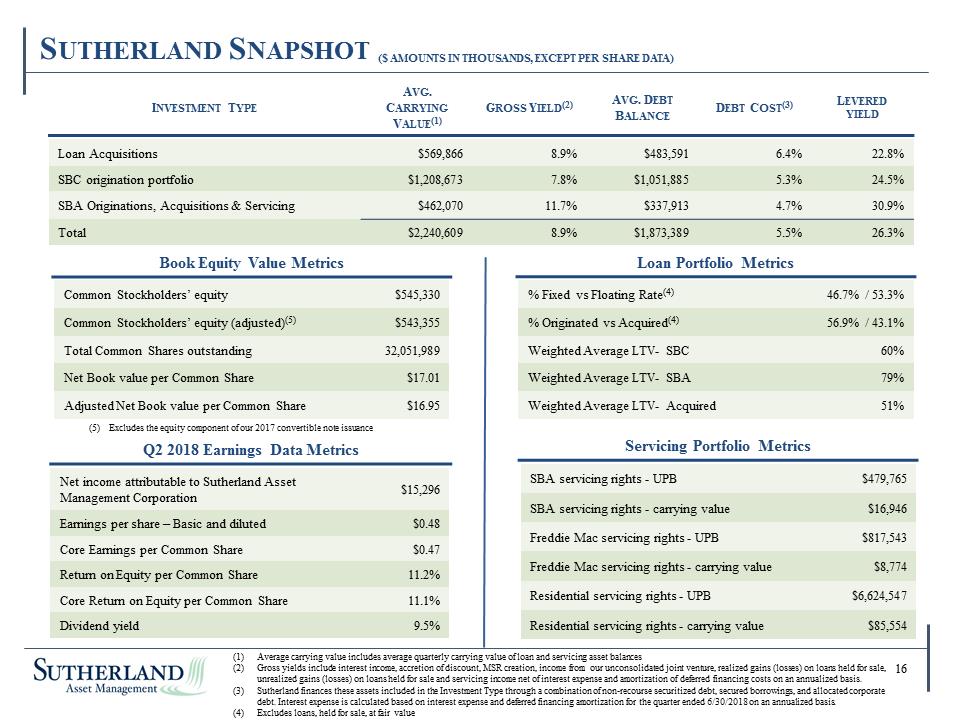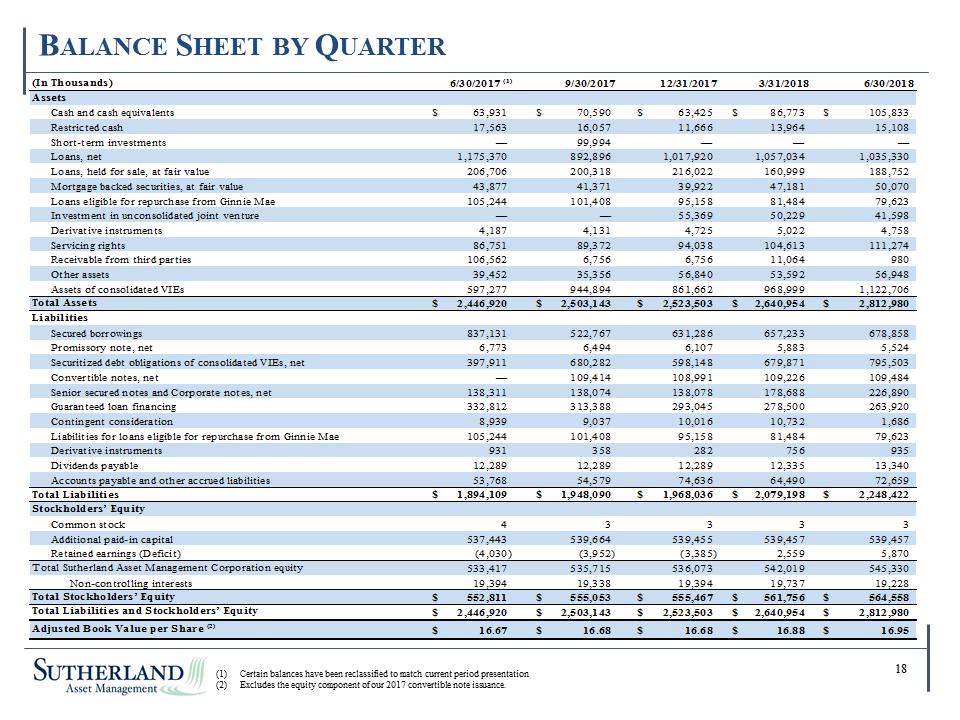
| Balance Sheet by Quarter Certain balances have been reclassified to match current period presentation Excludes the equity component of our 2017 convertible note issuance. 18 Check: Page #s (In Thousands)AssetsCash and cash equivalents$63,931 $70,590 $63,425 $86,773 $105,833 Restricted cash 17,563 16,057 11,666 13,964 15,108 Short-term investments — 99,994 — — — Loans, net 1,175,370 892,896 1,017,920 1,057,034 1,035,330 Loans, held for sale, at fair value 206,706 200,318 216,022 160,999 188,752 Mortgage backed securities, at fair value 43,877 41,371 39,922 47,181 50,070 Loans eligible for repurchase from Ginnie Mae105,244 101,408 95,158 81,484 79,623 Investment in unconsolidated joint venture— — 55,369 50,229 41,598 Derivative instruments 4,187 4,131 4,725 5,022 4,758 Servicing rights 86,751 89,372 94,038 104,613 111,274 Receivable from third parties 106,562 6,756 6,756 11,064 980 Other assets 39,452 35,356 56,840 53,592 56,948 Assets of consolidated VIEs597,277 944,894 861,662 968,999 1,122,706 Total Assets$2,446,920 $2,503,143 $2,523,503 $2,640,954 $2,812,980 LiabilitiesSecured borrowings 837,131 522,767 631,286 657,233 678,858 Promissory note, net6,773 6,494 6,107 5,883 5,524 Securitized debt obligations of consolidated VIEs, net 397,911 680,282 598,148 679,871 795,503 Convertible notes, net— 109,414 108,991 109,226 109,484 Senior secured notes and Corporate notes, net 138,311 138,074 138,078 178,688 226,890 Guaranteed loan financing 332,812 313,388 293,045 278,500 263,920 Contingent consideration8,939 9,037 10,016 10,732 1,686 Liabilities for loans eligible for repurchase from Ginnie Mae105,244 101,408 95,158 81,484 79,623 Derivative instruments 931 358 282 756 935 Dividends payable 12,289 12,289 12,289 12,335 13,340 Accounts payable and other accrued liabilities 53,768 54,579 74,636 64,490 72,659 Total Liabilities$1,894,109 $1,948,090 $1,968,036 $2,079,198 $2,248,422 Stockholders’ EquityCommon stock 4 3 3 3 3 Additional paid-in capital 537,443 539,664 539,455 539,457 539,457 Retained earnings (Deficit) (4,030) (3,952) (3,385) 2,559 5,870 Total Sutherland Asset Management Corporation equity 533,417 535,715 536,073 542,019 545,330 Non-controlling interests 19,394 19,338 19,394 19,737 19,228 Total Stockholders’ Equity$552,811 $555,053 $555,467 $561,756 $564,558 Total Liabilities and Stockholders’ Equity$2,446,920 $2,503,143 $2,523,503 $2,640,954 $2,812,980 Adjusted Book Value per Share (2)$16.67 $16.68 $16.68 $16.88 $16.95 6/30/2017 (1)9/30/201712/31/20173/31/2018 6/30/2018 |