Exhibit 99.2
Supplemental Financial Data First Quarter 2019 |
DISCLAIMER 2 This presentation contains statements that constitute "forward-looking statements," as such term is defined in Section 27A of the Securities Act of 1933, as amended, and Section 21E of the Securities Exchange Act of 1934, as amended, and such statements are intended to be covered by the safe harbor provided by the same. These statements are based on management's current expectations and beliefs and are subject to a number of trends and uncertainties that could cause actual results to differ materially from those described in the forward-looking statements; Ready Capital Corporation (the "Company") can give no assurance that its expectations will be attained. Factors that could cause actual results to differ materially from the Company's expectations include those set forth in the Risk Factors section of the most recent Annual Report on Form 10-K filed with the SEC and other reports filed by the Company with the SEC, copies of which are available on the SEC's website, www.sec.gov. The Company undertakes no obligation to update these statements for revisions or changes after the date of this release, except as required by law. This presentation includes certain non-GAAP financial measures, including Core Earnings. These non-GAAP financial measures should be considered only as supplemental to, and not as superior to, financial measures in accordance with GAAP. Please refer to Appendix A for the most recent GAAP information. This presentation also contains market statistics and industry data which are subject to uncertainty and are not necessarily reflective of market conditions. These have been derived from third party sources and have not been independently verified by the Company or its affiliates. All material presented is compiled from sources believed to be reliable and current, but accuracy cannot be guaranteed. All data is as of March 31, 2019 unless otherwise noted. |
FIRST QUARTER 2019 HIGHLIGHTS 3 ▪ Net income of $30.5 million(1), or $0.90 per common share ▪ Core earnings of $11.3 million(1), or $0.34 per common share ▪ Declared dividend of $0.40 per share EARNINGS / DIVIDENDS ▪ Return on Equity(2) of 21.6% ▪ Core Return on Equity(3) of 8.0% ▪ Dividend Yield(4) of 10.9% RETURNS ▪ Total SBC loan investment of $464.8 million ▪ SBC loan originations of $292.0 million and $128.7 million of loan acquisitions ▪ SBA loan originations of $44.1 million ▪ Residential mortgage loan originations of $344.4 million LOANORIGINATIONS(5) / ACQUISITIONS ▪ Completed the securitization of $399.2 million of fixed-rate SBC loans and issued $355.8 million of senior bonds at a weighted average pass-through rate of 4.1% ▪ Adjusted net book value(6) of $16.65 per common share ▪ Loans increased by 5.8% to $2.7 billion(7) BALANCE SHEET (1) Inclusive of non-controlling interest (2) Return on Equity is an annualized percentage equal to quarterly net income over the average monthly total stockholders’ equity for the period (3) Core Return on Equity is an annualized percentage equal to core earnings over the average monthly total stockholders’ equity for the period. Refer to the “Core Earnings Reconciliation” slide for a reconciliation of GAAP Net Income to Core Earnings (4) Q1 Dividend yield for the period based on the 3/31/2019 closing share price of $14.67 (5) Represents fully committed amounts (6) Excludes the equity component of our 2017 convertible note issuance (7) Represents carrying value of loans |
MERGER WITH OWENS REALTY MORTGAGE, INC. TRANSACTION HIGHLIGHTS • Completed previously announced merger on March 29, 2019 • Increases total equity by 38% to approximately $760 million • Larger market capitalization may benefit the company as smaller commercial mortgage REITs trade at a price/book discount to larger commercial mortgage REITs • Additional 12.2 million shares increased equity float by over 50% • Additional capital and portfolio turnover expected to generate $650 million in investment capacity • Enhanced scale, liquidity and larger capital base will improve operating efficiencies and metrics $556.3 $472.0 $760.9 $651.3 $- $100.0 $200.0 $300.0 $400.0 $500.0 $600.0 $700.0 $800.0 Total Equity Implied Market Cap Capital Base - Pre vs Post Merger Pre Merger Post Merger IMPACT ON TOTAL EQUITY SUMMARY OF NET ASSET ALLOCATION 7.6% 62.0% 30.4% Net Assets Acquired Cash & Other Loans REO 4 |
RETURN ON EQUITY 5 1) Levered yields include interest income, accretion of discount, MSR creation, income from our unconsolidated joint venture, realized gains (losses) on loans held for sale, unrealized gains (losses) on loans held for sale and servicing income net of interest expense and amortization of deferred financing costs on an annualized basis. 2) GAAP ROE is based on GAAP Net Income, while Core ROE is based on Core Earnings, which adjusts GAAP Net Income for the items in the “Core Earnings Reconciliation” slide. 3) ROE based on net income before tax of the Residential Mortgage Banking business line divided by the business line’s equity. 4) Excludes the effects of the ORM merger on the Company’s equity. Segment Loan Acquisitions 22.2 % 22.2 % 17.7 % SBC Originations 11.2 % 11.2 % 56.8 % SBA Originations, Acquisitions, & Servicing 26.1 % 26.1 % 14.6 % Residential Mortgage Banking (3) (24.2) % 9.1 % 10.9 % 2.7 4.3 5.5 4.9 (3.0) (2.5) (4.3) (2.7) 11.2 % 16.1 % 16.3 % 17.2 % 3.8 (2.1) 3.8 (1.9) (10.2) (7.6) (10.2) (7.6) 16.1 - (1.4) - (1.4) (1.7) (1.4) (1.7) 2.1 2.1 0.9 2.1 21.6 % 6.8 % 8.0 % 8.1 %Return on equity(4) Realized & unrealized gains, net Other income and expenses, net Investment advisory fees Provision for income taxes Unallocated corporate finance and non-earning assets, net Gross return on equity Corporate leverage Non-recurring gains and expenses 11.5 % 14.3 % 15.1 % 15.0 % GAAP ROE (2) Core ROE (2) Levered Yield (1) Core Levered Yield (1) Equity Allocation Q1'19 Q4'18 Q1'19 Q4'18 |
SBC INVESTMENT BY PRODUCT TYPE(1) 6 (1) Origination volumes are based on fully committed amounts $48.3 $48.3 $51.1 $65.4 $44.1 $23.0 $69.4 $125.4 $95.7 $86.3 $110.6 $160.3 $70.3 $70.3 $62.9 $78.0 $122.6 $95.5 $166.9 $142.8 $142.4 $142.8 $86.4 $8.8 $128.7 0 20 40 60 80 100 120 140 160 Q1'18 Q2'18 Q3'18 Q4'18 Q1'19 SBA Conventional Freddie Mac Transitional Acquired |
Q1 2019 QUARTERLY SBC LOAN INVESTMENT ALLOCATION 7 • Total funded investments of $450.5 million added during the quarter. • Funded $321.8 million(1) of SBC and SBA loan originations. • Acquired $128.7 million of SBC loans • Excludes acquired loans from ORM (1) Represents actual disbursements during the quarter. (2) $ in millions (3) Based on fully funded loan amount (4) Gross yield equals contractual interest rates and accretion of discount based on the Company’s estimates of loan performance, where applicable (5) Weighted average advance rate of all assets of this loan type currently financed on the Company’s facilities (6) Weighted average debt cost of all assets of this loan type currently financed on the Company’s facilities (7) SBA loan counts include the guaranteed and unguaranteed loan portion. (in millions, except loan count information) # of Loans Gross Yield(4) Weighted Avg Maturity(3) FX / ARM Avg Advance Rate(5) Debt Cost (6) Loan Originations Held-for-investment SBC $ 85.2 25 $ 3.4 5.4% 8 years 100% / 0% 66% 1M Libor +241 Transitional 149.7 84 1.8 5.9% 3 years 0% / 100% 69% 1M Libor + 238 SBA(7) 8.2 26 0.2 7.5% 23 years 0% / 100% 74% 1M Libor + 250 Prime + 29 Held-for-sale SBA(7) $ 24.7 26 $ 0.5 7.5% 23 years 0% / 100% 74% 1M Libor + 250 Prime + 29 Freddie Mac 54 21 2.6 5.1% 15 years 45% / 55% 100% 1M Libor + 175 Total Loan Originations $ 321.8 182 $ 1.8 5.8% 8 years 34% / 66% 74% Loan Acquisitions SBC $ 128.7 124 $ 1.1 5.7% 13 years 36% / 64% 75% SBC: 1M Libor + 250 Total Loan Acquisitions $ 128.7 124 $ 1.1 5.7% 13 years 36% / 64% 75% Total SBC Investment (Originations + Acquisitions) $ 450.5 306 $ 1.5 6.3% 10 years 39% / 61% 72% Avg Balance Gross Investments(2) |
SBC ORIGINATIONS -SEGMENT SNAPSHOT 8 1) Represents fully committed amounts. 2) As of April 30, 2019 including April 2019 fundings. 3) $ in millions, as of quarter end. 4) Represents fixed rate loans that have been securitized. 5) Includes interest income, accretion of discount, and servicing income net of interest expense and amortization of deferred financing costs. 6) Includes realized and unrealized gains (losses) on loans held for sale and MSR creation. • Originations of $292.0 million(1), 62% of loans held-for-investment are floating rate • Origination pipeline of $458.4 million(2) : 11.7% 12.5% 9.4% 8.9% 9.3% 2.3% 2.4% 2.3% 1.8% 1.9% 0.0% 5.0% 10.0% 15.0% 20.0% Q1 '18 Q2 '18 Q3 '18 Q4 '18 Q1 '19 Gross Levered Yield (ex. Gains) Gains on Loans, held for sale GROSS LEVERED YIELDCURRENT QUARTER HIGHLIGHTS (5) (6) Portfolio Metrics (Balance Sheet) Number of loans 357 397 403 421 429 Unpaid Principal Balance (3) $ 1,120 $ 1,202 $ 1,305 $ 1,479 $ 1,582 Carrying Value (3) $ 1,132 $ 1,213 $ 1,314 $ 1,488 $ 1,589 Weighted Average LTV 61% 60% 60% 63% 63% Weighted Average Coupon 6.4% 6.4% 6.3% 6.3% 6.2% Weighted Average Maturity 5 years 5 years 5 years 5 years 5 years Weighted Average Principal Balance (3) $ 3.1 $ 3.0 $ 3.2 $ 3.5 $ 3.7 Percentage of loans fixed / floating 56% / 44% 55% / 45% 56% / 44% 55% / 45% 53% / 47% Percentage of fixed, match funded (4) 82.2% 73.9% 62.8% 54.2% 87.3% Percentage of loans 30+ days delinquent 1.3% 1.7% 1.3% 2.3% 2.7% Q1 2018 Q2 2018 Q3 2018 Q4 2018 Q1 2019 Fixed Rate $ 44.5 $ 126.9 $ 171.4 Transitional 24.9 133.9 158.8 Freddie Mac 22.4 105.8 128.2 Total $ 91.8 $ 366.6 $ 458.4 Product April 2019 Forward Total Pipeline |
SBA ORIGINATIONS, ACQUISITIONS, & SERVICING-SEGMENT SNAPSHOT 9 1) Represents fully committed amounts. 2) $ in millions, as of quarter end. 3) Includes interest income, accretion of discount, and servicing income net of interest expense and amortization of deferred 4) Includes realized and unrealized gains (losses) on loans held for sale and MSR creation. • $43.6 million of SBA secondary market loans sales, with an average sale premium of 9.6% • Originations of $44.1 million(1) • Origination pipeline of $135.9 million SBA loans, including $17.5 million of April 2019 fundings 20.4% 17.1% 16.6% 17.1% 15.0% 8.0% 11.8% 11.6% 13.9% 11.1% 0.0% 5.0% 10.0% 15.0% 20.0% 25.0% 30.0% 35.0% Q1 '18 Q2 '18 Q3 '18 Q4 '18 Q1 '19 Gross Levered Yield (ex. Gains) Gains on Loans, held for sale CURRENT QUARTER HIGHLIGHTS GROSS LEVERED YIELD (3) (4) Portfolio Metrics (Balance Sheet) Number of loans 2,062 2,029 1,976 1,931 1,876 Unpaid Principal Balance (2) $ 502 $ 489 $ 481 $ 467 $ 262 Carrying Value (2) $ 452 $ 438 $ 434 $ 424 $ 220 Weighted Average LTV 78% 79% 80% 79% 82% Weighted Average Coupon 6.2% 6.4% 6.7% 7.0% 7.4% Weighted Average Maturity 14 years 14 years 14 years 14 years 15 years Weighted Average Principal Balance (2) $ 0.2 $ 0.2 $ 0.2 $ 0.2 $ 0.1 Percentage of loans fixed / floating 1% / 99% 1% / 99% 1% / 99% 1% / 99% 1% / 99% Percentage of loans 30+ days delinquent 6.0% 3.6% 4.1% 7.0% 9.0% Q1 2018 Q2 2018 Q3 2018 Q4 2018 Q1 2019 |
LOAN ACQUISITIONS-SEGMENT SNAPSHOT 10 1) Excludes joint venture investment. 2) $ in millions, as of quarter end. 3) Represents fixed rate loans that have been securitized. • At this stage of the credit cycle, ample inventory of opportunistic performing SBC loans • Acquired $128.7 million of SBC loans • Acquisition pipeline of $573.3 million SBC loans, including April 2019 acquisitions of $19.5 million 12.5% 11.1% 11.9% 12.2% 13.8% 15.0% 3.0% 4.5% 7.0% 8.4% 0.0% 5.0% 10.0% 15.0% 20.0% 25.0% 30.0% Q1 '18 Q2 '18 Q3 '18 Q4 '18 Q1 '19 Income on joint venture investment Gross Levered Yield (ex. Gains) CURRENT QUARTER HIGHLIGHTS GROSS LEVERED YIELD Portfolio Metrics(1) (Balance Sheet) Number of loans 976 1,019 949 896 1,018 Unpaid Principal Balance (2) $ 525 $ 602 $ 617 $ 573 $ 798 Carrying Value (2) $ 488 $ 569 $ 588 $ 548 $ 770 Weighted Average LTV 50% 51% 49% 44% 53% Weighted Average Coupon 6.5% 6.6% 6.7% 6.6% 6.7% Weighted Average Maturity 8 years 8 years 8 years 7 years 7 years Weighted Average Principal Balance (2) $ 0.5 $ 0.6 $ 0.6 $ 0.6 $ 0.8 Percentage of loans fixed / floating 58% / 42% 62% / 38% 65% / 35% 66% / 34% 61% / 39% Percentage of fixed, match funded (3) 27.0% 15.5% 11.4% 51.6% 51.6% Percentage of loans performing / non-performing 97% / 3% 97% / 3% 98% / 2% 98% / 2% 95% / 5% Q1 2018 Q2 2018 Q3 2018 Q4 2019 Q1 2019 |
RESIDENTIAL MORTGAGE BANKING –SEGMENT SNAPSHOT 111) $ in millions. Represents activity during the quarter. 2) Represents fully committed amounts • MSR portfolio of approximately $7.6 billion in UPB, up 2% compared to Q4 • Fair market value of $88.2 million • Originations of $344.4 million(2) • Loan sales of $326.5 million • Origination pipeline of $198.7 million in commitments to originate residential agency loans(2) $6.8 $7.0 $7.3 $7.5 $7.6 $0.0 $2.0 $4.0 $6.0 $8.0 MSR PORTFOLIO (UPB IN $ BILLIONS)CURRENT QUARTER HIGHLIGHTS Portfolio Metrics (quarterly activity) Unpaid principal balance (1) $ 438.9 $ 498.6 $ 472.1 $ 369.1 $ 344.4 % of Originations - Purchased 72.8% 80.6% 79.6% 76.7% 74.3% % of Originations - Refinanced 27.2% 19.4% 20.4% 23.3% 25.7% Channel - % Correspondent 41.0% 36.7% 37.0% 38.2% 34.5% Channel - % Retail 39.3% 41.6% 42.5% 44.0% 47.2% Channel - % Wholesale 19.7% 21.7% 20.5% 17.8% 18.2% Unpaid principal balance (1) $ 475.5 $ 479.9 $ 496.1 $ 382.7 $ 326.5 % of UPB - Fannie/ Freddie securitizations 68.8% 67.6% 65.6% 62.8% 68.4% % of UPB - Ginnie Mae securitizations 20.4% 23.0% 24.3% 25.8% 24.6% % of UPB - Other investors 10.8% 9.4% 10.1% 11.5% 7.0% Q4 2018 Q1 2019 Originations Sales Q1 2018 Q2 2018 Q3 2018 Fair Q1' 18 Q2' 18 Q3' 18 Q4' 18 Q1' 19 Value ($ mm) $ 81.6 $ 85.6 $ 91.7 $ 93.1 $ 88.2 |
ACTIVE SBC AND SBA LOAN SECURITIZATION PERFORMANCE 121) Represents remaining collateral in the securitization Issuance Date Delinquency 30+ Delinquency 60+ Delinquency 90+ Cumulative Loss Fixed Rate $ 1,126,954 RCMT 2014-1 September 2014 181,922 0.25 0.0% 0.0% 0.0% 0.0% RCMT 2015-2 November 2015 218,757 0.55 0.9% 0.0% 0.0% 0.0% RCMT 2016-3 November 2016 162,075 0.49 0.0% 0.0% 0.0% 0.0% RCMT 2018-4 March 2018 165,000 0.96 0.0% 0.0% 0.0% 0.0% RCMT 2019-5 January 2019 399,200 0.98 0.0% 0.0% 0.0% 0.0% Floating Rate $ 522,080 RCMF 2017-FL1 August 2017 243,797 0.26 0.0% 0.0% 0.0% 0.0% RCMF 2018-FL2 June 2018 278,283 0.73 2.8% 0.0% 0.0% 0.0% $ 1,878,787 FRESB 2016-SB11 January 2016 109,965 0.58 0.0% 0.0% 0.0% 0.0% FRESB 2016-SB18 July 2016 118,037 0.81 0.0% 0.0% 0.0% 0.0% FRESB 2017-SB33 June 2017 219,852 0.87 1.8% 0.0% 0.0% 0.0% FRESB 2018-SB45 January 2018 362,018 0.95 0.0% 0.0% 0.0% 0.0% FRESB 2018-SB52 September 2018 561,584 0.97 0.0% 0.0% 0.0% 0.0% FRESB 2018-SB56 December 2018 507,331 1.00 0.0% 0.0% 0.0% 0.0% Acquired - Performing $ 515,153 WVMT 2011-SBC2 March 2011 97,557 0.23 3.0% 2.5% 2.5% 3.7% SCMT 2017-SBC6 August 2017 154,929 0.48 2.3% 0.1% 0.1% 0.0% SCMT 2018-SBC7 November 2018 262,667 0.87 0.3% 0.2% 0.2% 0.0% $ 4,042,974 Freddie Mac Acquired Originated Total loan securitizations Securitization Original Collateral Balance Pool - Factor(1) |
INTEREST RATE RISK SENSITIVITY 13 1) As a percent of carrying value 2) Excludes loans held-for-sale, at fair value 3) Based on portfolio as of March 31, 2019 and assumes no future changes in the composition of the portfolio. PORTFOLIO -FIXED VS FLOATING INTEREST RATESENSITIVITY ► 69% of our fixed rate loan portfolio is match funded $- $0.02 $0.04 $0.06 $0.08 $0.10 $0.12 25 basis point increase 50 basis point increase 75 basis point increase 100 basis point increase Annual Net Interest Income Per Share (Pre-tax)(3) Floating Rate, 46.6% Fixed Rate, match funded, 36.7% Fixed Rate, not match funded, 16.7% % of Total Loan Exposure (1)(2) |
LOAN PORTFOLIO COMPOSITION AS OF MARCH 31, 2019(1)(2) Geographic Location Lien Position (1) As a percent of unpaid principal balance (2) Excludes loans held-for-sale, at fair value (3) 14 Collateral Type SBA Collateral Type California, 18.4% Texas, 13.7% Florida, 8.9% New York, 5.2%Georgia, 5.2% Other, 48.6% SBA, 9.5% Multi-Family, 30.0% Retail, 20.8% Office, 15.0% Mixed use, 9.1% Other, 15.6% Physicians Offices, 14.4% Child Day Care Services, 9.5% Lodging, 6.5% Veterinarians, 5.5% Restaurants, 7.2% Other, 56.9% First Mortgage, 97.9% Subordinated Mortgage, 1.3% Other, 0.8% |
CAPITAL STRUCTURE –REDUCTION IN LIQUIDITY RISK ► Since going public in Q4 2016, we continue to optimize our capital structure: • Issued $345 million of corporate debt: • Convertible notes: 6 year notes, 7.0% coupon, $115 million • Senior secured notes: 5 year notes, 7.5% coupon • $75 million in 2/2017; YTM of 7.5% • $65 million in 6/2017; YTM of 6.75% • $40 million in 1/2018, YTM of 6.5% • Retail Baby Bonds: 3 year notes, 6.5% coupon, $50 million ► Completed $320 million securitization of originated transitional loans in April 2019 15 Funding Mix Total Debt + Equity CURRENT SOURCES OF FUNDINGHISTORICAL CAPITAL STRUCTURETotal Debt + Equity ($M) Funding Mix $2,193 $2,382 $2,480 $2,641 $3,088 Convertible Notes $ 115 7.0% 7.0% Senior Secured Notes $ 180 7.5% 7.0% Retail Baby Bonds $ 50 6.5% 6.5% Total $ 345 7.2% 7.0% Principal Balance Coupon YTM Corporate Financing (in $M) 26% 24% 23% 21% 25% 5% 5% 4% 4% 4% 8% 10% 9% 9% 7% 30% 29% 33% 32% 27% 31% 33% 30% 34% 37% Q1 2018 Q2 2018 Q3 2018 Q4 2018 Q1 2019 Common Equity Convertible senior notes Senior secured notes and Corporate debt Credit facilities and repurchase agreements Securitized debt obligations |
FINANCING AND LEVERAGE 16 1.7x 1.8x 2.0x 2.1x 1.6x 2.9x 3.2x 3.4x 3.7x 3.1x 0 0.5 1 1.5 2 2.5 3 3.5 4 Q1 2018 Q2 2018 Q3 2018 Q4 2018 Q1 2019 Historical Leverage Recourse Total HISTORICAL LEVERAGE Total Debt-to-Equity Ratio Secured borrowings (warehouse credit facilities and borrowings under repo transactions) $ 848 Securitized debt obligations 1,141 Senior secured notes and corporate bonds 228 Convertible notes 110 Total Debt $ 2,327 Total Stockholders' Equity $ 761 Total debt-to-equity ratio 3.06 Total recourse debt-to-equity ratio Total Debt $ 2,327 Less: Securitized debt obligations (1,141) Total recourse debt $ 1,186 Total Stockholders' Equity $ 761 Total recourse debt-to-equity ratio 1.56 3/31/2019 (in millions) |
LOAN WAREHOUSE FACILITIES 17(1) $ in millions Bank Maturity Rate Description and Uses of Funds JPMorgan May '19 1M L + 2.50% $ 225 $ 158 Borrowings are used to finance SBC and SBA loan acquisitions, and SBA loan originations. KeyBank Feb '20 1M L + 1.50% 125 120 Borrowings are used to finance Freddie Mac SBC loan originations. East West July '20 Prime - 0.821 to + 0.029% 50 17 Borrowings are used to finance SBA loan originations and acquisitions. FCB June '21 2.75% 3 - Borrowings are used to finance SBC loan acquisitions. GMFS facilities < 1 year 1M L + 1.75 to 2.0% 180 91 Borrowings are used to finance Residential Agency loan originations. GMFS - MSR Sept '23 1M L + 2.50% 50 9 Borrowings are used to finance Residential Agency MSRs. Rabobank Jan '21 4.22% 15 2 Borrowings are used to finance acquired REO properties. $ 648 $ 395 Citibank June '19 1M L + 2.125 to 2.50% $ 500 $ 397 Borrowings are used to finance SBC loan originations and SBC loan acquisitions. Deutsche Bank Feb '20 3M L + 2.30 to 2.80% 300 168 Borrowings are used to finance SBC loan originations and Transitional loan originations. JPMorgan Dec '20 1M L + 2.25 to 4.00% 200 25 Borrowings are used to finance SBC and Transitional loan originations, and SBC loan acquisitions. $ 1,000 $ 590 Total Secured Borrowings $ 1,648 $ 985 Borrowings under repurchase agreements Total Borrowings under repurchase agreements Total Borrowings under credit facilities Borrowings under credit facilities Available Capacity (1) Facility Size (1) |
READY CAPITAL SNAPSHOT ($ amounts in thousands, except per share data) 18 (5) Excludes the equity component of our 2017 convertible note issuance 1) Average carrying value includes average quarterly carrying value of loan and servicing asset balances 2) Gross yields include interest income, accretion of discount, MSR creation, income from our unconsolidated joint venture, realized gains (losses) on loans held for sale, unrealized gains (losses) on loans held for sale and servicing income net of interest expense and amortization of deferred financing costs on an annualized basis. 3) The Company finances the assets included in the Investment Type through securitizations, repurchase agreements, warehouse facilities and bank credit facilities. Interest expense is calculated based on interest expense and deferred financing amortization for the quarter ended 3/31/2019 on an annualized basis. 4) Excludes loans, held for sale, at fair value 5) Excludes the equity component of our 2017 convertible note issuance. Common Stockholders' equity $ 741,146 Common Stockholders' equity (adjusted)(5) $ 739,166 Total Common Shares outstanding 44,395,713 Net Book Value per Common Share $ 16.69 Adjusted Net Book Value per Common Share $ 16.65 Book Equity Value Metrics Net income attributable to Ready Capital Corporation $ 29,467 Earnings per share - Basic and diluted $ 0.90 Core Earnings per Common Share $ 0.34 Return on Equity per Common Share 21.6% Core Return on Equity per Common Share 8.0% Dividend Yield 10.9% Q1 2019 Earnings Data Metrics SBA servicing rights - UPB $ 510,789 SBA servicing rights- carrying value $ 16,448 Freddie Mac servicing rights - UPB $ 1,023,109 Freddie Mac servicing rights - carrying value $ 10,839 Residential servicing rights - UPB $ 7,590,151 Residential servicing rights - carrying value $ 88,218 Servicing Portfolio Metrics Average Carrying Value(1) Debt Cost (3) Levered Yield Loan Acquisitions 590,110$ 8.9% 451,401$ 4.8% 22.2% SBC Originations 1,693,869$ 6.9% 1,249,703$ 5.3% 11.2% SBA Originations, Acquisitions, & Servicing 430,983$ 11.0% 316,667$ 5.6% 26.1% Total 2,714,962$ 8.0% 2,017,771$ 5.2% 15.9% Investment Type Gross Yield(2) Average Debt Balance % Fixed vs Floating Rate 46.6% / 53.4% % Originated vs Acquired 66.8% / 33.2% Weighted Average LTV - SBC 63% Weighted Average LTV - SBA 82% Weighted Average LTV - Acquired 53% Loan Portfolio Metrics (4) |
APPENDIX 19 |
PER SHARE FINANCIAL PERFORMANCE 20 ► Adjusted net book value of $16.65 per common share as of March 31, 2019 Per Share Trends $0.56 $0.48 $0.53 $0.30 $0.90 $0.47 $0.47 $0.48 $0.34 $0.34 $0.37 $0.40 $0.40 $0.40 $0.40 $0.10 $0.20 $0.30 $0.40 $0.50 $0.60 $0.70 $0.80 $0.90 $1.00 Q1 2018 Q2 2018 Q3 2018 Q4 2018 Q1 2019 Earnings Core earnings Dividends declared |
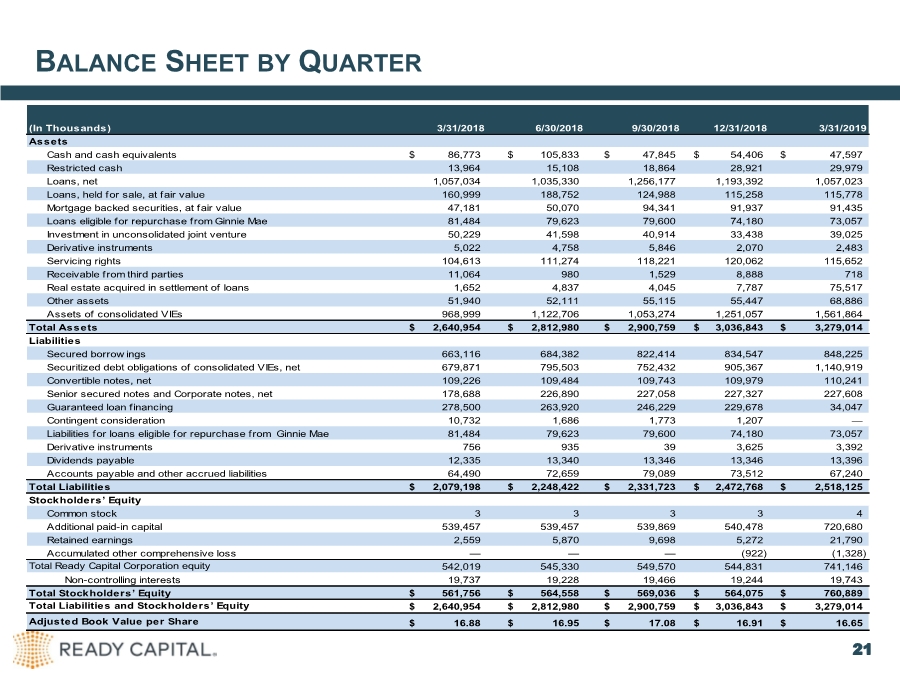
BALANCE SHEET BY QUARTER 21 (In Thousands) Assets Cash and cash equivalents $ 86,773 $ 105,833 $ 47,845 $ 54,406 $ 47,597 Restricted cash 13,964 15,108 18,864 28,921 29,979 Loans, net 1,057,034 1,035,330 1,256,177 1,193,392 1,057,023 Loans, held for sale, at fair value 160,999 188,752 124,988 115,258 115,778 Mortgage backed securities, at fair value 47,181 50,070 94,341 91,937 91,435 Loans eligible for repurchase from Ginnie Mae 81,484 79,623 79,600 74,180 73,057 Investment in unconsolidated joint venture 50,229 41,598 40,914 33,438 39,025 Derivative instruments 5,022 4,758 5,846 2,070 2,483 Servicing rights 104,613 111,274 118,221 120,062 115,652 Receivable from third parties 11,064 980 1,529 8,888 718 Real estate acquired in settlement of loans 1,652 4,837 4,045 7,787 75,517 Other assets 51,940 52,111 55,115 55,447 68,886 Assets of consolidated VIEs 968,999 1,122,706 1,053,274 1,251,057 1,561,864 Total Assets $ 2,640,954 $ 2,812,980 $ 2,900,759 $ 3,036,843 $ 3,279,014 Liabilities Secured borrow ings 663,116 684,382 822,414 834,547 848,225 Securitized debt obligations of consolidated VIEs, net 679,871 795,503 752,432 905,367 1,140,919 Convertible notes, net 109,226 109,484 109,743 109,979 110,241 Senior secured notes and Corporate notes, net 178,688 226,890 227,058 227,327 227,608 Guaranteed loan financing 278,500 263,920 246,229 229,678 34,047 Contingent consideration 10,732 1,686 1,773 1,207 — Liabilities for loans eligible for repurchase from Ginnie Mae 81,484 79,623 79,600 74,180 73,057 Derivative instruments 756 935 39 3,625 3,392 Dividends payable 12,335 13,340 13,346 13,346 13,396 Accounts payable and other accrued liabilities 64,490 72,659 79,089 73,512 67,240 Total Liabilities $ 2,079,198 $ 2,248,422 $ 2,331,723 $ 2,472,768 $ 2,518,125 Stockholders’ Equity Common stock 3 3 3 3 4 Additional paid-in capital 539,457 539,457 539,869 540,478 720,680 Retained earnings 2,559 5,870 9,698 5,272 21,790 Accumulated other comprehensive loss — — — (922) (1,328) Total Ready Capital Corporation equity 542,019 545,330 549,570 544,831 741,146 Non-controlling interests 19,737 19,228 19,466 19,244 19,743 Total Stockholders’ Equity $ 561,756 $ 564,558 $ 569,036 $ 564,075 $ 760,889 Total Liabilities and Stockholders’ Equity $ 2,640,954 $ 2,812,980 $ 2,900,759 $ 3,036,843 $ 3,279,014 Adjusted Book Value per Share $ 16.88 $ 16.95 $ 17.08 $ 16.91 $ 16.65 3/31/20193/31/2018 6/30/2018 9/30/2018 12/31/2018 |
STATEMENT OF INCOME BY QUARTER 22(1) Certain balances have been reclassified to match current period presentation (In Thousands, except share data) Interest income $ 37,150 $ 41,858 $ 44,287 $ 46,204 $ 48,753 Interest expense (22,666) (26,407) (28,925) (31,240) (35,775) Net interest income before provision for loan losses $ 14,484 $ 15,451 $ 15,362 $ 14,964 $ 12,978 Provision for loan losses (167) 397 (800) (1,131) (518) Net interest income after provision for loan losses $ 14,317 $ 15,848 $ 14,562 $ 13,833 $ 12,460 Non-interest income Residential mortgage banking activities $ 14,024 $ 17,255 $ 17,011 $ 11,561 $ 14,587 Net realized gain on financial instruments 12,232 8,620 6,946 10,610 7,282 Net unrealized gain (loss) on financial instruments 3,008 4,457 8,500 (11,112) (6,912) Other income 1,334 1,826 1,204 1,222 900 Servicing income, net of amortization and impairment 6,410 6,627 6,922 7,116 6,752 Income on unconsolidated joint venture 5,739 1,503 2,178 2,728 2,929 Gain on bargain purchase — — — — 30,728 Total non-interest income $ 42,747 $ 40,288 $ 42,761 $ 22,125 $ 56,266 Non-interest expense Employee compensation and benefits (15,320) (14,272) (14,163) (12,847) (11,448) Allocated employee compensation and benefits from related party (1,200) (1,200) (1,200) (600) (853) Variable expenses on residential mortgage banking activities (2,290) (7,493) (8,337) (4,108) (9,176) Professional fees (2,648) (2,401) (2,294) (420) (1,829) Management fees – related party (2,013) (2,036) (2,070) (2,058) (1,997) Incentive fees – related party (408) (269) — (467) — Loan servicing expense (4,093) (3,000) (4,247) (3,442) (3,648) ORM merger expenses — — — — (5,467) Other operating expenses (8,011) (8,916) (6,548) (5,267) (6,861) Total non-interest expense $ (35,983) $ (39,587) $ (38,859) $ (29,209) $ (41,279) Income before provision for income taxes $ 21,081 $ 16,549 $ 18,464 $ 6,749 $ 27,447 Provision for income (taxes) benefit (2,563) (665) (895) 2,737 3,003 Net income $ 18,518 $ 15,884 $ 17,569 $ 9,486 $ 30,450 Less: Net income attributable to non-controlling interest 664 588 638 309 983 Net income attributable to Ready Capital Corporation $ 17,854 $ 17,854 $ 16,931 $ 9,177 $ 29,467 Earnings per common share - basic $ 0.56 $ 0.48 $ 0.53 $ 0.30 $ 0.90 Earnings per common share - diluted $ 0.56 $ 0.48 $ 0.53 $ 0.30 $ 0.90 Weighted-average shares outstanding - Basic 32,036,504 32,073,717 32,109,642 32,122,503 32,556,875 Weighted-average shares outstanding - Diluted 32,045,844 32,092,750 32,130,262 32,138,712 32,563,644 Dividends declared per share of common stock $ 0.37 $ 0.40 $ 0.40 $ 0.40 $ 0.40 Q1 2018 Q2 2018 Q3 2018 Q4 2018 Q1 2019 |
CORE EARNINGS RECONCILIATION 23 We believe that providing investors with Core Earnings, a non-U.S.GAAP financial measure, in addition to the related U.S.GAAP measures, gives investors greater transparency into the information used by management in our financial and operational decision-making. However, because Core Earnings is an incomplete measure of our financial performance and involves differences from net income computed in accordance with U.S.GAAP, it should be considered along with, but not as an alternative to, our net income as a measure of our financial performance. In addition, because not all companies use identical calculations, our presentation of Core Earnings may not be comparable to other similarly-titled measures of other companies. We calculate Core Earnings as GAAP net income (loss) excluding the following: i) any unrealized gains or losses on certain MBS ii) any realized gains or losses on sales of certain MBS iii) any unrealized gains or losses on Residential MSRs iv) one-time non-recurring gains or losses, such as gains or losses on discontinued operations, bargain purchase gains, or merger related expenses In calculating Core Earnings, Net Income (in accordance with GAAP) is adjusted to exclude unrealized gains and losses on MBS acquired by us in the secondary market, but is not adjusted to exclude unrealized gains and losses on MBS retained by us as part of our loan origination businesses, where we transfer originated loans into an MBS securitization and retain an interest in the securitization. In calculating Core Earnings, we do not adjust Net Income (in accordance with GAAP) to take into account unrealized gains and losses on MBS retained by us as part of our loan origination businesses because we consider the unrealized gains and losses that are generated in the loan origination and securitization process to be a fundamental part of this business and an indicator of the ongoing performance and credit quality of our historical loan originations. In calculating Core Earnings, Net Income (in accordance with GAAP) is adjusted to exclude realized gains and losses on certain MBS securities considered to be non-core. Certain MBS positions are considered to be non-core due to a variety of reasons which may include collateral type, duration, and size. In addition, in calculating Core Earnings, Net Income (in accordance with GAAP) is adjusted to exclude unrealized gains or losses on Residential MSRs, held at fair value. We treat our commercial MSRs and Residential MSRs as two separate classes based on the nature of the underlying mortgages and our treatment of these assets as two separate pools for risk management purposes. Servicing rights relating to our small business commercial business are accounted for under ASC 860, Transfer and Servicing, while our residential MSRs are accounted for under the fair value option under ASC 825, Financial Instruments. In calculating Core Earnings, we do not exclude realized gains or losses on either commercial MSRs or Residential MSRs, held at fair value, as servicing income is a fundamental part of our business and as an indicator of the ongoing performance. (In Thousands) Net Income $ 18,518 $ 15,884 $ 17,569 $ 9,486 $ 30,450 Reconciling items: Gain on bargain purchase $ — $ — $ — $ — $ (30,728) ORM merger expenses — — — — 5,467 Non-recurring expenses — — — — 726 Unrealized (gain) loss on mortgage-backed securities 79 86 (10) 226 14 Unrealized (gain) loss on mortgage servicing rights (4,155) (253) (1,969) 2,171 7,128 Total reconciling items $ (4,076) $ (167) $ (1,979) $ 2,397 $ (17,393) Core earnings before income taxes $ 14,442 $ 15,717 $ 15,590 $ 11,883 $ 13,057 Income tax adjustments 1,047 64 495 (547) (1,782) Core earnings $ 15,489 $ 15,781 $ 16,085 $ 11,336 $ 11,275 Less: Core earnings attributable to non-controlling interests $ 555 $ 584 $ 584 $ 369 $ 364 Core earnings attributable to Common Stockholders $ 14,935 $ 15,197 $ 15,501 $ 10,967 $ 10,911 Core earnings per share $ 0.47 $ 0.47 $ 0.48 $ 0.34 $ 0.34 Weighted average common shares outstanding 32,036,504 32,073,717 32,109,642 32,122,503 32,556,875 Q1 2018 Q2 2018 Q3 2018 Q4 2018 Q1 2019 |