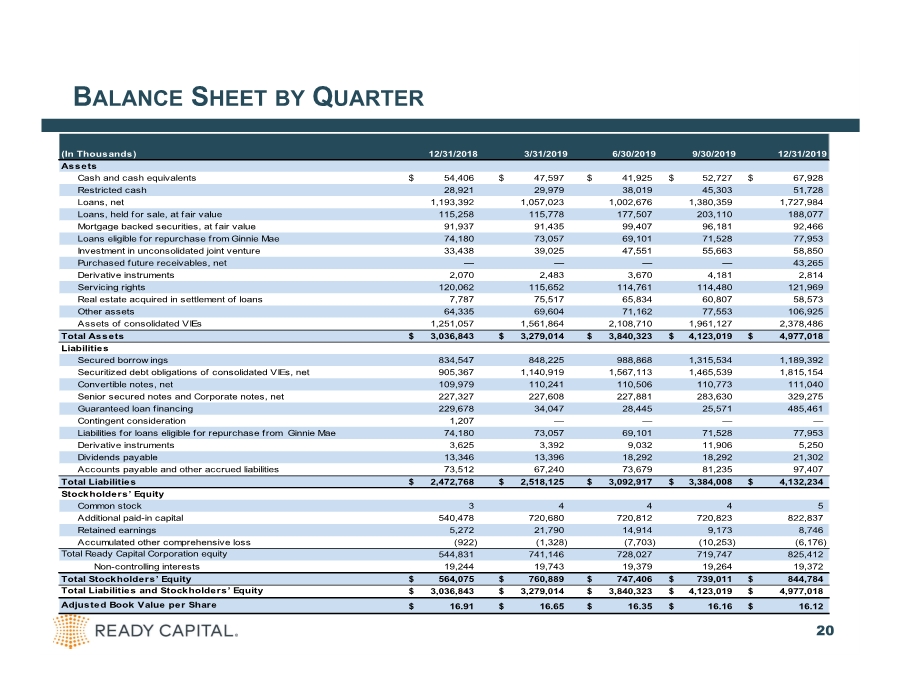
| BALANCE SHEET BY QUARTER 20 (In Thousands) Assets Cash and cash equivalents $ 54,406 $ 47,597 $ 41,925 $ 52,727 $ 67,928 Restricted cash 28,921 29,979 38,019 45,303 51,728 Loans, net 1,193,392 1,057,023 1,002,676 1,380,359 1,727,984 Loans, held for sale, at fair value 115,258 115,778 177,507 203,110 188,077 Mortgage backed securities, at fair value 91,937 91,435 99,407 96,181 92,466 Loans eligible for repurchase from Ginnie Mae 74,180 73,057 69,101 71,528 77,953 Investment in unconsolidated joint venture 33,438 39,025 47,551 55,663 58,850 Purchased future receivables, net — — — — 43,265 Derivative instruments 2,070 2,483 3,670 4,181 2,814 Servicing rights 120,062 115,652 114,761 114,480 121,969 Real estate acquired in settlement of loans 7,787 75,517 65,834 60,807 58,573 Other assets 64,335 69,604 71,162 77,553 106,925 Assets of consolidated VIEs 1,251,057 1,561,864 2,108,710 1,961,127 2,378,486 Total Assets $ 3,036,843 $ 3,279,014 $ 3,840,323 $ 4,123,019 $ 4,977,018 Liabilities Secured borrow ings 834,547 848,225 988,868 1,315,534 1,189,392 Securitized debt obligations of consolidated VIEs, net 905,367 1,140,919 1,567,113 1,465,539 1,815,154 Convertible notes, net 109,979 110,241 110,506 110,773 111,040 Senior secured notes and Corporate notes, net 227,327 227,608 227,881 283,630 329,275 Guaranteed loan financing 229,678 34,047 28,445 25,571 485,461 Contingent consideration 1,207 — — — — Liabilities for loans eligible for repurchase from Ginnie Mae 74,180 73,057 69,101 71,528 77,953 Derivative instruments 3,625 3,392 9,032 11,906 5,250 Dividends payable 13,346 13,396 18,292 18,292 21,302 Accounts payable and other accrued liabilities 73,512 67,240 73,679 81,235 97,407 Total Liabilities $ 2,472,768 $ 2,518,125 $ 3,092,917 $ 3,384,008 $ 4,132,234 Stockholders’ Equity Common stock 3 4 4 4 5 Additional paid-in capital 540,478 720,680 720,812 720,823 822,837 Retained earnings 5,272 21,790 14,914 9,173 8,746 Accumulated other comprehensive loss (922) (1,328) (7,703) (10,253) (6,176) Total Ready Capital Corporation equity 544,831 741,146 728,027 719,747 825,412 Non-controlling interests 19,244 19,743 19,379 19,264 19,372 Total Stockholders’ Equity $ 564,075 $ 760,889 $ 747,406 $ 739,011 $ 844,784 Total Liabilities and Stockholders’ Equity $ 3,036,843 $ 3,279,014 $ 3,840,323 $ 4,123,019 $ 4,977,018 Adjusted Book Value per Share $ 16.91 $ 16.65 $ 16.35 $ 16.16 $ 16.12 12/31/2019 12/31/2018 3/31/2019 6/30/2019 9/30/2019 |