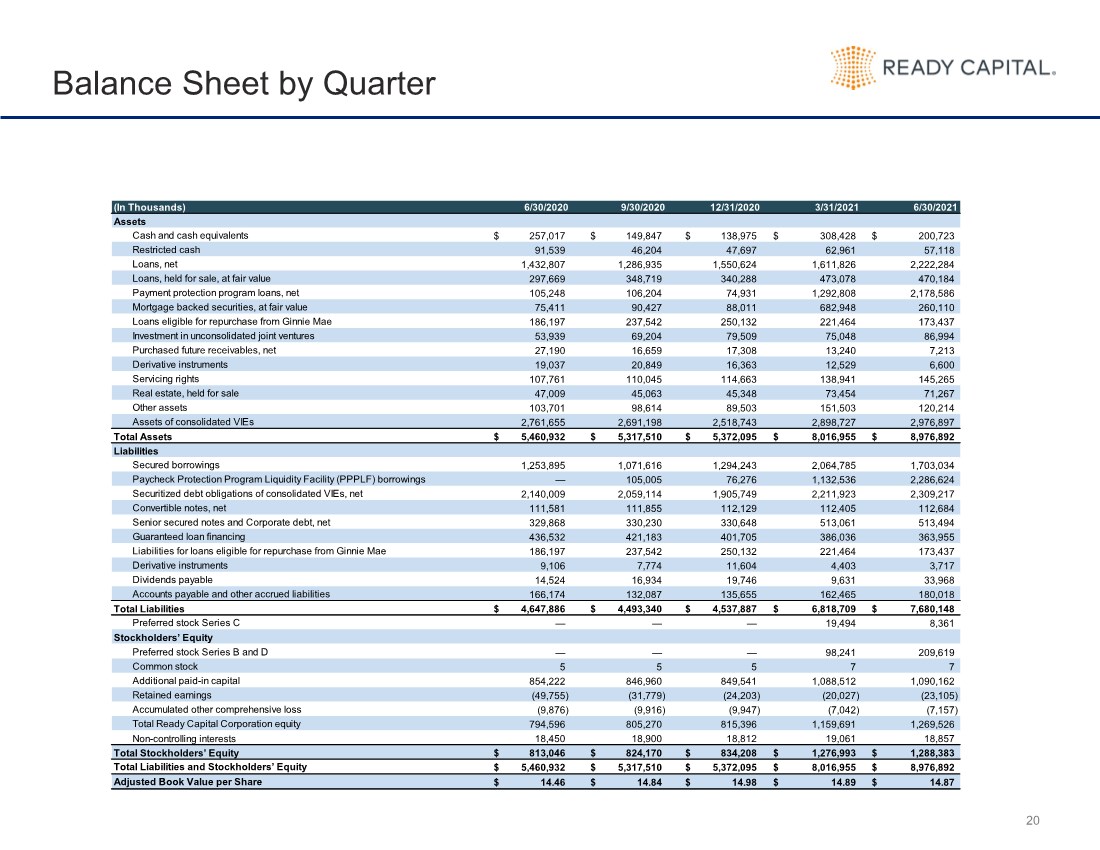
| 20 Balance Sheet by Quarter (In Thousands) Assets Cash and cash equivalents $ 257,017 $ 149,847 $ 138,975 $ 308,428 $ 200,723 Restricted cash 91,539 46,204 47,697 62,961 57,118 Loans, net 1,432,807 1,286,935 1,550,624 1,611,826 2,222,284 Loans, held for sale, at fair value 297,669 348,719 340,288 473,078 470,184 Payment protection program loans, net 105,248 106,204 74,931 1,292,808 2,178,586 Mortgage backed securities, at fair value 75,411 90,427 88,011 682,948 260,110 Loans eligible for repurchase from Ginnie Mae 186,197 237,542 250,132 221,464 173,437 Investment in unconsolidated joint ventures 53,939 69,204 79,509 75,048 86,994 Purchased future receivables, net 27,190 16,659 17,308 13,240 7,213 Derivative instruments 19,037 20,849 16,363 12,529 6,600 Servicing rights 107,761 110,045 114,663 138,941 145,265 Real estate, held for sale 47,009 45,063 45,348 73,454 71,267 Other assets 103,701 98,614 89,503 151,503 120,214 Assets of consolidated VIEs 2,761,655 2,691,198 2,518,743 2,898,727 2,976,897 Total Assets $ 5,460,932 $ 5,317,510 $ 5,372,095 $ 8,016,955 $ 8,976,892 Liabilities Secured borrowings 1,253,895 1,071,616 1,294,243 2,064,785 1,703,034 Paycheck Protection Program Liquidity Facility (PPPLF) borrowings — 105,005 76,276 1,132,536 2,286,624 Securitized debt obligations of consolidated VIEs, net 2,140,009 2,059,114 1,905,749 2,211,923 2,309,217 Convertible notes, net 111,581 111,855 112,129 112,405 112,684 Senior secured notes and Corporate debt, net 329,868 330,230 330,648 513,061 513,494 Guaranteed loan financing 436,532 421,183 401,705 386,036 363,955 Liabilities for loans eligible for repurchase from Ginnie Mae 186,197 237,542 250,132 221,464 173,437 Derivative instruments 9,106 7,774 11,604 4,403 3,717 Dividends payable 14,524 16,934 19,746 9,631 33,968 Accounts payable and other accrued liabilities 166,174 132,087 135,655 162,465 180,018 Total Liabilities $ 4,647,886 $ 4,493,340 $ 4,537,887 $ 6,818,709 $ 7,680,148 Preferred stock Series C — — — 19,494 8,361 Stockholders’ Equity Preferred stock Series B and D — — — 98,241 209,619 Common stock 5 5 5 7 7 Additional paid-in capital 854,222 846,960 849,541 1,088,512 1,090,162 Retained earnings (49,755) (31,779) (24,203) (20,027) (23,105) Accumulated other comprehensive loss (9,876) (9,916) (9,947) (7,042) (7,157) Total Ready Capital Corporation equity 794,596 805,270 815,396 1,159,691 1,269,526 Non-controlling interests 18,450 18,900 18,812 19,061 18,857 Total Stockholders’ Equity $ 813,046 $ 824,170 $ 834,208 $ 1,276,993 $ 1,288,383 Total Liabilities and Stockholders’ Equity $ 5,460,932 $ 5,317,510 $ 5,372,095 $ 8,016,955 $ 8,976,892 Adjusted Book Value per Share $ 14.46 $ 14.84 $ 14.98 $ 14.89 $ 14.87 6/30/2021 6/30/2020 9/30/2020 12/31/2020 3/31/2021 |