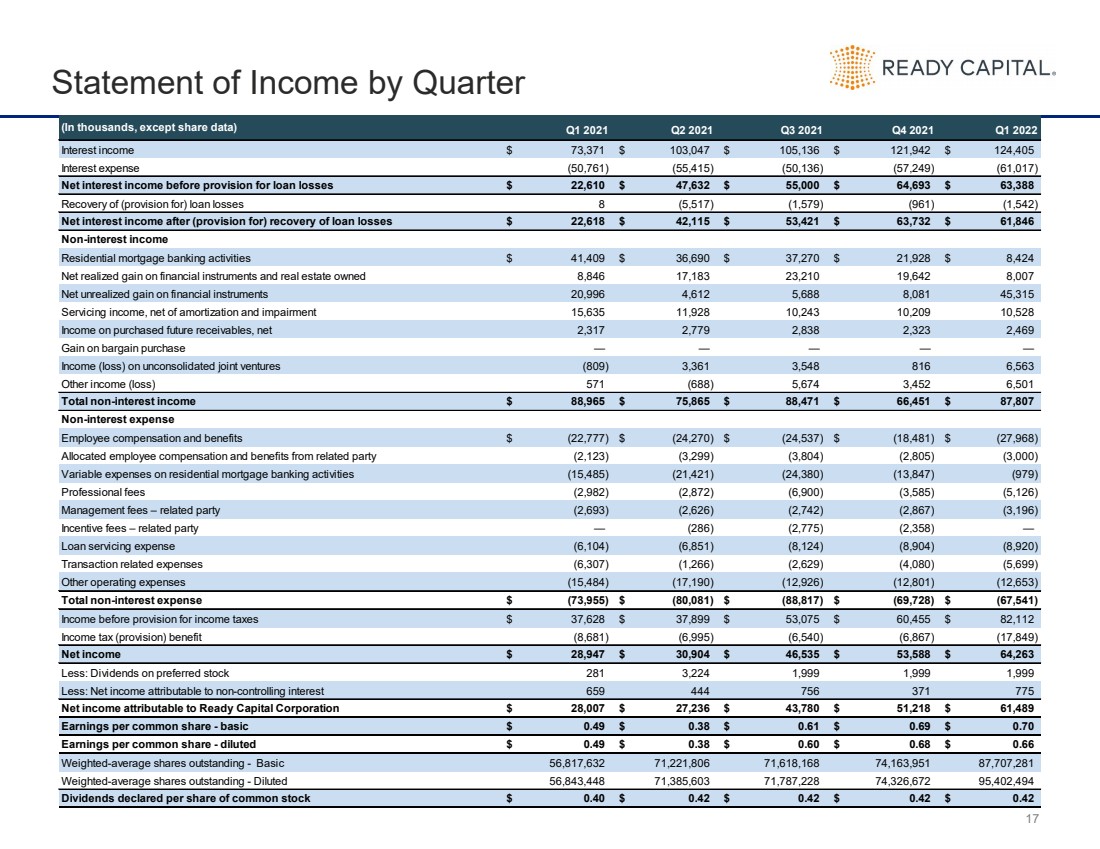
| 17Statement of Income by Quarter (In thousands, except share data) Interest income$73,371 $103,047 $105,136 $121,942 $124,405 Interest expense (50,761) (55,415) (50,136) (57,249) (61,017) Net interest income before provision for loan losses$22,610 $47,632 $55,000 $64,693 $63,388 Recovery of (provision for) loan losses 8 (5,517) (1,579) (961) (1,542) Net interest income after (provision for) recovery of loan losses$22,618 $42,115 $53,421 $63,732 $61,846 Non-interest income Residential mortgage banking activities$41,409 $36,690 $37,270 $21,928 $8,424 Net realized gain on financial instruments and real estate owned8,846 17,183 23,210 19,642 8,007 Net unrealized gain on financial instruments20,996 4,612 5,688 8,081 45,315 Servicing income, net of amortization and impairment 15,635 11,928 10,243 10,209 10,528 Income on purchased future receivables, net2,317 2,779 2,838 2,323 2,469 Gain on bargain purchase Income (loss) on unconsolidated oint ventures(809) 3,361 3,548 816 6,563 Other income (loss) 571 (688) 5,674 3,452 6,501 Total non-interest income$88,965 $75,865 $88,471 $66,451 $87,807 Non-interest expense Employee compensation and benefits$(22,777) $(24,270) $(24,537) $(18,481) $(27,968) Allocated employee compensation and benefits from related party (2,123) (3,299) (3,804) (2,805) (3,000) Variable expenses on residential mortgage banking activities(15,485) (21,421) (24,380) (13,847) (979) Professional fees (2,982) (2,872) (6,900) (3,585) (5,126) Management fees related party (2,693) (2,626) (2,742) (2,867) (3,196) Incentive fees related party (286) (2,775) (2,358) Loan servicing expense (6,104) (6,851) (8,124) (8,904) (8,920) Transaction related expenses(6,307) (1,266) (2,629) (4,080) (5,699) Other operating expenses (15,484) (17,190) (12,926) (12,801) (12,653) Total non-interest expense$(73,955) $(80,081) $(88,817) $(69,728) $(67,541) Income before provision for income taxes$37,628 $37,899 $53,075 $60,455 $82,112 Income tax (provision) benefit (8,681) (6,995) (6,540) (6,867) (17,849) Net income$28,947 $30,904 $46,535 $53,588 $64,263 Less: Dividends on preferred stock281 3,224 1,999 1,999 1,999 Less: Net income attributable to non-controlling interest 659 444 756 371 775 Net income attributable to Ready Capital Corporation$28,007 $27,236 $43,780 $51,218 $61,489 Earnings per common share - basic$0.49 $0.38 $0.61 $0.69 $0.70 Earnings per common share - diluted$0.49 $0.38 $0.60 $0.68 $0.66 Weighted-average shares outstanding - Basic56,817,632 71,221,806 71,618,168 74,163,951 87,707,281 Weighted-average shares outstanding - Diluted56,843,448 71,385,603 71,787,228 74,326,672 95,402,494 Dividends declared per share of common stock$0.40 $0.42 $0.42 $0.42 $0.42 Q1 2021 Q2 2021 Q3 2021 Q4 2021 Q1 2022 |