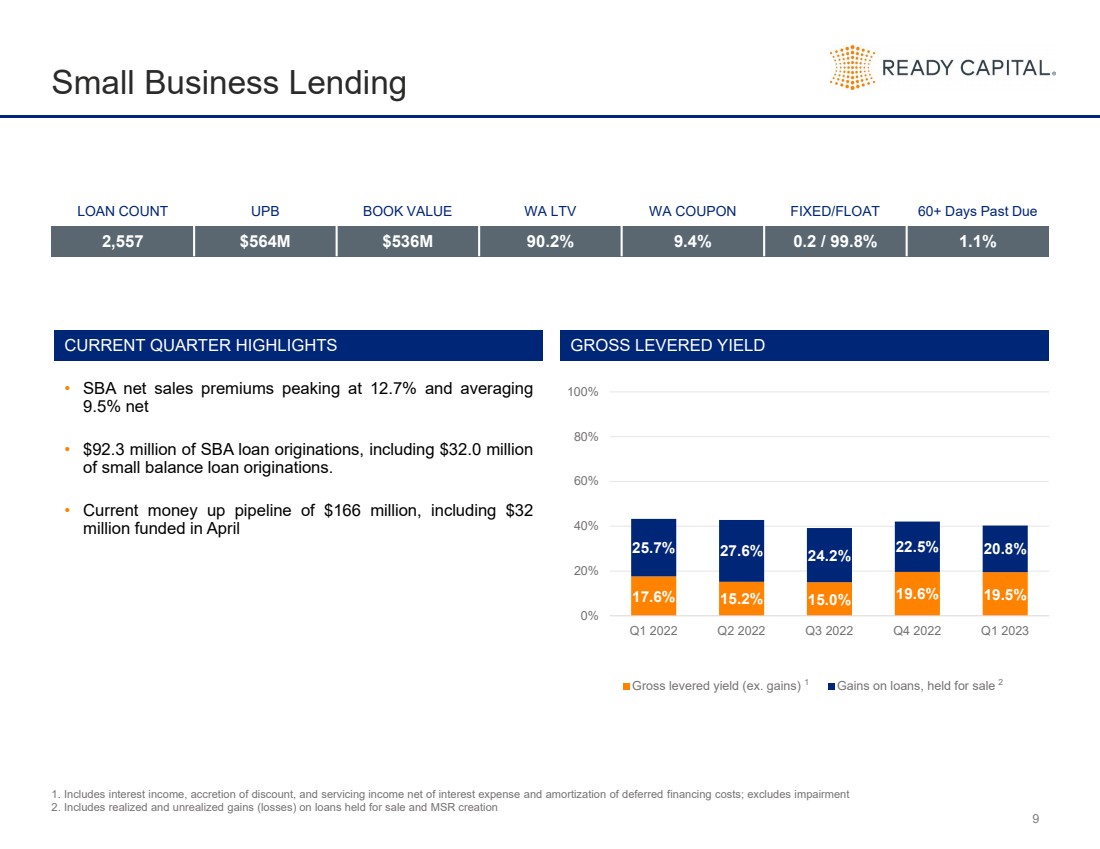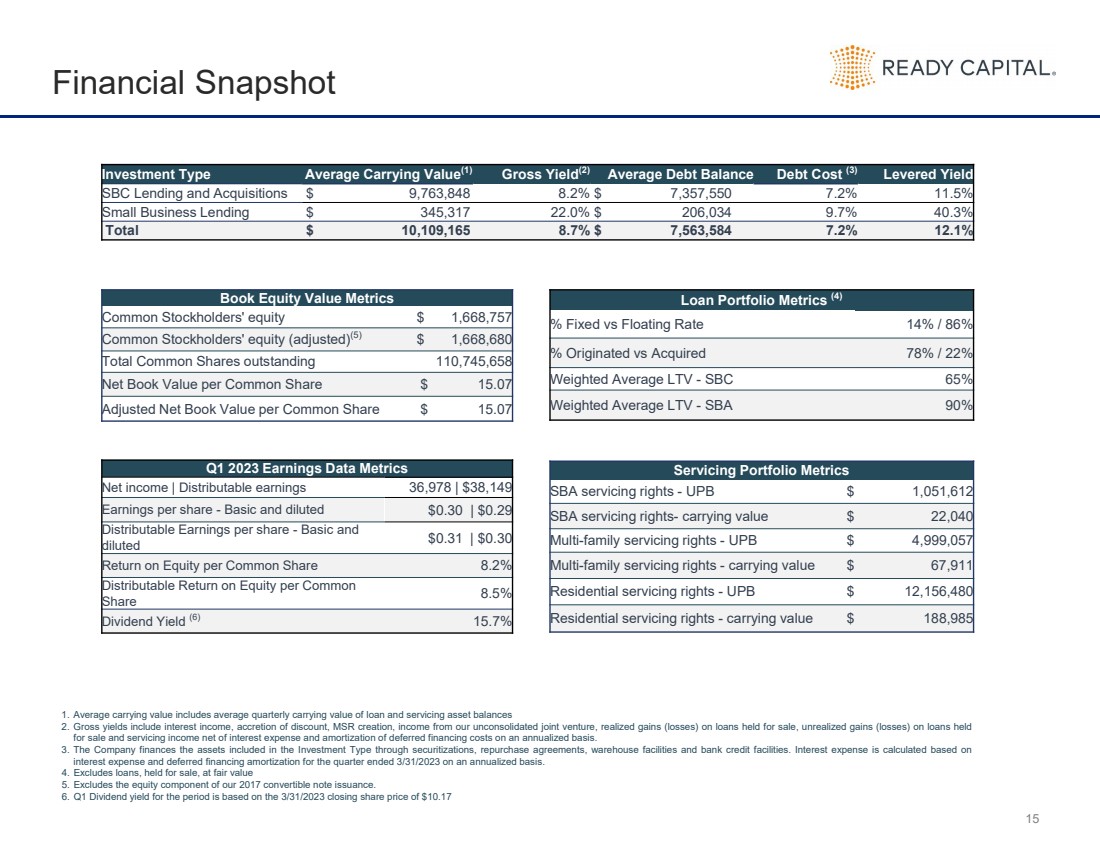
| 15 Financial Snapshot Investment Type Average Carrying Value(1) Gross Yield(2) Average Debt Balance Debt Cost (3) Levered Yield SBC Lending and Acquisitions $ 9,763,848 8.2% $ 7,357,550 7.2% 11.5% Small Business Lending $ 345,317 22.0% $ 206,034 9.7% 40.3% Total $ 10,109,165 8.7% $ 7,563,584 7.2% 12.1% Book Equity Value Metrics Common Stockholders' equity $ 1,668,757 Common Stockholders' equity (adjusted)(5) $ 1,668,680 Total Common Shares outstanding 110,745,658 Net Book Value per Common Share $ 15.07 Adjusted Net Book Value per Common Share $ 15.07 Loan Portfolio Metrics (4) % Fixed vs Floating Rate 14% / 86% % Originated vs Acquired 78% / 22% Weighted Average LTV - SBC 65% Weighted Average LTV - SBA 90% Q1 2023 Earnings Data Metrics Net income | Distributable earnings 36,978 | $38,149 Earnings per share - Basic and diluted $0.30 | $0.29 Distributable Earnings per share - Basic and diluted $0.31 | $0.30 Return on Equity per Common Share 8.2% Distributable Return on Equity per Common Share 8.5% Dividend Yield (6) 15.7% Servicing Portfolio Metrics SBA servicing rights - UPB $ 1,051,612 SBA servicing rights- carrying value $ 22,040 Multi-family servicing rights - UPB $ 4,999,057 Multi-family servicing rights - carrying value $ 67,911 Residential servicing rights - UPB $ 12,156,480 Residential servicing rights - carrying value $ 188,985 1. Average carrying value includes average quarterly carrying value of loan and servicing asset balances 2. Gross yields include interest income, accretion of discount, MSR creation, income from our unconsolidated joint venture, realized gains (losses) on loans held for sale, unrealized gains (losses) on loans held for sale and servicing income net of interest expense and amortization of deferred financing costs on an annualized basis. 3. The Company finances the assets included in the Investment Type through securitizations, repurchase agreements, warehouse facilities and bank credit facilities. Interest expense is calculated based on interest expense and deferred financing amortization for the quarter ended 3/31/2023 on an annualized basis. 4. Excludes loans, held for sale, at fair value 5. Excludes the equity component of our 2017 convertible note issuance. 6. Q1 Dividend yield for the period is based on the 3/31/2023 closing share price of $10.17 |