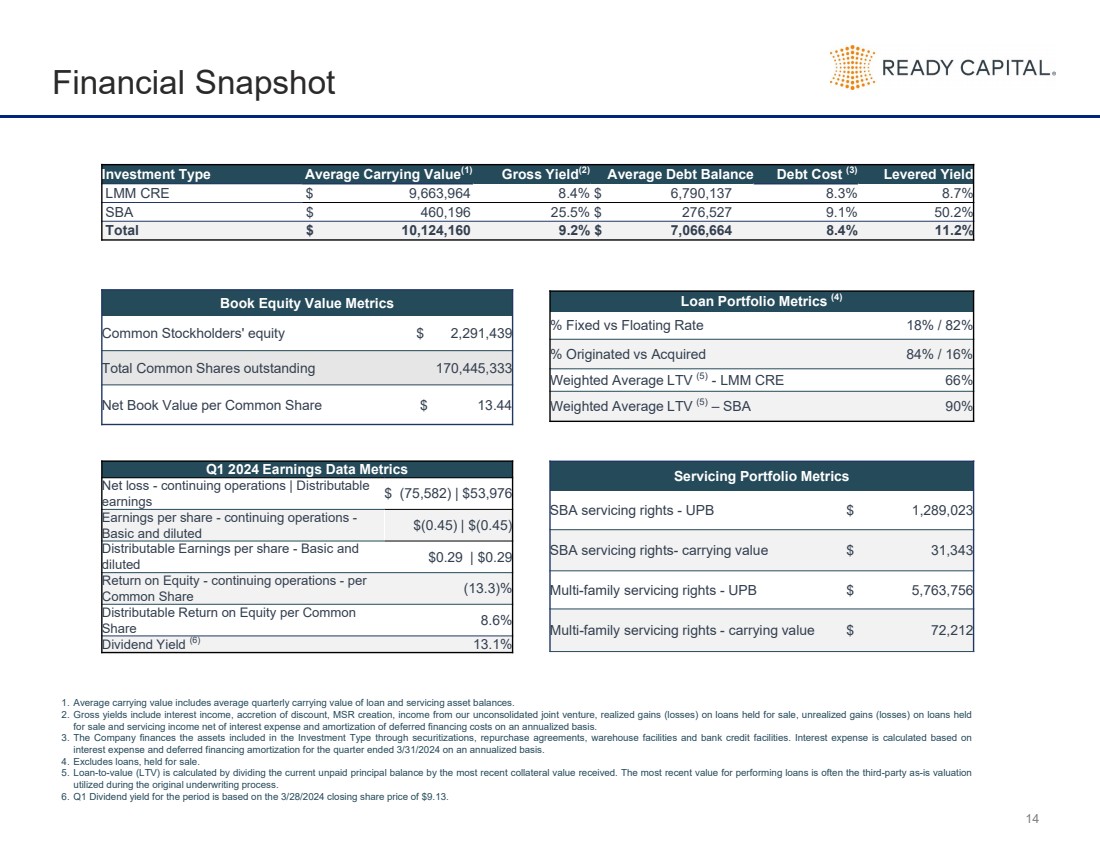
| 14 Financial Snapshot Investment Type Average Carrying Value(1) Gross Yield(2) Average Debt Balance Debt Cost (3) Levered Yield LMM CRE $ 9,663,964 8.4% $ 6,790,137 8.3% 8.7% SBA $ 460,196 25.5% $ 276,527 9.1% 50.2% Total $ 10,124,160 9.2% $ 7,066,664 8.4% 11.2% Book Equity Value Metrics Common Stockholders' equity $ 2,291,439 Total Common Shares outstanding 170,445,333 Net Book Value per Common Share $ 13.44 Loan Portfolio Metrics (4) % Fixed vs Floating Rate 18% / 82% % Originated vs Acquired 84% / 16% Weighted Average LTV (5) - LMM CRE 66% Weighted Average LTV (5) – SBA 90% Q1 2024 Earnings Data Metrics Net loss - continuing operations | Distributable earnings $ (75,582) | $53,976 Earnings per share - continuing operations - Basic and diluted $(0.45) | $(0.45) Distributable Earnings per share - Basic and diluted $0.29 | $0.29 Return on Equity - continuing operations - per Common Share (13.3)% Distributable Return on Equity per Common Share 8.6% Dividend Yield (6) 13.1% Servicing Portfolio Metrics SBA servicing rights - UPB $ 1,289,023 SBA servicing rights- carrying value $ 31,343 Multi-family servicing rights - UPB $ 5,763,756 Multi-family servicing rights - carrying value $ 72,212 1. Average carrying value includes average quarterly carrying value of loan and servicing asset balances. 2. Gross yields include interest income, accretion of discount, MSR creation, income from our unconsolidated joint venture, realized gains (losses) on loans held for sale, unrealized gains (losses) on loans held for sale and servicing income net of interest expense and amortization of deferred financing costs on an annualized basis. 3. The Company finances the assets included in the Investment Type through securitizations, repurchase agreements, warehouse facilities and bank credit facilities. Interest expense is calculated based on interest expense and deferred financing amortization for the quarter ended 3/31/2024 on an annualized basis. 4. Excludes loans, held for sale. 5. Loan-to-value (LTV) is calculated by dividing the current unpaid principal balance by the most recent collateral value received. The most recent value for performing loans is often the third-party as-is valuation utilized during the original underwriting process. 6. Q1 Dividend yield for the period is based on the 3/28/2024 closing share price of $9.13. |