Use these links to rapidly review the document
Table of contents
Index to consolidated financial statements
Table of Contents
As filed with the Securities and Exchange Commission on March 8, 2012
Registration No. 333-
SECURITIES AND EXCHANGE COMMISSION
Washington, D.C. 20549
FORM F-1
REGISTRATION STATEMENT
UNDER THE SECURITIES ACT OF 1933
Acquity Group Limited
(Exact name of registrant as specified in its charter)
Not Applicable
(Translation of Registrant's name into English)
| | | | |
Cayman Islands
(State or other jurisdiction of
incorporation or organization) | | 7389
(Primary Standard Industrial
Classification Code Number) | | Not Applicable
(I.R.S. Employer
Identification Number) |
6th Floor, Alexandra House
18 Chater Road, Hong Kong
(852) 3106-4999
(Address, including zip code, and telephone number, including area code, of Registrant's principal executive offices)
National Corporate Research, Ltd.
10 East 40 Street
New York, N.Y. 10016
(212) 947-7200
(Name, address, including zip code, and telephone number, including area code, of agent for service)
| | |
| Copies to: |
Alan Seem, Esq.
Shearman & Sterling LLP
12th Floor East Tower, Twin Towers
B-12 Jianguomenwai Dajie
Beijing 100022, People's Republic of China
(86-10) 5922 8000 |
|
Allen Wang, Esq.
Latham & Watkins LLP
Unit 2318, China World Trade Office 2
1 Jianguomenwai Dajie
Beijing 100004, People's Republic of China
(86-10) 5965 7041 |
Approximate date of commencement of proposed sale to the public: As soon as practicable after the effective date of this registration statement.
If any of the securities being registered on this form are to be offered on a delayed or continuous basis pursuant to Rule 415 under the Securities Act of 1933, check the following box. o
If this Form is filed to register additional securities for an offering pursuant to Rule 462(b) under the Securities Act, check the following box and list the Securities Act registration statement number of the earlier effective registration statement for the same offering. o
If this Form is a post-effective amendment filed pursuant to Rule 462(c) under the Securities Act, check the following box and list the Securities Act registration statement number of the earlier effective registration statement for the same offering. o
If this Form is a post-effective amendment filed pursuant to Rule 462(d) under the Securities Act, check the following box and list the Securities Act registration statement number of the earliest effective registration statement for the same offering. o
CALCULATION OF REGISTRATION FEE
| | | | |
| | | | |
| |
Title of each class of
securities to be registered
| | Proposed maximum
aggregate
offering price(1)
| | Amount of
registration fee
|
|---|
| |
Ordinary shares, par value US$0.0001 per share(2)(3) | | US$55,000,000 | | US$6,303 |
|
- (1)
- Estimated solely for the purpose of determining the amount of registration fee in accordance with Rule 457(o) under the Securities Act of 1933.
- (2)
- Includes (i) ordinary shares represented by American depositary shares initially offered and sold outside the United States that may be resold from time to time in the United States either as part of their distribution or within 40 days after the later of the effective date of this registration statement and the date the shares are first bona fide offered to the public and (ii) ordinary shares represented by American depositary shares that may be purchased by the underwriters pursuant to an option to purchase additional ordinary shares represented by American depositary shares. The ordinary shares are not being registered for the purposes of sales outside of the United States.
- (3)
- American depositary shares issuable upon deposit of the ordinary shares registered hereby will be registered under a separate registration statement on Form F-6 (Registration No.333- ). Each American depositary share represents ordinary shares.
The Registrant hereby amends this registration statement on such date or dates as may be necessary to delay its effective date until the Registrant shall file a further amendment which specifically states that this registration statement shall thereafter become effective in accordance with Section 8(a) of the Securities Act of 1933, as amended, or until the registration statement shall become effective on such date as the Securities and Exchange Commission, acting pursuant to such Section 8(a), may determine.
Table of Contents
Subject to completion, dated , 2012
The information in this preliminary prospectus is not complete and may be changed. We may not sell these securities until the registration statement filed with the Securities and Exchange Commission is effective. This preliminary prospectus is not an offer to sell these securities and it is not soliciting an offer to buy these securities in any jurisdiction where the offer or sale is not permitted.
Prospectus
American Depositary Shares
Acquity Group Limited

Representing Ordinary Shares
This is the initial public offering of our American depositary shares, or ADSs. We are offering of our ordinary shares in the form of ADSs and the selling shareholders named in this prospectus are selling ordinary shares in the form of ADSs. We will not receive any proceeds from the sale of the ADSs by the selling shareholders. The ADSs may be evidenced by American depositary receipts, or ADRs, and each ADS represents ordinary shares, par value US$0.0001 per ordinary share. Prior to this offering, there has been no public market for our ADSs or our ordinary shares. We currently expect the initial public offering price to be between US$ and US$ per ADS.
We have applied to have the ADSs listed on the New York Stock Exchange, or the NYSE, under the symbol "AQ".
| | | | |
| |
| | Per ADS
| | Total
|
|---|
| |
| Initial public offering price | | US$ | | US$ |
Underwriting discounts and commissions |
|
US$ |
|
US$ |
Proceeds to Acquity Group Limited (before expenses) |
|
US$ |
|
US$ |
Proceeds to the selling shareholders (before expenses) |
|
US$ |
|
US$ |
|
|
|
|
|
|
The underwriters have an option to purchase up to additional ADSs from us and the selling shareholders to cover over-allotments, at the initial public offering price less underwriting discounts and commissions, within 30 days from the date of this prospectus.
Immediately after the completion of this offering, Rong Lu and Khazanah Nasional Berhad will beneficially own and ordinary shares, respectively, which will represent % and %, respectively, of the shareholder voting rights in our company, assuming the underwriters do not exercise their over-allotment option to purchase additional ADSs. See "Principal and selling shareholders."
Investing in the ADSs involves risks. See "Risk Factors" beginning on page 14.
Neither the Securities and Exchange Commission nor any state securities commission or other regulatory body has approved or disapproved of these securities or determined if this prospectus is truthful or complete. Any representation to the contrary is a criminal offense.
The underwriters expect to deliver the ADSs to purchasers on or about , 2012.
| | |
| Citigroup | | Oppenheimer & Co. |
William Blair & Company
, 2012

Table of Contents
Table of contents
| | |
| | Page
|
|---|
Prospectus summary | | 1 |
Risk factors | | 14 |
Special note regarding forward-looking statements | | 37 |
Use of proceeds | | 38 |
Capitalization | | 39 |
Dilution | | 40 |
Dividend policy | | 42 |
Enforceability of civil liabilities | | 43 |
Corporate history and structure | | 44 |
Selected consolidated financial and operating data | | 47 |
Management's discussion and analysis of financial condition and results of operations | | 51 |
Industry overview | | 75 |
Business | | 82 |
Management | | 100 |
Principal and selling shareholders | | 107 |
Related party transactions | | 109 |
Description of share capital | | 112 |
Description of American depositary shares | | 122 |
Shares eligible for future sale | | 135 |
Taxation | | 137 |
Underwriting | | 144 |
Expenses related to this offering | | 151 |
Legal matters | | 152 |
Experts | | 152 |
Where you can find additional information | | 153 |
Conventions that apply to this prospectus | | 154 |
Index to consolidated financial statements | | F-1 |
i
Table of Contents
Prospectus summary
The following summary highlights selected information appearing elsewhere in this prospectus and should be read in conjunction with the more detailed information and financial statements appearing elsewhere in this prospectus. You should read the entire prospectus carefully, including our financial statements and the related notes and the sections entitled "Risk factors" and "Management's discussion and analysis of financial condition and results of operations" before deciding whether to buy our ADSs.
Our business
We are a leading brand e-commerce and digital marketing company that leverages the internet, mobile devices and social media to enhance our clients' brands and e-commerce performance. We are the digital agency of record for a number of well-known global brands in multiple industries, including Allstate Insurance Company, Discover Card's mobile-related business, Shimano, Tommy Bahama and W.W. Grainger Inc., which means that we are the principal provider of brand e-commerce and digital marketing services for these clients.
We deliver end-to-end solutions to address our clients' brand e-commerce and digital marketing needs. We offer three types of services: digital strategy, multi-channel digital marketing and brand e-commerce technology services.
- •
- Digital strategy: We provide our clients a broad array of digital strategy services aimed at enhancing the brand experience, increasing brand loyalty and monetizing their brands. We combine our business and technology expertise to analyze how products, brands and consumers interact and the role that current and emerging technologies play in this digital relationship. We assist clients to develop strategies to translate their brand identity to the digital channel in order to enhance their brand e-commerce websites, integrate the customer's online brand experience with their offline brand experience and increase the conversion of site visits to sales. Our strategies are formulated to deliver quantifiable results for our clients. We also provide business technology optimization, or BTO, services to help our clients assess and improve their business technology assets.
- •
- Multi-channel digital marketing: We assist our clients to create a seamless brand experience across internet, mobile devices and social media applications, allowing them to develop higher value and long-term customer relationships. We employ digital marketing techniques such as targeted online promotional activities, newsfeeds on social network websites, search engine optimization, mobile marketing and location-based services to engage customers with the brand. As a result, we help transform a client's digital brand into an engaging experience for its customers, investors, vendors and prospective employees. We also help our clients analyze and track the effectiveness of these multi-channel digital marketing efforts.
- •
- Brand e-commerce technology: We design and implement online stores and other points of sale for our clients that can supplement their physical store networks or serve as an effective alternative to expanding those networks. In some cases, we also operate websites on behalf of our clients. As a result, we manage or control the user experience of many multinational and multi-lingual digital corporate platforms. Our brand e-commerce technology services also help our clients to create a lasting brand impression with their customers and sell their products and services. In addition, our technology experts assist our clients to enhance the
1
Table of Contents
technical aspects of their platform, such as creating applications and employing software and architectural solutions to fit their specific needs. Our Commerce OnDemand™ solution facilitates our clients' quick integration and implementation of their e-commerce sites.
Our experience and multinational capabilities have enabled us to serve more than 500 companies and their global brands, with many of whom we have had multi-year relationships of up to ten years. In 2011, we derived over 70% of our revenues from clients that were our clients in the previous year.
We have offices in ten cities in the United States and plan to leverage our existing capabilities to strategically grow our business in China, which has the largest population of Internet users in the world, according to an industry source, and is expected to be the third-fastest growing internet retailing market for the next five years, according to research by Euromonitor International in 2012. We have opened offices in Beijing and Shanghai and operate the Chinese websites for several of our clients, including General Motors, Motorola and Underwriter's Laboratories.
As part of our China strategy, we have focused on building our presence and capabilities in the sportswear market. We believe that the brand experience is critical for sports marketing and that sportswear will be a fast-growing e-commerce segment. We recently entered into a joint venture with Li Ning Co., Ltd, or Li Ning, which is China's largest sports brand and is among the top ten sports brands globally in terms of revenues, based on public company filings. This joint venture was established to develop, market and sell Li Ning's sports apparel, shoes and accessories via brand e-commerce and digital marketing in the United States and elevate the Li Ning brand from a national Chinese brand into a global brand. We recently entered into a joint venture relating to k121.com, a leading internet retailing website for sportswear products in China, which sells brands such as Nike, Adidas and Kappa. We plan to introduce other global sports brands to consumers in China through this platform.
Our revenues increased from US$51.1 million in 2009 to US$72.6 million in 2010, and grew further to US$106.7 million in 2011. Our gross profit increased from US$22.0 million in 2009 to US$31.4 million in 2010, and grew further to US$46.1 million in 2011. Our net loss was US$0.1 million and US$3.4 million in 2009 and 2010, respectively. Our net profit was US$8.3 million in 2011. Our adjusted EBITDA increased from US$8.0 million in 2009 to US$10.6 million in 2010 and to US$20.0 million in 2011, representing a CAGR of 57.6% from 2009 to 2011. For a reconciliation of our non-IFRS adjusted EBITDA to the IFRS measure of net profit or loss, see "Selected consolidated financial and operating data—Adjusted EBITDA".
Industry background
We believe the pervasive influence of the internet and other digital media in today's society presents numerous opportunities and challenges for companies seeking to build their brands and sell their products and services. The internet has not only become a channel for e-commerce but also a fundamental communication channel that influences a brand's overall perception, positioning and performance. We believe the rise of social media and mobile internet devices has accelerated these trends.
We believe these trends have created a market for "brand e-commerce," in which one can create an effective and consistent end-to-end digital brand experience for consumers, thereby
2
Table of Contents
translating leading traditional brands into digital brands that generate consumer demand online capable of being monetized through e-commerce platforms.
Brand e-commerce helps brands develop one-on-one digital relationships with their consumers, starting with an initial brand introduction online and potentially continuing to the completion of a transaction.
We believe the growth of brand e-commerce and the attractiveness of our business model is underpinned by the following industry factors:
- •
- Deepening and broadening of the consumer digital experience: Consumers continue to be spurred in part by the proliferation of a broader range of internet-connected devices, such as smartphones, tablets and eReaders, which offer different ways for consumers to stay connected at all times and regardless of location. Furthermore, social networking sites have become hubs of internet activity, augmenting internet usage and influencing consumer behavior.
- •
- Transformation of digital strategies: As internet usage and e-commerce have increased, companies have found that the digital channel has also had an increasing impact on offline sales. As a result, companies are rapidly transforming their business strategies and moving away from a simple storefront platform-based e-commerce approach to providing a complete and rich digital brand experience to their consumers and e-commerce, as a result, is becoming increasingly mainstream.
- •
- Global brands increasingly adopting a digital-driven strategy in emerging markets, such as China: As a result of the rise in Chinese consumer wealth and China's integration into global markets, consumers in China only recently started to connect fashion with "big brands." As a result, China represents a green field opportunity for global brands to take advantage of the digital channel to access this opportunity. Apparel and sportswear industries have been at the forefront of this trend.
Our competitive strengths
We believe that the following strengths contribute to our success and differentiate us from our competitors:
- •
- Market leadership and unique business model;
- •
- Strong relationships with a wide portfolio of leading brands;
- •
- Strategic presence and expertise in China;
- •
- Global brand e-commerce and digital marketing capabilities; and
- •
- Experienced management team with extensive backgrounds in the brand e-commerce and digital marketing industry.
3
Table of Contents
Our strategies
Our goal is to strengthen our position as a leading global provider of brand e-commerce and digital marketing services to established brands by building on our China-related advantages. We intend to achieve our goal through implementing the following key strategies:
- •
- Strengthen our leading position in brand e-commerce and digital marketing;
- •
- Transform top Chinese brands into global brands;
- •
- Introduce global brands into China;
- •
- Pioneer the partnership and principal model for dominant brands; and
- •
- Selectively pursue strategic acquisitions and alliances.
Our challenges
Our ability to achieve our goals and execute our strategies is subject to risks and uncertainties. We believe the following are the major risks and uncertainties that may materially affect us:
- •
- We depend on the continued growth of the market for brand e-commerce and digital marketing services;
- •
- Our ability to manage our growth and the geographical expansion of our business;
- •
- Our ability to keep up with technological developments and users' changing requirements and preferences;
- •
- Our ability to implement our acquisition strategy and manage the charges to earnings resulting from acquisitions;
- •
- Our ability to successfully develop our joint ventures with our partners; and
- •
- Our ability to expand our business in emerging markets, particularly China.
See "Risk factors" and "Special note regarding forward-looking statements" for detailed discussions of these and other risks and uncertainties associated with our business and investing in our ADSs.
Corporate structure
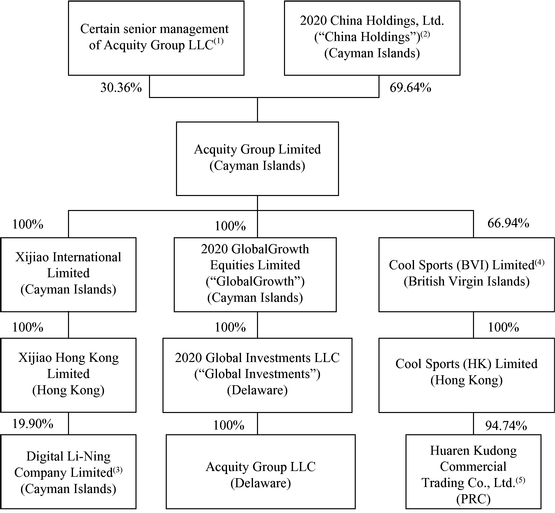
We are a holding company incorporated in the Cayman Islands on August 12, 2010. We conduct substantially all of our business through our principal operating subsidiary, Acquity Group LLC, a Delaware limited liability company established on March 22, 2001. We indirectly own 100% of the equity of Acquity Group LLC.
On March 20, 2008, our subsidiary 2020 GlobalGrowth Equities Limited, or GlobalGrowth, a limited liability company incorporated in the Cayman Islands, acquired 910,100 Class A units of Acquity Group LLC for US$49.0 million. After taking into account the redemption by Acquity Group LLC of 780,089 Class A units from other unit holders immediately thereafter, GlobalGrowth acquired a 70% equity interest in Acquity Group LLC. The remaining 30% of the
4
Table of Contents
outstanding equity interest in Acquity Group LLC was held by certain senior management of Acquity Group LLC. On December 24, 2010, the senior management of Acquity Group LLC contributed all their equity interests in Acquity Group LLC to our wholly-owned subsidiary, 2020 Global Investments LLC, or Global Investments, and in return received newly issued shares in our company.
In anticipation of this offering, we reorganized our corporate structure through a series of transactions. See "Corporate history and structure".
Immediately after the completion of this offering, Rong Lu and Khazanah Nasional Berhad will beneficially own and ordinary shares, respectively, which will represent % and %, respectively, of the shareholder voting rights in our company, assuming the underwriters do not exercise their over-allotment option to purchase additional ADSs. See "Principal and selling shareholders."
The following diagram illustrates our corporate structure prior to the completion of this offering.
5
Table of Contents
The following diagram illustrates our company's corporate structure upon the completion of this offering.
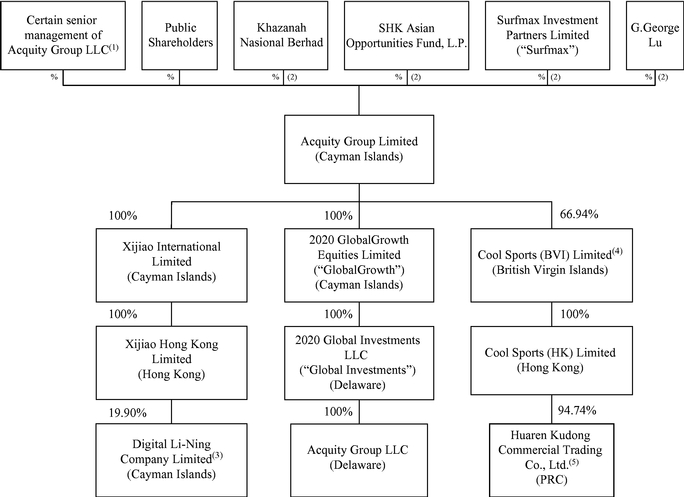
(1) Includes a group of senior management members of Acquity Group LLC who hold their equity interest in our company directly as well as four family limited partnerships that hold our ordinary shares. These senior management members include James Newman, Andrew Peebler, Todd Schwartz, Jonathan Borg-Breen, Jay Dettling, Kevin Doohan, Raymond Grady, Christopher Hauca, Mark Joseph and Rick Nash (resigned recently). See note (10) and notes (12) to (14) to the table of principal and selling shareholders in the "Principal and selling shareholder" section of this prospectus for further details regarding the equity interest held by those family limited partnerships.
(2) Upon the completion of this offering, China Holdings will transfer all of the ordinary shares of our company held by it to certain holders of exchangeable bonds and exchangeable notes, including Khazanah Nasional Bernad (through its subsidiary, Datai Bay Investments Ltd., or Datai Bay), SHK Asian Opportunities Fund, L.P. (through its subsidiary, SHK Asian Opportunities Holdings Ltd., or SHK), Surfmax and G. George Lu, our executive chairman and group chief executive. See notes (4), (7), (9) and (11) to the table of principal and selling shareholders in the "Principal and selling shareholders" section of this prospectus for further details regarding the respective ordinary shares to be received by those exchangeable security holders.
(3) Joint venture relating to brand e-commerce and digital marketing of the Li-Ning brand in the U.S. markets. Li Ning Company Limited, Li Tang and G. George Lu, our executive chairman and group chief executive, hold 19.90%, 30.10% and 30.10% of the equity interest in Digital Li-Ning Company Limited, respectively.
(4) G. George Lu, our executive chairman and group chief executive, Adrian Chan, our director and company secretary, and Shiu Wah Tse hold 25.52%, 5.02% and 2.52% of the equity interest in Cool Sports (BVI) Limited, respectively.
(5) Joint venture relating to the www.k121.com sportswear e-commerce platform in China. Shiu Wah Tse, Yan Wang and Qigong Zhu hold 2.63%, 1.97% and 0.66% of the equity interest of Huaren Kudong Commercial Trading Co., Ltd., respectively. Mr. Tse was an employee of 2020 Equity Partners Limited, or Equity Partners, from June 1, 2008 to March 31, 2011, and currently serves as a consultant for Equity Partners. Under an investment framework agreement entered into among the parties to the joint venture, Cool Sports (HK) Limited, Mr. Tse, Mr. Wang and Mr. Zhu are entitled to 5.00%, 28.00%, 50.25% and 16.75%, respectively, of the total profits of Huaren Kudong Commercial Trading Co., Ltd. If certain sales or revenue thresholds are met, Mr. Tse will transfer to Mr. Wang and Mr. Zhu a certain percentage of profit to which he is entitled. In any event, Mr. Tse has agreed to transfer all his entitlement to profit distributions from Huaren Kudong Commercial Trading Co., Ltd. to
6
Table of Contents
Cool Sports (HK) Limited before January 1, 2014. Huaren Kudong Commercial Trading Co., Ltd. is in the process of increasing its registered capital, which is subject to approvals from relevant PRC governmental authorities. After such proposed capital increase, Cool Sports (HK) Limited, Shiu Wah Tse, Tianjin Muyan Investment Management L.P., Yan Wang and Qigong Zhu will hold 92.46%, 2.25%, 2.93%, 1.74% and 0.62% of the equity interest of Huaren Kudong Commercial Trading Co., Ltd., respectively. Cool Sports (HK) Limited, Shiu Wah Tse, Tianjin Muyan Investment Management L.P., Yan Wang and Qigong Zhu will be entitled to 15.72%, 23.96%, 2.97%, 43.00% and 14.35%, respectively, of the total profits of Huaren Kudong Commercial Trading Co., Ltd.
Corporate information
Our principal executive offices are located at 6th Floor, Alexandra House, 18 Chater Road, Hong Kong. Our telephone number at this address is (852) 3106-4999 and our fax number is (852) 3106-4706. Our registered office is located at Walkers Corporate Services Limited, 87 Mary Street, George Town, Grand Cayman KYI-9005, Cayman Islands.
Investor inquiries should be directed to us at the address and telephone number of our principal executive offices set forth above. Our website is www.acquitygroup.com. The information contained on our website does not constitute part of this prospectus. Our agent for service of process in the United States is National Corporate Research, Ltd., located at 10 East 40 Street, New York, N.Y. 10016.
7
Table of Contents
The offering
| | | |
| Price per ADS | | We estimate that the initial public offering price will be between US$ and US$ per ADS. |
This Offering: |
|
|
| |
ADSs Offered by Us |
|
ADSs |
| |
ADSs Offered by the Selling Shareholders |
|
ADSs |
| |
Total |
|
ADSs |
ADSs Outstanding Immediately After This Offering |
|
ADSs (or ADSs if the underwriters exercise the over-allotment option in full). |
Ordinary Shares Outstanding Immediately After This Offering |
|
ordinary shares (or ordinary shares if the underwriters exercise the over-allotment option in full), excluding ordinary shares issuable upon the exercise of outstanding share options and ordinary shares reserved for issuance under our share incentive plan. |
Over-Allotment Option |
|
We and the selling shareholders have granted to the underwriters an option, exercisable for 30 days from the date of this prospectus, to purchase up to an aggregate of additional ADSs at the initial public offering price listed on the cover page of this prospectus, less underwriting discounts and commissions. |
The ADSs |
|
Each ADS represents ordinary shares, par value US$0.0001 per ordinary share. The ADSs will be evidenced by ADRs. |
|
|
The depositary will be the holder of the ordinary shares underlying the ADSs and you will have the rights of an ADR holder as provided in the deposit agreement among us, the depositary and owners and beneficial owners of ADSs from time to time. |
|
|
You may surrender your ADSs to the depositary to withdraw the ordinary shares underlying your ADSs. The depositary will charge you a fee for such an exchange. |
|
|
We may amend or terminate the deposit agreement for any reason without your consent. If an amendment becomes effective, you will be bound by the deposit agreement as amended if you continue to hold your ADSs. |
8
Table of Contents
| | |
| | | To better understand the terms of the ADSs, you should carefully read the section in this prospectus entitled "Description of American depositary shares". We also encourage you to read the deposit agreement, which is an exhibit to the registration statement that includes this prospectus. |
Timing and Settlement for ADSs |
|
The ADSs are expected to be delivered against payment on, 2012. The ADRs evidencing the ADSs will be deposited with a custodian for, and registered in the name of a nominee of, The Depositary Trust Company, or DTC, in New York, New York. DTC, and its direct and indirect participants, will maintain records that will show the beneficial interests in the ADSs and facilitate any transfer of the beneficial interests. |
Use of Proceeds |
|
We estimate that we will receive net proceeds of approximately US$ million (or US$ million if the underwriters exercise the over-allotment option in full) from this offering, after deducting the underwriting discounts, commissions and estimated offering expenses payable by us. We intend to use our net proceeds from this offering for the following purposes: |
| | • approximately US$ million to conduct acquisitions and further expand our footprint in North America and Europe, as well as deepen our expertise in key areas; |
| | • approximately US$ million to conduct strategic investments in the China market; and |
| | • the remainder to fund our working capital and for general corporate purposes. |
|
|
See "Use of proceeds" for additional information. |
|
|
We will not receive any of the proceeds from the sale of the ADSs by the selling shareholders. |
Risk Factors |
|
See "Risk factors" and other information included in this prospectus for a discussion of the risks you should carefully consider before deciding to invest in our ADSs. |
Listing |
|
We have applied to have the ADSs quoted on the New York Stock Exchange. Our ordinary shares will not be listed on any exchange or quoted for trading on any over-the-counter trading system. |
New York Stock Exchange symbol |
|
"AQ" |
Depositary |
|
JPMorgan Chase Bank, N.A. |
9
Table of Contents
| | |
| Lock-up | | We and our directors, officers and other shareholders have agreed with the underwriters not to sell, transfer or dispose of any ADSs, ordinary shares or similar securities for a period of 180 days after the date of this prospectus. See "Underwriting". |
Reserved ADSs |
|
At our request, the underwriters have reserved for sale, at the initial public offering price, up to 5% of the ADSs offered by this prospectus to our directors, officers, employees, business associates and related persons through a directed share program. |
10
Table of Contents
Summary consolidated financial and operating data
The following summary consolidated statement of operations data for the years ended December 31, 2009, 2010 and 2011 of our company, and the consolidated statement of financial position data as of December 31, 2009, 2010 and 2011 of our company, have been derived from our audited consolidated financial statements, which have been audited by Ernst & Young LLP, an independent registered accounting firm. The report of Ernst & Young LLP on those financial statements is included elsewhere in this prospectus.
You should read the summary consolidated financial data in conjunction with our financial statements and the related notes and "Management's discussion and analysis of financial condition and results of operations" included elsewhere in this prospectus. Our consolidated financial statements are prepared and presented in accordance with IFRS, as issued by the International Accounting Standards Board. Our historical results do not necessarily indicate our results expected for any future periods.
| | | | | | | | | | |
| | |
| | Year ended December 31, | |
|---|
(Amounts in thousands of US$,
except for per share data)
| |
|---|
| | 2009
| | 2010
| | 2011
| |
|---|
| | |
Summary Consolidated Statement of Comprehensive Income (Loss) Data | | | | | | | | | | |
Revenues | | | 51,087 | | | 72,559 | | | 106,655 | |
Cost of sales | | | (29,132 | ) | | (41,150 | ) | | (60,543 | ) |
| | | | |
Gross profit | | | 21,955 | | | 31,409 | | | 46,112 | |
Selling and distribution costs | | | (4,851 | ) | | (6,734 | ) | | (7,750 | ) |
Administrative expenses | | | (14,204 | ) | | (19,866 | ) | | (22,543 | ) |
| | | | |
Operating profit | | | 2,900 | | | 4,809 | | | 15,819 | |
Finance income | | | 69 | | | * | | | 87 | |
Other non-operating income | | | 445 | | | 24 | | | — | |
Finance costs | | | (2,588 | ) | | (6,311 | ) | | (62 | ) |
Equity in earnings (losses) of joint venture | | | — | | | — | | | (1,037 | ) |
Other non-operating expenses | | | — | | | (41 | ) | | — | |
| | | | |
Profit (loss) before tax | | | 826 | | | (1,519 | ) | | 14,807 | |
Income tax benefit (expense) | | | (897 | ) | | (1,853 | ) | | (6,472 | ) |
| | | | |
Net profit (loss) | | | (71 | ) | | (3,372 | ) | | 8,335 | |
| | | | |
Profit (loss) attributable to: | | | | | | | | | | |
Equity holders of the company | | | (1,465 | ) | | (5,533 | ) | | 8,607 | |
Non-controlling interests | | | 1,394 | | | 2,161 | | | (272 | ) |
Pre-acquisition equity holders | | | — | | | — | | | — | |
Other comprehensive income | | | — | | | — | | | 102 | |
| | | | |
| | | (71 | ) | | (3,372 | ) | | 8,437 | |
| | | | |
Earnings per share attributable to equity holders of the company | | | | | | | | | | |
—Basic earnings (loss) per share | | | (1,465.1 | ) | | (5.0 | ) | | 0.23 | |
—Diluted earnings (loss) per share | | | (1,465.1 | ) | | (5.0 | ) | | 0.23 | |
Other Financial Data: | | | | | | | | | | |
Adjusted EBITDA(1) | | | 8,036 | | | 10,640 | | | 19,959 | |
| | |
(1) We define adjusted EBITDA, a non-IFRS measure, as net income (loss), plus interest expense, income taxes, depreciation and amortization, impairment losses, other expenses and costs. For the reconciliation of adjusted EBITDA to net income (loss), see "—Adjusted EBITDA" below.
* — Less than 0.1
11
Table of Contents
| | | | | | | | | | |
| | |
��
| | As of December 31, | |
|---|
(Amounts in thousands of US$)
| | 2009
| | 2010
| | 2011
| |
|---|
| | |
Summary Consolidated Statement of Financial Position Data | | | | | | | | | | |
Non-current assets | | | 37,566 | | | 35,935 | | | 38,557 | |
Current assets | | | 32,534 | | | 31,670 | | | 40,990 | |
| | | | |
Total assets | | | 70,100 | | | 67,605 | | | 79,547 | |
| | | | |
Total equity (deficit) | | | (1,101 | ) | | 55,997 | | | 64,434 | |
| | | | |
Non-current liabilities | | | 61,033 | | | 4,115 | | | 5,379 | |
Current liabilities | | | 10,168 | | | 7,493 | | | 9,734 | |
| | | | |
Total liabilities | | | 71,201 | | | 11,608 | | | 15,113 | |
| | | | |
Total equity and liabilities | | | 70,100 | | | 67,605 | | | 79,547 | |
| | |
| | | | | | | | | | |
| | |
| | Year Ended December 31, | |
|---|
| | 2009
| | 2010
| | 2011
| |
|---|
| | |
Selected Operating Data | | | | | | | | | | |
Average Number of Project Personnel | | | 164 | | | 202 | | | 288 | |
Project Personnel Utilization Rate | | | 73.4% | | | 79.6% | | | 80.5% | |
Project Personnel Average Realized Billing Rate | | US$ | 157/hour | | US$ | 162/hour | | US$ | 164/hour | |
Total hours billed to our clients | | | 226,836 | | | 333,224 | | | 475,807 | |
| | |
Adjusted EBITDA
To provide investors with additional information regarding our financial results, we have disclosed in this prospectus adjusted EBITDA, a non-IFRS financial measure. We have provided a reconciliation of adjusted EBITDA to net income (loss), the most directly comparable IFRS financial measure.
We have included adjusted EBITDA in this prospectus because it is a key measure used by our management and board of directors to understand and evaluate our core operating performance and trends, to prepare and approve our annual budget and to develop short- and long-term operational plans. In particular, the exclusion of certain expenses in calculating adjusted EBITDA can provide a useful measure for period-to-period comparisons of our core business. Specifically we believe it identifies the expenses associated with the acquisition of Acquity Group LLC, many of which did not occur after December 31, 2010. Accordingly, we believe that adjusted EBITDA provides useful information to investors and others in understanding and evaluating our operating results in the same manner as our management and board of directors.
Our use of adjusted EBITDA has limitations as an analytical tool, and you should not consider it in isolation or as a substitute for analysis of our results as reported under IFRS. Some of these limitations are:
- •
- although depreciation and amortization are non-cash charges, the assets being depreciated and amortized may have to be replaced in the future, and adjusted EBITDA does not reflect cash capital expenditure requirements for such replacements or for new capital expenditure requirements;
- •
- adjusted EBITDA does not reflect changes in, or cash requirements for, our working capital needs;
12
Table of Contents
- •
- adjusted EBITDA does not reflect the potentially dilutive impact of equity-based compensation;
- •
- adjusted EBITDA does not reflect tax payments that may represent a reduction in cash available to us; and
- •
- other companies, including companies in our industry, may calculate adjusted EBITDA differently, which reduces its usefulness as a comparative measure.
Because of these limitations, you should consider adjusted EBITDA alongside other financial performance measures, including various cash flow metrics, net income (loss) and our other IFRS results. The following table presents a reconciliation of adjusted EBITDA for each of the periods indicated:
| | | | | | | | | | | |
| | |
| | Year ended December 31, | |
|---|
(Amount in thousands of US$)
| | 2009
| | 2010
| | 2011
| |
|---|
| | |
Net profit (loss) | | | (71 | ) | | (3,372 | ) | | 8,335 | |
Interest expense, net of Interest Income | | | | | | | | | | |
| | Relating to business operations at Acquity Group LLC | | | 111 | | | 14 | | | (87 | ) |
| | Relating to acquisition of Acquity Group LLC by Acquity Group Limited | | | 2,407 | | | 6,298 | | | 62 | |
Income tax expense (benefit) | | | 897 | | | 1,853 | | | 6,472 | |
Depreciation and amortization | | | | | | | | | | |
| | Relating to business operations at Acquity Group LLC | | | 842 | | | 941 | | | 1,469 | |
| | Intangible assets affecting administrative expense relating to the Acquisition | | | 2,750 | | | 2,555 | | | 2,500 | |
Impairment loss | | | — | | | — | | | — | |
Other expenses and costs(1) | | | 1,100 | | | 2,351 | | | 1,208 | |
| | | | |
Adjusted EBITDA | | | 8,036 | | | 10,640 | | | 19,959 | |
| | |
(1) Includes advisory fees paid in connection with the issuance of the convertible bonds and acquisition of Acquity Group LLC, non-cash expenses in connection with the cancellation of incentive units in preparation for this offering, management fees paid to Equity Partners, professional fees related to an aborted financing transaction and the initial public offering related fees.
13
Table of Contents
Risk factors
An investment in our ADSs involves significant risks. You should carefully consider the risks described below as well as other information in this prospectus, including our consolidated financial statements and related notes, before you decide to buy our ADSs. If any of the following risks actually occurs, our business, prospects, financial condition and results of operations could be materially harmed, the trading price of our ADSs could decline and you could lose all or part of your investment.
Risks related to our business and industry
Brand e-commerce and digital marketing are emerging market segments, which makes it difficult to evaluate our current business and future prospects.
Brand e-commerce and digital marketing are relatively new and rapidly evolving market segments. Some of our current or potential clients have little or no experience using digital marketing and brand e-commerce technology services and have allocated only limited portions of their marketing budgets to such services. The adoption of digital marketing and brand e-commerce technology services, particularly by entities that have historically relied upon traditional channels, requires the acceptance of a new way of conducting business. In particular, our success depends on the general public's continued willingness to use the internet as a means to purchase goods, share information, communicate and conduct commercial transactions. If consumers become unwilling to use the internet for communications or commerce for any reason, including lack of access to high-speed communications equipment, congestion of traffic on the internet, outages or delays, disruptions or damage to users' computers or other digital devices, increases in the cost of accessing the internet and security and privacy risks or the perception of such risks, our businesses will suffer. If there is any reversal or slowdown of the trend towards the development of the brand e-commerce and digital marketing sector, our clients' budgets for digital advertising may decrease, which would adversely affect our business, financial condition and results of operations.
We cannot assure you that the market for brand e-commerce technology services will continue to grow. If the market for such services fails to continue to develop or develops more slowly than we anticipate, our ability to grow our business may be limited and our revenues may decrease. In particular, our services depend to a significant extent on usage of social media, and certain countries, such as China and those in the Middle East, may restrict the use of social media for political and other reasons.
Our failure to manage growth and geographical expansion of our business could harm us.
We are continuing our efforts to grow and diversify our business both in the United States and internationally. We experienced rapid headcount growth during the past several years. As of December 31, 2009, 2010 and 2011, we had 269, 356 and 458 full-time employees, including 165, 240 and 334 project personnel, respectively. We have also recently expanded to ten offices in the United States as well as offices in Beijing and Shanghai, China. This growth has placed, and will continue to place, demands on our operational and financial infrastructure. To effectively manage our growth initiatives, we will need to continue to expand, improve and adapt our personnel, operations, infrastructure and financial and information management systems and continue to implement adequate controls. These enhancements and improvements
14
Table of Contents
are likely to be complex and could require significant operating expenses, capital expenditures and allocation of valuable management resources. We may also have to expand our management team by recruiting and employing additional experienced executives and employees. If we are unable to adapt our systems and business, put adequate controls in place and expand our management team in a timely manner to accommodate our growth, our business may be adversely affected.
In addition, our ability to accurately budget project personnel headcount needs and maintain an appropriately sized workforce will affect our financial condition and performance. The utilization rate of our project personnel was 73.4%, 79.6% and 80.5% for the years ended December 31, 2009, 2010 and 2011, respectively. If we fail to maintain a high utilization rate, our financial condition and results of operations may be materially and adversely affected.
Disputes with our joint venture partners and other business partners may adversely affect our business.
We have in the past formed, and may in the future form, joint ventures, consortiums or other cooperative relationships with other parties to jointly engage in certain business activities. We recently entered into a joint venture with Li Ning, to develop, market and sell Li Ning's sports apparel, shoes and accessories via brand e-commerce and digital marketing in the U.S. We also recently entered into a joint venture relating to k121.com, a leading e-commerce platform for selling sportswear products in China. Our joint venture partners and other business partners may (i) have economic or business interests or goals that are inconsistent with ours; (ii) take actions contrary to our instructions or requests or contrary to our policies or objectives; (iii) be unable or unwilling to fulfill their obligations under the relevant joint venture agreements or other cooperative arrangements, including their obligation to make required capital contributions; or (iv) have financial difficulties. Entering into joint ventures with companies and individuals based in foreign countries may subject us to changes in economic and political conditions in those foreign countries, as well as relevant laws and regulations. For example, operating our joint venture relating to k121.com in China may subject us to changes in economic and political conditions in China as well as relevant PRC laws and regulations regarding foreign-invested enterprises, including foreign currency exchange rules. See "—Strict PRC laws on foreign investment may have an adverse impact on the operation of our joint venture in China and impede our business expansion in China." In addition, as PRC laws and regulations are evolving gradually, their interpretation and enforcement involve significant uncertainties that could limit the reliability of the legal protections available to us. The PRC administrative and court authorities also have significant discretion in interpreting and implementing statutory terms. Thus, it may be more difficult to evaluate the outcome of administrative and court proceedings and the level of legal protection we have in the PRC legal system than in more developed legal systems. As a result, we may encounter difficulties when bringing legal claims against our PRC-based joint venture partners.
A serious dispute with our joint venture partners or other business partners may cause the loss of business opportunities or disruption to or termination of the relevant project or business venture. Such dispute may also give rise to litigation or other legal proceedings, which would divert our management's attention and other resources, and if a decision or award is rendered against us, we could be required to pay significant monetary damages, assume other liabilities and suspend or terminate the related project or operations. In the event that we encounter
15
Table of Contents
any of the foregoing issues, our business, financial condition and results of operations may be materially and adversely affected.
Implementing our acquisition strategy could result in dilution and operating difficulties leading to a decline in our operating profit.
A key element of our business strategy involves expansion through the selective acquisitions of businesses, assets, products or technologies and strategic alliances that can enhance our existing capabilities or provide us with new capabilities and platforms strategic to brand e-commerce and digital marketing. We evaluate and explore strategic acquisition opportunities as they arise, including business combination transactions and the purchase or sale of assets, including tangible and intangible assets such as intellectual property. Acquisitions using our ordinary shares or ADSs as consideration could also result in considerable dilution for our shareholders. Acquisitions may require significant capital infusions, typically entail many risks and could result in unforeseen difficulties, disruptions, distractions and expenditures in assimilating and integrating with the operations, personnel, technologies, products and information systems of acquired companies or businesses. We have in the past and may in the future experience delays in the timing and successful completion of such activities. These challenges may be magnified as the size of the acquisition increases. Furthermore, these challenges would be even greater if we acquired a business or entered into a business combination transaction with a company that was larger and more difficult to integrate than the companies and assets we have acquired in the past. Moreover, an acquisition may not succeed or the anticipated benefits of the acquisition may not be realized. A significant number of clients of the acquired businesses may cease doing business with us, key personnel of an acquired company may decide not to work for us or we may be required to enter into a geographic or business market in which we have little or no prior experience. Any of these circumstances could have an adverse effect on our operating profit and our results of operations generally.
We plan to continue to expand our business in emerging markets, with a particular focus on China, where we have limited operating experience, which makes our business susceptible to numerous business risks and challenges.
Our growth strategy involves expanding our business in emerging markets, with a particular focus on China. However, we have limited operating experience in these markets, and we cannot assure you that our expansion strategy in these markets will be successful. Our experience in the United States may not be relevant to our ability to expand in emerging markets. In addition, our lack of a track record in emerging markets increases our execution risks and the risks described below:
- •
- competition with local or global companies operating in these markets, which could cause us to lose clients or business or put pressure on the pricing of our services;
- •
- compliance with local legal and regulatory requirements, including relevant PRC laws and regulations regarding foreign-invested enterprises, such as the possible need for us to obtain an internet contact provider license in China or foreign currency exchange rules, which could result in additional expenses and/or fines and penalties for failure to comply;
- •
- fluctuations in foreign currency exchange rates, which could impact our revenues and costs in overseas markets;
16
Table of Contents
- •
- greater difficulty in accounts receivable collection, which could negatively impact our revenues and gross profit;
- •
- potential adverse tax consequences, such as PRC withholding tax applicable to interest and dividends payable to investors that are "non-resident enterprises";
- •
- uncertain political and economic climates, which could disrupt our business;
- •
- different employer/employee relationships than what we are accustomed to in our current operations, which could impact our operational efficiency and level of client service;
- •
- language and cultural barriers; and
- •
- price controls or other restrictions on foreign currency.
Some of these factors may cause our costs of doing business in emerging markets to exceed our comparable costs in the U.S. market. We cannot assure you that our global expansion strategy will be successful. If we fail to execute our strategy to expand our business in emerging markets, including China, our growth, financial prospects and results of operations may be adversely affected.
Our clients operate in rapidly changing industries, which makes our operating results difficult to predict.
The industries in which our clients operate, including the retail, technology, media, telecommunications and financial services industries, are rapidly evolving, making our risks, capital needs and operating results difficult to predict. Any failure to adapt our business in response to changes affecting our clients' industries or businesses could adversely affect our operating results. As a result, our quarterly and annual revenues, operating results and growth rates are likely to fluctuate significantly and we believe that quarter-to-quarter and year-to-year comparisons of our revenues and operating results may not be accurate indicators of future performance.
Any downturn in the retail sector may adversely affect our business operations and financial condition.
We have generated a significant portion of our revenues from the retail sector, which accounted for 42.1%, 44.2% and 49.3% of our revenues for the years ended December 31, 2009, 2010 and 2011, respectively. Any downturn in consumer spending in the retail sector may cause our clients in that sector to scale back the resources and spending they devote to digital strategy, digital marketing and brand e-commerce technology services, which may in turn adversely affect our business operations and financial condition.
We incurred net losses in 2008, 2009 and 2010 and may incur net losses in the future.
For the years ended December 31, 2008, 2009 and 2010, we incurred net losses of US$10.3 million, US$0.1 million and US$3.4 million, respectively. Our losses primarily resulted from the impact of non-cash items, such as non-operating expenses in connection with the acquisition of Acquity Group LLC in March 2008, as well as the finance costs associated with the convertible bonds issued by GlobalGrowth in February 2008. For example, we incurred impairment loss on goodwill and intangible assets in the amount of US$8.3 million in 2008 and also incurred interest expense on convertible bonds in the amounts of US$3.3 million
17
Table of Contents
US$4.2 million and US$3.0 million for the years ended December 31, 2008, 2009, 2010, respectively. Most of the expenses in connection with the acquisition of Acquity Group LLC and the issuance of the convertible bonds did not recur after December 31, 2010. We had net profit of US$8.3 million for the year ended December 31, 2011. However, our ability to maintain profitability is also affected by various other factors, many of which are beyond our control. For example, the success of our digital strategy, digital marketing and brand e-commerce technology services depends on the demand for our services driven by the global trend towards increased internet usage. In addition, our ability to be profitable depends on our ability to control our costs and operating expenses, which we expect will increase as we expand our business. We cannot assure you that we can sustain profitability or avoid net losses in the future. If we fail to increase revenues at the rate we anticipate or if our costs and operating expenses increase without a commensurate increase in our revenues, our business, financial condition and results of operations will be adversely affected.
If we fail to keep up with the technological developments and users' changing requirements and preferences, our business and prospects may be materially and adversely affected.
The brand e-commerce and digital marketing industries are subject to rapid changes in technology, user preferences, the nature of services offered and business models. Our success will depend on our ability to keep up with the changes in technology and user behavior resulting from technological developments, such as increasing use of different digital devices and use of social networks. If we do not adapt our services to such changes in an effective and timely manner and deliver results such as enhanced brand experience or increased e-commerce spending, we may suffer from reduced demand for our services.
We periodically enhance and expand our digital marketing or e-commerce technology and systems, network infrastructure and other technologies to accommodate increases in the service volume due to factors including launches of new projects or engagements and seasonal fluctuations in client and consumer demand. To remain competitive, we must enhance and improve the responsiveness, functionality and features of our brand e-commerce and digital marketing platforms, and develop and introduce new business offerings and programs. Any inability to enhance and expand our existing technology, systems or network infrastructure to manage such increased business volume may make our platform less attractive to clients, cause unanticipated systems disruptions, slower response times and a decline in client services, including impaired quality and speed of order fulfillment. We may be unable to improve and increase the capacity of our network infrastructure sufficiently or to anticipate and react to expected increases in the use of the platform to handle increased volume, or to obtain needed related services from third-party suppliers. We may also fail to use new technologies effectively or fail to adapt our proprietary technology and systems to client requirements or emerging industry standards. If any of these issues arise, our financial condition and results of operations could be adversely affected.
Charges to earnings resulting from acquisitions may adversely affect our financial condition and results of operations.
In connection with our acquisition of Acquity Group LLC in March 2008, we recorded goodwill of US$25.2 million and intangible assets, including customer relationship and trademarks, of US$18.8 million at the date of acquisition. We incurred impairment losses on goodwill and intangible assets of US$8.3 million in 2008 due to the unfavorable economic conditions at the
18
Table of Contents
date of the impairment test, which substantially reduced our net profit. In addition, we recorded amortization expenses of US$2.5 million in each of 2009, 2010 and 2011 in relation to the customer relationships acquired in the acquisition. For any business combination that we consummate, we will recognize the identifiable assets acquired, the liabilities assumed and any non-controlling interest in acquired companies generally at their acquisition date fair values and, in each case, separately from goodwill. Goodwill as of the acquisition date is measured as the excess amount of consideration transferred, which is also generally measured at fair value, and the net of the acquisition date amounts of the identifiable assets acquired and the liabilities assumed. After an acquisition is completed, the following factors could result in material charges and adversely affect our business, financial condition and results of operations may adversely affect our cash flows:
- •
- costs incurred to combine the operations of companies we acquire, such as employee retention, redeployment or relocation expenses;
- •
- impairment of goodwill or intangible assets;
- •
- amortization of intangible assets acquired;
- •
- a reduction in the useful lives of intangible assets acquired;
- •
- charges to our operating results resulting from expenses incurred to effect the acquisition; and
- •
- changes in the estimate of fair value of contingent consideration.
Substantially all of these costs will be accounted for as expenses that will decrease our profit and earnings per ADS for the periods in which those costs are incurred. Charges to our operating results in any given period could differ substantially from other periods based on the timing and size of our acquisitions and the extent of integration activities. If we undertake any acquisitions in the future, there may be impairment charges to our earnings resulting from acquisitions, which may adversely affect our financial condition and results of operations.
The digital marketing and e-commerce industry is highly competitive; if we cannot effectively compete, our business may be adversely affected.
The digital marketing and e-commerce industry is relatively new and highly competitive. We compete with the digital advisory arms of strategic consulting firms for our digital strategies services, with digital marketing agencies for our multi-channel digital marketing services and with providers of e-commerce solutions that enable online sales for our brand e-commerce technology services. Our competitors in these different service sectors could also adopt our end-to-end service model and become our direct competitors in all categories of services. We expect competition to intensify as the industry matures. Some of our competitors have more clients, greater brand or name recognition and greater financial, technical, marketing and public relations resources than we do. Competition for clients is intense, and we may not be able to add new clients or keep existing clients on favorable terms, or at all. Furthermore, our industry, and the related technology, is evolving quickly. As a result, new and unknown market entrants pose a threat to our business and may result in pressure on our billing rates. Current or future competitors may also develop or offer services that are comparable or superior to ours at a lower price, which could affect our ability to retain existing clients and attract new clients. In addition, current and potential competitors have established or may establish
19
Table of Contents
strategic alliances among themselves or other third parties to increase their ability to address customer needs. Accordingly, new competitors or alliances among competitors may emerge and rapidly acquire significant market share. We cannot assure you that we will be able to continue to compete successfully with existing competitors or any new competitors. If we fail to compete successfully, the market share of our digital marketing and e-commerce technology services would be adversely affected, which in turn would adversely affect our long-term business growth, profitability and results of operations.
Many of our clients outsource their brand e-commerce business to us to capitalize on our experience and expertise. Our business could also be materially adversely affected if our clients decrease their level of such outsourcing. This is particularly likely to occur during general economic downturns, when corporations are more likely to bring previously outsourced functions back in-house to avoid or delay layoffs or reduce marketing spending, which may adversely affect our business, financial condition and results of operations.
We rely on third parties to provide a number of important services in connection with our business, and any disruption to the provision of these services to us could materially and adversely affect our business and results of operations.
Our business substantially depends upon services provided by third parties and relationships with third parties, including subcontractors, web-hosting software and hardware providers and payment service providers. We also engage independent subcontractors to provide services in order to meet client demand that exceeds the capacity of our project personnel. If the third parties on which we rely fail to provide their services effectively, terminate their service or license agreements or discontinue their relationships with us, we could suffer service interruptions, reduced revenues or increased costs, any of which may have a material adverse effect on our business, financial condition and results of operations. Certain third-party service providers could be difficult and costly to replace, and any disruption to the provision of these services to us may have a material adverse effect on our business, financial condition and results of operations.
General economic conditions, particularly in the United States, may adversely affect our financial condition and results of operations.
General economic conditions may adversely affect our financial condition and results of operations. The direction and relative strength of the global economy as well as the markets in which we compete, including the United States and China, continue to be uncertain and any weakness in consumer spending may have an adverse effect on our results of operations and financial condition. We may not be able to foresee downturns or respond to such downturns in a timely manner. Recent softness in the real estate and mortgage markets, volatility in fuel and other energy costs, deteriorating economic conditions in different countries, difficulties in the financial services sector and credit markets, high levels of unemployment and other macro-economic factors have created consumer uncertainty about current economic conditions which could adversely affect consumer confidence and behavior in ways that adversely affect our financial condition and results of operations.
For the three years ended December 31, 2011, all of our revenues were derived from clients in the United States. The United States has experienced, and is still in the process of recovery from, a significant economic downturn. The credit crisis, deterioration of global economies,
20
Table of Contents
rising unemployment and reduced equity valuations all create risks that could harm our business. Any downturn in the macroeconomic conditions in the United States would adversely impact the brand e-commerce and digital marketing industry in general, which may in turn adversely affect our business, financial condition and results of operations.
Changes in China's economic, political or social conditions, or government policies could have a material adverse effect on our business and operations.
Part of our business strategy is to expand our operations in China. Accordingly, our business, financial condition, results of operations and prospects may be influenced by political, economic and social conditions in China generally and by continued economic growth in China as a whole.
The Chinese economy differs from the economies of most developed countries in many respects, including the level of government involvement, level of development, growth rate, control of foreign exchange and allocation of resources. Although the Chinese government has implemented measures since the late 1970s emphasizing the utilization of market forces for economic reform, the reduction of state ownership of productive assets, and the establishment of improved corporate governance in business enterprises, a substantial portion of productive assets in China is still owned by the Chinese government. In addition, the Chinese government continues to play a significant role in regulating industry development by imposing industrial policies. The Chinese government also exercises significant control over China's economic growth through allocating resources, controlling payment of foreign currency-denominated obligations, setting monetary policy, and providing preferential treatment to particular industries or companies.
While the Chinese economy has experienced significant growth over the past decades, growth has been uneven, both geographically and among various sectors of the economy. The Chinese government has implemented various measures to encourage economic growth and guide the allocation of resources. Some of these measures may benefit the overall Chinese economy, but may have a negative effect on us. For example, our financial condition and results of operations may be adversely affected by government control over capital investments or changes in tax regulations. In addition, in the past the Chinese government has implemented certain measures, including interest rate increases, to control the pace of economic growth. These measures may cause decreased economic activity in China, which may adversely affect our business expansion plans and future growth. In addition, any regime or government change in China may result in instability in the political and economic conditions in China, which could have a negative impact on companies doing business in or with China.
In addition, according to the National Bureau of Statistics of China, China's Consumer Price Index increased by 5.9% in 2008, decreased by 0.7% in 2009, and increased by 3.3% and 5.4% in 2010 and 2011, respectively. If inflation continues to increase in China, it may adversely affect our business.
We may not be able to access on satisfactory terms, or at all, the credit and capital markets as needed to finance our growth plans, working capital requirements and liquidity needs.
We rely upon access to the credit and capital markets to fund our growth plans and working capital requirements. We may in the future need to seek additional equity or debt financing.
21
Table of Contents
We may not be able to obtain financing on satisfactory terms or at all and the terms of these securities could impose restrictions on our operations.
Market disruptions such as those recently experienced in the United States and abroad may increase our cost of borrowing or adversely affect our ability to access sources of liquidity. If we are unable to access credit at competitive rates when needed, or at all, if our short-term or long-term borrowing costs dramatically increase, or if we are not able to obtain financing on satisfactory terms or at all, our ability to finance our operations, meet our short-term obligations and implement our operating strategy could be adversely affected, which may limit our growth potential and our ability to execute our business strategy.
Our clients could experience unfavorable business conditions that could adversely affect our business.
Some of our clients have experienced, from time to time, difficulty raising capital and supporting their operations and implementing their business plans, or may be anticipating such difficulties. These clients may not be able to discharge their payment and other obligations to us. The non-payment or late payment of amounts due to us from our clients could negatively impact our financial condition. If the business environment for our clients worsens, our business, results of operations and financial condition could be materially adversely affected. If any of our clients were to exit the business to which we provide services, declare bankruptcy, suffer other financial difficulties, fail to pay amounts owed to us, demand lower billing rates, and/or terminate or modify its relationships with us, our business, results of operations and financial condition could be adversely affected. In the case of bankruptcy or insolvency by one of our significant clients, accounts receivable with respect to that client would potentially be uncollectible, which would adversely affect our financial performance.
In addition, our brand e-commerce technology services may be substantially impacted by the offline businesses of our clients. The impairment of the offline business of a client, whether due to financial difficulties, impairment of their brands, reduction in marketing efforts or reduction in the number of their retail stores, could adversely affect our business. If any of these occurs, consumer traffic and sales through our clients' websites could be negatively affected and clients could choose not to continue to utilize our brand e-commerce technology services. Our results of operations could also be negatively impacted if certain of our clients fail to accurately forecast product or service demand.
Our contractual arrangements with our clients are generally short-term in nature and they may choose not to renew their engagements with us on similar terms or at all.
Key elements of our growth strategy include adding new clients and extending the term of existing client agreements. A change in the management of our clients could adversely affect our relationship with those clients, including our ability to renew agreements with those clients or enter into amendments to those agreements on favorable terms. In addition, our contractual terms with clients are generally less than three years, with some engagements being for one year or less. If, upon expiry of the original terms of the contracts, our clients decide not to renew their contracts with us on terms acceptable to us, or at all, our business, financial condition and results of operations will be adversely affected.
22
Table of Contents
Our failure to meet clients' expectations could result in losses, reputational damage or negative publicity and could subject us to liability for the services we provide.
As clients have dedicated more money and resources to our engagements with them, their expectations have also increased. As client engagements become larger and more complex and are required to be completed in a shorter time frame, we face increased management challenges and greater risk of mistakes or late delivery. Any failure on our part to deliver services in accordance with clients' expectations could result in:
- •
- additional expenditures by us to correct the problem;
- •
- delayed or lost client revenues;
- •
- adverse client reactions and negative publicity;
- •
- damage to our reputation and our ability to gain new clients; and
- •
- claims against us.
In addition, from time to time, we are required to provide warranty work to our clients for which we do not charge our clients or charge for our services at lower billing rates. Our average realized billing rates for our project personnel are calculated as revenues collected for the period divided by total hours billed by our project personnel, including the hours incurred for warranty work. If we provide more warranty work to our clients, our average realized billing rates will be reduced accordingly, which would in turn affect our financial condition and results of operations.
Software and components that we incorporate into our multi-channel marketing services may contain errors or defects, which could have an adverse effect on our business.
We use a combination of proprietary software, particularly our analytics software, and third-party software in building our multi-channel marketing and brand e-commerce platform. Although we test certain software before incorporating it into our platform, we cannot guarantee that all of the third party technology that we incorporate will not contain errors, defects or viruses. If errors or defects occur in products and services that we utilize in our multi-channel marketing and e-commerce technology services, it could result in damage to our reputation, reduction in revenue and diverted development resources.
A disruption at any of our offices could materially and adversely affect our business, financial condition and results of operations.
We lease office space in ten cities across the United States and we also have the right to use our offices in Beijing and Shanghai, China pursuant to certain contractual arrangements. Any disruption at any of our offices, including system, network, telecommunications, software or hardware failures, any damage to our physical locations or off-site data centers, or our ability to access our locations for any reason, could materially and adversely affect our business, financial condition and results of operations.
Our operations are subject to the risk of damage or interruption from:
- •
- fire, flood, hurricane, tornado, earthquake or other natural disasters;
- •
- power losses and interruptions;
23
Table of Contents
- •
- Internet, telecommunications or data network failures;
- •
- physical and electronic break-ins or security breaches;
- •
- computer viruses;
- •
- acts of terrorism;
- •
- outbreak of disease; and
- •
- other similar events.
If any of these events occurs in any of our offices, it could result in interruptions, delays or cessations in our businesses. Any interruptions to our business could adversely affect the utilization rate of our project personnel, which would in turn adversely affect our gross margin, profitability and results of operations. In addition, our clients might seek significant compensation from us for their losses. Even if unsuccessful, this type of claim likely would be time consuming and costly for us to address and damaging to our reputation.
A disruption in transportation systems may affect our business travel and thus adversely affect our business.
In providing our digital strategy, digital marketing and brand e-commerce technology services, our personnel are required to travel on business across the United States, as well as in foreign countries. Adverse circumstances or events that might disrupt transportation systems and affect our business travel include the following:
- •
- an outbreak of war or political or social unrest;
- •
- an outbreak of serious contagious diseases, such as severe acute respiratory syndrome, avian influenza or the H1-N1 virus;
- •
- acts of terrorism; and
- •
- severe weather conditions, earthquakes, floods or other natural disasters.
As a result of such travel disruptions, we may not be able to provide our services to our clients on a timely basis, which may lead to decreased client satisfaction and even legal disputes. Any delay in the provision of our services by our project personnel caused by travel disruptions may adversely affect the utilization rate of our project personnel, which would in turn adversely affect our gross margin, profitability and results of operations.
Problems relating to internet infrastructure could adversely affect our business.
The success of our businesses depends on the continued development and maintenance of the internet infrastructure. As currently configured, the internet may not support changes in technology or continued increases in the number or requirements of users, or there may be delays in the development of necessary modifications to the internet infrastructure, either of which could result in internet outages, malfunction and delays. In addition, problems caused by "viruses," "worms" and similar programs and/or cyber attack may harm the performance of the internet or our systems. Our digital marketing service may not achieve intended effects for our clients or the amount of traffic on our clients' e-commerce businesses could decline materially if there are internet outages, malfunction or delays in the future.
24
Table of Contents
We may be unable to protect our proprietary technology and intellectual property rights.
Our success depends upon the protection of our intellectual property rights. We rely on a combination of trademark laws, copyright laws and contractual provisions to protect our intellectual property rights. We may be unable to deter infringement or misappropriation of our software, trademarks, business processes and other proprietary information and material, detect unauthorized use or take appropriate steps to enforce our intellectual property rights. Furthermore. our intellectual property rights may not be registered or protected in all relevant jurisdictions. The steps we have taken to protect our proprietary rights may be inadequate and third parties may infringe or misappropriate our proprietary rights. Any significant failure on our part to protect our intellectual property could make it easier for our competitors to offer similar services and thereby adversely affect our market opportunities. In addition, litigation may be necessary in the future to enforce our intellectual property rights. Litigation could result in substantial costs and diversion of management and technical resources. In addition, we recently established a joint venture relating to k121.com, an internet retailing website for sportswear products in China. As intellectual property rights are not protected in the PRC to the same extent as in the United States, our joint venture in China may face increased risk of intellectual property infringement.
We may be subject to intellectual property claims or competition or trade practices claims that could be costly and could disrupt our business.
Third parties may assert that our businesses or technologies infringe or misappropriate their intellectual property rights, or that we are engaging in unfair competition or other illegal trade practices. We could increasingly be subject to infringement claims as our services expand in scope and complexity. We recently entered into a joint venture relating to k121.com, a leading internet retailing website for sportswear products in China, which sells international and PRC domestic brands. However, we may be unable to obtain adequate authorization from such brands to use their trademarks, logos and other marks in a timely manner, or at all, which may expose us to potential claims for unauthorized use of such trademarks, logos and other markings under PRC law. Any infringement and other intellectual property claims, whether meritorious or not, are time consuming and costly to resolve, and could require expensive changes in our methods of doing business, could require us to enter into costly royalty or licensing agreements, or could require us to cease conducting certain operations. We may be unsuccessful in defending against these claims, which could result in substantial damages, fines or other penalties. Even unsuccessful claims could result in significant legal fees and other expenses, diversion of management's time and disruptions in our business. Any of these claims could also harm our reputation.
We have incorporated open source software into our platform. Although we closely monitor our use of open source software, the terms of many open source licenses to which we are subject have not been interpreted by U.S. or foreign courts, and there is a risk that such licenses could be construed in a manner that imposes unanticipated conditions or restrictions on our ability to provide our platform to our clients. In that event, we could be required to seek licenses from third parties in order to continue offering our platform, to reengineer our platform or discontinue use of portions of the functionality provided by our platform, any of which could have a material adverse effect on our business, operating results or financial condition.
25
Table of Contents
We rely on insurance to mitigate some risks facing our business, and to the extent our insurance does not mitigate the risks facing our business or our insurers are unable to meet their obligations, our operating results may be negatively impacted.
We maintain various insurance policies, including property casualty insurance to cover certain potential risks and liabilities covering our equipment and facilities. In addition, we provide workers' compensation to our employees pursuant to different states' statutory requirements. We also maintain key-man life insurance for certain senior management members. However, we do not maintain business interruption insurance or general third-party liability insurance. It is possible that we may not have adequate insurance to meet our needs, may have to pay high prices for the insurance coverage we have, may have high deductibles or may not be able to, or may choose not to, acquire insurance for certain types of business risk. This could leave us exposed to potential claims. If we were found liable for a significant claim in the future, our operating results could be negatively impacted. Also, to the extent the cost of maintaining insurance increases, our operating results could be negatively affected. There can be no assurance that our insurance will be adequate to protect us from pending and future claims.
Existing or future laws or regulations could harm our business.
We are subject to a number of foreign and domestic laws and regulations that affect companies conducting business over the internet. With the development of the internet, federal and state regulation of various aspects of the internet and digital technologies has increased, including intellectual property rights and infringement, user privacy, information security and data protection, advertising methods and on-line content. Our international operations are also subject to U.S. laws such as the Foreign Corrupt Practices Act, and local laws prohibiting corrupt payments to governmental officials.
It is not clear how some existing laws apply to the Internet and e-commerce, and some laws that are specific to the Internet and e-commerce, such as the Digital Millennium Copyright Act and The Controlling the Assault of Non-Solicited Pornography and Marketing Act of 2003, are only beginning to be interpreted by the courts and their applicability and reach are therefore uncertain. The laws and regulations regulating social media also vary from country to country and there are new regulations regarding taxation of e-commerce activities currently being adopted in certain countries. In addition, the potential scope of operation and enforcement of the new Consumer Financial Protection Bureau with respect to those handling consumer credit card transactions also is unclear at present. Unfavorable regulations and laws, or interpretations thereof, could diminish the demand for our services, limit the services we can provide, increase our cost of doing business and subject us to penalties.
Our operations in China are governed by PRC laws and regulations. The PRC legal system is based in part on government policies and internal rules, some of which are not published on a timely basis or at all, which may have a retroactive effect. As a result, we may not be aware of our violation of any of these policies and rules until some time after the violation. In addition, any administrative and court proceedings in China may be protracted, resulting in substantial costs and diversion of resources and management attention. The operation of our joint venture in China relating to k121.com may be subject to PRC laws and regulations regarding restrictions on dividend distributions for foreign-invested enterprises, registration and use of trademarks and restrictions on foreign currency exchange. Moreover, the PRC government extensively regulates the internet industry, including foreign ownership of, and the licensing and permit
26
Table of Contents
requirements pertaining to, companies in the internet industry. These internet-related laws and regulations are relatively new and evolving, and their interpretation and enforcement involve significant uncertainty. As a result, in certain circumstances it may be difficult to determine what actions or omissions may be deemed to be violations of applicable laws and regulations. There are also uncertainties relating to the licensing practices of the internet industry in China. New laws and regulations may be promulgated that will regulate internet activities such as social networking services, e-commerce and online advertising businesses. Additional licenses may be required. If our operations do not comply with new regulations at the time they become effective, or if we fail to obtain any licenses required under any new laws and regulations, we could be subject to penalties.
Strict PRC laws and regulations on foreign investment may adversely impact the operation of our joint venture in China and impede our business expansion in China.
China has adopted strict laws and regulations regarding foreign investment in the PRC. Besides the Company Law of the PRC, our joint venture in the PRC must also comply with the Law of the PRC on Chinese-Foreign Equity Joint Ventures and its Implementation Rules, which apply to foreign-invested enterprises established in the form of an equity joint venture and provide restrictions on distribution of profits. The PRC government also imposes strict controls over foreign currency exchange. The conversion of Renminbi for capital account items is subject to the approval or verification of the State Administration of Foreign Exchange, or SAFE, and our PRC joint venture is required to apply to SAFE for a foreign exchange registration certificate for foreign-invested enterprise, which is subject to review and renewal by SAFE on an annual basis. Failure to pass the SAFE annual review or timely file changes with SAFE may subject us to administrative penalties.
In addition, foreign investment and ownership in certain PRC industries are subject to limitations. Foreign investors must comply with the Catalogue for the Guidance of Foreign Investment Industries and other applicable PRC laws and regulations regarding foreign investment in specific industries. Futhermore, those PRC laws and regulations may change and new restrictions may be imposed on our investment and business in the PRC. For example, in August 2011, the PRC government adopted the Security Review System in Mergers and Acquisitions of Domestic Enterprises by Foreign Investors, under which mergers and acquisitions transactions by foreign investors of domestic enterprises in sensitive sectors or industries may be subject to security review. Due to the uncertainty of the newly adopted security review system, our potential expansion in the PRC through mergers and acquisitions may be subject to security review. The security review procedures are time-consuming and uncertain, which may impede our business expansion in the PRC.
Our success depends upon our executive officers and other key personnel.
Our success depends to a significant degree upon the contribution of our executive officers and other key personnel. In particular, the senior management team of Acquity Group LLC has an average of more than 20 years of experience in brand e-commerce and digital marketing. Our executive officers and key personnel could terminate their employment with us at any time despite any employment agreements we may have with these employees. Due to the competition for highly qualified personnel, we cannot be sure that we will be able to retain or attract executive, managerial or other key personnel. In addition, key personnel of an acquired company may decide not to work for us. Our executive officers or key personnel may not
27
Table of Contents
comply with the non-competition restrictions in their employment agreements and leave us to join our competitors. The loss of any of our key personnel could harm our business if we are unable to effectively replace that person, if we incur significant operating expenses and direct management time to search for a replacement, or if that person should join one of our competitors or otherwise compete with us.
We may be liable if third parties misappropriate our or our clients' or customers' personal information from our network.
We cannot be assured that our security measures will prevent security breaches. A compromise of our security systems that results in customers' personal information being obtained by an unauthorized person could result in litigation against us and fines imposed on us, and could adversely affect customers' willingness to utilize our and our clients' businesses, as well as our reputation, results of operations and financial condition. Additionally, any security breach could require that we expend significant resources to strengthen the security of our information systems and result in a disruption of our online operations.
We are subject to regulations relating to consumer privacy.
We collect and maintain customer data from our customers, which subjects us to increasing international, federal and state regulations related to online privacy and the use of personal user information. Legislation and regulations are pending in various domestic and international governmental bodies that address online privacy protections. Several governments have proposed, and some have enacted, legislation that would limit the use and transfer of personal user information or require online service providers to establish privacy policies. In addition, the U.S. Federal Trade Commission, or FTC, has urged Congress to adopt legislation regarding the collection and use of personal identifying information obtained from individuals when accessing websites, including both adults and minors. Even in the absence of laws requiring companies to establish these procedures, the FTC has settled several proceedings resulting in consent decrees in which internet companies have been required to establish programs regarding the manner in which personal information is collected from users and provided to third parties. We could become a party to a similar enforcement proceeding. These regulatory and enforcement efforts could limit our collection of and/or ability to share with our clients demographic and personal information from customers, which could adversely affect our ability to comprehensively serve our clients.
We may be unable to hire and retain skilled personnel which could limit our growth.
Given the rapid developments in the digital marketing and brand e-commerce sector, hiring and retaining skilled professionals who are able to deliver high-quality services is critical to our business. For the years ended December 31, 2009, 2010 and 2011, the average number of our project personnel was 164, 202 and 288, respectively. Due to intense competition for these individuals from our competitors and other employers, we may not be able to attract or retain highly qualified personnel in the future. Our failure to attract and retain the experienced and highly trained personnel that are integral to our businesses may limit our growth. Additionally, we have experienced recent growth in personnel numbers and expect to continue to hire additional personnel in selected areas. Managing this growth requires significant time and resource commitments from our senior management. If we are unable to effectively manage a large and geographically dispersed group of employees or to anticipate our future growth and
28
Table of Contents
personnel needs, we may not be able to retain skilled personnel and our business may be adversely affected.
If we grant employee share options or other share-based compensation in the future, our net income could be adversely affected.
In November 2011 we adopted our 2011 Share Incentive Plan, which will be effective upon the completion of this offering. Our share incentive plan permits the grant of incentive share options, non-statutory share options, restricted shares, restricted share units, share appreciation rights, performance units, performance shares and other share-based awards to employees, directors and consultants of our company. As a result of potential future grants under the plan, we may incur share-based compensation expenses in future periods. The amount of these expenses will be based on the fair value of the share-based awards. We will apply IFRS 2, Share-based Payments for the accounting treatment of our share incentive plan. As a result, we will have to account for compensation costs for all share options, including share options granted to our directors and employees, using a fair-value based method and recognize expenses in our consolidated statement of income in accordance with the relevant rules under IFRS, which may reduce our profit. Therefore, employee share options or other share-based compensation we may grant in the future may have a material adverse effect on our financial condition and results of operations.
If we fail to maintain an effective system of internal controls, we may not be able to accurately report our financial results or prevent fraud.
We will be subject to reporting obligations under the U.S. securities laws upon the completion of our initial public offering. Our reporting obligations as a public company will place a significant strain on our management, operational and financial resources and systems for the foreseeable future. Beginning with our annual report on Form 20-F for the fiscal year ending December 31, 2013, we will be required to prepare a management report on our internal controls over financial reporting containing our management's assessment of the effectiveness of our internal controls over financial reporting. In addition, depending on our market capitalization, our independent registered public accounting firm may be required to attest to and report on our management's assessment of the effectiveness of our internal controls over financial reporting. Our management may conclude that our internal controls over our financial reporting are not effective. Moreover, even if our management concludes that our internal controls over financial reporting are effective, our independent registered public accounting firm may still decline to attest to our management's assessment or may issue a report that is qualified if it is not satisfied with our controls or the level at which our controls are documented, designed, operated or reviewed, or if it interprets the relevant requirements differently from us.
Risks related to this offering
There has been no public market for our ordinary shares or ADSs prior to this offering, and you may not be able to resell our ADSs at or above the price you paid, or at all.
Prior to this initial public offering, there has been no public market for our ordinary shares or ADSs. Our ADSs have been approved for listing on the New York Stock Exchange. Our ordinary shares will not be listed on any exchange or quoted for trading on any over-the-counter
29
Table of Contents
trading system. If an active trading market for our ADSs does not develop after this offering, the market price and liquidity of our ADSs will be materially and adversely affected.
The initial public offering price for our ADSs is determined by negotiations between us and the underwriters and may bear no relationship to the market price for our ADSs after this initial public offering. An active trading market for our ADSs may not develop and the market price of our ADSs may decline below the initial public offering price.
The trading prices of our ADSs are likely to be volatile, which could result in substantial losses to investors.
The trading prices of our ADSs are likely to be volatile and could fluctuate widely due to factors beyond our control. This may happen because of broad market and industry factors, such as the performance and fluctuation of the market prices of other companies with business operations located mainly in China that have listed their securities in the United States. A number of companies engaged in e-commerce business have listed or are in the process of listing their securities on U.S. stock markets. The securities of some of these companies have experienced significant volatility, including price declines in connection with their initial public offerings. The trading performances of these companies' securities after their offerings may affect the attitudes of investors toward such companies listed in the United States as a whole and consequently may impact the trading performance of our ADSs, regardless of our actual operating performance.
In addition to market and industry factors, the price and trading volume of our ADSs may be highly volatile for factors specific to our own operations, including the following:
- •
- actual or anticipated fluctuations in our quarterly results of operations;
- •
- variations in our revenues, earnings and cash flow;
- •
- announcements of new investments, acquisitions, strategic partnerships or joint ventures;
- •
- announcements of scientific developments or the issuance of patents to us or our competitors;
- •
- announcements of new products or services and expansions by us or our competitors;
- •
- changes in financial estimates by securities research analysts;
- •
- additions or departures of our executive officers and key personnel;
- •
- release or expiry of lock-up or other transfer restrictions on our outstanding equity securities or sales of additional equity securities;
- •
- potential litigation or regulatory investigations; and
- •
- fluctuations in market prices for our products or services.
Any of these factors may result in large and sudden changes in the volume and price at which our ADSs will trade. Furthermore, the securities market has from time to time experienced significant price and volume fluctuations that are not related to the operating performance of particular companies. These market fluctuations may also have a material adverse effect on the market price of our ADSs.
30
Table of Contents
Because the initial public offering price of our ADSs is substantially higher than our net tangible book value per share, you will incur immediate and substantial dilution.
If you purchase ADSs in this offering, you will pay more for your ADSs than the amount paid by our existing shareholders for their ordinary shares on a per ADS basis. As a result, you will experience immediate and substantial dilution of approximately US$ per ADS (assuming no exercise by the underwriters of options to acquire additional ADSs), representing the difference between our net tangible book value per ADS as of December 31, 2011, after giving effect to this offering and the initial public offering price of US$ per ADS, the mid-point of the estimated price range set forth on the cover of this prospectus. In addition, you may experience further dilution to the extent that our ordinary shares are issued upon the exercise of outstanding or to-be-issued share options.
Substantial future sales or perceived sales of our ADSs in the public market could cause the price of our ADSs to decline.
Sales of our ADSs or ordinary shares in the public market after this offering, or the perception that these sales could occur, could cause the market price of our ADSs to decline. Upon completion of this offering, we will have ordinary shares outstanding, including ordinary shares represented by ADSs. All ADSs sold in this offering will be freely transferable without restriction or additional registration under the Securities Act of 1933, as amended, or the Securities Act. The remaining ordinary shares outstanding after this offering will be available for sale, upon the expiration of the 180-day lock-up period beginning from the date of this prospectus and, in the case of the ordinary shares that certain option holders will receive when they exercise their share options, until the later of (i), the first anniversary of the grant date, and (ii) the expiration of the aforementioned lock-up period, subject to volume and other restrictions as applicable under Rule 144 and Rule 701 under the Securities Act. Any or all of these shares (other than those held by certain option holders) may be released prior to expiration of the lock-up period at the discretion of the lead underwriters. To the extent shares are released before the expiration of the lock-up period and these shares are sold into the market, the market price of our ADSs could decline.
Our articles of association contain anti-takeover provisions that could have a material adverse effect on the rights of holders of our ordinary shares and ADSs.
We have adopted our amended and restated articles of association, which will become effective immediately upon completion of this offering. Our new articles of association limit the ability of others to acquire control of our company or cause us to engage in change-of-control transactions. These provisions could have the effect of depriving our shareholders of an opportunity to sell their shares at a premium over prevailing market prices by discouraging third parties from seeking to obtain control of our company in a tender offer or similar transaction. For example, our board of directors has the authority, without further action by our shareholders, to issue preferred shares in one or more series and to fix their designations, powers, preferences, privileges, and relative participating, optional or special rights and the qualifications, limitations or restrictions, including dividend rights, conversion rights, voting rights, terms of redemption and liquidation preferences, any or all of which may be greater than the rights associated with our ordinary shares, in the form of ADS or otherwise. Preferred shares could be issued quickly with terms calculated to delay or prevent a change in control of our company or make removal of management more difficult. If our
31
Table of Contents
board of directors decides to issue preferred shares, the price of our ADSs may fall and the voting and other rights of the holders of our ordinary shares and ADSs may be materially and adversely affected.
Holders of ADSs have fewer rights than shareholders and must act through the depositary to exercise those rights.
Holders of ADSs do not have the same rights as our shareholders and may only exercise the voting rights with respect to the underlying ordinary shares in accordance with the provisions of the deposit agreement. Under our amended and restated articles of association, the minimum notice period required to convene a general meeting is seven days. When a general meeting is convened, you may not receive sufficient notice of a shareholders' meeting to permit you to withdraw your ordinary shares to allow you to cast your vote with respect to any specific matter. In addition, the depositary and its agents may not be able to send voting instructions to you or carry out your voting instructions in a timely manner. We will make all reasonable efforts to cause the depositary to extend voting rights to you in a timely manner, but you may not receive the voting materials in time to ensure that you can instruct the depositary to vote your ADSs. Furthermore, the depositary and its agents will not be responsible for any failure to carry out any instructions to vote, for the manner in which any vote is cast or for the effect of any such vote. As a result, you may not be able to exercise your right to vote and you may lack recourse if your ADSs are not voted as you requested. In addition, in your capacity as an ADS holder, you will not be able to call a shareholders' meeting.
Our corporate actions are substantially controlled by our executive officers, directors, principal shareholders and affiliated entities.
After this offering, our executive officers, directors, principal shareholders and their affiliated entities will beneficially own approximately % of our outstanding shares. These shareholders, if they act together, could exert substantial influence over matters requiring approval by our shareholders, including electing directors and approving mergers or other business combination transactions and they may not act in the best interests of minority shareholders. This concentration of ownership may also discourage, delay or prevent a change in control of our company, which could deprive our shareholders of an opportunity to receive a premium for their shares as part of a sale of our company and might reduce the price of our ADSs. These actions may be taken even if they are opposed by our other shareholders, including you.
The depositary for our ADSs will give us a discretionary proxy to vote our ordinary shares underlying your ADSs if you do not vote at shareholders' meetings, except in limited circumstances, which could adversely affect your interests.
Under the deposit agreement for the ADSs, if you do not vote, the depositary will give us a discretionary proxy to vote our ordinary shares underlying your ADSs at shareholders' meetings unless:
- •
- we have failed to timely provide the depositary with notice of meeting and related voting materials;
- •
- we have instructed the depositary that we do not wish a discretionary proxy to be given;
32
Table of Contents
- •
- we have informed the depositary that there is substantial opposition as to a matter to be voted on at the meeting;
- •
- a matter to be voted on at the meeting would have a material adverse impact on shareholders; or
- •
- the voting at the meeting is to be made on a show of hands.
The effect of this discretionary proxy is that if you do not vote at shareholders' meetings, you cannot prevent our ordinary shares underlying your ADSs from being voted, except under the circumstances described above. This may make it more difficult for shareholders to influence the management of our company. Holders of our ordinary shares are not subject to this discretionary proxy.
You may not receive dividends or other distributions on our ordinary shares and you may not receive any value for them, if it is illegal or impractical to make them available to you.
The depositary of our ADSs has agreed to pay to you the cash dividends or other distributions it or the custodian receives on ordinary shares or other deposited securities underlying our ADSs, after deducting its fees and expenses. You will receive these distributions in proportion to the number of ordinary shares your ADSs represent. However, the depositary is not responsible if it decides that it is unlawful or impractical to make a distribution available to any holders of ADSs. For example, it would be unlawful to make a distribution to a holder of ADSs if it consists of securities that require registration under the Securities Act but that are not properly registered or distributed under an applicable exemption from registration. The depositary may also determine that it is not feasible to distribute certain property through the mail. Additionally, the value of certain distributions may be less than the cost of mailing them. In these cases, the depositary may determine not to distribute such property. We have no obligation to register under U.S. securities laws any ADSs, ordinary shares, rights or other securities received through such distributions. We also have no obligation to take any other action to permit the distribution of ADSs, ordinary shares, rights or anything else to holders of ADSs. This means that you may not receive distributions we make on our ordinary shares or any value for them if it is illegal or impractical for us to make them available to you. These restrictions may cause a material decline in the value of our ADSs.
You may be subject to limitations on transfers of your ADSs.
Your ADSs are transferable on the books of the depositary. However, the depositary may close its transfer books at any time or from time to time when it deems expedient in connection with the performance of its duties. In addition, the depositary may refuse to deliver, transfer or register transfers of ADSs generally when our books or the books of the depositary are closed, or at any time if we or the depositary deem it advisable to do so because of any requirement of law or of any government or governmental body, or under any provision of the deposit agreement, or for any other reason.
Your right to participate in any future rights offerings may be limited, which may cause dilution to your holdings, and you may not receive distributions with respect to the underlying ordinary shares if it is impractical to make them available to you.
We may from time to time distribute rights to our shareholders, including rights to acquire our securities. However, we cannot make rights available to you in the United States unless we
33
Table of Contents
register the rights and the securities to which the rights relate under the Securities Act or an exemption from the registration requirements is available. Also, under the deposit agreement, the depositary bank will not make rights available to you unless the distribution to ADS holders of both the rights and any related securities are either registered under the Securities Act, or exempted from registration under the Securities Act. We are under no obligation to file a registration statement with respect to any such rights or securities or to endeavor to cause such a registration statement to be declared effective. Moreover, we may not be able to establish an exemption from registration under the Securities Act. Accordingly, you may be unable to participate in our rights offerings and may experience dilution in your holdings.
In addition, the depositary of our ADSs has agreed to pay to you the cash dividends or other distributions it or the custodian receives on our ordinary shares or other deposited securities after deducting its fees and expenses. You will receive these distributions in proportion to the number of ordinary shares your ADSs represent. However, the depositary may, at its discretion, decide that it is inequitable or impractical to make a distribution available to any holders of ADSs. For example, the depositary may determine that it is not practicable to distribute certain property through the mail, or that the value of certain distributions may be less than the cost of mailing them. In these cases, the depositary may decide not to distribute such property and you will not receive such distribution.
We are a Cayman Islands company and, because judicial precedent regarding the rights of shareholders is more limited under Cayman Islands law than under U.S. law, you may have less protection for your shareholder rights than you would under U.S. law.
Our corporate affairs are governed by our amended and restated memorandum and articles of association, the Cayman Islands Companies Law and the common law of the Cayman Islands. The rights of shareholders to take action against the directors, actions by minority shareholders and the fiduciary responsibilities of our directors to us under Cayman Islands law are to a large extent governed by the common law of the Cayman Islands. The common law of the Cayman Islands is derived in part from comparatively limited judicial precedent in the Cayman Islands as well as that from English common law, which has persuasive, but not binding, authority on a court in the Cayman Islands. The rights of our shareholders and the fiduciary responsibilities of our directors under Cayman Islands law are not as clearly established as they would be under statutes or judicial precedent in some jurisdictions in the United States. In particular, the Cayman Islands has a less developed body of securities laws than the United States. In addition, some U.S. states, such as Delaware, have more fully developed and judicially interpreted bodies of corporate law than the Cayman Islands.
As a result of all of the above, public shareholders may have more difficulty in protecting their interests in the face of actions taken by management, members of the board of directors or controlling shareholders than they would as shareholders of a U.S. public company.
We have not determined a specific use for a portion of the net proceeds from this offering, and we may use these proceeds in ways with which you may not agree.
We have not determined a specific use for a portion of the net proceeds of this offering, and our management will have considerable discretion in deciding how to apply these proceeds. You will not have the opportunity to assess whether the proceeds are being used appropriately before you make your investment decision. You must rely on the judgment of our management
34
Table of Contents
regarding the application of the net proceeds of this offering. We cannot assure you that the net proceeds will be used in a manner that would improve our results of operations or increase our ADS price, nor that these net proceeds will be placed only in investments that generate income or appreciate in value.
We will incur increased costs as a result of being a public company.
As a public company, we will incur a significantly higher level of legal, accounting and other expenses than we did as a private company. In addition, the Sarbanes-Oxley Act of 2002, as well as new rules subsequently implemented by the U.S. Securities and Exchange Commission, or the SEC, and the New York Stock Exchange, have required changes in corporate governance practices of public companies. We expect these new rules and regulations to increase our legal and financial compliance costs and to make some activities more time-consuming and costly. We are currently evaluating and monitoring developments with respect to these new rules, and we cannot predict or estimate the amount of additional costs we may incur or the timing of such costs.
We may lose our foreign private issuer status in the future, which could result in significant additional costs and expenses.
We are a "foreign private issuer," as such term is defined in Rule 405 under the Securities Act, and therefore, we are not required to comply with all the periodic disclosure and current reporting requirements of the U.S. Securities Exchange Act of 1934, as amended, or the Exchange Act, and related rules and regulations. Under Rule 405, the determination of foreign private issuer status is made annually on the last business day of an issuer's most recently completed second fiscal quarter and, accordingly, the next determination will be made with respect to us on June 30, 2012. In the future, we would lose our foreign private issuer status if it is determined that a majority of our outstanding voting securities are directly or indirectly held of record by U.S. residents and if a majority of our shareholders or a majority of our directors or management are U.S. citizens or residents, a majority of our assets are located in the United States, or our business is administered principally in the United States. If we were to lose our foreign private issuer status, we would have to comply with U.S. federal proxy requirements, and our officers, directors and principal shareholders would become subject to the short-swing profit disclosure and recovery provisions of Section 16 of the Exchange Act. We would also be required to present financial statements in accordance with U.S. generally accepted accounting principles and to file periodic reports and registration statements on U.S. domestic issuer forms with the SEC, which are more detailed and extensive than the forms available to a foreign private issuer. As a result, the regulatory and compliance costs to us under U.S. securities laws as a U.S. domestic issuer may be significantly higher. We may also be required to modify certain of our policies to comply with corporate governance practices associated with U.S. domestic issuers. Such conversion and modifications would involve additional costs.
We may be or become a passive foreign investment company or a controlled foreign corporation for U.S. federal income tax purposes, which could result in adverse U.S. federal income tax consequences to U.S. investors in our ADSs or ordinary shares.
A non-U.S. corporation will be a passive foreign investment company, or PFIC, for any taxable year in which (1) at least 75% of its gross income is passive income or (2) at least 50% of the
35
Table of Contents
value (determined on a quarterly basis) of its assets is attributable to assets that produce or are held for the production of passive income. A non-U.S. corporation that is a controlled foreign corporation, or CFC, for U.S. federal income tax purposes may be required to use the adjusted basis of its assets in applying the PFIC asset test, which may increase the likelihood that it qualifies as a PFIC. The legislative history to the special PFIC adjusted basis rule can be read as intending for the rule to apply only to U.S. persons that own at least 10% of the voting stock of the non-U.S. corporation; however, this limitation is not reflected in the statute. We would be treated as a CFC for any year if on any day of such year more than 50% of the total combined voting power of all classes of our voting shares or more than 50% of the total value of our shares are owned by U.S. Holders (as defined in "Taxation—United States federal income taxation") that own (directly, indirectly or by attribution) at least 10% of our voting shares. If we were treated as a CFC for any taxable year during which a U.S. Holder owns at least 10% of our voting shares (directly, indirectly or by attribution), certain adverse U.S. federal income tax consequences could apply to such U.S. Holder. Further, if we are treated as a CFC for U.S. federal income tax purposes for any portion of our taxable year that includes this offering, we would be more likely to be classified as a PFIC. If we are classified as a PFIC, our ADSs or ordinary shares will continue to be treated as shares in a PFIC for all succeeding years during which a U.S. Holder holds our ADSs or ordinary shares, unless we cease to be a PFIC and the U.S. Holder makes a "deemed sale" election or "deemed dividend" election with respect to the ADSs or ordinary shares. If you are a U.S. Holder and you make a deemed sale election, you will be deemed to have sold the ADSs or ordinary shares you hold at their fair market value as of the last day of the last year during which we were a PFIC, or the "termination date". If you make a "deemed dividend" election, you will be required to include in income as a deemed dividend your pro-rata share of our earnings and profits accumulated during any portion of your holding period ending at the close of the termination date and attributable to the ADSs or ordinary shares held on the termination date.
We do not believe that we were a PFIC for the taxable year ended December 31, 2011. Based on the projected composition of our income and value of our assets (without regard to the CFC issues described in the preceding paragraph), we do not currently expect to be a PFIC for our taxable year ending December 31, 2012 or the foreseeable future. However, a separate determination must be made at the close of each taxable year as to whether we are a PFIC for such year. In addition, our PFIC status will depend upon the composition of our income and assets from time to time, including the value of our ADSs at any such time. Our PFIC status will also depend, in part, on how, and how quickly, we spend the cash we raise in this offering. Accordingly, there can be no assurance that we will not be a PFIC for our current taxable year or any future taxable year. If we were treated as a PFIC for any taxable year during which a U.S. Holder holds our ADSs or ordinary shares, certain adverse U.S. federal income tax consequences and additional reporting requirements could apply to that U.S. Holder. You are urged to consult your tax advisor regarding our possible status as a PFIC as well as the benefit of making an actual or protective deemed dividend election or deemed sale election. See "Taxation—United States federal income taxation—Passive foreign investment company".
36
Table of Contents
Special note regarding forward-looking statements
This prospectus contains forward-looking statements that relate to our current expectations and views of future events. The forward-looking statements are contained principally in the sections entitled "Prospectus summary," "Risk factors," "Use of proceeds," "Management's discussion and analysis of financial condition and results of operations," "Industry overview" and "Business." These statements relate to events that involve known and unknown risks, uncertainties and other factors, including those listed under "Risk factors," which may cause our actual results, performance or achievements to be materially different from any future results, performances or achievements expressed or implied by the forward-looking statements.
In some cases, these forward-looking statements can be identified by words or phrases such as "may," "will," "expect," "anticipate," "aim," "estimate," "intend," "plan," "believe," "potential," "continue," "is/are likely to" or other similar expressions. We have based these forward-looking statements largely on our current expectations and projections about future events and financial trends that we believe may affect our financial condition, results of operations, business strategy and financial needs. These forward-looking statements include, among other things, statements relating to:
- •
- our growth strategies;
- •
- the anticipated growth and development of our business, financial condition and results of operations;
- •
- factors that affect our future revenues and expenses;
- •
- the future growth of our industry globally as a whole;
- •
- trends and competition in our industry globally;
- •
- economic and demographic trends;
- •
- our ability to obtain and maintain permits and licenses to carry on our business; and
- •
- our plan to use the proceeds from this offering.
This prospectus also contains data related to the brand e-commerce and digital marketing industry worldwide. These market data include projections that are based on a number of assumptions. The market may not grow at the rates projected by the market data, or at all. The failure of the market to grow at the projected rates may have a material adverse effect on our business and the market price of our ADSs. In addition, the rapidly changing nature of the brand e-commerce and digital marketing industry subjects any projections or estimates relating to the growth prospects or future condition of our market to significant uncertainties. If any one or more of the assumptions underlying the market data turns out to be incorrect, actual results may differ from the projections based on these assumptions. You should not place undue reliance on these forward-looking statements.
The forward-looking statements made in this prospectus relate only to events or information as of the date on which the statements are made in this prospectus. Except as required by law, we undertake no obligation to update or revise publicly any forward-looking statements, whether as a result of new information, future events or otherwise, after the date on which the statements are made or to reflect the occurrence of unanticipated events. You should read this prospectus and the documents that we reference in this prospectus and have filed as exhibits to the registration statement, of which this prospectus is a part, completely and with the understanding that our actual future results may be materially different from what we expect.
37
Table of Contents
Use of proceeds
We estimate that we will receive net proceeds from this offering of approximately US$ million, after deducting the underwriting discounts and commissions and estimated offering expenses payable by us, and assuming an initial public offering price of US$ per ADS, the midpoint of the estimated range of the initial public offering price as set forth on the cover page of this prospectus. A US$1.00 increase (decrease) in the assumed initial public offering price of US$ per ADS, the midpoint of the estimated price range set forth on the cover of this prospectus, would increase (decrease) the net proceeds to us from this offering by US$ million, after deducting the estimated underwriting discounts and commissions and estimated aggregate offering expenses payable by us and assuming no exercise of the underwriters' over-allotment option and no other change to the number of ADSs offered by us as set forth on the cover page of this prospectus.
We intend to use the net proceeds we receive from this offering primarily for the following purposes:
- •
- approximately US$ million to conduct acquisitions and further expand our footprint in North America and Europe, as well as deepen our expertise in key areas;
- •
- approximately US$ million to conduct strategic investments in the China market; and
- •
- the remainder to fund our working capital and for general corporate purposes.
Depending on future events and other changes in the business climate, we may determine at a later time to use the net proceeds for different purposes. Pending these uses, we intend to invest the net proceeds to us in short-term bank deposits, direct or guaranteed obligations of the U.S. government or other short-term money market instruments. These investments may have a material adverse effect on the U.S. federal income tax consequences of your investment in our ADSs. It is possible that we may become a PFIC for U.S. federal tax purposes, which could result in negative tax consequences for you. For a more detailed discussion of these consequences, see "Taxation—United States federal income taxation—Passive foreign investment company". Also see "Risk factors—Risks related to this offering—We may be or become a passive foreign investment company or a CFC for U.S. federal income tax purposes, which could result in adverse U.S. federal income tax consequences to U.S. investors in our ADSs or ordinary shares".
We will not receive any of the proceeds from the sale of ADSs by the selling shareholders.
38
Table of Contents
Capitalization
The following table sets forth our capitalization, as of December 31, 2011:
- •
- on an actual basis; and
- •
- on an as adjusted basis to give effect to the issuance and sale of ordinary shares in the form of ADSs by us in this offering based on an assumed initial public offering price of US$ per ADS, the midpoint of the estimated price range set forth on the cover of this prospectus, after deducting the underwriting discounts and commissions and estimated aggregate offering expenses payable by us and assuming no exercise of the underwriters' over-allotment option and no other change to the number of ADSs sold by us as set forth on the cover page of this prospectus.
The information on an as adjusted basis below is illustrative only and our capitalization following the completion of this offering is subject to adjustment based on the actual initial public offering price of our ADSs and other terms of this offering determined at pricing.
You should read this table together with our consolidated financial statements and the related notes included elsewhere in this prospectus and the information under "Management's discussion and analysis of financial condition and results of operations."
| | | | | | | | | |
| | |
| | As of December 31, 2011 | |
|---|
(in thousands of US$, except share and per share amounts)
| | Actual
| | As adjusted
| |
|---|
| | |
Shareholders' equity | | | | | | | |
| | Ordinary shares, US$0.0001 par value, 500,000,000 shares authorized; 37,477,264 shares issued and outstanding and shares issued and outstanding on an as adjusted basis(1)(2) | | | 4 | | | | |
Capital reserve | | | 71,030 | | | | |
Other comprehensive income | | | 68 | | | | |
Retained losses | | | (7,413 | ) | | | |
Non-controlling interests | | | 745 | | | | |
| | Total shareholders' equity | | | 64,434 | | | | (2) |
| | | | |
| | | Total capitalization(2) | | | 64,434 | | | | (2) |
| | |
(1) Excludes 5,000,000 ordinary shares reserved for future issuance under our 2011 Share Incentive Plan.
(2) Assuming the number of ADSs offered by us as set forth on the cover page of this prospectus remains the same, and after deduction of underwriting discounts and commissions and the estimated offering expenses payable by us, a US$ increase (decrease) in the assumed initial public offering price of US$ per ADS, the midpoint of the estimated price range set forth on the cover of this prospectus, would increase (decrease) additional paid-in capital, total shareholders' equity and total capitalization by , and , respectively.
39
Table of Contents
Dilution
If you invest in our ADSs, your interest will be diluted to the extent of the difference between the initial public offering price per ADS and our net tangible book value per ADS after this offering. Dilution results from the fact that the initial public offering price per ordinary share of our ADSs is substantially in excess of the book value per ordinary share attributable to the existing shareholders for our presently outstanding ordinary shares. Our net tangible book value as of December 31, 2011, was approximately US$38.0 million, or US$1.01 per ordinary share and US$ per ADS. Net tangible book value represents the amount of our total consolidated tangible assets, less the amount of our total consolidated liabilities.
After giving effect to our sale of the ADSs offered in this offering at the initial public offering price of US$ per ADS, the midpoint of the estimated price range set forth on the cover of this prospectus, and after deduction of the underwriting discounts and commissions and estimated offering expenses of this offering payable by us, our adjusted net tangible book value as of , would have increased to US$ million or US$ per ordinary share and US$ per ADS. This represents an immediate increase in net tangible book value of US$ per ordinary share and US$ per ADS, to the existing shareholders and an immediate dilution in net tangible book value of US$ per ordinary share and US$ per ADS, to investors purchasing ADSs in this offering.
The following table illustrates such dilution on a per ordinary share and per ADS basis:
| | | | | | |
| | |
(In US$)
| | Per Ordinary
Share
| | Per ADS
| |
|---|
| | |
Estimated initial public offering price | | | | | | |
Net tangible book value as of December 31, 2011 | | 1.01 | | | | |
Adjusted net tangible book value after giving effect to this offering | | | | | | |
Dilution in net tangible book value to new investors in this offering | | | | | | |
| | |
A US$1.00 increase (decrease) in the assumed initial public offering price of US$ per ADS, the midpoint of the estimated price range set forth on the cover of this prospectus, would increase (decrease) our adjusted net tangible book value after giving effect to the offering by US$ million, the adjusted net tangible book value per ordinary share and per ADS after giving effect to this offering by US$ per ordinary share and US$ per ADS and the dilution in adjusted net tangible book value per ordinary share and per ADS to new investors in this offering by US$ per ordinary share and US$ per ADS, assuming no change to the number of ADSs offered by us as set forth on the cover page of this prospectus, and after deducting underwriting discounts and commissions and other expenses of the offering. The adjusted information discussed above is illustrative only. Our net tangible book value following the completion of this offering is subject to adjustment based on the actual initial public offering price of our ADSs and other terms of this offering determined at pricing.
40
Table of Contents
The following table summarizes, on an as adjusted basis, as of December 31, 2011, the differences between existing shareholders and the new investors with respect to the number of ordinary shares (in the form of ADSs or shares) purchased from us, the total consideration paid and the average price per ordinary share paid before deducting the underwriting discounts and commissions and estimated offering expenses. The total number of ordinary shares does not include ordinary shares underlying the ADSs issuable upon the exercise of the over-allotment option granted to the underwriters. The information in the following table is illustrative only and the total consideration paid and the average price per ordinary share is subject to adjustment based on the actual initial public offering price of our ADSs and other terms of this offering determined at pricing.
| | | | | | | | | | | | | | | | | | | | |
| | |
| | Ordinary Shares
Purchased | |
| |
| |
| |
| |
|---|
| | Total Consideration | |
| |
| |
|---|
| | Average Price Per
Ordinary Share
| | Average Price
Per ADS
| |
|---|
| | Number
| | Percent
| | Amount
| | Percent
| |
|---|
| | |
Existing shareholders | | | | | | | % | US$ | | | | | % | | | % | US$ | | |
New investors | | | | | | | | | | | | | | | | | | | |
| | | | |
| | Total | | | | | | 100 | % | | | | | 100 | % | | 100 | % | | | |
| | |
A US$1.00 increase (decrease) in the assumed initial public offering price of US$ per ADS, the midpoint of the estimated price range set forth on the cover of this prospectus, would increase (decrease) total consideration paid by new investors, total consideration paid by all shareholders and the average price per ADS paid by all shareholders by US$ , US$ and US$ , respectively, assuming no change in the number of ADSs sold by us as set forth on the cover page of this prospectus and without deducting underwriting discounts and commissions and other expenses of the offering.
41
Table of Contents
Dividend policy
While our predecessor entities have from time to time paid dividends, we do not plan to pay any cash dividends on our ordinary shares in the foreseeable future. We currently intend to retain most, if not all, of our available funds and any future earnings to operate and expand our business.
Our board of directors has complete discretion on whether to pay dividends, subject to the approval of our shareholders. Even if our board of directors decides to pay dividends, the form, frequency and amount will depend upon our future operations and earnings, capital requirements and surplus, general financial condition, contractual restrictions and other factors that the board of directors may deem relevant. If we pay any dividends, we will pay our ADS holders to the same extent as holders of our ordinary shares, subject to the terms of the deposit agreement, including the fees and expenses payable thereunder. See "Description of American depositary shares". Cash dividends on our ordinary shares, if any, will be paid in U.S. dollars.
In China, the payment of dividends is subject to limitations. PRC regulations currently permit payment of dividends only out of accumulated profits as determined in accordance with PRC accounting standards and regulations. Under PRC law, our joint venture in China, Huaren Kudong Commercial Trading Co., Ltd., is required to set aside at least 10% of its after-tax profits each year, if any, to fund a statutory reserve until such reserve reaches 50% of its registered capital. Our PRC joint venture is also required to set aside a portion of its after-tax profits to fund the employee welfare fund and enterprise expansion fund at the discretion of the board. Although the statutory reserves can be used, among other ways, to increase the registered capital and eliminate future losses in excess of retained earnings, the reserve funds are not distributable as cash dividends except in the event of liquidation of such subsidiary. In addition, dividend payments from our PRC joint venture could be delayed as such dividends may only be distributed upon completion of an annual audit of such joint venture. Our PRC joint venture, Huaren Kudong Commercial Trading Co., Ltd., which was established on November 25, 2010, has not yet achieved profitability, and therefore it has not set aside any funds for such statutory reserves.
42
Table of Contents
Enforceability of civil liabilities
We are incorporated in the Cayman Islands to take advantage of certain benefits associated with being a Cayman Islands exempted company, such as:
- •
- political and economic stability;
- •
- an effective judicial system;
- •
- a favorable tax system;
- •
- the absence of foreign exchange control or currency restrictions; and
- •
- the availability of professional and support services.
However, certain disadvantages accompany incorporation in the Cayman Islands. These disadvantages include:
- •
- the Cayman Islands has a less developed body of securities laws compared to the United States and provides significantly less protection to investors; and
- •
- Cayman Islands companies may not have standing to sue before the federal courts of the United States.
Our constituent documents do not contain provisions requiring that disputes, including those arising under the securities laws of the United States, between us, our officers, directors and shareholders, be arbitrated.
A majority of our directors are nationals or residents of jurisdictions other than the United States and a substantial portion of their assets are located outside the United States. As a result, it may be difficult for a shareholder to effect service of process within the United States upon such persons, or to enforce against them judgments obtained in United States courts, including judgments predicated upon the civil liability provisions of the securities laws of the United States or any state in the United States.
We have appointed National Corporate Research, Ltd. as our agent to receive service of process with respect to any action brought against us in the United States District Court for the Southern District of New York under the federal securities laws of the United States or of any state in the United States or any action brought against us in the Supreme Court of the State of New York in the County of New York under the securities laws of the State of New York.
Walkers, our counsel as to Cayman Islands law, has advised that there is uncertainty as to whether the courts of the Cayman Islands would:
- •
- recognize or enforce judgments of United States courts obtained against us or our directors or officers predicated upon the civil liability provisions of the securities laws of the United States or any state in the United States; or
- •
- entertain original actions brought in the Cayman Islands against us or our directors or officers predicated upon the securities laws of the United States or any state in the United States.
Walkers has further advised us that a final and conclusive judgment in the federal or state courts of the United States under which a sum of money is payable, other than a sum payable in respect of taxes, fines, penalties or similar charges, may be subject to enforcement proceedings as a debt in the courts of the Cayman Islands under common law.
43
Table of Contents
Corporate history and structure
We are a holding company incorporated in the Cayman Islands on August 12, 2010. We conduct substantially all of our business through our principal operating subsidiary Acquity Group LLC, a Delaware limited liability company established on March 22, 2001. Acquity Group LLC also began its commercial operations in 2001. We indirectly own 100% of the equity of Acquity Group LLC.
Acquisition of Acquity Group LLC
On March 20, 2008, our subsidiary GlobalGrowth, a limited liability company incorporated in the Cayman Islands, acquired 910,100 class A units of Acquity Group LLC for US$49.0 million. After taking into account the redemption by Acquity Group LLC of 780,089 class A units from other unit holders immediately thereafter, GlobalGrowth held a 70% equity interest in Acquity Group LLC. At that time GlobalGrowth was owned by two individuals, Louis Koo and Adrian Chan. GlobalGrowth's equity interest in Acquity Group LLC was held through a wholly owned subsidiary, Global Investments, a limited liability company incorporated in Delaware. The remaining 30% of the outstanding equity interest in Acquity Group LLC was held by certain senior management of Acquity Group LLC.
Convertible bonds issued by GlobalGrowth
The acquisition of Acquity Group LLC was funded through the issuance in February 2008 by GlobalGrowth of convertible bonds in the aggregate amount of US$50.2 million to two financial investors, Datai Bay Investments Ltd., or Datai Bay, which is a subsidiary of Khazanah Nasional Berhad, and SHK Asian Opportunities Holdings Ltd., or SHK. Additional bonds were issued from August 2008 to April 2010, in the aggregate amount of US$2.1 million. The initial maturity of the bonds was in February 2010, with an option for further extension of up to two years. These bonds were subsequently cancelled due to our restructuring, as described below.
Restructuring in anticipation of this offering
To prepare for this offering, the following restructuring steps were taken:
- (1)
- Our company, Acquity Group Limited, was incorporated in the Cayman Islands on August 12, 2010 as the holding company for the business of Acquity Group LLC as well as other future business projects. Our initial shareholder was 2020 China Holdings, Ltd., or China Holdings, which was incorporated in the Cayman Islands on August 4, 2010 to be our holding company. The entire issued share capital of China Holdings is held by Louis Koo and Adrian Chan.
- (2)
- On August 23, 2010, Louis Koo and Adrian Chan transferred the entire issued share capital of GlobalGrowth to us for nominal consideration and GlobalGrowth became our wholly owned subsidiary.
- (3)
- The senior management of Acquity Group LLC contributed all their equity interests in Acquity Group LLC to Global Investments on December 24, 2010 and in return received newly issued shares in our company.
44
Table of Contents
Exchangeable bonds and notes issued by China Holdings
On December 15, 2010, pursuant to a deed in respect of the convertible bonds issued by GlobalGrowth, the convertible bonds issued by GlobalGrowth were assigned by Datai Bay and SHK to China Holdings, in consideration of which China Holdings issued exchangeable bonds to each of Datai Bay and SHK. The convertible bonds issued by GlobalGrowth were subsequently cancelled. China Holdings subsequently partially redeemed the exchangeable bonds it had previously issued to Datai Bay in the principal amount of US$26.6 million, which redemption was financed by the existing cash reserves of China Holdings as well as the issue of exchangeable notes in the aggregate amount of US$25.8 million to two parties, namely, Surfmax Investment Partners Limited, or Surfmax, and G. George Lu, our chairman. Surfmax is a limited liability company incorporated in the British Virgin Islands and is indirectly owned by G. George Lu's sister and by one of our directors, Adrian Chan. The partial redemption of the exchangeable bonds and issuance of exchangeable notes were completed in February 2011.
All of the above-described exchangeable bonds and notes issued by China Holdings will, in accordance with their terms, be automatically exchanged upon the completion of this offering into the ordinary shares of our company currently held by China Holdings.
The following diagram illustrates our corporate structure prior to the completion of this offering.
45
Table of Contents
The following diagram illustrates our corporate structure upon the completion of this offering.
(1) Includes a group of senior management members of Acquity Group LLC who hold their equity interest in our company directly as well as four family limited partnerships that hold our ordinary shares. These senior management members include James Newman, Andrew Peebler, Todd Schwartz, Jonathan Borg-Breen, Jay Dettling, Kevin Doohan, Raymond Grady, Christopher Hauca, Mark Joseph and Rick Nash (resigned recently). See note (10) and notes (12) to (14) to the table of principal and selling shareholders in the "Principal and selling shareholder" section of this prospectus for further details regarding the equity interest held by those family limited partnerships.
(2) Upon the completion of this offering, China Holdings will transfer all of the ordinary shares of our company held by it to certain holders of exchangeable bonds and exchangeable notes, including Khazanah Nasional Bernad (through its subsidiary, Datai Bay Investments Ltd., or Datai Bay), SHK Asian Opportunities Fund, L.P. (through its subsidiary, SHK Asian Opportunities Holdings Ltd., or SHK), Surfmax and G. George Lu, our executive chairman and group chief executive. See notes (4), (7), (9) and (11) to the table of principal and selling shareholders in the "Principal and selling shareholders" section of this prospectus for further details regarding the respective ordinary shares to be received by those exchangeable security holders.
(3) Joint venture relating to brand e-commerce and digital marketing of the Li-Ning brand in the U.S. markets. Li Ning Company Limited, Li Tang and G. George Lu, our executive chairman and group chief executive, hold 19.90%, 30.10% and 30.10% of the equity interest in Digital Li-Ning Company Limited, respectively.
(4) G. George Lu, our executive chairman and group chief executive, Adrian Chan, our director and company secretary, and Shiu Wah Tse hold 25.52%, 5.02% and 2.52% of the equity interest in Cool Sports (BVI) Limited, respectively.
(5) Joint venture relating to the www.k121.com sportswear e-commerce platform in China. Shiu Wah Tse, Yan Wang and Qigong Zhu hold 2.63%, 1.97% and 0.66% of the equity interest of Huaren Kudong Commercial Trading Co., Ltd., respectively. Mr. Tse was an employee of Equity Partners from June 1, 2008 to March 31, 2011, and currently serves as a consultant for Equity Partners. Under an investment framework agreement entered into among the parties to the joint venture, Cool Sports (HK) Limited, Mr. Tse, Mr. Wang and Mr. Zhu are entitled to 5.00%, 28.00%, 50.25% and 16.75%, respectively, of the total profits of Huaren Kudong Commercial Trading Co., Ltd. If certain sales or revenue thresholds are met, Mr. Tse will transfer to Mr. Wang and Mr. Zhu a certain percentage of profit to which he is entitled. In any event, Mr. Tse has agreed to transfer all his entitlement to profit distributions from Huaren Kudong Commercial Trading Co., Ltd. to Cool Sports (HK) Limited before January 1, 2014. Huaren Kudong Commercial Trading Co., Ltd. is in the process of increasing its registered capital, which is subject to approvals from relevant PRC governmental authorities. After such proposed capital increase, Cool Sports (HK) Limited, Shiu Wah Tse, Tianjin Muyan Investment Management L.P., Yan Wang and Qigong Zhu will hold 92.46%, 2.25%, 2.93%, 1.74% and 0.62% of the equity interest of Huaren Kudong Commercial Trading Co., Ltd., respectively. Cool Sports (HK) Limited, Shiu Wah Tse, Tianjin Muyan Investment Management L.P., Yan Wang and Qigong Zhu will be entitled to 15.72%, 23.96%, 2.97%, 43.00% and 14.35%, respectively, of the total profits of Huaren Kudong Commercial Trading Co., Ltd.
46
Table of Contents
Selected consolidated financial and operating data
Our selected consolidated statement of operations data for the years ended December 31, 2009, 2010 and 2011 of our company, and the consolidated statement of financial position data as of December 31, 2009, 2010 and 2011 of our company, have been derived from our audited consolidated financial statements, which have been audited by Ernst & Young LLP, an independent registered accounting firm, and are included elsewhere in this prospectus. Our selected consolidated statement of operations data for the year ended December 31, 2007, and for the period from January 1, 2008 through March 20, 2008 of Acquity Group LLC (Predecessor), and for the year ended December 31, 2008 of our company, and the consolidated statement of financial position data as of December 31, 2007 of Acquity Group LLC (Predecessor), and as of December 31, 2008 of our company, have been derived from our audited consolidated financial statements, which have been audited by Ernst & Young LLP, an independent registered public accounting firm, and are not included in this prospectus.
Our consolidated financial statements for the year ended December 31, 2008 only included the financial results of our predecessor entity, Acquity Group LLC, for the partial period from March 21, 2008 to December 31, 2008. We have also included in this section non-IFRS pro forma financial results for the year ended December 31, 2008 assuming that the acquisition of our predecessor entity, Acquity Group LLC, occurred on January 1, 2008. See "Management's Discussion and Analysis of financial conditions and results of operation – Acquisition of Acquity Group LLC and impact on our financial statements." Unless otherwise indicated, all data for the year ended December 31, 2008 are presented in this prospectus on a non-IFRS pro forma basis. You should read the selected consolidated financial data in conjunction with our financial statements and the related notes and "Management's discussion and analysis of financial condition and results of operations" included elsewhere in this prospectus. Our consolidated financial statements are prepared and presented in accordance with IFRS.
47
Table of Contents
| | | | | | | | | | | | | | | | | | | | | | | | | |
| | |
| | Predecessor
(Acquity Group LLC) | | Year ended December 31, | |
|---|
(Amounts in thousands of US$, except for per share data)
| | Year ended
December 31,
2007
| | For the Period
January 1-March 20,
2008
| | Successor
(Acquity Group Limited)
2008
| | Pro Forma
Adjustments
| | (unaudited)
Pro Forma Basis
2008
| | 2009
| | 2010
| | 2011
| |
|---|
| | |
Selected Consolidated Statement of Comprehensive Income (Loss) Data | | | | | | | | | | | | | | | | | | | | | | | | | |
Revenues | | | 54,217 | | | 13,344 | | | 47,939 | | | | | | 61,283 | | | 51,087 | | | 72,559 | | | 106,655 | |
Cost of sales | | | (33,879 | ) | | (8,856 | ) | | (29,591 | ) | | | | | (38,447 | ) | | (29,132 | ) | | (41,150 | ) | | (60,543 | ) |
| | | | |
Gross profit | | | 20,338 | | | 4,488 | | | 18,348 | | | | | | 22,836 | | | 21,955 | | | 31,409 | | | 46,112 | |
Selling and distribution costs | | |
(4,396 |
) | |
(1,257 |
) | |
(4,356 |
) | | | | |
(5,613 |
) | |
(4,851 |
) | |
(6,734 |
) | |
(7,750 |
) |
Administrative expenses | | | (10,245 | ) | | (4,087 | ) | | (11,849 | ) | | (546 | )(2) | | (16,482 | ) | | (14,204 | ) | | (19,866 | ) | | (22,543 | ) |
| | | | |
Operating (loss) profit | | | 5,697 | | | (856 | ) | | 2,143 | | | (546 | ) | | 741 | | | 2,900 | | | 4,809 | | | 15,819 | |
Finance income | | |
— | | |
— | | |
357 | | | | | |
357 | | |
69 | | |
* | | |
87 | |
Other non-operating income | | | — | | | — | | | 855 | | | | | | 855 | | | 445 | | | 24 | | | — | |
Finance costs | | | (344 | ) | | (150 | ) | | (4,867 | ) | | (850 | )(3) | | (5,867 | ) | | (2,588 | ) | | (6,311 | ) | | (62 | ) |
Equity in earnings (losses) of joint venture | | | — | | | — | | | — | | | | | | — | | | — | | | — | | | (1,037 | ) |
Other non-operating expenses | | | — | | | — | | | (8,260 | ) | | | | | (8,260 | ) | | — | | | (41 | ) | | — | |
| | | | |
Profit (loss) before tax | | | 5,353 | | | (1,006 | ) | | (9,772 | ) | | (1,396 | ) | | (12,174 | ) | | 826 | | | (1,519 | ) | | 14,807 | |
Income tax benefit (expenses) | | |
(51 |
) | |
(16 |
) | |
1,697 | | |
213 |
(4) | |
1,894 | | |
(897 |
) | |
(1,853 |
) | |
(6,472 |
) |
| | | | |
Net profit (loss) | | | 5,302 | | | (1,022 | ) | | (8,075 | ) | | (1,183 | ) | | (10,280 | ) | | (71 | ) | | (3,372 | ) | | 8,335 | |
| | | | |
Profit (Loss) attributable to: | | | | | | | | | | | | | | | | | | | | | | | | | |
Equity holders of the company | | | | | | — | | | (9,022 | ) | | (828 | ) | | (9,850 | ) | | (1,465 | ) | | (5,533 | ) | | 8,607 | |
Non-controlling interests | | | | | | — | | | 947 | | | (355 | ) | | 592 | | | 1,394 | �� | | 2,161 | | | (272 | ) |
Pre-acquisition equity holder | | | 5,302 | | | (1,022 | ) | | — | | | — | | | (1,022 | ) | | — | | | — | | | | |
Other comprehensive income | | | — | | | — | | | — | | | — | | | — | | | — | | | — | | | 102 | |
| | | | |
| | | 5,302 | | | (1,022 | ) | | (8,075 | ) | | (1,183 | ) | | (10,280 | ) | | (71 | ) | | (3,372 | ) | | 8,437 | |
| | | | |
Earnings per share attributable to equity holders of the company | | | | | | | | | | | | | | | | | | | | | | | | | |
—Basic earnings (loss) per share | | | | | | — | | | (9,022.3 | ) | | — | | | NM | | | (1,465.1 | ) | | (5.0 | ) | | 0.23 | |
—Diluted earnings (loss) per share | | | | | | — | | | (9,022.3 | ) | | — | | | NM | | | (1,465.1 | ) | | (5.0 | ) | | 0.23 | |
Other Financial Data: | | | | | | | | | | | | | | | | | | | | | | | | | |
Adjusted EBITDA(1) | | | | | | 502 | | | 6,867 | | | | | | 7,369 | | | 8,036 | | | 10,640 | | | 19,959 | |
| | |
(1) We define adjusted EBITDA, a non-IFRS measure, as net income (loss), plus interest expense, income taxes, depreciation and amortization, impairment losses, other expenses and costs. For the reconciliation of adjusted EBITDA to net income (loss), see "—Adjusted EBITDA" below.
(2) Adjustment to record the expense attributable to the amortization of intangible assets identified at the acquisition date during the predecessor period, as if the acquisition had occurred on January 1, 2008.
(3) Adjustment to record the expense attributable to the valuation loss on convertible bonds during the predecessor period, as if the acquisition had occurred on January 1, 2008.
(4) Adjustment to record tax benefit incurred during the predecessor period as a result of the adjustments discussed in (2) and (3), as if the acquisition had occurred on January 1, 2008.
NM — Not Meaningful
* — Less than 0.1
48
Table of Contents
| | | | | | | | | | | | | | | | |
| | |
| | As of December 31, | |
|---|
| | 2007
| | 2008
| | 2009
| | 2010
| | 2011
| |
|---|
| | | |
|---|
(Amounts in thousands of US$)
| | Predecessor
| | Successor
| |
|---|
| | |
Selected Consolidated Statements of Financial Position Data | | | | | | | | | | | | | | | | |
Non-current assets | | | 2,144 | | | 48,691 | | | 37,566 | | | 35,935 | | | 38,557 | |
Current assets | | | 17,344 | | | 33,940 | | | 32,534 | | | 31,670 | | | 40,990 | |
| | | | |
Total assets | | | 19,488 | | | 82,631 | | | 70,100 | | | 67,605 | | | 79,547 | |
| | | | |
Total equity (deficit) | | | 6,795 | | | 2,076 | | | (1,101 | ) | | 55,997 | | | 64,434 | |
| | | | |
Non-current liabilities | | | 1,329 | | | 56,648 | | | 61,033 | | | 4,115 | | | 5,379 | |
Current liabilities | | | 11,364 | | | 23,907 | | | 10,168 | | | 7,493 | | | 9,734 | |
| | | | |
Total liabilities | | | 12,693 | | | 80,555 | | | 71,201 | | | 11,608 | | | 15,113 | |
| | | | |
Total equity and liabilities | | | 19,488 | | | 82,631 | | | 70,100 | | | 67,605 | | | 79,547 | |
| | |
| | | | | | | | | | | | | | | | |
| | |
| | Year Ended December 31, | |
|---|
| | 2007
| | 2008
| | 2009
| | 2010
| | 2011
| |
|---|
| | |
Selected Operating Data | | | | | | | | | | | | | | | | |
Average Number of Project Personnel | | | 140 | | | 191 | | | 164 | | | 202 | | | 288 | |
Project Personnel Utilization Rate | | | 81.7% | | | 75.8% | | | 73.4% | | | 79.6% | | | 80.5% | |
Project Personnel Average Realized Billing Rate | | US$ | 156/hour | | US$ | 147/hour | | US$ | 157/hour | | US$ | 162/hour | | US$ | 164/hour | |
Total hours billed to our clients | | | 222,628 | | | 290,480 | | | 226,836 | | | 333,224 | | | 475,807 | |
| | |
Adjusted EBITDA
To provide investors with additional information regarding our financial results, we have disclosed in this prospectus adjusted EBITDA, a non-IFRS financial measure. We have provided a reconciliation of adjusted EBITDA to net loss, the most directly comparable IFRS financial measure.
We have included adjusted EBITDA in this prospectus because it is a key measure used by our management and board of directors to understand and evaluate our core operating performance and trends, to prepare and approve our annual budget and to develop short- and long-term operational plans. In particular, the exclusion of certain expenses in calculating adjusted EBITDA can provide a useful measure for period-to-period comparisons of our core business. Specifically we believe it identifies the expenses associated with the acquisition of Acquity Group LLC, many of which did not occur after December 31, 2010. Accordingly, we believe that adjusted EBITDA provides useful information to investors and others in understanding and evaluating our operating results in the same manner as our management and board of directors.
Our use of adjusted EBITDA has limitations as an analytical tool, and you should not consider it in isolation or as a substitute for analysis of our results as reported under IFRS. Some of these limitations are:
- •
- although depreciation and amortization are non-cash charges, the assets being depreciated and amortized may have to be replaced in the future, and adjusted EBITDA does not reflect cash capital expenditure requirements for such replacements or for new capital expenditure requirements;
- •
- adjusted EBITDA does not reflect changes in, or cash requirements for, our working capital needs;
- •
- adjusted EBITDA does not reflect the potentially dilutive impact of equity-based compensation;
49
Table of Contents
- •
- adjusted EBITDA does not reflect tax payments that may represent a reduction in cash available to us; and
- •
- other companies, including companies in our industry, may calculate adjusted EBITDA differently, which reduces its usefulness as a comparative measure.
Because of these limitations, you should consider adjusted EBITDA alongside other financial performance measures, including various cash flow metrics, net income (loss) and our other IFRS results. The following table presents a reconciliation of adjusted EBITDA for each of the periods indicated:
| | | | | | | | | | | | | | | | | | | | | | |
| | |
| | Predecessor
(Acquity Group LLC) | | Year ended December 31, | |
|---|
(Amounts in thousands of US$)
| | For the Period
January 1-March 20,
2008
| | Successor
(Acquity Group
Limited)
2008
| | Pro Forma
Adjustments
| | Pro Forma
Basis
2008
| | 2009
| | 2010
| | 2011
| |
|---|
| | |
Net profit (loss) | | | (1,022 | ) | | (8,075 | ) | | (1,183 | ) | | (10,280 | ) | | (71 | ) | | (3,372 | ) | | 8,335 | |
Interest Expense, net of interest income relating to business operations at Acquity Group LLC | | | 150 | | | (71 | ) | | — | | | 79 | | | 111 | | | 14 | | | (87 | ) |
Relating to acquisition of Acquity Group LLC by Acquity Group Limited | | | — | | | 4,581 | | | 850 | (3) | | 5,431 | | | 2,407 | | | 6,298 | | | 62 | |
Income tax expense (benefit) | | | 16 | | | (1,697 | ) | | (213 | )(4) | | (1,894 | ) | | 897 | | | 1,853 | | | 6,472 | |
Depreciation and amortization relating to business operations at Acquity Group LLC | | | 190 | | | 742 | | | — | | | 932 | | | 842 | | | 941 | | | 1,469 | |
Intangible assets affecting administrative expense relating to the acquisition | | | — | | | 2,149 | | | 546 | (2) | | 2,695 | | | 2,750 | | | 2,555 | | | 2,500 | |
Impairment loss | | | — | | | 8,260 | | | — | | | 8,260 | | | — | | | — | | | — | |
Other expenses and costs(1) | | | 1,168 | | | 978 | | | — | | | 2,146 | | | 1,100 | | | 2,351 | | | 1,208 | |
| | | | |
Adjusted EBITDA | | | 502 | | | 6,867 | | | — | | | 7,369 | | | 8,036 | | | 10,640 | | | 19,959 | |
| | |
(1) Includes advisory fees paid in connection with the issuance of the convertible bonds and acquisition of Acquity Group LLC, non-cash expenses in connection with the cancellation of incentive units in preparation for this offering, management fees paid to Equity Partners, professional fees related to an aborted financing transaction and the initial public offering related fees.
(2) Adjustment to record the expense attributable to the amortization of intangible assets identified at the acquisition date during the predecessor period, as if the acquisition had occurred on January 1, 2008.
(3) Adjustment to record the expense attributable to the valuation loss on convertible bonds during the predecessor period, as if the acquisition had occurred on January 1, 2008.
(4) Adjustment to record tax benefit incurred during the predecessor period as a result of the adjustments discussed in (2) and (3), as if the acquisition had occurred on January 1, 2008.
50
Table of Contents
Management's discussion and analysis of
financial condition and results of operations
The following discussion of our financial condition and results of operations is based upon and should be read in conjunction with our audited consolidated financial statements and related notes as of and for the years ended December 31, 2009, 2010 and 2011 included elsewhere in this prospectus. Our consolidated financial statements have been prepared in accordance with International Financial Reporting Standards, or IFRS. This discussion contains forward-looking statements that involve risks and uncertainties. Actual results could differ materially from those projected in the forward-looking statements. In evaluating our business, you should carefully consider the information provided under the caption "Risk factors" beginning on page 15 of this prospectus.
Overview
We are a leading brand e-commerce and digital marketing company that leverages the internet, mobile devices and social media to enhance our clients' brand impressions and their e-commerce performance. We are the digital agency of record for a number of well-known global brands in multiple industries, specifically Allstate Insurance Company, Discover Card's mobile-related business, Shimano, Tommy Bahama and W.W. Grainger Inc., which meant that we are the principal provider of brand e-commerce and digital marketing services for these clients. We deliver end-to-end solutions to address their brand e-commerce and digital marketing needs.
We derive almost all of our revenues from our three service offerings: digital strategy, multi-channel digital marketing and brand e-commerce technology services.
- •
- Digital strategy: We provide our clients a broad array of digital strategy services aimed at enhancing the brand experience, increasing brand loyalty and monetizing their brands. We combine our business and technology expertise to analyze how products, brands and consumers interact and the role that current and emerging technologies play in this digital relationship. We also provide BTO services to help our clients assess and improve their business technology assets.
- •
- Multi-channel digital marketing: We assist our clients to create a seamless brand experience across internet, mobile devices and social media applications, allowing them to develop higher value and long-term customer relationships. We employ digital marketing techniques such as targeted online promotional activities, newsfeeds on social network websites, search engine optimization, mobile marketing and location-based services to engage customers with the brand.
- •
- Brand e-commerce technology: We design online stores and other points of sale for our clients that can supplement their physical store networks or serve as an effective alternative to expanding those networks. In some cases, we also operate websites on behalf of our clients. As a result, we manage or control the user experience of many multinational and multi-lingual digital corporate platforms.
We derived all of our revenues in the three-year period ended December 31, 2011 from our clients in the United States. We derive substantially all of our revenues from fees for services
51
Table of Contents
generated on a project-by-project basis. Most of our services are provided on a time-and-materials basis, with a small portion being performed on a fixed-price basis. We have one reportable operating segment and record our revenues as a single line item.
We believe the major challenge that we currently face that could have a material effect on our financial condition and results of operations involves the recent recessionary conditions in the United States and the risk that such conditions could worsen, as substantially all of our revenues are derived from our U.S. operations and from clients based in the United States, and the amount of business we generate from our clients is directly related to the state of the U.S. economy as a whole. See "Risk Factors" for a detailed discussion of other risks and challenges that we are facing.
Our revenues increased from US$51.1 million in 2009 to US$72.6 million in 2010, and grew further to US$106.7 million in 2011. Our gross profit increased from US$22.0 million in 2009 to US$31.4 million in 2010, and grew further to US$46.1 million in 2011. Our net loss was US$0.1 million and US$3.4 million in 2009 and 2010, respectively. Our net profit was US$8.3 million in 2011. Our adjusted EBITDA increased from US$8.0 million in 2009 to US$10.6 million in 2010 and to US$20.0 million in 2011, representing a CAGR of 57.6% from 2009 to 2011. For a reconciliation of our non-IFRS adjusted EBITDA to the IFRS measure of net profit or loss, see "Selected consolidated financial and operating data—Adjusted EBITDA".
Factors affecting our financial condition and results of operations
We believe the key factors affecting our financial condition and results of operations include:
- •
- Global growth in internet usage. Consumers rely increasingly on the internet for information on products and services they are considering to purchase and more of such purchases are being made online, with the global internet population expected to grow from 2 billion in 2010 to 2.7 billion by 2015, according to an industry source. See "Industry overview—Deepening and broadening of the consumer digital experience". This trend has required companies around the world to reconsider their business strategies and place greater emphasis on brand e-commerce and digital marketing. As a result, this trend has increased the demand for our digital strategy, multi-channel digital marketing and brand e-commerce technology services. Our financial condition and results of operations depend on the continuation of this global trend towards increasing usage of the internet and increasing demand for our services.
- •
- Economic conditions in our key client industries and locations. While the recent global financial crisis has caused companies generally to place more emphasis on their e-commerce strategies, our revenues continue to be significantly affected by economic conditions in the industries in which our main clients operate, including retailing, media and telecommunications and financial services. Any downturn in economic conditions in these industries may adversely affect our clients' budgets for digital advertising and e-commerce technology services. Our revenues may also be affected by economic conditions in the countries and regions in which our clients operate. Economic growth or decline in these industries and locations over the past several years has had a significant effect on the level of demand for our services, which has also affected our financial condition and results of operations. For the three years ended December 31, 2011, all of our revenues were derived from our clients in the United States. Significant downturns in the level of
52
Table of Contents
business activity in the United States have had and will have an adverse effect on our financial condition and results of operations. For example, the slowdown in our key clients' industries as a result of the global financial crisis in 2008 and 2009 led some of our clients to reduce their budgets for digital advertising and e-commerce technology, which in turn adversely affected our financial performance and results of operations. Our 16.6% revenue decrease from 2008 to 2009 was partially attributable to the decline in economic conditions in the United States as a result of the global financial crisis, and our 42.0% revenue increase from 2009 to 2010 and 47.0% revenue increase from 2010 to 2011 were partially attributable to the partial U.S. economic recovery and the rebound in our key clients' industries during these periods.
- •
- Competition. We operate in the digital marketing and e-commerce sector, which is a relatively new industry sector and highly competitive, and such competition is not limited by geographic boundaries. Our operations may be affected by competition in the digital marketing and brand e-commerce sector, particularly from companies that compete with us in one or more of our service areas, including the digital advisory arms of strategic consulting firms, digital marketing agencies and providers of e-commerce solutions. Competition has also intensified as a result of increased alliances and acquisitions by our competitors. See "Business—Competition". Although in the three years ended December 31, 2011 we did not face consistent competition from major competitors in the industry which had significantly impacted our business operations, we believe that our financial condition and results of operations may be adversely affected in the future if we fail to successfully compete with existing and new competitors in the industry in terms of price, location, quality of services, technical and strategic expertise, as well as the ability to attract new and repeat business.
- •
- Utilization rate of our project personnel. The utilization rate of our project personnel represents the total hours billed by our project personnel in a period divided by available hours of our project personnel in such period. The utilization rate of our project personnel will be affected by the time the project personnel spend on training, business development and transitioning between projects. The utilization rate of our project personnel has a direct effect on our gross margin, profitability and results of operations. Our ability to accurately budget project personnel headcount needs and maintain an appropriately sized workforce will also affect our financial condition and performance. From time to time we engage independent subcontractors to provide services in order to meet client demand that exceeds the capacity of our project personnel. In general, when the utilization rate of our project personnel increases, our use of subcontractors also increases, subject to possible time lags due to the time required to engage the subcontractors and the timing of the commencement and completion of our projects. The utilization rate of our project personnel was 73.4%, 79.6% and 80.5%, for the years ended December 31, 2009, 2010 and 2011, respectively. The increase in our gross margin from 43.0% in 2009 to 43.3% in 2010 was partially attributable to an increase in our project personnel utilization rate from 73.4% in 2009 to 79.6% in 2010. Our gross margin decreased slightly from 43.3% in 2010 to 43.2% in 2011, despite the increase in the utilization rate of our project personnel from 2010 to 2011. The slight decrease in our gross margin from 2010 to 2011 was primarily attributable to a 74.7% increase in our subcontractor costs from 2010 to 2011 as a result of increased use of subcontractors to meet the higher level of client demand.
53
Table of Contents
- •
- Billing rates and realization. Most of our work is performed on a time-and-materials basis, with a small portion performed on a fixed-price basis. Our billing rates and ability to collect our fees at those rates are key factors impacting our revenues and gross margins. Our billing rates vary by the experience level of our project personnel and the type of services provided by such personnel, and are usually adjusted on an annual basis. Our average realized billing rates for our project personnel (not including subcontractors) are calculated as revenues generated by our project personnel recognized for the period divided by total hours billed by our project personnel (not including subcontractors) for the period, including hours incurred for warranty work we provide to our clients for which we do not charge our clients or charge for our services at lower billing rates. Our average realized billing rates for our project personnel were US$157 per hour, US$162 per hour and US$164 per hour for the years ended December 31, 2009, 2010 and 2011, respectively. The 42.0% increase in our revenues from 2009 to 2010 was partially attributable to the increase of our average realized billing rate for our project personnel from US$157 per hour in 2009 to US$162 per hour in 2010. The 47.0% increase in our revenues from 2010 to 2011 was partially attributable to the increase of our average realized billing rate for our project personnel from US$162 per hour in 2010 to US$164 per hour in 2011.
Acquisition of Acquity Group LLC and impact on our financial statements
We are a holding company incorporated in the Cayman Islands on August 12, 2010 and we conduct substantially all of our business through our principal operating entity, Acquity Group LLC, a limited liability company incorporated in Delaware on March 22, 2001. We acquired our interest in Acquity Group LLC as follows:
On March 20, 2008, our wholly owned indirect subsidiary, 2020 Global Investments LLC, or Global Investments, entered into a Unit Purchase and Redemption Agreement with Acquity Group LLC. Pursuant to this agreement, Global Investments paid US$49 million as consideration for 910,100 newly issued units from Acquity Group LLC. Immediately following the issuance of the units, Acquity Group LLC redeemed 780,089 units from existing unit holders. As a result of these transactions, Global Investments held an equity interest of 70% in Acquity Group LLC. The remaining 30% equity interest in Acquity Group LLC continued to be held by the founders of Acquity Group LLC and certain senior management of Acquity Group LLC. As a result, our consolidated financial statements for the year ended December 31, 2008 on an IFRS basis only included the financial results of our operating entity, Acquity Group LLC, for the partial period from March 21, 2008 to December 31, 2008 under the purchase method of accounting.
As part of the funding arrangements for the acquisition of Acquity Group LLC, on December 21, 2007, our wholly owned subsidiary, GlobalGrowth, entered into bond subscription agreements with two independent third parties, Datai Bay and SHK. Convertible bonds in the aggregate amount of US$50.2 million were issued by GlobalGrowth in February 2008. Additional bonds were issued from August 2008 to April 2010, in the aggregate amount of US$2.1 million. On August 23, 2010, the entire issued share capital of GlobalGrowth was transferred to us for nominal consideration and GlobalGrowth became our wholly owned subsidiary.
On December 15, 2010, pursuant to a deed in respect of the convertible bonds in the principal amount of US$52.3 million issued by GlobalGrowth, these bonds were assigned by Datai Bay
54
Table of Contents
and SHK to China Holdings, in consideration of which China Holdings issued exchangeable bonds to each of Datai Bay and SHK. The convertible bonds issued by GlobalGrowth were subsequently cancelled. China Holdings partially redeemed US$26.6 million of the exchangeable bonds it issued to Datai Bay, which redemption was financed by the existing cash reserves of China Holdings as well as the issue of exchangeable notes in the aggregate amount of US$25.8 million to Surfmax and G. George Lu. See "Our Corporate history and structure" for details.
Key components of results of operations
Revenues
Our revenues are primarily derived from our three service offerings: digital strategy, multi-channel digital marketing and brand e-commerce technology services. All of our revenues in the three-year period ended December 31, 2011 were derived from our clients in the United States. The table below sets forth our revenues for the periods indicated:
| | | | | | | | | | |
| | |
| | Year ended December 31, | |
|---|
(Amounts in thousands of US$)
| | 2009
| | 2010
| | 2011
| |
|---|
| | |
Total Revenues | | | 51,087 | | | 72,559 | | | 106,655 | |
| | |
We derive substantially all of our revenues from fees for services generated on a project-by-project basis. Most of our services are provided on a time-and-materials basis, with a small portion being performed on a fixed-price basis. We recognize revenues for time-and-material arrangements on hours worked as services are provided. We recognize revenues for fixed-price arrangements on the percentage-of-completion method. See "—Critical accounting policies—Revenue recognition—Services".
Our revenues from our digital strategy, multi-channel digital marketing and brand e-commerce technology services grew significantly from 2009 to 2010, primarily due to increasing market demand for our services driven by the trend towards increasing Internet usage and the economic recovery from the global financial crisis, as well as our enhanced sales efforts to capitalize on this demand. Our revenues increased by 47.0% from 2010 to 2011, primarily due to increased demand for our services from both new and existing clients, as well as our enhanced business development efforts. We believe our revenues will continue to grow as we expand the scope and coverage of our services to meet the increasing demand for digital marketing and e-commerce-related services.
A portion of our revenues are derived from services provided by independent subcontractors. From time to time we engage independent subcontractors to provide services in order to meet client demand that exceeds the capacity of our project personnel and to provide ancillary
55
Table of Contents
services that we do not generally provide. The table below sets forth our revenues derived from subcontractors for the periods indicated:
| | | | | | | | | | | | | | | | | | | |
| | |
| | Year ended December 31, | |
|---|
| | 2009 | | 2010 | | 2011 | |
|---|
(Amounts in thousands of US$, except for percentages)
| | Amount
| | % of
Revenues
| | Amount
| | % of
Revenues
| | Amount
| | % of
Revenues
| |
|---|
| | |
Revenues derived from subcontractors | | | 4,099 | | | 8.0% | | | 11,020 | | | 15.2% | | | 19,016 | | | 17.8% | |
| | |
Cost of sales
The principal components of our cost of sales consist of compensation costs for our project personnel, subcontractor costs, travel, third-party hosting and other costs. Our compensation costs generally include salaries, bonuses, benefits and payroll-related taxes we pay to our employees. Project personnel refer to those personnel who engage in providing services to clients and for whose services we charge our clients based on their hourly billing rates. Our subcontractor costs are costs we pay to outside service providers that we engage to provide services to our clients, in cases where our own project personnel are fully engaged and we require additional support or for ancillary services that we do not generally provide. Our third-party hosting costs refer to the costs paid to our third-party hosting providers, along with the depreciation and amortization costs of hardware and software associated with the hosting services and software maintenance fees. Our cost of sales grew significantly from 2009 to 2011, in line with the substantial growth of our revenues. The following table sets forth a breakdown of our cost of sales for the periods indicated:
| | | | | | | | | | | | | | | | | | | | |
| | |
| | Year ended December 31, | |
|---|
| | 2009 | | 2010 | | 2011 | |
|---|
(Amounts in thousands of US$, except for percentages)
| |
|---|
| | Amount
| | %
| | Amount
| | %
| | Amount
| | %
| |
|---|
| | |
Cost of sales: | | | | | | | | | | | | | | | | | | | |
| | Compensation costs for our project personnel | | | 20,807 | | | 71.4% | | | 27,714 | | | 67.4% | | | 39,749 | | | 65.7% | |
| | Subcontractor costs | | | 3,516 | | | 12.1 | | | 7,824 | | | 19.0 | | | 13,669 | | | 22.5 | |
| | Travel, third-party hosting and other costs | | | 4,809 | | | 16.5 | | | 5,612 | | | 13.6 | | | 7,125 | | | 11.8 | |
| | | | |
| | | 29,132 | | | 100.0% | | | 41,150 | | | 100.0% | | | 60,543 | | | 100.0% | |
| | |
We expect our cost of sales to continue to grow as we add project personnel to meet the increasing demand for our digital strategy, multi-channel digital marketing and brand e-commerce technology services and expand into new markets. We expect that our subcontractor costs will increase, as the engagement of subcontractors for certain services can provide us with greater flexibility in scaling our business operations. We intend to continue to engage subcontractors on a selected and strategic basis to extend our scope and range of services without incurring the fixed costs associated with the addition of permanent project personnel.
56
Table of Contents
Gross profit
Gross profit is equal to revenues less cost of sales. Gross margin is equal to gross profit divided by revenues. The table below sets forth our gross profit and gross margins for the periods indicated:
| | | | | | | | | | | | | | | | | | | |
| | |
| | Year ended December 31, | |
|---|
| | 2009 | | 2010 | | 2011 | |
|---|
(Amounts in thousands of US$, except for percentages)
| | Amount
| | Gross Margin
| | Amount
| | Gross Margin
| | Amount
| | Gross Margin
| |
|---|
| | |
Gross profit | | | 21,955 | | | 43.0% | | | 31,409 | | | 43.3% | | | 46,112 | | | 43.2% | |
| | |
Our gross profit and gross margin increased from 2009 to 2010, primarily driven by the increased utilization rates of our project personnel as demand for our services increased. Our gross profit increased by 46.8% from 2010 to 2011, primarily due to the 47.0% increase in our revenues from 2010 to 2011. Our gross margin decreased slightly from 43.3% in 2010 to 43.2% in 2011, primarily due to a 74.7% increase in subcontractor costs from 2010 to 2011.
Selling and distribution costs
Our selling and distribution costs primarily consist of compensation costs for our business development personnel and marketing costs. The table below sets forth our selling and distribution costs for the periods indicated:
| | | | | | | | | | | | | | | | | | | |
| | |
| | Year ended December 31, | |
|---|
| | 2009 | | 2010 | | 2011 | |
|---|
(Amounts in thousands of US$, except for percentages)
| | Amount
| | % of
Revenues
| | Amount
| | % of
Revenues
| | Amount
| | % of
Revenues
| |
|---|
| | |
Selling and distribution costs | | | 4,851 | | | 9.5% | | | 6,734 | | | 9.3% | | | 7,750 | | | 7.3% | |
| | |
For the years ended December 31, 2009, 2010 and 2011, the average number of our business development personnel was 40, 44 and 39, respectively, while the average number of our business development personnel in charge of client relationships, whom we refer to as our client partners, was 12, 15 and 17, respectively. The 15.1% increase in our selling and distribution costs from 2010 to 2011 was primarily due to the increase in the number of our client partners and the increase in the commission-related incentive payments made to our selling and distribution personnel, which was partially offset by the decrease in the overall average number of our selling and distribution personnel. We anticipate our selling and distribution costs will continue to increase as we expand our digital strategy, multi-channel digital marketing and brand e-commerce technology services in response to increasing demand.
Administrative expenses
Our administrative expenses consist primarily of compensation costs for our management, accounting and administrative personnel, amortization of intangible assets expenses, professional service fees, lease expenses and other expenses. Our administrative expenses were US$14.2 million, US$19.9 million and US$22.5 million for the years ended December 31, 2009, 2010 and 2011, respectively. As a percentage of revenues, our administrative expenses were
57
Table of Contents
27.8%, 27.4% and 21.1% for the years ended December 31, 2009, 2010 and 2011, respectively. As a percentage of revenues, our administrative expenses decreased from 27.4% in 2010 to 21.1% in 2011, primarily as a result of economies of scale as our business grew. Our administrative expenses increased in the three-year period ended December 31, 2011, primarily as a result of our expanding operations and hiring of additional staff to support our growth. For the years ended December 31, 2009, 2010 and 2011, the average number of our management, accounting and administrative personnel was 43, 48 and 51, respectively. We expect our administrative expenses to continue to increase as our operations expand.
The table below sets forth the breakdown of our administrative expenses for the periods indicated:
| | | | | | | | | | | | | | | | | | | | |
| | |
| | Year ended December 31, | |
|---|
| | 2009 | | 2010 | | 2011 | |
|---|
(Amounts in thousands of US$, except for percentages)
| |
|---|
| | Amount
| | %
| | Amount
| | %
| | Amount
| | %
| |
|---|
| | |
Administrative expenses: | | | | | | | | | | | | | | | | | | | |
| | Compensation costs for our management, accounting and administrative personnel | | | 5,270 | | | 37.1 | % | | 8,317 | | | 41.9 | % | | 8,482 | | | 37.6 | % |
| | Amortization of intangible assets | | | 2,500 | | | 17.6 | | | 2,500 | | | 12.6 | | | 2,533 | | | 11.2 | |
| | Professional service fees | | | 571 | | | 4.0 | | | 2,241 | | | 11.3 | | | 3,509 | | | 15.6 | |
| | Lease and related expenses | | | 1,751 | | | 12.3 | | | 1,963 | | | 9.9 | | | 2,612 | | | 11.6 | |
| | Other expenses(1) | | | 4,112 | | | 29.0 | | | 4,845 | | | 24.3 | | | 5,407 | | | 24.0 | |
| | | | |
| | | 14,204 | | | 100.0 | % | | 19,866 | | | 100.0 | % | | 22,543 | | | 100.0 | % |
| | |
(1) Other expenses primarily include depreciation costs, information technology maintenance fees, employee relations fees, insurance costs, travel expenses and external recruiting fees.
Our administrative expenses included amortization of intangible assets expenses of US$2.5 million in each of the years ended December 31, 2009, 2010 and 2011. The amortization of intangible assets expenses represented the amortization expenses for customer lists which we incurred as a result of the acquisition of Acquity Group LLC in 2008, which will recur until the first quarter of 2014. See "—Other non-operating income and expenses". In 2011, we also incurred amortization of intangible assets expenses related to non-competition agreements of US$33,000 in connection with the purchase of a search marketing analytics company. Such expenses will recur until 2013.
58
Table of Contents
Finance income and costs
Our finance income represents interest income on our bank balances. Our finance costs primarily include interest expenses on interest-bearing borrowings and non-cash interest expenses on convertible bonds. The following table sets forth our finance income and costs for the periods indicated:
| | | | | | | | | | |
| | |
| | Year ended December 31, | |
|---|
(Amounts in thousands of US$)
| | 2009
| | 2010
| | 2011
| |
|---|
| | |
Finance income | | | | | | | | | | |
Interest income | | | 69 | | | * | | | 87 | |
| | | | |
Finance costs | | | | | | | | | | |
Interest expenses on interest bearing borrowings | | | 181 | | | 22 | | | — | |
Interest expenses on convertible bonds | | | 4,230 | | | 2,990 | | | — | |
Loss (gain) on valuation of convertible bonds derivative component | | | (1,883 | ) | | 3,217 | | | — | |
Others | | | 60 | | | 82 | | | 62 | |
| | | | |
| | | 2,588 | | | 6,311 | | | 62 | |
| | |
* — Less than 0.1
In connection with the Unit Purchase and Redemption Agreement, Acquity Group LLC was required to place US$21 million into an interest-bearing escrow account to be used for earn-out payments for 2008 and 2009. Our interest income on bank balances represents interest income relating to this escrow account.
We incurred interest expenses on the convertible bonds issued by GlobalGrowth in February 2008 in the amount of US$4.2 million and US$3.0 million for the years ended December 31, 2009 and 2010, respectively. The convertible bonds contain two components, a liability component and a derivative component. Transaction costs relating to the liability component amounting to US$0.8 million have been included in the carrying amount of the liability portion and amortized over the period of the borrowing term using the effective interest method. The fair value of the embedded derivative component was determined at each issue date and the end of reporting period using the binomial method by an independent valuer. The changes in fair value of the components are recognized in profit or loss. We incurred a gain on valuation of convertible bonds derivative component of US$1.9 million in 2009 and a loss on valuation of convertible bonds derivative component of US$3.2 million in 2010.
The convertible bonds issued by GlobalGrowth were subsequently cancelled and in consideration for the cancellation of the convertible bonds, GlobalGrowth paid US$3.9 million to the bondholder and the excess amount of convertible bonds amounting to US$60.7 million was recorded as capital reserve. Interest expenses on convertible bonds and loss (gain) on valuation of convertible bonds derivative component did not recur after the end of 2010. See "— Acquisition of Acquity Group LLC and impact on our financial statements".
Our net finance costs were US$2.5 million and US$6.3 million in 2009 and 2010, respectively. Our net finance income was US$25,711 in 2011.
59
Table of Contents
Other non-operating income and expenses
Other non-operating income primarily represents gain on change in fair value of contingent consideration. Other non-operating expenses primarily include impairment loss on goodwill, impairment loss on intangible assets and loss on change in fair value of contingent consideration. The following table sets forth our other non-operating income and expenses for the periods indicated:
| | | | | | | | | | |
| | |
| | Year ended December 31, | |
|---|
(Amounts in thousands of US$)
| | 2009
| | 2010
| | 2011
| |
|---|
| | |
Other non-operating income | | | | | | | | | | |
Gain on change in fair value of contingent consideration | | | 445 | | | — | | | — | |
Others | | | — | | | 24 | | | — | |
| | | | |
| | | 445 | | | 24 | | | — | |
| | | | |
Other non-operating expenses | | | | | | | | | | |
Impairment loss on goodwill | | | — | | | — | | | — | |
Impairment loss on intangible assets | | | — | | | — | | | — | |
Loss on change in fair value of contingent consideration | | | — | | | 41 | | | — | |
| | | | |
| | | — | | | 41 | | | — | |
| | |
In connection with the Unit Purchase and Redemption Agreement, contingent consideration in association with earn-out payments for 2008 and 2009 was recorded when certain conditions were met. The contingent consideration resulting from business combinations is remeasured to fair value at each reporting date. The determination of the fair value is based on discounted cash flow. The fair value adjustment is recognized as non-operating income or expenses.
Taxation
Cayman Islands
The Cayman Islands currently levies no taxes on individuals or corporations based upon profits, income, gains or appreciation and there is no taxation in the nature of inheritance tax or estate duty. Dividend payments are not subject to withholding tax in the Cayman Islands. There are no other taxes likely to be material to our company levied by the government of the Cayman Islands, except for stamp duties that may be applicable on instruments executed in, or after execution brought within the jurisdiction of, the Cayman Islands. The Cayman Islands is not a party to any double taxation treaties that are applicable to any payments made to or by our company.
United States
Global Investments was formed in the United States and is subject to U.S. federal income tax at a statutory rate of 34% and state income tax at various jurisdictional tax rates as a corporation. The current Acquity Group LLC originally was formed in the United States as a partnership, which was not subject to income tax (i.e., its income or loss flowed through to its partners). As a result of the business combination on March 20, 2008, Acquity Group LLC experienced, for U.S. federal income tax purposes, a partnership technical termination, resulting in a pro-rata
60
Table of Contents
step-up in tax basis of Acquity Group LLC's assets and the formation of a new partnership, for U.S. federal income tax purposes. As a result of the share swap on December 24, 2010, Acquity Group LLC experienced, for U.S. federal income tax purposes, a partnership technical termination, resulting in a pro-rata step-up in the tax basis of Acquity Group LLC and the formation of a new single member limited liability company for U.S. federal income tax purposes. From December 24, 2010, Acquity Group LLC elected for U.S. federal income tax purposes, to be treated as a disregarded entity, which is not subject to U.S. federal income tax (i.e., its income or loss flows through to its single member, Global Investments).
People's Republic of China
The PRC Enterprise Income Tax Law, or the PRC EIT Law, and Implementation Regulations of the Enterprise Income Tax Law, or the Implementation Regulations, apply a uniform 25.0% enterprise income tax rate to both foreign-invested enterprises and domestic enterprises. The PRC EIT Law and Implementation Regulations provide preferential tax treatments to industries and projects that are strongly supported and encouraged by the state, and enterprises classified as "High and New Technology Enterprises" are entitled to a 15.0% enterprise income tax rate. Our PRC joint venture, Hua Ren Commercial, as a joint venture registered in Beijing, is subject to an enterprise income tax rate of 25%.
Under the PRC EIT Law and the Implementation Regulations, PRC withholding tax at the rate of 10.0% is applicable to interest and dividends payable to investors that are "non-resident enterprises," which do not have an establishment or place of business in the PRC, or which have such establishment or place of business but the relevant income is not effectively connected with the establishment or place of business, to the extent such interest and dividends have their sources within the PRC. A lower income tax rate of 5.0% is applied if the "non-resident enterprises" are registered in Hong Kong or another jurisdiction that has a tax treaty arrangement with China and such "non-resident enterprises" are deemed as "beneficial owners" of the income generated in the PRC as defined in Notice on How to Understand and Determine the Beneficial Owners in Tax Agreement, or SAT Circular 601. According to SAT Circular 601, a "beneficial owner" generally must be engaged in substantive business activities. An agent or conduit company will not be regarded as a beneficial owner and, therefore, will not qualify for treaty benefits. The conduit company normally refers to a company that is set up for the purpose of avoiding or reducing taxes or transferring or accumulating profits. In our case, we hold the equity interest in our PRC joint venture through Cool Sports (HK) Limited, one of our subsidiaries registered in Hong Kong. The income tax rate applicable to the dividends derived from our PRC joint venture would be 5% if Cool Sports (HK) Limited is regarded as a "beneficial owner" by the local tax authority.
Critical accounting policies
The discussion and analysis of our financial condition and results of operations are based upon our consolidated financial statements as of and for the years ended December 31, 2009, 2010 and 2011, which have been prepared in accordance with IFRS. Our reported financial condition and operating results are sensitive to accounting methods and assumptions and estimates that underlie the preparation of the financial statements. We periodically evaluate our estimates and assumptions and base them on historical experience and on various other factors that we believe to be reasonable under the circumstances, the results of which form the basis for
61
Table of Contents
making judgments about the carrying values of assets and liabilities that are not readily apparent from other sources. Actual results typically differ from these estimates.
The selection of critical accounting policies, the judgments and other uncertainties affecting application of those policies and the sensitivity of reported results to changes in conditions and assumptions are factors that should be considered when reviewing our financial statements. For further information on our significant accounting policies, see note 2 to our consolidated financial statements included elsewhere in this prospectus. We believe the following accounting policies involve the most significant judgments and estimates used in the preparation of our financial statements.
Revenue recognition
Revenues are recognized to the extent that it is probable that all the economic benefits will flow to us and the revenues can be reliably measured. Revenues are measured at the fair value of the consideration received, excluding discounts, rebates and other sales taxes or duty. The following specific recognition criteria must also be met before revenues are recognized.
Services
We recognize revenues from the provision of digital strategy, multi-channel digital marketing and brand e-commerce technology services to our clients when persuasive evidence of an arrangement exists, and services have been provided to our customers. Revenues for time-and-materials contracts are earned based on hours worked and reimbursements received for out-of-pocket expenses and realized as services are provided. Revenues from fixed-price contracts are recognized using the percentage-of-completion method. Revenues are recognized based on the percentage-of-labor incurred to estimated total labor. Reimbursements received for out-of-pocket expenses incurred are characterized as revenues, other than operating expenses such as taxes, subcontractor costs and travel expenses.
Interest income
For all financial instruments measured at amortized cost and interest-bearing financial assets classified as available-for-sale, interest income or expense is recorded using the effective interest rate, which discounts the estimated future cash payments or receipts through the expected life of the financial instrument or a shorter period, where appropriate, to the net carrying amount of the financial asset or liability. Interest income is included in finance income in our consolidated financial statements.
Fair value of financial instruments
The fair value of financial instruments that are traded in active markets at each reporting date is determined by reference to quoted market prices or dealer price quotations (bid price for long positions and ask price for short positions), without any deduction for transaction costs. For financial instruments not traded in any active market, the fair value is determined using appropriate valuation techniques. Such techniques may include using recent arm's length market transactions, reference to the current fair value of another instrument that is substantially the same, discounted cash flow analysis or other valuation models.
62
Table of Contents
Taxes
Current income tax
Current income tax assets and liabilities are measured at the amount expected to be recovered from or paid to the taxation authorities. The tax rates and tax laws used to compute the amount are those that are enacted or substantively enacted by the reporting date, in the country where we operate and generate taxable income. Current income tax relating to items recognized directly in equity is recognized in equity and not in our consolidated statements of comprehensive income.
Deferred tax
Deferred tax is provided using the asset-liability method on temporary differences at the reporting date between the tax bases of assets and liabilities and their carrying amounts for financial reporting purposes. Deferred tax liabilities are recognized for all taxable temporary differences, except:
- (a)
- where the deferred tax liability arises from the initial recognition of goodwill or of an asset or liability in a transaction that is not a business combination and, at the time of the transaction, affects neither the accounting profit nor taxable profit or loss; and
- (b)
- in respect of taxable temporary differences associated with investments in subsidiaries, where the timing of the reversal of the temporary differences can be controlled and it is probable that the temporary differences will not reverse in the foreseeable future.
Deferred tax assets are recognized for all deductible temporary differences, carry forward of unused tax credits and unused tax losses, to the extent that it is probable that taxable profit will be available against which the deductible temporary differences, and the carry forward of unused tax credits and unused tax losses, can be utilized, except:
- (a)
- where the deferred tax asset relating to the deductible temporary difference arises from the initial recognition of an asset or liability in a transaction that is not a business combination and, at the time of the transaction, affects neither the accounting profit nor taxable profit or loss; and
- (b)
- in respect of deductible temporary differences associated with investments in subsidiaries, deferred tax assets are recognized only to the extent that it is probable that the temporary differences will reverse in the foreseeable future and taxable profit will be available against which the temporary differences can be utilized.
The carrying amount of deferred tax assets is reviewed at each reporting date and reduced to the extent that it is no longer probable that sufficient taxable profit will be available to allow all or part of the deferred tax asset to be utilized. Unrecognized deferred tax assets are reassessed at each reporting date and are recognized to the extent that it has become probable that future taxable profit will allow the deferred tax asset to be recovered.
Deferred tax assets and liabilities are measured at the tax rates that are expected to apply in the year when the asset is realized or the liability is settled, based on tax rates (and tax laws) that have been enacted or substantively enacted at the reporting date. Deferred tax items are recognized in correlation to the underlying transaction either in other comprehensive income or directly in equity. Deferred tax assets and deferred tax liabilities are offset, if a legally
63
Table of Contents
enforceable right exists, to set off current tax assets against current income tax liabilities and the deferred taxes related to the same taxable entity and the same taxation authority.
Impairment of goodwill and trademarks
Impairment exists when the carrying value of an asset or cash-generating unit exceeds its recoverable amount, which is the higher of its fair value less costs to sell and its value in use. The fair value in use calculation is based on a discounted cash flow model. The cash flows are derived from the budget for the next five years and do not include restructuring activities that we are not yet committed to or significant future investments that will enhance the performance of the cash-generating unit being tested. The recoverable amount is most sensitive to the discount rate used for the discounted cash flow model as well as the expected future cash inflows and the growth rate used for extrapolation purposes.
Internal control over financial reporting
In connection with the preparation and audit of our consolidated financial statements for the year ended December 31, 2010 included in this prospectus, we and our independent registered public accounting firm identified one significant deficiency in our internal control over financial reporting as of December 31, 2010. As defined in the U.S. Public Company Accounting Oversight Board Standard AU325, a "significant deficiency" is a deficiency, or a combination of deficiencies, in internal control over financial reporting that is less severe than a material weakness, yet important enough to merit attention by those responsible for oversight of our financial reporting.
Our significant deficiency is related to our accounting method for equity awards. On October 1, 2009, we issued 51,482 incentive units to ten executives under our 2009 Incentive Unit Plan. The 51,482 incentive units had a grant date fair value of approximately US$890,000, which we intended to recognize as compensation expense over the vesting period of four years. In October 2010, certain incentive units were cancelled and certain units were settled for cash of US$256,000. We recorded the cash payment of US$256,000 as share-based compensation expense at the settlement date. However, IFRS 2, Share-based Payments, requires that any unrecognized grant date fair value be recorded as compensation expense at the settlement date. Accordingly, we recorded additional compensation expense of US$634,000 for the year ended December 31, 2010.
We and our independent registered public accounting firm believe the improper accounting for these settled incentive units indicates that a significant deficiency existed with respect to the operating effectiveness of the controls associated with our accounting for equity awards. We have taken measures to remediate this deficiency, including improving our communications with our registered public accounting firm to ensure the consistency of our interpretations of the guidelines regarding complicated accounting transactions and related training of our accounting personnel regarding the rules for accounting for equity awards. We did not incur material costs in connection with remediating the deficiency. We also believe this was an unusual event that we do not expect to recur in the future.
In connection with the preparation and audit of our consolidated financial statements for the year ended December 31, 2011 included in this prospectus, we and our independent registered
64
Table of Contents
public accounting firm did not identify any material weakness or significant deficiency in our internal control over financial reporting as of December 31, 2011.
Results of operations
The following table sets forth a summary of our consolidated results of operations for the years indicated. This information should be read together with our consolidated financial statements and related notes included elsewhere in this prospectus. Our historical results presented below are not necessarily indicative of the results for any future periods.
| | | | | | | | | | | | | | | | | | | |
| | |
| | Year ended December 31, | |
|---|
| | 2009 | | 2010 | | 2011 | |
|---|
(Amounts in thousands
of US$, except for percentages)
| | Amount
| | % of
Revenues
| | Amount
| | % of
Revenues
| | Amount
| | % of
Revenues
| |
|---|
| | |
Revenues | | | 51,087 | | | 100.0 % | | | 72,559 | | | 100.0 % | | | 106,655 | | | 100 % | |
Cost of sales | | | (29,132 | ) | | (57.0) | | | (41,150 | ) | | (56.7) | | | (60,543 | ) | | (56.8) | |
| | | | |
Gross profit | | | 21,955 | | | 43.0 % | | | 31,409 | | | 43.3 % | | | 46,112 | | | 43.2 % | |
Selling and distribution costs | | | (4,851 | ) | | (9.5) | | | (6,734 | ) | | (9.3) | | | (7,750 | ) | | (7.3) | |
Administrative expenses | | | (14,204 | ) | | (27.8) | | | (19,866 | ) | | (27.4) | | | (22,543 | ) | | (21.1) | |
| | | | |
Operating profit | | | 2,900 | | | 5.7 % | | | 4,809 | | | 6.6 % | | | 15,819 | | | 14.8 % | |
Finance income | | | 69 | | | 0.1 | | | * | | | 0.0 | | | 87 | | | — | |
Other non-operating income | | | 445 | | | 0.9 | | | 24 | | | 0.0 | | | — | | | — | |
Finance costs | | | (2,588 | ) | | (5.0) | | | (6,311 | ) | | (8.7) | | | (62 | ) | | — | |
Equity in earnings (losses) of joint venture | | | — | | | — | | | — | | | — | | | (1,037 | ) | | (1.0) | |
Other non-operating expenses | | | — | | | — | | | (41 | ) | | 0.0 | | | — | | | — | |
| | | | |
Profit (loss) before tax | | | 826 | | | 1.7 % | | | (1,519 | ) | | (2.1)% | | | 14,807 | | | 13.8 % | |
Income tax | | | (897 | ) | | (1.8) | | | (1,853 | ) | | (2.5) | | | (6,472 | ) | | (6.0)% | |
| | | | |
Net profit (loss) | | | (71 | ) | | (0.1)% | | | (3,372 | ) | | (4.6)% | | | 8,335 | | | 7.8 % | |
| | |
* — Less than 0.1
Year ended December 31, 2011 compared to year ended December 31, 2010
Revenues
Our revenues increased by 47.0%, or US$34.1 million, to US$106.7 million in the year ended December 31, 2011 from US$72.6 million in the year ended December 31, 2010. This increase was primarily due to an increase in revenues from all of our three service lines, attributable primarily to increasing market demand for our services from both new and existing clients, as well as our enhanced business development efforts to capitalize on this demand. To meet the increased demand for our services, the average number of our project personnel increased from 202 in 2010 to 288 in 2011, and our average realized billing rate for our project personnel increased from US$162 per hour in 2010 to US$164 per hour in 2011. Our total hours charged to our clients increased by 42.8%, from 333,224 hours in 2010 to 475,807 hours in 2011. The number of our client accounts generating aggregate revenues of over US$500,000 increased from 39 in 2010 to 50 in 2011. The average revenues from our client accounts with
65
Table of Contents
aggregate revenues of over US$500,000 increased from US$1.4 million in 2010 to US$1.7 million in 2011.
Our revenues derived from subcontractors increased by 72.6%, or US$8.0 million, to US$19.0 million in the year ended December 31, 2011 from US$11.0 million in the year ended December 31, 2010, primarily as a result of our increased use of subcontractors, which was driven by the need to meet client demand that exceeded the capacity of our own project personnel. The use of subcontractors provides us with flexibility in scaling our business operations to meet the demands of particular projects without incurring the fixed costs associated with the addition of permanent project personnel. See "—Key Components of Results of Operations—Cost of sales."
Cost of sales
Our cost of sales increased by 47.1%, or US$19.4 million, to US$60.5 million in the year ended December 31, 2011 from US$41.1 million in the year ended December 31, 2010. The increase in our cost of sales was consistent with the continued expansion of our business. This increase was primarily due to (i) our increased use of subcontractors, resulting in a 74.7% increase in our subcontractor costs from the year ended December 31, 2010 to the year ended December 31, 2011, which was driven by the need to meet client demand that exceeded the capacity of our own project personnel; and (ii) the increase in the average number of project personnel from 202 in the year ended December 31, 2010 to 288 in the year ended December 31, 2011.
Gross profit
Our gross profit increased by 46.8%, or US$14.7 million, to US$46.1 million in the year ended December 31, 2011 from US$31.4 million in the year ended December 31, 2010. The increase in our gross profit was primarily due to the increase in our overall revenues driven by the strong demand for our services. Our gross margin decreased slightly to 43.2% in the year ended December 31, 2011 from 43.3% in the year ended December 31, 2010. The decrease in our gross margin was primarily attributable to the 74.7% increase in our subcontractor costs from 2010 to 2011 as a result of the increased use of subcontractors to meet the higher level of client demand.
Selling and distribution costs
Our selling and distribution costs increased by 15.1%, or US$1.0 million, to US$7.7 million in the year ended December 31, 2011 from US$6.7 million in the year ended December 31, 2010. This increase was primarily due to an increase in the average number of our client partners from 15 in 2010 to 17 in 2011 and the increase in commission-related incentive payments made to our selling and distribution personnel, which was partially offset by the decrease in the overall average number of our selling and distribution personnel from 44 in 2010 to 39 in 2011.
Administrative expenses
Our administrative expenses increased by 13.5%, or US$2.7 million, to US$22.5 million in the year ended December 31, 2011 from US$19.8 million in the year ended December 31, 2010. This increase was primarily due to (i) a 56.6% increase in our professional services fees in 2011 in preparation for this offering; (ii) a 33.1% increase in lease and other related expenses as a
66
Table of Contents
result of our office expansion; and (iii) a 11.6% increase in other administrative expenses, including depreciation costs.
Operating profit
As a result of the foregoing, our operating profit increased by 229.0%, or US$11.0 million, to US$15.8 million in the year ended December 31, 2011 from US$4.8 million in the year ended December 31, 2010.
Finance income and costs
Our net finance income was US$25,711 in the year ended December 31, 2011, while our net finance costs were US$6.3 million in the year ended December 31, 2010. The interest expenses on the convertible bonds issued by GlobalGrowth and loss (gain) on valuation of the convertible bonds derivative component did not recur after the end of 2010. In 2011, we recorded finance income of US$86,878 which primarily included interest income on loans receivable from officers. Such loans to our officers were repaid in October 2011. See "Related party transactions—Loans to certain senior management of Acquity Group LLC." In 2011, we recorded finance costs of US$61,167, which were mainly accrued interest expense in connection with a potential tax liability.
Equity in losses of joint venture
In the year ended December 31, 2011, we had equity in losses of joint venture of US$1.0 million, including US$0.8 million in connection with our joint venture relating to k121.com, which was established in May 2011, and US$0.2 million in connection with our joint venture with Li Ning, which was established in July 2011. We did not record such equity in losses of joint venture in the year ended December 31, 2010, as the joint ventures had not been established at that time.
Income tax
Our income tax increased by 249.3%, or US$4.6 million, to US$6.5 million in the year ended December 31, 2011, from US$1.9 million in the year ended December 31, 2010. The increase in our tax expenses was primarily due to the fact that we recorded pre-tax income in 2011, as compared to a pre-tax loss in 2010. Our effective tax rate was negative in 2010, resulting primarily from a pre-tax loss for the year and withholding taxes. Our effective tax rate was 43.7% in 2011, resulting primarily from pre-tax income and withholding taxes.
Profit (loss)
As a result of the foregoing, our profit in the year ended December 31, 2011 was US$8.3 million, while we incurred a loss of US$3.4 million in the year ended December 31, 2010. Our adjusted EBITDA increased from US$10.6 million in 2010 to US$20.0 million in 2011. See "Selected Consolidated Financial and Operating Data—Adjusted EBITDA".
Year ended December 31, 2010 compared to year ended December 31, 2009
Revenues
Our revenues increased by 42.0%, or US$21.5 million, to US$72.6 million in the year ended December 31, 2010 from US$51.1 million in the year ended December 31, 2009. This increase was primarily due to an increase in revenues from our three service lines and was primarily
67
Table of Contents
attributable to increasing market demand for our services driven by increased Internet usage and the economic recovery from the global financial crisis, as well as our enhanced sales efforts to capitalize on this demand. To meet the increased demand for our services, the average number of our project personnel increased from 164 in 2009 to 202 in 2010, and our average realized billing rate for our project personnel increased from US$157 per hour to US$162 per hour. Our total hours charged to our clients increased by 46.9% from 226,836 hours in 2009 to 333,224 hours in 2010. The number of our client accounts generating aggregate annual revenues of over US$500,000 increased from 33 in 2009 to 39 in 2010. The average revenue from our client accounts with aggregate annual revenues of over US$500,000 increased from US$1.0 million in 2009 to US$1.4 million in 2010.
Our revenues derived from subcontractors increased by 168.8%, or US$6.9 million, to US$11.0 million in the year ended December 31, 2010 from US$4.1 million in the year ended December 31, 2009, primarily as a result of our increased use of subcontractors, which was driven by the need to meet client demand that exceeded the capacity of our own project personnel.
Cost of sales
Our cost of sales increased by 41.6%, or US$12.1 million, to US$41.2 million in the year ended December 31, 2010 from US$29.1 million in the year ended December 31, 2009. The increase in our cost of sales was in line with the increase in our revenues during the same period and consistent with the continued expansion of our business. This increase was primarily due to (i) the increase in the number of project personnel from 164 in 2009 to 202 in 2010; (ii) starting in the first quarter of 2010, the return to prior or higher salary levels for our project personnel who had previously agreed to an up to 10% temporary salary reduction starting in the second quarter of 2009; and (iii) our increased use of subcontractors reflecting a 122.5% increase in our subcontractor costs from 2009 to 2010, which was driven by the need to meet client demand that exceeded the capacity of our own project personnel.
Gross profit
Our gross profit increased by 42.7%, or US$9.4 million, to US$31.4 million in the year ended December 31, 2010 from US$22.0 million in the year ended December 31, 2009. Our gross margin increased to 43.3% in 2010 from 43.0% in 2009. The increases in gross profit and gross margin were primarily attributable to an increase in our project personnel utilization rate from 73.4% in 2009 to 79.6% in 2010, which was partially offset by (i) our increased use of subcontractors to meet client demand and (ii) the return in 2010 to prior or higher salary levels for our project personnel whose salaries were reduced by up to 10% in 2009.
Selling and distribution costs
Our selling and distribution costs increased by 36.7%, or US$1.8 million, to US$6.7 million in the year ended December 31, 2010 from US$4.9 million in the year ended December 31, 2009. This increase was primarily due to (i) an increase in compensation costs in connection with the expansion of our sales and distribution team, with the average number of sales and distribution personnel increasing from 40 in 2009 to 44 in 2010; (ii) the return in 2010 to prior salary levels for those sales and distribution personnel whose salaries were reduced by up to 10% in 2009; and (iii) the return in 2010 of sales commissions for our business development personnel to prior levels, as such sales commissions were temporarily reduced in 2009.
68
Table of Contents
Administrative expenses
Our administrative expenses increased by 40.1%, or US$5.7 million, to US$19.9 million in the year ended December 31, 2010 from US$14.2 million in the year ended December 31, 2009. This increase was primarily due to (i) a 57.8% increase in our salary expenses due to an increase in our average number of management, accounting and administrative personnel from 43 in 2009 to 48 in 2010; (ii) the return in 2010 to prior or higher salary levels for our management, accounting and administrative personnel whose salaries were reduced in 2009 by up to 50% for executives and senior management members and by up to 10% for other personnel; and (iii) an increase in our professional services fees in preparation for this offering.
Operating profit
As a result of the foregoing, our operating profit increased by 65.5%, or US$1.9 million, to US$4.8 million in the year ended December 31, 2010 from US$2.9 million in the year ended December 31, 2009.
Finance income and costs
Our finance income, which represents interest income on our bank balances relating to the escrow account for the earn-out payments under the Unit Purchase and Redemption Agreement with Acquity Group LLC, decreased to US$90 in the year ended December 31, 2010 from US$0.1 million in the year ended December 31, 2009, as we made the final earn-out payments for 2009 in 2010. See "—Key components of results of operations—Finance income and costs".
Our finance costs increased by 142.3%, or US$3.7 million, to US$6.3 million in the year ended December 31, 2010 from US$2.6 million in the year ended December 31, 2009. The increase in finance costs was primarily due to a loss on valuation of convertible bonds derivative component of US$3.2 million that we incurred in 2010. See "—Key components of results of operations—Finance income and costs".
Other non-operating income and expenses
Our other non-operating income decreased to US$0.02 million in the year ended December 31, 2010 from US$0.4 million in the year ended December 31, 2009, as we made the final earn-out payments under the Unit Purchase and Redemption Agreement with Acquity Group LLC and as a result did not incur any gain on change in fair value of contingent consideration in 2010. See "—Key components of results of operations—Other non-operating income and expenses".
We incurred other non-operating expenses of US$0.04 million in the year ended December 31, 2010 as a result of a loss on change in fair value of contingent consideration in association with the earn-out payments under the Unit Purchase and Redemption Agreement. We did not incur non-operating expenses in the year ended December 31, 2009. See "—Key components of results of operations—Other non-operating income and expenses".
Income tax
Our income tax increased by 111.1%, or US$1.0 million, to US$1.9 million in the year ended December 31, 2010 from US$0.9 million in the year ended December 31, 2009. This increase was primarily related to the increase in the amount of the taxable income of our U.S. subsidiaries, for which certain finance costs and non-operating expenses incurred by us
69
Table of Contents
were not deductible. The increase was partially offset by the effect of foreign tax differences. Our effective tax rate was 108.5% in 2009 and negative 121.9% in 2010, due to a pre-tax loss in 2010. See "Taxation—United States".
Net loss
As a result of the foregoing, our loss for the year increased by US$3.3 million, to US$3.4 million in the year ended December 31, 2010 from US$0.1 million in the year ended December 31, 2009. Our adjusted EBITDA increased to US$10.6 million in the year ended December 31, 2010 from US$8.0 million in the year ended December 31, 2009. See "Selected consolidated financial and operating data—Adjusted EBITDA".
Selected Quarterly Results of Operations
The following table sets forth our unaudited consolidated quarterly results of operations for each of the eight quarters in the period from January 1, 2010 to December 31, 2011. You should read the following table in conjunction with our consolidated financial statements and the related notes included elsewhere in this prospectus. We have prepared this unaudited consolidated quarterly financial data on the same basis as we have prepared our audited consolidated financial statements. The unaudited consolidated financial data includes all adjustments that we consider necessary for a fair statement of our financial position and operating results for the quarters presented.
| | | | | | | | | | | | | | | | | | | | | | | | | |
| | |
| | Three months ended | |
|---|
(Amounts in thousands of US$)
| | March 31,
2010
| | June 30,
2010
| | September 30,
2010
| | December 31,
2010
| | March 31,
2011
| | June 30,
2011
| | September 30,
2011
| | December 31
2011
| |
|---|
| | |
Revenues | | | 15,346 | | | 17,435 | | | 19,281 | | | 20,497 | | | 21,726 | | | 24,719 | | | 29,570 | | | 30,640 | |
Cost of sales | | | (8,442 | ) | | (9,824 | ) | | (10,877 | ) | | (12,007 | ) | | (12,640 | ) | | (14,445 | ) | | (15,728 | ) | | (17,730 | ) |
| | | | |
Gross profit | | | 6,904 | | | 7,611 | | | 8,404 | | | 8,490 | | | 9,086 | | | 10,274 | | | 13,842 | | | 12,910 | |
Selling and distribution costs | | | (1,448 | ) | | (1,604 | ) | | (1,964 | ) | | (1,718 | ) | | (1,840 | ) | | (1,678 | ) | | (2,107 | ) | | (2,125 | ) |
Administrative expenses | | | (3,843 | ) | | (4,689 | ) | | (4,496 | ) | | (6,838 | ) | | (4,911 | ) | | (4,811 | ) | | (6,176 | ) | | (6,645 | ) |
| | | | |
Operating (loss) profit | | | 1,613 | | | 1,318 | | | 1,944 | | | (66 | ) | | 2,335 | | | 3,785 | | | 5,559 | | | 4,140 | |
Finance costs, net | | | (10,359 | ) | | (125 | ) | | 28 | | | 4,145 | | | (17 | ) | | (14 | ) | | 64 | | | (8 | ) |
Equity in earnings (losses) of joint venture | | | — | | | — | | | — | | | — | | | — | | | (89 | ) | | (441 | ) | | (507 | ) |
Other non-operating (expenses) income | | | — | | | — | | | 24 | | | (41 | ) | | — | | | — | | | — | | | — | |
| | | | |
Profit (loss) before tax | | | (8,746 | ) | | 1,193 | | | 1,996 | | | 4,038 | | | 2,318 | | | 3,682 | | | 5,182 | | | 3,625 | |
Income tax expense | | | (411 | ) | | (409 | ) | | (590 | ) | | (443 | ) | | (900 | ) | | (1,474 | ) | | (2,167 | ) | | (1,931 | ) |
| | | | |
Net profit (loss) | | | (9,157 | ) | | 784 | | | 1,406 | | | 3,595 | | | 1,418 | | | 2,208 | | | 3,015 | | | 1,694 | |
Attributable to: | | | | | | | | | | | | | | | | | | | | | | | | | |
Equity holders of the company | | | (9,771 | ) | | 226 | | | 682 | | | 3,330 | | | 1,420 | | | 2,238 | | | 3,144 | | | 1,805 | |
Non-controlling interests(1) | | | 614 | | | 558 | | | 724 | | | 265 | | | (2 | ) | | (30 | ) | | (129 | ) | | (111 | ) |
Other comprehensive income | | | — | | | — | | | — | | | — | | | 7 | | | 31 | | | 35 | | | 29 | |
| | | | |
Total comprehensive income (loss) for the period, net of tax | | | (9,157 | ) | | 784 | | | 1,406 | | | 3,595 | | | 1,425 | | | 2,239 | | | 3,050 | | | 1,723 | |
Adjusted EBITDA | | | 2,747 | | | 2,557 | | | 3,433 | | | 1,903 | | | 3,296 | | | 4,704 | | | 6,896 | | | 5,063 | |
| | |
(1) Non-controlling interest in 2010 refers to the 30.36% in Acquity Group LLC that was not controlled by us. Non-controlling interest from March 31, 2011 relates to the non-controlling interest of 33.06% in Cool Sports (BVI) Limited.
Because the use of adjusted EBITDA has limitations, you should consider adjusted EBITDA alongside other financial performance measures, including various cash flow metrics, net
70
Table of Contents
income (loss) and our other IFRS results. The following table presents a reconciliation of adjusted EBITDA for each of the periods indicated:
| | | | | | | | | | | | | | | | | | | | | | | | | | |
| | |
| | Three months ended | |
|---|
(Amounts in thousands of US$)
| | March 31,
2010
| | June 30,
2010
| | September 30,
2010
| | December 31,
2010
| | March 31,
2011
| | June 30,
2011
| | September 30,
2011
| | December 31,
2011
| |
|---|
| | |
Net profit (loss) | | | (9,157 | ) | | 784 | | | 1,406 | | | 3,595 | | | 1,418 | | | 2,208 | | | 3,015 | | | 1,694 | |
Interest expense, net of Interest Income | | | | | | | | | | | | | | | | | | | | | | | | | |
| | Relating to business operations at Acquity Group LLC | | | 15 | | | 5 | | | 1 | | | (7 | ) | | — | | | — | | | (79 | ) | | (8 | ) |
| | Relating to acquisition of Acquity Group LLC by Acquity Group Limited | | | 10,345 | | | 120 | | | (29 | ) | | (4,138 | ) | | 16 | | | 13 | | | 15 | | | 18 | |
Income tax expense (benefit) | | | 411 | | | 409 | | | 590 | | | 443 | | | 900 | | | 1,474 | | | 2,167 | | | 1,931 | |
Depreciation and amortization | | | | | | | | | | | | | | | | | | | | | | | | | |
| | Relating to business operations at Acquity Group LLC | | | 179 | | | 201 | | | 283 | | | 278 | | | 313 | | | 320 | | | 387 | | | 449 | |
| | Intangible assets affecting administrative expense relating to the Acquisition | | | 680 | | | 625 | | | 625 | | | 625 | | | 625 | | | 625 | | | 625 | | | 625 | |
Impairment loss | | | — | | | — | | | — | | | — | | | | | | | | | | | | | |
Other expenses and costs(1) | | | 274 | | | 413 | | | 557 | | | 1,107 | | | 24 | | | 64 | | | 766 | | | 354 | |
| | | | |
Adjusted EBITDA | | | 2,747 | | | 2,557 | | | 3,433 | | | 1,903 | | | 3,296 | | | 4,704 | | | 6,896 | | | 5,063 | |
| | |
(1) Includes advisory fees paid in connection with the issuance of the convertible bonds and acquisition of Acquity Group LLC, non-cash expenses in connection with the cancellation of incentive units in preparation for this offering, management fees paid to Equity Partners, professional fees related to an aborted financing transaction and the initial public offering related fees.
Liquidity and capital resources
The following table sets forth a summary of our cash flows for the periods indicated:
| | | | | | | | | | |
| | |
| | Year ended December 31, | |
|---|
(Amounts in thousands of US$)
| | 2009
| | 2010
| | 2011
| |
|---|
| | |
Net cash provided by operating activities | | | 7,317 | | | 5,063 | | | 4,661 | |
Net cash provided by (used in) investing activities | | | 2,052 | | | 2,271 | | | (10,214 | ) |
Net cash provided by (used in) financing activities | | | (4,885 | ) | | (6,109 | ) | | — | |
Net (decrease) increase in cash and cash equivalents | | | 4,484 | | | 1,225 | | | (5,553 | ) |
Cash and cash equivalents, beginning of period | | | 6,719 | | | 11,203 | | | 12,428 | |
Cash and cash equivalents, end of period | | | 11,203 | | | 12,428 | | | 6,875 | |
| | |
To date, we have financed our operations primarily through cash flows from operations, short-term bank borrowings, and the sale of convertible bonds in private placements. We may explore other ways to finance our operations in the future, including long-term credit facilities and offerings of debt or equity securities.
We believe that our current cash and cash equivalents, anticipated cash flow from operations and the proceeds from this offering will be sufficient to meet our expected cash requirements, including for working capital and capital expenditure purposes, for at least 12 months following this offering. We may, however, require additional cash due to changing business conditions or other future developments, including any investments or acquisitions we may decide to pursue.
We currently have a line of credit in the amount of US$10.0 million secured by our accounts receivables. This line of credit has not yet been used.
Operating activities
Net cash provided by operating activities primarily consists of changes in operating assets and liabilities such as trade receivables, prepayments and other receivables, trade payables, other
71
Table of Contents
payables and accruals, settlement of share-based payment, amount due to customers under fixed-price contracts, other non-current assets and non-current liabilities.
Net cash provided by operating activities was US$4.7 million in 2011. This was primarily due to (i) profit before tax of US$14.8 million, (ii) non-cash adjustments of US$5.0 million, including primarily amortization of intangible assets of US$2.5 million, depreciation of property and equipment of US$1.4 million, and equity in losses of joint ventures of US$1.0 million, and (iii) an increase in other payables and accruals of US$2.7 million as a result of an increase in the overall use of subcontractors; partially offset by (a) an increase in trade receivables of US$10.5 million as a result of our sales growth, and (b) payment of income tax of US$7.8 million.
Net cash provided by operating activities was US$5.1 million in 2010. This was primarily due to (i) loss before tax of US$1.5 million, (ii) non-cash adjustments of US$10.7 million, including primarily interest expenses of US$6.3 million and amortization of intangible assets of US$2.6 million, and (iii) an increase in other payables and accruals of US$2.7 million as a result of an increase in the overall use of subcontractors; partially offset by an increase in trade receivables of US$5.0 million as a result of our sales growth, despite a decrease in trade receivables turnover days driven by our stricter enforcement of our collection policy.
Net cash provided by operating activities was US$7.3 million in 2009. This was primarily due to (i) profit before tax of US$0.8 million, (ii) non-cash adjustments of US$5.0 million, including primarily amortization of intangible assets of US$2.8 million and interest expenses of US$2.6 million, and (iii) a decrease in trade receivables of US$2.2 million as a result of a slowdown in our sales due to the global financial crisis; offset by a decrease in trade payables of US$0.4 million as a result of a decrease in the use of subcontractors and the lack of client prepayments for services.
Investing activities
Net cash used in investing activities was US$10.2 million in 2011, primarily consisting of (i) the purchase of property and equipment of US$2.4 million, including computer and office equipment, software, furniture and fixture purchases and leasehold improvements; (ii) an investment in joint venture of US$4.8 million in connection with the formation of the joint venture relating to K121.com and the joint venture with Li Ning, Digital Li-Ning Company Limited; and (iii) an increase in restricted cash of US$2.6 million in connection with a loan guarantee we provided to Shanghai Pudong Development bank for the bank borrowing of Huaren Kudong Commercial Trading Co. Ltd.
Net cash provided by investing activities was US$2.3 million in 2010, primarily consisting of a decrease in restricted cash of US$8.6 million in connection with the earn-out payments under the Unit Purchase and Redemption Agreement entered into with Acquity Group LLC; offset by (i) the payment of contingent consideration of US$4.5 million in connection with the final earn-out payments under the Unit Purchase and Redemption Agreement and (ii) the purchase of computer equipment and software in the amount of US$1.8 million.
Net cash provided by investing activities was US$2.1 million in 2009, primarily consisting of a decrease in restricted cash of US$12.7 million in connection with the earn-out payments under the Unit Purchase and Redemption Agreement; offset by (i) the payment of contingent consideration of US$10.0 million in connection with the earn-out payments under the Unit
72
Table of Contents
Purchase and Redemption Agreement, and (ii) the purchase of computer equipment and software in the amount of US$0.7 million.
Financing activities
We did not have any cash flow generated from or used in financing activities in 2011.
Net cash used in financing activities was US$6.1 million in 2010, primarily resulting from (i) consideration paid for the convertible bonds transfer from GlobalGrowth to 2020 CH of US$3.9 million, (ii) a distribution to non-controlling interest of US$2.0 million and (iii) repayment of borrowings of US$1.4 million, offset by an issuance of new shares of US$1.2 million.
Net cash used in financing activities was US$4.9 million in 2009, primarily resulting from (i) a distribution to non-controlling interest of US$2.6 million and (ii) repayment of borrowings of US$2.9 million, offset by an issuance of convertible bonds of US$1.1 million.
Capital expenditures
Our capital expenditures were approximately US$0.7 million, US$1.8 million and US$2.4 million for the years ended December 31, 2009, 2010 and 2011, respectively. Our capital expenditures were primarily used for computer equipment and software purchases, furniture and fixture purchases and leasehold improvements.
Contractual obligations and commercial commitments
The following table sets forth our contractual obligations and commercial commitments as of December 31, 2011:
| | | | | | | | | | | | | | | | |
| | |
| | Payment Due by Period | |
|---|
(Amounts in thousands of US$)
| | Total
| | Less than 1 year
| | 1-3 years
| | 3-5 years
| | More than 5 years
| |
|---|
| | |
Operating lease commitments | | | 10,611 | | | 2,476 | | | 4,638 | | | 3,022 | | | 475 | |
| | |
Off-balance sheet commitments and arrangements
Pursuant to a loan guarantee agreement dated December 2011, we provided a loan guarantee to Shanghai Pudong Development Bank for the bank borrowing of our indirect subsidiary, Huaren Kudong Commercial Trading Co., Ltd., with a maximum borrowing amount of RMB14.0 million.
Other than the loan guarantee arrangement, we did not have any other off-balance sheet commitments or arrangements as of December 31, 2011. We do not anticipate entering into any other such commitments or arrangements in the foreseeable future.
Quantitative and qualitative disclosures about market risk
Interest rate risk
We were subject to market risks due to fluctuations in interest rates in association with our short-term bank borrowings and convertible bonds. We do not use any derivative instruments to manage our interest rate risk exposure. We have not been subject to nor do we anticipate being exposed to material risks due to changes in interest rates.
73
Table of Contents
Foreign currency risk
Growth in our international operations, such as in China, will incrementally increase our exposure to foreign currency fluctuations as well as other risks typical of international operations, including, but not limited to, differing economic conditions, changes in political climate, differing tax structures and other regulations and restrictions. However, as of December 31, 2011 we had no significant exposure to foreign currency exchange fluctuations.
In the future, foreign exchange rate fluctuations may adversely impact our consolidated results of operations as exchange rate fluctuations on transactions denominated in currencies other than our functional currency result in gains and losses that are reflected in our consolidated statement of operations. If we engage in a substantial number of foreign currency-denominated transactions, to the extent the U.S. dollar weakens against foreign currencies, the translation of these transactions will result in increased revenues and operating expenses. Conversely, if we engage in a substantial number of such transactions, our revenues and operating expenses will decrease when the U.S. dollar strengthens against foreign currencies.
Recent accounting pronouncements
Impact of issued but not yet effective standards
Standards issued but not yet effective up to the date of issuance of our consolidated financial statements are set forth below. This list is of standards and interpretations issued, which we reasonably expect to be applicable at a future date. We intend to adopt those standards when they become effective.
- •
- IAS1 Financial Statement Presentation—Presentation of Items of Other Comprehensive Income: Effective for annual periods beginning on or after July 1, 2012.
- •
- IAS 12 Income Taxes—Recovery of Underlying Assets: Effective for annual periods beginning on or after January 1, 2012.
- •
- IAS 19 Employee Benefits (Amendment): Effective for annual periods beginning on or after January 1, 2013.
- •
- IAS 27 Separate Financial Statements (as revised in 2011): Effective for annual periods beginning on or after January 1, 2013.
- •
- IAS 28 Investments in Associates and Joint Ventures (as revised in 2011): Effective for annual periods beginning on or after January 1, 2013.
- •
- IFRS 9 Financial Instruments: Classification and Measurement: Effective for annual periods beginning on or after January 1, 2013.
- •
- IFRS 10 Consolidated Financial Statements: Effective for annual periods beginning on or after January 1, 2013.
- •
- IFRS 11 Joint Arrangements: Effective for annual periods beginning on or after January 1, 2013.
- •
- IFRS 12 Disclosure of Involvement with Other Entities: Effective for annual periods beginning on or after January 1, 2013.
- •
- IFRS 13 Fair Value Measurement: Effective for annual periods beginning on or after January 1, 2013.
We are currently assessing the impact, if any, from the adoption of the above standards or amendments on our financial position or performance.
74
Table of Contents
Industry overview
We believe the pervasive influence of the internet and other digital media in today's society presents numerous opportunities and challenges for companies seeking to build their brands and sell their products and services. The internet has not only become a channel for e-commerce but also a fundamental communication channel that influences a brand's overall perception, positioning and performance. We believe the rise of social media and mobile internet devices has accelerated these trends.
We believe these trends have created a market for "brand e-commerce" in which one can create an effective and consistent end-to-end digital brand experience for consumers, transforming existing leading traditional brands into digital brands that generate consumer demand online capable of being monetized through e-commerce platforms.
Brand e-commerce helps brands develop a one-on-one digital relationship with their consumers, starting with an initial brand introduction online and potentially continuing to the completion of a transaction. Effective digital branding can drive e-commerce performance and enhance the performance of a brand's offline sales.
We believe the growth of brand e-commerce and the attractiveness of our business model is underpinned by the following industry factors:
- •
- deepening and broadening of the consumer digital experience;
- •
- transformation of digital strategies; and
- •
- global brands increasingly adopting a digital-driven strategy in emerging markets, such as China.
We believe the global growth of brand e-commerce and digital marketing provides significant opportunities to expand our U.S. and international presence. Although all of our clients have been based in the U.S., we have advised our clients on their digital presence in over 50 countries and in five languages. See "Business—Competitive strengths—Global brand e-commerce and digital marketing capabilities." We believe global growth in our industry will provide more opportunities from U.S. clients with international operations as well as potential clients based outside the U.S.
In addition, we believe that global growth in our industry directly impacts our U.S. operations, as brands with global expansion strategies require the brand e-commerce and digital marketing companies that service their U.S. operations to have the capability to execute their strategies internationally.
We believe that the Chinese market in particular has the potential to play a significant role in our operations. As part of our China strategy, we recently began focusing on building our presence and capabilities in the Chinese sportswear market through our joint venture relating to k121.com, a leading internet retailing website for sportswear products in China, which sells brands such as Nike, Adidas and Kappa, and we believe certain clients with whom we have significant engagements in the U.S. partnered with us because we are also able to support their growing operations in China.
75
Table of Contents
Deepening and broadening of the consumer digital experience
The number of consumers who use the internet, the variety of digital devices they use, the total time they spend on-line and their online transaction volumes have increased in recent years and are expected to continue to do so. In parallel with these trends, the integrated digital experience, and its increasingly social, local and mobile nature, has increasingly impacted overall brand perception and spending.
Consumers continue to migrate online, with the global internet population expected to grow from 2.0 billion in 2010 to 2.7 billion by 2015, according to an industry source. Emerging markets are expected to lead this growth and, by 2015, almost one-third of internet users are expected to come from BRIC nations (Brazil, Russia, India and China). The average time spent on the internet per user has also increased steadily.
This growth is spurred in part by the proliferation of a broader range of internet-connected devices. In addition to personal computers, devices such as smartphones, tablets, eReaders, connected home theater products, game consoles and wireless home appliances offer different ways for consumers to stay connected at all times and regardless of location. Furthermore, social networking sites, or SNS, have become hubs of internet activity, supporting the growth of internet usage and its influence on consumer behavior. Consumers are now using social media to discuss quality, price and customer service issues for the brands they consume, making social media a powerful platform that enables companies to target and respond to specific customer needs. According to comScore, the average daily visitor to "social media" websites, including blogs and social networking websites, at home in the United States increased from 50.5 million in January 2009 to 91.9 million in January 2012. comScore has also reported a simultaneous increase in the frequency of visits by each visitor and the time spent by them on such websites over the last three years. This growth has primarily been underpinned by the increasing popularity of leading SNSs such as Facebook and Twitter.
The following bar charts set forth the average visits per visitor per month and average minutes per visitor per month, respectively, from January 2009 to January 2012.
| | |
| Average visits per visitor per month | | Average minutes per visitor per month |
|
|
|
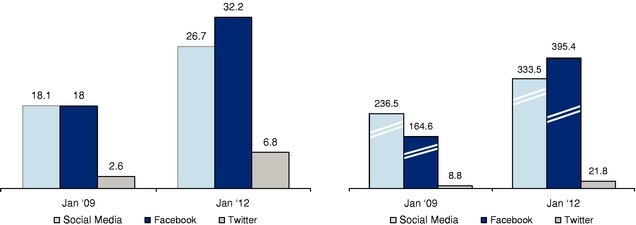 |
Source: Media Metrix (US, Home Locations), comScore, January 2012.
76
Table of Contents
We believe that increased consumer online presence and the deepening of online interaction will drive the continued growth of e-commerce. We believe other factors will drive the growth of this sector, such as:
- •
- increased acceptance of e-commerce as a convenient means to shop;
- •
- increasing confidence regarding the security and reliability of online payments;
- •
- the transition from physical to digital products in certain categories such as in media, books, music, games and video;
- •
- the recent acceleration in new business models in the social commerce space, which is becoming a new way for many consumers to shop and is converting a significant portion of local offline inventory into online; and
- •
- increased recognition and support of the internet by retailers and manufacturers as an important sales channel.
Mobile commerce, or m-commerce, has also shown a growing trend driven by increasing usage of mobile connected devices, and improved mobile applications and technology. M-commerce is especially prominent in Japan (accounting for almost 20% of all online sales, according to a 2011 report by Euromonitor International) and also gaining prominence in other markets such as Western Europe and North America. Successful m-commerce applications, like those of Amazon and eBay, experienced strong sales growth in 2010. One of the most recent growth drivers for m-commerce has been the increasing usage of tablet devices.
As tablet device ownership and usage grows, we expect that consumers will also adopt tablet commerce rapidly, as this simple and portable device both expands the opportunities that consumers have to shop and has the potential to make the experience of shopping more engaging. Furthermore, some retailers have begun to use tablets to supplement existing sales tools (e.g. kiosks, POS Devices and even sales associates) in stores.
The online migration of consumers is not restricted to developed markets. Many emerging economies, such as China, mirror this trend. According to a 2011 report by the China Internet Network Information Center, or CNNIC, China had 457 million internet users as of December 2010, representing growth of 19% over 2009 and a penetration level of 34.3% in 2010.
Transformation of digital strategies
From the corporate perspective, the internet initially served simply as an additional medium to apply brand advertising resources originally prepared for traditional media. We believe that, as a channel for sales, the internet received less attention because of the low starting base and the risk of alienating traditional sales channels. However, as the level of e-commerce as a proportion of total sales increased, we believe that companies found that the digital channel also increased the impact on offline sales, and began transforming their business strategies and moving away from a simple storefront platform-based e-commerce approach to providing a complete and rich digital brand experience to their consumers. We believe that many companies that own prominent brands are starting to view the digital channel as one of the most important channels for brand promotion as well as product distribution.
77
Table of Contents
We believe that this transition offers several advantages to companies. With features like product reviews and product customization, digital points of sale can provide a more complete shopping experience than traditional channel counterparts. In addition, companies are able to gain more information about their consumers' needs and requirements through digital media and can engage in targeted selling using relevant customer information, as well as personalization and segmentation techniques, to deliver stronger results.
We believe that the 2008 financial crisis provided a significant boost to e-commerce and has since started an accelerating trend towards online migration. On a global scale, the e-commerce market is expected to continue its rapid development over the next few years.
Owing to the growth of Internet usage and the increase in online social networking, among other factors, we believe that the more general category of web-influenced offline sales are even higher than B2C e-commerce spending.
E-commerce is also playing an increasingly important role in emerging markets, such as China, which is expected to be one of the fastest-growing internet retail markets in the world growing at a CAGR of 26.1% from 2012 to 2016 according to Euromonitor International estimates. China is also at the forefront globally in the development of pure e-commerce brands in areas such as apparel. Some branded vendors, such as "Tao brands" and Vancl, have created business models based on building a digital presence and channel without operating traditional storefronts. The following chart sets forth the CAGR of the ten fastest growing internet retail markets from 2010 to 2015, respectively.
Ten fastest growing internet retailing markets (2012 - 2016E CAGR)
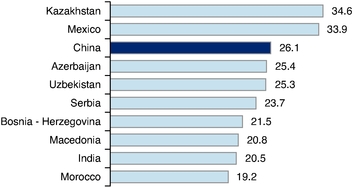
Source: © Euromonitor International 2012
The focus on digital media is further exemplified by growing expenditures on online advertising. Companies are shifting their advertising focus from traditional media including television, print media and radio to the internet. In a 2011 survey by the Society of Digital Agencies, the majority of respondents indicated spending 20% or more of their overall marketing budget on digital channels and over 70% of the brand marketers suggested that they were planning to shift budgets from traditional to digital media in 2011 as compared to 2010. The survey also suggested that digital investment plans are increasingly aimed at creating
78
Table of Contents
"experiences," with the top three investment areas being social networks, brand experiences and digital infrastructure. According to a 2011 report by ZenithOptimedia, global online advertising will approach US$113 billion and represent 21% of all advertisement spending. While traditional media is expected to grow at a CAGR of 2.7% from 2010 to 2014, online advertising is expected to grow at a CAGR of 15.4%. The following bar chart sets forth the share of advertising spending by medium from 2010 to 2014.
Global market share of different marketing media, 2010 to 2014E (in billions of US$)
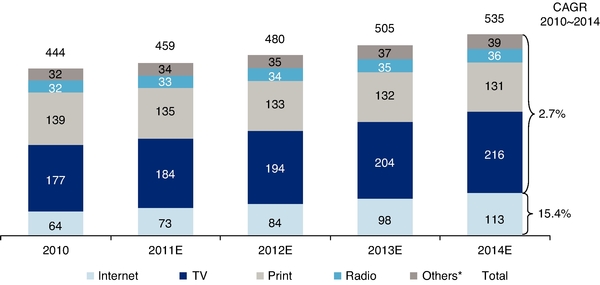
Source: ZenithOptimedia December 2011.
*: Others include outdoor and cinema advertising.
Development of e-commerce in emerging markets like China is also expected to result in significant spending on internet and digital marketing. The internet is expected to surpass print media as the second-largest advertising medium in China after television by 2011. According to ZenithOptimedia, it is estimated that internet advertising expenditures in China will reach approximately US$15.6 billion in 2014, representing a CAGR of 35.0% from 2010 to 2014. The following bar chart sets forth China's market share of different marketing media from 2010 to 2014.
79
Table of Contents
China's market share of different marketing media, 2010 to 2014E (in billions of US$)
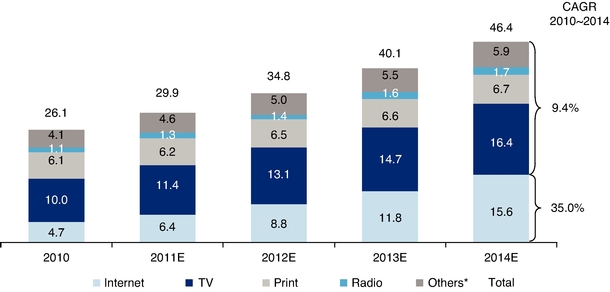
Source: ZenithOptimedia December 2011.
* Note: Others include outdoor and cinema advertising.
Global brands increasingly adopting a digital-driven strategy in emerging markets such as China
China has become one of the fastest growing economies in the world, with a large and growing middle class. Per capita consumer expenditures of urban households in China increased from RMB1,279 in 1990 to RMB12,265 in 2009, representing a CAGR of 12.6%, according to the National Bureau of Statistics of China. In addition, the number of households in China with annual disposable income of over US$10,000 (in nominal terms) is expected to more than double from 89.3 million in 2010 to 257.8 million by 2020, according to research by Euromonitor International in 2012.
This growth of wealth and increasing awareness of global brands in China provides a favorable environment for brands to cultivate a newly affluent market. Global brands can exploit this opportunity through brand e-commerce and digital marketing.
The advantages of a digital-driven entry strategy include:
- •
- Increased ability to precisely target a specific consumer base as well as track and monitor their buying preferences and behavior;
- •
- Lower capital expenditures by rolling out a limited number of "experience stores"; and
- •
- Usage of social media and "viral" online promotions to generate effective and measurable promotions.
As part of our China strategy, we recently began building a presence in the sportswear market through a joint venture relating to k121.com, a leading internet retailing website for
80
Table of Contents
sportswear products in China, which sells brands such as Nike, Adidas and Kappa. We believe that the apparel industry, particularly sportswear, in China provides an example of brands entering new markets through a digital strategy, because it caters to a demographic that is more digitally connected, interactive and influenced by brand image, and is dominated by established corporations who have historically allocated significant resources to brand-building and marketing exercises.
Sports brands fulfill consumers' desire for highly recognizable brands while serving their low-key wardrobe needs.
We believe sportswear occupies a different segment in China's fashion market compared with the fashion markets in other developed countries. Since the dress code in Chinese companies is generally less formal than that of Western companies, and sportswear is lightweight, comfortable, wear-resistant and fashionable, it is a prevalent choice for Chinese consumers as a substitute to traditional casual wear, even for work purposes.
The online approach in China provides sportswear companies with the opportunity to effectively transmit the brand culture and to precisely target China's large population without the capital and resources required for physical store deployment.
81
Table of Contents
Business
Overview
We are a leading brand e-commerce and digital marketing company that leverages the internet, mobile devices and social media to enhance our clients' brands and e-commerce performance. We are the digital agency of record for a number of well-known global brands in multiple industries, including Allstate Insurance Company, Discover Card's mobile-related business, Shimano, Tommy Bahama and W.W. Grainger Inc., which means we are the principal provider of the brand e-commerce and digital marketing services for these clients.
We deliver end-to-end solutions to address our clients' brand e-commerce and digital marketing needs. We offer three types of services: digital strategy, multi-channel digital marketing and brand e-commerce technology services.
- •
- Digital strategy: We provide our clients a broad array of digital strategy services aimed at enhancing the brand experience, increasing brand loyalty and monetizing their brands. We combine our business and technology expertise to analyze how products, brands and consumers interact and the role that current and emerging technologies play in this digital relationship. We assist clients to develop strategies to translate their brand identity to the digital channel, in order to enhance their brand e-commerce websites, integrate the customer's online brand experience with their offline brand experience and increase the conversion of site visits to sales. Our strategies are formulated to deliver quantifiable results for our clients. We also provide BTO services to help our clients assess and improve their business technology assets.
- •
- Multi-channel digital marketing: We assist our clients to create a seamless brand experience across internet, mobile devices and social media applications, allowing them to develop higher value and long-term customer relationships. We employ digital marketing techniques such as targeted online promotional activities, newsfeeds on social network websites, search engine optimization, mobile marketing and location-based services to engage customers with the brand. As a result, we help transform a client's digital brand into an engaging experience for its customers, investors, vendors and prospective employees. We also help our clients analyze and track the effectiveness of these multi-channel digital marketing efforts.
- •
- Brand e-commerce technology: We design and implement online stores and other points of sale for our clients that can supplement their physical store networks or serve as an effective alternative to expanding those networks. In some cases, we also operate websites on behalf of our clients. As a result, we manage or control the user experience of many multinational and multi-lingual digital corporate platforms. Our brand e-commerce technology services also help our clients to create a lasting brand impression with their customers and sell their products and services. In addition, our technology experts assist our clients to enhance the technical aspects of their platform, such as creating applications and employing software and architectural solutions to fit their specific needs. Our Commerce OnDemand™ solution facilitates quick integration and implementation of our clients' e-commerce sites.
Our experience and multinational capabilities have enabled us to serve more than 500 companies and their global brands, with many of whom we have had multi-year
82
Table of Contents
relationships of up to ten years. In 2011, we derived over 70% of our revenues from clients that were our clients in the previous year.
We have offices in ten cities in the United States and plan to leverage our existing capabilities to strategically grow our business in China, which has the largest population of Internet users in the world, according to an industry source, and is expected to be the third-fastest growing internet retailing market for the next five years, according to research by Euromonitor International in 2012. We have opened offices in Beijing and Shanghai and operate the Chinese websites for several of our clients, including General Motors, Motorola and Underwriter's Laboratories.
As part of our China strategy, we have focused on building our presence and capabilities in the sportswear market. We believe that the brand experience is critical for sports marketing and that sportswear will be a fast-growing e-commerce segment. We have recently entered into a joint venture with Li Ning, which is China's largest sports brand and is among the top ten sports brands globally in terms of revenues based on public company filings. This joint venture was established to develop, market and sell Li Ning's sports apparel, shoes and accessories via brand e-commerce and digital marketing in the United States and elevate the Li Ning brand from a national Chinese brand into a global brand. We recently entered into a joint venture relating to k121.com, a leading internet retailing website for sportswear products in China, which sells brands such as Nike, Adidas and Kappa. We plan to introduce other global sports brands to consumers in China through this platform.
Our revenues increased from US$51.1 million in 2009 to US$72.6 million in 2010, and grew further to US$106.7 million in 2011. Our gross profit increased from US$22.0 million in 2009 to US$31.4 million in 2010, and grew further to US$46.1 million in 2011. Our net loss was US$0.1 million and US$3.4 million in 2009 and 2010, respectively. Our net profit was US$8.3 million in 2011. Our adjusted EBITDA increased from US$8.0 million in 2009 to US$10.6 million in 2010 and to US$20.0 million in 2011, representing a CAGR of 57.6% from 2009 to 2011. For a reconciliation of our non-IFRS adjusted EBITDA to the IFRS measure of net profit or loss, see "Selected consolidated financial and operating data—Adjusted EBITDA".
Competitive strengths
The following competitive strengths have helped us to become a leading brand e-commerce and digital marketing company:
Market leadership and unique business model
We are a leader among digital agencies generally, as recognized by Advertising Age's 2010 and 2011 Agency Report. In addition, we believe we are the only one among our competitors that provides end-to-end brand e-commerce and digital marketing services. Traditional advertising agencies have focused on formulating creative ideas and executing them across various media channels, with little specialization in digital channel implementation. Management consultants have typically operated at a strategic advisory level without detailed execution capabilities. Pure technology providers typically offer only technology-driven solutions without creative input.
In contrast, we combine these three traditional models and provide an end-to-end solution. Our end-to-end approach helps our clients to transition their digital presence from generic
83
Table of Contents
platforms focused on desktop-based transactions or static informational websites to proprietary multi-channel digital experiences. Our digital strategy services develop strategies to enhance the brand experience, increase brand loyalty and brand monetization. Our multi-channel digital marketing services assist our clients to create a seamless brand experience across internet, mobile devices and social media applications, allowing them to develop higher value, long-term customer relationships. Our brand e-commerce technology services include designing online stores and other points of sale and helping our clients to create a lasting brand impression with their customers.
Strong relationships with a wide portfolio of leading brands
Our experience and multinational capabilities have enabled us to build relationships over the last decade with more than 500 companies and their global brands. Such brands include Allstate Insurance Company, Discover Card, Motorola, Shimano, Tommy Bahama and W.W. Grainger Inc., all of whom have had multi-year relationships with us as their digital agency of record. In 2011, we derived over 70% of our revenue from clients that had been our clients in the previous year. Our client base is difficult for new entrants or potential competitors to replicate organically and serves as a base for our future growth. In addition, our more than a decade of experience in serving our clients provides us with a greater ability to recognize and foresee the needs of our clients and their customers and recommend new initiatives that allow our clients to maintain a digital advantage over their competitors.
Strategic presence and expertise in China
We have opened offices in Beijing and Shanghai and operate the Chinese websites of several of our clients, including General Motors, Motorola and Underwriter's Laboratories. In addition, our executive management team has extensive experience investing in and operating companies in China and has a deep understanding of the China market. We believe our strategic presence has given us an early mover advantage over our competitors with respect to China-related business, allowing us to service both Chinese companies that wish to establish a presence abroad through the digital channel and global companies that wish to introduce their brands into the China market. This is exemplified by our recent joint ventures relating to the brand e-commerce and digital marketing of Li Ning and sale of sportswear products in China through k121.com.
We believe the breadth of experience of our board members also provides us with a competitive advantage in China in terms of managing our business and evaluating strategic acquisition opportunities. For example, Mr. William John Sharp managed global businesses during his tenure at Goodyear Tire and Rubber Company and currently serves as a director of several China-based and multinational companies. Mr. Wing Chung Anders Cheung is a former vice president for strategic investment at Lenovo and was the project manager for Lenovo's acquisition of IBM's personal computer business, among other strategic investments. Mr. Donghui Wang is the former chief financial officer of Kingsoft, a leading Chinese software and digital entertainment company. We plan to take advantage of the expertise and business connections of our directors to grow our business in China both organically and through acquisitions.
84
Table of Contents
Global brand e-commerce and digital marketing capabilities
We have a track record of assisting clients around the world, including numerous large multinational companies with a well-established global presence. Our client projects have included hosting multinational media sites, optimization and standardization of country-specific product catalogs and pricing terms as well as the country-by-country rollout of localized e-commerce sites. Our multinational capabilities in brand e-commerce and digital marketing allow our clients to support their physical stores across widespread geographies and localize the customer experience. We have advised clients on their digital presence in over 50 countries and five languages. Our track record of formulating and implementing digital strategies for clients around the world makes us a leading choice for brands seeking a unified and coordinated approach to their digital branding experience and digital sales channels across different markets.
Experienced management team with extensive backgrounds in the brand e-commerce and digital marketing industry
Most of the members of our senior management team have worked together since the early 1990s. Our senior management team has an average of more than 20 years of experience in brand e-commerce and digital marketing. The core management team of our U.S. operations, most of whom had been with us since our establishment in 2001, has successfully steered our company through various economic cycles, delivered revenue growth for our U.S. operations at a CAGR of more than 40% from 2009 to 2011 and maintained consistent operating profitability at our U.S. operations over the last ten years, including through several periods of significant economic challenges and the resulting financial challenges for our company's U.S. operations. Our management successfully anticipated the needs of companies with global and emerging brands to integrate e-commerce with digital marketing, and positioned us among the first digital agencies to employ social networking tools and mobile applications to drive digital marketing.
Strategies
As the demand for brand e-commerce and digital marketing services increases, we intend to strengthen our position as a leading global provider of such services to established brands and build on our China-related advantages. Our strategies include the following:
Strengthen our leading position in brand e-commerce and digital marketing
With our unique business model that combines offerings of digital strategy, multi-channel digital marketing and brand e-commerce technology services, we plan to strengthen our leading position in brand e-commerce and digital marketing. To achieve this, we intend to focus on what we believe to be the most important growth areas in our sector, including monetization of social media, mobile connectivity and customization of applications for the latest devices that are used to achieve it, including smartphones and tablets, and assisting our clients to create points of sale outside of desktop web-based online stores. In particular, we believe our strengths in brand e-commerce and digital marketing will help us to integrate points of sale within the social media experience to create a favorable environment to enable social media monetization. We also plan to expand our geographical presence in the United States, deepen our penetration into developing markets and become more specialized in our ability to analyze and target key demographic sectors such as women and teenagers. In
85
Table of Contents
addition, we plan to engage in a higher level of customization of our solutions for clients in different sectors and further diversify our client base.
Transform top Chinese brands into global brands
Increasing numbers of leading and established Chinese companies are seeking to expand their brands globally. We recently entered into a joint venture with Li Ning, which is China's largest sports brand and is among the top ten sports brands globally in terms of revenues, based on public company filings. Through this joint venture, we plan to develop, market and sell Li Ning's sports apparel, shoes and accessories via brand e-commerce and digital marketing into the U.S. market and elevate the Li Ning brand from a national Chinese brand into a global brand. We believe this is the first time a Chinese brand has partnered with a digital agency in the U.S. for brand e-commerce and digital marketing. We intend to leverage our management and board's extensive experience in China to work with other leading Chinese brands to enable them to reach global consumers via the digital channel.
Introduce global brands into China
Increasing numbers of leading global brands will need to look to China in order to fuel their future growth. China is expected to be the third-fastest growing internet retailing market for the next five years, according to Euromonitor International. As a result, we believe there is a substantial opportunity to grow our business by enabling global companies to expand their sales through brand e-commerce and digital marketing to the China market. We have begun implementing this strategy by entering into a joint venture relating to k121.com, a leading internet retailing website for sportswear products in China, which sells brands such as Nike, Adidas and Kappa. We also plan to build relationships with leading global brands in various sectors that are seeking to enter the China market or which already operate in China but wish to attain higher and more rapid growth through a China-focused digital marketing strategy. We will assist our clients in developing new products and executing digital marketing strategies designed to meet the preferences of Chinese customers.
Pioneer the partnership and principal model for dominant brands
The traditional agency business model is based on engagements with clients that vary from single term to multi-year projects and from revenue-sharing to fee-based compensation arrangements. We are pioneering a new partnership and principal model under which we enter into equity partnerships with established and successful brands to drive their customers' brand experience by implementing digital marketing strategies. The principal model allows us to gain a competitive advantage and enjoy the potential returns from our investments in the partnership. Our joint venture with Li Ning is an example of our principal model of engagement. We will continue to selectively assess other opportunities to establish similar principal engagements.
Selectively pursue strategic acquisitions and alliances
We intend to grow by selectively acquiring companies and assets, and pursuing strategic alliances that can enhance our existing capabilities or provide us with new capabilities and platforms that are strategic to brand e-commerce and digital marketing. Some of the strategic factors we consider when evaluating an opportunity include extending our geographical reach in China, Europe and the U.S., deepening our expertise in each consumer demographic, enhancing core platform technologies and opening new revenue streams in complementary or
86
Table of Contents
adjacent market segments. We also intend to leverage our directors' extensive networking resources to explore strategic acquisition and alliance opportunities. We have not currently identified any definitive acquisition targets or alliance partners.
Our services
Our company is positioned at the convergence of traditional advertising agencies, management consultants and pure technology providers. Our combined portfolio of services includes digital strategy, multi-channel digital marketing and brand e-commerce technology services. We offer each of these services on a stand-alone basis, but those services also complement each other to allow for cross-selling among service areas. By integrating these services in a single service package, we are able to lower our clients' overall costs and reduce the need for them to engage multiple agencies for a single project.
Digital strategy services
We develop strategies that are aimed at enhancing the brand experience, increasing brand loyalty and monetizing the brand. Our typical engagement starts with a strategic evaluation of the digital-related challenges facing the client. We help the client to identify high growth digital opportunities to increase and enhance customer reach, and reduce costs so as to drive top-line growth and improve margins. We then employ our expertise to translate strategic intent into actionable plans that we help clients execute through our other service offerings. We assist clients to develop strategies to, among other things, enhance their digital presence, integrate the customer's online experience with their existing offline brand experience and increase the conversion of site visits to positive brand impressions and sales. Our monetization strategies start with our clients' business and financial models to determine the best sales strategy. We identify opportunities for multi-channel interactions and improved customer engagement platforms to improve monetization of the brand.
We conduct industry benchmarking and user research for developing the appropriate digital strategy for a particular client. We conduct intensive interviews with various stakeholders of our clients on a global scale in order to better understand their digital brand opportunities. We also conduct in-depth research on our clients' specific industry to gain insights on the end-user points of view. Finally, we formulate a phased and sequential roadmap for carrying out an effective digital strategy.
We also provide BTO services to our clients as a stand-alone strategy service or as a prelude to a specialized digital brand engagement. Through our BTO services, we assess the technology infrastructure and digital assets of our clients and then propose solutions to help our clients to (i) measure both the costs and value of services their existing business technology delivers; (ii) optimize utilization of their existing infrastructure and personnel; and (iii) identify the most cost-efficient or most value-added paths to grow their infrastructure.
Multi-channel digital marketing services
Our multi-channel digital marketing services focus on identifying customer acquisition and retention opportunities for our clients, which is the next phase of our client engagement after our digital strategy services. Through our digital marketing services, we create meaningful user experiences through the integration of creative concepts, channel execution and customized content. We employ user-centered processes to identify customer needs and balance those
87
Table of Contents
against our clients' business objectives to create solutions for external websites, social media and mobile applications. We adopt a phased approach to achieve desirable user experiences, first creating artistic mock-ups, wireframes, sitemaps, schematics, process maps, feature lists, working prototypes and other artifacts to describe the intended user experience. After we receive our client's approval based on these detailed design specifications, we work closely with development and design teams to ensure that these specifications are implemented. We also apply expertise in marketing analytics to collect, analyze and report on consumer behavior and make judgments about their behavior patterns as represented by such data.
Multi-channel marketing activities
Unlike other digital agencies that only focus on internet advertising, we achieve multi-channel marketing by supporting and encouraging digital community activities through a combination of internet, mobile devices and third-party social networking channels. We employ cutting-edge digital marketing techniques that have evolved from search engine marketing and optimization on the desktop to the use of social media and mobile applications. In particular, we offer programs that help to build thematic operator and brand communities for our clients. For example, subscribers may push, pull, publish and distribute content to or from established online social networks (e.g., Facebook and Twitter) via their mobile handset or through a single point from within their online accounts. This helps to foster a community that becomes a digital arena for the introduction of new services, branded promotions, incentives and contests.
One of the main channels on which we focus are our clients' brand e-commerce websites. Our goal is to convey to the end users vivid and engaging impressions of our clients' brands, which requires not only the technical design of the website, but also creative visual design skills. Once we have formulated the design concept suitable for each client's unique brand impressions, our development managers are then responsible for designing the architecture, as well as developing and integrating front-end solutions so that these designs are translated into stimulating user experiences via digital channels. Through the brand e-commerce website, we aim to engage customers with our clients' brands, drive sales conversion and offer a rewarding customer shopping experience. Our team focuses on understanding the customers' needs and offering site personalization assessments that will improve the customer experience and enhance the brand. In addition to site personalization, we advise our clients how best to categorize website content for presenting the most user-friendly online experience and integrate the new website with their back-end systems, existing physical stores, product packaging and logistics vendors.
We also customize clients' websites to make them accessible by mobile devices, such as smartphones and tablets. By maintaining the latest know-how regarding how consumers use these devices and what functions they offer, we are able to design applications that take advantage of touch-screen capabilities and help fully utilize the functionality of these devices as each new generation is rolled out. By customizing for these devices, we are able to help optimize the accessibility of our clients' brands and keep them relevant for new generations of digital consumers.
Another important area of our expertise is the use of social media to further promote digital brands. We focus on creating content that attracts the attention of customers through social networking sites such as Facebook and Twitter and drives traffic and sales to client websites. We monitor customer comments, posts and other feedback. We also support the ongoing
88
Table of Contents
management of clients' social media initiatives. We are familiar with and have worked on many third-party tools in social media, offering our clients numerous options for possible software and solutions that could meet their needs. For example, we have a strategic relationship with leading social networking software providers that enable corporations to run their own social sites if they prefer not to outsource the site operation. We have implemented customer community and social media-based offerings and integrated them into our clients' websites, which allows them to further engage consumers. The result for our clients can be an active social media community that supports forums, user-generated personas, photos, videos, polls and customer feedback.
In addition, we help our clients to develop other digital channels such as high-quality digital newsletter campaigns featuring new products, recent news and exclusive online promotions. These campaigns generally have a significant positive impact on web traffic and on translating clicks by web visitors into sales. We also combine knowledge of search engine marketing and optimization practices with a detailed knowledge of technology platforms to achieve measurable results by using best-of-breed on-site page optimization tactics, internal-linking strategies, back-linking strategies and back-link building. With our expertise, we are able to achieve top rankings in the search engine results, increase visibility of the brand and drive sales results for our clients.
Analytics
We use our proprietary analytics capabilities to assist our clients to make data-driven, fact-based decisions. Our proprietary toolsets enable (i) data mining utilizing pre-built adaptors to extract data from Google Adwords, Google Analytics and other major search engine marketing platforms, (ii) categorization of data by its lowest level characteristics using pre-built parsing and pattern recognition segmentation algorithms and (iii) analytics data warehousing specifically designed for digital marketing that allows for advanced statistical analysis. The results of our analysis are then used to build our proprietary statistical models. These models are founded on base models that represent common digital marketing patterns across most industries, on which we then apply advanced multiple regression analysis to create a customer-specific model. Based on this model, we formulate recommendations for the client to develop successful online marketing strategies and campaigns across various digital marketing channels.
Our analytical results help improve customers' response rates to marketing campaigns, increase the frequency at which customers make purchases, enhance the value of each order and improve customer loyalty over time. Moreover, we closely interact with our clients to gain better insights on the effectiveness of our marketing campaigns. We believe our ability to capture and analyze integrated traffic and brand e-commerce sales data enhances the value of our strategic marketing services as it allows us to more precisely show the effectiveness of specific marketing activities, website changes, and other actions taken by our clients.
We also provide clients access to a large collection of standard and customizable reports via cutting-edge web analytics technology. This enables our clients to track and analyze sales, products, transactions, customer behavior and the results of marketing campaigns so they can enhance and adjust their marketing efforts to increase traffic, order close ratios and average order values. We believe this information is also valuable in measuring the lifetime value of particular customers.
89
Table of Contents
Brand e-commerce technology services
We not only assist our clients with their digital marketing campaigns, but also provide our clients brand e-commerce technology services on a global basis. We help our clients to establish their on-line stores or optimize their existing online stores, as well as establish other points of sale. The solutions used for such service are typically complex and must have the capacity to facilitate thousands of transactions simultaneously through various types of Internet-enabled devices, including smartphones and tablets. Our brand e-commerce technology services are evaluated by our clients mainly based on time to market and the relevance and functionality of our solution on these devices. Our brand e-commerce technology services include the following:
- •
- Brand e-commerce platform selection and integration: We help our clients collect, organize, and prioritize their requirements for a brand e-commerce platform, resulting in a short list of potential platforms that would suit their needs. Based on our recommendations, our clients typically either choose a platform that they purchase from a third-party vendor or outsource the entire solution to us. We also assist our clients to integrate the platform into their existing back office systems. The brand e-commerce platforms help our clients to support a wide range of marketing, merchandising and selling activities. These platforms enable our clients to effectively execute promotions, up-sell and cross-sell and feature specific products and services throughout the shopping experience.
- •
- Implementation of cutting-edge technologies: We apply cutting-edge e-commerce technologies, including software, applications and architecture solutions, on our clients' brand e-commerce platforms that allow our clients to make targeted offers designed to increase order close ratios and average order sizes. These technologies also allow for rapid deployment and upgrades of the brand e-commerce platforms. For example, we use our Commerce OnDemand™ solution to provide services in connection with the development, operation and maintenance of our clients' e-commerce sites. Utilizing our Commerce OnDemand™ solution, our clients can achieve quick integration and implementation of their e-commerce sites. Our ability to provide these technologies in an outsourced solution also helps to address one of the largest challenges facing our clients, which is their ability to grow and enhance their e-commerce platforms to keep up with the rapid changes in technology. Most companies do not have the internal technology and marketing resources to do this themselves on a cost-effective basis. As a result, many of our clients outsource the entire end-to-end process of their brand e-commerce business to us to capitalize on our experience and expertise. By leveraging our years of experience in running brand e-commerce businesses, we offer complete solutions that enable our clients to engage in e-commerce without incurring up-front and on-going costs for qualified staff, hardware, software and network infrastructure, allowing them instead to focus on their core competencies.
- •
- Content management and customization: We help our clients manage and customize their digital contents such as website information, online product information, digital images or videos and other digital assets. These measures enhance the impression of a client's brand, which can stimulate higher offline sales for products that are not normally sold online. For example, one of our key clients in the automotive industry must deliver not only robust content around the features and options of each automobile model but also maintain thousands of high-resolution images and videos of models available 24 hours a day. By helping this client to effectively manage and customize this vast amount of digital content,
90
Table of Contents
we contributed to improved sales conversion at dealerships along with an improved perception of the client's digital brand. These challenges demand robust solutions that are aimed not only at directly selling a product online, but also at removing buying obstacles by streamlining site navigation, updating information and providing customer support chat services.
We support the customer's digital experience through effective web content management and a cohesive digital governance policy, both of which are usually applied across different countries and regions for global brands. These offerings can be managed through client-facing, remotely controllable self-service tools that can be used by client personnel without specialized training. Whether or not the client outsources the entire solution to us, we help our clients achieve greater revenue from online transaction, and the clients' customers can have a more rewarding shopping experience, with attractive product configuration options at multiple touch points. When clients outsource the entire solution to us, we use third-party data centers that perform and scale for uninterrupted operation in a high-demand environment. We only utilize data centers that feature fully redundant high-speed connections to the internet, server capacity to handle unpredictable spikes in traffic and transactions, 24-hour security and monitoring, back-up electric generators and dedicated power supplies.
Case studies
| | |
Challenges
| | Acquity Solution
|
|---|
| |
|---|
| A leading internet and software company | | |
Client A, a leading internet and software company, decided to address two urgent issues relating to its online site:
i) how to refresh more than 4,000 pages of global online content at the pace necessary to engage customers and showcase its rapidly evolving product line; and
ii) prioritize online revenue generation by improving content management and driving customer connectivity. | | We have launched multiple sites for Client A, including:
• a website, containing tutorials, articles, forums and other content for the development community of Client A;
• a website, with optimization for 29 languages and 56 geographies; and
• Client A's Digital Enterprise Platform and Customer Experience Solutions, offering a more comprehensive, cross-portfolio value proposition for customers along with social media integration. |
A large automobile insurer |
|
|
| Client B, one of the largest automobile insurers in the United States, engaged us to create a digital teen experience and create unique modules for teens and parents to have authentic, engaging and productive interactions about responsible driving. | | We translated the business plan designed by Client B into a digital brand strategy and digital marketing initiative to build loyal relationships with young drivers and their parents. The site won an Advertising Age award and we continue to provide strategic thought leadership and recommendations to keep teens and parents engaged with the program. |
91
Table of Contents
| | |
Challenges
| | Acquity Solution
|
|---|
| |
|---|
A large regional big-box retailer |
|
|
| Client C, one of the largest regional big-box retailers in the United States, had outsourced their e-commerce platform to a third-party provider. We were engaged to resolve misalignment within the company's e-commerce and technology organizations as well as address the instability problem of the underlying e-commerce platform. | | We developed an enhanced customer experience that better aligned with brand expectations. Re-launched, the e-commerce site's availability increased from 85% in the 2010 holiday season to 99.96% in 2011, and the improved site performance contributed to Client C's exceeding its planned sales for that season. |
A leading specialty retailer |
|
|
| Client D, one of the leading specialty retailers in the United States, embarked on a rebranding program to integrate its multiple brands, previously in stand-alone boutique stores, into one-stop physical megastores. We were engaged to work on a transformation of its e-commerce experience into a multi-brand shopping experience. | | We defined and developed the digital strategy, user experience and creative design for the multi-brand portal and were responsible for the implementation of the brand e-commerce platform.
The new platform will integrate five brands into one seamless web store—enabling customers to view and shop the company's 1,700 style assortment and catering to a wide array of its customer profiles. |
A large credit card insurer |
|
|
| Client E, one of the largest credit card issuers in the United States, was looking for a mobile solutions partner to maintain relevancy with its customer base through mobile platforms while gaining a competitive advantage in the emerging mobile payment space. It placed special focus on the mobile experience via smartphones and tablets. | | As Client E's mobile agency of record, we were responsible for developing a holistic mobile strategy across business units and executing that strategy. The number of Client E's unique mobile users increased from 139,332 to 341,041 within one year. |
A leading automobile manufacturer |
|
|
| Client F, a leading automobile manufacturer, engaged us to help build its corporate website to become the single digital source for world media to access up-to-date news coverage, press releases and vehicle information for all of its brands globally. One of the key sub-engagements was preparing the site for its 2010 initial public offering on the NYSE. | | We designed and built a new global media site on our Content OnDemand Managed Services Platform. Our outsourced solution significantly lowered the total cost of ownership for the site and enabled authors in over nine countries to publish content faster than before. The solution establishes a flexible and scalable platform while introducing new social media capabilities and enables Client F to launch micro-sites and mobile-optimized sites for special events such as auto shows and other campaigns. |
92
Table of Contents
| | |
Challenges
| | Acquity Solution
|
|---|
| |
|---|
A large big-box department store chain |
|
|
| Client G is a large big-box department store chain in the United States. Its e-commerce website had not been significantly updated in the five years before engaging us and it found that its website was not ready to meet its expanding online business plan. | | We transformed both the merchandising and technical platforms over a 36-month period. Client G's e-commerce sales more than quadrupled from 2006 to 2010. The results were achieved without scaling overhead to support the rapid growth. The new web store allowed Client G to sell 100% of their SKUs online. We also assisted Client G in deploying a new gift registry, in-store kiosk and customer service solution. |
A global laboratory supply and distribution company |
|
|
| Client H, a global laboratory supply and distribution company, was seeking to expand its digital marketing platform into other tactics that their 43 brands could leverage across 180 countries. | | We delivered a 24-month realization plan and roadmap to evolve Client H's digital strategy to increase coverage into 11 new tactical areas, including organizational recommendations to foster innovation and handle the increase in demand of services from their 43 brands. |
A leading luxury retailer |
|
|
| Client I, one of the leading luxury retailers in the United States, needed to remedy instabilities in its core e-commerce platform, build additional value-added functionality and drive efficiencies in product publication and platform development. | | We developed a multi-year brand e-commerce technology strategy, identified a publishing process remediation roadmap, and implemented a visual merchandising tool. Client I achieved over 100% online revenue growth since the inception of our engagement. |
A leading global distributor of scientific equipment |
|
|
| Client J is a leading global distributor of scientific equipment. Its catalog of over 750,000 products is accessed by its community of scientists every day across the world. We were asked to build a brand e-commerce strategy and platform roadmap that could support its global channel needs. We were later requested to build the global brand e-commerce platform for it. | | We successfully deployed the global B2B commerce platform in the spring of 2011. The new platform fully integrates with back-end systems and is considered a leader in global B2B e-commerce. |
93
Table of Contents
| | |
Challenges
| | Acquity Solution
|
|---|
| |
|---|
A large maintenance, repair and operations service provider |
|
|
| Client K, one of the world's largest maintenance, repair and operations service providers, was an early adopter of the digital channels and already had more than US$1 billion in online revenue when it engaged us. The engagement was to develop and execute a multi-year e-commerce strategic plan to align multiple channels (e.g., online, retail, catalog and direct) to deliver top line growth, cost containment, allow for product expansion and address competitive pressures. | | We are actively working on Phase 1 of a multi-year initiative that targets to significantly boost Client K's online revenue through increased customer growth and retention, business process optimization and technology innovation. |
| |
Our clients
Over the last decade, we have built relationships with over 500 companies that are active in the brand e-commerce and digital marketing sector. These clients span a wide range of industries, including retail, technology, media, telecommunications and financial services. We have an engagement history with some brand portfolios of over ten years and, in 2011, we derived over 70% of our revenue from clients that had been our clients in the previous year. We provide services to these clients on a project-by-project basis. For those clients to which we have provided services over a period of several years, we have in many cases taken over the management and hosting of their digital properties and integrated their data on our servers. This level of integration and dependence makes it difficult for those clients to change to a new service provider. Thus, we believe it is difficult for new entrants or potential competitors to replicate organically the type of services we provide to our clients. In addition, through these multi-year relationships, we have gained intimate knowledge of the operations of our clients and built personal relationships with their executives. This level of knowledge typically takes years to replicate and makes it difficult for our clients to change to new providers without a significant ramp-up period. Furthermore, our more than a decade of experience in serving our clients provides us with a greater ability to recognize and foresee the needs of our clients and their customers and recommend new initiatives that allow our clients to maintain a digital advantage over their competitors.
Most of our clients lack the specialized expertise required for formulating and implementing successful brand e-commerce and digital marketing strategies and have chosen to outsource such work rather than developing their own inhouse capabilities. Our target clients generally seek to efficiently implement or enhance business initiatives, adapt their marketing strategies, or introduce new products or programs, without the burden of having to modify or expand their technology, customer care, supply chain or logistics infrastructure.
In 2011, our top ten clients as measured by revenues were, in alphabetical order: Adobe Systems Inc., Allstate Insurance Company, American Express, Belk, Inc., Discover Financial Services, General Motors Company, HTC, Motorola, Inc., The Pampered Chef, Ltd., and W.W. Grainger Inc. We are the digital agency of record for several of these clients. These ten clients
94
Table of Contents
collectively represented 43% of our revenues in 2011. Our top client in 2011, W.W. Grainger Inc., accounted for 13% of our revenues. In 2009 and 2010, no single client accounted for more than 10% of our revenues.
The following table sets forth the percentage of our revenues by client industry for the years ended December 31, 2009 and 2010 and 2011:
| | | | | | | | | | |
| | % of
Revenues for | |
|---|
Client Industry
| | 2009
| | 2010
| | 2011
| |
|---|
| | |
Retail | | | 42.1 | % | | 44.2 | % | | 49.2 | % |
Technology, Media and Telecommunications | | | 13.6 | | | 12.8 | | | 13.9 | |
Financial Services | | | 6.5 | | | 10.7 | | | 11.2 | |
Healthcare | | | 8.7 | | | 9.5 | | | 5.1 | |
Business Services | | | 7.4 | | | 6.0 | | | 3.0 | |
All Others Combined | | | 21.7 | | | 16.8 | | | 17.6 | |
| | |
We value our long-standing relationships with our clients and have had multi-year relationships with our top clients. Also, as many of our clients are large, multinational companies, there are still significant potential untapped revenue opportunities for us even among our top clients.
Sales and marketing
Our sales and marketing strategy is targeted at increasing market awareness of our brand and service offerings, gaining new business from target clients, cross-selling our services to existing clients, and promoting repeat business from existing clients. In addition, our sales efforts are data driven and we tailor our marketing proposals to fit each prospective client. We have a proprietary database of knowledge and insight built over ten years, as well as a highly customized Sales Force Automation and Customer Relationship Management solution. Our sales teams are located in our key target markets, which we believe provides us with a competitive advantage over many other competitors in the industry.
We believe the principles and procedures by which we select our clients are a key to our sustainable growth. We first identify companies with attributes that are consistent with our target client base, such as those that are leaders in their sector, have a complex business problem that requires a digital solution or face the challenge of evolving market trends within their sector that are forcing them to reevaluate their business model. We next evaluate their suitability as a client, including the competitive pressures facing them, whether we have a sponsor within the organization at an appropriate level and whether they have the budget available for the project. Once these factors are vetted, we determine what type of services to provide and which economic model (joint venture, retainer or service contract) to adopt.
Our executive management is actively involved in business development and managing our key client relationships. Our main sources of leads for new revenue generation include our management team and directors' relationships, database and media mining, industry analyst relationships and software vendor partnerships.
As of December 31, 2011, we had 41 sales professionals. We have recently been expanding rapidly and are planning to add to our sales force for China. Our sales team consists of client
95
Table of Contents
partners, account managers and special sales representatives. Client partners are responsible for directing all business development activities in their designated territories. Account managers are responsible for managing the day-to-day aspects of client relationships and supporting new business development efforts. Our special sales representatives strategically target potential clients with specific value propositions tailored for that particular company based on the analytics and subsequent preparation from the sales representatives team. We believe this unique model accelerates our sales process.
Our comprehensive marketing approach includes both direct and indirect marketing initiatives. Some of the direct marketing activities include speaking at industry conferences; attending various trade shows and industry events; and maintaining a significant presence at events held by strategic partners. These speaking and exhibiting engagements provide us with a number of qualified leads for the business development team. Some of the indirect marketing activities include managing the corporate website, regularly refining sales and marketing materials and maintaining a library of case studies in various sectors and industries highlighting the work we have done. In order to supplement these marketing efforts, we manage a comprehensive public relations effort aimed at achieving positive coverage in print and online trade and business publications, both at the local and national level.
Competition
We believe we are a pioneer in the area of brand e-commerce and one of the only agencies offering a full suite of services including digital strategy, multi-channel digital marketing and brand e-commerce technology. However, we face many competitors that compete with us with respect to different parts of our business. Our competitors range from large international advertising agencies to smaller companies offering specialized e-commerce solutions. The competitive environment is also changing as a result of increased alliances among our competitors and through strategic acquisitions. We also face competition from the in-house digital marketing departments of some of our clients that may decide to take over the work once we have formulated a strategy or established an initial platform for them.
We face the following competitors in each of our respective service areas:
- •
- Digital strategy: The digital advisory arms of strategic consulting firms such as A.T. Kearney, The Boston Consulting Group and McKinsey & Company;
- •
- Multi-channel digital marketing: Digital marketing agencies that are either independent such as AKQA Inc., or subsidiaries of global advertising holding companies, such as Rosetta Marketing Group, LLC and Razorfish Inc.; and
- •
- Brand e-commerce technology: Providers of e-commerce solutions that enable online sales channel capabilities, such as Accenture Interactive, Deloitte Consulting, Digital River, Inc., GSI Commerce, Inc., IBM Global Business Services and SapientNitro. There are other IT consulting companies providing services in this area, such as Cognizant, Infosys and Wipro.
We believe that the principal competitive factors in our industry are quality of services, time to market, technical and strategic expertise, ability to provide end-to-end solutions, brand recognition and track record size of the firm, as well as financial stability. We believe that we compete favorably with respect to these factors.
96
Table of Contents
Intellectual property
Our key assets include intellectual property rights and our brand, which we have used for more than ten years in the United States. We rely primarily on a combination of trademark laws, copyright laws, confidentiality procedures and contractual provisions to protect our intellectual property rights and our brand. Our consumer-facing businesses depend on trademarks, service marks, copyrights and domain names, and we have registered, or applied for the registration of, a number of U.S. and international trademarks, service marks, copyrights and domain names. For example, we have registered the Commerce OnDemand® trademark and filed a supplementary trademark registration of Brand Commerce OnDemand™. We are entitled to use Brand E-Commerce on a first-use basis and intend to apply to register this trademark. We use our clients' names, URLs, logos and other marks in connection with the operation and promotion of their brand e-commerce businesses. Our agreements with our clients provide us with licenses generally to use this intellectual property in connection with the operation of their brand e-commerce businesses. These licenses typically are coterminous with the respective agreements. In addition, we enter into confidentiality and invention assignment agreements with our employees to control access to software, documentation and other proprietary information.
Government regulations
We are subject to a number of foreign and domestic laws and regulations that affect companies conducting business over the internet. With the development of the internet, federal and state regulation of various aspects of the internet and digital technologies has increased, including intellectual property rights and infringement, user privacy, information security and data protection, advertising methods and on-line content. In addition, laws and regulations relating to user privacy, information security and intellectual property rights are being considered for adoption by many countries throughout the world.
In the area of intellectual property rights, the Digital Millennium Copyright Act has provisions that limit, but do not necessarily eliminate, our liability for listing, linking or hosting third-party content that includes materials that infringe copyrights. In the area of user privacy, the Children's Online Privacy Protection Act restricts the distribution of materials considered harmful to children and imposes additional restrictions on the ability of online services to collect information from children under thirteen. In the area of data protection, many states have passed laws requiring notification to users when there is a security breach for personal data, such as the California Security Breach Notification Act. In the area of advertising methods and content, the Federal Controlling the Assault of Non-Solicited Pornography and Marketing Act of 2003 contains restrictions on the content and distribution of commercial e-mails and imposes complex and burdensome requirements in connection with sending unsolicited commercial promotion e-mails to customers or potential customers.
In addition, the operation of our joint venture in China may be subject to relevant PRC laws and regulations. Besides the Company Law of the PRC, our joint venture in China, as an equity joint venture, must also comply with the Law of the PRC on Chinese-Foreign Equity Joint Venture and its Implementation Rules, which provide restrictions on distribution of profits. Under the PRC foreign exchange laws and regulations, foreign currency exchanges are also strictly controlled. The conversion of Renminbi for capital account items is subject to the
97
Table of Contents
approval or verification of SAFE, and our joint venture is required to apply to SAFE for a foreign exchange registration certificate for foreign-invested enterprise, which is subject to review and renewal by SAFE on an annual basis. Failure to pass the SAFE annual review or timely file its changes with SAFE may subject our joint venture to administrative penalties. Foreign investors must comply with the Catalogue for the Guidance of Foreign Investment Industries and other applicable PRC laws and regulations regarding foreign investment in specific industries, and those PRC laws and regulations are amended from time to time. Furthermore, registration of our trademarks and use of our and others' trademarks in China are required to comply with the Trademark Law of the PRC.
We believe we have complied with these laws and regulations in all material respects. The failure to comply with applicable laws or regulations could have a material adverse effect on our business. Any changes in the current laws and regulations or judicial interpretations narrowing their protections may subject us to greater risks and may increase our costs of compliance with these laws and regulations or limit our ability to operate certain lines of business. See "Risk Factors—Risks related to our business and industry—Existing or future laws or regulations could harm our business."
Employees and human capital
We had 269, 356 and 458 full-time employees as of December 31, 2009, 2010 and 2011, respectively. The following table sets forth a breakdown of our employees by function as of December 31, 2011. In addition, from time to time we engage independent subcontractors to assist us in our project work.
| | |
| |
Function
| | As of
December 31, 2011
|
|---|
| |
Technology | | 250 |
Creative Design | | 107 |
Administration | | 60 |
Sales & Marketing | | 41 |
| | |
| | |
| | | |
Total | | 458 |
| |
We have developed a strong company culture that encourages individual thinking and creativity and a strong commitment to providing the best experience to our clients. We maintain high employee retention rates as compared to industry averages by paying competitive salaries, offering an attractive work environment and culture, and investing in the long-term growth and development of our personnel. None of our employees are represented by a labor union or are subject to a collective bargaining agreement, nor have we experienced any material work stoppages. We consider our relationship with our employees to be good.
We source both experienced candidates from industry and candidates directly from universities. Experienced candidates join us from competitive agencies, professional services organizations and marketing companies. Candidates joining us directly from university have generally attended the top marketing, engineering and design schools in the U.S.
We employ a rigorous, multi-step interviewing process to help ensure that all candidates meet our high standards. Once hired, employees participate in a one-week orientation program
98
Table of Contents
during which they participate in training sessions focused on our solutions, methodologies and processes. Over the course of an employee's career, he or she will participate in ongoing educational opportunities, including certification training or technical training, and will also have the opportunity participate in key mentorship and leadership programs.
Insurance
We maintain various insurance policies, including property casualty insurance covering our equipment and facilities. In addition, we provide workers' compensation to our employees pursuant to different states' statutory requirements. We also maintain key-man life insurance for certain senior management members. We do not maintain business interruption insurance or general third-party liability insurance. We believe that our insurance coverage is in line with industry practice and is sufficient for our business operations.
Properties
We have an aggregate of 109,000 square feet of leased office space in ten cities in the U.S., as well as two offices in Beijing and Shanghai, China, respectively, which we have right to use pursuant to certain contractual arrangements. Our leases have an average term of four years.
Legal proceedings
We are currently not a party to, and we are not aware of any threat of, any legal, arbitration or administrative proceedings that, in the opinion of our management, is likely to have a material and adverse effect on our business, financial condition or results of operations.
99
Table of Contents
Management
Directors and executive officers
The following table sets forth information regarding our directors and executive officers and information regarding senior management of our operating entity, Acquity Group LLC.
Our Directors and Officers
| | | | |
| |
Name
| | Age
| | Position/Title
|
|---|
| |
| G. George Lu | | 47 | | Executive Chairman and Group Chief Executive |
| Adrian Chan | | 37 | | Director and Company Secretary |
| Wing Chung Anders Cheung | | 47 | | Independent Director |
| William John Sharp | | 70 | | Independent Director |
| Donghui Wang | | 40 | | Independent Director |
| Paul Weinewuth | | 47 | | Chief Financial Officer |
| Raymond Grady | | 40 | | Executive Vice President and Global Head of Sales |
| |
Senior Management of Acquity Group LLC
| | | | |
| |
Name
| | Age
| | Position/Title
|
|---|
| |
| Christopher Dalton | | 44 | | President and CEO |
| Matthew Schmeltz | | 43 | | Executive Vice President |
| James Newman | | 50 | | Executive Vice President |
| Andrew Peebler | | 37 | | Executive Vice President |
| Jay Dettling | | 41 | | Executive Vice President |
| |
Directors and executive officers of our company
Mr. G. George Lu has been the executive chairman and group chief executive of our company since 2008. He is also the president of Digital Li-Ning Company Limited, which was jointly established with Li Ning Company Limited in 2011. Mr. Lu founded a private investment firm in the United States in November 1997, and serves as an officer or adviser to other private companies that he founded or in which he invested. From April 2004 to December 2010, Mr. Lu served as the vice chairman of Xingda International Holdings Limited, a Hong Kong Stock Exchange-listed company. He is also the independent non-executive director of Kingsoft Corporation Limited, a Hong Kong Stock Exchange-listed software company. From August 2006 to October 2009, Mr. Lu served as the chairman and chief executive officer of Exceed Company Limited, a Nasdaq-listed company. Mr. Lu graduated from Huazhong Normal University and obtained a master's degree in Science from the University of Memphis.
Mr. Adrian Chan has been a director and company secretary of our company since 2011. From 2005 to 2007, Mr. Chan was an investment banker at Goldman Sachs where he worked on restructurings, mergers and acquisitions and equity offerings relating to Chinese companies. Before he joined Goldman Sachs, he was on the China investment banking team of UBS AG in Hong Kong, which he joined in 2004. Prior to his employment at UBS, Mr. Chan was a solicitor at Linklaters in Hong Kong starting in 1999 where he specialized in advising on China-related
100
Table of Contents
and Hong Kong securities offerings. He graduated with a B.A. in Jurisprudence from the University of Oxford in the United Kingdom.
Mr. Wing Chung Anders Cheung has been an independent director of our company since 2011. Mr. Cheung has been the chairman and managing director of Lenovo Chinaweal System & Service Co. Ltd. based in China since 2008. Prior to that, Mr. Cheung was a vice president of Lenovo Group Limited and was responsible for the corporate development of Lenovo Group, including strategic investment, acquisitions, joint ventures and investment portfolio investment. Between 2006 and 2008, Mr. Cheung served as a non-executive director at Asiainfo Holdings Inc., a Nasdaq-listed company. Between 2004 and 2010, Mr. Cheng served as an independent non-executive director of Kingsoft Corporation Limited. Mr. Cheung received an MBA degree from a joint program between Northwestern University in the United States and the Hong Kong University of Science and Technology.
Mr. William John Sharp, has been an independent director of our company since 2010. Mr. Sharp has served as President of Global Industrial Consulting, a consulting firm since 2001. Since 2011, Mr. Sharp has been a director of China Zenix Auto International Ltd., a New York Stock Exchange-listed company that manufactures commercial vehicle wheels. Since 1998, Mr. Sharp has been a director of Ferro Corp, a New York Stock Exchange-listed company that produces performance materials, where he also serves as chairman of the Audit Committee and as a member of the Compensation Committee and the Finance Committee. From 1964 to 2000, Mr. Sharp served at Goodyear Tire and Rubber Company in various capacities, including president of the North American Tire division, president of the Global Support Operations and president of its Europe, Middle East and Africa division. Since 2005, Mr. Sharp has been a director of Xingda International Holdings Limited, where he serves as chairman of the Compensation and Management Development Committee and a member of the Audit Committee. Mr. Sharp has actively advised leading global private equity investors in their investments in China. Mr. Sharp graduated with a bachelor of science degree from Ohio State University.
Mr. Donghui Wang has been an independent director of our company since 2011. Mr. Wang co-founded Shang Ameba Venture Capital LLP, a venture fund engaged in angel investments, in 2011 and remains its general partner. Mr. Wang served as the chief financial officer of Kingsoft Corporation Limited, a Hong Kong Stock Exchange-listed software company, from 2005 to 2011. Mr. Wang worked at Ernst & Young Beijing from 1997 to 1999 as a senior accountant. From 1999 to 2005, Mr. Wang served as a consultant in the PricewaterhouseCoopers office in Sydney, Australia and a senior manager in their Beijing office. Mr. Wang received a bachelor's degree in Engineering from Tianjin Polytechnic University and an MBA degree from Victoria University of Technology in Australia.
Mr. Paul Weinewuth has been our chief financial officer since 2010 and was one of the founders of Acquity Group LLC. Mr. Weinewuth also currently serves as the chief financial officer of Acquity Group LLC. Mr. Weinewuth began his career as an engineer in 1986 and entered the consulting industry by joining Andersen Consulting in 1993. Mr. Weinewuth left Andersen Consulting to co-found Modern Business Technology in 1994. Mr. Weinewuth has more than 20 years of experience in consulting and software development and earned a bachelor's degree in Science from Marquette University.
Mr. Raymond Grady has been an executive vice president and global head of sales of our company since 2010. Mr. Grady is also serving as executive vice president of Acquity Group LLC
101
Table of Contents
with primary responsibility for business development since 2001. Prior to joining us in 2001, Mr. Grady was a vice president of business development for the Venture Creation Group. Mr. Grady began his career at Bottomline Technologies in 1993, after receiving his bachelor's degree from the University of New Hampshire.
Senior management of our operating entity, Acquity Group LLC
Mr. Christopher Dalton co-founded Acquity Group LLC in 2001 and has since served as the president and CEO. Mr. Dalton started his career with Arthur Andersen in 1990. Mr. Dalton worked as a director at Lante Corporation from 1992 to 1997. After Lante, Mr. Dalton worked as a partner with Modern Business Technology from 1997 to 2001. Mr. Dalton graduated with a bachelor of science degree in Business Administration from Marquette University.
Mr. Matthew Schmeltz co-founded Acquity Group LLC in 2001 and is the executive vice-president responsible for marketing. Mr. Schmeltz started his career at Motorola in 1990 and held various positions at United Stationers and New Resource Corporation through 1996. Mr. Schmeltz was a partner of Modern Business Technology from 1996 to 1999. Mr. Schmeltz graduated with a bachelor of science degree from the University of Iowa.
Mr. James Newman joined Acquity Group LLC in 2001 and serves as executive vice president of operations. From 1998 to 2001, Mr. Newman was vice president at marchFIRST, Inc. where he served as solution leader for the business intelligence and knowledge management practice. Prior to that, Mr. Newman was vice president at Utilities International, Inc. from 1994 to 1998 and principal consultant at Metzler & Associates from 1988 to 1994. Mr. Newman graduated with a bachelor's degree in General Engineering from the University of Illinois at Urbana-Champaign and an MBA degree from Northwestern University.
Mr. Andrew Peebler joined Acquity Group LLC in 2002, and serves as executive vice president in charge of the western region of the United States. Mr. Peebler began his career as a consultant at Andersen Consulting (later Accenture) from 1996 to 1998. Mr. Peebler then joined Whittman-Hart from 1998 to 2001. Mr. Peebler graduated with a bachelor's degree in Political Science from the University of Iowa.
Mr. Jay Dettling joined Acquity Group LLC in 2002, and serves as executive vice president in charge of the central and eastern regions of the United States. Mr. Dettling began his career as a senior consultant at Andersen Consulting from 1994 to 1995. Mr. Dettling then worked in Whittman-Hart from 1995 to 2001. In 2001, Mr. Dettling joined USA.NET as a senior director, until he joined Acquity Group LLC. Mr. Dettling graduated with a bachelor's degree in Economics and Computer Applications from the University of Notre Dame. He also earned an MBA in Finance and Marketing from Northwestern University.
Committees of the board of directors
Prior to the completion of this offering, we intend to establish three committees under the board of directors: the audit committee, the compensation committee and the corporate governance and nominating committee, and adopt a charter for each of the committees. Each committee's members and functions are described below.
Audit committee
Our audit committee will comprise Mr. Wing Chung Anders Cheung, Mr. William John Sharp and Mr. Donghui Wang and will be chaired by Mr. Wang, a director with accounting and
102
Table of Contents
financial management expertise as required by the NYSE corporate governance rules, or the NYSE Rules. All of our audit committee members satisfy the "independence" requirements of the NYSE Rules. The audit committee will oversee our accounting and financial reporting processes and the audits of the financial statements of our company. The audit committee will be responsible for, among other things:
- •
- selecting our independent auditors and pre-approving all auditing and non-auditing services permitted to be performed by our independent auditors;
- •
- reviewing with our independent auditors any audit problems or difficulties and management's response;
- •
- reviewing and approving all proposed related-party transactions, as defined in Item 404 of Regulation S-K under the Securities Act;
- •
- discussing the annual audited financial statements with management and our independent auditors;
- •
- reviewing major issues as to the adequacy of our internal controls and any special audit steps adopted in light of material control deficiencies;
- ���
- annually reviewing and reassessing the adequacy of our audit committee charter;
- •
- meeting separately and periodically with management and our internal and independent auditors;
- •
- reporting regularly to the full board of directors; and
- •
- such other matters that are specifically delegated to our audit committee by our board of directors from time to time.
Compensation committee
Our compensation committee will comprise Mr. Wing Chung Anders Cheung, Mr. William John Sharp and Mr. Donghui Wang, all of whom satisfy the "independence" requirements of the NYSE Rules. Our compensation committee will be chaired by Mr. Cheung. Our compensation committee assists the board in reviewing and approving the compensation structure of our directors and executive officers, including all forms of compensation to be provided to our directors and executive officers. The compensation committee will be responsible for, among other things:
- •
- approving and overseeing the compensation package for our executive officers;
- •
- reviewing and making recommendations to the board with respect to the compensation of our directors;
- •
- reviewing and approving corporate goals and objectives relevant to the compensation of our chief executive officer, evaluating the performance of our chief executive officer in light of those goals and objectives, and setting the compensation level of our chief executive officer based on this evaluation; and
- •
- reviewing periodically and making recommendations to the board regarding any long-term incentive compensation or equity plans, programs or similar arrangements, annual bonuses, employee pension and welfare benefit plans.
103
Table of Contents
Corporate governance and nominating committee
Our corporate governance and nominating committee will comprise Mr. Wing Chung Anders Cheung, Mr. William John Sharp and Mr. Donghui Wang, all of whom satisfy the "independence" requirements of the NYSE Rules. Our corporate governance and nominating committee will be chaired by Mr. Sharp. The corporate governance and nominating committee will assist the board of directors in identifying individuals qualified to become our directors and in determining the composition of the board and its committees. The corporate governance and nominating committee will be responsible for, among other things:
- •
- identifying and recommending to the board nominees for election or re-election to the board, or for appointment to fill any vacancy;
- •
- reviewing annually with the board the current composition of the board in light of the characteristics of independence, age, skills, experience and availability of service to us;
- •
- identifying and recommending to the board the directors to serve as members of the board's committees;
- •
- advising the board periodically with respect to significant developments in the law and practice of corporate governance as well as our compliance with applicable laws and regulations, and making recommendations to the board on all matters of corporate governance and on any corrective action to be taken; and
- •
- monitoring compliance with our code of business conduct and ethics, including reviewing the adequacy and effectiveness of our procedures to ensure proper compliance.
Executive committee
Our executive committee comprises G. George Lu and Adrian Chan and is chaired by G. George Lu. The executive committee is generally in charge of the executive management of our company. The executive committee reports directly to our board of directors.
Interested transactions
A director may vote in respect of any contract or transaction in which he or she is interested, provided that the nature of the interest of any directors in such contract or transaction is disclosed by him or her at or prior to its consideration and any vote in that matter.
Remuneration and borrowing
The directors may determine remuneration to be paid to the directors. The compensation committee will assist the directors in reviewing and approving the compensation structure for the directors. The directors may exercise all the powers of the company to borrow money and to mortgage or charge its undertaking, property and uncalled capital, and to issue debentures or other securities whether outright or as security for any debt obligations of our company or of any third party.
Qualification
There is no shareholding qualification for directors.
104
Table of Contents
Employment arrangements
Each of our senior management members serves on an "at will" basis and has entered into a letter of employment with our company. Each executive officer has agreed to hold, both during and subsequent to the terms of his or her agreement, in confidence and not to use, except in pursuance of his or her duties in connection with the employment, any of our confidential information, technological secrets, commercial secrets and know-how. Each of our executive officers has also entered into a confidentiality and non-competition agreement with our company.
Compensation of directors and executive officers
For the year ended December 31, 2011, we paid an aggregate of US$0.7 million in salaries, variable compensation and benefits to our executive officers and directors.
2011 Share Incentive Plan
In November 2011, we adopted our 2011 Share Incentive Plan, which will be effective upon the completion of this offering. Our share incentive plan provides for the grant of options, share appreciation rights, restricted shares, restricted share units, and other share-based awards. The maximum aggregate number of our ordinary shares that may be issued under our 2011 Share Incentive Plan is 5,000,000, plus an annual increase in the number of ordinary shares available for issuance equal to 1% of the outstanding ordinary shares on the first day of our fiscal year or such lesser amount as determined by our board of directors. The purpose of the plan is to attract and retain the best available personnel for positions of substantial responsibility, provide additional incentive to employees, directors and consultants and promote the success of our business. Our board of directors believes that our company's long-term success depends upon our ability to attract and retain superior individuals who, by virtue of their ability, experience and qualifications, make important contributions to our business.
Options. The terms of an option will be stated in an award agreement and determined by the administrator. The exercise price of incentive stock options must be at least equal to the fair market value of our ordinary shares on the date of grant. However, the exercise price of all other options may be determined by the administrator. The term of an incentive stock option may not exceed ten years, except that with respect to any participant who owns 10% of the voting power of all classes of our outstanding shares as of the grant date, the term must not exceed five years and the exercise price must equal at least 110% of the fair market value on the grant date. After termination of an employee, director or consultant, he or she may exercise his or her vested options for the period of time stated in the award agreement. Generally, if termination is due to death or disability, the option will remain exercisable for twelve months. In all other cases, the option will generally remain exercisable for sixty days. However, an option generally may not be exercised later than the expiration of its term.
Restricted Shares. Restricted share awards are ordinary shares that vest in accordance with terms and conditions established by the administrator and set forth in an award agreement. The administrator will determine the number of restricted shares granted to any employee and may impose whatever conditions to vesting it determines to be appropriate.
Restricted Share Units. Restricted share units are similar to awards of restricted shares, and are typically settled when the award vests or at some later date if the date of settlement is
105
Table of Contents
deferred. Until the restricted share units are settled and the awarded shares are delivered, no right to vote or receive dividends or any other rights as a shareholder or depositary receipt holder will exist with respect to the awarded shares.
Share Appreciation Rights. Share appreciation rights allow the recipient to receive the appreciation in the fair market value of our ordinary shares between the date of grant and the exercise date. The exercise price of share appreciation rights granted under our plan will be determined by the administrator. Share appreciation rights expire under the same rules that apply to options on the date as determined by the administrator.
Performance Units and Performance Shares. Performance units and performance shares are awards that will result in a payment to a participant only if performance goals established by the administrator are achieved or the awards otherwise vest. The administrator will establish organizational or individual performance goals in its discretion, which, depending on the extent to which they are met, will determine the number and the value of performance units and performance shares to be paid out to participants.
Amendment and Termination. Our 2011 Share Incentive Plan will automatically terminate in 2021, unless we terminate it sooner. Our board of directors has the authority to amend, alter, suspend or terminate the plan provided such action does not impair the rights of any participant with respect to any outstanding awards. Shareholder approval is required for any plan amendment to the extent necessary and desirable to comply with applicable laws.
We do not plan to make any awards under our 2011 Share Incentive Plan prior to the completion of this offering.
106
Table of Contents
Principal and selling shareholders
The following table sets forth information with respect to the beneficial ownership, in accordance with the rules and regulations of the SEC, of our ordinary shares, as of the date of this prospectus and as adjusted to reflect the sale of our ADSs in this offering by:
- •
- each of our directors and executive officers;
- •
- each person known to us to own beneficially more than 5% of our ordinary shares; and
- •
- each other selling shareholder.
| | | | | | | | | | | | | | | | |
| | |
| | Ordinary Shares
Beneficially Owned
Prior to
This Offering(1)(2)(3) | | Ordinary Shares
Being Sold in
This Offering | | Shares Beneficially
Owned After
This Offering(1)(2)(3) | |
|---|
| | Number
| | %
| | Number
| | %
| | Number
| | %
| |
|---|
| | |
Directors and Executive Officers: | | | | | | | | | | | | | | | | |
G. George Lu(4) | | 507,738 | | | 1.4 | | | | | | | | | | | |
Adrian Chan(5) | | 1,396,879 | | | 3.7 | | | | | | | | | | | |
Wing Chung Anders Cheung | | — | | | — | | | | | | | | | | | |
William John Sharp | | — | | | — | | | | | | | | | | | |
Donghui Wang | | — | | | — | | | | | | | | | | | |
Paul Weinewuth | | 2,389,731 | | | 6.4 | | | | | | | | | | | |
Raymond Grady | | 706,403 | | | 1.9 | | | | | | | | | | | |
All directors and executive officers as a group | | 5,000,751 | | | 13.4 | | | | | | | | | | | |
Principal and Selling Shareholders: | | | | | | | | | | | | | | | | |
2020 China Holdings, Ltd(6) | | 26,099,188 | | | 69.6 | | | | | | | | | | | |
Surfmax Investment Partners Limited(7) | | 12,571,915 | | | 33.5 | | | | | | | | | | | |
Rong Lu(8) | | 11,175,036 | | | 29.8 | | | | | | | | | | | |
Khazanah Nasional Berhad(9) | | 10,631,035 | | | 28.4 | | | | | | | | | | | |
Dalton Family Limited Partnership(10) | | 2,492,967 | | | 6.7 | | | | | | | | | | | |
SHK Asian Opportunities Fund, L.P.(11) | | 2,388,500 | | | 6.4 | | | | | | | | | | | |
Weinewuth Family Limited Partnership(12) | | 2,389,731 | | | 6.4 | | | | | | | | | | | |
Schmeltz Family Limited Partnership(13) | | 2,338,113 | | | 6.2 | | | | | | | | | | | |
Spear Holdings LLC(14) | | 2,338,112 | | | 6.2 | | | | | | | | | | | |
| | |
Notes:
(1) Beneficial ownership is determined in accordance with the rules of the SEC and includes the power to direct the voting or the disposition of the securities or to receive the economic benefit of ownership of the securities.
(2) For each person and entity included in this column, percentage ownership is calculated by dividing the number of shares beneficially owned by such person or entity by the sum of the number of shares outstanding and the number of shares such person or entity has the right to acquire through exchange of exchangeable bonds or notes within 60 days after the date of this prospectus. The total number of shares outstanding as of the date of this prospectus is 37,477,264. The total number of shares outstanding after the completion of this offering will be .
(3) Assumes no exercise of the underwriters' over-allotment option and no other change to the number of ADSs offered by the selling shareholders and us as set forth on the cover page of this prospectus.
(4) Represents 507,738 ordinary shares in our company transferable to Mr. Lu from China Holdings upon the exchange of the exchangeable notes in the principal amount of US$1.0 million held by Mr. Lu. Such notes shall be automatically exchanged into ordinary shares upon the completion of this offering.
(5) Represents Mr. Chan's 11.1% equity interest in Surfmax. Surfmax shall receive from China Holdings 12,571,915 ordinary shares in our company upon the completion of this offering pursuant to the automatic exchange of exchangeable notes in the principal amount of US$24.8 million held by Surfmax. See note (7) below.
(6) Represents ordinary shares held by China Holdings prior to this offering. Upon the completion of this offering, all the ordinary shares held by China Holdings will be transferred to the holders of the exchangeable securities issued by China Holdings. See also notes (4), (7), (9) and (11). The investment committee of China Holdings has the power to direct the voting and disposition of the securities beneficially owned by China Holdings. The investment committee consists of G. George Lu,
107
Table of Contents
William John Sharp and Ben Chan, who is a nominee appointed by Datai Bay. Adrian Chan and Louis Koo are each the nominal holders of 50% equity interest in China Holdings, but do not individually or collectively control China Holdings. The address of China Holdings is Walkers Corporate Services Limited, Walker House, 87 Mary Street, George Town, Grand Cayman KY1-9005, Cayman Islands.
(7) Represents 12,571,915 ordinary shares in our company transferable to Surfmax from China Holdings upon the completion of this offering pursuant to the automatic exchange of exchangeable notes in the principal amount of US$24.8 million held by Surfmax. Surfmax is a limited liability company incorporated in the British Virgin Islands. Rong Lu holds an 88.9% equity interest in and is the controlling person of Surfmax. Adrian Chan holds the remaining 11.1% equity interest in Surfmax. The address of Surfmax's registered office is P.O. Box 957, Offshore Incorporations Centre, Road Town, Tortola, British Virgin Islands.
(8) Represents Ms. Lu's 88.9% equity interest in Surfmax. Surfmax shall receive from China Holdings 12,571,915 ordinary shares in our company upon the completion of this offering pursuant to the automatic exchange of exchangeable notes in the principal amount of US$24.8 million held by Surfmax. See note (7) above.
(9) Represents 10,631,035 ordinary shares in our company transferable to Datai Bay, a 100% indirect subsidiary of Khazanah Nasional Berhad, from China Holdings upon the automatic exchange at the completion of this offering of exchangeable bonds in the principal amount of US$20.9 million held by Datai Bay. Khazanah Nasional Berhad is the strategic investment fund of the government of Malaysia entrusted to hold and manage the commercial assets of the government and to undertake strategic investments. Khazanah Nasional Berhad is involved in various sectors such as power, telecommunications, banking, automotive manufacture, airport management, infrastructure, property development, broadcasting, semiconductor, steel production, electronics, investment holding, technology and venture capital. Khazanah Nasional Berhad has a nine-member board comprising representatives from the public and private sectors. Prime Minister Mohd Najib Tun Abdul Razak is the Chairman of the Board. The address of Datai Bay's registered office is Equity Trust Company (Cayman) Ltd, 2/F, Compass Centre, PO Box 10338, Shedden Road, Grand Cayman KY1-1003, Cayman Islands. The address of Khazanah Nasional Berhad is Level 33, Tower 2, Petronas Twin Towers, Kuala Lumpur City Centre, 50088 Kuala Lumpur, Malaysia.
(10) Represents 2,492,967 ordinary shares held by Dalton Family Limited Partnership. Dalton Family Limited Partnership is controlled by Christopher Dalton, president and CEO of Acquity Group LLC. The address of Dalton Family Limited Partnership's registered office is 500 W. Madison Street, Suite 2200, Chicago, Illinois. These ordinary shares have been pledged to American Chartered Bank as security for a term loan.
(11) Represents 2,388,500 ordinary shares in our company transferable to SHK, a wholly owned subsidiary of SHK Asian Opportunities Fund, L.P., from China Holdings upon the automatic exchange at the completion of this offering of exchangeable bonds in the principal amount of US$4.7 million held by SHK. The general partner of SHK Asian Opportunities Fund, L.P. is SHK Private Equity Managers Ltd., an exempted company incorporated in the Cayman Islands, while Credit Suisse Administration Services (Cayman) Limited is the administrator of SHK. The investment manager of SHK Asian Opportunities Fund, L.P. is SHK Alpha Managers Ltd. The investment committee of SHK Alpha Managers Ltd. has the power to direct the voting and disposition of the securities held by SHK Asian Opportunities Fund, L.P. The investment committee of SHK Alpha Managers Ltd. consists of Mr. Rizal Wijono and Ms. Lysanda Lam. The registered office of SHK Asian Opportunities Fund, L.P. is Campbell Corporate Services Limited, 4/F, Scotia Centre, P.O. Box 268, George Town, Grand Cayman KY1-1104, Cayman Islands.
(12) Represents 2,389,731 ordinary shares held by Weinewuth Family Limited Partnership. Weinewuth Family Limited Partnership is controlled by Paul Weinewuth, our chief financial officer. The address of Weinewuth Family Limited Partnership's registered office is 500 W. Madison Street, Suite 2200, Chicago, Illinois. These ordinary shares have been pledged to American Chartered Bank as security for a term loan.
(13) Represents 2,338,113 ordinary shares held by Schmeltz Family Limited Partnership. Schmeltz Family Limited Partnership is controlled by Matthew Schmeltz, executive vice president of Acquity Group LLC. The address of Schmeltz Family Limited Partnership's registered office is 500 W. Madison Street, Suite 2200, Chicago, Illinois. These ordinary shares have been pledged to American Chartered Bank as security for a term loan.
(14) Represents 2,338,112 ordinary shares held by Spear Holdings LLC prior to the offering. Spear Holdings LLC is controlled by Scott Spear. The address of Spear Holdings LLC's registered office is 2525 Diamond Ridge Drive, Burlington, Iowa. These ordinary shares have been pledged to American Chartered Bank as security for a term loan.
As of the date of this prospectus, % of our outstanding ordinary shares are held by record holders in the United States.
None of our existing shareholders has voting rights that will differ from the voting rights of other shareholders after the closing of this offering. We are not aware of any arrangement that may, at a subsequent date, result in a change of control of our company.
108
Table of Contents
Related party transactions
Convertible bonds issued by GlobalGrowth and exchangeable bonds issued by China Holdings
As part of the funding arrangements for the acquisition of Acquity Group LLC, on December 21, 2007, our wholly owned subsidiary, GlobalGrowth, entered into bond subscription agreements with two independent third parties, Datai Bay and SHK, respectively. Convertible bonds in the aggregate amount of US$50.2 million were issued by GlobalGrowth in February 2008. Additional bonds were issued from August 2008 to April 2010, in the aggregate amount of US$2.1 million. The initial maturity of the bonds was in February 2010, with an option for further extension of up to two years. These bonds were subsequently cancelled, as described below.
On December 15, 2010, GlobalGrowth entered into a deed in respect of the convertible bonds issued by GlobalGrowth with China Holdings, Datai Bay and SHK. Under the terms of the deed, the convertible bonds were assigned from Datai Bay and SHK to our holding company China Holdings, together with all rights and benefits relating to each bond subscription agreement, in consideration of which China Holdings issued exchangeable bonds to each of Datai Bay and SHK. The convertible bonds issued by GlobalGrowth were subsequently cancelled by agreement between GlobalGrowth and China Holdings. In consideration for the cancellation of the convertible bonds, GlobalGrowth paid US$3.9 million to China Holdings and the excess amount of convertible bonds amounting to US$60.7 million was recorded as capital reserve of GlobalGrowth. The exchangeable bonds issued by China Holdings will be automatically exchanged upon the completion of this offering into ordinary shares in our company held by China Holdings.
As part of the deed of restructuring entered into on December 2010, the parties agreed that Datai Bay would redeem its outstanding bonds and the financing was to be provided by certain new investors in early 2011. Given the relatively short timeline for seeking investors and negotiating documentation for investments, China Holdings, Datai Bay and SHK determined that the new investors should subscribe for exchangeable securities on terms substantially similar to the bond subscription agreement entered into by Datai Bay and SHK. In February 2011, China Holdings partially redeemed exchangeable bonds which had been issued to Datai Bay in December 2010 in the principal amount of US$26.6 million, which redemption was financed by the existing cash reserves of China Holdings as well as the issue of exchangeable notes to G. George Lu and Surfmax, in the aggregate amount of US$25.8 million. This transaction was primarily coordinated on behalf of China Holdings by Adrian Chan and was subject to the parameters set by Datai Bay and SHK in the December 2010 agreement. Surfmax is a limited liability company incorporated in the British Virgin Islands and is indirectly owned by G. George Lu's sister and by one of our directors, Adrian Chan. The exchangeable notes issued by China Holdings will be automatically exchanged upon the completion of this offering into ordinary shares in our company held by China Holdings.
As of December 31, 2011, an aggregate amount of US$51.4 million of the exchangeable bonds and notes remain outstanding. There is no interest payable on the exchangeable bonds and notes if the initial public offering of our company is completed and all such bonds and notes are exchanged for our company's ordinary shares. In the event that our company's initial public
109
Table of Contents
offering does not take place, which may trigger certain redemption rights of the holders of such exchangeable bonds and notes, interest at the compounded rate of 5% will be payable by China Holdings.
The relative percentage ownership of our company into which the exchangeable securities are exchangeable upon the completion of this offering is calculated on the basis of the following formula:
A = The outstanding principal amount of the exchangeable securities exchangeable into 1% of post-IPO issued ordinary shares of our company
B = The percentage of public float in post-IPO issued ordinary shares of our company
Such percentage is calculated on a fully diluted basis.
As a result, upon the completion of this offering, the exchangeable securities shall be exchanged into 10,631,035, 2,388,500, 12,571,915 and 507,738 ordinary shares of our company and delivered to Datai Bay, SHK, Surfmax and G. George Lu, respectively.
Investment management agreement
As part of the funding arrangement for GlobalGrowth, Datai Bay and SHK requested that GlobalGrowth appoint an investment manager to provide professional investment management services in connection with GlobalGrowth's investments. An investment management agreement was entered into by Equity Partners and GlobalGrowth on February 21, 2008. Equity Partners is a limited liability company 49.9% owned by G. George Lu, our executive chairman and group chief executive, and 10.0% owned by Adrian Chan, our director and company secretary. As managing directors of Equity Partners, G. George Lu and Louis Koo have the power to direct the voting and disposition of the securities managed by Equity Partners. The investment management agreement substantially reflected the principal investment management terms contemplated in the bond subscription agreement entered into by GlobalGrowth, Datai Bay and SHK on December 21, 2007. Adrian Chan represented GlobalGrowth in negotiating the investment management agreement. Pursuant to the investment management agreement, Equity Partners was appointed as the exclusive investment manager over the investments of GlobalGrowth. The purpose of the appointment is to maximize the return on investment in Acquity Group LLC through the investment management of Equity Partners. The management fees paid to Equity Partners in the years ended December 31, 2008, 2009 and 2010 were US$1.0 million, US$1.1 million and US$1.1 million, respectively. No management fee was paid to Equity Partners in 2011. Pursuant to the deed in respect of the convertible bonds issued by GlobalGrowth, China Holdings assumed all the obligations of GlobalGrowth under the investment management agreement. Equity Partners may be entitled to receive from Datai Bay and SHK a performance fee under the investment management agreement in the form of ordinary shares in our company, if and when Datai Bay and SHK achieve certain minimum returns on their initial investment. It is expected that such performance fee in aggregate will not exceed 20% of the ordinary shares held by Datai Bay and SHK after the completion of this offering.
110
Table of Contents
Loan Guarantee for Huaren Kudong Commercial Trading Co., Ltd.
Pursuant to a loan guarantee agreement dated December 2011, we provided a loan guarantee to Shanghai Pudong Development Bank for the bank borrowings of our indirect subsidiary, Huaren Kudong Commercial Trading Co., Ltd., with a maximum borrowing amount of RMB 14.0 million.
Loans to certain senior management of Acquity Group LLC
On January 18, 2011, we provided promissory notes in the principal amounts of US$81,000 and US$14,000 to Matthew Schmeltz and Raymond Grady, respectively. The interest rate borne by the promissory notes shall be the daily prime rate published by The Wall Street Journal on such date less 0.5%. In no event shall the interest rate be less than a per annum rate of interest equal to 3.75%.
On April 14, 2011, we provided promissory notes in the principal amounts of US$3,549,042, US$74,799, US$83,092, US$43,233, US$125,778 and US$221,939 to Acquity Holdings LLC, an entity controlled by certain senior management members of Acquity Group LLC, Mark Joseph, James Newman, Jay Dettling, Andrew Peebler and Raymond Grady, respectively. The interest rate borne by the promissory notes shall be the daily prime rate published by The Wall Street Journal on such date less 0.5%. In no event shall the interest rate be less than a per annum rate of interest equal to 4.0%.
All the loans above are intended to fund the payment of certain tax liabilities incurred by those senior management personnel of Acquity Group LLC. All of such loans were fully repaid on October 14, 2011. On the same date, those senior management personnel (except for James Newman) each received term loans from American Chartered Bank to fund the payment of their respective outstanding tax liabilities. As a condition precedent to the term loan, those senior management personnel pledged the ordinary shares in our company held by them to American Chartered Bank.
111
Table of Contents
Description of share capital
We are a Cayman Islands exempted company and our affairs are governed by our memorandum and articles of association, as amended and restated from time to time, and the Cayman Islands Companies Law, which is referred to as the Companies Law below.
As of the date of this prospectus, our authorized share capital is US$50,000 and consists of 500,000,000 ordinary shares, with a par value of US$0.0001 each. As of the date of this prospectus, there were 37,477,264 ordinary shares issued and outstanding.
We have adopted the amended and restated memorandum and articles of association that will take effect upon the closing of this offering to replace our current memorandum and articles of association in their entirety. The following is a summary of the material provisions of our post-offering memorandum and articles of association and the Companies Law as they relate to the material terms of our ordinary shares.
Ordinary shares
General
All of our outstanding ordinary shares are fully paid and non-assessable. Certificates representing the ordinary shares are issued in registered form. Shareholders who are nonresidents of the Cayman Islands may freely hold and vote their shares.
Dividends
The holders of our ordinary shares are entitled to such dividends as may be declared by our board of directors subject to the Companies Law and our articles of association.
Voting rights
Each ordinary share is entitled to one vote on all matters upon which the ordinary shares are entitled to vote. Voting at any shareholders' meeting is by show of hands unless a poll is demanded. A poll may be demanded by our chairman or any shareholder.
A quorum required for a meeting of shareholders consists of shareholders who hold at least one-third of the issued voting share capital at the meeting present in person or by proxy or, if a corporation or other non-natural person, by its duly authorized representative. Although not required by the Companies Law, we expect to hold annual shareholders' meetings as required by NYSE and such meetings may be convened by our board of directors on its own initiative or upon a request to the directors by shareholders holding in aggregate at least one-third of our voting share capital. Advance notice of at least 21 calendar days is required for the convening of our annual general meeting and other shareholders' meetings.
An ordinary resolution to be passed by the shareholders requires the affirmative vote of a simple majority of the votes attaching to the ordinary shares cast in a general meeting, while a special resolution requires the affirmative vote of no less than two-thirds of the votes cast attaching to the ordinary shares. A special resolution is required for important matters, including reducing the amount of our share capital, removing a director before the expiration of his or her term, amending the memorandum or articles of association, and changing the corporate name. Holders of the ordinary shares may effect certain changes by ordinary resolution, including increasing the amount of our authorized share capital, consolidating and
112
Table of Contents
dividing all or any of our share capital into shares of larger amount than our existing share capital, and canceling any shares.
Transfer of shares
Subject to the restrictions of our memorandum and articles of association, as applicable, a shareholder may transfer all or any of his or her ordinary shares by an instrument of transfer in writing and in the usual or common form or any other form approved by our board.
Our directors may, in its sole discretion, decline to register any transfer of any ordinary share unless (a) the instrument of transfer is lodged with us, accompanied by the certificate for the ordinary shares to which it relates and such other evidence as our board of directors may reasonably require to show the right of the transferor to make the transfer; (b) the instrument of transfer is in respect of only one class of ordinary shares; (c) the instrument of transfer is properly stamped, if required; (d) in the case of a transfer to joint holders, the number of joint holders to whom the ordinary share is to be transferred does not exceed four; or (e) the shares conceded are fully paid and free of any lien in favor of us.
If our directors refuse to register a transfer they must, within two months after the date on which the instrument of transfer was lodged, send to each of the transferor and the transferee notice of such refusal. The registration of transfers may, on 14 calendar days' notice being given by advertisement in such one or more newspapers or by electronic means, be suspended and our register of members closed at such times and for such periods as our board of directors may from time to time determine. However, the registration of transfers may not be suspended, and the register may not be closed, for more than 30 calendar days in any year.
Liquidation
On a return of capital on winding up or otherwise (other than on conversion, redemption or purchase of shares), assets available for distribution among the holders of ordinary shares must be distributed among the holders of the ordinary shares on a pro rata basis. If our assets available for distribution are insufficient to repay all of the paid-up capital, the assets will be distributed so that the losses are borne by our shareholders proportionately.
Calls on shares and forfeiture of shares
Our board of directors may from time to time make calls upon shareholders for any amounts unpaid on their shares in a notice served to such shareholders at least 14 days prior to the specified time and place of payment. The shares that have been called upon and remain unpaid on the specified time are subject to forfeiture.
Redemption of shares
Subject to the provisions of the Companies Law, we may issue shares on terms that are subject to redemption, at our option or at the option of the holders, on such terms and in such manner as may be determined by our board, before the issue of such shares.
Variation of rights of shares
All or any of the special rights attached to any class of shares may, subject to the provisions of the Companies Law, be varied either with the consent in writing of the holders of not less than two-thirds of the issued shares of the relevant class or with the sanction of a resolution passed
113
Table of Contents
at a separate meeting of the holders of the shares of such class by a majority of two-thirds of the votes cast at such a meeting.
Inspection of books and records
Holders of our ordinary shares will have no general right under Cayman Islands law to inspect or obtain copies of our register of members or our corporate records. However, we will provide our shareholders with annual audited financial statements. See "Where you can find additional information".
History of Securities Issuances
Ordinary Shares
On August 12, 2010, we issued 1 ordinary share of par value US$0.10 to Walkers Nominees Limited.
On August 13, 2010, Walkers Nominees Limited transferred the 1 ordinary share held by it to China Holdings.
On December 20, 2010, pursuant to the sole shareholder resolution dated December 20, 2010, the 1 ordinary share held by China Holdings was sub-divided into 1,000 ordinary shares of par value US$0.0001 each. We issued an additional 26,098,188 ordinary shares to China Holdings, pursuant to directors resolutions dated December 20, 2010.
On December 24, 2010, we allotted 14,958, 254,315, 281,209, 23,484, 9,558,923, 124,659, 152,032, 19,715, 706,403, 18,009, 224,369 ordinary shares to Rick Nash, James Newman, Andrew Peebler, Todd Schwarz, Acquity Holdings, L.L.C., Jonathan Borg-Breen, Jay Dettling, Kevin Doohan, Raymond Grady, Christopher Hauca, Mark Joseph, respectively, in consideration of those unit holders agreeing to transfer all their respective units in the capital of Acquity Group LLC to us.
Convertible/Exchangeable Securities
In February 2008, GlobalGrowth issued convertible bonds in the aggregate amount of US$50.2 million to two financial investors, Datai Bay and SHK. Additional bonds were issued from August 2008 to April 2010 in the aggregate amount of US$2.1 million.
On December 15, 2010, pursuant to a deed in respect of the convertible bonds issued by GlobalGrowth, the convertible bonds issued by GlobalGrowth were assigned by Datai Bay and SHK to China Holdings, in consideration of which China Holdings issued exchangeable bonds, to each of Datai Bay and SHK. The convertible bonds issued by GlobalGrowth were subsequently cancelled. 2020 China Holdings, Ltd. partially redeemed the exchangeable bonds it issued to Datai Bay in the principal amount of US$26.6 million, which redemption was financed by the existing cash reserves of China Holdings as well as the issue of exchangeable notes, in the aggregate amount of US$25.8 million, to two parties, namely, Surfmax and G. George Lu, our executive chairman and group chief executive. This partial redemption of the exchangeable bonds and issuance of exchangeable notes were completed in February 2011.
114
Table of Contents
Exempted Company
We are an exempted company with limited liability under the Companies Law of the Cayman Islands. The Companies Law distinguishes between ordinary resident companies and exempted companies. Any company that is registered in the Cayman Islands but conducts business mainly outside of the Cayman Islands may apply to be registered as an exempted company. The requirements for an exempted company are essentially the same as for an ordinary company except for the exemptions and privileges listed below:
- •
- annual reporting requirements are minimal and consist mainly of a statement that the company has conducted its operations mainly outside of the Cayman Islands and has complied with the provisions of the Companies Law;
- •
- an exempted company's register of members is not open to inspection;
- •
- an exempted company does not have to hold an annual general meeting;
- •
- an exempted company may issue negotiable or bearer shares or shares with no par value;
- •
- an exempted company may obtain an undertaking against the imposition of any future taxation (such undertakings are usually given for 20 years in the first instance);
- •
- an exempted company may register by way of continuation in another jurisdiction and be deregistered in the Cayman Islands;
- •
- an exempted company may register as a limited duration company; and
- •
- an exempted company may register as a segregated portfolio company.
Differences in corporate law
The Companies Law is modeled after that of England and Wales but does not follow recent statutory enactments in England. In addition, the Companies Law differs from laws applicable to Delaware corporations and their shareholders. Set forth below is a summary of the significant differences between the provisions of the Companies Law applicable to us and the laws applicable to Delaware corporations and their shareholders.
Mergers and similar arrangements
The Companies Law permits mergers and consolidations between Cayman Islands companies and between Cayman Islands companies and non-Cayman Islands companies. For these purposes:
- •
- a "merger" means the merging of two or more constituent companies and the vesting of their undertaking, property and liabilities in one of such companies as the surviving company; and
- •
- a "consolidation" means the combination of two or more constituent companies into a consolidated company and the vesting of the undertaking, property and liabilities of such companies to the consolidated company.
115
Table of Contents
In order to effect a merger or consolidation, the directors of each constituent company must approve a written plan of merger or consolidation, which must then be authorized by:
- •
- a special resolution of the shareholders of each constituent company; and
- •
- such other authorization, if any, as may be specified in such constituent company's articles of association.
The plan of merger or consolidation must be filed with the Registrar of Companies together with a declaration as to the solvency of the consolidated or surviving company, a list of the assets and liabilities of each constituent company and an undertaking that a copy of the certificate of merger or consolidation will be given to the members and creditors of each constituent company and that notification of the merger and consolidation will be published in the Cayman Islands Gazette. Dissenting shareholders have the right to be paid the fair value of their shares if they follow the required procedures, subject to certain exceptions. The fair value of the shares will be determined by the Cayman Islands court if it cannot be agreed among the parties. Court approval is not required for a merger or consolidation effected in compliance with these statutory procedures.
In addition, there are statutory provisions that facilitate the reconstruction and amalgamation of companies, provided that the arrangement is approved by a majority in number of each class of shareholders and creditors with whom the arrangement is to be made, and who must in addition represent three-fourths in value of each such class of shareholders or creditors, as the case may be, that are present and voting either in person or by proxy at a meeting, or meetings, convened for that purpose. The convening of the meetings and subsequently the arrangement must be sanctioned by the Grand Court of the Cayman Islands.
While a dissenting shareholder has the right to express to the court the view that the transaction ought not to be approved, the court can be expected to approve the arrangement if it determines that:
- •
- the statutory provisions as to the required majority vote have been met;
- •
- the shareholders have been fairly represented at the meeting in question;
- •
- the arrangement is such that a businessman would reasonably approve; and
- •
- the arrangement is not one that would more properly be sanctioned under some other provision of the Companies Law.
When a take-over offer is made and accepted by holders of not less than 90% of the shares within four months, the offerer may, within a two-month period conversing on the expiration of such four months period, require the holders of the remaining shares to transfer such shares on the terms of the offer. An objection can be made to the Grand Court of the Cayman Islands but this is unlikely to succeed unless there is evidence of fraud, bad faith or collusion.
If the arrangement and reconstruction is thus approved, the dissenting shareholder would have no rights comparable to appraisal rights, which would otherwise ordinarily be available to dissenting shareholders of United States corporations, providing rights to receive payment in cash for the judicially determined value of the shares.
116
Table of Contents
Shareholder suits
The Cayman Islands courts can be expected to follow English case law precedents. The Cayman Islands courts have applied and followed common law principles that permit a minority shareholder to commence a class action against the company or a derivative action in the name of the company to challenge (1) an act that is outside the company's corporate powers or that is illegal, (2) an act constituting a fraud against the minority shareholders where the wrongdoers are themselves in control of the company, and (3) an action requiring a resolution passed by a qualified or special majority that has not been obtained.
Directors' fiduciary duties
Under Delaware corporate law, a director of a Delaware corporation has a fiduciary duty to the corporation and its shareholders. This duty has two components, the duty of care and the duty of loyalty. The duty of care requires that a director act in good faith, with the care that an ordinarily prudent person would exercise under similar circumstances. Under this duty, a director must inform himself of, and disclose to shareholders, all material information reasonably available regarding a significant transaction. The duty of loyalty requires that a director must act in a manner he or she reasonably believes to be in the best interests of the corporation. A director must not use his or her corporate position for personal gain or advantage. This duty prohibits self-dealing by a director and mandates that the best interests of the corporation and its shareholders take precedence over any interest possessed by a director, officer or controlling shareholder and not shared by the shareholders generally. In general, actions of a director are presumed to have been made on an informed basis, in good faith and in the honest belief that the action taken was in the best interests of the corporation. However, this presumption may be rebutted by evidence of a breach of one of the fiduciary duties. Should such evidence be presented concerning a transaction by a director, the director must prove the procedural fairness of the transaction and that the transaction was of fair value to the corporation.
As a matter of Cayman Islands law, a director of a Cayman Islands company is in the position of a fiduciary with respect to the company, and therefore it is considered that he or she owes the following duties to the company—a duty to act bona fide in the best interests of the company, a duty not to make a profit out of his or her position as director (unless the company permits him or her to do so) and a duty not to put himself or herself in a position where the interests of the company conflict with his or her personal interests or his or her duty to a third party. A director of a Cayman Islands company owes to the company a duty to act with skill and care. It was previously considered that a director need not exhibit in the performance of his or her duties a greater degree of skill than may reasonably be expected from a person of his or her knowledge and experience. However, there are indications that the courts are moving towards an objective standard with regard to the required skill and care.
Under our post-offering memorandum and articles of association, directors who are in any way, whether directly or indirectly, interested in a contract or proposed contract with our company must declare the nature of their interest at a meeting of the board of directors. Following such declaration, a director may vote in respect of any contract or proposed contract notwithstanding his interest.
117
Table of Contents
Shareholder action by written resolution
Under the Delaware General Corporation Law, a corporation may eliminate the right of shareholders to act by written consent by amendment to its certificate of incorporation. Under Cayman Islands law, a company may eliminate the ability of shareholders to approve corporate matters by way of written resolution signed by or on behalf of each shareholder who would have been entitled to vote on such matters at a general meeting without a meeting being held by amending the articles of association. Our post-offering memorandum and articles of association allow shareholders to act by written resolutions.
Cumulative voting
Under the Delaware General Corporation Law, cumulative voting for elections of directors is not permitted unless the corporation's certificate of incorporation specifically provides for it. Cumulative voting potentially facilitates the representation of minority shareholders on a board of directors since it permits the minority shareholder to cast all the votes to which the shareholder is entitled for a single director, which increases the shareholder's voting power with respect to electing such director.
As permitted under Cayman Islands law, our post-offering memorandum and articles of association do not provide for cumulative voting.
Removal of directors
Under the Delaware General Corporation Law, a director of a corporation may be removed with the approval of a majority of the outstanding shares entitled to vote, unless the certificate of incorporation provides otherwise.
Under our post-offering memorandum and articles of association, directors can be removed by a special resolution of the shareholders.
Transactions with interested shareholders
The Delaware General Corporation Law contains a business combination statute applicable to Delaware public corporations whereby, unless the corporation has specifically elected not to be governed by such statute by amendment to its certificate of incorporation, it is prohibited from engaging in certain business combinations with an "interested shareholder" for three years following the date on which such person becomes an interested shareholder. An interested shareholder generally is one which owns or owned 15% or more of the target's outstanding voting shares within the past three years. This has the effect of limiting the ability of a potential acquirer to make a two-tiered bid for the target in which all shareholders would not be treated equally. The statute does not apply if, among other things, prior to the date on which such shareholder becomes an interested shareholder, the board of directors approves either the business combination or the transaction that resulted in the person becoming an interested shareholder. This encourages any potential acquirer of a Delaware public corporation to negotiate the terms of any acquisition transaction with the target's board of directors.
Cayman Islands law has no comparable statute. As a result, we cannot avail ourselves of the types of protections afforded by the Delaware business combination statute. However, although Cayman Islands law does not regulate transactions between a company and its significant shareholders, it does provide that such transactions entered into must be bona fide
118
Table of Contents
in the best interests of the company and not with the effect of perpetrating a fraud on the minority shareholders.
Dissolution and winding up
Under the Delaware General Corporation Law, unless the board of directors approves the proposal to dissolve, dissolution must be approved by shareholders holding 100% of the total voting power of the corporation. Only if the dissolution is initiated by the board of directors may it be approved by a simple majority of the corporation's outstanding shares. The Delaware General Corporation Law allows a Delaware corporation to include in its certificate of incorporation a supermajority voting requirement in connection with dissolutions initiated by the board of directors.
Under our post-offering memorandum and articles of association, if our company is wound up, the liquidator of our company may distribute the assets with the sanction of an ordinary resolution of the shareholders.
Variation of rights of shares
Under the Delaware General Corporation Law, a corporation may vary the rights of a class of shares with the approval of a majority of the outstanding shares of such class, unless the certificate of incorporation provides otherwise.
Under Cayman Islands law and our post-offering memorandum and articles of association, if our share capital is divided into more than one class of shares, we may vary the rights attached to any class with the consent in writing of the holders of not less than two-thirds of the issued shares of the relevant class or with the sanction of a resolution passed at a separate meeting of the holders of the shares of such class by a majority of two-thirds of the votes cast at such a meeting.
Amendment of governing documents
Under the Delaware General Corporation Law, a corporation's governing documents may be amended with the approval of a majority of the outstanding shares entitled to vote, unless the certificate of incorporation provides otherwise.
Our post-offering memorandum and articles of association may be amended by a special resolution of shareholders.
Inspection of books and records
Under the Delaware General Corporation Law, any shareholder of a corporation may for any proper purpose inspect or make copies of the corporation's stock ledger, list of shareholders and other books and records.
Holders of our shares will have no general right under Cayman Islands law to inspect or obtain copies of our register of members or our corporate records. However, we intend to provide our shareholders with annual reports containing audited financial statements.
Anti-takeover provisions in our memorandum and articles of association
Some provisions of our post-offering memorandum and articles of association may discourage, delay or prevent a change of control of our company or management that shareholders may
119
Table of Contents
consider favorable, including a provision that authorizes our board of directors to issue preference shares in one or more series and to designate the price, rights, preferences, privileges and restrictions of such preference shares without any further vote or action by our shareholders.
Such shares could be issued quickly with terms calculated to delay or prevent a change in control of our company or make removal of management more difficult. If our board of directors decides to issue these preference shares, the price of our ADSs may fall and the voting and other rights of the holders of our ordinary shares and ADSs may be materially and adversely affected.
However, under Cayman Islands law, our directors may only exercise the rights and powers granted to them under our memorandum and articles of association for a proper purpose and for what they believe in good faith to be in the best interests of our company.
Rights of non-resident or foreign shareholders
There are no limitations imposed by foreign law or by our post-offering memorandum and articles of association on the rights of non-resident or foreign shareholders to hold or exercise voting rights on our shares. In addition, there are no provisions in our post-offering memorandum and articles of association governing the ownership threshold above which shareholder ownership must be disclosed.
Registration Rights
Prior to this offering, we intend to enter into a registration rights agreement with China Holdings, Equity Partners, G. George Lu, Datai Bay, SHK and Surfmax, pursuant to which we will grant certain registration rights to holders of our registrable securities, which include our ordinary shares to be received by these holders in exchange for exchangeable bonds and notes upon the completion of this offering. Set forth below is a description of the registration rights to be granted under the agreement.
Demand Registration Rights. Holders of at least 25% of our registrable securities, or Equity Partners, shall have the right to demand in writing, at any time after one hundred eighty days following the completion of this offering, that we file a registration statement to register their registrable securities. We are not obligated to effect more than three demand registrations. We have the right to defer filing of a registration statement for up to 60 days in certain cirsumstances, but we cannot exercise the deferral right more than once in any twelve-month period and cannot register any other shares during such 60-day period. Further, the underwriters of any underwritten offering may in good faith reduce on a pro rata basis the number of shares having registration rights to be included in the registration statement, subject to certain limitations.
Form S-3 or Form F-3 Registration Rights. Holders of at least 25% of our registrable securities, or Equity Partners, shall have the right to request that we file a registration statement on Form F-3 or Form S-3. We, however, are not obligated to effect such registration if (i) Form S-3 or Form F-3 is not available for such offering by the holders of registrable securities, (ii) the aggregate anticipated price of such offering is less than US$1,000,000, (iii) we have, within the six-month period preceding the date of such request, already effected a registration where the holders of registrable securities have piggyback rights, (iv) we have, within the 12-month
120
Table of Contents
period preceding the date of such request, already effected one registration, or (v) in any jurisdiction we would be required to qualify to do business or to execute a consent to service or process in effecting such registration. We may defer filing of a registration statement on Form F-3 or Form S-3 no more than once during any twelve-month period for up to 60 days in certain circumstances, provided that we cannot register any other shares during such 60-day period. Further, the underwriters of any underwritten offering may in good faith reduce on a pro rata basis the number of shares having registration rights to be included in the registration statement, subject to certain limitations.
Piggyback Registration Rights. If we propose to file a registration statement for a public offering of our securities other than pursuant to a demand registration right or a Form S-3 or Form F-3 registration statement, then we must offer holders of registrable securities an opportunity to include in this registration all or any part of their registrable securities. The underwriters of any underwritten offering may in good faith allocate the shares to be included in the registration statement first to us, and second to each of the requesting holders of registrable securities on a pro rata basis, as long as (i) the number of registrable securities included in an such registration is not reduced below 25% of the aggregate number of shares of registrable securities for which inclusion has been requested, and (ii) all shares that are not registrable securities and are held by any other person are first excluded.
Expenses of Registration. All registration expenses incurred in connection with any demand, piggyback or Form S-3/F-3 registration shall be borne by the participating shareholders in proportion to the shares included in such registration.
121
Table of Contents
Description of American depositary shares
American depositary receipts
JPMorgan Chase Bank, N.A., as depositary will issue the ADSs which you will be entitled to receive in this offering. Each ADS will represent an ownership interest in ordinary shares which we will deposit with the custodian, as agent of the depositary, under the deposit agreement among ourselves, the depositary and yourself as an ADR holder. In the future, each ADS will also represent any securities, cash or other property deposited with the depositary but which they have not distributed directly to you. Unless specifically requested by you, all ADSs will be issued on the books of our depositary in book-entry form and periodic statements will be mailed to you which reflect your ownership interest in such ADSs. In our description, references to American depositary receipts or ADRs shall include the statements you will receive which reflect your ownership of ADSs.
The depositary's office is located at 1 Chase Manhattan Plaza, Floor 21, New York, NY, 10005-1401.
You may hold ADSs either directly or indirectly through your broker or other financial institution. If you hold ADSs directly, by having an ADS registered in your name on the books of the depositary, you are an ADR holder. This description assumes you hold your ADSs directly. If you hold the ADSs through your broker or financial institution nominee, you must rely on the procedures of such broker or financial institution to assert the rights of an ADR holder described in this section. You should consult with your broker or financial institution to find out what those procedures are.
As an ADR holder, we will not treat you as a shareholder of ours and you will not have any shareholder rights. Cayman Island law governs shareholder rights. Because the depositary or its nominee will be the shareholder of record for the shares represented by all outstanding ADSs, shareholder rights rest with such record holder. Your rights are those of an ADR holder. Such rights derive from the terms of the deposit agreement to be entered into among us, the depositary and all registered holders from time to time of ADSs issued under the deposit agreement. The obligations of the depositary and its agents are also set out in the deposit agreement. Because the depositary or its nominee will actually be the registered owner of the shares, you must rely on it to exercise the rights of a shareholder on your behalf. The deposit agreement and the ADSs are governed by New York law.
The following is a summary of what we believe to be the material terms of the deposit agreement. Notwithstanding this, because it is a summary, it may not contain all the information that you may otherwise deem important. For more complete information, you should read the entire deposit agreement and the form of ADR which contains the terms of your ADSs. You can read a copy of the deposit agreement which is filed as an exhibit to the registration statement of which this prospectus forms a part. You may also obtain a copy of the deposit agreement at the SEC's Public Reference Room which is located at 100 F Street, NE, Washington, DC 20549. You may obtain information on the operation of the Public Reference Room by calling the SEC at 1-800-732-0330. You may also find the registration statement and the attached deposit agreement on the SEC's website at http://www.sec.gov.
122
Table of Contents
Share dividends and other distributions
How will I receive dividends and other distributions on the shares underlying my ADSs?
We may make various types of distributions with respect to our securities. The depositary has agreed that, to the extent practicable, it will pay to you the cash dividends or other distributions it or the custodian receives on shares or other deposited securities, after converting any cash received into U.S. dollars and, in all cases, making any necessary deductions provided for in the deposit agreement. You will receive these distributions in proportion to the number of underlying securities that your ADSs represent.
Except as stated below, the depositary will deliver such distributions to ADR holders in proportion to their interests in the following manner:
- •
- Cash. The depositary will distribute any U.S. dollars available to it resulting from a cash dividend or other cash distribution or the net proceeds of sales of any other distribution or portion thereof (to the extent applicable), on an averaged or other practicable basis, subject to (i) appropriate adjustments for taxes withheld, (ii) such distribution being impermissible or impracticable with respect to certain registered ADR holders, and (iii) deduction of the depositary's expenses in (1) converting any foreign currency to U.S. dollars to the extent that it determines that such conversion may be made on a reasonable basis, (2) transferring foreign currency or U.S. dollars to the United States by such means as the depositary may determine to the extent that it determines that such transfer may be made on a reasonable basis, (3) obtaining any approval or license of any governmental authority required for such conversion or transfer, which is obtainable at a reasonable cost and within a reasonable time and (4) making any sale by public or private means in any commercially reasonable manner. If exchange rates fluctuate during a time when the depositary cannot convert a foreign currency, you may lose some or all of the value of the distribution.
- •
- Shares. In the case of a distribution in shares, the depositary will issue additional ADRs to evidence the number of ADSs representing such shares. Only whole ADSs will be issued. Any shares which would result in fractional ADSs will be sold and the net proceeds will be distributed in the same manner as cash to the ADR holders entitled thereto.
- •
- Rights to receive additional shares. In the case of a distribution of rights to subscribe for additional shares or other rights, if we provide evidence satisfactory to the depositary that it may lawfully distribute such rights, the depositary will distribute warrants or other instruments in the discretion of the depositary representing such rights. However, if we do not furnish such evidence, the depositary may:
- •
- sell such rights if practicable and distribute the net proceeds in the same manner as cash to the ADR holders entitled thereto; or
- •
- if it is not practicable to sell such rights, do nothing and allow such rights to lapse, in which case ADR holders will receive nothing.
We have no obligation to file a registration statement under the Securities Act in order to make any rights available to ADR holders.
- •
- Other Distributions. In the case of a distribution of securities or property other than those described above, the depositary may either (i) distribute such securities or property in any
123
Table of Contents
manner it deems equitable and practicable or (ii) to the extent the depositary deems distribution of such securities or property not to be equitable and practicable, sell such securities or property and distribute any net proceeds in the same way it distributes cash.
If the depositary determines that any distribution described above is not practicable with respect to any specific registered ADR holder, the depositary may choose any method of distribution that it deems practicable for such ADR holder, including the distribution of foreign currency, securities or property, or it may retain such items, without paying interest on or investing them, on behalf of the ADR holder as deposited securities, in which case the ADSs will also represent the retained items.
Any U.S. dollars will be distributed by checks drawn on a bank in the United States for whole dollars and cents. Fractional cents will be withheld without liability and dealt with by the depositary in accordance with its then current practices.
The depositary is not responsible if it decides that it is unlawful or impractical to make a distribution available to any ADR holders.
There can be no assurance that the depositary will be able to convert any currency at a specified exchange rate or sell any property, rights, shares or other securities at a specified price, nor that any of such transactions can be completed within a specified time period.
Deposit, withdrawal and cancellation
How does the depositary issue ADSs?
The depositary will issue ADSs if you or your broker deposit shares or evidence of rights to receive shares with the custodian and pay the fees and expenses owing to the depositary in connection with such issuance. In the case of the ADSs to be issued under this prospectus, we will arrange with the underwriters named herein to deposit such shares.
Shares deposited in the future with the custodian must be accompanied by certain delivery documentation and shall, at the time of such deposit, be registered in the name of JPMorgan Chase Bank, N.A., as depositary for the benefit of holders of ADRs or in such other name as the depositary shall direct.
The custodian will hold all deposited shares (including those being deposited by or on our behalf in connection with the offering to which this prospectus relates) for the account of the depositary. ADR holders thus have no direct ownership interest in the shares and only have such rights as are contained in the deposit agreement. The custodian will also hold any additional securities, property and cash received on or in substitution for the deposited shares. The deposited shares and any such additional items are referred to as "deposited securities".
Upon each deposit of shares, receipt of related delivery documentation and compliance with the other provisions of the deposit agreement, including the payment of the fees and charges of the depositary and any taxes or other fees or charges owing, the depositary will issue an ADR or ADRs in the name or upon the order of the person entitled thereto evidencing the number of ADSs to which such person is entitled. All of the ADSs issued will, unless specifically requested to the contrary, be part of the depositary's direct registration system, and a registered holder will receive periodic statements from the depositary which will show the number of ADSs registered in such holder's name. An ADR holder can request that the ADSs
124
Table of Contents
not be held through the depositary's direct registration system and that a certificated ADR be issued.
How do ADR holders cancel an ADS and obtain deposited securities?
When you turn in your ADR certificate at the depositary's office, or when you provide proper instructions and documentation in the case of direct registration ADSs, the depositary will, upon payment of certain applicable fees, charges and taxes, deliver the underlying shares to you or upon your written order. At your risk, expense and request, the depositary may deliver deposited securities at such other place as you may request.
The depositary may only restrict the withdrawal of deposited securities in connection with:
- •
- temporary delays caused by closing our transfer books or those of the depositary or the deposit of shares in connection with voting at a shareholders' meeting, or the payment of dividends;
- •
- the payment of fees, taxes and similar charges; or
- •
- compliance with any U.S. or foreign laws or governmental regulations relating to the ADRs or to the withdrawal of deposited securities.
This right of withdrawal may not be limited by any other provision of the deposit agreement.
Record dates
The depositary may, after consultation with us if practicable, fix record dates for the determination of the registered ADR holders who will be entitled (or obligated, as the case may be):
- •
- to receive any distribution on or in respect of shares,
- •
- to give instructions for the exercise of voting rights at a meeting of holders of shares, or
- •
- to pay the fee assessed by the depositary for administration of the ADR program and for any expenses as provided for in the ADR,
- •
- to receive any notice or to act in respect of other matters
all subject to the provisions of the deposit agreement.
Voting rights
How do I vote?
If you are an ADR holder and the depositary asks you to provide it with voting instructions, you may instruct the depositary how to exercise the voting rights for the shares which underlie your ADSs. As soon as practicable after receiving notice of any meeting or solicitation of consents or proxies from us, the depositary will distribute to the registered ADR holders a notice stating such information as is contained in the voting materials received by the depositary and describing how you may instruct the depositary to exercise the voting rights for the shares which underlie your ADSs, including instructions for giving a discretionary proxy to a person designated by us. For instructions to be valid, the depositary must receive them in the
125
Table of Contents
manner and on or before the date specified. The depositary will try, as far as is practical, subject to the provisions of and governing the underlying shares or other deposited securities, to vote or to have its agents vote the shares or other deposited securities as you instruct. The depositary will only vote or attempt to vote as you instruct. The depositary will not itself exercise any voting discretion. Furthermore, neither the depositary nor its agents are responsible for any failure to carry out any voting instructions, for the manner in which any vote is cast or for the effect of any vote. Notwithstanding anything contained in the deposit agreement or any ADR, the depositary may, to the extent not prohibited by law or regulations, or by the requirements of the stock exchange on which the ADSs are listed, in lieu of distribution of the materials provided to the depositary in connection with any meeting of, or solicitation of consents or proxies from, holders of deposited securities, distribute to the registered holders of ADRs a notice that provides such holders with, or otherwise publicizes to such holders, instructions on how to retrieve such materials or receive such materials upon request (i.e., by reference to a website containing the materials for retrieval or a contact for requesting copies of the materials).
We have advised the depositary that under the Cayman Islands law and our constituent documents, each as in effect as of the date of the deposit agreement, voting at any meeting of shareholders is by show of hands unless a poll is (before or on the declaration of the results of the show of hands) demanded. In the event that voting on any resolution or matter is conducted on a show of hands basis in accordance with our constituent documents, the depositary will refrain from voting and the voting instructions (or the deemed voting instructions, as set out above) received by the depositary from holders shall lapse. The depositary will not demand a poll or join in demanding a poll, whether or not requested to do so by holders of ADSs. There is no guarantee that you will receive voting materials in time to instruct the depositary to vote and it is possible that you, or persons who hold their ADSs through brokers, dealers or other third parties, will not have the opportunity to exercise a right to vote.
Reports and other communications
Will ADR holders be able to view our reports?
The depositary will make available for inspection by ADR holders at the offices of the depositary and the custodian the deposit agreement, the provisions of or governing deposited securities, and any written communications from us which are both received by the custodian or its nominee as a holder of deposited securities and made generally available to the holders of deposited securities.
Additionally, if we make any written communications generally available to holders of our shares, and we furnish copies thereof (or English translations or summaries) to the depositary, it will distribute the same to registered ADR holders.
Fees and expenses
What fees and expenses will I be responsible for paying?
The depositary may charge each person to whom ADSs are issued, including, without limitation, issuances against deposits of shares, issuances in respect of share distributions, rights
126
Table of Contents
and other distributions, issuances pursuant to a stock dividend or stock split declared by us or issuances pursuant to a merger, exchange of securities or any other transaction or event affecting the ADSs or deposited securities, and each person surrendering ADSs for withdrawal of deposited securities or whose ADRs are cancelled or reduced for any other reason, $5.00 for each 100 ADSs (or any portion thereof) issued, delivered, reduced, cancelled or surrendered, as the case may be. The depositary may sell (by public or private sale) sufficient securities and property received in respect of a share distribution, rights and/or other distribution prior to such deposit to pay such charge.
The following additional charges shall be incurred by the ADR holders, by any party depositing or withdrawing shares or by any party surrendering ADSs or to whom ADSs are issued (including, without limitation, issuance pursuant to a stock dividend or stock split declared by us or an exchange of stock regarding the ADRs or the deposited securities or a distribution of ADSs), whichever is applicable:
- •
- a fee of US$1.50 per ADR or ADRs for transfers of certificated or direct registration ADRs;
- •
- a fee of up to US$0.05 per ADS for any cash distribution made pursuant to the deposit agreement;
- •
- a fee of up to US$0.05 per ADS per calendar year (or portion thereof) for services performed by the depositary in administering the ADRs (which fee may be charged on a periodic basis during each calendar year and shall be assessed against holders of ADRs as of the record date or record dates set by the depositary during each calendar year and shall be payable in the manner described in the next succeeding provision);
- •
- reimbursement of such fees, charges and expenses as are incurred by the depositary and/or any of the depositary's agents (including, without limitation, the custodian and expenses incurred on behalf of holders in connection with compliance with foreign exchange control regulations or any law or regulation relating to foreign investment) in connection with the servicing of the shares or other deposited securities, the delivery of deposited securities or otherwise in connection with the depositary's or its custodian's compliance with applicable law, rule or regulation (which charge shall be assessed on a proportionate basis against holders as of the record date or dates set by the depositary and shall be payable at the sole discretion of the depositary by billing such holders or by deducting such charge from one or more cash dividends or other cash distributions);
- •
- a fee for the distribution of securities (or the sale of securities in connection with a distribution), such fee being in an amount equal to the US$0.05 per ADS issuance fee for the execution and delivery of ADSs which would have been charged as a result of the deposit of such securities (treating all such securities as if they were shares) but which securities or the net cash proceeds from the sale thereof are instead distributed by the depositary to those holders entitled thereto;
- •
- stock transfer or other taxes and other governmental charges;
- •
- cable, telex and facsimile transmission and delivery charges incurred at your request in connection with the deposit or delivery of shares;
- •
- transfer or registration fees for the registration of transfer of deposited securities on any applicable register in connection with the deposit or withdrawal of deposited securities; and
127
Table of Contents
- •
- expenses of the depositary in connection with the conversion of foreign currency into U.S. dollars.
We will pay all other charges and expenses of the depositary and any agent of the depositary (except the custodian) pursuant to agreements from time to time between us and the depositary. The charges described above may be amended from time to time by agreement between us and the depositary.
Our depositary has agreed to reimburse us for certain expenses we incur that are related to establishment and maintenance of the ADR program, including investor relations expenses and exchange application and listing fees. Neither the depositary nor we can determine the exact amount to be made available to us because (i) the number of ADSs that will be issued and outstanding, (ii) the level of fees to be charged to holders of ADSs and (iii) our reimbursable expenses related to the ADR program are not known at this time. The depositary collects its fees for issuance and cancellation of ADSs directly from investors depositing shares or surrendering ADSs for the purpose of withdrawal or from intermediaries acting for them. The depositary collects fees for making distributions to investors by deducting those fees from the amounts distributed or by selling a portion of distributable property to pay the fees. The depositary may collect its annual fee for depositary services by deduction from cash distributions, or by directly billing investors, or by charging the book-entry system accounts of participants acting for them. The depositary will generally set off the amounts owing from distributions made to holders of ADSs. If, however, no distribution exists and payment owing is not timely received by the depositary, the depositary may refuse to provide any further services to holders that have not paid those fees and expenses owing until such fees and expenses have been paid. At the discretion of the depositary, all fees and charges owing under the deposit agreement are due in advance and/or when declared owing by the depositary.
Payment of taxes
ADR holders must pay any tax or other governmental charge payable by the custodian or the depositary on any ADS or ADR, deposited security or distribution. If an ADR holder owes any tax or other governmental charge, the depositary may (i) deduct the amount thereof from any cash distributions, or (ii) sell deposited securities (by public or private sale) and deduct the amount owing from the net proceeds of such sale. In either case the ADR holder remains liable for any shortfall. Additionally, if any taxes or other governmental charges (including any penalties and/or interest) shall become payable by or on behalf of the custodian or the depositary with respect to any ADR, any deposited securities represented by the ADSs evidenced thereby or any distribution thereon, including, without limitation, if applicable, any Chinese Enterprise Income Tax owing if the Circular Guoshuifa [2009] No. 82 issued by the Chinese State Administration of Taxation (SAT) or any other circular, edict, order or ruling, as issued and as from time to time amended, is applied or otherwise, such tax or other governmental charge shall be paid by the holder thereof to the depositary and by holding or having held an ADR the holder and all prior holders thereof, jointly and severally, agree to indemnify, defend and save harmless each of the depositary and its agents in respect thereof. If any tax or governmental charge is unpaid, the depositary may also refuse to effect any registration, registration of transfer, split-up or combination of deposited securities or withdrawal of deposited securities until such payment is made. If any tax or governmental charge is required to be withheld on any cash distribution, the depositary may deduct the
128
Table of Contents
amount required to be withheld from any cash distribution or, in the case of a non-cash distribution, sell the distributed property or securities (by public or private sale) to pay such taxes and distribute any remaining net proceeds to the ADR holders entitled thereto.
By holding an ADR or an interest therein, you will be agreeing to indemnify us, the depositary, its custodian and any of our or their respective directors, employees, agents and affiliates against, and hold each of them harmless from, any claims by any governmental authority with respect to taxes, additions to tax, penalties or interest arising out of any refund of taxes, reduced rate of withholding at source or other tax benefit obtained.
Reclassifications, recapitalizations and mergers
If we take certain actions that affect the deposited securities, including (i) any change in par value, split-up, consolidation, cancellation or other reclassification of deposited securities or (ii) any distributions not made to holders of ADRs or (iii) any recapitalization, reorganization, merger, consolidation, liquidation, receivership, bankruptcy or sale of all or substantially all of our assets, then the depositary may choose to:
- •
- amend the form of ADR;
- •
- distribute additional or amended ADRs;
- •
- distribute cash, securities or other property it has received in connection with such actions;
- •
- sell any securities or property received and distribute the proceeds as cash; or
- •
- none of the above.
If the depositary does not choose any of the above options, any of the cash, securities or other property it receives will constitute part of the deposited securities and each ADS will then represent a proportionate interest in such property.
Amendment and termination
How may the deposit agreement be amended?
We may agree with the depositary to amend the deposit agreement and the ADSs without your consent for any reason. ADR holders must be given at least 30 days notice of any amendment that imposes or increases any fees or charges (other than stock transfer or other taxes and other governmental charges, transfer or registration fees, cable, telex or facsimile transmission costs, delivery costs or other such expenses), or otherwise prejudices any substantial existing right of ADR holders. Such notice need not describe in detail the specific amendments effectuated thereby, but must give ADR holders a means to access the text of such amendment. If an ADR holder continues to hold an ADR or ADRs after being so notified, such ADR holder is deemed to agree to such amendment and to be bound by the deposit agreement as so amended. Notwithstanding the foregoing, if any governmental body or regulatory body should adopt new laws, rules or regulations which would require amendment or supplement of the deposit agreement or the form of ADR to ensure compliance therewith, we and the depositary may amend or supplement the deposit agreement and the ADR at any time in accordance with such changed laws, rules or regulations, which amendment or supplement may take effect before a notice is given or within any other period of time as
129
Table of Contents
required for compliance. No amendment, however, will impair your right to surrender your ADSs and receive the underlying securities, except in order to comply with mandatory provisions of applicable law.
How may the deposit agreement be terminated?
The depositary may, and shall at our written direction, terminate the deposit agreement and the ADRs by mailing notice of such termination to the registered holders of ADRs at least 30 days prior to the date fixed in such notice for such termination; provided, however, if the depositary shall have (i) resigned as depositary under the deposit agreement, notice of such termination by the depositary shall not be provided to registered holders unless a successor depositary shall not be operating under the deposit agreement within 45 days of the date of such resignation, and (ii) been removed as depositary under the deposit agreement, notice of such termination by the depositary shall not be provided to registered holders of ADRs unless a successor depositary shall not be operating under the deposit agreement on the 90th day after our notice of removal was first provided to the depositary. After termination, the depositary's only responsibility will be (i) to deliver deposited securities to ADR holders who surrender their ADRs, and (ii) to hold or sell distributions received on deposited securities. As soon as practicable after the expiration of six months from the termination date, the depositary will sell the deposited securities which remain and hold the net proceeds of such sales (as long as it may lawfully do so), without liability for interest, in trust for the ADR holders who have not yet surrendered their ADRs. After making such sale, the depositary shall have no obligations except to account for such proceeds and other cash.
Limitations on obligations and liability to ADR holders
Limits on our obligations and the obligations of the depositary; limits on liability to ADR holders and holders of ADSs
Prior to the issue, registration, registration of transfer, split-up, combination, or cancellation of any ADRs, or the delivery of any distribution in respect thereof, and from time to time, we or the depositary or its custodian may require:
- •
- payment with respect thereto of (i) any stock transfer or other tax or other governmental charge, (ii) any stock transfer or registration fees in effect for the registration of transfers of shares or other deposited securities upon any applicable register and (iii) any applicable fees and expenses described in the deposit agreement;
- •
- the production of proof satisfactory to it of (i) the identity of any signatory and genuineness of any signature and (ii) such other information, including without limitation, information as to citizenship, residence, exchange control approval, beneficial ownership of any securities, compliance with applicable law, regulations, provisions of or governing deposited securities and terms of the deposit agreement and the ADRs, as it may deem necessary or proper; and
- •
- compliance with such regulations as the depositary may establish consistent with the deposit agreement.
The issuance of ADRs, the acceptance of deposits of shares, the registration, registration of transfer, split-up or combination of ADRs or the withdrawal of shares, may be suspended, generally or in particular instances, when the ADR register or any register for deposited
130
Table of Contents
securities is closed or when any such action is deemed advisable by the depositary; provided that the ability to withdraw shares may only be limited under the following circumstances: (i) temporary delays caused by closing transfer books of the depositary or our transfer books or the deposit of shares in connection with voting at a shareholders' meeting, or the payment of dividends, (ii) the payment of fees, taxes, and similar charges, and (iii) compliance with any laws or governmental regulations relating to ADRs or to the withdrawal of deposited securities.
The deposit agreement expressly limits the obligations and liability of the depositary, ourselves and our respective agents, provided, however, that no such disclaimer of liability under the Securities Act of 1933 is intended by any provision of the limitations of liabilities provisions of the deposit agreement. In the deposit agreement it provides that neither we nor the depositary nor any such agent will be liable if:
- •
- any present or future law, rule, regulation, fiat, order or decree of the United States, the Cayman Islands, the People's Republic of China or any other country, or of any governmental or regulatory authority or securities exchange or market or automated quotation system, the provisions of or governing any deposited securities, any present or future provision of our charter, any act of God, war, terrorism or other circumstance beyond our, the depositary's or our respective agents' control shall prevent or delay, or shall cause any of them to be subject to any civil or criminal penalty in connection with, any act which the deposit agreement or the ADRs provide shall be done or performed by us, the depositary or our respective agents (including, without limitation, voting);
- •
- it exercises or fails to exercise discretion under the deposit agreement or the ADR;
- •
- it performs its obligations under the deposit agreement and ADRs without gross negligence or bad faith;
- •
- it takes any action or refrains from taking any action in reliance upon the advice of or information from legal counsel, accountants, any person presenting shares for deposit, any registered holder of ADRs, or any other person believed by it to be competent to give such advice or information; or
- •
- it relies upon any written notice, request, direction or other document believed by it to be genuine and to have been signed or presented by the proper party or parties.
Neither the depositary nor its agents have any obligation to appear in, prosecute or defend any action, suit or other proceeding in respect of any deposited securities or the ADRs. We and our agents shall only be obligated to appear in, prosecute or defend any action, suit or other proceeding in respect of any deposited securities or the ADRs, which in our opinion may involve us in expense or liability, if indemnity satisfactory to us against all expense (including fees and disbursements of counsel) and liability is furnished as often as may be required. The depositary and its agents may fully respond to any and all demands or requests for information maintained by or on its behalf in connection with the deposit agreement, any registered holder or holders of ADRs, any ADRs or otherwise related to the deposit agreement or ADRs to the extent such information is requested or required by or pursuant to any lawful authority, including without limitation laws, rules, regulations, administrative or judicial process, banking, securities or other regulators. The depositary shall not be liable for the acts or omissions made by, or the insolvency of, any securities depository, clearing agency or settlement system.
131
Table of Contents
Furthermore, the depositary shall not be responsible for, and shall incur no liability in connection with or arising from, the insolvency of any custodian that is not a branch or affiliate of JPMorgan Chase Bank, N.A. Notwithstanding anything to the contrary contained in the deposit agreement or any ADRs, the depositary shall not be responsible for, and shall incur no liability in connection with or arising from, any act or omission to act on the part of the custodian except to the extent that (A) the custodian has been determined by a final non-appealable judgment of a court of competent jurisdiction to have (i) committed fraud or willful misconduct in the provision of custodial services to the depositary or (ii) failed to use reasonable care in the provision of custodial services to the depositary as determined in accordance with the standards prevailing in the jurisdiction in which the custodian is located and (B) we or the registered holders of ADRs have incurred direct damages as a result of such act or omission to act on the part of the custodian. The depositary and the custodian(s) may use third party delivery services and providers of information regarding matters such as pricing, proxy voting, corporate actions, class action litigation and other services in connection with the ADRs and the deposit agreement, and use local agents to provide extraordinary services such as attendance at annual meetings of issuers of securities. Although the depositary and the custodian will use reasonable care (and cause their agents to use reasonable care) in the selection and retention of such third party providers and local agents, they will not be responsible for any errors or omissions made by them in providing the relevant information or services.
Additionally, none of us, the depositary or the custodian shall be liable for the failure by any registered holder of ADRs or beneficial owner therein to obtain the benefits of credits on the basis of non-U.S. tax paid against such holder's or beneficial owner's income tax liability. Neither we nor the depositary shall incur any liability for any tax consequences that may be incurred by holders or beneficial owners on account of their ownership of ADRs or ADSs.
Neither the depositary nor its agents will be responsible for any failure to carry out any instructions to vote any of the deposited securities, for the manner in which any such vote is cast or for the effect of any such vote. Neither the depositary nor any of its agents shall be liable to registered holders of ADRs or beneficial owners of interests in ADSs for any indirect, special, punitive or consequential damages (including, without limitation, lost profits) of any form incurred by any person or entity, whether or not foreseeable and regardless of the type of action in which such a claim may be brought.
In the deposit agreement each party thereto (including, for avoidance of doubt, each holder and beneficial owner and/or holder of interests in ADRs) irrevocably waives, to the fullest extent permitted by applicable law, any right it may have to a trial by jury in any suit, action or proceeding against the depositary and/or the company directly or indirectly arising out of or relating to the shares or other deposited securities, the ADSs or the ADRs, the deposit agreement or any transaction contemplated therein, or the breach thereof (whether based on contract, tort, common law or any other theory).
The depositary may own and deal in any class of our securities and in ADSs.
Disclosure of interest in ADSs
To the extent that any law, rule, regulation, fiat, order or decree, or any of our constituent documents may require disclosure of or impose limits on beneficial or other ownership of
132
Table of Contents
deposited securities, other shares and other securities and may provide for blocking transfer, voting or other rights to enforce such disclosure or limits, you agree to comply with all such disclosure requirements and ownership limitations and to comply with any reasonable instructions we may provide in respect thereof. We reserve the right to instruct you to deliver your ADSs for cancellation and withdrawal of the deposited securities so as to permit us to deal with you directly as a holder of shares and, by holding an ADS or an interest therein, you will be agreeing to comply with such instructions.
Books of depositary
The depositary or its agent will maintain a register for the registration, registration of transfer, combination and split-up of ADRs, which register shall include the depositary's direct registration system. Registered holders of ADRs may inspect such records at the depositary's office at all reasonable times, but solely for the purpose of communicating with other holders in the interest of the business of our company or a matter relating to the deposit agreement. Such register may be closed from time to time, when deemed expedient by the depositary.
The depositary will maintain facilities for the delivery and receipt of ADRs.
Pre-release of ADSs
In its capacity as depositary, the depositary shall not lend shares or ADSs; provided, however, that the depositary may (i) issue ADSs prior to the receipt of shares and (ii) deliver shares prior to the receipt of ADSs for withdrawal of deposited securities, including ADSs which were issued under (i) above but for which shares may not have been received (each such transaction a "pre-release"). The depositary may receive ADSs in lieu of shares under (i) above (which ADSs will promptly be canceled by the depositary upon receipt by the depositary) and receive shares in lieu of ADSs under (ii) above. Each such pre-release will be subject to a written agreement whereby the person or entity (the "applicant") to whom ADSs or shares are to be delivered (a) represents that at the time of the pre-release the applicant or its customer owns the shares or ADSs that are to be delivered by the applicant under such pre-release, (b) agrees to indicate the depositary as owner of such shares or ADSs in its records and to hold such shares or ADSs in trust for the depositary until such shares or ADSs are delivered to the depositary or the custodian, (c) unconditionally guarantees to deliver to the depositary or the custodian, as applicable, such shares or ADSs, and (d) agrees to any additional restrictions or requirements that the depositary deems appropriate. Each such pre-release will be at all times fully collateralized with cash, U.S. government securities or such other collateral as the depositary deems appropriate, terminable by the depositary on not more than five (5) business days' notice and subject to such further indemnities and credit regulations as the depositary deems appropriate. The depositary will normally limit the number of ADSs and shares involved in such pre-release at any one time to thirty percent (30%) of the ADSs outstanding (without giving effect to ADSs outstanding under (i) above), provided, however, that the depositary reserves the right to change or disregard such limit from time to time as it deems appropriate. The depositary may also set limits with respect to the number of ADSs and shares involved in pre-release with any one person on a case-by-case basis as it deems appropriate. The depositary may retain for its own account any compensation received by it in conjunction with the foregoing.
133
Table of Contents
Appointment
In the deposit agreement, each registered holder of ADRs and each person holding an interest in ADSs, upon acceptance of any ADSs (or any interest therein) issued in accordance with the terms and conditions of the deposit agreement will be deemed for all purposes to:
- •
- be a party to and bound by the terms of the deposit agreement and the applicable ADR or ADRs, and
- •
- appoint the depositary its attorney-in-fact, with full power to delegate, to act on its behalf and to take any and all actions contemplated in the deposit agreement and the applicable ADR or ADRs, to adopt any and all procedures necessary to comply with applicable laws and to take such action as the depositary in its sole discretion may deem necessary or appropriate to carry out the purposes of the deposit agreement and the applicable ADR and ADRs, the taking of such actions to be the conclusive determinant of the necessity and appropriateness thereof.
Governing law
The deposit agreement and the ADRs shall be governed by and construed in accordance with the laws of the State of New York. In the deposit agreement, we have submitted to the jurisdiction of the courts of the State of New York and appointed an agent for service of process on our behalf. Notwithstanding the foregoing, any action based on the deposit agreement or the transactions contemplated thereby may be instituted by the depositary and holders in any competent court in the Cayman Islands, Hong Kong, the People's Republic of China and/or the United States or through the commencement of an English language arbitration either in New York, New York in accordance with the Commercial Arbitration Rules of the American Arbitration Association or in Hong Kong following the arbitration rules of the United Nations Commission on International Trade Law (UNCITRAL).
134
Table of Contents
Shares eligible for future sale
Before this offering, there has not been a public market for our ordinary shares or our ADSs, and while we have applied for approval to have our ADSs listed on the New York Stock Exchange, we cannot assure you that a significant public market for the ADSs will develop or be sustained after this offering. We do not expect that an active trading market will develop for our ordinary shares not represented by the ADSs. Future sales of substantial amounts of our ADSs in the public markets after this offering, or the perception that such sales may occur, could adversely affect market prices prevailing from time to time. As described below, only a limited number of our ordinary shares currently outstanding will be available for sale immediately after this offering due to contractual and legal restrictions on resale. Nevertheless, after these restrictions lapse, future sales of substantial amounts of our ADSs, including ADSs representing ordinary shares issued upon exercise of outstanding options, in the public market in the United States, or the possibility of such sales, could negatively affect the market price in the United States of our ADSs and our ability to raise equity capital in the future.
Upon the closing of the offering, we will have outstanding ordinary shares, including ordinary shares represented by ADSs, assuming no exercise of the underwriters' over-allotment option. Of that amount, ordinary shares, including ordinary shares represented by ADSs, will be publicly held by investors participating in this offering, and ordinary shares will be held by our existing shareholders, who may be our "affiliates" as that term is defined in Rule 144 under the Securities Act. As defined in Rule 144, an "affiliate" of an issuer is a person that directly, or indirectly through one or more intermediaries, controls, or is controlled by, or is under common control with, the issuer. In addition, based on options outstanding as of , ordinary shares will be subject to outstanding options after this offering, of which ordinary shares will be vested and exercisable 180 days after this offering.
All of the ADSs sold in the offering and the ordinary shares they represent will be freely transferable by persons other than our "affiliates" in the United States without restriction or further registration under the Securities Act. Ordinary shares or ADSs purchased by one of our "affiliates" may not be resold, except pursuant to an effective registration statement or an exemption from registration, including an exemption under Rule 144 of the Securities Act described below.
The ordinary shares held by existing shareholders are, and those ordinary shares issuable upon exercise of options outstanding following the completion of this offering will be, "restricted securities," as that term is defined in Rule 144 under the Securities Act. These restricted securities may be sold in the United States only if they are registered or if they qualify for an exemption from registration under Rule 144 or Rule 701 under the Securities Act. These rules are described below.
Lock-up agreements
We and our directors, officers and other shareholders have agreed with the underwriters to certain lock-up agreements. See "Underwriting". A total of of our ordinary shares are subject to the lock-up agreements.
135
Table of Contents
Rule 144
In general, under Rule 144 as currently in effect, beginning 90 days after the date of this prospectus, a person who is not deemed to have been our affiliate at any time during the three months preceding a sale and who has beneficially owned "restricted securities" within the meaning of Rule 144 for at least six months would be entitled to sell an unlimited number of those shares, subject only to the availability of current public information about us. A non-affiliate who has beneficially owned "restricted securities" for at least one year from the later of the date these shares were acquired from us or from our affiliate would be entitled to freely sell those shares.
A person who is deemed to be an affiliate of ours and who has beneficially owned "restricted securities" for at least six months would be entitled to sell, within any three-month period, a number of shares that is not more than the greater of:
- •
- 1.0% of the number of our ordinary shares then outstanding, which will equal approximately ordinary shares immediately after this offering; or
- •
- the average weekly reported trading volume of our ADSs on the NYSE during the four calendar weeks proceeding the date on which a notice of the sale on Form 144 is filed with the SEC by such person.
Sales under Rule 144 by persons who are deemed to be our affiliates are also subject to manner-of-sale provisions, notice requirements and the availability of current public information about us.
In addition, in each case, these shares would remain subject to lock-up arrangements and would only become eligible for sale when the lock-up period expires.
Rule 701
Beginning 90 days after the date of this prospectus, persons other than affiliates who purchased ordinary shares under a written compensatory plan or contract may be entitled to sell such shares in the United States in reliance on Rule 701. Rule 701 permits affiliates to sell their Rule 701 shares under Rule 144 without complying with the holding period requirements of Rule 144. Rule 701 further provides that non-affiliates may sell these shares in reliance on Rule 144 subject only to its manner-of-sale requirements. However, the Rule 701 shares would remain subject to lock-up arrangements and would only become eligible for sale when the lock-up period expires.
Registration Rights
Upon completion of this offering, certain holders of our ordinary shares, or their transferees, will be entitled to request that we register their shares under the Securities Act, following the expiration of the lock-up agreements described above. See "Description of Share Capital—Registration Rights."
136
Table of Contents
Taxation
The following discussion of the material Cayman Islands and U.S. federal income tax consequences of an investment in our ADSs or ordinary shares is based upon laws and relevant interpretations thereof in effect as of the date of this prospectus, all of which are subject to change. This discussion does not deal with all possible tax consequences relating to an investment in our ADSs or ordinary shares, such as the tax consequences under state, local and other tax laws.
Cayman Islands taxation
In the opinion of Walkers, our Cayman Islands counsel, the following are the material Cayman Islands tax consequence of an investment in our ordinary shares. The Cayman Islands currently levies no taxes on individuals or corporations based upon profits, income, gains or appreciation and there is no taxation in the nature of inheritance tax or estate duty. There are no other taxes likely to be material to us levied by the Government of the Cayman Islands except for stamp duties which may be applicable on instruments executed in, or brought within, the jurisdiction of the Cayman Islands. The Cayman Islands is not party to any double tax treaties. There are no exchange control regulations or currency restrictions in the Cayman Islands.
United States federal income taxation
In the opinion of Shearman & Sterling LLP, our U.S. counsel, the following are the material U.S. federal income tax consequences of an investment in our ADSs or ordinary shares, based upon the U.S. Internal Revenue Code of 1986, as amended, or the Code, the U.S. Treasury regulations promulgated thereunder, judicial decisions, revenue rulings and revenue procedures of the Internal Revenue Service, and other administrative pronouncements of the Internal Revenue Service, all as of the date hereof. This discussion is applicable to U.S. Holders (as defined below) who hold our ADSs or ordinary shares as capital assets within the meaning of Section 1221 of the Code (primarily property held for investment). For purposes of this discussion you are a "U.S. Holder" if you are a beneficial owner of an ADS or ordinary share that is:
- •
- an individual citizen or resident of the United States, as determined for U.S. federal income tax purposes;
- •
- a corporation (or other entity treated as a corporation for U.S. federal income tax purposes) created or organized in or under the laws of the United States, any state thereof or the District of Columbia;
- •
- an estate the income of which is subject to U.S. federal income taxation regardless of its source; or
- •
- a trust if it (1) is subject to the primary supervision of a court within the United States and one or more U.S. persons have the authority to control all substantial decisions of the trust or (2) has a valid election in effect under applicable U.S. Treasury regulations to be treated as a U.S. person.
137
Table of Contents
This discussion does not address U.S. federal income tax consequences applicable to you if you are subject to special treatment under the U.S. federal income tax laws, including if you are:
- •
- a dealer in securities or currencies;
- •
- a financial institution;
- •
- a regulated investment company;
- •
- a real estate investment trust;
- •
- an insurance company;
- •
- a tax exempt organization;
- •
- a person holding our ADSs or ordinary shares as part of a hedging, integrated or conversion transaction, a constructive sale or a straddle;
- •
- a trader in securities that has elected the mark to market method of accounting for your securities;
- •
- a person liable for alternative minimum tax;
- •
- a U.S. expatriate or former U.S. citizen or long-term resident;
- •
- persons who acquired ADSs or ordinary shares pursuant to the exercise of any employee share option or otherwise as compensation;
- •
- a person who actually or constructively owns 10% or more of our voting stock; or
- •
- a person whose "functional currency" is not the U.S. dollar.
If a partnership (including any entity treated as a partnership for U.S. federal income tax purposes) holds ADSs or ordinary shares, the tax treatment of a partner will depend upon the status of the partner and the activities of the partnership. If you are a partner of a partnership holding our ADSs or ordinary shares, you should consult your tax advisors.
The authorities upon which this discussion is based are subject to change, which could apply retroactively, and could affect the U.S. federal income tax consequences discussed below. This discussion does not address all of the U.S. federal income tax consequences that may apply to you in light of your particular circumstances. Moreover, this discussion does not address any state, local or non-U.S. tax consequences or any aspects of U.S. federal tax law other than income taxation.If you are considering the purchase, ownership or disposition of our ADSs or ordinary shares, you should consult your own tax advisors concerning the U.S. federal income tax consequences to you in light of your particular circumstances as well as any consequences arising under the laws of any other taxing jurisdiction.
ADSs
The discussion below assumes that the representations contained in the deposit agreement are true and that the obligations in the deposit agreement and any related agreement will be complied with in accordance with their terms. If you hold ADSs, for U.S. federal income tax purposes, you will be treated as the owner of the underlying ordinary shares that are
138
Table of Contents
represented by such ADSs. Accordingly, deposits or withdrawals of ordinary shares for ADSs will not be subject to U.S. federal income tax.
The U.S. Treasury has expressed concerns that intermediaries in the chain of ownership between the holder of an ADS and the issuer of the security underlying the ADS may be taking actions that are inconsistent with the beneficial ownership of the underlying security (for example, pre-releasing ADSs to persons that do not have the beneficial ownership of the securities underlying the ADSs). Accordingly, the creditability of any foreign taxes and the availability of the reduced tax rate for any dividends received by certain non-corporate U.S. Holders, including individual U.S. Holders (as discussed below), could be affected by actions taken by intermediaries in the chain of ownership between the holders of ADSs and our company if as a result of such actions the holders of ADSs are not properly treated as beneficial owners of underlying ordinary shares.
Distributions
Subject to the discussion under "—Passive foreign investment company" below, the gross amount of distributions we make to you with respect to the ADSs or ordinary shares will be includible in your income as dividends, on the date of receipt by the depositary in the case of ADSs, or on the date of receipt by you in the case of ordinary shares, to the extent paid out of our current or accumulated earnings and profits, as determined under U.S. federal income tax principles. Such dividends will not be eligible for the dividends received deduction allowed to U.S. corporations under the Code for dividends received from other U.S. corporations.
With respect to non-corporate U.S. investors, certain dividends received before January 1, 2013 from a qualified foreign corporation may be subject to reduced rates of taxation, provided the ADSs or ordinary shares are held for a holding period of more than 60 days during the 121-day period beginning 60 days before the ex-dividend date. A non-U.S. corporation is treated as a qualified foreign corporation with respect to dividends received from that corporation on shares (or ADSs backed by such shares) that are readily tradable on an established securities market in the United States. U.S. Department of the Treasury guidance indicates that ordinary shares (or ADSs backed by such shares) are considered to be readily tradable on an established securities market in the United States if they are listed on the New York Stock Exchange, as our ADSs (but not our ordinary shares) are expected to be. In addition, in order to be treated as a qualified foreign corporation, we must neither be a PFIC nor be treated as such with respect to you for the taxable year in which the dividend was paid and the preceding taxable year. You should consult your own tax advisors regarding the application of these rules given your particular circumstances.
Dividends will constitute non-U.S. source income for foreign tax credit purposes and will be "passive category" income or, in the case of certain U.S. Holders, "general category" income. The rules governing the foreign tax credit are complex. You are urged to consult your tax advisors regarding the availability of the foreign tax credit in your particular circumstances.
To the extent that the amount of any distribution exceeds our current and accumulated earnings and profits for a taxable year, as determined under U.S. federal income tax principles, the distribution will first be treated as a tax free return of your tax basis in your ADSs or ordinary shares, and the balance in excess of adjusted basis in the ADSs or ordinary shares will be taxed as capital gain recognized on a sale or exchange. However, we do not expect to calculate our earnings and profits in accordance with U.S. federal income tax principles, and,
139
Table of Contents
accordingly, you should expect that a distribution will be reported as a dividend (as discussed above) even if that distribution (or a portion thereof) would otherwise be treated as a tax-free return of capital or as capital gain.
Sale, exchange or other disposition
Subject to the discussion under "—Passive foreign investment company" below, you will recognize taxable gain or loss on any sale, exchange or other taxable disposition of ADSs or ordinary shares in an amount equal to the difference between the amount realized for the ADSs or ordinary shares and your tax basis in the ADSs or ordinary shares. Such gain or loss will be capital gain or loss. Capital gains of non-corporate U.S. Holders derived with respect to capital assets held for more than one year are currently eligible for reduced rates of taxation. The deductibility of capital losses is subject to limitations. Any gain or loss recognized by you will be treated as U.S. source gain or loss for foreign tax credit purposes in most circumstances.
Passive foreign investment company
We will be a PFIC for any taxable year in which:
- •
- at least 75% of our gross income for such year is passive income, or
- •
- at least 50% of the value (determined on a quarterly basis) of our assets during such year is attributable to assets that produce or are held for the production of passive income.
For this purpose, passive income includes dividends, interest, certain royalties and rents and gains from the disposition of passive assets. If we own, directly or indirectly, at least 25% (by value) of the stock of another corporation, we will be treated, for purposes of the PFIC tests, as owning our proportionate share of the other corporation's assets and receiving our proportionate share of the other corporation's income.
A non-U.S. corporation that is a CFC for U.S. federal income tax purposes may be required to use the adjusted basis of its assets in applying the PFIC asset test, which may increase the likelihood that it qualifies as a PFIC. The legislative history to the special PFIC adjusted basis rule can be read as intending for the rule to apply only to U.S. persons that own at least 10% of the voting stock of the non-U.S. corporation; however, this limitation is not reflected in the statute. We would be treated as a CFC for any year if on any day of such year more than 50% of the total combined voting power of all classes of our voting shares or more than 50% of the total value of our shares are owned by U.S. Holders that own (directly, indirectly or by attribution) at least 10% of our voting shares. If we are treated as a CFC for U.S. federal income tax purposes for any portion of our taxable year that includes this offering, we would be more likely to be classified as a PFIC.
If we are a PFIC for any taxable year during which you hold ADSs or ordinary shares, our ADSs or ordinary shares will continue to be treated as shares in a PFIC with respect to you for all succeeding years during which a you hold our ADSs or ordinary shares, unless we cease to be a PFIC and you make a "deemed sale" election or "deemed dividend" election with respect to the ADSs or ordinary shares. If you make a deemed sale election, you will be deemed to have sold the ADSs or ordinary shares you hold at their fair market value as of the last day of the last year during which we were a PFIC (the "termination date"). If you make a "deemed dividend" election, you will be required to include in income as a deemed dividend your pro-rata share of our earnings and profits accumulated during any portion of your holding period ending at
140
Table of Contents
the close of the termination date and attributable to the ADSs or ordinary shares held on the termination date. You are urged to consult your tax advisor regarding our possible status as a PFIC as well as the benefit of making an actual or protective deemed dividend election or deemed sale election. We do not believe that we were a PFIC for the taxable year ended December 31, 2011. Based on the projected composition of our income and value of our assets (without regard to the CFC issues described above), we do not currently expect to be a PFIC for our current taxable year ending December 31, 2012, and we do not expect to become a PFIC in the foreseeable future, although there can be no assurance in this regard. The determination of whether we are a PFIC will be made annually. Accordingly, it is possible that we may become a PFIC in the current or any future taxable year due to changes in our asset or income composition. Because we will value our goodwill based on the market value of our equity following this offering, a decrease in the price of our ADSs may also result in our becoming a PFIC. In addition, the composition of our income and assets will be affected by how, and how quickly, we spend the cash we raise in this offering. Our PFIC status for a taxable year will not be determinable until the close of the taxable year, and, accordingly, there can be no assurance that we will not be a PFIC for our current taxable year or any future taxable year. However, if the rule requiring a CFC to use the adjusted basis of its assets to determine PFIC status under the asset test does not apply to us, we do not currently expect to be a PFIC for the current year or the foreseeable future.
If we are a PFIC for any taxable year during which you hold our ADSs or ordinary shares, you will be subject to special tax rules with respect to any "excess distribution" received and any gain realized from a sale or other disposition, including a pledge, of ADSs or ordinary shares. Distributions received in a taxable year that are greater than 125% of the average annual distributions received during the shorter of the three preceding taxable years or your holding period for the ADSs or ordinary shares will be treated as excess distributions. Under these special tax rules:
- •
- the excess distribution or gain will be allocated ratably over your holding period for the ADSs or ordinary shares,
- •
- the amount allocated to the current taxable year, and any taxable year prior to the first taxable year in which we were a PFIC, will be treated as ordinary income, and
- •
- the amount allocated to each other year will be subject to tax at the highest tax rate in effect for that year and the interest charge applicable to underpayments of tax will be imposed on the resulting tax attributable to each such year.
The tax liability for amounts allocated to taxable years prior to the year of disposition or excess distribution cannot be offset by any net operating losses for such years, and gains (but not losses) realized on the sale or other disposition of the ADSs or ordinary shares cannot be treated as capital, even if you hold the ADSs or ordinary shares as capital assets. In addition, non-corporate U.S. Holders will not be eligible for reduced rates of taxation on any dividends received from us prior to January 1, 2013, if we are a PFIC in the taxable year in which such dividends are paid or in the preceding taxable year. You will be required to file Internal Revenue Service Form 8621 (or any other form specified by the U.S. Department of the Treasury) if you hold our ADSs or ordinary shares in any year in which we are a PFIC.
141
Table of Contents
If we are a PFIC for any taxable year and any of our non-U.S. subsidiaries is also a PFIC, a U.S. Holder would be treated as owning a proportionate amount (by value) of the shares of the lower-tier PFIC for purposes of the application of these rules. You are urged to consult your tax advisors about the application of the PFIC rules to any of our subsidiaries.
In certain circumstances, in lieu of being subject to the excess distribution rules discussed above, a U.S. investor may make an election to include gain on the stock of a PFIC as ordinary income under a mark-to-market method, provided that such stock is regularly traded on a qualified exchange. Under current law, the mark-to-market election may be available to holders of ADSs, but not ordinary shares, because the ADSs will be listed on the New York Stock Exchange, which constitutes a qualified exchange. There can be no assurance that the ADSs will be "regularly traded" for purposes of the mark-to-market election. In addition, because a mark-to-market election cannot be made for equity interests in any lower-tier PFICs that we own, a U.S. Holder may continue to be subject to the PFIC rules with respect to its indirect interest in any investments held by us that are treated as an equity interest in a PFIC for U.S. federal income tax purposes.
If you make an effective mark-to-market election, you will include in each year as ordinary income the excess of the fair market value of your ADSs at the end of the year over your adjusted tax basis in the ADSs. You will be entitled to deduct as an ordinary loss each year the excess of your adjusted tax basis in the ADSs over their fair market value at the end of the year, but only to the extent of the net amount previously included in income as a result of the mark-to-market election. Your adjusted tax basis in the ADSs will be increased by the amount of any income inclusion and decreased by the amount of any deductions under the mark-to-market rules. Any distributions that we make would generally be subject to the rules discussed above under "Distributions," except that the lower rate applicable to qualified dividend income would not apply. If you make a mark-to-market election it will be effective for the taxable year for which the election is made and all subsequent taxable years unless the ADSs are no longer regularly traded on a qualified exchange or the Internal Revenue Service consents to the revocation of the election. You are urged to consult your tax advisor about the availability of the mark-to-market election, and whether making the election would be advisable in your particular circumstances.
Alternatively, a U.S. investor in a PFIC can mitigate the tax consequences described above by electing to treat the PFIC as a "qualified electing fund" within the meaning of Section 1295 of the Code. However, this option is not available to you because we do not intend to maintain and compute the information necessary to permit you to make this election.
You are urged to consult your tax advisors concerning the U.S. federal income tax consequences of holding ADSs or ordinary shares if we are a PFIC in any taxable year.
Information reporting and backup withholding
Information reporting will apply to dividends in respect of our ADSs or ordinary shares and the proceeds from the sale, exchange or redemption of our ADSs or ordinary shares that are paid to you within the United States (and in certain cases, outside the United States), unless you are an exempt recipient. Backup withholding may apply to such payments if you fail to provide a taxpayer identification number or certification of other exempt status or fail to report in full dividend and interest income. U.S. Holders that are required to establish their exempt status
142
Table of Contents
must provide such certification on U.S. Internal Revenue Service Form W-9 or a substitute Form W-9.
Backup withholding is not an additional tax. Amounts withheld under the backup withholding rules may be credited against your U.S. federal income tax liability, and you may obtain a refund of any excess amounts withheld under the backup withholding rules by filing the appropriate claim for refund with the Internal Revenue Service and furnishing any required information in a timely manner.
In addition, certain U.S. Holders that hold certain foreign financial assets (which may include our ADSs or ordinary shares) are required to report information relating to such assets, subject to exceptions (including an exception for ADSs or ordinary shares held in accounts maintained by certain financial institutions). U.S. Holders are urged to consult their tax advisors regarding the effect, if any, of this reporting requirement on their ownership and disposition of our ADSs or ordinary shares.
143
Table of Contents
Underwriting
We are offering the ADSs described in this prospectus through a number of underwriters. Citigroup Global Markets Inc. and Oppenheimer & Co. Inc. are acting as joint book-running managers of the offering and as representatives of the underwriters. We have entered into an underwriting agreement with the underwriters. Subject to the terms and conditions of the underwriting agreement, we have agreed to sell to the underwriters, and each underwriter has severally agreed to purchase, at the public offering price less the underwriting discounts and commissions set forth on the cover page of this prospectus, the number of ADSs listed next to its name in the following table:
| | | | |
| | |
Name
| | Number of ADSs
| |
|---|
| | |
Citigroup Global Markets Inc. | | | | |
Oppenheimer & Co. Inc. | | | | |
William Blair & Company, L.L.C. | | | | |
| | | | |
| | | | |
Total | | | | |
| | |
The underwriters are committed to purchase all the ADSs offered by us if they purchase any ADSs. The underwriting agreement also provides that if an underwriter defaults, the purchase commitments of non-defaulting underwriters may also be increased or the offering may be terminated.
The underwriters propose to offer the ADSs directly to the public at the initial public offering price set forth on the cover page of this prospectus and to certain dealers at that price less a concession not in excess of US$ per ADS. Any such dealers may resell ADSs to certain other brokers or dealers at a discount of up to US$ per ADS from the initial public offering price. After the initial public offering of the ADSs, the offering price and other selling terms may be changed by the underwriters. Sales of ADSs made outside of the United States may be made by affiliates of the underwriters.
At our request, the underwriters have reserved for sale, at the initial public offering price, up to 5% of the ADSs offered by this prospectus to our directors, officers, employees, business associates and related persons. We will pay all fees and disbursements of counsel incurred by the underwriters in connection with offering the ADSs to such persons. The number of ADSs available for sale to the general public will be reduced to the extent such persons purchase such reserved ADSs. Any reserved ADSs not so purchased will be offered by the underwriters to the general public on the same basis as the other ADSs offered by this prospectus. We have agreed to indemnify the underwriters against certain liabilities and expenses, including liabilities under the Securities Act, in connection with the sales of the reserved ADSs.
The underwriters have an option to buy up to additional ADSs from us to cover sales of ADSs by the underwriters which exceed the number of ADSs specified in the table above. The underwriters have 30 days from the date of this prospectus to exercise this over-allotment option. If any ADSs are purchased with this over-allotment option, the underwriters will purchase ADSs in approximately the same proportion as shown in the table above. If any additional ADSs are purchased, the underwriters will offer the additional ADSs on the same terms as those on which the ADSs are being offered.
144
Table of Contents
The underwriting fee is equal to the public offering price per ADS less the amount paid by the underwriters to us per ADS. The underwriting fee is US$ per ADS. The following table shows the per ADS and total underwriting discounts and commissions to be paid to the underwriters assuming both no exercise and full exercise of the underwriters' option to purchase additional ADSs.
| | | | | | | |
| | |
(In US$)
| | Without
over-allotment
exercise
| | With full
over-allotment
exercise
| |
|---|
| | |
Per ADS | | | | | | | |
| | | | |
Total | | | | | | | |
| | |
We estimate that the total expenses of this offering, including registration, filing and listing fees, printing fees and legal and accounting expenses, but excluding the underwriting discounts and commissions, will be approximately US$ .
A prospectus in electronic format may be made available on the web sites maintained by one or more underwriters, or selling group members, if any, participating in the offering. The underwriters may agree to allocate a number of ADSs to underwriters and selling group members for sale to their online brokerage account holders. Internet distributions will be allocated by the representatives to underwriters and selling group members that may make Internet distributions on the same basis as other allocations.
We have agreed that we will not (i) offer, pledge, announce the intention to sell, sell, contract to sell, sell any option or contract to purchase, purchase any option or contract to sell, grant any option, right or warrant to purchase or otherwise dispose of, directly or indirectly, or file with the SEC a registration statement under the Securities Act relating to, any ADSs or ordinary shares or securities convertible into or exchangeable or exercisable for any of our ADSs or ordinary shares, or publicly disclose the intention to make any offer, sale, pledge, disposition or filing, or (ii) enter into any swap or other arrangement that transfers all or a portion of the economic consequences associated with the ownership of any ADSs or ordinary shares or any such other securities (regardless of whether any of these transactions are to be settled by the delivery of ADSs or ordinary shares or such other securities, in cash or otherwise), in each case without the prior written consent of the representatives of the underwriters for a period of 180 days after the date of this prospectus, other than the ADSs to be sold hereunder. Notwithstanding the foregoing, if (1) during the last 17 days of the 180-day restricted period, we issue an earnings release or material news or a material event relating to our company occurs; or (2) prior to the expiration of the 180-day restricted period, we announce that we will release earnings results during the 16-day period beginning on the last day of the 180-day period, the restrictions described above shall continue to apply until the expiration of the 18-day period beginning on the issuance of the earnings release or the occurrence of the material news or material event
Our directors, executive officers and other shareholders have entered into lock-up agreements with the underwriters prior to the commencement of this offering pursuant to which each of these persons or entities, with limited exceptions, for a period of 180 days after the date of this prospectus, may not, without the prior written consent of the representatives of the underwriters, (1) offer, pledge, announce the intention to sell, sell, contract to sell, sell any
145
Table of Contents
option or contract to purchase, purchase any option or contract to sell, grant any option, right or warrant to purchase, or otherwise transfer or dispose of, directly or indirectly, any ADSs or ordinary shares or any securities convertible into or exercisable or exchangeable for our ADSs or ordinary shares (including, without limitation, ordinary shares or such other securities which may be deemed to be beneficially owned by such directors, executive officers, managers and members in accordance with the rules and regulations of the SEC and securities which may be issued upon exercise of a stock option or warrant) or (2) enter into any swap or other agreement that transfers, in whole or in part, any of the economic consequences of ownership of the ADSs or ordinary shares or such other securities, whether any such transaction described in clause (1) or (2) above is to be settled by delivery of ADSs or ordinary shares or such other securities, in cash or otherwise, or (3) make any demand for or exercise any right with respect to the registration of any ADSs or ordinary shares or any security convertible into or exercisable or exchangeable for our ADSs or ordinary shares. Notwithstanding the foregoing, if (1) during the last 17 days of the applicable restricted period, we issue an earnings release or material news or a material event relating to our company occurs; or (2) prior to the expiration of the applicable restricted period, we announce that we will release earnings results during the 16-day period beginning on the last day of the applicable restricted period, the restrictions described above shall continue to apply until the expiration of the 18-day period beginning on the issuance of the earnings release or the occurrence of the material news or material event.
We have agreed to indemnify the underwriters against certain liabilities, including liabilities under the Securities Act.
We will apply to have our common stock approved for listing on the NYSE, under the symbol "AQ".
In connection with this offering, the underwriters may engage in stabilizing transactions, which involves making bids for, purchasing and selling ADSs in the open market for the purpose of preventing or retarding a decline in the market price of the ADSs while this offering is in progress. These stabilizing transactions may include making short sales of the ADSs, which involves the sale by the underwriters of a greater number of ADSs than they are required to purchase in this offering, and purchasing ADSs on the open market to cover positions created by short sales. Short sales may be "covered" shorts, which are short positions in an amount not greater than the underwriters' over-allotment option referred to above, or may be "naked" shorts, which are short positions in excess of that amount. The underwriters may close out any covered short position either by exercising their over-allotment option, in whole or in part, or by purchasing ADSs in the open market. In making this determination, the underwriters will consider, among other things, the price of ADSs available for purchase in the open market compared to the price at which the underwriters may purchase ADSs through the over-allotment option. A naked short position is more likely to be created if the underwriters are concerned that there may be downward pressure on the price of the common stock in the open market that could adversely affect investors who purchase in this offering. To the extent that the underwriters create a naked short position, they will purchase ADSs in the open market to cover the position.
The underwriters have advised us that, pursuant to Regulation M of the Securities Act, they may also engage in other activities that stabilize, maintain or otherwise affect the price of the ADSs, including the imposition of penalty bids. This means that if the representatives of the underwriters purchase ADSs in the open market in stabilizing transactions or to cover short
146
Table of Contents
sales, the representatives can require the underwriters that sold those ADSs as part of this offering to repay the underwriting discount received by them.
These activities may have the effect of raising or maintaining the market price of the ADSs or preventing or retarding a decline in the market price of the ADSs, and, as a result, the price of the ADSs may be higher than the price that otherwise might exist in the open market. If the underwriters commence these activities, they may discontinue them at any time. The underwriters may carry out these transactions on the NYSE, in the over-the-counter market or otherwise.
Prior to this offering, there has been no public market for our ADSs or ordinary shares. The initial public offering price will be determined by negotiations between us and the representatives of the underwriters. In determining the initial public offering price, we and the representatives of the underwriters expect to consider a number of factors including:
- •
- the information set forth in this prospectus and otherwise available to the representatives;
- •
- our prospects and the history and prospects for the industry in which we compete;
- •
- an assessment of our management;
- •
- our prospects for future earnings;
- •
- the general condition of the securities markets at the time of this offering;
- •
- the recent market prices of, and demand for, publicly traded ADSs or common stock of generally comparable companies; and
- •
- other factors deemed relevant by the underwriters and us.
Neither we nor the underwriters can assure investors that an active trading market will develop for our ADSs, or that the ADSs will trade in the public market at or above the initial public offering price.
Other than in the United States, no action has been taken by us or the underwriters that would permit a public offering of the securities offered by this prospectus in any jurisdiction where action for that purpose is required. The securities offered by this prospectus may not be offered or sold, directly or indirectly, nor may this prospectus or any other offering material or advertisements in connection with the offer and sale of any such securities be distributed or published in any jurisdiction, except under circumstances that will result in compliance with the applicable rules and regulations of that jurisdiction. Persons into whose possession this prospectus comes are advised to inform themselves about and to observe any restrictions relating to the offering and the distribution of this prospectus. This prospectus does not constitute an offer to sell or a solicitation of an offer to buy any securities offered by this prospectus in any jurisdiction in which such an offer or a solicitation is unlawful.
This document is only being distributed to and is only directed at (i) persons who are outside the United Kingdom or (ii) to investment professionals falling within Article 19(5) of the Financial Services and Markets Act 2000 (Financial Promotion) Order 2005, or the Order, or (iii) high net worth entities, and other persons to whom it may lawfully be communicated, falling with Article 49(2)(a) to (d) of the Order, all such persons together being referred to as "relevant persons". The securities are only available to, and any invitation, offer or agreement
147
Table of Contents
to subscribe, purchase or otherwise acquire such securities will be engaged in only with, relevant persons. Any person who is not a relevant person should not act or rely on this document or any of its contents.
In relation to each Member State of the European Economic Area(1) which has implemented the Prospectus Directive (each, a "Relevant Member State"), from and including the date on which the European Union Prospectus Directive, or the EU Prospectus Directive, is implemented in that Relevant Member State, or the Relevant Implementation Date, an offer of securities described in this prospectus may not be made to the public in that Relevant Member State prior to the publication of a prospectus in relation to the ADSs which has been approved by the competent authority in that Relevant Member State or, where appropriate, approved in another Relevant Member State and notified to the competent authority in that Relevant Member State, all in accordance with the EU Prospectus Directive, except that it may, with effect from and including the Relevant Implementation Date, make an offer of ADSs to the public in that Relevant Member State at any time:
(1) The EU plus Iceland, Norway and Liechtenstein
- •
- to legal entities which are authorized or regulated to operate in the financial markets or, if not so authorized or regulated, whose corporate purpose is solely to invest in securities;
- •
- to any legal entity which has two or more of (1) an average of at least 250 employees during the last financial year; (2) a total balance sheet of more than €43,000,000 and (3) an annual net turnover of more than €50,000,000, as shown in its last annual or consolidated accounts;
- •
- to fewer than 100 natural or legal persons (other than qualified investors as defined in the EU Prospectus Directive) subject to obtaining the prior consent of the book-running managers for any such offer; or
- •
- in any other circumstances which do not require the publication by the Issuer of a prospectus pursuant to Article 3 of the Prospectus Directive.
For the purposes of this provision, the expression an "offer of securities to the public" in relation to any securities in any Relevant Member State means the communication in any form and by any means of sufficient information on the terms of the offer and the securities to be offered so as to enable an investor to decide to purchase or subscribe for the securities, as the same may be varied in that Member State by any measure implementing the EU Prospectus Directive in that Member State and the expression EU Prospectus Directive means Directive 2003/71/EC and includes any relevant implementing measure in each Relevant Member State.
This prospectus, as well as any other material relating to the ADSs which are the subject of the offering contemplated by this prospectus, do not constitute an issue prospectus pursuant to Article 652a of the Swiss Code of Obligations. The ADSs will not be listed on the SWX Swiss Exchange and, therefore, the documents relating to the ADSs, including, but not limited to, this document, do not claim to comply with the disclosure standards of the listing rules of SWX Swiss Exchange and corresponding prospectus schemes annexed to the listing rules of the SWX Swiss Exchange. The ADSs are being offered in Switzerland by way of a private placement, i.e. to a small number of selected investors only, without any public offer and only to investors who do not purchase the ADSs with the intention to distribute them to the public. The investors will be individually approached by us from time to time. This document, as well as
148
Table of Contents
any other material relating to the ADSs, is personal and confidential and do not constitute an offer to any other person. This document may only be used by those investors to whom it has been handed out in connection with the offering described herein and may neither directly nor indirectly be distributed or made available to other persons without our express consent. It may not be used in connection with any other offer and shall in particular not be copied and/or distributed to the public in (or from) Switzerland.
The securities may not be offered or sold in Hong Kong by means of any document other than (i) in circumstances which do not constitute an offer to the public within the meaning of the Companies Ordinance (Cap. 32, Laws of Hong Kong), or (ii) to "professional investors" within the meaning of the Securities and Futures Ordinance (Cap. 571, Laws of Hong Kong) and any rules made thereunder, or (iii) in other circumstances which do not result in the document being a "prospectus" within the meaning of the Companies Ordinance (Cap. 32, Laws of Hong Kong) and no advertisement, invitation or document relating to the securities may be issued or may be in the possession of any person for the purpose of issue (in each case whether in Hong Kong or elsewhere), which is directed at, or the contents of which are likely to be accessed or read by, the public in Hong Kong (except if permitted to do so under the laws of Hong Kong) other than with respect to securities which are or are intended to be disposed of only to persons outside Hong Kong or only to "professional investors" within the meaning of the Securities and Futures Ordinance (Cap. 571, Laws of Hong Kong) and any rules made thereunder.
In the State of Israel, the securities offered hereby may not be offered to any person or entity other than the following, all of whom must acquire the securities for their own account and not for purposes of distribution and/or sale to others:
- •
- a fund for joint investments in trust (i.e., mutual fund), as such term is defined in the Law for Joint Investments in Trust, 5754-1994, or a management company of such a fund;
- •
- a provident fund as defined in the Control of Financial Services law (Provident Funds), 5765-2005;
- •
- an insurer, as defined under the Insurance Business (Control) Law, 5741-1981;
- •
- a banking entity or satellite entity, as such terms are defined in the Banking Law (Licensing) Law, 5741-1981—other than a joint services company, acting for their own account or for the account of investors of the type listed in Section 15A(b) of the Securities Law 1968;
- •
- a portfolio manager, as such term is defined in Section 8(b) of the Law for the Regulation of Investment Advisors and Portfolio Managers, 5755-1995, acting on its own account or for the account of investors of the type listed in Section 15A(b) of the Securities Law 1968;
- •
- an investment advisor, as such term is defined in Section 7(c) of the Law for the Regulation of Investment Advisors and Portfolio Managers, 5755-1995, acting on its own account;
- •
- a member of the Tel Aviv Stock Exchange, acting on its own account or for the account of investors of the type listed in Section 15A(b) of the Securities Law 1968;
- •
- an underwriter fulfilling the conditions of Section 56(c) of the Securities Law 1968, purchasing for itself;
149
Table of Contents
- •
- a venture capital fund (defined as an entity primarily involved in investments in companies which, at the time of investment, (i) are primarily engaged in research and development or manufacture of new technological products or processes and (ii) where the risk of investment is higher than what is customary for other investments);
- •
- a corporation primarily engaged in capital markets activities and which is wholly owned by investors listed in Section 15A(b) of the Securities Law 1968;
- •
- a corporation, other than an entity formed for the purpose of purchasing securities in this offering, in which the shareholders equity is in excess of NIS 50 million; and
- •
- An individual as to which the conditions provided in sub-section 9 to Addendum 1 of the Investment Advisors Law, 5755-1995, purchasing for his own account, and for the purposes hereof, the aforementioned sub-section shall be read whereby "as an eligible client for the purpose of this law," is replaced with "as an investor for the purpose of Section 15A(b)(1) of the Securities Law 1968".
Any offeree of the securities offered hereby in the State of Israel shall be required to submit written confirmation that it falls within the scope of one of the above criteria. This prospectus will not be distributed or directed to investors in the State of Israel who do not fall within one of the above criteria.
Certain of the underwriters and their affiliates have provided in the past to us and our affiliates and may provide from time to time in the future certain commercial banking, financial advisory, investment banking and other services for us and such affiliates in the ordinary course of their business, for which they have received and may continue to receive customary fees and commissions. In addition, from time to time, certain of the underwriters and their affiliates may effect transactions for their own account or the account of customers, and hold on behalf of themselves or their customers, long or short positions in our debt or equity securities or loans, and may do so in the future.
150
Table of Contents
Expenses related to this offering
Set forth below is an itemization of the total expenses, excluding underwriting discounts and commissions, which are expected to be incurred in connection with the offer and sale of the ADSs by us and the selling shareholders. With the exception of the SEC registration fee and the Financial Industry Regulatory Authority, or FINRA, filing fee, all amounts are estimates.
| | | | | |
| | |
SEC registration fee | | US$ | 6,303 | |
NYSE listing fee | | | | |
FINRA filing fee | | | | |
Printing and engraving expenses | | | | |
Legal fees and expenses | | | | |
Accounting fees and expenses | | | | |
Miscellaneous | | | | |
| | | | |
| | Total | | US$ | | |
| | |
Expenses for the offering will be borne by us, except for certain insignificant legal fees and expenses which will be borne by the selling shareholders.
151
Table of Contents
Legal matters
The validity of the ADSs and certain other legal matters as to the United States federal securities and New York State law in connection with this offering will be passed upon for us by Shearman & Sterling LLP. Certain legal matters as to the United States federal securities and New York State law in connection with this offering will be passed upon for the underwriters by Latham & Watkins LLP. The validity of the ordinary shares represented by the ADSs offered in this offering and certain other legal matters as to Cayman Islands law will be passed upon for us by Walkers. Certain legal matters as to PRC law will be passed upon for us by Jingtian & Gongcheng. Shearman & Sterling LLP may rely upon Walkers with respect to matters governed by Cayman Islands law, and upon Jingtian & Gongcheng with respect to matters governed by PRC law.
Experts
Our consolidated financial statements at December 31, 2011, 2010 and 2009, and for the each of the three years in the period ended December 31, 2011 appearing in this prospectus and registration statement have been audited by Ernst & Young LLP, independent registered public accounting firm, as set forth in their report thereon appearing elsewhere herein, and are included in reliance upon such report given on the authority of such firm as experts in accounting and auditing.
The offices of Ernst & Young LLP are located at 155 North Wacker Driver, Chicago, Illinois 60606, United States of America.
152
Table of Contents
Where you can find additional information
We have filed with the SEC a registration statement on Form F-1, including relevant exhibits and schedules under the Securities Act with respect to underlying ordinary shares represented by the ADSs, to be sold in this offering. A related registration statement on F-6 has been filed with the SEC to register the ADSs. This prospectus, which constitutes a part of the registration statement, does not contain all of the information contained in the registration statement. You should read the registration statement and its exhibits and schedules for further information with respect to us and our ADSs.
Immediately upon completion of this offering, we will become subject to periodic reporting and other informational requirements of the Exchange Act as applicable to foreign private issuers. Accordingly, we will be required to file reports, including annual reports on Form 20-F, and other information with the SEC. All information filed with the SEC can be inspected and copied at the public reference facilities maintained by the SEC at 100 F Street, N.E., Washington, D.C. 20549. You can request copies of these documents upon payment of a duplicating fee, by writing to the SEC. Please call the SEC at 1-800-SEC-0330 for further information on the operation of the public reference rooms. Additional information may also be obtained over the internet at the SEC's website at www.sec.gov.
As a foreign private issuer, we are exempt under the Exchange Act from, among other things, the rules prescribing the furnishing and content of proxy statements, and our executive officers, directors and principal shareholders are exempt from the reporting and short-swing profit recovery provisions contained in Section 16 of the Exchange Act. In addition, we will not be required under the Exchange Act to file periodic reports and financial statements with the SEC as frequently or as promptly as U.S. companies whose securities are registered under the Exchange Act. However, we intend to furnish the depositary with our annual reports, which will include a review of operations and annual audited consolidated financial statements prepared in conformity with IFRS, and all notices of shareholders' meeting and other reports and communications that are made generally available to our shareholders. The depositary will make such notices, reports and communications available to holders of ADSs and, upon our request, will mail to all record holders of ADSs the information contained in any notice of a shareholders' meeting received by the depositary from us.
153
Table of Contents
Conventions that apply to this prospectus
Unless otherwise indicated, references in this prospectus to:
- •
- "ADRs" are to American depositary receipts that evidence our ADSs;
- •
- "ADSs" are to American depositary shares, each of which represents ordinary shares;
- •
- "Average number of personnel" are to the total number of days worked by individuals employed during the period (not including subcontractors) divided by the total number of days in the period;
- •
- "China" or the "PRC" are to the People's Republic of China, excluding Taiwan and the special administrative regions of Hong Kong and Macau;
- •
- "Project personnel" are to our personnel (not including subcontractors) who provide services to clients for which we charge our clients at their hourly billing rates;
- •
- "Shares" or "ordinary shares" are to our ordinary shares, par value US$0.0001 per share; and
- •
- "Utilization rate of project personnel" are to the total hours billed by our project personnel in a period divided by available hours of our project personnel in such period. Available hours of our project personnel are calculated by multiplying the average number of our project personnel in a period by the total work hours in such period. Total work hours in a period are the total calendar days in the period, minus all Saturdays, Sundays and office holidays, multiplied by eight hours.
Unless the context indicates otherwise, "we," "us," "our company" and "our" refer to Acquity Group Limited, its predecessor entities and its consolidated subsidiaries.
Unless otherwise indicated, information in this prospectus assumes that the underwriters do not exercise their over-allotment option to purchase additional ADSs.
154
Table of Contents
Acquity Group Limited
Index to consolidated financial statements
| | | | |
| | Pages
| |
|---|
Report of Independent registered public accounting firm | | | F-2 | |
Consolidated statements of comprehensive income (loss) | | |
F-3 | |
Consolidated statements of financial position | | |
F-4 | |
Consolidated statements of changes in equity | | |
F-5 | |
Consolidated statements of cash flows | | |
F-6 | |
Notes to consolidated financial statements | | |
F-7 - F-44 | |
F-1
Table of Contents
Report of independent registered public accounting firm
Board of Directors and Stockholders of Acquity Group Limited and Subsidiaries
We have audited the accompanying consolidated statements of financial position of Acquity Group Limited and Subsidiaries (AGL) as of December 31, 2011, 2010, and 2009, and the related consolidated statements of comprehensive income (loss), changes in equity, and cash flows for each of the three years in the period ended December 31, 2011. These financial statements are the responsibility of AGL's management. Our responsibility is to express an opinion on these financial statements based on our audits.
We conducted our audits in accordance with the standards of the Public Company Accounting Oversight Board (United States). Those standards require that we plan and perform the audit to obtain reasonable assurance about whether the financial statements are free of material misstatement. We were not engaged to perform an audit of AGL's internal control over financial reporting. Our audits included consideration of internal control over financial reporting as a basis for designing audit procedures that are appropriate in the circumstances, but not for the purpose of expressing an opinion on the effectiveness of AGL's internal control over financial reporting. Accordingly, we express no such opinion. An audit includes examining, on a test basis, evidence supporting the amounts and disclosures in the financial statements, assessing the accounting principles used and significant estimates made by management, as well as evaluating the overall financial statement presentation. We believe that our audits provide a reasonable basis for our opinion.
In our opinion, the financial statements referred to above present fairly, in all material respects, the consolidated financial position of AGL at December 31, 2011, 2010, and 2009, and the consolidated results of AGL's operations and their cash flows for each of the three years in the period ended December 31, 2011 in conformity with International Financial Reporting Standards as issued by the International Accounting Standards Board (IASB).
| | |
| | /s/ ERNST & YOUNG LLP |
Chicago, Illinois | | |
March 1, 2012 | | |
F-2
Table of Contents
Acquity Group Limited
Consolidated statements of comprehensive income (loss)
For the years ended 31 December 2011, 2010 and 2009
| | | | | | | | | | | | |
| | |
| | Notes
| | 2011
| | 2010
| | 2009
| |
|---|
| |
| | | | | | | | | | | | |
| |
| | USD
| | USD
| | USD
| |
|---|
Revenue | | 31 | | $ | 106,655,286 | | $ | 72,558,666 | | $ | 51,087,271 | |
Cost of sales | | | | | (60,543,536 | ) | | (41,150,096 | ) | | (29,132,402 | ) |
| | | | | | |
Gross profit | | | | | 46,111,750 | | | 31,408,570 | | | 21,954,869 | |
Selling and distribution costs | | | | | (7,749,607 | ) | | (6,733,597 | ) | | (4,850,715 | ) |
Administrative expenses | | | | | (22,543,222 | ) | | (19,866,372 | ) | | (14,204,371 | ) |
| | | | | | |
Operating profit | | | | | 15,818,921 | | | 4,808,601 | | | 2,899,783 | |
Finance income | | 8 | | | 86,878 | | | 90 | | | 68,906 | |
Other non-operating income | | 7 | | | — | | | 24,648 | | | 445,377 | |
Finance costs | | 8 | | | (61,167 | ) | | (6,311,418 | ) | | (2,587,787 | ) |
Other non-operating expenses | | 7 | | | — | | | (41,190 | ) | | — | |
Equity in losses of joint ventures | | 32 | | | (1,037,237 | ) | | — | | | — | |
| | | | | | |
Profit (loss) before tax | | | | | 14,807,395 | | | (1,519,269 | ) | | 826,279 | |
Income tax expense | | 11 | | | (6,471,940 | ) | | (1,852,541 | ) | | (896,867 | ) |
| | | | | | |
Profit (loss) | | | | | 8,335,455 | | | (3,371,810 | ) | | (70,588 | ) |
Other comprehensive income | | | | | | | | | | | | |
Currency translation differences | | | | | 101,920 | | | — | | | — | |
| | | | | | |
Total comprehensive profit (loss) | | | | $ | 8,437,375 | | $ | (3,371,810 | ) | $ | (70,588 | ) |
| | | | | | |
Profit (loss) attributable to: | | | | | | | | | | | | |
Equity holders of the Company | | | | $ | 8,607,282 | | $ | (5,532,385 | ) | $ | (1,465,116 | ) |
Non-controlling interests | | 29 | | | (271,827 | ) | | 2,160,575 | | | 1,394,528 | |
| | | | | | |
| | | | $ | 8,335,455 | | $ | (3,371,810 | ) | $ | (70,588 | ) |
| | | | | | |
Total comprehensive profit (loss) attributable to: | | | | | | | | | | | | |
Equity holders of the Company | | | | $ | 8,675,507 | | $ | (5,532,385 | ) | $ | (1,465,116 | ) |
Non-controlling interests | | 29 | | | (238,132 | ) | | 2,160,575 | | | 1,394,528 | |
| | | | | | |
| | | | $ | 8,437,375 | | $ | (3,371,810 | ) | $ | (70,588 | ) |
| | | | | | |
Earnings per share attributable to equity holders of the Company: | | 12 | | | | | | | | | | |
Basic profit (loss) per share for the year | | | | | 0.23 | | | (5.0 | ) | | (1,465.1 | ) |
Diluted profit (loss) per share for the year | | | | | 0.23 | | | (5.0 | ) | | (1,465.1 | ) |
| | |
See accompanying notes
F-3
Table of Contents
Acquity Group Limited
Consolidated statements of financial position
As of 31 December 2011, 2010 and 2009
| | | | | | | | | | | | | |
| | |
| | Notes
| | 2011
| | 2010
| | 2009
| |
|---|
| |
| | | | | | | | | | | | | |
| |
| | USD
| | USD
| | USD
| |
|---|
Assets | | | | | | | | | | | | | |
Non-current assets | | | | | | | | | | | | | |
Property and equipment | | | 13, 22, 27 | | $ | 3,648,414 | | $ | 2,695,923 | | $ | 1,789,510 | |
Intangible assets | | | 5, 14, 15 | | | 26,427,602 | | | 28,802,680 | | | 31,357,325 | |
Other non-current asset | | | | | | 73,502 | | | 55,506 | | | 19,935 | |
Investment in joint ventures | | | 32 | | | 3,886,668 | | | — | | | — | |
Deferred tax assets | | | 11 | | | 4,521,000 | | | 4,381,000 | | | 4,399,000 | |
| | | | | | | |
| | | | | | 38,557,186 | | | 35,935,109 | | | 37,565,770 | |
| | | | | | | |
Current assets | | | | | | | | | | | | | |
Trade receivables | | | 16, 24 | | | 27,961,769 | | | 17,440,196 | | | 12,389,967 | |
Due from customers under fixed-price contracts | | | 31 | | | 455,781 | | | 906,286 | | | — | |
Prepayments and other receivables | | | 17, 28 | | | 3,097,935 | | | 895,661 | | | 344,523 | |
Restricted cash | | | 18, 24 | | | 2,600,000 | | | — | | | 8,596,216 | |
Cash and cash equivalents | | | 19, 24 | | | 6,874,657 | | | 12,427,908 | | | 11,203,656 | |
| | | | | | | |
| | | | | | 40,990,142 | | | 31,670,051 | | | 32,534,362 | |
| | | | | | | |
Total assets | | | | | $ | 79,547,328 | | $ | 67,605,160 | | $ | 70,100,132 | |
| | | | | | | |
Equity and liabilities | | | | | | | | | | | | | |
Equity attributable to equity holders of the parent | | | | | | | | | | | | | |
Issued capital | | | 25 | | $ | 3,748 | | $ | 3,748 | | $ | — | |
Capital reserve | | | | | | 71,029,768 | | | 71,029,768 | | | — | |
Other comprehensive income | | | | | | 68,225 | | | — | | | — | |
Retained losses | | | | | | (7,412,552 | ) | | (16,019,834 | ) | | (10,487,449 | ) |
Non-controlling interests | | | 29 | | | 745,282 | | | 983,414 | | | 9,386,721 | |
| | | | | | | |
Total equity (deficits) | | | | | | 64,434,471 | | | 55,997,096 | | | (1,100,728 | ) |
| | | | | | | |
Non-current liabilities | | | | | | | | | | | | | |
Long term debts | | | 22, 24, 27, 30 | | | — | | | — | | | 22,058 | |
Convertible bonds | | | 23,24,30 | | | — | | | — | | | 58,384,796 | |
Other non-current liabilities | | | 24 | | | 5,379,066 | | | 4,114,588 | | | 2,625,897 | |
| | | | | | | |
| | | | | | 5,379,066 | | | 4,114,588 | | | 61,032,751 | |
| | | | | | | |
Current liabilities | | | | | | | | | | | | | |
Trade payables | | | 20, 24, 30 | | | 1,498,561 | | | 1,051,618 | | | 452,074 | |
Other payables and accruals | | | 21, 24, 28, 30 | | | 8,193,790 | | | 6,441,858 | | | 3,870,971 | |
Due to customers under fixed-price contracts | | | 30, 31 | | | 41,440 | | | — | | | 23,456 | |
Interest bearing borrowing | | | 22, 24, 30 | | | — | | | — | | | 1,000,000 | |
Current portion of long term debt | | | 22, 24, 27, 30 | | | — | | | — | | | 385,671 | |
Accrued unit redemption liability | | | 5, 24, 30 | | | — | | | — | | | 4,435,937 | |
| | | | | | | |
| | | | | | 9,733,791 | | | 7,493,476 | | | 10,168,109 | |
| | | | | | | |
Total liabilities | | | | | | 15,112,857 | | | 11,608,064 | | | 71,200,860 | |
| | | | | | | |
Total equity and liabilities | | | | | $ | 79,547,328 | | $ | 67,605,160 | | $ | 70,100,132 | |
| | |
See accompanying notes
F-4
Table of Contents
Acquity Group Limited
Consolidated statements of changes in equity
For the years ended 31 December 2011, 2010 and 2009
| | | | | | | | | | | | | | | | | | | | | | | | | |
| | |
| | Notes
| | Issued
capital
USD
| | Capital
reserve
USD
| | Other
comprehensive
income
USD
| | Retained
losses
USD
| | Equity
attributable
to equity
holders of
the parent
USD
| | Non-controlling
interests
USD
| | Total
| |
|---|
| | |
|---|
As at 1 January 2009 | | | | | $ | 0.1 | | $ | — | | $ | — | | $ | (9,022,333 | ) | $ | (9,022,333 | ) | $ | 11,098,478 | | $ | 2,076,145 | |
Profit (loss) for the year | | | | | | — | | | — | | | — | | | (1,465,116 | ) | | (1,465,116 | ) | | 1,394,528 | | | (70,588 | ) |
Other comprehensive income | | | | | | — | | | — | | | — | | | — | | | — | | | — | | | — | |
| | | | | | | |
Total comprehensive income (loss) for the year | | | | | | — | | | — | | | — | | | (1,465,116 | ) | | (1,465,116 | ) | | 1,394,528 | | | (70,588 | ) |
| | | | | | | |
Issuance of share-based payment to non-controlling interests | | | 29 | | | — | | | — | | | — | | | — | | | — | | | 55,625 | | | 55,625 | |
Redemption of subsidiaries' units from non-controlling interests | | | 29 | | | — | | | — | | | — | | | — | | | — | | | (598,731 | ) | | (598,731 | ) |
Distribution to non-controlling interests | | | 29 | | | — | | | — | | | — | | | — | | | — | | | (2,563,179 | ) | | (2,563,179 | ) |
| | | | | | | |
As at 31 December 2009 | | | | | | 0.1 | | | — | | | — | | | (10,487,449 | ) | | (10,487,449 | ) | $ | 9,386,721 | | $ | (1,100,728 | ) |
| | | | | | | |
Profit (loss) for the year | | | | | | — | | | — | | | — | | | (5,532,385 | ) | | (5,532,385 | ) | | 2,160,575 | | | (3,371,810 | ) |
Other comprehensive income | | | | | | — | | | — | | | — | | | — | | | — | | | — | | | — | |
| | | | | | | |
Total comprehensive income (loss) for the year | | | | | | — | | | — | | | — | | | (5,532,385 | ) | | (5,532,385 | ) | | 2,160,575 | | | (3,371,810 | ) |
| | | | | | | |
Acquisition of interest in subsidiaries | | | 5 | | | — | | | — | | | — | | | — | | | — | | | 1,244,081 | | | 1,244,081 | |
Issuance of share-based payment to non-controlling interests | | | 29 | | | — | | | — | | | — | | | — | | | — | | | 834,375 | | | 834,375 | |
Issuance of controlling equity holders | | | 25 | | | 2,610 | | | — | | | — | | | — | | | 2,610 | | | — | | | 2,610 | |
Settlement of share-based payment | | | 26,29 | | | — | | | — | | | — | | | — | | | — | | | (256,825 | ) | | (256,825 | ) |
Redemption of subsidiaries' units from non-controlling interests | | | 29 | | | — | | | — | | | — | | | — | | | — | | | (77,271 | ) | | (77,271 | ) |
Distribution to non-controlling interests | | | 29 | | | — | | | — | | | — | | | — | | | — | | | (1,980,012 | ) | | (1,980,012 | ) |
Share swap between equity holders of the parent and non-controlling interests | | | 25 | | | 1,138 | | | 10,327,092 | | | — | | | — | | | 10,328,230 | | | (10,328,230 | ) | | — | |
Transfer of convertible bonds | | | 23 | | | — | | | 60,702,676 | | | — | | | — | | | 60,702,676 | | | — | | | 60,702,676 | |
| | | | | | | |
As at 31 December 2010 | | | | | | 3,748 | | | 71,029,768 | | | — | | | (16,019,834 | ) | | 55,013,682 | | $ | 983,414 | | $ | 55,997,096 | |
| | | | | | | |
Profit (loss) for the year | | | | | | — | | | — | | | — | | | 8,607,282 | | | 8,607,282 | | | (271,827 | ) | | 8,335,455 | |
Other comprehensive income | | | | | | — | | | — | | | 68,225 | | | — | | | 68,225 | | | 33,695 | | | 101,920 | |
| | | | | | | |
Total comprehensive income (loss) for the year | | | | | | — | | | — | | | 68,225 | | | 8,607,282 | | | 8,675,507 | | | (238,132 | ) | | 8,437,375 | |
| | | | | | | |
As at 31 December 2011 | | | | | $ | 3,748 | | $ | 71,029,768 | | $ | 68,225 | | $ | (7,412,552 | ) | $ | 63,689,189 | | $ | 745,282 | | $ | 64,434,471 | |
| | |
See accompanying notes
F-5
Table of Contents
Acquity Group Limited
Consolidated statements of cash flows
For the years ended 31 December 2011, 2010 and 2009
| | | | | | | | | | | | | |
| | |
| | Notes
| | 2011
| | 2010
| | 2009
| |
|---|
| |
| | | | | | | | | | | | | |
| |
| | USD
| | USD
| | USD
| |
|---|
Operating activities | | | | | | | | | | | | | |
Profit (loss) before tax | | | | | $ | 14,807,395 | | $ | (1,519,269 | ) | $ | 826,279 | |
Adjustments to reconcile profit (loss) before tax to net cash flows from operating activities: | | | | | | | | | | | | | |
Non-cash: | | | | | | | | | | | | | |
Depreciation of property and equipment | | | 9,13 | | | 1,436,355 | | | 941,420 | | | 842,087 | |
Amortization of intangible assets | | | 9,14 | | | 2,532,874 | | | 2,554,645 | | | 2,750,000 | |
Impairment loss of trade receivables | | | 16 | | | 21,000 | | | (6,545 | ) | | (754,455 | ) |
Interest expenses | | | 8 | | | 61,167 | | | 6,311,418 | | | 2,587,787 | |
Interest income | | | 8 | | | (86,878 | ) | | (90 | ) | | (68,906 | ) |
Foreign exchange difference, net | | | 9 | | | — | | | — | | | 117 | |
Share-based payment expenses | | | 26 | | | — | | | 834,375 | | | 55,625 | |
Gain (loss) on change in fair value of contingent consideration | | | 5,7 | | | — | | | 41,190 | | | (445,377 | ) |
Equity in losses of joint ventures | | | 32 | | | 1,037,237 | | | — | | | — | |
Working capital adjustments: | | | | | | | | | | | | | |
Trade receivables | | | | | | (10,542,573 | ) | | (5,043,684 | ) | | 2,157,729 | |
Due from customers under fixed-price contracts | | | | | | 450,505 | | | (906,286 | ) | | 252,572 | |
Prepayments and other receivables | | | | | | (646,605 | ) | | (548,528 | ) | | 38,827 | |
Trade payables | | | | | | 446,943 | | | 599,544 | | | (428,498 | ) |
Settlement of share-based payment | | | 26,29 | | | — | | | (256,825 | ) | | — | |
Other payables and accruals | | | | | | 2,735,643 | | | 2,661,768 | | | (169,697 | ) |
Due to customers under fixed-priced contracts | | | | | | 41,440 | | | (23,456 | ) | | (119,868 | ) |
Other non-current assets | | | | | | (17,996 | ) | | (35,570 | ) | | 4,172 | |
Other non-current liabilities | | | | | | 125,478 | | | 325,692 | | | 341,850 | |
Interest received | | | | | | 86,878 | | | 90 | | | 68,906 | |
Interest paid | | | | | | (167 | ) | | (21,780 | ) | | (180,389 | ) |
Income tax paid | | | | | | (7,827,590 | ) | | (845,423 | ) | | (441,809 | ) |
| | | | | | | |
Net cash flows generated from operating activities | | | | | | 4,661,106 | | | 5,062,686 | | | 7,316,952 | |
| | | | | | | |
Purchase of property and equipment | | | 13 | | | (2,388,846 | ) | | (1,847,833 | ) | | (692,959 | ) |
Purchase of intangible asset | | | 14 | | | (157,796 | ) | | — | | | — | |
Payment of contingent consideration | | | 5 | | | — | | | (4,477,127 | ) | | (9,977,210 | ) |
Investment in joint ventures | | | 32 | | | (4,821,985 | ) | | — | | | — | |
Loans to Digital Li-Ning | | | 17,28 | | | (245,730 | ) | | — | | | — | |
Increase (decrease) in restricted cash | | | 18 | | | (2,600,000 | ) | | 8,596,216 | | | 12,722,226 | |
| | | | | | | |
Net cash flows (used in) generated from investing activities | | | | | | (10,214,357 | ) | | 2,271,256 | | | 2,052,057 | |
| | | | | | | |
Financing activities | | | | | | | | | | | | | |
Issuance of convertible bonds | | | 23 | | | — | | | 27,241 | | | 1,130,995 | |
Issuance of ordinary shares | | | | | | — | | | 1,244,081 | | | — | |
Repayment of borrowings | | | | | | — | | | (1,407,729 | ) | | (2,853,927 | ) |
Distribution to non-controlling interest | | | 29 | | | — | | | (1,980,012 | ) | | (2,563,179 | ) |
Redemption of subsidiaries' units from non-controlling interest | | | | | | — | | | (77,271 | ) | | (598,731 | ) |
Consideration paid for convertible bonds transfer | | | 23 | | | — | | | (3,916,000 | ) | | — | |
| | | | | | | |
Net cash flows used in financing activities | | | | | | — | | | (6,109,690 | ) | | (4,884,842 | ) |
| | | | | | | |
Net (decrease) increase in cash and cash equivalents | | | | | | (5,553,251 | ) | | 1,224,252 | | | 4,484,167 | |
Cash and cash equivalents at the beginning of the year | | | | | | 12,427,908 | | | 11,203,656 | | | 6,719,489 | |
| | | | | | | |
Cash and cash equivalents at the end of the year | | | | | $ | 6,874,657 | | $ | 12,427,908 | | $ | 11,203,656 | |
| | |
See accompanying notes
F-6
Table of Contents
Acquity Group Limited
Notes to consolidated financial statements
For the years ended 31 December 2011, 2010 and 2009
1. Corporate information
Acquity Group Limited (the "Company") was incorporated on 12 August 2010 in the Cayman Islands as an exempted company with limited liability under the Companies Law of the Cayman Islands. The registered office of the Company is located at Walker House, 87 Mary Street, George Town, Grand Cayman KY1-9005, Cayman Islands and the principal place of business of the Group is located at 500 West Madison Street, Chicago, Illinois, United States of America ("USA"). The Company is owned by 2020 China Holdings, Ltd. holding 69.94% equity ownership at 31 December 2011.
The principal activities of the Company and its subsidiaries (collectively referred to as the "Group") are described in Note 6, and the details of the Company and its subsidiaries are as follows:
| | | | | | | | | | | | | |
| |
Company name
| | Registered
place
| | Registration
date
| | Capital as of
31 December
2011
(USD)
| | Ownership
ratio
| | Main activity
|
|---|
| |
Acquity Group Limited (the "Company") | | Cayman Islands | | | 12 August 2010 | | | 3,748 | | | — | | Holding company |
2020 GlobalGrowth Equities Limited ("Global Growth") | | Cayman Islands | | | 13 November 2007 | | | — | | | 100 | % | Holding company |
2020 Global Investments, LLC ("2020 GI") | | Delaware, USA | | | 22 February 2008 | | | 13,000,000 | | | 100 | % | Holding company |
Acquity Group, LLC | | Delaware, USA | | | 22 March 2001 | | | 12,258,700 | | | 100 | % | Digital marketing services |
Xijiao International Limited | | Cayman Islands | | | 12 August 2010 | | | 1 | | | 100 | % | Holding company |
Xijiao Hong Kong Limited | | Hong Kong | | | 16 August 2010 | | | 0.13 | | | 100 | % | Holding company |
Cool Sports (BVI) Limited | | British Virgin Islands | | | 14 September 2010 | | | 2,980,715 | | | 66.94 | % | Holding company |
Cool Sports (Hong Kong) Limited | | Hong Kong | | | 12 October 2010 | | | 0.13 | | | 100 | % | Holding company |
| |
2. Summary of significant accounting policies
2.1 Basis of preparation and consolidation
Statement of compliance
The accompanying consolidated financial statements of the Group have been prepared in accordance with International Financial Reporting Standards ("IFRS") as issued by the International Accounting Standards Board ("IASB").
F-7
Table of Contents
Basis of preparation
The consolidated financial statements have been prepared on a historical cost basis except for derivative financial instruments, which are stated at fair value. The consolidated financial statements are presented in US dollars ("USD" or $) and all values are rounded to the nearest dollar except when otherwise indicated. The financial year end date of the Group is 31 December.
Basis of consolidation
The Company was incorporated on 12 August 2010 and inserted at the top of 2020 GlobalGrowth Equities Limited and its subsidiaries. The Company issued shares to the existing shareholders of 2020 GlobalGrowth Equities Limited in exchange for the shares already held in that entity, and there were no changes to the shareholder group. This transaction does not represent a business combination as there is no economic substance in terms of any real alteration to the composition or ownership of the group. Accordingly, its consolidated financial statements are presented as a continuance of the existing group.
The consolidated financial statements comprise the financial statements of the Company and its subsidiaries for the years ended 31 December 2009, 2010 and 2011 (the "reporting periods"). The financial statements of the subsidiaries are prepared for the same reporting period as the parent company, using consistent accounting policies.
All intra-group balances, income and expenses, and unrealized gains and losses resulting from intra-group transactions are eliminated in full.
2.2. Summary of significant accounting policies
Business combinations
Business combinations of the Company are accounted for using the purchase method. Acquisition cost is measured by adding the fair value of the cost of the consideration transferred over at the acquisition date and the Group's total amount of non-controlling interest. The non-controlling interest of the Group is measured in relative portion of identifiable assets. Costs related to acquisition are expensed as occurred.
Goodwill is initially measured at cost being the excess of the cost of the consideration transferred over the Group's net identifiable assets and liabilities assumed.
After initial recognition, goodwill is measured at cost less any accumulated impairment losses. For the purpose of impairment testing, goodwill acquired in a business combination is, from the acquisition date, allocated to each of the Group's cash generating units ("CGU") that are expected to benefit from the synergies of the combination.
Where goodwill forms part of a CGU and part of the operation within that unit is disposed of, the goodwill associated with the operation disposed of is included in the carrying amount of the operation when determining the gain or loss on disposal of the operation. Goodwill disposed of in this circumstance is measured based on the relative values of the operation disposed of and the portion of the CGU retained.
F-8
Table of Contents
Revenue recognition
Revenue is recognised to the extent that it is probable that all the economic benefits will flow to the Group and the revenue can be reliably measured. Revenue is measured at the fair value of the consideration received, excluding discounts, rebates and other sales taxes or duty. The following specific recognition criteria must also be met before revenue is recognised.
Services
The Group recognizes revenue from the provision of professional and digital marketing services to its clients when persuasive evidence of an arrangement exists and services have been provided to the customer.
Revenue for time-and-materials contract is earned based on hours worked and reimbursements received for out-of-pocket expenses and realized as services are provided.
Revenues from fixed-price contracts are recognised using the percentage-of-completion method. Revenue is recognised based on the percentage-of-labour incurred to estimated total labour. Further details related to fixed-price contracts are provided in Note 31.
Hosting arrangements are provided to manage and control the system needed for the client's business operations. Revenues generated from hosting arrangements are recognised ratably over the arrangement's term and as the monthly services are provided.
Reimbursements received for out-of-pocket expenses incurred are characterized as revenue and the related expenses are included in cost of sales in the consolidated statements of income.
Interest income
For all financial instruments measured at amortized cost and interest bearing financial assets classified as available-for-sale, interest income or expense is recorded using the effective interest rate (EIR), which is the rate that exactly discounts the estimated future cash payments or receipts through the expected life of the financial instrument or a shorter period, where appropriate, to the net carrying amount of the financial asset or liability. Interest income is included in finance income in the consolidated statements of comprehensive income.
Cost of revenues
Cost of revenues primarily include consultants' salaries and bonuses, benefits and payroll-related taxes, subcontractor costs, and travel expenses.
Taxes
Current income tax
Current income tax assets and liabilities are measured at the amount expected to be recovered from or paid to the taxation authorities. The tax rates and tax laws used to compute the amount are those that are enacted or substantively enacted by the reporting date in the country where the Group operates and generates taxable income.
F-9
Table of Contents
Current income tax relating to items recognised directly in equity is recognised in equity and not in the consolidated statements of comprehensive income.
Deferred tax
Deferred tax is provided using the asset-liability method on temporary differences at the reporting date between the tax bases of assets and liabilities and their carrying amounts for financial reporting purposes.
Deferred tax liabilities are recognised for all taxable temporary differences, except:
(a) Where the deferred tax liability arises from the initial recognition of goodwill or of an asset or liability in a transaction that is not a business combination and, at the time of the transaction, affects neither the accounting profit nor taxable profit or loss
(b) In respect of taxable temporary differences associated with investments in subsidiaries, where the timing of the reversal of the temporary differences can be controlled and it is probable that the temporary differences will not reverse in the foreseeable future
Deferred tax assets are recognised for all deductible temporary differences, carry forward of unused tax credits and unused tax losses, to the extent that it is probable that taxable profit will be available against which the deductible temporary differences and the carry forward of unused tax credits and unused tax losses can be utilised, except:
(a) Where the deferred tax asset relating to the deductible temporary difference arises from the initial recognition of an asset or liability in a transaction that is not a business combination and, at the time of the transaction, affects neither the accounting profit nor taxable profit or loss
(b) In respect of deductible temporary differences associated with investments in subsidiaries, deferred tax assets are recognised only to the extent that it is probable that the temporary differences will reverse in the foreseeable future and taxable profit will be available against which the temporary differences can be utilised
The carrying amount of deferred tax assets is reviewed at each reporting date and reduced to the extent that it is no longer probable that sufficient taxable profit will be available to allow all or part of the deferred tax asset to be utilised. Unrecognised deferred tax assets are reassessed at each reporting date and are recognised to the extent that it has become probable that future taxable profit will allow the deferred tax asset to be recovered.
Deferred tax assets and liabilities are measured at the tax rates that are expected to apply in the year when the asset is realized or the liability is settled, based on tax rates (and tax laws) that have been enacted or substantively enacted at the reporting date.
Deferred tax items are recognised in correlation to the underlying transaction either in other comprehensive income or directly in equity.
Deferred tax assets and deferred tax liabilities are offset if a legally enforceable right exists to set off current tax assets against current income tax liabilities and the deferred taxes related to the same taxable entity and the same taxation authority.
F-10
Table of Contents
Foreign currencies translation
The consolidated financial statements are presented in USD, which is the functional currency of the Company and its subsidiaries and the presentation currency of the Group.
Transactions in foreign currencies are initially recorded by the Group entities at their respective functional currency rates prevailing at the date of the transaction. Monetary assets and liabilities denominated in foreign currencies are retranslated at the functional currency rates of exchange ruling at the reporting date. All differences are taken to the consolidated statements of comprehensive income with the exception of all monetary items that provide an effective hedge for a net investment in a foreign operation. These are recognised in other comprehensive income until the disposal of the net investment, at which time they are recognised in the consolidated statements of comprehensive income. Tax charges and credits attributable to exchange difference on those monetary items are also recorded in equity. Non-monetary items that are measured in terms of historical cost in a foreign currency are translated using the exchange rates at the dates of the initial transactions. Non-monetary items measured at fair value in a foreign currency are translated using the exchange rates at the date when the fair value is determined.
Trademarks, software development costs, non-compete and customer relationships intangible assets
Separately acquired trademarks and licenses are shown at historical cost. Trademarks, software development costs and customer relationships acquired in a business combination are recognised at fair value at the acquisition date. Trademarks have an indefinite useful life and the Group assesses whether there is any indication of impairment at each reporting date. Software development costs, non-compete and customer relationships have a finite useful life and are carried at cost less accumulated amortization and any accumulated impairment losses. Amortization is calculated using the straight-line method to allocate the cost of software development and customer relationships over their estimated useful lives as follows:
| | |
| |
Software development costs | | 2 years |
Non-compete agreements | | 2 years |
Customer relationships | | 6 years |
| |
Internal costs incurred in researching and developing a computer software product to sell, lease, or otherwise market are charged to expense until technological feasibility has been established for the product. Software development costs incurred subsequent to establishing technological feasibility through general release of the software products are capitalised. Judgment is required in determining when technological feasibility of a product is established. Amortization of the asset begins when development is complete and the asset is available for use. It is amortized over the period of expected future benefit. During the period of development, the asset is tested for impairment annually.
Property and equipment
Property and equipment other than construction-in-progress are stated at cost net of accumulated depreciation and/or impairment losses, if any. Such cost includes the cost of replacing part of the equipment if the recognition criteria are met. Likewise, when a major inspection is performed, its cost is recognised in the carrying amount of the equipment as a
F-11
Table of Contents
replacement if the recognition criteria are satisfied. All other repair and maintenance costs are recognised in the consolidated statements of comprehensive income as incurred.
Depreciation is calculated on the straight-line basis over the estimated useful life of the asset as follows:
| | |
| |
Office and electronic equipment | | 2 to 3 years |
Software | | 2 to 3 years |
Furniture and fixtures | | 7 years |
Leasehold improvements | | Shorter of useful life or lease term |
| |
Where parts of an item of property and equipment have different useful lives, the cost of that item is allocated on a reasonable basis among the parts, and each part is depreciated separately.
Assets under construction-in-progress are not depreciated as they are not yet available for use.
An item of property and equipment is derecognised upon disposal or when no future economic benefits are expected from its use or disposal. Any gain or loss arising on derecognition of asset is included in the consolidated statements of comprehensive income in the year the asset is derecognised.
The asset's residual values, useful lives and methods of depreciation are reviewed at each financial year end and adjusted prospectively, if appropriate.
Research and development costs
Research costs are expensed as incurred. Development expenditures incurred on an individual project are recognised as an intangible asset when the Group can demonstrate:
(a) The technical feasibility of completing the intangible asset so that it will be available for use or sale
(b) Its intention to complete and its ability to use or sell the asset
(c) How the asset will generate future economic benefits
(d) The ability to measure reliably the expenditure during the development
Following initial recognition of the development expenditure as an asset, the cost model is applied requiring the asset to be carried at cost less any accumulated amortization and accumulated impairment losses. Amortization of the asset begins when development is complete and the asset is available for use. It is amortized over the period of expected future benefit. During the period of development, the asset is tested for impairment annually.
Impairment of non-financial assets
The Group assesses at each reporting date whether there is an indication that an asset may be impaired. If any such indication exists, or when annual impairment testing for an asset is required, the Group estimates the asset's recoverable amount. An asset's recoverable amount is the higher of an asset's or CGU's fair value less costs to sell and its value in use and is determined for an individual asset, unless the asset does not generate cash inflows that are largely independent of those from other assets or groups of assets. Where the carrying amount
F-12
Table of Contents
of an asset or CGU exceeds its recoverable amount, the asset is considered impaired and is written down to its recoverable amount. In assessing value in use, the estimated future cash flows are discounted to their present value using a pre-tax discount rate that reflects current market assessments of the time value of money and the risks specific to the asset. In determining fair value less costs to sell, an appropriate valuation model is used. These calculations are corroborated by valuation multiples, quoted share prices for publicly traded subsidiaries or other available fair value indicators.
Impairment losses are recognised in the consolidated statements of comprehensive income in those expense categories consistent with the function of the impaired asset.
For assets, excluding goodwill and trademarks, an assessment is made at each statement of financial position reporting date as to whether there is any indication that previously recognised impairment losses may no longer exist or may have decreased. If such indication exists, the Group estimates the asset's or CGU's recoverable amount. A previously recognised impairment loss is reversed only if there has been a change in the estimates used to determine the asset's recoverable amount since the last impairment loss was recognised. The reversal is limited so that the carrying amount of the asset does not exceed its recoverable amount nor exceed the carrying amount that would have been determined, net of depreciation, had no impairment loss been recognised for the asset in prior years. Such reversal is recognised in the statement of comprehensive income.
Goodwill
Goodwill is tested for impairment annually (as of 1 October) and when circumstances indicate that the carrying value may be impaired.
Impairment is determined for goodwill by assessing the recoverable amount of each CGU (or group of CGUs) to which the goodwill relates. Where the recoverable amount of the CGU is less than its carrying amount, an impairment loss is recognised. Impairment losses relating to goodwill cannot be reversed in future periods.
Financial assets
Initial recognition and measurement
Financial assets within the scope of International Accounting Standards ("IAS") 39 are classified as financial assets at fair value through profit or loss, loans and receivables, held-to-maturity investments or available-for-sale financial assets, as appropriate. The Group determines the classification of its financial assets at initial recognition.
All financial assets are recognised initially at fair value plus, in the case of investments not at fair value through profit or loss, directly attributable transaction costs.
Purchases or sales of financial assets that require delivery of assets within a time frame established by regulation or convention in the marketplace (regular way purchases) are recognised on the trade date, i.e., the date that the Group commits to purchase or sell the asset.
The Group's major financial assets include trade receivables, other receivables, amount due from related parties, restricted cash, and cash and cash equivalents.
F-13
Table of Contents
Subsequent measurement—loans and receivables
Loans and receivables are non-derivative financial assets with fixed or determinable payments that are not quoted in an active market. After initial measurement, such financial assets are subsequently measured at amortized cost using the EIR method, less impairment. The EIR amortization is included in finance income in the consolidated statements of comprehensive income. The losses arising from impairment are recognised in the consolidated statements of comprehensive income.
Derecognition of financial assets
A financial asset (or, where applicable, a part of a financial asset or part of a group of similar financial assets) is derecognised when:
(a) The rights to receive cash flows from the asset have expired.
(b) The Group has transferred its rights to receive cash flows from the asset or has assumed an obligation to pay the received cash flows in full without material delay to a third party under a 'pass-through' arrangement; and either (i) the Group has transferred substantially all the risks and rewards of the asset, or (ii) the Group has neither transferred nor retained substantially all the risks and rewards of the asset but has transferred control of the asset.
Impairment of financial assets
The Group assesses at each reporting date whether there is any objective evidence that a financial asset or a group of financial assets is impaired.
Financial liabilities
Initial recognition and measurement
Financial liabilities within the scope of IAS 39 are classified as financial liabilities at fair value through profit or loss, loans and borrowings, or as derivatives designated as hedging instruments in an effective hedge, as appropriate. The Group determines the classification of its financial liabilities at initial recognition.
Financial liabilities are recognised initially at fair value and, in the case of loans and borrowings, directly attributable transaction costs.
The Company's financial liabilities include trade payables and other payables and accruals.
Subsequent measurement
Financial liabilities at fair value through profit or loss
Gains or losses on financial liabilities designated as at fair value through profit or loss are recognised in the consolidated statements of comprehensive income.
Loan and borrowings
After initial recognition, interest bearing loans and borrowings are subsequently measured at amortized cost using the EIR method. Gains and losses are recognised in the consolidated statements of comprehensive income when the liabilities are derecognised as well as through the amortization process.
F-14
Table of Contents
Amortized cost is calculated by taking into account any discount or premium on acquisition and fee or costs that are an integral part of the EIR. The EIR amortization is included in finance costs in the consolidated statements of comprehensive income.
Financial guarantee contracts
Financial guarantee contracts issued by the Group are those contracts that require a payment to be made to reimburse the holder for a loss it incurs because the specified debtor fails to make a payment when due in accordance with the terms of a debt instrument. Financial guarantee contracts are recognised initially as a liability at fair value, adjusted for transaction costs that are directly attributable to the issuance of the guarantee. Subsequently, the liability is measured at the higher of the best estimate of the expenditure required to settle the present obligation at the reporting date and the amount recognised less cumulative amortization.
Derecognition of financial liabilities
A financial liability is derecognised when the obligation under the liability is discharged or cancelled or expires.
When an existing financial liability is replaced by another from the same lender on substantially different terms, or the terms of an existing liability are substantially modified, such an exchange or modification is treated as a derecognition of the original liability and the recognition of a new liability, and the difference in the respective carrying amounts is recognised in the consolidated statements of comprehensive income.
Offsetting of financial instruments
Financial assets and financial liabilities are offset and the net amount reported in the statement of financial position if, and only if, there is a currently enforceable legal right to offset the recognised amounts and there is an intention to settle on a net basis or to realize the assets and settle the liabilities simultaneously.
Fair value of financial instruments
The fair value of financial instruments that are traded in active markets at each reporting date is determined by reference to quoted market prices or dealer price quotations (bid price for long positions and ask price for short positions), without any deduction for transaction costs.
For financial instruments not traded in an active market, the fair value is determined using appropriate valuation techniques. Such techniques may include using recent arm's length market transactions, reference to the current fair value of another instrument that is substantially the same, discounted cash flow analysis or other valuation models.
An analysis of fair values of financial instruments and further details as to how they are measured are provided in Note 24.
Share-based payment
Employees (primarily senior executives) of the Group receive remuneration in the form of share-based payment transactions, whereby employees render services as consideration for equity instruments ("equity-settled transactions").
F-15
Table of Contents
In situations where equity instruments are issued and some or all of the goods or services received by the entity as consideration cannot be specifically identified, the unidentified goods or services received (or to be received) are measured as the difference between the fair value of the share-based payment transaction and the fair value of any identifiable goods or services received at the grant date. This is then capitalized or expensed as appropriate.
Equity-settled transactions
The cost of equity-settled transactions with employees for awards granted is measured by reference to the fair value at the date on which they are granted. The fair value is determined by using an appropriate pricing model, further details of which are given in Note 26.
The cost of equity-settled transactions is recognised, together with a corresponding increase in equity, over the period in which the performance and/or service conditions are fulfilled. The cumulative expense recognised for equity-settled transactions at each reporting date until the vesting date reflects the extent to which the vesting period has expired and the Group's best estimate of the number of equity instruments that will ultimately vest. The consolidated statements of comprehensive income represent the movement in cumulative expense recognised at each period.
No expense is recognised for awards that do not ultimately vest, except for equity-settled transactions where vesting is conditional upon a market or non-vesting condition, which are treated as vesting irrespective of whether or not the market or non-vesting condition is satisfied, provided that all other performance and/or service conditions are satisfied.
Where the terms of an equity-settled transaction award are modified, the minimum expense recognised is the expense as if the terms had not been modified, if the original terms of the award are met. An additional expense is recognised for any modification that increases the total fair value of the share-based payment transaction, or is otherwise beneficial to the employee as measured at the date of modification.
Where an equity-settled award is cancelled, it is treated as if it vested on the date of cancellation, and any expense not yet recognised for the award is recognised immediately. This includes any award where non-vesting conditions within the control of either the entity or the employee are not met. However, if a new award is substituted for the cancelled award, and designated as a replacement award on the date that it is granted, the cancelled and new awards are treated as if they were a modification of the original award, as described in the previous paragraph. All cancellations of equity-settled transaction awards are treated equally.
Cash and cash equivalents
Cash and cash equivalents in the statement of financial position comprise cash at banks and on hand and short-term deposits with original maturity of three months or less. For the purpose of the consolidated statement of cash flow, cash and cash equivalents consist of cash and short-term deposits as defined above.
Leases
The determination of whether an arrangement is, or contains, a lease is based on the substance of the arrangement at inception date, whether fulfillment of the arrangement is dependent on the use of a specific asset or assets, or the arrangement conveys a right to use the asset.
F-16
Table of Contents
Group as a lessee
Leases where substantially all the rewards and risks of ownership of assets remain with the lessor are accounted for as operating leases.
Operating lease payments are recognised as an expense in the consolidated statements of comprehensive income on the straight-line basis over the lease term.
Group as lessor
Leases where the Group does not transfer substantially all the risks and benefits of ownership of the asset are classified as operating leases. Rental income from operating leases is recognised in the consolidated statements of comprehensive income on a straight-line basis over the term of the relevant lease.
3. Significant accounting judgments, estimates and assumptions
The preparation of the Group's consolidated financial statements requires management to make judgments, estimates and assumptions that affect the reported amounts of revenues, expenses, assets and liabilities, and the disclosure of contingent liabilities, at the reporting date. However, uncertainty about these assumptions and estimates could result in outcomes that could require a material adjustment to the carrying amount of the asset or liability affected in the future periods.
Estimates and assumption
The key assumptions concerning the future and other key sources of estimation uncertainty at the reporting date that have a significant risk of causing a material adjustment to the carrying amounts of assets and liabilities within the next financial year are discussed below.
Impairment of non-financial assets
The Group's impairment test for property and equipment is based on value in use calculations that use a discounted cash flow model. The cash flows are derived from the budget for the next five years and do not include restructuring activities that the Group is not yet committed to or significant future investments that will enhance the asset base of the CGU being tested. The recoverable amount is most sensitive to the discount rate used for the discounted cash flow model as well as the expected future cash inflows and the growth rate used for extrapolation purposes.
Impairment of goodwill and trademarks
Impairment exists when the carrying value of an asset or CGU exceeds its recoverable amount, which is the higher of its fair value less costs to sell and its value in use. The fair value in use calculation is based on a discounted cash flow model. The cash flows are derived from the budget for the next five years and do not include restructuring activities that the Group is not yet committed to or significant future investments that will enhance the asset's performance of the CGU being tested. The recoverable amount is most sensitive to the discount rate used for the discounted cash flow model as well as the expected future cash inflows and the growth rate used for extrapolation purpose. The key assumptions used to determine the recoverable amount for the different CGU, including sensitivity analysis, are further explained in Note 15.
F-17
Table of Contents
Useful lives and residual values of property and equipment
The directors of the Company determine the estimated useful lives and residual values and consequently related depreciation charges. This estimate is based on the historical experience of the actual useful lives and residual values of property and equipment of similar nature and functions. It could change significantly as a result of technical innovations and competitor actions in response to severe industry cycles. The directors will increase the depreciation charge where useful lives and residual values are less than previously estimated.
Fair value of financial instruments
Where the fair value of financial assets and financial liabilities recorded in the statement of financial position cannot be derived from active markets, they are determined using valuation techniques including the discounted cash flows model. The inputs to these models are taken from observable markets where possible, but where this is not feasible, a degree of judgment is required in establishing fair values. The judgments include considerations of inputs such as liquidity risk, credit risk and volatility. Changes in assumptions about these factors could affect the reported fair value of financial instruments.
Provisions for impairment of trade and other receivables
Provisions for impairment of trade and other receivables are made based on the assessment of the recoverability and aging analysis of trade and other receivables. The identification of impairment of trade and other receivables requires management's judgment and estimates. Where the actual outcome or expectation in the future is different from the original estimate, such differences will have impact on the carrying amounts of the receivables and impairment of trade and other receivables expenses/write-back in the year in which such estimate has been changed.
Percent-of-completion revenue recognition
Revenues from fixed-price contracts are recognised using the percentage-of-completion method. Revenue is recognised based on the percentage-of-labour incurred to estimated total labour.
Deferred tax assets
Deferred tax assets are recognised for all deductible temporary differences to the extent that it is probable that taxable profit will be available against which the losses can be utilized. Significant management's judgment and estimate are required to determine the amount of deferred tax assets that can be recognised, based upon the likely timing and level of future taxable profits together with future tax planning strategies. Further details are given in Note 11.
Deferred tax liabilities
Deferred tax liabilities are recognised for taxable temporary differences. Significant management's judgment and estimate are required to determine the amount of deferred tax liabilities to be recognised based on management's expectation and applicable tax rates. Further details are given in Note 11.
F-18
Table of Contents
4. Impact of issued but not yet effective standards
Standards issued but not yet effective up to the date of issuance of the Group's consolidated financial statements are listed below. This listing is of standards and interpretations issued, which the Group reasonably expects to be applicable at a future date. The Group intends to adopt these standards when they become effective.
| | |
| |
Standard
| | Effective Date
|
|---|
| |
| IAS1 Financial Statement Presentation—Presentation of Items of Other Comprehensive Income | | Effective for annual periods beginning on or after 1 July 2012 |
IAS 12 Income Taxes—Recovery of Underlying Assets |
|
Effective for annual periods beginning on or after 1 January 2012 |
IAS 19 Employee Benefits (Amendent) |
|
Effective for annual periods beginning on or after 1 January 2013 |
IAS 27 Separate Financial Statements (as revised in 2011) |
|
Effective for annual periods beginning on or after 1 January 2013 |
IAS 28 Investments in Associates and Joint Ventures (as revised in 2011) |
|
Effective for annual periods beginning on or after 1 January 2013 |
IFRS 9 Financial Instruments: Classification and Measurement |
|
Effective for annual periods beginning on or after 1 January 2013 |
IFRS 10 Consolidated Financial Statements |
|
Effective for annual periods beginning on or after 1 January 2013 |
IFRS 11 Joint Arrangements |
|
Effective for annual periods beginning on or after 1 January 2013 |
IFRS 12 Disclosure of Involvement with Other Entities |
|
Effective for annual periods beginning on or after 1 January 2013 |
IFRS 13 Fair Value Measurement |
|
Effective for annual periods beginning on or after 1 January 2013 |
|
|
|
|
The Group is currently assessing the impact, if any, from the adoption of the above standards or amendments on its financial position or performance.
5. Business combination and acquisition of non-controlling interests
On 20 March 2008, 2020 Global Investments, LLC paid $49,000,000 (ownership interest after payment: 43.75%) as an exchange of newly issued units of 910,000 from Acquity Group, LLC. Immediately following the issuance of units, Acquity Group, LLC redeemed 780,089 units from existing unit holders. As a result of the transaction, 2020 Global Investments, LLC achieved an ownership interest of approximately 70% of Acquity Group, LLC.
F-19
Table of Contents
Contingent consideration
In connection with the purchase agreement with the previous members of Acquity Group, LLC, a liability has been recorded for contingent consideration that will be paid if certain conditions are met.
At the acquisition date, the fair value of the contingent consideration was estimated at $15,713,138.
Contingent consideration, resulting from business combinations, is remeasured to fair value at each reporting date as it meets the definition of a derivative and thus financial liability. The determination of the fair value is based on discounted cash flows. The key assumptions take into consideration meeting each performance target and the discount factor and are reflected in each reporting date. The fair value adjustment is recognised as non-operating income or expense. Movements in the provision for contingent consideration for the reporting periods based on above were as follows:
| | | | |
| | |
| | Contingent
consideration
USD
| |
|---|
| | |
At 21 March 2008 acquisition of subsidiary | | | 15,713,138 | |
Gain on change in fair value of contingent consideration | | | (854,614 | ) |
| | | | |
At 31 December 2008 | | | 14,858,524 | |
Cash payments of contingent consideration | | | (9,977,210 | ) |
Gain on change in fair value of contingent consideration | | | (445,377 | ) |
| | | | |
At 31 December 2009 | | | 4,435,937 | |
Cash payments of contingent consideration | | | (4,477,127 | ) |
Loss on change in fair value of contingent consideration | | | 41,190 | |
| | | | |
At 31 December 2010 | | | — | |
| | |
6. Operating segment information
The Group is principally engaged in the business of digital marketing services. For management purposes, the Group operates in one business unit based on its digital marketing services and has one reportable operating segment.
No operating segments have been aggregated to form the above reportable operating segment.
The Group ordinarily has not placed reliance on any single external customers amounting to 10% or more of its revenues. However, during the year ended 31 December 2011, one customer amounted to 12.6% of its revenues. No customers amounted to more than 10% of its revenues for the years ended 31 December 2010 and 2009. No geographical information is presented as all of the Group's revenue is derived from customers based in the United States of America and all non-current assets other than financial instruments, deferred tax assets, post employment benefit assets, and rights arising under insurance contracts are in the United States.
F-20
Table of Contents
7. Other non-operating income and expenses
| | | | | | | | | | |
| | |
| | Year ended 31 December | |
|---|
| | 2011
USD
| | 2010
USD
| | 2009
USD
| |
|---|
| | |
Non-operating income | | | | | | | | | | |
Gain on change in fair value of contingent consideration (Note 5) | | | — | | | — | | | 445,377 | |
Other | | | — | | | 24,648 | | | — | |
| | | | |
| | | — | | | 24,648 | | | 445,377 | |
| | | | |
Non-operating expenses | | | | | | | | | | |
Loss on change in fair value of contingent consideration (Note 5) | | | — | | | 41,190 | | | — | |
| | |
8. Finance income and costs
| | | | | | | | | | |
| | |
| | Year ended 31 December | |
|---|
| | 2011
USD
| | 2010
USD
| | 2009
USD
| |
|---|
| | |
Finance income | | | | | | | | | | |
Interest income on loan receivable from officers (Note 28) | | | 85,541 | | | — | | | — | |
Interest income on bank balances | | | 1,337 | | | 90 | | | 68,906 | |
| | | | |
| | | 86,878 | | | 90 | | | 68,906 | |
| | | | |
Finance costs | | | | | | | | | | |
Interest expenses on interest bearing borrowings | | | 167 | | | 21,780 | | | 180,389 | |
Interest expense on convertible bonds | | | — | | | 2,989,638 | | | 4,230,398 | |
Loss (gain) on valuation of convertible bonds derivative component | | | — | | | 3,217,000 | | | (1,883,000 | ) |
Other | | | 61,000 | | | 83,000 | | | 60,000 | |
| | | | |
| | | 61,167 | | | 6,311,418 | | | 2,587,787 | |
| | |
9. Depreciation, amortization and foreign exchange differences included in the consolidated statement of comprehensive income
| | | | | | | | | | |
| | |
| | Year ended 31 December | |
|---|
| | 2011
USD
| | 2010
USD
| | 2009
USD
| |
|---|
| | |
Included in cost of sales: | | | | | | | | | | |
Depreciation | | | 46,765 | | | 34,659 | | | 86,673 | |
Amortization of intangible asset | | | — | | | 54,645 | | | 250,000 | |
Included in general and administrative expenses: | | | | | | | | | | |
Depreciation | | | 1,389,590 | | | 906,761 | | | 755,414 | |
Amortization of intangible asset | | | 2,532,874 | | | 2,500,000 | | | 2,500,000 | |
Net foreign exchange differences | | | — | | | — | | | 117 | |
| | |
F-21
Table of Contents
10. Employee benefits expense
| | | | | | | | | | |
| | |
| | Year ended 31 December | |
|---|
| | 2011
USD
| | 2010
USD
| | 2009
USD
| |
|---|
| | |
Wage and salaries | | | 49,813,117 | | | 37,339,683 | | | 26,896,302 | |
Social security costs | | | 3,441,951 | | | 2,457,132 | | | 1,931,057 | |
Welfare expenses | | | 1,818,556 | | | 1,278,995 | | | 1,359,004 | |
| | | | |
| | | 55,073,624 | | | 41,075,810 | | | 30,186,363 | |
| | |
11. Income taxes
The Company and Global Growth were incorporated in the Cayman Islands as exempted companies with limited liability under the Companies Law of Cayman Islands. The Company and Global Growth are not subject to income tax or withholding tax in the Cayman Islands.
2020 GI was formed in the United States and is subject to U.S. federal income tax at a statutory rate of 34% and state income tax at various jurisdictional tax rates as a corporation. Acquity Group, LLC originally was formed in the U.S. as a partnership, which was not subject to income tax (i.e., its income or loss flowed through to its partners). As a result of the business combination on 20 March 2008 (see Note 5), Acquity Group, LLC experienced, for U.S. federal income tax purposes, a partnership technical termination, resulting in a pro-rata step-up in tax basis of Acquity Group, LLC's assets and the formation of a new partnership. As a result of the Unit Holders sale and purchase agreement on 24 December 2010 (see Note 25), Acquity Group, LLC experienced, for U.S. federal income tax purposes, another partnership technical termination, resulting in a pro-rata step-up in the tax basis of Acquity Group, LLC's assets and the formation of a new single member limited liability company. From 24 December 2010, Acquity Group, LLC elected, for U.S. federal income tax purposes, to be treated as a disregarded entity, which is not subject to U.S. income tax (i.e., its income or loss is reported by its single member, 2020 GI).
The major components of income tax (benefit)/expense for the reporting periods are as follows:
| | | | | | | | | | |
| | |
| | Year ended 31 December | |
|---|
| | 2011
USD
| | 2010
USD
| | 2009
USD
| |
|---|
| | |
Current income tax | | | 6,611,940 | | | 1,834,541 | | | 1,346,867 | |
Deferred tax | | | (140,000 | ) | | 18,000 | | | (450,000 | ) |
| | | | |
| | | 6,471,940 | | | 1,852,541 | | | 896,867 | |
| | |
F-22
Table of Contents
A reconciliation of the Company's total tax expense to the anticipated tax at the U.S. federal statutory income tax rate for the reporting periods is as follows:
| | | | | | | | | | |
| | |
| | Year ended 31 December | |
|---|
| | 2011
USD
| | 2010
USD
| | 2009
USD
| |
|---|
| | |
Profit (loss) before tax | | | 14,807,395 | | | (1,519,269 | ) | | 826,279 | |
| | | | |
Statutory tax rate | | | 34 | % | | 34 | % | | 34 | % |
Tax at the statutory tax rate | | | 5,034,515 | | | (516,551 | ) | | 280,935 | |
State tax, net of federal benefit | | | 828,954 | | | 171,376 | | | 69,342 | |
Foreign tax rate differences | | | (594,371 | ) | | 1,495,484 | | | (38,900 | ) |
Permanent book-tax differences | | | 132,016 | | | 369,926 | | | 2,006 | |
Noncontrolling interest | | | — | | | (734,596 | ) | | (474,140 | ) |
Withholding taxes | | | 1,080,000 | | | 1,080,000 | | | 1,080,000 | |
Other | | | (9,174 | ) | | (13,098 | ) | | (22,376 | ) |
| | | | |
Total tax charge | | | 6,471,940 | | | 1,852,541 | | | 896,867 | |
| | | | |
Effective tax rate | | | 43.7 | % | | -121.9 | % | | 108.5 | % |
| | |
The most significant items impacting the effective tax rate are foreign tax rate differences, noncontrolling interest and withholding taxes. Foreign tax rate differences represent the impact of tax rate differences between the U.S. and foreign jurisdictions in which the Company and its subsidiaries operate, including the Cayman Islands, in which the Company and Global Growth operate. Noncontrolling interest represents the impact of the Company's noncontrolling interest in Acquity Group, LLC prior to the reorganization on 24 December 2010. Withholding taxes represent the impact of 30% withholding tax on interest accrued on the loan from Global Growth (a Cayman Islands entity) to 2020 GI (a U.S. entity).
Deferred taxes relate to the following:
| | | | | | | | | | |
| | |
| | Year ended 31 December | |
|---|
| | 2011
USD
| | 2010
USD
| | 2009
USD
| |
|---|
| | |
Deferred tax assets: | | | | | | | | | | |
Amortizable intangibles | | | 2,185,000 | | | 2,552,000 | | | 2,671,000 | |
Other assets | | | 379,000 | | | 300,000 | | | 161,000 | |
Interest expenses | | | 2,899,000 | | | 2,028,000 | | | 1,722,000 | |
| | | | |
| | | 5,463,000 | | | 4,880,000 | | | 4,554,000 | |
| | | | |
Deferred tax liabilities: | | | | | | | | | | |
Depreciation and others | | | 942,000 | | | 499,000 | | | 155,000 | |
| | | | |
Net deferred tax assets | | | 4,521,000 | | | 4,381,000 | | | 4,399,000 | |
| | |
Deferred taxes on interest expense relate to accrued and unpaid interest on an intercompany loan between Global Growth and 2020 GI.
For comparability, the deferred tax position in 2009 is presented as their correlative inside book-tax basis differences, rather than as book-tax basis differences in partnership interests.
F-23
Table of Contents
12. Earnings per share
Basic earnings per share is calculated by dividing the net profit for the year attributable to ordinary equity holders of the Company by the weighted average number of ordinary shares outstanding during the year.
The following table shows the income (loss) and share data used in the basic earnings (loss) per share calculations:
| | | | | | | | | | |
| | |
| | Year ended 31 December | |
|---|
| | 2011
USD
| | 2010
USD
| | 2009
USD
| |
|---|
| | |
Net earnings (loss) attributable to ordinary holders of the parent for basic earnings | | $ | 8,607,282 | | $ | (5,532,385 | ) | $ | (1,465,116 | ) |
Net earnings (loss) attributable to ordinary shares for basic earnings | | | 8,607,282 | | | (5,532,385 | ) | | (1,465,116 | ) |
| | | | |
Weighted average number of ordinary shares for basic earnings per share(*) | | | 37,477,264 | | | 1,108,405 | | | 1,000 | |
| | | | |
Net earnings (loss) attributable to ordinary equity holders of the parent adjusted for the effect of dilution | | $ | 0.23 | | $ | (5.0 | ) | $ | (1,465.1 | ) |
| | |
(*) The details of calculation for weighted average number of ordinary shares for basic earnings per share are as follows:
| | | | | | | | | | |
| | |
| | Year ended 31 December | |
|---|
| | 2011
USD
| | 2010
USD
| | 2009
USD
| |
|---|
| | |
Number of shares at the beginning of the year | | | 37,477,264 | | | 1 | | | 1 | |
Subdivision of ordinary shares (retroactive) | | | — | | | 999 | | | 999 | |
Issued ordinary shares during the year | | | — | | | 26,098,188 | | | — | |
Share swap | | | — | | | 11,378,076 | | | — | |
Number of shares at the end of the year | | | 37,477,264 | | | 37,477,264 | | | 1,000 | |
Number of days in a year | | | 365 days | | | 365 days | | | 365 days | |
Weighted number | | | 13,679,201,360 | | | 404,567,864 | | | 365,000 | |
Weighted average number of ordinary shares for basic earnings per share | | | 37,477,264 | | | 1,108,405 | | | 1,000 | |
| | |
Subdivision of the ordinary share on 20 December 2010 is retroactively applied for the year ended 31 December 2009 for calculation of weighted average number of ordinary shares.
There have been no other transactions involving ordinary shares or potential ordinary shares between the reporting date and the date of issuance of these consolidated financial statements.
The Group does not have a dilution effect, and therefore net profit (loss) for basic earnings per share and net profit (loss) for diluted earnings per share are the same.
F-24
Table of Contents
13. Property and equipment
| | | | | | | | | | | | | | | | |
| | |
| | Office and electronic equipment
USD
| | Software
USD
| | Furniture and fixtures
USD
| | Leasehold improvement
USD
| | Total
USD
| |
|---|
| | |
Cost | | | | | | | | | | | | | | | | |
At 1 January 2009 | | | 862,586 | | | 573,557 | | | 469,465 | | | 775,477 | | | 2,681,085 | |
Additions | | | 160,286 | | | 511,156 | | | 19,792 | | | 1,725 | | | 692,959 | |
| | | | |
At 31 December 2009 | | | 1,022,872 | | | 1,084,713 | | | 489,257 | | | 777,202 | | | 3,374,044 | |
Additions | | | 973,206 | | | 479,678 | | | 80,652 | | | 314,297 | | | 1,847,833 | |
| | | | |
At 31 December 2010 | | | 1,996,078 | | | 1,564,391 | | | 569,909 | | | 1,091,499 | | | 5,221,877 | |
Additions | | | 746,149 | | | 833,822 | | | 652,811 | | | 156,064 | | | 2,388,846 | |
| | | | |
At 31 December 2011 | | | 2,742,227 | | | 2,398,213 | | | 1,222,720 | | | 1,247,563 | | | 7,610,723 | |
| | | | |
Accumulated depreciation | | | | | | | | | | | | | | | | |
At 1 January 2009 | | | 374,660 | | | 217,111 | | | 61,430 | | | 89,246 | | | 742,447 | |
Depreciation charged for the year | | | 391,083 | | | 253,528 | | | 83,399 | | | 114,077 | | | 842,087 | |
| | | | |
At 31 December 2009 | | | 765,743 | | | 470,639 | | | 144,829 | | | 203,323 | | | 1,584,534 | |
Depreciation charged for the year | | | 392,064 | | | 330,600 | | | 87,566 | | | 131,190 | | | 941,420 | |
| | | | |
At 31 December 2010 | | | 1,157,807 | | | 801,239 | | | 232,395 | | | 334,513 | | | 2,525,954 | |
Depreciation charged for the year | | | 684,164 | | | 437,682 | | | 127,338 | | | 187,171 | | | 1,436,355 | |
| | | | |
At 31 December 2011 | | | 1,841,971 | | | 1,238,921 | | | 359,733 | | | 521,684 | | | 3,962,309 | |
| | | | |
Net book value | | | | | | | | | | | | | | | | |
At 1 January 2009 | | | 487,926 | | | 356,446 | | | 408,035 | | | 686,231 | | | 1,938,638 | |
| | | | |
At 31 December 2009 | | | 257,129 | | | 614,074 | | | 344,428 | | | 573,879 | | | 1,789,510 | |
| | | | |
At 31 December 2010 | | | 838,271 | | | 763,152 | | | 337,514 | | | 756,986 | | | 2,695,923 | |
| | | | |
At 31 December 2011 | | | 900,256 | | | 1,159,292 | | | 862,987 | | | 725,879 | | | 3,648,414 | |
| | |
F-25
Table of Contents
14. Intangible assets
| | | | | | | | | | | | | | | | | | | |
| | |
| | Goodwill
USD
| | Trademark
USD
| | Software development costs
USD
| | Customer relationships
USD
| | Noncompete
USD
| | Total
USD
| |
|---|
| | |
Cost | | | | | | | | | | | | | | | | | | | |
At 1 January 2009 | | | 25,216,232 | | | 3,800,000 | | | 500,000 | | | 15,000,000 | | | — | | | 44,516,232 | |
Additions | | | — | | | — | | | — | | | — | | | — | | | — | |
| | | | |
At 31 December 2009 | | | 25,216,232 | | | 3,800,000 | | | 500,000 | | | 15,000,000 | | | — | | | 44,516,232 | |
Additions | | | — | | | — | | | — | | | — | | | — | | | — | |
| | | | |
At 31 December 2010 | | | 25,216,232 | | | 3,800,000 | | | 500,000 | | | 15,000,000 | | | — | | | 44,516,232 | |
Additions | | | — | | | — | | | — | | | — | | | 157,796 | | | 157,796 | |
| | | | |
At 31 December 2011 | | | 25,216,232 | | | 3,800,000 | | | 500,000 | | | 15,000,000 | | | 157,796 | | | 44,674,028 | |
| | | | |
Accumulated amortization and impairment | | | | | | | | | | | | | | | | | | | |
At 1 January 2009 | | | 7,160,000 | | | 1,100,000 | | | 195,355 | | | 1,953,552 | | | — | | | 10,408,907 | |
Amortization charged for the year | | | — | | | — | | | 250,000 | | | 2,500,000 | | | — | | | 2,750,000 | |
| | | | |
At 31 December 2009 | | | 7,160,000 | | | 1,100,000 | | | 445,355 | | | 4,453,552 | | | — | | | 13,158,907 | |
Amortization charged for the year | | | — | | | — | | | 54,645 | | | 2,500,000 | | | — | | | 2,554,645 | |
| | | | |
At 31 December 2010 | | | 7,160,000 | | | 1,100,000 | | | 500,000 | | | 6,953,552 | | | — | | | 15,713,552 | |
Amortization charged for the year | | | — | | | — | | | — | | | 2,500,000 | | | 32,874 | | | 2,532,874 | |
| | | | |
At 31 December 2011 | | | 7,160,000 | | | 1,100,000 | | | 500,000 | | | 9,453,552 | | | 32,874 | | | 18,246,426 | |
| | | | |
Net book value | | | | | | | | | | | | | | | | | | | |
At 1 January 2009 | | | 18,056,232 | | | 2,700,000 | | | 304,645 | | | 13,046,448 | | | — | | | 34,107,325 | |
| | | | |
At 31 December 2009 | | | 18,056,232 | | | 2,700,000 | | | 54,645 | | | 10,546,448 | | | — | | | 31,357,325 | |
| | | | |
At 31 December 2010 | | | 18,056,232 | | | 2,700,000 | | | — | | | 8,046,448 | | | — | | | 28,802,680 | |
| | | | |
At 31 December 2011 | | | 18,056,232 | | | 2,700,000 | | | — | | | 5,546,448 | | | 124,922 | | | 26,427,602 | |
| | |
15. Impairment testing of goodwill and intangible assets with indefinite lives
Goodwill acquired through business combinations and trademarks with indefinite lives have been allocated to one CGU, which is also the only operating segment, for impairment testing. The Group performed its annual impairment test of goodwill and trademarks as of 1 October 2011, 2010 and 2009.
F-26
Table of Contents
The recoverable amount of goodwill has been determined based on the unit's fair value less cost to sell using projections of earnings from financial forecast approved by senior management covering a five-year period as well as comparison of the CGU to available market multiples of comparable publicly traded companies. The after-tax discount rates applied to the earnings forecasts prepared at 1 October 2011, 2010 and 2009 are 19%, 16%, and 15%, respectively. Earnings beyond the five-year period in each set of forecast are extrapolated using a 4% growth rate. No impairment charge has been recognised against goodwill during 2011, 2010 or 2009.
The recoverable amount of the CGU trademarks has been determined using earnings from financial forecasts approved by senior management covering a five-year period. The after-tax discount rates applied to the earnings forecasts prepared at 1 October 2011, 2010 and 2009 are 19%, 16%, and 15%, respectively. Earnings beyond the five-year period in each set of forecast are extrapolated using a 4% growth rate. No impairment charge has been recognised against trademarks during 2011, 2010 and 2009.
Key assumptions used in value-in-use calculations
The calculation of value for goodwill and trademarks are most sensitive to the following assumptions:
- (a)
- Profit margins
- (b)
- Discount rates
- (c)
- Growth rate used during the projection period and growth rates to extrapolate cash flows beyond the forecast period
Profit margins—Profit margins are based on management reference to current operating results, staffing level, backlog, as well as external market factors including market validity. These are increased over the projection period for anticipated efficiency improvements, economics of scale, higher utilization personal, and increased name recognition.
Discount rates—Discount rates reflect the current market assessment of the risks specific to the CGU. The discount rate was estimated based on industry indication for weighted average cost of capital.
Growth rate estimates—Rates are based on historical growth and industry research. Between 2009 through 2011 Acquity Group, LLC revenue grew in excess of 50% year over year. Continued growth is expected.
With regard to the assessment of value-in-use of goodwill and trademarks, the management believes that no reasonably possible change in any of the above key assumption would cause the carrying value of the Company to materially exceed its recoverable amount.
F-27
Table of Contents
16. Trade receivables
| | | | | | | | | | |
| | |
| | 31 December | |
|---|
| | 2011
USD
| | 2010
USD
| | 2009
USD
| |
|---|
| | |
Trade receivables | | | 28,146,769 | | | 17,604,196 | | | 12,560,512 | |
Less: accumulated impairment losses | | | (185,000 | ) | | (164,000 | ) | | (170,545 | ) |
| | | | |
| | | 27,961,769 | | | 17,440,196 | | | 12,389,967 | |
| | |
The aging analysis of the trade receivables at each of the respective reporting dates, net of accumulated impairment losses, is as follows:
| | | | | | | | | | | | | | | | | | | |
| | |
| |
| |
| | Past due but not impaired | |
| |
|---|
| |
| | Neither past
due nor
impaired
USD
| |
| |
|---|
| | Total
USD
| | < 30 days
USD
| | 31-60 days
USD
| | 61-90 days
USD
| | 90 days
USD
| |
|---|
| | |
At 31 December 2009 | | | 12,389,967 | | | 9,649,733 | | | 2,094,339 | | | 582,771 | | | 63,124 | | | — | |
At 31 December 2010 | | | 17,440,196 | | | 13,646,024 | | | 2,527,814 | | | 1,239,429 | | | 26,929 | | | — | |
At 31 December 2011 | | | 27,961,769 | | | 21,447,895 | | | 3,349,892 | | | 2,056,250 | | | 1,023,029 | | | 84,703 | |
| | |
The Group has a policy of allowing an average credit period of 30 days to its trade customers with trading history; otherwise sales on cash terms or receipts in advance are required. In determining the recoverability of a receivable, the Group considers any change in the credit quality of the receivable from the date credit was initially granted up to the reporting date.
Trade receivables that were past due but not impaired relate to a number of customers that have a favourable collection history with the Group. Trade receivables that were past due but not impaired at 31 December 2011, 2010 and 2009 are $6,513,874, $3,794,172 and $2,740,234, respectively. The Group does not hold any collateral over these balances.
Movements in the provision for impairment of trade receivables were as follows:
| | | | | | | | | | |
| | |
| | 31 December | |
|---|
| | 2011
USD
| | 2010
USD
| | 2009
USD
| |
|---|
| | |
Beginning balance of the year | | | 164,000 | | | 170,545 | | | 925,000 | |
Charge for the year | | | 21,000 | | | (26,545 | ) | | 235,196 | |
Amounts recovered/(used) | | | — | | | 20,000 | | | (989,651 | ) |
| | | | |
Ending balance of the year | | | 185,000 | | | 164,000 | | | 170,545 | |
| | |
At each of the respective reporting dates, the Group's trade receivables include receivables from customers that were individually determined to be impaired. The individually impaired receivables were recognised based on the credit history of the Group's customers, such as financial difficulties or default in payments, and current market conditions.
F-28
Table of Contents
17. Prepayments and other receivables
| | | | | | | | | | |
| | |
| | 31 December | |
|---|
| | 2011
USD
| | 2010
USD
| | 2009
USD
| |
|---|
| | |
Prepayments | | | 691,706 | | | 544,347 | | | 331,242 | |
Prepaid income taxes | | | 1,309,939 | | | — | | | — | |
Due from joint ventures (Note 28) | | | 245,730 | | | — | | | — | |
Other receivables | | | 850,560 | | | 351,314 | | | 13,281 | |
| | | | |
| | | 3,097,935 | | | 895,661 | | | 344,523 | |
| | |
At each of the respective reporting dates, none of the Group's prepayments and other receivables were individually determined to be impaired. Based on the credit history of the Group's debtors, such as financial difficulties or default in payments and current market conditions, no impaired receivables were recognised.
18. Restricted cash
| | | | | | | | | | |
| | |
| | 31 December | |
|---|
| | 2011
USD
| | 2010
USD
| | 2009
USD
| |
|---|
| | |
Restricted cash, current portion (MMF) | | | 2,600,000 | | | — | | | 8,596,216 | |
| | | | |
| | | 2,600,000 | | | — | | | 8,596,216 | |
| | |
Restricted cash represents deposits placed in banks and financial institutions.
During 2011, the Group provided a guarantee to Shanghai Pudong Development Bank for the bank borrowings of the joint venture, Huaren Kudong Commercial Trading Co., Ltd. (Note 27). The Group was required to deposit $2,600,000 with the bank to serve as collateral in the event the guarantee was exercised by Shanghai Pudong Development Bank.
In conjunction with the acquisition of Acquity Group, LLC, a substantial amount of the Group's cash in 2009 was restricted for future earn-out payments. The Bank of America (the "Trustee") invests funds held in these accounts at the direction of the Group.
The funds are invested in money market funds or bank proprietary funds. The investments are carried at cost, which approximates fair value at 31 December 2011, 2010 and 2009.
19. Cash and cash equivalents
| | | | | | | | | | |
| | |
| | 31 December | |
|---|
| | 2011
USD
| | 2010
USD
| | 2009
USD
| |
|---|
| | |
Cash and bank balances | | | 9,474,657 | | | 12,427,908 | | | 19,799,872 | |
Less: restricted cash | | | (2,600,000 | ) | | — | | | (8,596,216 | ) |
| | | | |
Cash and cash equivalents | | | 6,874,657 | | | 12,427,908 | | | 11,203,656 | |
| | |
Bank balances carry interest at prevailing market rates during each reporting period.
F-29
Table of Contents
20. Trade payables
Trade payables are non-interest bearing and are normally settled on 60 day terms. The aging analysis of the trade payables at the respective reporting date is as follows:
| | | | | | | | | | |
| | |
| | 31 December | |
|---|
| | 2011
USD
| | 2010
USD
| | 2009
USD
| |
|---|
| | |
0 - 30 days | | | 965,357 | | | 926,565 | | | 204,053 | |
31 - 60 days | | | 364,984 | | | 100,460 | | | 182,075 | |
61 - 90 days | | | 129,470 | | | 23,273 | | | 47,169 | |
91 - 180 days | | | 38,750 | | | 1,320 | | | 18,777 | |
| | | | |
| | | 1,498,561 | | | 1,051,618 | | | 452,074 | |
| | |
21. Other payables and accruals
| | | | | | | | | | |
| | |
| | 31 December | |
|---|
| | 2011
USD
| | 2010
USD
| | 2009
USD
| |
|---|
| | |
Payroll and welfare payables | | | 4,785,362 | | | 3,005,954 | | | 828,406 | |
Accrued subcontractor services | | | 1,864,729 | | | 641,395 | | | 467,460 | |
Accrued expenses | | | 1,284,958 | | | 1,659,856 | | | 1,325,733 | |
Due to government | | | 34,524 | | | 989,226 | | | 1,080,108 | |
Others | | | 224,217 | | | 145,427 | | | 169,264 | |
| | | | |
| | | 8,193,790 | | | 6,441,858 | | | 3,870,971 | |
| | |
Other payables are non-interest bearing and have average terms within one year from the reporting date.
22. Interest-bearing borrowings
| | | | | | | | | | |
| | |
| | 31 December | |
|---|
| | 2011
USD
| | 2010
USD
| | 2009
USD
| |
|---|
| | |
Short-term financing arrangements: | | | | | | | | | | |
Bank borrowings | | | — | | | — | | | 1,000,000 | |
Current portion of long-term debt | | | — | | | — | | | 60,972 | |
Finance lease liabilities | | | — | | | — | | | 324,699 | |
Long-term financing arrangements: | | | | | | | | | | |
Finance lease liabilities | | | — | | | — | | | 22,058 | |
| | |
The above bank borrowings are secured by the following:
- •
- As of 31 December 2009, bank borrowings of $1,000,000 were secured by 80% of eligible accounts receivable.
- •
- As of 31 December 2009, finance lease liabilities of $346,757 were secured by equipment being leased.
During 2009, the interest rates of the interest-bearing borrowings ranged between 6.22% and 10.43%.
F-30
Table of Contents
23. Convertible bonds
On 21 December 2007, Global Growth entered into bond subscription agreements (the "Subscription Agreement") with two independent third parties, Datai Bay Investment Ltd. ("Datai") and SHK Asian Opportunities Holdings Ltd. ("SHK") to issue convertible bonds (the "Convertible Bonds") with aggregate principal amounts not to exceed $50,000,000 and $5,000,000, respectively. The Convertible Bonds would mature on the two-year anniversary from the initial issue date of the convertible bonds (the "Maturity Date"). In the event that the Company's successful execution of an initial public offering ("IPO") did not take place on or before the Maturity Date, the Maturity Date could have been extended by holders for a period of one year ("Extended Maturity Date") by giving notice in writing to Global Growth within 14 days prior to the original Maturity Date. In the event that an IPO did not take place on or before the Extended Maturity Date, the Extended Maturity Date could have been further extended by holders for another one-year ("Final Maturity Date"). The Final Maturity Date could not be further extended.
In the event that an IPO did take place on or before the Maturity Date, the Convertible Bonds would mandatorily be converted into a number of ordinary shares of Global Growth calculated by adding the amount of 20% annualized IRR yield applied to the principal amount of the Convertible Bonds divided by the conversion ratio. In the event that an IPO did not take place on or before the Maturity Date, holders of the aggregate principal amount of all the Convertible Bonds issued and outstanding had the collective right to either redeem the Convertible Bonds at a 5% annualized IRR yield or convert the outstanding principal amount of all the Convertible Bonds into shares at a conversion price not less than the par value of a share.
In the opinion of the directors of the Company, the Convertible Bonds contained two components, a liability component and a derivative component. The derivative component included a conversion feature and an extension feature.
On 15 December 2010, Global Growth entered into a deed of restructuring (the "Deed") with 2020 China Holdings, Ltd. ("2020 CH"), Datai and SHK. Under the terms of the Deed, the Convertible Bonds were assigned from Datai and SHK respectively to 2020 CH, together with all rights and benefits relating to each Subscription Agreement. In consideration for the assignment of the Convertible Bonds, 2020 CH issued exchangeable bonds to each of Datai and SHK. The Convertible Bonds were subsequently cancelled by agreement between Global Growth and 2020 CH. In consideration for the cancellation of the Convertible Bonds, 2020 Global Growth paid $3,916,000 to 2020 CH, and the excess amount of Convertible Bonds amounting to $60,702,676 was recorded as capital reserve.
Fair value of the embedded derivative component
The fair value of the embedded derivative component was determined at each issue date and the end of each reporting period using the Binomial Model-Method. The changes in fair value
F-31
Table of Contents
of the components are recognised in profit or loss. The inputs used in the Binomial Model-Method were as follows:
| | | | | | | | | | |
| | |
| | 31 December | |
|---|
| | 2011
| | 2010
| | 2009
| |
|---|
| | |
Business value | | | N/A | | | N/A | | | 44,556,000 | |
Expected volatility | | | N/A | | | N/A | | | 95.58 | % |
Risk-free rate | | | N/A | | | N/A | | | 0.249 | % |
Expected life | | | N/A | | | N/A | | | 0.49 years | |
Expected dividend yield | | | N/A | | | N/A | | | 0 | % |
| | |
The business value was determined by the reference to the weighted average value from the income approach and market approach for each reporting period.
The income approach uses the discounted cash flow method applying a discount rate of 15% to 16%. It uses cash flow projections based on a five-year financial budget approved by management and a perpetuity growth rate of 4.0% per annum thereafter, which is based on the general growth rate of relevant industry. The expected volatility is calculated using the historical volatility of share price of companies in the similar industry.
The market approach uses various market multiples that are derived from either the share price or the total invested capital value to its revenue, earnings or cash flow of the similar company in its size, profitability and growth rate.
24. Financial asset and liabilities
Below is a comparison by class of the carrying amounts and fair value of the Group's financial instruments that are carried in the consolidated financial statements.
| | | | | | | | | | | | | | | | | | | |
| | |
| | Carrying value
31 December | | Fair value
31 December | |
|---|
| | 2011
USD
| | 2010
USD
| | 2009
USD
| | 2011
USD
| | 2010
USD
| | 2009
USD
| |
|---|
| | |
Financial assets | | | | | | | | | | | | | | | | | | | |
Trade receivables | | | 27,961,769 | | | 17,440,196 | | | 12,389,967 | | | 27,961,769 | | | 17,440,196 | | | 12,389,967 | |
Restricted cash | | | 2,600,000 | | | — | | | 8,596,216 | | | 2,600,000 | | | — | | | 8,596,216 | |
Cash and cash equivalents | | | 6,874,657 | | | 12,427,908 | | | 11,203,656 | | | 6,874,657 | | | 12,427,908 | | | 11,203,656 | |
| | | | |
| | | 37,436,426 | | | 29,868,104 | | | 32,189,839 | | | 37,436,426 | | | 29,868,104 | | | 32,189,839 | |
| | | | |
Financial liabilities | | | | | | | | | | | | | | | | | | | |
Interest-bearing borrowing | | | — | | | — | | | 1,000,000 | | | — | | | — | | | 1,000,000 | |
Trade payables | | | 1,498,561 | | | 1,051,618 | | | 452,074 | | | 1,498,561 | | | 1,051,618 | | | 452,074 | |
Other payables and accruals | | | 8,193,790 | | | 6,441,858 | | | 3,870,971 | | | 8,193,790 | | | 6,441,858 | | | 3,870,971 | |
Current portion of long-term debt | | | — | | | — | | | 385,671 | | | — | | | — | | | 385,671 | |
Accrued unit redemption liability | | | — | | | — | | | 4,435,937 | | | — | | | — | | | 4,435,937 | |
Long-term debts | | | — | | | — | | | 22,058 | | | — | | | — | | | 22,058 | |
Convertible Bonds | | | — | | | — | | | 56,810,796 | | | — | | | — | | | 44,688,000 | |
Derivative components of Convertible Bonds(*) | | | — | | | — | | | 1,574,000 | | | — | | | — | | | 1,574,000 | |
Other non-current liabilities | | | 5,379,066 | | | 4,114,588 | | | 2,625,897 | | | 5,379,066 | | | 4,114,588 | | | 2,625,897 | |
| | | | |
| | | 15,071,417 | | | 11,608,064 | | | 71,177,404 | | | 15,071,417 | | | 11,608,064 | | | 59,054,608 | |
| | |
(*) Fair value of derivative component of the Convertible Bonds is presented separately from the Convertible Bonds.
F-32
Table of Contents
The following methods and assumptions were used to estimate the fair values:
Trade receivables, other receivables, restricted cash, cash and cash equivalents, trade payables, other payables and accruals, amount due to related parties and interest-bearing borrowings approximate their carrying amounts largely due to the short-term maturities of these instruments.
The fair value of unquoted instruments and non-current financial liabilities such as bank borrowings is estimated by discounting future cash flows using rates currently available for debt on similar terms, credit risk and remaining maturities.
The Group uses the following hierarchy for determining and disclosing the fair value of financial instruments by valuation technique:
| | |
| Level 1: | | quoted (unadjusted) prices in active markets for identical assets or liabilities |
| Level 2: | | other techniques for which all inputs which have a significant effect on the recorded fair value are observable, either directly or indirectly |
| Level 3: | | techniques which use inputs which have a significant effect on the recorded fair value that are not based on observable market data |
As of 31 December 2011, there were no items measured at fair value that are not Level 1, and therefore, during the reporting period ending 31 December 2011, there were no transfers between Level 1 and Level 2 fair value measurements and no transfers into and out of Level 3 fair value measurements.
25. Ordinary share capital
| | | | | | | |
| | |
| | Number
of shares
| | USD
| |
|---|
| | |
Authorised: | | | | | | | |
Ordinary shares of $0.1 each upon incorporation as at 12 August 2010 | | | 500,000 | | | 50,000 | |
Ordinary shares of $0.0001 each upon subdivision as at 20 December 2010 | | | 499,500,000 | | | — | |
| | | | |
At 31 December 2011 | | | 500,000,000 | | | 50,000 | |
| | | | |
Issued and fully paid: | | | | | | | |
Ordinary shares of $0.1 each upon incorporation as at 12 August 2010 | | | 1 | | | 0.1 | |
At 20 December 2010, issued ordinary shares upon subdivision of share capital | | | 999 | | | — | |
At 20 December 2010, issued ordinary shares to 2020 China Holdings, Ltd. | | | 26,098,188 | | | 2,610 | |
At 24 December 2010, issued ordinary shares of $0.0001 each to non-controlling shareholders of Acquity Group, LLC | | | 11,378,076 | | | 1,138 | |
| | | | |
At 31 December 2011 | | | 37,477,264 | | | 3,748 | |
| | |
By a resolution of the shareholder's meeting held on 20 December 2010, the Company's 500,000 authorised ordinary shares with a par value of $0.10 were divided into 500,000,000 shares at par value of $0.0001. Accordingly, the Company's 1 authorised and issued ordinary share with a par value of $0.10 was increased to 1,000 shares with a par value of $0.0001.
F-33
Table of Contents
By a resolution of the directors' meeting held on 20 December 2010, the Company's share capital was increased by the amount of $2,610, by the issue of 26,098,188 new ordinary shares of $0.0001 each to 2020 China Holdings, Ltd.
On 24 December 2010, the Company entered into a sale and purchase agreement with non-controlling Class A unit holders of Acquity Group LLC (the "Unit Holders"). Pursuant to the agreement, the Unit Holders agreed to sell all their units, and the Company agreed to purchase the same from the Unit Holders on 24 December 2010. In consideration of the Unit Holders agreeing to sell the units to the Company, the Company issued 11,378,076 new ordinary shares with a par value of $0.0001. On the same date, the Company assigned to 2020 Global Investments, LLC the units purchased by the Company pursuant to the agreement. As a result, the Company became the sole shareholder of Acquity Group, LLC. The Company recorded $10,327,092 as capital reserve arising from the total consideration for Class A units of $10,328,230 less the par value of the newly issued shares of $1,138.
26. Share-based payment plan of Acquity Group, LLC
On 1 October 2009, the Group issued 51,482 units to ten of its subsidiaries' senior management personnel in accordance with the 2009 Incentive Unit Plan and the individual incentive unit agreements. The Incentive Units vest over a period of four years. Upon vesting, the Incentive Units are converted to Class A units with no cost to the incentive unit holders at an exercise price of $63.07. These units had an estimated fair value at the date of issuance of $890,000, which was recorded as unit compensation expense in the consolidated statements of comprehensive income over the service period. The grant date fair value of the Class A units was determined using the Black-Scholes Merton option analysis and discounted for lack of marketability of 26.5%. The following table lists the inputs to the model used to establish the grant date fair value:
| | |
| |
Dividend yield (%) | | 0% - 0% |
The expected volatility (%) | | 60.7% - 58.2% |
Risk-free interest rate (%) | | 1.39% - 1.76% |
Expected life of unit options | | 3 - 4 |
Model used | | Black-Scholes Model |
| |
The expected life of the share-based awards was based on historical data and expectations at the time of grant and was not necessarily indicative of exercise patterns that may occur. The expected stock price volatility was determined by assessing historical stock price volatility of comparable entities with lines of business similar to that of the Company. The expected volatility reflects the assumption that the historical volatility over a period similar to the life of the awards is indicative of future trends, which may not necessarily be the actual outcome.
The expense received for employee services is shown in the following table:
| | | | | | | | | | |
| | |
| | Year ended 31 December | |
|---|
| | 2011
USD
| | 2010
USD
| | 2009
USD
| |
|---|
| | |
Expense arising from share-based payment | | | — | | | 834,375 | | | 55,625 | |
| | |
F-34
Table of Contents
The share-based payment plan was settled during 2010. With respect to the settlement of the share-based payment, Acquity Group, LLC has accounted for settlement as an acceleration of vesting and, therefore, recognised immediately the amount that otherwise would have been recognised for services received over the reminder of the vesting period. The payment amounting to $256,825 made to the employees on the settlement of the share-based payment granted is accounted for as a deduction from non-controlling interests.
Movements in the year
The following table illustrates the number of units and movement of the awards during the reporting periods:
| | | | | | | | | | |
| | |
| | Year ended 31 December | |
|---|
| | 2011
USD
| | 2010
USD
| | 2009
USD
| |
|---|
| | |
Outstanding balance at 1 January | | | — | | | 51,482 | | | — | |
Settled during the year | | | — | | | (51,482 | ) | | — | |
Awarded during the year | | | — | | | — | | | 51,482 | |
| | | | |
Outstanding balance at 31 December | | | — | | | — | | | 51,482 | |
| | |
27. Commitments and contingencies
Operating lease
The Group leases office space in various locations throughout the United States under non-cancellable operating lease agreements that mature through February 2018. For the periods indicated, rent expense approximated the following:
| | | | | | | | | | |
| | |
| | Year ended 31 December | |
|---|
| | 2011
USD
| | 2010
USD
| | 2009
USD
| |
|---|
| | |
Rent expense | | | 2,364,000 | | | 1,684,000 | | | 1,587,000 | |
| | |
At the respective reporting date, future minimum rental payments under non-cancellable operating leases are due as follows:
| | | | | | | | | | |
| | |
| | Year ended 31 December | |
|---|
| | 2011
USD
| | 2010
USD
| | 2009
USD
| |
|---|
| | |
Within one year | | | 2,475,582 | | | 1,916,458 | | | 1,500,975 | |
After one year but not more than five years | | | 7,660,363 | | | 6,087,795 | | | 4,456,256 | |
More than five years | | | 474,923 | | | 337,708 | | | 1,104,827 | |
| | | | |
| | | 10,610,868 | | | 8,341,961 | | | 7,062,058 | |
| | |
Capital lease
The book value of assets under capital lease at the end of the reporting periods is as follows:
| | | | | | | | | | |
| | |
| | Year ended 31 December | |
|---|
| | 2011
USD
| | 2010
USD
| | 2009
USD
| |
|---|
| | |
Assets under capital lease | | | — | | | — | | | 50,571 | |
| | |
F-35
Table of Contents
The Group has a bargain purchase option on certain computers and office equipment under capital lease. Future minimum lease payments under capital leases due and the present value of the minimum lease payments are as follows:
| | | | | | | | | | | | | | | | | | | |
| | |
| | Minimum payments
31 December | | Present value of payments
31 December | |
|---|
| | 2011
USD
| | 2010
USD
| | 2009
USD
| | 2011
USD
| | 2010
USD
| | 2009
USD
| |
|---|
| | |
Within one year | | | — | | | — | | | 339,091 | | | — | | | — | | | 324,699 | |
After one year but not more than five years | | | — | | | — | | | 22,288 | | | — | | | — | | | 22,058 | |
| | | | |
Total minimum lease payments | | | — | | | — | | | 361,379 | | | — | | | — | | | 346,757 | |
| | |
Guarantees
The Group has provided a guarantee to Shanghai Pudong Development Bank for the bank borrowings of the joint venture, Huaren Kudong Commercial Trading Co., Ltd., to a maximum amount of RMB14,000,000. No liability is expected to arise.
28. Related party disclosures
The related parties of the Group and nature of their relationship with the Group are as follows:
| | |
| |
Name
| | Relationship with the Group
|
|---|
| |
G. George Lu | | Executive Chairman and Group Chief Executive |
Adrian Chan | | Director and Company Secretary |
Wing Chung Anders Cheung | | Independent Director |
William John Sharp | | Independent Director |
Donghui Wang | | Independent Director |
Paul Weinewuth | | Chief Financial Officer |
Raymond Grady | | Executive Vice President and Global Head of Sales |
2020 China Holdings, Ltd. | | Parent Company |
2020 Equity Partnership Limited | | A company under significant influence of a key officer of the Group |
Rong Ju | | Principal Shareholder |
Khazanah Nasional Berhad | | Principal Shareholder |
Dalton Family Limited Partnership | | Principal Shareholder |
SHK Asian Opportunities Fund, L.P. | | Principal Shareholder |
Weinewuth Family Limited Partnership | | Principal Shareholder |
Schmeltz Family Limited Partnership | | Principal Shareholder |
Spear Holdings LLC | | Principal Shareholder |
Surfmax Corp. | | A company wholly owned by a key officer of the Group |
Huaren Kudong Commercial Trading Co., Ltd. | | Joint Venture |
Digital Li-Ning Company Limited | | Joint Venture |
| |
F-36
Table of Contents
At the respective reporting date, the Group's balances with the related parties are as follows:
| | | | | | | | | | | | |
| | |
| |
| | 31 December | |
|---|
Amounts due from related parties
| | Relationship
| | 2011
USD
| | 2010
USD
| | 2009
USD
| |
|---|
| | |
Huaren Kudong Commercial Trading Co., Ltd. | | Joint venture | | | 100,000 | | | | | | | |
Digital Li-Ning Company Limited | | Joint venture | | | 145,730 | | | — | | | — | |
2020 China Holdings | | Parent company | | | 2,610 | | | 2,610 | | | — | |
| | | | | | |
| | | | | 248,340 | | | 2,610 | | | — | |
| | |
| | | | | | | | | | | | |
| | |
| |
| | 31 December | |
|---|
Amounts due to related parties
| | Relationship
| | 2011
USD
| | 2010
USD
| | 2009
USD
| |
|---|
| | |
William John Sharp | | Independent Director | | | — | | | — | | | 50,000 | |
2020 Equity Partners Limited | | A company under significant influence of the ultimate controllers | | | — | | | 34,880 | | | 470,704 | |
Surfmax Corp. | | A company wholly owned by a key officer the Group | | | — | | | — | | | 50,000 | |
| | | | | | |
| | | | | — | | | 34,880 | | | 570,704 | |
| | |
| | | | | | | | | | | | |
| | |
| |
| | 31 December | |
|---|
Guarantees provided to creditors of related parties
| | Relationship
| | 2011
USD
| | 2010
USD
| | 2009
USD
| |
|---|
| | |
Huaren Kudong Commercial Trading Co., Ltd. | | Joint venture | | | 1,870,624 | | | — | | | — | |
| | |
The amounts due to related parties are unsecured, non-interest bearing and repayable on demand. Significant trade transactions in connection with the amounts due to related parties are disclosed below.
The Group entered into the following significant transactions with the related parties:
| | | | | | | | | | | | |
| | |
| |
| | Year ended 31 December | |
|---|
Name of related party
| | Nature of transaction
| | 2011
USD
| | 2010
USD
| | 2009
USD
| |
|---|
| | |
William John Sharp | | Consultancy fee | | | 50,000 | | | 50,000 | | | 50,000 | |
2020 Equity Partners Limited | | Management fee | | | — | | | 1,052,688 | | | 1,100,000 | |
Surfmax Corp. | | Management fee | | | 50,000 | | | 50,000 | | | 50,000 | |
Loan receivable from officers of Acquity Group LLC | | Interest income | | | 85,541 | | | — | | | — | |
2020 China Holdings | | Consideration paid for convertible bond transfer | | | — | | | 3,916,000 | | | — | |
2020 China Holdings | | Transfer of convertible bond | | | — | | | 60,702,675 | | | — | |
| | |
F-37
Table of Contents
The expenditure to related parties is made at terms equivalent to those that prevail in arm's length transactions. Outstanding balances at the end of the reporting period are unsecured, interest free and have been settled in cash. There have been no guarantees provided or received for any related party receivables or payables. For the reporting periods, the Group has not recorded any impairment of receivables relating to amounts owed by related parties. This assessment is undertaken each financial year through examining the financial position of the related party and the market in which the related party operates.
Compensation of key management personnel of the Group is as follows:
| | | | | | | | | | |
| | |
| | Year ended 31 December | |
|---|
| | 2011
USD
| | 2010
USD
| | 2009
USD
| |
|---|
| | |
Short-term benefits | | | 718,973 | | | 615,842 | | | 478,247 | |
| | |
The remuneration of key management personnel is determined by the board of directors having regard to the performance of individuals and market trends.
29. Non-controlling interest
The changes of non-controlling interest ("NCI") are as follows:
| | | | |
| | |
| | USD
| |
|---|
| | |
As of 1 January 2009 | | | 11,098,478 | |
NCI income from net income | | | 2,202,490 | |
Amortization of additional identifiable intangible assets | | | (807,962 | ) |
| | | | |
Subtotal | | | 1,394,528 | |
| | | | |
Redemption | | | (598,731 | ) |
Compensation (Note 26) | | | 55,625 | |
Distribution | | | (2,563,179 | ) |
| | | | |
As of 31 December 2009 | | | 9,386,721 | |
| | | | |
NCI income from net income | | | 2,962,670 | |
Amortization of additional identifiable intangible assets | | | (802,095 | ) |
| | | | |
Subtotal | | | 2,160,575 | |
| | | | |
Redemption | | | (77,271 | ) |
Settlement | | | (256,825 | ) |
Compensation (Note 26) | | | 834,375 | |
Distribution | | | (1,980,012 | ) |
Proceeds from unit issuance | | | (10,328,230 | ) |
Acquisition of interest in subsidiaries(*) | | | 1,244,081 | |
| | | | |
As of 31 December 2010 | | | 983,414 | |
| | | | |
NCI loss from net income | | | (271,827 | ) |
NCI other comprehensive income | | | 33,695 | |
| | | | |
Subtotal | | | (238,132 | ) |
| | | | |
As of 31 December 2011 | | | 745,282 | |
| | |
(*) At the incorporation of Cool Sports (BVI) Limited, 33% of Cool Sports (BVI) Limited was acquired by non-controlling interests for $985,000.
F-38
Table of Contents
30. Financial risk management objectives and policies
The Group's principal financial liabilities comprise trade payables, other payables and accruals, amount due to related parties, interest-bearing borrowings, tax payables and convertible bonds. The main purpose of these financial liabilities is to raise finances for the Group's operations. The Group's principal financial assets comprise trade receivables, other receivables, amount due from related parties, pledged deposits and cash and cash equivalents that are derived directly from its operations.
The main risks arising from the Group's financial instruments are market risk, credit risk and liquidity risk. The Group's senior management oversees the management of these risks. The Group's senior management is supported by a financial risk committee that advises on financial risk and the appropriate financial risk governance framework for the Group. The financial risk committee provides assurance to the Group's senior management that the Group's financial risk-taking activities are governed by appropriate policies and procedures and that financial risks are identified, measured and managed in accordance with group policies and group risk appetite. The Group does not invest in derivative instruments and its compliance is reviewed annually.
The Board of Directors reviews and agrees policies for managing each of these risks which are summarized below.
Market risk
Market risk is the risk that the fair value of future cash flows of a financial instrument will fluctuate because of changes in market prices. Market prices comprise two types of risk: interest rate risk and currency risk. Financial instruments affected by market risk include borrowings, pledged deposits, cash and cash equivalents and convertible promissory bonds.
The sensitivity analysis at the end of each reporting period is summarized as follows:
Interest rate risk
Interest rate risk is the risk that the fair value or future cash flows of a financial instrument will fluctuate because of changes in market interest rates. The Group's exposure to the risk of changes in market interest rates relates primarily to the Group's interest-bearing borrowings, and convertible bonds.
Interest rate sensitivity
The assumed movement in basis points for interest rate sensitivity analysis is based on the currently observable market environment. Since the Group maintains fixed rate leases and an interest rate floor, 5% increases or decreases in the interest rate would not affect the Group's profit.
Foreign currency risk
Foreign currency risk is the risk that the fair value or future cash flows of a financial instrument will fluctuate because of changes in foreign exchange rates.
The Group's exposure to the risk of changes in foreign exchange rates is considered to be immaterial since operating activities of the Group are conducted in USD.
F-39
Table of Contents
Credit risk
Credit risk is the risk that a counterparty will not meet its obligations under a financial instrument or customer contract, leading to a financial loss. The Group is exposed to credit risk from its operating activities (primarily for trade and notes receivables, and other receivable) and from its financing activities, including deposits with banks and financial institutions.
Customer credit risk is managed subject to the Group's established policy, procedures and control relating to customer credit risk management. Credit quality of the customer is assessed through credit verification procedures. Outstanding customer receivables are regularly monitored with the result that the Group's exposure to bad debts is not significant. The requirement for an impairment is analysed at each reporting date on an individual basis for major customers. The maximum exposure to credit risk at the reporting date is the carrying value of each class of financial assets disclosed in Note 24. Management considers that a concentration of credit risk exists when outstanding trade receivables from one customer exceed 10% of total trade receivables. There were no concentrations of credit risk as of 31 December 2011, 2010 and 2009.
With respect to credit risk arising from the other financial assets of the Group, which comprise restricted cash, cash and cash equivalents, the Group's exposure to credit risk arises from default of the counterparty, with a maximum exposure equal to the carrying amount of these instruments disclosed in Note 16.
Liquidity risk
Liquidity risk is the risk of non-availability of funds to meet all contractual financial commitments as they fall due. The Group's policy is to maintain sufficient cash and cash equivalents or have available funding through adequate amounts of committed credit facilities from financial institutions to meet its commitments over the foreseeable future in accordance with its strategic plan.
The table below summarises the maturity profile of the Group's financial liabilities as at the end of the reporting period, based on contractual undiscounted payment.
| | | | | | | | | | | | | | | | |
| | |
| | On demand
USD
| | Less than
3 months
USD
| | 3 to
12 months
USD
| | 1 to
5 years
USD
| | Total
USD
| |
|---|
| | |
31 December 2011 | | | | | | | | | | | | | | | | |
Trade payables | | |
1,498,561 | | |
— | | |
— | | |
— | | |
1,498,561 | |
Other payables and accruals | | | 8,235,230 | | | — | | | — | | | — | | | 8,235,230 | |
| | | | |
| | | 9,733,791 | | | — | | | — | | | — | | | 9,733,791 | |
| | |
| | | | | | | | | | | | | | | | |
| | |
| | On demand
USD
| | Less than
3 months
USD
| | 3 to
12 months
USD
| | 1 to
5 years
USD
| | Total
USD
| |
|---|
| | |
31 December 2010 | | | | | | | | | | | | | | | | |
Trade payables | | |
1,051,618 | | |
— | | |
— | | |
— | | |
1,051,618 | |
Other payables and accruals | | | 6,441,858 | | | — | | | — | | | — | | | 6,441,858 | |
| | | | |
| | | 7,493,476 | | | — | | | — | | | — | | | 7,493,476 | |
| | |
F-40
Table of Contents
| | | | | | | | | | | | | | | | |
| | |
| | On demand
USD
| | Less than
3 months
USD
| | 3 to
12 months
USD
| | 1 to
5 years
USD
| | Total
USD
| |
|---|
| | |
31 December 2009 | | | | | | | | | | | | | | | | |
Trade payables | | |
452,074 | | |
— | | |
— | | |
— | | |
452,074 | |
Other payables and accruals | | | 3,870,971 | | | — | | | — | | | — | | | 3,870,971 | |
Accrued unit redemption liability | | | — | | | — | | | 4,435,937 | | | — | | | 4,435,937 | |
Interest-bearing borrowings | | | — | | | 96,417 | | | 1,289,254 | | | 22,058 | | | 1,407,729 | |
Convertible bonds | | | — | | | — | | | — | | | 58,384,796 | | | 58,384,796 | |
| | | | |
| | | 4,323,045 | | | 96,417 | | | 5,725,191 | | | 58,406,854 | | | 68,551,507 | |
| | |
Capital management
The primary objective of the Group's capital management is to safeguard the Group's ability to continue as a going concern and to maintain healthy capital ratios in order to support its business.
The Group manages its capital structure and makes adjustments to it, in light of changes in economic conditions. To maintain or adjust the capital structure, the Group may adjust the dividend payment to shareholders, return capital to shareholders or issue new shares. No changes were made in the objectives, policies or processes during the reporting periods.
The Group monitors capital using a gearing ratio, which is net debt divided by the capital plus net debt. Net debt includes trade payables, other payables and accruals, interest-bearing borrowings, convertible bonds, less cash and cash equivalents.
| | | | | | | | | | |
| | |
| | 31 December | |
|---|
| | 2011
USD
| | 2010
USD
| | 2009
USD
| |
|---|
| | |
Trade payables | | | 1,498,561 | | | 1,051,618 | | | 452,074 | |
Other payables and accruals | | | 8,235,230 | | | 6,441,858 | | | 3,870,971 | |
Accrued unit redemption liability | | | — | | | — | | | 4,435,937 | |
Convertible bonds | | | — | | | — | | | 58,384,796 | |
Interest-bearing borrowings | | | — | | | — | | | 1,407,729 | |
| | | | |
| | | 9,733,791 | | | 7,493,476 | | | 68,551,507 | |
Less: Cash and cash equivalents | | | (6,874,657 | ) | | (12,427,908 | ) | | (11,203,656 | ) |
Less: Restricted cash | | | (2,600,000 | ) | | — | | | (8,596,216 | ) |
| | | | |
Net debt | | | 259,134 | | | (4,934,432 | ) | | 48,751,635 | |
Capital | | | 64,434,471 | | | 55,997,096 | | | (1,100,728 | ) |
| | | | |
Capital and net debt | | | 64,693,605 | | | 51,062,664 | | | 47,650,907 | |
| | | | |
Gearing ratio | | | 0.40 | % | | N/A | | | N/A | |
| | |
F-41
Table of Contents
31. Fixed-price contracts
The Group's revenues recognised based on fixed-price contracts, which are accounted for in accordance with IAS 11, are as follows:
| | | | | | | | | | |
| | |
| | Year ended 31 December | |
|---|
| | 2011
USD
| | 2010
USD
| | 2009
USD
| |
|---|
| | |
Total contract amount | | | 9,731,887 | | | 8,466,671 | | | 3,116,624 | |
Contract revenue recognised in the year | | | 8,281,760 | | | 5,131,426 | | | 2,634,071 | |
| | |
The status of the Group's contracts in progress at the end of reporting periods are as follows:
| | | | | | | | | | |
| | Year ended 31 December | |
|---|
| | 2011
USD
| | 2010
USD
| | 2009
USD
| |
|---|
| | |
Contract costs incurred to date | | | 1,379,310 | | | 1,216,519 | | | 584,311 | |
Recognised profits to date | | | 992,742 | | | 1,545,672 | | | 975,164 | |
Contract revenue recognised to date | | | 2,372,052 | | | 2,762,191 | | | 1,559,475 | |
Progress billings | | | 1,957,711 | | | 1,855,905 | | | 1,582,931 | |
Unbilled contract revenue | | | 455,781 | | | 906,286 | | | — | |
Billings in excess of revenue recognised | | | 41,440 | | | — | | | 23,456 | |
| | |
32. Joint ventures
The table below summarizes the Company's investments in joint ventures at the respective reporting date:
| | | | | | | | | | |
| | |
| | 31 December | |
|---|
| | 2011
USD
| | 2010
USD
| | 2009
USD
| |
|---|
| | |
Huaren Kudong Commercial Trading Co., Ltd: | | | | | | | | | | |
Initial investment | | | 2,831,985 | | | — | | | — | |
Equity method loss recognized | | | (812,401 | ) | | — | | | — | |
Other comprehensive income | | | 101,920 | | | — | | | — | |
| | | | |
Investment value at December 31, 2011 | | | 2,121,504 | | | — | | | — | |
| | | | |
Digital Li-Ning Company Limited: | | | | | | | | | | |
Initial investment | | | 1,990,000 | | | — | | | — | |
Equity method loss recognized | | | (224,836 | ) | | — | | | — | |
| | | | |
Investment value at December 31, 2011 | | | 1,765,164 | | | — | | | — | |
| | | | |
Total investments in joint venture | | | 3,886,668 | | | — | | | — | |
| | |
Huaren Kudong Commercial Trading Co., Ltd.
In December 2010, Cool Sports (HK) Limited, one of our subsidiaries, entered into an equity joint venture in the PRC relating to k121.com, a leading brand e-commerce website for
F-42
Table of Contents
sportswear products in China. Cool Sports (HK) Limited entered into the joint venture, Huaren Kudong Commercial Trading Co., Ltd., or Huaren Kudong Commercial (the "Joint Venture"), with three individuals, Mr. Qigong Zhu, Mr. Yan Wang and Mr. Shiu Wah Tse, for a term of 30 years. On 9 May 2011, the Joint Venture was established and holds a business license issued by the Administration of Industry and Commerce in Beijing. According to the agreement, Cool Sports (HK) Limited will invest RMB 18,000,000 (USD 2,831,985) in the Joint Venture, after which Cool Sports (HK)
Limited will hold 94.74% of the ownership. As the Company holds 20% (1 of 5 board seats) of the joint venture voting power, it has the ability to exercise significant influence over this joint venture. Therefore, the investment is accounted for as an associate of the Company using the equity method in accordance with IAS 28. Cool Sports, Mr. Zhu, Mr. Wang and Mr. Tse own equity interests of 94.7%, 2.6%, 2.0% and 0.7%, respectively. Under an investment framework agreement entered into between the parties to the joint venture, Cool Sports (HK) Limited, Mr. Tse, Mr. Wang and Mr. Zhu are entitled to 5.0%, 28.0%, 50.2% and 16.8%, respectively, of the total profit earned by the joint venture. If the joint venture achieves certain agreed sales volume or revenue targets, Mr. Tse shall allocate to Mr. Wang and Mr. Zhu 5.3% and 1.8% of the profit, respectively, from the 28.0% profit share attributable to Mr. Tse. If the joint venture fails to fully achieve those targets, Mr. Wang and Mr. Zhu will be given lesser allocations of the profit share from Mr. Tse based on an agreed formula. Separately, Mr. Tse has undertaken to transfer his entitlement to the profit distribution in the joint venture to Cool Sports (HK) Limited at a nominal price if either of the sales volume or revenue targets is achieved. In any event, Mr. Tse has agreed to transfer all his entitlement to profit distribution in the joint venture to Cool Sports (HK) Limited before 1 January 2014.
As of 31 December 2011, Huaren Kudong Commercial held total assets of $4,597,689 (including current assets of $4,514,415), total liabilities of $4,239,970 (all classified as current liabilities), and for the period from 9 May 2011 to 31 December 2011 recognized revenues of $5,497,831 and recognized a loss of $2,461,813. During the period from 9 May 2011 to 31 December 2011, the Company recognized a loss of $812,401 for its equity method investment in the Joint Venture.
Digital Li-Ning Company Limited
In July 2011, the Company entered into a joint venture with Li Ning. Through this joint venture, the Company will develop, market and sell via brand e-commerce and digital marketing into the U.S. market Li Ning sports apparel, shoes and accessories. Under our arrangements with Li Ning, we will develop a brand e-commerce platform for the joint venture company and will also set up a company in the United States to provide marketing services to the joint venture. Li Ning will be responsible for supplying product collections that are tailored for the U.S. market. In the event that Li Ning intends to pursue the sale of its branded products over an e-commerce platform outside of North America and China, the joint venture also will have a right of first refusal to establish and operate such platform. In July, 2011, under the shareholders' agreement entered into among Li Ning, the Company, Li Tang, G. George Lu and Digital Li-Ning Company Limited, or Digital Li-Ning, Li Ning and our company will each own 19.9% of the joint venture company, Digital Li-Ning. Li Ning has granted an exclusive right to the joint venture to sell its products in the United States through a proprietary e-commerce platform operated by the joint venture. Without the mutual written consent of Li Ning and us, the joint venture shall not engage in the marketing, promotion or
F-43
Table of Contents
sale of any other products and services other than Li-Ning products. In connection with the joint venture arrangements, Li Ning, our company and Digital Li-Ning also entered into a Contribution and License Agreement for Intellectual Property in July 2011. Pursuant to this agreement, Li Ning and the Company have each granted the joint venture a royalty-free, non-exclusive, non-transferable, irrevocable and non-sublicensable license to use certain trademark and trade names of Li-Ning, as well as our company's trademarks. The joint venture has also granted Li Ning and our company a royalty-free, perpetual and irrevocable license to use its intellectual property rights solely for internal use and in a manner that does not compete with the joint venture in its conduct of business in the United States. The Company has invested $1,990,000 for its 19.9% stake in this joint venture. As the Company holds 25% (1 of 4 board seats) of the joint venture voting power, it has the ability to exercise significant influence over this joint venture. Therefore, the investment in this joint venture is accounted for as an associate of the Company using the equity method in accordance with IAS 28.
As of 31 December 2011, Digital Li-Ning held total assets of $10,199,948 (including current assets of $9,677,857), total liabilities of $1,329,757 (all classified as current liabilities), and, for the period from 1 July 2011 to 31 December 2011 recognized revenues of $13,924 and recognized a net loss of $1,129,829. The financial year end date of Digital Li-Ning is 31 January, typical of consumer product retailers. During the period from 1 July 2011 to 31 December 2011, the Company recognized a loss of $224,836 for its equity method investment in the joint venture.
33. Approval of consolidated financial statement
The consolidated financial statements were approved by the board of directors and authorised for issue on 1 March 2012.
F-44

Table of Contents
American Depositary Shares
Acquity Group Limited

Representing Ordinary Shares
Prospectus
| | |
| Citigroup | | Oppenheimer & Co. |
William Blair & Company
|
, 2012
You should rely only on the information contained in this prospectus. We have not authorized anyone to provide you with information different from that contained in this prospectus. We are offering to sell, and seeking offers to buy, ADSs only in jurisdictions where offers and sales are permitted. The information contained in this prospectus in accurate only as of the date of this prospectus, regardless of the time of delivery of this prospectus or of any sale of our ADSs.
No action is being taken in any jurisdiction outside the United States to permit a public offering of the ADSs or possession or distribution of this prospectus in that jurisdiction. Persons who came into possession of this prospectus in jurisdictions outside the United States are required to inform themselves about and to observe any restrictions as to this offering and the distribution of this prospectus applicable to that jurisdiction.
Until, 2012 (the 25th day after the commencement of the offering), all dealers that buy, sell, or trade ADSs, whether or not participating in this offering, may be required to deliver a prospectus. This is in addition to the obligation of dealers to deliver a prospectus when acting as underwriters and with respect to their unsold allotments or subscriptions.
Table of Contents
Part II
Information not required in prospectus
Item 6. Indemnification of directors and officers.
Cayman Islands law does not limit the extent to which a company's articles of association may provide for indemnification of officers and directors, except to the extent any such provision may be held by the Cayman Islands courts to be contrary to public policy, such as to provide indemnification against civil fraud or the consequences or committing a crime. Our Articles of Association provide for indemnification of officers and directors for losses, damages, costs and expenses incurred in their capacities as such, except through their own willful neglect or default.
Pursuant to the form of indemnification agreements filed as Exhibit 10.2 to this Registration Statement, we will agree to indemnify our directors and officers against certain liabilities and expenses incurred by such persons in connection with claims made by reason of their being such a director or officer.
The form of Underwriting Agreement to be filed as Exhibit 1.1 to this Registration Statement will also provide for indemnification of us and our officers and directors.
Insofar as indemnification for liabilities arising under the Securities Act of 1933, as amended (the "Securities Act") may be permitted to directors, officers or persons controlling us pursuant to the foregoing provisions, we have been informed that in the opinion of the SEC such indemnification is against public policy as expressed in the Securities Act and is therefore unenforceable.
ITEM 7. Recent sales of unregistered securities
During the past three years, we have issued the following securities (including options to acquire our ordinary shares). We believe that each of the following issuances was exempt from registration under the Securities Act in reliance on Regulation S under the Securities Act or pursuant to Section 4(2) of the Securities Act regarding transactions not involving a public offering.
In February 2008, GlobalGrowth issued convertible bonds in the aggregate amount of US$50.2 million to two financial investors, Datai Bay Investments Ltd., or Datai Bay, and SHK Asian Opportunities Ltd., or SHK. Additional bonds were issued from August 2008 to April 2010, in the aggregate amount of US$2.1 million.
On August 12, 2010, we issued 1 ordinary share of par value US$0.10 to Walkers Nominees Limited.
On August 13, 2010, Walkers Nominees Limited transferred the 1 ordinary share held by it to 2020 China Holdings, Ltd.
On December 15, 2010, pursuant to a deed in respect of the convertible bonds issued by GlobalGrowth, the convertible bonds issued by GlobalGrowth were assigned by Datai Bay and SHK to China Holdings, in consideration of which China Holdings issued exchangeable bonds, to each of Datai Bay and SHK. The convertible bonds issued by GlobalGrowth were
II-1
Table of Contents
subsequently cancelled. China Holdings partially redeemed the exchangeable bonds it issued to Datai Bay, in the principal amount of US$26.6 million, which redemption was financed by the existing cash reserves of China Holdings, as well as the issue of some exchangeable notes in the aggregate amount of US$25.8 million, to two parties, namely, Surfmax Investment Partners Limited, or Surfmax, and G. George Lu, our executive chairman and group chief executive. This partial redemption of the exchangeable bonds and issuance of exchangeable notes were completed in February 2011.
On December 20, 2010, pursuant to the sole shareholder resolution dated December 20, 2010, the 1 ordinary share held by 2020 China Holdings, Ltd. was sub-divided into 1,000 ordinary shares of par value US$0.0001 each. We issued an additional 26,098,188 ordinary shares to 2020 China Holdings, Ltd., pursuant to directors resolutions dated December 20, 2010.
On December 24, 2010, we allotted 14,958, 254,315, 281,209, 23,484, 9,558,923, 124,659, 152,032, 19,715, 706,403, 18,009, 224,369 ordinary shares to Rick Nash, James Newman, Andrew Peebler, Todd Schwarz, Acquity Holdings, L.L.C., Jonathan Borg-Breen, Jay Dettling, Kevin Doohan, Raymond Grady, Christopher Hauca, Mark Joseph, respectively, in consideration of those unit holders agreeing to transfer all their respective units in the capital of Acquity Group LLC to us.
No underwriters were involved in the foregoing sales of securities.
Item 8. Exhibits and financial statement schedules.
- (a)
- Exhibits
See Exhibit Index beginning on page II-6 of this registration statement.
- (b)
- Financial Statement Schedules
Schedules have been omitted because the information required to be set forth therein is not applicable or is shown in the Consolidated Financial Statements or the Notes thereto.
Item 9. Undertakings.
The undersigned registrant hereby undertakes to provide to the underwriters at the closing specified in the underwriting agreements, certificates in such denominations and registered in such names as required by the underwriters to permit prompt delivery to each purchaser.
Insofar as indemnification for liabilities arising under the Securities Act may be permitted to directors, officers and controlling persons of the registrant pursuant to the provisions described in Item 6, or otherwise, the registrant has been advised that in the opinion of the SEC such indemnification is against public policy as expressed in the Securities Act and is therefore unenforceable. In the event that a claim for indemnification against such liabilities (other than the payment by the registrant of expenses incurred or paid by a director, officer or controlling person of the registrant in the successful defense of any action, suit or proceeding) is asserted by such director, officer or controlling person in connection with the securities being registered, the registrant will, unless in the opinion of its counsel the matter has been settled by controlling precedent, submit to a court of appropriate jurisdiction the question whether such
II-2
Table of Contents
indemnification by it is against public policy as expressed in the Securities Act and will be governed by the final adjudication of such issue.
The undersigned registrant hereby undertakes that:
(1) For purposes of determining any liability under the Securities Act, the information omitted from the form of prospectus filed as part of this registration statement in reliance upon Rule 430A and contained in a form of prospectus filed by the registrant under Rule 424(b)(1) or (4) or 497(h) under the Securities Act shall be deemed to be part of this registration statement as of the time it was declared effective.
(2) For the purpose of determining any liability under the Securities Act, each post-effective amendment that contains a form of prospectus shall be deemed to be a new registration statement relating to the securities offered therein, and the offering of such securities at that time shall be deemed to be the initialbona fide offering thereof.
II-3
Table of Contents
Signatures
Pursuant to the requirements of the Securities Act of 1933, the registrant certifies that it has reasonable grounds to believe that it meets all of the requirements for filing on Form F-1 and has duly caused this registration statement to be signed on its behalf by the undersigned, thereunto duly authorized, in Beijing, China, on March 8, 2012.
| | | | |
| | | ACQUITY GROUP LIMITED |
|
|
By: |
|
/s/ G. GEORGE LU
Name: G. George Lu
Title: Executive Chairman and Group Chief Executive
|
II-4
Table of Contents
Power of attorney
Each person whose signature appears below constitutes and appoints G. George Lu and Adrian Chan as attorneys-in-fact with full power of substitution, for him or her in any and all capacities, to do any and all acts and all things and to execute any and all instruments which said attorney and agent may deem necessary or desirable to enable the registrant to comply with the Securities Act of 1933, as amended (the "Securities Act"), and any rules, regulations and requirements of the Securities and Exchange Commission thereunder, in connection with the registration under the Securities Act of ordinary shares of the registrant (the "Shares"), including, without limitation, the power and authority to sign the name of each of the undersigned in the capacities indicated below to the Registration Statement on Form F-1 (the "Registration Statement") to be filed with the Securities and Exchange Commission with respect to such Shares, to any and all amendments or supplements to such Registration Statement, whether such amendments or supplements are filed before or after the effective date of such Registration Statement, to any related Registration Statement filed pursuant to Rule 462(b) under the Securities Act, and to any and all instruments or documents filed as part of or in connection with such Registration Statement or any and all amendments thereto, whether such amendments are filed before or after the effective date of such Registration Statement; and each of the undersigned hereby ratifies and confirms all that such attorney and agent shall do or cause to be done by virtue hereof.
Pursuant to the requirements of the Securities Act, this Registration Statement has been signed by the following persons in the capacities indicated on March 8, 2012.
| | | | |
Signature | | Title | | Date |
|---|
|
|
|
|
|
/s/ G. GEORGE LU
Name: G. George Lu | | Executive Chairman and
Group Chief Executive
(Principal Executive Officer) | | March 8, 2012 |
|
|
|
|
|
/s/ ADRIAN CHAN
Name: Adrian Chan | | Director and Company Secretary | | March 8, 2012 |
|
|
|
|
|
/s/ WILLIAM JOHN SHARP
Name: William John Sharp | | Independent Director | | March 8, 2012 |
|
|
|
|
|
/s/ WING CHUNG ANDERS CHEUNG
Name: Wing Chung Anders Cheung | | Independent Director | | March 8, 2012 |
|
|
|
|
|
/s/ DONGHUI WANG
Name: Donghui Wang | | Independent Director | | March 8, 2012 |
|
|
|
|
|
/s/ PAUL WEINEWUTH
Name: Paul Weinewuth | | Chief Financial Officer
(Principal Financial and Accounting Officer) | | March 8, 2012 |
|
|
|
|
|
/s/ PAUL WEINEWUTH
Name: Paul Weinewuth
Title: Chief Financial Officer,
Acquity Group LLC | | Authorized U.S. Representative
| | March 8, 2012 |
II-5
Table of Contents
Acquity Group Limited
Exhibit Index
| | |
Exhibit number | | Description of document |
|---|
| 1.1* | | Form of Underwriting Agreement |
| 3.1 | | Amended and Restated Memorandum and Articles of Association of the Registrant, as currently in effect |
| 3.2 | | Form of Second Amended and Restated Memorandum and Articles of Association of the Registrant (effective upon the completion of this offering) |
| 4.1* | | Registrant's Specimen American Depositary Receipt (included in Exhibit 4.3) |
| 4.2 | | Registrant's Specimen Certificate for Ordinary Shares |
| 4.3* | | Form of Deposit Agreement, among the Registrant, the depositary and holders of the American Depositary Receipts(1) |
| 4.4 | | Form of Registration Rights Agreement |
| 5.1 | | Form of opinion of Walkers regarding the validity of the ordinary shares being registered |
| 5.2 | | Form of opinion of Jingtian & Gongcheng regarding certain PRC legal matters |
| 8.1 | | Form of opinion of Shearman & Sterling LLP regarding certain U.S. tax matters |
| 8.2 | | Form of Opinion of Walkers regarding certain Cayman Islands tax matters (included in Exhibit 5.1) |
| 10.1 | | Share Incentive Plan |
| 10.2 | | Form of Indemnification Agreement with the Registrant's directors |
| 10.3 | | Form of Employment Offer Letter with the Registrant's Executive Officers, with a schedule setting forth details for different terms for the officers |
| 10.4 | | Form of Employment Agreement with senior management of Acquity Group LLC, with a schedule setting forth details for different terms for the officers |
| 10.5 | | Deed in Respect of the Convertible Bonds Issued by 2020 GlobalGrowth Equity Limited dated as of December 21, 2007, between GlobalGrowth and SHK |
| 10.6 | | Deed in Respect of the Convertible Bonds Issued by 2020 GlobalGrowth Equity Limited dated as of December 14, 2007, between GlobalGrowth and Datai Bay |
| 10.7 | | Agreement in Respect of the Issue of Note by 2020 China Holdings, Ltd., dated as of February 11, 2011, between China Holdings and Surfmax |
| 10.8 | | Supplemental Agreement to the Agreement in Respect of the Issue of Note by 2020 China Holdings, Ltd., dated as of February 23, 2011, between Surfmax and China Holdings |
| 10.9 | | Agreement in Respect of the issue of note by 2020 China Holdings, Ltd., dated as of February 23, 2011, between China Holdings and G. George Lu |
| 10.10 | | Investment Management Agreement dated as of February 21, 2008, between GlobalGrowth and Equity Partners |
| 10.11 | | Unit Purchase and Redemption Agreement, dated as of March 20, 2008, between Global Investments and Acquity Group LLC |
| 10.12 | | Sale and Purchase Agreement, dated as of December 24, 2010, among Acquity Group Limited, 2020 China Holdings, Ltd. and certain senior management |
| 10.13* | | Deed in Respect of the Bonds Issued by 2020 China Holdings Ltd., among 2020 China Holdings Ltd., Datai Bay Investments Ltd., SHK Asian Opportunities Holdings Ltd. and 2020 Equity Partners Limited. |
| 10.14* | | Deed in Respect of Notes issued by 2020 China Holdings Ltd., among 2020 China Holdings Ltd., G. George Lu, Surfmax Investments Partners Limited and 2020 Equity Partners Limited. |
| 21.1 | | Subsidiaries of the Registrant |
II-6
Table of Contents
| | |
Exhibit number | | Description of document |
|---|
| 23.1 | | Consent of Ernst & Young LLP, an Independent Registered Public Accounting Firm |
| 23.2 | | Consent of Walkers (included in Exhibit 5.1) |
| 23.3 | | Consent of Shearman & Sterling LLP (included in Exhibit 8.1) |
| 23.4 | | Consent of Jingtian & Gongcheng (included in Exhibit 5.2) |
| 24.1 | | Powers of Attorney (included on signature page) |
| 99.1 | | Code of Business Conduct and Ethics of the Registrant |
* To be filed by amendment.
(1) Incorporated by reference to the Registration Statement on Form F-6 (file No. 333- ) filed with the SEC with respect to American depositary shares representing ordinary shares.
II-7