Exhibit 99.1

Investor Presentation NobleCon – January 2019 Genie Energy Ltd (NYSE: GNE)

Safe Harbor Statement 2 This presentation contains forward - looking statements. Statements that are not historical facts are forward - looking statements and such forward - looking statements are statements made pursuant to the Safe Harbor Provisions of the Private Securities Litigation Reform Act of 1995 . E xamples of forward - looking statements include: • statements about Genie’s and its divisions’ future performance; • projections of Genie’s and its divisions’ results of operations or financial condition; and • statements regarding Genie’s plans, objectives or goals, including those relating to its strategies, initiatives, competition , a cquisitions, dispositions and/or its products and offerings. Words such as "believe," "anticipate," "plan," "expect," "intend," "target," "estimate," "project," "predict," "forecast," "g uid eline," "aim," "will," "should," “likely,” "continue" and similar expressions are intended to identify forward - looking statements but are not the exclusive means of identi fying such statements. Readers are cautioned not to place undue reliance on these forward - looking statements and all such forward - looking statements ar e qualified in their entirety by reference to the following cautionary statements. Forward - looking statements are based on Genie’s current expectations, estimates and assumptions and because forward - looking stat ements address future results, events and conditions, they, by their very nature, involve inherent risks and uncertainties, many of which are unfor ese eable and beyond the Genie’s control. Such known and unknown risks, uncertainties and other factors may cause Genie’s actual results, performance or other ac hievements to differ materially from the anticipated results, performance or achievements expressed, projected or implied by these forward - looking st atements. These factors include those discussed under the headings "Risk Factors" and “Management’s Discussion and Analysis of Financia l C ondition and Results of Operations in Genie’s periodic filings made with the Securities and Exchange Commission. Genie cautions that such factors are not exhaustive and that other risks and uncertainties may cause actual results to differ ma terially from those in forward - looking statements. Forward - looking statements speak only as of the date they are made and are statements of Genie’s current expectations concerning future results, events and conditions and Genie is under no obligation to update any of the forward - looking statements, whether as a result of new info rmation, future events or otherwise.

Genie Energy | at a glance 3 Genie Retail Energy Services Genie Energy Ltd.* (NYSE: GNE) (NYSE: GNEPRA) Genie Retail Energy Genie Retail Energy International * Genie Oil and Gas (GOGAS) and Afek not included. The company has reduced its oil and gas exploration operations accounted for in these business units Genie Energy Class B Common Stock Symbol NYSE: GNE Stock Price 1 $8.17 Shares Outstanding 2 26.5 million Dividend Yield 1 3.7% Market Capitalization 1 $216 million Genie Energy Series 2012-A Preferred Stock Symbol NYSE: GNEPRA Stock Price 1 $8.07 Shares Outstanding 2.3 million Dividend Yield 1 7.9% Cash 3, 4 $46.9 million Debt 4 $2.5 million Revenue (TTM) 5 $290.6 million Income from operations (TTM) 5 $10.8 million Adjusted EBITDA (TTM) 5, 6 $27.4 million Full time employees 175 1 Market data as of 1/22/2019 3 Includes cash, cash equivalents and restricted cash 4 As of 09/30/2018 5 TTM - Twelve months ended 09/30/2018 6 Non-GAAP measure. See reconciliation to corresponding GAAP measure later in this presentation 2 Includes 1.6 million shares of Class A common stock convertible to Class B common stock and not publicly traded

Investment Thesis Successfully restructured operations to focus on growth within Retail Energy and Energy Services businesses Strategic Transition • Legacy oil and gas exploration operations have been substantially reduced Genie Energy is expanding domestic and international operations Strong G rowth O pportunities ● Domestic : Growth potential through organic meter adds, geographic expansion and strategic acquisitions. Entering Texas, one of the nation’s largest deregulated electricity markets, in 1H18 ● International : Operations in Great Britain and Finland. Preparing to launch in Japan. ● Services : Energy brokerage and expanding solar offerings continue expansion Yield on Genie common and preferred stocks supported by strong cash flows and balance sheet Attractive D ividend 4

Genie Retail Energy Overview Genie Retail Energy operates a leading portfolio of domestic retail energy providers (REP s ) • Launched in 2004. • Now among the largest independent residential REPs • Domestic operations in 14 states and D.C. • History of strong financial performance 5

Genie Retail Energy Overview Value proposition ● Customers: Power of choice, value added services and potential savings ● Utilities: Removes load - based risk while generating fees from services 6 Managed - risk model ● Many utilities offer purchase of receivables programs – reducing credit risk ● Asset – light business model reduces capital - at - risk ● Geographic diversity mitigates regulatory and weather related risks

7 Commentary ● 2014 : First half Polar Vortex increases churn. Second half stabilization ● 2015 - 2016 : Strong sequential electric meter, RCE growth and new territories ● 2016 : Acquired Town Square Energy in fourth quarter ● 2017 : Organic RCE growth ● 2018: Declines through first three quarters reflect compliance with a regulatory mandate and reduced investment in domestic meter acquisitions Meters and RCEs (Domestic) Meters Residential Customer Equivalents (RCEs)
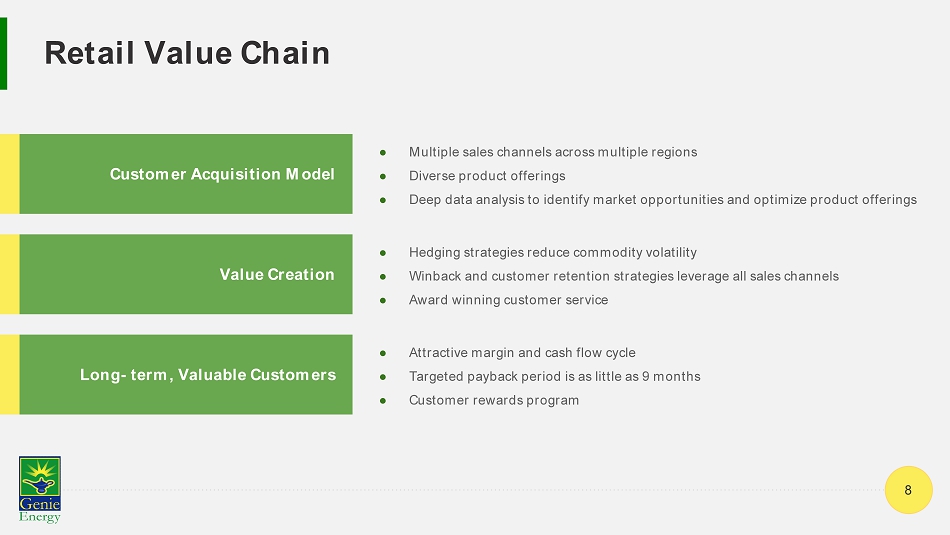
Retail Value Chain Customer Acquisition Model Value Creation Long - term, Valuable Customers ● Multiple sales channels across multiple regions ● Diverse product offerings ● Deep data analysis to identify market opportunities and optimize product offerings ● Hedging strategies reduce commodity volatility ● Winback and customer retention strategies leverage all sales channels ● Award winning customer service 8 ● Attractive margin and cash flow cycle ● Targeted payback period is as little as 9 months ● Customer rewards program

Genie Retail Energy Markets 9

Texas Market Launch License Granted in 4Q18, market launch 1HQ19 Large, diverse addressable market: • 6.2 million residential customers • 1.1 million commercial • 4.3 thousand industrial Robust innovative marketplace: • ERCOT handles 90% of state's electric load • Mandatory switch - 92% of customers have switched providers since inception of deregulation • 440 products, of which 97 are renewable 10

Customer Portfolio* 11 * Residential Customer Equivalents (RCEs) at September 30, 2018

Powerful Brands 12

Genie Retail International ● Acquired Lumo Energia , in January 2019 ● 32,000 electric meters ● TAM: 3.4 million meters in Finland ● Platform to address Scandinavian markets ● Date entered: December 2017 ● Electricity and natural gas ● TAM: 50 million meters 13 Finland Great Britain Japan ● 1H 2019 ● TAM: 83 million electric meters ● Market partially opened in 2016. Low REP penetration with full deregulation coming in 2020 Diversification through expansion of REP business to deregulated markets globally

Genie Retail Energy Services 14 ● Diversegy – Energy brokerage, efficiency consulting and LED installation ● Genie Solar Energy - End to end solar solutions from initial project design though installation ● Prism Solar Technologies – US design er and manufacture r of solar systems featuring innovative bifacial solar modules GRES provides energy solutions to business customers with an expanding portfolio of products:

Genie Energy P&L By Line of Business 15 *TTM – Trailing twelve months ended September 30, 2018 Afek and Genie Oil & Gas(USD in millions) 1Q17 2Q17 3Q17 4Q17 1Q18 2Q18 3Q18 2017 TTM* Revenue - - - - - - $0.2 $0.0 $0.2 Gross Profit - - - - - - 0.2 0.0 0.2 SG&A 0.5 0.5 0.4 0.5 1.1 1.1 0.7 1.9 2.9 Exploration expense /R&D 0.9 1.0 0.8 2.3 0.2 - - 4.9 0.2 Write-Off of capitalized exploration cost - - - 6.5 - - - 6.5 6.5 Equity in the loss of Atid - - - - - - (0.1) - (0.1) Impairments & other gain (loss) - - - - - 2.3 0.5 - 2.7 (Loss) from operations (1.4) (1.4) (1.2) (9.3) (1.4) (3.4) (1.1) (13.3) (15.2) Adjusted EBITDA (1.3) (1.3) (1.1) (2.5) (1.2) (0.9) (0.6) (6.2) (5.3) Capitalized Exploration Costs $1.1 $2.2 $2.3 - - - - $5.6 -

Why Own Genie Energy? 16 Special Situation Investors ● Successful transition to ward a pure - play retail energy provider model while curtailing oil and gas (O&G) exploration program ● Reduced O&G exploration expense will positively impact Adjusted EBITDA* and cash flows in 2018 - 2019 ● Public companies in retail energy provider space facilitate valuation Dividend Investors ● Attractive dividend yield supported by strong retail energy cash flows and liquid balance sheet Growth Investors ● Proven retail energy model with strong growth prospects ● Expanding international presence - Great Britain and Japan ● Recently entered Texas, one of largest domestic markets ● Capacity to finance continued expansion from working capital * Adjusted EBITDA is non - GAAP measure. See reconciliation to corresponding GAAP measure later in this presentation

Reconciliation of Non - GAAP Financials 17 In addition to including financial results that are determined in accordance with generally accepted accounting principles in th e United States of America (GAAP), Genie Energy’s investor presentation included Adjusted EBITDA, which is a non - GAAP financial measure. Generally, a non - GAAP financial measure is a numer ical measure of a company’s performance, financial position, or cash flows that either excludes or includes amounts that are not normally excluded or included in the most direc tly comparable measure calculated and presented in accordance with GAAP. Genie Energy’s measure of Adjusted EBITDA consists of gross profit less selling, general and administrative expense, research an d development expense, exploration expense and equity in the net loss of equity method investees, plus depreciation, amortization and stock - based compensation (which are included in selling , general and administrative expense). Another way of calculating Adjusted EBITDA is to start with income (loss) from operations and add depreciation, amortization, stock - based compe nsation, impairment, other operating loss, and the write - off of capitalized exploration costs, and other operating gain. These additions and deductions are non - cash and/or non - routine items i n the relevant periods. Management believes that Genie’s Adjusted EBITDA measure provides useful information to both management and investors by excl udi ng certain expenses and non - routine gains or losses that may not be indicative of Genie’s or the relevant segment’s core operating results. Management uses Adjusted EBITDA, among oth er measures, as a relevant indicator of core operational strengths in its financial and operational decision making. In addition, management uses Adjusted EBITDA to evaluate operatin g p erformance in relation to Genie’s competitors. Disclosure of this financial measure may be useful to investors in evaluating performance and allows for greater transparency to the underl yin g supplemental information used by management in its financial and operational decision - making. Adjusted EBITDA may also be an indicator of the strength and performance of Genie’s a nd the segment’s ongoing business operations, including the ability to fund capital expenditures, and meet working capital needs from current operations (as opposed to cash resources), and to incur and service debt. Management refers to Adjusted EBITDA, as well as the GAAP measures gross profit and income (loss) from operations, on a segme nt and/or consolidated level to facilitate internal and external comparisons to the segments’ and Genie's historical operating results, in making operating decisions, for budget and planning pu rposes, and to form the basis upon which management is compensated. Although depreciation and amortization are considered operating costs under GAAP, they primarily represent the non - cash current period allocation of costs associated with long - lived assets acquired or constructed in prior periods. While Genie Energy’s oil and gas exploration business may be capital intensive, Gen ie Energy does not expect to incur significant depreciation or depletion expense for the foreseeable future. Genie Energy’s operating results exclusive of depreciation and amortization is the refore a useful indicator of its current performance. Stock - based compensation recognized by Genie Energy and other companies may not be comparable because of the various valuation m ethodologies, subjective assumptions and the variety of types of awards that are permitted under GAAP. Stock - based compensation is excluded from Genie Energy’s calculation of Adjust ed EBITDA because management believes this allows investors to make more meaningful comparisons of the operating results of Genie Energy’s core business with the results of ot her companies. However, stock - based compensation will continue to be a significant expense for Genie Energy for the foreseeable future and an important part of employees’ compensation that im pacts their performance. The write - off of capitalized exploration costs, which is a component of income (loss) from operations, is also excluded from the calculation of Adjusted EBITDA. The write - off of capitalized exploration costs is primarily dictated by events and circumstances outside the control of management that trigger an impairm ent analysis. While there may be similar charges in other periods, the nature and magnitude of these charges can fluctuate markedly and do not reflect the performance of Genie Energy’s continu ing operations. Adjusted EBITDA should be considered in addition to, not as a substitute for, or superior to, gross profit, income (loss) fro m o perations, cash flow from operating activities, net income (loss) or other measures of liquidity and financial performance prepared in accordance with GAAP. In addition, Genie’s measurement of A dju sted EBITDA may not be comparable to similarly titled measures reported by other companies. Following are reconciliations of Adjusted EBITDA to the most directly comparable GAAP measure, Income from Operations:

Reconciliation of Non - GAAP Financials 18 *TTM – Trailing twelve months ended September 30, 2018

Reconciliation of Non - GAAP Financials 19 *TTM – Trailing twelve months ended September 30, 2018

Michael Stein Chief Executive Officer Avi Goldin Chief Financial Officer