Exhibit 99.1
Investor Presentation November 2023 Genie Energy Ltd (NYSE: GNE)

Safe Harbor Statement 2 This presentation contains forward - looking statements. Statements that are not historical facts are forward - looking statements and such forward - looking statements are statements made pursuant to the Safe Harbor Provisions of the Private Securities Litigation Reform Act of 1995. Examples of forward - looking statements include: • statements about Genie’s and its divisions’ future performance; • projections of Genie’s and its divisions’ results of operations or financial condition; and • statements regarding Genie’s plans, objectives or goals, including those relating to its strategies, initiatives, competition, acquisitions, dispositions and/or its products and offerings. Words such as "believe," "anticipate," "plan," "expect," "intend," "target," "estimate," "project," "predict," "forecast," "g uid eline," "aim," "will," "should," “likely,” "continue" and similar expressions are intended to identify forward - looking statements but ar e not the exclusive means of identifying such statements. Readers are cautioned not to place undue reliance on these forward - looking statements and all such forward - looking statements are qualified in their entirety by reference to the following cautionary statements. Forward - looking statements are based on Genie’s current expectations, estimates and assumptions and because forward - looking statements address future results, events and conditions, they, by their very nature, involve inherent risks and uncertainties, many of which are unforeseeable and beyond the Genie’s control. Such known and unknown risks, uncertainties and other factors may cause Genie’s actual results, performance or other achievements to differ materially from the anticipat ed results, performance or achievements expressed, projected or implied by these forward - looking statements. These factors include those discussed under the headings "Risk Factors" and “Management’s Discussion and Analysis of Financial Condition and Results of Operations in Genie’s periodic filings made with the Securities and Exchange Commission. Genie cautions that such factors are not exhaustive and that other risks and uncertainties may cause actual results to differ materially from those in forward - looking statements. Forward - looking statements speak only as of the date they are made and are statements of Genie’s current expectations concerning future results, events and conditions and Genie is under no obligation to update any of the forward - looking statements, whether as a result of new information, future events or otherwise.

Genie Energy At A Glance *as of quarter ended 9/30/23 ** from continuing operations ***see reconciliation in appendix 1 Based on stock price as of 11/18/23 $405M TTM Revenue* 36.4% TTM GM* $65M TTM Adj. EBITDA*/*** ~1.2% Dividend Yield 1 Genie Energy Ltd. Genie Retail Energy (GRE) Genie Renewables (GREW) Genie is a leading provider of electricity, natural gas and green energy to retail and commercial customers in the U.S. $2.16 TTM GAAP EPS** ~8.6X EV/TTM Adj. EBITDA 1 $144M Cash and equivalents (no debt)* $60M TTM Operating Income* 3 $5.27 Cash /share*
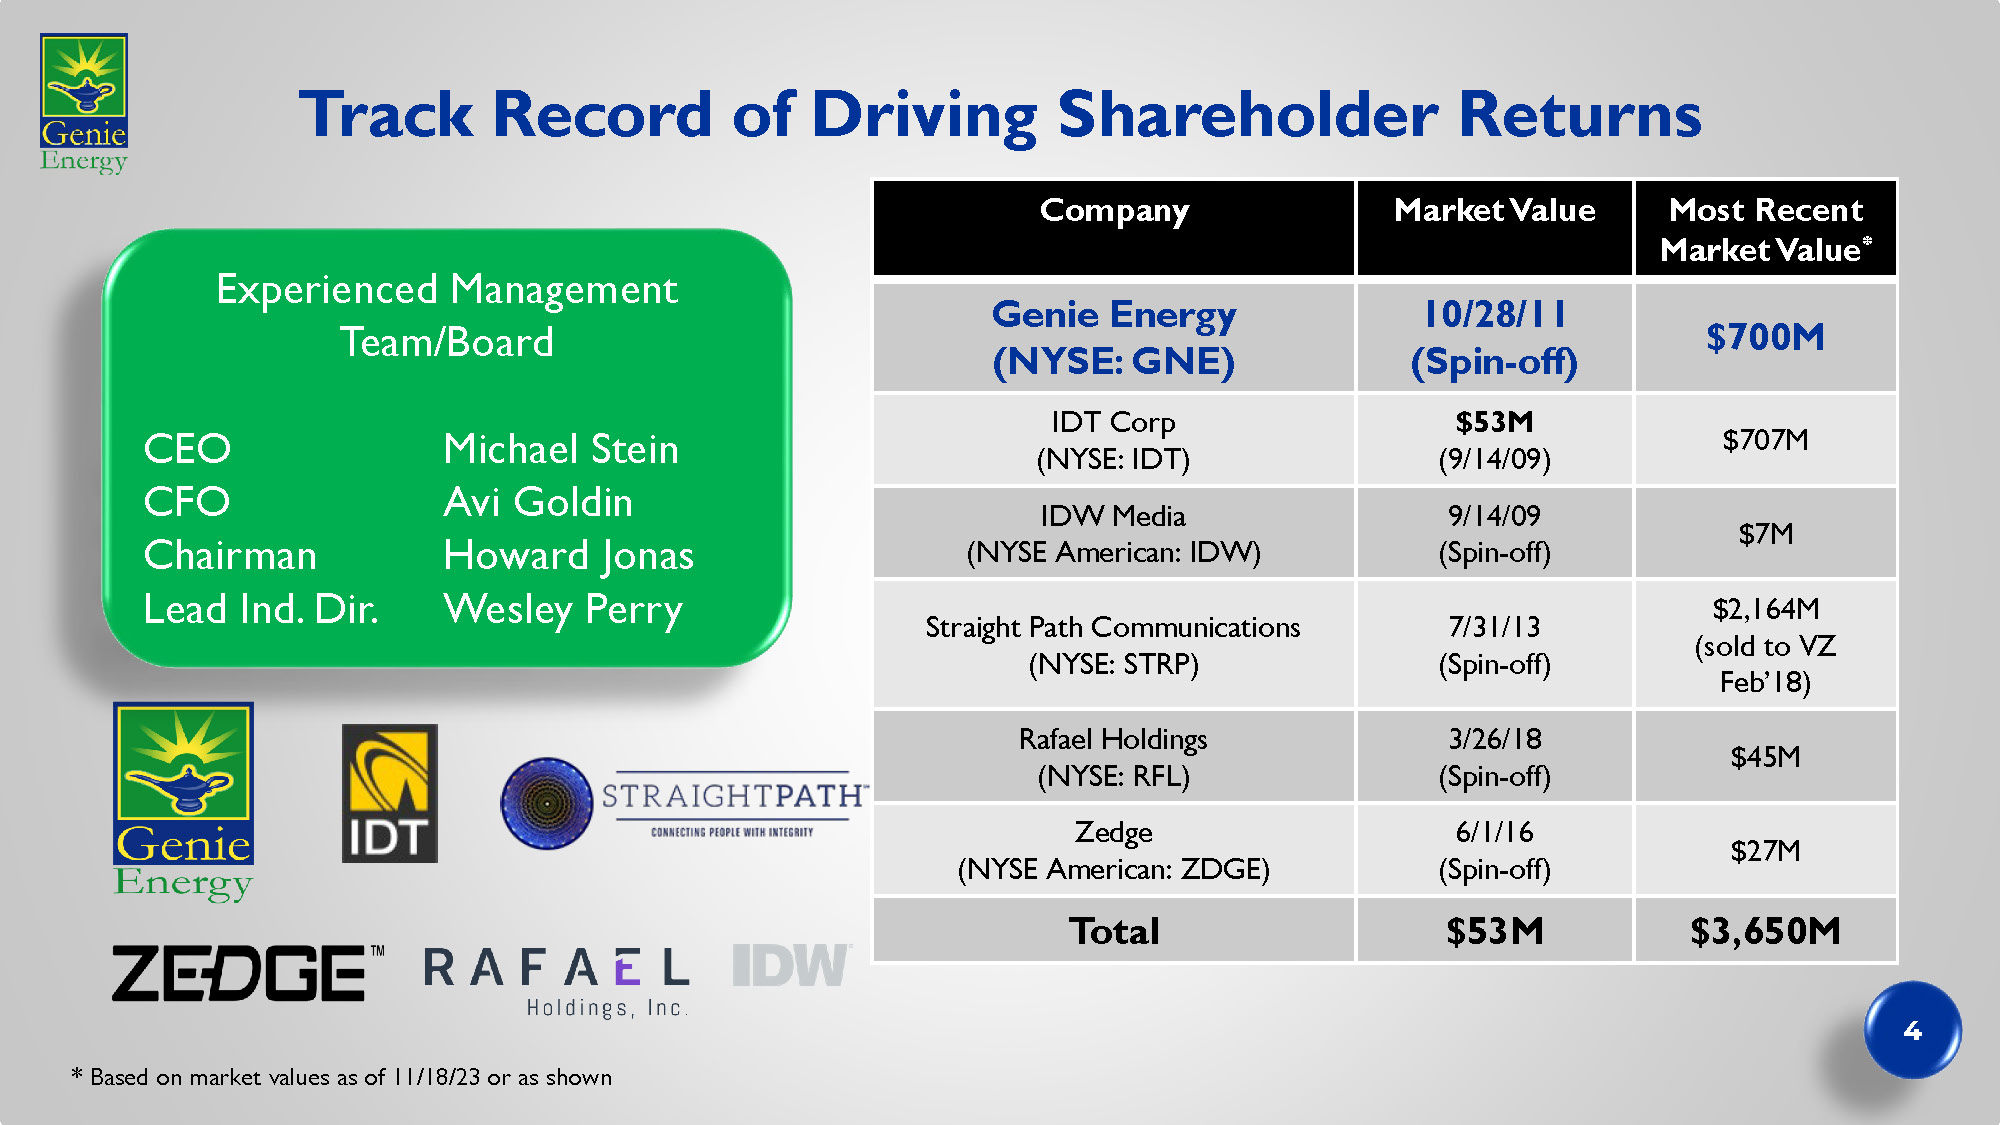
Track Record of Driving Shareholder Returns Most Recent Market Value * Market Value Company $700M 10/28/11 (Spin - off) Genie Energy (NYSE: GNE) $707M $53M (9/14/09) IDT Corp (NYSE: IDT) $7M 9/14/09 (Spin - off) IDW Media (NYSE American: IDW) $2,164M (sold to VZ Feb’18) 7/31/13 (Spin - off) Straight Path Communications (NYSE: STRP) $45M 3/26/18 (Spin - off) Rafael Holdings (NYSE: RFL) $27M 6/1/16 (Spin - off) Zedge (NYSE American: ZDGE) $3,650M $53M Total * Based on market values as of 11/18/23 or as shown Experienced Management Team/Board CEO Michael Stein CFO Avi Goldin Chairman Howard Jonas Lead Ind. Dir. Wesley Perry 4
Investment Highlights Large market opportunity Attractive Growth Profile Portfolio & Risk Management Are Differentiators Strong Balance Sheet/Cash Flow Provide Strategic Flexibility 5

LARGE MARKET OPPORTUNITY
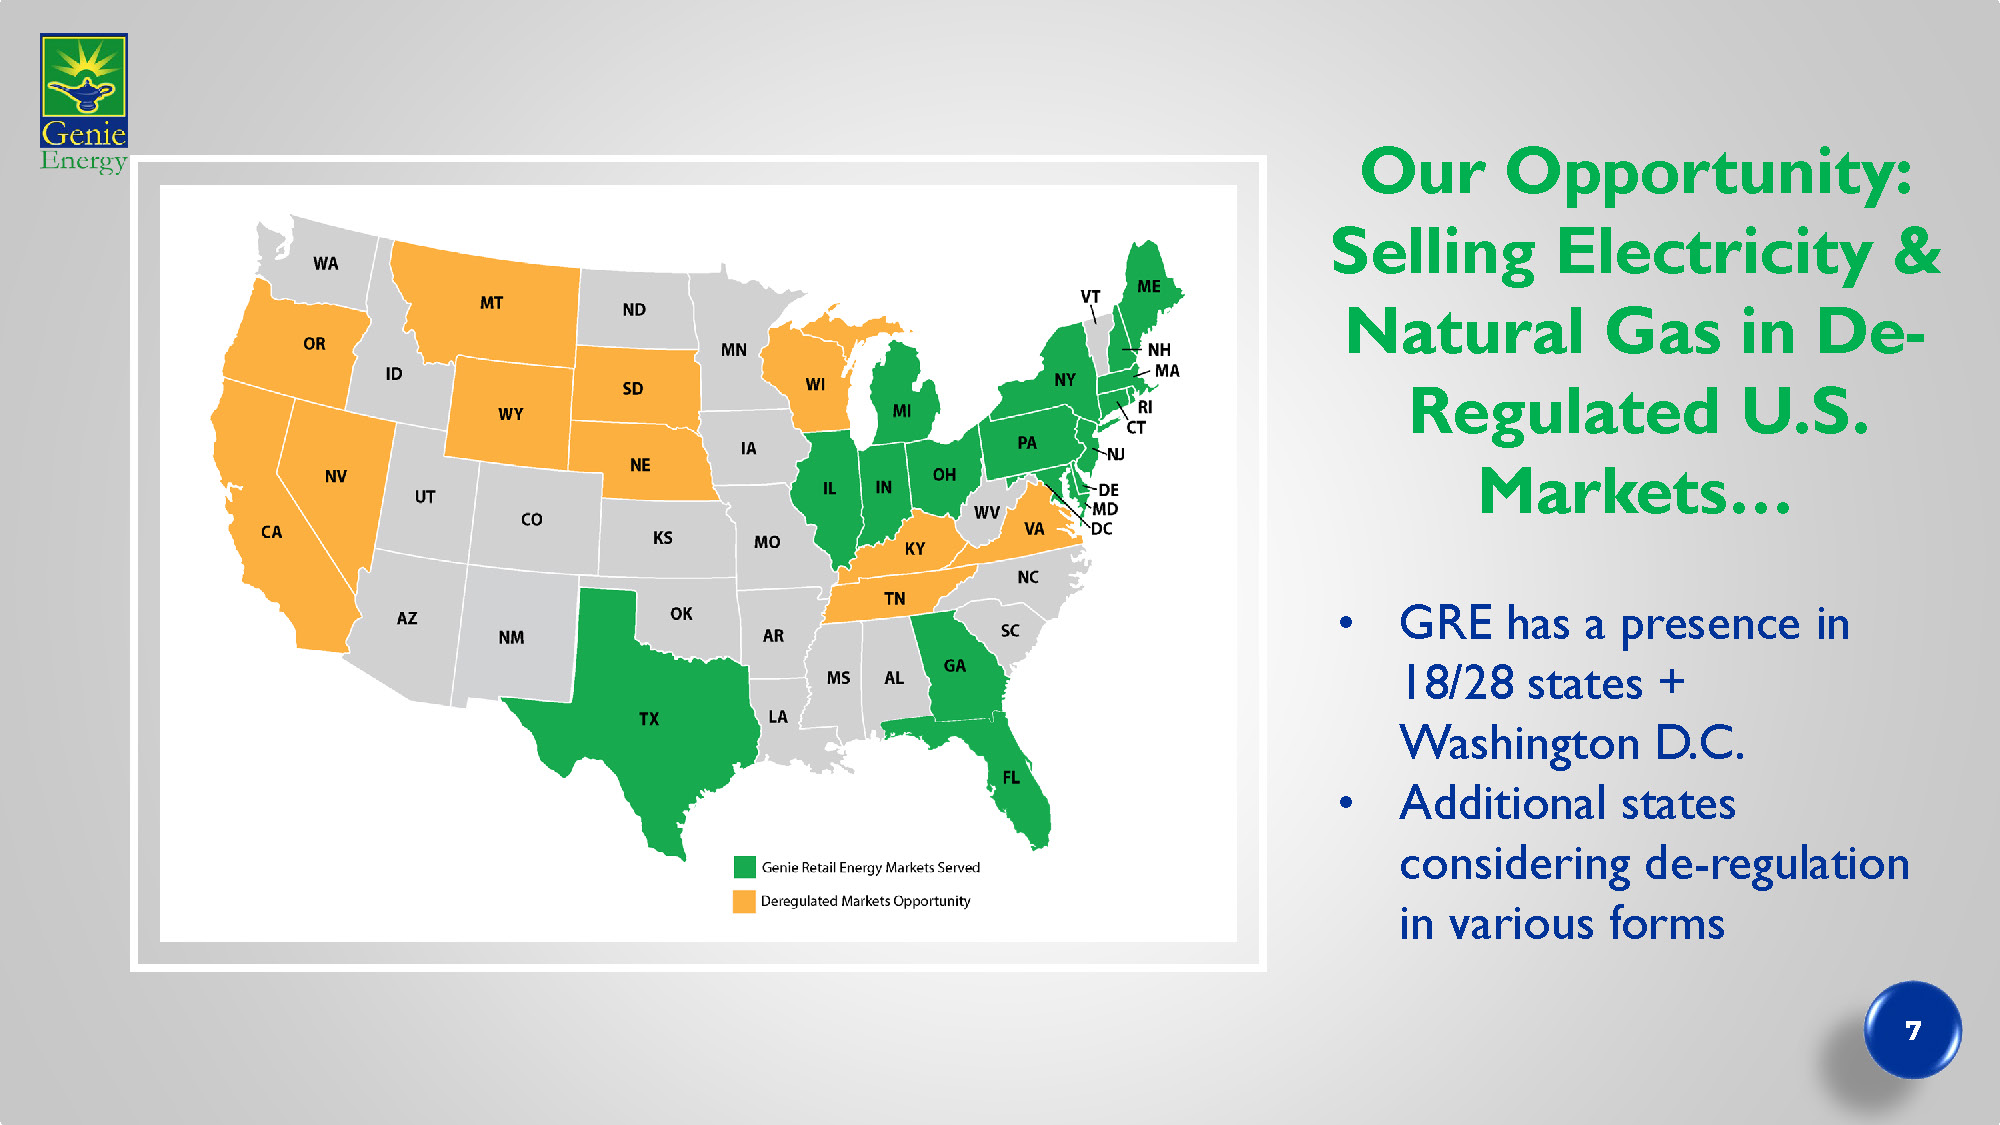
Our Opportunity: Selling Electricity & Natural Gas in De - Regulated U.S. Markets… • GRE has a presence in 18/28 states + Washington D.C. • Additional states considering de - regulation in various forms 7

…And in Developing, Owning & Operating Solar Farms *Solar Energy Industry Association Community Commercial Utility >600K Commercial Facilities 1% Penetration Components Shortages due to global supply chain issues 8X DOE Est. Growth thru 2025 Favorable Regulatory Environment “ In the next half decade, the long - term tax incentives and manufacturing provisions in the IRA provide the market certainty needed to boost expected solar deployment by over 40% compared to pre - IRA projections.” - Solar Energy Industry Association >5% * % of Total US Electricity Generation (1H23) ~45% * of new grid capacity (1H23) 155GW * Installed Capacity (through 1H23) 8

ATTRACTIVE GROWTH PROFILE

Our Organic Growth Strategy is… Retail Solar • Take share in existing markets • Opportunistically expand retail book geographically • Introduce new products • Focus on customer retention to manage churn • Originate, develop, own & operate solar farms • Differentiate solar through vertical integration 10

…Complemented by Inorganic Growth Retail Acquisitions – customer books or companies 01 Direct purchase, development and operation of solar farms by GREW 02 General Partner for Sunlight Energy Investments - owned solar farms 03 Acquire new renewable technologies 04 11

Attractive Financial Returns Targeted payback period tailored to product & customer type How We Grow in Retail Multiple sales channels Diverse portfolio of products Deep data analysis to identify market opportunities & optimize offerings Targeted M&A Hedging strategies reduce commodity volatility risk Geographic diversity reduces weather/regulatory risks Utilities assume bad debt risk in most markets Superior customer service via i n - sourced, US - based customer service team Customer rewards program New technology investments Customer Acquisition Risk Management Customer Retention 12
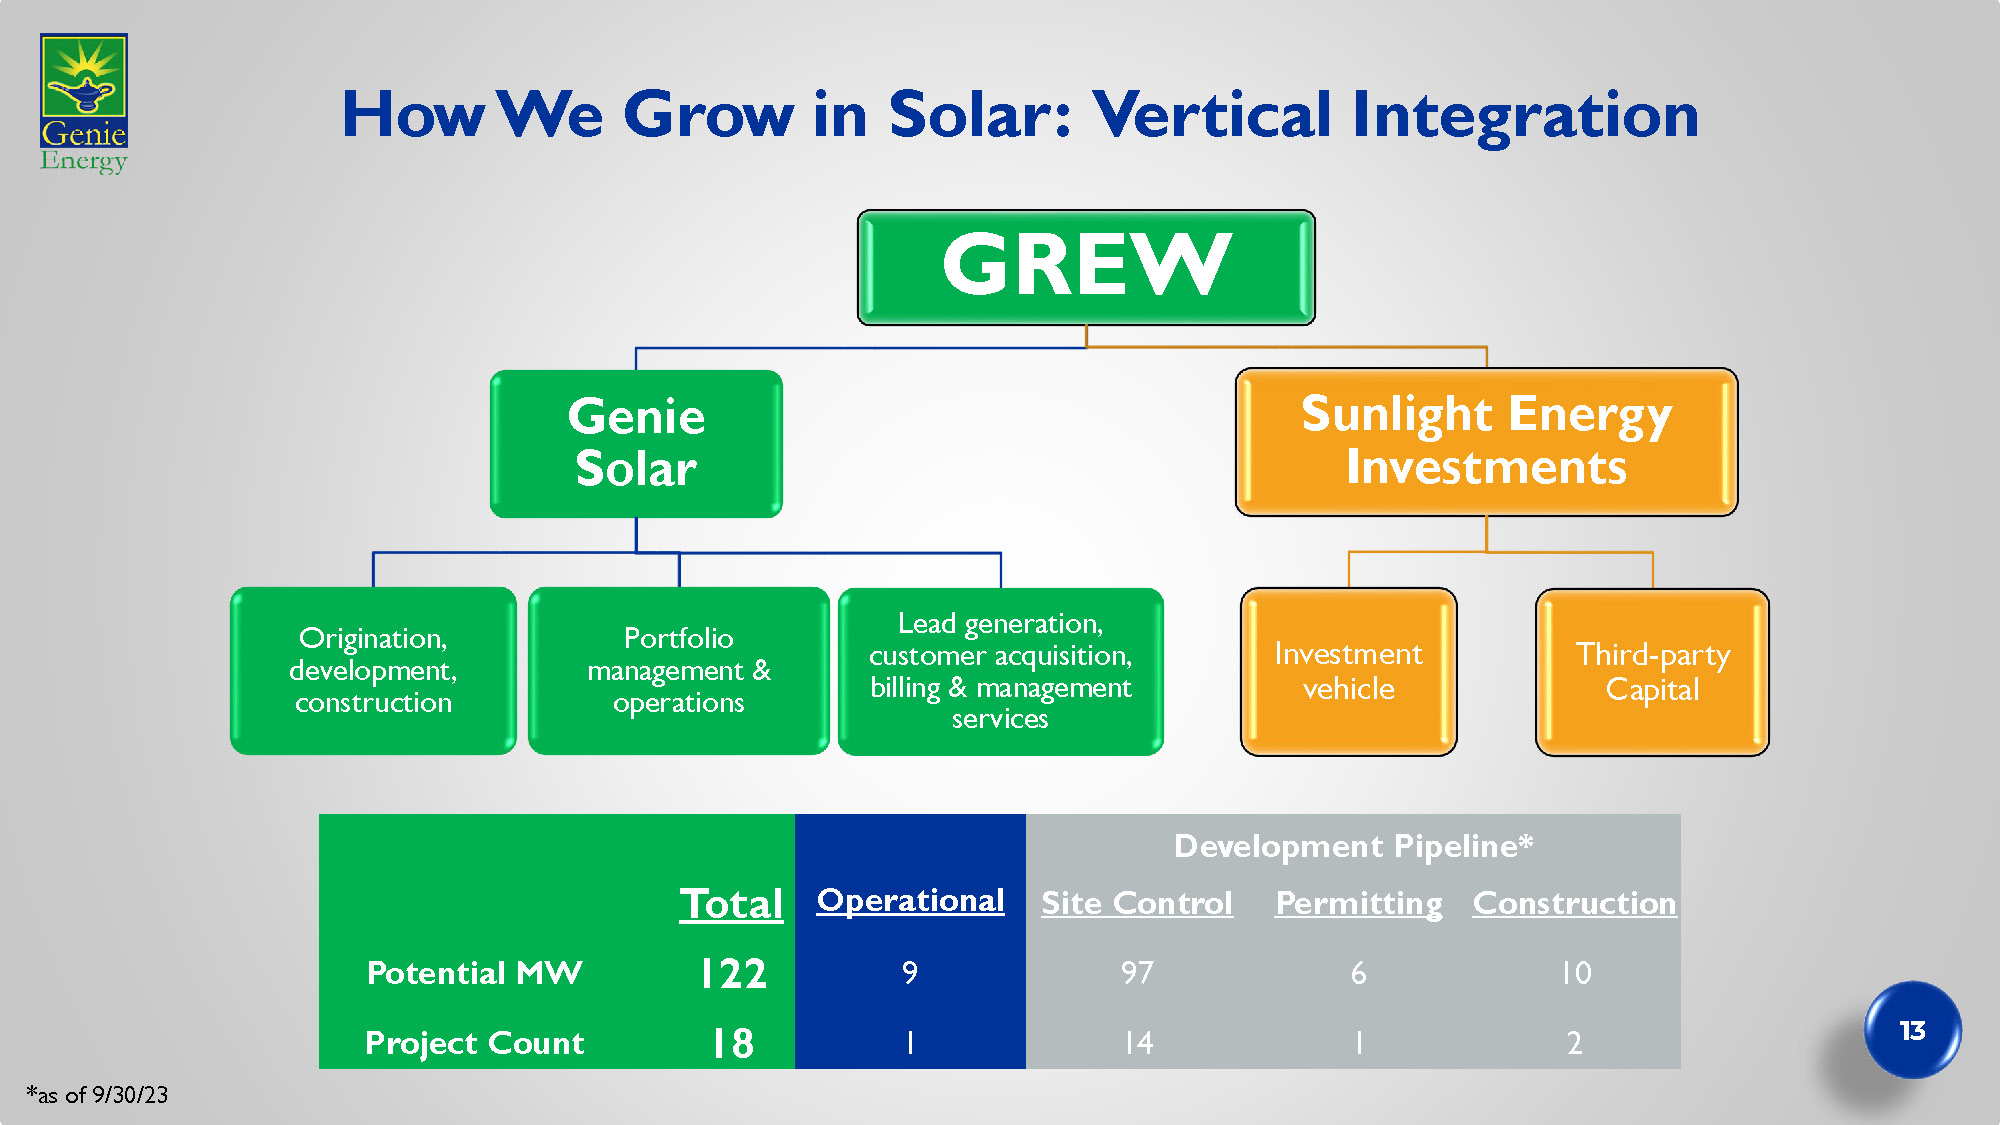
How We Grow in Solar: Vertical Integration GREW Genie Solar Origination, development, construction Portfolio management & operations Lead generation, customer acquisition, billing & management services Sunlight Energy Investments Investment vehicle Third - party Capital 13 Development Pipeline* Construction Permitting Site Control Operational Total 10 6 97 9 122 Potential MW 2 1 14 1 18 Project Count *as of 9/30/23
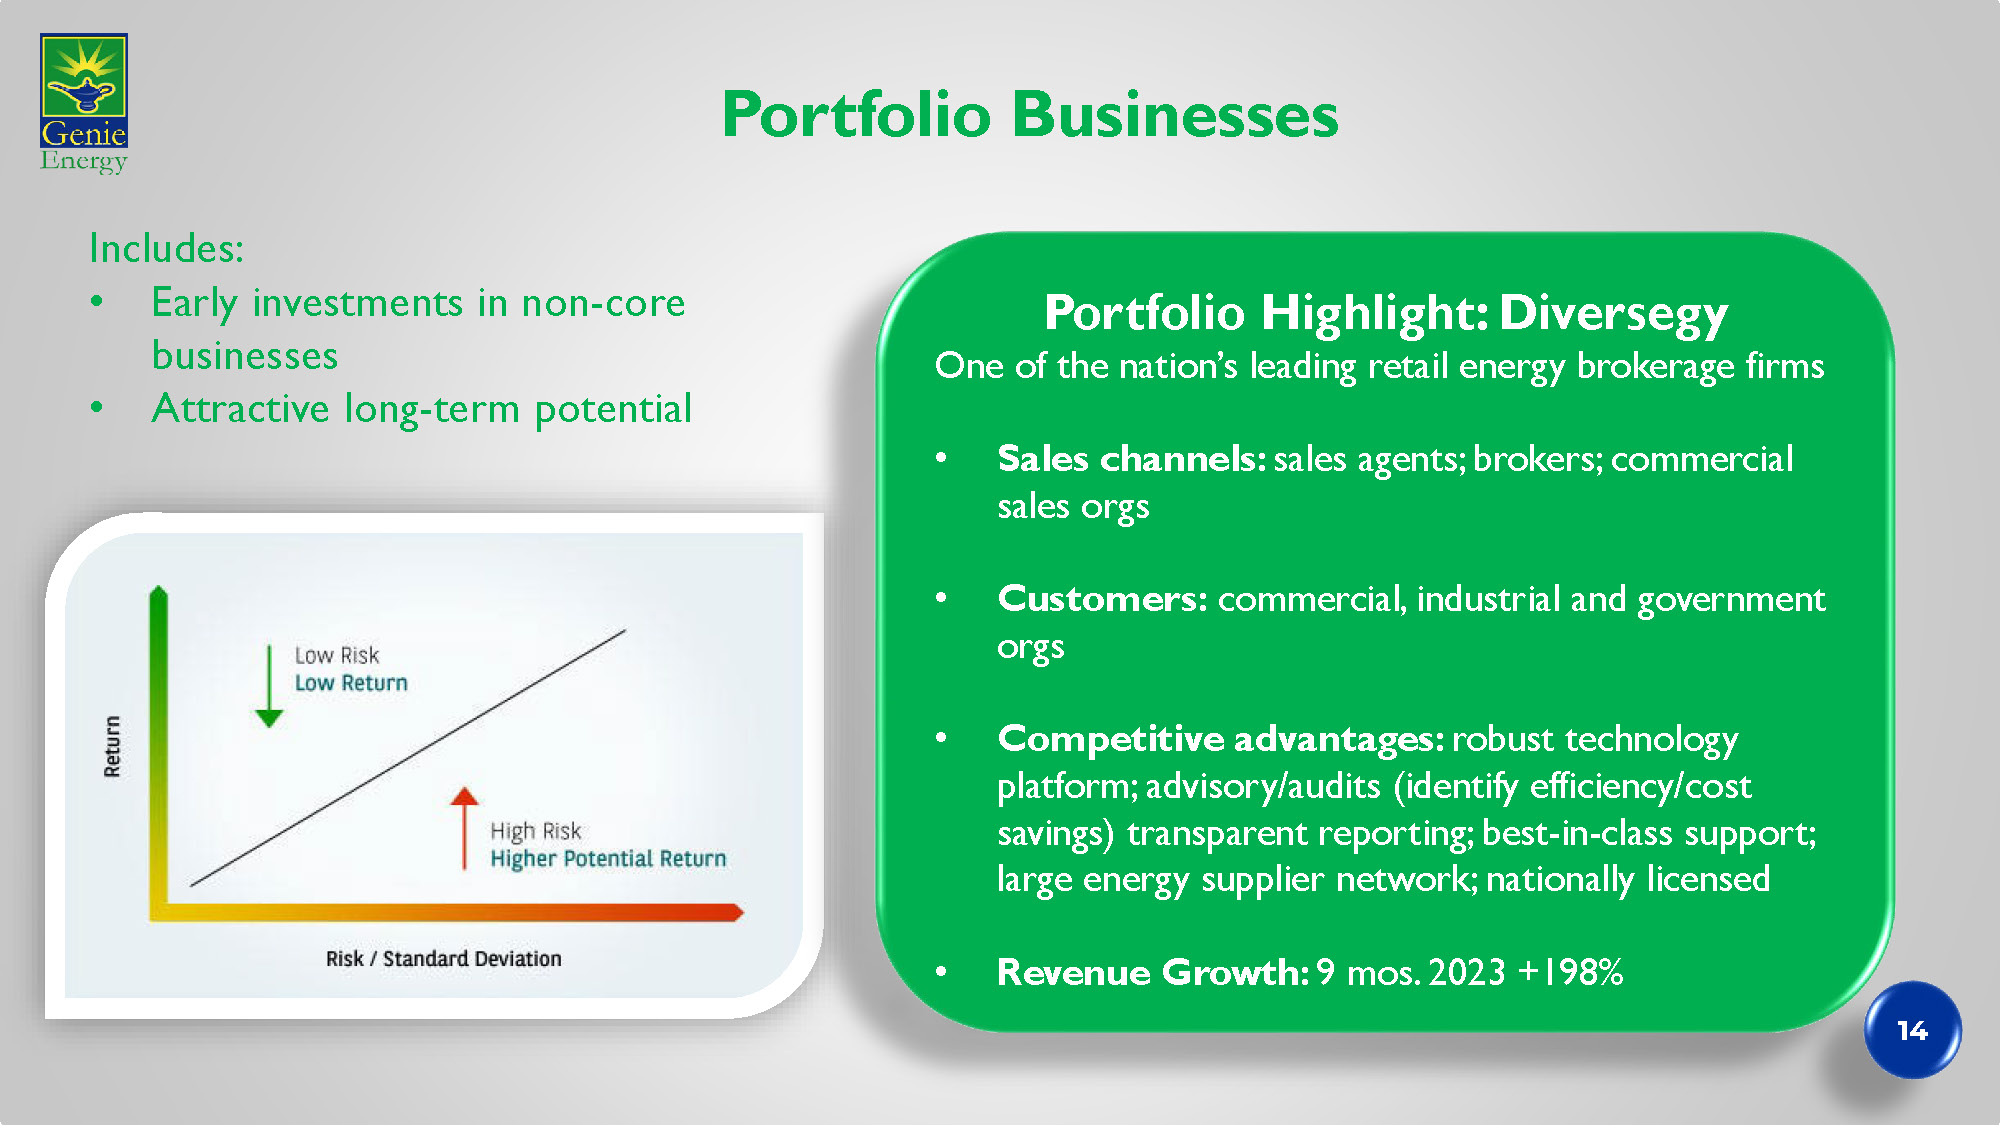
Portfolio Businesses 14 Includes: • Early investments in non - core businesses • Attractive long - term potential Portfolio Highlight: Diversegy One of the nation’s leading retail energy brokerage firms • Sales channels: sales agents; brokers; commercial sales orgs • Customers: commercial, industrial and government orgs • Competitive advantages: robust technology platform; advisory/audits (identify efficiency/cost savings) transparent reporting; best - in - class support; large energy supplier network; nationally licensed • Revenue Growth: 9 mos. 2023 +198%

PORTFOLIO AND RISK MANAGEMENT

» Hedged customer book heading into colder months » Long Energy in U.S. and Europe 2H21 » UK energy market disintegrates » Exited UK - returned cash to U.S. Global Events: Energy Crisis in Europe » Long Energy » Portfolio management of low margin customers in U.S. drives strong margins GRE » Long Energy (most competitors unhedged) » Market decayed, value of hedges > value of business » Sold/exited most of business Sweden Hedging Program Provides Portfolio Optionality » Record gross margin, adjusted EBITDA & cash flow » Paid dividends, repurchased common/preferred stock & provided investment capital for attractive projects 16 Hedging Program: How We Opportunistically Drove Massive Returns in 2022

FINANCIAL SUMMARY
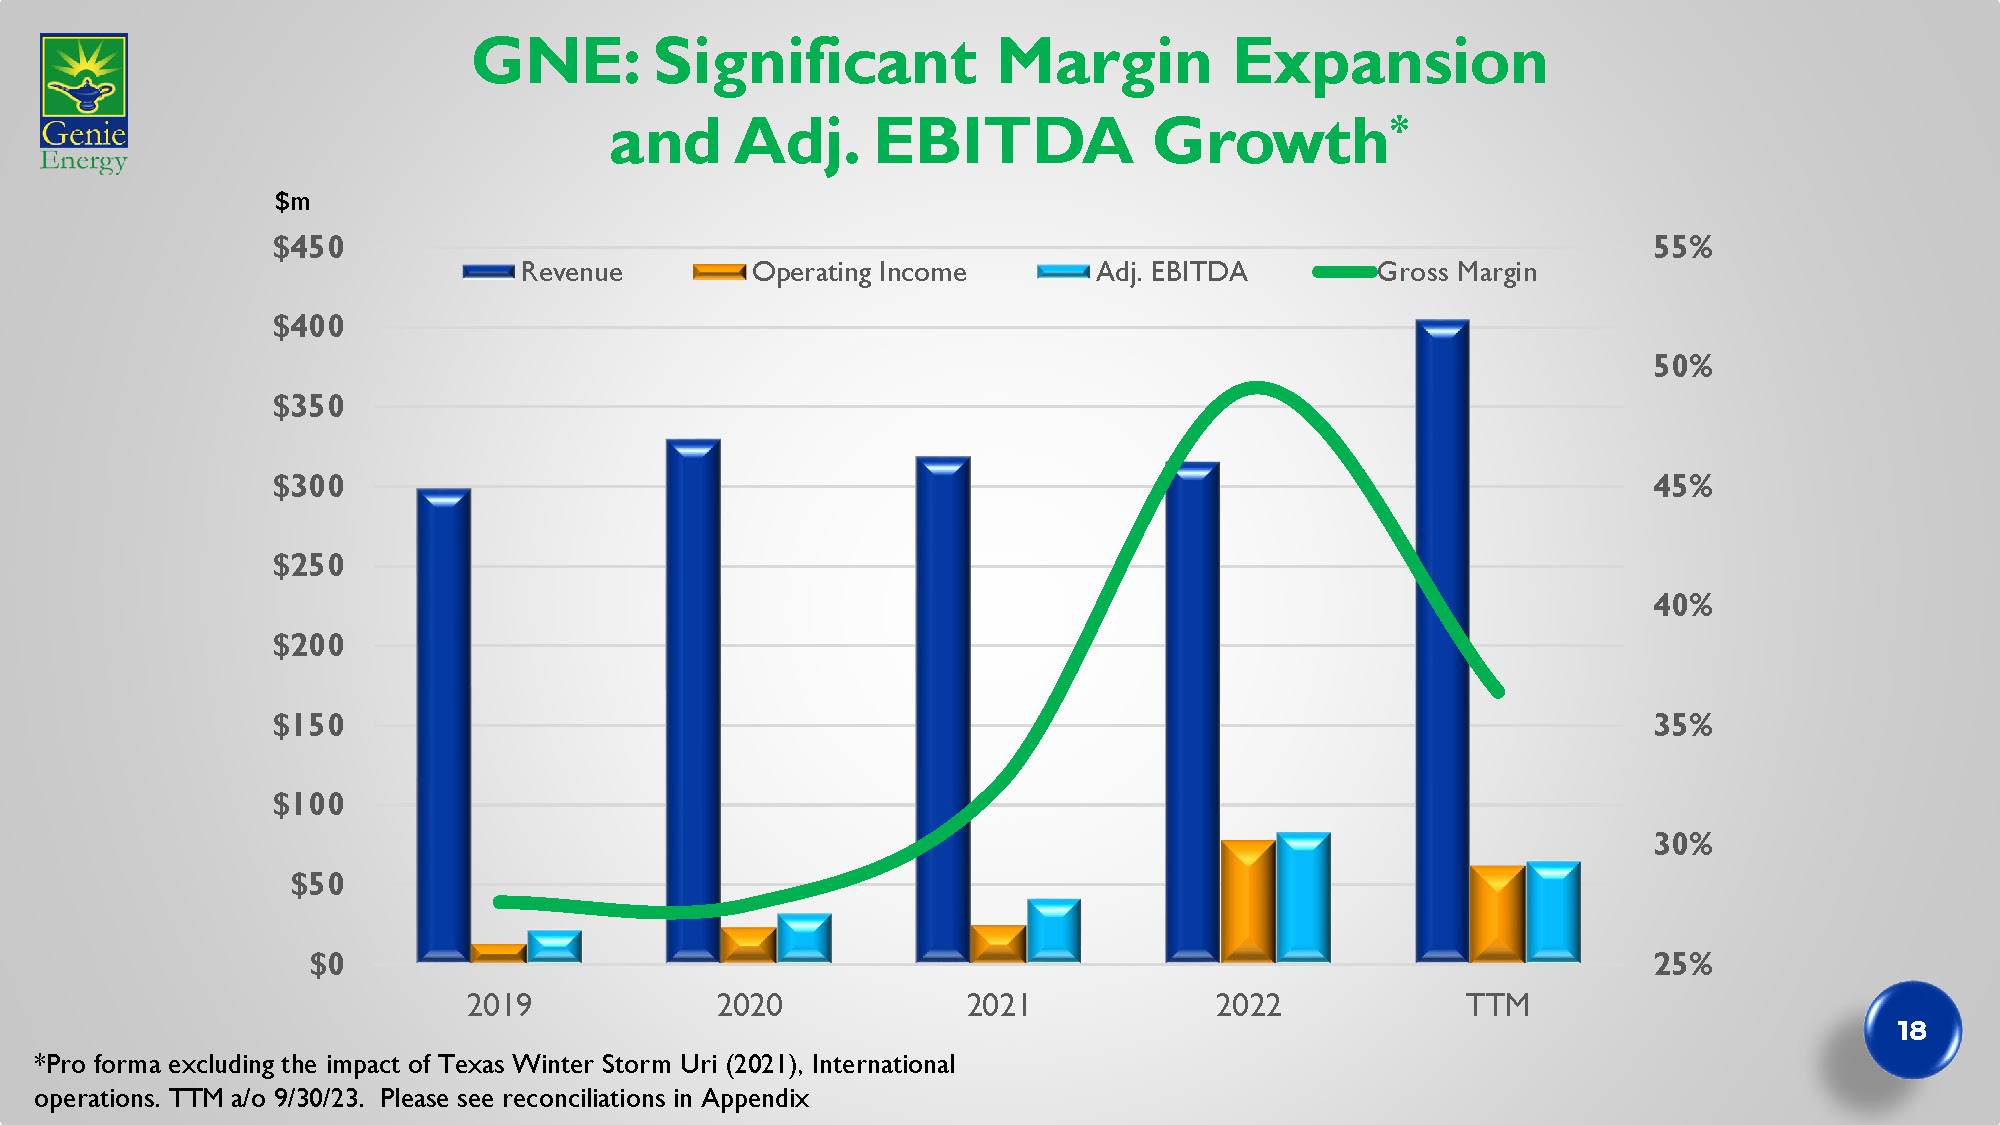
GNE: Significant Margin Expansion and Adj. EBITDA Growth * 25% 30% 35% 40% 45% 50% 55% $0 $50 $100 $150 $200 $250 $300 $350 $400 $450 2019 2020 2021 2022 TTM Revenue Operating Income Adj. EBITDA Gross Margin $m *Pro forma excluding the impact of Texas Winter Storm Uri (2021), International operations. TTM a/o 9/30/23. Please see reconciliations in Appendix 18

Driven by GRE Strength* 25% 30% 35% 40% 45% 50% 55% 60% $0 $50 $100 $150 $200 $250 $300 $350 $400 2019 2020 2021 2022 TTM Revenue Op. Inc. Adj. EBITDA Gross Margin $m *Pro forma excluding the impact of Texas Winter Storm Uri (2021) TTM a/o 9/30/23 Please see reconciliations in Appendix 19

GREW: Re - Positioned for Future Growth * 0% 5% 10% 15% 20% 25% 30% 35% 40% -$5 $5 $15 $25 $35 2019 2020 2021 2022 TTM Revenue Op. Inc. Adj. EBITDA Gross Margin $m * Please see reconciliations in Appendix 2023/2024 » Project acquisition and development » Investing in internal capabilities e.g. expanding salesforce Pre - 2022: Third Party Services Only 2022+: Project ownership & development 20
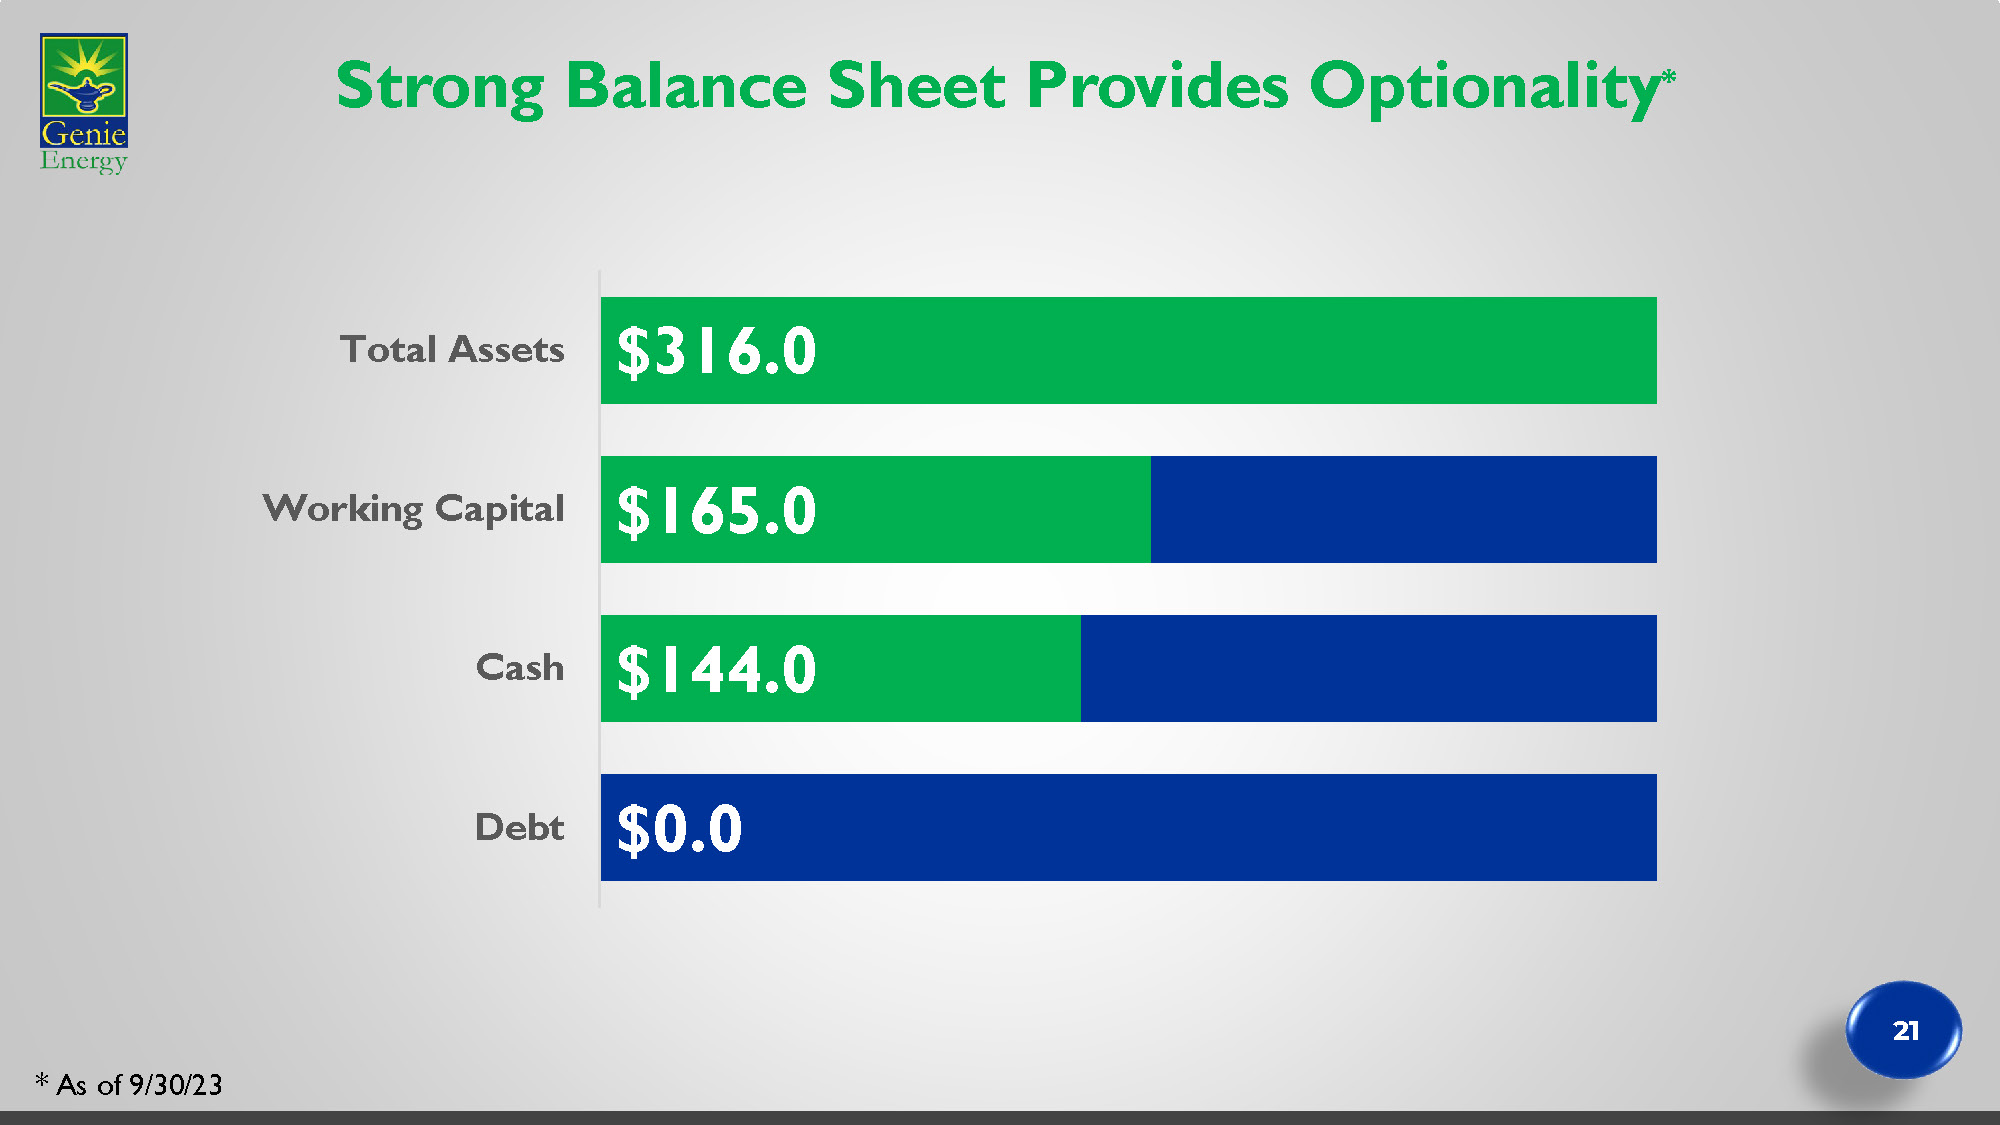
Strong Balance Sheet Provides Optionality * * As of 9/30/23 $0.0 $144.0 $165.0 $316.0 Debt Cash Working Capital Total Assets 21
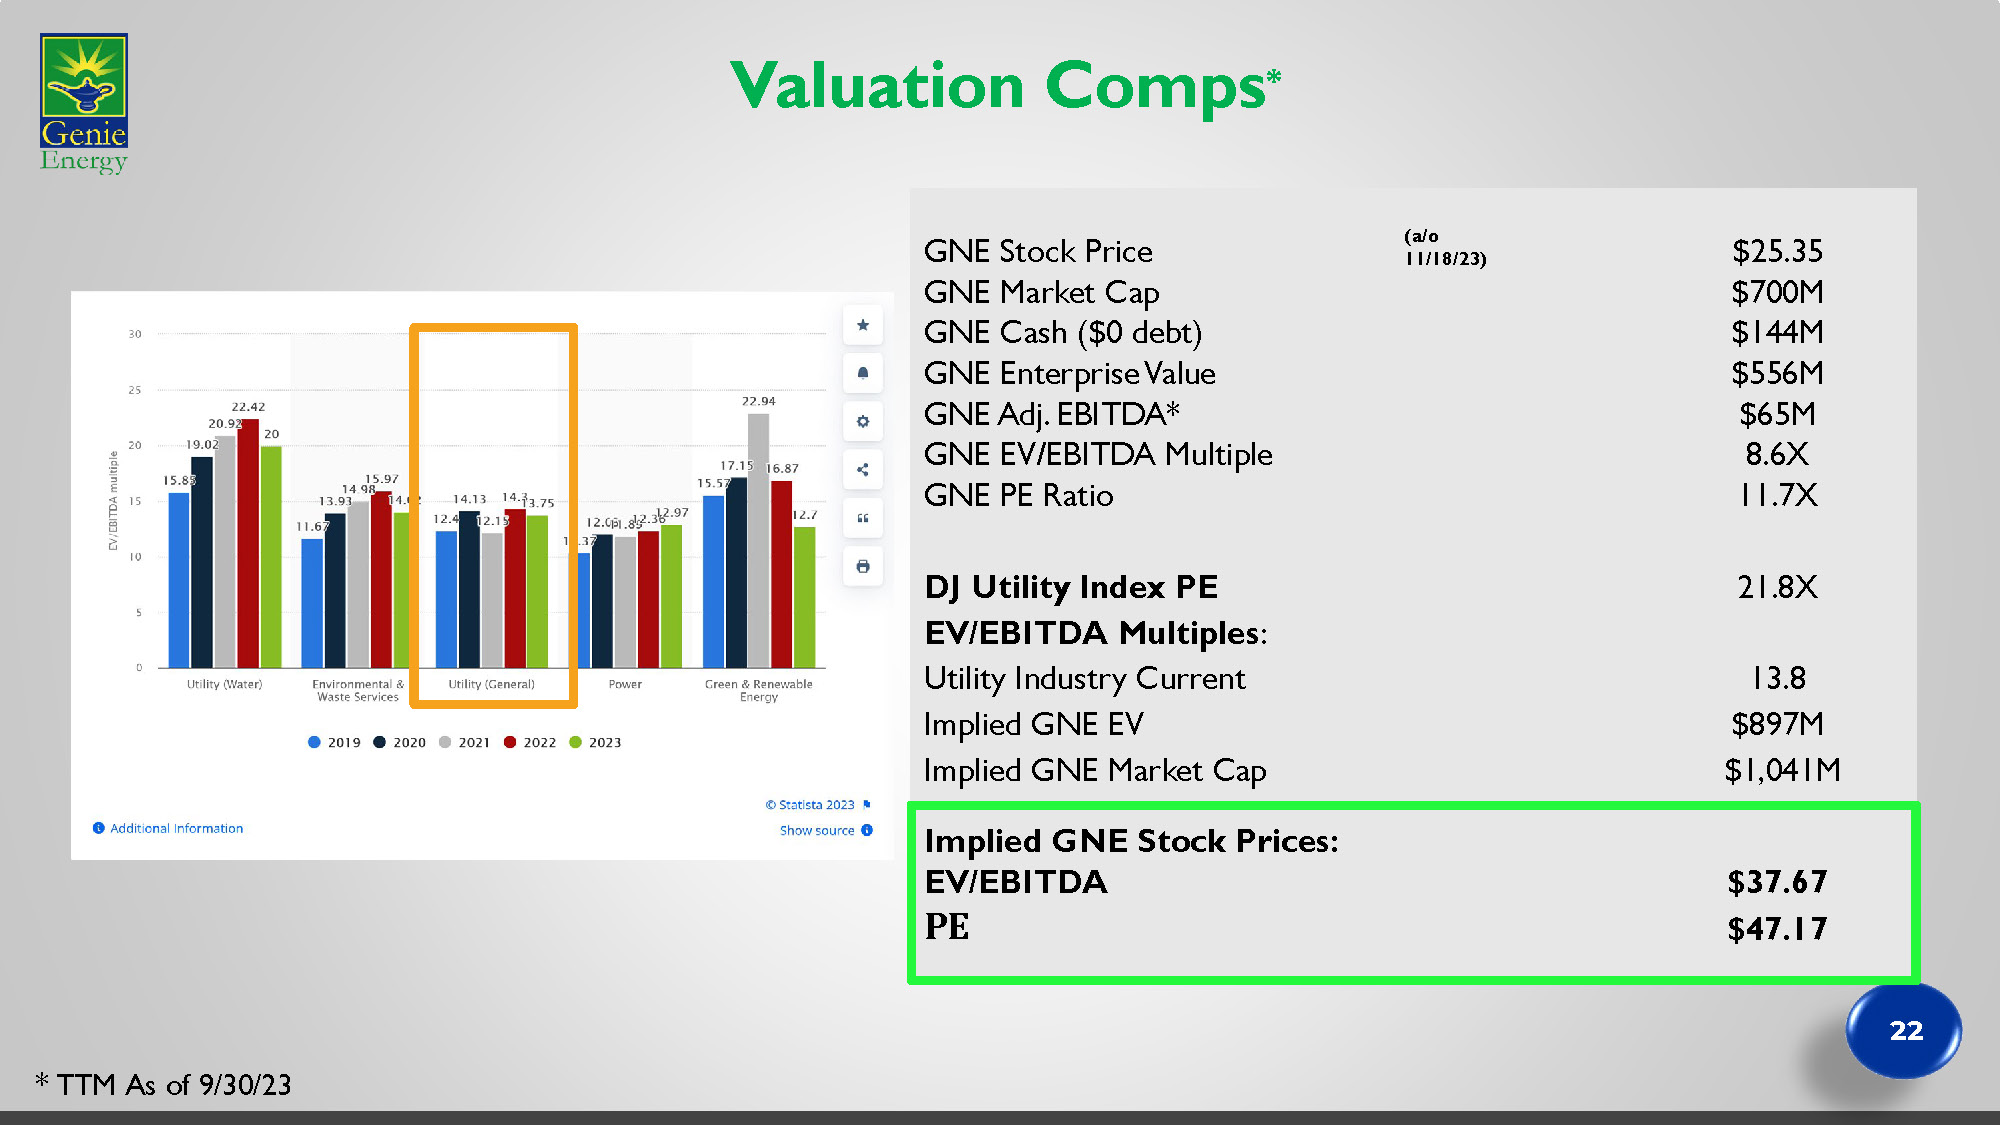
Valuation Comps * * TTM As of 9/30/23 22 $25.35 (a/o 11/18/23) GNE Stock Price $700M GNE Market Cap $144M GNE Cash ($0 debt) $556M GNE Enterprise Value $65M GNE Adj. EBITDA * 8.6 X GNE EV/EBITDA Multiple 11.7X GNE PE Ratio 21.8X DJ Utility Index PE EV/EBITDA Multiples : 13.8 Utility Industry Current $897M Implied GNE EV $1,041M Implied GNE Market Cap Implied GNE Stock Prices: $37.67 EV/EBITDA $47.17 PE

Capital Allocation Strategy Drives Shareholder Returns Common stock dividend (currently $0.075/quarter) Common Stock Opportunities for outsized growth potential (e.g. Solar) Select M&A Retail Customer acquisition New retail markets New retail products Internal Reinvestment Corporate Development Dividend Share repurchases 23

Summary Large market opportunity Attractive Growth Profile Portfolio & Risk Management Are Differentiators Strong Balance Sheet/Cash Flow Provide Strategic Flexibility 24

THANK YOU! Michael Stein Chief Executive Officer IR Contact: Brian Siegel Senior Managing Director Hayden IR (346) 396 - 8696 brian@haydenir.com Avi Goldin Chief Financial Officer
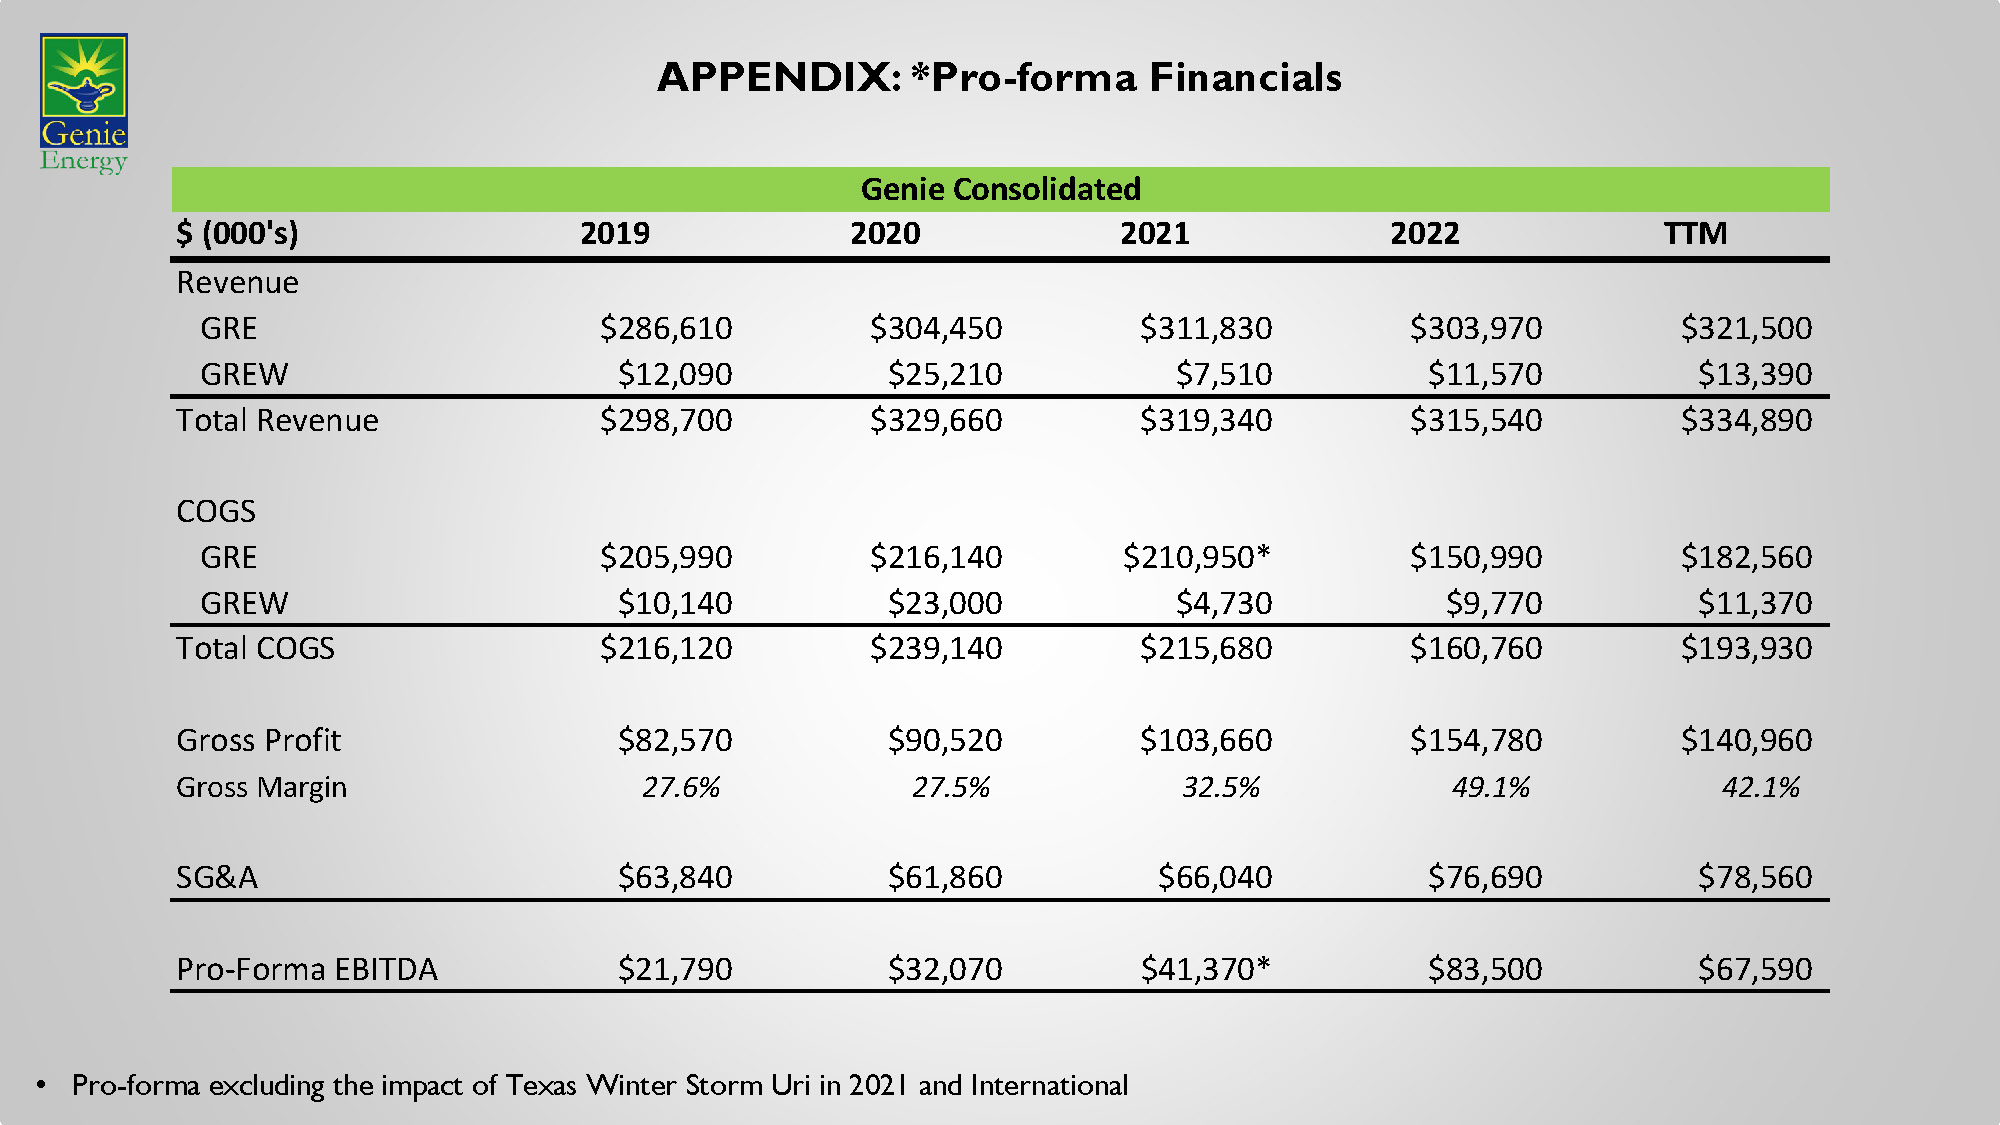
APPENDIX: *Pro - forma Financials • Pro - forma excluding the impact of Texas Winter Storm Uri in 2021 and International $ (000's) 2019 2020 2021 2022 TTM Revenue GRE $286,610 $304,450 $311,830 $303,970 $321,500 GREW $12,090 $25,210 $7,510 $11,570 $13,390 Total Revenue $298,700 $329,660 $319,340 $315,540 $334,890 COGS GRE $205,990 $216,140 $210,950* $150,990 $182,560 GREW $10,140 $23,000 $4,730 $9,770 $11,370 Total COGS $216,120 $239,140 $215,680 $160,760 $193,930 Gross Profit $82,570 $90,520 $103,660 $154,780 $140,960 Gross Margin 27.6% 27.5% 32.5% 49.1% 42.1% SG&A $63,840 $61,860 $66,040 $76,690 $78,560 Pro-Forma EBITDA $21,790 $32,070 $41,370* $83,500 $67,590 Genie Consolidated BS0

Reconciliation Tables Slides 18,26 – Genie Energy Financials - Consolidated 2019 2020 2021 2022 TTM Consolidated revenue (as reported) $300,100 $338,430 $323,270 $315,540 $334,890 Less: Revenue of Genie Japan $1,400 $8,770 $3,930 --- --- Pro forma consolidated revenue $298,700 $329,660 $319,340 $315,540 $334,890 Consolidated gross profit (as reported) $82,330 $91,480 $91,640 $154,780 $140,960 Less Gross profit (loss) of GREI ($240) $960 ($2,020) --- --- Gross (loss) profit from Winter Storm Uri --- --- ($10,000) --- --- Pro-forma consolidated gross profit $82,570 $90,520 $103,660 $154,780 $140,960 Pro forma consolidated gross profit margin 27.6% 27.5% 32.5% 49.1% 42.1% Income (Loss) from Operations $12,620 $23,140 $24,530 $77,740 $62,120 Add Back: Non-Cash Compensation $1,050 $970 $2,820 $2,970 $3,000 Depreciation & Amortization $1,960 $1,100 $440 $390 $380 Impairment $400 $1,400 --- $2,070 $2,080 Consolidated Adjusted EBITDA (as reported) $16,020 $26,610 $27,780 $83,160 $67,590 Less: Adjusted EBITDA of GREI ($4,500) ($3,340) ($3,360) --- --- Profit (loss) from Winter Storm Uri --- --- ($10,000) --- --- Adjusted EBITDA of GOGAS ($1,260) ($2,120) ($180) --- --- Pro forma consolidated Adjusted EBITDA $21,790 $32,070 $41,320 $83,160 $67,590 BS0
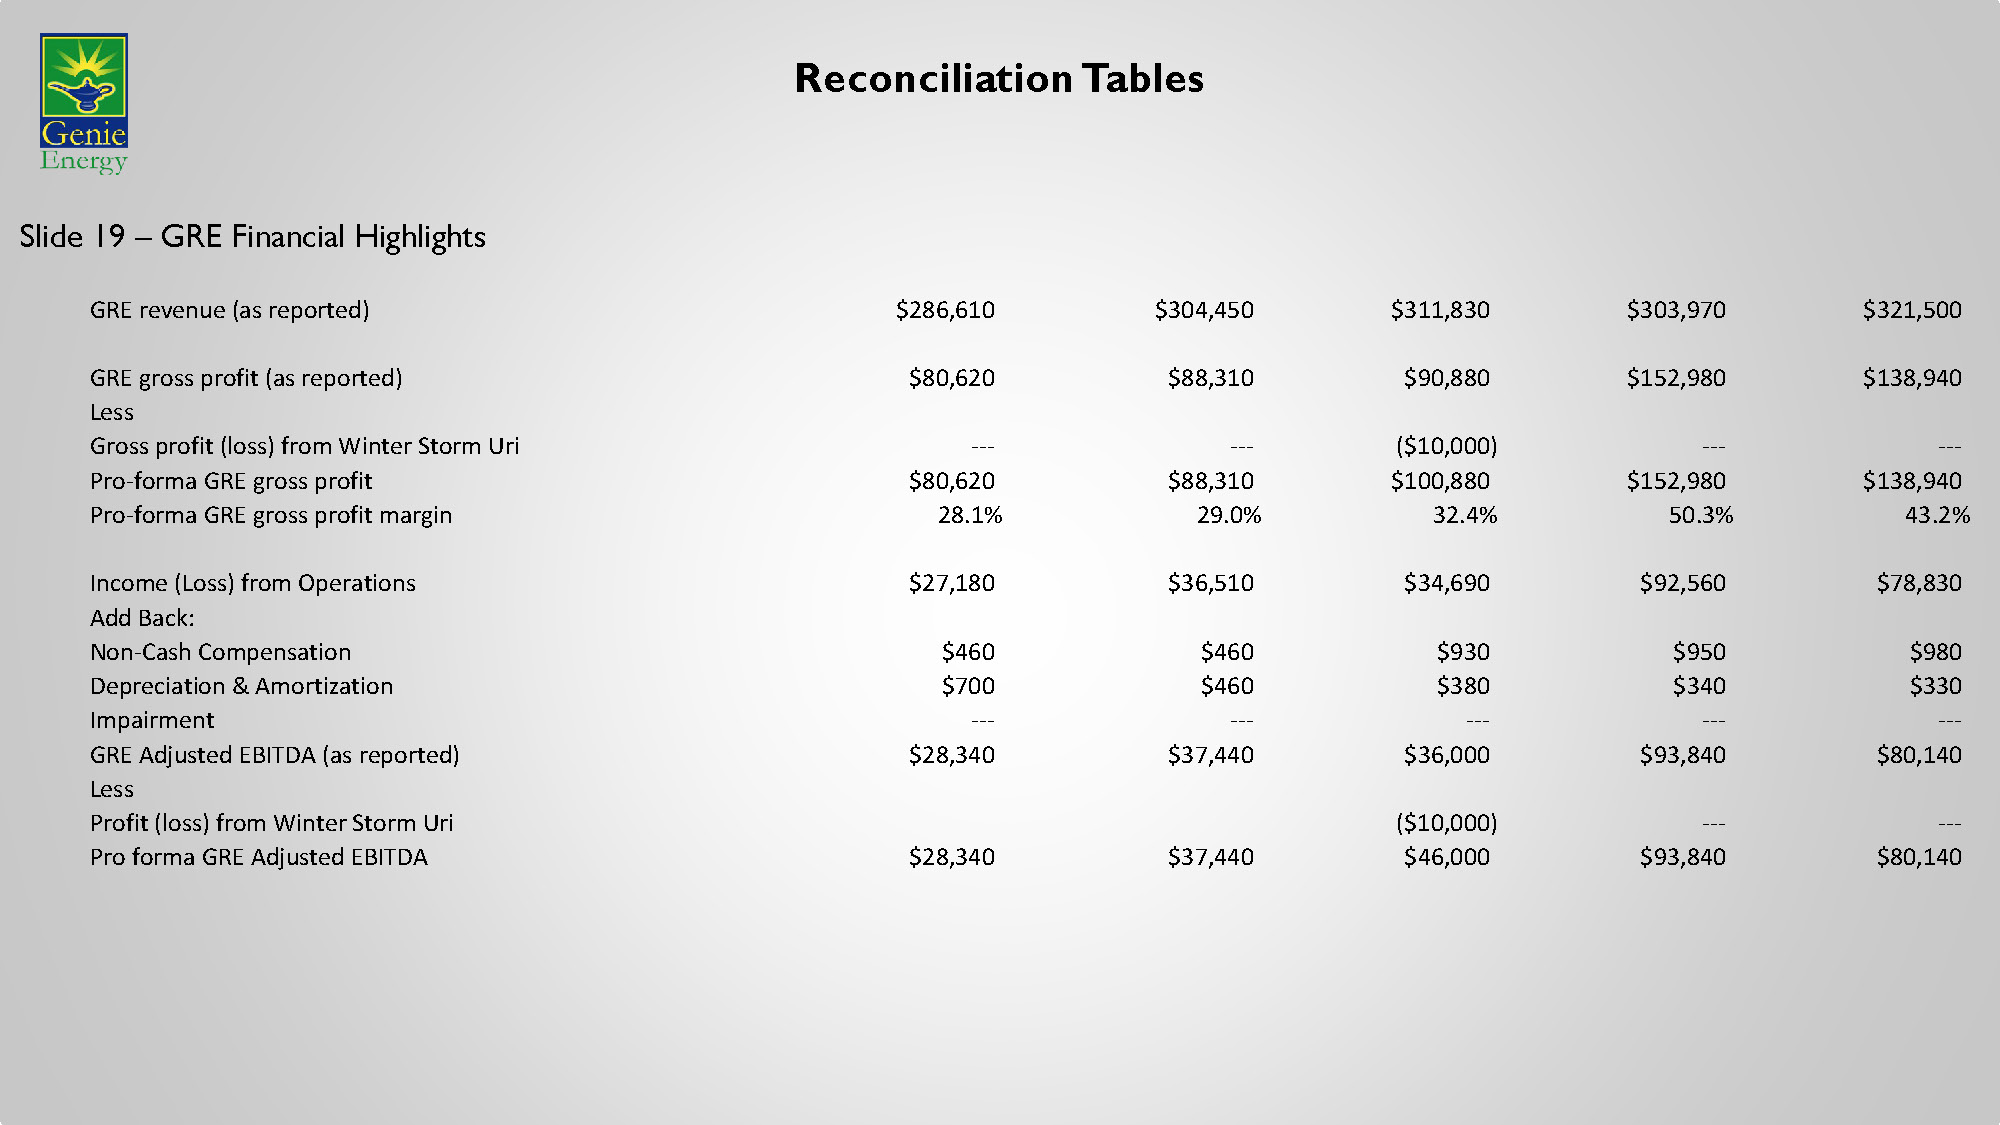
Reconciliation Tables Slide 19 – GRE Financial Highlights GRE revenue (as reported) $286,610 $304,450 $311,830 $303,970 $321,500 GRE gross profit (as reported) $80,620 $88,310 $90,880 $152,980 $138,940 Less Gross profit (loss) from Winter Storm Uri --- --- ($10,000) --- --- Pro-forma GRE gross profit $80,620 $88,310 $100,880 $152,980 $138,940 Pro-forma GRE gross profit margin 28.1% 29.0% 32.4% 50.3% 43.2% Income (Loss) from Operations $27,180 $36,510 $34,690 $92,560 $78,830 Add Back: Non-Cash Compensation $460 $460 $930 $950 $980 Depreciation & Amortization $700 $460 $380 $340 $330 Impairment --- --- --- --- --- GRE Adjusted EBITDA (as reported) $28,340 $37,440 $36,000 $93,840 $80,140 Less Profit (loss) from Winter Storm Uri ($10,000) --- --- Pro forma GRE Adjusted EBITDA $28,340 $37,440 $46,000 $93,840 $80,140 BS0

Reconciliation Tables Slide 20 – GREW Financial Highlights 2019 2020 2021 2022 TTM Income (Loss) from Operations ($2,890) ($2,570) $250 ($3,130) ($2,610) Add Back: Non-Cash Compensation --- --- --- --- --- Depreciation & Amortization $1,010 $330 $50 $50 $50 Impairment $400 $1,400 --- --- --- GREW Adjusted EBITDA (as reported) ($1,490) ($850) $300 ($3,080) ($3,470) BS0