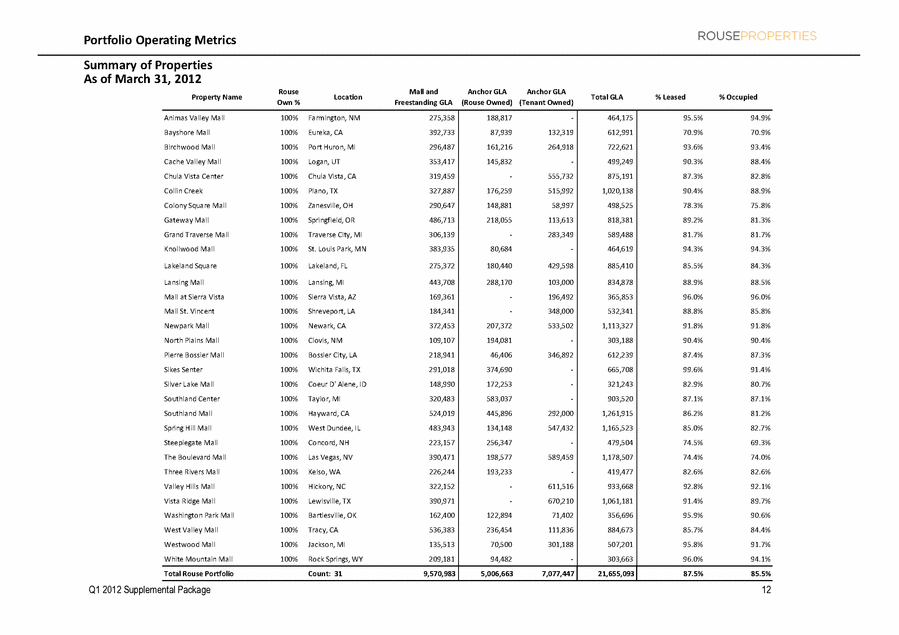
| Q1 2012 Supplemental Package 12 Portfolio Operating Metrics Summary of Properties Property Name Rouse Own % Location Mall and Freestanding GLA Anchor GLA (Rouse Owned) Anchor GLA (Tenant Owned) Total GLA % Leased % Occupied Animas Valley Mall 100% Farmington, NM 275,358 188,817 - 464,175 95.5% 94.9% Bayshore Mall 100% Eureka, CA 392,733 87,939 132,319 612,991 70.9% 70.9% Birchwood Mall 100% Port Huron, MI 296,487 161,216 264,918 722,621 93.6% 93.4% Cache Valley Mall 100% Logan, UT 353,417 145,832 - 499,249 90.3% 88.4% Chula Vista Center 100% Chula Vista, CA 319,459 - 555,732 875,191 87.3% 82.8% Collin Creek 100% Plano, TX 327,887 176,259 515,992 1,020,138 90.4% 88.9% Colony Square Mall 100% Zanesville, OH 290,647 148,881 58,997 498,525 78.3% 75.8% Gateway Mall 100% Springfield, OR 486,713 218,055 113,613 818,381 89.2% 81.3% Grand Traverse Mall 100% Traverse City, MI 306,139 - 283,349 589,488 81.7% 81.7% Knollwood Mall 100% St. Louis Park, MN 383,935 80,684 - 464,619 94.3% 94.3% Lakeland Square 100% Lakeland, FL 275,372 180,440 429,598 885,410 85.5% 84.3% Lansing Mall 100% Lansing, MI 443,708 288,170 103,000 834,878 88.9% 88.5% Mall at Sierra Vista 100% Sierra Vista, AZ 169,361 - 196,492 365,853 96.0% 96.0% Mall St. Vincent 100% Shreveport, LA 184,341 - 348,000 532,341 88.8% 85.8% Newpark Mall 100% Newark, CA 372,453 207,372 533,502 1,113,327 91.8% 91.8% North Plains Mall 100% Clovis, NM 109,107 194,081 - 303,188 90.4% 90.4% Pierre Bossier Mall 100% Bossier City, LA 218,941 46,406 346,892 612,239 87.4% 87.3% Sikes Senter 100% Wichita Falls, TX 291,018 374,690 - 665,708 99.6% 91.4% Silver Lake Mall 100% Coeur D' Alene, ID 148,990 172,253 - 321,243 82.9% 80.7% Southland Center 100% Taylor, MI 320,483 583,037 - 903,520 87.1% 87.1% Southland Mall 100% Hayward, CA 524,019 445,896 292,000 1,261,915 86.2% 81.2% Spring Hill Mall 100% West Dundee, IL 483,943 134,148 547,432 1,165,523 85.0% 82.7% Steeplegate Mall 100% Concord, NH 223,157 256,347 - 479,504 74.5% 69.3% The Boulevard Mall 100% Las Vegas, NV 390,471 198,577 589,459 1,178,507 74.4% 74.0% Three Rivers Mall 100% Kelso, WA 226,244 193,233 - 419,477 82.6% 82.6% Valley Hills Mall 100% Hickory, NC 322,152 - 611,516 933,668 92.8% 92.1% Vista Ridge Mall 100% Lewisville, TX 390,971 - 670,210 1,061,181 91.4% 89.7% Washington Park Mall 100% Bartlesville, OK 162,400 122,894 71,402 356,696 95.9% 90.6% West Valley Mall 100% Tracy, CA 536,383 236,454 111,836 884,673 85.7% 84.4% Westwood Mall 100% Jackson, MI 135,513 70,500 301,188 507,201 95.8% 91.7% White Mountain Mall 100% Rock Springs, WY 209,181 94,482 - 303,663 96.0% 94.1% Total Rouse Portfolio Count: 31 9,570,983 5,006,663 7,077,447 21,655,093 87.5% 85.5% As of March 31, 2012 |
