 Sanchez Energy Corporation Corporate Presentation February 2012 Exhibit 99.1 |
 This presentation contains forward-looking statements within the meaning of Section 27A of the Securities Act of 1933 and Section 21E of the Securities Exchange Act of 1934. All statements, other than statements of historical facts, included in this presentation that address activities, events or developments that the Company expects, believes or anticipates will or may occur in the future are forward-looking statements. Without limiting the generality of the foregoing, forward-looking statements contained in this presentation specifically include the expectations of plans, strategies, objectives and anticipated financial and operating results of the Company, including the Company's drilling program, production, derivative instruments, capital expenditure levels and other guidance included in this presentation. These statements are based on certain assumptions made by the Company based on management's experience and perception of historical trends, current conditions, anticipated future developments and other factors believed to be appropriate. Such statements are subject to a number of assumptions, risks and uncertainties, many of which are beyond the control of the Company, which may cause actual results to differ materially from those implied or expressed by the forward-looking statements. These include, but are not limited to, changes in oil and natural gas prices, weather and environmental conditions, the timing of planned capital expenditures, availability of acquisitions, uncertainties in estimating proved reserves and forecasting production results, operational factors affecting the commencement or maintenance of producing wells, the condition of the capital markets generally, as well as the Company's ability to access them, the proximity to and capacity of transportation facilities, and uncertainties regarding environmental regulations or litigation and other legal or regulatory developments affecting the Company's business and other important factors that could cause actual results to differ materially from those projected as described in the Company's reports filed with the SEC. Any forward-looking statement speaks only as of the date on which such statement is made and the Company undertakes no obligation to correct or update any forward-looking statement, whether as a result of new information, future events or otherwise, except as required by applicable law. References to quantities of oil or natural gas may include amounts that the Company believes will ultimately be produced but that are not yet classified as “proved reserves” under SEC definitions. Forward-Looking Statements 2 |
 Sanchez Energy Corporation Overview 3 Financial Summary Reserves And Resource Potential Eagle Ford Acreage And Drilling Inventory Production 1. Management estimates based on ~120 acre spacing on the undeveloped portion of our acreage. Eagle Ford Acres ~91,000 Eagle Ford Net Unrisked Drilling Locations (1) ~750 Proved Reserves (MMBoe) 6.7 Oil % of Proved Reserves 84% Undeveloped % of Proved Reserves 86% Resource Potential (MMBoe) ~250 9 Months Ended 9/30/11 (Boe/d) 431 2011 Exit Rate (Boe/d) 1,350 2012E Exit Rate (Boe/d) 4,000 - 5,000 Market Capitalization ($MM) ~$650 Enterprise Value ($MM) ~$580 Debt / Enterprise Value 0% |
 High growth oil and gas producer with significant exposure to lower-risk drilling opportunities in the Eagle Ford Shale trend of South Texas, one of the fastest growing shale plays in North America ~91,000 net acre position in oil portion of the Eagle Ford Expect to aggressively grow undeveloped acreage position at attractive per acre valuations Sanchez Group has a proven track record of identifying, acquiring, and executing large drilling programs ~40 years of operations Sanchez has been in the oil and gas business since 1972, drilled or participated in over 900 wells, invested over $1 billion in South Texas, and cultivated long-standing relationships with surface and mineral rights owners in the Eagle Ford Access to significant technological database including 3D seismic, 2D seismic, and well logs Near-term growth leveraged to oil and liquids projects Large inventory of identified lower risk, higher return drilling opportunities 2012 capital budget: $136 – $154 million for drilling and completions of 16.5 net Eagle Ford wells plus facilities, leasing, and seismic Transforms valuation proposition through conversion of resource to production, reserves, and cash flow Majority of Eagle Ford leases have full depth rights and we believe are prospective for the Buda Limestone, Austin Chalk, and Pearsall Shale formations, among others ~1,200 net acre position in the core of the Haynesville Shale ~82,000 net acres in northern Montana prospective for the Heath, Three Forks, and Bakken Shales Pure Play Eagle Ford Company Proven Track Record Provides Platform for Growth Aggressive 2012 Growth Plan Additional Upside Summary Highlights 4 Volatile oil window (Gonzales, Fayette, & Lavaca Counties) Black oil window (Zavala, Frio, & Atascosa Counties) – – |
 Directly involved in the energy business for over 12 years Integral in identifying prospective areas and implementing leasing and drilling programs in the Eagle Ford and other oil producing plays Extensive experience drilling a broad range of conventional and unconventional wells Prior experience includes JP Morgan Investment Banking (Mergers & Acquisitions) and Zix Corporation, a Dallas based public technology firm where he continues to serve on the Board of Directors MBA, Harvard University; BBA Georgetown University (dual major in Accounting and Finance, minor in Economics) SVP and CFO of Edge Petroleum Corporation for 12 years; IPO and capital markets experience VP Finance at W&T Offshore, a public E&P company (1996-1997) 17 years of oil & gas (commercial and investment) banking experience MS (Economics); University of Illinois 30 years of successful experience in oil and gas exploration and development Generated and drilled numerous prospects in the Gulf of Mexico and along the Gulf Coast Onshore Exploration experience in the Cretaceous Carbonates along the Texas Gulf Coast Managed successful exploration programs for over 14 years BS Geology, Geophysics and Petroleum Engineering Minor; The University of Texas at Austin 1981 Graduate level coursework; University Texas at Dallas 1983 Managing Partner of Garcia Hamilton & Associates, L.P. since 2002 Prior experience includes Smith Graham & Company (Chief Investment Officer), Cisneros Asset Management (President), and Salomon Brothers (mortgage-backed securities) BA Economics; Yale University Tony Sanchez III Founder, Chairman & CEO Michael G. Long SVP & CFO Management and Directors 5 Patrick Talamas SVP of Geoscience Gilbert Garcia Director |
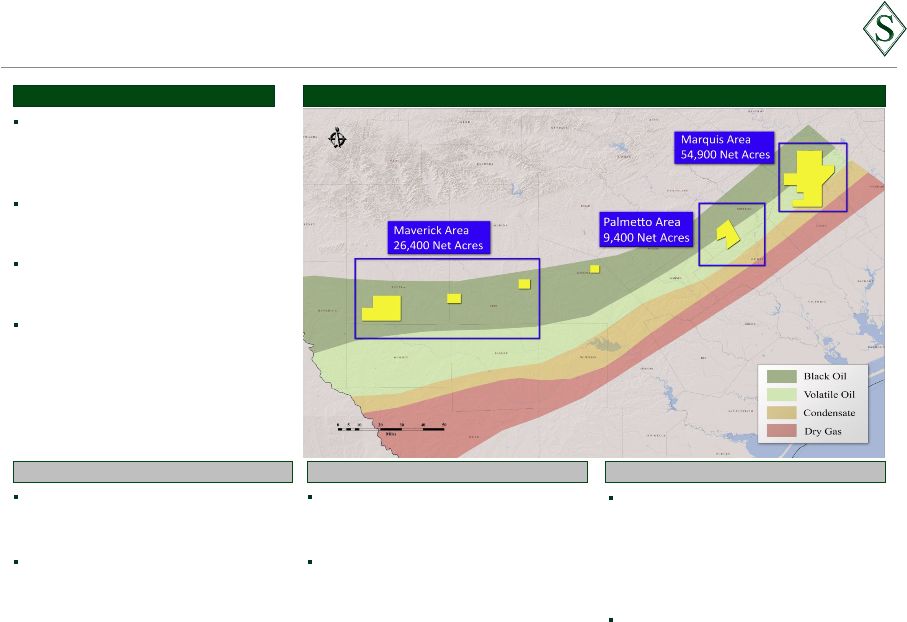 ~26,400 net acres – Zavala and Frio Counties, Texas – Black oil window 2012 drilling plans – 4.0 net operated wells: $22 – $28 million Sanchez Energy Corporation Overview ~91,000 net acres in the Eagle Ford – 3 primary project areas – Large contiguous blocks drive efficiencies Drilling inventory (1) – ~750 net unrisked Eagle Ford locations 2012 drilling program – $126 – $144 million to drill 16.5 net Eagle Ford wells Positioned to expand core Eagle Ford acreage position – ~40 year relationships with mineral and surface owners should allow for rapid acreage growth Maverick 1. Management estimates based on ~120 acre spacing on the undeveloped portion of our acreage. ~9,400 net acres – Gonzales County, Texas – Volatile oil window 2012 drilling plans – 6.5 net wells: $52 – $58 million Company Overview Eagle Ford Shale Area Map Palmetto ~54,900 net acres – ~48,600 net in SW Fayette & NE Lavaca Counties, Texas – Volatile oil window – ~6,300 net in Atascosa, Webb, and DeWitt Counties, Texas 2012 drilling plans – 6.0 net operated wells: $52 – $58 million Marquis 6 |
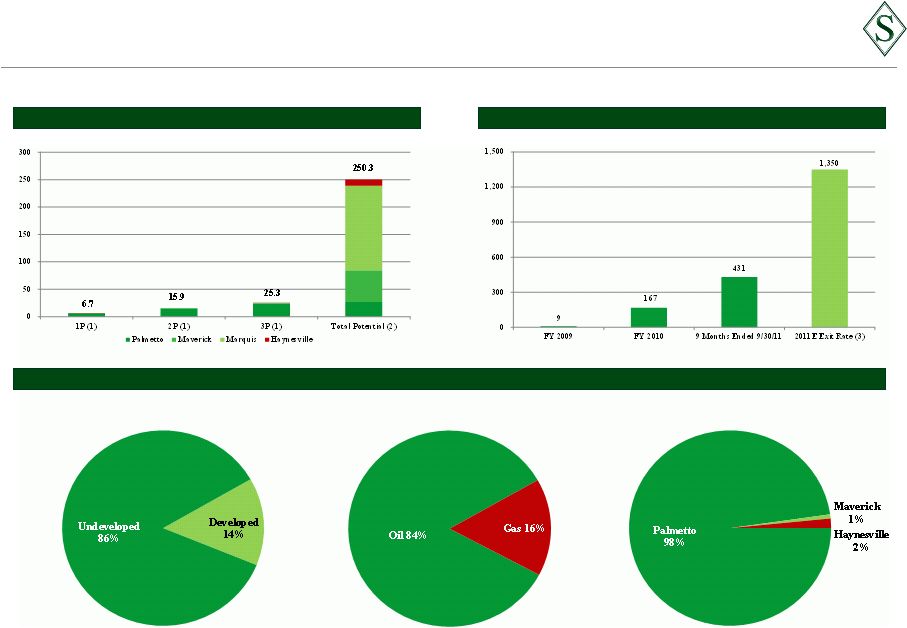 Oil-Weighted Reserve & Production Growth 7 Reserves & Potential (MMBoe) (1) Average Daily Net Production (Boe/d) Proved Reserves: 6.7 MMBoe (12/31/11) 1. Per Ryder Scott as of 12/31/11. 3P reserves principally include the Palmetto area. 2. Per management estimates. 3. Exit rate for last day of 2011. |
 Multi-Year Inventory & 2012 Drilling Program During 2012 Sanchez anticipates spending $126 – $144 million to drill 23 gross (16.5 net) wells Sanchez has identified a multi-year drilling inventory of ~750 total net unrisked locations in the Eagle Ford – Additional upside identified in the Austin Chalk and Buda Limestone formations 9 Eagle Ford wells currently producing: 7 from the Eagle Ford; 2 from dual-completions in the Austin Chalk and Buda Limestone 1 additional vertical Eagle Ford well awaiting completion with first production expected in February 2012 Other 2012 capital spending of ~$10 million for facilities, leasing, and seismic 8 1. Total identified drilling locations are calculated using ~120 acre spacing. Net Net Unrisked Planned Project Area Acres Locations (1) Net Wells Eagle Ford Palmetto 9,416 75 6.5 $52 - $58 Marquis 54,868 457 6.0 52 - 58 Maverick 26,410 218 4.0 22 - 28 Total Eagle Ford 90,694 750 16.5 $126 - $144 2012E ($MM) Drilling Budget |
 Eagle Ford Overview 9 |
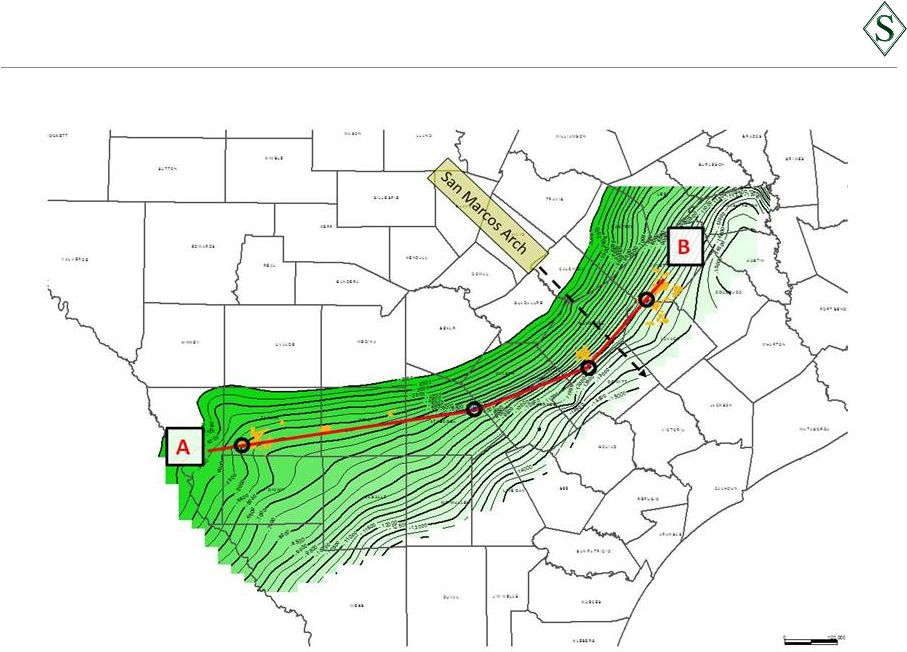 10 Eagle Ford Structure Map |
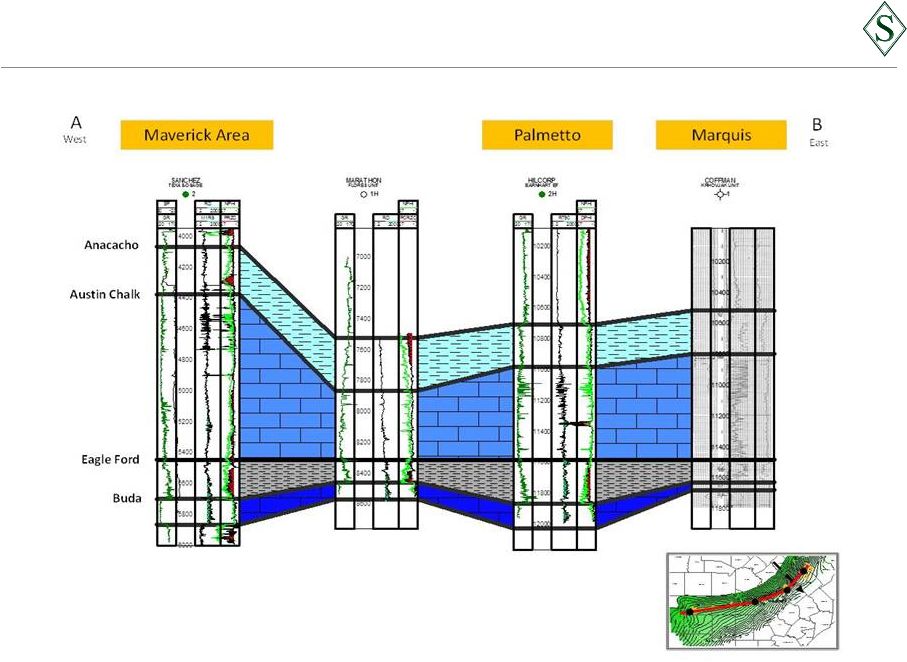 11 Eagle Ford Cross Section |
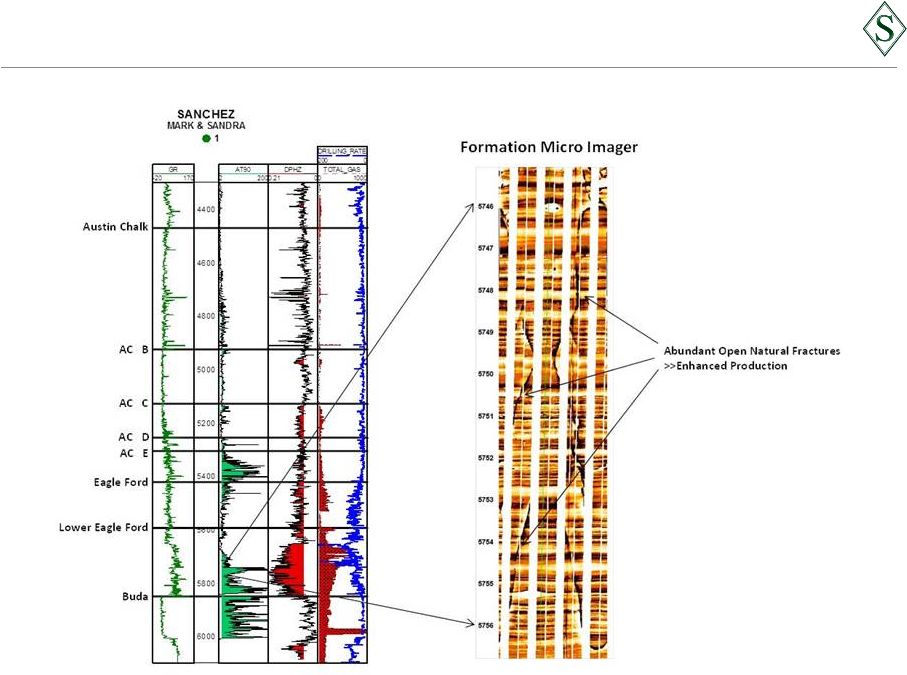 Maverick Area Natural Fracturing 12 |
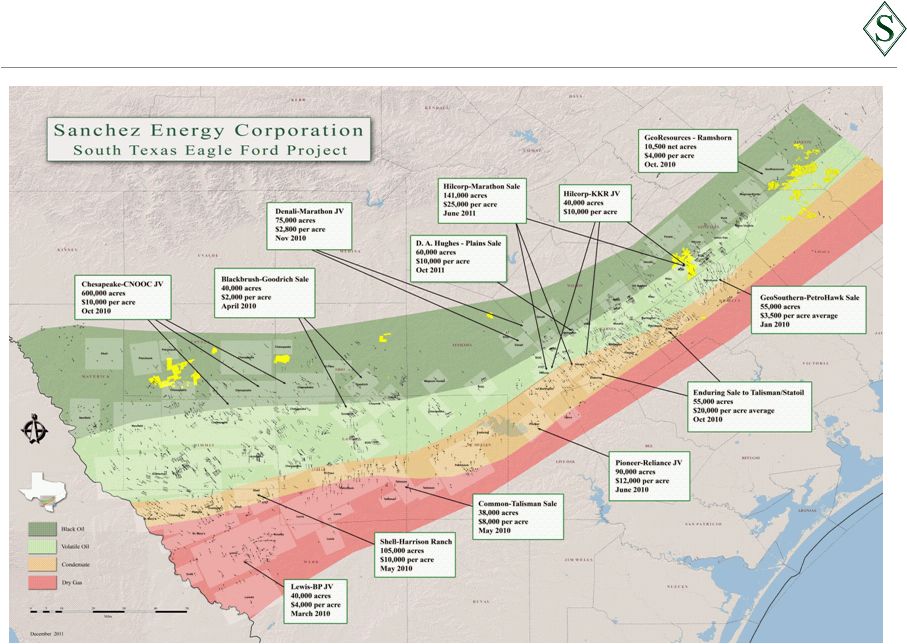 Eagle Ford Shale Overview Map (1) 13 1. Transaction information based on Management estimates. |
 Operational Overview 14 |
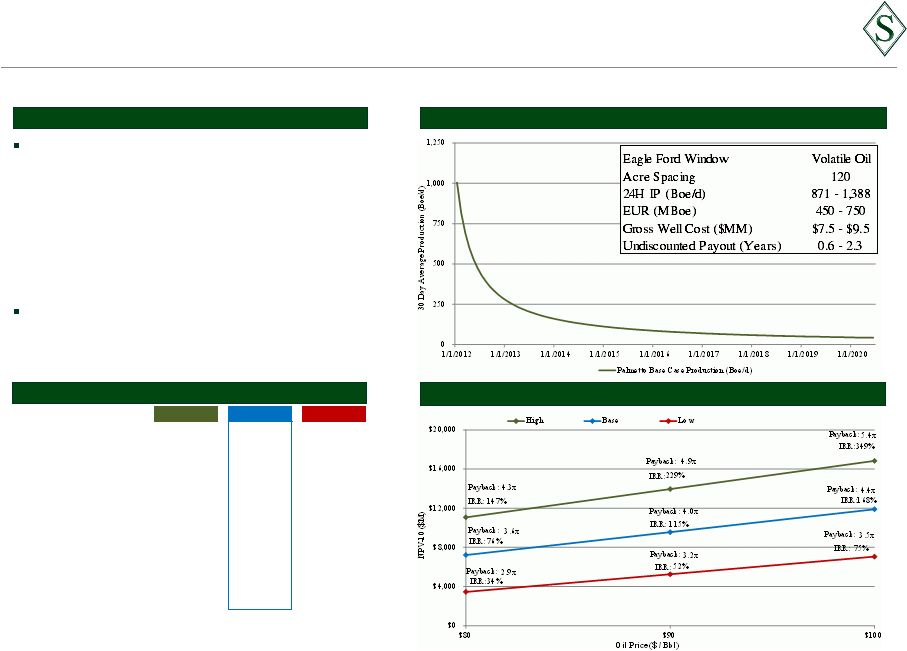 Eagle Ford Shale – Palmetto Area ~9,400 net acres in Gonzales County – 50% / 50% area of mutual interest with Marathon – ~50% W.I. – ~75 net identified unrisked locations / ~27 MMBoe of unrisked potential (1) – Exploring down spacing from 120 to 80 acres, which will increase net identified unrisked locations to 115 from 75 2012 drilling program – $52 – $58 million committed to Palmetto – 6.5 net wells planned in Palmetto 15 Palmetto Area Overview Sensitivity Case Assumptions (2) Average Type Curve / Development Economics (2) Undiscounted Payback and IRR (2) 1. Management estimates. 2. Sensitivity cases, type curves, undiscounted paybacks, and IRRs are management estimates and are derived from operating experience, offset operator activity, and other published industry information. 3. At $90 oil. High Base Low Gross Well Cost ($MM) $8.5 $8.5 $8.5 24H IP (Boe/d) 1,388 1,125 871 Initial Decline (% / Year) 75% 75% 75% B-Factor 1.0 1.0 1.0 EUR (MBoe) 750 600 450 PV-10 ($MM) (3) $14.0 $9.6 $5.3 |
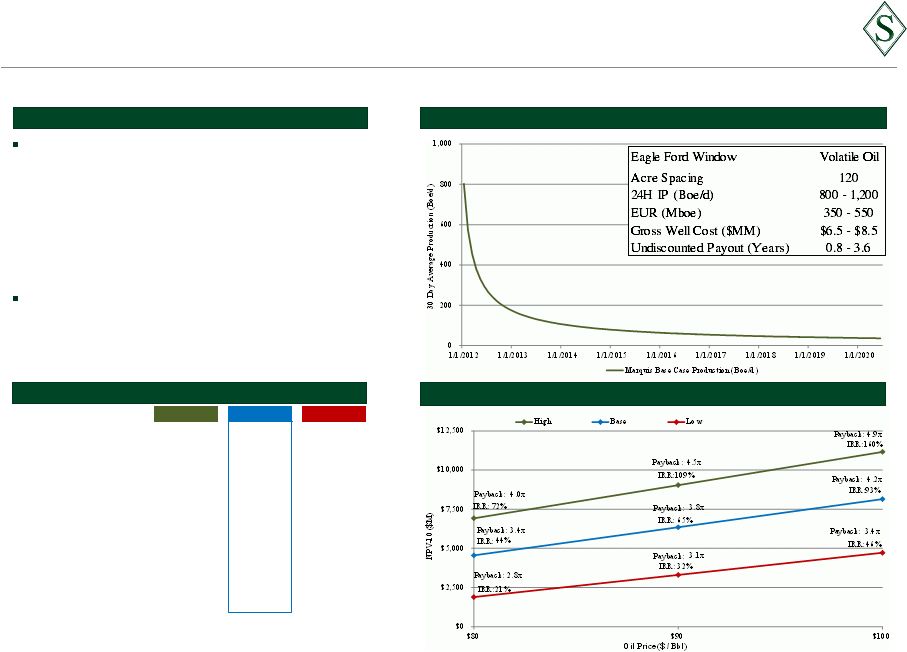 Eagle Ford Shale – Marquis Area ~54,900 net acres – ~48,600 net acres in Southwest Fayette & Northeast Lavaca Counties – ~6,300 net acres in Atascosa, Webb, and DeWitt Counties – 100% W.I. / 100% Operated – ~457 net identified unrisked locations / ~154 MMBoe of unrisked potential (1) 2012 drilling program – $52 - $58 million committed to Marquis – 6.0 net wells planned in Marquis Area Marquis Area Overview Sensitivity Case Assumptions (2) Average Type Curve / Development Economics (2) Undiscounted Payback and IRR (2) 1. Management estimates. 2. Sensitivity cases, type curves, undiscounted paybacks, and IRRs are management estimates and are derived from operating experience, offset operator activity, and other published industry information. 3. Reflects well costs under a continuous development program; initial test wells may have higher costs. 4. At $90 oil. High Base Low Gross Well Cost ($MM) (3) $7.5 $7.5 $7.5 24H IP (Boe/d) 1,200 1,000 800 Initial Decline (% / Year) 83% 83% 83% B-Factor 1.3 1.3 1.3 EUR (MBoe) 550 450 350 PV-10 ($MM) (4) $9.0 $6.4 $3.3 16 |
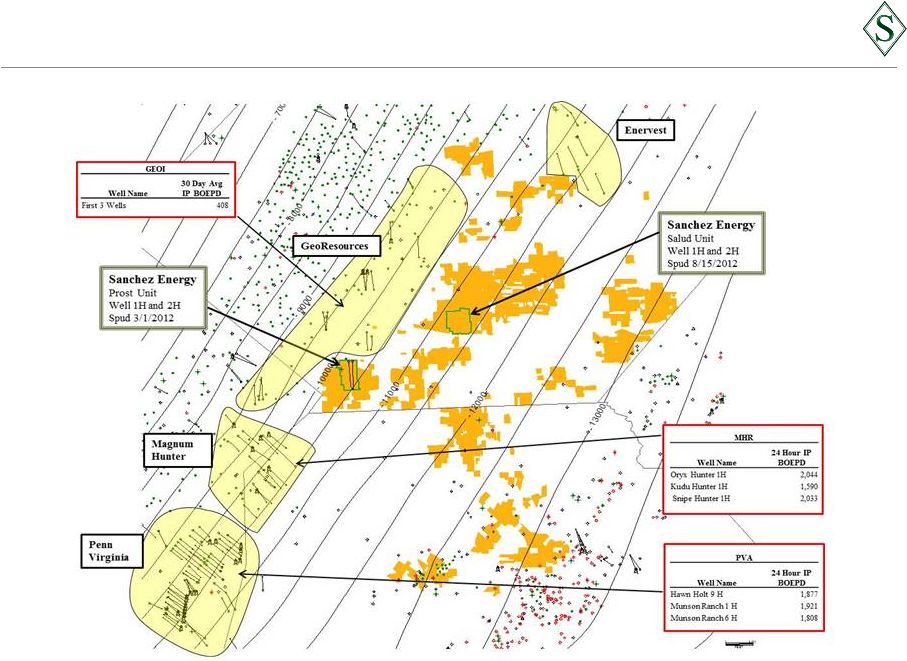 Marquis Area Activity 17 |
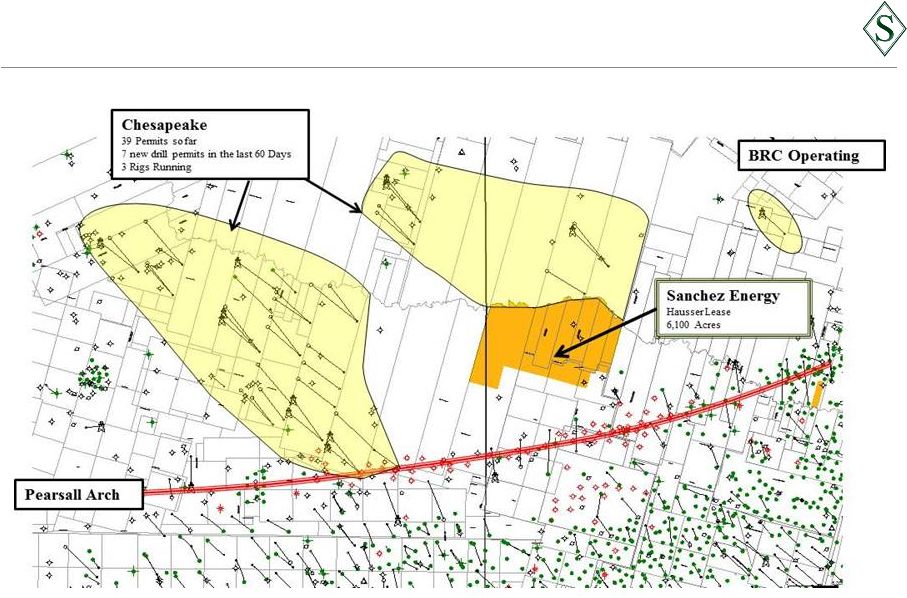
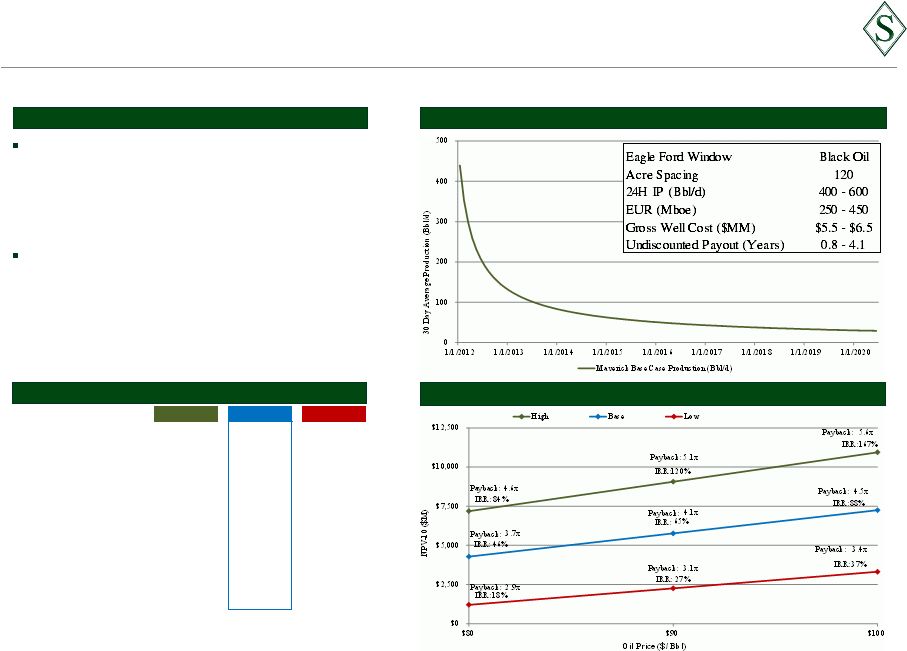 Eagle Ford Shale – Maverick Area 18 Maverick Area Overview ~26,400 net acres in Zavala and Frio Counties – ~80% W.I. / 100% operated – ~218 net identified unrisked locations / ~58 MMBoe of unrisked potential (1) 2012 drilling program – $22 - $28 million committed to Maverick – 4.0 net wells planned in Maverick Area Sensitivity Case Assumptions (2) Average Type Curve / Development Economics (2) Undiscounted Payback and IRR (2) 1. Management estimates. 2. Sensitivity cases, type curves, undiscounted paybacks, and IRRs are management estimates and are derived from operating experience, offset operator activity, and other published industry information. 3. At $90 oil. High Base Low Gross Well Cost ($MM) $6.0 $6.0 $6.0 24H IP (Bbl/d) 600 500 400 Initial Decline (% / Year) 72% 74% 77% B-Factor 1.3 1.3 1.3 EUR (MBoe) 450 350 250 PV-10 ($MM) (1) $9.1 $5.8 $2.3 |
 Maverick Area Activity 19 |
 High growth oil and gas producer with significant exposure to lower-risk drilling opportunities in the Eagle Ford Shale trend of South Texas, one of the fastest growing shale plays in North America ~91,000 net acre position in oil portion of the Eagle Ford Expect to aggressively grow undeveloped acreage position at attractive per acre valuations Sanchez Group has a proven track record of identifying, acquiring, and executing large drilling programs ~40 years of operations Sanchez has been in the oil and gas business since 1972, drilled or participated in over 900 wells, invested over $1 billion in South Texas, and cultivated long-standing relationships with surface and mineral rights owners in the Eagle Ford Access to significant technological database including 3D seismic, 2D seismic, and well logs Near-term growth leveraged to oil and liquids projects Large inventory of identified lower risk, higher return drilling opportunities 2012 capital budget: $136 – $154 million for drilling and completions of 16.5 net Eagle Ford wells plus facilities, leasing, and seismic Transforms valuation proposition through conversion of resource to production, reserves, and cash flow Majority of Eagle Ford leases have full depth rights and we believe are prospective for the Buda Limestone, Austin Chalk, and Pearsall Shale formations, among others ~1,200 net acre position in the core of the Haynesville Shale ~82,000 net acres in northern Montana prospective for the Heath, Three Forks, and Bakken Shales Pure Play Eagle Ford Company Proven Track Record Provides Platform for Growth Aggressive 2012 Growth Plan Additional Upside Summary Highlights 20 Volatile oil window (Gonzales, Fayette, & Lavaca Counties) Black oil window (Zavala, Frio, & Atascosa Counties) – – |
 Appendix 21 |
 Haynesville Shale and Northern Montana ~1,200 net acres primarily in Natchitoches Parish – 22% - 25% non-operated W.I. – 14 net identified unrisked locations Operated by Chesapeake 2012 drilling program – Do not plan on spending additional capital in the near-term 22 Haynesville Area Overview Heath, Three Forks, and Bakken – Northern Montana Area Overview 82,000 net acres in Lewis & Clark, Meagher, and Cascade Counties, Montana Prospective for the Heath, Three Forks, and Bakken Shales Five year lease terms with option to extend an additional five years for $10 per acre 2012 drilling program – Do not plan on spending additional capital in this area as we will allow industry activity to de-risk the play |