Exhibit (C)(1)
| Preliminary Draft – Confidential Jefferies LLC Member SIPC The information provided in this document, including valuation discussions, represents the views of Jefferies Investment Banking. There is no assurance that the views expressed herein will be consistent with the views expressed by Jefferies Research or its Analysts. Nothing in this document should be understood as a promise or offer of favorable research coverage. Project FREEDOM Preliminary Materials for Discussion April 2023 / Confidential |

| Preliminary Draft – Confidential Jefferies LLC / April 2023 Table of Contents Part 1 Situation Overview 3 Public Market Overview 6 Selected Dividend Considerations 12 Management LRP Overview 16 Part 2 Preliminary FREEDOM Valuation Considerations 21 Preliminary VICTORY Considerations 33 Potential Next Steps for Discussion 41 Appendix 45 i |
| Preliminary Draft – Confidential Jefferies LLC / April 2023 Disclaimer The following pages contain material provided to the Special Committee (the “Special Committee”) of the Board of Directors (the “Board”) of FREEDOM (the “Company”) by Jefferies LLC (“Jefferies”) in connection with Project FREEDOM. These materials were prepared on a confidential basis in connection with an oral presentation to the Special Committee and not with a view toward complying with the disclosure standards under state or federal securities laws or otherwise. These materials are solely for use of the Special Committee in its evaluation of the proposed transaction and may not be used for any other purpose or disclosed to any party without Jefferies’ prior written consent. The information contained in this presentation was based solely on publicly available information or information furnished to Jefferies by the Company. Jefferies has relied, without independent investigation or verification, on the accuracy, completeness and fair presentation of all such information and the conclusions contained herein are conditioned upon such information (whether written or oral) being accurate, complete and fairly presented in all respects. None of Jefferies, its affiliates or its or their respective employees, directors, officers, contractors, advisors, members, successors or agents makes any representation or warranty in respect of the accuracy, completeness or fair presentation of any information or any conclusion contained herein. Jefferies, its affiliates and its and their respective employees, directors, officers, contractors, advisors, members, successors and agents shall have no liability with respect to any information or matter contained herein, or any oral information provided herewith or data any of them generates. Jefferies undertakes no obligation to update these materials. Neither Jefferies nor any of its affiliates is an advisor as to legal, tax, accounting or regulatory matters in any jurisdiction. This presentation is a preliminary analysis only and does not constitute a fairness opinion of Jefferies as to the value of the Company, and as such, should not be relied upon by the Company or by any other person as such. The financial data, analyses and assumptions reflected here remain subject to refinement and change based on further discussions and information regarding FREEDOM’s businesses and its financial and operating markets. 1 |
| Preliminary Draft – Confidential Jefferies LLC / April 2023 Part 1 2 |

| Preliminary Draft – Confidential Jefferies LLC / April 2023 Situation Overview 3 |
| Preliminary Draft – Confidential Jefferies LLC / April 2023 ◼ On March 20, 2023, FREEDOM (or the “Company”) announced publicly the receipt of an an unsolicited non-binding proposal from an undisclosed bidder(1) (the “Bidder”) to acquire all of the outstanding shares of the common stock for $30.00 per share in cash (the “Proposed Transaction”) ─ The proposal implied a 31.9% and 12.8% premium to FREEDOM’s unaffected and 30-day VWAP as of April 12, 2023, respectively, and 7.3x FREEDOM’s LTM 2022A reported EBITDA ─ Conditioned on: o Current management agreeing to roll their equity and continue with the Company o Approval of the Special Committee and majority of non-Bidder and non-management shareholders o Other customary conditions (e.g., HSR) o 30 days of diligence o Transaction funded by cash on hand and newly-raised debt financing; no financing condition ◼ A transaction led by Permitted Holders, including B.Riley, Irradiant, Pimco (and Brian Kahn), should not require the refinancing of FREEDOM’s existing debt ◼ In its capacity as financial advisor to the Special Committee of the Board of Directors of FREEDOM (the “Special Committee”), Jefferies has: ─ Reviewed the Company’s publicly available information and internal financial analyses including its long-range plan (“LRP”) dated as of April 13, 2023 ─ Engaged in numerous discussions with the Bidder and its approved partners including current Company lenders Irradiant and Pimco as well as Garnett Station and Morgan Stanley Direct Lending ─ Contacted 9 third parties regarding potential interest in a transaction with FREEDOM, of which 3 parties are in process and 2 parties are interested in an NDA ─ Two additional VICTORY-only parties that are currently assessing interest; one has passed; more are being contacted ◼ Based on our work to date, the following materials reflect the following analysis and discussion topics: ─ Perspectives on FREEDOM’s current situation including as it relates to the performance of its businesses, future dividend payments and valuation ─ Preliminary valuation analysis as it relates to the Company’s stand-alone intrinsic and Sum-of-the-Parts value and relative to other publicly traded companies and precedent M&A transactions relative to the Proposed Transaction ─ Considerations regarding a potential divestiture of VICTORY including potential gross and net valuation levels assuming full debt paydown, interested parties and process timelines ─ Potential next steps Executive Summary (1) Bidder was B. Riley Financial, Inc. 4 |
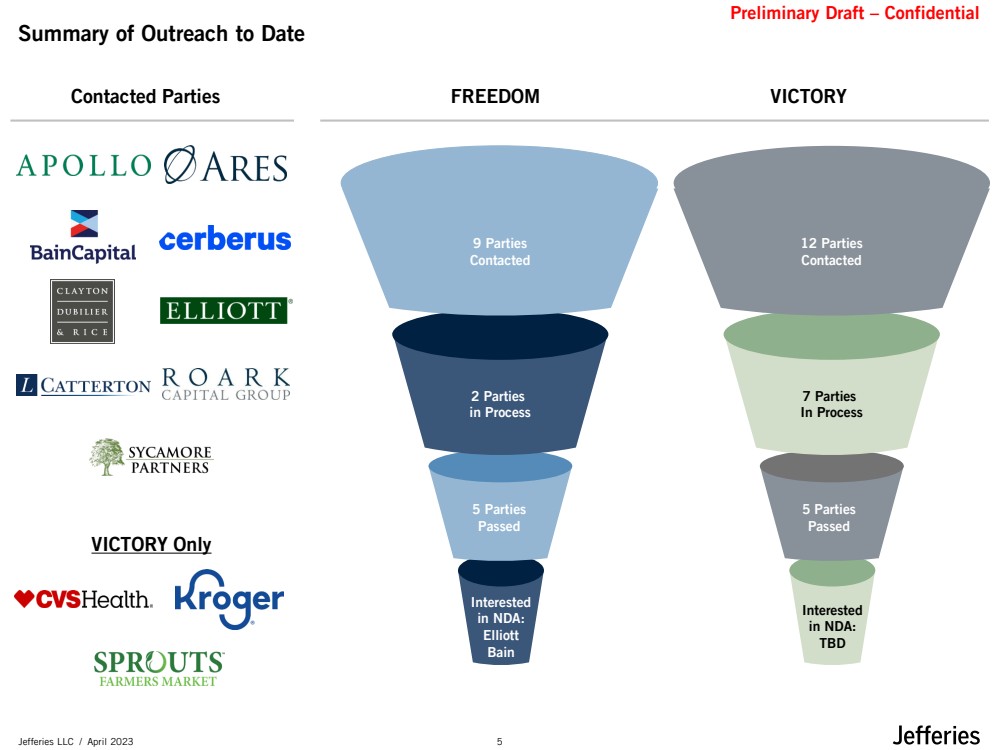
| Preliminary Draft – Confidential Jefferies LLC / April 2023 Summary of Outreach to Date FREEDOM Interested in NDA: Elliott Bain 9 Parties Contacted 2 Parties in Process Contacted Parties Interested in NDA: TBD 12 Parties Contacted 7 Parties In Process VICTORY VICTORY Only 5 Parties Passed 5 Parties Passed 5 |
| Preliminary Draft – Confidential Jefferies LLC / April 2023 Public Market Overview 6 |
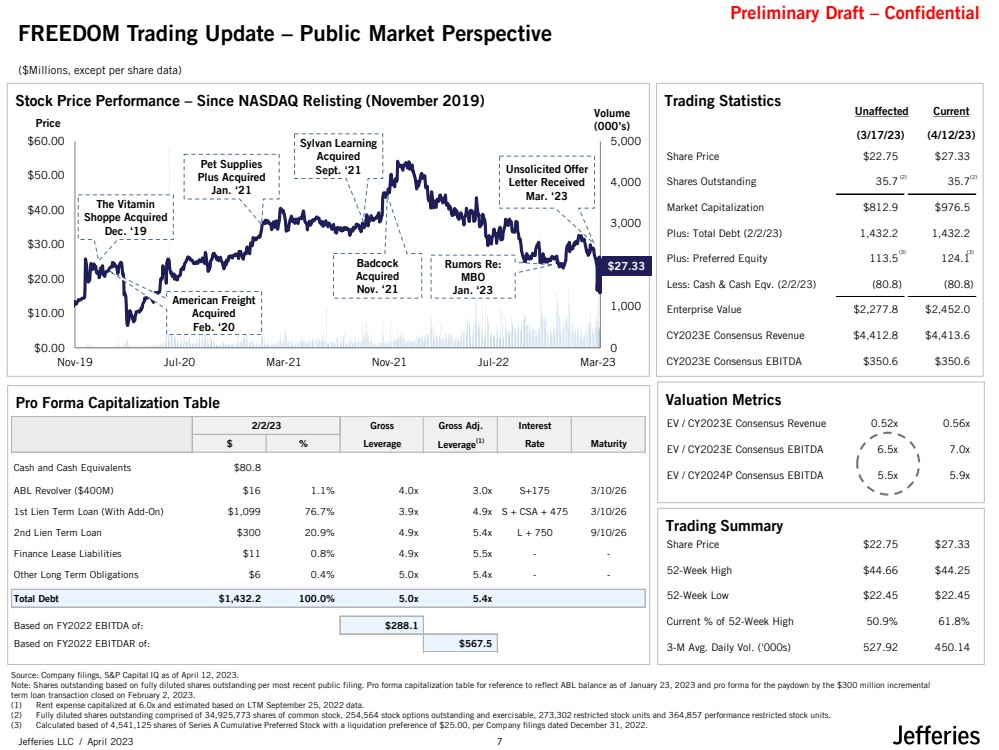
| Preliminary Draft – Confidential Jefferies LLC / April 2023 Stock Price Performance – Since NASDAQ Relisting (November 2019) Trading Statistics 0 1,000 2,000 3,000 4,000 5,000 $0.00 $10.00 $20.00 $30.00 $40.00 $50.00 $60.00 Nov-19 Jul-20 Mar-21 Nov-21 Jul-22 Mar-23 Volume (000’s) Price Pro Forma Capitalization Table Valuation Metrics Trading Summary FREEDOM Trading Update – Public Market Perspective $27.33 8.2x 7.0x 15.2x 12.7x Unsolicited Offer Letter Received Mar. ‘23 Rumors Re: MBO Jan. ‘23 (4/12/23) Current (3/17/23) Unaffected ($Millions, except per share data) (2) (2) Pet Supplies Plus Acquired Jan. ‘21 Sylvan Learning Acquired Sept. ‘21 The Vitamin Shoppe Acquired Dec. ‘19 Badcock Acquired Nov. ‘21 American Freight Acquired Feb. ‘20 Source: Company filings, S&P Capital IQ as of April 12, 2023. Note: Shares outstanding based on fully diluted shares outstanding per most recent public filing. Pro forma capitalization table for reference to reflect ABL balance as of January 23, 2023 and pro forma for the paydown by the $300 million incremental term loan transaction closed on February 2, 2023. (1) Rent expense capitalized at 6.0x and estimated based on LTM September 25, 2022 data. (2) Fully diluted shares outstanding comprised of 34,925,773 shares of common stock, 254,564 stock options outstanding and exercisable, 273,302 restricted stock units and 364,857 performance restricted stock units. (3) Calculated based of 4,541,125 shares of Series A Cumulative Preferred Stock with a liquidation preference of $25.00, per Company filings dated December 31, 2022. 2/2/23 Gross Gross Adj. Interest $ % Leverage Leverage(1) Rate Maturity Cash and Cash Equivalents $80.8 ABL Revolver ($400M) $16 1.1% 4.0x 3.0x S+175 3/10/26 1st Lien Term Loan (With Add-On) $1,099 76.7% 3.9x 4.9x S + CSA + 475 3/10/26 2nd Lien Term Loan $300 20.9% 4.9x 5.4x L + 750 9/10/26 Finance Lease Liabilities $11 0.8% 4.9x 5.5x - - Other Long Term Obligations $6 0.4% 5.0x 5.4x - - Total Debt $1,432.2 100.0% 5.0x 5.4x Based on FY2022 EBITDA of: $288.1 Based on FY2022 EBITDAR of: $567.5 Share Price $22.75 $27.33 Shares Outstanding 35.7 35.7 Market Capitalization $812.9 $976.5 Plus: Total Debt (2/2/23) 1,432.2 1,432.2 Plus: Preferred Equity 113.5 124.1 Less: Cash & Cash Eqv. (2/2/23) (80.8) (80.8) Enterprise Value $2,277.8 $2,452.0 CY2023E Consensus Revenue $4,412.8 $4,413.6 CY2023E Consensus EBITDA $350.6 $350.6 EV / CY2023E Consensus Revenue 0.52x 0.56x EV / CY2023E Consensus EBITDA 6.5x 7.0x EV / CY2024P Consensus EBITDA 5.5x 5.9x Share Price $22.75 $27.33 52-Week High $44.66 $44.25 52-Week Low $22.45 $22.45 Current % of 52-Week High 50.9% 61.8% 3-M Avg. Daily Vol. ('000s) 527.92 450.14 (3) (3) 7 |
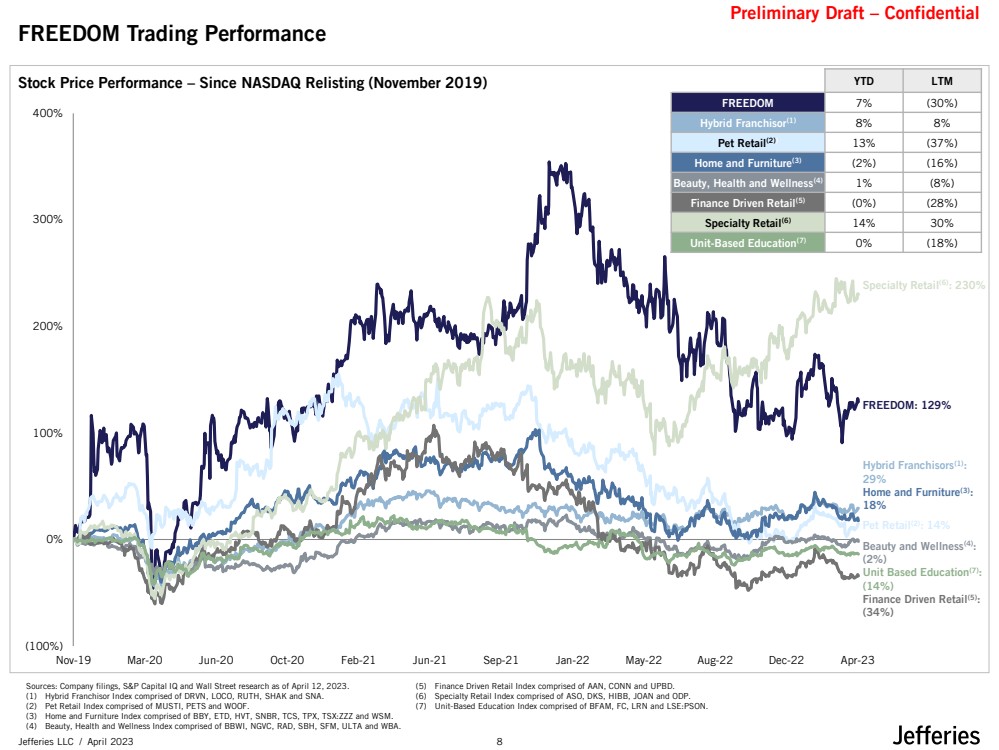
| Preliminary Draft – Confidential Jefferies LLC / April 2023 FREEDOM Trading Performance Nov-19 Mar-20 Jun-20 Oct-20 Feb-21 Jun-21 Sep-21 Jan-22 May-22 Aug-22 Dec-22 Apr-23 (100%) 0% 100% 200% 300% 400% Stock Price Performance – Since NASDAQ Relisting (November 2019) Sources: Company filings, S&P Capital IQ and Wall Street research as of April 12, 2023. (1) Hybrid Franchisor Index comprised of DRVN, LOCO, RUTH, SHAK and SNA. (2) Pet Retail Index comprised of MUSTI, PETS and WOOF. (3) Home and Furniture Index comprised of BBY, ETD, HVT, SNBR, TCS, TPX, TSX:ZZZ and WSM. (4) Beauty, Health and Wellness Index comprised of BBWI, NGVC, RAD, SBH, SFM, ULTA and WBA. (5) Finance Driven Retail Index comprised of AAN, CONN and UPBD. (6) Specialty Retail Index comprised of ASO, DKS, HIBB, JOAN and ODP. (7) Unit-Based Education Index comprised of BFAM, FC, LRN and LSE:PSON. FREEDOM: 129% Hybrid Franchisors(1): 29% Specialty Retail(6): 230% Beauty and Wellness(4): (2%) Finance Driven Retail(5): (34%) Unit Based Education(7): (14%) Pet Retail(2): 14% Home and Furniture(3): 18% YTD LTM FREEDOM 7% (30%) Hybrid Franchisor(1) 8% 8% Pet Retail(2)) 13% (37%) Home and Furniture(3) (2%) (16%) Beauty, Health and Wellness(4) 1% (8%) Finance Driven Retail(5) (0%) (28%) Specialty Retail(6) 14% 30% Unit-Based Education(7) 0% (18%) 8 |
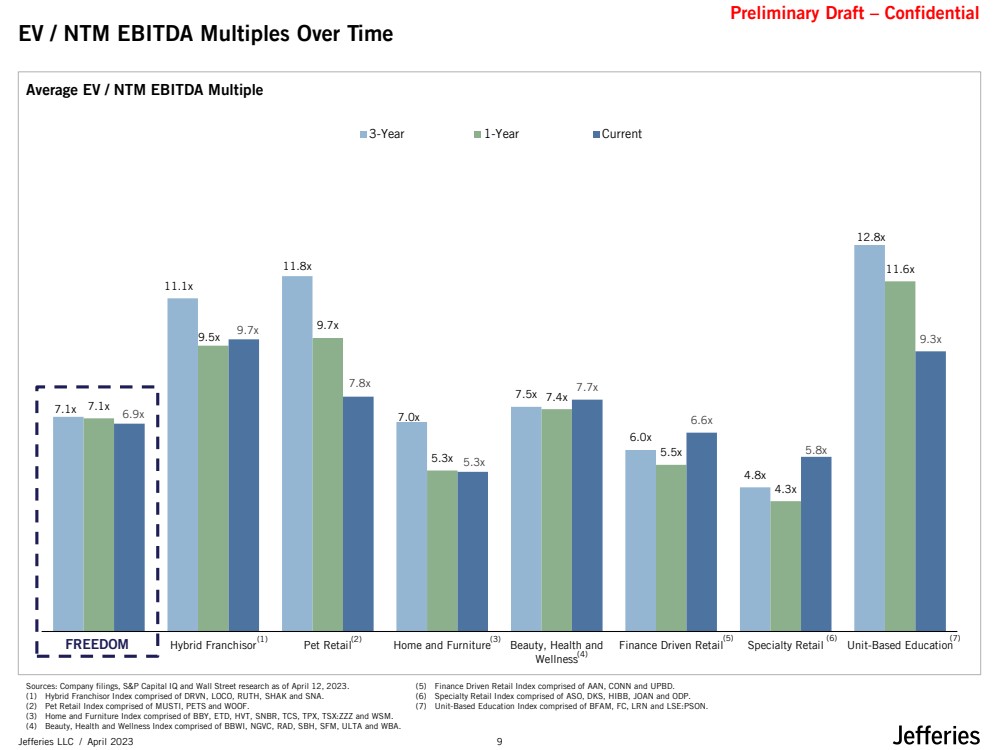
| Preliminary Draft – Confidential Jefferies LLC / April 2023 Average EV / NTM EBITDA Multiple EV / NTM EBITDA Multiples Over Time 7.1x 11.1x 11.8x 7.0x 7.5x 6.0x 4.8x 12.8x 7.1x 9.5x 9.7x 5.3x 7.4x 5.5x 4.3x 11.6x 6.9x 9.7x 7.8x 5.3x 7.7x 6.6x 5.8x 9.3x FREEDOM Hybrid Franchisor Pet Retail Home and Furniture Beauty, Health and Wellness Finance Driven Retail Specialty Retail Unit-Based Education 3-Year 1-Year Current Sources: Company filings, S&P Capital IQ and Wall Street research as of April 12, 2023. (1) Hybrid Franchisor Index comprised of DRVN, LOCO, RUTH, SHAK and SNA. (2) Pet Retail Index comprised of MUSTI, PETS and WOOF. (3) Home and Furniture Index comprised of BBY, ETD, HVT, SNBR, TCS, TPX, TSX:ZZZ and WSM. (4) Beauty, Health and Wellness Index comprised of BBWI, NGVC, RAD, SBH, SFM, ULTA and WBA. (5) Finance Driven Retail Index comprised of AAN, CONN and UPBD. (6) Specialty Retail Index comprised of ASO, DKS, HIBB, JOAN and ODP. (7) Unit-Based Education Index comprised of BFAM, FC, LRN and LSE:PSON. (1) (2) (3) (4) (5) (6) (7) FREEDOM 9 |
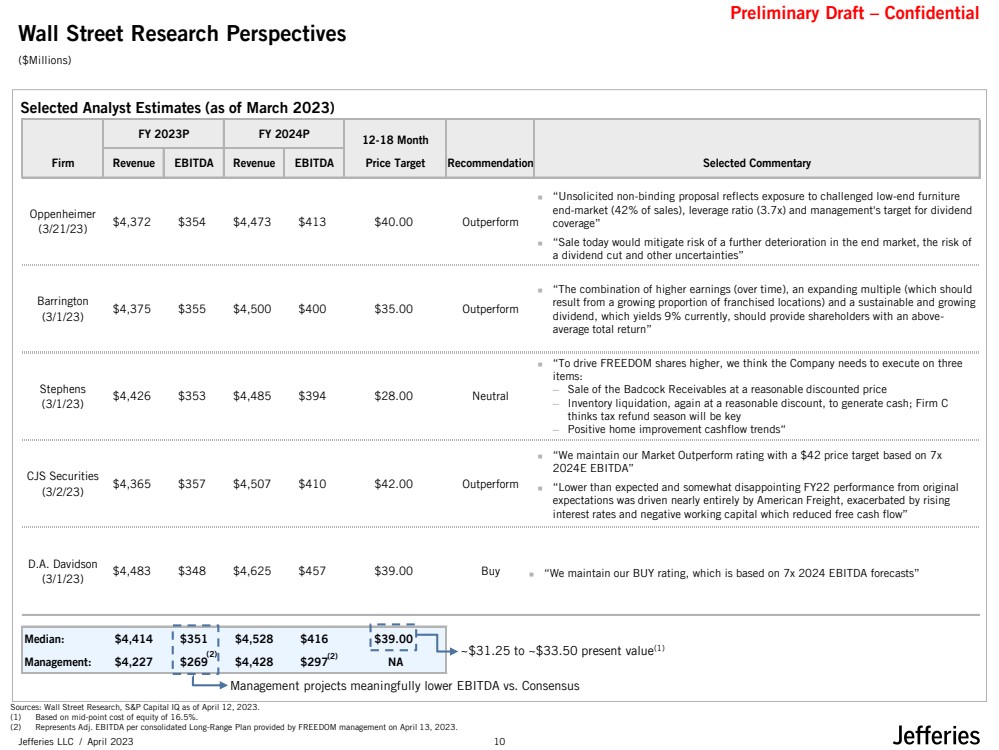
| Preliminary Draft – Confidential Jefferies LLC / April 2023 FY 2023P FY 2024P 12-18 Month Firm Revenue EBITDA Revenue EBITDA Price Target Recommendation Selected Commentary Oppenheimer (3/21/23) $4,372 $354 $4,473 $413 $40.00 Outperform Barrington (3/1/23) $4,375 $355 $4,500 $400 $35.00 Outperform Stephens (3/1/23) $4,426 $353 $4,485 $394 $28.00 Neutral CJS Securities (3/2/23) $4,365 $357 $4,507 $410 $42.00 Outperform D.A. Davidson (3/1/23) $4,483 $348 $4,625 $457 $39.00 Buy Median: $4,414 $351 $4,528 $416 $39.00 Management: $4,227 $269 $4,428 $297 NA Selected Analyst Estimates (as of March 2023) Sources: Wall Street Research, S&P Capital IQ as of April 12, 2023. (1) Based on mid-point cost of equity of 16.5%. (2) Represents Adj. EBITDA per consolidated Long-Range Plan provided by FREEDOM management on April 13, 2023. Wall Street Research Perspectives ($Millions) ~$31.25 to ~$33.50 present value(1) ◼ “Unsolicited non-binding proposal reflects exposure to challenged low-end furniture end-market (42% of sales), leverage ratio (3.7x) and management's target for dividend coverage” ◼ “Sale today would mitigate risk of a further deterioration in the end market, the risk of a dividend cut and other uncertainties” ◼ “The combination of higher earnings (over time), an expanding multiple (which should result from a growing proportion of franchised locations) and a sustainable and growing dividend, which yields 9% currently, should provide shareholders with an above-average total return” ◼ “To drive FREEDOM shares higher, we think the Company needs to execute on three items: ─ Sale of the Badcock Receivables at a reasonable discounted price ─ Inventory liquidation, again at a reasonable discount, to generate cash; Firm C thinks tax refund season will be key ─ Positive home improvement cashflow trends“ ◼ “We maintain our Market Outperform rating with a $42 price target based on 7x 2024E EBITDA” ◼ “Lower than expected and somewhat disappointing FY22 performance from original expectations was driven nearly entirely by American Freight, exacerbated by rising interest rates and negative working capital which reduced free cash flow” ◼ “We maintain our BUY rating, which is based on 7x 2024 EBITDA forecasts” Management projects meaningfully lower EBITDA vs. Consensus (2) (2) 10 |
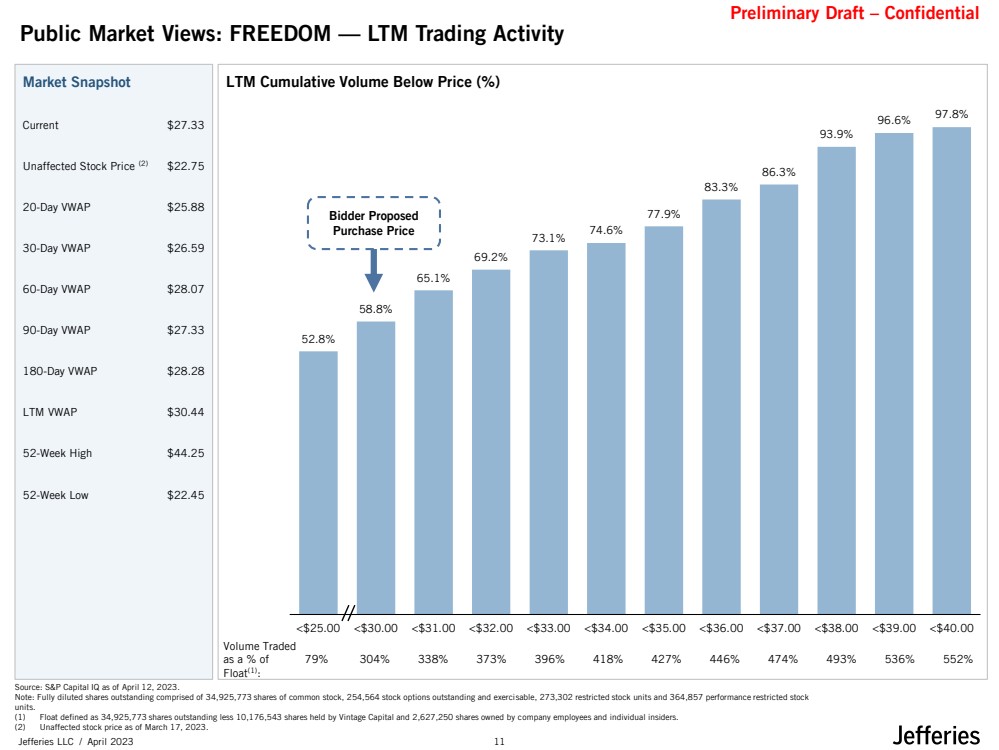
| Preliminary Draft – Confidential Jefferies LLC / April 2023 79% 304% 338% 373% 396% 418% 427% 446% 474% 493% 536% 552% LTM Cumulative Volume Below Price (%) 52.8% 58.8% 65.1% 69.2% 73.1% 74.6% 77.9% 83.3% 86.3% 93.9% 96.6% 97.8% <$25.00 <$30.00 <$31.00 <$32.00 <$33.00 <$34.00 <$35.00 <$36.00 <$37.00 <$38.00 <$39.00 <$40.00 Market Snapshot Current $27.33 Unaffected Stock Price (2) $22.75 20-Day VWAP $25.88 30-Day VWAP $26.59 60-Day VWAP $28.07 90-Day VWAP $27.33 180-Day VWAP $28.28 LTM VWAP $30.44 52-Week High $44.25 52-Week Low $22.45 Source: S&P Capital IQ as of April 12, 2023. Note: Fully diluted shares outstanding comprised of 34,925,773 shares of common stock, 254,564 stock options outstanding and exercisable, 273,302 restricted stock units and 364,857 performance restricted stock units. (1) Float defined as 34,925,773 shares outstanding less 10,176,543 shares held by Vintage Capital and 2,627,250 shares owned by company employees and individual insiders. (2) Unaffected stock price as of March 17, 2023. Public Market Views: FREEDOM — LTM Trading Activity Bidder Proposed Purchase Price Volume Traded as a % of Float(1): 11 |
| Preliminary Draft – Confidential Jefferies LLC / April 2023 Selected Dividend Considerations 12 |
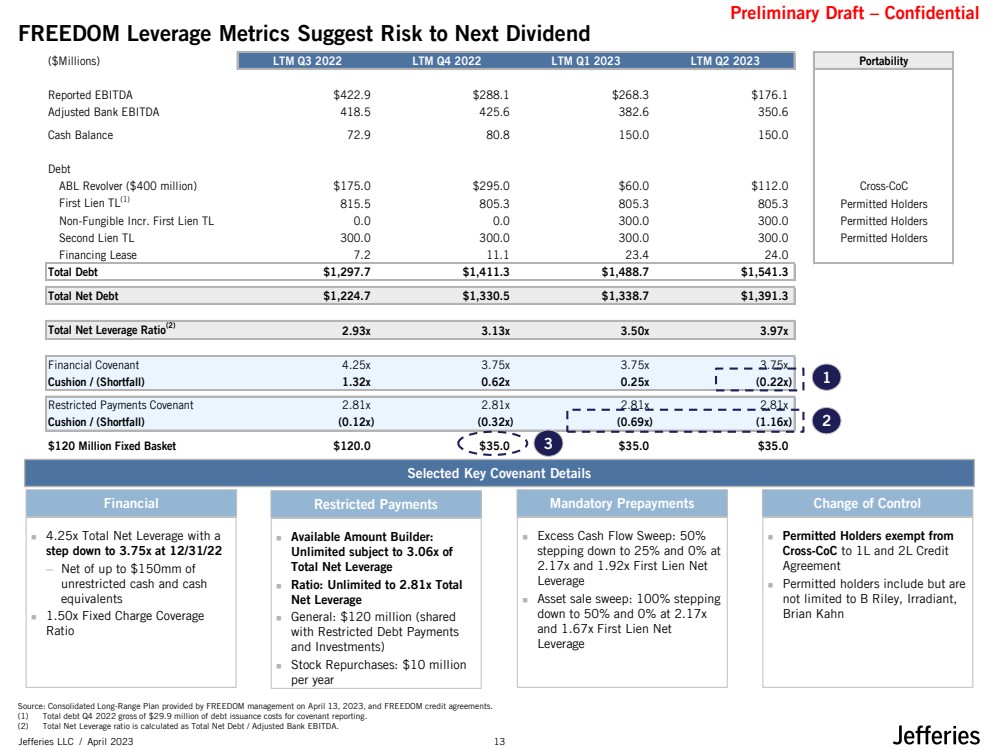
| Preliminary Draft – Confidential Jefferies LLC / April 2023 ($Millions) LTM Q3 2022 LTM Q4 2022 LTM Q1 2023 LTM Q2 2023 Portability Reported EBITDA $422.9 $288.1 $268.3 $176.1 Adjusted Bank EBITDA 418.5 425.6 382.6 350.6 Cash Balance 72.9 80.8 150.0 150.0 Debt ABL Revolver ($400 million) $175.0 $295.0 $60.0 $112.0 Cross-CoC First Lien TL(1) 815.5 805.3 805.3 805.3 Permitted Holders Non-Fungible Incr. First Lien TL 0.0 0.0 300.0 300.0 Permitted Holders Second Lien TL 300.0 300.0 300.0 300.0 Permitted Holders Financing Lease 7.2 11.1 23.4 24.0 Total Debt $1,297.7 $1,411.3 $1,488.7 $1,541.3 Total Net Debt $1,224.7 $1,330.5 $1,338.7 $1,391.3 Total Net Leverage Ratio(2) 2.93x 3.13x 3.50x 3.97x Financial Covenant 4.25x 3.75x 3.75x 3.75x Cushion / (Shortfall) 1.32x 0.62x 0.25x (0.22x) Restricted Payments Covenant 2.81x 2.81x 2.81x 2.81x Cushion / (Shortfall) (0.12x) (0.32x) (0.69x) (1.16x) $120 Million Fixed Basket $120.0 $35.0 $35.0 $35.0 FREEDOM Leverage Metrics Suggest Risk to Next Dividend Selected Key Covenant Details Source: Consolidated Long-Range Plan provided by FREEDOM management on April 13, 2023, and FREEDOM credit agreements. (1) Total debt Q4 2022 gross of $29.9 million of debt issuance costs for covenant reporting. (2) Total Net Leverage ratio is calculated as Total Net Debt / Adjusted Bank EBITDA. ◼ Available Amount Builder: Unlimited subject to 3.06x of Total Net Leverage ◼ Ratio: Unlimited to 2.81x Total Net Leverage ◼ General: $120 million (shared with Restricted Debt Payments and Investments) ◼ Stock Repurchases: $10 million per year Restricted Payments ◼ 4.25x Total Net Leverage with a step down to 3.75x at 12/31/22 ─ Net of up to $150mm of unrestricted cash and cash equivalents ◼ 1.50x Fixed Charge Coverage Ratio ◼ Permitted Holders exempt from Cross-CoC to 1L and 2L Credit Agreement ◼ Permitted holders include but are not limited to B Riley, Irradiant, Brian Kahn ◼ Excess Cash Flow Sweep: 50% stepping down to 25% and 0% at 2.17x and 1.92x First Lien Net Leverage ◼ Asset sale sweep: 100% stepping down to 50% and 0% at 2.17x and 1.67x First Lien Net Leverage Financial Mandatory Prepayments Change of Control 1 2 3 13 |
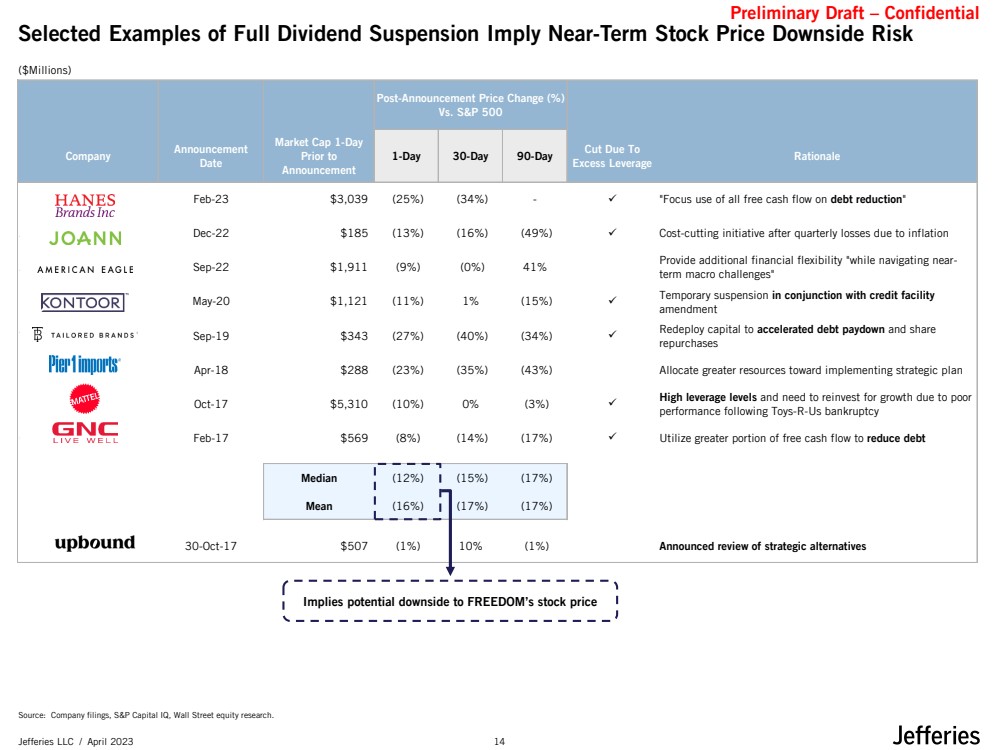
| Preliminary Draft – Confidential Jefferies LLC / April 2023 Post-Announcement Price Change (%) Vs. S&P 500 Company Announcement Date Market Cap 1-Day Prior to Announcement 1-Day 30-Day 90-Day Cut Due To Excess Leverage Rationale Hanesbrands Feb-23 $3,039 (25%) (34%) - ✓ "Focus use of all free cash flow on debt reduction" JOANN Dec-22 $185 (13%) (16%) (49%) ✓ Cost-cutting initiative after quarterly losses due to inflation American Eagle Outfitters Sep-22 $1,911 (9%) (0%) 41% Provide additional financial flexibility "while navigating near-term macro challenges" Kontoor Brands May-20 $1,121 (11%) 1% (15%) ✓ Temporary suspension in conjunction with credit facility amendment Tailored Brands Sep-19 $343 (27%) (40%) (34%) ✓ Redeploy capital to accelerated debt paydown and share repurchases Pier 1 Imports Apr-18 $288 (23%) (35%) (43%) Allocate greater resources toward implementing strategic plan Mattel Oct-17 $5,310 (10%) 0% (3%) ✓ High leverage levels and need to reinvest for growth due to poor performance following Toys-R-Us bankruptcy GNC Holdings Feb-17 $569 (8%) (14%) (17%) ✓ Utilize greater portion of free cash flow to reduce debt Median (12%) (15%) (17%) Mean (16%) (17%) (17%) Upbound Group (Rent-A-Center) 30-Oct-17 $507 (1%) 10% (1%) Announced review of strategic alternatives Selected Examples of Full Dividend Suspension Imply Near-Term Stock Price Downside Risk Source: Company filings, S&P Capital IQ, Wall Street equity research. ($Millions) Implies potential downside to FREEDOM’s stock price 14 |
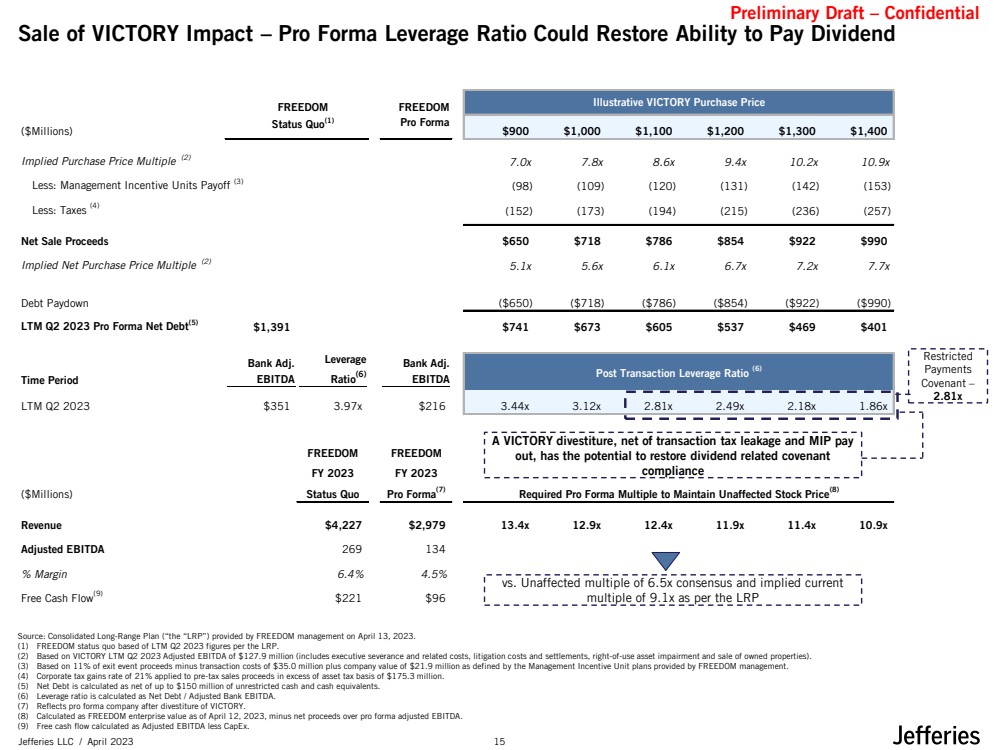
| Preliminary Draft – Confidential Jefferies LLC / April 2023 FREEDOM FREEDOM Illustrative VICTORY Purchase Price ($Millions) Status Quo(1) Pro Forma $900 $1,000 $1,100 $1,200 $1,300 $1,400 Implied Purchase Price Multiple (2) 7.0x 7.8x 8.6x 9.4x 10.2x 10.9x Less: Management Incentive Units Payoff (3) (98) (109) (120) (131) (142) (153) Less: Taxes (4) (152) (173) (194) (215) (236) (257) Net Sale Proceeds $650 $718 $786 $854 $922 $990 Implied Net Purchase Price Multiple (2) 5.1x 5.6x 6.1x 6.7x 7.2x 7.7x Debt Paydown ($650) ($718) ($786) ($854) ($922) ($990) LTM Q2 2023 Pro Forma Net Debt(5) $1,391 $741 $673 $605 $537 $469 $401 Time Period Bank Adj. EBITDA Leverage Ratio(6) Bank Adj. EBITDA Post Transaction Leverage Ratio (6) LTM Q2 2023 $351 3.97x $216 3.44x 3.12x 2.81x 2.49x 2.18x 1.86x FREEDOM FREEDOM FY 2023 FY 2023 ($Millions) Status Quo Pro Forma(7) Required Pro Forma Multiple to Maintain Unaffected Stock Price(8) Revenue $4,227 $2,979 13.4x 12.9x 12.4x 11.9x 11.4x 10.9x Adjusted EBITDA 269 134 % Margin 6.4% 4.5% Free Cash Flow(9) $221 $96 Sale of VICTORY Impact – Pro Forma Leverage Ratio Could Restore Ability to Pay Dividend Source: Consolidated Long-Range Plan (“the “LRP”) provided by FREEDOM management on April 13, 2023. (1) FREEDOM status quo based of LTM Q2 2023 figures per the LRP. (2) Based on VICTORY LTM Q2 2023 Adjusted EBITDA of $127.9 million (includes executive severance and related costs, litigation costs and settlements, right-of-use asset impairment and sale of owned properties). (3) Based on 11% of exit event proceeds minus transaction costs of $35.0 million plus company value of $21.9 million as defined by the Management Incentive Unit plans provided by FREEDOM management. (4) Corporate tax gains rate of 21% applied to pre-tax sales proceeds in excess of asset tax basis of $175.3 million. (5) Net Debt is calculated as net of up to $150 million of unrestricted cash and cash equivalents. (6) Leverage ratio is calculated as Net Debt / Adjusted Bank EBITDA. (7) Reflects pro forma company after divestiture of VICTORY. (8) Calculated as FREEDOM enterprise value as of April 12, 2023, minus net proceeds over pro forma adjusted EBITDA. (9) Free cash flow calculated as Adjusted EBITDA less CapEx. vs. Unaffected multiple of 6.5x consensus and implied current multiple of 9.1x as per the LRP A VICTORY divestiture, net of transaction tax leakage and MIP pay out, has the potential to restore dividend related covenant compliance Restricted Payments Covenant – 2.81x 15 |
| Preliminary Draft – Confidential Jefferies LLC / April 2023 Management LRP Overview 16 |
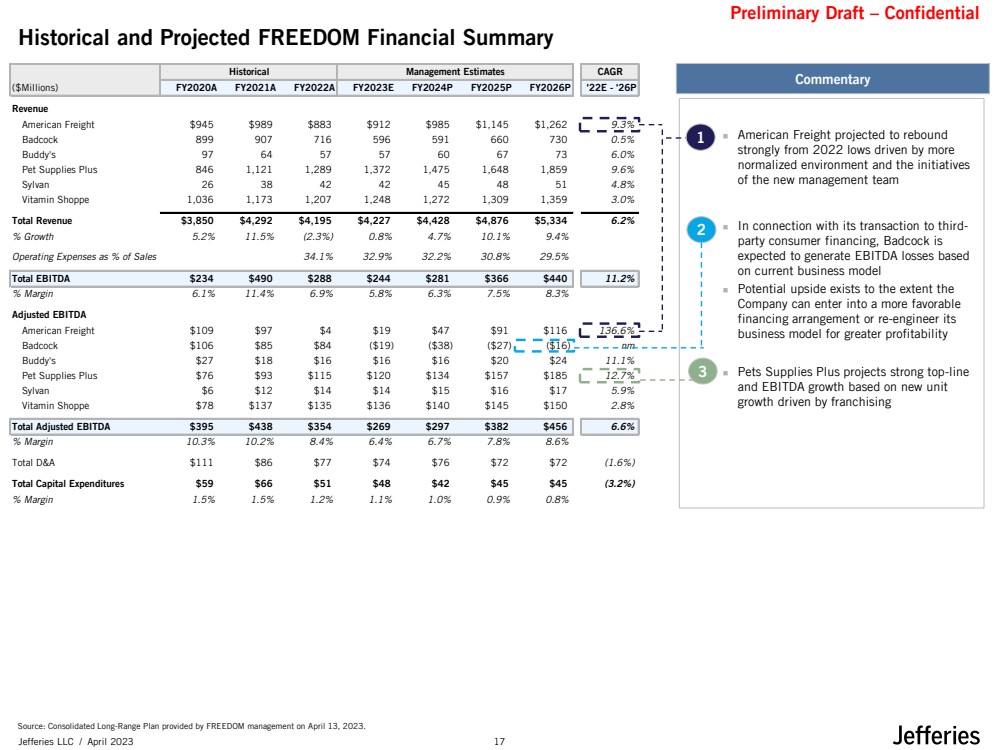
| Preliminary Draft – Confidential Jefferies LLC / April 2023 Historical Management Estimates CAGR ($Millions) FY2020A FY2021A FY2022A FY2023E FY2024P FY2025P FY2026P '22E - '26P Revenue American Freight $945 $989 $883 $912 $985 $1,145 $1,262 9.3% Badcock 899 907 716 596 591 660 730 0.5% Buddy's 97 64 57 57 60 67 73 6.0% Pet Supplies Plus 846 1,121 1,289 1,372 1,475 1,648 1,859 9.6% Sylvan 26 38 42 42 45 48 51 4.8% Vitamin Shoppe 1,036 1,173 1,207 1,248 1,272 1,309 1,359 3.0% Total Revenue $3,850 $4,292 $4,195 $4,227 $4,428 $4,876 $5,334 6.2% % Growth 5.2% 11.5% (2.3%) 0.8% 4.7% 10.1% 9.4% Operating Expenses as % of Sales 34.1% 32.9% 32.2% 30.8% 29.5% Total EBITDA $234 $490 $288 $244 $281 $366 $440 11.2% % Margin 6.1% 11.4% 6.9% 5.8% 6.3% 7.5% 8.3% Adjusted EBITDA American Freight $109 $97 $4 $19 $47 $91 $116 136.6% Badcock $106 $85 $84 ($19) ($38) ($27) ($16) nm Buddy's $27 $18 $16 $16 $16 $20 $24 11.1% Pet Supplies Plus $76 $93 $115 $120 $134 $157 $185 12.7% Sylvan $6 $12 $14 $14 $15 $16 $17 5.9% Vitamin Shoppe $78 $137 $135 $136 $140 $145 $150 2.8% Total Adjusted EBITDA $395 $438 $354 $269 $297 $382 $456 6.6% % Margin 10.3% 10.2% 8.4% 6.4% 6.7% 7.8% 8.6% Total D&A $111 $86 $77 $74 $76 $72 $72 (1.6%) Total Capital Expenditures $59 $66 $51 $48 $42 $45 $45 (3.2%) % Margin 1.5% 1.5% 1.2% 1.1% 1.0% 0.9% 0.8% Historical and Projected FREEDOM Financial Summary Source: Consolidated Long-Range Plan provided by FREEDOM management on April 13, 2023. Commentary 1 3 2 ◼ American Freight projected to rebound strongly from 2022 lows driven by more normalized environment and the initiatives of the new management team ◼ In connection with its transaction to third-party consumer financing, Badcock is expected to generate EBITDA losses based on current business model ◼ Potential upside exists to the extent the Company can enter into a more favorable financing arrangement or re-engineer its business model for greater profitability ◼ Pets Supplies Plus projects strong top-line and EBITDA growth based on new unit growth driven by franchising 17 |
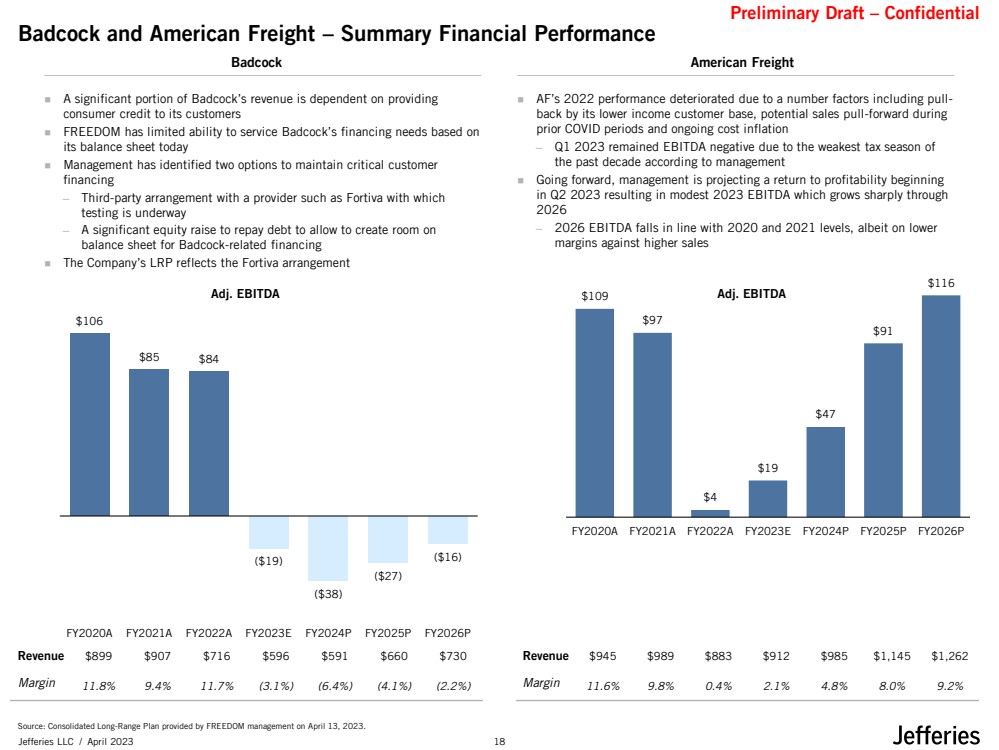
| Preliminary Draft – Confidential Jefferies LLC / April 2023 Badcock and American Freight – Summary Financial Performance $899 $907 $716 $596 $591 $660 $730 11.8% 9.4% 11.7% (3.1%) (6.4%) (4.1%) (2.2%) Source: Consolidated Long-Range Plan provided by FREEDOM management on April 13, 2023. Revenue Badcock American Freight $945 $989 $883 $912 $985 $1,145 $1,262 11.6% 9.8% 0.4% 2.1% 4.8% 8.0% 9.2% Revenue ◼ A significant portion of Badcock’s revenue is dependent on providing consumer credit to its customers ◼ FREEDOM has limited ability to service Badcock’s financing needs based on its balance sheet today ◼ Management has identified two options to maintain critical customer financing ─ Third-party arrangement with a provider such as Fortiva with which testing is underway ─ A significant equity raise to repay debt to allow to create room on balance sheet for Badcock-related financing ◼ The Company’s LRP reflects the Fortiva arrangement ◼ AF’s 2022 performance deteriorated due to a number factors including pull-back by its lower income customer base, potential sales pull-forward during prior COVID periods and ongoing cost inflation ─ Q1 2023 remained EBITDA negative due to the weakest tax season of the past decade according to management ◼ Going forward, management is projecting a return to profitability beginning in Q2 2023 resulting in modest 2023 EBITDA which grows sharply through 2026 ─ 2026 EBITDA falls in line with 2020 and 2021 levels, albeit on lower margins against higher sales Margin Margin Adj. EBITDA Adj. EBITDA $106 $85 $84 ($19) ($38) ($27) ($16) FY2020A FY2021A FY2022A FY2023E FY2024P FY2025P FY2026P $109 $97 $4 $19 $47 $91 $116 FY2020A FY2021A FY2022A FY2023E FY2024P FY2025P FY2026P 18 |
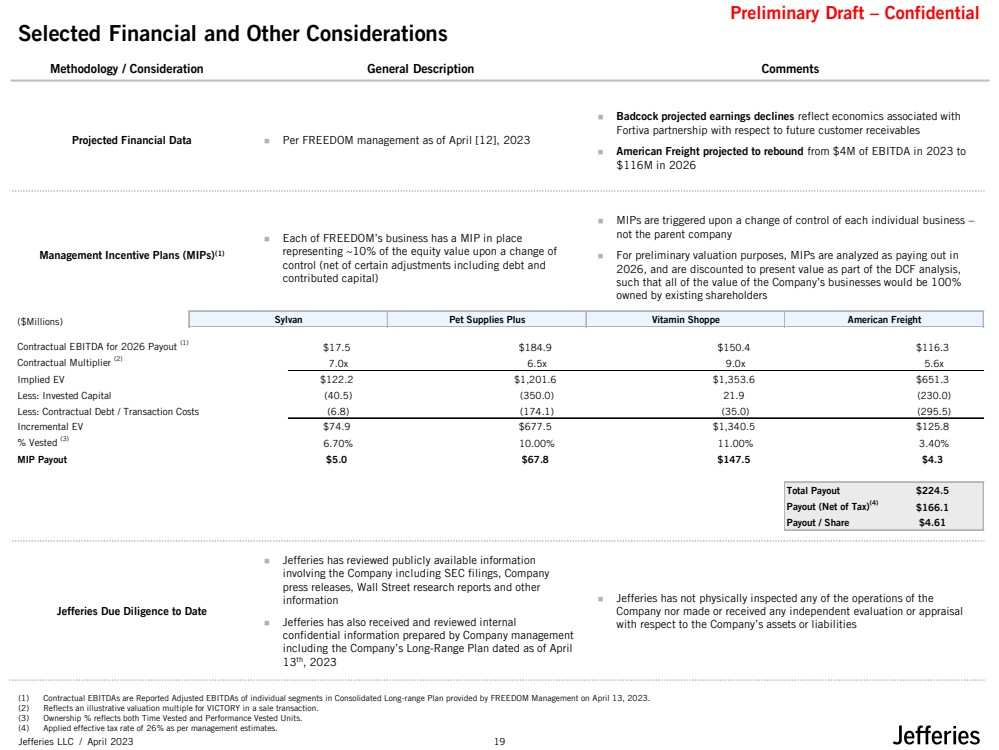
| Preliminary Draft – Confidential Jefferies LLC / April 2023 Projected Financial Data ◼ Per FREEDOM management as of April [12], 2023 ◼ Badcock projected earnings declines reflect economics associated with Fortiva partnership with respect to future customer receivables ◼ American Freight projected to rebound from $4M of EBITDA in 2023 to $116M in 2026 Management Incentive Plans (MIPs)(1) ◼ Each of FREEDOM’s business has a MIP in place representing ~10% of the equity value upon a change of control (net of certain adjustments including debt and contributed capital) ◼ MIPs are triggered upon a change of control of each individual business – not the parent company ◼ For preliminary valuation purposes, MIPs are analyzed as paying out in 2026, and are discounted to present value as part of the DCF analysis, such that all of the value of the Company’s businesses would be 100% owned by existing shareholders Jefferies Due Diligence to Date ◼ Jefferies has reviewed publicly available information involving the Company including SEC filings, Company press releases, Wall Street research reports and other information ◼ Jefferies has also received and reviewed internal confidential information prepared by Company management including the Company’s Long-Range Plan dated as of April 13th, 2023 ◼ Jefferies has not physically inspected any of the operations of the Company nor made or received any independent evaluation or appraisal with respect to the Company’s assets or liabilities Methodology / Consideration General Description Comments Selected Financial and Other Considerations (1) Contractual EBITDAs are Reported Adjusted EBITDAs of individual segments in Consolidated Long-range Plan provided by FREEDOM Management on April 13, 2023. (2) Reflects an illustrative valuation multiple for VICTORY in a sale transaction. (3) Ownership % reflects both Time Vested and Performance Vested Units. (4) Applied effective tax rate of 26% as per management estimates. ($Millions) Sylvan Pet Supplies Plus Vitamin Shoppe American Freight Contractual EBITDA for 2026 Payout (1) $17.5 $184.9 $150.4 $116.3 Contractual Multiplier (2) 7.0x 6.5x 9.0x 5.6x Implied EV $122.2 $1,201.6 $1,353.6 $651.3 Less: Invested Capital (40.5) (350.0) 21.9 (230.0) Less: Contractual Debt / Transaction Costs (6.8) (174.1) (35.0) (295.5) Incremental EV $74.9 $677.5 $1,340.5 $125.8 % Vested (3) 6.70% 10.00% 11.00% 3.40% MIP Payout $5.0 $67.8 $147.5 $4.3 Total Payout $224.5 Payout (Net of Tax)(4) $166.1 Payout / Share $4.61 19 |
| Preliminary Draft – Confidential Jefferies LLC / April 2023 Part 2 20 |
| Preliminary Draft – Confidential Jefferies LLC / April 2023 Preliminary FREEDOM Valuation Considerations 21 |
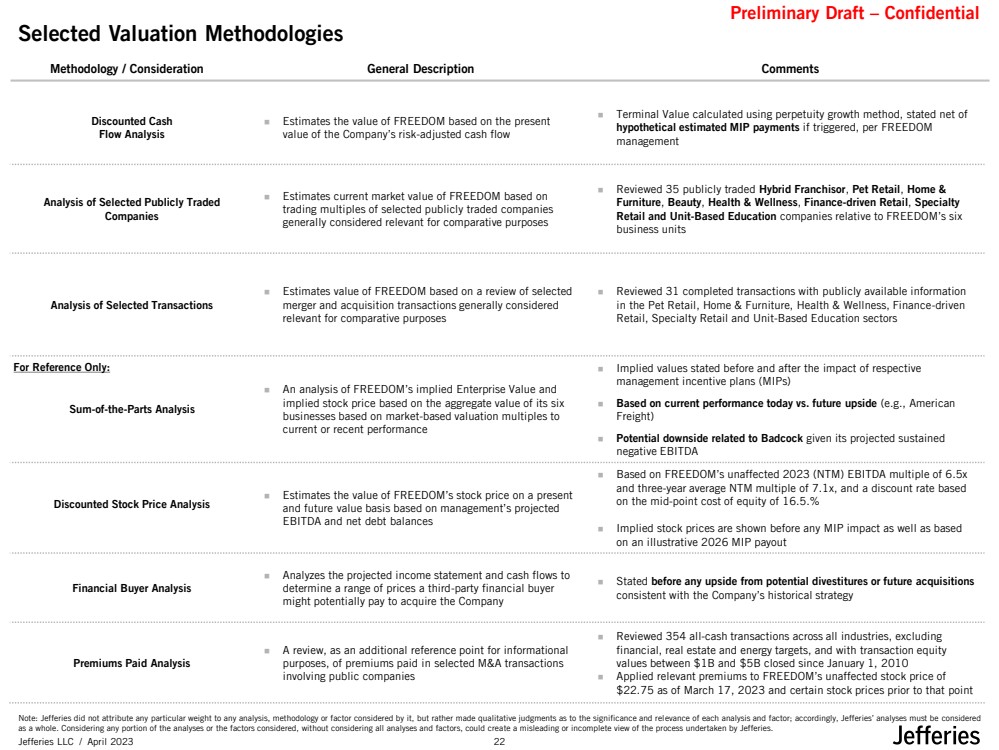
| Preliminary Draft – Confidential Jefferies LLC / April 2023 Discounted Cash Flow Analysis ◼ Estimates the value of FREEDOM based on the present value of the Company’s risk-adjusted cash flow ◼ Terminal Value calculated using perpetuity growth method, stated net of hypothetical estimated MIP payments if triggered, per FREEDOM management Analysis of Selected Publicly Traded Companies ◼ Estimates current market value of FREEDOM based on trading multiples of selected publicly traded companies generally considered relevant for comparative purposes ◼ Reviewed 35 publicly traded Hybrid Franchisor, Pet Retail, Home & Furniture, Beauty, Health & Wellness, Finance-driven Retail, Specialty Retail and Unit-Based Education companies relative to FREEDOM’s six business units Analysis of Selected Transactions ◼ Estimates value of FREEDOM based on a review of selected merger and acquisition transactions generally considered relevant for comparative purposes ◼ Reviewed 31 completed transactions with publicly available information in the Pet Retail, Home & Furniture, Health & Wellness, Finance-driven Retail, Specialty Retail and Unit-Based Education sectors Sum-of-the-Parts Analysis ◼ An analysis of FREEDOM’s implied Enterprise Value and implied stock price based on the aggregate value of its six businesses based on market-based valuation multiples to current or recent performance ◼ Implied values stated before and after the impact of respective management incentive plans (MIPs) ◼ Based on current performance today vs. future upside (e.g., American Freight) ◼ Potential downside related to Badcock given its projected sustained negative EBITDA Discounted Stock Price Analysis ◼ Estimates the value of FREEDOM’s stock price on a present and future value basis based on management’s projected EBITDA and net debt balances ◼ Based on FREEDOM’s unaffected 2023 (NTM) EBITDA multiple of 6.5x and three-year average NTM multiple of 7.1x, and a discount rate based on the mid-point cost of equity of 16.5.% ◼ Implied stock prices are shown before any MIP impact as well as based on an illustrative 2026 MIP payout Financial Buyer Analysis ◼ Analyzes the projected income statement and cash flows to determine a range of prices a third-party financial buyer might potentially pay to acquire the Company ◼ Stated before any upside from potential divestitures or future acquisitions consistent with the Company’s historical strategy Premiums Paid Analysis ◼ A review, as an additional reference point for informational purposes, of premiums paid in selected M&A transactions involving public companies ◼ Reviewed 354 all-cash transactions across all industries, excluding financial, real estate and energy targets, and with transaction equity values between $1B and $5B closed since January 1, 2010 ◼ Applied relevant premiums to FREEDOM’s unaffected stock price of $22.75 as of March 17, 2023 and certain stock prices prior to that point Methodology / Consideration General Description Comments Selected Valuation Methodologies Note: Jefferies did not attribute any particular weight to any analysis, methodology or factor considered by it, but rather made qualitative judgments as to the significance and relevance of each analysis and factor; accordingly, Jefferies’ analyses must be considered as a whole. Considering any portion of the analyses or the factors considered, without considering all analyses and factors, could create a misleading or incomplete view of the process undertaken by Jefferies. For Reference Only: 22 |
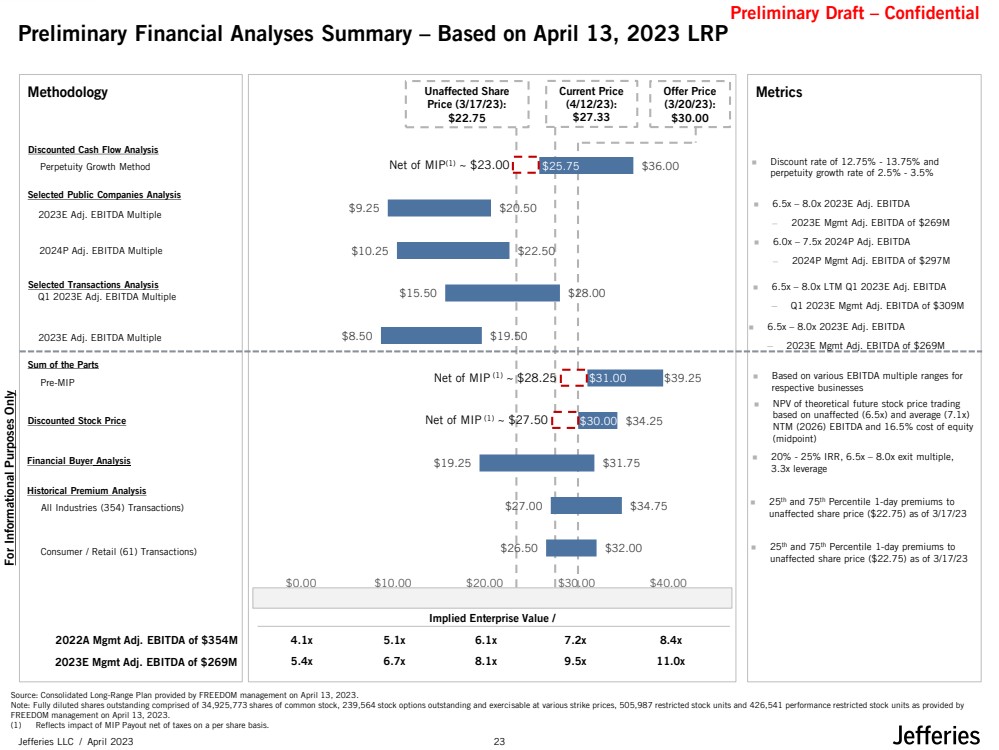
| Preliminary Draft – Confidential Jefferies LLC / April 2023 $26.50 $27.00 $19.25 $30.00 $31.00 $8.50 $15.50 $10.25 $9.25 $25.75 $32.00 $34.75 $31.75 $34.25 $39.25 $19.50 $28.00 $22.50 $20.50 $36.00 $0.00 $10.00 $20.00 $30.00 $40.00 Net of MIP(1) ~ $23.00 Current Price (4/12/23): $27.33 Methodology Metrics Preliminary Financial Analyses Summary – Based on April 13, 2023 LRP Implied Enterprise Value / For Informational Purposes Only All Industries (354) Transactions) Historical Premium Analysis Consumer / Retail (61) Transactions) 2022A Mgmt Adj. EBITDA of $354M Financial Buyer Analysis 2023E Mgmt Adj. EBITDA of $269M Source: Consolidated Long-Range Plan provided by FREEDOM management on April 13, 2023. Note: Fully diluted shares outstanding comprised of 34,925,773 shares of common stock, 239,564 stock options outstanding and exercisable at various strike prices, 505,987 restricted stock units and 426,541 performance restricted stock units as provided by FREEDOM management on April 13, 2023. (1) Reflects impact of MIP Payout net of taxes on a per share basis. Unaffected Share Price (3/17/23): $22.75 Sum of the Parts Pre-MIP Discounted Cash Flow Analysis Perpetuity Growth Method Selected Public Companies Analysis 2023E Adj. EBITDA Multiple Selected Transactions Analysis 2023E Adj. EBITDA Multiple ◼ Discount rate of 12.75% - 13.75% and perpetuity growth rate of 2.5% - 3.5% ◼ 6.5x – 8.0x 2023E Adj. EBITDA ─ 2023E Mgmt Adj. EBITDA of $269M ◼ 6.5x – 8.0x 2023E Adj. EBITDA ─ 2023E Mgmt Adj. EBITDA of $269M ◼ 25th and 75th Percentile 1-day premiums to unaffected share price ($22.75) as of 3/17/23 ◼ 25th and 75th Percentile 1-day premiums to unaffected share price ($22.75) as of 3/17/23 ◼ 20% - 25% IRR, 6.5x – 8.0x exit multiple, 3.3x leverage ◼ Based on various EBITDA multiple ranges for respective businesses Discounted Stock Price ◼ NPV of theoretical future stock price trading based on unaffected (6.5x) and average (7.1x) NTM (2026) EBITDA and 16.5% cost of equity (midpoint) Q1 2023E Adj. EBITDA Multiple ◼ 6.5x – 8.0x LTM Q1 2023E Adj. EBITDA ─ Q1 2023E Mgmt Adj. EBITDA of $309M Offer Price (3/20/23): $30.00 2024P Adj. EBITDA Multiple ◼ 6.0x – 7.5x 2024P Adj. EBITDA ─ 2024P Mgmt Adj. EBITDA of $297M 4.1x 5.1x 6.1x 7.2x 8.4x 5.4x 6.7x 8.1x 9.5x 11.0x Net of MIP (1) ~ $28.25 Net of MIP (1) ~ $27.50 23 |
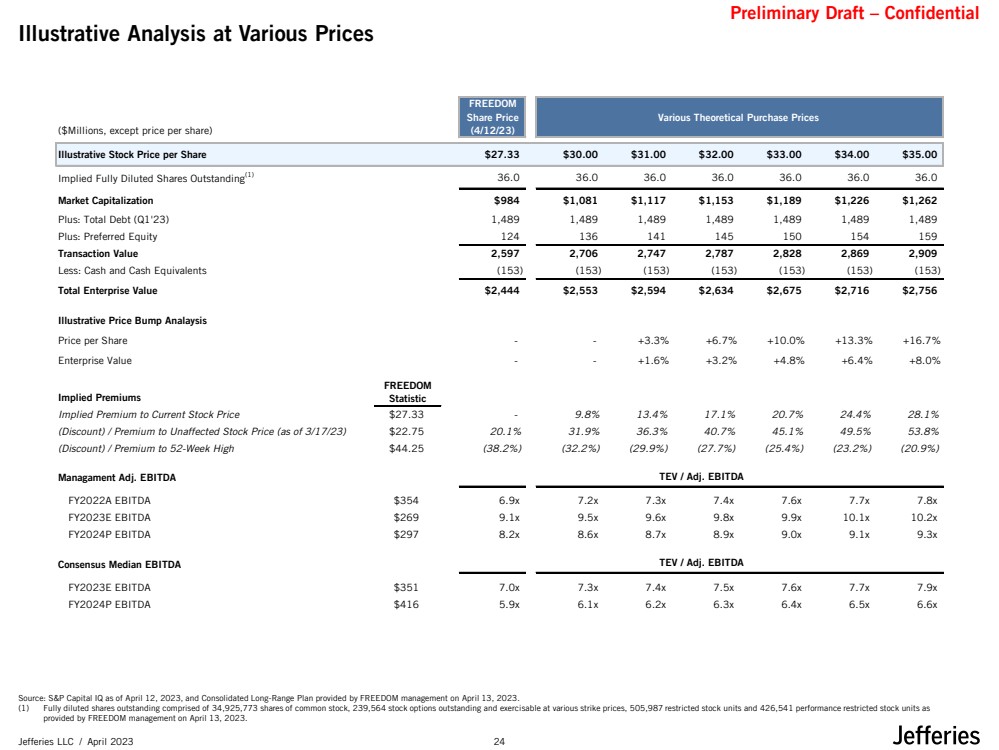
| Preliminary Draft – Confidential Jefferies LLC / April 2023 Illustrative Analysis at Various Prices Source: S&P Capital IQ as of April 12, 2023, and Consolidated Long-Range Plan provided by FREEDOM management on April 13, 2023. (1) Fully diluted shares outstanding comprised of 34,925,773 shares of common stock, 239,564 stock options outstanding and exercisable at various strike prices, 505,987 restricted stock units and 426,541 performance restricted stock units as provided by FREEDOM management on April 13, 2023. FREEDOM Share Price Various Theoretical Purchase Prices ($Millions, except price per share) (4/12/23) Illustrative Stock Price per Share $27.33 $30.00 $31.00 $32.00 $33.00 $34.00 $35.00 Implied Fully Diluted Shares Outstanding(1) 36.0 36.0 36.0 36.0 36.0 36.0 36.0 Market Capitalization $984 $1,081 $1,117 $1,153 $1,189 $1,226 $1,262 Plus: Total Debt (Q1'23) 1,489 1,489 1,489 1,489 1,489 1,489 1,489 Plus: Preferred Equity 124 136 141 145 150 154 159 Transaction Value 2,597 2,706 2,747 2,787 2,828 2,869 2,909 Less: Cash and Cash Equivalents (153) (153) (153) (153) (153) (153) (153) Total Enterprise Value $2,444 $2,553 $2,594 $2,634 $2,675 $2,716 $2,756 Illustrative Price Bump Analaysis Price per Share - - +3.3% +6.7% +10.0% +13.3% +16.7% Enterprise Value - - +1.6% +3.2% +4.8% +6.4% +8.0% Implied Premiums FREEDOM Statistic Implied Premium to Current Stock Price $27.33 - 9.8% 13.4% 17.1% 20.7% 24.4% 28.1% (Discount) / Premium to Unaffected Stock Price (as of 3/17/23) $22.75 20.1% 31.9% 36.3% 40.7% 45.1% 49.5% 53.8% (Discount) / Premium to 52-Week High $44.25 (38.2%) (32.2%) (29.9%) (27.7%) (25.4%) (23.2%) (20.9%) Managament Adj. EBITDA TEV / Adj. EBITDA FY2022A EBITDA $354 6.9x 7.2x 7.3x 7.4x 7.6x 7.7x 7.8x FY2023E EBITDA $269 9.1x 9.5x 9.6x 9.8x 9.9x 10.1x 10.2x FY2024P EBITDA $297 8.2x 8.6x 8.7x 8.9x 9.0x 9.1x 9.3x Consensus Median EBITDA TEV / Adj. EBITDA FY2023E EBITDA $351 7.0x 7.3x 7.4x 7.5x 7.6x 7.7x 7.9x FY2024P EBITDA $416 5.9x 6.1x 6.2x 6.3x 6.4x 6.5x 6.6x 24 |
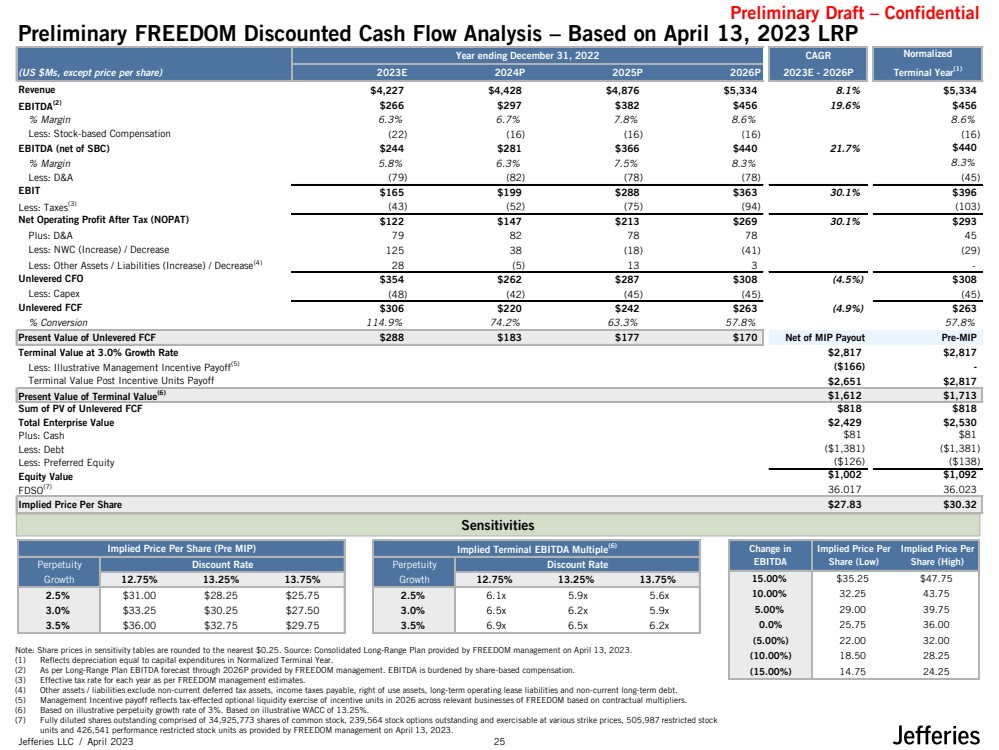
| Preliminary Draft – Confidential Jefferies LLC / April 2023 Sensitivities Preliminary FREEDOM Discounted Cash Flow Analysis – Based on April 13, 2023 LRP Note: Share prices in sensitivity tables are rounded to the nearest $0.25. Source: Consolidated Long-Range Plan provided by FREEDOM management on April 13, 2023. (1) Reflects depreciation equal to capital expenditures in Normalized Terminal Year. (2) As per Long-Range Plan EBITDA forecast through 2026P provided by FREEDOM management. EBITDA is burdened by share-based compensation. (3) Effective tax rate for each year as per FREEDOM management estimates. (4) Other assets / liabilities exclude non-current deferred tax assets, income taxes payable, right of use assets, long-term operating lease liabilities and non-current long-term debt. (5) Management Incentive payoff reflects tax-effected optional liquidity exercise of incentive units in 2026 across relevant businesses of FREEDOM based on contractual multipliers. (6) Based on illustrative perpetuity growth rate of 3%. Based on illustrative WACC of 13.25%. (7) Fully diluted shares outstanding comprised of 34,925,773 shares of common stock, 239,564 stock options outstanding and exercisable at various strike prices, 505,987 restricted stock units and 426,541 performance restricted stock units as provided by FREEDOM management on April 13, 2023. Year ending December 31, 2022 CAGR Normalized (US $Ms, except price per share) 2023E 2024P 2025P 2026P 2023E - 2026P Terminal Year(1) Revenue $4,227 $4,428 $4,876 $5,334 8.1% $5,334 EBITDA(2) $266 $297 $382 $456 19.6% $456 % Margin 6.3% 6.7% 7.8% 8.6% 8.6% Less: Stock-based Compensation (22) (16) (16) (16) (16) EBITDA (net of SBC) $244 $281 $366 $440 21.7% $440 % Margin 5.8% 6.3% 7.5% 8.3% 8.3% Less: D&A (79) (82) (78) (78) (45) EBIT $165 $199 $288 $363 30.1% $396 Less: Taxes(3) (43) (52) (75) (94) (103) Net Operating Profit After Tax (NOPAT) $122 $147 $213 $269 30.1% $293 Plus: D&A 79 82 78 78 45 Less: NWC (Increase) / Decrease 125 38 (18) (41) (29) Less: Other Assets / Liabilities (Increase) / Decrease(4) 28 (5) 13 3 - Unlevered CFO $354 $262 $287 $308 (4.5%) $308 Less: Capex (48) (42) (45) (45) (45) Unlevered FCF $306 $220 $242 $263 (4.9%) $263 % Conversion 114.9% 74.2% 63.3% 57.8% 57.8% Present Value of Unlevered FCF $288 $183 $177 $170 Net of MIP Payout Pre-MIP Terminal Value at 3.0% Growth Rate $2,817 $2,817 Less: Illustrative Management Incentive Payoff(5) ($166) - Terminal Value Post Incentive Units Payoff $2,651 $2,817 Present Value of Terminal Value(6) $1,612 $1,713 Sum of PV of Unlevered FCF $818 $818 Total Enterprise Value $2,429 $2,530 Plus: Cash $81 $81 Less: Debt ($1,381) ($1,381) Less: Preferred Equity ($126) ($138) Equity Value $1,002 $1,092 FDSO(7) 36.017 36.023 Implied Price Per Share $27.83 $30.32 15.00% $35.25 $47.75 10.00% 32.25 43.75 5.00% 29.00 39.75 0.0% 25.75 36.00 (5.00%) 22.00 32.00 (10.00%) 18.50 28.25 (15.00%) 14.75 24.25 Change in EBITDA Implied Price Per Share (Low) Implied Price Per Share (High) Implied Price Per Share (Pre MIP) Perpetuity Discount Rate Growth 12.75% 13.25% 13.75% 2.5% $31.00 $28.25 $25.75 3.0% $33.25 $30.25 $27.50 3.5% $36.00 $32.75 $29.75 Implied Terminal EBITDA Multiple(6) Perpetuity Discount Rate Growth 12.75% 13.25% 13.75% 2.5% 6.1x 5.9x 5.6x 3.0% 6.5x 6.2x 5.9x 3.5% 6.9x 6.5x 6.2x 25 |
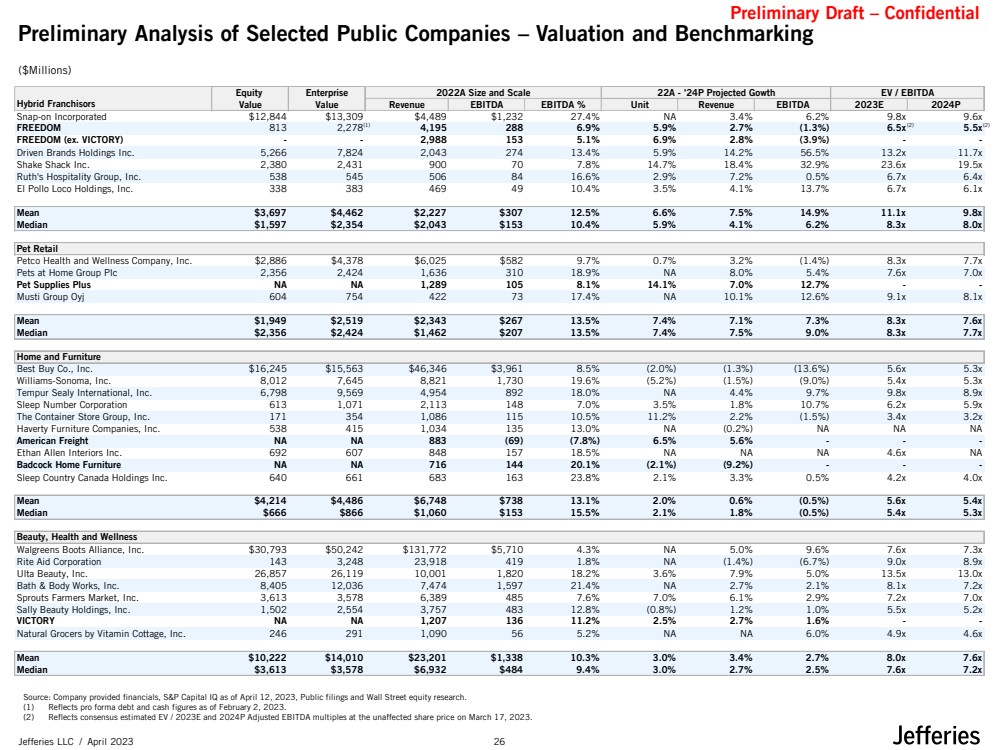
| Preliminary Draft – Confidential Jefferies LLC / April 2023 Equity Enterprise 2022A Size and Scale 22A - '24P Projected Gowth EV / EBITDA Hybrid Franchisors Value Value Revenue EBITDA EBITDA % Unit Revenue EBITDA 2023E 2024P Snap-on Incorporated $12,844 $13,309 $4,489 $1,232 27.4% NA 3.4% 6.2% 9.8x 9.6x FREEDOM 813 2,278 4,195 288 6.9% 5.9% 2.7% (1.3%) 6.5x 5.5x FREEDOM (ex. VICTORY) - - 2,988 153 5.1% 6.9% 2.8% (3.9%) - - Driven Brands Holdings Inc. 5,266 7,824 2,043 274 13.4% 5.9% 14.2% 56.5% 13.2x 11.7x Shake Shack Inc. 2,380 2,431 900 70 7.8% 14.7% 18.4% 32.9% 23.6x 19.5x Ruth's Hospitality Group, Inc. 538 545 506 84 16.6% 2.9% 7.2% 0.5% 6.7x 6.4x El Pollo Loco Holdings, Inc. 338 383 469 49 10.4% 3.5% 4.1% 13.7% 6.7x 6.1x Mean $3,697 $4,462 $2,227 $307 12.5% 6.6% 7.5% 14.9% 11.1x 9.8x Median $1,597 $2,354 $2,043 $153 10.4% 5.9% 4.1% 6.2% 8.3x 8.0x Pet Retail Petco Health and Wellness Company, Inc. $2,886 $4,378 $6,025 $582 9.7% 0.7% 3.2% (1.4%) 8.3x 7.7x Pets at Home Group Plc 2,356 2,424 1,636 310 18.9% NA 8.0% 5.4% 7.6x 7.0x Pet Supplies Plus NA NA 1,289 105 8.1% 14.1% 7.0% 12.7% - - Musti Group Oyj 604 754 422 73 17.4% NA 10.1% 12.6% 9.1x 8.1x Mean $1,949 $2,519 $2,343 $267 13.5% 7.4% 7.1% 7.3% 8.3x 7.6x Median $2,356 $2,424 $1,462 $207 13.5% 7.4% 7.5% 9.0% 8.3x 7.7x Home and Furniture Best Buy Co., Inc. $16,245 $15,563 $46,346 $3,961 8.5% (2.0%) (1.3%) (13.6%) 5.6x 5.3x Williams-Sonoma, Inc. 8,012 7,645 8,821 1,730 19.6% (5.2%) (1.5%) (9.0%) 5.4x 5.3x Tempur Sealy International, Inc. 6,798 9,569 4,954 892 18.0% NA 4.4% 9.7% 9.8x 8.9x Sleep Number Corporation 613 1,071 2,113 148 7.0% 3.5% 1.8% 10.7% 6.2x 5.9x The Container Store Group, Inc. 171 354 1,086 115 10.5% 11.2% 2.2% (1.5%) 3.4x 3.2x Haverty Furniture Companies, Inc. 538 415 1,034 135 13.0% NA (0.2%) NA NA NA American Freight NA NA 883 (69) (7.8%) 6.5% 5.6% - - - Ethan Allen Interiors Inc. 692 607 848 157 18.5% NA NA NA 4.6x NA Badcock Home Furniture NA NA 716 144 20.1% (2.1%) (9.2%) - - - Sleep Country Canada Holdings Inc. 640 661 683 163 23.8% 2.1% 3.3% 0.5% 4.2x 4.0x Mean $4,214 $4,486 $6,748 $738 13.1% 2.0% 0.6% (0.5%) 5.6x 5.4x Median $666 $866 $1,060 $153 15.5% 2.1% 1.8% (0.5%) 5.4x 5.3x Beauty, Health and Wellness Walgreens Boots Alliance, Inc. $30,793 $50,242 $131,772 $5,710 4.3% NA 5.0% 9.6% 7.6x 7.3x Rite Aid Corporation 143 3,248 23,918 419 1.8% NA (1.4%) (6.7%) 9.0x 8.9x Ulta Beauty, Inc. 26,857 26,119 10,001 1,820 18.2% 3.6% 7.9% 5.0% 13.5x 13.0x Bath & Body Works, Inc. 8,405 12,036 7,474 1,597 21.4% NA 2.7% 2.1% 8.1x 7.2x Sprouts Farmers Market, Inc. 3,613 3,578 6,389 485 7.6% 7.0% 6.1% 2.9% 7.2x 7.0x Sally Beauty Holdings, Inc. 1,502 2,554 3,757 483 12.8% (0.8%) 1.2% 1.0% 5.5x 5.2x VICTORY NA NA 1,207 136 11.2% 2.5% 2.7% 1.6% - - Natural Grocers by Vitamin Cottage, Inc. 246 291 1,090 56 5.2% NA NA 6.0% 4.9x 4.6x Mean $10,222 $14,010 $23,201 $1,338 10.3% 3.0% 3.4% 2.7% 8.0x 7.6x Median $3,613 $3,578 $6,932 $484 9.4% 3.0% 2.7% 2.5% 7.6x 7.2x Preliminary Analysis of Selected Public Companies – Valuation and Benchmarking Source: Company provided financials, S&P Capital IQ as of April 12, 2023, Public filings and Wall Street equity research. (1) Reflects pro forma debt and cash figures as of February 2, 2023. (2) Reflects consensus estimated EV / 2023E and 2024P Adjusted EBITDA multiples at the unaffected share price on March 17, 2023. ($Millions) (1) (2) (2) 26 |
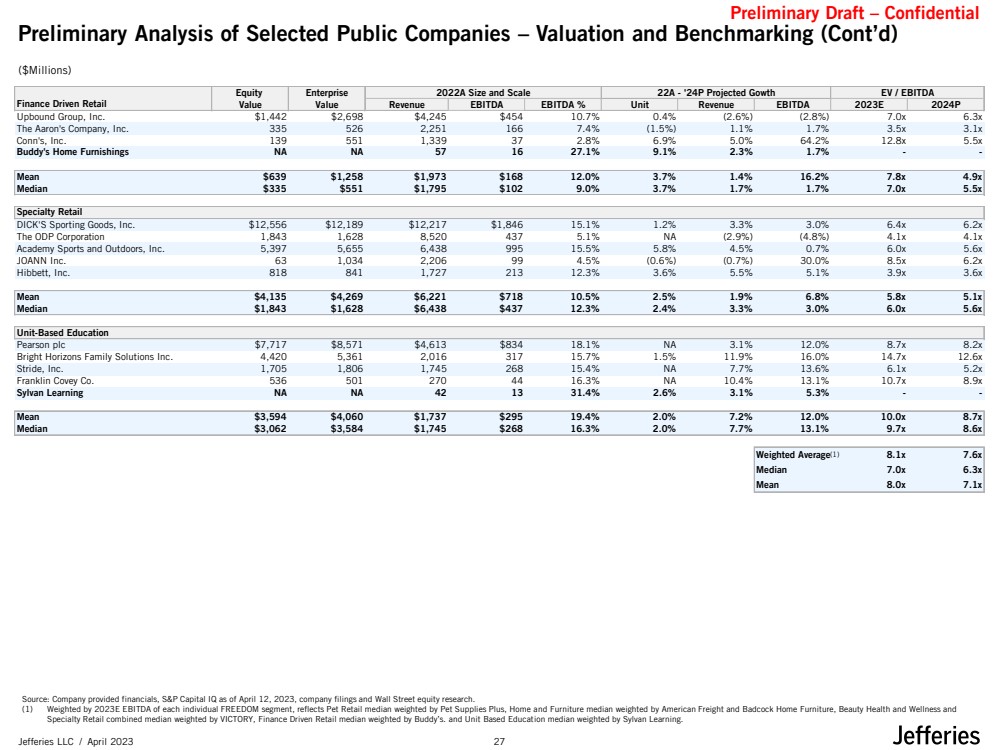
| Preliminary Draft – Confidential Jefferies LLC / April 2023 Equity Enterprise 2022A Size and Scale 22A - '24P Projected Gowth EV / EBITDA Finance Driven Retail Value Value Revenue EBITDA EBITDA % Unit Revenue EBITDA 2023E 2024P Upbound Group, Inc. $1,442 $2,698 $4,245 $454 10.7% 0.4% (2.6%) (2.8%) 7.0x 6.3x The Aaron's Company, Inc. 335 526 2,251 166 7.4% (1.5%) 1.1% 1.7% 3.5x 3.1x Conn's, Inc. 139 551 1,339 37 2.8% 6.9% 5.0% 64.2% 12.8x 5.5x Buddy's Home Furnishings NA NA 57 16 27.1% 9.1% 2.3% 1.7% - - Mean $639 $1,258 $1,973 $168 12.0% 3.7% 1.4% 16.2% 7.8x 4.9x Median $335 $551 $1,795 $102 9.0% 3.7% 1.7% 1.7% 7.0x 5.5x Specialty Retail DICK'S Sporting Goods, Inc. $12,556 $12,189 $12,217 $1,846 15.1% 1.2% 3.3% 3.0% 6.4x 6.2x The ODP Corporation 1,843 1,628 8,520 437 5.1% NA (2.9%) (4.8%) 4.1x 4.1x Academy Sports and Outdoors, Inc. 5,397 5,655 6,438 995 15.5% 5.8% 4.5% 0.7% 6.0x 5.6x JOANN Inc. 63 1,034 2,206 99 4.5% (0.6%) (0.7%) 30.0% 8.5x 6.2x Hibbett, Inc. 818 841 1,727 213 12.3% 3.6% 5.5% 5.1% 3.9x 3.6x Mean $4,135 $4,269 $6,221 $718 10.5% 2.5% 1.9% 6.8% 5.8x 5.1x Median $1,843 $1,628 $6,438 $437 12.3% 2.4% 3.3% 3.0% 6.0x 5.6x Unit-Based Education Pearson plc $7,717 $8,571 $4,613 $834 18.1% NA 3.1% 12.0% 8.7x 8.2x Bright Horizons Family Solutions Inc. 4,420 5,361 2,016 317 15.7% 1.5% 11.9% 16.0% 14.7x 12.6x Stride, Inc. 1,705 1,806 1,745 268 15.4% NA 7.7% 13.6% 6.1x 5.2x Franklin Covey Co. 536 501 270 44 16.3% NA 10.4% 13.1% 10.7x 8.9x Sylvan Learning NA NA 42 13 31.4% 2.6% 3.1% 5.3% - - Mean $3,594 $4,060 $1,737 $295 19.4% 2.0% 7.2% 12.0% 10.0x 8.7x Median $3,062 $3,584 $1,745 $268 16.3% 2.0% 7.7% 13.1% 9.7x 8.6x Weighted Average 8.1x 7.6x Median 7.0x 6.3x Mean 8.0x 7.1x Preliminary Analysis of Selected Public Companies – Valuation and Benchmarking (Cont’d) Source: Company provided financials, S&P Capital IQ as of April 12, 2023, company filings and Wall Street equity research. (1) Weighted by 2023E EBITDA of each individual FREEDOM segment, reflects Pet Retail median weighted by Pet Supplies Plus, Home and Furniture median weighted by American Freight and Badcock Home Furniture, Beauty Health and Wellness and Specialty Retail combined median weighted by VICTORY, Finance Driven Retail median weighted by Buddy’s. and Unit Based Education median weighted by Sylvan Learning. ($Millions) (1) 27 |
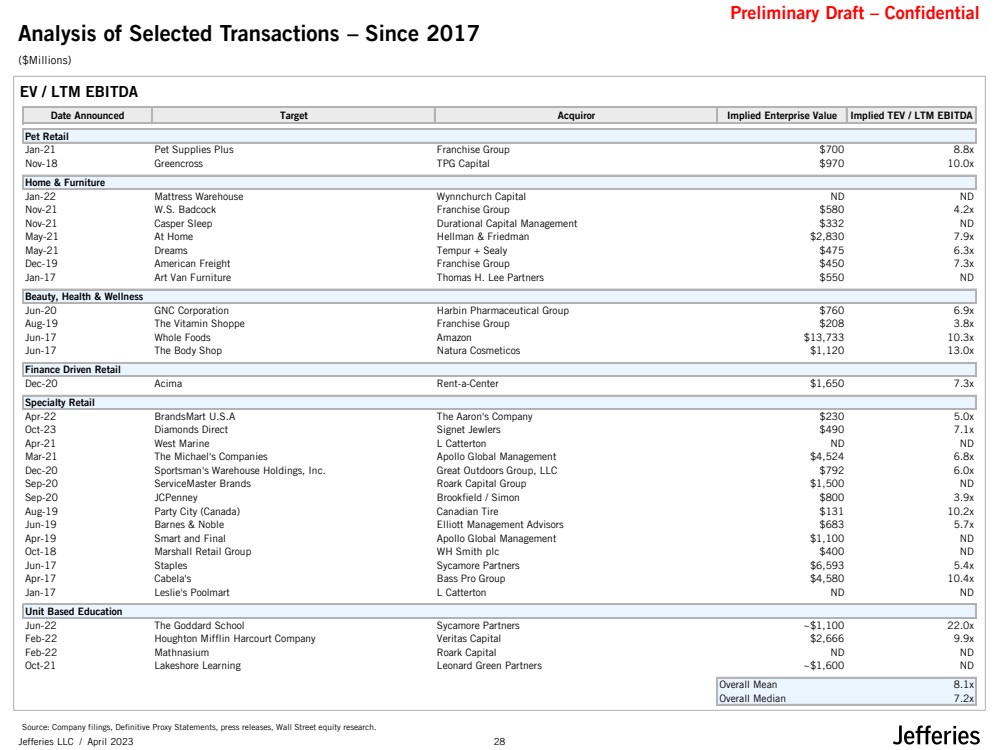
| Preliminary Draft – Confidential Jefferies LLC / April 2023 EV / LTM EBITDA Analysis of Selected Transactions – Since 2017 ($Millions) Source: Company filings, Definitive Proxy Statements, press releases, Wall Street equity research. 28 Date Announced Target Acquiror Implied Enterprise Value Implied TEV / LTM EBITDA Pet Retail Jan-21 Pet Supplies Plus Franchise Group $700 8.8x Nov-18 Greencross TPG Capital $970 10.0x Home & Furniture Jan-22 Mattress Warehouse Wynnchurch Capital ND ND Nov-21 W.S. Badcock Franchise Group $580 4.2x Nov-21 Casper Sleep Durational Capital Management $332 ND May-21 At Home Hellman & Friedman $2,830 7.9x May-21 Dreams Tempur + Sealy $475 6.3x Dec-19 American Freight Franchise Group $450 7.3x Jan-17 Art Van Furniture Thomas H. Lee Partners $550 ND Beauty, Health & Wellness Jun-20 GNC Corporation Harbin Pharmaceutical Group $760 6.9x Aug-19 The Vitamin Shoppe Franchise Group $208 3.8x Jun-17 Whole Foods Amazon $13,733 10.3x Jun-17 The Body Shop Natura Cosmeticos $1,120 13.0x Finance Driven Retail Dec-20 Acima Rent-a-Center $1,650 7.3x Specialty Retail Apr-22 BrandsMart U.S.A The Aaron's Company $230 5.0x Oct-23 Diamonds Direct Signet Jewlers $490 7.1x Apr-21 West Marine L Catterton ND ND Mar-21 The Michael's Companies Apollo Global Management $4,524 6.8x Dec-20 Sportsman's Warehouse Holdings, Inc. Great Outdoors Group, LLC $792 6.0x Sep-20 ServiceMaster Brands Roark Capital Group $1,500 ND Sep-20 JCPenney Brookfield / Simon $800 3.9x Aug-19 Party City (Canada) Canadian Tire $131 10.2x Jun-19 Barnes & Noble Elliott Management Advisors $683 5.7x Apr-19 Smart and Final Apollo Global Management $1,100 ND Oct-18 Marshall Retail Group WH Smith plc $400 ND Jun-17 Staples Sycamore Partners $6,593 5.4x Apr-17 Cabela's Bass Pro Group $4,580 10.4x Jan-17 Leslie's Poolmart L Catterton ND ND Unit Based Education Jun-22 The Goddard School Sycamore Partners ~$1,100 22.0x Feb-22 Houghton Mifflin Harcourt Company Veritas Capital $2,666 9.9x Feb-22 Mathnasium Roark Capital ND ND Oct-21 Lakeshore Learning Leonard Green Partners ~$1,600 ND Overall Mean 8.1x Overall Median 7.2x |
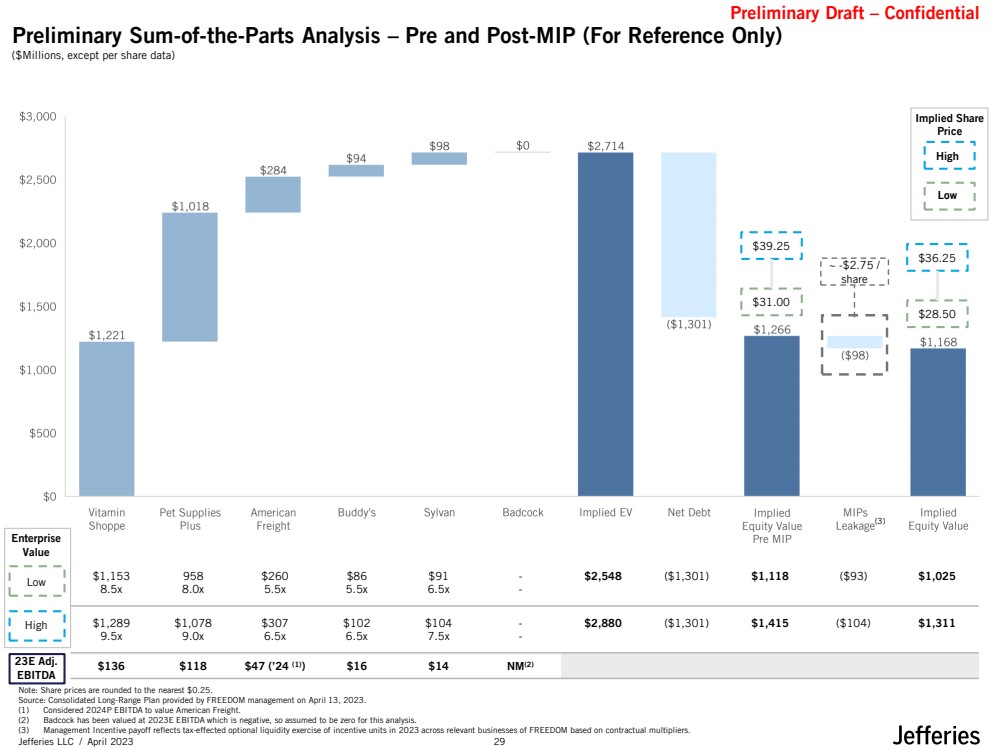
| Preliminary Draft – Confidential Jefferies LLC / April 2023 Preliminary Sum-of-the-Parts Analysis – Pre and Post-MIP (For Reference Only) ($Millions, except per share data) Note: Share prices are rounded to the nearest $0.25. Source: Consolidated Long-Range Plan provided by FREEDOM management on April 13, 2023. (1) Considered 2024P EBITDA to value American Freight. (2) Badcock has been valued at 2023E EBITDA which is negative, so assumed to be zero for this analysis. (3) Management Incentive payoff reflects tax-effected optional liquidity exercise of incentive units in 2023 across relevant businesses of FREEDOM based on contractual multipliers. $39.25 $31.00 $36.25 $28.50 $1,153 8.5x 958 8.0x $260 5.5x $86 5.5x $91 6.5x - - $2,548 ($1,301) $1,118 ($93) $1,025 $1,289 9.5x $1,078 9.0x $307 6.5x $102 6.5x $104 7.5x - - $2,880 ($1,301) $1,415 ($104) $1,311 $136 $118 $47 (’24 (1)) $16 $14 NM(2) Low High 23E Adj. EBITDA Enterprise Value High Low Implied Share Price ~ -$2.75 / share (3) 29 |
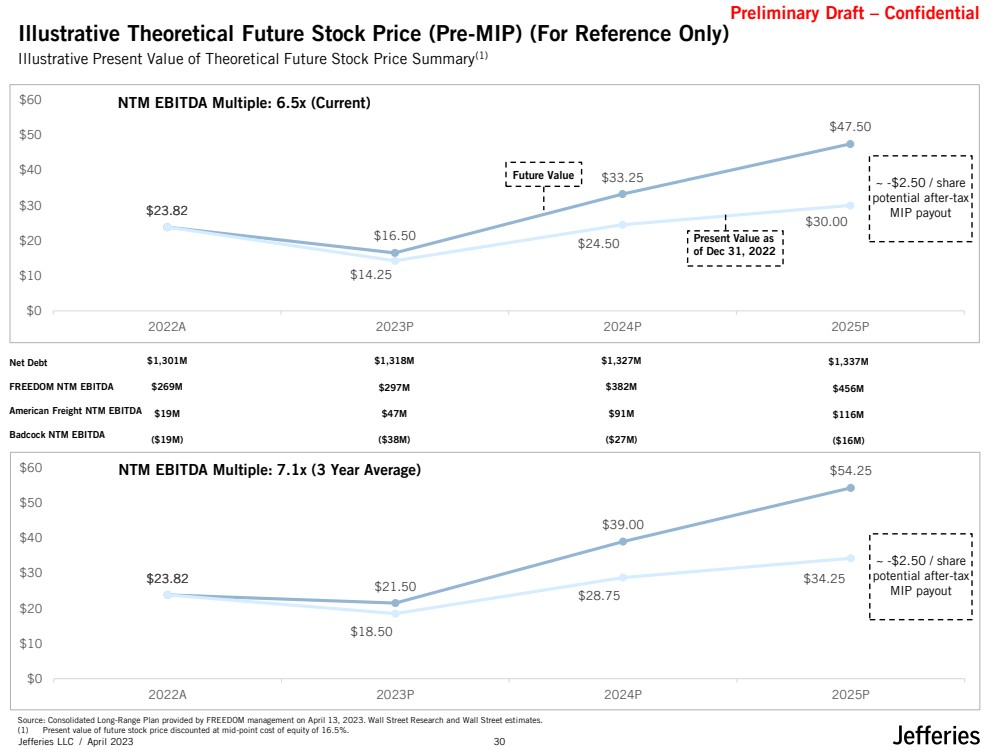
| Preliminary Draft – Confidential Jefferies LLC / April 2023 $23.82 $16.50 $33.25 $47.50 $14.25 $24.50 $30.00 $0 $10 $20 $30 $40 $50 $60 2022A 2023P 2024P 2025P NTM EBITDA Multiple: 6.5x (Current) NTM EBITDA Multiple: 7.1x (3 Year Average) Present Value as of Dec 31, 2022 Illustrative Theoretical Future Stock Price (Pre-MIP) (For Reference Only) Illustrative Present Value of Theoretical Future Stock Price Summary(1) Source: Consolidated Long-Range Plan provided by FREEDOM management on April 13, 2023. Wall Street Research and Wall Street estimates. (1) Present value of future stock price discounted at mid-point cost of equity of 16.5%. Future Value Net Debt FREEDOM NTM EBITDA American Freight NTM EBITDA Badcock NTM EBITDA $1,301M $269M $19M ($19M) $1,318M $297M $47M ($38M) $1,327M $382M $91M ($27M) $1,337M $456M $116M ($16M) ~ -$2.50 / share potential after-tax MIP payout ~ -$2.50 / share potential after-tax MIP payout $23.82 $21.50 $39.00 $54.25 $18.50 $28.75 $34.25 $0 $10 $20 $30 $40 $50 $60 2022A 2023P 2024P 2025P 30 |
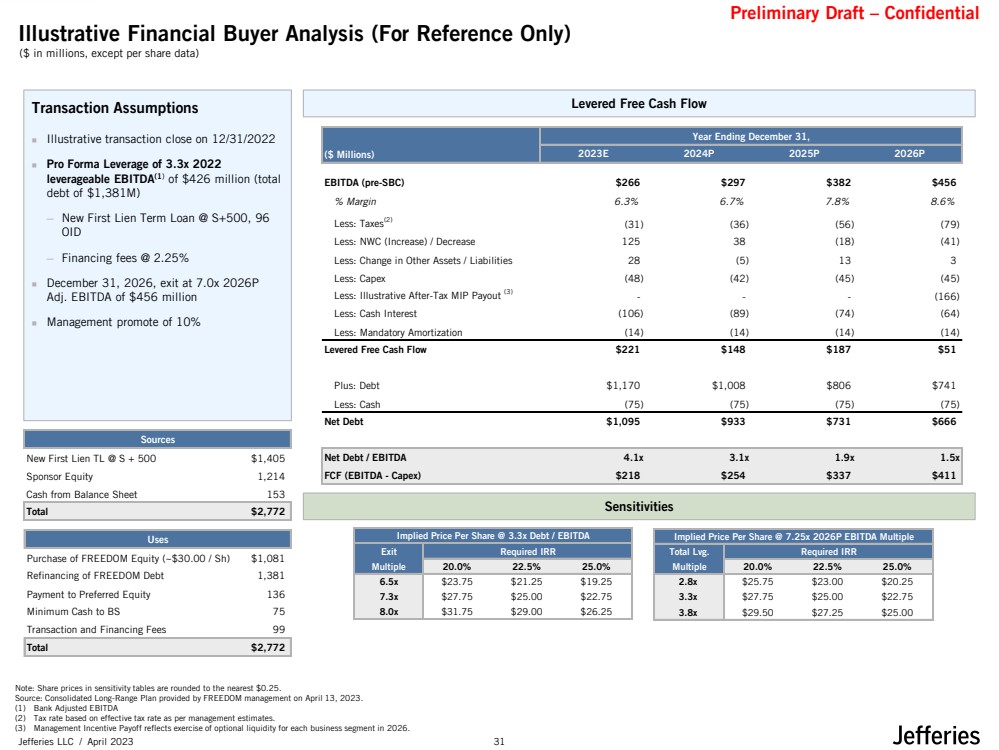
| Preliminary Draft – Confidential Jefferies LLC / April 2023 Note: Share prices in sensitivity tables are rounded to the nearest $0.25. Source: Consolidated Long-Range Plan provided by FREEDOM management on April 13, 2023. (1) Bank Adjusted EBITDA (2) Tax rate based on effective tax rate as per management estimates. (3) Management Incentive Payoff reflects exercise of optional liquidity for each business segment in 2026. Levered Free Cash Flow Sensitivities Transaction Assumptions ◼ Illustrative transaction close on 12/31/2022 ◼ Pro Forma Leverage of 3.3x 2022 leverageable EBITDA(1) of $426 million (total debt of $1,381M) ─ New First Lien Term Loan @ S+500, 96 OID ─ Financing fees @ 2.25% ◼ December 31, 2026, exit at 7.0x 2026P Adj. EBITDA of $456 million ◼ Management promote of 10% Illustrative Financial Buyer Analysis (For Reference Only) ($ in millions, except per share data) Implied Price Per Share @ 7.25x 2026P EBITDA Multiple Total Lvg. Required IRR Multiple 20.0% 22.5% 25.0% 2.8x $25.75 $23.00 $20.25 3.3x $27.75 $25.00 $22.75 3.8x $29.50 $27.25 $25.00 Sources New First Lien TL @ S + 500 $1,405 Sponsor Equity 1,214 Cash from Balance Sheet 153 Total $2,772 Uses Purchase of FREEDOM Equity (~$30.00 / Sh) $1,081 Refinancing of FREEDOM Debt 1,381 Payment to Preferred Equity 136 Minimum Cash to BS 75 Transaction and Financing Fees 99 Total $2,772 Year Ending December 31, ($ Millions) 2023E 2024P 2025P 2026P EBITDA (pre-SBC) $266 $297 $382 $456 % Margin 6.3% 6.7% 7.8% 8.6% Less: Taxes(2) (31) (36) (56) (79) Less: NWC (Increase) / Decrease 125 38 (18) (41) Less: Change in Other Assets / Liabilities 28 (5) 13 3 Less: Capex (48) (42) (45) (45) Less: Illustrative After-Tax MIP Payout (3) - - - (166) Less: Cash Interest (106) (89) (74) (64) Less: Mandatory Amortization (14) (14) (14) (14) Levered Free Cash Flow $221 $148 $187 $51 Plus: Debt $1,170 $1,008 $806 $741 Less: Cash (75) (75) (75) (75) Net Debt $1,095 $933 $731 $666 Net Debt / EBITDA 4.1x 3.1x 1.9x 1.5x FCF (EBITDA - Capex) $218 $254 $337 $411 Implied Price Per Share @ 3.3x Debt / EBITDA Exit Required IRR Multiple 20.0% 22.5% 25.0% 6.5x $23.75 $21.25 $19.25 7.3x $27.75 $25.00 $22.75 8.0x $31.75 $29.00 $26.25 31 |
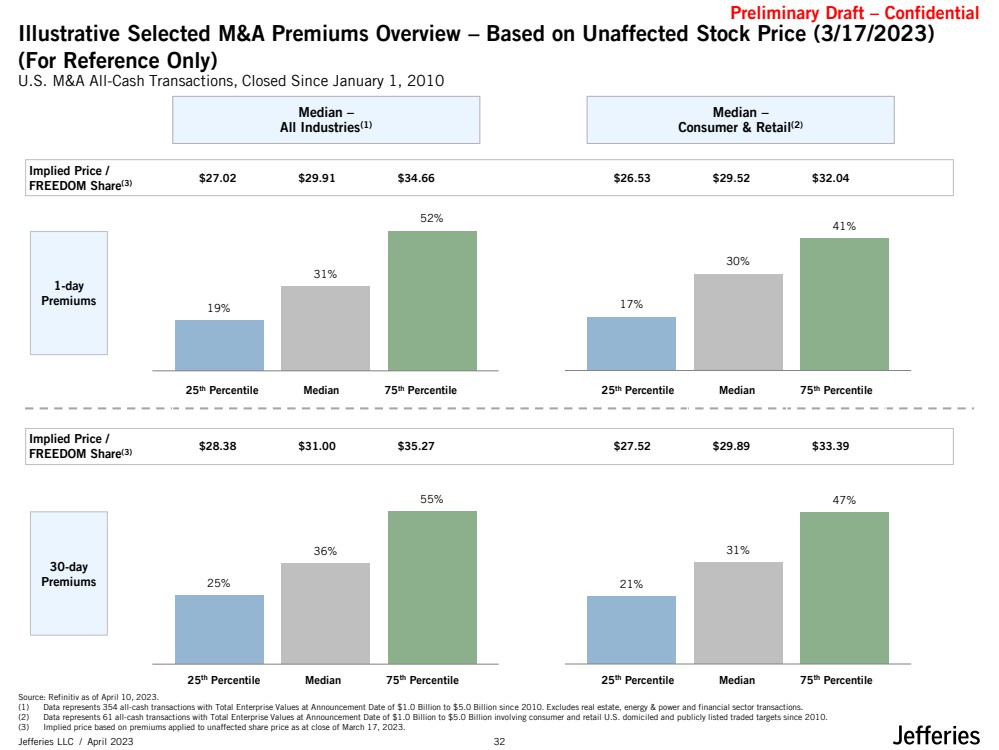
| Preliminary Draft – Confidential Jefferies LLC / April 2023 1-day Premiums 17% 30% 41% 19% 31% 52% $27.02 $29.91 $34.66 $26.53 $29.52 $32.04 25% 36% 55% Illustrative Selected M&A Premiums Overview – Based on Unaffected Stock Price (3/17/2023) (For Reference Only) Source: Refinitiv as of April 10, 2023. (1) Data represents 354 all-cash transactions with Total Enterprise Values at Announcement Date of $1.0 Billion to $5.0 Billion since 2010. Excludes real estate, energy & power and financial sector transactions. (2) Data represents 61 all-cash transactions with Total Enterprise Values at Announcement Date of $1.0 Billion to $5.0 Billion involving consumer and retail U.S. domiciled and publicly listed traded targets since 2010. (3) Implied price based on premiums applied to unaffected share price as at close of March 17, 2023. U.S. M&A All-Cash Transactions, Closed Since January 1, 2010 Median – All Industries(1) Median – Consumer & Retail(2) 21% 31% 47% Implied Price / FREEDOM Share(3) Implied Price / FREEDOM Share(3) 30-day Premiums $28.38 $31.00 $35.27 $27.52 $29.89 $33.39 25th Percentile Median 75th Percentile 25th Percentile Median 75th Percentile 25th Percentile Median 75th Percentile 25th Percentile Median 75th Percentile 32 |
| Preliminary Draft – Confidential Jefferies LLC / April 2023 Preliminary VICTORY Considerations 33 |
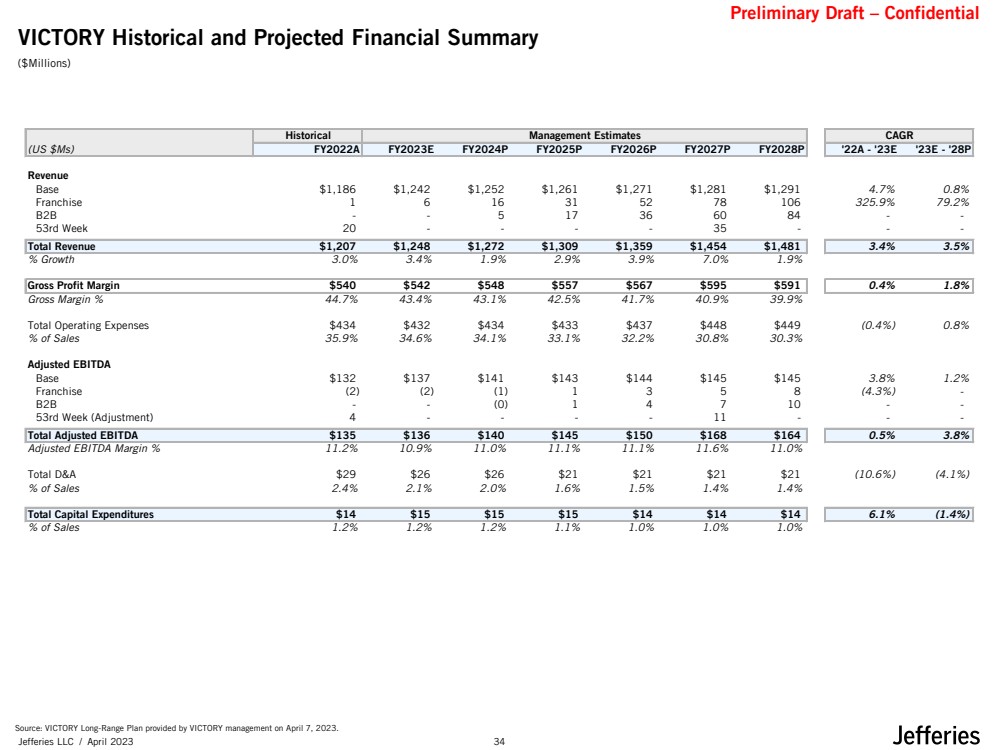
| Preliminary Draft – Confidential Jefferies LLC / April 2023 VICTORY Historical and Projected Financial Summary ($Millions) Source: VICTORY Long-Range Plan provided by VICTORY management on April 7, 2023. Historical Management Estimates (US $Ms) FY2022A FY2023E FY2024P FY2025P FY2026P FY2027P FY2028P '22A - '23E '23E - '28P Revenue Base $1,186 $1,242 $1,252 $1,261 $1,271 $1,281 $1,291 4.7% 0.8% Franchise 1 6 16 31 52 78 106 325.9% 79.2% B2B - - 5 17 36 60 84 - - 53rd Week 20 - - - - 35 - - - Total Revenue $1,207 $1,248 $1,272 $1,309 $1,359 $1,454 $1,481 3.4% 3.5% % Growth 3.0% 3.4% 1.9% 2.9% 3.9% 7.0% 1.9% Gross Profit Margin $540 $542 $548 $557 $567 $595 $591 0.4% 1.8% Gross Margin % 44.7% 43.4% 43.1% 42.5% 41.7% 40.9% 39.9% Total Operating Expenses $434 $432 $434 $433 $437 $448 $449 (0.4%) 0.8% % of Sales 35.9% 34.6% 34.1% 33.1% 32.2% 30.8% 30.3% Adjusted EBITDA Base $132 $137 $141 $143 $144 $145 $145 3.8% 1.2% Franchise (2) (2) (1) 1 3 5 8 (4.3%) - B2B - - (0) 1 4 7 10 - - 53rd Week (Adjustment) 4 - - - - 11 - - - Total Adjusted EBITDA $135 $136 $140 $145 $150 $168 $164 0.5% 3.8% Adjusted EBITDA Margin % 11.2% 10.9% 11.0% 11.1% 11.1% 11.6% 11.0% Total D&A $29 $26 $26 $21 $21 $21 $21 (10.6%) (4.1%) % of Sales 2.4% 2.1% 2.0% 1.6% 1.5% 1.4% 1.4% Total Capital Expenditures $14 $15 $15 $15 $14 $14 $14 6.1% (1.4%) % of Sales 1.2% 1.2% 1.2% 1.1% 1.0% 1.0% 1.0% CAGR 34 |
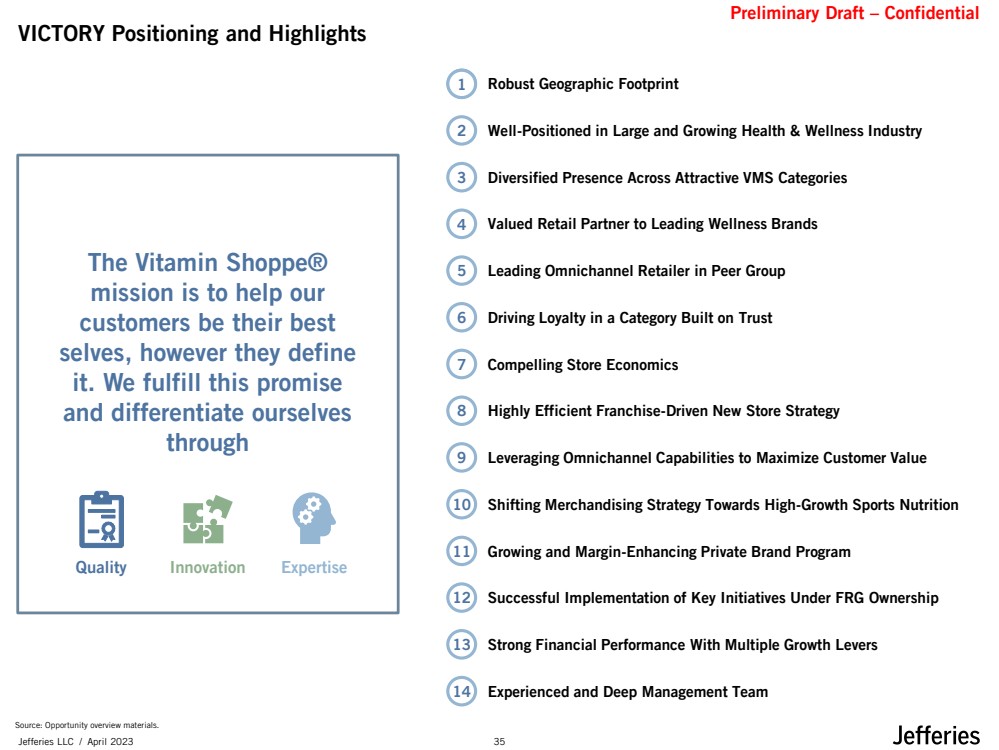
| Preliminary Draft – Confidential Jefferies LLC / April 2023 VICTORY Positioning and Highlights The Vitamin Shoppe® mission is to help our customers be their best selves, however they define it. We fulfill this promise and differentiate ourselves through Quality Innovation Expertise Source: Opportunity overview materials. 6 Driving Loyalty in a Category Built on Trust 7 Compelling Store Economics 3 Diversified Presence Across Attractive VMS Categories 5 Leading Omnichannel Retailer in Peer Group 2 Well-Positioned in Large and Growing Health & Wellness Industry 11 Growing and Margin-Enhancing Private Brand Program 1 Robust Geographic Footprint 9 Leveraging Omnichannel Capabilities to Maximize Customer Value 8 Highly Efficient Franchise-Driven New Store Strategy 12 Successful Implementation of Key Initiatives Under FRG Ownership 13 Strong Financial Performance With Multiple Growth Levers 4 Valued Retail Partner to Leading Wellness Brands 14 Experienced and Deep Management Team 10 Shifting Merchandising Strategy Towards High-Growth Sports Nutrition 35 |
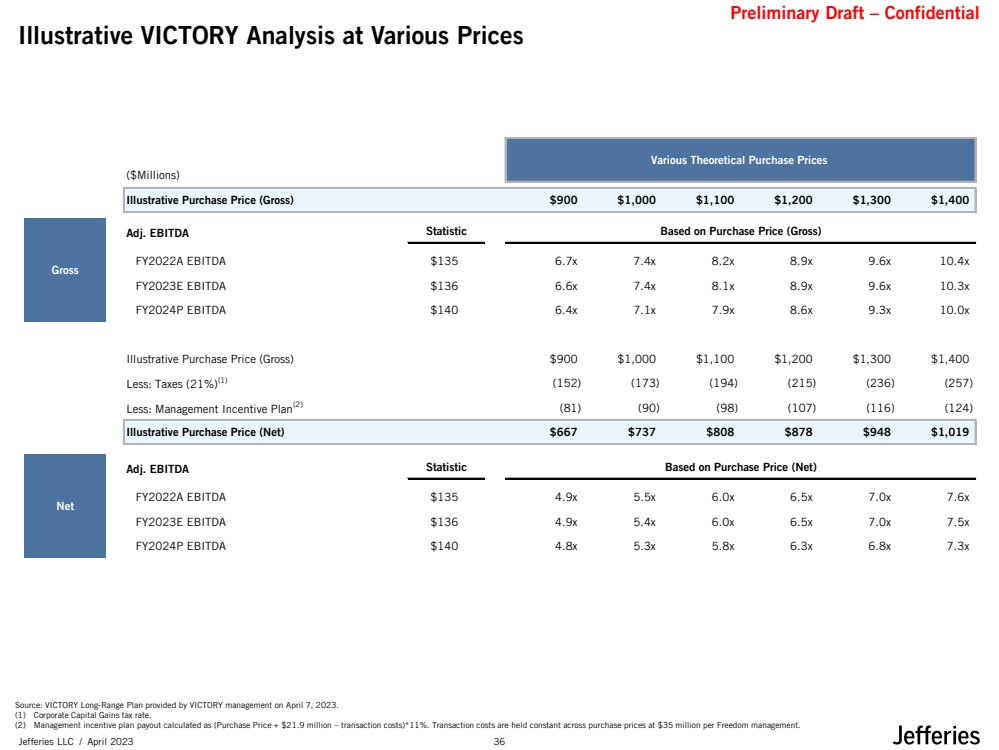
| Preliminary Draft – Confidential Jefferies LLC / April 2023 Illustrative VICTORY Analysis at Various Prices Source: VICTORY Long-Range Plan provided by VICTORY management on April 7, 2023. (1) Corporate Capital Gains tax rate. (2) Management incentive plan payout calculated as (Purchase Price + $21.9 million – transaction costs)*11%. Transaction costs are held constant across purchase prices at $35 million per Freedom management. Various Theoretical Purchase Prices ($Millions) Illustrative Purchase Price (Gross) $900 $1,000 $1,100 $1,200 $1,300 $1,400 Adj. EBITDA Statistic Based on Purchase Price (Gross) FY2022A EBITDA $135 6.7x 7.4x 8.2x 8.9x 9.6x 10.4x FY2023E EBITDA $136 6.6x 7.4x 8.1x 8.9x 9.6x 10.3x FY2024P EBITDA $140 6.4x 7.1x 7.9x 8.6x 9.3x 10.0x Illustrative Purchase Price (Gross) $900 $1,000 $1,100 $1,200 $1,300 $1,400 Less: Taxes (21%)(1) (152) (173) (194) (215) (236) (257) Less: Management Incentive Plan(2) (81) (90) (98) (107) (116) (124) Illustrative Purchase Price (Net) $667 $737 $808 $878 $948 $1,019 Adj. EBITDA Statistic Based on Purchase Price (Net) FY2022A EBITDA $135 4.9x 5.5x 6.0x 6.5x 7.0x 7.6x FY2023E EBITDA $136 4.9x 5.4x 6.0x 6.5x 7.0x 7.5x FY2024P EBITDA $140 4.8x 5.3x 5.8x 6.3x 6.8x 7.3x Gross Net 36 |
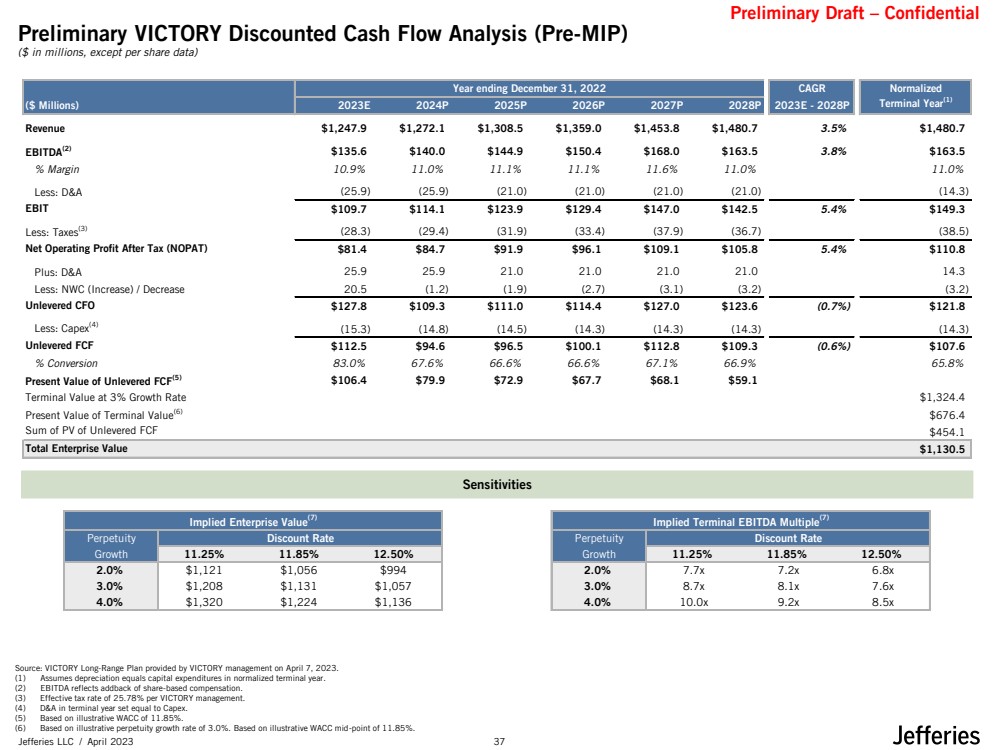
| Preliminary Draft – Confidential Jefferies LLC / April 2023 Sensitivities Preliminary VICTORY Discounted Cash Flow Analysis (Pre-MIP) Source: VICTORY Long-Range Plan provided by VICTORY management on April 7, 2023. (1) Assumes depreciation equals capital expenditures in normalized terminal year. (2) EBITDA reflects addback of share-based compensation. (3) Effective tax rate of 25.78% per VICTORY management. (4) D&A in terminal year set equal to Capex. (5) Based on illustrative WACC of 11.85%. (6) Based on illustrative perpetuity growth rate of 3.0%. Based on illustrative WACC mid-point of 11.85%. (8) ($ in millions, except per share data) Year ending December 31, 2022 CAGR Normalized ($ Millions) 2023E 2024P 2025P 2026P 2027P 2028P 2023E - 2028P Terminal Year(1) Revenue $1,247.9 $1,272.1 $1,308.5 $1,359.0 $1,453.8 $1,480.7 3.5% $1,480.7 EBITDA(2) $135.6 $140.0 $144.9 $150.4 $168.0 $163.5 3.8% $163.5 % Margin 10.9% 11.0% 11.1% 11.1% 11.6% 11.0% 11.0% Less: D&A (25.9) (25.9) (21.0) (21.0) (21.0) (21.0) (14.3) EBIT $109.7 $114.1 $123.9 $129.4 $147.0 $142.5 5.4% $149.3 Less: Taxes(3) (28.3) (29.4) (31.9) (33.4) (37.9) (36.7) (38.5) Net Operating Profit After Tax (NOPAT) $81.4 $84.7 $91.9 $96.1 $109.1 $105.8 5.4% $110.8 Plus: D&A 25.9 25.9 21.0 21.0 21.0 21.0 14.3 Less: NWC (Increase) / Decrease 20.5 (1.2) (1.9) (2.7) (3.1) (3.2) (3.2) Unlevered CFO $127.8 $109.3 $111.0 $114.4 $127.0 $123.6 (0.7%) $121.8 Less: Capex(4) (15.3) (14.8) (14.5) (14.3) (14.3) (14.3) (14.3) Unlevered FCF $112.5 $94.6 $96.5 $100.1 $112.8 $109.3 (0.6%) $107.6 % Conversion 83.0% 67.6% 66.6% 66.6% 67.1% 66.9% 65.8% Present Value of Unlevered FCF(5) $106.4 $79.9 $72.9 $67.7 $68.1 $59.1 Terminal Value at 3% Growth Rate $1,324.4 Present Value of Terminal Value(6) $676.4 Sum of PV of Unlevered FCF $454.1 Total Enterprise Value $1,130.5 Implied Enterprise Value(7) Perpetuity Discount Rate Growth 11.25% 11.85% 12.50% 2.0% $1,121 $1,056 $994 3.0% $1,208 $1,131 $1,057 4.0% $1,320 $1,224 $1,136 Implied Terminal EBITDA Multiple(7) Perpetuity Discount Rate Growth 11.25% 11.85% 12.50% 2.0% 7.7x 7.2x 6.8x 3.0% 8.7x 8.1x 7.6x 4.0% 10.0x 9.2x 8.5x 37 |
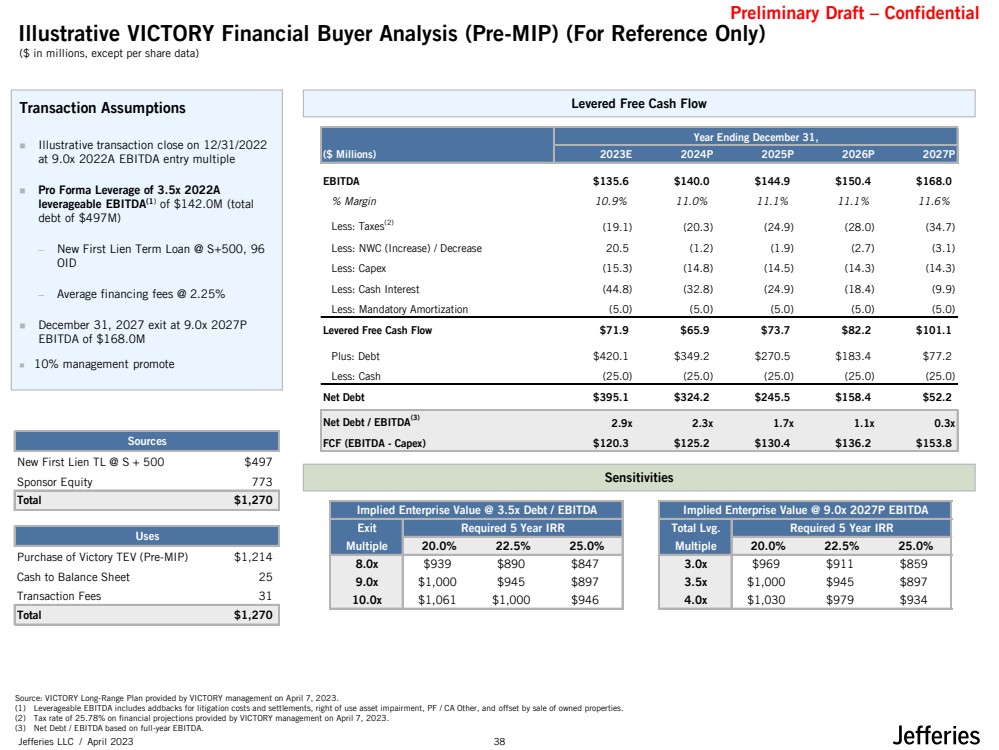
| Preliminary Draft – Confidential Jefferies LLC / April 2023 Source: VICTORY Long-Range Plan provided by VICTORY management on April 7, 2023. (1) Leverageable EBITDA includes addbacks for litigation costs and settlements, right of use asset impairment, PF / CA Other, and offset by sale of owned properties. (2) Tax rate of 25.78% on financial projections provided by VICTORY management on April 7, 2023. (3) Net Debt / EBITDA based on full-year EBITDA. Levered Free Cash Flow Sensitivities Transaction Assumptions ◼ Illustrative transaction close on 12/31/2022 at 9.0x 2022A EBITDA entry multiple ◼ Pro Forma Leverage of 3.5x 2022A leverageable EBITDA(1) of $142.0M (total debt of $497M) ─ New First Lien Term Loan @ S+500, 96 OID ─ Average financing fees @ 2.25% ◼ December 31, 2027 exit at 9.0x 2027P EBITDA of $168.0M ◼ 10% management promote Illustrative VICTORY Financial Buyer Analysis (Pre-MIP) (For Reference Only) ($ in millions, except per share data) Implied Enterprise Value @ 9.0x 2027P EBITDA Total Lvg. Multiple 20.0% 22.5% 25.0% 3.0x $969 $911 $859 3.5x $1,000 $945 $897 4.0x $1,030 $979 $934 Required 5 Year IRR Implied Enterprise Value @ 3.5x Debt / EBITDA Exit Multiple 20.0% 22.5% 25.0% 8.0x $939 $890 $847 9.0x $1,000 $945 $897 10.0x $1,061 $1,000 $946 Required 5 Year IRR Sources New First Lien TL @ S + 500 $497 Sponsor Equity 773 Total $1,270 Uses Purchase of Victory TEV (Pre-MIP) $1,214 Cash to Balance Sheet 25 Transaction Fees 31 Total $1,270 Year Ending December 31, ($ Millions) 2023E 2024P 2025P 2026P 2027P EBITDA $135.6 $140.0 $144.9 $150.4 $168.0 % Margin 10.9% 11.0% 11.1% 11.1% 11.6% Less: Taxes(2) (19.1) (20.3) (24.9) (28.0) (34.7) Less: NWC (Increase) / Decrease 20.5 (1.2) (1.9) (2.7) (3.1) Less: Capex (15.3) (14.8) (14.5) (14.3) (14.3) Less: Cash Interest (44.8) (32.8) (24.9) (18.4) (9.9) Less: Mandatory Amortization (5.0) (5.0) (5.0) (5.0) (5.0) Levered Free Cash Flow $71.9 $65.9 $73.7 $82.2 $101.1 Plus: Debt $420.1 $349.2 $270.5 $183.4 $77.2 Less: Cash (25.0) (25.0) (25.0) (25.0) (25.0) Net Debt $395.1 $324.2 $245.5 $158.4 $52.2 Net Debt / EBITDA(3) 2.9x 2.3x 1.7x 1.1x 0.3x FCF (EBITDA - Capex) $120.3 $125.2 $130.4 $136.2 $153.8 38 |
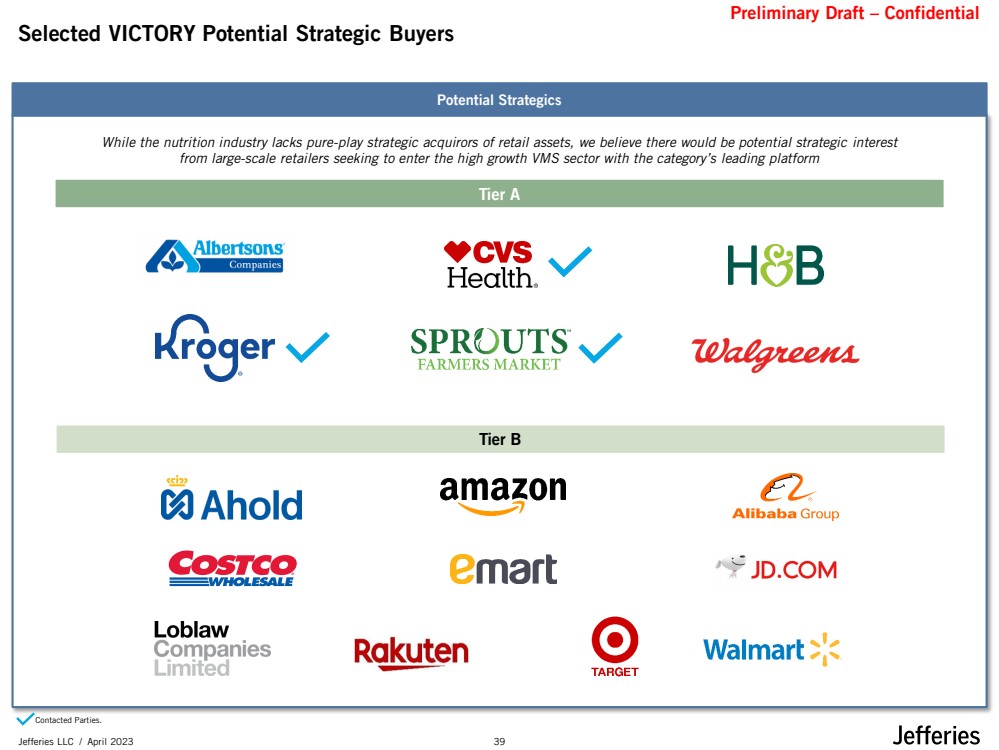
| Preliminary Draft – Confidential Jefferies LLC / April 2023 Selected VICTORY Potential Strategic Buyers Potential Strategics Tier A Tier B While the nutrition industry lacks pure-play strategic acquirors of retail assets, we believe there would be potential strategic interest from large-scale retailers seeking to enter the high growth VMS sector with the category’s leading platform Contacted Parties. 39 |
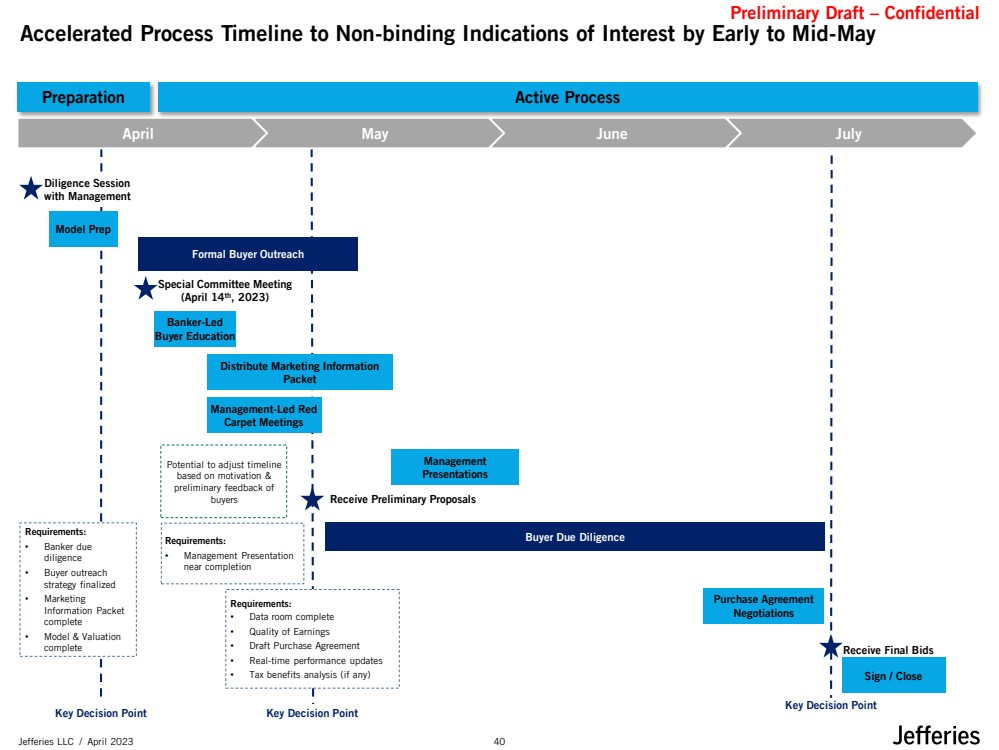
| Preliminary Draft – Confidential Jefferies LLC / April 2023 Key Decision Point Accelerated Process Timeline to Non-binding Indications of Interest by Early to Mid-May Management Presentations Receive Final Bids Diligence Session with Management Special Committee Meeting (April 14th, 2023) Receive Preliminary Proposals Requirements: • Management Presentation near completion Distribute Marketing Information Packet Sign / Close Buyer Due Diligence Purchase Agreement Negotiations April May June July Banker-Led Buyer Education Management-Led Red Carpet Meetings Potential to adjust timeline based on motivation & preliminary feedback of buyers Requirements: • Data room complete • Quality of Earnings • Draft Purchase Agreement • Real-time performance updates • Tax benefits analysis (if any) Model Prep Preparation Active Process Formal Buyer Outreach Key Decision Point Key Decision Point ` Requirements: • Banker due diligence • Buyer outreach strategy finalized • Marketing Information Packet complete • Model & Valuation complete 40 |
| Preliminary Draft – Confidential Jefferies LLC / April 2023 Potential Next Steps for Discussion 41 |
| Preliminary Draft – Confidential Jefferies LLC / April 2023 Potential Next Steps For Discussion ◼ Deliver Special Committee’s official response to Bidder − Prepare for valuation discussion with Bidder as appropriate ◼ Continue ongoing outbound calls with remaining identified parties for FREEDOM and VICTORY ◼ Accelerate information gathering for Bidder and its financing partners diligence to allow for a transaction by early May − Populate electronic data room based on request lists received to date (business and legal) − Identify other key documents ◼ Establish process and timing for determining Brian Kahn’s potential willingness to participate in Bidder’s proposed transaction given rollover condition (or any other proposed transaction if relevant) ◼ Continue to pursue separate VICTORY discussions if confirmed by the Special Committee − Drafting of VICTORY marketing materials − VICTORY-specific data room ◼ Prepare for May 9 Board meeting In light of projected dividend constraints / suspension − Determine FREEDOM’s potential options beyond solely announcing dividend suspension: • Sign and announce a Sale of Company transaction with Bidder or potentially another party, if available • Announce a suspension of dividend together with review of strategic alternatives (e.g., public sale process or potential VICTORY divestiture) • Other ◼ Provide future updates to the Special Committee through May 9 Board meeting 42 |
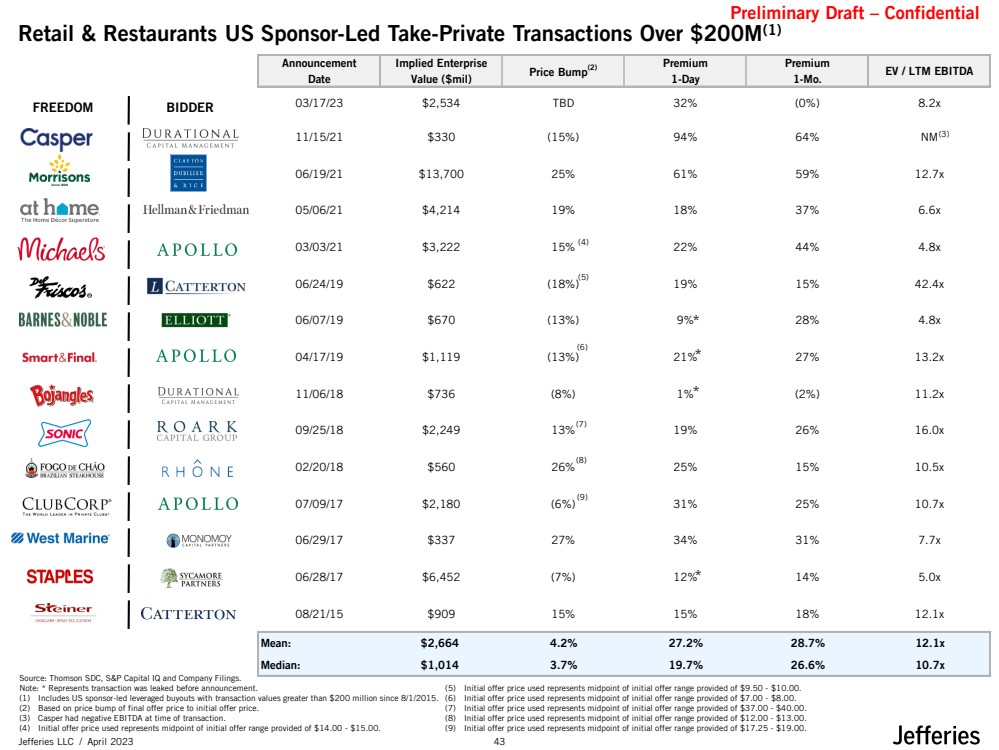
| Preliminary Draft – Confidential Jefferies LLC / April 2023 Retail & Restaurants US Sponsor-Led Take-Private Transactions Over $200M(1) Source: Thomson SDC, S&P Capital IQ and Company Filings. Note: * Represents transaction was leaked before announcement. (1) Includes US sponsor-led leveraged buyouts with transaction values greater than $200 million since 8/1/2015. (2) Based on price bump of final offer price to initial offer price. (3) Casper had negative EBITDA at time of transaction. (4) Initial offer price used represents midpoint of initial offer range provided of $14.00 - $15.00. (5) Initial offer price used represents midpoint of initial offer range provided of $9.50 - $10.00. (6) Initial offer price used represents midpoint of initial offer range provided of $7.00 - $8.00. (7) Initial offer price used represents midpoint of initial offer range provided of $37.00 - $40.00. (8) Initial offer price used represents midpoint of initial offer range provided of $12.00 - $13.00. (9) Initial offer price used represents midpoint of initial offer range provided of $17.25 - $19.00. * * * * (3) FREEDOM BIDDER (4) (5) (6) (7) (8) (9) Announcement Date Implied Enterprise Value ($mil) Price Bump(2) Premium 1-Day Premium 1-Mo. EV / LTM EBITDA 03/17/23 $2,534 TBD 32% (0%) 8.2x 11/15/21 $330 (15%) 94% 64% NM 06/19/21 $13,700 25% 61% 59% 12.7x 05/06/21 $4,214 19% 18% 37% 6.6x 03/03/21 $3,222 15% 22% 44% 4.8x 06/24/19 $622 (18%) 19% 15% 42.4x 06/07/19 $670 (13%) 9% 28% 4.8x 04/17/19 $1,119 (13%) 21% 27% 13.2x 11/06/18 $736 (8%) 1% (2%) 11.2x 09/25/18 $2,249 13% 19% 26% 16.0x 02/20/18 $560 26% 25% 15% 10.5x 07/09/17 $2,180 (6%) 31% 25% 10.7x 06/29/17 $337 27% 34% 31% 7.7x 06/28/17 $6,452 (7%) 12% 14% 5.0x 08/21/15 $909 15% 15% 18% 12.1x Mean: $2,664 4.2% 27.2% 28.7% 12.1x Median: $1,014 3.7% 19.7% 26.6% 10.7x 43 |
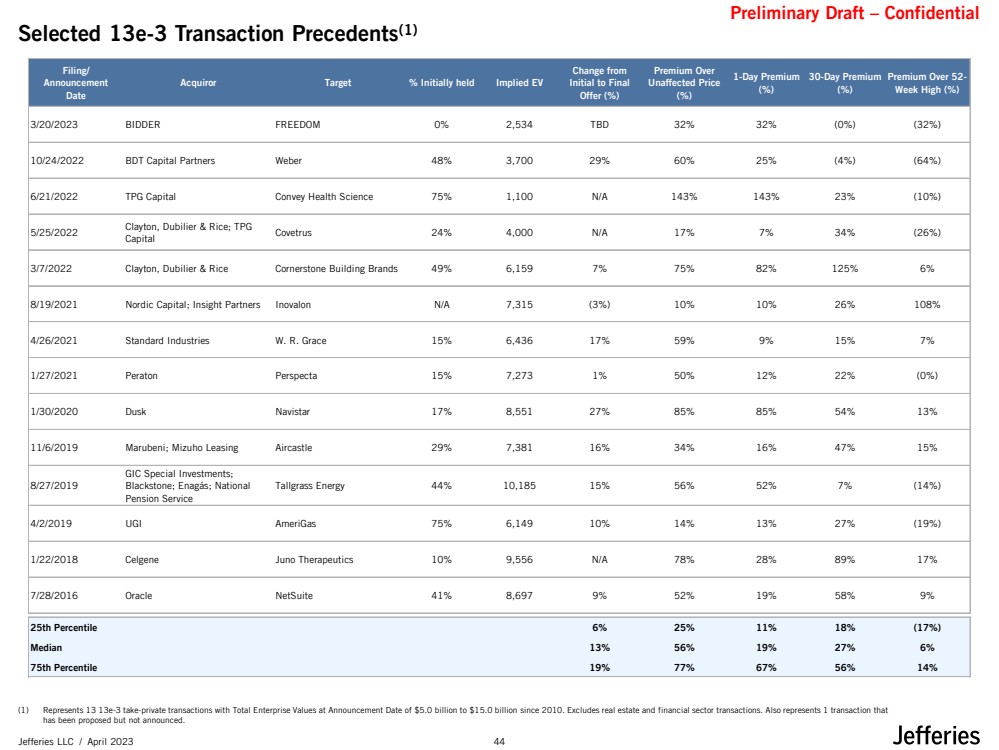
| Preliminary Draft – Confidential Jefferies LLC / April 2023 Selected 13e-3 Transaction Precedents(1) (1) Represents 13 13e-3 take-private transactions with Total Enterprise Values at Announcement Date of $5.0 billion to $15.0 billion since 2010. Excludes real estate and financial sector transactions. Also represents 1 transaction that has been proposed but not announced. Filing/ Announcement Date Acquiror Target % Initially held Implied EV Change from Initial to Final Offer (%) Premium Over Unaffected Price (%) 1-Day Premium (%) 30-Day Premium (%) Premium Over 52- Week High (%) 3/20/2023 BIDDER FREEDOM 0% 2,534 TBD 32% 32% (0%) (32%) 10/24/2022 BDT Capital Partners Weber 48% 3,700 29% 60% 25% (4%) (64%) 6/21/2022 TPG Capital Convey Health Science 75% 1,100 N/A 143% 143% 23% (10%) 5/25/2022 Clayton, Dubilier & Rice; TPG Capital Covetrus 24% 4,000 N/A 17% 7% 34% (26%) 3/7/2022 Clayton, Dubilier & Rice Cornerstone Building Brands 49% 6,159 7% 75% 82% 125% 6% 8/19/2021 Nordic Capital; Insight Partners Inovalon N/A 7,315 (3%) 10% 10% 26% 108% 4/26/2021 Standard Industries W. R. Grace 15% 6,436 17% 59% 9% 15% 7% 1/27/2021 Peraton Perspecta 15% 7,273 1% 50% 12% 22% (0%) 1/30/2020 Dusk Navistar 17% 8,551 27% 85% 85% 54% 13% 11/6/2019 Marubeni; Mizuho Leasing Aircastle 29% 7,381 16% 34% 16% 47% 15% 8/27/2019 GIC Special Investments; Blackstone; Enagás; National Pension Service Tallgrass Energy 44% 10,185 15% 56% 52% 7% (14%) 4/2/2019 UGI AmeriGas 75% 6,149 10% 14% 13% 27% (19%) 1/22/2018 Celgene Juno Therapeutics 10% 9,556 N/A 78% 28% 89% 17% 7/28/2016 Oracle NetSuite 41% 8,697 9% 52% 19% 58% 9% 25th Percentile 6% 25% 11% 18% (17%) Median 13% 56% 19% 27% 6% 75th Percentile 19% 77% 67% 56% 14% 44 |
| Preliminary Draft – Confidential Jefferies LLC / April 2023 Appendix 45 |
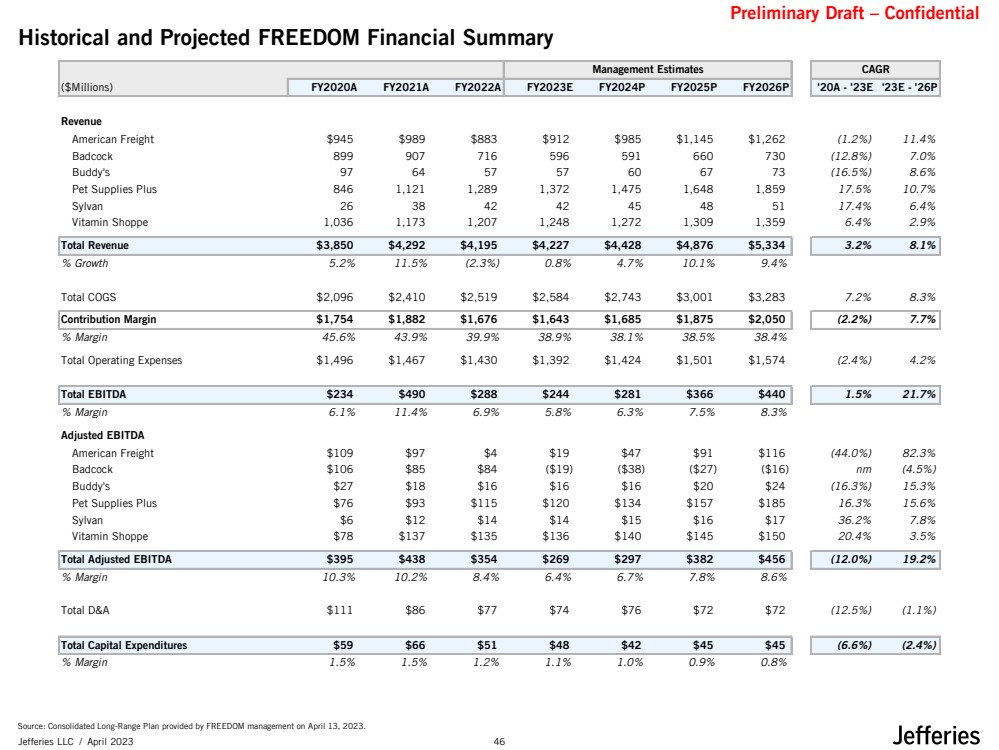
| Preliminary Draft – Confidential Jefferies LLC / April 2023 Historical and Projected FREEDOM Financial Summary Source: Consolidated Long-Range Plan provided by FREEDOM management on April 13, 2023. Management Estimates CAGR ($Millions) FY2020A FY2021A FY2022A FY2023E FY2024P FY2025P FY2026P '20A - '23E '23E - '26P Revenue American Freight $945 $989 $883 $912 $985 $1,145 $1,262 (1.2%) 11.4% Badcock 899 907 716 596 591 660 730 (12.8%) 7.0% Buddy's 97 64 57 57 60 67 73 (16.5%) 8.6% Pet Supplies Plus 846 1,121 1,289 1,372 1,475 1,648 1,859 17.5% 10.7% Sylvan 26 38 42 42 45 48 51 17.4% 6.4% Vitamin Shoppe 1,036 1,173 1,207 1,248 1,272 1,309 1,359 6.4% 2.9% Total Revenue $3,850 $4,292 $4,195 $4,227 $4,428 $4,876 $5,334 3.2% 8.1% % Growth 5.2% 11.5% (2.3%) 0.8% 4.7% 10.1% 9.4% Total COGS $2,096 $2,410 $2,519 $2,584 $2,743 $3,001 $3,283 7.2% 8.3% Contribution Margin $1,754 $1,882 $1,676 $1,643 $1,685 $1,875 $2,050 (2.2%) 7.7% % Margin 45.6% 43.9% 39.9% 38.9% 38.1% 38.5% 38.4% Total Operating Expenses $1,496 $1,467 $1,430 $1,392 $1,424 $1,501 $1,574 (2.4%) 4.2% Total EBITDA $234 $490 $288 $244 $281 $366 $440 1.5% 21.7% % Margin 6.1% 11.4% 6.9% 5.8% 6.3% 7.5% 8.3% Adjusted EBITDA American Freight $109 $97 $4 $19 $47 $91 $116 (44.0%) 82.3% Badcock $106 $85 $84 ($19) ($38) ($27) ($16) nm (4.5%) Buddy's $27 $18 $16 $16 $16 $20 $24 (16.3%) 15.3% Pet Supplies Plus $76 $93 $115 $120 $134 $157 $185 16.3% 15.6% Sylvan $6 $12 $14 $14 $15 $16 $17 36.2% 7.8% Vitamin Shoppe $78 $137 $135 $136 $140 $145 $150 20.4% 3.5% Total Adjusted EBITDA $395 $438 $354 $269 $297 $382 $456 (12.0%) 19.2% % Margin 10.3% 10.2% 8.4% 6.4% 6.7% 7.8% 8.6% Total D&A $111 $86 $77 $74 $76 $72 $72 (12.5%) (1.1%) Total Capital Expenditures $59 $66 $51 $48 $42 $45 $45 (6.6%) (2.4%) % Margin 1.5% 1.5% 1.2% 1.1% 1.0% 0.9% 0.8% 46 |
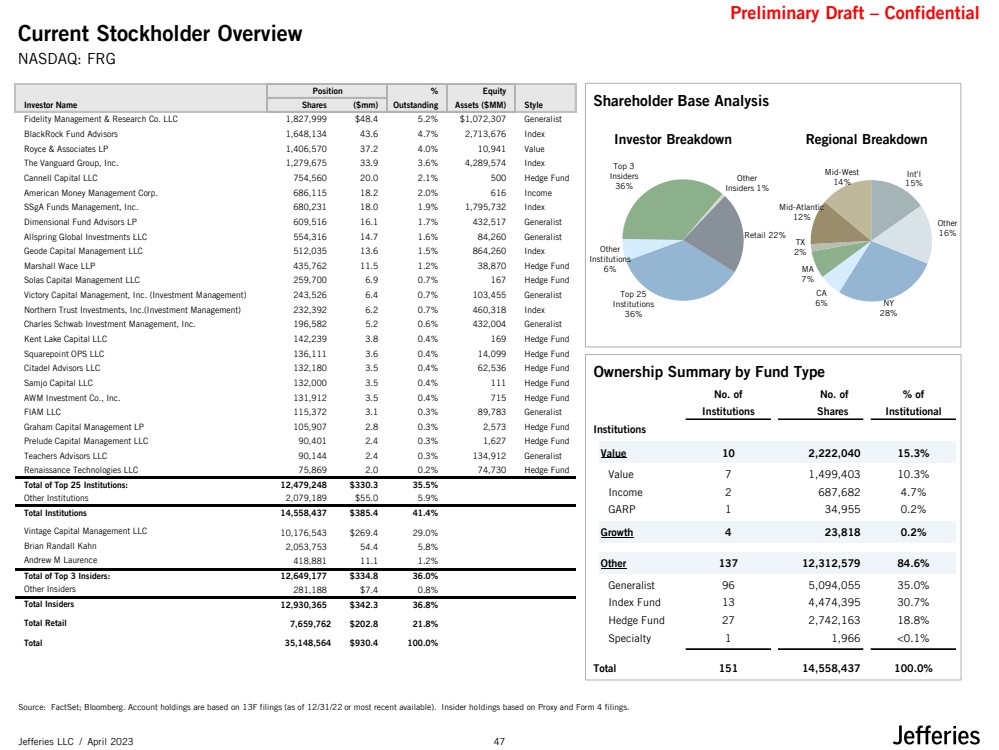
| Preliminary Draft – Confidential Jefferies LLC / April 2023 Ownership Summary by Fund Type No. of No. of % of Institutions Shares Institutional Institutions Value 10 2,222,040 15.3% Value 7 1,499,403 10.3% Income 2 687,682 4.7% GARP 1 34,955 0.2% Growth 4 23,818 0.2% Other 137 12,312,579 84.6% Generalist 96 5,094,055 35.0% Index Fund 13 4,474,395 30.7% Hedge Fund 27 2,742,163 18.8% Specialty 1 1,966 <0.1% Total 151 14,558,437 100.0% % Equity Investor Name Shares ($mm) Outstanding Assets ($MM) Style Fidelity Management & Research Co. LLC 1,827,999 $48.4 5.2% $1,072,307 Generalist BlackRock Fund Advisors 1,648,134 43.6 4.7% 2,713,676 Index Royce & Associates LP 1,406,570 37.2 4.0% 10,941 Value The Vanguard Group, Inc. 1,279,675 33.9 3.6% 4,289,574 Index Cannell Capital LLC 754,560 20.0 2.1% 500 Hedge Fund American Money Management Corp. 686,115 18.2 2.0% 616 Income SSgA Funds Management, Inc. 680,231 18.0 1.9% 1,795,732 Index Dimensional Fund Advisors LP 609,516 16.1 1.7% 432,517 Generalist Allspring Global Investments LLC 554,316 14.7 1.6% 84,260 Generalist Geode Capital Management LLC 512,035 13.6 1.5% 864,260 Index Marshall Wace LLP 435,762 11.5 1.2% 38,870 Hedge Fund Solas Capital Management LLC 259,700 6.9 0.7% 167 Hedge Fund Victory Capital Management, Inc. (Investment Management) 243,526 6.4 0.7% 103,455 Generalist Northern Trust Investments, Inc.(Investment Management) 232,392 6.2 0.7% 460,318 Index Charles Schwab Investment Management, Inc. 196,582 5.2 0.6% 432,004 Generalist Kent Lake Capital LLC 142,239 3.8 0.4% 169 Hedge Fund Squarepoint OPS LLC 136,111 3.6 0.4% 14,099 Hedge Fund Citadel Advisors LLC 132,180 3.5 0.4% 62,536 Hedge Fund Samjo Capital LLC 132,000 3.5 0.4% 111 Hedge Fund AWM Investment Co., Inc. 131,912 3.5 0.4% 715 Hedge Fund FIAM LLC 115,372 3.1 0.3% 89,783 Generalist Graham Capital Management LP 105,907 2.8 0.3% 2,573 Hedge Fund Prelude Capital Management LLC 90,401 2.4 0.3% 1,627 Hedge Fund Teachers Advisors LLC 90,144 2.4 0.3% 134,912 Generalist Renaissance Technologies LLC 75,869 2.0 0.2% 74,730 Hedge Fund Total of Top 25 Institutions: 12,479,248 $330.3 35.5% Other Institutions 2,079,189 $55.0 5.9% Total Institutions 14,558,437 $385.4 41.4% Vintage Capital Management LLC 10,176,543 $269.4 29.0% Brian Randall Kahn 2,053,753 54.4 5.8% Andrew M Laurence 418,881 11.1 1.2% Total of Top 3 Insiders: 12,649,177 $334.8 36.0% Other Insiders 281,188 $7.4 0.8% Total Insiders 12,930,365 $342.3 36.8% Total Retail 7,659,762 $202.8 21.8% Total 35,148,564 $930.4 100.0% Position Shareholder Base Analysis Investor Breakdown Regional Breakdown Source: FactSet; Bloomberg. Account holdings are based on 13F filings (as of 12/31/22 or most recent available). Insider holdings based on Proxy and Form 4 filings. Current Stockholder Overview NASDAQ: FRG Top 25 Institutions 36% Other Institutions 6% Top 3 Insiders 36% Other Insiders 1% Retail 22% NY 28% CA 6% MA 7% TX 2% Mid-Atlantic 12% Mid-West 14% Int'l 15% Other 16% 47 |