Exhibit 99.1

inland-investments.com 1 Inland Real Estate Income Trust, Inc. THIS IS NEITHER AN OFFER TO SELL NOR A SOLICITATION OF AN OFFER TO BUY ANY SECURITY. 2016 Annual Stockholders’ Meeting June 16, 2016 • 10:00 am CT inland-investments.com
inland-investments.com 2 Disclaimer This material is neither an offer to sell nor the solicitation of an offer to buy any security, which can be made only by a prospectus, as supplemented, which has been filed or registered with appropriate state and federal regulatory agencies, and sold only by broker dealers authorized to do so. Past performance is not a guarantee of future results. The companies depicted in the photographs and logos in this presentation are tenants of Inland Real Estate Income Trust, Inc. (“Inland Income Trust”) andmay have proprietary interests in their trademarks and trade names and nothing herein shall be considered an endorsement, authorization or approval of Inland Income Trust or its subsidiaries. The Inland name and logo are registered trademarks being used under license. This material has been distributed by Inland Securities Corporation, member FINRA/SIPC, dealer manager for Inland Income Trust. Publication Date: 6/16/2016
inland-investments.com 3 Risk Factors An investment in Inland Income Trust’s shares involves significant risks. If Inland Income Trust is unable to effectively managethese risks, it may not meet its investment objectives and investors may lose some or all of their investment. Some of the risks related to investing in lnland lncome Trust include, but are not limited to: the board of directors, rather than the trading market, determines the offering price of shares; there is limited liquidity because shares are not bought and sold on an exchange; repurchase programs may be modified or terminated; a typical time horizon for an exit strategy may be longer than five years; there is no guarantee that a liquidity event will occur; distributions cannot be guaranteed and may be paid from sources other than cash flow from operations, including borrowings and net offering proceeds; and failure to continue to qualify as a REIT and thus being required to pay federal, state and local taxes. Please consult lnland lncome Trust's most recent Annual Report on Form 10-K and any subsequent Quarterly Reports on Form 10-Q for more information on the specific risks.
inland-investments.com 4 Forward-Looking Statements In addition to historical information, this presentation contains "forward-looking statements" made under the "safe harbor" provisions of the Private Securities Litigation Reform Act of 1995. The statements may be identified by terminology such as "may," “can,” "would," “will,” "expect," "intend," "estimate," "anticipate," "plan," "seek," "appear," or "believe." Such statements reflect the current view of Inland Income Trust with respect to future events and are subject to certain risks, uncertainties and assumptions related to certain factors including, without limitation, the uncertainties related to general economic conditions, unforeseen events affecting thereal estate industry or particular markets, and other factors detailed under Risk Factors in our most recent Form 10-K and subsequent Form 10-Qs on file with the Securities and Exchange Commission. Although Inland Income Trust believes that the expectations reflected in such forward-looking statements are reasonable, it can give no assurance that such expectations will prove to be correct. You should exercise caution when considering forward-looking statements and not place undue reliance on them. Based upon changing conditions, should any one or more of these risks or uncertainties materialize, or should any underlying assumptions prove incorrect, actual results may vary materially from those described herein. Except as required by federal securities laws,Inland Income Trust undertakes no obligation to publicly update or revise any written or oral forward-looking statements, whether as a result of new information, future events, changed circumstances or any other reason after the date of this presentation.

inland-investments.com Agenda 5 • Call to Order and Opening Remarks: Daniel L. Goodwin, Chairman, Inland Real Estate Income Trust, Inc. • Report of Quorum and Presentation of the Affidavit of Mailing of Proxy Solicitation: Cathleen M. Hrtanek, Secretary, Inland Real Estate Income Trust, Inc. • Proxy Vote: Daniel L. Goodwin, Chairman, Inland Real Estate Income Trust, Inc. • Management Update, Investment Strategy and Retail and Economic Overview: Mitchell Sabshon, Chief Executive Officer, Inland Real Estate Income Trust, Inc. • Portfolio Overview and Acquisitions Update: JoAnn McGuinness, President and Chief Operating Officer, Inland Real Estate Income Trust, Inc. • Financial Highlights: David Lichterman, Vice President, Chief Accounting Officer and Treasurer, Inland Real Estate Income Trust, Inc. • Report of the Vote: Kevin Kelly, Inspector of Elections, Morrow & CO LLC –Election of Directors –Ratify selection of KPMG LLP –Approve employee and director restricted share plan • Closing Remarks: Daniel L. Goodwin, Chairman, Inland Real Estate Income Trust, Inc. SLIDE 7 13 22

inland-investments.com Board of Directors and Executive Officers 6

inland-investments.com Mitchell Sabshon Chief Executive Officer
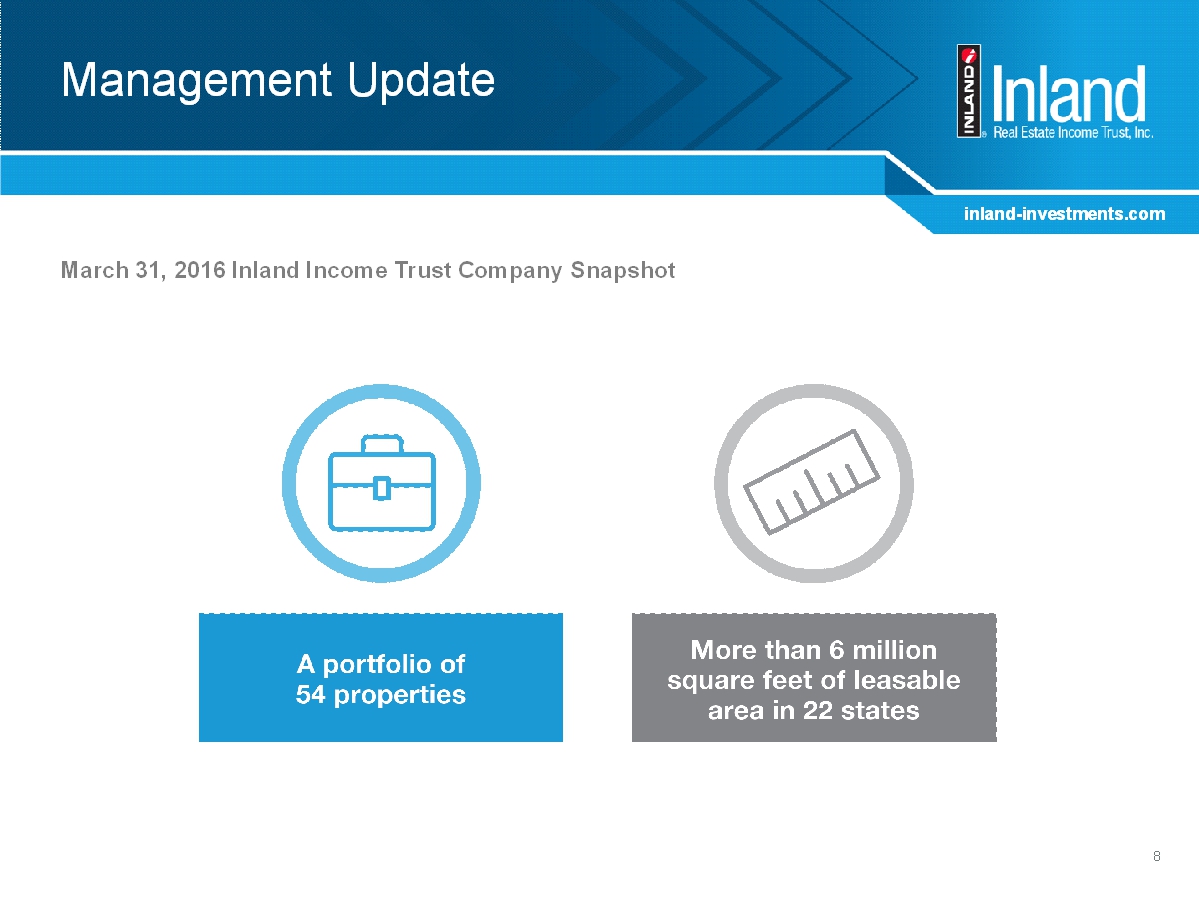
inland-investments.com 8 Management Update March 31, 2016 Inland Income Trust Company Snapshot
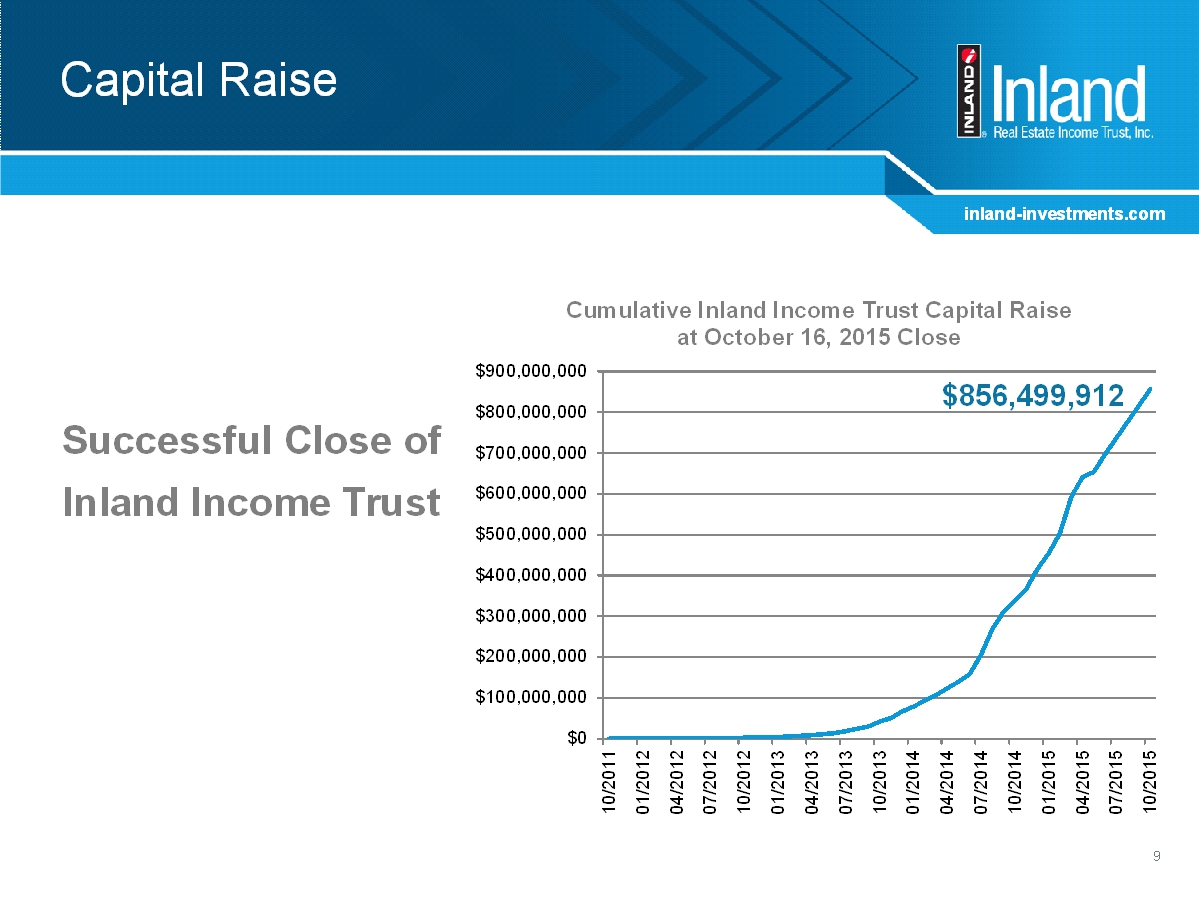
inland-investments.com Capital Raise Successful Close of Inland Income Trust 9 $0 $100,000,000 $200,000,000 $300,000,000 $400,000,000 $500,000,000 $600,000,000 $700,000,000 $800,000,000 $900,000,000 1 0 / 2 0 1 1 0 1 / 2 0 1 2 0 4 / 2 0 1 2 0 7 / 2 0 1 2 1 0 / 2 0 1 2 0 1 / 2 0 1 3 0 4 / 2 0 1 3 0 7 / 2 0 1 3 1 0 / 2 0 1 3 0 1 / 2 0 1 4 0 4 / 2 0 1 4 0 7 / 2 0 1 4 1 0 / 2 0 1 4 0 1 / 2 0 1 5 0 4 / 2 0 1 5 0 7 / 2 0 1 5 1 0 / 2 0 1 5 Cumulative Inland Income Trust Capital Raise at October 16, 2015 Close $856,499,912
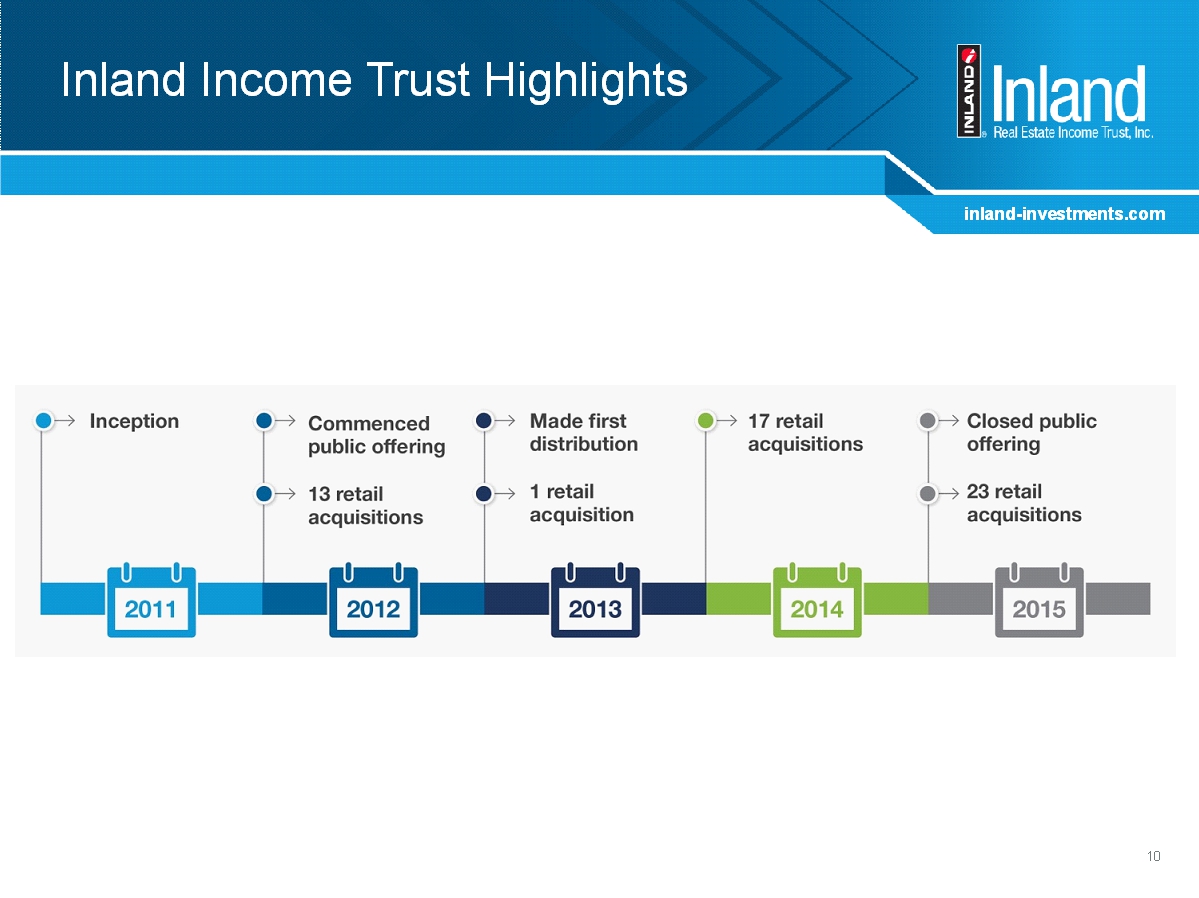
inland-investments.com 10 Inland Income Trust Highlights

inland-investments.com 11 Investment Strategy Focus on acquiring multi-tenant, necessity-based shopping centers
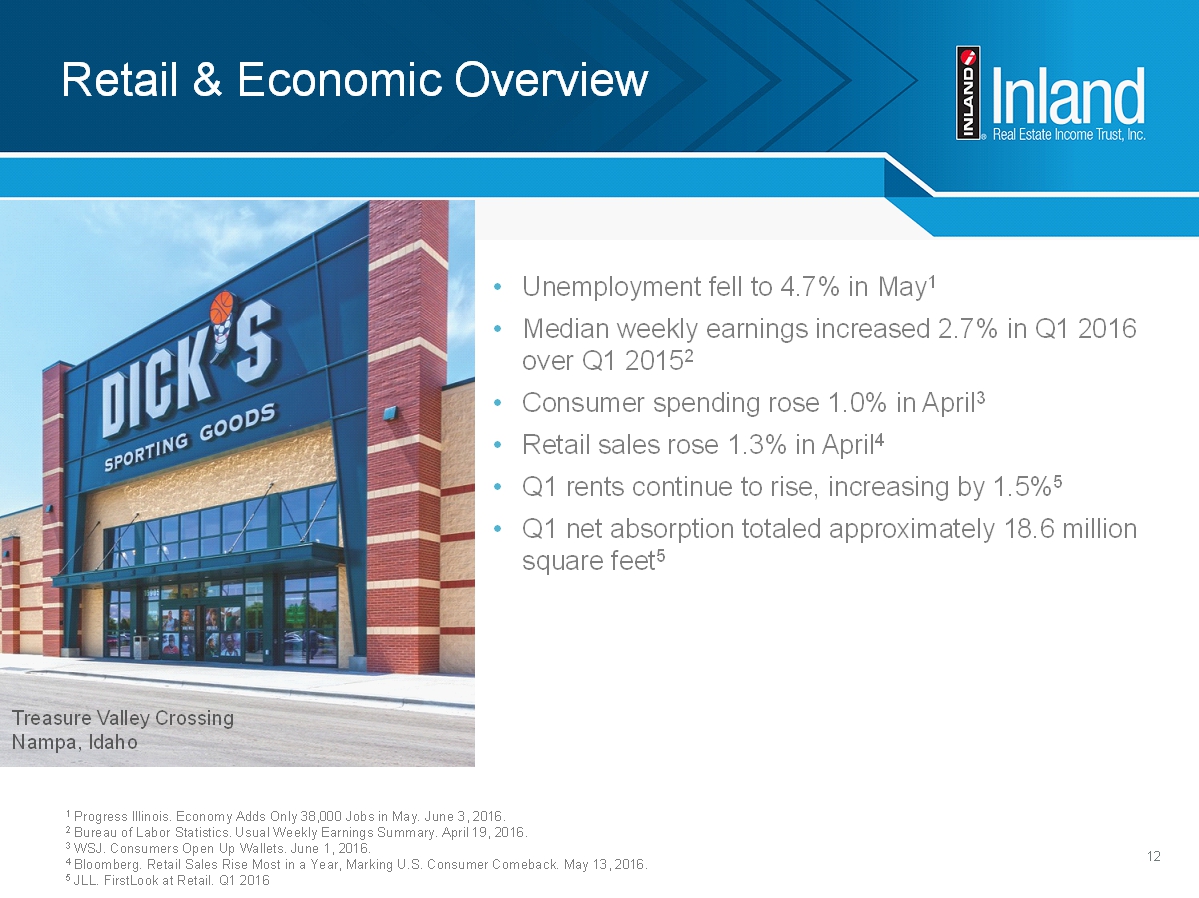
inland-investments.com 12 Retail & Economic Overview • Unemployment fell to 4.7% in May 1 • Median weekly earnings increased 2.7% in Q1 2016 over Q1 2015 2 • Consumer spending rose 1.0% in April 3 • Retail sales rose 1.3% in April 4 • Q1 rents continue to rise, increasing by 1.5% 5 • Q1 net absorption totaled approximately 18.6 million square feet 5 1 Progress Illinois. Economy Adds Only 38,000 Jobs in May. June 3, 2016. 2 Bureau of Labor Statistics. Usual Weekly Earnings Summary. April 19, 2016. 3 WSJ. Consumers Open Up Wallets. June 1, 2016. 4 Bloomberg. Retail Sales Rise Most in a Year, Marking U.S. Consumer Comeback. May 13, 2016. 5 JLL. FirstLook at Retail. Q1 2016 Treasure Valley Crossing Nampa, Idaho
inland-investments.com JoAnn McGuinness President and Chief Operating Officer

inland-investments.com 14 Multi-Tenant Retail Characteristics 1 Statista. Consumers’ weekly grocery shopping trips in the United States from 2006 to 2015 1 Characteristics of a multi-tenant, necessity-based anchored shopping center include:

inland-investments.com 15 Geographic Footprint Our properties are geographically diverse and well-located
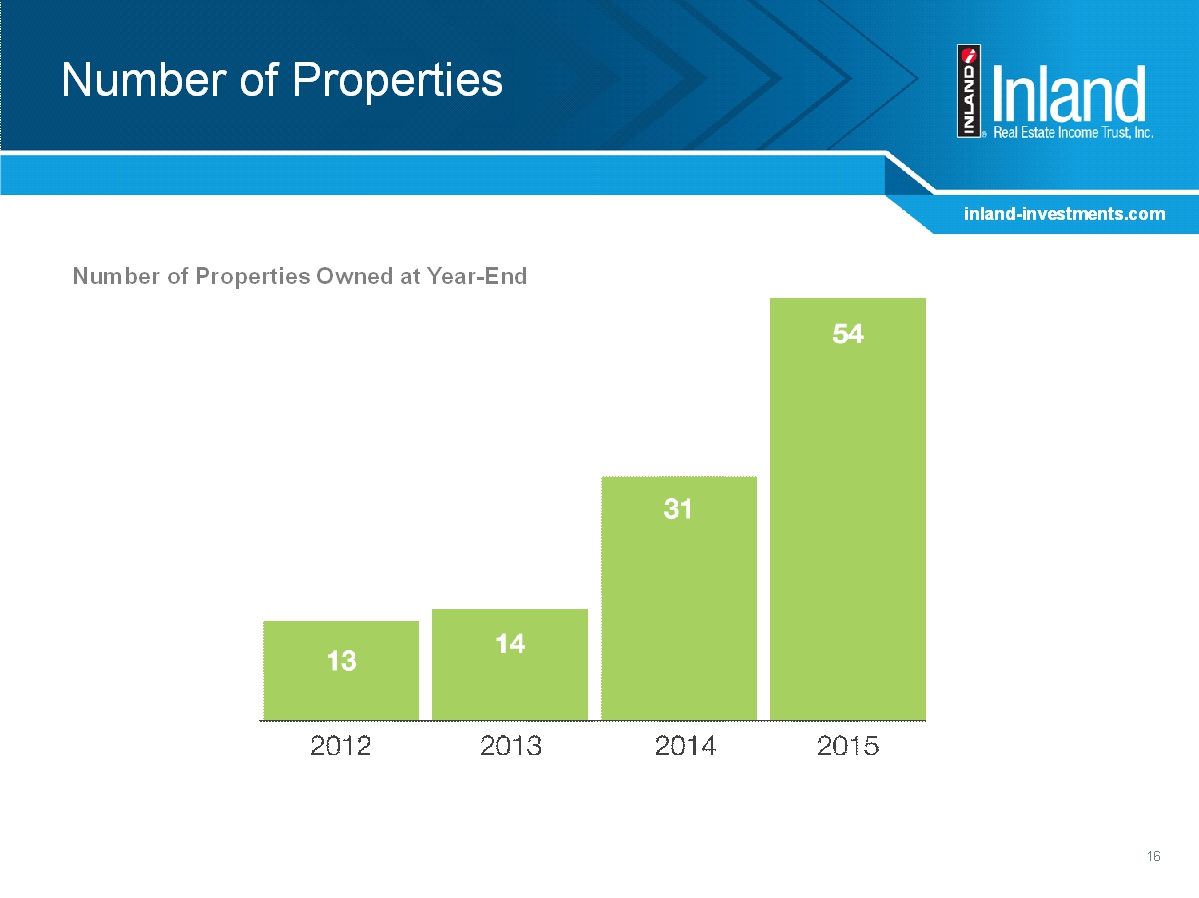
inland-investments.com 16 Number of Properties Number of Properties Owned at Year-End
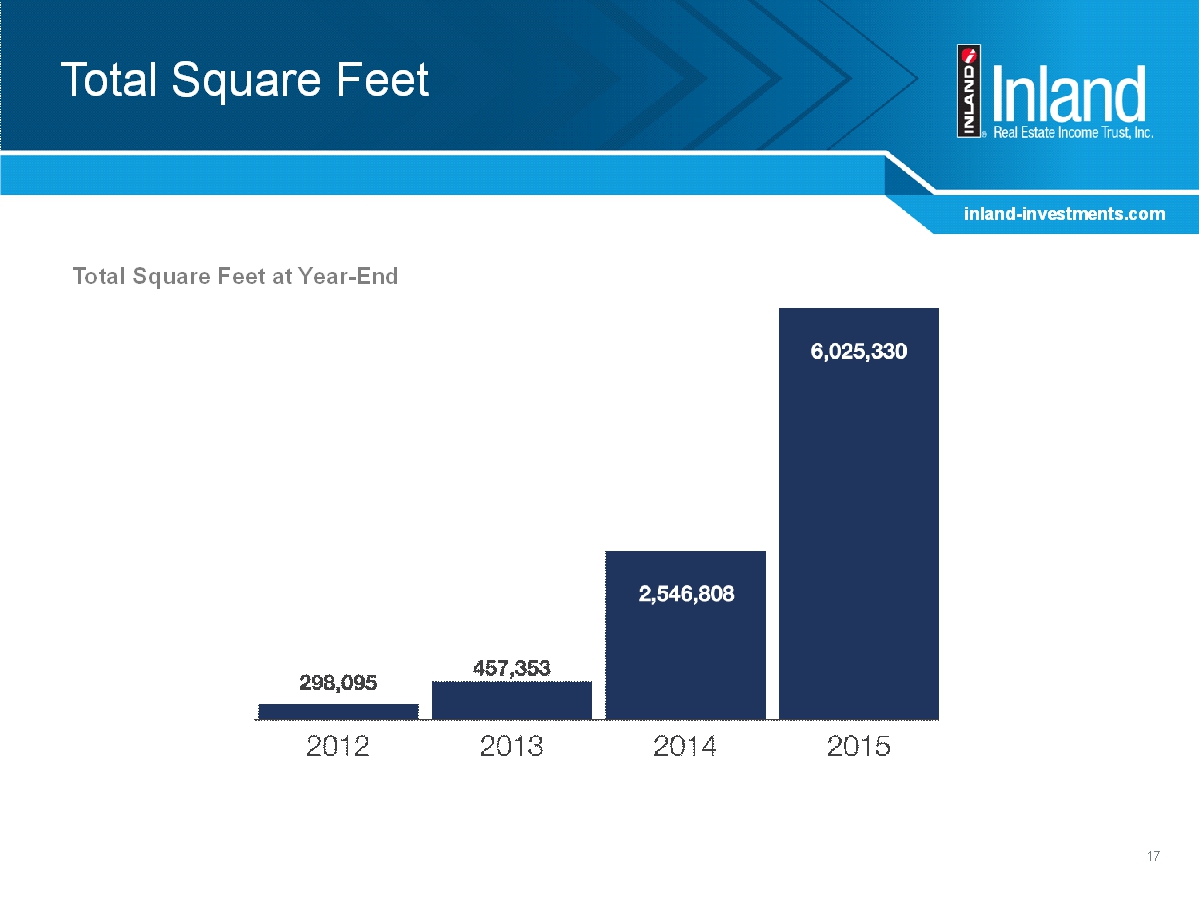
inland-investments.com 17 Total Square Feet Total Square Feet at Year-End
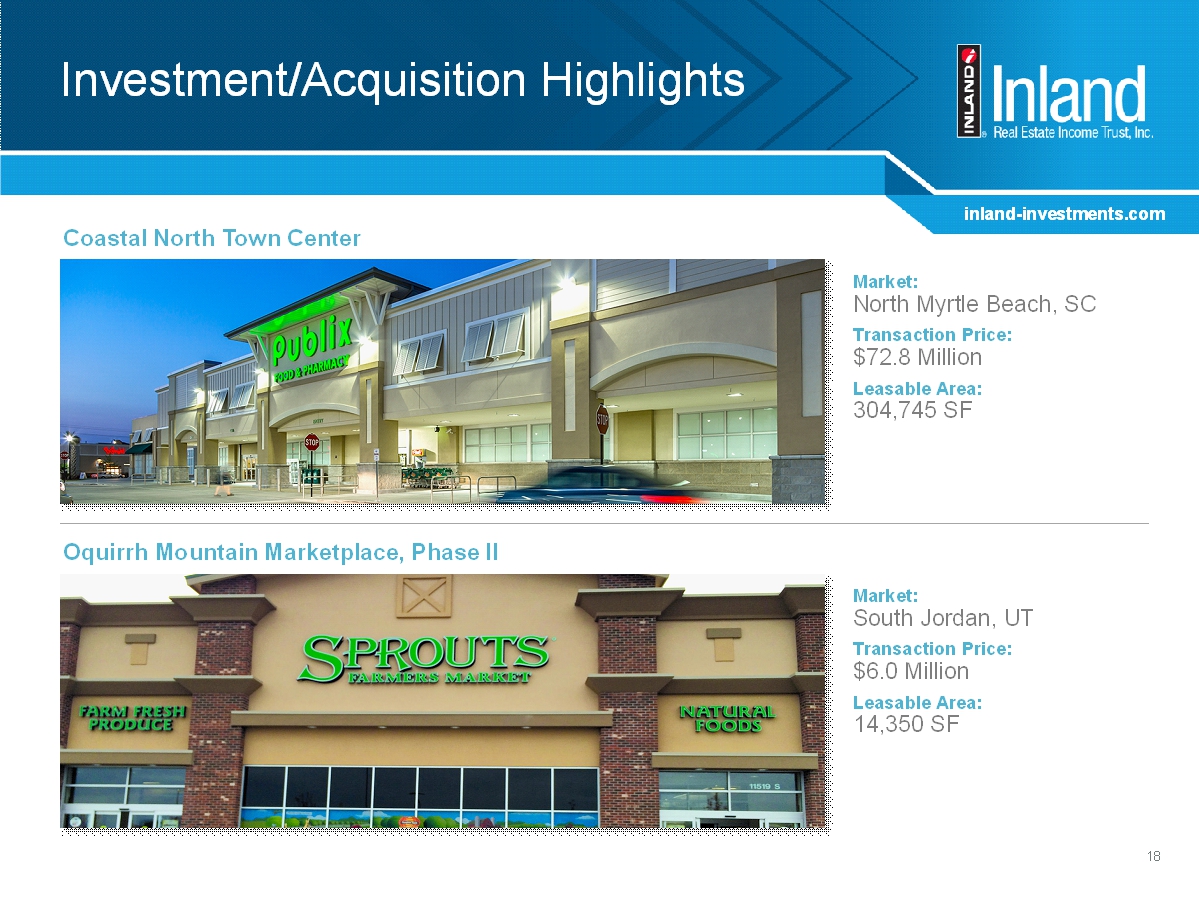
inland-investments.com Investment/Acquisition Highlights 18 Market: North Myrtle Beach, SC Transaction Price: $72.8 Million Leasable Area: 304,745 SF Coastal North Town Center Market: South Jordan, UT Transaction Price: $6.0 Million Leasable Area: 14,350 SF OquirrhMountain Marketplace, Phase II

inland-investments.com Investment/Acquisition Highlights 19 Market: Newport News, VA Transaction Price: $72.5 Million Leasable Area: 210,584 SF Marketplace at Tech Center Market: Kansas City, MO Transaction Price: $35.4 Million Leasable Area: 158,118 SF The Village at Burlington Creek Update photo
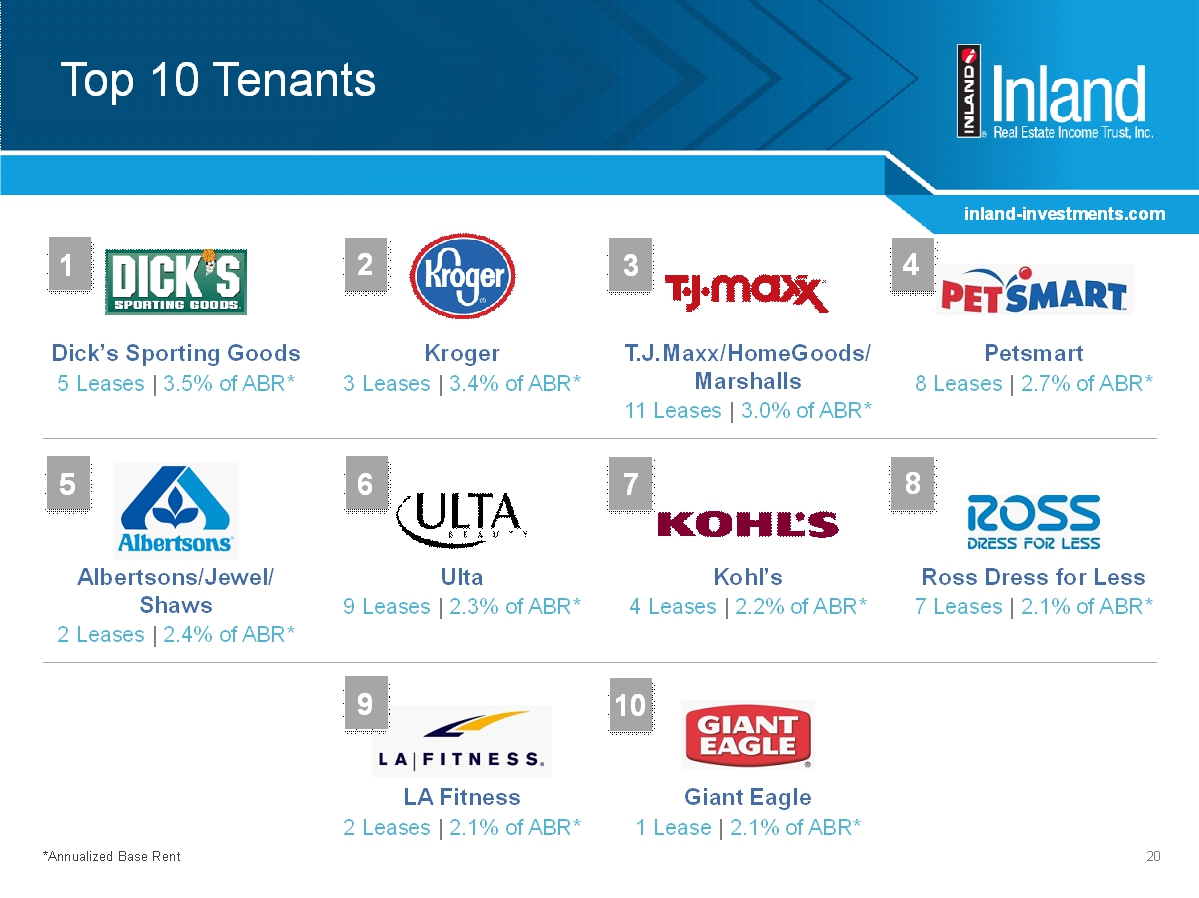
inland-investments.com 20 Top 10 Tenants Dick’s Sporting Goods 5 Leases |3.5% of ABR* Kroger 3 Leases |3.4% of ABR* T.J.Maxx/HomeGoods/ Marshalls 11 Leases |3.0% of ABR* Petsmart 8 Leases |2.7% of ABR* Albertsons/Jewel/ Shaws 2 Leases |2.4% of ABR* Ulta 9 Leases |2.3% of ABR* Kohl’s 4 Leases |2.2% of ABR* Ross Dress for Less 7 Leases |2.1% of ABR* LA Fitness 2 Leases |2.1% of ABR* Giant Eagle 1 Lease |2.1% of ABR* *Annualized Base Rent 1 2 3 4 5 6 7 8 9 10
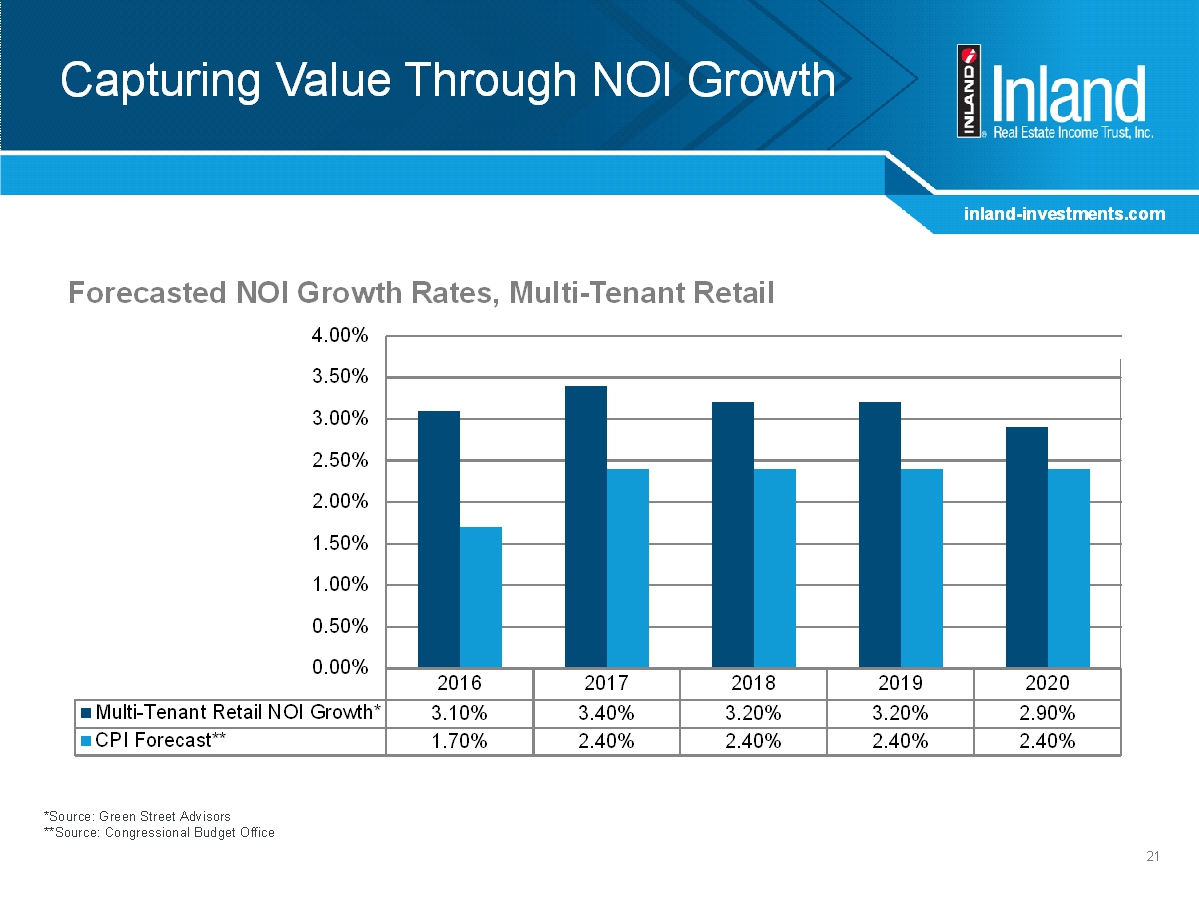
inland-investments.com Capturing Value Through NOI Growth 21 2016 2017 2018 2019 2020 Multi-Tenant Retail NOI Growth* 3.10% 3.40% 3.20% 3.20% 2.90% CPI Forecast** 1.70% 2.40% 2.40% 2.40% 2.40% 0.00% 0.50% 1.00% 1.50% 2.00% 2.50% 3.00% 3.50% 4.00% *Source: Green Street Advisors **Source: Congressional Budget Office Forecasted NOI Growth Rates, Multi-Tenant Retail
inland-investments.com David Lichterman Vice President, Treasurer and Chief Accounting Officer
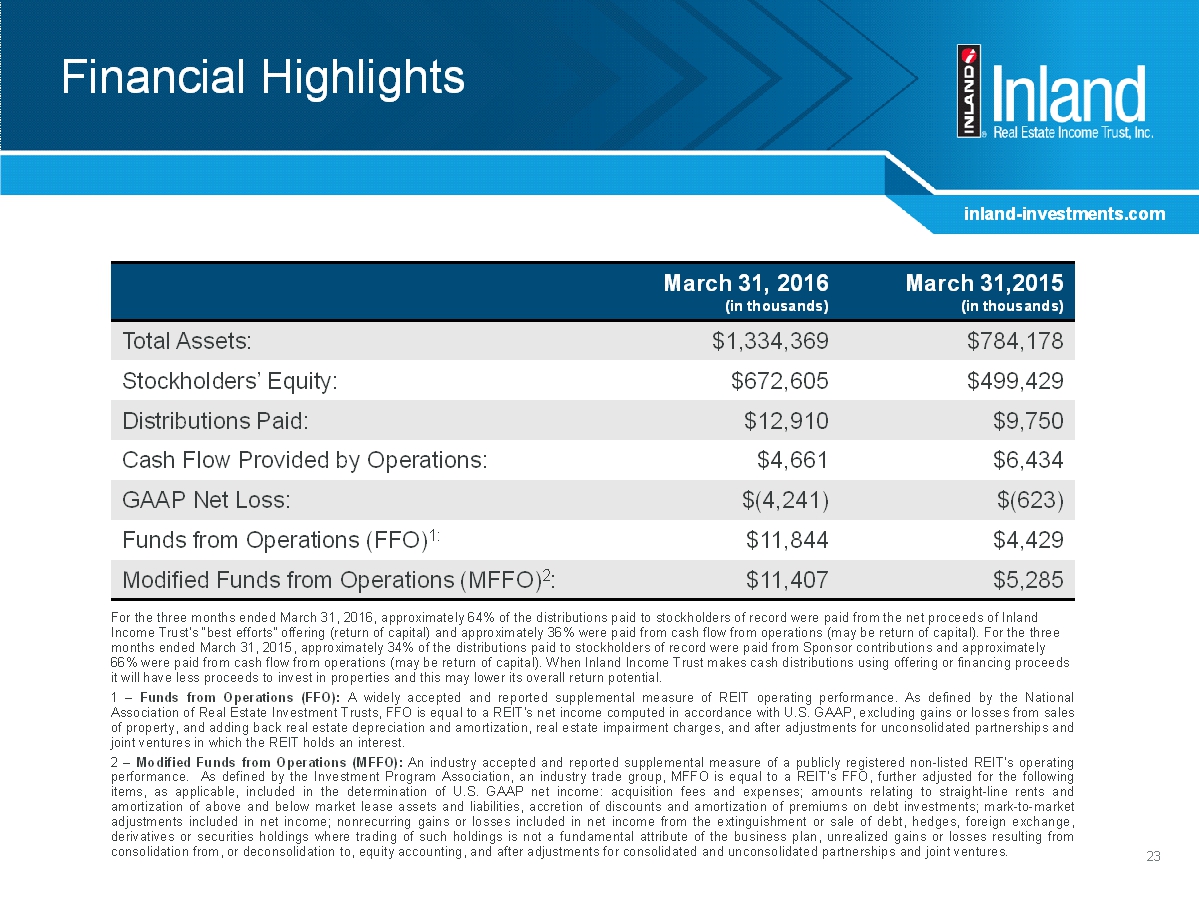
inland-investments.com Financial Highlights March 31, 2016 (in thousands) March 31,2015 (in thousands) Total Assets: $1,334,369 $784,178 Stockholders’ Equity: $672,605 $499,429 Distributions Paid: $12,910 $9,750 Cash Flow Provided by Operations: $4,661 $6,434 GAAP Net Loss: $(4,241) $(623) Funds from Operations(FFO) 1: $11,844 $4,429 Modified Funds from Operations (MFFO) 2 : $11,407 $5,285 For the three months ended March 31, 2016, approximately 64% of the distributions paid to stockholders of record were paid from the net proceeds of Inland Income Trust’s “best efforts” offering (return of capital) and approximately 36% were paid from cash flow from operations (may be return of capital). For the three months ended March 31, 2015, approximately 34% of the distributions paid to stockholders of record were paid from Sponsor contributions and approximately 66% were paid from cash flow from operations (may be return of capital). When Inland Income Trust makes cash distributions usingoffering or financing proceeds it will have less proceeds to invest in properties and this may lower its overall return potential. 1 – Funds from Operations (FFO): A widely accepted and reported supplemental measure of REIT operating performance. As defined by the National AssociationofRealEstateInvestmentTrusts,FFOisequaltoaREIT’snetincomecomputedinaccordancewithU.S.GAAP,excludinggainsorlossesfromsales ofproperty,andaddingbackrealestatedepreciationandamortization,realestateimpairmentcharges,andafteradjustmentsforunconsolidatedpartnershipsand jointventuresinwhichtheREITholdsaninterest. 2–ModifiedFundsfromOperations(MFFO):Anindustryacceptedandreportedsupplementalmeasureofapubliclyregisterednon-listedREIT’soperating performance. AsdefinedbytheInvestmentProgramAssociation,anindustrytradegroup,MFFOisequaltoaREIT’sFFO,furtheradjustedforthefollowing items, as applicable, included in the determination of U.S. GAAP net income: acquisition fees and expenses; amounts relating to straight-line rents and amortizationofaboveandbelowmarketleaseassetsandliabilities,accretionofdiscountsandamortizationofpremiumsondebtinvestments;mark-to-market adjustmentsincludedinnetincome;nonrecurringgainsorlossesincludedinnetincomefromtheextinguishmentorsaleofdebt,hedges,foreignexchange, derivativesorsecuritiesholdingswheretradingofsuchholdingsisnotafundamentalattributeofthebusinessplan,unrealizedgainsorlossesresultingfrom consolidationfrom,ordeconsolidationto,equityaccounting,andafteradjustmentsforconsolidatedandunconsolidatedpartnershipsandjointventures. 23
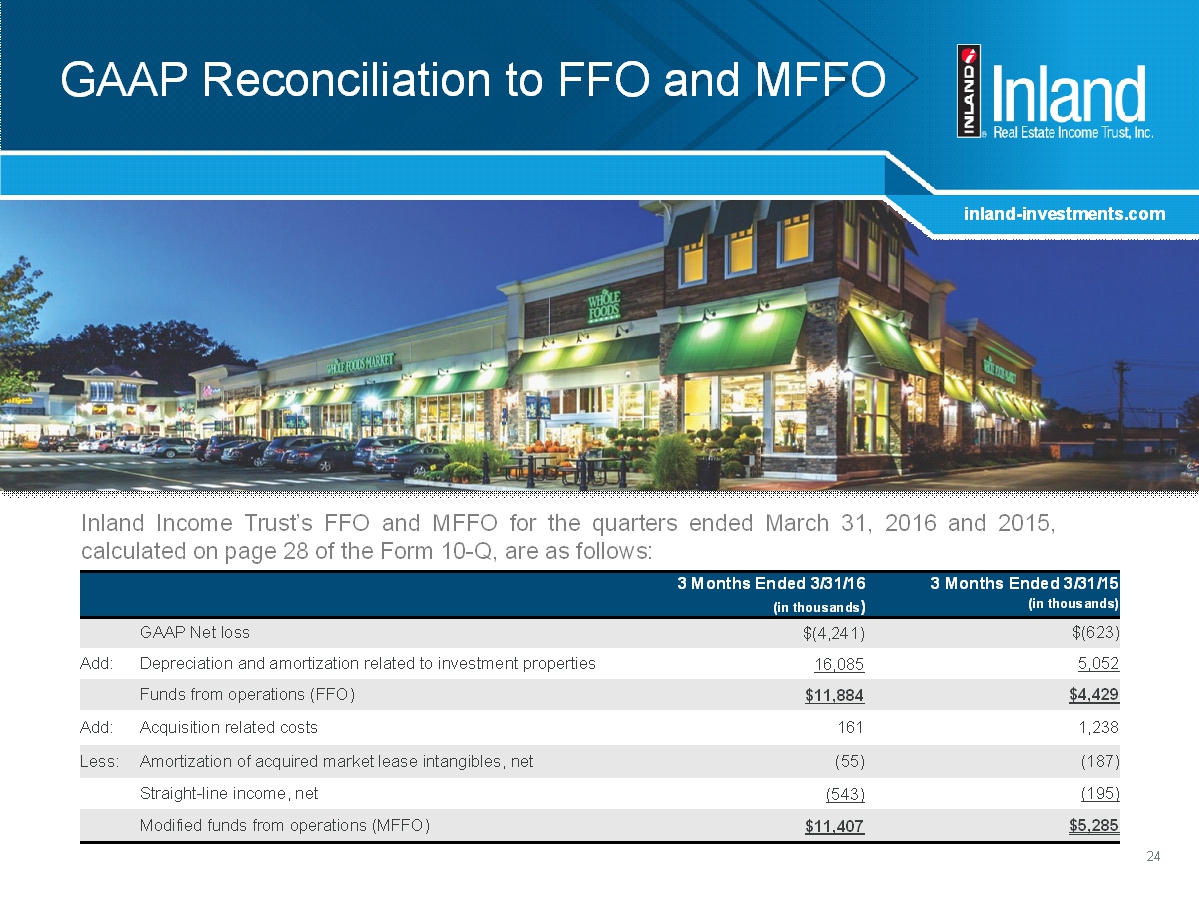
inland-investments.com 24 GAAP Reconciliation to FFO and MFFO inland-investments.com 3 Months Ended 3/31/16 (in thousands) 3 Months Ended 3/31/15 (in thousands) GAAP Net loss $(4,241) $(623) Add: Depreciation and amortization related to investment properties 16,085 5,052 Funds from operations (FFO) $11,884 $4,429 Add: Acquisition related costs 161 1,238 Less: Amortization of acquired market lease intangibles, net (55) (187) Straight-line income, net (543) (195) Modified funds from operations (MFFO) $11,407 $5,285 Inland Income Trust’sFFO and MFFO for the quarters ended March 31, 2016 and 2015, calculatedonpage28oftheForm10-Q,areasfollows:
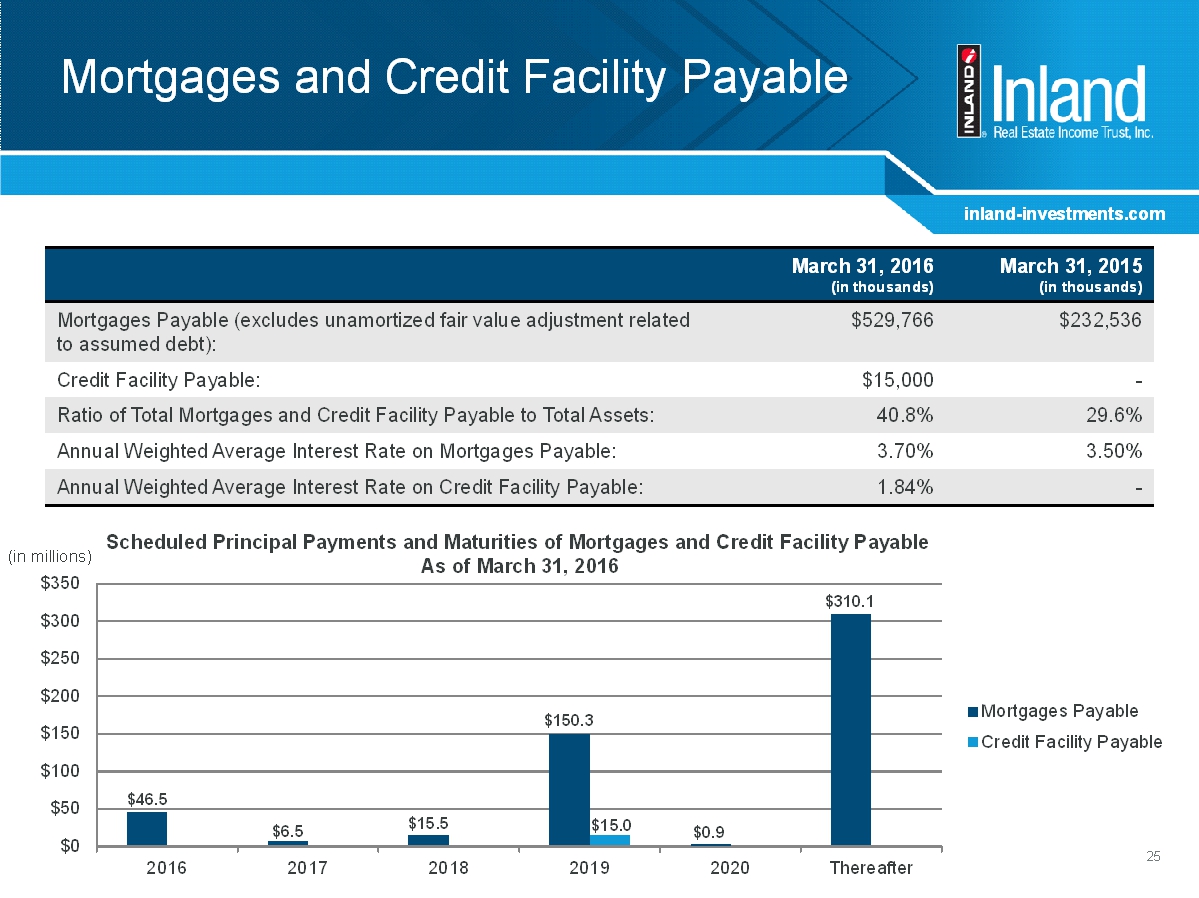
inland-investments.com Mortgages and Credit Facility Payable 25 March 31, 2016 (in thousands) March 31, 2015 (in thousands) Mortgages Payable(excludes unamortized fair value adjustment related to assumed debt): $529,766 $232,536 Credit Facility Payable: $15,000 - Ratio of Total Mortgages and Credit Facility Payable to Total Assets: 40.8% 29.6% Annual Weighted Average Interest Rate on Mortgages Payable: 3.70% 3.50% Annual Weighted Average Interest Rateon Credit Facility Payable: 1.84% - Scheduled Principal Payments and Maturities of Mortgages and Credit Facility Payable As of March 31, 2016 (in millions) $0 $50 $100 $150 $200 $250 $300 $350 2016 2017 2018 2019 2020 Thereafter Mortgages Payable Credit Facility Payable $46.5 $6.5 $15.5 $150.3 $15.0 $0.9 $310.1

inland-investments.com Questions?