Exhibit 99.1
inland - investments.com 1 Inland Real Estate Income Trust, Inc. THIS IS NEITHER AN OFFER TO SELL NOR A SOLICITATION OF AN OFFER TO BUY ANY SECURITY. 2016 Q3 Results Webcast Tuesday, November 29, 2016 • 2:00 pm CT Audio is available via webcast – dial in number not required. i nland - investments.com
inland - investments.com 2 Disclaimer This material is neither an offer to sell nor the solicitation of an offer to buy any security, which can be made only by a prospectus , which has been filed or registered with appropriate state and federal regulatory agencies, and sold only by broker dealers authoriz ed to do so . Past performance is not a guarantee of future results. The companies depicted in the photographs and logos in this presentation are tenants of Inland Real Estate Income Trust, Inc. (I nland Income Trust) and may have proprietary interests in their trademarks and trade names and nothing herein shall be considered a n endorsement, authorization or approval of Inland Income Trust or its subsidiaries. The Inland name and logo are registered trademarks being used under license. This material has been distributed by Inland Securities Corporation, member FINRA/SIPC, dealer manager for Inland Income Trust. Publication Date: 11/29/2016
inland - investments.com 3 Risk Factors Some of the risks related to investing in commercial real estate include, but are not limited to: market risks such as local pro perty supply and demand conditions; tenants’ inability to pay rent; tenant turnover; inflation and other increases in operating cos ts; adverse changes in laws and regulations; relative illiquidity of real estate investments; changing market demographics; acts of God s uch as earthquakes, floods or other uninsured losses; interest rate fluctuations; and availability of financing. An investment in Inland Income Trust’s shares involves significant risks. If Inland Income Trust is unable to effectively man age these risks, it may not meet its investment objectives and investors may lose some or all of their investment. Some of the risks re lat ed to investing in Inland Income Trust include, but are not limited to: the board of directors, rather than the trading market, det erm ines the offering price of shares; there is limited liquidity because shares are not bought and sold on an exchange; repurchase progra ms may be modified or terminated; a typical time horizon for an exit strategy may be longer than five years; there is no guarantee t hat a liquidity event will occur; distributions cannot be guaranteed and may be paid from sources other than cash flow from operati ons , including borrowings and net offering proceeds; and failure to continue to qualify as a REIT and thus being required to pay f ede ral, state and local taxes. Please consult Inland Income Trust’s most recent Annual Report on Form 10 - K and any subsequent Quarterly Reports on Form 10 - Q for more information on the specific risks.
inland - investments.com 4 Forward - Looking Statements In addition to historical information, this webcast contains "forward - looking statements" made under the "safe harbor" provision s of the Private Securities Litigation Reform Act of 1995. The statements may be identified by terminology such as "may," “can,” "would, " “will,” "expect," "intend," "estimate," "anticipate," "plan," "seek," "appear," or "believe." Such statements reflect the current view of Inland Income Trust with respect to future events and are subject to certain risks, uncertainties and assumptions related to certain fa ctors including, without limitation, the uncertainties related to general economic conditions, unforeseen events affecting the real es tate industry or particular markets, and other factors detailed under Risk Factors in our most recent Form 10 - K and subsequent Form 10 - Qs on file with the Securities and Exchange Commission. Although Inland Income Trust believes that the expectations reflected in such forward - looking statements are reasonable, it can give no assurance that such expectations will prove to be correct. You s hould exercise caution when considering forward - looking statements and not place undue reliance on them. Based upon changing conditions, should any one or more of these risks or uncertainties materialize, or should any underlying assumptions prove in cor rect, actual results may vary materially from those described herein. Except as required by federal securities laws, Inland Income Tr ust undertakes no obligation to publicly update or revise any written or oral forward - looking statements, whether as a result of new information, future events, changed circumstances or any other reason after the date of this webcast.

inland - investments.com On Today’s Call 5 Mitchell Sabshon Chief Executive Officer JoAnn McGuinness President and Chief Operating Officer David Lichterman Vice President, Chief Accounting Officer & Treasurer
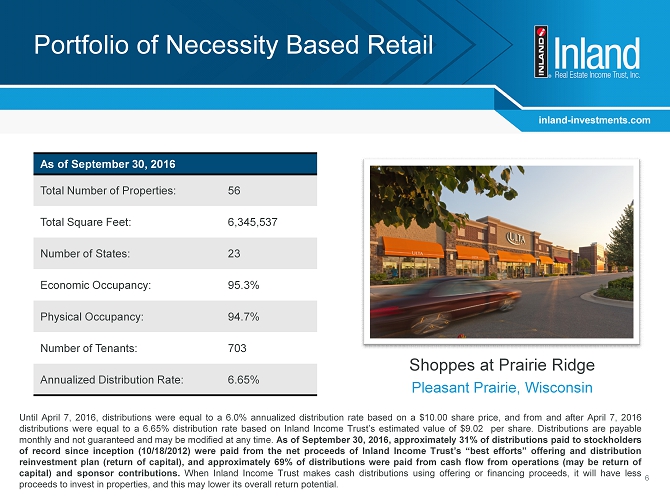
inland - investments.com 6 As of September 30 , 2016 Total Number of Properties: 56 Total Square Feet: 6,345,537 Number of States: 23 Economic Occupancy: 95.3% Physical Occupancy: 94.7% Number of Tenants: 703 Annualized Distribution Rate: 6.65% Until April 7 , 2016 , distributions were equal to a 6 . 0 % annualized distribution rate based on a $ 10 . 00 share price , and from and after April 7 , 2016 distributions were equal to a 6 . 65 % distribution rate based on Inland Income Trust’s estimated value of $ 9 . 02 per share . Distributions are payable monthly and not guaranteed and may be modified at any time . As of September 30 , 2016 , approximately 31 % of distributions paid to stockholders of record since inception ( 10 / 18 / 2012 ) were paid from the net proceeds of Inland Income Trust’s “best efforts” offering and distribution reinvestment plan (return of capital), and approximately 69 % of distributions were paid from cash flow from operations (may be return of capital) and sponsor contributions . When Inland Income Trust makes cash distributions using offering or financing proceeds, it will have less proceeds to invest in properties, and this may lower its overall return potential . Portfolio of Necessity Based Retail Shoppes at Prairie Ridge Pleasant Prairie, Wisconsin
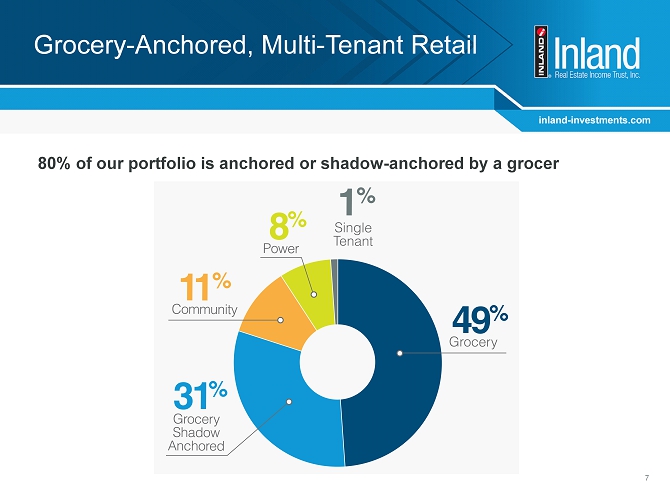
inland - investments.com 7 Grocery - Anchored, Multi - Tenant Retail 80% of our portfolio is anchored or shadow - anchored by a grocer
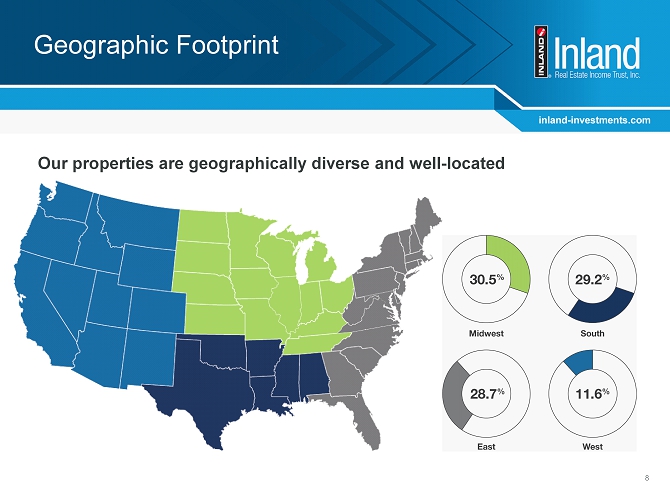
inland - investments.com 8 Geographic Footprint Our properties are geographically diverse and well - located
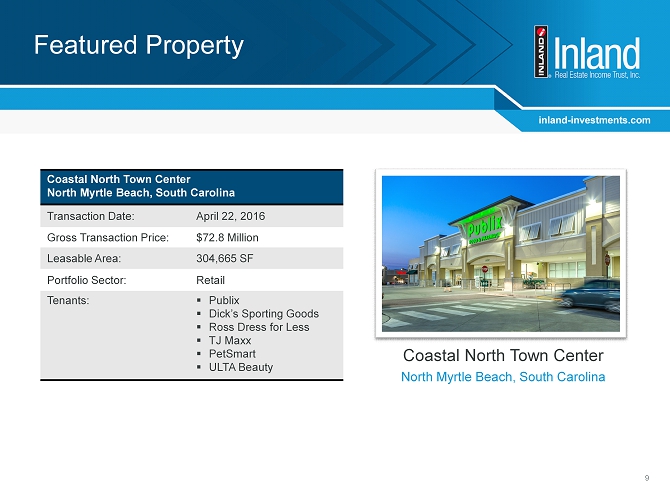
inland - investments.com Featured Property 9 Coastal North Town Center North Myrtle Beach, South Carolina Coastal North Town Center North Myrtle Beach, South Carolina Transaction Date: April 22, 2016 Gross Transaction Price: $72.8 Million Leasable Area: 304,665 SF Portfolio Sector: Retail Tenants: ▪ Publix ▪ Dick’s Sporting Goods ▪ Ross Dress for Less ▪ TJ Maxx ▪ PetSmart ▪ ULTA Beauty
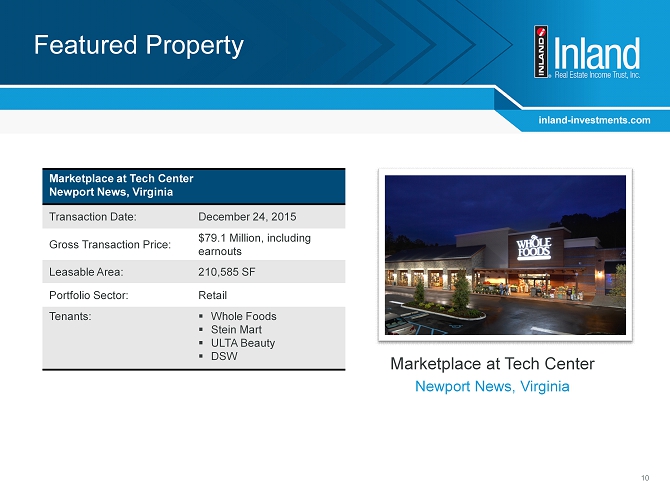
inland - investments.com Featured Property 10 Marketplace at Tech Center Newport News, Virginia Marketplace at Tech Center Newport News, Virginia Transaction Date: December 24, 2015 Gross Transaction Price: $79.1 Million, including earnouts Leasable Area: 210,585 SF Portfolio Sector: Retail Tenants: ▪ Whole Foods ▪ Stein Mart ▪ ULTA Beauty ▪ DSW
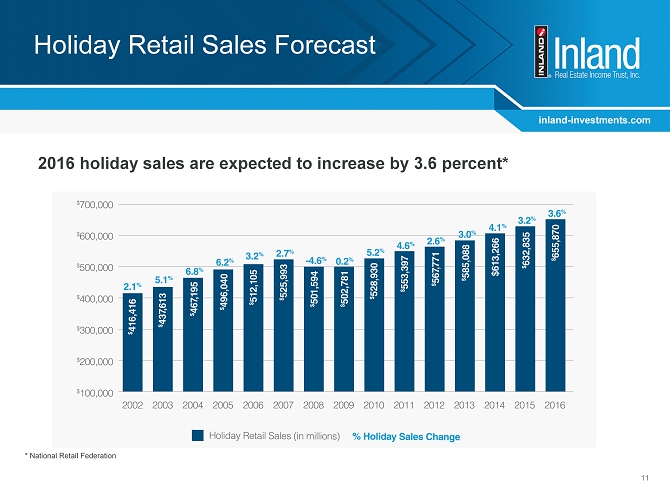
inland - investments.com 11 Holiday Retail Sales Forecast 2016 holiday sales are expected to increase by 3.6 percent* * National Retail Federation
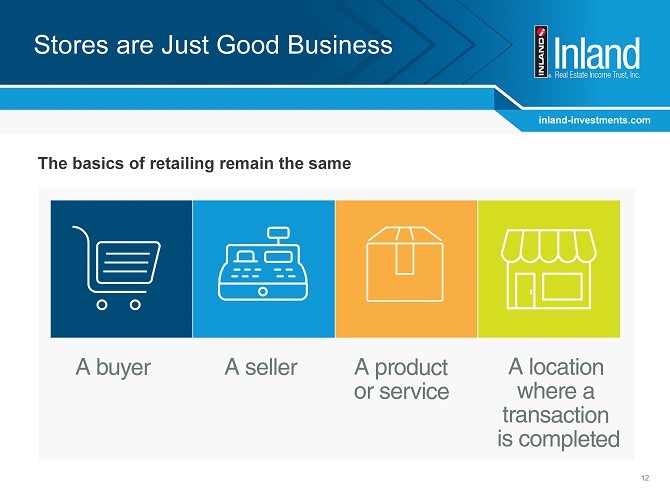
inland - investments.com 12 Stores are Just Good Business The basics of retailing remain the same
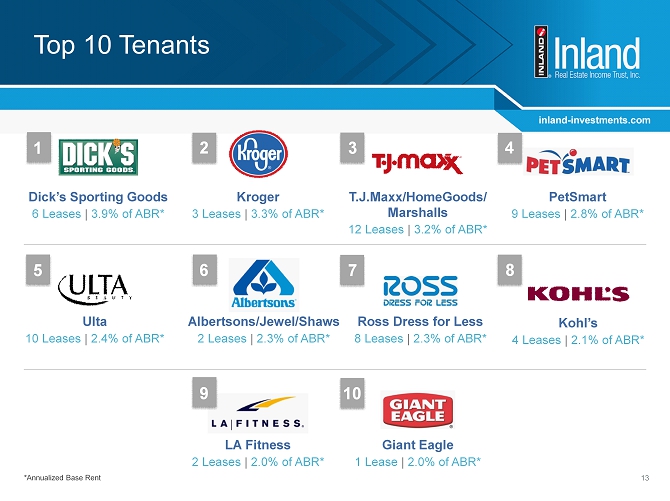
inland - investments.com 13 Top 10 Tenants Dick’s Sporting Goods 6 Leases | 3.9% of ABR* Kroger 3 Leases | 3.3% of ABR* T.J.Maxx/HomeGoods/ Marshalls 12 Leases | 3.2% of ABR* PetSmart 9 Leases | 2.8% of ABR* LA Fitness 2 Leases | 2.0% of ABR* Giant Eagle 1 Lease | 2.0% of ABR* *Annualized Base Rent 1 2 3 4 5 6 7 8 9 10 Ulta 10 Leases | 2.4% of ABR* Albertsons/Jewel/Shaws 2 Leases | 2.3% of ABR* Ross Dress for Less 8 Leases | 2.3% of ABR* Kohl’s 4 Leases | 2.1% of ABR*
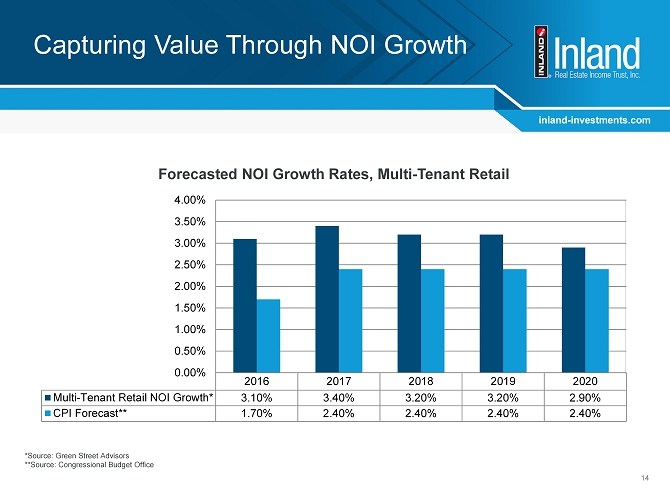
inland - investments.com Capturing Value Through NOI Growth 14 2016 2017 2018 2019 2020 Multi-Tenant Retail NOI Growth* 3.10% 3.40% 3.20% 3.20% 2.90% CPI Forecast** 1.70% 2.40% 2.40% 2.40% 2.40% 0.00% 0.50% 1.00% 1.50% 2.00% 2.50% 3.00% 3.50% 4.00% Forecasted NOI Growth Rates, Multi - Tenant Retail *Source: Green Street Advisors **Source: Congressional Budget Office
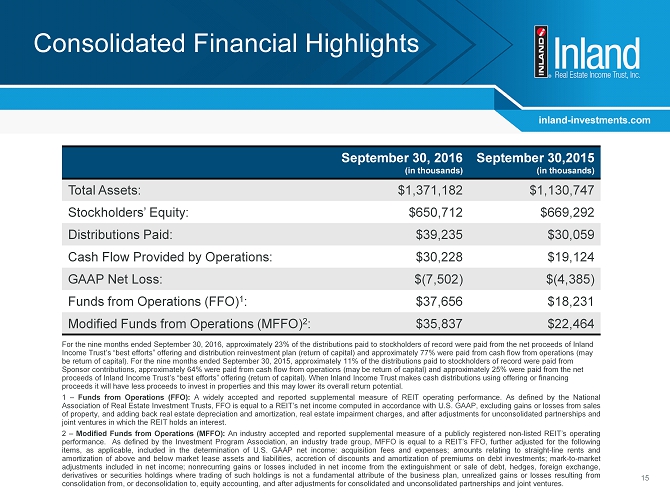
inland - investments.com Consolidated Financial Highlights September 30, 2016 (in thousands) September 30,2015 (in thousands) Total Assets: $1,371,182 $1,130,747 Stockholders’ Equity: $650,712 $669 ,292 Distributions Paid: $39,235 $30,059 Cash Flow Provided by Operations: $30,228 $19,124 GAAP Net Loss : $(7,502) $(4,385 ) Funds from Operations (FFO) 1 : $37,656 $18 ,231 Modified Funds from Operations (MFFO) 2 : $35,837 $22 ,464 For the nine months ended September 30, 2016, approximately 23% of the distributions paid to stockholders of record were paid from the net proceeds of Inland Income Trust’s “best efforts” offering and distribution reinvestment plan (return of capital ) and approximately 77% were paid from cash flow from operations (may be return of capital). For the nine months ended September 30, 2015, approximately 11% of the distributions paid to stockholders of record were paid from Sponsor contributions, approximately 64% were paid from cash flow from operations (may be return of capital ) and approximately 25% were paid from the net proceeds of Inland Income Trust’s “best efforts” offering (return of capital). When Inland Income Trust makes cash distributions using offering or financing proceeds it will have less proceeds to invest in properties and this may lower its overall return potential. 1 – Funds from Operations (FFO) : A widely accepted and reported supplemental measure of REIT operating performance . As defined by the National Association of Real Estate Investment Trusts, FFO is equal to a REIT’s net income computed in accordance with U . S . GAAP, excluding gains or losses from sales of property, and adding back real estate depreciation and amortization, real estate impairment charges, and after adjustments for unconsolidated partnerships and joint ventures in which the REIT holds an interest . 2 – Modified Funds from Operations (MFFO) : An industry accepted and reported supplemental measure of a publicly registered non - listed REIT’s operating performance . As defined by the Investment Program Association, an industry trade group, MFFO is equal to a REIT’s FFO, further adjusted for the following items, as applicable, included in the determination of U . S . GAAP net income : acquisition fees and expenses ; amounts relating to straight - line rents and amortization of above and below market lease assets and liabilities, accretion of discounts and amortization of premiums on debt investments ; mark - to - market adjustments included in net income ; nonrecurring gains or losses included in net income from the extinguishment or sale of debt, hedges, foreign exchange, derivatives or securities holdings where trading of such holdings is not a fundamental attribute of the business plan, unrealized gains or losses resulting from consolidation from, or deconsolidation to, equity accounting, and after adjustments for consolidated and unconsolidated partnerships and joint ventures . 15
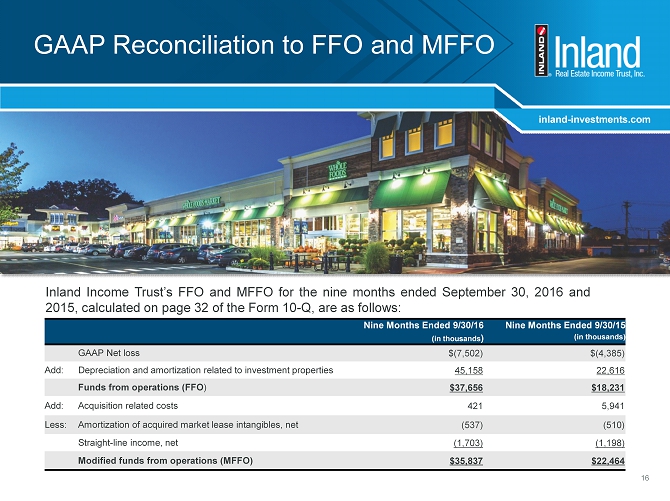
inland - investments.com 16 GAAP Reconciliation to FFO and MFFO inland - investments.com Nine Months Ended 9/30/16 (in thousands ) Nine Months Ended 9/30/15 (in thousands) GAAP Net loss $(7,502) $(4,385) Add: Depreciation and amortization related to investment properties 45,158 22,616 Funds from operations (FFO ) $37,656 $18,231 Add: Acquisition related costs 421 5,941 Less: Amortization of acquired market lease intangibles, net (537) (510) Straight - line income, net (1,703) (1,198) Modified funds from operations (MFFO) $35,837 $22,464 Inland Income Trust’s FFO and MFFO for the nine months ended September 30 , 2016 and 2015 , calculated on page 32 of the Form 10 - Q, are as follows :
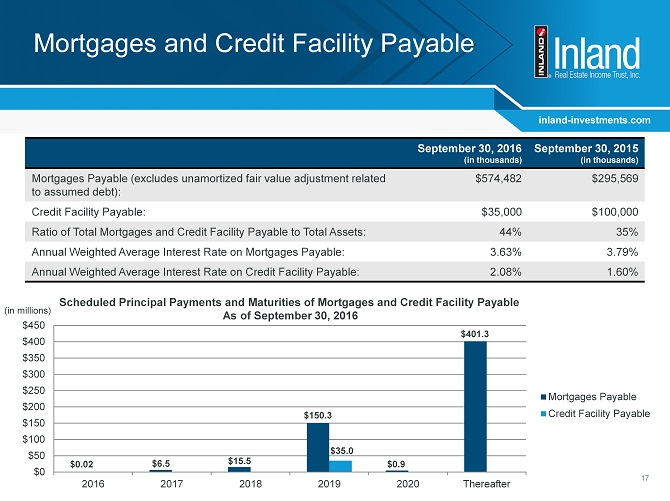
inland - investments.com Mortgages and Credit Facility Payable 17 September 30, 2016 (in thousands) September 30, 2015 (in thousands) Mortgages Payable (excludes unamortized fair value adjustment related to assumed debt) : $574,482 $295,569 Credit Facility Payable: $35,000 $100,000 Ratio of Total Mortgages and Credit Facility Payable to Total Assets: 44% 35% Annual Weighted Average Interest Rate on Mortgages Payable: 3.63% 3.79% Annual Weighted Average Interest Rate on Credit Facility Payable: 2.08% 1.60% Scheduled Principal Payments and Maturities of Mortgages and Credit Facility Payable As of September 30, 2016 (in millions) $0 $50 $100 $150 $200 $250 $300 $350 $400 $450 2016 2017 2018 2019 2020 Thereafter Mortgages Payable Credit Facility Payable $0.02 $6.5 $15.5 $150.3 $35.0 $0.9 $401.3
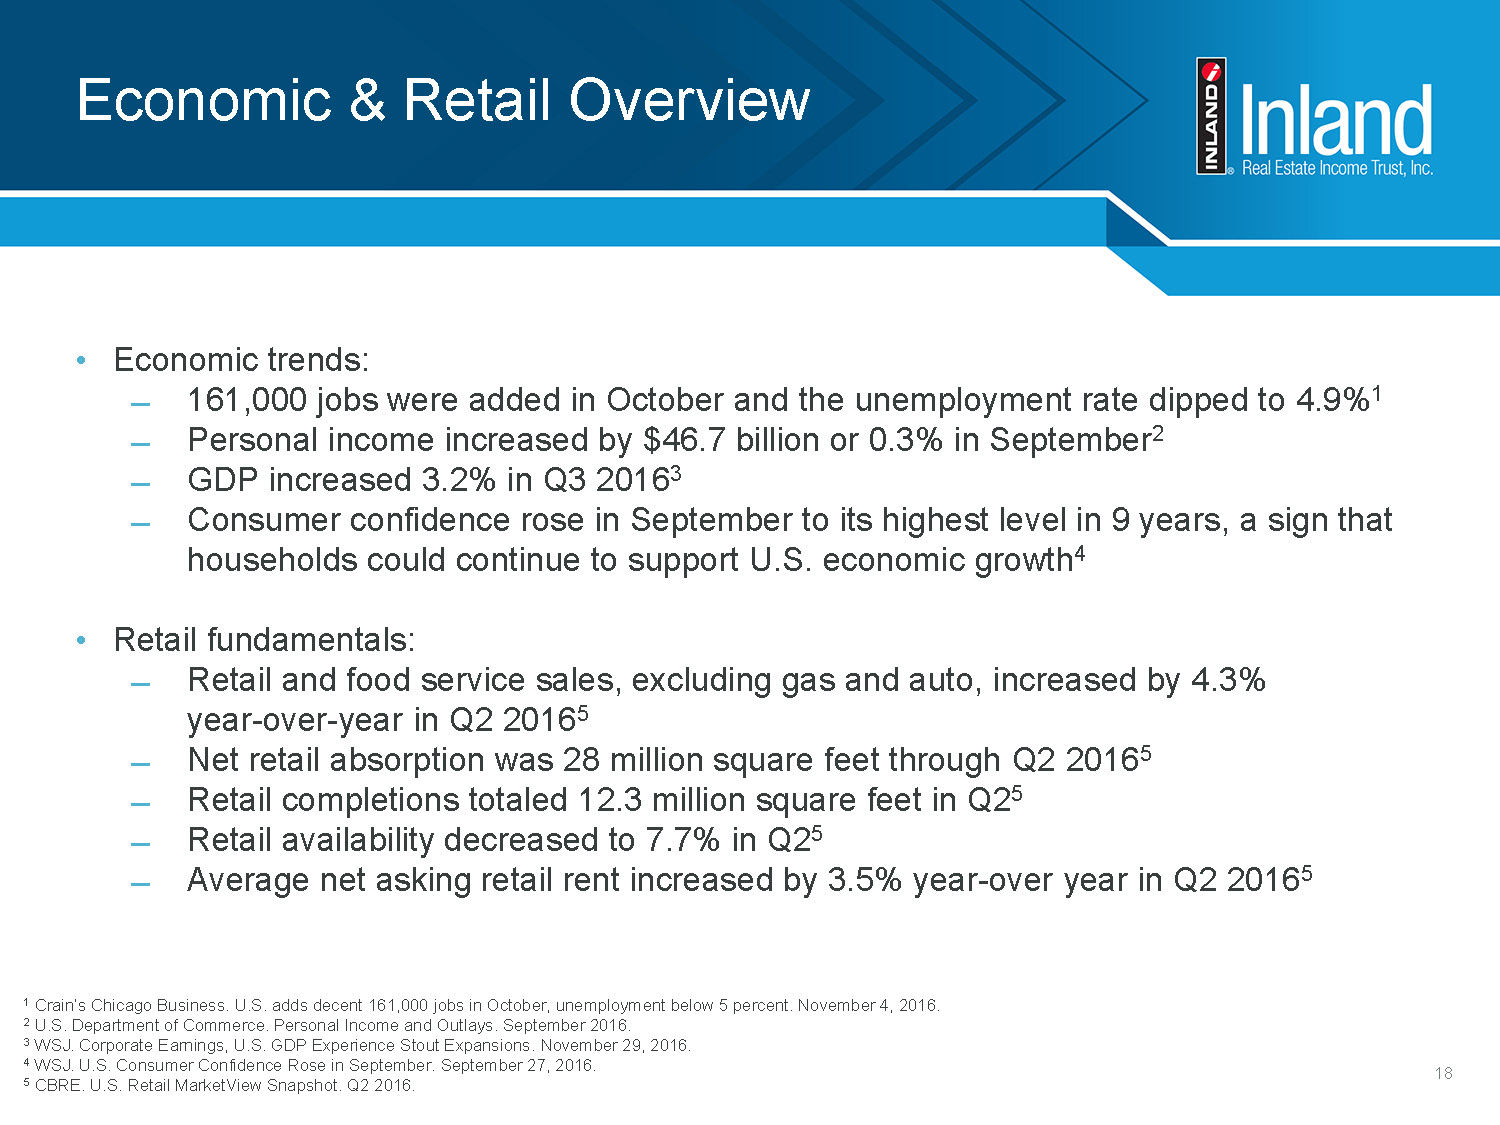
inlantail Overview • Economic trends: ̶ 161,000 jobs were added in October and the unemployment rate dipped to 4.9% 1 ̶ Personal income increased by $46.7 billion or 0.3% in September 2 ̶ GDP increased 2.9% in 2016 Q3 3 ̶ Consumer confidence rose in September to its highest level in 9 years , a sign that househole to support U.S. economic growth 4 • Retail fundamentals: ̶ Retail and food service sales, excluding gas and auto, increased by 4.3% year - over - year in Q2 2016 5 ̶ Net retail absorption was 28 million square feet through Q2 2016 5 ̶ Retail completions totaled 12.3 million square feet in 5 ̶ Retail availability decreased to 7.7% in Q2 5 ̶ Average net asking retail rent increased by 3.5% year - over year in Q2 2016 5 1 Crain’s Chicago Business. U.S. adds decent 161,000 jobs in October, unemployment below 5 percent . November 4, 2016. 2 U.S. Department of Commerce. Personal Income and Outlays. September 2016. 3 U.S. Department of Commerce. National Income and Product Accounts. October 28, 2016. 4 WSJ. U.S. Consumer Confidence Rose in September. September 27, 2016. 5 CBRE. U.S. Retail MarketView Snapshot . Q2 2016.

inland - investments.com Questions?