UNITED STATES
SECURITIES AND EXCHANGE COMMISSION
Washington, D.C. 20549
________
FORM N-CSR
________
CERTIFIED SHAREHOLDER REPORT OF REGISTERED MANAGEMENT
INVESTMENT COMPANIES
Investment Company Act File Number 811-22704
CAMBRIA ETF TRUST
(Exact name of registrant as specified in charter)
________
2321 Rosecrans Avenue
Suite 3225
El Segundo, CA 90245
(Address of principal executive offices) (Zip code)
Corporation Service Company
2711 Centerville Road
Suite 400
Wilmington, DE 19808
(Name and address of agent for service)
With a Copy to:
W. John McGuire
Morgan, Lewis & Bockius LLP
1111 Pennsylvania Avenue, NW
Washington, D.C. 20004
Registrant’s telephone number, including area code: 1-310-683-5500
Date of fiscal year end: April 30, 2018
Date of reporting period: April 30, 2018
Item 1. Reports to Stockholders.
The registrant’s schedules as of the close of the reporting period, as set forth in §§ 210.12-12 through 210.12-14 of Regulation S-X [17 CFR §§ 210-12.12-12.14], are attached hereto.

Cambria Shareholder Yield ETF (SYLD)
Cambria Foreign Shareholder Yield ETF (FYLD)
Cambria Global Value ETF (GVAL)
Cambria Global Momentum ETF (GMOM)
Cambria Global Asset Allocation ETF (GAA)
Cambria Value and Momentum ETF (VAMO)
Cambria Sovereign Bond ETF (SOVB)
Cambria Emerging Shareholder Yield ETF (EYLD)
Cambria Tail Risk ETF (TAIL)
Cambria Core Equity ETF (CCOR)
Annual Report
April 30, 2018
Cambria Investment Management Table of Contents |
Shareholder Letter (Unaudited) | 2 |
Manager’s Discussion and Analysis of Fund Performance (Unaudited) | 9 |
Schedules of Investments | |
Cambria Shareholder Yield ETF | 19 |
Cambria Foreign Shareholder Yield ETF | 23 |
Cambria Global Value ETF | 28 |
Cambria Global Momentum ETF | 34 |
Cambria Global Asset Allocation ETF | 36 |
Cambria Value and Momentum ETF | 38 |
Cambria Sovereign Bond ETF | 42 |
Cambria Emerging Shareholder Yield ETF | 45 |
Cambria Tail Risk ETF | 50 |
Cambria Core Equity ETF | 52 |
Statements of Assets and Liabilities | 55 |
Statements of Operations | 57 |
Statements of Changes in Net Assets | 59 |
Financial Highlights | 64 |
Notes to Financial Statements | 66 |
Report of Independent Registered Public Accounting Firm | 80 |
Disclosure of Fund Expenses (Unaudited) | 81 |
Trustees and Officers of the Cambria ETF Trust (Unaudited) | 83 |
Approval of Advisory Agreements & Board Considerations (Unaudited) | 85 |
Notice to Shareholders (Unaudited) | 88 |
Supplemental Information (Unaudited) | 89 |
Shareholder Voting Results (Unaudited) | 95 |
The Funds file their complete schedules of Fund holdings with the Securities and Exchange Commission (the “Commission”) for the first and third quarters of each fiscal year on Form N-Q within sixty days after the end of the period. The Funds’ Forms N-Q are available on the Commission’s website at http://www.sec.gov, and may be reviewed and copied at the Commission's Public Reference Room in Washington, DC. Information on the operation of the Public Reference Room may be obtained by calling 1-800-SEC-0330.
A description of the policies and procedures that Cambria Investment Management L.P., the Funds’ investment advisor, uses to determine how to vote proxies relating to Fund securities, as well as information relating to how the Funds voted proxies relating to Fund securities during the most recent 12-month period ended June 30, is available (i) without charge, upon request, by calling (855)-383-4636; and (ii) on the Commission’s website at www.sec.gov.
Cambria Investment Management Shareholder Letter (Unaudited) |
Dear Shareholder:
We are pleased to present the following annual report for the Cambria ETF Trust.
The Cambria Shareholder Yield ETF (“SYLD”) seeks to achieve its investment objective by investing, under normal market conditions, primarily in equity securities that provide a high “shareholder yield.” Cambria views equity securities as providing a high shareholder yield if they exhibit strong cash flows, as reflected by their payment of dividends to shareholders and their return of capital to shareholders in other forms, such as through net stock buybacks and net debt paydown. These metrics generally result in the Fund’s portfolio holding value stocks (as opposed to growth stocks).
SYLD launched on May 13, 2013, at $25.00 per share. For the three-month quarter ended April 30, 2018, SYLD posted a loss of 4.84%. For the 12-month period ended April 30, 2018, SYLD gained 13.58%. For the period since inception through April 30, 2018, SYLD posted a cumulative gain of 78.68%.
We believe that the S&P 500 serves as a suitable benchmark for SYLD and, at the end of the Fund’s first complete calendar year; we identified the S&P 500 in the Fund’s prospectus as an appropriate broad-based benchmark for the Fund. The table below shows the performance of the Fund(NAV) vs. its benchmark, the S&P 500, for the three-month, 12-month, and since inception periods ended April 30, 2018.
| | | | vs. Benchmark | |
| | | | SYLD | | | S&P 500 | |
| | Annualized Returns Since Inception | | | 12.40% | | | | 12.51% | |
| | Cumulative Returns Since Inception | | | 78.68% | | | | 79.62% | |
| | 12 Months Ended 4/30/2018 | | | 13.58% | | | | 13.27% | |
| | 3 Months Ended 4/30/2018 | | | -4.84% | | | | -5.77% | |
The Fund’s performance (NAV) as of March 31, 2018 is as follows: 12.58% (1 year), 12.39% (annualized since inception). The Fund’s performance (Market Price) as March 31, 2018 is as follows: 12.61% (1 year), 12.39% (annualized since inception).
The Cambria Foreign Shareholder Yield ETF (“FYLD”) seeks to achieve its investment objective by investing at least 80% of its assets in the components of the Cambria Foreign Shareholder Yield Index, and the Index identifies the 100 issuers in the relevant universe that have exhibited, in the aggregate, the strongest cash flows, the highest dividends paid to shareholders, and net stock buybacks and debt paydown. These metrics generally result in the Fund’s portfolio holding value stocks (as opposed to growth stocks).
FYLD launched on December 2, 2013, at $25.00 per share. For the three-month quarter ended April 30, 2018 FYLD posted a loss of 2.78%. For the 12-month period ended April 30, 2018, FYLD posted a gain of 19.03%. From the Fund’s launch date through April 30, 2018, FYLD posted a cumulative gain of 22.79%.
Cambria Investment Management Shareholder Letter (Unaudited) |
We believe that the MSCI EAFE Index serves as a suitable benchmark for FYLD and, at the end of the Fund’s first complete calendar year, we identified the MSCI EAFE Index in the prospectus as an appropriate broad-based benchmark for the Fund. The table below shows the performance of the Fund(NAV) vs. its benchmark, the MSCI EAFE Index, for the three-month, 12-month, and since inception periods ended April 30, 2018.
| | | | vs. Benchmark | |
| | | | FYLD | | | MSCI EAFE | |
| | Annualized Returns Since Inception | | | 4.76% | | | | 5.22% | |
| | Cumulative Returns Since Inception | | | 22.79% | | | | 25.19% | |
| | 12 Months Ended 4/30/2018 | | | 19.03% | | | | 15.07% | |
| | 3 Months Ended 4/30/2018 | | | -2.78% | | | | -3.88% | |
The Fund’s performance (NAV) as of March 31, 2018 is as follows: 18.44% (1 year), 4.18% (annualized since inception). The Fund’s performance (Market Price) as March 31, 2018 is as follows: 18.68% (1 year), 4.43% (annualized since inception).
The Cambria Global Value ETF (“GVAL”) seeks to achieve its investment objective by investing at least 80% of its assets in the components of the Cambria Global Value Index. The GVAL index is a quantitative, value-oriented stock selection methodology that selects up to 11 countries trading at long-term discount (relative to other countries’ equity markets). Within the selected countries, the model selects stocks trading at the most attractive valuations, i.e., value stocks. Such a strategy will likely underperform when it faces headwinds during growth periods.
GVAL launched on March 11, 2014, at $25.00 per share. For the three-month quarter ended April 30, 2018, GVAL posted a loss of 6.46%. For the 12-month period ended April 30, 2018, GVAL posted a gain of 17.42%. For the period from launch through April 30, 2018, the Fund posted a 14.27% cumulative gain.
We believe that the MSCI ACWI Index serves as a suitable benchmark for GVAL. The table below shows the performance of GVAL(NAV) vs. its benchmark, the MSCI ACWI Index, for the three-month, 12-month, and since inception periods ended April 30, 2018.
| | | | vs. Benchmark | |
| | | | GVAL | | | ACWI | |
| | Annualized Returns Since Inception | | | 3.28% | | | | 8.18% | |
| | Cumulative Returns Since Inception | | | 14.27% | | | | 38.48% | |
| | 12 Months Ended 4/30/2018 | | | 17.42% | | | | 14.77% | |
| | 3 Months Ended 4/30/2018 | | | -6.46% | | | | -5.21% | |
The Fund’s performance (NAV) as of March 31, 2018 is as follows: 21.34% (1 year), 3.39% (annualized since inception). The Fund’s performance (Market Price) as March 31, 2018 is as follows: 21.77% (1 year), 3.59% (annualized since inception).
The Cambria Global Momentum ETF (“GMOM”) launched on November 3, 2014, at $25.00 per share. For the three-month quarter ended April 30, 2018, GMOM posted a loss of 4.86%. For the 12-month period ended April 30, 2018, GMOM posted a gain of 12.97%. From the period from inception through April 30, 2018, GMOM posted a cumulative gain of 17.26%.
Cambria Investment Management Shareholder Letter (Unaudited) |
We believe that a suitable benchmark for GMOM is the S&P Balanced Equity and Bond – Moderate Index (SPBXMI). We believe the “blended” portfolio of US equities and US Treasuries is a suitable benchmark for GMOM because the equity-bond blend is the precursor to most modern asset allocation strategies. This benchmark has long been used by academia and practitioners alike as a measurement for broad asset allocation strategies. The table below shows the performance of GMOM(NAV) vs. its benchmark, SPBXMI, for the three-month, 12-month, and since inception periods ended April 30, 2018.
| | | | vs. Benchmark | |
| | | | GMOM | | | SPBXMI | |
| | Annualized Returns Since Inception | | | 4.67% | | | | 5.79% | |
| | Cumulative Returns Since Inception | | | 17.26% | | | | 21.72% | |
| | 12 Months Ended 4/30/2018 | | | 12.97% | | | | 5.14% | |
| | 3 Months Ended 4/30/2018 | | | -4.86% | | | | -3.48% | |
The Fund’s performance (NAV) as of March 31, 2018 is as follows: 13.99% (1 year), 4.76% (annualized since inception). The Fund’s performance (Market Price) as March 31, 2018 is as follows: 13.89% (1 year), 4.78% (annualized since inception).
The Cambria Global Asset Allocation ETF (“GAA”) launched on December 9, 2014, at $25.00 per share. For the three-month quarter ended April 30, 2018, GAA posted a loss of 2.73%. For the 12-month period ended April 30, 2018, GAA posted a gain of 9.43%. From the Fund’s inception through April 30, 2018, GAA posted a cumulative gain of 19.28%.
We believe that a suitable benchmark for GAA is the S&P Balanced Equity and Bond – Moderate Index (SPBXMI). We believe the “blended” portfolio of US equities and US Treasuries is a suitable benchmark for GAA because the equity-bond blend is the precursor to most modern asset allocation strategies. This benchmark has long been used by academia and practitioners alike as a measurement for broad asset allocation strategies. The table below shows the performance of GAA(NAV) vs. its benchmark, SPBXMI, for the three-month, 12-month, and since inception periods ended April 30, 2018.
| | | | vs. Benchmark | |
| | | | GAA | | | SPBXMI | |
| | Annualized Returns Since Inception | | | 5.33% | | | | 6.05% | |
| | Cumulative Returns Since Inception | | | 19.28% | | | | 22.06% | |
| | 12 Months Ended 4/30/2018 | | | 9.43% | | | | 5.14% | |
| | 3 Months Ended 4/30/2018 | | | -2.73% | | | | -3.48% | |
The Fund’s performance (NAV) as of March 31, 2018 is as follows: 11.24% (1 year), 5.65% (annualized since inception). The Fund’s performance (Market Price) as March 31, 2018 is as follows: 10.87% (1 year), 5.56% (annualized since inception).
Each of GMOM and GAA are designed to provide an investor with a stand-alone, fully diversified investment portfolio. Thus, the performance of each Fund is expected to be moderate under most market conditions, and the performance of each Fund has been in line with Cambria’s expectations. In general, we believe market conditions have been favorable for US and foreign equities. We further believe that US equities may currently be trading at prices that are above their fair valuation — although not in “bubble” territory.
Cambria Investment Management Shareholder Letter (Unaudited) |
Nevertheless, we expect valuations to be a headwind in the years ahead and we appreciate your continuing confidence in us as asset managers.
The Cambria Value and Momentum ETF (“VAMO”) seeks to protect against market fluctuation through the use of a rules-based hedging strategy. VAMO launched on September 8, 2015, at $25.00 per share. For the three-month period ended April 30, 2018, VAMO posted a loss of 1.14%. For the 12-month period ended April 30, 2018, VAMO posted a gain of 6.40%. From the Fund’s inception through April 30, 2018, VAMO posted a cumulative gain of 1.68%.
We believe that the S&P 500 Index serves as a suitable benchmark for VAMO. The table below shows the performance of the Fund(NAV) vs. its benchmark, the S&P 500 Index, for the three-month, 12-month, and since inception periods ended April 30, 2018.
| | | | vs. Benchmark | |
| | | | VAMO | | | S&P 500 | |
| | Annualized Returns Since Inception | | | 0.63% | | | | 14.18% | |
| | Cumulative Returns Since Inception | | | 1.68% | | | | 41.99% | |
| | 12 Months Ended 4/30/2018 | | | 6.40% | | | | 13.27% | |
| | 3 Months Ended 4/30/2018 | | | -1.14% | | | | -5.77% | |
The Fund’s performance (NAV) as of March 31, 2018 is as follows: 5.82% (1 year), 0.07% (annualized since inception). The Fund’s performance (Market Price) as March 31, 2018 is as follows: 5.72% (1 year), 0.13% (annualized since inception).
The Cambria Sovereign Bond ETF (“SOVB”) launched on February 22, 2016, at $25.00 per share. For the three-month period ended April 30, 2018, SOVB posted a loss of 3.16%. For the 12-month period ended April 30, 2018, SOVB posted a gain of 7.56%. Since inception, SOVB posted a cumulative gain of 21.40%.
We believe that the FTSE/Citi World Government Bond Index (“WGBI”) serves as a suitable benchmark for SOVB. The table below shows the performance of the Fund(NAV) vs. WGBI since inception of SOVB through April 30, 2018.
| | | | vs. Benchmark | |
| | | | SOVB | | | WGBI | |
| | Annualized Returns Since Inception | | | 9.27% | | | | 2.32% | |
| | Cumulative Returns Since Inception | | | 21.40% | | | | 5.15% | |
| | 12 Months Ended 4/30/2018 | | | 7.56% | | | | 5.08% | |
| | 3 Months Ended 4/30/2018 | | | -3.16% | | | | -1.06% | |
The Fund’s performance (NAV) as of March 31, 2018 is as follows: 12.05% (1 year), 11.06% (annualized since inception). The Fund’s performance (Market Price) as March 31, 2018 is as follows: 11.31% (1 year), 11.31% (annualized since inception).
Cambria Investment Management Shareholder Letter (Unaudited) |
The Cambria Emerging Shareholder Yield ETF (“EYLD”) seeks to achieve its investment objective by investing at least 80% of its assets in the components of the Cambria Emerging Shareholder Yield Index, and the Index identifies the 100 issuers in the relevant universe that have exhibited, in the aggregate, the strongest cash flows, the highest dividends paid to shareholders, and net stock buybacks and debt paydown. These metrics generally result in the Fund’s portfolio holding value stocks (as opposed to growth stocks).
EYLD launched on July 13, 2016, at $25.00 per share. For the three-month period ended April 30, 2018, EYLD posted a loss of 3.75%. For the 12-month period ended April 30, 2018, EYLD posted a gain of 25.75%. Since inception, EYLD posted a cumulative gain of 49.10%.
For the purpose of this commentary, we are using the MSCI Emerging Markets Index (“EEM”) as a proxy for the benchmark index. The table below shows the performance of the Fund(NAV) vs. EEM since inception of EYLD through April 30, 2018.
| | | | vs. Benchmark | |
| | | | EYLD | | | EEM | |
| | Annualized Returns Since Inception | | | 24.87% | | | | 21.40% | |
| | Cumulative Returns Since Inception | | | 49.10% | | | | 41.69% | |
| | 12 Months Ended 4/30/2018 | | | 25.75% | | | | 22.14% | |
| | 3 Months Ended 4/30/2018 | | | -3.75% | | | | -6.74% | |
The Fund’s performance (NAV) as of March 31, 2018 is as follows: 29.05% (1 year), 27.02% (annualized since inception). The Fund’s performance (Market Price) as March 31, 2018 is as follows: 29.00% (1 year), 28.36% (annualized since inception).
The Cambria Tail Risk ETF (“TAIL”) launched on April 5, 2017, at $25.00 per share. For the three-month period ended April 30, 2018, TAIL posted a loss of 0.61%. For the 12-month period ended April 30, 2018, TAIL posted a loss of 11.74%. Since inception, EYLD posted a cumulative loss of 12.65%.
We believe that the Bloomberg Barclays Short Treasury Index serves as a suitable benchmark for TAIL. The table below shows the performance of the Fund(NAV) vs. its benchmark since inception of TAIL through April 30, 2018.
| | | | vs. Benchmark | |
| | | | TAIL | | | Short Treasury Index | |
| | Annualized Returns Since Inception | | | -11.88% | | | | 1.07% | |
| | Cumulative Returns Since Inception | | | -12.65% | | | | 1.14% | |
| | 12 Months Ended 4/30/2018 | | | -11.74% | | | | 1.09% | |
| | 3 Months Ended 4/30/2018 | | | -0.61% | | | | 0.34% | |
The Fund’s performance (NAV) as of March 31, 2018 is as follows: -9.46% (cumulative since inception). The Fund’s performance (Market Price) as March 31, 2018 is as follows: -9.62% (cumulative since inception).
Cambria Investment Management Shareholder Letter (Unaudited) |
TAIL held US Treasuries and a basket of S&P 500 Index put options. Some of the losses generated by the put position were offset by gains of the Treasury bonds.
The Cambria Core Equity ETF (“CCOR”) launched on May 23, 2017, at $25.00 per share. For the three-month period ended April 30, 2018, CCOR posted a loss of 3.25%. Since inception, CCOR posted a cumulative gain of 0.01%.
We believe that the S&P 500 serves as a suitable benchmark for CCOR. The table below shows the performance of the Fund(NAV) vs. its benchmark, the S&P 500, for the three-month and since inception period ended April 30, 2018.
| | | | vs. Benchmark | |
| | | | CCOR | | | S&P 500 | |
| | Cumulative Returns Since Inception | | | 0.01% | | | | 12.39% | |
| | 3 Months Ended 4/30/2018 | | | -3.25% | | | | -5.77% | |
The Fund’s performance (NAV) as of March 31, 2018 is as follows: 1.47% (cumulative since inception). The Fund’s performance (Market Price) as March 31, 2018 is as follows: 1.55% (cumulative since inception).
Sincerely,

Mebane Faber
Cambria Investment Management Shareholder Letter (Unaudited) |
The performance data quoted represents past performance. Past performance does not guarantee future results. The investment return and principal value of an investment will fluctuate so that an investor's shares, when redeemed, may be worth more or less than their original cost and current performance may be lower or higher than the performance quoted.
Shares are bought and sold at market price (not NAV) and are not individually redeemed from the Fund. Market price returns are based upon the midpoint of the bid/ask spread at the close of the exchange and does not represent the returns an investor would receive if shares were trade at other times. Brokerage commissions will reduce returns. NAVs are calculated using prices as of 4:00 PM Eastern Time. Brokerage commissions will reduce returns.
The information provided represents the opinion of the manager at a specific point in time and is not intended to be a forecast of future events, a guarantee of future events or investment advice.
Indices are unmanaged and do not include the effect of fees. One cannot invest directly in an index.
The S&P 500 Index is a diverse index that includes 500 American companies that represent over 70% of the total market capitalization of the U.S. stock market.
The Cambria Foreign Shareholder Yield Index represents issuers with strong cash flows, highest dividends paid to shareholders, net stock buybacks and net debt paydowns. The initial screening universe for this Index includes issuers in foreign developed countries with marketing capitalizations of at least $200 million. The Index is comprised of the 100 issuers with high rankings across a composite of the aforementioned factors.
The MSCI EAFE Index is a free float-adjusted market capitalization weighted index, designed to measure developed market equity performance excluding the U.S. and Canada, consisting of 21 stock markets in Europe, Australasia, and the Far East.
The Cambria Global Value Index consists of equity securities of issuers that are domiciled in, trade in, or have exposure to a market that is undervalued according to various valuation metrics. The initial screening universe for this Index includes issuers having a market capitalization of at least $200 million.
The MSCI ACWI Index is a free float-adjusted market capitalization weighted index that is designed to measure the equity market performance of developed and emerging markets. The MSCI ACWI consists of 46 country indexes comprising 23 developed and 23 emerging market country indexes.
The S&P Balanced Equity and Bond Index is comprised of three multi-asset class indices, each with a particular risk level. The indices consist of U.S. Treasury Bonds and Equities with the following asset mix proportions: Conservative: 75% Treasuries/ 25% Equities, Moderate: 50% Treasuries/50% Equities, Growth: 25% Treasuries/75% Equities.
Cambria Global Asset Allocation Index is designed to model absolute positive returns with reduced volatility, and manageable risk and drawdowns, by identifying an investable portfolio of equity and fixed income securities, real estate, commodities and currencies.
The FTSE/Citi World Government Bond Index (WGBI) measures the performance of fixed-rate, local currency, investment grade sovereign bonds. The WGBI is a widely used benchmark that currently comprises sovereign debt from over 20 countries, denominated in a variety of currencies, and has more than 25 years of history available. The WGBI provides a broad benchmark for the global sovereign fixed income market. Sub-indices are available in any combination of currency, maturity, or rating.
MSCI Emerging Markets Index is a free-float weighted equity index that captures large and mid-cap representation across Emerging Markets (EM) countries. The index covers approximately 85% of the free float-adjusted market capitalization in each country
The Bloomberg Barclays U.S. Short Treasury Index is composed of zero-coupon Treasury Bills and fixed-rate. Treasury bonds with a maturity between 1 and 12 months. As Treasury bonds and notes fall below one year-to-maturity and exit the U.S. Treasury Index, they become eligible for the Short Treasury Index. Maturity subindices are published in three-month increments: 1-3 month, 3-6 month, 6-9 month, and 9-12 month and can be separated into subindices that only include bills or only include notes that have aged below 1-year.
Cambria Investment Management Manager’s Discussion and Analysis of Fund Performance (Unaudited) |
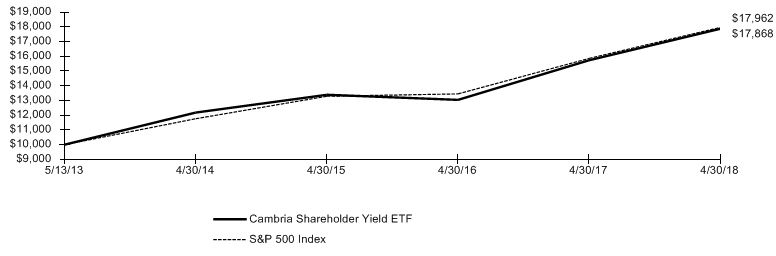
Comparison of Change in the Value of a $10,000 Investment in the Cambria Shareholder Yield ETF versus the S&P 500 Index
The Fund returned 13.58% for the fiscal year ended April 30, 2018. During this 12-month period, the Fund slightly outperformed the S&P 500. Underweight in Consumer Staples, coupled with over-weights in Materials and Industrials contributed to outperformance. Underweight to Technology limited outperformance.
| | AVERAGE ANNUAL TOTAL RETURN FOR THE PERIODS ENDED APRIL 30, 2018 |
| | One Year Return | Since Inception (Annualized)* |
| | Net Asset Value | Market Price | Net Asset Value | Market Price |
Cambria Shareholder Yield ETF | | 13.58% | 13.80% | 12.40% | 12.43% |
S&P 500 Index | | 13.27% | 13.27% | 12.51% | 12.51% |
* Fund inception date is May 13, 2013.
The performance data quoted herein represents past performance and the return and value of an investment in
the Fund will fluctuate so that, when redeemed, may be worth less than its original cost.
Past performance is no guarantee of future performance and should not be considered as a representation of the future
results of the Fund. Current performance may be lower or higher than the performance quoted. For the most recent month-end performance information
please call 855-ETF-INFO (383-4636). As stated in the Fund’s prospectus, the annual fund operating expenses are 0.59%.
Returns shown do not reflect the deduction of taxes that a shareholder would pay on Fund distributions or the redemption of Fund shares.
The Fund’s performance assumes the reinvestment of all dividends and all capital gains.
Index returns assume reinvestment of dividends and, unlike a Fund’s returns, do not reflect any fees
or expenses. If such fees and expenses were included in the index returns, the performance would
have been lower. The index is unmanaged and is not available for investment.
There are no assurances that the Fund will meet its stated objectives.
S&P 500 Index is a market-value weighted index consisting of 500 stocks chosen for market size, liquidity, and industry group representation, with each stock’s weight in the Index proportionate to its market value.
Cambria Investment Management Manager’s Discussion and Analysis of Fund Performance (Unaudited) |
Comparison of Change in the Value of a $10,000 Investment in the Cambria Foreign Shareholder Yield ETF versus the Cambria Foreign Shareholder Yield Index and the MSCI EAFE Index
The Fund returned 19.03% for the fiscal year ended April 30, 2018. During this 12-month period, the Fund outperformed the MSCI EAFE Index. Stock selection in Norway, Canada, and Switzerland made the largest contributions to positive outperformance.
| | AVERAGE ANNUAL TOTAL RETURN FOR THE PERIODS ENDED APRIL 30, 2018 |
| | One Year Return | Since Inception (Annualized)* |
| | Net Asset Value | Market Price | Net Asset Value | Market Price |
Cambria Foreign Shareholder Yield ETF | | 19.03% | 18.84% | 4.76% | 4.81% |
Cambria Foreign Shareholder Yield Index | | 20.11% | 20.11% | 5.30% | 5.30% |
MSCI EAFE Index | | 15.07% | 15.07% | 5.22% | 5.22% |
* Fund inception date is December 2, 2013.
The performance data quoted herein represents past performance and the return and value of an investment in
the Fund will fluctuate so that, when redeemed, may be worth less than its original cost.
Past performance is no guarantee of future performance and should not be considered as a representation of the future
results of the Fund. Current performance may be lower or higher than the performance quoted. For the most recent month-end performance information
please call 855-ETF-INFO (383-4636). As stated in the Fund’s prospectus, the annual fund operating expenses are 0.59%.
Returns shown do not reflect the deduction of taxes that a shareholder would pay on Fund distributions or the redemption of Fund shares.
The Fund’s performance assumes the reinvestment of all dividends and all capital gains.
Index returns assume reinvestment of dividends and, unlike a Fund’s returns, do not reflect any fees
or expenses. If such fees and expenses were included in the index returns, the performance would
have been lower. The indexes are unmanaged and are not available for investment.
There are no assurances that the Fund will meet its stated objectives.
Cambria Foreign Shareholder Yield Index represents issuers with strong cash flows, highest dividends paid to shareholders, net stock buybacks and net debt paydowns. The initial screening universe for this Index includes issuers in foreign developed countries with marketing capitalizations of at least $200 million. The Index is comprised of the 100 issuers with high rankings across a composite of the aforementioned factors.
MSCI EAFE Index (Europe, Australasia, Far East) is a free float-adjusted market capitalization index that is designed to measure the equity market performance of developed markets, excluding the US & Canada. The MSCI EAFE Index consists of the following 21 developed market country indexes: Australia, Austria, Belgium, Denmark, Finland, France, Germany, Hong Kong, Ireland, Israel, Italy, Japan, the Netherlands, New Zealand, Norway, Portugal, Singapore, Spain, Sweden, Switzerland, and the United Kingdom.
Cambria Investment Management Manager’s Discussion and Analysis of Fund Performance (Unaudited) |
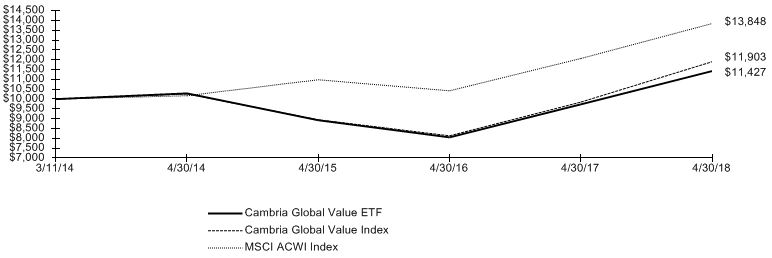
Comparison of Change in the Value of a $10,000 Investment in the Cambria Global Value ETF versus the Cambria Global Value Index and the MSCI ACWI Index
The Fund returned 17.42% for the fiscal year ended April 30, 2018. During this 12-month period, the Fund outperformed the MSCI ACWI Index. Significant over-weights in Norway, Japan, Canada, and the United Kingdom led the outperformance.
| | AVERAGE ANNUAL TOTAL RETURN FOR THE PERIODS ENDED APRIL 30, 2018 |
| | One Year Return | Since Inception (Annualized)* |
| | Net Asset Value | Market Price | Net Asset Value | Market Price |
Cambria Global Value ETF | | 17.42% | 16.56% | 3.28% | 3.25% |
Cambria Global Value Index | | 20.89% | 20.89% | 4.30% | 4.30% |
MSCI ACWI Index | | 14.77% | 14.77% | 8.18% | 8.18% |
* Fund inception date is March 11, 2014.
The performance data quoted herein represents past performance and the return and value of an investment in
the Fund will fluctuate so that, when redeemed, may be worth less than its original cost.
Past performance is no guarantee of future performance and should not be considered as a representation of the future
results of the Fund. Current performance may be lower or higher than the performance quoted. For the most recent month-end performance information
please call 855-ETF-INFO (383-4636). As stated in the Fund’s prospectus, the annual fund operating expenses are 0.68%.
Returns shown do not reflect the deduction of taxes that a shareholder would pay on Fund distributions or the redemption of Fund shares.
The Fund’s performance assumes the reinvestment of all dividends and all capital gains.
Index returns assume reinvestment of dividends and, unlike a Fund’s returns, do not reflect any fees
or expenses. If such fees and expenses were included in the index returns, the performance would
have been lower. The indexes are unmanaged and are not available for investment.
There are no assurances that the Fund will meet its stated objectives.
Cambria Global Value Index consists of equity securities of issuers that are domiciled in, trade in, or have exposure to a market that is undervalued according to various valuation metrics. The initial screening universe for this Index includes issuers having a market capitalization of at least $200 million.
MSCI ACWI (All Country World Index) is a free float-adjusted market capitalization weighted index that is designed to measure the equity market performance of developed and emerging markets. The MSCI ACWI consists of 45 country indices comprising 24 developed and 21 emerging market country indices. The developed market country indices included are: Australia, Austria, Belgium, Canada, Denmark, Finland, France, Germany, Greece, Hong Kong, Ireland, Israel, Italy, Japan, Netherlands, New Zealand, Norway, Portugal, Singapore, Spain, Sweden, Switzerland, the United Kingdom and the United States. The emerging market country indices included are: Brazil, Chile, China, Colombia, Czech Republic, Egypt, Hungary, India, Indonesia, Korea, Malaysia, Mexico, Morocco, Peru, Philippines, Poland, Russia, South Africa, Taiwan, Thailand, and Turkey.
Cambria Investment Management Manager’s Discussion and Analysis of Fund Performance (Unaudited) |
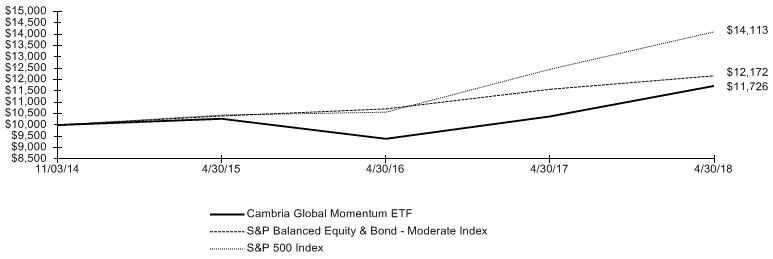
Comparison of Change in the Value of a $10,000 Investment in the Cambria Global Momentum ETF versus the S&P Balanced Equity & Bond – Moderate Index and the S&P 500 Index
The Fund returned 12.97% for the fiscal year ended April 30, 2018. During this 12-month period, the Fund outperformed the S&P Balanced Equity and Bond – Moderate Index (SPBXMI). Allocations to Global Technology, Developed ex-US, and Emerging Markets stocks, aided by allocation to Mortgage and Real Estate, contributed to outperformance.
| | AVERAGE ANNUAL TOTAL RETURN FOR THE PERIODS ENDED APRIL 30, 2018 |
| | One Year Return | Since Inception (Annualized)* |
| | Net Asset Value | Market Price | Net Asset Value | Market Price |
Cambria Global Momentum ETF | | 12.97% | 13.23% | 4.67% | 4.69% |
S&P Balanced Equity & Bond – Moderate Index | | 5.14% | 5.14% | 5.79% | 5.79% |
S&P 500 Index | | 13.27% | 13.27% | 10.37% | 10.37% |
* Fund inception date is November 3, 2014.
The performance data quoted herein represents past performance and the return and value of an investment in
the Fund will fluctuate so that, when redeemed, may be worth less than its original cost.
Past performance is no guarantee of future performance and should not be considered as a representation of the future
results of the Fund. Current performance may be lower or higher than the performance quoted. For the most recent month-end performance information
please call 855-ETF-INFO (383-4636). As stated in the Fund’s prospectus, the annual fund operating expenses are 1.03%.
Returns shown do not reflect the deduction of taxes that a shareholder would pay on Fund distributions or the redemption of Fund shares.
The Fund’s performance assumes the reinvestment of all dividends and all capital gains.
Index returns assume reinvestment of dividends and, unlike a Fund’s returns, do not reflect any fees
or expenses. If such fees and expenses were included in the index returns, the performance would
have been lower. The index is unmanaged and is not available for investment.
There are no assurances that the Fund will meet its stated objectives.
S&P Balanced Equity & Bond – Moderate Index the S&P 500 Balanced Equity & Bond – Moderate Index combines investable S&P indices for core equity and fixed income to provide a regularly rebalanced multi-asset measure for moderate risk-reward profiles The construction of the index consists of a position in the S&P 500 Total Return Index with 50% weight, and a position in the S&P U.S. Treasury Bond 7-10 Year Index with 50% weight.
Cambria Investment Management Manager’s Discussion and Analysis of Fund Performance (Unaudited) |
Comparison of Change in the Value of a $10,000 Investment in the Cambria Global Asset Allocation ETF versus the Cambria Global Asset Allocation Index, S&P Balanced Equity Bond – Moderate Index and the S&P 500 Index
The Fund returned 9.43% for the fiscal year ended April 30, 2018. During this 12-month period, the Fund outperformed the S&P Balanced Equity and Bond – Moderate Index (SPBXMI). Momentum-based US equity and Global equity strategies contributed to outperformance; whereas REITs and long-dated US Treasuries detracted from performance.
| | AVERAGE ANNUAL TOTAL RETURN FOR THE PERIODS ENDED APRIL 30, 2018 |
| | One Year Return | Since Inception (Annualized)* |
| | Net Asset Value | Market Price | Net Asset Value | Market Price |
Cambria Global Asset Allocation ETF | | 9.43% | 9.26% | 5.33% | 5.29% |
Cambria Global Asset Allocation Index | | 8.64% | 8.64% | 3.59% | 3.59% |
S&P Balanced Equity & Bond – Moderate Index | | 5.14% | 5.14% | 6.05% | 6.05% |
S&P 500 Index | | 13.27% | 13.27% | 9.93% | 9.93% |
* Fund inception date is December 9, 2014.
The performance data quoted herein represents past performance and the return and value of an investment in
the Fund will fluctuate so that, when redeemed, may be worth less than its original cost.
Past performance is no guarantee of future performance and should not be considered as a representation of the future
results of the Fund. Current performance may be lower or higher than the performance quoted. For the most recent month-end performance information
please call 855-ETF-INFO (383-4636). As stated in the Fund’s prospectus, the annual fund operating expenses are 0.30%.
Returns shown do not reflect the deduction of taxes that a shareholder would pay on Fund distributions or the redemption of Fund shares.
The Fund’s performance assumes the reinvestment of all dividends and all capital gains.
Index returns assume reinvestment of dividends and, unlike a Fund’s returns, do not reflect any fees
or expenses. If such fees and expenses were included in the index returns, the performance would
have been lower. The indexes are unmanaged and are not available for investment.
There are no assurances that the Fund will meet its stated objectives.
Cambria Global Asset Allocation Index is designed to model absolute positive returns with reduced volatility, and manageable risk and drawdowns, by identifying an investable portfolio of equity and fixed income securities, real estate, commodities and currencies.
S&P Balanced Equity & Bond – Moderate Index the S&P 500 Balanced Equity & Bond – Moderate Index combines investable S&P indices for core equity and fixed income to provide a regularly rebalanced multi-asset measure for moderate risk-reward profiles The construction of the index consists of a position in the S&P 500 Total Return Index with 50% weight, and a position in the S&P U.S. Treasury Bond 7-10 Year Index with 50% weight.
Cambria Investment Management Manager’s Discussion and Analysis of Fund Performance (Unaudited) |
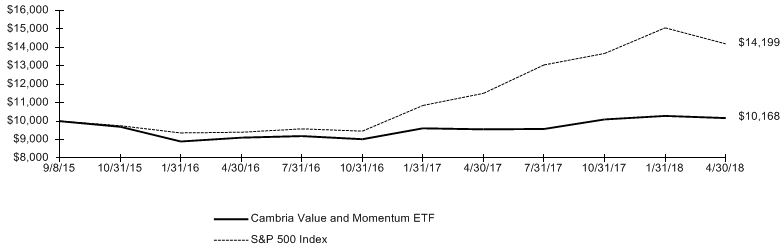
Comparison of Change in the Value of a $10,000 Investment in the Cambria Value and Momentum ETF versus S&P 500 Index
The Fund returned 6.40% for the fiscal year ended April 30, 2018. During this 12-month period, the Fund underperformed the S&P 500 Index. Significant overweight in Industrials, combined with underweight in Technology detracted from performance. However, the majority of underperformance was the result of the Fund’s average short hedge of 50% to the S&P 500, which returned 13.27% for the period.
| | AVERAGE ANNUAL TOTAL RETURN FOR THE PERIODS ENDED APRIL 30, 2018 |
| | One Year Return | Since Inception (Annualized)* |
| | Net Asset Value | Market Price | Net Asset Value | Market Price |
Cambria Value and Momentum ETF | | 6.40% | 6.13% | 0.63% | 0.65% |
S&P 500 Index | | 13.27% | 13.27% | 14.18% | 14.18% |
* Fund inception date is September 8, 2015.
The performance data quoted herein represents past performance and the return and value of an investment in
the Fund will fluctuate so that, when redeemed, may be worth less than its original cost.
Past performance is no guarantee of future performance and should not be considered as a representation of the future
results of the Fund. Current performance may be lower or higher than the performance quoted. For the most recent month-end performance information
please call 855-ETF-INFO (383-4636). As stated in the Fund’s prospectus, the annual fund operating expenses are 0.59%.
Returns shown do not reflect the deduction of taxes that a shareholder would pay on Fund distributions or the redemption of Fund shares.
The Fund’s performance assumes the reinvestment of all dividends and all capital gains.
Index returns assume reinvestment of dividends and, unlike a Fund’s returns, do not reflect any fees
or expenses. If such fees and expenses were included in the index returns, the performance would
have been lower. The indexes are unmanaged and are not available for investment.
There are no assurances that the Fund will meet its stated objectives.
S&P 500 Index is a market-value weighted index consisting of 500 stocks chosen for market size, liquidity, and industry group representation, with each stock’s weight in the Index proportionate to its market value.
Cambria Investment Management Manager’s Discussion and Analysis of Fund Performance (Unaudited) |
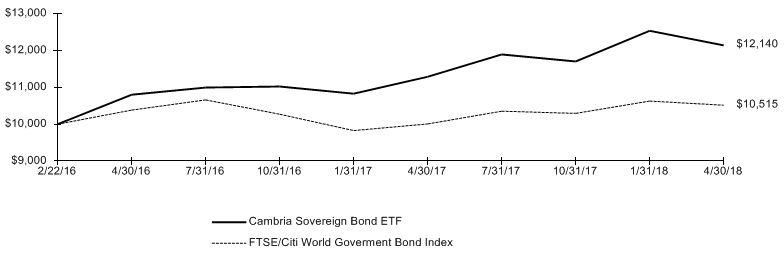
Comparison of Change in the Value of a $10,000 Investment in the Cambria Sovereign Bond ETF versus the FTSE/Citi World Government Bond Index
The Fund returned 7.56% for the fiscal year ended April 30, 2018. During this 12-month period, the Fund outperformed the FTSE/Citi World Government Bond Index. Allocations to debt issues of Greece, South Africa, Portugal, and Poland were the largest contributors to performance. Russia, Turkey, and Argentina detracted slightly from performance.
| | AVERAGE ANNUAL TOTAL RETURN FOR THE PERIODS ENDED APRIL 30, 2018 |
| | One Year Return | Since Inception (Annualized)* |
| | Net Asset Value | Market Price | Net Asset Value | Market Price |
Cambria Sovereign Bond ETF | | 7.56% | 7.12% | 9.27% | 9.62% |
FTSE/Citi World Government Bond Index | | 5.08% | 5.08% | 2.32% | 2.32% |
* Fund inception date is February 22, 2016.
The performance data quoted herein represents past performance and the return and value of an investment in
the Fund will fluctuate so that, when redeemed, may be worth less than its original cost.
Past performance is no guarantee of future performance and should not be considered as a representation of the future
results of the Fund. Current performance may be lower or higher than the performance quoted. For the most recent month-end performance information
please call 855-ETF-INFO (383-4636). As stated in the Fund’s prospectus, the annual fund operating expenses are 0.61%.
Returns shown do not reflect the deduction of taxes that a shareholder would pay on Fund distributions or the redemption of Fund shares.
The Fund’s performance assumes the reinvestment of all dividends and all capital gains.
Index returns assume reinvestment of dividends and, unlike a Fund’s returns, do not reflect any fees
or expenses. If such fees and expenses were included in the index returns, the performance would
have been lower. The indexes are unmanaged and are not available for investment.
There are no assurances that the Fund will meet its stated objectives.
FTSE/Citi World Government Bond Index measures the performance of fixed-rate, local currency, investment grade sovereign bonds. The WGBI is a widely used benchmark that currently comprises sovereign debt from over 20 countries, denominated in a variety of currencies, and has more than 25 years of history available. The WGBI provides a broad benchmark for the global sovereign fixed income market. Sub-indices are available in any combination of currency, maturity, or rating.
Cambria Investment Management Manager’s Discussion and Analysis of Fund Performance (Unaudited) |
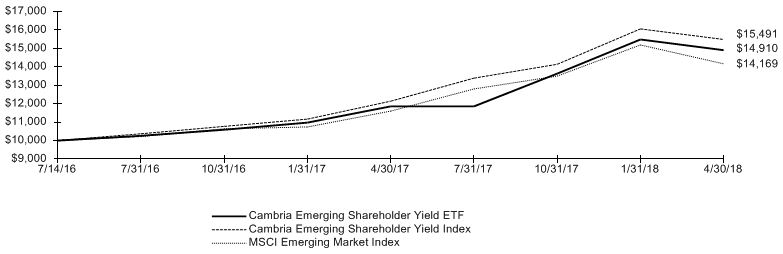
Comparison of Change in the Value of a $10,000 Investment in the Cambria Emerging Shareholder Yield ETF versus the Cambria Emerging Shareholder Yield Index and MSCI Emerging Market Index
The Fund returned 25.75% for the fiscal year ended April 30, 2018. During this 12-month period, the Fund outperformed the MSCI Emerging Market Index. Stock selection in Brazil, China, South Africa, and Thailand contributed to outperformance.
| | AVERAGE ANNUAL TOTAL RETURN FOR THE PERIODS ENDED APRIL 30, 2018 |
| | One Year Return | Since Inception (Annualized)* |
| | Net Asset Value | Market Price | Net Asset Value | Market Price |
Cambria Emerging Shareholder Yield ETF | | 25.75% | 23.99% | 24.87% | 24.98% |
Cambria Emerging Shareholder Yield Index | | 27.61% | 27.61% | 27.57% | 27.57% |
MSCI Emerging Market Index | | 22.14% | 22.14% | 21.40% | 21.40% |
* Fund inception date is July 13, 2016 and the Fund commenced operations on July 14, 2016.
The performance data quoted herein represents past performance and the return and value of an investment in
the Fund will fluctuate so that, when redeemed, may be worth less than its original cost.
Past performance is no guarantee of future performance and should not be considered as a representation of the future
results of the Fund. Current performance may be lower or higher than the performance quoted. For the most recent month-end performance information
please call 855-ETF-INFO (383-4636). As stated in the Fund’s prospectus, the annual fund operating expenses are 0.69%.
Returns shown do not reflect the deduction of taxes that a shareholder would pay on Fund distributions or the redemption of Fund shares.
The Fund’s performance assumes the reinvestment of all dividends and all capital gains.
Index returns assume reinvestment of dividends and, unlike a Fund’s returns, do not reflect any fees
or expenses. If such fees and expenses were included in the index returns, the performance would
have been lower. The indexes are unmanaged and are not available for investment.
There are no assurances that the Fund will meet its stated objectives.
MSCI Emerging Markets Index is a free-float weighted equity index that captures large and mid-cap representation across Emerging Markets (EM) countries. The index covers approximately 85% of the free float-adjusted market capitalization in each country
Cambria Investment Management Manager’s Discussion and Analysis of Fund Performance (Unaudited) |
Comparison of Change in the Value of a $10,000 Investment in the Cambria Tail Risk ETF versus the Bloomberg Barclays Short Treasury Index.
The Fund returned a loss of 11.74% for the fiscal year ended April 30, 2018. During this 12-month period, the Fund underperformed the Bloomberg Barclays Short Treasury Index. The Fund is designed as a US-equity market insurance portfolio: it holds a basket of equity index put options. The equity market had strong positive returns during this period.
| | AVERAGE ANNUAL TOTAL RETURN FOR THE PERIODS ENDED APRIL 30, 2018 |
| | One Year Return | Since Inception (Annualized)* |
| | Net Asset Value | Market Price | Net Asset Value | Market Price |
Cambria Tail Risk ETF | | -11.74% | -12.01% | -11.88% | -11.81% |
Bloomberg Barclays Short Treasury Index | | 1.09% | 1.09% | 1.07% | 1.07% |
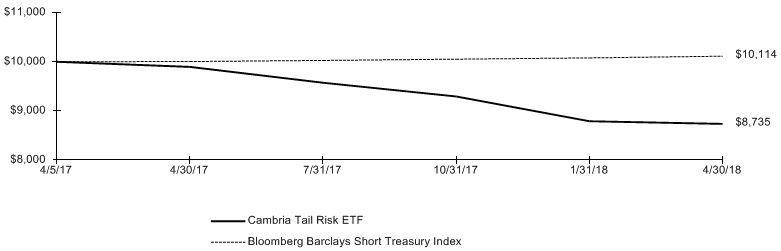
* Fund inception date is April 5, 2017.
The performance data quoted herein represents past performance and the return and value of an investment in
the Fund will fluctuate so that, when redeemed, may be worth less than its original cost.
Past performance is no guarantee of future performance and should not be considered as a representation of the future
results of the Fund. Current performance may be lower or higher than the performance quoted. For the most recent month-end performance information
please call 855-ETF-INFO (383-4636). As stated in the Fund’s prospectus, the annual fund operating expenses are 0.59%.
Returns shown do not reflect the deduction of taxes that a shareholder would pay on Fund distributions or the redemption of Fund shares.
The Fund’s performance assumes the reinvestment of all dividends and all capital gains.
Index returns assume reinvestment of dividends and, unlike a Fund’s returns, do not reflect any fees
or expenses. If such fees and expenses were included in the index returns, the performance would
have been lower. The indexes are unmanaged and are not available for investment.
There are no assurances that the Fund will meet its stated objectives.
The Bloomberg Barclays U.S. Short Treasury Index is composed of zero-coupon Treasury Bills and fixed-rate. Treasury bonds with a maturity between 1 and 12 months. As Treasury bonds and notes fall below one year-to-maturity and exit the U.S. Treasury Index, they become eligible for the Short Treasury Index. Maturity subindices are published in three-month increments: 1-3 month, 3-6 month, 6-9 month, and 9-12 month and can be separated into subindices that only include bills or only include notes that have aged below 1-year.
Cambria Investment Management Manager’s Discussion and Analysis of Fund Performance (Unaudited) |
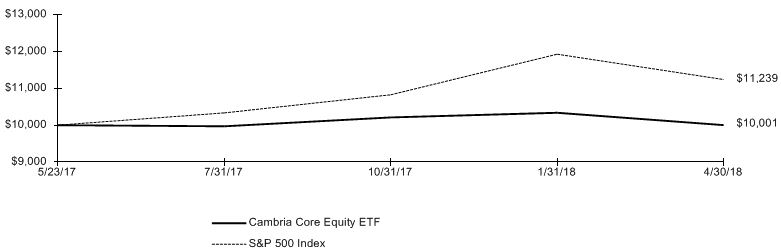
Comparison of Change in the Value of a $10,000 Investment in the Cambria Core Equity ETF versus the S&P 500 Index.
The Fund returned 0.01% for the since inception period ended April 30, 2018. The Fund launched on May 23, 2017. For the period ended April 30, 2018, the Fund underperformed the S&P 500. The largest detractors of performance were allocations to Consumer Discretionary, Technology, and Consumer Staples. Options investments also contributed to underperformance.
| | AVERAGE ANNUAL TOTAL RETURN FOR THE PERIODS ENDED APRIL 30, 2018 |
| | Cumulative Inception to Date* |
| | Net Asset Value | Market Price |
Cambria Core Equity ETF | | 0.01% | -0.15% |
S&P 500 Index | | -12.39% | -12.39% |
* Fund inception date is May 23, 2017.
The performance data quoted herein represents past performance and the return and value of an investment in
the Fund will fluctuate so that, when redeemed, may be worth less than its original cost.
Past performance is no guarantee of future performance and should not be considered as a representation of the future
results of the Fund. Current performance may be lower or higher than the performance quoted. For the most recent month-end performance information
please call 855-ETF-INFO (383-4636). As stated in the Fund’s prospectus, the annual fund operating expenses are 1.05%.
Returns shown do not reflect the deduction of taxes that a shareholder would pay on Fund distributions or the redemption of Fund shares.
The Fund’s performance assumes the reinvestment of all dividends and all capital gains.
Index returns assume reinvestment of dividends and, unlike a Fund’s returns, do not reflect any fees
or expenses. If such fees and expenses were included in the index returns, the performance would
have been lower. The indexes are unmanaged and are not available for investment.
There are no assurances that the Fund will meet its stated objectives.
S&P 500 Index is a market-value weighted index consisting of 500 stocks chosen for market size, liquidity, and industry group representation, with each stock’s weight in the Index proportionate to its market value.
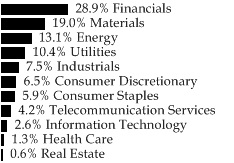
Cambria Investment Management Schedule of Investments ● Cambria Shareholder Yield ETF April 30, 2018 |
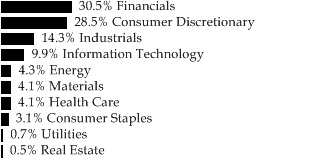
Sector Weightings(Unaudited)† |
|
| |
† Percentages based on total investments. |
Description | | Shares | | | Value | |
| | | | | | | | | |
COMMON STOCK — 99.5% | | | | | | | | |
| | | | | | | | | |
Consumer Discretionary — 28.4% | | | | | | | | |
American Eagle Outfitters | | | 100,196 | | | $ | 2,072,053 | |
Best Buy | | | 24,601 | | | | 1,882,715 | |
BJ's Restaurants | | | 35,971 | | | | 2,008,980 | |
Buckle | | | 72,892 | | | | 1,680,161 | |
Carnival | | | 8 | | | | 505 | |
CBS, Cl B | | | 19,650 | | | | 966,780 | |
Children's Place | | | 4 | | | | 510 | |
Cooper Tire & Rubber | | | 32,406 | | | | 792,327 | |
Dillard's, Cl A | | | 7,003 | | | | 522,074 | |
Finish Line, Cl A | | | 9 | | | | 122 | |
Gannett | | | 162,363 | | | | 1,570,050 | |
Gap | | | 41,700 | | | | 1,219,308 | |
Gentex | | | 68,807 | | | | 1,564,671 | |
Group 1 Automotive | | | 14,712 | | | | 961,429 | |
Guess? | | | 64,355 | | | | 1,498,828 | |
H&R Block | | | 19 | | | | 525 | |
Hibbett Sports* | | | 66,677 | | | | 1,813,614 | |
Home Depot | | | 13,622 | | | | 2,517,346 | |
Interpublic Group of Cos | | | 68,880 | | | | 1,624,879 | |
Kohl's | | | 22,987 | | | | 1,427,953 | |
La-Z-Boy, Cl Z | | | 54,659 | | | | 1,574,179 | |
Lear | | | 7,632 | | | | 1,426,955 | |
Lennar, Cl A | | | 23,431 | | | | 1,239,266 | |
Lennar, Cl B | | | 481 | | | | 20,534 | |
Lowe's | | | 23,250 | | | | 1,916,497 | |
Macy's | | | 14,803 | | | | 459,929 | |
Michael Kors Holdings* | | | 14,697 | | | | 1,005,569 | |
Office Depot | | | 13 | | | | 30 | |
O'Reilly Automotive* | | | 7,636 | | | | 1,955,351 | |
Six Flags Entertainment | | | 27,684 | | | | 1,750,736 | |
Sturm Ruger | | | 13,650 | | | | 754,163 | |
Target | | | 13,389 | | | | 972,041 | |
The accompanying notes are an integral part of the financial statements.
Cambria Investment Management Schedule of Investments ● Cambria Shareholder Yield ETF April 30, 2018 |
Description | | Shares | | | Value | |
| | | | | | | | | |
Urban Outfitters* | | | 26,929 | | | $ | 1,084,431 | |
Visteon* | | | 8,069 | | | | 1,004,106 | |
Whirlpool | | | 7,593 | | | | 1,176,535 | |
| | | | | | | | 40,465,152 | |
Consumer Staples — 3.0% | | | | | | | | |
Archer-Daniels-Midland | | | 12,110 | | | | 549,552 | |
Dr Pepper Snapple Group | | | 18,975 | | | | 2,276,241 | |
Nu Skin Enterprises, Cl A | | | 6 | | | | 427 | |
Walmart | | | 17,205 | | | | 1,521,954 | |
| | | | | | | | 4,348,174 | |
Energy — 4.2% | | | | | | | | |
Arch Coal | | | 17,094 | | | | 1,381,708 | |
CVR Energy | | | 34,220 | | | | 1,180,590 | |
Marathon Petroleum | | | 22,148 | | | | 1,659,107 | |
Murphy Oil | | | 5 | | | | 150 | |
Valero Energy | | | 16,511 | | | | 1,831,565 | |
| | | | | | | | 6,053,120 | |
Financials — 30.3% | | | | | | | | |
Aflac | | | 35,726 | | | | 1,628,034 | |
Allstate | | | 21,365 | | | | 2,089,924 | |
American Express | | | 13,633 | | | | 1,346,259 | |
American Financial Group | | | 1 | | | | 113 | |
American International Group | | | 20,401 | | | | 1,142,456 | |
Ameriprise Financial | | | 11,257 | | | | 1,578,344 | |
Assurant | | | 16,925 | | | | 1,570,978 | |
Assured Guaranty | | | 44,933 | | | | 1,630,619 | |
Axis Capital Holdings | | | 26,657 | | | | 1,564,766 | |
Bank of America | | | 7 | | | | 210 | |
CIT Group | | | 29,276 | | | | 1,550,164 | |
Citizens Financial Group | | | 38,484 | | | | 1,596,701 | |
CNO Financial Group | | | 63,336 | | | | 1,357,924 | |
Discover Financial Services | | | 22,693 | | | | 1,616,876 | |
Fifth Third Bancorp | | | 53,550 | | | | 1,776,254 | |
Hartford Financial Services Group | | | 24,561 | | | | 1,322,364 | |
JPMorgan Chase | | | 11,693 | | | | 1,271,965 | |
Leucadia National | | | 5 | | | | 120 | |
Lincoln National | | | 18,413 | | | | 1,300,694 | |
MetLife | | | 17,550 | | | | 836,609 | |
New York Community Bancorp | | | 125,222 | | | | 1,487,637 | |
Old Republic International | | | 73,786 | | | | 1,505,234 | |
PNC Financial Services Group | | | 8,917 | | | | 1,298,404 | |
State Street | | | 10,500 | | | | 1,047,690 | |
SunTrust Banks | | | 31,163 | | | | 2,081,688 | |
Synchrony Financial | | | 48,694 | | | | 1,615,180 | |
The accompanying notes are an integral part of the financial statements.
Cambria Investment Management Schedule of Investments ● Cambria Shareholder Yield ETF April 30, 2018 |
Description | | Shares | | | Value | |
| | | | | | | | | |
Synovus Financial | | | 24,487 | | | $ | 1,279,936 | |
Travelers | | | 13,956 | | | | 1,836,610 | |
Unum Group | | | 33,525 | | | | 1,621,940 | |
US Bancorp | | | 18,140 | | | | 915,163 | |
Voya Financial | | | 31,732 | | | | 1,661,170 | |
Waddell & Reed Financial, Cl A | | | 81,747 | | | | 1,654,559 | |
| | | | | | | | 43,186,585 | |
Health Care — 4.1% | | | | | | | | |
Aetna | | | 6,541 | | | | 1,171,166 | |
CVS Health | | | 16,050 | | | | 1,120,771 | |
Express Scripts Holding* | | | 15,713 | | | | 1,189,474 | |
McKesson | | | 5,475 | | | | 855,250 | |
Mylan* | | | 38,376 | | | | 1,487,454 | |
| | | | | | | | 5,824,115 | |
Industrials — 14.3% | | | | | | | | |
Boeing | | | 3,948 | | | | 1,316,895 | |
Cummins | | | 11,514 | | | | 1,840,628 | |
Delta Air Lines | | | 25,902 | | | | 1,352,602 | |
Eaton | | | 25,061 | | | | 1,880,327 | |
FTI Consulting* | | | 33,385 | | | | 1,949,684 | |
GATX | | | 18,066 | | | | 1,178,626 | |
General Dynamics | | | 8 | | | | 1,610 | |
Greenbrier | | | 6 | | | | 263 | |
Huntington Ingalls Industries | | | 4,514 | | | | 1,097,850 | |
Ingersoll-Rand | | | 11,453 | | | | 960,792 | |
ManpowerGroup | | | 14,327 | | | | 1,371,380 | |
MRC Global* | | | 18 | | | | 337 | |
Northrop Grumman | | | 1 | | | | 322 | |
Parker-Hannifin | | | 18 | | | | 2,963 | |
Robert Half International | | | 19,350 | | | | 1,175,513 | |
Southwest Airlines | | | 35,726 | | | | 1,887,405 | |
Spirit AeroSystems Holdings, Cl A | | | 16,275 | | | | 1,308,022 | |
United Continental Holdings* | | | 28,557 | | | | 1,928,740 | |
Wabash National | | | 52,850 | | | | 1,060,171 | |
| | | | | | | | 20,314,130 | |
Information Technology — 9.9% | | | | | | | | |
Apple | | | 13,191 | | | | 2,179,944 | |
Applied Materials | | | 27,608 | | | | 1,371,290 | |
Avnet | | | 38,862 | | | | 1,524,556 | |
Corning | | | 54,207 | | | | 1,464,673 | |
Hewlett Packard Enterprise | | | 91,019 | | | | 1,551,874 | |
HP | | | 45,554 | | | | 978,955 | |
NetApp | | | 3 | | | | 200 | |
Sanmina* | | | 47,709 | | | | 1,407,416 | |
The accompanying notes are an integral part of the financial statements.
Cambria Investment Management Schedule of Investments ● Cambria Shareholder Yield ETF April 30, 2018 |
Description | | Shares | | | Value | |
| | | | | | | | | |
Texas Instruments | | | 25,275 | | | $ | 2,563,643 | |
Xerox | | | 32,475 | | | | 1,021,339 | |
| | | | | | | | 14,063,890 | |
Materials — 4.1% | | | | | | | | |
Alcoa* | | | 5 | | | | 256 | |
Eastman Chemical | | | 11,550 | | | | 1,179,024 | |
Huntsman | | | 8 | | | | 238 | |
LyondellBasell Industries, Cl A | | | 9,709 | | | | 1,026,533 | |
Packaging Corp of America | | | 11 | | | | 1,273 | |
Steel Dynamics | | | 29,583 | | | | 1,325,614 | |
Trinseo | | | 16 | | | | 1,167 | |
Warrior Met Coal | | | 55,843 | | | | 1,298,350 | |
Worthington Industries | | | 22,470 | | | | 1,000,589 | |
| | | | | | | | 5,833,044 | |
Real Estate — 0.5% | | | | | | | | |
Realogy Holdings | | | 29,100 | | | | 721,971 | |
| | | | | | | | | |
Utilities — 0.7% | | | | | | | | |
AES | | | 78,420 | | | | 959,861 | |
| | | | | | | | | |
| | | | | | | | | |
Total Common Stock | | | | | | | | |
(Cost $123,478,126) | | | | | | | 141,770,042 | |
| | | | | | | | | |
Total Investments - 99.5% | | | | | | | | |
(Cost $123,478,126) | | | | | | $ | 141,770,042 | |
Other Assets and Liabilities - 0.5% | | | | | | | 669,802 | |
Net Assets - 100.0% | | | | | | $ | 142,439,844 | |
Percentages based on Net Assets.
* | Non-income producing security. |
As of April 30, 2018, all of the Fund's investments in securities were considered Level 1, in accordance with the authoritative guidance on fair value measurements and disclosure under U.S. generally accepted accounting principles. |
Please see Note 2 in Notes to Financial Statements for further information regarding fair value measurements.
There have been no transfers between Level 1, Level 2 or Level 3 assets and liabilities. It is the Fund’s policy to recognize transfers into and out of all Levels at the end of the reporting period.
The accompanying notes are an integral part of the financial statements.
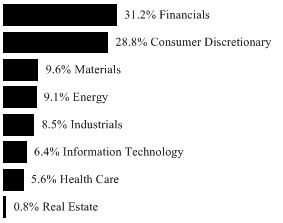
Cambria Investment Management Schedule of Investments ● Cambria Foreign Shareholder Yield ETF April 30, 2018 |
Sector Weightings (Unaudited)† |
|
| |
† Percentages based on total investments. |
Description | | Shares | | | Value | |
| | | | | | | | | |
COMMON STOCK — 98.3% | | | | | |
| | | | | | |
Australia — 7.5% | | | | | | | | |
Alumina | | | 188,367 | | | $ | 374,383 | |
BlueScope Steel | | | 17,535 | | | | 217,952 | |
Cabcharge Australia | | | 117,028 | | | | 162,993 | |
Crown Resorts | | | 35,031 | | | | 341,794 | |
Fortescue Metals Group | | | 83,020 | | | | 285,006 | |
Metcash | | | 2,393 | | | | 6,486 | |
Monadelphous Group | | | 78,946 | | | | 959,864 | |
Myer Holdings | | | 654,874 | | | | 189,813 | |
Nine Entertainment Holdings | | | 195,836 | | | | 347,946 | |
Qantas Airways | | | 84,417 | | | | 366,701 | |
South32 | | | 78,085 | | | | 218,684 | |
| | | | | | | | 3,471,622 | |
Belgium — 1.2% | | | | | | | | |
Ageas | | | 10,236 | | | | 549,445 | |
| | | | | | | | | |
Canada — 8.2% | | | | | | | | |
BRP | | | 17,500 | | | | 707,932 | |
Ensign Energy Services | | | 59,500 | | | | 284,999 | |
Genworth MI Canada | | | 13,421 | | | | 433,795 | |
Great-West Lifeco | | | 12,261 | | | | 326,877 | |
IGM Financial | | | 8,373 | | | | 257,004 | |
Labrador Iron Ore Royalty | | | 20,452 | | | | 348,048 | |
Magna International | | | 10,640 | | | | 628,398 | |
Metro, Cl A | | | 624 | | | | 19,800 | |
Norbord | | | 10,500 | | | | 433,592 | |
TFI International | | | 13,413 | | | | 388,303 | |
| | | | | | | 3,828,748 | |
Denmark — 2.4% | | | | | | | | |
Novo Nordisk, Cl B | | | 7,437 | | | | 351,738 | |
Pandora | | | 3,925 | | | | 437,306 | |
Spar Nord Bank | | | 28,105 | | | | 322,062 | |
The accompanying notes are an integral part of the financial statements.
Cambria Investment Management Schedule of Investments ● Cambria Foreign Shareholder Yield ETF April 30, 2018 |
Description | | Shares | | | Value | |
| | | | | | | | | |
Tryg | | | 814 | | | $ | 19,328 | |
| | | | | | | | 1,130,434 | |
Finland — 2.3% | | | | | | | | |
Kesko, Cl B | | | 8,264 | | | | 486,006 | |
UPM-Kymmene | | | 15,715 | | | | 563,249 | |
| | | | | | | | 1,049,255 | |
France — 8.0% | | | | | | | | |
AXA | | | 12,683 | | | | 363,295 | |
BNP Paribas | | | 7,987 | | | | 617,093 | |
Casino Guichard Perrachon | | | 6,423 | | | | 333,215 | |
CNP Assurances | | | 22,578 | | | | 579,112 | |
Engie | | | 21,959 | | | | 385,832 | |
Metropole Television | | | 19,358 | | | | 476,884 | |
Natixis | | | 74,200 | | | | 610,381 | |
Neopost | | | 13,440 | | | | 362,905 | |
| | | | | | | | 3,728,717 | |
Germany — 3.0% | | | | | | | | |
CECONOMY | | | 419 | | | | 4,704 | |
Freenet | | | 15,206 | | | | 483,307 | |
Muenchener Rueckversicherungs | | | 2,527 | | | | 579,652 | |
Uniper | | | 11,197 | | | | 347,096 | |
| | | | | | | | 1,414,759 | |
Hong Kong — 6.4% | | | | | | | | |
Hang Lung Properties | | | 165,704 | | | | 393,536 | |
Li & Fung | | | 780,494 | | | | 394,789 | |
Shandong Chenming Paper Holdings, Cl H | | | 297,500 | | | | 454,855 | |
Shanghai Industrial Holdings | | | 128,604 | | | | 339,180 | |
Shimao Property Holdings | | | 280,000 | | | | 750,957 | |
Shougang Fushan Resources Group | | | 2,590,000 | | | | 643,486 | |
Xinyi Glass Holdings | | | 12,000 | | | | 17,491 | |
| | | | | | | | 2,994,294 | |
Italy — 3.4% | | | | | | | | |
Saras | | | 151,197 | | | | 361,154 | |
Societa Cattolica di Assicurazioni SC | | | 44,590 | | | | 476,006 | |
STMicroelectronics | | | 34,387 | | | | 752,860 | |
| | | | | | | | 1,590,020 | |
Japan — 19.6% | | | | | | | | |
Astellas Pharma | | | 21,000 | | | | 308,411 | |
Brother Industries | | | 14,000 | | | | 301,720 | |
Dai Nippon Printing | | | 16,026 | | | | 345,676 | |
Denka | | | 17,500 | | | | 625,914 | |
Duskin | | | 14,000 | | | | 353,330 | |
Hokkoku Bank | | | 300 | | | | 11,992 | |
The accompanying notes are an integral part of the financial statements.
Cambria Investment Management Schedule of Investments ● Cambria Foreign Shareholder Yield ETF April 30, 2018 |
Description | | Shares | | | Value | |
| | | | | | | | | |
Hosiden | | | 38,500 | | | $ | 462,056 | |
ITOCHU | | | 800 | | | | 16,056 | |
K's Holdings | | | 14,000 | | | | 202,598 | |
Leopalace21 | | | 24,500 | | | | 213,131 | |
Mitsubishi Gas Chemical | | | 7,000 | | | | 164,819 | |
Mitsui | | | 21,000 | | | | 379,679 | |
Mixi | | | 7,000 | | | | 231,156 | |
Nippon Express | | | 7,000 | | | | 529,546 | |
Nitto Boseki | | | 400 | | | | 8,665 | |
NOF | | | 17,500 | | | | 522,663 | |
NTT DOCOMO | | | 17,870 | | | | 463,424 | |
Sankyo | | | 11,938 | | | | 419,883 | |
Showa Shell Sekiyu | | | 24,500 | | | | 346,702 | |
Sumitomo Bakelite | | | 2,000 | | | | 18,112 | |
Suzuki Motor | | | 200 | | | | 10,778 | |
Taisei | | | 10,500 | | | | 567,645 | |
Toyo Kanetsu | | | 17,500 | | | | 537,070 | |
Tsugami | | | 35,000 | | | | 423,893 | |
UT Group * | | | 59,500 | | | | 1,646,428 | |
| | | | | | | | 9,111,347 | |
Netherlands — 3.8% | | | | | | | | |
Aegon | | | 87,990 | | | | 647,315 | |
ASR Nederland | | | 7,995 | | | | 378,080 | |
BinckBank | | | 75,358 | | | | 439,541 | |
Philips Lighting (A) | | | 9,101 | | | | 277,396 | |
| | | | | | | | 1,742,332 | |
New Zealand — 0.7% | | | | | | | | |
SKY Network Television | | | 213,250 | | | | 342,098 | |
Tower * | | | 273 | | | | 152 | |
| | | | | | | | 342,250 | |
Norway — 6.3% | | | | | | | | |
DNB | | | 28,847 | | | | 541,356 | |
Grieg Seafood | | | 47,075 | | | | 506,116 | |
Salmar | | | 32,222 | | | | 1,506,208 | |
Telenor | | | 17,678 | | | | 391,801 | |
| | | | | | | | 2,945,481 | |
Portugal — 2.0% | | | | | | | | |
EDP - Energias de Portugal | | | 120,523 | | | | 447,691 | |
Galp Energia SGPS | | | 25,595 | | | | 491,909 | |
| | | | | | | | 939,600 | |
Spain — 2.7% | | | | | | | | |
Endesa | | | 15,616 | | | | 365,276 | |
Gas Natural SDG | | | 21,230 | | | | 536,076 | |
The accompanying notes are an integral part of the financial statements.
Cambria Investment Management Schedule of Investments ● Cambria Foreign Shareholder Yield ETF April 30, 2018 |
Description | | Shares | | | Value | |
| | | | | | | | | |
International Consolidated Airlines Group | | | 39,543 | | | $ | 342,478 | |
| | | | | | | | 1,243,830 | |
Sweden — 2.8% | | | | | | | | |
JM | | | 15,241 | | | | 302,674 | |
Peab | | | 40,293 | | | | 358,451 | |
Svenska Cellulosa SCA, Cl B | | | 19,915 | | | | 221,332 | |
Telia | | | 81,835 | | | | 403,537 | |
| | | | | | | | 1,285,994 | |
Switzerland — 2.4% | | | | | | | | |
Sunrise Communications Group (A) | | | 2,240 | | | | 176,533 | |
Swiss Re | | | 4,666 | | | | 445,695 | |
Zurich Insurance Group | | | 1,540 | | | | 493,546 | |
| | | | | | | | 1,115,774 | |
United Kingdom — 15.6% | | | | | | | | |
Anglo American | | | 14,654 | | | | 344,859 | |
Carillion *(B)(C)(D) | | | 1,154,979 | | | | — | |
Centamin | | | 177,905 | | | | 383,918 | |
Direct Line Insurance Group | | | 63,837 | | | | 328,953 | |
EI Group * | | | 6,471 | | | | 11,474 | |
HSBC Holdings | | | 47,478 | | | | 474,146 | |
Intermediate Capital Group | | | 49,230 | | | | 736,041 | |
J Sainsbury | | | 113,098 | | | | 481,122 | |
Kingfisher | | | 78,901 | | | | 329,999 | |
Legal & General Group | | | 106,338 | | | | 395,271 | |
Pearson | | | 32,498 | | | | 373,045 | |
Persimmon | | | 17,990 | | | | 672,424 | |
Rio Tinto | | | 9,526 | | | | 517,499 | |
Royal Mail | | | 70,768 | | | | 566,245 | |
South32 | | | 238,105 | | | | 661,503 | |
Sports Direct International * | | | 111,440 | | | | 617,977 | |
Vodafone Group | | | 122,818 | | | | 357,783 | |
| | | | | | | | 7,252,259 | |
| | | | | | | | | |
Total Common Stock | | | | | | | | |
(Cost $42,314,360) | | | | | | | 45,736,161 | |
| | | | | | | | | |
Total Investments - 98.3% | | | | | | | | |
(Cost $42,314,360) | | | | | | $ | 45,736,161 | |
Other Assets and Liabilities - 1.7% | | | | | | | 774,782 | |
Net Assets - 100.0% | | | | | | $ | 46,510,943 | |
Percentages based on Net Assets.
The accompanying notes are an integral part of the financial statements.
Cambria Investment Management Schedule of Investments ● Cambria Foreign Shareholder Yield ETF April 30, 2018 |
(A) | Securities sold within terms of a private placement memorandum, exempt from registration under Section 144A of the Securities Act of 1933, as amended, and may be sold only to dealers in that program or other "accredited investors." These securities are deemed to be liquid by the Board of Trustees. The total value of such securities at April 30, 2018 was $453,929 and represents 1.0% of Net Assets. |
(B) | Level 3 security in accordance with fair value hierarchy. |
(C) | Securities considered illiquid. The total value of such securities as of April 30, 2018 was $0 and represented 0.0% of Net Assets. See Note 2 in Notes to Financial Statements. |
(D) | Security is fair valued using methods determined in good faith by the Fair Value Committee of the Fund. The total value of such securities as of April 30, 2018, was $0 and represents 0.0% of Net Assets. |
* | Non-income producing security. |
The following is a list of the inputs used as of April 30, 2018, in valuing the Fund’s investments and other financial instruments carried at market value: |
Investments in Securities | | Level 1 | | | Level 2 | | | Level 3(1) | | | Total | |
Common Stock | | | | | | | | | | | | | | | | |
Australia | | $ | 3,471,622 | | | $ | — | | | $ | — | | | $ | 3,471,622 | |
Belgium | | | 549,445 | | | | — | | | | — | | | | 549,445 | |
Canada | | | 3,828,748 | | | | — | | | | — | | | | 3,828,748 | |
Denmark | | | 1,130,434 | | | | — | | | | — | | | | 1,130,434 | |
Finland | | | 1,049,255 | | | | — | | | | — | | | | 1,049,255 | |
France | | | 3,728,717 | | | | — | | | | — | | | | 3,728,717 | |
Germany | | | 1,414,759 | | | | — | | | | — | | | | 1,414,759 | |
Hong Kong | | | 2,994,294 | | | | — | | | | — | | | | 2,994,294 | |
Italy | | | 1,590,020 | | | | — | | | | — | | | | 1,590,020 | |
Japan | | | 9,111,347 | | | | — | | | | — | | | | 9,111,347 | |
Netherlands | | | 1,742,332 | | | | — | | | | — | | | | 1,742,332 | |
New Zealand | | | 342,250 | | | | — | | | | — | | | | 342,250 | |
Norway | | | 2,945,481 | | | | — | | | | — | | | | 2,945,481 | |
Portugal | | | 939,600 | | | | — | | | | — | | | | 939,600 | |
Spain | | | 1,243,830 | | | | — | | | | — | | | | 1,243,830 | |
Sweden | | | 1,285,994 | | | | — | | | | — | | | | 1,285,994 | |
Switzerland | | | 1,115,774 | | | | — | | | | — | | | | 1,115,774 | |
United Kingdom | | | 7,252,259 | | | | — | | | —^ | | | | 7,252,259 | |
Total Common Stock | | | 45,736,161 | | | | — | | | | — | | | | 45,736,161 | |
Total Investments in Securities | | $ | 45,736,161 | | | $ | – | | | $ | – | | | $ | 45,736,161 | |
^ | Represents security in which the fair value is $0 or have been rounded to $0. |
(1) | Included in Level 3 is one security with total value of $0. A reconciliation of Level 3 investments and disclosures of significant unobservable inputs are presented when the Fund has a significant amount of Level 3 investments at the beginning and/or end of the period in relation to net assets. Management has concluded that Level 3 investments are not material in relation to net assets. |
Please see Note 2 in Notes to Financial Statements for further information regarding fair value measurements.
There have been no transfers between Level 1, Level 2 or Level 3 assets and liabilities. It is the Fund’s policy to recognize transfers into and out of all Levels at the end of the reporting period.
The accompanying notes are an integral part of the financial statements.
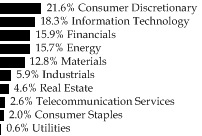
Cambria Investment Management Schedule of Investments ● Cambria Global Value ETF April 30, 2018 |
Sector Weightings (Unaudited)† |
|
| |
† Percentages based on total investments. |
Description | | Shares | | | Value | |
| | | | | | | | | |
COMMON STOCK — 98.2% | | | | | | | | |
| | | | | | | | | |
Austria — 1.8% | | | | | | | | |
AMAG Austria Metall (A) | | | 59,834 | | | $ | 3,757,283 | |
| | | | | | | | | |
Brazil — 7.0% | | | | | | | | |
AMBEV | | | 283,872 | | | | 1,889,671 | |
Banco do Brasil | | | 217,456 | | | | 2,279,340 | |
Banco Santander Brasil | | | 386,903 | | | | 4,212,286 | |
Cia Siderurgica Nacional * | | | 498,812 | | | | 1,258,706 | |
Cosan Industria e Comercio | | | 140,888 | | | | 1,607,472 | |
JBS | | | 523,566 | | | | 1,309,214 | |
Vale | | | 156,027 | | | | 2,165,903 | |
| | | | | | | | 14,722,592 | |
Czech Republic — 8.7% | | | | | | | | |
CEZ | | | 101,762 | | | | 2,602,320 | |
Fortuna Entertainment Group * | | | 310,392 | | | | 2,914,334 | |
Komercni Banka | | | 56,765 | | | | 2,450,629 | |
Pegas Nonwovens | | | 66,582 | | | | 2,814,755 | |
Philip Morris CR | | | 3,726 | | | | 2,854,991 | |
Unipetrol | | | 268,920 | | | | 4,707,310 | |
| | | | | | | | 18,344,339 | |
Greece — 8.9% | | | | | | | | |
Alpha Bank AE * | | | 36,947 | | | | 97,711 | |
Athens Water Supply & Sewage | | | 175,770 | | | | 1,262,944 | |
Bank of Greece | | | 95,256 | | | | 1,736,968 | |
FF Group * | | | 27,255 | | | | 516,736 | |
Hellenic Petroleum | | | 202,014 | | | | 2,061,392 | |
Hellenic Telecommunications Organization | | | 91,736 | | | | 1,334,902 | |
Holding ADMIE IPTO * | | | 200,756 | | | | 448,500 | |
Intralot -Integrated Lottery Systems & Services * | | | 655,614 | | | | 937,394 | |
JUMBO | | | 78,149 | | | | 1,430,688 | |
Karelia Tobacco | | | 6,720 | | | | 2,272,217 | |
The accompanying notes are an integral part of the financial statements.
Cambria Investment Management Schedule of Investments ● Cambria Global Value ETF April 30, 2018 |
Description | | Shares | | | Value | |
| | | | | | | | | |
Motor Oil Hellas Corinth Refineries | | | 149,688 | | | $ | 3,575,492 | |
Mytilineos Holdings | | | 111,780 | | | | 1,349,853 | |
National Bank of Greece * | | | 45,868 | | | | 19,165 | |
OPAP | | | 90,570 | | | | 1,086,066 | |
Piraeus Bank * | | | 1,028 | | | | 4,360 | |
Public Power * | | | 200,756 | | | | 662,811 | |
| | | | | | | | 18,797,199 | |
Israel — 12.0% | | | | | | | | |
Bank Hapoalim | | | 374,158 | | | | 2,563,730 | |
Bank Leumi Le-Israel | | | 431,863 | | | | 2,555,935 | |
Bezeq The Israeli Telecommunication | | | 2,081,636 | | | | 2,627,097 | |
Elbit Systems | | | 21,242 | | | | 2,458,298 | |
Israel Chemicals | | | 586,260 | | | | 2,635,682 | |
Israel Discount Bank, Cl A * | | | 906,791 | | | | 2,517,079 | |
Mizrahi Tefahot Bank | | | 125,070 | | | | 2,290,491 | |
Nice * | | | 26,814 | | | | 2,543,603 | |
Teva Pharmaceutical Industries * | | | 145,459 | | | | 2,655,401 | |
Tower Semiconductor * | | | 92,149 | | | | 2,423,970 | |
| | | | | | | | 25,271,286 | |
Italy — 6.2% | | | | | | | | |
Atlantia | | | 67,935 | | | | 2,256,050 | |
Enel | | | 381,186 | | | | 2,424,963 | |
Eni | | | 84,078 | | | | 1,644,826 | |
Intesa Sanpaolo | | | 534,957 | | | | 2,039,464 | |
Saipem * | | | 8,637 | | | | 33,105 | |
Telecom Italia * | | | 1,493,039 | | | | 1,475,207 | |
UniCredit | | | 26,758 | | | | 580,792 | |
Unipol Gruppo | | | 280,422 | | | | 1,506,935 | |
UnipolSai | | | 409,758 | | | | 1,103,455 | |
| | | | | | | | 13,064,797 | |
Norway — 7.1% | | | | | | | | |
Aker Solutions * | | | 254,412 | | | | 1,729,633 | |
DNB | | | 75,707 | | | | 1,420,751 | |
Gjensidige Forsikring | | | 58,009 | | | | 919,779 | |
Norsk Hydro | | | 234,583 | | | | 1,463,823 | |
Petroleum Geo-Services * | | | 339,587 | | | | 1,467,171 | |
Statoil | | | 57,385 | | | | 1,469,980 | |
Storebrand | | | 250,779 | | | | 2,147,578 | |
Telenor | | | 58,682 | | | | 1,300,582 | |
TGS Nopec Geophysical | | | 60,600 | | | | 1,920,212 | |
Yara International | | | 24,638 | | | | 1,041,133 | |
| | | | | | | | 14,880,642 | |
The accompanying notes are an integral part of the financial statements.
Cambria Investment Management Schedule of Investments ● Cambria Global Value ETF April 30, 2018 |
Description | | Shares | | | Value | |
| | | | | | | | | |
Poland — 8.0% | | | | | | | | |
Alior Bank * | | | 34,854 | | | $ | 705,551 | |
Asseco Poland | | | 43,121 | | | | 540,571 | |
Bank Millennium * | | | 382,844 | | | | 932,609 | |
Bank Polska Kasa Opieki | | | 15,780 | | | | 525,573 | |
Bank Zachodni WBK | | | 7,975 | | | | 843,886 | |
CCC | | | 14,777 | | | | 1,090,429 | |
Cyfrowy Polsat | | | 110,390 | | | | 807,045 | |
Energa | | | 102,238 | | | | 300,319 | |
Eurocash | | | 82,017 | | | | 572,741 | |
Grupa Azoty | | | 31,430 | | | | 479,082 | |
Grupa Lotos | | | 93,991 | | | | 1,481,426 | |
ING Bank Slaski | | | 19,496 | | | | 1,094,267 | |
KGHM Polska Miedz | | | 22,899 | | | | 610,927 | |
LPP | | | 365 | | | | 953,616 | |
Lubelski Wegiel Bogdanka | | | 30,319 | | | | 474,241 | |
mBank* | | | 5,720 | | | | 699,793 | |
Orange Polska * | | | 267,155 | | | | 401,130 | |
PGE Polska Grupa Energetyczna * | | | 122,161 | | | | 364,410 | |
Polski Koncern Naftowy ORLEN | | | 42,949 | | | | 1,097,632 | |
Polskie Gornictwo Naftowe i Gazownictwo | | | 499,656 | | | | 879,774 | |
Powszechna Kasa Oszczednosci Bank Polski | | | 82,467 | | | | 983,067 | |
Powszechny Zaklad Ubezpieczen | | | 59,492 | | | | 727,495 | |
Tauron Polska Energia * | | | 577,368 | | | | 386,574 | |
| | | | | | | | 16,952,158 | |
Portugal — 9.8% | | | | | | | | |
Altri SGPS | | | 82,810 | | | | 599,007 | |
Banco BPI, Cl G * | | | 231,200 | | | | 339,503 | |
Banco Comercial Portugues, Cl R * | | | 80,904 | | | | 27,170 | |
Banco Espirito Santo *(B)(C)(D) | | | 318,087 | | | | — | |
BANIF - Banco Internacional do Funchal *(B)(C)(D) | | | 60,980,850 | | | | — | |
CIMPOR Cimentos de Portugal SGPS *(B)(C)(D) | | | 450,116 | | | | — | |
Corticeira Amorim SGPS | | | 525,042 | | | | 6,987,118 | |
CTT-Correios de Portugal | | | 32,909 | | | | 121,528 | |
EDP - Energias de Portugal | | | 524,266 | | | | 1,947,424 | |
Galp Energia SGPS | | | 146,991 | | | | 2,825,009 | |
Jeronimo Martins SGPS | | | 48,328 | | | | 848,566 | |
Mota-Engil SGPS | | | 95,582 | | | | 414,952 | |
Navigator | | | 78,795 | | | | 460,539 | |
NOS SGPS | | | 48,769 | | | | 290,109 | |
Pharol SGPS * | | | 952,460 | | | | 313,426 | |
REN - Redes Energeticas Nacionais SGPS | | | 120,274 | | | | 379,374 | |
The accompanying notes are an integral part of the financial statements.
Cambria Investment Management Schedule of Investments ● Cambria Global Value ETF April 30, 2018 |
Description | | Shares | | | Value | |
| | | | | | | | | |
Semapa-Sociedade de Investimento e Gestao | | | 140,778 | | | $ | 3,151,861 | |
Sonae | | | 1,135,620 | | | | 1,546,908 | |
Teixeira Duarte | | | 1,378,782 | | | | 462,874 | |
| | | | | | | | 20,715,368 | |
Russia — 9.5% | | | | | | | | |
Alrosa PJSC | | | 1,967,328 | | | | 2,799,512 | |
Gazprom Neft PJSC | | | 521,640 | | | | 2,553,010 | |
Gazprom PJSC | | | 581,094 | | | | 1,346,605 | |
Rosneft PJSC | | | 308,448 | | | | 1,875,987 | |
Sberbank of Russia PJSC | | | 896,022 | | | | 3,229,791 | |
Severstal PJSC | | | 258,552 | | | | 4,154,651 | |
Unipro PJSC | | | 34,926,552 | | | | 1,539,658 | |
Uralkali * | | | 460,242 | | | | 818,565 | |
VTB Bank PJSC | | | 2,013,144,516 | | | | 1,725,347 | |
| | | | | | | | 20,043,126 | |
Singapore — 6.1% | | | | | | | | |
CapitaLand | | | 453,600 | | | | 1,286,226 | |
City Developments | | | 145,800 | | | | 1,393,127 | |
ComfortDelGro | | | 615,600 | | | | 1,044,570 | |
Golden Agri-Resources | | | 4,681,800 | | | | 1,218,115 | |
Jardine Cycle & Carriage | | | 32,400 | | | | 837,122 | |
Oversea-Chinese Banking | | | 162,000 | | | | 1,685,973 | |
SATS | | | 324,000 | | | | 1,353,665 | |
Sembcorp Industries | | | 534,600 | | | | 1,237,724 | |
Singapore Airlines | | | 162,000 | | | | 1,329,231 | |
United Overseas Bank | | | 64,800 | | | | 1,472,905 | |
| | | | | | | | 12,858,658 | |
Spain — 7.9% | | | | | | | | |
Acciona | | | 20,773 | | | | 1,741,431 | |
Banco Bilbao Vizcaya Argentaria | | | 168,042 | | | | 1,365,700 | |
Banco Santander | | | 233,450 | | | | 1,514,723 | |
CaixaBank | | | 335,869 | | | | 1,638,198 | |
Enagas | | | 55,106 | | | | 1,606,418 | |
Endesa | | | 65,136 | | | | 1,523,608 | |
Ferrovial | | | 74,042 | | | | 1,585,739 | |
Gas Natural SDG | | | 80,870 | | | | 2,042,039 | |
Iberdrola | | | 248,382 | | | | 1,924,451 | |
Mapfre | | | 515,209 | | | | 1,794,325 | |
| | | | | | | | 16,736,632 | |
Turkey — 5.2% | | | | | | | | |
Akbank Turk | | | 453,438 | | | | 944,360 | |
Eregli Demir ve Celik Fabrikalari | | | 683,640 | | | | 1,709,899 | |
Haci Omer Sabanci Holding | | | 405,810 | | | | 961,053 | |
The accompanying notes are an integral part of the financial statements.
Cambria Investment Management Schedule of Investments ● Cambria Global Value ETF April 30, 2018 |
Description | | Shares | | | Value | |
| | | | | | | | | |
KOC Holding | | | 260,982 | | | $ | 881,483 | |
Petkim Petrokimya Holding | | | 893,754 | | | | 1,579,762 | |
Turkiye Halk Bankasi | | | 364,176 | | | | 741,423 | |
Turkiye Is Bankasi, Cl C | | | 620,946 | | | | 941,638 | |
Turkiye Sise ve Cam Fabrikalari | | | 1,061,818 | | | | 1,178,898 | |
Turkiye Vakiflar Bankasi TAO, Cl D | | | 711,666 | | | | 1,045,924 | |
Yapi ve Kredi Bankasi * | | | 1,007,964 | | | | 987,592 | |
| | | | | | | | 10,972,032 | |
| | | | | | | | | |
Total Common Stock | | | | | | | | |
(Cost $194,277,744) | | | | | | | 207,116,112 | |
| | | | | | | | | |
PREFERRED STOCK — 2.3% | | | | | | | | |
| | | | | | | | | |
Brazil — 2.3% | | | | | | | | |
Banco Bradesco | | | 256,471 | | | | 2,527,226 | |
Cia Energetica de Minas Gerais | | | 354,480 | | | | 856,046 | |
Telefonica Brasil | | | 109,292 | | | | 1,540,857 | |
| | | | | | | | | |
| Total Preferred Stock | | | | | | | | |
(Cost $5,629,834) | | | | | | | 4,924,130 | |
| | | | | | | | | |
Total Investments - 100.5% | | | | | | | | |
(Cost $199,907,578) | | | | | | $ | 212,040,242 | |
Other Assets and Liabilities - (0.5)% | | | | | | | (1,065,115 | ) |
Net Assets - 100.0% | | | | | | $ | 210,975,126 | |
Percentages based on Net Assets.
The accompanying notes are an integral part of the financial statements.
Cambria Investment Management Schedule of Investments ● Cambria Global Value ETF April 30, 2018 |
(A) | Securities sold within terms of a private placement memorandum, exempt from registration under Section 144A of the Securities Act of 1933, as amended, and may be sold only to dealers in that program or other "accredited investors." These securities are deemed to be liquid by the Board of Trustees. The total value of such securities at April 30, 2018 was $3,757,283 and represents 1.8% of Net Assets. |
(B) | Level 3 security in accordance with fair value hierarchy. |
(C) | Securities considered illiquid. The total value of such securities as of April 30, 2018 was $0 and represented 0.0% of Net Assets. See Note 2 in Notes to Financial Statements. |
(D) | Security is fair valued using methods determined in good faith by the Fair Value Committee of the Fund. The total value of such securities as of April 30, 2018, was $0 and represents 0.0% of Net Assets. |
Cl — Class |
PJSC — Private Joint Stock Company |
The following is a list of the inputs used as of April 30, 2018, in valuing the Fund’s investments and other financial instruments carried at market value: |
Investments in Securities | | Level 1 | | | Level 2 | | | Level 3(1) | | | Total | |
Common Stock | | | | | | | | | | | | | | | | |
Austria | | $ | 3,757,283 | | | $ | — | | | $ | — | | | $ | 3,757,283 | |
Brazil | | | 14,722,592 | | | | — | | | | — | | | | 14,722,592 | |
Czech Republic | | | 18,344,339 | | | | — | | | | — | | | | 18,344,339 | |
Greece | | | 18,797,199 | | | | — | | | | — | | | | 18,797,199 | |
Israel | | | 25,271,286 | | | | — | | | | — | | | | 25,271,286 | |
Italy | | | 13,064,797 | | | | — | | | | — | | | | 13,064,797 | |
Norway | | | 14,880,642 | | | | — | | | | — | | | | 14,880,642 | |
Poland | | | 16,952,158 | | | | — | | | | — | | | | 16,952,158 | |
Portugal | | | 20,715,368 | | | | — | | | —^ | | | | 20,715,368 | |
Russia | | | 20,043,126 | | | | — | | | | — | | | | 20,043,126 | |
Singapore | | | 12,858,658 | | | | — | | | | — | | | | 12,858,658 | |
Spain | | | 16,736,632 | | | | — | | | | — | | | | 16,736,632 | |
Turkey | | | 10,972,032 | | | | — | | | | — | | | | 10,972,032 | |
Total Common Stock | | | 207,116,112 | | | | — | | | | — | | | | 207,116,112 | |
Preferred Stock | | | | | | | | | | | | | | | | |
Brazil | | | 4,924,130 | | | | — | | | | — | | | | 4,924,130 | |
Total Preferred Stock | | | 4,924,130 | | | | — | | | | — | | | | 4,924,130 | |
Total Investments in Securities | | $ | 212,040,242 | | | $ | — | | | $ | — | | | $ | 212,040,242 | |
^ | Represents securities in which the fair value is $0 or have been rounded to $0 |
(1) | Included in Level 3 are three securities with total value of $0. A reconciliation of Level 3 investments and disclosures of significant unobservable inputs are presented when the Fund has a significant amount of Level 3 investments at the beginning and/or end of the period in relation to net assets. Management has concluded that Level 3 investments are not material in relation to net assets. |
Please see Note 2 in Notes to Financial Statements for further information regarding fair value measurements.
There have been no transfers between Level 1 and Level 2 assets and liabilities. There were transfers into Level 3 due to changes in the availability of observable inputs to determine fair value. It is the Fund’s policy to recognize transfers into and out of all Levels at the end of the reporting period.
The accompanying notes are an integral part of the financial statements.
Cambria Investment Management Schedule of Investments ● Cambria Global Momentum ETF April 30, 2018 |
Sector Weightings (Unaudited)†: | |
| |
| | |
† Percentages based on total investments. | |
Description | | Shares | | | Value | |
| | | | | | | | | |
EXCHANGE TRADED FUNDS — 97.5% | | | | | |
Cambria Emerging Shareholder Yield ETF‡ | | | 337,444 | | | $ | 12,126,658 | |
Cambria Foreign Shareholder Yield ETF‡ | | | 226,297 | | | | 6,019,500 | |
Cambria Global Value ETF‡ | | | 446,490 | | | | 11,622,581 | |
Cambria Shareholder Yield ETF‡ | | | 120,319 | | | | 4,581,748 | |
FlexShares Global Upstream Natural Resources Index Fund | | | 146,999 | | | | 4,992,086 | |
iShares Global Financials ETF | | | 92,332 | | | | 6,398,608 | |
iShares Global Materials ETF | | | 100,730 | | | | 6,911,085 | |
iShares Global Tech ETF | | | 44,597 | | | | 7,024,473 | |
iShares Micro-Capital ETF | | | 55,428 | | | | 5,395,916 | |
PowerShares DB Energy Fund* | | | 405,263 | | | | 6,524,734 | |
Vanguard FTSE All World ex-US Small-Capital ETF | | | 47,951 | | | | 5,735,419 | |
Vanguard FTSE Developed Markets ETF | | | 128,426 | | | | 5,754,769 | |
Vanguard FTSE Emerging Markets ETF | | | 179,658 | | | | 8,206,777 | |
Vanguard Global ex-U.S. Real Estate ETF | | | 82,403 | | | | 5,046,360 | |
WisdomTree Emerging Markets SmallCap Dividend Fund | | | 123,053 | | | | 6,428,289 | |
| | | | | | | | | |
| | | | | | | | | |
Total Exchange Traded Funds | | | | | | | | |
(Cost $93,378,579) | | | | | | | 102,769,003 | |
| | | | | | | | | |
Total Investments - 97.5% | | | | | | | | |
(Cost $93,378,579) | | | | | | $ | 102,769,003 | |
Other Assets and Liabilities - 2.5% | | | | | | | 2,688,434 | |
Net Assets - 100.0% | | | | | | $ | 105,457,437 | |
Percentages based on Net Assets.
The accompanying notes are an integral part of the financial statements.
Cambria Investment Management Schedule of Investments ● Cambria Global Momentum ETF April 30, 2018 |
* | Non-income producing security. |
‡ | Affiliated investment is a registered investment company which is managed by Cambria Investment Management, L.P. (the "Investment Adviser") or an affiliate of the Investment Adviser or which is distributed by an affiliate of the Fund's distributor. Transactions with affiliated companies during the year ended April 30, 2018 are as follows: |
| | | | | | | | | | | | | Change in | | | | | | | | | | | | | |
Value of | | | | | | | | | | | Unrealized | | | | | | | Value of | | | | | |
Shares Held | | | Purchases | | | Proceeds | | | Appreciation | | | Realized | | | Shares Held | | | Dividend | |
as of 04/30/17 | | | at Cost | | | from Sales | | | (Depreciation) | | | Gain (Loss) | | | as of 04/30/18 | | | Income | |
Cambria Emerging Shareholder Yield ETF | | | | | | | | | | | | | | | | | | | | | |
| $ | 3,867,209 | | | $ | 7,126,620 | | | $ | - | | | $ | 1,132,829 | | | $ | - | | | $ | 12,126,658 | | | $ | 202,647 | |
Cambria Foreign Shareholder Yield ETF | | | | | | | | | | | | | | | | | | | | | |
| | 3,129,618 | | | | 2,324,412 | | | | - | | | | 565,470 | | | | - | | | | 6,019,500 | | | | 123,073 | |
Cambria Global Value ETF | | | | | | | | | | | | | | | | | | | | | |
| | 3,566,743 | | | | 7,421,849 | | | | - | | | | 633,989 | | | | - | | | | 11,622,581 | | | | 125,793 | |
Cambria Shareholder Yield ETF | | | | | | | | | | | | | | | | | | | | | |
| | 3,003,050 | | | | 5,244,684 | | | | (3,713,392 | ) | | | (74,927 | ) | | | 122,333 | | | | 4,581,748 | | | | 38,815 | |
| $ | 13,566,620 | | | $ | 22,117,565 | | | $ | (3,713,392 | ) | | $ | 2,257,361 | | | $ | 122,333 | | | $ | 34,350,487 | | | $ | 490,328 | |
ETF — Exchanged Traded Fund |
FTSE — Financial Times Stock Exchange |
As of April 30, 2018, all of the Fund's investments in securities were considered Level 1, in accordance with the authoritative guidance on fair value measurements and disclosure under U.S. generally accepted accounting principles.
Please see Note 2 in Notes to Financial Statements for further information regarding fair value measurements.
There have been no transfers between Level 1, Level 2 or Level 3 assets and liabilities. It is the Fund’s policy to recognize transfers into and out of all Levels at the end of the reporting period.
The accompanying notes are an integral part of the financial statements.
Cambria Investment Management Schedule of Investments ● Cambria Global Asset Allocation ETF April 30, 2018 |
��
Sector Weightings (Unaudited)†: | |
| |
| | |
† Percentages based on total investments. | |
Description | | Shares | | | Value | |
| | | | | | | | | |
EXCHANGE TRADED FUNDS — 99.4% | | | | | |
Alpha Architect Value Momentum Trend ETF | | | 45,989 | | | $ | 1,318,045 | |
Cambria Emerging Shareholder Yield ETF‡ | | | 172,558 | | | | 6,201,182 | |
Cambria Foreign Shareholder Yield ETF‡ | | | 116,132 | | | | 3,089,111 | |
Cambria Global Value ETF‡ | | | 143,909 | | | | 3,746,095 | |
Cambria Shareholder Yield ETF‡ | | | 95,428 | | | | 3,633,898 | |
Cambria Sovereign Bond ETF‡ | | | 199,981 | | | | 5,549,473 | |
iShares Edge MSCI USA Momentum Factor ETF | | | 25,800 | | | | 2,746,410 | |
iShares Short Treasury Bond ETF | | | 12,113 | | | | 1,336,791 | |
PowerShares DB Optimum Yield Diversified Commodity Strategy Portfolio | | | 269,494 | | | | 4,966,774 | |
Schwab U.S. REIT ETF | | | 48,330 | | | | 1,875,687 | |
Schwab US TIPs ETF | | | 36,254 | | | | 1,984,181 | |
SPDR Citi International Government Inflation-Protected Bond ETF | | | 34,909 | | | | 1,997,493 | |
VanEck Vectors Emerging Markets High Yield Bond ETF | | | 108,975 | | | | 2,582,708 | |
VanEck Vectors International High Yield Bond ETF | | | 52,224 | | | | 1,313,267 | |
Vanguard FTSE Developed Markets ETF | | | 29,864 | | | | 1,338,206 | |
Vanguard Global ex-U.S. Real Estate ETF | | | 33,138 | | | | 2,029,371 | |
Vanguard Intermediate-Term Corporate Bond ETF | | | 22,924 | | | | 1,918,051 | |
Vanguard Intermediate-Term Treasury ETF | | | 44,938 | | | | 2,800,087 | |
Vanguard Long-Term Treasury ETF | | | 33,347 | | | | 2,445,002 | |
Vanguard Mid-Capital ETF | | | 8,609 | | | | 1,325,011 | |
Vanguard Short-Term Corporate Bond ETF | | | 16,836 | | | | 1,315,902 | |
Vanguard Total Bond Market ETF | | | 65,562 | | | | 5,182,676 | |
Vanguard Total International Bond ETF | | | 61,398 | | | | 3,352,331 | |
Vanguard Total Stock Market ETF | | | 19,425 | | | | 2,648,210 | |
The accompanying notes are an integral part of the financial statements.
Cambria Investment Management Schedule of Investments ● Cambria Global Asset Allocation ETF April 30, 2018 |
Description | | Value | |
| | | | | |
| | | | | |
Total Exchange Traded Funds | | | | |
(Cost $65,071,330) | | $ | 66,695,962 | |
| | | | | |
Total Investments - 99.4% | | | | |
(Cost $65,071,330) | | $ | 66,695,962 | |
Other Assets and Liabilities - 0.6% | | | 376,619 | |
Net Assets - 100.0% | | $ | 67,072,581 | |
Percentages based on Net Assets.
* | Non-income producing security. |
‡ | Affiliated investment is a registered investment company which is managed by Cambria Investment Management, L.P. (the "Investment Adviser") or an affiliate of the Investment Adviser or which is distributed by an affiliate of the Fund's distributor. Transactions with affiliated companies during the year ended April 30, 2018 are as follows: |
| | | | | | | | | | | | | Change in | | | | | | | | | | | | | |
Value of | | | | | | | | | | | Unrealized | | | | | | | Value of | | | | | |
Shares Held | | | Purchases | | | Proceeds | | | Appreciation | | | Realized | | | Shares Held | | | Dividend | |
as of 04/30/17 | | | at Cost | | | from Sales | | | (Depreciation) | | | Gain (Loss) | | | as of 04/30/18 | | | Income | |
Cambria Emerging Shareholder Yield ETF | | | | | | | | | | | | | | | | | | | | | |
| $ | 3,950,496 | | | $ | 3,058,014 | | | $ | (1,675,915 | ) | | $ | 425,479 | | | $ | 443,108 | | | $ | 6,201,182 | | | $ | 146,996 | |
Cambria Foreign Shareholder Yield ETF | | | | | | | | | | | | | | | | | | | | | |
| | 719,637 | | | | 2,379,749 | | | | (142,107 | ) | | | 97,544 | | | | 34,288 | | | | 3,089,111 | | | | 26,886 | |
Cambria Global Value ETF | | | | | | | | | | | | | | | | | | | | | |
| | 1,558,127 | | | | 2,352,525 | | | | (415,709 | ) | | | 161,821 | | | | 89,331 | | | | 3,746,095 | | | | 39,942 | |
Cambria Shareholder Yield ETF | | | | | | | | | | | | | | | | | | | | | |
| | 1,161,508.0 | | | | 2,485,251 | | | | (157,704 | ) | | | 105,090 | | | | 39,753 | | | | 3,633,898 | | | | 27,276 | |
Cambria Sovereign Bond ETF | | | | | | | | | | | | | | | | | | | | | |
| | 1,324,935 | | | | 4,484,413 | | | | (218,531 | ) | | | -65,210 | | | | 23,866 | | | | 5,549,473 | | | | 116,249 | |
| $ | 8,714,702 | | | $ | 14,759,952 | | | $ | (2,609,966 | ) | | $ | 724,724 | | | $ | 630,346 | | | $ | 22,219,759 | | | $ | 357,349 | |
ETF — Exchanged Traded Fund |
FTSE — Financial Times Stock Exchange |
MSCI — Morgan Stanley Capital International |
REIT — Real Estate Investment Trust |
SPDR — Standard & Poor’s Depositary Receipt |
TIPS — Treasury Inflation Protected Security |
As of April 30, 2018, all of the Fund's investments in securities were considered Level 1, in accordance with the authoritative guidance on fair value measurements and disclosure under U.S. generally accepted accounting principles.
Please see Note 2 in Notes to Financial Statements for further information regarding fair value measurements.
There have been no transfers between Level 1, Level 2 or Level 3 assets and liabilities. It is the Fund’s policy to recognize transfers into and out of all Levels at the end of the reporting period.
The accompanying notes are an integral part of the financial statements.
Cambria Investment Management
Schedule of Investments ● Cambria Value and Momentum ETF
April 30, 2018
Sector Weightings (Unaudited)†: |
|
| |
† Percentages based on total investments. |
Description | | Shares | | | Value | |
| | | | | | | | | |
COMMON STOCK — 92.1% | | | | | |
| | | | | | |
Consumer Discretionary — 26.6% | | | | | |
Aaron's | | | 5,382 | | | $ | 224,806 | |
Abercrombie & Fitch, Cl A | | | 14,772 | | | | 378,460 | |
Adtalem Global Education* | | | 6,680 | | | | 317,968 | |
American Eagle Outfitters | | | 11,458 | | | | 236,951 | |
Best Buy | | | 4,914 | | | | 376,069 | |
Buckle | | | 10,286 | | | | 237,092 | |
Career Education* | | | 35,489 | | | | 460,292 | |
Citi Trends | | | 9,571 | | | | 293,160 | |
Conn's* | | | 12,117 | | | | 308,984 | |
Crocs* | | | 31,201 | | | | 492,975 | |
Deckers Outdoor* | | | 2,614 | | | | 243,782 | |
Dillard's, Cl A | | | 2,951 | | | | 219,997 | |
Fiat Chrysler Automobiles* | | | 14,482 | | | | 316,142 | |
Fossil Group* | | | 18,488 | | | | 276,396 | |
Gannett | | | 22,418 | | | | 216,782 | |
Gap | | | 7,647 | | | | 223,598 | |
Guess? | | | 16,984 | | | | 395,558 | |
Hibbett Sports* | | | 9,332 | | | | 253,830 | |
ILG | | | 11,025 | | | | 376,283 | |
KB Home | | | 9,235 | | | | 245,189 | |
Kohl's | | | 3,610 | | | | 224,253 | |
Michael Kors Holdings* | | | 3,653 | | | | 249,938 | |
Movado Group | | | 10,459 | | | | 412,608 | |
Penn National Gaming* | | | 11,101 | | | | 336,471 | |
Scientific Games, Cl A* | | | 7,774 | | | | 414,355 | |
Tailored Brands | | | 8,899 | | | | 280,763 | |
Tilly's, Cl A | | | 16,905 | | | | 189,505 | |
Urban Outfitters* | | | 6,131 | | | | 246,895 | |
The accompanying notes are an integral part of the financial statements.
Cambria Investment Management
Schedule of Investments ● Cambria Value and Momentum ETF
April 30, 2018
Description | | Shares | | | Value | |
| | | | | | | | | |
Zumiez* | | | 9,370 | | | $ | 219,258 | |
| | | | | | | | 8,668,360 | |
Energy — 8.4% | | | | | |
Arch Coal | | | 2,471 | | | | 199,731 | |
Cosan, Cl A | | | 22,142 | | | | 223,191 | |
Delek US Holdings | | | 8,059 | | | | 381,754 | |
HollyFrontier | | | 5,436 | | | | 329,911 | |
Mammoth Energy Services* | | | 7,340 | | | | 238,403 | |
PBF Energy, Cl A | | | 6,735 | | | | 258,153 | |
Peabody Energy | | | 6,121 | | | | 225,559 | |
Renewable Energy Group* | | | 16,566 | | | | 213,701 | |
Valero Energy | | | 2,964 | | | | 328,797 | |
W&T Offshore* | | | 54,398 | | | | 331,828 | |
| | | | | | | | 2,731,028 | |
Financials — 28.8% | | | | | |
American Equity Investment Life Holding | | | 12,167 | | | | 367,443 | |
American Financial Group | | | 4,290 | | | | 485,714 | |
B. Riley Financial | | | 17,425 | | | | 359,826 | |
Bancorp* | | | 35,653 | | | | 369,008 | |
Bank of America | | | 12,141 | | | | 363,259 | |
Cannae Holdings* | | | 12,206 | | | | 252,176 | |
Citizens Financial Group | | | 8,137 | | | | 337,604 | |
CNA Financial | | | 6,501 | | | | 328,040 | |
Corporate Capital Trust | | | 13,430 | | | | 227,370 | |
Encore Capital Group* | | | 5,076 | | | | 226,390 | |
Enova International* | | | 14,433 | | | | 422,887 | |
EZCORP, Cl A* | | | 17,679 | | | | 242,202 | |
First American Financial | | | 6,034 | | | | 308,398 | |
Green Dot, Cl A* | | | 6,888 | | | | 418,859 | |
Health Insurance Innovations, Cl A* | | | 11,776 | | | | 335,616 | |
Heritage Insurance Holdings | | | 15,241 | | | | 239,284 | |
Kemper | | | 3,797 | | | | 256,298 | |
Old Republic International | | | 19,136 | | | | 390,374 | |
Progressive | | | 9,932 | | | | 598,801 | |
Regions Financial | | | 14,874 | | | | 278,144 | |
Reinsurance Group of America, Cl A | | | 3,224 | | | | 481,666 | |
Selective Insurance Group | | | 9,750 | | | | 577,200 | |
Universal Insurance Holdings | | | 7,300 | | | | 236,885 | |
Validus Holdings | | | 3,357 | | | | 227,504 | |
Voya Financial | | | 4,604 | | | | 241,019 | |
Walker & Dunlop | | | 4,372 | | | | 249,685 | |
World Acceptance* | | | 3,274 | | | | 335,585 | |
XL Group | | | 4,107 | | | | 228,308 | |
| | | | | | | | 9,385,545 | |
The accompanying notes are an integral part of the financial statements.
Cambria Investment Management
Schedule of Investments ● Cambria Value and Momentum ETF
April 30, 2018
Description | | Shares | | | Value | |
| | | | | | | | | |
Health Care — 5.1% | | | | | | | | |
Anthem | | | 1,072 | | | $ | 252,981 | |
Centene* | | | 3,151 | | | | 342,136 | |
Concert Pharmaceuticals* | | | 11,510 | | | | 210,058 | |
Humana | | | 1,228 | | | | 361,253 | |
Triple-S Management, Cl B* | | | 10,121 | | | | 286,930 | |
| WellCare Health Plans* | | | 1,121 | | | | 229,984 | |
| | | | | | | | 1,683,342 | |
Industrials — 7.8% | | | | | | | | |
ArcBest | | | 8,996 | | | | 288,771 | |
Boeing | | | 1,149 | | | | 383,260 | |
China Yuchai International | | | 10,639 | | | | 221,398 | |
Greenbrier | | | 5,069 | | | | 222,275 | |
Heritage-Crystal Clean* | | | 13,552 | | | | 286,625 | |
Kelly Services, Cl A | | | 7,871 | | | | 230,305 | |
Korn | | | 7,491 | | | | 400,470 | |
Rush Enterprises, Cl A* | | | 5,877 | | | | 239,958 | |
Werner Enterprises | | | 8,196 | | | | 281,123 | |
| | | | | | | | 2,554,185 | |
Information Technology — 5.8% | | | | | | | | |
Comtech Telecommunications | | | 13,890 | | | | 424,895 | |
Electro Scientific Industries* | | | 12,586 | | | | 226,548 | |
First Solar* | | | 3,722 | | | | 263,927 | |
HP | | | 14,904 | | | | 320,287 | |
Jabil | | | 6,870 | | | | 182,742 | |
KEMET* | | | 16,432 | | | | 282,959 | |
Micron Technology* | | | 4,520 | | | | 207,830 | |
| | | | | | | | 1,909,188 | |
Materials — 8.9% | | | | | | | | |
Alcoa* | | | 7,304 | | | | 373,965 | |
Century Aluminum* | | | 23,063 | | | | 402,910 | |
Huntsman | | | 8,038 | | | | 239,291 | |
Intrepid Potash* | | | 69,244 | | | | 313,676 | |
Louisiana-Pacific | | | 10,377 | | | | 293,980 | |
Resolute Forest Products* | | | 26,940 | | | | 266,706 | |
Schnitzer Steel Industries, Cl A | | | 10,459 | | | | 308,018 | |
Tronox, Cl A | | | 15,006 | | | | 257,803 | |
Verso* | | | 14,214 | | | | 256,705 | |
Warrior Met Coal | | | 7,904 | | | | 183,768 | |
| | | | | | | | 2,896,822 | |
Real Estate — 0.7% | | | | | | | | |
Jones Lang LaSalle | | | 1,322 | | | | 224,092 | |
The accompanying notes are an integral part of the financial statements.
Cambria Investment Management
Schedule of Investments ● Cambria Value and Momentum ETF
April 30, 2018
Description | | Shares | | | Value | |
| | | | | | | | | |
| | | | | | | | | |
Total Common Stock | | | | | | | | |
(Cost $27,789,378) | | | | | | $ | 30,052,562 | |
| | | | | | | | | |
Total Investments - 92.1% | | | | | | | | |
(Cost $27,789,378) | | | | | | $ | 30,052,562 | |
Other Assets and Liabilities - 7.9% | | | | | | | 2,564,510 | |
Net Assets - 100.0% | | | | | | $ | 32,617,072 | |
Percentages based on Net Assets.
* | Non-income producing security. |
The open futures contracts held by the Fund at April 30, 2018, is as follows: | |
| | | Number of | | | | | | | | | | | | | | |
Type of | | Contracts | | Expiration | | Notional | | | Value | | | Unrealized | |
Contract | | Short | | Date | | Amount | | | | | | | Appreciation | |
S&P 500 Index EMINI | | | (152 | ) | Jun-2018 | | $ | (20,422,976 | ) | | $ | (20,117,200 | ) | | $ | 305,776 | |
For the period ended April 30, 2018, the monthly average notional value of the short equity futures contracts held was $(7,031,579) and the ending notional value of short equity futures contracts held was $(20,422,976).
For the period ended April 30, 2018, the monthly average notional value of the options was $452,305. There were no options held at year end.
The following is a list of the inputs used as of April 30, 2018 in valuing the Fund’s investments carried at value: |
Investments in Securities | | Level 1 | | | Level 2 | | | Level 3 | | | Total | |
Common Stock | | $ | 30,052,562 | | | $ | — | | | $ | — | | | $ | 30,052,562 | |
Total Investments in Securities | | $ | 30,052,562 | | | $ | — | | | $ | — | | | $ | 30,052,562 | |
Other Financial Instruments | | Level 1 | | | Level 2 | | | Level 3 | | | Total | |
Future Contracts Unrealized Appreciation | | $ | 305,776 | | | $ | — | | | $ | — | | | $ | 305,776 | |
Total Other Financial Instruments | | $ | 305,776 | | | $ | — | | | $ | — | | | $ | 305,776 | |
Please see Note 2 in Notes to Financial Statements for further information regarding fair value measurements.
There have been no transfers between Level 1, Level 2 or Level 3 assets and liabilities. It is the Fund’s policy to recognize transfers into and out of all Levels at the end of the reporting period.
The accompanying notes are an integral part of the financial statements.
Cambria Investment Management
Schedule of Investments ● Cambria Sovereign Bond ETF
April 30, 2018
Sector Weightings (Unaudited)† |

† Percentages based on total investments. |
Description | | | Face Amount(1) | | | Value | |
| | | | | | | | | | |
SOVEREIGN DEBT — 89.0% | | | | | |
| | | | | | |
Argentina — 3.6% | | | | | |
Argentine Bonos del Tesoro | | | | | | | | | |
18.200%, 10/03/21 | ARS | | | 5,205,032 | | | $ | 241,752 | |
16.000%, 10/17/23 | ARS | | | 5,160,736 | | | | 230,764 | |
15.500%, 10/17/26 | ARS | | | 4,944,282 | | | | 223,786 | |
| | | | | | | | | 696,302 | |
Australia — 3.7% | | | | | |
Queensland Treasury | | | | | | | | | |
5.750%, 07/22/24 | AUD | | | 406,000 | | | | 355,762 | |
4.750%, 07/21/25 (A) | AUD | | | 434,000 | | | | 364,093 | |
| | | | | | | | | 719,855 | |
Brazil — 7.5% | | | | | |
Brazilian Government International Bond | | | | | | | | | |
8.500%, 01/05/24 | BRL | | | 4,900,000 | | | | 1,444,739 | |
| | | | | | | | | | |
Colombia — 4.7% | | | | | |
Colombian TES | | | | | | | | | |
11.000%, 07/24/20 | COP | | | 741,000,000 | | | | 296,947 | |
7.500%, 08/26/26 | COP | | | 812,500,000 | | | | 312,178 | |
7.000%, 05/04/22 | COP | | | 819,000,000 | | | | 307,576 | |
| | | | | | | | | 916,701 | |
Greece — 8.0% | | | | | |
Hellenic Republic Government Bond | | | | | | | | | |
4.750%, 04/17/19 (A) | EUR | | | 224,000 | | | | 280,186 | |
3.000%, 02/24/23 (B) | EUR | | | 162,792 | | | | 198,402 | |
3.000%, 02/24/24 (B) | EUR | | | 873,852 | | | | 1,058,898 | |
| | | | | | | | | 1,537,486 | |
Hungary — 4.8% | | | | | |
Hungary Government Bond | | | | | | | | | |
6.000%, 11/24/23 | HUF | | | 92,820,000 | | | | 443,363 | |
5.500%, 06/24/25 | HUF | | | 94,780,000 | | | | 447,909 | |
3.000%, 06/26/24 | HUF | | | 10,660,000 | | | | 43,975 | |
| | | | | | | | | 935,247 | |
Indonesia — 3.6% | | | | | |
Indonesia Treasury Bond | | | | | | | | | |
8.375%, 03/15/24 | IDR | | | 4,476,000,000 | | | | 344,949 | |
7.000%, 05/15/27 | IDR | | | 4,800,000,000 | | | | 347,601 | |
| | | | | | | | | 692,550 | |
The accompanying notes are an integral part of the financial statements.
Cambria Investment Management
Schedule of Investments ● Cambria Sovereign Bond ETF
April 30, 2018
Description | | | Face Amount(1) | | | Value | |
| | | | | | | | | | |
Malaysia — 3.7% | | | | | |
Malaysia Government Bond | | | | | | | | | |
4.498%, 04/15/30 | MYR | | | 1,563,000 | | | $ | 397,088 | |
4.392%, 04/15/26 | MYR | | | 110,000 | | | | 28,506 | |
4.181%, 07/15/24 | MYR | | | 1,010,000 | | | | 258,570 | |
Malaysia Government Investment Issue | | | | | | | | | |
4.070%, 09/30/26 | MYR | | | 110,000 | | | | 27,571 | |
| | | | | | | | | 711,735 | |
Mexico — 5.4% | | | | | |
Mexican Bonos | | | | | | | | | |
10.000%, 12/05/24 | MXN | | | 4,773,200 | | | | 290,375 | |
8.500%, 05/31/29 | MXN | | | 8,743,500 | | | | 501,388 | |
7.500%, 06/03/27 | MXN | | | 4,585,000 | | | | 245,280 | |
| | | | | | | | | 1,037,043 | |
New Zealand — 2.5% | | | | | |
New Zealand Government Bond | | | | | | | | | |
4.500%, 04/15/27 | NZD | | | 602,000 | | | | 478,270 | |
| | | | | | | | | | |
Philippines — 2.8% | | | | | |
Philippine Government Bond | | | | | | | | | |
8.000%, 07/19/31 | PHP | | | 23,858,684 | | | | 536,009 | |
| | | | | | | | | | |
Poland — 5.1% | | | | | |
Poland Government Bond | | | | | | | | | |
5.750%, 04/25/29 | PLN | | | 1,988,000 | | | | 706,874 | |
Republic of Poland Government Bond | | | | | | | | | |
3.250%, 07/25/25 | PLN | | | 462,000 | | | | 135,026 | |
2.500%, 07/25/26 | PLN | | | 504,000 | | | | 138,728 | |
| | | | | | | | | 980,628 | |
Portugal — 6.3% | | | | | |
Portugal Obrigacoes do Tesouro OT | | | | | | | | | |
4.125%, 04/14/27 (A) | EUR | | | 405,289 | | | | 596,857 | |
3.875%, 02/15/30 (A) | EUR | | | 424,413 | | | | 617,460 | |
| | | | | | | | | 1,214,317 | |
Romania — 4.3% | | | | | |
Romania Government Bond | | | | | | | | | |
5.850%, 04/26/23 | RON | | | 980,000 | | | | 271,958 | |
5.800%, 07/26/27 | RON | | | 980,000 | | | | 275,998 | |
4.750%, 02/24/25 | RON | | | 1,050,000 | | | | 277,386 | |
| | | | | | | | | 825,342 | |
Russia — 7.2% | | | | | |
Russian Federal Bond - OFZ | | | | | | | | | |
7.600%, 04/14/21 | RUB | | | 54,250,000 | | | | 884,954 | |
7.600%, 07/20/22 | RUB | | | 17,444,000 | | | | 285,315 | |
7.000%, 01/25/23 | RUB | | | 14,112,000 | | | | 226,679 | |
| | | | | | | | | 1,396,948 | |
The accompanying notes are an integral part of the financial statements.
Cambria Investment Management
Schedule of Investments ● Cambria Sovereign Bond ETF
April 30, 2018
Description | | | Face Amount(1) | | | Value | |
| | | | | | | | | | |
South Africa — 6.8% | | | | | |
Republic of South Africa Government Bond | | | | | | | | | |
8.250%, 03/31/32 | ZAR | | | 2,970,982 | | | $ | 228,664 | |
8.000%, 01/31/30 | ZAR | | | 11,136,482 | | | | 855,271 | |
7.000%, 02/28/31 | ZAR | | | 3,332,728 | | | | 233,144 | |
| | | | | | | | | 1,317,079 | |
Thailand — 3.7% | | | | | |
Thailand Government Bond | | | | | | | | | |
3.625%, 06/16/23 | THB | | | 20,667,000 | | | | 707,258 | |
| | | | | | | | | | |
Turkey — 5.3% | | | | | |
Turkey Government Bond | | | | | | | | | |
10.700%, 02/17/21 | TRY | | | 2,226,000 | | | | 510,729 | |
8.500%, 09/14/22 | TRY | | | 2,450,000 | | | | 514,475 | |
| | | | | | | | 1,025,204 | |
Total Sovereign Debt | | | | | |
(Cost $17,051,036) | | | | | | | 17,172,713 | |
| | | | | | | | | |
Total Investments - 89.0% | | | | | | | | |
(Cost $17,051,036) | | | | | | $ | 17,172,713 | |
Other Assets and Liabilities - 11.0% | | | | | | | 2,126,286 | |
Net Assets - 100.0% | | | | | | $ | 19,298,999 | |
Percentages based on Net Assets.
(1) | In foreign currency unless otherwise indicated. |
(A) | Securities sold within terms of a private placement memorandum, exempt from registration under Section 144A of the Securities Act of 1933, as amended, and may be sold only to dealers in that program or other "accredited investors." These securities are deemed to be liquid by the Board of Trustees. The total value of such securities at April 30, 2018 was $1,858,596 and represents 9.6% of Net Assets. |
(B) | Step Bond - The rate reflected on the Schedule of Investments is the effective yield on April 30, 2018. The coupon on a step bond changes on a specified date. |
ARS — Argentine Peso |
AUD — Australian Dollar |
BRL — Brazilian Real |
COP — Colombian Peso |
EUR — Euro |
HUF — Hungarian Forint |
IDR — Indonesian Rupiah |
MXN — Mexican Peso |
MYR — Malaysian Ringgit |
NZD — New Zealand Dollar |
PHP — Philippine Peso |
PLN — Polish Zloty |
RON — Romanian Leu |
RUB — Russian Ruble |
THB — Thailand Baht |
TRY — Turkish Lira |
ZAR — South African Rand |
As of April 30, 2018, all of the Fund's investments in securities were considered Level 2, in accordance with the authoritative guidance on fair value measurements and disclosure under U.S. generally accepted accounting principles.
Please see Note 2 in Notes to Financial Statements for further information regarding fair value measurements.
There have been no transfers between Level 1, Level 2 or Level 3 assets and liabilities. It is the Fund’s policy to recognize transfers into and out of all Levels at the end of the reporting period.
The accompanying notes are an integral part of the financial statements.
Cambria Investment Management
Schedule of Investments ● Cambria Emerging Shareholder Yield ETF
April 30, 2018
| |
Sector Weightings (Unaudited)† |
|
| |
† Percentages based on total investments. |
Description | | Shares | | | Value | |
| | | | | | | | | |
| COMMON STOCK — 97.6% | | | | | | | | |
| | | | | | | | | |
| Brazil — 13.6% | | | | | | | | |
Ez Tec Empreendimentos e Participacoes | | | 40,800 | | | $ | 231,299 | |
Magazine Luiza | | | 114,200 | | | | 3,461,011 | |
SLC Agricola | | | 34,000 | | | | 435,676 | |
| | | | | | | | 4,127,986 | |
China — 1.8% | | | | | | | | |
China Petroleum & Chemical ADR | | | 2,839 | | | | 276,916 | |
CNOOC ADR | | | 1,649 | | | | 278,698 | |
| | | | | | | | 555,614 | |
Colombia — 0.8% | | | | | | | | |
Banco de Bogota | | | 10,387 | | | | 256,628 | |
| | | | | | | | | |
Czech Republic — 1.1% | | | | | | | | |
O2 Czech Republic | | | 25,007 | | | | 342,165 | |
| | | | | | | | | |
Greece — 2.9% | | | | | | | | |
Aegean Airlines | | | 27,897 | | | | 314,986 | |
Hellenic Petroleum | | | 22,967 | | | | 234,360 | |
Motor Oil Hellas Corinth Refineries | | | 14,212 | | | | 339,472 | |
| | | | | | | | 888,818 | |
Hong Kong — 13.3% | | | | | | | | |
China Lilang | | | 340,000 | | | | 428,430 | |
CPMC Holdings | | | 476,000 | | | | 295,353 | |
Fantasia Holdings Group | | | 714,000 | | | | 141,915 | |
Flat Glass Group, Cl H | | | 1,054,000 | | | | 329,012 | |
Greatview Aseptic Packaging | | | 323,000 | | | | 214,410 | |
Greenland Hong Kong Holdings | | | 595,000 | | | | 277,462 | |
Guangzhou R&F Properties | | | 149,600 | | | | 359,864 | |
Industrial & Commercial Bank of China, Cl H | | | 306,000 | | | | 272,133 | |
Red Star Macalline Group, Cl H (A) | | | 204,000 | | | | 276,032 | |
Sino-Ocean Group Holding | | | 425,000 | | | | 297,822 | |
The accompanying notes are an integral part of the financial statements.
Cambria Investment Management
Schedule of Investments ● Cambria Emerging Shareholder Yield ETF
April 30, 2018
Description | | Shares | | | Value | |
| | | | | | | | | |
Sinopec Shanghai Petrochemical ADR | | | 4,301 | | | $ | 283,952 | |
Tianneng Power International | | | 306,000 | | | | 444,458 | |
Weiqiao Textile, Cl H | | | 119,000 | | | | 57,767 | |
Xingda International Holdings | | | 510,000 | | | | 183,892 | |
Zoomlion Heavy Industry Science and Technology | | | 442,000 | | | | 190,909 | |
| | | | | | | | 4,053,411 | |
| Hungary — 1.3% | | | | | | | | |
OTP Bank Nyrt | | | 9,044 | | | | 395,128 | |
| | | | | | | | | |
India — 5.3% | | | | | | | | |
Chennai Petroleum | | | 46,837 | | | | 225,307 | |
Hindustan Petroleum | | | 22,083 | | | | 100,753 | |
Hindustan Zinc | | | 71,944 | | | | 352,336 | |
Indian Oil | | | 109,076 | | | | 265,254 | |
Rural Electrification | | | 112,880 | | | | 215,646 | |
Sonata Software | | | 85,324 | | | | 458,581 | |
| | | | | | | | 1,617,877 | |
Mexico — 0.6% | | | | | | | | |
Rassini, Cl A | | | 91,800 | | | | 191,483 | |
| | | | | | | | | |
| Poland — 0.8% | | | | | | | | |
Budimex | | | 4,692 | | | | 251,053 | |
| | | | | | | | | |
| Russia — 8.3% | | | | | | | | |
Alrosa PJSC | | | 207,400 | | | | 295,131 | |
Center for Cargo Container Traffic TransContainer PJSC | | | 4,335 | | | | 342,133 | |
Gazprom Neft PJSC | | | 63,240 | | | | 309,509 | |
Gazprom PJSC ADR | | | 48,025 | | | | 218,994 | |
LUKOIL PJSC ADR | | | 4,862 | | | | 320,357 | |
Magnitogorsk Iron & Steel Works PJSC | | | 176,800 | | | | 136,673 | |
Novolipetsk Steel PJSC | | | 129,880 | | | | 332,390 | |
Sberbank of Russia PJSC | | | 32,980 | | | | 118,879 | |
Tatneft PJSC ADR | | | 6,970 | | | | 445,383 | |
| | | | | | | | 2,519,449 | |
| South Africa — 13.5% | | | | | | | | |
African Oxygen | | | 58,429 | | | | 142,733 | |
Assore | | | 15,674 | | | | 386,550 | |
Astral Foods | | | 6,120 | | | | 150,881 | |
Barclays Africa Group | | | 16,711 | | | | 245,323 | |
BHP Billiton | | | 15,334 | | | | 327,654 | |
Coronation Fund Managers | | | 44,863 | | | | 266,983 | |
FirstRand | | | 64,702 | | | | 347,569 | |
The accompanying notes are an integral part of the financial statements.
Cambria Investment Management
Schedule of Investments ● Cambria Emerging Shareholder Yield ETF
April 30, 2018
Description | | Shares | | | Value | |
| | | | | | | | | |
Imperial Holdings | | | 20,111 | | | $ | 387,812 | |
Kumba Iron Ore | | | 16,796 | | | | 361,845 | |
Liberty Holdings | | | 23,851 | | | | 253,588 | |
RMB Holdings | | | 49,844 | | | | 313,419 | |
Sanlam | | | 48,348 | | | | 307,232 | |
Standard Bank Group | | | 23,307 | | | | 400,734 | |
Telkom SOC | | | 46,308 | | | | 211,089 | |
| | | | | | | | 4,103,412 | |
| South Korea — 9.9% | | | | | | | | |
Hana Financial Group | | | 10,268 | | | | 459,057 | |
Huvis | | | 31,943 | | | | 403,755 | |
Hyundai Marine & Fire Insurance | | | 8,228 | | | | 294,669 | |
Kumho Industrial | | | 32,266 | | | | 398,775 | |
Meritz Fire & Marine Insurance | | | 11,730 | | | | 230,086 | |
Samsung Electronics (B) | | | 170 | | | | 421,797 | |
SK Innovation | | | 1,649 | | | | 303,383 | |
S-Oil | | | 1,326 | | | | 136,567 | |
Woori Bank | | | 24,616 | | | | 369,914 | |
| | | | | | | | 3,018,003 | |
| Taiwan — 15.5% | | | | | | | | |
Actron Technology | | | 51,000 | | | | 179,271 | |
Asustek Computer | | | 17,000 | | | | 159,735 | |
Aten International | | | 85,000 | | | | 282,122 | |
Chang Wah Electromaterials | | | 51,000 | | | | 254,254 | |
Chaun-Choung Technology | | | 34,000 | | | | 87,912 | |
Chicony Electronics | | | 85,000 | | | | 210,299 | |
Chilisin Electronics | | | 85,000 | | | | 266,321 | |
Chin-Poon Industrial | | | 102,000 | | | | 134,970 | |
Chunghwa Telecom ADR | | | 5,508 | | | | 209,249 | |
CyberPower Systems | | | 51,000 | | | | 154,104 | |
Elite Advanced Laser | | | 61,200 | | | | 216,159 | |
Elite Material | | | 68,000 | | | | 167,779 | |
Hon Hai Precision Industry | | | 68,000 | | | | 190,533 | |
Micro-Star International | | | 68,000 | | | | 214,665 | |
Nishoku Technology | | | 34,000 | | | | 91,474 | |
Pegatron | | | 68,000 | | | | 159,735 | |
Phison Electronics | | | 34,000 | | | | 309,703 | |
Powertech Technology | | | 85,000 | | | | 245,348 | |
Simplo Technology | | | 42,400 | | | | 238,609 | |
Sitronix Technology | | | 68,000 | | | | 195,819 | |
Thinking Electronic Industrial | | | 68,000 | | | | 192,372 | |
Tripod Technology | | | 102,000 | | | | 309,932 | |
The accompanying notes are an integral part of the financial statements.
Cambria Investment Management
Schedule of Investments ● Cambria Emerging Shareholder Yield ETF
April 30, 2018
Description | | Shares | | | Value | |
| | | | | | | | | |
Vivotek | | | 85,000 | | | $ | 233,857 | |
| | | | | | | | 4,704,222 | |
| Thailand — 4.5% | | | | | | | | |
PTT | | | 187,000 | | | | 334,775 | |
PTT Exploration & Production | | | 89,777 | | | | 381,182 | |
PTT Global Chemical | | | 115,600 | | | | 358,961 | |
Thai Oil | | | 98,600 | | | | 294,457 | |
| | | | | | | | 1,369,375 | |
| Turkey — 4.4% | | | | | | | | |
Aksa Akrilik Kimya Sanayii | | | 52,241 | | | | 171,046 | |
Aygaz | | | 52,530 | | | | 174,320 | |
Eregli Demir ve Celik Fabrikalari | | | 123,607 | | | | 309,162 | |
Kordsa Teknik Tekstil | | | 95,778 | | | | 166,228 | |
Tekfen Holding | | | 50,524 | | | | 191,295 | |
Tupras Turkiye Petrol Rafinerileri | | | 7,956 | | | | 202,714 | |
Vestel Beyaz Esya Sanayi ve Ticaret | | | 46,291 | | | | 125,354 | |
| | | | | | | | 1,340,119 | |
| | | | | | | | | |
| Total Common Stock | | | | | | | | |
| (Cost $25,398,932) | | | | | | | 29,734,743 | |
| | | | | | | | | |
Total Investments - 97.6% | | | | | | | | |
(Cost $25,398,932) | | | | | | $ | 29,734,743 | |
Other Assets and Liabilities - 2.4% | | | | | | | 723,112 | |
Net Assets - 100.0% | | | | | | $ | 30,457,855 | |
Percentages based on Net Assets.
The accompanying notes are an integral part of the financial statements.
Cambria Investment Management
Schedule of Investments ● Cambria Emerging Shareholder Yield ETF
April 30, 2018
(A) | Securities sold within terms of a private placement memorandum, exempt from registration under Section 144A of the Securities Act of 1933, as amended, and may be sold only to dealers in that program or other "accredited investors." These securities are deemed to be liquid by the Board of Trustees. The total value of such securities at April 30, 2018 was $276,032 and represents 0.9% of Net Assets. |
(B) | Security fair valued using methods determined in good faith by the Valuation Committee of the Board of Trustees. The total market value of such securities as of April 30, 2018 was $421,797 and represented 1.4% of the Net Assets of the Fund. |
ADR — American Depositary Receipt
Cl — Class
PJSC — Public Joint Stock Company
The following is a list of the inputs used as of April 30, 2018, in valuing the Fund’s investments and other financial instruments carried at market value: |
Investments in Securities | | Level 1 | | | Level 2 | | | Level 3 | | | Total | |
Common Stock | | | | | | | | | | | | | | | | |
Brazil | | $ | 4,127,986 | | | $ | — | | | $ | — | | | $ | 4,127,986 | |
China | | | 555,614 | | | | — | | | | — | | | | 555,614 | |
Colombia | | | 256,628 | | | | — | | | | — | | | | 256,628 | |
Czech Republic | | | 342,165 | | | | — | | | | — | | | | 342,165 | |
Greece | | | 888,818 | | | | — | | | | — | | | | 888,818 | |
Hong Kong | | | 4,053,411 | | | | — | | | | — | | | | 4,053,411 | |
Hungary | | | 395,128 | | | | — | | | | — | | | | 395,128 | |
India | | | 1,617,877 | | | | — | | | | — | | | | 1,617,877 | |
Mexico | | | 191,483 | | | | — | | | | — | | | | 191,483 | |
Poland | | | 251,053 | | | | — | | | | — | | | | 251,053 | |
Russia | | | 2,519,449 | | | | — | | | | — | | | | 2,519,449 | |
South Africa | | | 4,103,412 | | | | — | | | | — | | | | 4,103,412 | |
South Korea | | | 3,018,003 | | | | — | | | | — | | | | 3,018,003 | |
Taiwan | | | 4,704,222 | | | | — | | | | — | | | | 4,704,222 | |
Thailand | | | 1,369,375 | | | | — | | | | — | | | | 1,369,375 | |
Turkey | | | 1,340,119 | | | | — | | | | — | | | | 1,340,119 | |
Total Common Stock | | | 29,734,743 | | | | — | | | | — | | | | 29,734,743 | |
Total Investments in Securities | | $ | 29,734,743 | | | $ | — | | | $ | — | | | $ | 29,734,743 | |
The following is a reconciliation of the investments in which significant unobservable inputs (Level 3) were used in determining value:
| | | Investments in Common Stock | |
Beginning Balance as of April 30, 2017 | | $ | 59,184 | |
Transfer out of Level 3 | | | (57,767 | ) |
Transfer into Level 3 | | | - | |
Net purchases | | | 23,225 | |
Net Sales | | | (506 | ) |
Realized gain/(loss) | | | (1,789 | ) |
Change in unrealized appreciation/depreciation | | | (22,347 | ) |
Ending Balance as of April 30, 2018 | | $ | - | |
Please see Note 2 in Notes to Financial Statements for further information regarding fair value measurements.
There have been no transfers between Level 1 and Level 2 assets and liabilities. There were transfers out of Level 3 due to changes in the availability of observable inputs to determine fair value. It is the Fund’s policy to recognize transfers into and out of all Levels at the end of the reporting period.
The accompanying notes are an integral part of the financial statements.
Cambria Investment Management
Schedule of Investments ● Cambria Tail Risk ETF
April 30, 2018
Sector Weightings (Unaudited)† |
|
| |
† Percentages based on total investments. |
Description | | Face Amount | | | Value | |
| | | | | | | | | |
| U.S. TREASURY OBLIGATION — 91.7% | | | | | | | | |
| | | | | | | | | |
| | | | | | | | | |
U.S. Treasury Notes | | | | | | | | |
2.250%, 02/15/27 | | $ | 21,926,800 | | | $ | 20,766,221 | |
| | | | | | | | | |
| | | | | | | | | |
Total U.S. Treasury Obligation | | | | | | | | |
(Cost $21,403,621) | | | | | | | 20,766,221 | |
| | | | | | | | | |
| | | | | | | | | |
Total Investments – 91.7% | | | | | | | | |
(Cost $21,403,621) | | | | | | $ | 20,766,221 | |
Other Assets and Liabilities – 8.3% | | | | | | | 1,891,518 | |
Net Assets - 100.0% | | | | | | $ | 22,657,739 | |
| | | | | | | | | |
| | | | | | | | | |
| PURCHASED OPTIONS — 6.6% (A)‡* | | | | | | | | |
Total Purchased Options | | | | | | | | |
(Cost $1,767,613) | | | | | | $ | 1,499,885 | |
Percentages based on Net Assets.
* | Non-income producing security. |
‡ | For the period ended April 30, 2018, the average notional value of equity purchased options held was $49,374,173 and the ending notional value of equity purchased options held was $71,762,155. |
(A) | Refer to table below for details on Purchased Options Contracts. |
The accompanying notes are an integral part of the financial statements.
Cambria Investment Management
Schedule of Investments ● Cambria Tail Risk ETF
April 30, 2018
A list of the exchange traded option contracts held by the Fund at April 30, 2018, is as follows:
| | | Contracts | | | Notional Amount | | | Value | |
| PURCHASED OPTIONS - 6.6% | | | | | | | | | | | | |
Put Options | | | | | | | | | | | | |
SPX, Expires 06/15/2018, Strike Price $2,125 | | | 8 | | | $ | 2,118,440 | | | $ | 1,500 | |
SPX, Expires 06/15/2018, Strike Price $2,150 | | | 8 | | | | 2,118,440 | | | | 1,660 | |
SPX, Expires 06/15/2018, Strike Price $2,200 | | | 8 | | | | 2,118,440 | | | | 2,040 | |
SPX, Expires 06/15/2018, Strike Price $2,225 | | | 21 | | | | 5,560,905 | | | | 5,985 | |
SPX, Expires 06/15/2018, Strike Price $2,400 | | | 3 | | | | 794,415 | | | | 2,370 | |
SPX, Expires 09/21/2018, Strike Price $2,300 | | | 40 | | | | 10,592,200 | | | | 100,200 | |
SPX, Expires 09/21/2018, Strike Price $2,400 | | | 2 | | | | 529,610 | | | | 7,380 | |
SPX, Expires 12/21/2018, Strike Price $2,250 | | | 25 | | | | 6,620,125 | | | | 94,750 | |
SPX, Expires 12/21/2018, Strike Price $2,325 | | | 25 | | | | 6,620,125 | | | | 119,000 | |
SPX, Expires 12/21/2018, Strike Price $2,400 | | | 37 | | | | 9,797,785 | | | | 220,890 | |
SPX, Expires 03/15/2019, Strike Price $2,400 | | | 2 | | | | 529,610 | | | | 15,830 | |
SPX, Expires 03/15/2019, Strike Price $2,450 | | | 23 | | | | 6,090,515 | | | | 206,885 | |
SPX, Expires 03/15/2019, Strike Price $2,500 | | | 25 | | | | 6,620,125 | | | | 255,375 | |
SPX, Expires 06/21/2019, Strike Price $2,400 | | | 24 | | | | 6,355,320 | | | | 234,720 | |
SPX, Expires 06/21/2019, Strike Price $2,475 | | | 20 | | | | 5,296,100 | | | | 231,300 | |
Total Purchased Options | | | | | | | | | | $ | 1,499,885 | |
The following is a list of the inputs used as of April 30, 2018 in valuing the Fund’s investments and other financial instruments carried at value: |
Investments in Securities | | Level 1 | | | Level 2 | | | Level 3 | | | Total | |
U.S. Treasury Obligation | | $ | — | | | $ | 20,766,221 | | | $ | — | | | $ | 20,766,221 | |
Total Investments in Securities | | $ | — | | | $ | 20,766,221 | | | $ | — | | | $ | 20,766,221 | |
| | | | | | | | | | | | | |
Other Financial Instruments | | Level 1 | | | Level 2 | | | Level 3 | | | Total | |
Purchased Options | | $ | 1,499,885 | | | $ | — | | | $ | — | | | $ | 1,499,885 | |
Total Other Financial Instruments | | $ | 1,499,885 | | | $ | — | | | $ | — | | | $ | 1,499,885 | |
Please see Note 2 in Notes to Financial Statements for further information regarding fair value measurements.
There have been no transfers between Level 1, Level 2 or Level 3 assets and liabilities. It is the Fund’s policy to recognize transfers into and out of all Levels at the end of the reporting period.
The accompanying notes are an integral part of the financial statements.
Cambria Investment Management
Schedule of Investments ● Cambria Core Equity ETF
April 30, 2018
Sector Weightings (Unaudited)† |
|
| |
† Percentages based on total investments. |
Description | | Shares | | | Value | |
| | | | | | | | | |
| COMMON STOCK — 95.7% | | | | | | | | |
| | | | | | | | | |
| Consumer Discretionary — 5.7% | | | | | | | | |
Genuine Parts (A) | | | 17,372 | | | $ | 1,534,295 | |
McDonald's (A) | | | 10,625 | | | | 1,779,050 | |
Starbucks (A) | | | 29,538 | | | | 1,700,503 | |
| | | | | | | | 5,013,848 | |
| Consumer Staples — 14.3% | | | | | | | | |
Altria Group (A) | | | 25,348 | | | | 1,422,276 | |
Diageo ADR | | | 12,545 | | | | 1,780,888 | |
Hershey (A) | | | 15,122 | | | | 1,390,317 | |
Kimberly-Clark (A) | | | 13,973 | | | | 1,446,764 | |
PepsiCo (A) | | | 14,702 | | | | 1,484,020 | |
Procter & Gamble (A) | | | 17,933 | | | | 1,297,273 | |
Sysco (A) | | | 30,225 | | | | 1,890,272 | |
Walmart (A) | | | 20,655 | | | | 1,827,141 | |
| | | | | | | | 12,538,951 | |
| Energy — 6.0% | | | | | | | | |
Chevron (A) | | | 13,980 | | | | 1,749,038 | |
Exxon Mobil (A) | | | 20,095 | | | | 1,562,386 | |
Occidental Petroleum (A) | | | 25,247 | | | | 1,950,583 | |
| | | | | | | | 5,262,007 | |
| Financials — 14.0% | | | | | | | | |
Aflac (A) | | | 39,254 | | | | 1,788,805 | |
CME Group, Cl A (A) | | | 12,251 | | | | 1,931,737 | |
Eaton Vance (A) | | | 33,479 | | | | 1,820,923 | |
FactSet Research Systems (A) | | | 9,143 | | | | 1,729,033 | |
JPMorgan Chase (A) | | | 17,286 | | | | 1,880,371 | |
US Bancorp (A) | | | 30,228 | | | | 1,525,003 | |
Wells Fargo (A) | | | 30,124 | | | | 1,565,243 | |
| | | | | | | | 12,241,115 | |
| Health Care — 11.4% | | | | | | | | |
Abbott Laboratories (A) | | | 31,596 | | | | 1,836,676 | |
The accompanying notes are an integral part of the financial statements.
Cambria Investment Management
Schedule of Investments ● Cambria Core Equity ETF
April 30, 2018
Description | | Shares | | | Value | |
| | | | | | | | | |
Amgen (A) | | | 8,871 | | | $ | 1,547,812 | |
Eli Lilly (A) | | | 19,358 | | | | 1,569,353 | |
Johnson & Johnson (A) | | | 12,586 | �� | | | 1,592,003 | |
Merck (A) | | | 25,234 | | | | 1,485,526 | |
UnitedHealth Group (A) | | | 8,483 | | | | 2,005,381 | |
| | | | | | | | 10,036,751 | |
| Industrials — 19.2% | | | | | | | | |
3M (A) | | | 7,832 | | | | 1,522,463 | |
Cummins (A) | | | 9,733 | | | | 1,555,917 | |
Emerson Electric (A) | | | 25,895 | | | | 1,719,687 | |
General Dynamics (A) | | | 7,916 | | | | 1,593,570 | |
Harris (A) | | | 12,573 | | | | 1,966,669 | |
Illinois Tool Works (A) | | | 11,102 | | | | 1,576,706 | |
Lockheed Martin (A) | | | 5,310 | | | | 1,703,660 | |
Norfolk Southern (A) | | | 12,448 | | | | 1,785,915 | |
United Technologies (A) | | | 14,020 | | | | 1,684,503 | |
Waste Management (A) | | | 20,935 | | | | 1,701,806 | |
| | | | | | | | 16,810,896 | |
| Information Technology — 17.6% | | | | | | | | |
Accenture, Cl A (A) | | | 12,014 | | | | 1,816,517 | |
Apple (A) | | | 10,617 | | | | 1,754,565 | |
Broadridge Financial Solutions (A) | | | 20,254 | | | | 2,171,431 | |
Cisco Systems (A) | | | 48,938 | | | | 2,167,464 | |
Intel (A) | | | 43,940 | | | | 2,268,183 | |
Microsoft (A) | | | 22,288 | | | | 2,084,374 | |
Oracle | | | 33,943 | | | | 1,550,177 | |
Paychex (A) | | | 27,144 | | | | 1,644,112 | |
| | | | | | | | 15,456,823 | |
| Materials — 2.0% | | | | | | | | |
Air Products & Chemicals (A) | | | 10,849 | | | | 1,760,684 | |
| | | | | | | | | |
| Telecommunication Services — 1.6% | | | | | | | | |
AT&T (A) | | | 42,125 | | | | 1,377,487 | |
| | | | | | | | | |
| Utilities — 3.9% | | | | | | | | |
NextEra Energy (A) | | | 11,198 | | | | 1,835,464 | |
Southern (A) | | | 33,566 | | | | 1,548,064 | |
| | | | | | | | 3,383,528 | |
Total Common Stock | | | | | | | | |
(Cost $77,832,915) | | | | | | | 83,882,090 | |
Total Investments – 95.7% | | | | | | | | |
(Cost $77,832,915) | | | | | | $ | 83,882,090 | |
The accompanying notes are an integral part of the financial statements.
Cambria Investment Management
Schedule of Investments ● Cambria Core Equity ETF
April 30, 2018
Description | | Value | |
| | | | | |
Other Assets and Liabilities - 4.3% | | | 3,798,613 | |
Net Assets - 100.0% | | $ | 87,680,703 | |
| | | | | |
| | | | | |
| PURCHASED OPTIONS — 4.2% (B)‡* | | | | |
Total Purchased Options | | | | |
(Cost $3,969,104) | | $ | 3,662,500 | |
Percentages based on Net Assets.
* | Non-income producing security. |
‡ | For the period ended April 30, 2018, the average notional value of equity purchased options held was $180,556,570 and the ending notional value of equity purchased options held was $205,113,250. For the period ended April 30, 2018, the average notional value of equity written options held was $91,136,766. There were no equity written options held at year end. |
(A) | Security, or a portion thereof, has been pledged as collateral for open purchased option contracts. |
(B) | Refer to table below for details on Purchased Options Contracts. |
ADR — American Depositary Receipt |
Cl — Class |
A list of the exchange traded option contracts held by the Fund at April 30, 2018, is as follows:
| | | Contracts | | | Notional Amount | | | Value | |
| PURCHASED OPTIONS - 4.2% | | | | | | | | | | | | |
Put Options | | | | | | | | | | | | |
SPX, Expires 05/18/2018, Strike Price $2,600 | | | 200 | | | $ | 52,961,000 | | | $ | 333,000 | |
SPX, Expires 06/15/2018, Strike Price $2,650 | | | 200 | | | | 52,961,000 | | | | 1,042,000 | |
SPY, Expires 12/21/2018, Strike Price $240 | | | 3,750 | | | | 99,191,250 | | | | 2,287,500 | |
Total Purchased Options | | | | | | | | | | $ | 3,662,500 | |
The following is a list of the inputs used as of April 30, 2018 in valuing the Fund’s investments carried at value: |
Investments in Securities | | Level 1 | | | Level 2 | | | Level 3 | | | Total | |
Common Stock | | $ | 83,882,090 | | | $ | — | | | $ | — | | | $ | 83,882,090 | |
Total Investments in Securities | | $ | 83,882,090 | | | $ | — | | | $ | — | | | $ | 83,882,090 | |
| | | | | | | | | | | | | |
Other Financial Instruments | | Level 1 | | | Level 2 | | | Level 3 | | | Total | |
Purchased Options | | $ | 3,662,500 | | | $ | — | | | $ | — | | | $ | 3,662,500 | |
Total Other Financial Instruments | | $ | 3,662,500 | | | $ | — | | | $ | — | | | $ | 3,662,500 | |
Please see Note 2 in Notes to Financial Statements for further information regarding fair value measurements.
There have been no transfers between Level 1, Level 2 or Level 3 assets and liabilities. It is the Fund’s policy to recognize transfers into and out of all Levels at the end of the reporting period.
The accompanying notes are an integral part of the financial statements.
Cambria Investment Management
Statements of Assets and Liabilities
April 30, 2018
| | | Cambria Shareholder Yield ETF | | | Cambria Foreign Shareholder Yield ETF | | | Cambria Global Value ETF | | | Cambria Global Momentum ETF | | | Cambria Global Asset Allocation ETF | |
Assets: | | | | | | | | | | | | | | | | | | | | |
Investments at Fair Value | | $ | 141,770,042 | | | $ | 45,736,161 | | | $ | 212,040,242 | | | $ | 68,418,516 | | | $ | 44,476,203 | |
Affiliated Investments at Value | | | — | | | | — | | | | — | | | | 34,350,487 | | | | 22,219,759 | |
Foreign Currency at Value | | | — | | | | 273,576 | | | | 20,201,911 | | | | — | | | | — | |
Cash and Cash Equivalents | | | 635,276 | | | | 151,407 | | | | — | | | | 2,739,103 | | | | 376,619 | |
Receivable from Broker | | | — | | | | — | | | | 31,943 | | | | — | | | | — | |
Dividends Receivable, Net | | | 85,232 | | | | 218,113 | | | | 597,007 | | | | — | | | | — | |
Receivable for Investment Securities Sold | | | — | | | | — | | | | 21,906,809 | | | | — | | | | — | |
Reclaims Receivable | | | 19,096 | | | | 154,118 | | | | 261,576 | | | | — | | | | — | |
Total Assets | | | 142,509,646 | | | | 46,533,375 | | | | 255,039,488 | | | | 105,508,106 | | | | 67,072,581 | |
| | | | | | | | | | | | | | | | | | | | | |
Liabilities: | | | | | | | | | | | | | | | | | | | | |
Payable for Investment Securities Purchased | | | — | | | | — | | | | 25,396,675 | | | | — | | | | — | |
Payable Due to Investment Adviser | | | 69,802 | | | | 22,432 | | | | 102,972 | | | | 50,669 | | | | — | |
Payable Due to Custodian | | | — | | | | — | | | | 18,535,964 | | | | — | | | | — | |
Unrealized Depreciation on Foreign Currency Spot Contracts | | | — | | | | — | | | | 13,561 | | | | — | | | | — | |
Custodian Fees Payable | | | — | | | | — | | | | 15,190 | | | | — | | | | — | |
Total Liabilities | | | 69,802 | | | | 22,432 | | | | 44,064,362 | | | | 50,669 | | | | — | |
| | | | | | | | | | | | | | | | | | | | | |
Net Assets | | $ | 142,439,844 | | | $ | 46,510,943 | | | $ | 210,975,126 | | | $ | 105,457,437 | | | $ | 67,072,581 | |
| | | | | | | | | | | | | | | | | | | | | |
Net Assets Consist of: | | | | | | | | | | | | | | | | | | | | |
Paid-in Capital | | $ | 124,837,699 | | | $ | 45,280,111 | | | $ | 195,593,408 | | | $ | 97,948,420 | | | $ | 65,457,205 | |
Undistributed (Distributions in Excess of) Net Investment Income | | | 417,886 | | | | 232,798 | | | | 1,064,941 | | | | (133,083 | ) | | | 16,263 | |
Accumulated Net Realized Gain (Loss) on Unaffiliated Investments and Affiliated Investments | | | (1,107,533 | ) | | | (2,413,287 | ) | | | 2,229,668 | | | | (1,748,324 | ) | | | (25,519 | ) |
Net Unrealized Appreciation on Unaffiliated Investments and Affiliated Investments | | | 18,291,916 | | | | 3,421,801 | | | | 12,132,664 | | | | 9,390,424 | | | | 1,624,632 | |
Net Unrealized Depreciation on Foreign Currency Transactions | | | (124 | ) | | | (10,480 | ) | | | (45,555 | ) | | | — | | | | — | |
Net Assets | | $ | 142,439,844 | | | $ | 46,510,943 | | | $ | 210,975,126 | | | $ | 105,457,437 | | | $ | 67,072,581 | |
Outstanding Shares of Beneficial Interest (unlimited authorization — no par value) | | | 3,750,000 | | | | 1,750,010 | | | | 8,100,010 | | | | 3,850,001 | | | | 2,450,001 | |
Net Asset Value, Offering and Redemption Price Per Share | | $ | 37.98 | | | $ | 26.58 | | | $ | 26.05 | | | $ | 27.39 | | | $ | 27.38 | |
| | | | | | | | | | | | | | | | | | | | | |
Investments at Cost | | $ | 123,478,126 | | | $ | 42,314,360 | | | $ | 199,907,578 | | | $ | 62,331,996 | | | $ | 44,342,000 | |
Affiliated Investments at Cost | | | — | | | | — | | | | — | | | | 31,046,583 | | | | 20,729,330 | |
Cost of Foreign Currency | | | — | | | | 278,137 | | | | 20,831,883 | | | | — | | | | — | |
The accompanying notes are an integral part of the financial statements.
Cambria Investment Management
Statements of Assets and Liabilities
April 30, 2018
| | | Cambria Value and Momentum ETF | | | Cambria Sovereign Bond ETF | | | Cambria Emerging Shareholder Yield ETF | | | Cambria Tail Risk ETF | | | Cambria Core Equity ETF | |
Assets: | | | | | | | | | | | | | | | | | | | | |
Investments at Fair Value | | $ | 30,052,562 | | | $ | 17,172,713 | | | $ | 29,734,743 | | | $ | 20,766,221 | | | $ | 83,882,090 | |
Purchased Options at Value | | | — | | | | — | | | | — | | | | 1,499,885 | | | | 3,662,500 | |
Foreign Currency at Value | | | — | | | | 292,989 | | | | 288,715 | | | | — | | | | — | |
Cash and Cash Equivalents | | | 665,383 | | | | 1,554,581 | | | | 439,334 | | | | 82,840 | | | | 1,123,576 | |
Cash at Broker | | | 1,726,821 | | | | — | | | | — | | | | 1,000 | | | | — | |
Receivable from Broker | | | — | | | | 24,352 | | | | — | | | | 200,000 | | | | — | |
Variation Margin Receivable | | | 185,440 | | | | — | | | | — | | | | — | | | | — | |
Dividends Receivable, Net | | | 6,608 | | | | — | | | | 31,902 | | | | — | | | | 98,408 | |
Receivable for Capital Shares Sold | | | — | | | | — | | | | — | | | | 1,078,938 | | | | — | |
Interest Receivable | | | — | | | | 287,915 | | | | — | | | | 97,347 | | | | — | |
Reclaims Receivable | | | 95 | | | | — | | | | 9,127 | | | | — | | | | 3,376 | |
Total Assets | | | 32,636,909 | | | | 19,332,550 | | | | 30,503,821 | | | | 23,726,231 | | | | 88,769,950 | |
| | | | | | | | | | | | | | | | | | | | | |
Liabilities: | | | | | | | | | | | | | | | | | | | | |
Payable for Investment Securities Purchased | | | — | | | | — | | | | — | | | | 1,057,671 | | | | 516,246 | |
Payable Due to Investment Adviser | | | 19,837 | | | | 9,536 | | | | 14,351 | | | | 10,821 | | | | 80,403 | |
Custodian Fees Payable | | | — | | | | — | | | | 1,528 | | | | — | | | | — | |
Payable to Broker | | | — | | | | — | | | | 11,840 | | | | — | | | | 492,598 | |
Withholding Tax Payable | | | — | | | | 24,015 | | | | — | | | | — | | | | — | |
Accrued Foreign Capital Gains Tax on Appreciated Securities | | | — | | | | — | | | | 18,247 | | | | — | | | | — | |
Total Liabilities | | | 19,837 | | | | 33,551 | | | | 45,966 | | | | 1,068,492 | | | | 1,089,247 | |
| | | | | | | | | | | | | | | | | | | | | |
Net Assets | | $ | 32,617,072 | | | $ | 19,298,999 | | | $ | 30,457,855 | | | $ | 22,657,739 | | | $ | 87,680,703 | |
| | | | | | | | | | | | | | | | | | | | | |
Net Assets Consist of: | | | | | | | | | | | | | | | | | | | | |
Paid-in Capital | | $ | 31,647,604 | | | $ | 19,107,361 | | | $ | 26,244,446 | | | $ | 24,569,508 | | | $ | 92,604,731 | |
Undistributed Net Investment Income | | | 54,732 | | | | 82,499 | | | | 123,080 | | | | 38,840 | | | | — | |
Accumulated Net Realized Loss on Unaffiliated Investments, Affiliated Investments and Options contracts | | | (1,654,224 | ) | | | (2,279 | ) | | | (223,325 | ) | | | (1,045,481 | ) | | | (10,666,599 | ) |
Net Unrealized Appreciation (Depreciation) on Unaffiliated Investments, Affiliated Investments and Options contracts | | | 2,263,184 | | | | 121,677 | | | | 4,335,811 | | | | (905,128 | ) | | | 5,742,571 | |
Net Unrealized Appreciation (Depreciation) on Foreign Currency Transactions | | | — | | | | (10,259 | ) | | | (3,910 | ) | | | — | | | | — | |
Net Unrealized Appreciation on Futures Contracts | | | 305,776 | | | | — | | | | — | | | | — | | | | — | |
Accumulated foreign capital gains tax on appreciated securities | | | — | | | | — | | | | (18,247 | ) | | | — | | | | — | |
Net Assets | | $ | 32,617,072 | | | $ | 19,298,999 | | | $ | 30,457,855 | | | $ | 22,657,739 | | | $ | 87,680,703 | |
Outstanding Shares of Beneficial Interest (unlimited authorization — no par value) | | | 1,300,004 | | | | 700,000 | | | | 850,004 | | | | 1,050,002 | | | | 3,550,002 | |
Net Asset Value, Offering and Redemption Price Per Share | | $ | 25.09 | | | $ | 27.57 | | | $ | 35.83 | | | $ | 21.58 | | | $ | 24.70 | |
| | | | | | | | | | | | | | | | | | | | | |
Investments at Cost | | $ | 27,789,378 | | | $ | 17,051,036 | | | $ | 25,398,932 | | | $ | 21,403,621 | | | $ | 77,832,915 | |
Affiliated Investments at Cost | | | — | | | | — | | | | — | | | | — | | | | — | |
Cost of Purchased Options | | | — | | | | — | | | | — | | | | 1,767,613 | | | | 3,969,104 | |
Cost of Foreign Currency | | | — | | | | 298,853 | | | | 292,727 | | | | — | | | | — | |
The accompanying notes are an integral part of the financial statements.
Cambria Investment Management
Statements of Operations
For the year ended April 30, 2018
| | | Cambria Shareholder Yield ETF | | | Cambria Foreign Shareholder Yield ETF | | | Cambria Global Value ETF | | | Cambria Global Momentum ETF | | | Cambria Global Asset Allocation ETF | |
Investment Income: | | | | | | | | | | | | | | | | | | | | |
Dividend Income from Unaffiliated Investments | | $ | 3,130,844 | | | $ | 1,743,547 | | | $ | 5,565,067 | | | $ | 1,307,049 | | | $ | 1,005,610 | |
Dividend Income from Affiliated Investments | | | — | | | | — | | | | — | | | | 490,328 | | | | 357,349 | |
Interest Income | | | 3,600 | | | | 4,260 | | | | 7,062 | | | | 6,962 | | | | 2,019 | |
Less: Foreign Taxes Withheld | | | — | | | | (177,142 | ) | | | (747,017 | ) | | | — | | | | — | |
Total Investment Income | | | 3,134,444 | | | | 1,570,665 | | | | 4,825,112 | | | | 1,804,339 | | | | 1,364,978 | |
Management Fees | | | 783,510 | | | | 275,353 | | | | 981,838 | | | | 493,077 | | | | — | |
Custodian Fees | | | — | | | | — | | | | 141,634 | | | | — | | | | — | |
Total Expenses | | | 783,510 | | | | 275,353 | | | | 1,123,472 | | | | 493,077 | | | | — | |
| | | | | | | | | | | | | | | | | | | | | |
Net Investment Income | | | 2,350,934 | | | | 1,295,312 | | | | 3,701,640 | | | | 1,311,262 | | | | 1,364,978 | |
| | | | | | | | | | | | | | | | | | | | | |
Net Realized and Unrealized Gains (Losses) on Investments: | | | | | | | | | | | | | | | | | | | | |
Net Realized Gain on Unaffiliated Investments(1) | | | 13,837,663 | | | | 3,896,273 | | | | 3,448,834 | | | | 1,837,505 | | | | 1,489,355 | |
Net Realized Gain on Affiliated Investments(1) | | | — | | | | — | | | | — | | | | 122,333 | | | | 630,346 | |
Capital Gain Distributions Received from Unaffiliated Investments | | | — | | | | — | | | | — | | | | — | | | | 2,978 | |
Capital Gain Distributions Received from Affiliated Investments | | | — | | | | — | | | | — | | | | 3,174 | | | | 3,291 | |
Net Realized Gain (Loss) on Foreign Currency Transactions | | | — | | | | 12,559 | | | | (69,515 | ) | | | — | | | | — | |
Net Change in Unrealized Appreciation (Depreciation) on Unaffiliated Investments | | | (818,584 | ) | | | 3,102,127 | | | | 14,883,636 | | | | 3,406,235 | | | | (318,337 | ) |
Net Change in Unrealized Appreciation on Affiliated Investments | | | — | | | | — | | | | — | | | | 2,257,361 | | | | 724,724 | |
Net Change in Unrealized Appreciation (Depreciation) on Foreign Currency Translation | | | 108 | | | | (1,420 | ) | | | (1,677 | ) | | | — | | | | — | |
Net Realized and Unrealized Gain on Investments | | | 13,019,187 | | | | 7,009,539 | | | | 18,261,278 | | | | 7,626,608 | | | | 2,532,357 | |
| | | | | | | | | | | | | | | | | | | | | |
Net Increase in Net Assets Resulting from Operations | | $ | 15,370,121 | | | $ | 8,304,851 | | | $ | 21,962,918 | | | $ | 8,937,870 | | | $ | 3,897,335 | |
(1) | Includes realized gain as a result of in-kind transactions. (See Note 5 in Notes to Financial Statements). |
The accompanying notes are an integral part of the financial statements.
Cambria Investment Management
Statements of Operations
For the year or period ended April 30, 2018
| | | Cambria Value and Momentum ETF | | | Cambria Sovereign Bond ETF | | | Cambria Emerging Shareholder Yield ETF | | | Cambria Tail Risk ETF | | | Cambria Core Equity ETF(1) | |
Investment Income: | | | | | | | | | | | | | | | | | | | | |
Dividend Income from Unaffiliated Investments | | $ | 223,667 | | | $ | — | | | $ | 837,127 | | | $ | — | | | $ | 2,656,650 | |
Interest Income | | | 1,269 | | | | 764,858 | | | | 5,672 | | | | 289,387 | | | | 2,170 | |
Less: Foreign Taxes Withheld | | | (143 | ) | | | (18,526 | ) | | | (101,781 | ) | | | — | | | | — | |
Total Investment Income | | | 224,793 | | | | 746,332 | | | | 741,018 | | | | 289,387 | | | | 2,658,820 | |
Management Fees | | | 80,303 | | | | 79,249 | | | | 120,067 | | | | 75,943 | | | | 1,099,857 | |
Broker Expense | | | 8,843 | | | | — | | | | — | | | | — | | | | 103,872 | |
Interest Expense | | | — | | | | — | | | | — | | | | — | | | | 61,472 | |
Custodian Fees | | | — | | | | — | | | | 12,183 | | | | — | | | | — | |
Total Expenses | | | 89,146 | | | | 79,249 | | | | 132,250 | | | | 75,943 | | | | 1,265,201 | |
| | | | | | | | | | | | | | | | | | | | | |
Net Investment Income | | | 135,647 | | | | 667,083 | | | | 608,768 | | | | 213,444 | | | | 1,393,619 | |
| | | | | | | | | | | | | | | | | | | | | |
Net Realized and Unrealized Gains (Losses) on Investments: | | | | | | | | | | | | | | | | | | | | |
Net Realized Gain (Loss) on Unaffiliated Investments(2) | | | 78,804 | | | | 40,235 | | | | (90,440 | ) | | | (208,949 | ) | | | 2,242,404 | |
Net Realized Loss on Purchased Options | | | (66,469 | ) | | | — | | | | — | | | | (837,534 | ) | | | (4,950,343 | ) |
Net Realized Loss on Written Options | | | — | | | | — | | | | — | | | | — | | | | (4,795,589 | ) |
Net Realized Loss on Futures Contracts | | | (764,531 | ) | | | — | | | | — | | | | — | | | | — | |
Net Realized Gain (Loss) on Foreign Currency Transactions | | | — | | | | 13,300 | | | | (21,927 | ) | | | — | | | | — | |
Net Change in Unrealized Appreciation (Depreciation) on Unaffiliated Investments | | | 1,384,550 | | | | (126,471 | ) | | | 3,329,688 | | | | (651,039 | ) | | | 6,049,175 | |
Net Change in Unrealized Loss on Purchased Options | | | — | | | | — | | | | — | | | | (224,562 | ) | | | (306,604 | ) |
Net Change in Unrealized Appreciation on Futures Contracts | | | 320,526 | | | | — | | | | — | | | | — | | | | — | |
Change in Accumulated Foreign Capital Gains Tax on Appreciated Securities | | | — | | | | 364 | | | | 12,004 | | | | — | | | | — | |
Net Change in Unrealized Appreciation (Depreciation) on Foreign Currency Translation | | | — | | | | (11,903 | ) | | | (5,016 | ) | | | — | | | | — | |
| | | | | | | | | | | | | | | | | | | | | |
Net Realized and Unrealized Gain (Loss) on Investments | | | 952,880 | | | | (84,475 | ) | | | 3,224,309 | | | | (1,922,084 | ) | | | (1,760,957 | ) |
| | | | | | | | | | | | | | | | | | | | | |
Net Increase (Decrease) in Net Assets Resulting from Operations | | $ | 1,088,527 | | | $ | 582,608 | | | $ | 3,833,077 | | | $ | (1,708,640 | ) | | $ | (367,338 | ) |
(1) | Commenced operations on May 23, 2017. |
(2) | Includes realized gain or loss as a result of in-kind transactions. (See Note 5 in Notes to Financial Statements). |
The accompanying notes are an integral part of the financial statements.
Cambria Investment Management
Statements of Changes in Net Assets
| | | Cambria Shareholder Yield ETF | | | Cambria Foreign Shareholder Yield ETF | |
| | | Year Ended April 30, 2018 | | | Year Ended April 30, 2017 | | | Year Ended April 30, 2018 | | | Year Ended April 30, 2017 | |
Operations: | | | | | | | | | | | | | | | | |
Net Investment Income | | $ | 2,350,934 | | | $ | 2,110,868 | | | $ | 1,295,312 | | | $ | 1,100,866 | |
Net Realized Gain (Loss) on Investments(1) | | | 13,837,663 | | | | 9,915,364 | | | | 3,896,273 | | | | (857,118 | ) |
Net Realized Gain (Loss) on Foreign Currency Transactions | | | — | | | | 115 | | | | 12,559 | | | | (8,615 | ) |
Net Change in Unrealized Appreciation (Depreciation) on Investments | | | (818,584 | ) | | | 11,411,349 | | | | 3,102,127 | | | | 3,344,104 | |
Net Change in Unrealized Appreciation (Depreciation) on Foreign Currency Translation | | | 108 | | | | (270 | ) | | | (1,420 | ) | | | (7,642 | ) |
Net Increase in Net Assets Resulting from Operations | | | 15,370,121 | | | | 23,437,426 | | | | 8,304,851 | | | | 3,571,595 | |
| | | | | | | | | | | | | | | | | |
Distributions to Shareholders: | | | | | | | | | | | | | | | | |
Investment Income | | | (1,963,059 | ) | | | (2,080,769 | ) | | | (1,437,092 | ) | | | (683,048 | ) |
Net Realized Gains | | | (117,173 | ) | | | — | | | | — | | | | — | |
Total Distributions to Shareholders | | | (2,080,232 | ) | | | (2,080,769 | ) | | | (1,437,092 | ) | | | (683,048 | ) |
| | | | | | | | | | | | | | | | | |
Capital Share Transactions: | | | | | | | | | | | | | | | | |
Issued | | | 63,832,194 | | | | 6,673,132 | | | | 3,738,985 | | | | 16,416,416 | |
Redeemed | | | (60,364,569 | ) | | | (39,744,687 | ) | | | (6,700,708 | ) | | | (3,195,354 | ) |
Increase (Decrease) in Net Assets from Capital Share Transactions | | | 3,467,625 | | | | (33,071,555 | ) | | | (2,961,723 | ) | | | 13,221,062 | |
| | | | | | | | | | | | | | | | | |
Total Increase (Decrease) in Net Assets | | | 16,757,514 | | | | (11,714,898 | ) | | | 3,906,036 | | | | 16,109,609 | |
| | | | | | | | | | | | | | | | | |
Net Assets: | | | | | | | | | | | | | | | | |
Beginning of Year | | | 125,682,330 | | | | 137,397,228 | | | | 42,604,907 | | | | 26,495,298 | |
End of Year (Includes Undistributed Net Investment Income of $417,886, $30,016, $232,798 and $348,186, respectively) | | $ | 142,439,844 | | | $ | 125,682,330 | | | $ | 46,510,943 | | | $ | 42,604,907 | |
| | | | | | | | | | | | | | | | | |
Share Transactions: | | | | | | | | | | | | | | | | |
Issued | | | 1,700,000 | | | | 200,000 | | | | 150,000 | | | | 750,000 | |
Redeemed | | | (1,650,000 | ) | | | (1,300,000 | ) | | | (250,000 | ) | | | (150,000 | ) |
Net Increase (Decrease) in Shares Outstanding from Share Transactions | | | 50,000 | | | | (1,100,000 | ) | | | (100,000 | ) | | | 600,000 | |
(1) | Includes realized gain as a result of in-kind transactions. (See Note 5 in Notes to Financial Statements). |
The accompanying notes are an integral part of the financial statements.
Cambria Investment Management
Statements of Changes in Net Assets
| | | Cambria Global Value ETF | | | Cambria Global Momentum ETF | |
| | | Year Ended April 30, 2018 | | | Year Ended April 30, 2017 | | | Year Ended April 30, 2018 | | | Year Ended April 30, 2017 | |
Operations: | | | | | | | | | | | | | | | | |
Net Investment Income | | $ | 3,701,640 | | | $ | 2,075,370 | | | $ | 1,311,262 | | | $ | 552,812 | |
Net Realized Gain on Investments(1) | | | 3,448,834 | | | | 1,630,071 | | | | 1,959,838 | | | | 10,408 | |
Net Realized Loss on Foreign Currency Transactions | | | (69,515 | ) | | | (805 | ) | | | — | | | | — | |
Capital Gain Distributions Received from Investments | | | — | | | | — | | | | 3,174 | | | | 1,568 | |
Net Change in Unrealized Appreciation on Investments and Affiliated Investments | | | 14,883,636 | | | | 13,518,072 | | | | 5,663,596 | | | | 3,355,066 | |
Net Change in Unrealized Depreciation on Foreign Currency Translation | | | (1,677 | ) | | | (47,292 | ) | | | — | | | | — | |
Net Increase in Net Assets Resulting from Operations | | | 21,962,918 | | | | 17,175,416 | | | | 8,937,870 | | | | 3,919,854 | |
| | | | | | | | | | | | | | | | | |
Distributions to Shareholders: | | | | | | | | | | | | | | | | |
Investment Income | | | (3,023,213 | ) | | | (1,965,865 | ) | | | (1,446,903 | ) | | | (530,781 | ) |
Return of Capital | | | — | | | | — | | | | — | | | | (39,767 | ) |
Total Distributions to Shareholders | | | (3,023,213 | ) | | | (1,965,865 | ) | | | (1,446,903 | ) | | | (570,548 | ) |
| | | | | | | | | | | | | | | | | |
Capital Share Transactions: | | | | | | | | | | | | | | | | |
Issued | | | 79,845,297 | | | | 28,631,893 | | | | 38,638,611 | | | | 35,515,650 | |
Redeemed | | | — | | | | (1,087,609 | ) | | | — | | | | (1,176,541 | ) |
Increase in Net Assets from Capital Share Transactions | | | 79,845,297 | | | | 27,544,284 | | | | 38,638,611 | | | | 34,339,109 | |
| | | | | | | | | | | | | | | | | |
Total Increase in Net Assets | | | 98,785,002 | | | | 42,753,835 | | | | 46,129,578 | | | | 37,688,415 | |
| | | | | | | | | | | | | | | | | |
Net Assets: | | | | | | | | | | | | | | | | |
Beginning of Year | | | 112,190,124 | | | | 69,436,289 | | | | 59,327,859 | | | | 21,639,444 | |
End of Year (Includes Undistributed (Distributions in Excess of) Net Investment Income of $1,064,941, $456,029, $(133,083) and $—, respectively) | | $ | 210,975,126 | | | $ | 112,190,124 | | | $ | 105,457,437 | | | $ | 59,327,859 | |
| | | | | | | | | | | | | | | | | |
Share Transactions: | | | | | | | | | | | | | | | | |
Issued | | | 3,150,000 | | | | 1,400,000 | | | | 1,450,000 | | | | 1,500,000 | |
Redeemed | | | — | | | | (50,000 | ) | | | — | | | | (50,000 | ) |
Net Increase in Shares Outstanding from Share Transactions | | | 3,150,000 | | | | 1,350,000 | | | | 1,450,000 | | | | 1,450,000 | |
(1) | Includes realized gain as a result of in-kind transactions. (See Note 5 in Notes to Financial Statements). |
The accompanying notes are an integral part of the financial statements.
Cambria Investment Management
Statements of Changes in Net Assets
| | | Cambria Global Asset Allocation ETF | | | Cambria Value and Momentum ETF | |
| | | Year Ended April 30, 2018 | | | Year Ended April 30, 2017 | | | Year Ended April 30, 2018 | | | Year Ended April 30, 2017 | |
Operations: | | | | | | | | | | | | | | | | |
Net Investment Income | | $ | 1,364,978 | | | $ | 766,833 | | | $ | 135,647 | | | $ | 27,999 | |
Net Realized Gain (Loss) on Investments, Purchased Options and Futures Contracts(1) | | | 2,119,701 | | | | (122,039 | ) | | | (752,196 | ) | | | (516,266 | ) |
Capital Gain Distributions Received from Unaffiliated and Affiliated Investments | | | 6,269 | | | | 13,111 | | | | — | | | | — | |
Net Change in Unrealized Appreciation on Investments and Futures Contracts | | | 406,387 | | | | 2,061,906 | | | | 1,705,076 | | | | 723,219 | |
Net Increase in Net Assets Resulting from Operations | | | 3,897,335 | | | | 2,719,811 | | | | 1,088,527 | | | | 234,952 | |
| | | | | | | | | | | | | | | | | |
Distributions to Shareholders: | | | | | | | | | | | | | | | | |
Investment Income | | | (1,360,015 | ) | | | (777,368 | ) | | | (81,069 | ) | | | (28,879 | ) |
Total Distributions to Shareholders | | | (1,360,015 | ) | | | (777,368 | ) | | | (81,069 | ) | | | (28,879 | ) |
| | | | | | | | | | | | | | | | | |
Capital Share Transactions: | | | | | | | | | | | | | | | | |
Issued | | | 49,388,670 | | | | 14,843,502 | | | | 23,318,747 | | | | 3,547,675 | |
Redeemed | | | (22,035,804 | ) | | | (3,755,694 | ) | | | (25 | ) | | | — | |
Increase in Net Assets from Capital Share Transactions | | | 27,352,866 | | | | 11,087,808 | | | | 23,318,722 | | | | 3,547,675 | |
| | | | | | | | | | | | | | | | | |
Total Increase in Net Assets | | | 29,890,186 | | | | 13,030,251 | | | | 24,326,180 | | | | 3,753,748 | |
| | | | | | | | | | | | | | | | | |
Net Assets: | | | | | | | | | | | | | | | | |
Beginning of Year | | | 37,182,395 | | | | 24,152,144 | | | | 8,290,892 | | | | 4,537,144 | |
End of Year (Includes Undistributed Net Investment Income of $16,263, $11,732, $54,732 and $154, respectively) | | $ | 67,072,581 | | | $ | 37,182,395 | | | $ | 32,617,072 | | | $ | 8,290,892 | |
| | | | | | | | | | | | | | | | | |
Share Transactions: | | | | | | | | | | | | | | | | |
Issued | | | 1,800,000 | | | | 600,000 | | | | 950,000 | | | | 150,000 | |
Redeemed | | | (800,000 | ) | | | (150,000 | ) | | | — | | | | — | |
Net Increase in Shares Outstanding from Share Transactions | | | 1,000,000 | | | | 450,000 | | | | 950,000 | | | | 150,000 | |
(1) | May include realized gain as a result of in-kind transactions. (See Note 5 in Notes to Financial Statements). |
The accompanying notes are an integral part of the financial statements.
Cambria Investment Management
Statements of Changes in Net Assets
| | | Cambria Sovereign Bond ETF | | | Cambria Emerging Shareholder Yield ETF | |
| | | Year Ended April 30, 2018 | | | Year Ended April 30, 2017 | | | Year Ended April 30, 2018 | | | Period Ended April 30, 2017(2) | |
Operations: | | | | | | | | | | | | | | | | |
Net Investment Income | | $ | 667,083 | | | $ | 264,116 | | | $ | 608,768 | | | $ | 111,687 | |
Net Realized Gain (Loss) on Investments(1) | | | 40,235 | | | | 28,207 | | | | (90,440 | ) | | | (20,751 | ) |
Net Realized Gain (Loss) on Foreign Currency Transactions | | | 13,300 | | | | 4,549 | | | | (21,927 | ) | | | (14,206 | ) |
Net Change in Unrealized Appreciation (Depreciation) on Investments | | | (126,471 | ) | | | 46,318 | | | | 3,329,688 | | | | 1,006,123 | |
Net Change in Unrealized Appreciation (Depreciation) on Foreign Currency Translation | | | (11,903 | ) | | | 591 | | | | (5,016 | ) | | | 1,106 | |
Net Change in Unrealized Appreciation (Depreciation) on Foreign Capital Tax Gains on Appreciated Securities | | | 364 | | | | (364 | ) | | | 12,004 | | | | (30,251 | ) |
Net Increase in Net Assets Resulting from Operations | | | 582,608 | | | | 343,417 | | | | 3,833,077 | | | | 1,053,708 | |
| | | | | | | | | | | | | | | | | |
Distributions to Shareholders: | | | | | | | | | | | | | | | | |
Investment Income | | | (635,189 | ) | | | (218,944 | ) | | | (509,874 | ) | | | (55,329 | ) |
Net Realized Gains | | | (97,030 | ) | | | (10,215 | ) | | | — | | | | — | |
Total Distributions to Shareholders | | | (732,219 | ) | | | (229,159 | ) | | | (509,874 | ) | | | (55,329 | ) |
| | | | | | | | | | | | | | | | | |
Capital Share Transactions: | | | | | | | | | | | | | | | | |
Issued | | | 9,927,241 | | | | 6,666,175 | | | | 15,375,863 | | | | 12,207,140 | |
Redeemed | | | — | | | | (1,308,551 | ) | | | — | | | | (1,446,730 | ) |
Increase in Net Assets from Capital Share Transactions | | | 9,927,241 | | | | 5,357,624 | | | | 15,375,863 | | | | 10,760,410 | |
| | | | | | | | | | | | | | | | | |
Total Increase in Net Assets | | | 9,777,630 | | | | 5,471,882 | | | | 18,699,066 | | | | 11,758,789 | |
| | | | | | | | | | | | | | | | | |
Net Assets: | | | | | | | | | | | | | | | | |
Beginning of Year/Period | | | 9,521,369 | | | | 4,049,487 | | | | 11,758,789 | | | | — | |
End of and Year/Period (Includes Undistributed Net Investment Income of $82,499, $61,457, $123,080 and $46,114, respectively) | | $ | 19,298,999 | | | $ | 9,521,369 | | | $ | 30,457,855 | | | $ | 11,758,789 | |
| | | | | | | | | | | | | | | | | |
Share Transactions: | | | | | | | | | | | | | | | | |
Issued | | | 350,000 | | | | 250,000 | | | | 450,000 | | | | 450,004 | |
Redeemed | | | — | | | | (50,000 | ) | | | — | | | | (50,000 | ) |
Net Increase in Shares Outstanding from Share Transactions | | | 350,000 | | | | 200,000 | | | | 450,000 | | | | 400,004 | |
(1) | May include realized gain as a result of in-kind transactions. (See Note 5 in Notes to Financial Statements). |
(2) | Commenced operations on July 13, 2016. |
The accompanying notes are an integral part of the financial statements.
Cambria Investment Management
Statements of Changes in Net Assets
| | | Cambria Tail Risk ETF | | | Cambria Core Equity ETF | |
| | | Year Ended April 30, 2018 | | | Period Ended April 30, 2017(2) | | | Period Ended April 30, 2018(3) | |
Operations: | | | | | | | | | | | | |
Net Investment Income | | $ | 213,444 | | | $ | 2,278 | | | $ | 1,393,619 | |
Net Realized Gain (Loss) on Investments, Purchased Options and Written Options(1) | | | (1,046,483 | ) | | | 1,002 | | | | (7,503,528 | ) |
Net Change in Unrealized Appreciation (Depreciation) on Investments and Purchased Options | | | (875,601 | ) | | | (29,527 | ) | | | 5,742,571 | |
Net Decrease in Net Assets Resulting from Operations | | | (1,708,640 | ) | | | (26,247 | ) | | | (367,338 | ) |
| | | | | | | | | | | | | |
Distributions to Shareholders: | | | | | | | | | | | | |
Investment Income | | | (176,882 | ) | | | — | | | | (1,295,785 | ) |
Return of Capital | | | — | | | | — | | | | (51,766 | ) |
Total Distributions to Shareholders | | | (176,882 | ) | | | — | | | | (1,347,551 | ) |
| | | | | | | | | | | | | |
Capital Share Transactions: | | | | | | | | | | | | |
Issued | | | 27,787,067 | | | | 2,500,050 | | | | 126,953,408 | |
Redeemed | | | (5,717,609 | ) | | | — | | | | (37,557,816 | ) |
Increase in Net Assets from Capital Share Transactions | | | 22,069,458 | | | | 2,500,050 | | | | 89,395,592 | |
| | | | | | | | | | | | | |
Total Increase in Net Assets | | | 20,183,936 | | | | 2,473,803 | | | | 87,680,703 | |
| | | | | | | | | | | | | |
Net Assets: | | | | | | | | | | | | |
Beginning of Year/Period | | | 2,473,803 | | | | — | | | | — | |
End of Year/Period (Includes Undistributed Net Investment Income of $38,840, $2,278 and $—, respectively) | | $ | 22,657,739 | | | $ | 2,473,803 | | | $ | 87,680,703 | |
| | | | | | | | | | | | | |
Share Transactions: | | | | | | | | | | | | |
Issued | | | 1,200,000 | | | | 100,002 | | | | 5,050,002 | |
Redeemed | | | (250,000 | ) | | | — | | | | (1,500,000 | ) |
Net Increase in Shares Outstanding from Share Transactions | | | 950,000 | | | | 100,002 | | | | 3,550,002 | |
(1) | Includes realized gain as a result of in-kind transactions. (See Note 5 in Notes to Financial Statements). |
(2) | Commenced operations on April 5, 2017. |
(3) | Commenced operations on May 23, 2017. |
The accompanying notes are an integral part of the financial statements.
Cambria Investment Management
Financial Highlights
Selected Per Share Data & Ratios
For a Share Outstanding Throughout the Year/Period
| | Net Asset Value, Beginning of Year/Period | | Net Investment Income* | | Net Realized and Unrealized Gain (Loss) on Investments | | Total from Operations | | Distributions from Investment Income | | Distributions from Net Realized Capital Gains | | Return of Capital | | Total Distributions | | Net Asset Value, End of Year/Period | | Total Return(1) | | Net Assets End of Year/Period (000) | | Ratio of Expenses to Average Net Assets(2) | | Ratio of Net Investment Income to Average Net Assets | | Portfolio Turnover(1)(3) | |
| Cambria Shareholder Yield ETF | | | | | | | | | | | | | | | | | | | | | | |
2018 | $ | 33.97 | | $ | 0.64 | | $ | 3.94 | | $ | 4.58 | | $ | (0.54 | ) | $ | (0.03 | ) | $ | — | | $ | (0.57 | ) | $ | 37.98 | | 13.58% | | $ | 142,440 | | 0.59% | | 1.77% | | 16% | |
2017 | $ | 28.62 | | $ | 0.50 | | $ | 5.35 | | $ | 5.85 | | $ | (0.50 | ) | $ | — | | $ | — | | $ | (0.50 | ) | $ | 33.97 | | 20.62% | | $ | 125,682 | | 0.59% | | 1.63% | | 50% | |
2016 | $ | 31.54 | | $ | 0.64 | | $ | (1.45 | ) | $ | (0.81 | ) | $ | (0.69 | ) | $ | (1.39 | ) | $ | (0.03 | ) | $ | (2.11 | ) | $ | 28.62 | | (2.59)% | | $ | 137,397 | | 0.59% | | 2.10% | | 43% | |
2015 | $ | 29.95 | | $ | 0.65 | | $ | 2.29 | | $ | 2.94 | | $ | (0.55 | ) | $ | (0.80 | ) | $ | — | | $ | (1.35 | ) | $ | 31.54 | | 9.92% | | $ | 227,096 | | 0.59% | | 2.09% | | 41% | |
| 2014(5) | $ | 25.00 | | $ | 0.45 | | $ | 4.98 | | $ | 5.43 | | $ | (0.36 | ) | $ | (0.12 | ) | $ | — | | $ | (0.48 | ) | $ | 29.95 | | 21.81% | | $ | 205,156 | | 0.59% | (4) | 1.67% | (4) | 89% | |
| Cambria Foreign Shareholder Yield ETF | | | | | | | | | | | | | | | | | | | | | | |
2018 | $ | 23.03 | | $ | 0.70 | | $ | 3.60 | | $ | 4.30 | | $ | (0.75 | ) | $ | — | | $ | — | | $ | (0.75 | ) | $ | 26.58 | | 19.03% | | $ | 46,511 | | 0.59% | | 2.78% | | 44% | |
2017 | $ | 21.20 | | $ | 0.81 | | $ | 1.59 | | $ | 2.40 | | $ | (0.57 | ) | $ | — | | $ | — | | $ | (0.57 | ) | $ | 23.03 | | 11.93% | | $ | 42,605 | | 0.59% | | 3.80% | | 43% | |
2016 | $ | 23.80 | | $ | 0.81 | | $ | (2.61 | ) | $ | (1.80 | ) | $ | (0.68 | ) | $ | — | | $ | (0.12 | ) | $ | (0.80 | ) | $ | 21.20 | | (7.67)% | | $ | 26,495 | | 0.59% | | 3.83% | | 53% | |
2015 | $ | 26.63 | | $ | 0.93 | | $ | (2.70 | ) | $ | (1.77 | ) | $ | (0.77 | ) | $ | (0.29 | ) | $ | — | | $ | (1.06 | ) | $ | 23.80 | | (6.67)% | | $ | 60,694 | | 0.59% | | 3.76% | | 48% | |
2014(6) | $ | 25.00 | | $ | 0.41 | | $ | 1.33 | | $ | 1.74 | | $ | (0.11 | ) | $ | — | | $ | — | | $ | (0.11 | ) | $ | 26.63 | | 6.96% | | $ | 66,572 | | 0.59% | (4) | 3.91% | (4) | 15% | |
2018 | $ | 22.66 | | $ | 0.56 | | $ | 3.34 | | $ | 3.90 | | $ | (0.51 | ) | $ | — | | $ | — | | $ | (0.51 | ) | $ | 26.05 | | 17.42% | | $ | 210,975 | | 0.68% | | 2.22% | | 14% | |
2017 | $ | 19.29 | | $ | 0.50 | | $ | 3.38 | | $ | 3.88 | | $ | (0.51 | ) | $ | — | | $ | — | | $ | (0.51 | ) | $ | 22.66 | | 20.85% | | $ | 112,190 | | 0.68% | | 2.48% | | 16% | |
2016 | $ | 21.78 | | $ | 0.45 | | $ | (2.57 | ) | $ | (2.12 | ) | $ | (0.37 | ) | $ | — | | $ | — | | $ | (0.37 | ) | $ | 19.29 | | (9.76)% | | $ | 69,436 | | 0.69% | | 2.36% | | 15% | |
2015 | $ | 25.73 | | $ | 0.68 | | $ | (4.10 | ) | $ | (3.42 | ) | $ | (0.52 | ) | $ | (0.01 | ) | $ | — | | $ | (0.53 | ) | $ | 21.78 | | (13.29)% | | $ | 80,580 | | 0.69% | | 3.10% | | 25% | |
2014(7) | $ | 25.00 | | $ | 0.14 | | $ | 0.59 | | $ | 0.73 | | $ | — | | $ | — | | $ | — | | $ | — | | $ | 25.73 | | 2.92% | | $ | 23,160 | | 0.69% | (4) | 4.11% | (4) | —% | |
Cambria Global Momentum ETF |
2018 | $ | 24.72 | | $ | 0.42 | | $ | 2.75 | | $ | 3.17 | | $ | (0.50 | ) | $ | — | | $ | — | | $ | (0.50 | ) | $ | 27.39 | | 12.97% | | $ | 105,457 | | 0.59% | | 1.57% | | 50% | |
2017 | $ | 22.78 | | $ | 0.42 | | $ | 1.95 | | $ | 2.37 | | $ | (0.40 | ) | $ | — | | $ | (0.03 | ) | $ | (0.43 | ) | $ | 24.72 | | 10.52% | | $ | 59,328 | | 0.59% | | 1.78% | | 106% | |
2016 | $ | 25.35 | | $ | 0.34 | | $ | (2.51 | ) | $ | (2.17 | ) | $ | (0.38 | ) | $ | — | | $ | (0.02 | ) | $ | (0.40 | ) | $ | 22.78 | | (8.61)% | | $ | 21,639 | | 0.59% | | 1.43% | | 316% | |
2015(8) | $ | 25.00 | | $ | 0.30 | | $ | 0.39 | | $ | 0.69 | | $ | (0.34 | ) | $ | — | | $ | — | | $ | (0.34 | ) | $ | 25.35 | | 2.76% | | $ | 40,562 | | 0.59% | (4) | 2.40% | (4) | 16% | |
* | Per share data calculated using average shares method. |
(1) | Returns and portfolio turnover rates are for the period indicated and have not been annualized. Returns do not reflect the deduction of taxes the shareholder would pay on fund distributions or redemption of Fund shares. |
(2) | Expense ratios do not include expenses of the underlying funds. |
(3) | Portfolio turnover rate does not include securities received or delivered from processing creations or redemptions. |
(4) | Annualized. |
(5) | Inception date May 13, 2013. |
(6) | Inception date December 2, 2013. |
(7) | Inception date March 11, 2014. |
(8) | Inception date November 3, 2014. |
The accompanying notes are an integral part of the financial statements.
Cambria Investment Management
Financial Highlights
Selected Per Share Data & Ratios
For a Share Outstanding Throughout the Year/Period
| | Net Asset Value, Beginning of Year/Period | | Net Investment Income* | | Net Realized and Unrealized Gain (Loss) on Investments | | Total from Operations | | Distributions from Investment Income | | Distributions from Net Realized Capital Gains | | Return of Capital | | Total Distributions | | Net Asset Value, End of Year/Period | | Total Return(1) | | Net Assets End of Year/Period (000) | | Ratio of Expenses to Average Net Assets(2) | | Ratio of Net Investment Income to Average Net Assets | | Portfolio Turnover(1)(3) | |
| Cambria Global Asset Allocation ETF | | | | | | | | | | | | | | | | | | | | | | | | | | | | |
2018 | $ | 25.64 | | $ | 0.74 | | $ | 1.66 | | $ | 2.40 | | $ | (0.66 | ) | $ | — | | $ | — | | $ | (0.66 | ) | $ | 27.38 | | 9.43% | | $ | 67,073 | | —% | | 2.72% | | 30% | |
2017 | $ | 24.15 | | $ | 0.65 | | $ | 1.51 | | $ | 2.16 | | $ | (0.67 | ) | $ | — | | $ | — | | $ | (0.67 | ) | $ | 25.64 | | 9.08% | | $ | 37,182 | | —% | | 2.62% | | 9% | |
| 2016 | $ | 25.43 | | $ | 0.58 | | $ | (1.26 | ) | $ | (0.68 | ) | $ | (0.60 | ) | $ | — | | $ | — | | $ | (0.60 | ) | $ | 24.15 | | (2.58)% | | $ | 24,152 | | —% | | 2.44% | | 8% | |
| 2015(5) | $ | 25.00 | | $ | 0.18 | | $ | 0.46 | | $ | 0.64 | | $ | (0.21 | ) | $ | — | | $ | — | | $ | (0.21 | ) | $ | 25.43 | | 2.58% | | $ | 31,786 | | —% | (4) | 1.81% | (4) | 4% | |
| Cambria Value and Momentum ETF | | | | | | | | | | | | | | | | | | | | | | | | | | | |
| 2018 | $ | 23.69 | | $ | 0.24 | | $ | 1.27 | | $ | 1.51 | | $ | (0.11 | ) | $ | — | | $ | — | | $ | (0.11 | ) | $ | 25.09 | | 6.40% | | $ | 32,617 | | 0.65% | (6) | 1.00% | | 93% | |
| 2017 | $ | 22.69 | | $ | 0.12 | | $ | 1.01 | | $ | 1.13 | | $ | (0.13 | ) | $ | — | | $ | — | | $ | (0.13 | ) | $ | 23.69 | | 4.98% | | $ | 8,291 | | 0.66% | (7) | 0.50% | | 76% | |
| 2016(8) | $ | 25.00 | | $ | 0.08 | | $ | (2.32 | ) | $ | (2.24 | ) | $ | (0.07 | ) | $ | — | | $ | — | | $ | (0.07 | ) | $ | 22.69 | | (8.96)% | | $ | 4,537 | | 0.66% | (4)(7) | 0.55% | (4) | 48% | |
| Cambria Sovereign Bond ETF | | | | | | | | | | | | | | | | | | | | | | | | | | | |
| 2018 | $ | 27.20 | | $ | 1.39 | | $ | 0.64^ | | $ | 2.03 | | $ | (1.44 | ) | $ | (0.22 | ) | $ | — | | $ | (1.66 | ) | $ | 27.57 | | 7.56% | | $ | 19,299 | | 0.59% | | 4.97% | | 25% | |
| 2017 | $ | 26.99 | | $ | 1.04 | | $ | 0.14 | | $ | 1.18 | | $ | (0.93 | ) | $ | (0.04 | ) | $ | — | | $ | (0.97 | ) | $ | 27.20 | | 4.51% | | $ | 9,521 | | 0.59% | | 3.88% | | 86% | |
| 2016(9) | $ | 25.00 | | $ | 0.19 | | $ | 1.80 | | $ | 1.99 | | $ | — | | $ | — | | $ | — | | $ | — | | $ | 26.99 | | 7.96% | | $ | 4,049 | | 0.59% | (4) | 3.82% | (4) | — | |
| Cambria Emerging Shareholder Yield ETF | | | | | | | | | | | | | | | | | | | | | | | | | | | |
| 2018 | $ | 29.40 | | $ | 1.01 | | $ | 6.40 | | $ | 7.41 | | $ | (0.98 | ) | $ | — | | $ | — | | $ | (0.98 | ) | $ | 35.83 | | 25.75% | | $ | 30,458 | | 0.65% | | 2.99% | | 26% | |
| 2017(10) | $ | 25.00 | | $ | 0.43 | | $ | 4.18 | | $ | 4.61 | | $ | (0.21 | ) | $ | — | | $ | — | | $ | (0.21 | ) | $ | 29.40 | | 18.57% | | $ | 11,759 | | 0.69% | (4) | 2.00% | (4) | 33% | |
| Cambria Tail Risk ETF | | | | | | | | | | | | | | | | | | | | | | | | | | | |
| 2018 | $ | 24.74 | | $ | 0.38 | | $ | (3.27 | ) | $ | (2.89 | ) | $ | (0.27 | ) | $ | — | | $ | — | | $ | (0.27 | ) | $ | 21.58 | | (11.74)% | | $ | 22,658 | | 0.59% | | 1.66% | | 56% | |
| 2017(11) | $ | 25.00 | | $ | 0.02 | | $ | (0.28 | ) | $ | (0.26 | ) | $ | — | | $ | — | | $ | — | | $ | — | | $ | 24.74 | | (1.04)% | | $ | 2,474 | | 0.59% | (4) | 1.38% | (4) | —% | |
| Cambria Core Equity ETF | | | | | | | | | | | | | | | | | | | | | | | | | | | |
| 2018(12) | $ | 25.00 | | $ | 0.32 | | $ | (0.31 | ) | $ | 0.01 | | $ | (0.30 | ) | $ | — | | $ | (0.01 | ) | $ | (0.31 | ) | $ | 24.70 | | 0.01% | | $ | 87,681 | | 1.21% | (4)(13) | 1.35% | (4) | 8% | |
* | Per share data calculated using average shares method. |
^ | The amount shown for a share outstanding throughout the period does not accord with the aggregate net gains on investments for the period because of the sales and repurchases of fund shares in relation to fluctuating market value of the investments of the Fund. |
(1) | Returns and portfolio turnover rates are for the period indicated and have not been annualized. Returns do not reflect the deduction of taxes the shareholder would pay on fund distributions or redemption of Fund shares. |
(2) | Expense ratios do not include expenses of the underlying funds. |
(3) | Portfolio turnover rate does not include securities received or delivered from processing creations or redemptions. |
(4) | Annualized. |
(5) | Inception date December 9, 2014. |
(6) | Includes broker expense of 0.06%. |
(7) | Includes broker expense of 0.07%. |
(8) | Inception date September 8, 2015. |
(9) | Inception date February 22, 2016. |
(10) | Inception date July 13, 2016. |
(11) | Inception date April 5, 2017. |
(12) | Inception date May 23, 2017. |
(13) | Includes broker expense of 0.10% and interest expense of 0.06%. |
The accompanying notes are an integral part of the financial statements.
Cambria Investment Management
Notes to Financial Statements
April 30, 2018
1. ORGANIZATION
Cambria ETF Trust (the “Trust”), a Delaware statutory trust, was formed on September 9, 2011 as a diversified, open-end registered management investment company under the Investment Company Act of 1940, as amended. The Trust is comprised of multiple Exchange Traded Funds (ETFs): Cambria Global Income and Currency Strategies ETF, Cambria Shareholder Yield ETF, Cambria Foreign Shareholder Yield ETF, Cambria Emerging Shareholder Yield ETF, Cambria Sovereign Bond ETF (formerly Cambria Sovereign High Yield Bond ETF), Cambria Global Value ETF, Cambria Global Momentum ETF, Cambria Value and Momentum ETF, Cambria Global Asset Allocation ETF, Cambria Tail Risk ETF and Cambria Core Equity ETF. These financial statements relate only to Cambria Shareholder Yield ETF, Cambria Foreign Shareholder Yield ETF, Cambria Global Value ETF, Cambria Global Momentum ETF, Cambria Global Asset Allocation ETF, Cambria Value and Momentum ETF, Cambria Sovereign Bond ETF (formerly Cambria Sovereign High Yield Bond ETF), Cambria Emerging Shareholder Yield ETF, Cambria Tail Risk ETF, and Cambria Core Equity ETF (each a “Fund” and collectively, the “Funds”). Cambria Global Income and Currency Strategies ETF has not yet commenced operations. Cambria Investment Management, L.P. (the “Investment Adviser”) serves as the investment adviser to the Funds. The assets of each Fund are segregated, and a shareholder’s interest is limited to the Fund in which shares are held. Each Fund is diversified.
The investment objective of the Cambria Shareholder Yield ETF is to seek income and capital appreciation with an emphasis on income from investments in the U.S. equity market. The Fund inception date is May 13, 2013. The Fund commenced operations on May 14, 2013.
The investment objective of the Cambria Foreign Shareholder Yield ETF is to seek investment results that correspond (before fees and expenses) generally to the price and yield performance of its underlying index, the Cambria Foreign Shareholder Yield Index. The Fund inception date is December 2, 2013. The Fund commenced operations on December 3, 2013.
The investment objective of the Cambria Global Value ETF is to seek investment results that correspond (before fees and expenses) generally to the price and yield performance of its underlying index, the Cambria Global Value Index. The Fund inception date is March 11, 2014. The Fund commenced operations on March 12, 2014.
The investment objective of the Cambria Global Momentum ETF is to seek to preserve and grow capital from investments in the U.S. and foreign equity, fixed income, commodity and currency markets, independent of market direction. The Fund inception date is November 3, 2014. The Fund commenced operations on November 4, 2014.
The investment objective of the Cambria Global Asset Allocation ETF is to seek to track performance (before fees and expenses) of the Cambria Global Asset Allocation Index. The Fund inception date is December 9, 2014. The Fund commenced operations on December 10, 2014.
The investment objective of the Cambria Value and Momentum ETF is to seek income and capital appreciation from investments in the U.S. equity market. The Fund inception date is September 8, 2015. The Fund commenced operations on September 9, 2015.
The investment objective of the Cambria Sovereign Bond ETF is to seek income and capital appreciation from investments in securities and instruments that provide exposure to sovereign and quasi-sovereign bonds. The Fund inception date is February 22, 2016. The Fund commenced operations on February 23, 2016.
The investment objective of the Cambria Emerging Shareholder Yield ETF is to seek investment results that correspond (before fees and expenses) generally to the price and yield performance of its underlying index, the Cambria Emerging Shareholder Yield Index. The Fund inception date is July 13, 2016. The Fund commenced operations on July 14, 2016.
The investment objective of the Cambria Tail Risk ETF is to provide income and capital appreciation from investments in the U.S. market while protecting against significant downside risk. The Fund inception date is April 5, 2017. The Fund commenced operations on April 6, 2017.
Cambria Investment Management
Notes to Financial Statements
April 30, 2018 (Continued)
1. ORGANIZATION (continued)
The investment objective of the Cambria Core Equity ETF is to seek capital appreciation and capital preservation with a low correlation to the broader U.S. equity market. The Fund inception date is May 23, 2017. The Fund commenced operations on May 24, 2017.
Shares of the Funds are listed and traded on the NYSE Arca, Inc. Market prices for the Shares may be different from their net asset value ("NAV"). The Funds will issue and redeem Shares on a continuous basis at NAV only in large blocks of Shares, typically 50,000 Shares, called "Creation Units." Creation Units are to be issued and redeemed principally in kind for a basket of securities and a balancing cash amount. Shares generally will trade in the secondary market in amounts less than a Creation Unit at market prices that change throughout the day.
The Funds are an investment company and accordingly follow the investment company accounting and reporting guidance of the Financial Accounting Standards Board (“FASB”) Accounting Standards Codification Topic 946 Financial Services – Investment Companies.
2. SIGNIFICANT ACCOUNTING POLICIES
The following is a summary of the Significant Accounting Policies followed by the Funds.
Use of Estimates— The Funds are investment companies in conformity with U.S. generally accepted accounting principles (“U.S. GAAP”).Therefore, the Funds follow the accounting and reporting guidance for investment companies. The preparation of financial statements in conformity with U.S.GAAP requires management to make estimates and assumptions that affect the reported amounts of assets and liabilities and disclosure of contingent assets and liabilities at the date of the financial statements and the reported amounts of increases and decreases in net assets from operations during the reporting period. Actual results could differ from those estimates, and could have a material impact to the Funds.
Security Valuation — Securities listed on a securities exchange, market or automated quotation system for which quotations are readily available (except for securities traded on NASDAQ), including securities traded over the counter, are valued at the last quoted sale price on the primary exchange or market (foreign or domestic) on which they are traded (or at approximately 4:00 pm Eastern Time if a security’s primary exchange is normally open at that time), or, if there is no such reported sale, at the most recent quoted bid.
For securities traded on NASDAQ, the NASDAQ Official Closing Price will be used. Debt securities are priced based upon valuations provided by independent, third-party pricing agents, if available. Such values generally reflect the last reported sales price if the security is actively traded. The third-party pricing agents may also value debt securities at an evaluated bid price by employing methodologies that utilize actual market transactions, broker-supplied valuations, or other methodologies designed to identify the market value for such securities. Prices for most securities held in the Funds are provided daily by recognized independent pricing agents. If a security price cannot be obtained from an independent, third-party pricing agent, the Funds seeks to obtain a bid price from at least one independent broker.
Securities for which market prices are not "readily available" are valued in accordance with fair value procedures established by the Board. The Funds’ fair value procedures are implemented through a fair value committee (the “Committee”) designated by the Board. Some of the more common reasons that may necessitate that a security be valued using fair value procedures include: the security's trading has been halted or suspended; the security has been de-listed from a national exchange; the security's primary trading market is temporarily closed at a time when under normal conditions it would be open; the security has not been traded for an extended period of time; the security's primary pricing source is not able or willing to provide a price; or trading of the security is subject to local government-imposed restrictions. When a security is valued in accordance with the fair value procedures, the Committee will determine the value after taking into consideration relevant information reasonably available to the Committee.
In accordance with the authoritative guidance on fair value measurements and disclosure under U.S. GAAP, the Funds disclose fair value of its investments in a hierarchy that prioritizes the inputs to valuation techniques used
Cambria Investment Management
Notes to Financial Statements
April 30, 2018 (Continued)
2. SIGNIFICANT ACCOUNTING POLICIES (continued)
to measure the fair value. The objective of a fair value measurement is to determine the price that would be received to sell an asset or paid to transfer a liability in an orderly transaction between market participants at the measurement date (an exit price). Accordingly, the fair value hierarchy gives the highest priority to quoted prices (unadjusted) in active markets for identical assets or liabilities (Level 1) and the lowest priority to unobservable inputs (Level 3). The three levels of the fair value hierarchy are described below:
| | ● | Level 1 – Unadjusted quoted prices in active markets for identical, unrestricted assets or liabilities that the Funds have the ability to access at the measurement date; |
| | ● | Level 2 – Quoted prices which are not active, or inputs that are observable (either directly or indirectly) for substantially the full term of the asset or liability; and |
| | ● | Level 3 – Prices, inputs or exotic modeling techniques which are both significant to the fair value measurement and unobservable (supported by little or no market activity). |
For the year or period ended April 30, 2018, there have been no significant changes to the Funds’ fair valuation methodologies.
Foreign Currency Translation— The books and records of the Funds are maintained in U.S. dollars. Investment securities and other assets and liabilities denominated in a foreign currency are translated into U.S. dollars on the date of valuation. Purchases and sales of investment securities, income and expenses are translated into U.S. dollars at the relevant rates of exchange prevailing on the respective dates of such transactions. The Funds do not isolate that portion of realized or unrealized gains and losses resulting from changes in the foreign exchange rate from fluctuations arising from changes in the market prices of the securities. These gains and losses are included in net realized and unrealized gains and losses on investments on the Statements of Operations. Net realized and unrealized gains and losses on foreign currency transactions represent net foreign exchange gains or losses from foreign currency exchange contracts, disposition of foreign currencies, currency gains or losses realized between trade and settlement dates on securities transactions and the difference between the amount of the investment income and foreign withholding taxes recorded on the Funds’ books and the U.S. dollar equivalent amounts actually received or paid. These gains and losses are included in net realized and unrealized gains and losses on foreign currency transactions on the Statements of Operations.
Futures Contracts — To the extent consistent with its investment objective and strategies, Cambria Value and Momentum ETF utilized futures contracts during the year ended April 30, 2018. The Fund’s investment in futures contracts are designed to enable the Fund to more closely approximate their performance of their benchmark indices. Cambria Value and Momentum ETF chose to invest in futures contracts for tactical hedging purposes as well as to enhance the Fund’s returns. Initial margin deposits of cash or securities are made upon entering into futures contracts. The contracts are marked to market daily and the resulting changes in value are accounted for as unrealized gains and losses. Variation margin payments are paid or received, depending upon whether unrealized gains or losses are incurred. When the contract is closed, Cambria Value and Momentum ETF records a realized gain or loss equal to the difference between the proceeds from (or cost of) the closing transaction and the amount invested in the contract. A margin deposit was made upon entering into futures contracts and is included in Cash at Broker on the Statements of Assets and Liabilities.
Risks of entering into futures contracts include the possibility that there will be an imperfect price correlation between the futures and the underlying securities. Second, it is possible that a lack of liquidity for futures contracts could exist in the secondary market, resulting in an inability to close a position prior to its maturity date. Third, the futures contract involves the risk that Cambria Value and Momentum ETF could lose more than the original margin deposit required to initiate a futures transaction.
Finally, the risk exists that losses could exceed amounts disclosed on the Statements of Assets and Liabilities.
It is the Fund’s policy to present the gross variation margin payable and the gross variation margin receivable of the future contracts separately on the Statements of Assets and Liabilities, as Cambria Value and Momentum ETF does not have a master netting agreement with the counterparty to the futures contracts. Refer to the
Cambria Investment Management
Notes to Financial Statements
April 30, 2018 (Continued)
2. SIGNIFICANT ACCOUNTING POLICIES (continued)
Cambria Value and Momentum ETF Schedule of Investments for details regarding open future contracts as of April 30, 2018. The fair value of equity futures contracts held in the Fund can be found on the Statements of Assets and Liabilities under the captions Variation Margin Receivable. Only current day’s variation margin is reported within the Statements of Assets and Liabilities. Cumulative appreciation (depreciation) of futures contracts are reported in the Cambria Value and Momentum ETF Schedule of Investments. Realized gains or losses on equity rate futures contracts related to the Fund is recognized on the Statement of Operations as part of Net Realized Gain (Loss) on Futures Contracts and any change in unrealized appreciation or depreciation is recognized on the Statements of Operations as Net Change in Unrealized Gain (Loss) on Futures Contracts.
Options Written/Purchased — The Cambria Value and Momentum ETF, Cambria Tail Risk ETF and Cambria Core Equity ETF may invest in equity options contracts for the purpose of hedging its existing portfolio securities, or securities that a Fund intends to purchase, against fluctuations in fair market value caused by changes in prevailing market interest rates. A Fund may also invest in equity option contracts to enhance its returns. When the Fund writes or purchases an option, an amount equal to the premium received or paid by the Fund is recorded as a liability or an asset and is subsequently adjusted to the current market value of the option written or purchased. Premiums received or paid from writing or purchasing options which expire unexercised are treated by the Fund on the expiration date as realized gains or losses. The difference between the premium and the amount paid or received on affecting a closing purchase or sale transaction, including brokerage commissions, is also treated as a realized gain or loss. If an option is exercised, the premium paid or received is added to the cost of the purchase or proceeds from the sale in determining whether the Fund has realized a gain or a loss.
The risk in writing a call option is a Fund may give up the opportunity for profit if the market price of the security increases. The risk in writing a put option is a Fund may incur a loss if the market price of the security decreases and the option is exercised. The risk in purchasing an option is a Fund may pay a premium whether or not the option is exercised. The Funds also have the additional risk of being unable to enter into a closing transaction at an acceptable price if a liquid secondary market does not exist. Option contracts also involve the risk that they may not work as intended due to unanticipated developments in market conditions or other causes. Finally, the risk exists that losses on written options could exceed amounts disclosed on the Statements of Assets and Liabilities.
The Cambria Tail Risk ETF and Cambria Core Equity ETF had options contracts as of April 30, 2018, as disclosed in the Funds’ Schedule of Investments. The Cambria Value and Momentum ETF did not hold any option contracts as of April 30, 2018. The value of the option contracts held in the Funds can be found on the Statements of Assets and Liabilities. Any realized and change in unrealized gains or losses can be found on the Statements of Operations.
Federal Income Taxes — The Funds intend to qualify as “regulated investment companies” under Sub-chapter M of the Internal Revenue Code of 1986, as amended. If so qualified, the Funds will not be subject to U.S. federal income tax to the extent they distribute substantially all of their net investment income and net capital gains to their shareholders.
The Funds evaluate tax positions taken or expected to be taken in the course of preparing the Funds’ tax returns to determine whether it is "more-likely-than-not" (i.e., greater than 50 percent) that each tax position will be sustained upon examination by a taxing authority based on the technical merits of the position. Tax positions not deemed to meet the more-likely-than-not threshold are recorded as a tax benefit or expense in the current period.
The Funds did not record any tax provisions in the current period. However, management’s conclusions regarding tax positions may be subject to review and adjustment at a later date based on factors including, but not limited to, examination by tax authorities (i.e., the last three tax year ends, as applicable), on-going analysis of and changes to tax laws, regulations and interpretations thereof.
As of and during the year or period ended April 30, 2018, the Funds did not have a liability for any unrecognized tax benefits. The Funds recognize interest and penalties, if any, related to unrecognized tax benefits as income tax expense in the Statements of Operations. During the year or period, the Funds did not incur any interest or penalties.
Cambria Investment Management
Notes to Financial Statements
April 30, 2018 (Continued)
2. SIGNIFICANT ACCOUNTING POLICIES (continued)
Offering Expenses — All offering expenses of the Trust were borne by the Investment Adviser and are not subject to future recoupment. As a result, organizational and offering expenses are not reflected in the Statements of Assets and Liabilities.
Expenses — Expenses included in the accompanying financial statements reflect the expenses of each Fund and do not include any expenses associated with the underlying funds.
Security Transactions and Investment Income — Security transactions are accounted for on trade date. Dividend income received from the underlying funds is recognized on the ex-dividend date and is recorded as income distributions in the Statements of Operations. Capital gain distributions received from the underlying funds are recognized on ex-dividend date and are recorded on the Statements of Operations as such. Costs used in determining realized gains and losses on the sales of investment securities are on the basis of specific identification. Dividend income is recorded on the ex-dividend date. Interest income is recognized on the accrual basis. Amortization and accretion is calculated using the scientific interest method, which approximates the effective interest method over the holding period of the security. Amortization of premiums and discounts is included in interest income. Withholding taxes on foreign dividends have been provided for in accordance with the Funds’ understanding of the applicable country’s tax rules and regulations.
Dividends and Distributions to Shareholders — The Funds generally pay out dividends from their net investment income, if any, quarterly, and distributes their net capital gains, if any, to shareholders at least annually. All distributions are recorded on ex-dividend date.
Creation Units — The Funds issue and redeem shares on a continuous basis at NAV in groups of 50,000 shares called ‘‘Creation Units.’’ Purchasers of Creation Units (“Authorized Participants”) must pay a creation transaction fee per transaction. The fee is typically a single charge and will be the same regardless of the number of Creation Units purchased by an investor on the same day. An Authorized Participant who holds Creation Units and wishes to redeem at NAV would also pay a Redemption Fee per transaction to the custodian on the date of such redemption, regardless of the number of Creation Units redeemed that day.
The Distributor has entered into Participant Agreements with certain broker-dealers and others that allow those parties to be Authorized Participants and to subscribe for and redeem shares of the Funds. Such Authorized Participants may from time to time hold, of record or beneficially, a substantial percentage of the Funds’ shares outstanding, act as executing or clearing broker for investment transactions on behalf of the Fund and/or serve as counterparty to derivative transactions with the Fund.
Except when aggregated in Creation Units, shares are not redeemable securities of a Fund. Shares of the Funds may only be purchased or redeemed by Authorized Participants. An Authorized Participant is either (i) a broker-dealer or other participant in the clearing process through the Continuous Net Settlement System of the National Securities Clearing Corporation or (ii) a DTC participant and, in each case, must have executed a Participant Agreement with the Distributor. Most retail investors will not qualify as Authorized Participants or have the resources to buy and sell whole Creation Units. Therefore, they will be unable to purchase or redeem the shares directly from the Funds. Rather, most retail investors will purchase shares in the secondary market with the assistance of a broker and will be subject to customary brokerage commissions or fees.
Cambria Investment Management
Notes to Financial Statements
April 30, 2018 (Continued)
2. SIGNIFICANT ACCOUNTING POLICIES (continued)
If a Creation Unit is purchased or redeemed for cash, a higher transaction fee will be charged. The following table discloses Creation Unit breakdown for the year or period ended April 30, 2018:
| | | Creation Unit Shares | | | Transaction Fee | | | Value | | | Redemption Fee | | Variable Charge | |
Cambria Shareholder Yield ETF | | $ | 50,000 | | | $ | 700 | | | $ | 1,899,000 | | | $ | 700 | | None | |
Cambria Foreign Shareholder Yield ETF | | | 50,000 | | | | 2,000 | | | | 1,329,000 | | | | 2,000 | | Up to 2.0% | |
Cambria Global Value ETF | | | 50,000 | | | | 3,500 | | | | 1,302,500 | | | | 3,500 | | Up to 2.0% | |
Cambria Global Momentum ETF | | | 50,000 | | | | 500 | | | | 1,369,500 | | | | 500 | | Up to 2.0% | |
Cambria Global Asset Allocation ETF | | | 50,000 | | | | 500 | | | | 1,369,000 | | | | 500 | | None | |
Cambria Value and Momentum ETF | | | 50,000 | | | | 700 | | | | 1,254,500 | | | | 700 | | None | |
Cambria Sovereign Bond ETF | | | 50,000 | | | | 550 | | | | 1,378,500 | | | | 550 | | Up to 2.0% | |
Cambria Emerging Shareholder Yield ETF | | | 50,000 | | | | 3,500 | | | | 1,791,500 | | | | 3,500 | | Up to 2.0% | |
Cambria Tail Risk ETF | | | 50,000 | | | | 500 | | | | 1,079,000 | | | | 500 | | None | |
Cambria Core Equity ETF | | | 50,000 | | | | 500 | | | | 1,235,000 | | | | 500 | | None | |
To the extent the Funds permit the contribution of securities in exchange for the purchase of shares (contribution in-kind), shares may be issued in advance of receipt by the Fund of all or a portion of the applicable Deposit Securities. In these circumstances, the Fund may require the Authorized Participant to maintain with the Trust an amount up to 115% and/or 125% of the daily mark-to-market value of the missing Deposit Securities.
Illiquid Securities — A security is considered illiquid if it cannot be sold or disposed of in the ordinary course of business within seven days or less for its approximate carrying value on the books of a Fund. Valuations of illiquid securities may differ significantly from the values that would have been used had an active market value for these securities existed.
3. OFFSETTING ASSETS AND LIABILITIES
The Funds are required to disclose the impact of offsetting assets and liabilities represented in the statements of assets and liabilities to enable users of the financial statements to evaluate the effect or potential effect of netting arrangements on its financial position for recognized assets and liabilities. These recognized assets and liabilities are financial instruments and derivative instruments that are either subject to an enforceable master netting arrangement or similar agreement or meet the following right of setoff criteria: the amounts owed by the Funds to another party are determinable, the Funds has the right to set off the amounts owed with the amounts owed by the other party, the Funds intends to set off, and the Funds right of setoff is enforceable at law.
As of April 30, 2018, the Funds financial instruments and derivative instruments are not subject to a master netting arrangement.
4. RELATED PARTIES
Investment Advisory Agreement — The Investment Adviser is responsible for overseeing the management and business affairs of the Funds, and has discretion to purchase and sell securities in accordance with the Funds’ objectives, policies, and restrictions. The Investment Adviser reviews, supervises, and administers each Fund’s investment program. The Investment Adviser has entered into an investment advisory agreement (“Management Agreement”) with respect to the Funds. Pursuant to that Management Agreement, the Funds pay the Investment Adviser an annual advisory fee based on its average daily nets assets for the services and facilities it provides payable at an annual rate of 0.59%, excluding the Cambria Global Asset Allocation ETF which is not charged an advisory fee and the Cambria Core Equity EFT which pay an annual rate of 1.05%. This allows the cost-conscious investor to hold a diversified, low cost asset allocation portfolio in the Cambria Global Asset Allocation ETF.
Cambria Investment Management
Notes to Financial Statements
April 30, 2018 (Continued)
4. RELATED PARTIES (continued)
With respect to each fund, except the Cambria Global Value ETF and Cambria Emerging Shareholder Yield ETF, the Investment Adviser bears all of the costs of the Funds except for the advisory fee, payments under each Fund’s 12b-1 plan, brokerage expenses, acquired fund fees and expenses, taxes, interest (including borrowing costs and dividend expenses on securities sold short), litigation expenses and other extraordinary expenses. With respect to the Cambria Global Value ETF and Cambria Emerging Shareholder Yield ETF, the Investment Adviser bears all of the costs of each Fund, except for the advisory fee, payments under the Fund’s 12b-1 plan, brokerage expenses, custodial expenses, acquired fund fees and expenses, taxes, interest (including borrowing costs and dividend expenses on securities sold short), litigation expenses and other extraordinary expenses. The Cambria Global Value ETF and Cambria Emerging Shareholder Yield ETF may pay up to 0.10% in custody fees. The Management Agreement for the Funds provides that it may be terminated at any time, without the payment of any penalty, by the Board of Trustees or, with respect to the Funds, by a majority of the outstanding shares of the Funds, on 60 days’ written notice to the Investment Adviser, and by the Investment Adviser on 60 days’ written notice to the Trust and that it shall be automatically terminated if it is assigned.
On January 24, 2018, a controlling owner of the Investment Adviser passed away, resulting in a change in control of the Investment Adviser. This in turn caused the automatic termination of the investment advisory agreement between the Investment Adviser and the Trust, on behalf of each Fund. At a special telephonic meeting of the Board of Trustees held on February 7, 2018, the Board, including a majority of the Independent Trustees, approved an interim advisory agreement between the Investment Adviser and the Trust, on behalf of each Fund, that contains identical terms and compensation to the prior advisory agreement, except with respect to their effective dates and that the interim advisory agreement terminates upon either shareholder approval of a new advisory agreement for a Fund or the 150th day following the interim advisory agreement’s effective date, whichever occurs first. At an in-person meeting of the Board of Trustees held on March 8, 2018, the Board, including a majority of the Independent Trustees, approved a new advisory agreement between the Investment Adviser and the Trust, on behalf of each Fund, that contains identical terms and compensation to the prior advisory agreement, except with respect to their effective dates. The new advisory agreement is subject to the approval of shareholders of each of the Funds.
Additionally, the Investment Adviser earned $140,923 in management fees from the Cambria Global Momentum ETF related to the Fund’s investment in affiliated funds, Cambria Shareholder Yield ETF, Cambria Foreign Shareholder Yield ETF, Cambria Global Value ETF, Cambria Sovereign Bond ETF and Cambria Emerging Shareholder Yield ETF.
Administrator, Custodian and Transfer Agent — SEI Investments Global Fund Services (the “Administrator”) serves as the Funds’ Administrator pursuant to an administration agreement. Brown Brothers Harriman & Co. (the “Custodian” and “Transfer Agent”) serves as the Funds’ Custodian and Transfer Agent pursuant to a Custodian Agreement and a Transfer Agency Services Agreement.
Distribution Agreement — SEI Investments Distribution Co., a wholly-owned subsidiary of SEI Investments and an affiliate of the Administrator (the “Distributor”), serves as the Funds’ distributor of Creation Units pursuant to a distribution agreement. The Distributor does not maintain any secondary market in Fund shares.
The Trust has adopted a Distribution and Service Plan (“Plan”) pursuant to Rule 12b-1 under the Investment Company Act of 1940 (the “1940 Act”). In accordance with its Plan, the Funds are authorized to pay an amount up to 0.25% of its average daily net assets each year for certain distribution-related activities. However, no such fee is currently paid by the Funds, and the Board of Trustees has not currently approved the commencement of any payments under the Plan.
Certain officers and trustees of the funds are officers/employees of the Investment Adviser or the Administrator.
Cambria Investment Management
Notes to Financial Statements
April 30, 2018 (Continued)
5. INVESTMENT TRANSACTIONS
For the year or period ended April 30, 2018, the purchases and sales of investments in securities excluding in-kind transactions, long-term U.S. Government and short-term securities were:
| | | Purchases | | | Sales and Maturities | | |
| Cambria Shareholder Yield ETF | | $ | 56,957,629 | | | $ | 21,688,313 | | |
| Cambria Foreign Shareholder Yield ETF | | | 20,391,040 | | | | 20,024,661 | | |
| Cambria Global Value ETF | | | 33,066,923 | | | | 23,432,035 | | |
| Cambria Global Momentum ETF | | | 41,492,978 | | | | 43,151,033 | | |
| Cambria Global Asset Allocation ETF | | | 18,707,221 | | | | 15,042,761 | | |
| Cambria Value and Momentum ETF | | | 12,503,298 | | | | 13,875,568 | | |
| Cambria Sovereign Bond ETF | | | 12,251,219 | | | | 2,787,283 | | |
| Cambria Emerging Shareholder Yield ETF | | | 13,029,718 | | | | 5,127,251 | | |
| Cambria Tail Risk ETF | | | – | | | | – | | |
| Cambria Core Equity ETF(1) | | | 8,329,825 | | | | 16,815,642 | | |
(1) The Fund commenced operations on May 23, 2017.
For the year ended April 30, 2018 the Cambria Tail Risk ETF had purchases and sales of U.S. Government securities of $18,060,982 and $6,711,624, respectively.
For the year or period ended April 30, 2018, in-kind transactions associated with creations and redemptions were:
| | | Purchases | | | Sales and Maturities | | | Net Realized Gain (Loss) | |
Cambria Shareholder Yield ETF | | $ | 25,691,615 | | | $ | 57,605,105 | | | $ | 14,934,976 | |
Cambria Foreign Shareholder Yield ETF | | | 3,591,100 | | | | 6,659,453 | | | | 1,305,032 | |
Cambria Global Value ETF | | | 71,603,548 | | | | – | | | | – | |
Cambria Global Momentum ETF | | | 38,396,259 | | | | – | | | | – | |
Cambria Global Asset Allocation ETF | | | 45,256,443 | | | | 21,777,692 | | | | 1,564,708 | |
Cambria Value and Momentum ETF | | | 22,281,175 | | | | – | | | | – | |
Cambria Sovereign Bond ETF | | | – | | | | – | | | | – | |
Cambria Emerging Shareholder Yield ETF | | | 7,355,246 | | | | – | | | | – | |
Cambria Tail Risk ETF | | | 7,975,116 | | | | – | | | | – | |
Cambria Core Equity ETF(1) | | | 120,397,455 | | | | 36,321,128 | | | | 3,248,421 | |
(1) The Fund commenced May 23, 2017
For the year or period ended April 30, 2017, in-kind transactions associated with creations and redemptions were:
| | | Purchases | | | Sales and Maturities | | | Net Realized Gain (Loss) | |
Cambria Shareholder Yield ETF | | $ | 6,568,189 | | | $ | 39,302,674 | | | $ | 5,507,419 | |
| Cambria Foreign Shareholder Yield ETF | | | 16,286,102 | | | | 3,106,749 | | | | 28,648 | |
| Cambria Global Value ETF | | | 25,286,996 | | | | 971,685 | | | | 235,207 | |
| Cambria Global Momentum ETF | | | 35,311,850 | | | | 1,146,097 | | | | 54,612 | |
| Cambria Global Asset Allocation ETF | | | 14,780,563 | | | | 3,735,247 | | | | 156,745 | |
| Cambria Value and Momentum ETF | | | 3,238,094 | | | | – | | | | – | |
| Cambria Sovereign Bond ETF | | | – | | | | – | | | | – | |
| Cambria Emerging Shareholder Yield ETF(1) | | | 4,824,337 | | | | 718,982 | | | | 110,390 | |
| Cambria Tail Risk ETF(2) | | | – | | | | – | | | | – | |
(1) The Fund commenced operations on July 14, 2016.
(2) The Fund commenced operations on April 6, 2017.
Cambria Investment Management
Notes to Financial Statements
April 30, 2018 (Continued)
6. PRINCIPAL RISKS
As with all exchange traded funds (‘‘ETFs’’), shareholders of the Funds are subject to the risk that their investment could lose money. The Funds are subject to the principal risks noted below, any of which may adversely affect the Fund’s net asset value (‘‘NAV’’), trading price, yield, total return and ability to meet its investment objective. A more complete description of principal risks is included in the prospectus under the heading ‘‘Principal Risks’’.
Dividend Paying Security Risk — Securities that pay high dividends as a group can fall out of favor with the market, causing these companies to underperform companies that do not pay high dividends. Also, changes in the dividend policies of companies owned by the Funds and the capital resources available for these companies’ dividend payments may adversely affect the Funds.
Equity Investing Risk — An investment in the Funds involves risks similar to those of investing in any Fund holding equity securities, such as market fluctuations, changes in interest rates and perceived trends in stock prices. The values of equity securities could decline generally or could underperform other investments. In addition, securities may decline in value due to factors affecting a specific issuer, market or securities markets generally.
Management Risk — The Cambria Shareholder Yield ETF, Cambria Global Momentum ETF, Cambria Value and Momentum ETF, Cambria Sovereign Bond ETF, Cambria Tail Risk ETF, and Cambria Core Equity ETF (the “Active Funds”) are actively managed using proprietary investment strategies and processes. The Cambria Foreign Shareholder Yield ETF, Cambria Global Value ETF, Cambria Global Asset Allocation ETF and Cambria Emerging Shareholder Yield ETF (the “Index Funds”) are passively managed, meaning that they are designed to track the performance of an underlying index. There can be no guarantee that these strategies and processes will produce the intended results and no guarantee that the Fund will achieve its investment objective. This could result in the Fund’s underperformance compared to other funds with similar investment objectives.
Foreign Investment Risk — Returns on investments in foreign securities could be more volatile than, or trail the returns on, investments in U.S. securities. Investments in or exposures to foreign securities by each Fund are subject to special risks, including risks associated with foreign securities generally, including differences in information available about issuers of securities and investor protection standards applicable in other jurisdictions; capital controls risks, including the risk of a foreign jurisdiction imposing restrictions on the ability to repatriate or transfer currency or other assets; currency risks; political, diplomatic and economic risks; regulatory risks; and foreign market and trading risks, including the costs of trading and risks of settlement in foreign jurisdictions.
Exchange-Traded Funds and Exchange-Traded Products and Investment Companies Risk — The risks of investing in securities of ETFs, ETPs and investment companies typically reflect the risks of the types of instruments in which the underlying ETF, ETP or investment company invests. In addition, with such investments, the Funds bear its proportionate share of the fees and expenses of the underlying entity. As a result, the Funds’ operating expenses may be higher and performance may be lower.
Non-Correlation Risk — The returns of the Index Funds may not match the return of their Underlying Indexes for a number of reasons. For example, each Index Fund incurs operating expenses not applicable to the Underlying Index, and incurs costs in buying and selling securities, especially when rebalancing the Index Fund’s securities holdings to reflect changes in the composition of its Underlying Index. In addition, the performance of each Index Fund and its Underlying Index may vary due to asset valuation differences and differences between each Index Fund’s portfolio and its Underlying Index resulting from legal restrictions, cost or liquidity constraints.
Index Risk — Unlike many investment companies, the Index Funds do not utilize an investing strategy that seeks returns in excess of each Fund’s respective Underlying Index. Therefore, an Index Fund would not necessarily buy or sell a security unless that security is added or removed, respectively, from its respective Underlying Index, even if that security generally is underperforming.
Cash and Cash Equivalents — Cash and cash equivalents may consist of cash balances and time deposits maintained or held at Brown Brothers Harriman. Such amounts may be in excess of Federal Deposit Insurance Corporation limitations.
Cambria Investment Management
Notes to Financial Statements
April 30, 2018 (Continued)
6. PRINCIPAL RISKS (continued)
Futures Contracts Risk — Risks associated with the use of futures contracts include the following: (i) an imperfect correlation between movements in prices of index futures contracts and movements in the value of the stock index that the instrument is designed to simulate; and (ii) the possibility of an illiquid secondary market for a futures contract and the resulting inability to close a position prior to its maturity date. Investments in futures may expose the Fund to leverage.
Fixed Income Risk — A decline in an issuer’s credit rating may cause a decrease in the value of its fixed income securities and an increase in their investment risk and volatility. During periods of falling interest rates, an issuer of a callable bond held by the Funds may “call” (or repay) the security before its stated maturity, and the Funds may have to reinvest the proceeds at lower interest rates, resulting in a decline in the Funds’ income. The market value of fixed income securities generally changes in response to changes in interest rates. As interest rates rise, the value of certain fixed income securities is likely to decrease. Similarly, if interest rates decline, the value of fixed income securities is likely to increase.
High Yield Securities Risk — High yield securities and unrated securities of comparable credit quality are subject to the increased risk of an issuer’s inability to meet principal and interest payment obligations in the Funds. High yield securities are subject to a greater risk of default and investments in them are inherently speculative. The secondary markets in which high yield securities are traded may be less liquid and more volatile than the market for higher grade securities.
Sovereign Debt Securities Risk — Investments in sovereign and quasi-sovereign debt obligations involve special risks not present in corporate debt obligations. The issuer of the sovereign debt or the authorities that control the repayment of the debt may be unable or unwilling to repay principal or interest when due, and the Sovereign Bond ETF may have limited recourse in the event of a default. During periods of economic uncertainty, the market prices of sovereign debt, and the Sovereign Bond ETF’s net asset value, may be more volatile than prices of U.S. debt obligations. In the past, certain non-U.S. markets have encountered difficulties in servicing their debt obligations, withheld payments of principal and interest and declared moratoria on the payment of principal and interest on their sovereign debts.
Options Risk — The value of the Funds’ positions in options fluctuates in response to changes in the value of the underlying index. The Funds also risk losing all or part of the cash paid for purchasing put options. Writing index call options reduces the Funds’ ability to profit from increases in the value of the Funds’ equity portfolio. Because the Cambria Tail Risk ETF only purchases put options, the Fund’s losses from its exposure to put options is limited to the amount of premiums paid to the option seller. To the extent that the Cambria Core Equity ETF reduces its put option holdings relative to the number of call options sold by the Fund, the Fund’s ability to mitigate losses in the event of a market decline will be reduced.
7. GUARANTEES AND INDEMNIFICATIONS
In the normal course of business, the Funds enter into contracts with third-party service providers that contain a variety of representations and warranties and that provide general indemnifications. Additionally, under the Funds’ organizational documents, the officers and trustees are indemnified against certain liabilities arising out of the performance of their duties to the Funds. The Funds’ maximum exposure under these arrangements is unknown, as it involves possible future claims that may or may not be made against the Funds. Based on experience, the Investment Adviser is of the view that the risk of loss to the Funds in connection with the Funds’ indemnification obligations is remote; however, there can be no assurance that such obligations will not result in material liabilities that adversely affect the Funds.
Cambria Investment Management
Notes to Financial Statements
April 30, 2018 (Continued)
8. INCOME TAXES
The amount and character of income and capital gain distributions to be paid, if any, are determined in accordance with Federal income tax regulations, which may differ from U.S. GAAP. These differences are primarily attributable to foreign currency, wash sales and sales of passive foreign investment companies. As a result, net investment income (loss) and net realized gain (loss) on investment transactions for a reporting period may differ significantly from distributions during such period. These book/tax differences may be temporary or permanent. To the extent these differences are permanent in nature, they are charged or credited to undistributed net investment income(loss), accumulated net realized gain (loss) or paid-in capital, as appropriate, in the period that the differences arise.
Accordingly, the following permanent differences which are primarily attributable to partnership adjustments, reclassification of distributions paid and received, reallocation of dividend incomes from underlying funds and redemptions in-kind, have been reclassified to/from the following accounts.
| | | Paid-in Capital | | | Undistributed Net Investment Income (Loss) | | | Accumulated Net Realized Gain (Loss) | |
Cambria Shareholder Yield ETF | | $ | 14,945,197 | | | $ | (5 | ) | | $ | (14,945,192 | ) |
Cambria Foreign Shareholder Yield ETF | | | 1,291,199 | | | | 26,392 | | | | (1,317,591 | ) |
Cambria Global Value ETF | | | – | | | | (69,515 | ) | | | 69,515 | |
Cambria Global Momentum ETF | | | – | | | | 2,558 | | | | (2,558 | ) |
Cambria Global Asset Allocation ETF | | | 1,574,902 | | | | (432 | ) | | | (1,574,470 | ) |
Cambria Value and Momentum ETF | | | – | | | | – | | | | – | |
Cambria Sovereign Bond ETF | | | – | | | | (10,852 | ) | | | 10,852 | |
Cambria Emerging Shareholder Yield ETF | | | – | | | | (21,928 | ) | | | 21,928 | |
Cambria Tail Risk ETF | | | – | | | | – | | | | – | |
Cambria Core Equity ETF | | | 3,260,905 | | | | (97,834 | ) | | | (3,163,071 | ) |
These reclassifications had no impact on the net assets or the net asset value per share of the Funds.
For tax purposes, short-term realized gains are considered ordinary income. The tax character of dividends and distributions declared during the last two fiscal periods were as follows:
| | | Ordinary Income | | | Long-Term Capital Gain | | | Return of Capital | | | Totals | |
| Cambria Shareholder Yield ETF | | | | | | | | | | | | | | | | |
| 2018 | | $ | 1,963,064 | | | $ | 117,168 | | | $ | – | | | $ | 2,080,232 | |
| 2017 | | | 2,080,769 | | | | – | | | | – | | | | 2,080,769 | |
| Cambria Foreign Shareholder Yield ETF | | | | | | | | | | | | | | | | |
| 2018 | | $ | 1,437,092 | | | $ | – | | | $ | – | | | $ | 1,437,092 | |
| 2017 | | | 683,048 | | | | – | | | | – | | | | 683,048 | |
| Cambria Global Value ETF | | | | | | | | | | | | | | | | |
| 2018 | | $ | 3,023,213 | | | $ | – | | | $ | – | | | $ | 3,023,213 | |
| 2017 | | | 1,965,865 | | | | – | | | | – | | | | 1,965,865 | |
| Cambria Global Momentum ETF | | | | | | | | | | | | | | | | |
| 2018 | | $ | 1,446,903 | | | $ | – | | | $ | – | | | $ | 1,446,903 | |
| 2017 | | | 530,781 | | | | – | | | | 39,767 | | | | 570,548 | |
| Cambria Global Asset Allocation ETF | | | | | | | | | | | | | | | | |
| 2018 | | $ | 1,360,015 | | | $ | – | | | $ | – | | | $ | 1,360,015 | |
| 2017 | | | 777,368 | | | | – | | | | – | | | | 777,368 | |
Cambria Investment Management
Notes to Financial Statements
April 30, 2018 (Continued)
8. INCOME TAXES (continued)
| | | Ordinary Income | | | Long-Term Capital Gain | | | Return of Capital | | | Totals | |
| Cambria Value and Momentum ETF | | | | | | | | | | | | | | | | |
| 2018 | | $ | 81,069 | | | $ | – | | | $ | – | | | $ | 81,069 | |
| 2017 | | | 28,879 | | | | – | | | | – | | | | 28,879 | |
| Cambria Sovereign Bond ETF | | | | | | | | | | | | | | | | |
| 2018 | | $ | 719,881 | | | $ | 12,338 | | | $ | – | | | $ | 732,219 | |
| 2017 | | | 229,159 | | | | – | | | | – | | | | 229,159 | |
| Cambria Emerging Shareholder Yield ETF | | | | | | | | | | | | | | | | |
| 2018 | | $ | 509,874 | | | $ | – | | | $ | – | | | $ | 509,874 | |
| 2017 | | | 55,329 | | | | – | | | | – | | | | 55,329 | |
| Cambria Tail Risk ETF | | | | | | | | | | | | | | | | |
| 2018 | | $ | 176,882 | | | $ | – | | | $ | – | | | $ | 176,882 | |
| 2017 | | | – | | | | – | | | | – | | | | – | |
| Cambria Core Equity ETF | | | | | | | | | | | | | | | | |
| 2018 | | $ | 1,295,785 | | | $ | – | | | $ | 51,766 | | | $ | 1,347,551 | |
As of April 30, 2018, the components of distributable earnings (accumulated losses) on a tax basis were as follows:
| | | Cambria Shareholder Yield ETF | | | Cambria Foreign Shareholder Yield ETF | | | Cambria Global Value ETF | | | Cambria Global Momentum ETF | |
Undistributed Ordinary Income | | $ | 417,887 | | | $ | 569,075 | | | $ | 1,081,538 | | | $ | – | |
| Undistributed Long-Term Capital Gain | | | – | | | | – | | | | 2,423,857 | | | | – | |
| Capital Loss Carryforwards | | | (1,107,533 | ) | | | (2,408,302 | ) | | | – | | | | (1,674,283 | ) |
| Late Year Loss Deferral | | | – | | | | – | | | | – | | | | (133,084 | ) |
| Unrealized Appreciation | | | 18,291,791 | | | | 3,070,059 | | | | 11,876,323 | | | | 9,316,384 | |
| Total Distributable Earnings | | $ | 17,602,145 | | | $ | 1,230,832 | | | $ | 15,381,718 | | | $ | 7,509,017 | |
| | | Cambria Global Asset Allocation ETF | | | Cambria Value and Momentum ETF | | | Cambria Sovereign Bond ETF | | | Cambria Emerging Shareholder Yield ETF | |
Undistributed Ordinary Income | | $ | 16,262 | | | $ | 54,733 | | | $ | 168,726 | | | $ | 131,638 | |
| Undistributed Long-Term Capital Gain | | | 14,175 | | | | – | | | | 17,393 | | | | – | |
| Capital Loss Carryforwards | | | – | | | | (1,348,449 | ) | | | – | | | | (189,411 | ) |
| Unrealized Appreciation | | | 1,584,939 | | | | 2,263,184 | | | | 91,749 | | | | 4,271,182 | |
| Other Temporary Differences | | | – | | | | – | | | | (86,230 | ) | | | – | |
| Total Distributable Earnings | | $ | 1,615,376 | | | $ | 969,468 | | | $ | 191,638 | | | $ | 4,213,409 | |
Cambria Investment Management
Notes to Financial Statements
April 30, 2018 (Continued)
8. INCOME TAXES (continued)
| | | Cambria Tail Risk ETF | | | Cambria Core Equity ETF | |
Undistributed Ordinary Income | | $ | 38,839 | | | $ | – | |
| Capital Loss Carryforwards | | | (861,029 | ) | | | (10,587,275 | ) |
| Unrealized Appreciation | | | (1,089,579 | ) | | | 5,663,247 | |
| Total Accumulated Losses | | $ | (1,911,769 | ) | | $ | (4,924,028 | ) |
Under the Regulated Investment Company Modernization Act of 2010, the Fund is permitted to carry forward losses incurred in taxable years beginning after December 22, 2010 for an unlimited period. Additionally, post-enactment losses that are carried forward will retain their character as either short term or long term capital losses. As of April 30, 2018, the Funds have the following capital loss carryforwards and offset capital gains for an unlimited period:
| | | Non-Expiring Short-Term Loss | | | Non- Expiring Long-Term Loss | | | Total | |
Cambria Shareholder Yield ETF | | $ | 1,107,533 | | | $ | – | | | $ | 1,107,533 | |
| Cambria Foreign Shareholder Yield ETF | | $ | – | | | $ | 2,408,302 | | | $ | 2,408,302 | |
| Cambria Global Value ETF | | $ | – | | | $ | – | | | $ | – | |
| Cambria Global Momentum ETF | | $ | 1,674,283 | | | $ | – | | | $ | 1,674,283 | |
| Cambria Global Asset Allocation ETF | | $ | – | | | $ | – | | | $ | – | |
| Cambria Value and Momentum ETF | | $ | 1,348,449 | | | $ | – | | | $ | 1,348,449 | |
| Cambria Sovereign Bond ETF | | $ | – | | | $ | – | | | $ | – | |
| Cambria Emerging Shareholder Yield ETF | | $ | 189,411 | | | $ | – | | | $ | 189,411 | |
| Cambria Tail Risk ETF | | $ | 198,472 | | | $ | 662,557 | | | $ | 861,029 | |
| Cambria Core Equity ETF | | $ | 7,281,799 | | | $ | 3,305,476 | | | $ | 10,587,275 | |
During the year ended April 30, 2018, the Cambria Foreign Shareholder Yield ETF, Cambria Global Value ETF, Cambria Global Momentum ETF, Cambria Global Asset Allocation ETF and Cambria Value and Momentum ETF utilized $2,596,225, $1,025,220, $1,936,853, $577,019, $421,821 of capital loss carryforwards to offset capital gains, respectively.
Cambria Investment Management
Notes to Financial Statements
April 30, 2018 (Continued)
8. INCOME TAXES (continued)
The Federal tax cost and aggregate gross unrealized appreciation and depreciation on investments held by the Funds at April 30, 2018, were as follows:
Cambria Investment Management | | Federal Tax Cost | | | Aggregated Gross Unrealized Appreciation | | | Aggregated Gross Unrealized Depreciation | | | Net Unrealized Appreciation (Depreciation) | |
Cambria Shareholder Yield ETF | | $ | 123,478,126 | | | $ | 20,926,170 | | | $ | (2,634,379 | ) | | $ | 18,291,791 | |
| Cambria Foreign Shareholder Yield ETF | | | 42,655,622 | | | | 6,820,403 | | | | (3,750,344 | ) | | | 3,070,059 | |
| Cambria Global Value ETF | | | 200,118,364 | | | | 26,585,177 | | | | (14,708,854 | ) | | | 11,876,323 | |
| Cambria Global Momentum ETF | | | 93,452,619 | | | | 9,472,197 | | | | (155,813 | ) | | | 9,316,384 | |
| Cambria Global Asset Allocation ETF | | | 65,111,023 | | | | 2,196,552 | | | | (611,613 | ) | | | 1,584,939 | |
| Cambria Value and Momentum ETF | | | 27,789,378 | | | | 3,096,846 | | | | (833,662 | ) | | | 2,263,184 | |
| Cambria Sovereign Bond ETF | | | 17,094,720 | | | | 686,851 | | | | (595,102 | ) | | | 91,749 | |
| Cambria Emerging Shareholder Yield ETF | | | 25,459,651 | | | | 5,292,942 | | | | (1,021,760 | ) | | | 4,271,182 | |
| Cambria Tail Risk ETF | | | 21,588,072 | | | | 40,403 | | | | (1,129,982 | ) | | | (1,089,579 | ) |
| Cambria Core Equity ETF | | | 77,912,239 | | | | 8,773,122 | | | | (3,109,875 | ) | | | 5,663,247 | |
9. SUBSEQUENT EVENTS
The Funds have evaluated the need for additional disclosures and/or adjustments resulting from subsequent events through the date the financial statements were issued. Based on this evaluation, no adjustments were required to the financial statements.
Cambria Investment Management
Report of Independent Registered Public Accounting Firm
To the Shareholders and Board of Trustees of
Cambria ETF Trust
Opinion on the Financial Statements
We have audited the accompanying statements of assets and liabilities, including the schedules of investments, of Cambria Shareholder Yield ETF, Cambria Foreign Shareholder Yield ETF, Cambria Global Value ETF, Cambria Global Momentum ETF, Cambria Global Asset Allocation ETF, Cambria Value and Momentum ETF, Cambria Sovereign Bond ETF, Cambria Emerging Shareholder Yield ETF, Cambria Tail Risk ETF and Cambria Core Equity ETF (the “Funds”), each a series of Cambria ETF Trust, as of April 30, 2018, and the related statements of operations for the year then ended, the statements of changes in net assets for each of the two years in the period then ended, including the related notes, and the financial highlights for each of the three periods in the period then ended for the Cambria Shareholder Yield ETF, Cambria Foreign Shareholder Yield ETF, Cambria Global Value ETF, Cambria Global Momentum ETF, Cambria Global Asset Allocation ETF, Cambria Value and Momentum ETF and Cambria Sovereign Bond ETF, and the related statements of operations for the year then ended and the statements of changes in net assets, including the related notes, and the financial highlights for each of the two periods in the period then ended for the Cambria Emerging Shareholder Yield ETF and Cambria Tail Risk ETF, and the related statements of operations and changes in net assets, including the related notes, and financial highlights for the period May 23, 2017 (commencement of operations) through April 30, 2018 for the Cambria Core Equity ETF (collectively referred to as the “financial statements”). In our opinion, the financial statements present fairly, in all material respects, the financial position of the each of the Funds as of April 30, 2018, the results of their operations for the year then ended, and the changes in their net assets for each of the periods referred to above, in conformity with accounting principles generally accepted in the United States of America.
The Funds’ financial highlights for the periods ended April 30, 2015 and prior, were audited by other auditors whose report dated June 26, 2015, expressed an unqualified opinion on those financial highlights.
Basis for Opinion
These financial statements are the responsibility of the Funds’ management. Our responsibility is to express an opinion on the Funds’ financial statements based on our audits. We are a public accounting firm registered with the Public Company Accounting Oversight Board (United States) (“PCAOB”) and are required to be independent with respect to the Funds in accordance with the U.S. federal securities laws and the applicable rules and regulations of the Securities and Exchange Commission and the PCAOB.
We conducted our audits in accordance with the standards of the PCAOB. Those standards require that we plan and perform the audit to obtain reasonable assurance about whether the financial statements are free of material misstatement, whether due to error or fraud.
Our audits include performing procedures to assess the risks of material misstatement of the financial statements, whether due to error or fraud, and performing procedures that respond to those risks. Such procedures include examining, on a test basis, evidence regarding the amounts and disclosures in the financial statements and confirmation of securities owned as of April 30, 2018, by correspondence with the custodian and brokers. Our audits also included evaluating the accounting principles used and significant estimates made by management, as well as evaluating the overall presentation of the financial statements. We believe that our audits provide a reasonable basis for our opinion.
We have served as the Funds’ auditor since 2016.

COHEN & COMPANY, LTD.
Cleveland, Ohio
June 29, 2018
Cambria Investment Management
Disclosure of Fund Expenses
(Unaudited)
All Exchange Traded Funds (“ETF”) have operating expenses. As a shareholder of an ETF, your investment is affected by these ongoing costs, which include (among others) costs for ETF management, administrative services, brokerage fees and shareholder reports like this one. It is important for you to understand the impact of these costs on your investment returns.
Operating expenses such as these are deducted from an ETF’s gross income and directly reduce its final investment return. These expenses are expressed as a percentage of the ETF’s average net assets; this percentage is known as the ETF’s expense ratio.
The following examples use the expense ratio and are intended to help you understand the ongoing costs (in dollars) of investing in your Fund and to compare these costs with those of other funds. The examples are based on an investment of $1,000 made at the beginning of the period shown and held for the entire period (November 1, 2017 to April 30, 2018).
The table below illustrates your Fund’s costs in two ways:
Actual Fund Return. This section helps you to estimate the actual expenses after fee waivers that your Fund incurred over the period. The “Expenses Paid During Period” column shows the actual dollar expense cost incurred by a $1,000 investment in the Fund, and the “Ending Account Value” number is derived from deducting that expense cost from the Fund’s gross investment return.
You can use this information, together with the actual amount you invested in the Fund, to estimate the expenses you paid over that period. Simply divide your actual account value by $1,000 to arrive at a ratio (for example, an $8,600 account value divided by $1,000 = 8.6), then multiply that ratio by the number shown for your Fund under “Expenses Paid During Period.”
Hypothetical 5% Return. This section helps you compare your Fund’s costs with those of other funds. It assumes that the Fund had an annual 5% return before expenses during the year, but that the expense ratio (Column 3) for the period is unchanged. This example is useful in making comparisons because the Commission requires all funds to make this 5% calculation. You can assess your Fund’s comparative cost by comparing the hypothetical result for your Fund in the “Expenses Paid During Period” column with those that appear in the same charts in the shareholder reports for other funds.
Cambria Investment Management
Disclosure of Fund Expenses
(Unaudited)
NOTE: Because the return is set at 5% for comparison purposes — NOT your Fund’s actual return — the account values shown may not apply to your specific investment.
| | | Beginning
Account
Value
11/1/17 | | | Ending
Account
Value
4/30/18 | | | Annualized Expense Ratios | | | Expenses Paid During Period(1) | |
| Cambria Shareholder Yield ETF | | | | | | | | | | | | | | | | |
Actual Fund Return | | $ | 1,000.00 | | | $ | 1,063.20 | | | | 0.59 | % | | $ | 3.02 | |
| Hypothetical 5% Return | | $ | 1,000.00 | | | $ | 1,021.87 | | | | 0.59 | % | | $ | 2.96 | |
| | | | | | | | | | | | | | | | | |
| Cambria Foreign Shareholder Yield ETF | | | | | | | | | | | | | | | | |
| Actual Fund Return | | $ | 1,000.00 | | | $ | 1,047.20 | | | | 0.59 | % | | $ | 3.00 | |
| Hypothetical 5% Return | | $ | 1,000.00 | | | $ | 1,021.87 | | | | 0.59 | % | | $ | 2.96 | |
| | | | | | | | | | | | | | | | | |
| Cambria Global Value ETF | | | | | | | | | | | | | | | | |
| Actual Fund Return | | $ | 1,000.00 | | | $ | 1,041.20 | | | | 0.67 | % | | $ | 3.39 | |
| Hypothetical 5% Return | | $ | 1,000.00 | | | $ | 1,021.47 | | | | 0.67 | % | | $ | 3.36 | |
| | | | | | | | | | | | | | | | | |
| Cambria Global Momentum ETF | | | | | | | | | | | | | | | | |
| Actual Fund Return | | $ | 1,000.00 | | | $ | 1,033.30 | | | | 0.59 | % | | $ | 2.97 | |
| Hypothetical 5% Return | | $ | 1,000.00 | | | $ | 1,021.87 | | | | 0.59 | % | | $ | 2.96 | |
| | | | | | | | | | | | | | | | | |
| Cambria Global Asset Allocation ETF | | | | | | | | | | | | | | | | |
| Actual Fund Return | | $ | 1,000.00 | | | $ | 1,026.00 | | | | — | % | | $ | – | |
| Hypothetical 5% Return | | $ | 1,000.00 | | | $ | 1,024.79 | | | | — | % | | $ | – | |
| | | | | | | | | | | | | | | | | |
| Cambria Value and Momentum ETF | | | | | | | | | | | | | | | | |
| Actual Fund Return | | $ | 1,000.00 | | | $ | 1,007.30 | | | | 0.65 | % | | $ | 3.24 | |
| Hypothetical 5% Return | | $ | 1,000.00 | | | $ | 1,021.57 | | | | 0.65 | % | | $ | 3.26 | |
| | | | | | | | | | | | | | | | | |
| Cambria Sovereign Bond ETF | | | | | | | | | | | | | | | | |
| Actual Fund Return | | $ | 1,000.00 | | | $ | 1,037.40 | | | | 0.59 | % | | $ | 2.98 | |
| Hypothetical 5% Return | | $ | 1,000.00 | | | $ | 1,021.87 | | | | 0.59 | % | | $ | 2.96 | |
| | | | | | | | | | | | | | | | | |
| Cambria Emerging Shareholder Yield ETF | | | | | | | | | | | | | | | | |
| Actual Fund Return | | $ | 1,000.00 | | | $ | 1,093.40 | | | | 0.66 | % | | $ | 3.37 | |
| Hypothetical 5% Return | | $ | 1,000.00 | | | $ | 1,021.57 | | | | 0.66 | % | | $ | 3.26 | |
| | | | | | | | | | | | | | | | | |
| Cambria Tail Risk ETF | | | | | | | | | | | | | | | | |
| Actual Fund Return | | $ | 1,000.00 | | | $ | 940.00 | | | | 0.59 | % | | $ | 2.84 | |
| Hypothetical 5% Return | | $ | 1,000.00 | | | $ | 1,021.87 | | | | 0.59 | % | | $ | 2.96 | |
| | | | | | | | | | | | | | | | | |
| Cambria Core Equity ETF | | | | | | | | | | | | | | | | |
| Actual Fund Return | | $ | 1,000.00 | | | $ | 979.50 | | | | 1.23 | % | | $ | 6.04 | |
| Hypothetical 5% Return | | $ | 1,000.00 | | | $ | 1,018.70 | | | | 1.23 | % | | $ | 6.16 | |
(1) | Expenses are equal to the Fund’s annualized expense ratio multiplied by the average account value over the period, multiplied 181/365 (to reflect the one-half year period). |
| | |
Cambria Investment Management
Trustees and Officers
(Unaudited)
Set forth below are the names, ages, position with the Trust, term of office, length of time served and the principal occupations for the last five years of each of the persons currently serving as Trustees and Officers of the Trust. Trustees who are deemed not to be “interested persons” of the Trust are referred to as “Independent Trustees.” Mr. Faber is a Trustee who is deemed to be an “interested” Trustee of the Fund as that term is defined in the 1940 Act by virtue of his employment with and ownership interest in the Investment Adviser. The Trust’s Statement of Additional Information (“SAI”) includes additional information about the Trustees and Officers. The SAI may be obtained without charge by calling (855) 383-4636. The following chart lists Trustees and Officers as of April 30, 2018.
Name, Address, Age1 | | Position(s) Held with the Trust and Length of Time Served2 | | Principal Occupation(s) During the Past 5 Years | | Other Directorships Held by Trustee |
INTERESTED TRUSTEE 3 |
Mebane Faber DOB: 1977 | | President of the Trust; no set term (since 2018) | | Co-founder and Chief Investment Officer, Cambria Investment Management, L.P. (2006-present) | | None |
INDEPENDENT TRUSTEES |
Eric Leake DOB: 1970 | | Trustee; no set term (Since 2013) | | Partner and Chief Investment Officer, Anchor Capital Management Group, Inc. (since 1996). | | Board Member, National Association of Active Investment Management (NAAIM) (2008-2010). |
| | �� | | | | | |
Dennis G. Schmal DOB: 1947 | | Trustee; no set term (Since 2013) | | Self-employed consultant (since 2003). | | Director, AssetMark (formerly Genworth) Mutual Funds (2007-present); Director, Merriman Holdings Inc. (formerly MCF Corp.) (financial services) (2003-2016); Director, Owens Realty Mortgage Inc. (real estate) (2013-present); Director and Chairman, Pacific Metrics Corporation (2005-2014) (educational services); Director and Chairman, Sitoa Global (2011-2013) (e-commerce); Trustee, Wells Fargo GAI Hedge Funds (2007-present); Director, Blue Calypso (2015-present) (e-commerce). |
| | 1 | Unless otherwise noted, the business address of each trustee is Cambria ETF Trust, 2321 Rosecrans Avenue, Suite 3225, El Segundo CA 90245. Trustees oversee 10 funds in the Cambria ETF Trust. |
| | 2 | Each Trustee shall hold office during the lifetime of this trust until the election and qualification of his or her successor, or until he or she sooner dies, resigns, or is removed in accordance with the Trust's Trust Instrument. |
| | 3 | Denotes Trustees who may be deemed to be “interested” persons of the Fund as that term is defined in the 1940 Act by virtue of their affiliation with (the Distributor and/or its affiliates.) |
Cambria Investment Management
Trustees and Officers
(Unaudited)
| | | | | | | |
Name, Address, Age4 | | Position(s) Held with the Trust and Length of Time Served5 | | Principal Occupation(s) During the Past 5 Years | | Other Directorships Held by Board Member |
OFFICERS6 |
Douglas Tyre DOB: 1980 | | Chief Compliance Officer; no set term (Since May 2018) | | Assistant Compliance Director, Chief Compliance Officer, Cipperman Compliance Services, LLC (since 2014); Client Services & Operations Specialist - Senior Associate, Echo Point Investment Management LLC (2010 – 2014). | | None |
Himanshu Sudhir Surti DOB: 1974 | | Vice President; no set term (Since 2018) | | Chief Operating Officer (2014 – present), Portfolio Manager (2014 – present), Cambria Investment Management, L.P.; Strategy Manager (2008 – 2013), Research Affiliates, LLC. | | None |
Eric Kleinschmidt(7) 1 Freedom Valley Drive Oaks, PA 19456 DOB: 1968 | | Principal Financial Officer; no set term (Since 2016) | | Director of Fund Accounting, SEI Investments Global Funds Services since 2004. | | None |
| | 4 | Unless otherwise noted, the business address of each officer is Cambria ETF Trust, 2321 Rosecrans Avenue, Suite 3225, El Segundo CA 90245. |
| | 5 | Each Trustee shall hold office during the lifetime of this trust until the election and qualification of his or her successor, or until he or she sooner dies, resigns, or is removed in accordance with the Trust's Trust Instrument. |
| | 6 | Officers oversee 10 funds in the Cambria ETF Trust. |
| | 7 | Certain officers and/or interested trustees of the Fund are also officers of the distributor, the advisor or the administrator. |
Cambria Investment Management
Approval of Advisory Agreements & Board Considerations
April 30, 2018 (Unaudited)
Board Considerations in Approving the Interim Investment Advisory Agreements
At a telephonic meeting held on February 7, 2018, the Board of Trustees (the “Board”) of Cambria ETF Trust (the “Trust”), including those Trustees who are not “interested persons” as defined in the Investment Company Act of 1940, as amended (“1940 Act”) of the Trust (the “Independent Trustees”), met to discuss the unexpected death of Eric Richardson. Mr. Richardson had served as President of the Trust, interested Trustee, and Chairman of the Board since the Trust’s inception. He was also the Chief Executive Officer and a controlling owner of Cambria Investment Management, L.P. (“Cambria”). Mr. Richardson’s death resulted in a change in control of Cambria, which in turn caused the automatic termination of each existing investment advisory agreement between the Trust, on behalf of each of its series (each, a “Fund” and, collectively, the “Funds”), and Cambria, the Funds’ investment adviser (together, the “Prior Agreement”). The telephonic meeting was called for the purpose of, among other things, to consider, and vote on, the approval of interim investment advisory agreements (together, the “Interim Agreement”) between the Trust, on behalf of each Fund, and Cambria, that would allow Cambria to continue providing advisory services to the Funds. The Board considered that the Interim Agreement and the Prior Agreement contain identical terms and compensation, except with respect to their effective dates and that the Interim Agreement terminates upon either shareholder approval of a new advisory agreement for a Fund or the 150th day following the Interim Agreement’s effective date, whichever occurs first.
In evaluating the Interim Agreement, the Board considered each of the representations and factors discussed in greater detail below in its consideration of the new investment advisory agreement between the Trust, on behalf of each Fund, and Cambria (the “New Agreement”), which contains terms and compensation that are identical to those of the Prior Agreement, except with respect to their effective dates. The Board considered that its assessment of each of these factors had not changed materially as a result of Cambria’s change in control. The Board also evaluated information derived from past Board meetings concerning Fund performance and the quality of services rendered by Cambria to the Funds.
Based on the Board’s deliberations and its evaluation of the factors described below and the information it believed relevant in the exercise of its reasonable business judgment, the Board, including all of the Independent Trustees, with the assistance of Fund counsel, unanimously concluded that the terms of the Interim Agreement, including the fees to be paid thereunder, were fair and reasonable and agreed to approve the Interim Agreement. In its deliberations, the Board did not identify any absence of information as material to its decision, or any particular factor (or conclusion with respect thereto) or single piece of information that was all-important, controlling or determinative of its decision, but considered all of the factors together, and each Trustee may have attributed different weights to the various factors (and conclusions with respect thereto) and information.
Board Considerations in Approving the New Investment Advisory Agreement
At an in-person meeting held on March 14, 2018, the Board, including the Independent Trustees, met to discuss, among other things, Cambria’s change in control, including its impact on the Funds, and to consider, and vote on, the approval of the New Agreement with respect to each Fund.
In preparation for its deliberations, the Board requested and reviewed written responses from Cambria to a due diligence questionnaire circulated on the Board’s behalf. During its deliberations, the Board received an oral presentation from Cambria and was assisted by the advice of independent legal counsel. The Board, in considering the New Agreement in the context of Cambria’s change in control, relied upon representations from Cambria that: (i) the change in control was not expected to result in any material changes to the nature, quality and extent of services provided to the Funds by Cambria, as discussed below; (ii) Cambria did not anticipate any material changes to its compliance program or code of ethics in connection with the change in control; and (iii) Cambria expects Mr. Faber will continue to serve as a portfolio manager for each Fund and Mr. Pursell will continue to serve as a portfolio manager for the Cambria Core Equity ETF.
Cambria Investment Management
Approval of Advisory Agreements & Board Considerations
April 30, 2018 (Unaudited)
In evaluating the New Agreement, the Board reviewed information regarding Cambria’s personnel, operations, and financial condition. In addition, the Board considered that the evaluation process with respect to Cambria is an ongoing one and, in this regard, the Board considers information at each regularly scheduled meeting, including, among other things, information concerning performance and services provided by Cambria. At the meeting held on March 14, 2018, the Board considered: (1) the nature, extent and quality of the services provided to the Funds by Cambria; (2) the investment performance of Cambria with respect to each Fund as compared to the performance of an index (a Fund’s “benchmark”) and a group of funds (a Fund’s “peer group”) historically identified by Cambria as comparable to the Fund; (3) the costs of the services provided by Cambria and the profitability to Cambria derived from its relationship with the Funds; (4) the advisory fee and total expense ratio of the Funds compared to a relevant peer group of funds; (5) the extent to which economies of scale would be realized as the Funds grow and whether the advisory fee would enable investors to share in the benefits of economies of scale; (6) benefits (such as soft dollars, if any) received by Cambria and its affiliates from their relationship with the Funds; (7) Cambria’s reputation, expertise and resources in the financial markets; (8) Cambria’s investment management personnel; (9) Cambria’s operations and financial condition; (10) Cambria’s compliance program; and (11) other factors the Board deemed relevant. At the same meeting, the Board also considered the terms of the New Agreement and noted that the terms of, and the compensation payable to Cambria under, the New Agreement are identical to those of the Prior Agreement, except with respect to the date of the agreement.
The discussion immediately below outlines in greater detail the materials and information presented to the Board in connection with its consideration and approval of the New Agreement, and the conclusions made by the Board at the meeting held on March 14, 2018 when determining to approve the New Agreement for an initial two-year term.
Nature, Extent and Quality of Services. The Board reviewed the nature, quality and extent of the overall services provided by Cambria to the Funds. In particular, the Board considered the responsibilities of Cambria under the terms of the New Agreement, recognizing that Cambria had invested significant time and effort in structuring the Trust and the Funds, obtaining the necessary exemptive relief from the Securities and Exchange Commission (“SEC”), arranging service providers, exploring various sales channels, and assessing the appeal for each Fund’s investment strategy. In addition, the Board considered that Cambria is responsible for providing investment advisory services to the Funds, monitoring compliance with each Fund’s objectives, policies and restrictions, and carrying out directives of the Board. The Board also considered the services provided by Cambria in the oversight of the Trust’s distributor, administrator, transfer agent, and custodian. The Board also discussed and considered the role of Cambria Indices, LLC as index provider to the Funds with index tracking strategies (the “Index Funds”). In addition, the Board evaluated the integrity of Cambria’s personnel, the professional qualifications and experience of the portfolio management team in managing assets, their experiences with Cambria’s services, and the adequacy of Cambria’s resources and financial condition. Based on its review, within the context of its full deliberations, the Board determined that it was satisfied with the nature, extent and quality of the services provided, and expected to be provided, to the Funds by Cambria.
Investment Performance of the Funds. The Board noted that it considered the performance of the Funds throughout the year and reviewed each Fund’s performance for the three-month, 12-month, and since inception periods, as applicable. In this regard, among other things, the Board considered reports comparing each Fund’s total returns to the total returns of the Fund’s peer group of funds and its benchmark index. Representatives from Cambria provided information regarding and led discussions of factors impacting the performance of each Fund, outlining current market conditions and explaining their expectations and strategies for the future. The Trustees determined that each Fund’s performance was satisfactory, or, where the Fund’s performance was materially below its benchmark and/or peer group, the Trustees were satisfied by the reasons for the underperformance and/or the steps taken by Cambria in an effort to improve the Fund’s performance. With respect to the Index Funds, the Board also considered the quality of the index each Index Fund seeks to track, each Index Fund’s tracking error relative to its underlying index, and Cambria’s representation that each Index Fund’s tracking error met the expectations described in the SEC exemptive order on which Cambria and the Funds rely to operate as ETFs. The Board also considered each Fund’s portfolio turnover rate. Based on this information, the Board concluded that it was satisfied with the investment results that Cambria had been able to achieve for the Funds.
Cambria Investment Management
Approval of Advisory Agreements & Board Considerations
April 30, 2018 (Unaudited)
Comparative Fees and Expenses. The Board considered each Fund’s advisory fees in relation to the estimated costs of the advisory and related services provided by Cambria. The Trustees noted that each Fund charges a unitary advisory fee through which, Cambria, not the Funds, is responsible for paying many of the expenses necessary to service the Funds, including the expenses of other service providers. In considering the advisory fees, the Board reviewed and considered the fees in light of the nature, quality and extent of the services provided by Cambria. Because the Funds charge unitary advisory fees, the Board considered how the Funds’ total expense ratios compared to those of the funds in their peer groups. After comparing expense ratios, the Board noted that each Fund’s total expense ratio was generally consistent with the range of total expense ratios charged by its peer group of funds. The Board also considered Cambria’s representation that it would continue to monitor the Funds’ expense ratios as compared to those of their peer groups and seek to ensure that the Funds remain competitive. Based on its review, in the context of its full deliberations, the Board concluded for each Fund that the advisory fees appeared reasonable in light of the services rendered.
Costs and Profitability. The Board then considered the profits realized by Cambria in connection with providing services to the Funds. The Board reviewed profit and loss information provided by Cambria with respect to each of the Funds. In particular, the Board noted Cambria’s representation of its long-term commitment to the success of the Funds and the unitary fee structure under which Cambria bears the risk that the Funds’ expenses may increase. The Board further considered the costs associated with the personnel, systems and equipment necessary to manage the Funds and to meet the regulatory and compliance requirements adopted by the SEC and other regulatory bodies as well as other expenses Cambria pays in accordance with the Agreements. The Board also considered how Cambria’s profitability was affected by factors such as its organizational structure and method for allocating expenses. Based on its review, in the context of its full deliberations, the Board concluded that Cambria’s profitability with respect to the Funds appeared reasonable in light of the services Cambria rendered to the Funds.
Other Benefits. The Board then considered the extent to which Cambria derives ancillary benefits from the Funds’ operations. The Board discussed the potential benefits to Cambria resulting from its ability to use the Funds’ assets to engage in soft dollar transactions. The Board noted that Cambria did not have any affiliates that would benefit from the Funds’ operations. The Board reviewed the degree to which Cambria may receive compensation from the Funds based upon a Fund’s investment in other Cambria ETFs. The Board also considered that Cambria, not the applicable Index Fund, pays any licensing fees attributable to underlying Cambria indices to Cambria’s affiliated index provider.
Economies of Scale. The Board next considered the absence of breakpoints in Cambria’s fee schedule for each Fund and reviewed information regarding the extent to which economies of scale or other efficiencies may result from increases in each Fund’s asset levels. The Board determined that it is difficult to predict when economies of scale might be realized for Cambria and the Funds, many of which launched recently. The Board, thus, determined to monitor potential economies of scale, as well as the appropriateness of introducing breakpoints, as assets managed by each Fund grow larger.
Approval of the New Agreement. Based on the Board’s deliberations and its evaluation of the information described above and other factors and information it believed relevant in the exercise of its reasonable business judgment, the Board, including all of the Independent Trustees, with the assistance of Fund counsel, unanimously concluded that the terms of the New Agreement, including the fees to be paid thereunder, were fair and reasonable and agreed to approve the New Agreement for an initial term of two years and recommend the approval of the New Agreement to the Funds’ shareholders. In its deliberations, the Board did not identify any absence of information as material to its decision, or any particular factor (or conclusion with respect thereto) or single piece of information that was all-important, controlling or determinative of its decision, but considered all of the factors together, and each Trustee may have attributed different weights to the various factors (and conclusions with respect thereto) and information.
Cambria Investment Management
Notice to Shareholders
April 30, 2018 (Unaudited)
For shareholders that do not have an April 30, 2018, tax year end, this notice is for informational purposes only. For shareholders with an April 30, 2018 tax year end, please consult your tax advisor as to the pertinence of this notice. For the fiscal year ended April 30, 2018, the Funds are designating the following items with regard to distributions paid during the year.
| | | Return of Capital | | | Long-Term Capital Gain Distributions | | | Ordinary Income Distributions | | | Total Distributions | | | Qualifying Dividends(1) | | | Qualifying Dividend Income (2) | | | U.S. Government Interest (3) | | | Qualified Interest Income (4) | | | Qualified Short-Term Capital Gain (5) | | | Foreign Tax Credit (6) | |
Cambria Shareholder Yield ETF | | 0.00% | | | 5.63% | | | 94.37% | | | 100.00% | | | 100.00% | | | 100.00% | | | 0.00% | | | 0.12% | | | 0.00% | | | N/A | |
Cambria Foreign Shareholder Yield ETF | | 0.00% | | | 0.00% | | | 100.00% | | | 100.00% | | | 0.00% | | | 90.17% | | | 0.00% | | | 0.17% | | | 0.00% | | | 9.21% | |
Cambria Global Value ETF | | 0.00% | | | 0.00% | | | 100.00% | | | 100.00% | | | 0.00% | | | 99.90% | | | 0.00% | | | 0.12% | | | 0.00% | | | 19.81% | |
Cambria Global Momentum ETF | | 0.00% | | | 0.00% | | | 100.00% | | | 100.00% | | | 64.89% | | | 85.35% | | | 0.00% | | | 1.95% | | | 0.00% | | | N/A | |
Cambria Global Asset Allocation ETF | | 0.00% | | | 0.00% | | | 100.00% | | | 100.00% | | | 57.37% | | | 60.52% | | | 0.00% | | | 0.00% | | | 0.00% | | | N/A | |
Cambria Value and Momentum ETF | | 0.00% | | | 0.00% | | | 100.00% | | | 100.00% | | | 100.00% | | | 100.00% | | | 0.00% | | | 0.56% | | | 0.00% | | | N/A | |
Cambria Sovereign Bond ETF | | 0.00% | | | 1.69% | | | 98.31% | | | 100.00% | | | 0.00% | | | 0.00% | | | 0.00% | | | 0.00% | | | 100.00% | | | N/A | |
Cambria Emerging Shareholder Yield ETF | | 0.00% | | | 0.00% | | | 100.00% | | | 100.00% | | | 0.00% | | | 81.40% | | | 0.00% | | | 0.61% | | | 0.00% | | | 16.62% | |
Cambria Tail Risk ETF | | 0.00% | | | 0.00% | | | 100.00% | | | 100.00% | | | 0.00% | | | 0.00% | | | 100.00% | | | 100.00% | | | 0.00% | | | N/A | |
Cambria Core Equity ETF | | 3.84% | | | 0.00% | | | 96.16% | | | 100.00% | | | 100.00% | | | 100.00% | | | 0.00% | | | 0.09% | | | 0.00% | | | N/A | |
(1) | Qualifying dividends represent dividends which qualify for the corporate dividends received deduction and is reflected as a percentage of ordinary Income distributions (the total of short term capital gain and net investment income distributions). |
(2) | The percentage in this column represents the amount of "Qualifying Dividend Income" as created by the Jobs and Growth Relief Reconciliation Act of 2003 and its reflected as a percentage of ordinary income distributions (the total of short term capital gain and net investment income distributions). It is the intention of each of the aforementioned funds to designate the maximum amount permitted by law. |
(3) | "U.S. Government Interest represents the amount of interest that was derived from U.S. Government obligations and distributed during the fiscal year. This amount is reflected as a percentage of total ordinary income distributions (the total of short term capital gain and net investment income distributions). Generally, interest from direct U.S. Government obligations is exempt from state income tax. However, for shareholders of the Fund who are residents of California, Connecticut and New York, the statutory threshold requirements were not satisfied to permit exemption of these amounts from state income. |
(4) | The percentage in this column represents the amount of "Qualifying Interest Income" as created by the American Jobs Creation Act of 2004 and is a percentage of net investment income that is exempt from U.S. withholding tax when paid for foreign investors. |
(5) | The percentage in this column represents the amount of "Qualifying Short-Term Capital Gain" as created by the American Jobs Creation Act of 2004 and is reflected as a percentage of short-term capital gain distributions that is exempt from U.S. withholding tax when paid to foreign investors. |
(6) | The percentage in this column represents the "Qualifying Foreign Taxes" as a percentage of ordinary distributions during the fiscal year ended April 30, 2018. The Cambria Foreign Shareholder Yield ETF, Cambria Global Value ETF and Cambria Emerging Shareholder Yield ETF expect to pass through $145,749, $747,017 and $101,630 respectively, as foreign tax credits on Form 1099-DIV for the year ending December 31, 2018 which shareholders of these portfolios will receive in late January 2019. In addition, for the year ended April 30, 2018, gross foreign source income amounted to $1,746,059, $5,619,594 and $839,084 respectively, and will be reported on Form 1099-DIV for the year ending December 31, 2018, which shareholders of these portfolios will receive in late January 2019. |
The information reported herein may differ from the information and distributions taxable to the shareholders for the calendar year ending April 30, 2018. Complete information will be computed and reported in conjunction with your 2018 Form 1099-DIV.
Cambria Investment Management
Supplemental Information
April 30, 2018 (Unaudited)
Net asset value, or “NAV”, is the price per share at which a Fund issues and redeems shares. It is calculated in accordance with the standard formula for valuing mutual fund shares. The “Market Price” of a Fund generally is determined using the midpoint between the highest bid and the lowest offer on the stock exchange on which the Shares of the Fund are listed for trading, as of the time that the Fund’s NAV is calculated. A Fund’s Market Price may be at, above or below its NAV. The NAV of a Fund will fluctuate with changes in the market value of the Fund’s holdings. The Market Price of a Fund generally fluctuates in response to changes in its NAV, as well as market supply and demand.
Premiums or discounts are the differences (expressed as a percentage) between the NAV and Market Price of a Fund on a given day, generally at the time NAV is calculated. A premium is the amount that a Fund is trading above the reported NAV, expressed as a percentage of a NAV. A discount is the amount that the Fund is trading below the reported NAV, expressed as a percentage of the NAV.
| | | Market Price One Year Total Return | | | Market Price Cumulative Inception Date Total Return | | | Market Price, End of Period | |
Cambria Shareholder Yield ETF | | | 13.80 | % | | | - | % | | $ | 38.03 | |
Cambria Foreign Shareholder Yield ETF | | | 18.84 | | | | - | | | | 26.63 | |
Cambria Global Value ETF | | | 16.56 | | | | - | | | | 26.03 | |
Cambria Global Momentum ETF | | | 13.23 | | | | - | | | | 27.41 | |
Cambria Global Asset Allocation ETF | | | 9.26 | | | | - | | | | 27.42 | |
Cambria Value and Momentum ETF | | | 6.13 | | | | - | | | | 25.10 | |
Cambria Sovereign Bond ETF | | | 7.12 | | | | - | | | | 27.81 | |
Cambria Emerging Shareholder Yield ETF | | | 23.99 | | | | - | | | | 35.91 | |
Cambria Tail Risk ETF | | | (12.01 | ) | | | - | | | | 21.60 | |
Cambria Core Equity ETF | | | - | | | | (0.15 | ) | | | 24.66 | |
Cambria Investment Management
Supplemental Information
(Unaudited)
Cambria Shareholder Yield ETF |
Premium/ Discount Analysis |
Inception Date 5/13/13 |
Analysis Period 5/13/13-4/30/18 |
| Percent Above | Number of Days | Percent of Days |
| or Below Par | at Discount/Premium | at Discount/Premium |
| | -5.00% | 1 | 0.08% |
| | -4.50% | - | - |
| | -4.00% | - | - |
| | -3.50% | - | - |
Fund Sold at Discount | -3.00% | - | - |
| | -2.50% | 1 | 0.08% |
| | -2.00% | - | - |
| | -1.50% | - | - |
| | -1.00% | - | - |
| | -0.50% | 837 | 66.85% |
Sold at Par | 0.00% | - | - |
| | 0.50% | 413 | 32.99% |
| | 1.00% | - | - |
| | 1.50% | - | - |
| | 2.00% | - | - |
Fund Sold at Premium | 2.50% | - | - |
| | 3.00% | - | - |
| | 3.50% | - | - |
| | 4.00% | - | - |
| | 4.50% | - | - |
| | 5.00% | - | - |
Cambria Foreign Shareholder Yield ETF |
Premium/ Discount Analysis |
Inception Date 12/2/13 |
Analysis Period 12/2/13-4/30/18 |
| Percent Above | Number of Days | Percent of Days |
| or Below Par | at Discount/Premium | at Discount/Premium |
| | -5.00% | - | - |
| | -4.50% | - | - |
| | -4.00% | - | - |
| | -3.50% | - | - |
Fund Sold at Discount | -3.00% | 3 | 0.33% |
| | -2.50% | 2 | 0.33% |
| | -2.00% | 7 | 1.47% |
| | -1.50% | 33 | 4.56% |
| | -1.00% | 129 | 13.52% |
| | -0.50% | 354 | 29.80% |
Sold at Par | 0.00% | - | - |
| | 0.50% | 394 | 35.46% |
| | 1.00% | 166 | 14.94% |
| | 1.50% | 22 | 1.98% |
| | 2.00% | 1 | 0.09% |
Fund Sold at Premium | 2.50% | - | - |
| | 3.00% | - | - |
| | 3.50% | - | - |
| | 4.00% | - | - |
| | 4.50% | - | - |
| | 5.00% | - | - |
Cambria Investment Management
Supplemental Information
(Unaudited)
Cambria Global Value ETF |
Premium/ Discount Analysis |
Inception Date 3/11/14 |
Analysis Period 3/11/14-4/30/18 |
| Percent Above | Number of Days | Percent of Days |
| or Below Par | at Discount/Premium | at Discount/Premium |
| | -5.00% | - | - |
| | -4.50% | - | - |
| | -4.00% | 1 | 0.10% |
| | -3.50% | - | - |
Fund Sold at Discount | -3.00% | - | - |
| | -2.50% | 1 | 0.10% |
| | -2.00% | 3 | 0.29% |
| | -1.50% | 16 | 1.53% |
| | -1.00% | 64 | 6.13% |
| | -0.50% | 258 | 24.71% |
Sold at Par | 0.00% | - | - |
| | 0.50% | 454 | 43.49% |
| | 1.00% | 219 | 20.98% |
| | 1.50% | 21 | 2.01% |
| | 2.00% | 7 | 0.67% |
Fund Sold at Premium | 2.50% | - | - |
| | 3.00% | - | - |
| | 3.50% | - | - |
| | 4.00% | - | - |
| | 4.50% | - | - |
| | 5.00% | - | - |
Cambria Global Momentum |
Premium/ Discount Analysis |
Inception Date 11/3/14 |
Analysis Period 11/3/14-4/30/18 |
| Percent Above | Number of Days | Percent of Days |
| or Below Par | at Discount/Premium | at Discount/Premium |
| | -5.00% | - | - |
| | -4.50% | - | - |
| | -4.00% | - | - |
| | -3.50% | - | - |
Fund Sold at Discount | -3.00% | - | - |
| | -2.50% | - | - |
| | -2.00% | - | - |
| | -1.50% | - | - |
| | -1.00% | - | - |
| | -0.50% | 400 | 45.51% |
Sold at Par | 0.00% | - | - |
| | 0.50% | 472 | 53.70% |
| | 1.00% | 7 | 0.80% |
| | 1.50% | - | - |
| | 2.00% | - | - |
Fund Sold at Premium | 2.50% | - | - |
| | 3.00% | - | - |
| | 3.50% | - | - |
| | 4.00% | - | - |
| | 4.50% | - | - |
| | 5.00% | - | - |
| | | | |
Cambria Investment Management
Supplemental Information
(Unaudited)
Cambria Global Asset Allocation ETF |
Premium/ Discount Analysis |
Inception Date 12/9/14 |
Analysis Period 12/9/14-4/30/18 |
| Percent Above | Number of Days | Percent of Days |
| or Below Par | at Discount/Premium | at Discount/Premium |
| | -5.00% | - | - |
| | -4.50% | - | - |
| | -4.00% | - | - |
| | -3.50% | - | - |
Fund Sold at Discount | -3.00% | - | - |
| | -2.50% | - | - |
| | -2.00% | - | - |
| | -1.50% | - | - |
| | -1.00% | - | - |
| | -0.50% | 373 | 43.68% |
Sold at Par | 0.00% | - | - |
| | 0.50% | 476 | 55.74% |
| | 1.00% | 5 | 0.59% |
| | 1.50% | - | - |
| | 2.00% | - | - |
Fund Sold at Premium | 2.50% | - | - |
| | 3.00% | - | - |
| | 3.50% | - | - |
| | 4.00% | - | - |
| | 4.50% | - | - |
| | 5.00% | - | - |
Cambria Value and Momentum ETF |
Premium/ Discount Analysis |
Inception Date 9/8/15 |
Analysis Period 9/8/15-4/30/18 |
| Percent Above | Number of Days | Percent of Days |
| or Below Par | at Discount/Premium | at Discount/Premium |
| | -5.00% | - | - |
| | -4.50% | - | - |
| | -4.00% | - | - |
| | -3.50% | - | - |
Fund Sold at Discount | -3.00% | - | - |
| | -2.50% | - | - |
| | -2.00% | - | - |
| | -1.50% | - | - |
| | -1.00% | 4 | 0.60% |
| | -0.50% | 271 | 40.69% |
Sold at Par | 0.00% | - | - |
| | 0.50% | 355 | 53.30% |
| | 1.00% | 35 | 5.26% |
| | 1.50% | 1 | 0.15% |
| | 2.00% | - | - |
Fund Sold at Premium | 2.50% | - | - |
| | 3.00% | - | - |
| | 3.50% | - | - |
| | 4.00% | - | - |
| | 4.50% | - | - |
| | 5.00% | - | - |
Cambria Investment Management
Supplemental Information
(Unaudited)
Cambria Sovereign Bond ETF |
Premium/ Discount Analysis |
Inception Date 2/22/16 |
Analysis Period 2/22/16-4/30/18 |
| Percent Above | Number of Days | Percent of Days |
| or Below Par | at Discount/Premium | at Discount/Premium |
| | -5.00% | - | - |
| | -4.50% | - | - |
| | -4.00% | - | - |
| | -3.50% | - | - |
Fund Sold at Discount | -3.00% | - | - |
| | -2.50% | - | - |
| | -2.00% | - | - |
| | -1.50% | - | - |
| | -1.00% | - | - |
| | -0.50% | 6 | 1.09% |
Sold at Par | 0.00% | - | - |
| | 0.50% | 18 | 3.26% |
| | 1.00% | 180 | 32.61% |
| | 1.50% | 195 | 35.33% |
| | 2.00% | 53 | 9.60% |
Fund Sold at Premium | 2.50% | 50 | 9.06% |
| | 3.00% | 33 | 5.98% |
| | 3.50% | 14 | 2.54% |
| | 4.00% | 2 | 0.36% |
| | 4.50% | 1 | 0.18% |
| | 5.00% | - | - |
Cambria Emerging Shareholder Yield ETF |
Premium/ Discount Analysis |
Inception Date 7/13/16 |
Analysis Period 7/13/2016-4/30/18 |
| Percent Above | Number of Days | Percent of Days |
| or Below Par | at Discount/Premium | at Discount/Premium |
| | -5.00% | - | - |
| | -4.50% | - | - |
| | -4.00% | - | - |
| | -3.50% | - | - |
Fund Sold at Discount | -3.00% | - | - |
| | -2.50% | - | - |
| | -2.00% | 1 | 0.22% |
| | -1.50% | - | - |
| | -1.00% | 10 | 2.21% |
| | -0.50% | 27 | 5.96% |
Sold at Par | 0.00% | - | - |
| | 0.50% | 72 | 15.89% |
| | 1.00% | 127 | 28.04% |
| | 1.50% | 115 | 25.39% |
| | 2.00% | 76 | 16.78% |
Fund Sold at Premium | 2.50% | 17 | 3.75% |
| | 3.00% | 5 | 1.10% |
| | 3.50% | 3 | 0.66% |
| | 4.00% | - | - |
| | 4.50% | - | - |
| | 5.00% | - | - |
Cambria Investment Management
Supplemental Information
(Unaudited)
Cambria Tail Risk ETF |
Premium/ Discount Analysis |
Inception Date 4/5/2017 |
Analysis Period 4/5/17-4/30/18 |
| Percent Above | Number of Days | Percent of Days |
| or Below Par | at Discount/Premium | at Discount/Premium |
| | -5.00% | - | - |
| | -4.50% | - | - |
| | -4.00% | - | - |
| | -3.50% | - | - |
Fund Sold at Discount | -3.00% | 1 | 0.37% |
| | -2.50% | - | - |
| | -2.00% | - | - |
| | -1.50% | - | - |
| | -1.00% | 1 | 0.37% |
| | -0.50% | 51 | 18.96% |
Sold at Par | 0.00% | - | - |
| | 0.50% | 197 | 73.23% |
| | 1.00% | 18 | 6.69% |
| | 1.50% | - | - |
| | 2.00% | - | - |
Fund Sold at Premium | 2.50% | - | - |
| | 3.00% | - | - |
| | 3.50% | - | - |
| | 4.00% | 1 | 0.37% |
| | 4.50% | - | - |
| | 5.00% | - | - |
Cambria Core Equity ETF |
Premium/ Discount Analysis |
Inception Date 5/23/17 |
Analysis Period 5/23/17-4/30/18 |
| Percent Above | Number of Days | Percent of Days |
| or Below Par | at Discount/Premium | at Discount/Premium |
| | -5.00% | - | - |
| | -4.50% | - | - |
| | -4.00% | - | - |
| | -3.50% | - | - |
Fund Sold at Discount | -3.00% | - | - |
| | -2.50% | - | - |
| | -2.00% | - | - |
| | -1.50% | - | - |
| | -1.00% | 1 | 0.42% |
| | -0.50% | 111 | 47.03% |
Sold at Par | 0.00% | - | - |
| | 0.50% | 123 | 52.12% |
| | 1.00% | 1 | 0.42% |
| | 1.50% | - | - |
| | 2.00% | - | - |
Fund Sold at Premium | 2.50% | - | - |
| | 3.00% | - | - |
| | 3.50% | - | - |
| | 4.00% | - | - |
| | 4.50% | - | - |
| | 5.00% | - | - |
Cambria Investment Management
Shareholder Voting Results
(Unaudited)
A special meeting of Shareholders of each series (each, a “Fund” and, collectively, the “Funds”) of the Cambria ETF Trust (the “Trust”) was held on June 22, 2018 for the purpose of electing Mebane Faber as Trustee to the Trust. The proposal was approved with the following voting results:
| | | Shares Voted | | | % of Outstanding Shares | | | % Voted | |
For: | | | 19,412,530 | | | | 72.435 | | | | 99.251 | |
Against/Withhold: | | | 146,552 | | | | 0.547 | | | | 0.749 | |
Abstain: | | | - | | | | 0.000 | | | | 0.000 | |
BNV: | | | - | | | | 0.000 | | | | 0.000 | |
Total Voted: | | | 19,559,082 | | | | 72.982 | | | | 100.000 | |
A special meeting of Shareholders of each series (each, a “Fund” and, collectively, the “Funds”) of the Cambria ETF Trust (the “Trust”) was held on June 22, 2018 for the purpose of approving a new investment advisory agreement. The results of the votes are as follows:
Cambria Shareholder Yield ETF
| | | Shares Voted | | | % of Outstanding Shares | | | % Voted | |
For: | | | 1,111,731 | | | | 31.764 | | | | 45.262 | |
Against/Withhold: | | | 9,224 | | | | 0.264 | | | | 0.376 | |
Abstain: | | | 12,070 | | | | 0.345 | | | | 0.491 | |
BNV: | | | 1,323,200 | | | | 37.806 | | | | 53.871 | |
Total Voted: | | | 2,456,225 | | | | 70.179 | | | | 100.000 | |
Cambria Foreign Shareholder Yield ETF
| | | Shares Voted | | | % of Outstanding Shares | | | % Voted | |
For: | | | 1,016,680 | | | | 58.096 | | | | 69.101 | |
Against/Withhold: | | | 495 | | | | 0.028 | | | | 0.034 | |
Abstain: | | | 2,604 | | | | 0.149 | | | | 0.177 | |
BNV: | | | 451,515 | | | | 25.801 | | | | 30.688 | |
Total Voted: | | | 1,471,294 | | | | 84.074 | | | | 100.000 | |
Cambria Global Value ETF
| | | Shares Voted | | | % of Outstanding Shares | | | % Voted | |
For: | | | 2,698,146 | | | | 35.737 | | | | 55.050 | |
Against/Withhold: | | | 9,928 | | | | 0.131 | | | | 0.203 | |
Abstain: | | | 25,089 | | | | 0.332 | | | | 0.512 | |
BNV: | | | 2,168,056 | | | | 28.716 | | | | 44.235 | |
Total Voted: | | | 4,901,219 | | | | 64.916 | | | | 100.000 | |
Cambria Investment Management
Shareholder Voting Results
(Unaudited)
Cambria Global Momentum ETF
| | | Shares Voted | | | % of Outstanding Shares | | | % Voted | |
For: | | | 1,814,034 | | | | 44.791 | | | | 55.799 | |
Against/Withhold: | | | 1,850 | | | | 0.046 | | | | 0.057 | |
Abstain: | | | 7,450 | | | | 0.184 | | | | 0.229 | |
BNV: | | | 1,427,712 | | | | 35.252 | | | | 43.915 | |
Total Voted: | | | 3,251,046 | | | | 80.273 | | | | 100.000 | |
Cambria Global Asset Allocation ETF
| | | Shares Voted | | | % of Outstanding Shares | | | % Voted | |
For: | | | 549,761 | | | | 21.559 | | | | 30.040 | |
Against/Withhold: | | | 1,738 | | | | 0.068 | | | | 0.095 | |
Abstain: | | | 14,101 | | | | 0.553 | | | | 0.771 | |
BNV: | | | 1,264,465 | | | | 49.587 | | | | 69.094 | |
Total Voted: | | | 1,830,065 | | | | 71.767 | | | | 100.000 | |
Cambria Value and Momentum ETF
| | | Shares Voted | | | % of Outstanding Shares | | | % Voted | |
For: | | | 443,412 | | | | 35.473 | | | | 48.076 | |
Against/Withhold: | | | 750 | | | | 0.060 | | | | 0.081 | |
Abstain: | | | 3,610 | | | | 0.289 | | | | 0.391 | |
BNV: | | | 474,553 | | | | 37.964 | | | | 51.452 | |
Total Voted: | | | 922,325 | | | | 73.786 | | | | 100.000 | |
Cambria Sovereign Bond ETF
| | | Shares Voted | | | % of Outstanding Shares | | | % Voted | |
For: | | | 406,853 | | | | 58.122 | | | | 79.021 | |
Against/Withhold: | | | - | | | | 0.000 | | | | 0 | |
Abstain: | | | 219 | | | | 0.031 | | | | 0.043 | |
BNV: | | | 107,789 | | | | 15.399 | | | | 20.936 | |
Total Voted: | | | 514,861 | | | | 73.552 | | | | 100.000 | |
Cambria Emerging Shareholder Yield ETF
| | | Shares Voted | | | % of Outstanding Shares | | | % Voted | |
For: | | | 622,312 | | | | 69.145 | | | | 83.268 | |
Against/Withhold: | | | 789 | | | | 0.088 | | | | 0.106 | |
Abstain: | | | 45 | | | | 0.005 | | | | 0.006 | |
BNV: | | | 124,212 | | | | 13.801 | | | | 16.620 | |
Total Voted: | | | 747,358 | | | | 83.039 | | | | 100.000 | |
Cambria Investment Management
Shareholder Voting Results
(Unaudited)
Cambria Tail Risk ETF
| | | Shares Voted | | | % of Outstanding Shares | | | % Voted | |
For: | | | 213,618 | | | | 20.345 | | | | 34.163 | |
Against/Withhold: | | | - | | | | 0.000 | | | | 0 | |
Abstain: | | | 947 | | | | 0.090 | | | | 0.151 | |
BNV: | | | 410,734 | | | | 39.117 | | | | 65.686 | |
Total Voted: | | | 625,299 | | | | 59.552 | | | | 100.000 | |
Cambria Core Equity ETF
| | | Shares Voted | | | % of Outstanding Shares | | | % Voted | |
For: | | | 2,589,125 | | | | 73.974 | | | | 91.186 | |
Against/Withhold: | | | 1,208 | | | | 0.035 | | | | 0.043 | |
Abstain: | | | 3,610 | | | | 0.103 | | | | 0.127 | |
BNV: | | | 245,447 | | | | 7.013 | | | | 8.644 | |
Total Voted: | | | 2,839,390 | | | | 81.125 | | | | 100.000 | |
THIS PAGE INTENTIONALLY LEFT BLANK

Investment Adviser:
Cambria Investment Management, L.P.
2321 Rosecrans Avenue
Suite 3225
El Segundo, CA 90245
Distributor:
SEI Investments Distribution Co.
One Freedom Valley Drive
Oaks, PA 19456
Legal Counsel:
Morgan, Lewis & Bockius LLP
1111 Pennsylvania Avenue
Washington, District of Columbia 20004-2541
Independent Registered Public Accounting Firm:
Cohen & Company, Ltd.
1350 Euclid Avenue, Suite 800
Cleveland, Ohio 44115
This information must be preceded or accompanied by a current prospectus.
CIM-AR-001-0500
Item 2. Code of Ethics.
The Registrant has adopted a code of ethics that applies to the Registrant's principal executive officer, principal financial officer, comptroller or principal accounting officer or any person who performs a similar function.
Item 3. Audit Committee Financial Expert.
(a) (1) The Registrant’s Board of Trustees has determined that the Registrant has an audit committee financial expert serving on the audit committee.
(a) (2) The audit committee financial expert Dennis G. Schmal is an independent trustee as defined in Form N-CSR Item 3 (a) (2)
Item 4. Principal Accountant Fees and Services.
Fees billed by Cohen & Company, Ltd. (Cohen) related to the Registrant.
Cohen billed the Registrant aggregate fees for services rendered to the Registrant for the fiscal year 2018 and 2017, respectively, as follows:
| | Fiscal 2018 | Fiscal 2017 |
| | | All fees and services to the Registrant that were pre- approved | All fees and services to service affiliates that were pre- approved | All other fees and services to service affiliates that did not require pre-approval | All fees and services to the Registrant that were pre- approved | All fees and services to service affiliates that were pre- approved | All other fees and services to service affiliates that did not require pre-approval |
(a) | Audit Fees | $126,000 | N/A | N/A | $115,500 | N/A | N/A |
(b) | Audit-Related Fees | $— | $— | $— | $— | $— | $— |
(c) | Tax Fees | $— | $— | $— | $— | $— | $— |
(d) | All Other Fees | $— | $— | $— | $— | $— | $— |
(e)(1) The Trust’s Audit Committee has adopted, and the Board of Trustees has ratified, an Audit and Non-Audit Services Pre-Approval Policy (the “Policy”), which sets forth the procedures and the conditions pursuant to which services proposed to be performed by the independent auditor of the Trust may be pre-approved .
(e)(2) Percentage of fees billed applicable to non-audit services pursuant to waiver of pre-approval requirement were as follows (Cohen):
| | Fiscal 2018 | Fiscal 2017 |
Audit-Related Fees | —% | —% |
Tax Fees | —% | —% |
All Other Fees | —% | —% |
(f) Not Applicable.
(g) The aggregate non-audit fees and services billed by Cohen for the fiscal year 2018 were $0.
(h) During the past fiscal year, Registrant's principal accountant provided certain non-audit services to Registrant's investment adviser or to entities controlling, controlled by, or under common control with Registrant's investment adviser that provide ongoing services to Registrant that were not subject to pre-approval pursuant to paragraph (c)(7)(ii) of Rule 2-01 of Regulation S-X. The Audit Committee of Registrant's Board of Trustees reviewed and considered these non-audit services provided by Registrant's principal accountant to Registrant's affiliates, including whether the provision of these non-audit services is compatible with maintaining the principal accountant's independence.
Item 5. Audit Committee of Listed Registrants.
Not applicable to open-end management investment companies.
Item 6. Schedule of Investments.
Schedule of Investments is included as part of the Report to Shareholders filed under Item 1 of this form.
Item 7. Disclosure of Proxy Voting Policies and Procedures for Closed-End Management Investment Companies.
Not applicable to open-end management investment companies.
Item 8. Portfolio Managers of Closed-End Management Investment Companies.
Not applicable. Effective for closed-end management investment companies for fiscal years ending on or after December 31, 2005.
Item 9. Purchases of Equity Securities by Closed-End Management Company and Affiliated Purchasers.
Not applicable to open-end management investment companies.
Item 10. Submission of Matters to a Vote of Security Holders.
There have been no changes to the procedures by which shareholders may recommend nominees to the Registrant’s Board of Trustees during the period covered by this report.
Item 11. Controls and Procedures.
(a) The Registrant’s principal executive and principal financial officers, or persons performing similar functions, have concluded that the Registrant’s disclosure controls and procedures (as defined in Rule 30a-3(c) under the Act (17 CFR 270.30a-3(c))) as of a date within 90 days of the filing date of the report, are effective based on the evaluation of these controls and procedures required by Rule 30a-3(b) under the Act (17 CFR 270.30a-3(b)) and Rules 13a-15(b) or 15d-15(b) under the Exchange Act (17 CFR 240.13a-15(b) or 240.15d-15(b)).
(b) There has been no change in the Registrant’s internal control over financial reporting (as defined in Rule 30a-3(d) under the Act (17 CFR 270.30a-3(d)) that occurred during the second fiscal quarter of the period covered by this report that has materially affected, or is reasonably likely to materially affect, the Registrant’s internal control over financial reporting.
Items 12. Disclosure of Securities Lending Activities for Closed-End Management Investment Companies.
Not applicable.
Item 13. Exhibits.
(a)(1) Code of Ethics attached hereto.
(a)(2) Certifications pursuant to Rule 30a-2(a) under the Investment Company Act of 1940 are filed hereto.
(b) Officer certifications as required by Rule 30a-2(b) under the Investment Company Act of 1940, as amended (17 CFR 270.30a-2(b)) also accompany this filing as exhibits.
SIGNATURES
Pursuant to the requirements of the Securities Exchange Act of 1934 and the Investment Company Act of 1940, the registrant has duly caused this report to be signed on its behalf by the undersigned, thereunto duly authorized.
| | Cambria ETF Trust | |
| | | |
| | | |
| By (Signature and Title) | /s/ Mebane Faber | |
| | Mebane Faber, President | |
Date: July 9, 2018
Pursuant to the requirements of the Securities Exchange Act of 1934 and the Investment Company Act of 1940, this report has been signed below by the following persons on behalf of the registrant and in the capacities and on the dates indicated.
| By | /s/ Mebane Faber | |
| | Mebane Faber, President | |
| | | |
| Date: July 9, 2018 | | |
| | | |
| | | |
| By | /s/ Eric Kleinschmidt | |
| | Eric Kleinschmidt, Principal Financial Officer | |
| | | |
| Date: July 9, 2018 | | |