UNITED STATES
SECURITIES AND EXCHANGE COMMISSION
Washington, D.C. 20549
________
FORM N-CSRS
________
CERTIFIED SHAREHOLDER REPORT OF REGISTERED MANAGEMENT
INVESTMENT COMPANIES
Investment Company Act File Number 811-22704
CAMBRIA ETF TRUST
(Exact name of registrant as specified in charter)
________
2321 Rosecrans Avenue
Suite 3225
El Segundo, CA 90245
(Address of principal executive offices) (Zip code)
Corporation Service Company
2711 Centerville Road
Suite 400
Wilmington, DE 19808
(Name and address of agent for service)
With a Copy to:
John McGuire
Morgan Lewis & Bockius LLP
1111 Pennsylvania Avenue, NW
Washington, DC 20004-2541
Registrant’s telephone number, including area code: 1-310-683-5500
Date of fiscal year end: April 30, 2019
Date of reporting period: October 31, 2018
Item 1. Reports to Stockholders.
A copy of the report transmitted to stockholders pursuant to Rule 30e-1 under the Investment Company Act, as amended ( [17 CFR § 270.30e-1], are attached hereto.
Cambria Shareholder Yield ETF (SYLD)
Cambria Foreign Shareholder Yield ETF (FYLD)
Cambria Global Value ETF (GVAL)
Cambria Global Momentum ETF (GMOM)
Cambria Global Asset Allocation ETF (GAA)
Cambria Value and Momentum ETF (VAMO)
Cambria Sovereign Bond ETF (SOVB)
Cambria Emerging Shareholder Yield ETF (EYLD)
Cambria Tail Risk ETF (TAIL)
Cambria Core Equity ETF (CCOR)
Cambria Trinity ETF (TRTY)
Semi-Annual Report
October 31, 2018
Beginning on January 1, 2021, as permitted by regulations adopted by the Securities and Exchange Commission, paper copies of the Funds' shareholder reports like this one will no longer be sent by mail, unless you specifically request paper copies of the reports from your financial intermediary (such as a broker-dealer or bank). Instead, the reports will be available on the Funds' website (www.cambriafunds.com), and you will be notified by mail each time a report is posted and provided with a website link to access the report.
If you already elected to receive shareholder reports electronically, you will not be affected by this change and you need not take any action. You may elect to receive shareholder reports and other communications from a Fund electronically anytime by contacting your financial intermediary.
You may elect to receive all future reports in paper free of charge. Please contact your financial intermediary to request to continue receiving paper copies of your shareholder reports. Your election to receive reports in paper will apply to all funds held in your account.
Cambria Investment Management
Table of Contents
| Schedules of Investments | |
| Cambria Shareholder Yield ETF | 1 |
| Cambria Foreign Shareholder Yield ETF | 5 |
| Cambria Global Value ETF | 9 |
| Cambria Global Momentum ETF | 15 |
| Cambria Global Asset Allocation ETF | 17 |
Cambria Value and Momentum ETF | 19 |
| Cambria Sovereign Bond ETF | 23 |
| Cambria Emerging Shareholder Yield ETF | 27 |
| Cambria Tail Risk ETF | 31 |
| Cambria Core Equity ETF | 33 |
| Cambria Trinity ETF | 37 |
| Statements of Assets and Liabilities | 39 |
| Statements of Operations | 42 |
| Statements of Changes in Net Assets | 44 |
| Financial Highlights | 50 |
| Notes to Financial Statements | 53 |
| Disclosure of Fund Expenses | 68 |
| Approval of Advisory Agreements & Board Considerations | 70 |
| Supplemental Information | 72 |
| Shareholder Voting Results | 79 |
The Funds file their complete schedules of Fund holdings with the Securities and Exchange Commission (the “Commission”) for the first and third quarters of each fiscal year on Form N-Q within sixty days after the end of the period. The Funds’ Forms N-Q are available on the Commission’s website at http://www.sec.gov, and may be reviewed and copied at the Commission's Public Reference Room in Washington, DC. Information on the operation of the Public Reference Room may be obtained by calling 1-800-SEC-0330.
A description of the policies and procedures that Cambria Investment Management L.P., the Funds’ investment advisor, uses to determine how to vote proxies relating to Fund securities, as well as information relating to how the Funds voted proxies relating to Fund securities during the most recent 12-month period ended June 30, is available (i) without charge, upon request, by calling (855)-383-4636; and (ii) on the Commission’s website at www.sec.gov.
Cambria Investment Management
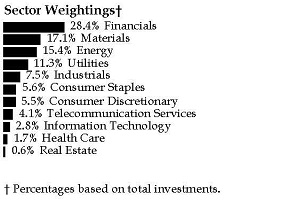
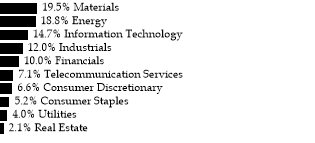
Schedule of Investments ● Cambria Shareholder Yield ETF
October 31, 2018 (Unaudited)
Sector Weightings† | |
| |
† Percentages based on total investments. | |
| |
Description | | Shares | | | Value | |
| | | | | | | | | |
COMMON STOCK — 99.5% | | | | | |
| | | | | | |
Consumer Discretionary — 30.4% | | | | | |
Abercrombie & Fitch, Cl A | | | 35,923 | | | $ | 707,683 | |
Best Buy | | | 22,633 | | | | 1,587,931 | |
BJ's Restaurants | | | 34,555 | | | | 2,114,075 | |
Buckle | | | 72,478 | | | | 1,478,551 | |
CBS, Cl B | | | 18,078 | | | | 1,036,773 | |
Cooper Tire & Rubber | | | 29,814 | | | | 920,955 | |
Deckers Outdoor* | | | 8,085 | | | | 1,028,170 | |
Dillard's, Cl A | | | 8,900 | | | | 626,738 | |
Dollar General | | | 9,108 | | | | 1,014,449 | |
DSW, Cl A | | | 36,608 | | | | 971,942 | |
Express* | | | 88,044 | | | | 775,668 | |
Foot Locker | | | 17,858 | | | | 841,826 | |
Gannett | | | 158,769 | | | | 1,540,059 | |
Gap | | | 38,364 | | | | 1,047,337 | |
Gentex | | | 64,469 | | | | 1,357,073 | |
Group 1 Automotive | | | 13,536 | | | | 781,569 | |
Guess? | | | 59,207 | | | | 1,257,557 | |
Hibbett Sports* | | | 66,143 | | | | 1,155,518 | |
Home Depot | | | 12,530 | | | | 2,203,776 | |
Interpublic Group of | | | 64,566 | | | | 1,495,349 | |
Kohl's | | | 21,145 | | | | 1,601,311 | |
La-Z-Boy, Cl Z | | | 54,113 | | | | 1,504,341 | |
Lear | | | 7,026 | | | | 933,755 | |
Lowe's | | | 21,390 | | | | 2,036,756 | |
Michael Kors Holdings* | | | 13,527 | | | | 749,531 | |
O'Reilly Automotive* | | | 7,024 | | | | 2,252,948 | |
Shoe Carnival | | | 25,806 | | | | 1,051,078 | |
Six Flags Entertainment | | | 25,470 | | | | 1,371,814 | |
Target | | | 12,321 | | | | 1,030,405 | |
Urban Outfitters* | | | 24,775 | | | | 977,622 | |
Visteon* | | | 7,421 | | | | 586,556 | |
| | | | | | | | 38,039,116 | |
The accompanying notes are an integral part of the financial statements.
Cambria Investment Management
Schedule of Investments ● Cambria Shareholder Yield ETF
October 31, 2018 (Unaudited)
| Description | | Shares | | | Value | |
| | | | | | | | | |
| Consumer Staples — 2.0% | | | | | | | | |
| Universal | | | 14,418 | | | $ | 978,405 | |
| Walmart | | | 15,831 | | | | 1,587,533 | |
| | | | | | | | 2,565,938 | |
| | | | | | | | | |
| Energy — 6.9% | | | | | | | | |
Arch Coal | | | 15,588 | | | | 1,494,889 | |
CNX Resources* | | | 55,175 | | | | 863,489 | |
ConocoPhillips | | | 12,696 | | | | 887,451 | |
CVR Energy | | | 31,484 | | | | 1,353,812 | |
Marathon Petroleum | | | 21,968 | | | | 1,547,646 | |
Renewable Energy Group* | | | 35,742 | | | | 1,110,861 | |
Valero Energy | | | 15,191 | | | | 1,383,748 | |
| | | | | | | | 8,641,896 | |
| | | | | | | | | |
| Financials — 26.3% | | | | | | | | |
Aflac | | | 32,870 | | | | 1,415,711 | |
Allstate | | | 19,655 | | | | 1,881,377 | |
American Express | | | 12,547 | | | | 1,288,953 | |
American International Group | | | 18,769 | | | | 774,972 | |
Ameriprise Financial | | | 10,357 | | | | 1,317,825 | |
Assured Guaranty | | | 41,339 | | | | 1,652,733 | |
CIT Group | | | 23,030 | | | | 1,091,161 | |
Citizens Financial Group | | | 37,560 | | | | 1,402,866 | |
CNO Financial Group | | | 58,272 | | | | 1,101,341 | |
Discover Financial Services | | | 22,111 | | | | 1,540,473 | |
Fifth Third Bancorp | | | 49,266 | | | | 1,329,689 | |
Hartford Financial Services Group | | | 22,593 | | | | 1,026,174 | |
JPMorgan Chase | | | 10,757 | | | | 1,172,728 | |
Lincoln National | | | 16,943 | | | | 1,019,799 | |
MetLife | | | 16,146 | | | | 665,054 | |
New York Community Bancorp | | | 124,358 | | | | 1,191,350 | |
Old Republic International | | | 68,800 | | | | 1,517,040 | |
PNC Financial Services Group | | | 8,209 | | | | 1,054,775 | |
SunTrust Banks | | | 28,673 | | | | 1,796,650 | |
Synchrony Financial | | | 48,418 | | | | 1,398,312 | |
Synovus Financial | | | 22,531 | | | | 846,264 | |
Travelers | | | 12,840 | | | | 1,606,669 | |
Unum Group | | | 30,843 | | | | 1,118,367 | |
US Bancorp | | | 16,688 | | | | 872,282 | |
Voya Financial | | | 28,894 | | | | 1,264,402 | |
Waddell & Reed Financial, Cl A | | | 81,159 | | | | 1,547,702 | |
| | | | | | | | 32,894,669 | |
| Health Care — 3.1% | | | | | | | | |
Aetna | | | 6,019 | | | | 1,194,170 | |
The accompanying notes are an integral part of the financial statements.
Cambria Investment Management
Schedule of Investments ● Cambria Shareholder Yield ETF
October 31, 2018 (Unaudited)
| Description | | Shares | | | Value | |
| | | | | | | | | |
| Mallinckrodt PLC* | | | 33,327 | | | $ | 835,175 | |
| McKesson | | | 6,607 | | | | 824,289 | |
| Mylan* | | | 33,162 | | | | 1,036,312 | |
| | | | | | | | 3,889,946 | |
| | | | | | | | | |
| Industrials — 15.2% | | | | | | | | |
Boeing | | | 3,636 | | | | 1,290,271 | |
Cummins | | | 10,596 | | | | 1,448,367 | |
Delta Air Lines | | | 23,832 | | | | 1,304,325 | |
Eaton | | | 23,057 | | | | 1,652,495 | |
FTI Consulting* | | | 32,965 | | | | 2,278,211 | |
GATX | | | 16,626 | | | | 1,245,786 | |
Huntington Ingalls Industries | | | 4,154 | | | | 907,566 | |
Ingersoll-Rand | | | 10,541 | | | | 1,011,304 | |
ManpowerGroup | | | 13,181 | | | | 1,005,579 | |
Robert Half International | | | 17,802 | | | | 1,077,555 | |
Southwest Airlines | | | 32,870 | | | | 1,613,917 | |
Spirit AeroSystems Holdings, Cl A | | | 14,973 | | | | 1,257,882 | |
United Continental Holdings* | | | 26,271 | | | | 2,246,433 | |
Wabash National | | | 48,626 | | | | 734,253 | |
| | | | | | | | 19,073,944 | |
| | | | | | | | | |
| Information Technology — 10.4% | | | | | | | | |
Apple | | | 12,135 | | | | 2,655,866 | |
Applied Materials | | | 25,400 | | | | 835,152 | |
Avnet | | | 37,224 | | | | 1,491,566 | |
Corning | | | 49,869 | | | | 1,593,314 | |
Hewlett Packard Enterprise | | | 84,749 | | | | 1,292,422 | |
HP | | | 41,912 | | | | 1,011,756 | |
Nanometrics* | | | 26,703 | | | | 856,098 | |
Sanmina* | | | 43,893 | | | | 1,110,493 | |
Texas Instruments | | | 23,253 | | | | 2,158,576 | |
| | | | | | | | 13,005,243 | |
| | | | | | | | | |
| Materials — 4.7% | | | | | | | | |
Eastman Chemical | | | 10,626 | | | | 832,547 | |
Kaiser Aluminum | | | 9,074 | | | | 865,387 | |
LyondellBasell Industries, Cl A | | | 8,935 | | | | 797,628 | |
Steel Dynamics | | | 27,219 | | | | 1,077,872 | |
Warrior Met Coal | | | 51,379 | | | | 1,438,612 | |
Worthington Industries | | | 20,670 | | | | 865,660 | |
| | | | | | | | 5,877,706 | |
| | | | | | | | | |
| Real Estate — 0.5% | | | | | | | | |
Realogy Holdings | | | 35,147 | | | | 670,253 | |
The accompanying notes are an integral part of the financial statements.
Cambria Investment Management
Schedule of Investments ● Cambria Shareholder Yield ETF
October 31, 2018 (Unaudited)
Description | | Shares | | | Value | |
| | | | | | | | | |
| | | | | | | | | |
Total Common Stock | | | | | | | | |
(Cost $117,446,261) | | | $ | 124,658,711 | |
| | | | | | | | | |
| Total Investments - 99.5% | | | | | | | | |
| (Cost $117,446,261) | | | $ | 124,658,711 | |
| Other Assets and Liabilities - 0.5% | | | | 648,052 | |
| Net Assets - 100.0% | | | $ | 125,306,763 | |
Percentages based on Net Assets.
* | Non-income producing security. |
Cl — Class |
PLC — Public Limited Company |
As of October 31, 2018, all of the Fund's investments in securities were considered Level 1, in accordance with the authoritative guidance on fair value measurements and disclosure under U.S. generally accepted accounting principles.
There have been no transfers between Level 1, Level 2 or Level 3 assets and liabilities. It is the Fund’s policy to recognize transfers into and out of all Levels at the end of the reporting period.
Please see Note 2 in Notes to Financial Statements for further information regarding fair value measurements.
The accompanying notes are an integral part of the financial statements.
Cambria Investment Management
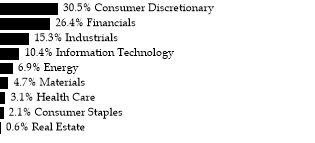
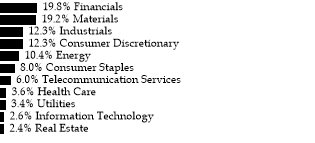
Schedule of Investments ● Cambria Foreign Shareholder Yield ETF
October 31, 2018 (Unaudited)
Sector Weightings† | |
| |
† Percentages based on total investments. | |
| |
| Description | | Shares | | | Value | |
| | | | | | | | | |
| COMMON STOCK — 97.7% | | | | | | | | |
| | | | | | | | | |
| Australia — 10.1% | | | | | | | | |
| Alumina | | | 123,819 | | | $ | 223,590 | |
| BHP Billiton | | | 11,224 | | | | 256,014 | |
| BlueScope Steel | | | 11,523 | | | | 117,259 | |
| Crown Resorts | | | 23,031 | | | | 204,031 | |
| Fortescue Metals Group | | | 54,556 | | | | 154,535 | |
| Monadelphous Group | | | 51,886 | | | | 528,733 | |
| Myer Holdings | | | 430,354 | | | | 138,664 | |
| Nine Entertainment Holdings | | | 128,720 | | | | 154,049 | |
| Qantas Airways | | | 55,461 | | | | 214,833 | |
| QBE Insurance Group | | | 34,891 | | | | 279,695 | |
| South32 | | | 78,085 | | | | 200,171 | |
| Whitehaven Coal | | | 71,047 | | | | 244,013 | |
| | | | | | | | 2,715,587 | |
| | | | | | | | | |
| Belgium — 1.3% | | | | | | | | |
| Ageas | | | 6,732 | | | | 337,099 | |
| | | | | | | | | |
| | | | | | | | | |
| Canada — 9.9% | | | | | | | | |
BRP | | | 11,500 | | | | 462,638 | |
Ensign Energy Services | | | 39,100 | | | | 152,367 | |
Genworth MI Canada | | | 8,825 | | | | 289,664 | |
Great-West Lifeco | | | 8,061 | | | | 184,985 | |
IGM Financial | | | 5,505 | | | | 135,194 | |
Labrador Iron Ore Royalty | | | 13,444 | | | | 292,072 | |
Magna International | | | 6,992 | | | | 344,222 | |
Norbord | | | 6,900 | | | | 175,953 | |
Sun Life Financial | | | 9,200 | | | | 336,915 | |
TFI International | | | 8,817 | | | | 293,420 | |
| | | | | | | | 2,667,430 | |
| | | | | | | | | |
| Denmark — 2.0% | | | | | | | | |
Novo Nordisk, Cl B | | | 4,893 | | | | 211,634 | |
Pandora | | | 2,581 | | | | 161,477 | |
The accompanying notes are an integral part of the financial statements.
Cambria Investment Management
Schedule of Investments ● Cambria Foreign Shareholder Yield ETF
October 31, 2018 (Unaudited)
Description | | Shares | | | Value | |
| | | | | | | | | |
Spar Nord Bank | | | 18,469 | | | $ | 153,093 | |
| | | | | | | | 526,204 | |
| | | | | | | | | |
| Finland — 1.2% | | | | | | | | |
Kesko, Cl B | | | 5,432 | | | | 317,593 | |
| | | | | | | | | |
| | | | | | | | | |
| France — 7.5% | | | | | | | | |
AXA | | | 8,339 | | | | 209,115 | |
BNP Paribas | | | 5,251 | | | | 274,359 | |
Casino Guichard Perrachon | | | 4,227 | | | | 186,720 | |
CNP Assurances | | | 14,838 | | | | 331,082 | |
Engie | | | 14,435 | | | | 192,518 | |
Metropole Television | | | 12,722 | | | | 246,546 | |
Natixis | | | 48,760 | | | | 285,306 | |
Neopost | | | 8,832 | | | | 284,100 | |
| | | | | | | | 2,009,746 | |
| | | | | | | | | |
| Germany — 3.0% | | | | | | | | |
Freenet | | | 9,998 | | | | 225,238 | |
Muenchener Rueckversicherungs | | | 1,663 | | | | 357,787 | |
Uniper | | | 7,369 | | | | 212,918 | |
| | | | | | | | 795,943 | |
| | | | | | | | | |
| Hong Kong — 4.6% | | | | | | | | |
Hang Lung Properties | | | 108,896 | | | | 197,186 | |
Shandong Chenming Paper Holdings, Cl H | | | 293,250 | | | | 164,538 | |
Shanghai Industrial Holdings | | | 84,516 | | | | 177,612 | |
Shimao Property Holdings | | | 184,000 | | | | 359,931 | |
Shougang Fushan Resources Group | | | 1,702,000 | | | | 342,920 | |
| | | | | | | | 1,242,187 | |
| | | | | | | | | |
| Italy — 3.0% | | | | | | | | |
Eni | | | 21,804 | | | | 387,878 | |
Saras | | | 99,345 | | | | 193,876 | |
Societa Cattolica di Assicurazioni SC | | | 29,302 | | | | 237,134 | |
| | | | | | | | 818,888 | |
| | | | | | | | | |
| Japan — 16.5% | | | | | | | | |
Astellas Pharma | | | 13,800 | | | | 213,663 | |
Denka | | | 11,500 | | | | 375,061 | |
JFE Holdings | | | 20,700 | | | | 390,940 | |
KDDI | | | 13,800 | | | | 344,220 | |
Leopalace21 | | | 16,100 | | | | 67,205 | |
Mitsubishi Gas Chemical | | | 4,600 | | | | 77,499 | |
Mitsui | | | 13,800 | | | | 230,601 | |
Mixi | | | 4,600 | | | | 100,533 | |
NGK Spark Plug | | | 13,800 | | | | 280,317 | |
NTT DOCOMO | | | 11,870 | | | | 299,235 | |
The accompanying notes are an integral part of the financial statements.
Cambria Investment Management
Schedule of Investments ● Cambria Foreign Shareholder Yield ETF
October 31, 2018 (Unaudited)
Description | | Shares | | | Value | |
| | | | | | | | | |
Showa Shell Sekiyu | | | 16,100 | | | $ | 310,485 | |
Sumitomo | | | 23,000 | | | | 349,276 | |
Sumitomo Osaka Cement | | | 9,200 | | | | 342,447 | |
Taisei | | | 6,900 | | | | 295,666 | |
Toyo Kanetsu | | | 11,500 | | | | 257,243 | |
Toyo Seikan Group Holdings | | | 13,800 | | | | 282,641 | |
Tsugami | | | 23,000 | | | | 206,895 | |
| | | | | | | | 4,423,927 | |
| | | | | | | | | |
| Netherlands — 5.0% | | | | | | | | |
Aegon | | | 57,822 | | | | 355,489 | |
ASR Nederland | | | 5,259 | | | | 239,216 | |
BinckBank | | | 49,522 | | | | 240,069 | |
Koninklijke Ahold Delhaize | | | 16,077 | | | | 368,378 | |
Philips Lighting (A) | | | 5,993 | | | | 147,977 | |
| | | | | | | | 1,351,129 | |
| | | | | | | | | |
| New Zealand — 0.8% | | | | | | | | |
SKY Network Television | | | 140,134 | | | | 204,836 | |
| | | | | | | | | |
| | | | | | | | | |
| Norway — 7.4% | | | | | | | | |
DNB | | | 18,959 | | | | 343,092 | |
Salmar | | | 21,182 | | | | 1,118,175 | |
Subsea 7 | | | 25,829 | | | | 326,164 | |
Telenor | | | 11,618 | | | | 213,139 | |
| | | | | | | | 2,000,570 | |
| | | | | | |
Portugal — 1.0% | | | | | |
EDP - Energias de Portugal | | | 79,207 | | | | 278,470 | |
| | | | | | | | | |
| | | | | | |
Spain — 2.7% | | | | | |
Endesa | | | 10,264 | | | | 214,838 | |
International Consolidated Airlines Group | | | 40,319 | | | | 310,967 | |
International Consolidated Airlines Group (LSE Shares) | | | 25,995 | | | | 200,802 | |
| | | | | | | | 726,607 | |
| | | | | | |
Sweden — 2.9% | | | | | |
JM | | | 10,021 | | | | 190,484 | |
Peab | | | 26,481 | | | | 233,235 | |
Svenska Cellulosa SCA, Cl B | | | 13,087 | | | | 123,875 | |
Telia | | | 53,779 | | | | 242,475 | |
| | | | | | | | 790,069 | |
| | | | | | |
Switzerland — 2.7% | | | | | |
Sunrise Communications Group (A) | | | 1,472 | | | | 129,640 | |
Swiss Re | | | 3,070 | | | | 277,265 | |
The accompanying notes are an integral part of the financial statements.
Cambria Investment Management
Schedule of Investments ● Cambria Foreign Shareholder Yield ETF
October 31, 2018 (Unaudited)
Description | | Shares | | | Value | |
| | | | | | | | | |
Zurich Insurance Group | | | 1,012 | | | $ | 314,708 | |
| | | | | | | | 721,613 | |
| | | | | | |
United Kingdom — 16.1% | | | | | |
Anglo American | | | 9,638 | | | | 206,373 | |
Centamin | | | 116,909 | | | | 148,686 | |
Direct Line Insurance Group | | | 41,961 | | | | 176,726 | |
HSBC Holdings | | | 31,206 | | | | 257,235 | |
Kingfisher | | | 51,853 | | | | 168,811 | |
Legal & General Group | | | 69,882 | | | | 224,648 | |
Man Group | | | 158,148 | | | | 314,234 | |
Pearson | | | 21,362 | | | | 245,362 | |
Persimmon | | | 11,822 | | | | 346,644 | |
Rio Tinto | | | 6,262 | | | | 304,435 | |
Royal Dutch Shell, Cl A | | | 8,096 | | | | 258,759 | |
Royal Dutch Shell, Cl B | | | 11,063 | | | | 362,710 | |
Royal Mail | | | 46,504 | | | | 213,395 | |
South32 | | | 129,697 | | | | 334,873 | |
Tate & Lyle | | | 31,993 | | | | 275,295 | |
Taylor Wimpey | | | 162,541 | | | | 335,532 | |
Vodafone Group | | | 80,710 | | | | 152,496 | |
| | | | | | | | 4,326,214 | |
| | | | | | | | | |
Total Common Stock | | | | | | | | |
(Cost $29,460,448) | | | | | | | 26,254,112 | |
| | | | | | | | | |
| | | | | | | | | |
Total Investments - 97.7% | | | | | | | | |
(Cost $29,460,448) | | | | | | $ | 26,254,112 | |
Other Assets and Liabilities - 2.3% | | | | | | | 618,147 | |
Net Assets - 100.0% | | | | | | $ | 26,872,257 | |
Percentages based on Net Assets.
(A) | Securities sold within terms of a private placement memorandum, exempt from registration under Section 144A of the Securities Act of 1933, as amended, and may be sold only to dealers in that program or other "accredited investors." These securities are deemed to be liquid by the Board of Trustees. The total value of such securities at October 31, 2018 was $277,617 and represents 1.0% of Net Assets. |
| Cl — | Class |
As of October 31, 2018, all of the Fund's investments were considered level 1 in accordance with the authoritative guidance of fair value measurements and disclosure under U.S. generally accepted accounting principles.
There have been no transfers between Level 1, Level 2 or Level 3 assets and liabilities. It is the Fund’s policy to recognize transfers into and out of all Levels at the end of the reporting period.
Please see Note 2 in Notes to Financial Statements for further information regarding fair value measurements.
The accompanying notes are an integral part of the financial statements.
Cambria Investment Management
Schedule of Investments ● Cambria Global Value ETF
October 31, 2018 (Unaudited)
Description | | Shares | | | Value | |
| | | | | | | | | |
COMMON STOCK — 94.6% | | | | | |
| | | | | | |
Austria — 1.6% | | | | | |
AMAG Austria Metall (A) | | | 57,589 | | | $ | 2,282,974 | |
| | | | | | | | | |
| | | | | | |
Brazil — 8.0% | | | | | |
AMBEV | | | 222,552 | | | | 971,179 | |
Banco do Brasil | | | 170,486 | | | | 1,953,843 | |
Banco Santander Brasil | | | 303,323 | | | | 3,441,980 | |
Cia Siderurgica Nacional | | | 391,047 | | | | 1,000,341 | |
Cosan Industria e Comercio | | | 110,438 | | | | 951,105 | |
JBS | | | 410,446 | | | | 1,128,272 | |
Vale | | | 122,322 | | | | 1,850,525 | |
| | | | | | | | 11,297,245 | |
| | | | | | |
Czech Republic — 6.1% | | | | | |
CEZ | | | 79,782 | | | | 1,898,609 | |
Fortuna Entertainment Group *(B) (C) | | | 279,736 | | | | 1,187,879 | |
Komercni Banka | | | 44,515 | | | | 1,691,063 | |
Pegas Nonwovens * | | | 52,197 | | | | 2,064,942 | |
Philip Morris CR | | | 2,921 | | | | 1,836,658 | |
| | | | | | | | 8,679,151 | |
| | | | | | |
Greece — 8.1% | | | | | |
Alpha Bank AE * | | | 28,967 | | | | 43,800 | |
Athens Water Supply & Sewage | | | 137,795 | | | | 811,578 | |
Bank of Greece | | | 74,676 | | | | 1,048,808 | |
FF Group *(B) (C) | | | 25,407 | | | | 41,439 | |
Hellenic Petroleum | | | 158,369 | | | | 1,259,217 | |
Hellenic Telecommunications Organization | | | 71,926 | | | | 802,446 | |
Holding ADMIE IPTO | | | 157,391 | | | | 287,725 | |
Intralot -Integrated Lottery Systems & Services * | | | 513,969 | | | | 345,211 | |
JUMBO | | | 61,279 | | | | 893,966 | |
Karelia Tobacco | | | 5,250 | | | | 1,510,381 | |
The accompanying notes are an integral part of the financial statements.
Cambria Investment Management
Schedule of Investments ● Cambria Global Value ETF
October 31, 2018 (Unaudited)
| Description | | Shares | | | Value | |
| Motor Oil Hellas Corinth Refineries | | | 117,348 | | | $ | 2,777,892 | |
| Mytilineos Holdings | | | 87,630 | | | | 775,171 | |
| National Bank of Greece * | | | 3,597 | | | | 6,233 | |
| OPAP | | | 71,005 | | | | 667,514 | |
| Piraeus Bank * | | | 818 | | | | 1,205 | |
| Public Power | | | 157,391 | | | | 236,383 | |
| | | | | | | | 11,508,969 | |
| | | | | | | | | |
Israel — 14.4% | | | | | | | | |
Bank Hapoalim | | | 293,343 | | | | 1,987,242 | |
Bank Leumi Le-Israel | | | 338,588 | | | | 2,113,530 | |
Bezeq The Israeli Telecommunication | | | 1,631,921 | | | | 1,876,785 | |
Elbit Systems | | | 16,657 | | | | 1,992,652 | |
Israel Chemicals | | | 459,630 | | | | 2,651,628 | |
Israel Discount Bank, Cl A | | | 710,896 | | | | 2,325,794 | |
Mizrahi Tefahot Bank | | | 107,500 | | | | 1,811,390 | |
Nice * | | | 21,039 | | | | 2,230,677 | |
Teva Pharmaceutical Industries | | | 114,064 | | | | 2,277,079 | |
Tower Semiconductor * | | | 79,658 | | | | 1,235,177 | |
| | | | | | | | 20,501,954 | |
| | | | | | | | | |
Italy — 5.1% | | | | | | | | |
Atlantia | | | 53,270 | | | | 1,071,566 | |
Enel | | | 298,831 | | | | 1,466,925 | |
Eni | | | 65,913 | | | | 1,172,547 | |
Intesa Sanpaolo | | | 419,387 | | | | 927,707 | |
Saipem * | | | 6,782 | | | | 37,140 | |
Telecom Italia * | | | 1,170,479 | | | | 688,322 | |
UniCredit | | | 20,983 | | | | 268,939 | |
Unipol Gruppo | | | 219,837 | | | | 885,932 | |
UnipolSai | | | 321,243 | | | | 702,602 | |
| | | | | | | | 7,221,680 | |
| | | | | | | | | |
Norway — 7.7% | | | | | | | | |
Aker Solutions | | | 199,462 | | | | 1,315,581 | |
DNB | | | 59,362 | | | | 1,074,245 | |
Gjensidige Forsikring | | | 45,479 | | | | 704,591 | |
Norsk Hydro | | | 183,903 | | | | 954,660 | |
Petroleum Geo-Services * | | | 266,227 | | | | 831,861 | |
Statoil | | | 44,995 | | | | 1,170,538 | |
Storebrand | | | 196,599 | | | | 1,636,265 | |
Telenor | | | 46,012 | | | | 844,119 | |
TGS Nopec Geophysical | | | 47,510 | | | | 1,594,413 | |
Yara International | | | 19,318 | | | | 831,175 | |
| | | | | | | | 10,957,448 | |
| | | | | | | | | |
Poland — 7.9% | | | | | | | | |
Alior Bank * | | | 27,329 | | | | 411,308 | |
The accompanying notes are an integral part of the financial statements.
Cambria Investment Management
Schedule of Investments ● Cambria Global Value ETF
October 31, 2018 (Unaudited)
Description | | Shares | | | Value | |
| | | | | | | | | |
Asseco Poland | | | 33,811 | | | $ | 425,595 | |
Bank Millennium * | | | 300,139 | | | | 690,676 | |
Bank Polska Kasa Opieki | | | 12,385 | | | | 337,936 | |
Bank Zachodni WBK | | | 6,260 | | | | 555,335 | |
CCC | | | 11,592 | | | | 504,506 | |
Cyfrowy Polsat | | | 86,555 | | | | 498,512 | |
Energa | | | 80,153 | | | | 162,932 | |
Eurocash | | | 64,307 | | | | 342,555 | |
Grupa Azoty | | | 24,640 | | | | 166,315 | |
Grupa Lotos | | | 73,691 | | | | 1,330,496 | |
ING Bank Slaski | | | 15,296 | | | | 649,765 | |
KGHM Polska Miedz * | | | 17,964 | | | | 406,737 | |
LPP | | | 295 | | | | 603,508 | |
Lubelski Wegiel Bogdanka | | | 23,774 | | | | 333,331 | |
mBank | | | 4,495 | | | | 438,119 | |
Orange Polska | | | 209,440 | | | | 236,887 | |
PGE Polska Grupa Energetyczna * | | | 95,771 | | | | 262,318 | |
Polski Koncern Naftowy ORLEN | | | 33,674 | | | | 809,478 | |
Polskie Gornictwo Naftowe i Gazownictwo | | | 391,716 | | | | 639,053 | |
Powszechna Kasa Oszczednosci Bank Polski | | | 64,652 | | | | 672,779 | |
Powszechny Zaklad Ubezpieczen | | | 46,647 | | | | 476,299 | |
Tauron Polska Energia | | | 452,628 | | | | 209,968 | |
| | | | | | | | 11,164,408 | |
| | | | | | | | | |
| Portugal — 9.6% | | | | | | | | |
Altri SGPS | | | 64,925 | | | | 569,911 | |
Banco BPI, Cl G * | | | 181,255 | | | | 300,966 | |
Banco Comercial Portugues, Cl R * | | | 63,439 | | | | 17,116 | |
Corticeira Amorim SGPS | | | 411,607 | | | | 4,522,180 | |
CTT-Correios de Portugal | | | 25,804 | | | | 99,079 | |
EDP - Energias de Portugal | | | 411,006 | | | | 1,444,985 | |
Galp Energia SGPS | | | 115,246 | | | | 2,009,551 | |
Jeronimo Martins SGPS | | | 37,898 | | | | 466,165 | |
Mota-Engil SGPS * | | | 74,932 | | | | 149,204 | |
Navigator | | | 61,785 | | | | 307,914 | |
NOS SGPS | | | 38,234 | | | | 214,795 | |
Pharol SGPS * | | | 746,695 | | | | 131,259 | |
REN - Redes Energeticas Nacionais SGPS | | | 94,304 | | | | 251,437 | |
Semapa-Sociedade de Investimento e Gestao | | | 110,363 | | | | 2,110,033 | |
Sonae | | | 890,270 | | | | 891,893 | |
Teixeira Duarte * | | | 1,080,897 | | | | 216,696 | |
| | | | | | | | 13,703,184 | |
| | | | | | |
Russia — 8.8% | | | | | |
Alrosa PJSC | | | 1,542,288 | | | | 2,338,937 | |
The accompanying notes are an integral part of the financial statements.
Cambria Investment Management
Schedule of Investments ● Cambria Global Value ETF
October 31, 2018 (Unaudited)
| Description | | Shares | | | Value | |
| | | | | | | | | |
| Gazprom Neft PJSC | | | 408,940 | | | $ | 2,390,055 | |
| Gazprom PJSC | | | 455,549 | | | | 1,075,151 | |
| Rosneft PJSC | | | 241808 | | | | 1,690,210 | |
| Sberbank of Russia PJSC | | | 351,236 | | | | 1,012,006 | |
| Severstal PJSC | | | 101,346 | | | | 1,584,643 | |
| Unipro PJSC | | | 27,380,692 | | | | 1,125,591 | |
| Uralkali * | | | 360,807 | | | | 461,732 | |
| VTB Bank PJSC | | | 1,578,205,886 | | | | 876,385 | |
| | | | | | | | 12,554,710 | |
| | | | | | | | | |
| Singapore — 5.6% | | | | | | | | |
CapitaLand | | | 355,600 | | | | 806,111 | |
City Developments | | | 114,300 | | | | 652,718 | |
ComfortDelGro | | | 482,600 | | | | 783,922 | |
Golden Agri-Resources | | | 3,670,300 | | | | 675,686 | |
Jardine Cycle & Carriage | | | 25,400 | | | | 555,072 | |
Oversea-Chinese Banking | | | 127,000 | | | | 984,716 | |
SATS | | | 254,000 | | | | 913,201 | |
Sembcorp Industries | | | 419,100 | | | | 853,238 | |
Singapore Airlines | | | 127,000 | | | | 869,191 | |
United Overseas Bank | | | 50,800 | | | | 894,130 | |
| | | | | | | | 7,987,985 | |
| | | | | | |
Spain — 8.2% | | | | | |
Acciona | | | 16,293 | | | | 1,376,312 | |
Banco Bilbao Vizcaya Argentaria | | | 131,747 | | | | 728,952 | |
Banco Santander | | | 183,015 | | | | 869,585 | |
Banco Santander | | | 185,897 | | | | 7,222 | |
CaixaBank | | | 263,314 | | | | 1,068,001 | |
Enagas | | | 43,206 | | | | 1,147,084 | |
Endesa | | | 51,066 | | | | 1,068,876 | |
Ferrovial | | | 58,047 | | | | 1,163,714 | |
Gas Natural SDG | | | 63,405 | | | | 1,559,828 | |
Iberdrola | | | 194,727 | | | | 1,379,801 | |
Mapfre | | | 403,909 | | | | 1,209,590 | |
| | | | | | | | 11,578,965 | |
| | | | | | |
Turkey — 3.5% | | | | | |
Akbank Turk | | | 355,473 | | | | 420,366 | |
Eregli Demir ve Celik Fabrikalari | | | 535,940 | | | | 868,688 | |
Haci Omer Sabanci Holding | | | 318,135 | | | | 405,238 | |
KOC Holding | | | 204,597 | | | | 570,277 | |
Petkim Petrokimya Holding | | | 770,732 | | | | 700,465 | |
Turkiye Halk Bankasi | | | 285,496 | | | | 315,141 | |
Turkiye Is Bankasi, Cl C | | | 486,791 | | | | 347,484 | |
Turkiye Sise ve Cam Fabrikalari | | | 832,428 | | | | 704,412 | |
Turkiye Vakiflar Bankasi TAO, Cl D | | | 557,911 | | | | 341,358 | |
The accompanying notes are an integral part of the financial statements.
Cambria Investment Management
Schedule of Investments ● Cambria Global Value ETF
October 31, 2018 (Unaudited)
Description | | Shares | | | Value | |
| | | | | | | | | |
Yapi ve Kredi Bankasi | | | 790,194 | | | $ | 229,017 | |
| | | | | | | | 4,902,446 | |
| | | | | | | | | |
| Total Common Stock | | | | | | | | |
| (Cost $153,218,289) | | | | | | | 134,341,119 | |
| | | | | | | | | |
| PREFERRED STOCK — 2.6% (D) | | | | | | | | |
| Brazil — 2.6% | | | | | | | | |
Banco Bradesco | | | 201,101 | | | | 1,842,683 | |
Cia Energetica de Minas Gerais | | | 277,900 | | | | 825,150 | |
Telefonica Brasil | | | 85,667 | | | | 991,909 | |
| | | | | | | | | |
| | | | | | | | | |
| Total Preferred Stock | | | | | | | | |
(Cost $4,195,473) | | | | | | | 3,659,742 | |
| | | | | | | | | |
| | | | | | | | | |
Total Investments - 97.2% | | | | | | | | |
(Cost $157,413,762) | | | | | | $ | 138,000,861 | |
Other Assets and Liabilities - 2.8% | | | | | | | 4,007,192 | |
Net Assets - 100.0% | | | | | | $ | 142,008,053 | |
Percentages based on Net Assets.
* | Non-income producing security. |
(A) | Securities sold within terms of a private placement memorandum, exempt from registration under Section 144A of the Securities Act of 1933, as amended, and may be sold only to dealers in that program or other "accredited investors." These securities are deemed to be liquid by the Board of Trustees. The total value of such securities at October 31, 2018 was $2,282,974 and represents 1.6% of Net Assets. |
(B) | Level 3 security in accordance with fair value hierarchy. |
(C) | Securities considered illiquid. The total value of such securities as of October 31, 2018 was $1,229,318 and represented 0.9% of Net Assets. See Note 2 in Notes to Financial Statements. |
(D) | There’s currently no stated interest rate or maturity date. |
Cl — Class |
PJSC — Private Joint Stock Company |
The accompanying notes are an integral part of the financial statements.
Cambria Investment Management
Schedule of Investments ● Cambria Global Value ETF
October 31, 2018 (Unaudited)
The following is a list of the inputs used as of October 31, 2018, in valuing the Fund’s investments and other financial instruments carried at market value:
Investments in Securities | | Level 1 | | | Level 2 | | | Level 3(1) | | | Total | |
Common Stock | | | | | | | | | | | | | | | | |
Austria | | $ | 2,282,974 | | | $ | — | | | $ | — | | | $ | 2,282,974 | |
Brazil | | | 11,297,245 | | | | — | | | | — | | | | 11,297,245 | |
Czech Republic | | | 7,491,272 | | | | — | | | | 1,187,879 | | | | 8,679,151 | |
Greece | | | 11,467,530 | | | | — | | | | 41,439 | | | | 11,508,969 | |
Israel | | | 20,501,954 | | | | — | | | | — | | | | 20,501,954 | |
Italy | | | 7,221,680 | | | | — | | | | — | | | | 7,221,680 | |
Norway | | | 10,957,448 | | | | — | | | | — | | | | 10,957,448 | |
Poland | | | 11,164,408 | | | | — | | | | — | | | | 11,164,408 | |
Portugal | | | 13,703,184 | | | | — | | | | — | | | | 13,703,184 | |
Russia | | | 12,554,710 | | | | — | | | | — | | | | 12,554,710 | |
Singapore | | | 7,987,985 | | | | — | | | | — | | | | 7,987,985 | |
Spain | | | 11,578,965 | | | | — | | | | — | | | | 11,578,965 | |
Turkey | | | 4,902,446 | | | | — | | | | — | | | | 4,902,446 | |
Total Common Stock | | | 133,111,801 | | | | — | | | | 1,229,318 | | | | 134,341,119 | |
Preferred Stock | | | | | | | | | | | | | | | | |
Brazil | | | 3,659,742 | | | | — | | | | — | | | | 3,659,742 | |
Total Preferred Stock | | | 3,659,742 | | | | — | | | | — | | | | 3,659,742 | |
Total Investments in Securities | | $ | 136,771,543 | | | $ | – | | | $ | 1,229,318 | | | $ | 138,000,861 | |
(1) Included in Level 3 are two securities with total value of $1,229,318. A reconciliation of Level 3 investments and disclosures of significant unobservable inputs are presented when the Fund has a significant amount of Level 3 investments at the beginning and/or end of the period in relation to net assets. Management has concluded that Level 3 investments are not material in relation to net assets.
There have been no transfers between Level 1 and Level 2 assets and liabilities. There were transfers between Level 1 and Level 3 during the period when foreign equity securities were fair valued using other observable market based inputs in place of the closing exchange price due to events occurring after the close of the exchange or market on which the investment was principally traded. It is the Fund’s policy to recognize transfers into and out of all Levels at the end of the reporting period.
Please see Note 2 in Notes to Financial Statements for further information regarding fair value measurements.
The accompanying notes are an integral part of the financial statements.
Cambria Investment Management
Schedule of Investments ●Cambria Global Momentum ETF
October 31, 2018 (Unaudited)
Sector Weightings †: | |

| |
† Percentages based on total investments. | |
| |
Description | | Shares | | | Value | |
| | | | | | | | | |
| EXCHANGE TRADED FUNDS — 98.5% | | | | | | | | |
Cambria Shareholder Yield ETF‡ | | | 161,049 | | | $ | 5,855,726 | |
Cambria Value and Momentum ETF‡ | | | 259,036 | | | | 6,183,863 | |
FlexShares Global Upstream Natural Resources Index Fund | | | 186,431 | | | | 5,868,848 | |
Invesco DB Energy Fund | | | 452,630 | | | | 7,472,921 | |
iShares Global Consumer Discretionary ETF | | | 52,424 | | | | 5,639,250 | |
iShares Global Energy ETF | | | 165,778 | | | | 5,666,292 | |
iShares Global Healthcare ETF | | | 100,130 | | | | 5,910,674 | |
iShares Global Tech ETF | | | 49,808 | | | | 7,988,207 | |
iShares Micro-Capital ETF | | | 61,907 | | | | 5,850,831 | |
iShares Mortgage Real Estate ETF | | | 146,383 | | | | 6,249,090 | |
iShares Residential Real Estate ETF | | | 102,380 | | | | 6,416,155 | |
Vanguard Mid-Capital ETF | | | 40,884 | | | | 6,151,815 | |
Vanguard Real Estate ETF | | | 78,295 | | | | 6,132,064 | |
Vanguard Small-Capital ETF | | | 39,415 | | | | 5,759,714 | |
Vanguard Small-Capital Value ETF | | | 47,519 | | | | 6,023,033 | |
Vanguard Total Stock Market ETF | | | 45,900 | | | | 6,359,904 | |
WisdomTree Managed Futures Strategy Fund | | | 153,572 | | | | 6,205,844 | |
| | | | | | | | | |
Total Exchange Traded Funds | | | | | | | | |
(Cost $108,548,936) | | | | | | | 105,734,231 | |
| | | | | | | | | |
Total Investments - 98.5% | | | | | | | | |
(Cost $108,548,936) | | | | | | $ | 105,734,231 | |
Other Assets and Liabilities - 1.5% | | | | | | | 1,626,500 | |
Net Assets - 100.0% | | | | | | $ | 107,360,731 | |
Percentages based on Net Assets.
‡ | Affiliated investment is a registered investment company which is managed by Cambria Investment Management, L.P. (the "Investment Adviser") or an affiliate of the Investment Adviser or which is distributed by an affiliate of the Fund's distributor. |
The accompanying notes are an integral part of the financial statements.
Cambria Investment Management
Schedule of Investments ●Cambria Global Momentum ETF
October 31, 2018 (Unaudited)
Transactions with affiliated companies during the period ended October 31, 2018 are as follows:
Value of Shares Held as of 04/30/18 | | | Purchases at Cost | | | Proceeds from Sales | | | Unrealized Appreciation (Depreciation) | | | Realized Gain (Loss) | | | Value of Shares Held as of 10/31/18 | | | Dividend Income | |
Cambria Emerging Shareholder Yield ETF | | | | | | | | | | | | | | | | | |
| $ | 12,126,658 | | | $ | 1,057,109 | | | $ | (12,492,777 | ) | | $ | (1,463,575 | ) | | $ | 772,585 | | | $ | - | | | $ | 87,897 | |
Cambria Foreign Shareholder Yield ETF | | | | | | | | | | | | | | | | | |
| | 6,019,500 | | | | 847,565 | | | | (6,405,286 | ) | | | ( 816,082 | ) | | | 354,303 | | | | - | | | | 111,285 | |
Cambria Global Value ETF | | | | | | | | | | | | | | | | | |
| | 11,622,581 | | | | 1,012,082 | | | | (11,847,345 | ) | | | (1,004,243 | ) | | | 216,925 | | | | - | | | | 59,478 | |
Cambria Shareholder Yield ETF | | | | | | | | | | | | | | | | | |
| | 4,581,748 | | | | 1,774,130 | | | | (177,584 | ) | | | (324,892 | ) | | | 2,324 | | | | 5,855,726 | | | | 69,745 | |
Cambria Value & Momentum ETF | | | | | | | | | | | | | | | | | |
| | - | | | | 6,777,996 | | | | (77,952 | ) | | | (516,093 | ) | | | (88 | ) | | | 6,183,863 | | | | 9,764 | |
| $ | 34,350,487 | | | $ | 11,468,882 | | | $ | (31,000,944 | ) | | $ | (4,124,885 | ) | | $ | 1,346,049 | | | $ | 12,039,589 | | | $ | 338,169 | |
ETF — Exchanged Traded Fund |
As of October 31, 2018, all of the Fund's investments in securities were considered Level 1, in accordance with the authoritative guidance on fair value measurements and disclosure under U.S. generally accepted accounting principles.
There have been no transfers between Level 1, Level 2 or Level 3 assets and liabilities. It is the Fund’s policy to recognize transfers into and out of all Levels at the end of the reporting period.
Please see Note 2 in Notes to Financial Statements for further information regarding fair value measurements.
The accompanying notes are an integral part of the financial statements.
Cambria Investment Management
Schedule of Investments ● Cambria Global Asset Allocation ETF
October 31, 2018 (Unaudited)
Sector Weightings †: | |

| |
† Percentages based on total investments. | |
| |
Description | | Shares | | | Value | |
| | | | | | | | | |
| EXCHANGE TRADED FUNDS — 99.9% | | | | | | | | |
Alpha Architect Value Momentum Trend ETF | | | 45,050 | | | $ | 1,178,058 | |
Cambria Emerging Shareholder Yield ETF‡ | | | 181,277 | | | | 5,324,106 | |
Cambria Foreign Shareholder Yield ETF‡ | | | 113,544 | | | | 2,655,874 | |
Cambria Global Value ETF‡ | | | 140,956 | | | | 3,146,138 | |
Cambria Shareholder Yield ETF‡ | | | 93,479 | | | | 3,398,887 | |
Cambria Sovereign Bond ETF‡ | | | 196,242 | | | | 4,792,033 | |
Invesco Optimum Yield Diversified Commodity Strategy No. K-1 ETF | | | 263,976 | | | | 4,682,934 | |
iShares Edge MSCI USA Momentum Factor ETF | | | 25,274 | | | | 2,711,142 | |
iShares Short Treasury Bond ETF | | | 11,866 | | | | 1,310,600 | |
Schwab U.S. REIT ETF | | | 47,342 | | | | 1,923,505 | |
Schwab US TIPs ETF | | | 35,515 | | | | 1,884,781 | |
SPDR FTSE International Government Inflation-Protected Bond ETF | | | 34,195 | | | | 1,786,005 | |
VanEck Vectors Emerging Markets High Yield Bond ETF | | | 106,751 | | | | 2,430,720 | |
VanEck Vectors International High Yield Bond ETF | | | 51,158 | | | | 1,219,607 | |
Vanguard FTSE Developed Markets ETF | | | 29,255 | | | | 1,157,035 | |
Vanguard Global ex-U.S. Real Estate ETF | | | 32,459 | | | | 1,718,055 | |
Vanguard Intermediate-Term Corporate Bond ETF | | | 22,457 | | | | 1,853,825 | |
Vanguard Intermediate-Term Treasury ETF | | | 44,022 | | | | 2,727,163 | |
Vanguard Long-Term Treasury ETF | | | 32,666 | | | | 2,284,987 | |
Vanguard Mid-Capital ETF | | | 8,434 | | | | 1,269,064 | |
Vanguard Short-Term Corporate Bond ETF | | | 16,493 | | | | 1,285,299 | |
Vanguard Total Bond Market ETF | | | 64,226 | | | | 4,999,352 | |
Vanguard Total International Bond ETF | | | 60,147 | | | | 3,279,816 | |
Vanguard Total Stock Market ETF | | | 19,029 | | | | 2,636,658 | |
The accompanying notes are an integral part of the financial statements.
Cambria Investment Management
Schedule of Investments ● Cambria Global Asset Allocation ETF
October 31, 2018 (Unaudited)
Description | | Shares | | | Value | |
| | | | | | | | | |
| | | | | | | | | |
Total Exchange Traded Funds | | | | | | | | |
| (Cost $64,616,068) | | | | | | $ | 61,655,644 | |
| | | | | | | | | |
Total Investments - 99.9% | | | | | | | | |
(Cost $64,616,068) | | | | | | $ | 61,655,644 | |
Other Assets and Liabilities - 0.1% | | | | | | | 48,722 | |
Net Assets - 100.0% | | | | | | $ | 61,704,366 | |
Percentages based on Net Assets.
| ‡ | Affiliated investment is a registered investment company which is managed by Cambria Investment Management, L.P. (the "Investment Adviser") or an affiliate of the Investment Adviser or which is distributed by an affiliate of the Fund's distributor. |
Transactions with affiliated companies during the period ended October 31, 2018 are as follows:
Value of Shares Held as of 04/30/18 | | | Purchases at Cost | | | Proceeds from Sales | | | Unrealized Appreciation (Depreciation) | | | Realized Gain (Loss) | | | Value of Shares Held as of 10/31/18 | | | Dividend Income | |
Cambria Emerging Shareholder Yield ETF | | | | | | | | | | | | | | | | | |
| $ | 6,201,182 | | | $ | 765,475 | | | $ | (432,855 | ) | | $ | (1,280,685 | ) | | $ | 70,989 | | | $ | 5,324,106 | | | $ | 153,585 | |
Cambria Foreign Shareholder Yield ETF | | | | | | | | | | | | | | | | | |
| | 3,089,111 | | | | 207,635 | | | | (251,916 | ) | | | (406,417 | ) | | | 17,461 | | | | 2,655,874 | | | | 75,378 | |
Cambria Global Value ETF | | | | | | | | | | | | | | | | | |
| | 3,746,095 | | | | 223,346 | | | | (273,619 | ) | | | (587,031 | ) | | | 37,347 | | | | 3,146,138 | | | | 65,538 | |
Cambria Shareholder Yield ETF | | | | | | | | | | | | | | | | | |
| | 3,633,898 | | | | 228,355 | | | | (294,749 | ) | | | (216,107 | ) | | | 47,490 | | | | 3,398,887 | | | | 52,203 | |
Cambria Sovereign Bond ETF | | | | | | | | | | | | | | | | | |
| | 5,549,473 | | | | 296,783 | | | | (371,500 | ) | | | (665,594 | ) | | | (17,129 | ) | | | 4,792,033 | | | | 91,359 | |
| $ | 22,219,759 | | | $ | 1,721,594 | | | $ | (1,624,639 | ) | | $ | (3,155,834 | ) | | $ | 156,158 | | | $ | 19,317,038 | | | $ | 438,063 | |
ETF — Exchanged Traded Fund |
FTSE — Financial Times Stock Exchange |
MSCI — Morgan Stanley Capital International |
REIT — Real Estate Investment Trust |
SPDR — Standard & Poor’s Depositary Receipt |
TIPS — Treasury Inflation Protected Security |
As of October 31, 2018, all of the Fund's investments in securities were considered Level 1, in accordance with the authoritative guidance on fair value measurements and disclosure under U.S. generally accepted accounting principles.
There have been no transfers between Level 1, Level 2 or Level 3 assets and liabilities. It is the Fund’s policy to recognize transfers into and out of all Levels at the end of the reporting period.
Please see Note 2 in Notes to Financial Statements for further information regarding fair value measurements.
The accompanying notes are an integral part of the financial statements.
Cambria Investment Management
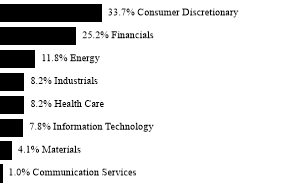
Schedule of Investments ● Cambria Value and Momentum ETF
October 31, 2018 (Unaudited)
Sector Weightings† | |
| |
† Percentages based on total investments. | |
Description | | Shares | | | Value | |
| | | | | | | | | |
| COMMON STOCK — 89.5% | | | | | | | | |
| | | | | | | | | |
| Communication Services — 0.8% | | | | | | | | |
Liberty TripAdvisor Holdings, Cl A* | | | 20,979 | | | $ | 302,517 | |
| | | | | | | | | |
| | | | | | | | | |
| Consumer Discretionary — 30.2% | | | | | | | | |
Aaron's | | | 6,210 | | | | 292,677 | |
Abercrombie & Fitch, Cl A | | | 17,044 | | | | 335,767 | |
American Eagle Outfitters | | | 13,218 | | | | 304,807 | |
Best Buy | | | 5,670 | | | | 397,807 | |
Brinker International | | | 5,551 | | | | 240,636 | |
Buckle | | | 11,866 | | | | 242,066 | |
Caleres | | | 7,171 | | | | 245,248 | |
Carvana, Cl A* | | | 4,300 | | | | 166,625 | |
Citi Trends | | | 11,043 | | | | 279,719 | |
Conn's* | | | 13,981 | | | | 388,392 | |
Crocs* | | | 36,001 | | | | 739,461 | |
Deckers Outdoor* | | | 3,014 | | | | 383,290 | |
Dick's Sporting Goods | | | 7,222 | | | | 255,442 | |
DSW, Cl A | | | 7,565 | | | | 200,851 | |
Express* | | | 23,368 | | | | 205,872 | |
Foot Locker | | | 6,384 | | | | 300,942 | |
Fossil Group* | | | 21,332 | | | | 463,118 | |
Genesco* | | | 5,428 | | | | 232,264 | |
Guess? | | | 19,596 | | | | 416,219 | |
Hibbett Sports* | | | 10,764 | | | | 188,047 | |
Kohl's | | | 4,162 | | | | 315,189 | |
Macy's | | | 9,060 | | | | 310,667 | |
Marriott Vacations Worldwide | | | 2,098 | | | | 185,652 | |
Michael Kors Holdings* | | | 4,213 | | | | 233,442 | |
Movado Group | | | 12,067 | | | | 464,700 | |
The accompanying notes are an integral part of the financial statements.
Cambria Investment Management
Schedule of Investments ● Cambria Value and Momentum ETF
October 31, 2018 (Unaudited)
Description | | Shares | | | Value | |
| | | | | | | | | |
New York* | | | 67,789 | | | $ | 268,444 | |
Ralph Lauren, Cl A | | | 2,664 | | | | 345,281 | |
Shoe Carnival | | | 10,317 | | | | 420,210 | |
Signet Jewelers | | | 3,930 | | | | 220,277 | |
Tailored Brands | | | 10,267 | | | | 215,710 | |
Target | | | 2,949 | | | | 246,625 | |
Tilly's, Cl A | | | 19,505 | | | | 346,019 | |
Urban Outfitters* | | | 7,071 | | | | 279,022 | |
Vitamin Shoppe* | | | 25,046 | | | | 194,607 | |
Williams-Sonoma | | | 3,941 | | | | 234,017 | |
Zumiez* | | | 10,810 | | | | 251,441 | |
| | | | | | | | 10,810,553 | |
| | | | | | | | | |
| Energy — 10.6% | | | | | | | | |
| Arch Coal | | | 2,851 | | | | 273,411 | |
Delek US Holdings | | | 9,299 | | | | 341,459 | |
HollyFrontier | | | 6,272 | | | | 422,984 | |
Magnolia Oil & Gas* | | | 17,267 | | | | 214,974 | |
Mammoth Energy Services | | | 8,468 | | | | 211,361 | |
Marathon Petroleum | | | 5,825 | | | | 410,371 | |
PBF Energy, Cl A | | | 7,771 | | | | 325,216 | |
Peabody Energy | | | 7,061 | | | | 250,312 | |
Renewable Energy Group* | | | 19,114 | | | | 594,064 | |
Valero Energy | | | 3,420 | | | | 311,528 | |
W&T Offshore* | | | 62,766 | | | | 423,043 | |
| | | | | | | | 3,778,723 | |
| | | | | | | | | |
| Financials — 22.5% | | | | | | | | |
| American Equity Investment Life Holding | | | 14,039 | | | | 438,298 | |
B. Riley Financial | | | 20,105 | | | | 387,021 | |
Cannae Holdings* | | | 14,082 | | | | 260,095 | |
Enova International* | | | 16,653 | | | | 393,843 | |
FedNat Holding | | | 14,809 | | | | 318,838 | |
First BanCorp* | | | 28,534 | | | | 263,369 | |
Genworth Financial, Cl A* | | | 77,780 | | | | 332,898 | |
Green Dot, Cl A* | | | 7,948 | | | | 601,982 | |
Health Insurance Innovations, Cl A* | | | 13,588 | | | | 664,453 | |
Kemper | | | 4,381 | | | | 329,407 | |
Navigators Group | | | 3,732 | | | | 258,068 | |
OFG Bancorp | | | 23,986 | | | | 409,921 | |
Old Republic International | | | 22,080 | | | | 486,864 | |
On Deck Capital* | | | 46,860 | | | | 323,334 | |
Popular | | | 5,010 | | | | 260,570 | |
Progressive | | | 11,460 | | | | 798,762 | |
Regions Financial | | | 17,162 | | | | 291,239 | |
TCF Financial | | | 13,605 | | | | 284,072 | |
The accompanying notes are an integral part of the financial statements.
Cambria Investment Management
Schedule of Investments ● Cambria Value and Momentum ETF
October 31, 2018 (Unaudited)
Description | | Shares | | | Value | |
| | | | | | | | | |
Universal Insurance Holdings | | | 8,420 | | | $ | 353,472 | |
Voya Financial | | | 5,312 | | | | 232,453 | |
World Acceptance* | | | 3,778 | | | | 383,429 | |
| | | | | | | | 8,072,388 | |
| | | | | | | | | |
| Health Care — 7.3% | | | | | | | | |
Anthem | | | 1,236 | | | | 340,605 | |
Centene* | | | 3,635 | | | | 473,713 | |
Express Scripts Holding* | | | 2,723 | | | | 264,049 | |
HCA Healthcare | | | 1,865 | | | | 249,033 | |
Humana | | | 1,416 | | | | 453,701 | |
Mallinckrodt PLC* | | | 8,825 | | | | 221,155 | |
Premier, Cl A* | | | 5,702 | | | | 256,590 | |
WellCare Health Plans* | | | 1,293 | | | | 356,855 | |
| | | | | | | | 2,615,701 | |
| | | | | | | | | |
| Industrials — 7.4% | | | | | | | | |
ArcBest | | | 10,380 | | | | 385,306 | |
Boeing | | | 1,325 | | | | 470,190 | |
FTI Consulting* | | | 5,550 | | | | 383,560 | |
Greenbrier | | | 4,288 | | | | 203,466 | |
Heidrick & Struggles International | | | 9,462 | | | | 326,534 | |
Korn | | | 8,643 | | | | 390,144 | |
Robert Half International | | | 3,706 | | | | 224,324 | |
United Continental Holdings* | | | 2,921 | | | | 249,775 | |
| | | | | | | | 2,633,299 | |
| | | | | | | | | |
| Information Technology — 7.0% | | | | | | | | |
Cohu | | | 5,210 | | | | 108,368 | |
Comtech Telecommunications | | | 16,026 | | | | 447,446 | |
Electro Scientific Industries* | | | 14,522 | | | | 421,137 | |
HP | | | 17,196 | | | | 415,111 | |
Insight Enterprises* | | | 4,753 | | | | 245,683 | |
KEMET | | | 18,960 | | | | 412,949 | |
Nanometrics* | | | 7,080 | | | | 226,985 | |
Unisys* | | | 12,709 | | | | 233,973 | |
| | | | | | | | 2,511,652 | |
| | | | | | | | | |
| Materials — 3.7% | | | | | | | | |
Louisiana-Pacific | | | 11,973 | | | | 260,652 | |
Resolute Forest Products* | | | 31,084 | | | | 350,317 | |
Verso* | | | 16,398 | | | | 460,948 | |
Warrior Met Coal | | | 9,120 | | | | 255,360 | |
| | | | | | | | 1,327,277 | |
| | | | | | | | | |
| Total Common Stock | | | | | | | | |
| (Cost $30,898,336) | | | | | | | 32,052,110 | |
The accompanying notes are an integral part of the financial statements.
Cambria Investment Management
Schedule of Investments ● Cambria Value and Momentum ETF
October 31, 2018 (Unaudited)
Description | | Shares | | | Value | |
| | | | | | | | | |
Total Investments - 89.5% | | | | | | | | |
(Cost $30,898,336) | | | | | | $ | 32,052,110 | |
Other Assets and Liabilities - 10.5% | | | | | | | 3,762,238 | |
Net Assets - 100.0% | | | | | | $ | 35,814,348 | |
Percentages based on Net Assets.
* | Non-income producing security. |
Cl — Class |
PLC — Public Limited Company |
S&P — Standard & Poor's |
The open futures contracts held by the Fund at October 31, 2018, is as follows:
Type of
Contract | | Number of
Contracts Short | | Expiration Date | | Notional Amount | | | Value | | | Unrealized
Appreciation | |
S&P 500 Index E-MINI | | | (210 | ) | Dec-2018 | | $ | (29,154,570 | ) | | $ | (28,466,550 | ) | | $ | 688,020 | |
S&P 500 Index E-MINI | | | (30 | ) | Mar-2019 | | | (4,402,851 | ) | | | (4,075,950 | ) | | | 326,901 | |
| | | | | | | | $ | (33,557,421 | ) | | $ | (32,542,500 | ) | | $ | 1,014,921 | |
For the period ended October 31, 2018, the monthly average notional value of the short equity futures contracts held was $(20,759,273) and the ending notional value of short equity futures contracts held was $(33,557,421).
As of October 31, 2018, all of the Fund's investments and other securities were considered Level 1, in accordance with the authoritative guidance on fair value measurements and disclosure under U.S. generally accepted accounting principles.
There have been no transfers between Level 1, Level 2 or Level 3 assets and liabilities. It is the Fund’s policy to recognize transfers into and out of all Levels at the end of the reporting period.
Please see Note 2 in Notes to Financial Statements for further information regarding fair value measurements.
The accompanying notes are an integral part of the financial statements.
Cambria Investment Management
Schedule of Investments ● Cambria Sovereign Bond ETF
October 31, 2018 (Unaudited)
Sector Weightings†: | |

| |
† Percentages based on total investments. | |
Description | | | Face Amount(1) | | | Value | |
| | | | | | | | | | |
| SOVEREIGN DEBT — 82.8% | | | | | | | | | |
| | | | | | | | | | |
| Argentina — 3.4% | | | | | | | | | |
Argentine Bonos del Tesoro | | | | | | | | | |
18.200%, 10/03/21 | ARS | | | 5,576,820 | | | $ | 127,513 | |
16.000%, 10/17/23 | ARS | | | 5,529,360 | | | | 136,120 | |
15.500%, 10/17/26 | ARS | | | 5,297,445 | | | | 122,324 | |
| Argentine Government International Bond | | | | | | | | | |
| 4.625%, 01/11/23 | | | | 277,000 | | | | 234,065 | |
| | | | | | | | | 620,022 | |
| | | | | | | | | | |
| Australia — 4.0% | | | | | | | | | |
Queensland Treasury | | | | | | | | | |
5.750%, 07/22/24 | AUD | | | 435,000 | | | | 358,595 | |
4.750%, 07/21/25 (A) | AUD | | | 465,000 | | | | 369,206 | |
| | | | | | | | | 727,801 | |
| | | | | | | | | | |
| Brazil — 7.6% | | | | | | | | | |
Brazilian Government International Bond | | | | | | | | | |
8.500%, 01/05/24 | BRL | | | 5,250,000 | | | | 1,396,614 | |
| | | | | | | | | | |
| | | | | | | | | | |
| Chile — 2.5% | | | | | | | | | |
Bonos de la Tesoreria de la Republica en pesos | | | | | | | | | |
6.000%, 01/01/24 | CLP | | | 150,000,000 | | | | 236,119 | |
4.500%, 03/01/26 | CLP | | | 150,000,000 | | | | 217,348 | |
| | | | | | | | | 453,467 | |
| | | | | | | | | | |
| Colombia — 4.2% | | | | | | | | | |
Colombian TES | | | | | | | | | |
11.000%, 07/24/20 | COP | | | 741,000,000 | | | | 251,181 | |
7.500%, 08/26/26 | COP | | | 812,500,000 | | | | 260,139 | |
7.000%, 05/04/22 | COP | | | 819,000,000 | | | | 262,901 | |
| | | | | | | | | 774,221 | |
| | | | | | | | | | |
| Croatia — 4.0% | | | | | | | | | |
Croatia Government International Bond | | | | | | | | | |
6.000%, 01/26/24 | HRK | | | 340,000 | | | | 366,219 | |
5.500%, 04/04/23 | HRK | | | 350,000 | | | | 367,128 | |
| | | | | | | | | 733,347 | |
| | | | | | | | | | |
| Greece — 4.6% | | | | | | | | | |
Hellenic Republic Government Bond | | | | | | | | | |
3.650%, 02/24/24 (B) | EUR | | | 747,795 | | | | 833,481 | |
The accompanying notes are an integral part of the financial statements.
Cambria Investment Management
Schedule of Investments ● Cambria Sovereign Bond ETF
October 31, 2018 (Unaudited)
Description | | | Face Amount(1) | | | Value | |
| | | | | | | | | | |
| Hungary — 4.6% | | | | | | | | | |
Hungary Government Bond | | | | | | | | | |
6.000%, 11/24/23 | HUF | | | 99,450,000 | | | $ | 404,495 | |
5.500%, 06/24/25 | HUF | | | 101,550,000 | | | | 403,985 | |
3.000%, 06/26/24 | HUF | | | 11,420,000 | | | | 40,051 | |
| | | | | | | | | 848,531 | |
| | | | | | | | | | |
| Indonesia — 3.2% | | | | | | | | | |
Indonesia Treasury Bond | | | | | | | | | |
8.375%, 03/15/24 | IDR | | | 4,476,000,000 | | | | 291,481 | |
7.000%, 05/15/27 | IDR | | | 4,800,000,000 | | | | 284,479 | |
| | | | | | | | | 575,960 | |
| | | | | | | | | | |
| Malaysia — 3.7% | | | | | | | | | |
Malaysia Government Bond | | | | | | | | | |
4.498%, 04/15/30 | MYR | | | 1,563,000 | | | | 373,447 | |
4.392%, 04/15/26 | MYR | | | 110,000 | | | | 26,607 | |
4.181%, 07/15/24 | MYR | | | 1,010,000 | | | | 243,579 | |
Malaysia Government Investment Issue | | | | | | | | | |
4.070%, 09/30/26 | MYR | | | 110,000 | | | | 26,067 | |
| | | | | | | | | 669,700 | |
| | | | | | | | | | |
| Mexico — 4.3% | | | | | | | | | |
Mexican Bonos | | | | | | | | | |
10.000%, 12/05/24 | MXN | | | 5,123,200 | | | | 267,224 | |
8.500%, 05/31/29 | MXN | | | 6,363,700 | | | | 304,741 | |
7.500%, 06/03/27 | MXN | | | 4,925,000 | | | | 223,081 | |
| | | | | | | | | 795,046 | |
| | | | | | | | | | |
| New Zealand — 2.7% | | | | | | | | | |
New Zealand Government Bond | | | | | | | | | |
4.500%, 04/15/27 | NZD | | | 645,000 | | | | 488,656 | |
| | | | | | | | | | |
| Philippines — 2.5% | | | | | | | | | |
Philippine Government Bond | | | | | | | | | |
8.000%, 07/19/31 | PHP | | | 23,858,684 | | | | 450,771 | |
| | | | | | | | | | |
| Poland — 5.2% | | | | | | | | | |
Poland Government Bond | | | | | | | | | |
5.750%, 04/25/29 | PLN | | | 2,130,000 | | | | 679,963 | |
Republic of Poland Government Bond | | | | | | | | | |
3.250%, 07/25/25 | PLN | | | 495,000 | | | | 131,801 | |
2.500%, 07/25/26 | PLN | | | 540,000 | | | | 135,523 | |
| | | | | | | | | 947,287 | |
| | | | | | | | | | |
| Portugal — 4.3% | | | | | | | | | |
Portugal Obrigacoes do Tesouro OT | | | | | | | | | |
4.125%, 04/14/27 (A) | EUR | | | 391,365 | | | | 526,791 | |
3.875%, 02/15/30 (A) | EUR | | | 195,330 | | | | 259,602 | |
| | | | | | | | | 786,393 | |
The accompanying notes are an integral part of the financial statements.
Cambria Investment Management
Schedule of Investments ● Cambria Sovereign Bond ETF
October 31, 2018 (Unaudited)
Description | | | Face Amount(1) | | | Value | |
| | | | | | | | | | |
Romania — 4.4% | | | | | |
Romania Government Bond | | | | | | | | | |
5.850%, 04/26/23 | RON | | | 1,050,000 | | | $ | 266,256 | |
5.800%, 07/26/27 | RON | | | 1,050,000 | | | | 268,898 | |
4.750%, 02/24/25 | RON | | | 1,125,000 | | | | 270,321 | |
| | | | | | | | | 805,475 | |
Russia — 4.3% | | | | | |
Russian Federal Bond - OFZ | | | | | | | | | |
7.600%, 04/14/21 | RUB | | | 19,185,000 | | | | 289,200 | |
7.600%, 07/20/22 | RUB | | | 18,690,000 | | | | 279,540 | |
7.000%, 01/25/23 | RUB | | | 15,120,000 | | | | 220,941 | |
| | | | | | | | | 789,681 | |
South Africa — 4.3% | | | | | |
Republic of South Africa Government Bond | | | | | | | | | |
8.250%, 03/31/32 | ZAR | | | 3,183,195 | | | | 187,663 | |
8.000%, 01/31/30 | ZAR | | | 6,838,005 | | | | 406,590 | |
7.000%, 02/28/31 | ZAR | | | 3,570,780 | | | | 192,271 | |
| | | | | | | | | 786,524 | |
Thailand — 3.9% | | | | | |
Thailand Government Bond | | | | | | | | | |
3.625%, 06/16/23 | THB | | | 22,143,000 | | | | 703,697 | |
| | | | | | | | | | |
Turkey — 5.1% | | | | | |
Turkey Government Bond | | | | | | | | | |
10.700%, 02/17/21 | TRY | | | 2,385,000 | | | | 342,202 | |
8.500%, 09/14/22 | TRY | | | 3,315,000 | | | | 427,007 | |
Turkey Government International Bond | | | | | | | | | |
4.250%, 04/14/26 | | | 200,000 | | | | 164,673 | |
| | | | | | | | | 933,882 | |
Total Sovereign Debt | | | | | | | | |
(Cost $17,428,301) | | | | | | | 15,120,556 | |
| | | | | | | | | | |
U.S. TREASURY OBLIGATION — 12.6% | | | | | |
| | | | | | | | | | |
U.S. Treasury Notes | | | | | | | | | |
2.250%, 02/15/27 | | | 2,465,300 | | | | 2,308,137 | |
| | | | | | | | | | |
Total U.S. Treasury Obligations | | | | | | | | |
(Cost $2,315,738) | | | | | | | 2,308,137 | |
| | | | | | | | | | |
Total Investments - 95.4% | | | | | | | | | |
(Cost $19,744,039) | | | | | | $ | 17,428,693 | |
Other Assets and Liabilities - 4.6% | | | | | | | 846,128 | |
Net Assets - 100.0% | | | | | | $ | 18,274,821 | |
Percentages based on Net Assets.
(1) | In U.S. dollars unless otherwise indicated. |
The accompanying notes are an integral part of the financial statements.
Cambria Investment Management
Schedule of Investments ● Cambria Sovereign Bond ETF
October 31, 2018 (Unaudited)
(A) | Securities sold within terms of a private placement memorandum, exempt from registration under Section 144A of the Securities Act of 1933, as amended, and may be sold only to dealers in that program or other "accredited investors." These securities are deemed to be liquid by the Board of Trustees. The total value of such securities at October 31, 2018 was $1,155,599 and represents 6.3% of Net Assets. |
(B) | Step Bond - Represents the current rate, the step rate, the step date and the final maturity date. |
ARS — Argentine Peso |
AUD — Australian Dollar |
BRL — Brazilian Real |
CLP — Chilean Peso |
COP — Colombian Peso |
EUR — Euro |
HRK — Croatian Kuna |
HUF — Hungarian Forint |
IDR — Indonesian Rupiah |
MXN — Mexican Peso |
MYR — Malaysian Ringgit |
NZD — New Zealand Dollar |
PHP — Philippine Peso |
PLN — Polish Zloty |
RON — Romanian Leu |
RUB — Russian Ruble |
THB — Thailand Baht |
TRY— Turkish Lira |
ZAR — South African Rand |
|
As of October 31, 2018, all of the Fund's investments in securities were considered Level 2, in accordance with the authoritative guidance on fair value measurements and disclosure under U.S. generally accepted accounting principles.
There have been no transfers between Level 1, Level 2 or Level 3 assets and liabilities. It is the Fund’s policy to recognize transfers into and out of all Levels at the end of the reporting period.
Please see Note 2 in Notes to Financial Statements for further information regarding fair value measurements.
The accompanying notes are an integral part of the financial statements.
Cambria Investment Management
Schedule of Investments ● Cambria Emerging Shareholder Yield ETF
October 31, 2018 (Unaudited)
Sector Weightings† |
|
† Percentages based on total investments. |
Description | | Shares | | | Value | |
| | | | | | | | | |
COMMON STOCK — 97.3% | | | | | |
Brazil — 4.3% | | | | | |
Cia de Saneamento de Minas Gerais-COPASA | | | 15,400 | | | $ | 211,292 | |
Mahle-Metal Leve | | | 24,200 | | | | 140,980 | |
SLC Agricola | | | 22,000 | | | | 334,301 | |
| | | | | | | | 686,573 | |
China — 0.9% | | | | | | | | |
China Petroleum & Chemical ADR | | | 1,837 | | | | 148,172 | |
| | | | | | | | | |
Colombia — 2.3% | | | | | | | | |
Banco de Bogota | | | 7,315 | | | | 149,958 | |
Ecopetrol | | | 192,324 | | | | 224,910 | |
| | | | | | | | 374,868 | |
Czech Republic — 1.1% | | | | | | | | |
O2 Czech Republic | | | 16,181 | | | | 170,277 | |
| | | | | | | | | |
Greece — 4.6% | | | | | | | | |
Aegean Airlines | | | 18,051 | | | | 136,575 | |
Hellenic Petroleum | | | 20,064 | | | | 159,532 | |
Motor Oil Hellas Corinth Refineries | | | 9,196 | | | | 217,690 | |
Mytilineos Holdings | | | 24,310 | | | | 215,045 | |
| | | | | | | | 728,842 | |
Hong Kong — 16.1% | | | | | | | | |
Anhui Conch Cement, Cl H | | | 44,000 | | | | 227,239 | |
Asia Cement China Holdings | | | 253,000 | | | | 217,126 | |
China Communications Construction, Cl H | | | 198,000 | | | | 181,034 | |
China Lilang | | | 220,000 | | | | 181,230 | |
China Telecom, Cl H | | | 528,000 | | | | 249,122 | |
CNOOC | | | 132,000 | | | | 226,566 | |
Greatview Aseptic Packaging | | | 275,000 | | | | 182,353 | |
Greenland Hong Kong Holdings | | | 473,000 | | | | 108,570 | |
The accompanying notes are an integral part of the financial statements.
Cambria Investment Management
Schedule of Investments ● Cambria Emerging Shareholder Yield ETF
October 31, 2018 (Unaudited)
Description | | Shares | | | Value | |
| | | | | | | | | |
Industrial & Commercial Bank of China, Cl H | | | 231,000 | | | $ | 156,122 | |
Maanshan Iron & Steel, Cl H | | | 374,000 | | | | 200,307 | |
PICC Property & Casualty, Cl H | | | 154,000 | | | | 149,249 | |
Sinopec Engineering Group, Cl H | | | 231,000 | | | | 214,741 | |
Sinopec Shanghai Petrochemical ADR | | | 2,783 | | | | 122,035 | |
Sinotruk Hong Kong | | | 110,000 | | | | 157,945 | |
| | | | | | | | 2,573,639 | |
Hungary — 1.4% | | | | | | | | |
MOL Hungarian Oil & Gas | | | 20,790 | | | | 218,017 | |
| | | | | | | | | |
Indonesia — 1.5% | | | | | | | | |
Gudang Garam | | | 51,700 | | | | 245,875 | |
| | | | | | | | | |
Mexico — 2.1% | | | | | | | | |
Nemak (A) | | | 323,400 | | | | 233,556 | |
Rassini, Cl A | | | 59,400 | | | | 94,598 | |
| | | | | | | | 328,154 | |
Russia — 11.5% | | | | | | | | |
Alrosa PJSC | | | 134,200 | | | | 203,519 | |
Center for Cargo Container Traffic TransContainer PJSC | | | 4,590 | | | | 309,722 | |
Gazprom PJSC ADR | | | 38,775 | | | | 182,243 | |
Gazprom Neft PJSC | | | 40,920 | | | | 239,157 | |
Inter RAO UES PJSC | | | 2,585,000 | | | | 156,261 | |
LUKOIL PJSC ADR | | | 3,146 | | | | 234,817 | |
Novolipetsk Steel PJSC | | | 84,040 | | | | 204,660 | |
Severstal PJSC | | | 15,620 | | | | 244,234 | |
Tatneft PJSC | | | 20,460 | | | | 243,630 | |
| | | | | | | | 2,018,243 | |
South Africa — 8.7% | | | | | | | | |
African Rainbow Minerals | | | 27,852 | | | | 235,786 | |
Assore | | | 10,142 | | | | 211,839 | |
BHP Billiton | | | 9,922 | | | | 199,657 | |
Investec | | | 24,420 | | | | 151,908 | |
Kumba Iron Ore | | | 10,868 | | | | 212,903 | |
Nedbank Group | | | 13,585 | | | | 229,221 | |
Reunert | | | 28,886 | | | | 156,154 | |
| | | | | | | | 1,397,468 | |
South Korea — 14.4% | | | | | | | | |
Cheil Worldwide | | | 14,124 | | | | 281,352 | |
Grand Korea Leisure | | | 11,407 | | | | 222,725 | |
Hanmi Semiconductor | | | 26,389 | | | | 212,816 | |
Huchems Fine Chemical | | | 11,473 | | | | 219,483 | |
The accompanying notes are an integral part of the financial statements.
Cambria Investment Management
Schedule of Investments ● Cambria Emerging Shareholder Yield ETF
October 31, 2018 (Unaudited)
Description | | Shares | | | Value | |
| | | | | | | | | |
KT&G | | | 2,662 | | | $ | 237,105 | |
LG Uplus | | | 16,390 | | | | 232,283 | |
SFA Engineering | | | 6,622 | | | | 226,050 | |
SK Innovation | | | 1,397 | | | | 261,734 | |
S-Oil | | | 1,628 | | | | 177,151 | |
Woori Bank | | | 16,885 | | | | 233,372 | |
| | | | | | | | 2,304,071 | |
Taiwan — 19.1% | | | | | | | | |
Actron Technology | | | 55,000 | | | | 161,927 | |
Asustek Computer | | | 11,000 | | | | 81,408 | |
Aten International | | | 55,000 | | | | 137,753 | |
Chang Wah Electromaterials | | | 33,000 | | | | 135,976 | |
Chong Hong Construction | | | 99,000 | | | | 224,920 | |
Chunghwa Telecom ADR | | | 4,664 | | | | 163,613 | |
CyberPower Systems | | | 33,000 | | | | 76,786 | |
Formosa Chemicals & Fibre | | | 66,000 | | | | 238,891 | |
Formosa Petrochemical | | | 55,000 | | | | 216,850 | |
ITEQ | | | 132,000 | | | | 168,930 | |
Micro-Star International | | | 44,000 | | | | 97,120 | |
Nan Ya Plastics | | | 88,000 | | | | 218,699 | |
Novatek Microelectronics | | | 55,000 | | | | 242,624 | |
Pixart Imaging | | | 66,000 | | | | 173,836 | |
Powertech Technology | | | 55,000 | | | | 120,156 | |
Simplo Technology | | | 22,000 | | | | 127,622 | |
Sitronix Technology | | | 44,000 | | | | 113,758 | |
Thinking Electronic Industrial | | | 55,000 | | | | 109,847 | |
Zhen Ding Technology Holding | | | 110,000 | | | | 251,333 | |
| | | | | | | | 3,062,049 | |
Thailand — 4.1% | | | | | | | | |
Electricity Generating | | | 35,200 | | | | 245,285 | |
Siam Commercial Bank | | | 56,100 | | | | 232,692 | |
Thai Oil | | | 69,300 | | | | 177,170 | |
| | | | | | | | 655,147 | |
Turkey — 4.1% | | | | | | | | |
Enka Insaat ve Sanayi | | | 295,856 | | | | 247,182 | |
Iskenderun Demir ve Celik | | | 108,284 | | | | 134,638 | |
Tekfen Holding | | | 70,895 | | | | 269,395 | |
| | | | | | | | 651,215 | |
| | | | | | | | | |
Total Common Stock | | | | | | | | |
(Cost $16,687,018) | | | | | | | 15,562,610 | |
The accompanying notes are an integral part of the financial statements.
Cambria Investment Management
Schedule of Investments ● Cambria Emerging Shareholder Yield ETF
October 31, 2018 (Unaudited)
Description | | Shares | | | Value | |
| | | | | | | | | |
| | | | | | | | | |
Total Investments - 97.3% | | | | | | | | |
(Cost $16,687,018) | | | | | | $ | 15,562,610 | |
Other Assets and Liabilities - 2.7% | | | | | | | 431,729 | |
Net Assets - 100.0% | | | | | | $ | 15,994,339 | |
Percentages based on Net Assets.
(A) | Securities sold within terms of a private placement memorandum, exempt from registration under Section 144A of the Securities Act of 1933, as amended, and may be sold only to dealers in that program or other "accredited investors." These securities are deemed to be liquid by the Board of Trustees. The total value of such securities at October 31, 2018 was $233,556 and represents 1.5% of Net Assets. |
ADR — American Depositary Receipt
Cl — Class
PJSC — Public Joint Stock Company
As of October 31, 2018, all of the Fund's investments were considered Level 1 in accordance with the authoritative guidance of fair value measurements and disclosure under U.S. generally accepted accounting principles.
There have been no transfers between Level 1, Level 2 or Level 3 assets and liabilities. It is the Fund’s policy to recognize transfers into and out of all Levels at the end of the reporting period.
Please see Note 2 in Notes to Financial Statements for further information regarding fair value measurements.
The accompanying notes are an integral part of the financial statements.
Cambria Investment Management
Schedule of Investments ● Cambria Tail Risk ETF
October 31, 2018 (Unaudited)
Sector Weightings† |
|
| |
| |
† Percentages based on total investments. |
Description | | Face Amount | | | Value | |
| | | | | | | | | |
U.S. TREASURY OBLIGATION — 89.4% | | | | | |
| | | | | | | | | |
U.S. Treasury Notes | | | | | | | | |
2.250%, 02/15/27 | | $ | 21,909,800 | | | $ | 20,513,050 | |
| | | | | | | | | |
Total U.S. Treasury Obligations | | | | | |
(Cost $21,169,381) | | | | 20,513,050 | |
| | | | | | | | | |
Total Investments - 89.4% | | | | | | | | |
(Cost $21,169,381) | | | | | | $ | 20,513,050 | |
Other Assets and Liabilities - 0.7% | | | | | | | 177,603 | |
Net Assets - 90.1% | | | | | | $ | 22,944,483 | |
Description | | Contracts | | | Value | |
| | | | | | | | | |
PURCHASED OPTIONS — 9.8%(A)‡* | | | | | |
Total Purchased Options | | | | | | | | |
(Cost $2,236,839) | | | | | | | 2,253,830 | |
Percentages based on Net Assets.
* | Non-income producing securities |
‡ For the period ended October 31, 2018, the average notional value of equity purchased options held was $82,509,702 and the ending notional value of the equity purchased options held was $75,657,546.
(A) | Refer to table below for details on Options Contracts. |
The accompanying notes are an integral part of the financial statements.
Cambria Investment Management
Schedule of Investments ● Cambria Tail Risk ETF
October 31, 2018 (Unaudited)
A list of the exchange traded option contracts held by the Fund at October 31, 2018, is as follows:
| | | Contracts | | | Notional Amount | | | Value | |
| | | | | | | | | | | | | |
PURCHASED OPTIONS - 9.82% | |
Put Options | | | | | | | | | | | | |
SPX, Expires 12/24/2018, Strike Price $2,250 | | | 5 | | | $ | 1,355,870 | | | $ | 3,050 | |
SPX, Expires 12/24/2018, Strike Price $2,325 | | | 5 | | | | 1,355,870 | | | | 4,400 | |
SPX, Expires 12/24/2018, Strike Price $2,400 | | | 11 | | | | 2,982,914 | | | | 14,300 | |
SPX, Expires 12/24/2018, Strike Price $2,500 | | | 2 | | | | 542,348 | | | | 4,540 | |
SPX, Expires 03/18/2019, Strike Price $2,450 | | | 23 | | | | 6,237,002 | | | | 109,365 | |
SPX, Expires 03/18/2019, Strike Price $2,500 | | | 31 | | | | 8,406,394 | | | | 174,375 | |
SPX, Expires 06/24/2019, Strike Price $2,400 | | | 24 | | | | 6,508,176 | | | | 155,400 | |
SPX, Expires 06/24/2019, Strike Price $2,450 | | | 21 | | | | 5,694,654 | | | | 154,875 | |
SPX, Expires 06/24/2019, Strike Price $2,475 | | | 26 | | | | 7,050,524 | | | | 204,490 | |
SPX, Expires 06/24/2019, Strike Price $2,500 | | | 31 | | | | 8,406,394 | | | | 260,245 | |
SPX, Expires 06/24/2019, Strike Price $2,525 | | | 29 | | | | 7,864,046 | | | | 259,550 | |
SPX, Expires 06/24/2019, Strike Price $2,550 | | | 26 | | | | 7,050,524 | | | | 248,430 | |
SPX, Expires 12/23/2019, Strike Price $2,550 | | | 21 | | | | 5,694,654 | | | | 277,830 | |
SPX, Expires 12/23/2019, Strike Price $2,625 | | | 9 | | | | 2,440,566 | | | | 139,005 | |
SPX, Expires 12/23/2019, Strike Price $2,650 | | | 15 | | | | 4,067,610 | | | | 243,975 | |
Total Purchased Options | | | | | | | | | | | 2,253,830 | |
The following is a list of the inputs used as of October 31, 2018 in valuing the Fund’s investments and other financial instruments carried at value: |
Investments in Securities | | Level 1 | | | Level 2 | | | Level 3 | | | Total | |
U.S. Treasury Obligation | | $ | — | | | $ | 20,513,050 | | | $ | — | | | $ | 20,513,050 | |
Total Investments in Securities | | $ | — | | | $ | 20,513,050 | | | $ | — | | | $ | 20,513,050 | |
Other Financial Instruments | | Level 1 | | | Level 2 | | | Level 3 | | | Total | |
Purchased Options | | $ | 2,253,830 | | | $ | — | | | $ | — | | | $ | 2,253,830 | |
Total Other Financial Instruments | | $ | 2,253,830 | | | $ | — | | | $ | — | | | $ | 2,253,830 | |
There have been no transfers between Level 1, Level 2 or Level 3 assets and liabilities. It is the Fund’s policy to recognize transfers into and out of all Levels at the end of the reporting period.
Please see Note 2 in Notes to Financial Statements for further information regarding fair value measurements.
The accompanying notes are an integral part of the financial statements.
Cambria Investment Management
Schedule of Investments ● Cambria Core Equity ETF
October 31, 2018 (Unaudited)
Sector Weightings† |
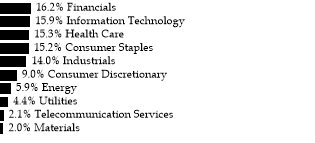
|
† Percentages based on total investments. |
|
Description | | Shares | | | Value | |
| | | | | | | | | |
COMMON STOCK — 91.6% | | | | | |
Consumer Discretionary — 8.3% | | | | | |
Dollar General | | | 14,246 | | | $ | 1,586,720 | |
Genuine Parts | | | 15,359 | | | | 1,503,953 | |
McDonald's | | | 9,391 | | | | 1,661,268 | |
Starbucks | | | 28,624 | | | | 1,667,920 | |
| | | | | | | | 6,419,861 | |
Consumer Staples — 13.9% | | | | | | | | |
Altria Group | | | 25,990 | | | | 1,690,389 | |
Diageo ADR | | | 10,888 | | | | 1,504,286 | |
Kimberly-Clark | | | 13,210 | | | | 1,377,803 | |
PepsiCo | | | 13,621 | | | | 1,530,728 | |
Procter & Gamble | | | 18,382 | | | | 1,630,116 | |
Sysco | | | 20,481 | | | | 1,460,910 | |
Walmart | | | 15,924 | | | | 1,596,859 | |
| | | | | | | | 10,791,091 | |
Energy — 5.4% | | | | | | | | |
Chevron | | | 12,873 | | | | 1,437,270 | |
Exxon Mobil | | | 19,066 | | | | 1,519,179 | |
Occidental Petroleum | | | 19,086 | | | | 1,280,098 | |
| | | | | | | | 4,236,547 | |
Financials — 14.9% | | | | | | | | |
Aflac | | | 32,852 | | | | 1,414,936 | |
CME Group, Cl A | | | 8,781 | | | | 1,609,030 | |
Eaton Vance | | | 29,056 | | | | 1,308,973 | |
FactSet Research Systems | | | 6,679 | | | | 1,494,493 | |
JPMorgan Chase | | | 13,348 | | | | 1,455,199 | |
Morgan Stanley | | | 31,203 | | | | 1,424,729 | |
US Bancorp | | | 28,245 | | | | 1,476,366 | |
Wells Fargo | | | 26,039 | | | | 1,386,056 | |
| | | | | | | | 11,569,782 | |
The accompanying notes are an integral part of the financial statements.
Cambria Investment Management
Schedule of Investments ● Cambria Core Equity ETF
October 31, 2018 (Unaudited)
Description | | Shares | | | Value | |
| | | | | | | | | |
Health Care — 14.1% | | | | | |
Abbott Laboratories | | | 22,842 | | | $ | 1,574,728 | |
Amgen | | | 7,636 | | | | 1,472,144 | |
Anthem | | | 5,773 | | | | 1,590,866 | |
Eli Lilly | | | 14,525 | | | | 1,575,091 | |
Johnson & Johnson | | | 11,353 | | | | 1,589,306 | |
Merck | | | 22,297 | | | | 1,641,282 | |
UnitedHealth Group | | | 5,688 | | | | 1,486,559 | |
| | | | | | | | 10,929,976 | |
| Industrials — 12.8% | | | | | | | | |
| 3M | | | 7,238 | | | | 1,377,102 | |
Emerson Electric | | | 19,919 | | | | 1,352,102 | |
Harris | | | 9,405 | | | | 1,398,617 | |
Lockheed Martin | | | 4,795 | | | | 1,409,011 | |
Norfolk Southern | | | 8,779 | | | | 1,473,380 | |
United Technologies | | | 11,592 | | | | 1,439,842 | |
Waste Management | | | 16,798 | | | | 1,502,917 | |
| | | | | | | | 9,952,971 | |
Information Technology — 14.5% | | | | | |
Accenture, Cl A | | | 9,033 | | | | 1,423,781 | |
Apple | | | 6,688 | | | | 1,463,736 | |
Broadridge Financial Solutions | | | 11,313 | | | | 1,322,942 | |
Cisco Systems | | | 32,075 | | | | 1,467,431 | |
Microsoft | | | 13,594 | | | | 1,451,975 | |
Oracle | | | 31,475 | | | | 1,537,239 | |
Paychex | | | 20,885 | | | | 1,367,759 | |
Texas Instruments | | | 13,550 | | | | 1,257,847 | |
| | | | | | | | 11,292,710 | |
Materials — 1.8% | | | | | |
Air Products & Chemicals | | | 9,162 | | | | 1,414,155 | |
| | | | | | | | | |
Telecommunication Services — 1.9% | | | | | |
AT&T | | | 47,930 | | | | 1,470,492 | |
| | | | | | | | | |
Utilities — 4.0% | | | | | |
NextEra Energy | | | 8,940 | | | | 1,542,150 | |
Southern | | | 34,631 | | | | 1,559,434 | |
| | | | | | | | 3,101,584 | |
Total Common Stock | | | | | | | | |
(Cost $63,857,570) | | | | | | | 71,179,169 | |
The accompanying notes are an integral part of the financial statements.
Cambria Investment Management
Schedule of Investments ● Cambria Core Equity ETF
October 31, 2018 (Unaudited)
Description | | Shares | | | Value | |
| | | | | | | | | |
Total Investments - 91.6% | | | | | | | | |
(Cost $63,857,570) | | | | | | $ | 71,179,169 | |
Other Assets and Liabilities – 8.4% | | | | | | | 6,499,034 | |
Net Assets – 100.0% | | | | | | $ | 77,678,203 | |
Description | | Contracts | | | Value | |
| | | | | | | | | |
PURCHASED OPTIONS — 7.2%(A) | | | | | |
Total Purchased Options | | | | | | | | |
(Cost $3,718,618) | | | 750 | | | $ | 5,564,750 | |
Description | | Contracts | | | Value | |
| | | | | | | | | |
WRITTEN OPTIONS — (1.6)%(A)‡* | | | | | |
Total Written Options | | | | | | | | |
(Cost $(1,134,072)) | | | 350 | | | | (1,238,750 | ) |
Percentages based on Net Assets.
* | Non-income producing securities |
‡ | For the period ended October 31, 2018, the average notional value of equity options held was $131,373,678 and the ending notional value of the equity purchased options held was $203,380,500. For the period ended October 31, 2018, the average notional value of equity written options held was $(71,869,840) and the ending notional value of equity written options held was $(94,910,900). |
(A) | Refer to table below for details on Options Contracts. |
ADR — American Depositary Receipt |
Cl — Class |
The accompanying notes are an integral part of the financial statements.
Cambria Investment Management
Schedule of Investments ● Cambria Core Equity ETF
October 31, 2018 (Unaudited)
A list of the exchange traded option contracts held by the Fund at April 30, 2018, is as follows:
| | | Contracts | | | Notional Amount | | | Value | |
| | | | | | | | | | | | | |
PURCHASED OPTIONS - 7.16% | |
Put Options | | | | | | | | | | | | |
SPX, Expires 11/19/2018, Strike Price $2,550 | | | 150 | | | $ | 40,676,100 | | | $ | 165,000 | |
SPX, Expires 11/19/2018, Strike Price $2,650 | | | 150 | | | | 40,676,100 | | | | 423,000 | |
SPX, Expires 12/24/2018, Strike Price $2,760 | | | 250 | | | | 67,793,500 | | | | 2,481,250 | |
SPX, Expires 12/24/2018, Strike Price $2,900 | | | 100 | | | | 27,117,400 | | | | 2,006,500 | |
Call Options | | | | | | | | | | | | |
SPX, Expires 11/19/2018, Strike Price $2,700 | | | 100 | | | | 27,117,400 | | | | 489,000 | |
Total Purchased Options | | | | | | | | | | | 5,564,750 | |
WRITTEN OPTIONS - (1.59)% | |
Call Options | | | | | | | | | | | | |
SPX, Expires 11/19/2018, Strike Price $2,750 | | | (100 | ) | | | (27,117,400 | ) | | | (235,000 | ) |
Put Options | | | | | | | | | | | | |
SPX, Expires 12/24/2018, Strike Price $2,600 | | | (250 | ) | | | (67,793,500 | ) | | | (1,003,750 | ) |
Total Written Options | | | | | | | | | | | (1,238,750 | ) |
The following is a list of the inputs used as of October 31, 2018 in valuing the Fund’s investments carried at value: |
Investments in Securities | | Level 1 | | | Level 2 | | | Level 3 | | | Total | |
Common Stock | | $ | 71,179,169 | | | $ | — | | | $ | — | | | $ | 71,179,169 | |
Total Investments in Securities | | $ | 71,179,169 | | | $ | — | | | $ | — | | | $ | 71.179,169 | |
Other Financial Instruments | | Level 1 | | | Level 2 | | | Level 3 | | | Total | |
Purchased Options | | $ | 5,564,750 | | | $ | — | | | $ | — | | | $ | 5,564,750 | |
Written Options | | | (1,238,750 | ) | | | — | | | | — | | | | (1,238,750 | ) |
Total Other Financial Instruments | | $ | 4,326,000 | | | $ | — | | | $ | — | | | $ | 4,326,000 | |
There have been no transfers between Level 1, Level 2 or Level 3 assets and liabilities. It is the Fund’s policy to recognize transfers into and out of all Levels at the end of the reporting period.
Please see Note 2 in Notes to Financial Statements for further information regarding fair value measurements.
The accompanying notes are an integral part of the financial statements.
Cambria Investment Management
Schedule of Investments ● Cambria Trinity ETF
October 31, 2018 (Unaudited)
Sector Weightings †: | |

| |
† Percentages based on total investments. | |
| |
Description | | Shares | | | Value | |
| | | | | | | | | |
EXCHANGE TRADED FUNDS — 97.6% | | | | | |
Alpha Architect Value Momentum Trend ETF | | | 9,394 | | | $ | 245,653 | |
Cambria Emerging Shareholder Yield ETF‡ | | | 17,457 | | | | 512,712 | |
Cambria Foreign Shareholder Yield ETF‡ | | | 21,747 | | | | 508,677 | |
Cambria Global Momentum ETF‡ | | | 172,304 | | | | 4,293,419 | |
Cambria Global Value ETF‡ | | | 23,320 | | | | 520,502 | |
Cambria Shareholder Yield ETF‡ | | | 13,420 | | | | 487,950 | |
Cambria Sovereign Bond ETF‡ | | | 33,176 | | | | 810,125 | |
Cambria Value and Momentum ETF‡ | | | 41,701 | | | | 995,511 | |
Invesco Optimum Yield Diversified Commodity Strategy No. K-1 ETF | | | 30,162 | | | | 535,074 | |
JPMorgan Managed Futures ETF | | | 22,198 | | | | 525,982 | |
Schwab US TIPs ETF | | | 4,961 | | | | 263,280 | |
SPDR FTSE International Government Inflation-Protected Bond ETF | | | 5,192 | | | | 271,178 | |
Vanguard Global ex-U.S. Real Estate ETF | | | 4,774 | | | | 252,688 | |
Vanguard Intermediate-Term Treasury ETF | | | 17,226 | | | | 1,067,151 | |
Vanguard Real Estate ETF | | | 3,212 | | | | 251,564 | |
Vanguard Total Bond Market ETF | | | 10,219 | | | | 795,447 | |
WisdomTree Managed Futures Strategy Fund | | | 13,321 | | | | 538,302 | |
| | | | | | | | | |
Total Exchange Traded Funds | | | | | | | | |
(Cost $13,384,323) | | | | | | | 12,875,215 | |
| | | | | | | | | |
Total Investments - 97.6% | | | | | | | | |
(Cost $13,384,323) | | | | | | $ | 12,875,215 | |
| | | | | | | | | |
Other Assets and Liabilities - 2.4% | | | | | | | 320,334 | |
Net Assets - 100.0% | | | | | | $ | 13,195,549 | |
Percentages based on Net Assets.
The accompanying notes are an integral part of the financial statements.
Cambria Investment Management
Schedule of Investments ● Cambria Trinity ETF
October 31, 2018 (Unaudited)
‡ | Affiliated investment is a registered investment company which is managed by Cambria Investment Management, L.P. (the "Investment Adviser") or an affiliate of the Investment Adviser or which is distributed by an affiliate of the Fund's distributor. |
Transactions with affiliated companies during the period ended October 31, 2018 are as follows:
Value of Shares Held as of 04/30/18 | | | Purchases at Cost | | | Proceeds from Sales | | | Unrealized Appreciation (Depreciation) | | | Realized Gain (Loss) | | | Value of Shares Held as of 10/31/18 | | | Dividend Income | |
Cambria Emerging Shareholder Yield ETF | | | | | | | | | | | | | | | | | |
| | - | | | $ | 542,700 | | | $ | - | | | $ | (29,988 | ) | | $ | - | | | $ | 512,712 | | | $ | 1,966 | |
Cambria Foreign Shareholder Yield ETF | | | | | | | | | | | | | | | | | |
| | - | | | | 540,997 | | | | - | | | | (32,300 | ) | | | - | | | | 508,677 | | | | 1,378 | |
| Cambria Global Momentun ETF | | | | | | | | | | | | | | | | | |
| | - | | | | 4,554,626 | | | | - | | | | (261,207 | ) | | | - | | | | 4,293,419 | | | | 3,581 | |
Cambria Global Value ETF | | | | | | | | | | | | | | | | | |
| | - | | | | 545,560 | | | | - | | | | (25,058 | ) | | | - | | | | 520,502 | | | | 1,586 | |
Cambria Sovereign Bond ETF | | | | | | | | | | | | | | | | | |
| | - | | | | 807,797 | | | | - | | | | 2,328 | | | | - | | | | 810,125 | | | | 2,285 | |
Cambria Shareholder Yield ETF | | | | | | | | | | | | | | | | | |
| | - | | | | 524,098 | | | | - | | | | (36,148 | ) | | | - | | | | 487,950 | | | | 1,438 | |
| Cambria Value & Momentum ETF | | | | | | | | | | | | | | | | | |
| | - | | | | 1,035,670 | | | | - | | | | (40,159 | ) | | | - | | | | 995,511 | | | | 585 | |
| $ | - | | | $ | 8,551,428 | | | $ | - | | | $ | (422,532 | ) | | $ | - | | | $ | 8,128,896 | | | $ | 12,820 | |
ETF — Exchanged Traded Fund |
FTSE — Financial Times Stock Exchange |
SPDR — Standard & Poor’s Depositary Receipt |
TIPS — Treasury Inflation Protected Security |
As of October 31, 2018, all of the Fund's investments were considered Level 1 in accordance with the authoritative guidance of fair value measurements and disclosure under U.S. generally accepted accounting principles. |
There have been no transfers between Level 1, Level 2 or Level 3 assets and liabilities. It is the Fund’s policy to recognize transfers into and out of all Levels at the end of the reporting period.
Please see Note 2 in Notes to Financial Statements for further information regarding fair value measurements.
The accompanying notes are an integral part of the financial statements.
Cambria Investment Management
Statements of Assets and Liabilities
October 31, 2018 (Unaudited)
| | | Cambria Shareholder Yield ETF | | | Cambria Foreign Shareholder Yield ETF | | | Cambria Global Value ETF | | | Cambria Global Momentum ETF | |
Assets: | | | | | | | | | | | | | | | | |
Investments at Fair Value | | $ | 124,658,711 | | | $ | 26,254,112 | | | $ | 138,000,861 | | | $ | 93,694,642 | |
Affiliated Investments at Value | | | — | | | | — | | | | — | | | | 12,039,589 | |
Foreign Currency at Value | | | 2,568 | | | | 160,836 | | | | 176,954 | | | | — | |
Cash and Cash Equivalents | | | 580,144 | | | | 223,858 | | | | 3,700,706 | | | | 1,681,288 | |
Dividends Receivable, Net | | | 115,898 | | | | 102,647 | | | | 130,639 | | | | — | |
Reclaims Receivable | | | 14,887 | | | | 145,392 | | | | 234,646 | | | | — | |
Receivable for Investment Securities Sold | | | — | | | | — | | | | 2,103,752 | | | | — | |
Total Assets | | | 125,372,208 | | | | 26,886,845 | | | | 144,347,558 | | | | 107,415,519 | |
| | | | | | | | | | | | | | | | | |
Liabilities: | | | | | | | | | | | | | | | | |
Payable Due to Investment Adviser | | | 65,445 | | | | 14,588 | | | | 74,613 | | | | 54,788 | |
Payable for Capital Shares Redeemed | | | — | | | | — | | | | 2,229,879 | | | | — | |
Custodian Fees Payable | | | — | | | | — | | | | 35,013 | | | | — | |
Total Liabilities | | | 65,445 | | | | 14,588 | | | | 2,339,505 | | | | 54,788 | |
Net Assets | | $ | 125,306,763 | | | $ | 26,872,257 | | | $ | 142,008,053 | | | $ | 107,360,731 | |
Net Assets Consist of: | | | | | | | | | | | | | | | | |
Paid-in Capital | | $ | 113,326,814 | | | $ | 30,309,984 | | | $ | 152,898,270 | | | $ | 110,151,501 | |
Total distributable earnings (loss) | | | 11,979,949 | | | | (3,437,727 | ) | | | (10,890,217 | ) | | | (2,790,770 | ) |
Net Assets | | $ | 125,306,763 | | | $ | 26,872,257 | | | $ | 142,008,053 | | | $ | 107,360,731 | |
Outstanding Shares of Beneficial Interest (unlimited authorization — no par value) | | | 3,450,000 | | | | 1,150,010 | | | | 6,350,010 | | | | 4,300,001 | |
Net Asset Value, Offering and Redemption Price Per Share | | $ | 36.32 | | | $ | 23.37 | | | $ | 22.36 | | | $ | 24.97 | |
Investments at Cost | | $ | 117,446,261 | | | $ | 29,460,448 | | | $ | 157,413,762 | | | $ | 95,688,367 | |
Affiliated Investments at Cost | | | ��� | | | | — | | | | — | | | | 12,860,569 | |
Cost of Foreign Currency | | | 2,598 | | | | 163,127 | | | | 177,825 | | | | — | |
The accompanying notes are an integral part of the financial statements.
Cambria Investment Management
Statements of Assets and Liabilities
October 31, 2018 (Unaudited)
| | | Cambria Global Asset Allocation ETF | | | Cambria Value and Momentum ETF | | | Cambria Sovereign Bond ETF | | | Cambria Emerging Shareholder Yield ETF | |
Assets: | | | | | | | | | | | | | | | | |
Investments at Fair Value | | $ | 42,338,606 | | | $ | 32,052,110 | | | $ | 17,428,693 | | | $ | 15,562,610 | |
Affiliated Investments at Value | | | 19,317,038 | | | | — | | | | — | | | | — | |
Foreign Currency at Value | | | — | | | | — | | | | 3,071 | | | | 83,553 | |
Cash and Cash Equivalents | | | 48,722 | | | | 4,096,582 | | | | 553,003 | | | | 345,259 | |
Interest Receivable | | | — | | | | — | | | | 299,246 | | | | — | |
Reclaims Receivable | | | — | | | | 95 | | | | — | | | | 10,593 | |
Dividends Receivable, Net | | | — | | | | 8,567 | | | | — | | | | 3,464 | |
Total Assets | | | 61,704,366 | | | | 36,157,354 | | | | 18,284,013 | | | | 16,005,479 | |
| | | | | | | | | | | | | | | | | |
Liabilities: | | | | | | | | | | | | | | | | |
Payable Due to Investment Adviser | | | — | | | | 18,732 | | | | 9,192 | | | | 8,306 | |
Variation Margin Payable | | | — | | | | 310,200 | | | | — | | | | — | |
Custodian Fees Payable | | | — | | | | — | | | | — | | | | 2,834 | |
Payable to Broker | | | — | | | | 14,074 | | | | — | | | | — | |
Total Liabilities | | | — | | | | 343,006 | | | | 9,192 | | | | 11,140 | |
Net Assets | | $ | 61,704,366 | | | $ | 35,814,348 | | | $ | 18,274,821 | | | $ | 15,994,339 | |
| | | | | | | | | | | | | | | | | |
Net Assets Consist of: | | | | | | | | | | | | | | | | |
Paid-in Capital | | $ | 64,278,881 | | | $ | 37,288,960 | | | $ | 20,408,204 | | | $ | 16,071,202 | |
Total distributable loss | | | (2,574,515 | ) | | | (1,474,612 | ) | | | (2,133,383 | ) | | | (76,863 | ) |
Net Assets | | $ | 61,704,366 | | | $ | 35,814,348 | | | $ | 18,274,821 | | | $ | 15,994,339 | |
Outstanding Shares of Beneficial Interest (unlimited authorization — no par value) | | | 2,400,001 | | | | 1,500,004 | | | | 750,000 | | | | 550,004 | |
Net Asset Value, Offering and Redemption Price Per Share | | $ | 25.71 | | | $ | 23.88 | | | $ | 24.37 | | | $ | 29.08 | |
| | | | | | | | | | | | | | | | | |
Investments at Cost | | $ | 43,633,648 | | | $ | 30,898,336 | | | $ | 19,744,039 | | | $ | 16,687,018 | |
Affiliated Investments at Cost | | | 20,982,420 | | | | — | | | | — | | | | — | |
Cost of Foreign Currency | | | — | | | | — | | | | 3,032 | | | | 84,525 | |
The accompanying notes are an integral part of the financial statements.
Cambria Investment Management
Statements of Assets and Liabilities
October 31, 2018 (Unaudited)
| | | Cambria Tail Risk ETF | | | Cambria Core Equity ETF | | | Cambria Trinity ETF | |
Assets: | | | | | | | | | | | | |
Investments at Fair Value | | $ | 20,513,050 | | | $ | 71,179,169 | | | $ | 4,746,319 | |
Affiliated Investments at Value | | | — | | | | — | | | | 8,128,896 | |
Purchased Options at Value | | | 2,253,830 | | | | 5,564,750 | | | | — | |
Cash and Cash Equivalents | | | 85,617 | | | | 1,817,949 | | | | 320,334 | |
Receivable for Investment Securities Sold | | | — | | | | 328,378 | | | | — | |
Reclaims Receivable | | | — | | | | 2,681 | | | | — | |
Interest Receivable | | | 104,541 | | | | — | | | | — | |
Dividends Receivable, Net | | | — | | | | 107,035 | | | | — | |
Total Assets | | | 22,957,038 | | | | 78,999,962 | | | | 13,195,549 | |
| | | | | | | | | | | | | |
Liabilities: | | | | | | | | | | | | |
Written Options at Value | | | — | | | | 1,238,750 | | | | — | |
Payable Due to Investment Adviser | | | 12,555 | | | | 69,125 | | | | — | |
Payable to Broker | | | — | | | | 13,884 | | | | — | |
Total Liabilities | | | 12,555 | | | | 1,321,759 | | | | — | |
Net Assets | | $ | 22,944,483 | | | $ | 77,678,203 | | | $ | 13,195,549 | |
| | | | | | | | | | | | | |
Net Assets Consist of: | | | | | | | | | | | | |
Paid-in Capital | | $ | 25,548,801 | | | $ | 78,861,935 | | | $ | 13,689,284 | |
Total distributable earnings loss | | | (2,604,318 | ) | | | (1,183,732 | ) | | | (493,735 | ) |
Net Assets | | $ | 22,944,483 | | | $ | 77,678,203 | | | $ | 13,195,549 | |
Outstanding Shares of Beneficial Interest (unlimited authorization — no par value) | | | 1,100,002 | | | | 3,000,002 | | | | 550,002 | |
Net Asset Value, Offering and Redemption Price Per Share | | $ | 20.86 | | | $ | 25.89 | | | $ | 23.99 | |
| | | | | | | | | | | | | |
Investments at Cost | | $ | 21,169,381 | | | $ | 63,857,570 | | | $ | 4,832,895 | |
Affiliated Investments at Cost | | | — | | | | — | | | | 8,551,428 | |
Cost of Purchased Options | | | 2,236,839 | | | | 3,718,618 | | | | — | |
Cost of Written Options | | | — | | | | 1,134,072 | | | | — | |
The accompanying notes are an integral part of the financial statements.
Cambria Investment Management
Statements of Operations
For the period ended October 31, 2018 (Unaudited)
| | | Cambria Shareholder Yield ETF | | | Cambria Foreign Shareholder Yield ETF | | | Cambria Global Value ETF | | | Cambria Global Momentum ETF | | | Cambria Global Asset Allocation ETF | |
Investment Income: | | | | | | | | | | | | | | | | | | | | |
Dividend Income from Unaffiliated Investments | | $ | 1,971,188 | | | $ | 1,236,598 | | | $ | 3,950,299 | | | $ | 1,122,778 | | | $ | 544,981 | |
Dividend Income from Affiliated Investments | | | — | | | | — | | | | — | | | | 338,169 | | | | 438,063 | |
Interest Income | | | 9,546 | | | | 142 | | | | 3,566 | | | | 15,826 | | | | 2,099 | |
Less: Foreign Taxes Withheld | | | (127 | ) | | | (120,908 | ) | | | (547,985 | ) | | | — | | | | — | |
Total Investment Income | | | 1,980,607 | | | | 1,115,832 | | | | 3,405,880 | | | | 1,476,773 | | | | 985,143 | |
Management Fees | | | 405,859 | | | | 124,034 | | | | 496,814 | | | | 331,054 | | | | — | |
Custodian Fees | | | — | | | | — | | | | 73,690 | | | | — | | | | — | |
Total Expenses | | | 405,859 | | | | 124,034 | | | | 570,504 | | | | 331,054 | | | | — | |
Net Investment Income | | | 1,574,748 | | | | 991,798 | | | | 2,835,376 | | | | 1,145,719 | | | | 985,143 | |
| | | | | | | | | | | | | | | | | | | | | |
Net Realized and Unrealized Gains (Losses) on Investments: | | | | | | | | | | | | | | | | | | | | |
Net Realized Gain on Unaffiliated Investments(1) | | | 5,730,065 | | | | 2,093,919 | | | | 5,836,951 | | | | 323,445 | | | | 153,674 | |
Net Realized Gain on Affiliated Investments(1) | | | — | | | | — | | | | — | | | | 1,346,049 | | | | 156,158 | |
Net Realized Gain (Loss) on Foreign Currency Transactions | | | 447 | | | | (72,977 | ) | | | (398,576 | ) | | | — | | | | — | |
Net Change in Unrealized Depreciation on Unaffiliated Investments | | | (11,079,466 | ) | | | (6,628,137 | ) | | | (31,545,565 | ) | | | (8,080,244 | ) | | | (1,429,222 | ) |
Net Change in Unrealized Depreciation on Affiliated Investments | | | — | | | | — | | | | — | | | | (4,124,885 | ) | | | (3,155,834 | ) |
Net Change in Unrealized Appreciation (Depreciation) on Foreign Currency Translation | | | (75 | ) | | | (2,816 | ) | | | 35,839 | | | | — | | | | — | |
Net Realized and Unrealized Loss on Investments | | | (5,349,029 | ) | | | (4,610,011 | ) | | | (26,071,351 | ) | | | (10,535,635 | ) | | | (4,275,224 | ) |
Net Decrease in Net Assets Resulting from Operations | | $ | (3,774,281 | ) | | $ | (3,618,213 | ) | | $ | (23,235,975 | ) | | $ | (9,389,916 | ) | | $ | (3,290,081 | ) |
(1) | Includes realized gain as a result of in-kind transactions. (See Note 5 in Notes to Financial Statements). |
The accompanying notes are an integral part of the financial statements.
Cambria Investment Management
Statements of Operations
For the period ended October 31, 2018 (Unaudited)
| | | Cambria Value and Momentum ETF | | | Cambria Sovereign Bond ETF | | | Cambria Emerging Shareholder Yield ETF | | | Cambria Tail Risk ETF | | | Cambria Core Equity ETF | | | Cambria Trinity ETF(1) | |
Investment Income: | | | | | | | | | | | | | | | | | | | | | | | | |
Dividend Income from Unaffiliated Investments | | $ | 239,822 | | | $ | — | | | $ | 778,080 | | | $ | — | | | $ | 1,055,709 | | | $ | 3,650 | |
Dividend Income from Affiliated Investments | | | — | | | | — | | | | — | | | | — | | | | — | | | | 12,820 | |
Interest Income | | | 2,819 | | | | 490,478 | | | | 6,153 | | | | 299,943 | | | | 5,004 | | | | — | |
Less: Foreign Taxes Withheld | | | (302 | ) | | | (12,674 | ) | | | (96,041 | ) | | | — | | | | — | | | | — | |
Total Investment Income | | | 242,339 | | | | 477,804 | | | | 688,192 | | | | 299,943 | | | | 1,060,713 | | | | 16,470 | |
Management Fees | | | 117,464 | | | | 55,574 | | | | 63,072 | | | | 70,611 | | | | 428,684 | | | | — | |
Broker Expense | | | 9,997 | | | | — | | | | — | | | | — | | | | 94,059 | | | | — | |
Custodian Fees | | | — | | | | — | | | | 6,490 | | | | — | | | | — | | | | — | |
Total Expenses | | | 127,461 | | | | 55,574 | | | | 69,562 | | | | 70,611 | | | | 522,743 | | | | — | |
Net Investment Income | | | 114,878 | | | | 422,230 | | | | 618,630 | | | | 229,332 | | | | 537,970 | | | | 16,470 | |
| | | | | | | | | | | | | | | | | | | | | | | | | |
Net Realized and Unrealized Gains (Losses) on Investments: | | | | | | | | | | | | | | | | | | | | | | | | |
Net Realized Gain (Loss) on Unaffiliated Investments(2) | | | (301,820 | ) | | | 78,144 | | | | 1,265,705 | | | | (300,498 | ) | | | 3,452,454 | | | | — | |
Net Realized Loss on Purchased Options | | | — | | | | — | | | | — | | | | — | | | | (2,548,956 | ) | | | — | |
Net Realized Loss on Written Options | | | — | | | | — | | | | — | | | | (669,993 | ) | | | — | | | | — | |
Net Realized Loss on Futures Contracts | | | (1,691,271 | ) | | | — | | | | — | | | | — | | | | — | | | | — | |
Net Realized Loss on Foreign Currency Transactions | | | — | | | | (59,791 | ) | | | (192,616 | ) | | | — | | | | — | | | | — | |
Net Change in Unrealized Appreciation (Depreciation) on Unaffiliated Investments | | | (1,109,409 | ) | | | (2,437,023 | ) | | | (5,460,219 | ) | | | (18,931 | ) | | | 1,272,423 | | | | (86,576 | ) |
Net Change in Unrealized Depreciation on Affiliated Investments | | | — | | | | — | | | | — | | | | — | | | | — | | | | (422,532 | ) |
Net Change in Unrealized Gain on Purchased Options | | | — | | | | — | | | | — | | | | 284,719 | | | | 2,048,059 | | | | — | |
Net Change in Unrealized Appreciation on Futures Contracts | | | 709,145 | | | | — | | | | — | | | | — | | | | — | | | | — | |
Change in Accumulated Foreign Capital Gains Tax on Appreciated Securities | | | — | | | | — | | | | 18,247 | | | | — | | | | — | | | | — | |
Net Change in Unrealized Appreciation on Foreign Currency Translation | | | — | | | | 4,258 | | | | 1,624 | | | | — | | | | — | | | | — | |
Net Realized and Unrealized Gain (Loss) on Investments | | | (2,393,355 | ) | | | (2,414,412 | ) | | | (4,367,259 | ) | | | (704,703 | ) | | | 4,223,980 | | | | (509,108 | ) |
Net Increase (Decrease) in Net Assets Resulting from Operations | | $ | (2,278,477 | ) | | $ | (1,992,182 | ) | | $ | (3,748,629 | ) | | $ | (475,371 | ) | | $ | 4,761,950 | | | $ | (492,638 | ) |
(1) | Commenced operations on September 7, 2018. |
(2) | Includes realized gain or loss as a result of in-kind transactions. (See Note 5 in Notes to Financial Statements). |
The accompanying notes are an integral part of the financial statements.
Cambria Investment Management
Statements of Changes in Net Assets
| | | Cambria Shareholder Yield ETF | | | Cambria Foreign Shareholder Yield ETF | |
| | | Period Ended October 31, 2018 | | | Year Ended April 30, 2018 | | | Period Ended October 31, 2018 | | | Year Ended April 30, 2018 | |
Operations: | | | | | | | | | | | | | | | | |
Net Investment Income | | $ | 1,574,748 | | | $ | 2,350,934 | | | $ | 991,798 | | | $ | 1,295,312 | |
Net Realized Gain on Investments (1) | | | 5,730,065 | | | | 13,837,663 | | | | 2,093,919 | | | | 3,896,273 | |
Net Realized Gain (Loss) on Foreign Currency Transactions | | | 447 | | | | — | | | | (72,977 | ) | | | 12,559 | |
Net Change in Unrealized Appreciation (Depreciation) on Investments and Futures Contracts | | | (11,079,466 | ) | | | (818,584 | ) | | | (6,628,137 | ) | | | 3,102,127 | |
Net Change in Unrealized Appreciation (Depreciation) on Foreign Currency Translation | | | (75 | ) | | | 108 | | | | (2,816 | ) | | | (1,420 | ) |
Net Increase (Decrease) in Net Assets Resulting from Operations | | | (3,774,281 | ) | | | 15,370,121 | | | | (3,618,213 | ) | | | 8,304,851 | |
Distributions(2) | | | (1,847,915 | ) | | | (2,080,232 | ) | | | (1,050,346 | ) | | | (1,437,092 | ) |
| | | | | | | | | | | | | | | | | |
Capital Share Transactions: | | | | | | | | | | | | | | | | |
Issued | | | 17,676,197 | | | | 63,832,194 | | | | — | | | | 3,738,985 | |
Redeemed | | | (29,187,082 | ) | | | (60,364,569 | ) | | | (14,970,127 | ) | | | (6,700,708 | ) |
Increase (Decrease) in Net Assets from Capital Share Transactions | | | (11,510,885 | ) | | | 3,467,625 | | | | (14,970,127 | ) | | | (2,961,723 | ) |
Total Increase (Decrease) in Net Assets | | | (17,133,081 | ) | | | 16,757,514 | | | | (19,638,686 | ) | | | 3,906,036 | |
Net Assets: | | | | | | | | | | | | | | | | |
Beginning of Period | | | 142,439,844 | | | | 125,682,330 | | | | 46,510,943 | | | | 42,604,907 | |
| End of Period | | $ | 125,306,763 | (*) | | $ | 142,439,844 | (*) | | $ | 26,872,257 | (†) | | $ | 46,510,943 | (†) |
| | | | | | | | | | | | | | | | | |
Share Transactions: | | | | | | | | | | | | | | | | |
Issued | | | 450,000 | | | | 1,700,000 | | | | — | | | | 150,000 | |
Redeemed | | | (750,000 | ) | | | (1,650,000 | ) | | | (600,000 | ) | | | (250,000 | ) |
Net Increase (Decrease) in Shares Outstanding from Share Transactions | | | (300,000 | ) | | | 50,000 | | | | (600,000 | ) | | | (100,000 | ) |
(1) | May include realized gain as a result of in-kind transactions. (see Note 5). |
(2) | Current year presentation of distributions conforms with S-X Disclosure Simplification. Prior year distributions have been consolidated to conform with S-X Disclosure Simplification (see Note 9). |
(*) | Includes undistributed net investment income of $417,886, in the year ended April 30, 2018. The SEC eliminated the requirement to disclose undistributed net investment income effective for periods after November 5, 2018 (see Note 9). |
(†) | Includes undistributed net investment income of $232,798, in the year ended April 30, 2018. The SEC eliminated the requirement to disclose undistributed net investment income effective for periods after November 5, 2018 (see Note 9). |
The accompanying notes are an integral part of the financial statements.
Cambria Investment Management
Statements of Changes in Net Assets
| | | Cambria Global Value ETF | | | Cambria Global Momentum ETF | |
| | | Period Ended October 31, 2018 | | | Year Ended April 30, 2018 | | | Period Ended October 31, 2018 | | | Year Ended April 30, 2018 | |
Operations: | | | | | | | | | | | | | | | | |
Net Investment Income | | $ | 2,835,376 | | | $ | 3,701,640 | | | $ | 1,145,719 | | | $ | 1,311,262 | |
Net Realized Gain on Investments(1) | | | 5,836,951 | | | | 3,448,834 | | | | 1,669,494 | | | | 1,959,838 | |
Net Realized Loss on Foreign Currency Transactions | | | (398,576 | ) | | | (69,515 | ) | | | — | | | | — | |
Capital Gain Distribution Received from Unaffiliated and Affiliated Investments | | | — | | | | — | | | | — | | | | 3,174 | |
Net Change in Unrealized Appreciation (Depreciation) on Investments and Affiliated Investments | | | (31,545,565 | ) | | | 14,883,636 | | | | (12,205,129 | ) | | | 5,663,596 | |
Net Change in Unrealized Appreciation (Depreciation) on Foreign Currency Translation | | | 35,839 | | | | (1,677 | ) | | | — | | | | — | |
Net Increase (Decrease) in Net Assets Resulting from Operations | | | (23,235,975 | ) | | | 21,962,918 | | | | (9,389,916 | ) | | | 8,937,870 | |
Distributions(2). | | | (3,035,960 | ) | | | (3,023,213 | ) | | | (909,871 | ) | | | (1,446,903 | ) |
| | | | | | | | | | | | | | | | | |
Capital Share Transactions: | | | | | | | | | | | | | | | | |
Issued | | | — | | | | 79,845,297 | | | | 16,173,778 | | | | 38,638,611 | |
Redeemed | | | (42,695,138 | ) | | | — | | | | (3,970,697 | ) | | | — | |
Increase (Decrease) in Net Assets from Capital Share Transactions | | | (42,695,138 | ) | | | 79,845,297 | | | | 12,203,081 | | | | 38,638,611 | |
Total Increase (Decrease) in Net Assets | | | (68,967,073 | ) | | | 98,785,002 | | | | 1,903,294 | | | | 46,129,578 | |
Net Assets: | | | | | | | | | | | | | | | | |
Beginning of Period | | | 210,975,126 | | | | 112,190,124 | | | | 105,457,437 | | | | 59,327,859 | |
| End of Period | | $ | 142,008,053 | (*) | | $ | 210,975,126 | (*) | | $ | 107,360,731 | (†) | | $ | 105,457,437 | (†) |
| | | | | | | | | | | | | | | | | |
Share Transactions: | | | | | | | | | | | | | | | | |
Issued | | | — | | | | 3,150,000 | | | | 600,000 | | | | 1,450,000 | |
Redeemed | | | (1,750,000 | ) | | | — | | | | (150,000 | ) | | | — | |
Net Increase (Decrease) in Shares Outstanding from Share Transactions. | | | (1,750,000 | ) | | | 3,150,000 | | | | 450,000 | | | | 1,450,000 | |
(1) | May include realized gain as a result of in-kind transactions. (see Note 5). |
(2) | Current year presentation of distributions conforms with S-X Disclosure Simplification. Prior year distributions have been consolidated to conform with S-X Disclosure Simplification (see Note 9). |
(*) | Includes undistributed net investment income of $1,064,941, in the year ended April 30, 2018. The SEC eliminated the requirement to disclose undistributed net investment income effective for periods after November 5, 2018 (see Note 9). |
(†) | Includes distributions in excess of net investment income of $(133,083), in the year ended April 30, 2018. The SEC eliminated the requirement to disclose undistributed net investment income effective for periods after November 5, 2018 (see Note 9). |
The accompanying notes are an integral part of the financial statements.
Cambria Investment Management
Statements of Changes in Net Assets
| | | Cambria Global Asset Allocation ETF | | | Cambria Value and Momentum ETF | |
| | | Period Ended October 31, 2018 | | | Year Ended April 30, 2018 | | | Period Ended October 31, 2018 | | | Year Ended April 30, 2018 | |
Operations: | | | | | | | | | | | | | | | | |
Net Investment Income | | $ | 985,143 | | | $ | 1,364,978 | | | $ | 114,878 | | | $ | 135,647 | |
Net Realized Gain (Loss) on Investments and Futures Contracts(1) | | | 309,832 | | | | 2,119,701 | | | | (1,993,091 | ) | | | (752,196 | ) |
Capital Gain Distributions Received from Unaffiliated and Affiliated Investments | | | — | | | | 6,269 | | | | — | | | | — | |
Net Change in Unrealized Appreciation (Depreciation) on Investments and Futures Contracts | | | (4,585,056 | ) | | | 406,387 | | | | (400,264 | ) | | | 1,705,076 | |
Net Increase (Decrease) in Net Assets Resulting from Operations | | | (3,290,081 | ) | | | 3,897,335 | | | | (2,278,477 | ) | | | 1,088,527 | |
Distributions(1) | | | (899,810 | ) | | | (1,360,015 | ) | | | (165,603 | ) | | | (81,069 | ) |
| | | | | | | | | | | | | | | | | |
Capital Share Transactions: | | | | | | | | | | | | | | | | |
Issued | | | 4,091,968 | | | | 49,388,670 | | | | 11,711,584 | | | | 23,318,747 | |
Redeemed | | | (5,270,292 | ) | | | (22,035,804 | ) | | | (6,070,228 | ) | | | (25 | ) |
Increase (Decrease) in Net Assets from Capital Share Transactions | | | (1,178,324 | ) | | | 27,352,866 | | | | 5,641,356 | | | | 23,318,722 | |
Total Increase (Decrease) in Net Assets | | | (5,368,215 | ) | | | 29,890,186 | | | | 3,197,276 | | | | 24,326,180 | |
Net Assets: | | | | | | | | | | | | | | | | |
Beginning of Period | | | 67,072,581 | | | | 37,182,395 | | | | 32,617,072 | | | | 8,290,892 | |
| End of Period | | $ | 61,704,366 | (*) | | $ | 67,072,581 | (*) | | $ | 35,814,348 | (†) | | $ | 32,617,072 | (†) |
| | | | | | | | | | | | | | | | | |
Share Transactions: | | | | | | | | | | | | | | | | |
Issued | | | 150,000 | | | | 1,800,000 | | | | 450,000 | | | | 950,000 | |
Redeemed | | | (200,000 | ) | | | (800,000 | ) | | | (250,000 | ) | | | — | |
Net Increase (Decrease) in Shares Outstanding from Share Transactions | | | (50,000 | ) | | | 1,000,000 | | | | 200,000 | | | | 950,000 | |
(1) | May include realized gain as a result of in-kind transactions. (see Note 5). |
(2) | Current year presentation of distributions conforms with S-X Disclosure Simplification. Prior year distributions have been consolidated to conform with S-X Disclosure Simplification (see Note 9). |
(*) | Includes undistributed net investment income of $16,263, in the year ended April 30, 2018. The SEC eliminated the requirement to disclose undistributed net investment income effective for periods after November 5, 2018 (see Note 9). |
(†) | Includes undistributed net investment income of $54,732, in the year ended April 30, 2018. The SEC eliminated the requirement to disclose undistributed net investment income effective for periods after November 5, 2018 (see Note 9). |
The accompanying notes are an integral part of the financial statements.
Cambria Investment Management
Statements of Changes in Net Assets
| | | Cambria Sovereign Bond ETF | | | Cambria Emerging Shareholder Yield ETF | |
| | | Period Ended October 31, 2018 | | | Year Ended April 30, 2018 | | | Period Ended October 31, 2018 | | | Year Ended April 30, 2018 | |
Operations: | | | | | | | | | | | | | | | | |
Net Investment Income | | $ | 422,230 | | | $ | 667,083 | | | $ | 618,630 | | | $ | 608,768 | |
Net Realized Gain (Loss) on Investments(1) | | | 78,144 | | | | 40,235 | | | | 1,265,705 | | | | (90,440 | ) |
Net Realized Gain (Loss) on Foreign Currency Transactions | | | (59,791 | ) | | | 13,300 | | | | (192,616 | ) | | | (21,927 | ) |
Net Change in Unrealized Appreciation (Depreciation) on Investments | | | (2,437,023 | ) | | | (126,471 | ) | | | (5,460,219 | ) | | | 3,329,688 | |
Net Change in Unrealized Appreciation (Depreciation) on Foreign Currency Translation | | | 4,258 | | | | (11,903 | ) | | | 1,624 | | | | (5,016 | ) |
Net Change in Unrealized Appreciation (Depreciation) on Foreign Capital Tax Gains on Appreciated Securities | | | — | | | | 364 | | | | 18,247 | | | | 12,004 | |
Net Increase (Decrease) in Net Assets Resulting from Operations | | | (1,992,182 | ) | | | 582,608 | | | | (3,748,629 | ) | | | 3,833,077 | |
Distributions(2) | | | (332,839 | ) | | | (732,219 | ) | | | (541,643 | ) | | | (509,874 | ) |
| | | | | | | | | | | | | | | | | |
Capital Share Transactions: | | | | | | | | | | | | | | | | |
Issued | | | 1,300,843 | | | | 9,927,241 | | | | 1,756,874 | | | | 15,375,863 | |
Redeemed | | | — | | | | — | | | | (11,930,118 | ) | | | — | |
Increase (Decrease) in Net Assets from Capital Share Transactions | | | 1,300,843 | | | | 9,927,241 | | | | (10,173,244 | ) | | | 15,375,863 | |
Total Increase (Decrease) in Net Assets | | | (1,024,178 | ) | | | 9,777,630 | | | | (14,463,516 | ) | | | 18,699,066 | |
Net Assets: | | | | | | | | | | | | | | | | |
Beginning of Period | | | 19,298,999 | | | | 9,521,369 | | | | 30,457,855 | | | | 11,758,789 | |
| End of Period | | $ | 18,274,821 | (*) | | $ | 19,298,999 | (*) | | $ | 15,994,339 | (†) | | $ | 30,457,855 | (†) |
| | | | | | | | | | | | | | | | | |
Share Transactions: | | | | | | | | | | | | | | | | |
Issued | | | 50,000 | | | | 350,000 | | | | 50,000 | | | | 450,000 | |
Redeemed | | | — | | | | — | | | | (350,000 | ) | | | — | |
Net Increase (Decrease) in Shares Outstanding from Share Transactions | | | 50,000 | | | | 350,000 | | | | (300,000 | ) | | | 450,000 | |
(1) | May include realized gain as a result of in-kind transactions. (see Note 5). |
(2) | Current year presentation of distributions conforms with S-X Disclosure Simplification. Prior year distributions have been consolidated to conform with S-X Disclosure Simplification (see Note 9). |
(*) | Includes undistributed net investment income of $82,499, in the year ended April 30, 2018. The SEC eliminated the requirement to disclose undistributed net investment income effective for periods after November 5, 2018 (see Note 9). |
(†) | Includes undistributed net investment income of $123,080, in the year ended April 30, 2018. The SEC eliminated the requirement to disclose undistributed net investment income effective for periods after November 5, 2018 (see Note 9). |
The accompanying notes are an integral part of the financial statements.
Cambria Investment Management
Statements of Changes in Net Assets
| | | Cambria Tail Risk ETF | | | Cambria Core Equity ETF | |
| | | Period Ended October 31, 2018 | | | Year Ended April 30, 2018 | | | Period Ended October 31, 2018 | | | Period Ended April 30, 2018(1) | |
Operations: | | | | | | | | | | | | | | | | |
Net Investment Income | | $ | 229,332 | | | $ | 213,444 | | | $ | 537,970 | | | $ | 1,393,619 | |
Net Realized Gain(Loss) on Investments, Purchase and Written Options(2) | | | (970,491 | ) | | | (1,046,483 | ) | | | 903,498 | | | | (7,503,528 | ) |
Net Change in Unrealized Appreciation (Depreciation) on Investments and Futures Purchase Options | | | 265,788 | | | | (875,601 | ) | | | 3,320,482 | | | | 5,742,571 | |
Net Increase (Decrease) in Net Assets Resulting from Operations | | | (475,371 | ) | | | (1,708,640 | ) | | | 4,761,950 | | | | (367,338 | ) |
Distributions(3) | | | (217,178 | ) | | | (176,882 | ) | | | (1,021,654 | ) | | | (1,347,551 | ) |
| | | | | | | | | | | | | | | | | |
Capital Share Transactions: | | | | | | | | | | | | | | | | |
Issued | | | 5,168,232 | | | | 27,787,067 | | | | — | | | | 126,953,408 | |
Redeemed | | | (4,188,939 | ) | | | (5,717,609 | ) | | | (13,742,796 | ) | | | (37,557,816 | ) |
Increase (Decrease) in Net Assets from Capital Share Transactions | | | 979,293 | | | | 22,069,458 | | | | (13,742,796 | ) | | | 89,395,592 | |
Total Increase (Decrease) in Net Assets | | | 286,744 | | | | 20,183,936 | | | | (10,002,500 | ) | | | 87,680,703 | |
Net Assets: | | | | | | | | | | | | | | | | |
Beginning of Period | | | 22,657,739 | | | | 2,473,803 | | | | 87,680,703 | | | | — | |
| End of Period | | $ | 22,944,483 | (*) | | $ | 22,657,739 | (*) | | $ | 77,678,203 | (†) | | $ | 87,680,703 | (†) |
| | | | | | | | | | | | | | | | | |
Share Transactions: | | | | | | | | | | | | | | | | |
Issued | | | 250,000 | | | | 1,200,000 | | | | — | | | | 5,050,002 | |
Redeemed | | | (200,000 | ) | | | (250,000 | ) | | | (550,000 | ) | | | (1,500,000 | ) |
Net Increase (Decrease) in Shares Outstanding from Share Transactions | | | 50,000 | | | | 950,000 | | | | (550,000 | ) | | | 3,550,002 | |
(1) | Inception date May 23, 2017. |
(2) | May include realized gain as a result of in-kind transactions. (see Note 5). |
(3) | Current year presentation of distributions conforms with S-X Disclosure Simplification. Prior year distributions have been consolidated to conform with S-X Disclosure Simplification (see Note 9). |
(*) | Includes undistributed net investment income of $38,840, in the year ended April 30, 2018. The SEC eliminated the requirement to disclose undistributed net investment income effective for periods after November 5, 2018 (see Note 9). |
(†) | Includes undistributed net investment income of $ —, in the year ended April 30, 2018. The SEC eliminated the requirement to disclose undistributed net investment income effective for periods after November 5, 2018 (see Note 9). |
The accompanying notes are an integral part of the financial statements.
Cambria Investment Management
Statements of Changes in Net Assets
| | | Cambria Trinity ETF | |
| | | Period Ended October 31, 2018(1) | |
Operations: | | | | |
Net Investment Income | | $ | 16,470 | |
Net Change in Unrealized Depreciation on Investments | | | (509,108 | ) |
Net Decrease in Net Assets Resulting from Operations | | | (492,638 | ) |
Distributions (2) | | | (1,097 | ) |
Capital Share Transactions: | | | | |
Issued | | | 13,689,284 | |
Increase in Net Assets from Capital Share Transactions | | | 13,689,284 | |
Total Increase in Net Assets | | | 13,195,524 | |
Net Assets: | | | | |
Beginning of Period | | | — | |
End of Period | | $ | 13,195,549 | |
Share Transactions: | | | | |
Issued | | | 550,002 | |
Net Increase in Shares Outstanding from Share Transactions | | | 550,002 | |
(1) | Inception date September 7, 2018. |
(2) | Current year presentation of distributions conforms with S-X Disclosure Simplification. |
The accompanying notes are an integral part of the financial statements.
Cambria Investment Management
Financial Highlights
Selected Per Share Data & Ratios
For a Share Outstanding Throughout the Year/Period
| | | Net Asset Value, Beginning of Year/Period | | Net Investment Income* | | Net Realized and Unrealized Gain (Loss) on Investments | | | Total from Operations | | | Distributions from Investment Income | | | Distributions from Net Realized Capital Gains | | | Return of Capital | | | Total Distributions | | | Net Asset Value, End of Year/Period | | Total Return(1) | | | Net Assets End of Year/Period (000) | | Ratio of Expenses to Average Net Assets(2) | | | Ratio of Net Investment Income to Average Net Assets | | | Portfolio Turnover(1)(3) | |
Cambria Shareholder Yield ETF | |
10/31/2018** | | $ | 37.98 | | $ | 0.45 | | $ | (1.58 | ) | | $ | (1.13 | ) | | $ | (0.53 | ) | | $ | — | | | $ | — | | | $ | (0.53 | ) | | $ | 36.32 | | | (3.06 | )% | | $ | 125,307 | | | 0.59% | (4) | | | 2.29% | (4) | | | 7 | % |
2018 | | $ | 33.97 | | $ | 0.64 | | $ | 3.94 | | | $ | 4.58 | | | $ | (0.54 | ) | | $ | (0.03 | ) | | $ | — | | | $ | (0.57 | ) | | $ | 37.98 | | | 13.58 | % | | $ | 142,440 | | | 0.59 | % | | | 1.77 | % | | | 16 | % |
2017 | | $ | 28.62 | | $ | 0.50 | | $ | 5.35 | | | $ | 5.85 | | | $ | (0.50 | ) | | $ | — | | | $ | — | | | $ | (0.50 | ) | | $ | 33.97 | | | 20.62 | % | | $ | 125,682 | | | 0.59 | % | | | 1.63 | % | | | 50 | % |
2016 | | $ | 31.54 | | $ | 0.64 | | $ | (1.45 | ) | | $ | (0.81 | ) | | $ | (0.69 | ) | | $ | (1.39 | ) | | $ | (0.03 | ) | | $ | (2.11 | ) | | $ | 28.62 | | | (2.59 | )% | | $ | 137,397 | | | 0.59 | % | | | 2.10 | % | | | 43 | % |
2015 | | $ | 29.95 | | $ | 0.65 | | $ | 2.29 | | | $ | 2.94 | | | $ | (0.55 | ) | | $ | (0.80 | ) | | $ | — | | | $ | (1.35 | ) | | $ | 31.54 | | | 9.92 | % | | $ | 227,096 | | | 0.59 | % | | | 2.09 | % | | | 41 | % |
| 2014(5) | | $ | 25.00 | | $ | 0.45 | | $ | 4.98 | | | $ | 5.43 | | | $ | (0.36 | ) | | $ | (0.12 | ) | | $ | — | | | $ | (0.48 | ) | | $ | 29.95 | | | 21.81 | % | | $ | 205,156 | | | 0.59% | (4) | | | 1.67% | (4) | | | 89 | % |
Cambria Foreign Shareholder Yield ETF | |
10/31/2018** | | $ | 26.58 | | $ | 0.61 | | $ | (3.19 | ) | | $ | (2.58 | ) | | $ | (0.63 | ) | | $ | — | | | $ | — | | | $ | (0.63 | ) | | $ | 23.37 | | | (9.89 | )% | | $ | 26,872 | | | 0.59% | (4) | | | 4.72% | (4) | | | 27 | % |
2018 | | $ | 23.03 | | $ | 0.70 | | $ | 3.60 | | | $ | 4.30 | | | $ | (0.75 | ) | | $ | — | | | $ | — | | | $ | (0.75 | ) | | $ | 26.58 | | | 19.03 | % | | $ | 46,511 | | | 0.59 | % | | | 2.78 | % | | | 44 | % |
2017 | | $ | 21.20 | | $ | 0.81 | | $ | 1.59 | | | $ | 2.40 | | | $ | (0.57 | ) | | $ | — | | | $ | — | | | $ | (0.57 | ) | | $ | 23.03 | | | 11.93 | % | | $ | 42,605 | | | 0.59 | % | | | 3.80 | % | | | 43 | % |
2016 | | $ | 23.80 | | $ | 0.81 | | $ | (2.61 | ) | | $ | (1.80 | ) | | $ | (0.68 | ) | | $ | — | | | $ | (0.12 | ) | | $ | (0.80 | ) | | $ | 21.20 | | | (7.67 | )% | | $ | 26,495 | | | 0.59 | % | | | 3.83 | % | | | 53 | % |
2015 | | $ | 26.63 | | $ | 0.93 | | $ | (2.70 | ) | | $ | (1.77 | ) | | $ | (0.77 | ) | | $ | (0.29 | ) | | $ | — | | | $ | (1.06 | ) | | $ | 23.80 | | | (6.67 | )% | | $ | 60,694 | | | 0.59 | % | | | 3.76 | % | | | 48 | % |
| 2014(6) | | $ | 25.00 | | $ | 0.41 | | $ | 1.33 | | | $ | 1.74 | | | $ | (0.11 | ) | | $ | — | | | $ | — | | | $ | (0.11 | ) | | $ | 26.63 | | | 6.96 | % | | $ | 66,572 | | | 0.59% | (4) | | | 3.91% | (4) | | | 15 | % |
Cambria Global Value ETF | |
10/31/2018** | | $ | 26.05 | | $ | 0.41 | | $ | (3.66 | ) | | $ | (3.25 | ) | | $ | (0.44 | ) | | $ | — | | | $ | — | | | $ | (0.44 | ) | | $ | 22.36 | | | (12.57 | )% | | $ | 142,008 | | | 0.68% | (4) | | | 3.37% | (4) | | | — | % |
2018 | | $ | 22.66 | | $ | 0.56 | | $ | 3.34 | | | $ | 3.90 | | | $ | (0.51 | ) | | $ | — | | | $ | — | | | $ | (0.51 | ) | | $ | 26.05 | | | 17.42 | % | | $ | 210,975 | | | 0.68 | % | | | 2.22 | % | | | 14 | % |
2017 | | $ | 19.29 | | $ | 0.50 | | $ | 3.38 | | | $ | 3.88 | | | $ | (0.51 | ) | | $ | — | | | $ | — | | | $ | (0.51 | ) | | $ | 22.66 | | | 20.85 | % | | $ | 112,190 | | | 0.68 | % | | | 2.48 | % | | | 16 | % |
2016 | | $ | 21.78 | | $ | 0.45 | | $ | (2.57 | ) | | $ | (2.12 | ) | | $ | (0.37 | ) | | $ | — | | | $ | — | | | $ | (0.37 | ) | | $ | 19.29 | | | (9.76 | )% | | $ | 69,436 | | | 0.69 | % | | | 2.36 | % | | | 15 | % |
2015 | | $ | 25.73 | | $ | 0.68 | | $ | (4.10 | ) | | $ | (3.42 | ) | | $ | (0.52 | ) | | $ | (0.01 | ) | | $ | — | | | $ | (0.53 | ) | | $ | 21.78 | | | (13.29 | )% | | $ | 80,580 | | | 0.69 | % | | | 3.10 | % | | | 25 | % |
| 2014(7) | | $ | 25.00 | | $ | 0.14 | | $ | 0.59 | | | $ | 0.73 | | | $ | — | | | $ | — | | | $ | — | | | $ | — | | | $ | 25.73 | | | 2.92 | % | | $ | 23,160 | | | 0.69% | (4) | | | 4.11% | (4) | | | — | % |
Cambria Global Momentum ETF | |
10/31/2018** | | $ | 27.39 | | $ | 0.28 | | $ | (2.48 | ) | | $ | (2.20 | ) | | $ | (0.22 | ) | | $ | — | | | $ | — | | | $ | (0.22 | ) | | $ | 24.97 | | | (8.09 | )% | | $ | 107,361 | | | 0.59% | (4) | | | 2.04% | (4) | | | 73 | % |
2018 | | $ | 24.72 | | $ | 0.42 | | $ | 2.75 | | | $ | 3.17 | | | $ | (0.50 | ) | | $ | — | | | $ | — | | | $ | (0.50 | ) | | $ | 27.39 | | | 12.97 | % | | $ | 105,457 | | | 0.59 | % | | | 1.57 | % | | | 50 | % |
2017 | | $ | 22.78 | | $ | 0.42 | | $ | 1.95 | | | $ | 2.37 | | | $ | (0.40 | ) | | $ | — | | | $ | (0.03 | ) | | $ | (0.43 | ) | | $ | 24.72 | | | 10.52 | % | | $ | 59,328 | | | 0.59 | % | | | 1.78 | % | | | 106 | % |
2016 | | $ | 25.35 | | $ | 0.34 | | $ | (2.51 | ) | | $ | (2.17 | ) | | $ | (0.38 | ) | | $ | — | | | $ | (0.02 | ) | | $ | (0.40 | ) | | $ | 22.78 | | | (8.61 | )% | | $ | 21,639 | | | 0.59 | % | | | 1.43 | % | | | 316 | % |
2015(8) | | $ | 25.00 | | $ | 0.30 | | $ | 0.39 | | | $ | 0.69 | | | $ | (0.34 | ) | | $ | — | | | $ | — | | | $ | (0.34 | ) | | $ | 25.35 | | | 2.76 | % | | $ | 40,562 | | | 0.59% | (4) | | | 2.40% | (4) | | | 16 | % |
* | Per share data calculated using average shares method. |
** | For the six month period ended October 31, 2018. |
(1) | Returns and portfolio turnover rates are for the period indicated and have not been annualized. Returns do not reflect the deduction of taxes the shareholder would pay on fund distributions or redemption of Fund shares. |
(2) | Expense ratios do not include expenses of the underlying funds. |
(3) | Portfolio turnover rate does not include securities received or delivered from processing creations or redemptions. |
(4) | Annualized. |
(5) | Inception date May 13, 2013. |
(6) | Inception date December 2, 2013. |
(7) | Inception date March 11, 2014. |
(8) | Inception date November 3, 2014. |
The accompanying notes are an integral part of the financial statements.
Cambria Investment Management
Financial Highlights
Selected Per Share Data & Ratios
For a Share Outstanding Throughout the Year/Period
| | | Net Asset Value, Beginning of Year/Period | | Net Investment Income* | | Net Realized and Unrealized Gain (Loss) on Investments | | | Total from Operations | | | Distributions from Investment Income | | | Distributions from Net Realized Capital Gains | | | Return of Capital | | Total Distributions | | | Net Asset Value, End of Year/Period | | Total Return(1) | | | Net Assets End of Year/Period (000) | | Ratio of Expenses to Average Net Assets(2) | | | Ratio of Net Investment Income to Average Net Assets | | | Portfolio Turnover(1)(3) | |
Cambria Global Asset Allocation ETF | |
10/31/2018** | | $ | 27.38 | | $ | 0.39 | | $ | (1.70 | ) | | $ | (1.31 | ) | | $ | (0.36 | ) | | $ | — | | | $ | — | | $ | (0.36 | ) | | $ | 25.71 | | | (4.84 | )% | | $ | 61,704 | | | —% | (4) | | | 2.89% | (4) | | | — | % |
2018 | | $ | 25.64 | | $ | 0.74 | | $ | 1.66 | | | $ | 2.40 | | | $ | (0.66 | ) | | $ | — | | | $ | — | | $ | (0.66 | ) | | $ | 27.38 | | | 9.43 | % | | $ | 67,073 | | | — | % | | | 2.72 | % | | | 30 | % |
2017 | | $ | 24.15 | | $ | 0.65 | | $ | 1.51 | | | $ | 2.16 | | | $ | (0.67 | ) | | $ | — | | | $ | — | | $ | (0.67 | ) | | $ | 25.64 | | | 9.08 | % | | $ | 37,182 | | | — | % | | | 2.60 | % | | | 9 | % |
2016 | | $ | 25.43 | | $ | 0.58 | | $ | (1.26 | ) | | $ | (0.68 | ) | | $ | (0.60 | ) | | $ | — | | | $ | — | | $ | (0.60 | ) | | $ | 24.15 | | | (2.58 | )% | | $ | 24,152 | | | — | % | | | 2.44 | % | | | 8 | % |
| 2015(5) | | $ | 25.00 | | $ | 0.18 | | $ | 0.46 | | | $ | 0.64 | | | $ | (0.21 | ) | | $ | — | | | $ | — | | $ | (0.21 | ) | | $ | 25.43 | | | 2.58 | % | | $ | 31,786 | | | —% | (4) | | | 1.81% | (4) | | | 4 | % |
Cambria Value and Momentum ETF | |
10/31/2018** | | $ | 25.09 | | $ | 0.07 | | $ | (1.17 | ) | | $ | (1.10 | ) | | $ | (0.11 | ) | | $ | — | | | $ | — | | $ | (0.11 | ) | | $ | 23.88 | | | (4.41 | )% | | $ | 35,814 | | | 0.64% | (4)(6) | | | 0.58% | (4) | | | 37 | % |
2018 | | $ | 23.69 | | $ | 0.24 | | $ | 1.27 | | | $ | 1.51 | | | $ | (0.11 | ) | | $ | — | | | $ | — | | $ | (0.11 | ) | | $ | 25.09 | | | 6.40 | % | | $ | 32,617 | | | 0.65% | (7) | | | 1.00 | % | | | 93 | % |
2017 | | $ | 22.69 | | $ | 0.12 | | $ | 1.01 | | | $ | 1.13 | | | $ | (0.13 | ) | | $ | — | | | $ | — | | $ | (0.13 | ) | | $ | 23.69 | | | 4.98 | % | | $ | 8,291 | | | 0.66% | (8) | | | 0.50 | % | | | 76 | % |
2016(9) | | $ | 25.00 | | $ | 0.08 | | $ | (2.32 | ) | | $ | (2.24 | ) | | $ | (0.07 | ) | | $ | — | | | $ | — | | $ | (0.07 | ) | | $ | 22.69 | | | (8.96 | )% | | $ | 4,537 | | | 0.66% | (4)(8) | | | 0.55% | (4) | | | 48 | % |
Cambria Sovereign Bond ETF | |
10/31/2018** | | $ | 27.57 | | $ | 0.57 | | $ | (3.33 | ) | | $ | (2.76 | ) | | $ | (0.44 | ) | | $ | — | | | $ | — | | $ | (0.44 | ) | | $ | 24.37 | | | (10.03 | )% | | $ | 18,275 | | | 0.59% | (4) | | | 4.48% | (4) | | | 16 | % |
2018 | | $ | 27.20 | | $ | 1.39 | $ | 0.64^ | | | $ | 2.03 | | | $ | (1.44 | ) | | $ | (0.22 | ) | | $ | — | | $ | (1.66 | ) | | $ | 27.57 | | | 7.56 | % | | $ | 19,299 | | | 0.59 | % | | | 4.97 | % | | | 25 | % |
2017 | | $ | 26.99 | | $ | 1.04 | | $ | 0.14 | | | $ | 1.18 | | | $ | (0.93 | ) | | $ | (0.04 | ) | | $ | — | | $ | (0.97 | ) | | $ | 27.20 | | | 4.51 | % | | $ | 9,521 | | | 0.59 | % | | | 3.88 | % | | | 86 | % |
2016(10) | | $ | 25.00 | | $ | 0.19 | | $ | 1.80 | | | $ | 1.99 | | | $ | — | | | $ | — | | | $ | — | | $ | — | | | $ | 26.99 | | | 7.96 | % | | $ | 4,049 | | | 0.59% | (4) | | | 3.82% | (4) | | | — | % |
Cambria Emerging Shareholder Yield ETF | |
10/31/2018** | | $ | 35.83 | | $ | 0.96 | | $ | (6.87 | ) | | $ | (5.91 | ) | | $ | (0.84 | ) | | $ | — | | | $ | — | | $ | (0.84 | ) | | $ | 29.08 | | | (16.71 | )% | | $ | 15,994 | | | 0.65% | (4) | | | 5.82% | (4) | | | 79 | % |
2018 | | $ | 29.40 | | $ | 1.01 | | $ | 6.40 | | | $ | 7.41 | | | $ | (0.98 | ) | | $ | — | | | $ | — | | $ | (0.98 | ) | | $ | 35.83 | | | 25.75 | % | | $ | 30,458 | | | 0.65 | % | | | 2.99 | % | | | 26 | % |
2017(11) | | $ | 25.00 | | $ | 0.43 | | $ | 4.18 | | | $ | 4.61 | | | $ | (0.21 | ) | | $ | — | | | $ | — | | $ | (0.21 | ) | | $ | 29.40 | | | 18.57 | % | | $ | 11,759 | | | 0.69% | (4) | | | 2.00% | (4) | | | 33 | % |
* | Per share data calculated using average shares method. |
** | For the six month period ended October 31, 2018. |
^ | The amount shown for a share outstanding throughout the period does not accord with the aggregate net gains on investments for the period because of the sales and repurchases of fund shares in relation to fluctuating market value of the investments of the Fund. |
(1) | Returns and portfolio turnover rates are for the period indicated and have not been annualized. Returns do not reflect the deduction of taxes the shareholder would pay on fund distributions or redemption of Fund shares. |
(2) | Expense ratios do not include expenses of the underlying funds. |
(3) | Portfolio turnover rate does not include securities received or delivered from processing creations or redemptions. |
(4) | Annualized. |
(5) | Inception date December 9, 2014. |
(6) | Includes broker expense of 0.05%. |
(7) | Includes broker expense of 0.06%. |
(8) | Includes broker expense of 0.07%. |
(9) | Inception date September 8, 2015. |
(10) | Inception date February 22, 2016. |
(11) | Inception date July 13, 2016. |
The accompanying notes are an integral part of the financial statements.
Cambria Investment Management
Financial Highlights
| | | Net Asset Value, Beginning of Year/Period | | Net Investment Income* | | Net Realized and Unrealized Gain (Loss) on Investments | | | Total from Operations | | | Distributions from Investment Income | | | Return of Capital | | | Total Distributions | | | Net Asset Value, End of Year/Period | | Total Return(1) | | | Net Assets End of Year/Period (000) | | Ratio of Expenses to Average Net Assets(2) | | | Ratio of Net Investment Income to Average Net Assets | | | Portfolio Turnover(1)(3) | |
Cambria Tail Risk ETF | |
10/31/2018** | | $ | 21.58 | | $ | 0.20 | | $ | (0.74 | ) | | $ | (0.54 | ) | | $ | (0.18 | ) | | $ | — | | | $ | (0.18 | ) | | $ | 20.86 | | | (2.49 | )% | | $ | 22,944 | | | 0.59% | (5) | | | 1.92% | (5) | | | 22 | % |
2018 | | $ | 24.74 | | $ | 0.38 | | $ | (3.27 | ) | | $ | (2.89 | ) | | $ | (0.27 | ) | | $ | — | | | $ | (0.27 | ) | | $ | 21.58 | | | (11.74 | )% | | $ | 22,658 | | | 0.59 | % | | | 1.66 | % | | | 56 | % |
2017(4) | | $ | 25.00 | | $ | 0.02 | | $ | (0.28 | ) | | $ | (0.26 | ) | | $ | — | | | $ | — | | | $ | — | | | $ | 24.74 | | | (1.04 | )% | | $ | 2,474 | | | 0.59% | (5) | | | 1.38% | (5) | | | — | % |
Cambria Core Equity ETF | |
10/31/2018** | | $ | 24.70 | | $ | 0.17 | | $ | 1.35 | | | $ | 1.52 | | | $ | (0.33 | ) | | $ | — | | | $ | (0.33 | ) | | $ | 25.89 | | | 6.20 | % | | $ | 77,678 | | | 1.28% | (5)(8) | | | 1.32% | (5) | | | 14 | % |
2018(6) | | $ | 25.00 | | $ | 0.32 | | $ | (0.31 | ) | | $ | 0.01 | | | $ | (0.30 | ) | | $ | (0.01 | ) | | $ | (0.31 | ) | | $ | 24.70 | | | 0.01 | % | | $ | 87,681 | | | 1.21% | (5)(9) | | | 1.35% | (5) | | | 8 | % |
Cambria Trinity ETF | |
2018(7) | | $ | 25.00 | | $ | 0.05 | | $ | (1.05 | ) | | $ | (1.00 | ) | | $ | (0.01 | ) | | $ | — | | | $ | (0.01 | ) | | $ | 23.99 | | | (4.02 | )% | | $ | 13,196 | | | —% | (5) | | | 1.45% | (5) | | | — | % |
* | Per share data calculated using average shares method. |
** | For the six month period ended October 31, 2018. |
(1) | Returns and portfolio turnover rates are for the period indicated and have not been annualized. Returns do not reflect the deduction of taxes the shareholder would pay on fund distributions or redemption of Fund shares. |
(2) | Expense ratios do not include expenses of the underlying funds. |
(3) | Portfolio turnover rate does not include securities received or delivered from processing creations or redemptions. |
(4) | Inception date April 5, 2017. |
(5) | Annualized. |
(6) | Inception date May 23, 2017. |
(7) | Inception date September 7, 2018. |
(8) | Includes broker expense of 0.23% |
(9) | Includes broker expense of 0.10% and interest expense of 0.06%. |
The accompanying notes are an integral part of the financial statements.
Cambria Investment Management
Notes to Financial Statements
October 31, 2018 (Continued)
1. ORGANIZATION
Cambria ETF Trust (the “Trust”), a Delaware statutory trust, was formed on September 9, 2011 as a diversified, open-end registered management investment company under the Investment Company Act of 1940, as amended. The Trust is comprised of multiple exchange traded funds (“ETFs”). These financial statements relate only to Cambria Shareholder Yield ETF, Cambria Foreign Shareholder Yield ETF, Cambria Global Value ETF, Cambria Global Momentum ETF, Cambria Global Asset Allocation ETF, Cambria Value and Momentum ETF, Cambria Sovereign Bond ETF, Cambria Emerging Shareholder Yield ETF, Cambria Tail Risk ETF, Cambria Core Equity ETF and Cambria Trinity ETF (each, a “Fund” and, collectively, the “Funds”). Cambria Investment Management, L.P. (the “Investment Adviser”) serves as the investment adviser to the Funds. The assets of each Fund are segregated, and a shareholder’s interest is limited to the Fund in which shares are held. Each Fund is diversified, except Cambria Sovereign Bond ETF.
The investment objective of the Cambria Shareholder Yield ETF is to seek investment results that correspond (before fees and expenses) generally to the price and yield performance of its underlying index, the Cambria Shareholder Yield Index. The Fund inception date is May 13, 2013. The Fund commenced operations on May 14, 2013.
The investment objective of the Cambria Foreign Shareholder Yield ETF is to seek investment results that correspond (before fees and expenses) generally to the price and yield performance of its underlying index, the Cambria Foreign Shareholder Yield Index. The Fund inception date is December 2, 2013. The Fund commenced operations on December 3, 2013.
The investment objective of the Cambria Global Value ETF is to seek investment results that correspond (before fees and expenses) generally to the price and yield performance of its underlying index, the Cambria Global Value Index. The Fund inception date is March 11, 2014. The Fund commenced operations on March 12, 2014.
The investment objective of the Cambria Global Momentum ETF is to seek to preserve and grow capital from investments in the U.S. and foreign equity, fixed income, commodity and currency markets, independent of market direction. The Fund inception date is November 3, 2014. The Fund commenced operations on November 4, 2014.
The investment objective of the Cambria Global Asset Allocation ETF is to seek to track performance (before fees and expenses) of the Cambria Global Asset Allocation Index. The Fund inception date is December 9, 2014. The Fund commenced operations on December 10, 2014.
The investment objective of the Cambria Value and Momentum ETF is to seek income and capital appreciation from investments in the U.S. equity market. The Fund inception date is September 8, 2015. The Fund commenced operations on September 9, 2015.
The investment objective of the Cambria Sovereign Bond ETF is to seek income and capital appreciation from investments in securities and instruments that provide exposure to sovereign and quasi-sovereign bonds. The Fund inception date is February 22, 2016. The Fund commenced operations on February 23, 2016.
The investment objective of the Cambria Emerging Shareholder Yield ETF is to seek investment results that correspond (before fees and expenses) generally to the price and yield performance of its underlying index, the Cambria Emerging Shareholder Yield Index. The Fund inception date is July 13, 2016. The Fund commenced operations on July 14, 2016.
The investment objective of the Cambria Tail Risk ETF is to provide income and capital appreciation from investments in the U.S. market while protecting against significant downside risk. The Fund inception date is April 5, 2017. The Fund commenced operations on April 6, 2017.
The investment objective of the Cambria Core Equity ETF is to seek capital appreciation and capital preservation with a low correlation to the broader U.S. equity market. The Fund inception date is May 23, 2017. The Fund commenced operations on May 24, 2017.
Cambria Investment Management
Notes to Financial Statements
October 31, 2018 (Continued)
1. ORGANIZATION (continued)
The investment objective of the Cambria Trinity ETF is to seek to track the performance, before fees and expenses, of the Cambria Trinity Index. The Fund inception date is September 7, 2018. The Fund commenced operations on September 10, 2018.
Shares of the Funds are listed and traded either on the NYSE Arca, Inc or CBOE BZX Exchange, Inc. Market prices for the Shares may be different from their net asset value ("NAV"). The Funds will issue and redeem Shares on a continuous basis at NAV only in large blocks of Shares, typically 50,000 Shares, called "Creation Units." Creation Units are to be issued and redeemed principally in kind for a basket of securities and a balancing cash amount. Shares generally will trade in the secondary market in amounts less than a Creation Unit at market prices that change throughout the day.
The Funds are an investment company and accordingly follow the investment company accounting and reporting guidance of the Financial Accounting Standards Board (“FASB”) Accounting Standards Codification Topic 946 Financial Services – Investment Companies.
2. SIGNIFICANT ACCOUNTING POLICIES
The following is a summary of the Significant Accounting Policies followed by the Funds.
Use of Estimates — The Funds are investment companies in conformity with U.S. generally accepted accounting principles (“U.S. GAAP”).Therefore, the Funds follow the accounting and reporting guidance for investment companies. The preparation of financial statements in conformity with U.S.GAAP requires management to make estimates and assumptions that affect the reported amounts of assets and liabilities and disclosure of contingent assets and liabilities at the date of the financial statements and the reported amounts of increases and decreases in net assets from operations during the reporting period. Actual results could differ from those estimates, and could have a material impact to the Funds.
Security Valuation — Securities listed on a securities exchange, market or automated quotation system for which quotations are readily available (except for securities traded on the NASDAQ Stock Market (the “NASDAQ”)), including securities traded over the counter, are valued at the last quoted sale price on the primary exchange or market (foreign or domestic) on which they are traded (or at approximately 4:00 pm Eastern Time if a security’s primary exchange is normally open at that time), or, if there is no such reported sale, at the most recent quoted bid.
For securities traded on NASDAQ, the NASDAQ Official Closing Price will be used. Debt securities are priced based upon valuations provided by independent, third-party pricing agents, if available. Such values generally reflect the last reported sales price if the security is actively traded. The third-party pricing agents may also value debt securities at an evaluated bid price by employing methodologies that utilize actual market transactions, broker-supplied valuations, or other methodologies designed to identify the market value for such securities. Prices for most securities held in the Funds are provided daily by recognized independent pricing agents. If a security price cannot be obtained from an independent, third-party pricing agent, the Funds seeks to obtain a bid price from at least one independent broker.
Securities for which market prices are not "readily available" are valued in accordance with fair value procedures established by the Board. The Funds’ fair value procedures are implemented through a fair value committee (the “Committee”) designated by the Board. Some of the more common reasons that may necessitate that a security be valued using fair value procedures include: the security's trading has been halted or suspended; the security has been de-listed from a national exchange; the security's primary trading market is temporarily closed at a time when under normal conditions it would be open; the security has not been traded for an extended period of time; the security's primary pricing source is not able or willing to provide a price; or trading of the security is subject to local government-imposed restrictions. When a security is valued in accordance with the fair value procedures, the Committee will determine the value after taking into consideration relevant information reasonably available to the Committee.
Cambria Investment Management
Notes to Financial Statements
October 31, 2018 (Continued)
2. SIGNIFICANT ACCOUNTING POLICIES (continued)
In accordance with the authoritative guidance on fair value measurements and disclosure under U.S. GAAP, the Funds disclose fair value of its investments in a hierarchy that prioritizes the inputs to valuation techniques used to measure the fair value. The objective of a fair value measurement is to determine the price that would be received to sell an asset or paid to transfer a liability in an orderly transaction between market participants at the measurement date (an exit price). Accordingly, the fair value hierarchy gives the highest priority to quoted prices (unadjusted) in active markets for identical assets or liabilities (Level 1) and the lowest priority to unobservable inputs (Level 3). The three levels of the fair value hierarchy are described below:
| | ● | Level 1 – Unadjusted quoted prices in active markets for identical, unrestricted assets or liabilities that the Funds have the ability to access at the measurement date; |
| | ● | Level 2 – Quoted prices which are not active, or inputs that are observable (either directly or indirectly) for substantially the full term of the asset or liability; and |
| | ● | Level 3 – Prices, inputs or exotic modeling techniques which are both significant to the fair value measurement and unobservable (supported by little or no market activity). |
For the period ended October 31, 2018, there have been no significant changes to the Funds’ fair valuation methodologies.
Foreign Currency Translation — The books and records of the Funds are maintained in U.S. dollars. Investment securities and other assets and liabilities denominated in a foreign currency are translated into U.S. dollars on the date of valuation. Purchases and sales of investment securities, income and expenses are translated into U.S. dollars at the relevant rates of exchange prevailing on the respective dates of such transactions. The Funds do not isolate that portion of realized or unrealized gains and losses resulting from changes in the foreign exchange rate from fluctuations arising from changes in the market prices of the securities. These gains and losses are included in net realized and unrealized gains and losses on investments on the Statements of Operations. net realized and unrealized gains and losses on foreign currency transactions represent net foreign exchange gains or losses from foreign currency exchange contracts, disposition of foreign currencies, currency gains or losses realized between trade and settlement dates on securities transactions and the difference between the amount of the investment income and foreign withholding taxes recorded on the Funds’ books and the U.S. dollar equivalent amounts actually received or paid. These gains and losses are included in net realized and unrealized gains and losses on foreign currency transactions on the Statements of Operations.
Futures Contracts — To the extent consistent with its investment objective and strategies, Cambria Value and Momentum ETF utilized futures contracts during the period ended October 31, 2018. The Fund’s investment in futures contracts are designed to enable the Fund to more closely approximate their performance of their benchmark indices. Cambria Value and Momentum ETF chose to invest in futures contracts for tactical hedging purposes as well as to enhance the Fund’s returns. Initial margin deposits of cash or securities are made upon entering into futures contracts. The contracts are marked to market daily and the resulting changes in value are accounted for as unrealized gains and losses. Variation margin payments are paid or received, depending upon whether unrealized gains or losses are incurred. When the contract is closed, Cambria Value and Momentum ETF records a realized gain or loss equal to the difference between the proceeds from (or cost of) the closing transaction and the amount invested in the contract. A margin deposit was made upon entering into futures contracts and is included in Cash at Broker on the Statements of Assets and Liabilities.
Risks of entering into futures contracts include the possibility that there will be an imperfect price correlation between the futures and the underlying securities. Second, it is possible that a lack of liquidity for futures contracts could exist in the secondary market, resulting in an inability to close a position prior to its maturity date. Third, the futures contract involves the risk that Cambria Value and Momentum ETF could lose more than the original margin deposit required to initiate a futures transaction.
Finally, the risk exists that losses could exceed amounts disclosed on the Statements of Assets and Liabilities.
Cambria Investment Management
Notes to Financial Statements
October 31, 2018 (Continued)
2. SIGNIFICANT ACCOUNTING POLICIES (continued)
It is the Fund’s policy to present the gross variation margin payable and the gross variation margin receivable of the future contracts separately on the Statements of Assets and Liabilities, as Cambria Value and Momentum ETF does not have a master netting agreement with the counterparty to the futures contracts. Refer to the Cambria Value and Momentum ETF Schedule of Investments for details regarding open future contracts as of October 31, 2018. The fair value of equity futures contracts held in the Fund can be found on the Statements of Assets and Liabilities under the captions variation margin receivable. Only current day’s variation margin is reported within the Statements of Assets and Liabilities. Cumulative appreciation (depreciation) of futures contracts are reported in the Cambria Value and Momentum ETF Schedule of Investments. Realized gains or losses on equity rate futures contracts related to the Fund is recognized on the Statement of Operations as part of net realized gain (loss) on futures contracts and any change in unrealized appreciation or depreciation is recognized on the Statements of Operations as net change in unrealized gain (loss) on futures contracts.
Options Written/Purchased — The Cambria Value and Momentum ETF, Cambria Tail Risk ETF and Cambria Core Equity ETF may invest in equity options contracts for the purpose of hedging its existing portfolio securities, or securities that a Fund intends to purchase, against fluctuations in fair market value caused by changes in prevailing market interest rates. A Fund may also invest in equity option contracts to enhance its returns. When the Fund writes or purchases an option, an amount equal to the premium received or paid by the Fund is recorded as a liability or an asset and is subsequently adjusted to the current market value of the option written or purchased. Premiums received or paid from writing or purchasing options which expire unexercised are treated by the Fund on the expiration date as realized gains or losses. The difference between the premium and the amount paid or received on affecting a closing purchase or sale transaction, including brokerage commissions, is also treated as a realized gain or loss. If an option is exercised, the premium paid or received is added to the cost of the purchase or proceeds from the sale in determining whether the Fund has realized a gain or a loss.
The risk in writing a call option is a Fund may give up the opportunity for profit if the market price of the security increases. The risk in writing a put option is a Fund may incur a loss if the market price of the security decreases and the option is exercised. The risk in purchasing an option is a Fund may pay a premium whether or not the option is exercised. The Funds also have the additional risk of being unable to enter into a closing transaction at an acceptable price if a liquid secondary market does not exist. Option contracts also involve the risk that they may not work as intended due to unanticipated developments in market conditions or other causes. Finally, the risk exists that losses on written options could exceed amounts disclosed on the Statements of Assets and Liabilities.
The Cambria Tail Risk ETF and Cambria Core Equity ETF had options contracts as of October 31, 2018, as disclosed in the Funds’ Schedule of Investments. The value of the option contracts held in the Funds can be found on the Statements of Assets and Liabilities. Any realized and change in unrealized gains or losses can be found on the Statements of Operations.
Federal Income Taxes — The Funds intend to qualify as “regulated investment companies” under Sub-chapter M of the Internal Revenue Code of 1986 (the “Code”), as amended. If so qualified, the Funds will not be subject to U.S. federal income tax to the extent they distribute substantially all of their net investment income and net capital gains to their shareholders.
The Funds evaluate tax positions taken or expected to be taken in the course of preparing the Funds’ tax returns to determine whether it is "more-likely-than-not" (i.e., greater than 50 percent) that each tax position will be sustained upon examination by a taxing authority based on the technical merits of the position. Tax positions not deemed to meet the more-likely-than-not threshold are recorded as a tax benefit or expense in the current period.
The Funds did not record any tax provisions in the current period. However, management’s conclusions regarding tax positions may be subject to review and adjustment at a later date based on factors including, but not limited to, examination by tax authorities (i.e., the last three tax year ends, as applicable), on-going analysis of and changes to tax laws, regulations and interpretations thereof.
As of and during the period ended October 31, 2018, the Funds did not have a liability for any unrecognized tax benefits. The Funds recognize interest and penalties, if any, related to unrecognized tax benefits as income tax expense in the Statements of Operations. During the period, the Funds did not incur any interest or penalties.
Cambria Investment Management
Notes to Financial Statements
October 31, 2018 (Continued)
2. SIGNIFICANT ACCOUNTING POLICIES (continued)
Offering Expenses — All offering expenses of the Trust were borne by the Investment Adviser and are not subject to future recoupment. As a result, organizational and offering expenses are not reflected in the Statements of Assets and Liabilities.
Expenses — Expenses included in the accompanying financial statements reflect the expenses of each Fund and do not include any expenses associated with the underlying funds.
Cash and Cash Equivalents — Cash and cash equivalents may consist of cash balances and time deposits maintained or held at Brown Brothers Harriman. Such amounts may be in excess of Federal Deposit Insurance Corporation limitations.
Security Transactions and Investment Income — Security transactions are accounted for on trade date. Dividend income received from the underlying funds is recognized on the ex-dividend date and is recorded as income distributions in the Statements of Operations. Capital gain distributions received from the underlying funds are recognized on ex-dividend date and are recorded on the Statements of Operations as such. Costs used in determining realized gains and losses on the sales of investment securities are on the basis of specific identification. Dividend income is recorded on the ex-dividend date. Interest income is recognized on the accrual basis. Amortization and accretion is calculated using the scientific interest method, which approximates the effective interest method over the holding period of the security. Amortization of premiums and discounts is included in interest income. Withholding taxes on foreign dividends have been provided for in accordance with the Funds’ understanding of the applicable country’s tax rules and regulations.
Dividends and Distributions to Shareholders — The Funds generally pay out dividends from their net investment income, if any, quarterly, and distributes their net capital gains, if any, to shareholders at least annually. All distributions are recorded on ex-dividend date.
Creation Units — The Funds issue and redeem shares on a continuous basis at NAV in groups of 50,000 shares called creation units (“Creation Units”). Purchasers of Creation Units (“Authorized Participants”) must pay a creation transaction fee per transaction. The fee is typically a single charge and will be the same regardless of the number of Creation Units purchased by an investor on the same day. An Authorized Participant who holds Creation Units and wishes to redeem at NAV would also pay a Redemption Fee per transaction to the custodian on the date of such redemption, regardless of the number of Creation Units redeemed that day.
The distributor has entered into participant agreements with certain broker-dealers and others that allow those parties to be Authorized Participants and to subscribe for and redeem shares of the Funds. Such Authorized Participants may from time to time hold, of record or beneficially, a substantial percentage of the Funds’ shares outstanding, act as executing or clearing broker for investment transactions on behalf of the Fund and/or serve as counterparty to derivative transactions with the Fund.
Except when aggregated in Creation Units, shares are not redeemable securities of a Fund. Shares of the Funds may only be purchased or redeemed by Authorized Participants. An Authorized Participant is either (i) a broker-dealer or other participant in the clearing process through the Continuous Net Settlement System of the National Securities Clearing Corporation or (ii) a DTC participant and, in each case, must have executed a participant agreement with the distributor. Most retail investors will not qualify as Authorized Participants or have the resources to buy and sell whole Creation Units. Therefore, they will be unable to purchase or redeem the shares directly from the Funds. Rather, most retail investors will purchase shares in the secondary market with the assistance of a broker and will be subject to customary brokerage commissions or fees.
Cambria Investment Management
Notes to Financial Statements
October 31, 2018 (Continued)
2. SIGNIFICANT ACCOUNTING POLICIES (continued)
If a Creation Unit is purchased or redeemed for cash, a higher transaction fee will be charged. The following table discloses Creation Unit breakdown for the period ended October 31, 2018:
| | | Creation Unit Shares | | | Transaction Fee | | | Value | | | Redemption Fee | | | Variable Charge | |
| Cambria Shareholder Yield ETF | | | 50,000 | | | $ | 700 | | | $ | 1,816,000 | | | $ | 700 | | | None | |
| Cambria Foreign Shareholder Yield ETF | | | 50,000 | | | | 2,000 | | | | 1,168,500 | | | | 2,000 | | | Up to 2.0% | |
| Cambria Global Value ETF | | | 50,000 | | | | 3,500 | | | | 1,118,000 | | | | 3,500 | | | Up to 2.0% | |
| Cambria Global Momentum ETF | | | 50,000 | | | | 500 | | | | 1,248,500 | | | | 500 | | | Up to 2.0% | |
| Cambria Global Asset Allocation ETF | | | 50,000 | | | | 500 | | | | 1,285,500 | | | | 500 | | | None | |
| Cambria Value and Momentum ETF | | | 50,000 | | | | 700 | | | | 1,194,000 | | | | 700 | | | None | |
| Cambria Sovereign Bond ETF | | | 50,000 | | | | 550 | | | | 1,218,500 | | | | 550 | | | Up to 2.0% | |
| Cambria Emerging Shareholder Yield ETF | | | 50,000 | | | | 3,500 | | | | 1,454,000 | | | | 3,500 | | | Up to 2.0% | |
| Cambria Tail Risk ETF | | | 50,000 | | | | 500 | | | | 1,043,000 | | | | 500 | | | None | |
| Cambria Core Equity ETF | | | 50,000 | | | | 500 | | | | 1,294,500 | | | | 500 | | | None | |
| Cambria Trinity ETF | | | 50,000 | | | | 500 | | | | 1,199,500 | | | | 500 | | | None | |
To the extent the Funds permit the contribution of securities in exchange for the purchase of shares (contribution in-kind), shares may be issued in advance of receipt by the Fund of all or a portion of the applicable Deposit Securities. In these circumstances, the Fund may require the Authorized Participant to maintain with the Trust an amount up to 115% and/or 125% of the daily mark-to-market value of the missing Deposit Securities.
Illiquid Securities — A security is considered illiquid if the Fund reasonably expects that the investment cannot be sold or disposed of in current market conditions in seven calendar days or less without the sale or disposition significantly changing the market value of the investment. Valuations of illiquid securities may differ significantly from the values that would have been used had an active market value for these securities existed.
3. OFFSETTING ASSETS AND LIABILITIES
The Funds are required to disclose the impact of offsetting assets and liabilities represented in the statements of assets and liabilities to enable users of the financial statements to evaluate the effect or potential effect of netting arrangements on its financial position for recognized assets and liabilities. These recognized assets and liabilities are financial instruments and derivative instruments that are either subject to an enforceable master netting arrangement or similar agreement or meet the following right of setoff criteria: the amounts owed by the Funds to another party are determinable, the Funds has the right to set off the amounts owed with the amounts owed by the other party, the Funds intends to set off, and the Funds right of setoff is enforceable at law.
As of October 31, 2018, the Funds financial instruments and derivative instruments are not subject to a master netting arrangement.
4. RELATED PARTIES
Investment Advisory Agreement — The Investment Adviser is responsible for overseeing the management and business affairs of the Funds, and has discretion to purchase and sell securities in accordance with the Funds’ objectives, policies, and restrictions. The Investment Adviser reviews, supervises, and administers each Fund’s investment program. The Investment Adviser has entered into an investment advisory agreement (“Management Agreement”) with respect to the Funds. Pursuant to that Management Agreement, the Funds pay the Investment Adviser, on a monthly basis, an annual advisory fee based on its average daily nets assets for the services and facilities it provides payable at an annual rate of 0.59%, excluding the Cambria Global Asset Allocation ETF and Cambria Trinity ETF which are not charged an advisory fee and the Cambria Core Equity EFT which pay an annual rate of 1.05%.
Cambria Investment Management
Notes to Financial Statements
October 31, 2018 (Continued)
4. RELATED PARTIES (continued)
With respect to each fund, except the Cambria Global Value ETF and Cambria Emerging Shareholder Yield ETF, the Investment Adviser bears all of the costs of the Funds except for the advisory fee, payments under each Fund’s 12b-1 plan, brokerage expenses, acquired fund fees and expenses, taxes, interest (including borrowing costs and dividend expenses on securities sold short), litigation expenses and other extraordinary expenses. With respect to the Cambria Global Value ETF and Cambria Emerging Shareholder Yield ETF, the Investment Adviser bears all of the costs of each Fund, except for the advisory fee, payments under the Fund’s 12b-1 plan, brokerage expenses, custodial expenses, acquired fund fees and expenses, taxes, interest (including borrowing costs and dividend expenses on securities sold short), litigation expenses and other extraordinary expenses. The Cambria Global Value ETF and Cambria Emerging Shareholder Yield ETF may pay up to 0.10% in custody fees. The Management Agreement for the Funds provides that it may be terminated at any time, without the payment of any penalty, by the Board of Trustees or, with respect to the Funds, by a majority of the outstanding shares of the Funds, on 60 days’ written notice to the Investment Adviser, and by the Investment Adviser on 60 days’ written notice to the Trust and that it shall be automatically terminated if it is assigned.
Additionally, the Investment Adviser earned $60,720 in management fees from the Cambria Global Momentum ETF related to the Fund’s investment in affiliated funds, Cambria Shareholder Yield ETF, Cambria Foreign Shareholder Yield ETF, Cambria Global Value ETF, Cambria Sovereign Bond ETF and Cambria Emerging Shareholder Yield ETF.
Administrator, Custodian and Transfer Agent — SEI Investments Global Fund Services (the “Administrator”) serves as the Funds’ Administrator pursuant to an administration agreement. Brown Brothers Harriman & Co. (the “Custodian” and “Transfer Agent”) serves as the Funds’ Custodian and Transfer Agent pursuant to a Custodian Agreement and a Transfer Agency Services Agreement.
Distribution Agreement — SEI Investments Distribution Co., a wholly-owned subsidiary of SEI Investments and an affiliate of the Administrator (the “Distributor”), serves as the Funds’ distributor of Creation Units pursuant to a distribution agreement. The Distributor does not maintain any secondary market in Fund shares.
The Trust has adopted a Distribution and Service Plan (“Plan”) pursuant to Rule 12b-1 under the Investment Company Act of 1940 (the “1940 Act”). In accordance with its Plan, the Funds are authorized to pay an amount up to 0.25% of its average daily net assets each year for certain distribution-related activities. However, no such fee is currently paid by the Funds, and the Board of Trustees has not currently approved the commencement of any payments under the Plan.
Certain officers and trustees of the funds are officers/employees of the Investment Adviser or the Administrator.
5. INVESTMENT TRANSACTIONS
For the period ended October 31, 2018, the purchases and sales of investments in securities excluding in-kind transactions, long-term U.S. Government and short-term securities were:
| | | Purchases | | | Sales and Maturities | |
Cambria Shareholder Yield ETF | | $ | 14,660,149 | | | $ | 9,061,576 | |
Cambria Foreign Shareholder Yield ETF | | | 11,044,813 | | | | 11,324,022 | |
Cambria Global Value ETF | | | 465,474 | | | | 11,365,621 | |
Cambria Global Momentum ETF | | | 80,694,063 | | | | 79,144,775 | |
Cambria Global Asset Allocation ETF | | | 399,326 | | | | – | |
Cambria Value and Momentum ETF | | | 13,462,241 | | | | 15,382,958 | |
Cambria Sovereign Bond ETF | | | 5,191,364 | | | | 2,445,638 | |
Cambria Emerging Shareholder Yield ETF | | | 16,459,860 | | | | 21,890,655 | |
Cambria Tail Risk ETF | | | – | | | | – | |
Cambria Core Equity ETF | | | 11,323,117 | | | | 15,281,271 | |
Cambria Trinity ETF(1) | | | – | | | | – | |
(1) The Fund commenced operations on September 10, 2018.
Cambria Investment Management
Notes to Financial Statements
October 31, 2018 (Continued)
5. INVESTMENT TRANSACTIONS (continued)
For the period ended October 31, 2018, the Cambria Sovereign Bond ETF had purchases of U.S. Government securities of $3,328,976 and Cambria Tail Risk ETF had purchases and sales of U.S. Government securities of $4,855,250 and $4,822,155, respectively.
For the period ended October 31, 2018, in-kind transactions associated with creations and redemptions were:
| | | Purchases | | | Sales and Maturities | | | Net Realized Gain (Loss) | |
Cambria Shareholder Yield ETF | | $ | 9,037,431 | | | $ | 26,353,102 | | | $ | 5,233,945 | |
Cambria Foreign Shareholder Yield ETF | | | – | | | | 14,668,608 | | | | 389,868 | |
Cambria Global Value ETF | | | – | | | | 37,430,642 | | | | 6,635,858 | |
Cambria Global Momentum ETF | | | 15,585,015 | | | | 3,634,189 | | | | 384,822 | |
Cambria Global Asset Allocation ETF | | | 4,056,026 | | | | 5,220,446 | | | | 309,832 | |
Cambria Value and Momentum ETF | | | 10,895,147 | | | | 5,563,553 | | | | 1,001,222 | |
Cambria Sovereign Bond ETF | | | – | | | | – | | | | – | |
Cambria Emerging Shareholder Yield ETF | | | 720,729 | | | | 5,281,792 | | | | 434,785 | |
Cambria Tail Risk ETF | | | – | | | | – | | | | – | |
Cambria Core Equity ETF | | | – | | | | 13,469,644 | | | | 1,691,173 | |
Cambria Trinity ETF(1) | | | 13,384,323 | | | | – | | | | – | |
(1) The Fund commenced operations on September 10, 2018.
For the year or period ended April 30, 2018, in-kind transactions associated with creations and redemptions were:
| | | Purchases | | | Sales and Maturities | | | Net Realized Gain (Loss) | |
Cambria Shareholder Yield ETF | | $ | 25,691,615 | | | $ | 57,605,105 | | | $ | 14,934,976 | |
Cambria Foreign Shareholder Yield ETF | | | 3,591,100 | | | | 6,659,453 | | | | 1,305,032 | |
Cambria Global Value ETF | | | 71,603,548 | | | | – | | | | – | |
Cambria Global Momentum ETF | | | 38,396,259 | | | | – | | | | – | |
Cambria Global Asset Allocation ETF | | | 45,256,443 | | | | 21,777,692 | | | | 1,564,708 | |
Cambria Value and Momentum ETF | | | 22,281,175 | | | | – | | | | – | |
Cambria Sovereign Bond ETF | | | – | | | | – | | | | – | |
Cambria Emerging Shareholder Yield ETF | | | 7,355,246 | | | | – | | | | – | |
Cambria Tail Risk ETF | | | 7,975,116 | | | | – | | | | – | |
Cambria Core Equity ETF(1) | | | 120,397,455 | | | | 36,321,128 | | | | 3,248,421 | |
(1) The Fund commenced May 23, 2017
6. PRINCIPAL RISKS
As with all ETFs, shareholders of the Funds are subject to the risk that their investments could lose money, including the possible loss of the entire principal amount of an investment, over short or long periods of time. An investment is not a bank deposit and it is not insured or guaranteed by the Federal Deposit Insurance Corporation or any other government agency. The Funds are subject to the principal risks set forth in their prospectuses under the heading ‘‘Principal Risks’’. Some of these risks, any of which may adversely affect a Fund’s NAV, trading price, yield, total return, or ability to meet its investment objective, are set forth below.
Cash Redemption Risk — The Fund’s investment strategy may require it to effect redemptions, in whole or in part, for cash. As a result, the Fund may be required to sell portfolio securities in order to obtain the cash needed to distribute redemption proceeds. This may cause the Fund to recognize investment income and/or capital gains or losses that it might not have recognized if it had completely satisfied the redemption in-kind. As a result, the Fund may be less tax efficient if it includes such a cash payment than if the in-kind redemption process was used exclusively (i.e., securities are distributed as payment of redemption proceeds). In addition, cash redemptions may incur higher brokerage costs than in-kind redemptions and these added costs may be borne by the Fund and negatively impact Fund performance.
Cambria Investment Management
Notes to Financial Statements
October 31, 2018 (Continued)
6. PRINCIPAL RISKS (continued)
Cyber Security Risk — The Fund, and its service providers, may be susceptible to operational and information security risks resulting from a breach in cyber security, including cyber-attacks. A breach in cyber security, intentional or unintentional, may adversely impact the Fund in many ways, including, but not limited to, disruption of the Fund’s operational capacity, loss of proprietary information, theft or corruption of data maintained online or digitally, denial-of-service attacks on websites or network resources, and the unauthorized release of confidential information. Cyber-attacks affecting the Fund’s third-party service providers, including Cambria, the custodian, and the transfer agent, may subject the Fund to many of the same risks associated with direct cyber security breaches and adversely impact the Fund. For instance, cyber-attacks may impact the Fund’s ability to calculate its NAV, cause the release of confidential business information, impede trading, cause the Fund to incur additional compliance costs associated with corrective measures, subject the Fund to regulatory fines or other financial losses, and/or cause reputational damage to the Fund. Cyber security breaches of market makers, Authorized Participants, or the issuers of securities in which the Fund invests could also have material adverse consequences on the Fund’s business operations and cause financial losses for the Fund and its shareholders. While the Fund and its service providers have established business continuity plans and risk management systems designed to address cyber security risks, prevent cyber-attacks and mitigate the impact of cyber security breaches, there are inherent limitations on such plans and systems. In addition, the Fund has no control over the cyber security protections put in place by its service providers or any other third parties whose operations may affect the Fund or its shareholders.
Derivatives Risk — Derivatives are financial instruments that have a value which depends upon, or is derived from, a reference asset, such as one or more underlying securities, pools of securities, indexes, rates or currencies. Derivatives may result in investment exposures that are greater than their cost would suggest; in other words, a small investment in a derivative may have a large impact on Fund performance. The successful use of derivatives generally depends on the ability to predict market movements. The use of these instruments requires special skills and knowledge of investment techniques that are different than those normally required for purchasing and selling securities. If the Adviser uses a derivative instrument at the wrong time or judges market conditions incorrectly, or if the derivative instrument does not perform as expected, these strategies may significantly reduce the Fund’s return. The Fund could also experience losses if it is unable to close out a position because the market for an instrument or position is or becomes illiquid.
Emerging Markets Risk — Investments in securities and instruments traded in developing or emerging markets, or that provide exposure to these securities or markets, can involve additional risks relating to political, economic, or regulatory conditions not associated with investments in U.S. securities and instruments or investments in more developed international markets. For example, emerging markets may be subject to, among other risks, greater market volatility; lower trading volume and liquidity; greater social, political and economic uncertainty; governmental controls on foreign investments and limitations on repatriation of invested capital; lower disclosure, corporate governance, auditing and financial reporting standards; fewer protections of property rights; restrictions on the transfer of securities or currency; and settlement and trading practices that differ from U.S. markets and markets of more developed countries. Each of these factors may impact the ability of the Fund to buy, sell or otherwise transfer securities, adversely affect the trading market and price for Fund Shares and cause the Fund to decline in value.
Dividend Paying Security Risk — Securities that pay high dividends as a group can fall out of favor with the market, causing these companies to underperform companies that do not pay high dividends. Also, changes in the dividend policies of companies owned by the Funds and the capital resources available for these companies’ dividend payments may adversely affect the Funds.
Equity Investing Risk — An investment in the Funds involves risks similar to those of investing in any Fund holding equity securities, such as market fluctuations, changes in interest rates and perceived trends in stock prices. The values of equity securities could decline generally or could underperform other investments. In addition, securities may decline in value due to factors affecting a specific issuer, market or securities markets generally.
Cambria Investment Management
Notes to Financial Statements
October 31, 2018 (Continued)
6. PRINCIPAL RISKS (continued)
Exchange-Traded Funds and Exchange-Traded Products (“ETP”) and Investment Companies Risk — The risks of investing in securities of ETFs, ETPs and investment companies typically reflect the risks of the types of instruments in which the underlying ETF, ETP or investment company invests. In addition, with such investments, the Funds bear its proportionate share of the fees and expenses of the underlying entity. As a result, the Funds’ operating expenses may be higher and performance may be lower.
Fixed Income Risk — A decline in an issuer’s credit rating may cause a decrease in the value of its fixed income securities and an increase in their investment risk and volatility. During periods of falling interest rates, an issuer of a callable bond held by the Funds may “call” (or repay) the security before its stated maturity, and the Funds may have to reinvest the proceeds at lower interest rates, resulting in a decline in the Funds’ income. The market value of fixed income securities generally changes in response to changes in interest rates. As interest rates rise, the value of certain fixed income securities is likely to decrease. Similarly, if interest rates decline, the value of fixed income securities is likely to increase.
Foreign Investment Risk — Returns on investments in foreign securities could be more volatile than, or trail the returns on, investments in U.S. securities. Investments in or exposures to foreign securities by each Fund are subject to special risks, including risks associated with foreign securities generally, including differences in information available about issuers of securities and investor protection standards applicable in other jurisdictions; capital controls risks, including the risk of a foreign jurisdiction imposing restrictions on the ability to repatriate or transfer currency or other assets; currency risks; political, diplomatic and economic risks; regulatory risks; and foreign market and trading risks, including the costs of trading and risks of settlement in foreign jurisdictions.
Futures Contracts Risk — Risks associated with the use of futures contracts include the following: (i) an imperfect correlation between movements in prices of index futures contracts and movements in the value of the stock index that the instrument is designed to simulate; and (ii) the possibility of an illiquid secondary market for a futures contract and the resulting inability to close a position prior to its maturity date. Investments in futures may expose the Fund to leverage.
High Yield Securities Risk — High yield securities and unrated securities of comparable credit quality are subject to the increased risk of an issuer’s inability to meet principal and interest payment obligations in the Funds. High yield securities are subject to a greater risk of default and investments in them are inherently speculative. The secondary markets in which high yield securities are traded may be less liquid and more volatile than the market for higher grade securities.
Index Risk — Unlike many investment companies, the Index Funds do not utilize an investing strategy that seeks returns in excess of each Fund’s respective Underlying Index. Therefore, an Index Fund would not necessarily buy or sell a security unless that security is added or removed, respectively, from its respective Underlying Index, even if that security generally is underperforming.
Management Risk — The Cambria Global Momentum ETF, Cambria Value and Momentum ETF, Cambria Sovereign Bond ETF, Cambria Tail Risk ETF and Cambria Core Equity ETF (the “Active Funds”) are actively managed using proprietary investment strategies and processes. The Cambria Foreign Shareholder Yield ETF, Cambria Global Value ETF, Cambria Global Asset Allocation ETF, Cambria Emerging Shareholder Yield ETF and Cambria Trinity ETF (the “Index Funds”) are passively managed, meaning that they are designed to track the performance of an underlying index. There can be no guarantee that these strategies and processes will produce the intended results and no guarantee that the Fund will achieve its investment objective. This could result in the Fund’s underperformance compared to other funds with similar investment objectives.
Non-Correlation Risk — The returns of the Index Funds may not match the return of their Underlying Indexes for a number of reasons. For example, each Index Fund incurs operating expenses not applicable to the Underlying Index, and incurs costs in buying and selling securities, especially when rebalancing the Index Fund’s securities holdings to reflect changes in the composition of its Underlying Index. In addition, the performance of each Index Fund and its Underlying Index may vary due to asset valuation differences and differences between each Index Fund’s portfolio and its Underlying Index resulting from legal restrictions, cost or liquidity constraints.
Cambria Investment Management
Notes to Financial Statements
October 31, 2018 (Continued)
6. PRINCIPAL RISKS (continued)
Options Risk — The value of the Funds’ positions in options fluctuates in response to changes in the value of the underlying index. The Funds also risk losing all or part of the cash paid for purchasing put options. Writing index the Cambria Tail Risk ETF only purchases put options, the Fund’s losses from its exposure to put options is limited to the amount of premiums paid to the option seller. To the extent that the Cambria Core Equity ETF reduces its put option holdings relative to the number of call options sold by the Fund, the Fund’s ability to mitigate losses in the event of a market decline will be reduced.
Premium Discount Risk — The Shares may trade above or below their NAV. The NAV of the Fund will generally fluctuate with changes in the market value of the Fund’s holdings. The market prices of Shares, however, will generally fluctuate in accordance with changes in NAV as well as the relative supply of, and demand for, Shares on the Exchange. The trading price of Shares may deviate significantly from NAV during periods of market volatility. Cambria cannot predict whether Shares will trade below, at or above their NAV. Price differences may be due, in large part, to the fact that supply and demand forces at work in the secondary trading market for Shares will be closely related to, but not identical to, the same forces influencing the prices of the securities held by the Fund. However, given that Shares can be purchased and redeemed in large blocks of Shares, called Creation Units (unlike shares of closed-end funds, which frequently trade at appreciable discounts from, and sometimes at premiums to, their NAV), and the Fund’s portfolio holdings are fully disclosed on a daily basis, Cambria believes that large discounts or premiums to the NAV of Shares should not be sustained, but that may not be the case.
Secondary Market Trading Risk — Investors buying or selling Shares in the secondary market will generally pay brokerage commissions or other charges imposed by brokers as determined by that broker. Brokerage commissions are often a fixed amount and may be a significant proportional cost for investors seeking to buy or sell relatively small amounts of Shares. In addition, secondary market investors will also incur the cost of the difference between the price that an investor is willing to pay for Shares (the “bid” price) and the price at which an investor is willing to sell Shares (the “ask” price). This difference in bid and ask prices is often referred to as the “spread” or “bid/ask spread.” The bid/ask spread varies over time for Shares based on trading volume and market liquidity, and is generally lower if the Fund’s Shares have more trading volume and market liquidity and higher if the Fund’s Shares have little trading volume and market liquidity. Further, increased market volatility may cause increased bid/ask spreads.
Although the Shares are listed on the Exchange, there can be no assurance that an active or liquid trading market for them will develop or be maintained. In addition, trading in Shares on the Exchange may be halted due to market conditions or for reasons that, in the view of the Exchange, make trading in Shares inadvisable. Further, trading in Shares on the Exchange is subject to trading halts caused by extraordinary market volatility pursuant to the Exchange “circuit breaker” rules. There can be no assurance that the requirements of the Exchange necessary to maintain the listing of the Fund will continue to be met or will remain unchanged.
Sovereign Debt Securities Risk — Investments in sovereign and quasi-sovereign debt obligations involve special risks not present in corporate debt obligations. The issuer of the sovereign debt or the authorities that control the repayment of the debt may be unable or unwilling to repay principal or interest when due, and the Sovereign Bond ETF may have limited recourse in the event of a default. During periods of economic uncertainty, the market prices of sovereign debt, and the Sovereign Bond ETF’s net asset value, may be more volatile than prices of U.S. debt obligations. In the past, certain non-U.S. markets have encountered difficulties in servicing their debt obligations, withheld payments of principal and interest and declared moratoria on the payment of principal and interest on their sovereign debts.
7. GUARANTEES AND INDEMNIFICATIONS
In the normal course of business, the Funds enter into contracts with third-party service providers that contain a variety of representations and warranties and that provide general indemnifications. Additionally, under the Funds’ organizational documents, the officers and trustees are indemnified against certain liabilities arising out of the performance of their duties to the Funds. The Funds’ maximum exposure under these arrangements is unknown, as it involves possible future claims that may or may not be made against the Funds. Based on experience, the Investment Adviser is of the view that the risk of loss to the Funds in connection with the Funds’ indemnification obligations is remote; however, there can be no assurance that such obligations will not result in material liabilities that adversely affect the Funds.
8. INCOME TAXES
The amount and character of income and capital gain distributions to be paid, if any, are determined in accordance with Federal income tax regulations, which may differ from U.S. GAAP. These differences are primarily attributable to foreign currency and sales of passive foreign investment companies. As a result, net investment income (loss) and net realized gain (loss) on investment transactions for a reporting period may differ significantly from distributions during such period. These book/tax differences may be temporary or permanent. To the extent these differences are permanent in nature, they are charged or credited to undistributed net investment income(loss), accumulated net realized gain (loss) or paid-in capital, as appropriate, in the period that the differences arise.
Cambria Investment Management
Notes to Financial Statements
October 31, 2018 (Continued)
8. INCOME TAXES (continued)
For tax purposes, short-term realized gains are considered ordinary income. The tax character of dividends and distributions declared during the last two fiscal periods were as follows:
| | | Ordinary Income | | | Long-Term Capital Gain | | | Return of Capital | | | Totals | |
Cambria Shareholder Yield ETF | |
2018 | | $ | 1,963,064 | | | $ | 117,168 | | | $ | – | | | $ | 2,080,232 | |
2017 | | | 2,080,769 | | | | – | | | | – | | | | 2,080,769 | |
Cambria Foreign Shareholder Yield ETF | |
2018 | | $ | 1,437,092 | | | $ | – | | | $ | – | | | $ | 1,437,092 | |
2017 | | | 683,048 | | | | – | | | | – | | | | 683,048 | |
Cambria Global Value ETF | |
2018 | | $ | 3,023,213 | | | $ | – | | | $ | – | | | $ | 3,023,213 | |
2017 | | | 1,965,865 | | | | – | | | | – | | | | 1,965,865 | |
Cambria Global Momentum ETF | |
2018 | | $ | 1,446,903 | | | $ | – | | | $ | – | | | $ | 1,446,903 | |
2017 | | | 530,781 | | | | – | | | | 39,767 | | | | 570,548 | |
Cambria Global Asset Allocation ETF | |
2018 | | $ | 1,360,015 | | | $ | – | | | $ | – | | | $ | 1,360,015 | |
2017 | | | 777,368 | | | | – | | | | – | | | | 777,368 | |
Cambria Value and Momentum ETF | |
2018 | | $ | 81,069 | | | $ | – | | | $ | – | | | $ | 81,069 | |
2017 | | | 28,879 | | | | – | | | | – | | | | 28,879 | |
Cambria Sovereign Bond ETF | |
2018 | | $ | 719,881 | | | $ | 12,338 | | | $ | – | | | $ | 732,219 | |
2017 | | | 229,159 | | | | – | | | | – | | | | 229,159 | |
Cambria Emerging Shareholder Yeild ETF | |
2018 | | $ | 509,874 | | | $ | – | | | $ | – | | | $ | 509,874 | |
2017 | | | 55,329 | | | | – | | | | – | | | | 55,329 | |
Cambria Tail Risk ETF | |
2018 | | $ | 176,882 | | | $ | – | | | $ | – | | | $ | 176,882 | |
2017 | | | – | | | | – | | | | – | | | _ | |
Cambria Core Equity ETF | |
2018 | | $ | 1,295,785 | | | $ | – | | | $ | 51,766 | | | $ | 1,347,551 | |
Cambria Trinity ETF | |
2018 | | $ | – | | | $ | – | | | $ | – | | | $ | – | |
As of October 31, 2018, the components of distributable earnings (accumulated losses) on a tax basis were as follows:
| | | Cambria Shareholder Yield ETF | | | Cambria Foreign Shareholder Yield ETF | | | Cambria Global Value ETF | | | Cambria Global Momentum ETF | |
Undistributed Ordinary Income | | $ | 417,887 | | | $ | 569,075 | | | $ | 1,081,538 | | | $ | – | |
Undistributed Long-Term Capital Gain | | | – | | | | – | | | | 2,423,857 | | | | – | |
Capital Loss Carryforwards | | | (1,107,533 | ) | | | (2,408,302 | ) | | | – | | | | (1,674,283 | ) |
Late Year Loss Deferral | | | – | | | | – | | | | – | | | | (133,084 | ) |
Unrealized Appreciation | | | 18,291,791 | | | | 3,070,059 | | | | 11,876,323 | | | | 9,316,384 | |
Total Distributable Earnings | | $ | 17,602,145 | | | $ | 1,230,832 | | | $ | 15,381,718 | | | $ | 7,509,017 | |
Cambria Investment Management
Notes to Financial Statements
October 31, 2018 (Continued)
8. INCOME TAXES (continued)
| | | Cambria Global Asset Allocation ETF | | | Cambria Value and Momentum ETF | | | Cambria Sovereign Bond ETF | | | Cambria Emerging Shareholder Yield ETF | |
Undistributed Ordinary Income | | $ | 16,262 | | | $ | 54,733 | | | $ | 168,726 | | | $ | 131,638 | |
Undistributed Long-Term Capital Gain | | | 14,175 | | | | – | | | | 17,393 | | | | – | |
Capital Loss Carryforwards | | | – | | | | (1,348,449 | ) | | | – | | | | (189,411 | ) |
Unrealized Appreciation | | | 1,584,939 | | | | 2,263,184 | | | | 91,749 | | | | 4,271,182 | |
Other Temporary Differences | | | – | | | | – | | | | (86,230 | ) | | | – | |
Total Distributable Earnings | | $ | 1,615,376 | | | $ | 969,468 | | | $ | 191,638 | | | $ | 4,213,409 | |
| | | Cambria Tail Risk ETF | | | Cambria Core Equity ETF | |
Undistributed Ordinary Income | | $ | 38,839 | | | $ | – | |
Capital Loss Carryforwards | | | (861,029 | ) | | | (10,587,275 | ) |
Unrealized Appreciation (Depreciation) | | | (1,089,579 | ) | | | 5,663,247 | |
Total Accumulated Losses | | $ | (1,911,769 | ) | | $ | (4,924,028 | ) |
Under the Regulated Investment Company Modernization Act of 2010, the Fund is permitted to carry forward losses incurred in taxable years beginning after December 22, 2010 for an unlimited period. Additionally, post-enactment losses that are carried forward will retain their character as either short term or long term capital losses. As of October 31, 2018, the Funds have the following capital loss carryforwards and offset capital gains for an unlimited period:
| | | Non-Expiring Short-Term Loss | | | Non- Expiring Long-Term Loss | | | Total | |
| | | | | | | | | | | | | |
Cambria Shareholder Yield ETF | | $ | 1,107,533 | | | $ | – | | | $ | 1,107,533 | |
| | | | | | | | | | | | | |
Cambria Foreign Shareholder Yield ETF | | $ | – | | | $ | 2,408,302 | | | $ | 2,408,302 | |
| | | | | | | | | | | | | |
Cambria Global Value ETF | | $ | – | | | $ | – | | | $ | – | |
| | | | | | | | | | | | | |
Cambria Global Momentum ETF | | $ | 1,674,283 | | | $ | – | | | $ | 1,674,283 | |
| | | | | | | | | | | | | |
Cambria Global Asset Allocation ETF | | $ | – | | | $ | – | | | $ | – | |
| | | | | | | | | | | | | |
Cambria Value and Momentum ETF | | $ | 1,348,449 | | | $ | – | | | $ | 1,348,449 | |
| | | | | | | | | | | | | |
Cambria Sovereign Bond ETF | | $ | – | | | $ | – | | | $ | – | |
| | | | | | | | | | | | | |
Cambria Emerging Shareholder Yield ETF | | $ | 189,411 | | | $ | – | | | $ | 189,411 | |
| | | | | | | | | | | | | |
Cambria Tail Risk ETF | | $ | 198,472 | | | $ | 662,557 | | | $ | 861,029 | |
| | | | | | | | | | | | | |
Cambria Core Equity ETF | | $ | 7,281,799 | | | $ | 3,305,476 | | | $ | 10,587,275 | |
Cambria Investment Management
Notes to Financial Statements
October 31, 2018 (Continued)
During the year ended October 31, 2018, the Cambria Foreign Shareholder Yield ETF, Cambria Global Value ETF, Cambria Global Momentum ETF and Cambria Global Asset Allocation ETF and Cambria Value and Momentum ETF utilized $2,596,225, $1,025,220, $1,936,853, $577,019, $421,821 of capital loss carryforwards to offset capital gains, respectively.
The Federal tax cost and aggregate gross unrealized appreciation and depreciation on investments held by the Funds at October 31, 2018, were as follows:
Cambria Investment Management | | Federal Tax Cost | | | Aggregated Gross Unrealized Appreciation | | | Aggregated Gross Unrealized Depreciation | | | Net Unrealized Appreciation (Depreciation) | |
Cambria Shareholder Yield ETF | | $ | 117,446,261 | | | $ | 13,825,769 | | | $ | (6,613,319 | ) | | $ | 7,212,450 | |
Cambria Foreign Shareholder Yield ETF | | | 29,460,448 | | | | 1,378,027 | | | | (4,584,363 | ) | | | (3,206,336 | ) |
Cambria Global Value ETF | | | 157,413,762 | | | | 9,559,121 | | | | (28,972,022 | ) | | | (19,412,901 | ) |
Cambria Global Momentum ETF | | | 108,548,936 | | | | 2,276,044 | | | | (5,090,749 | ) | | | (2,814,705 | ) |
Cambria Global Asset Allocation ETF | | | 64,616,068 | | | | 306,696 | | | | (3,267,120 | ) | | | (2,960,424 | ) |
Cambria Value and Momentum ETF | | | 30,898,336 | | | | 2,965,351 | | | | (1,811,577 | ) | | | 1,153,774 | |
Cambria Sovereign Bond ETF | | | 19,744,039 | | | | 39,169 | | | | (2,354,515 | ) | | | (2,315,346 | ) |
Cambria Emerging Shareholder Yield ETF | | | 16,687,018 | | | | 467,549 | | | | (1,591,957 | ) | | | (1,124,408 | ) |
Cambria Tail Risk ETF | | | 21,169,381 | | | | – | | | | (656,331 | ) | | | (656,331 | ) |
Cambria Core Equity ETF | | | 63,857,570 | | | | 8,877,325 | | | | (1,555,726 | ) | | | 7,321,599 | |
Cambria Trinity ETF | | | 13,384,323 | | | | 2,438 | | | | (511,546 | ) | | | (509,108 | ) |
9. REGULATORY MATTERS
On August 17, 2018, the SEC adopted amendments to Regulation S-X. These changes are effective for periods after November 5, 2018. The updates to Registered Investment Companies were mainly focused on simplifying the presentation of distributable earnings by eliminating the need to present the components of distributable earning on a book basis in the Statement of Assets & Liabilities. The update also impacted the presentation of undistributed net investment income and distribution to shareholders on the Statement of Changes in Net Assets. The amounts presented in the current Statement of Changes in Net Assets represent the aggregated total distributions of net investment income and realized capital gains, except for distributions classified as return of capital which are still presented separately. The disaggregated amounts from the prior fiscal year are broken out below if there were both distributions from net investment income, net realized gains and/or return of capital, otherwise, the amount on the current Statement of Changes for the prior fiscal year end represents distributions of net investment income:
Fund | | Net Investment Income | | | Net Realized Gains | | | Return of Capital | |
Cambria Shareholder Yield ETF | | $ | 1,963,059 | | | $ | 117,173 | | | $ | — | |
Cambria Sovereign Bond ETF | | | 635,189 | | | | 97,030 | | | | — | |
Cambria Core Equity ETF | | | 1,295,785 | | | | — | | | | 51,766 | |
Cambria Investment Management
Notes to Financial Statements
October 31, 2018 (Continued)
10. NEW ACCOUNTING PRONOUNCEMENT
In August 2018, The FASB issued Accounting Standards Update 2018-13, Fair Value Measurement (Topic 820). The new guidance includes additions and modifications to disclosures requirements for fair value measurements. For public entities, the amendments are effective for financial statements issued for fiscal years beginning after December 15, 2019, and interim periods within those fiscal years. At this time, management is currently evaluating the impact of this new guidance on the financial statements and disclosures.
11. SUBSEQUENT EVENTS
The Funds have evaluated the need for additional disclosures and/or adjustments resulting from subsequent events through the date the financial statements were issued. Based on this evaluation, no adjustments were required to the financial statements.
Cambria Investment Management
Disclosure of Fund Expenses
(Unaudited)
All Exchange Traded Funds (“ETF”) have operating expenses. As a shareholder of an ETF, your investment is affected by these ongoing costs, which include (among others) costs for ETF management, administrative services, brokerage fees and shareholder reports like this one. It is important for you to understand the impact of these costs on your investment returns.
Operating expenses such as these are deducted from an ETF’s gross income and directly reduce its final investment return. These expenses are expressed as a percentage of the ETF’s average net assets; this percentage is known as the ETF’s expense ratio.
The following examples use the expense ratio and are intended to help you understand the ongoing costs (in dollars) of investing in your Fund and to compare these costs with those of other funds. The examples do not reflect any brokerage commissions that you may pay on purchases and sales of Shares. The examples are based on an investment of $1,000 made at the beginning of the period shown and held for the entire period (May 1, 2018 to October 31, 2018).
The table below illustrates your Fund’s costs in two ways:
Actual Fund Return. This section helps you to estimate the actual expenses after fee waivers that your Fund incurred over the period. The “Expenses Paid During Period” column shows the actual dollar expense cost incurred by a $1,000 investment in the Fund, and the “Ending Account Value” number is derived from deducting that expense cost from the Fund’s gross investment return.
You can use this information, together with the actual amount you invested in the Fund, to estimate the expenses you paid over that period. Simply divide your actual account value by $1,000 to arrive at a ratio (for example, an $8,600 account value divided by $1,000 = 8.6), then multiply that ratio by the number shown for your Fund under “Expenses Paid During Period.”
Hypothetical 5% Return. This section helps you compare your Fund’s costs with those of other funds. It assumes that the Fund had an annual 5% return before expenses during the year, but that the expense ratio (Column 3) for the period is unchanged. This example is useful in making comparisons because the Commission requires all funds to make this 5% calculation. You can assess your Fund’s comparative cost by comparing the hypothetical result for your Fund in the “Expenses Paid During Period” column with those that appear in the same charts in the shareholder reports for other funds.
Cambria Investment Management
Disclosure of Fund Expenses
(Unaudited) (Concluded)
NOTE: Because the return is set at 5% for comparison purposes — NOT your Fund’s actual return — the account values shown may not apply to your specific investment.
| | | Beginning
Account
Value
5/1/18 | | | Ending
Account
Value
10/31/18 | | | Annualized Expense Ratios | | | Expenses Paid During Period(1) | |
Cambria Shareholder Yield ETF | |
Actual Fund Return | | $ | 1,000.00 | | | $ | 969.40 | | | | 0.59 | % | | $ | 2.93 | |
Hypothetical 5% Return | | $ | 1,000.00 | | | $ | 1,022.20 | | | | 0.59 | % | | $ | 3.01 | |
Cambria Foreign Shareholder Yield ETF | |
Actual Fund Return | | $ | 1,000.00 | | | $ | 901.10 | | | | 0.59 | % | | $ | 2.83 | |
Hypothetical 5% Return | | $ | 1,000.00 | | | $ | 1,022.20 | | | | 0.59 | % | | $ | 3.01 | |
Cambria Global Value ETF | |
Actual Fund Return | | $ | 1,000.00 | | | $ | 874.30 | | | | 0.68 | % | | $ | 3.21 | |
Hypothetical 5% Return | | $ | 1,000.00 | | | $ | 1,021.80 | | | | 0.68 | % | | $ | 3.47 | |
Cambria Global Momentum ETF | |
Actual Fund Return | | $ | 1,000.00 | | | $ | 919.10 | | | | 0.59 | % | | $ | 2.85 | |
Hypothetical 5% Return | | $ | 1,000.00 | | | $ | 1,022.20 | | | | 0.59 | % | | $ | 3.01 | |
Cambria Global Asset Allocation ETF | |
Actual Fund Return | | $ | 1,000.00 | | | $ | 951.60 | | | | — | % | | $ | — | |
Hypothetical 5% Return | | $ | 1,000.00 | | | $ | 1,025.20 | | | | — | % | | $ | — | |
Cambria Value and Momentum ETF | |
Actual Fund Return | | $ | 1,000.00 | | | $ | 955.90 | | | | 0.64 | % | | $ | 3.16 | |
Hypothetical 5% Return | | $ | 1,000.00 | | | $ | 1,022.00 | | | | 0.64 | % | | $ | 3.26 | |
Cambria Sovereign Bond ETF | |
Actual Fund Return | | $ | 1,000.00 | | | $ | 899.70 | | | | 0.59 | % | | $ | 2.83 | |
Hypothetical 5% Return | | $ | 1,000.00 | | | $ | 1,022.20 | | | | 0.59 | % | | $ | 3.01 | |
Cambria Emerging Shareholder Yield ETF | |
Actual Fund Return | | $ | 1,000.00 | | | $ | 832.90 | | | | 0.65 | % | | $ | 3.00 | |
Hypothetical 5% Return | | $ | 1,000.00 | | | $ | 1,021.90 | | | | 0.65 | % | | $ | 3.31 | |
Cambria Tail Risk ETF | |
Actual Fund Return | | $ | 1,000.00 | | | $ | 975.10 | | | | 0.59 | % | | $ | 2.94 | |
Hypothetical 5% Return | | $ | 1,000.00 | | | $ | 1,022.20 | | | | 0.59 | % | | $ | 3.01 | |
Cambria Core Equity ETF | |
Actual Fund Return | | $ | 1,000.00 | | | $ | 1,062.00 | | | | 1.28 | % | | $ | 6.65 | |
Hypothetical 5% Return | | $ | 1,000.00 | | | $ | 1,018.00 | | | | 1.28 | % | | $ | 6.51 | |
Cambria Trinity ETF | |
Actual Fund Return | | $ | 1,000.00 | | | $ | 959.80 | | | | — | % | | $ | – | (2) |
Hypothetical 5% Return | | $ | 1,000.00 | | | $ | 1,007.00 | | | | — | % | | $ | – | |
(1) | Expenses are equal to the Fund’s annualized expense ratio multiplied by the average account value over the period, multiplied 184/365 (to reflect the one-half year period). |
(2) | Expenses are equal to the Fund’s annualized expense ratio multiplied by the average account value over the period, multiplied 51/365 (to reflect the actual time the Fund had operations from 09/10/2018-10/31/2018). |
Cambria Investment Management
Approval of Advisory Agreements & Board Considerations
October 31, 2018 (Unaudited)
Board Considerations in Approving the Cambria Trinity ETF Investment Advisory Agreement
At an in-person meeting held on June 12, 2018, the Board, including the Independent Trustees, met to discuss, among other things, the organization resolutions related to Cambria Trinity ETF (the “Fund”), and to consider, and vote on, the approval of the investment advisory agreement between Cambria and the Trust, with respect to the Fund (the “Agreement”). In preparation for its deliberations, the Board requested and reviewed written responses from Cambria to a due diligence questionnaire circulated on the Board’s behalf. During its deliberations, the Board received an oral presentation from Cambria and was assisted by the advice of independent legal counsel.
In evaluating the Agreement, the Board reviewed information regarding Cambria’s personnel, operations, and financial condition. In addition, the Board considered the evaluation process of Cambria to be ongoing and, in this regard, the Board considered information about Cambria derived from prior meetings of the Board concerning Cambria’s performance and services with respect to other Funds as part of the 15(c) review process for the Fund. At the meeting held on June 12, 2018, the Board considered: (1) the nature, extent and quality of the services to be provided to the Fund by Cambria; (2) the investment performance of Cambria with respect to existing Funds with similar investment strategies and/or the same portfolio managers; (3) the costs of the services provided by Cambria and the profitability to Cambria derived from its relationship with the Fund; (4) the advisory fee and total expense ratio of the Fund compared to a relevant peer group of funds; (5) the extent to which economies of scale would be realized as the Fund grows and whether the advisory fee would enable investors to share in the benefits of economies of scale; (6) benefits (such as soft dollars, if any) to be derived by Cambria and its affiliates from their relationship with the Fund; (7) Cambria’s reputation, expertise and resources in the financial markets; (8) Cambria’s investment management personnel; (9) Cambria’s operations and financial condition; (10) Cambria’s compliance program; and (11) other factors the Board deemed relevant.
The discussion immediately below outlines in greater detail the materials and information presented to the Board in connection with its consideration and approval of the Agreement, and the conclusions made by the Board at the meeting held on June 12, 2018 when determining to approve the Agreement for an initial two-year term.
Nature, Extent and Quality of Services. The Board reviewed the nature, quality and extent of the overall services to be provided by Cambria to the Fund. In particular, the Board considered the responsibilities of Cambria under the terms of the Agreement, recognizing that Cambria had invested significant time and effort in structuring the Trust and the Fund, obtaining the necessary exemptive relief from the Securities and Exchange Commission (“SEC”), arranging service providers, exploring various sales channels, and assessing the appeal for the Fund’s investment strategy. In addition, the Board considered that Cambria is responsible for providing investment advisory services to the Fund, monitoring compliance with the Fund’s objectives, policies and restrictions, and carrying out directives of the Board. The Board also considered the services provided by Cambria in the oversight of the Trust’s distributor, administrator, transfer agent, and custodian. The Board also discussed and considered the role of Cambria Indices, LLC as index provider to the Fund. In addition, the Board evaluated the integrity of Cambria’s personnel, the professional qualifications and experience of the portfolio management team in managing assets, their experiences with Cambria’s services, and the adequacy of Cambria’s resources and financial condition. Based on its review, within the context of its full deliberations, the Board determined that it was satisfied with the nature, extent and quality of the services provided, and expected to be provided, to the Fund by Cambria.
Performance. The Board noted that, since the Fund had not yet commenced investment operations, the Fund had no investment performance. The Board considered, however, that Cambria has been relatively successful in advising other ETFs, including other series of the Trust, using different quantitative investment strategies. The Board also discussed and considered the performance track record, investment experience, professional background and qualifications of the Fund’s portfolio manager. The Board further noted that Cambria had performed extensive research on the strategy underlying the Fund.
Cambria Investment Management
Approval of Advisory Agreements & Board Considerations
October 31, 2018 (Unaudited)
Comparative Fees and Expenses. The Board considered that Cambria proposed charging a unitary advisory fee of 0.00% to the Fund. The Board also considered the Fund, a fund of funds, would incur acquired fund fees and expenses, some of which would be paid to affiliated Cambria Funds. The Trustees noted that under the unitary fee structure proposed, Cambria, and not the Fund, would be responsible for paying many of the expenses necessary to service the Fund, including those of other service providers. In considering the advisory fee and proposed expense ratio, the Board reviewed and considered the fee in light of the nature, quality and extent of the services to be provided by Cambria to the Fund. With respect to the Fund’s proposed advisory fee and estimated total expense ratio, the Board considered how the proposed fee and expense ratio compared to the advisory fees and expense ratios of ETFs with comparable strategies, noting how differences between fund strategies might impact fees. The Board noted that although the Fund’s proposed unitary advisory fee is lower than the advisory fee of each of its peer funds, the Fund’s average total expense ratio might be higher than the expense ratio of its peer funds. The Board also considered Cambria’s representation that it would continue to monitor the Fund’s expense ratio as compared to those of its peer group and seek to ensure that the Fund remains competitive. Based on its review, in the context of its full deliberations, the Board concluded that the Fund’s proposed advisory fees appeared reasonable in light of the services to be rendered.
Costs and Profitability. The Board then considered the estimated profits to be realized by Cambria in connection with providing services to the Fund. The Board noted that since the Fund had not yet launched, it was difficult to estimate how profitable it would be to Cambria. The Board, however, reviewed estimated profit and loss information provided by Cambria with respect to the Fund. In particular, the Board noted Cambria’s representation of its long-term commitment to the success of the Fund and its unitary fee structure under which it bears the risk that Fund expenses might increase. The Board further considered the costs associated with the personnel, systems and equipment necessary to manage the Fund and to meet the regulatory and compliance requirements adopted by the SEC and other regulatory bodies as well as other expenses Cambria would pay in accordance with the Agreement. Based on its review, in the context of its full deliberations, the Board concluded that Cambria’s expected profitability with respect to the Fund appeared reasonable in light of the services Cambria will render to the Fund.
Other Benefits. The Board then considered the extent to which Cambria will derive ancillary benefits from the Fund’s operations. The Board discussed the potential benefits to Cambria resulting from its ability to use the Fund’s assets to engage in soft dollar transactions. The Board noted that Cambria did not have any affiliates that would benefit from the Fund’s operations. The Board also reviewed the degree to which Cambria may receive compensation from other Cambria ETFs based upon the Fund’s investment in other Cambria ETFs. The Board also considered that Cambria, not the Fund, pays any licensing fees attributable to its underlying index to Cambria’s affiliated index provider.
Economies of Scale. The Board also considered whether economies of scale would be realized by the Fund as its assets grow larger, including the extent to which this is reflected in the level of fees to be charged. The Board noted that the proposed advisory fee for the Fund is 0.00%, which cannot include breakpoints, but that it was premature - before the commencement of investment operations - to evaluate potential economies of scale. The Board, thus, determined to monitor potential economies of scale as assets managed by the Fund grow larger.
Conclusion. In approving the Agreement, the Board did not identify any single factor as being of paramount importance, and different Trustees may have given different weight to different factors. The Board reviewed a memorandum from Fund counsel discussing the legal standards applicable to its consideration of the Agreement. Based on its review, including consideration of each of the factors referenced above, the Board determined, in the exercise of its reasonable business judgment, that the advisory arrangement, as outlined in the Agreement, was fair and reasonable in light of the services to be performed, expenses to be incurred, and such other matters as the Board considered relevant. In light of the foregoing, the Board, including a majority of the Independent Trustees, determined to approve the Agreement for the Fund.
Cambria Investment Management
Supplemental Information
(Unaudited)
Net asset value, or “NAV”, is the price per share at which a Fund issues and redeems shares. It is calculated in accordance with the standard formula for valuing mutual fund shares. The “Market Price” of a Fund generally is determined using the midpoint between the highest bid and the lowest offer on the stock exchange on which the Shares of the Fund are listed for trading, as of the time that the Fund’s NAV is calculated. A Fund’s Market Price may be at, above or below its NAV. The NAV of a Fund will fluctuate with changes in the market value of the Fund’s holdings. The Market Price of a Fund generally fluctuates in response to changes in its NAV, as well as market supply and demand. The data represented in the table below represents past performance and cannot be used to predict future results.
Premiums or discounts are the differences (expressed as a percentage) between the NAV and Market Price of a Fund on a given day, generally at the time NAV is calculated. A premium is the amount that a Fund is trading above the reported NAV, expressed as a percentage of a NAV. A discount is the amount that the Fund is trading below the reported NAV, expressed as a percentage of the NAV.
| | | Market Price One Year Total Return | | | Market Price Cumulative Inception Date Total Return | | | Market Price, End of Period | |
Cambria Shareholder Yield ETF | | | 0.92 | % | | | - | % | | $ | 36.30 | |
Cambria Foreign Shareholder Yield ETF | | | (9.10 | ) | | | - | | | | 23.37 | |
Cambria Global Value ETF | | | (11.04 | ) | | | - | | | | 22.32 | |
Cambria Global Momentum ETF | | | (6.63 | ) | | | - | | | | 24.94 | |
Cambria Global Asset Allocation ETF | | | (4.84 | ) | | | - | | | | 25.73 | |
Cambria Value and Momentum ETF | | | (4.20 | ) | | | - | | | | 23.93 | |
Cambria Sovereign Bond ETF | | | (10.61 | ) | | | - | | | | 24.42 | |
Cambria Emerging Shareholder Yield ETF | | | (11.99 | ) | | | - | | | | 29.22 | |
Cambria Tail Risk ETF | | | (10.01 | ) | | | - | | | | 20.86 | |
Cambria Core Equity ETF | | | 1.65 | | | | - | | | | 25.82 | |
Cambria Trinity ETF | | | - | | | | (3.48 | ) | | | 24.13 | |
Cambria Investment Management
Supplemental Information
(Unaudited)(Continued)
Cambria Shareholder Yield ETF Premium/ Discount Analysis Inception Date 5/13/13 |
Analysis Period 5/13/13-10/31/18 |
| Percent Above
or Below Par | Number of Days
at Discount/Premium | Percent of Days
at Discount/Premium |
| | -5.00% | 1 | 0.07% |
| | -4.50% | - | - |
| | -4.00% | - | - |
| | -3.50% | - | - |
Fund Sold at Discount | -3.00% | - | - |
| -2.50% | 1 | 0.07% |
| -2.00% | 1 | 0.07% |
| -1.50% | - | - |
| -1.00% | 1 | 0.07% |
| -0.50% | 893 | 64.66% |
Sold at Par | 0.00% | - | - |
| 0.50% | 483 | 34.97% |
| 1.00% | - | - |
| 1.50% | 1 | 0.07% |
| 2.00% | - | - |
Fund Sold at Premium | 2.50% | - | - |
| 3.00% | - | - |
| 3.50% | - | - |
| 4.00% | - | - |
| 4.50% | - | - |
| 5.00% | - | - |
| Cambria Foreign Shareholder Yield ETF |
| Premium/ Discount Analysis |
| Inception Date 12/2/13 |
| Analysis Period 12/2/13-10/31/18 |
| Percent Above
or Below Par | Number of Days
at Discount/Premium | Percent of Days
at Discount/Premium |
| | -5.00% | - | - |
| | -4.50% | - | - |
| | -4.00% | - | - |
| | -3.50% | - | - |
Fund Sold at Discount | -3.00% | 3 | 0.24% |
| -2.50% | 2 | 0.16% |
| -2.00% | 7 | 0.56% |
| -1.50% | 34 | 2.74% |
| -1.00% | 136 | 10.97% |
| -0.50% | 396 | 31.94% |
Sold at Par | 0.00% | - | - |
| 0.50% | 466 | 37.58% |
| 1.00% | 173 | 13.95% |
| 1.50% | 22 | 1.77% |
| 2.00% | 1 | 0.08% |
Fund Sold at Premium | 2.50% | - | - |
| 3.00% | - | - |
| 3.50% | - | - |
| 4.00% | - | - |
| 4.50% | - | - |
| 5.00% | - | - |
Cambria Investment Management
Supplemental Information
(Unaudited)(Continued)
Cambria Global Value ETF Premium/ Discount Analysis Inception Date 3/11/14 |
Analysis Period 3/11/14-10/31/18 |
| Percent Above
or Below Par | Number of Days
at Discount/Premium | Percent of Days
at Discount/Premium |
| | -5.00% | - | - |
| | -4.50% | - | - |
| | -4.00% | 1 | 0.09% |
| | -3.50% | - | - |
Fund Sold at Discount | -3.00% | - | - |
| -2.50% | 1 | 0.09% |
| -2.00% | 3 | 0.26% |
| -1.50% | 18 | 1.53% |
| -1.00% | 83 | 7.08% |
| -0.50% | 346 | 29.50% |
Sold at Par | 0.00% | - | - |
| 0.50% | 472 | 40.24% |
| 1.00% | 221 | 18.84% |
| 1.50% | 21 | 1.79% |
| 2.00% | 7 | 0.60% |
Fund Sold at Premium | 2.50% | - | - |
| 3.00% | - | - |
| 3.50% | - | - |
| 4.00% | - | - |
| 4.50% | - | - |
| 5.00% | - | - |
Cambria Global Momentum |
Premium/ Discount Analysis |
Inception Date 11/3/14 |
Analysis Period 11/3/14-10/31/18 |
| Percent Above
or Below Par | Number of Days
at Discount/Premium | Percent of Days
at Discount/Premium |
| | -5.00% | - | - |
| | -4.50% | - | - |
| | -4.00% | - | - |
| | -3.50% | - | - |
Fund Sold at Discount | -3.00% | - | - |
| -2.50% | - | - |
| -2.00% | - | - |
| -1.50% | - | - |
| -1.00% | - | - |
| -0.50% | 450 | 44.64% |
Sold at Par | 0.00% | - | - |
| 0.50% | 547 | 54.27% |
| 1.00% | 10 | 0.99% |
| 1.50% | - | - |
| 2.00% | - | - |
Fund Sold at Premium | 2.50% | 1 | 0.10% |
| 3.00% | - | - |
| 3.50% | - | - |
| 4.00% | - | - |
| 4.50% | - | - |
| 5.00% | - | - |
Cambria Investment Management
Supplemental Information
(Unaudited)(Continued)
Cambria Global Asset Allocation ETF Premium/ Discount Analysis Inception Date 12/9/14 |
Analysis Period 12/9/14-10/31/18 |
| Percent Above
or Below Par | Number of Days
at Discount/Premium | Percent of Days
at Discount/Premium |
| | -5.00% | - | - |
| | -4.50% | - | - |
| | -4.00% | - | - |
| | -3.50% | - | - |
Fund Sold at Discount | -3.00% | - | - |
| -2.50% | - | - |
| -2.00% | - | - |
| -1.50% | - | - |
| -1.00% | - | - |
| -0.50% | 432 | 43.95% |
Sold at Par | 0.00% | - | - |
| 0.50% | 546 | 55.54% |
| 1.00% | 5 | 0.51% |
| 1.50% | - | - |
| 2.00% | - | - |
Fund Sold at Premium | 2.50% | - | - |
| 3.00% | - | - |
| 3.50% | - | - |
| 4.00% | - | - |
| 4.50% | - | - |
| 5.00% | - | - |
Cambria Value and Momentum ETF |
Premium/ Discount Analysis |
Inception Date 9/8/15 |
Analysis Period 9/8/15-10/31/18 |
| Percent Above
or Below Par | Number of Days
at Discount/Premium | Percent of Days
at Discount/Premium |
| | -5.00% | - | - |
| | -4.50% | - | - |
| | -4.00% | - | - |
| | -3.50% | - | - |
Fund Sold at Discount | -3.00% | - | - |
| -2.50% | - | - |
| -2.00% | - | - |
| -1.50% | 1 | 0.13% |
| -1.00% | 11 | 1.38% |
| -0.50% | 323 | 40.63% |
Sold at Par | 0.00% | - | - |
| 0.50% | 424 | 53.33% |
| 1.00% | 35 | 4.40% |
| 1.50% | 1 | 0.13% |
| 2.00% | - | - |
Fund Sold at Premium | 2.50% | - | - |
| 3.00% | - | - |
| 3.50% | - | - |
| 4.00% | - | - |
| 4.50% | - | - |
| 5.00% | - | - |
Cambria Investment Management
Supplemental Information
(Unaudited)(Continued)
Cambria Sovereign Bond ETF Premium/ Discount Analysis Inception Date 2/22/16 |
Analysis Period 2/22/16-10/31/18 |
| Percent Above
or Below Par | Number of Days
at Discount/Premium | Percent of Days
at Discount/Premium |
| | -5.00% | - | - |
| | -4.50% | - | - |
| | -4.00% | - | - |
| | -3.50% | - | - |
Fund Sold at Discount | -3.00% | - | - |
| -2.50% | - | - |
| -2.00% | - | - |
| -1.50% | 3 | 0.44% |
| -1.00% | 18 | 2.64% |
| -0.50% | 23 | 3.38% |
Sold at Par | 0.00% | - | - |
| 0.50% | 81 | 11.89% |
| 1.00% | 203 | 29.81% |
| 1.50% | 199 | 29.22% |
| 2.00% | 54 | 7.93% |
Fund Sold at Premium | 2.50% | 50 | 7.34% |
| 3.00% | 33 | 4.85% |
| 3.50% | 14 | 2.06% |
| 4.00% | 2 | 0.29% |
| 4.50% | 1 | 0.15% |
| 5.00% | - | - |
Cambria Emerging Shareholder Yield ETF |
Premium/ Discount Analysis |
Inception Date 7/13/16 |
Analysis Period 7/13/2016-10/31/18 |
| Percent Above
or Below Par | Number of Days
at Discount/Premium | Percent of Days
at Discount/Premium |
| | -5.00% | - | - |
| | -4.50% | - | - |
| | -4.00% | - | - |
| | -3.50% | - | - |
Fund Sold at Discount | -3.00% | - | - |
| -2.50% | - | - |
| -2.00% | 1 | 0.17% |
| -1.50% | 1 | 0.17% |
| -1.00% | 12 | 2.06% |
| -0.50% | 50 | 8.59% |
Sold at Par | 0.00% | - | - |
| 0.50% | 122 | 20.96% |
| 1.00% | 164 | 28.18% |
| 1.50% | 129 | 22.16% |
| 2.00% | 78 | 13.40% |
Fund Sold at Premium | 2.50% | 17 | 2.92% |
| 3.00% | 5 | 0.86% |
| 3.50% | 3 | 0.52% |
| 4.00% | - | - |
| 4.50% | - | - |
| 5.00% | - | - |
Cambria Investment Management
Supplemental Information
(Unaudited)(Continued)
Cambria Tail Risk ETF Premium/ Discount Analysis Inception Date 4/5/2017 |
Analysis Period 4/5/17-10/31/18 |
| Percent Above
or Below Par | Number of Days
at Discount/Premium | Percent of Days
at Discount/Premium |
| | -5.00% | - | - |
| | -4.50% | - | - |
| | -4.00% | - | - |
| | -3.50% | - | - |
Fund Sold at Discount | -3.00% | 1 | 0.25% |
| -2.50% | - | - |
| -2.00% | - | - |
| -1.50% | - | - |
| -1.00% | 3 | 0.75% |
| -0.50% | 86 | 21.61% |
Sold at Par | 0.00% | - | - |
| 0.50% | 287 | 72.11% |
| 1.00% | 20 | 5.03% |
| 1.50% | - | - |
| 2.00% | - | - |
Fund Sold at Premium | 2.50% | - | - |
| 3.00% | - | - |
| 3.50% | - | - |
| 4.00% | 1 | 0.25% |
| 4.50% | - | - |
| 5.00% | - | - |
| Cambria Core Equity ETF |
| Premium/ Discount Analysis |
| Inception Date 5/23/17 |
| Analysis Period 5/23/17-10/31/18 |
| Percent Above
or Below Par | Number of Days
at Discount/Premium | Percent of Days
at Discount/Premium |
| | -5.00% | - | - |
| | -4.50% | - | - |
| | -4.00% | - | - |
| | -3.50% | - | - |
Fund Sold at Discount | -3.00% | 1 | 0.27% |
| -2.50% | - | - |
| -2.00% | - | - |
| -1.50% | - | - |
| -1.00% | 2 | 0.55% |
| -0.50% | 210 | 57.53% |
Sold at Par | 0.00% | - | - |
| 0.50% | 149 | 40.82% |
| 1.00% | 2 | 0.55% |
| 1.50% | - | - |
| 2.00% | 1 | 0.27% |
Fund Sold at Premium | 2.50% | - | - |
| 3.00% | - | - |
| 3.50% | - | - |
| 4.00% | - | - |
| 4.50% | - | - |
| 5.00% | - | - |
Cambria Investment Management
Supplemental Information
(Unaudited)(Continued)
Cambria Trinity ETF Premium/ Discount Analysis Inception Date 9/10/18 |
Analysis Period 9/10/18-10/31/18 |
| Percent Above
or Below Par | Number of Days
at Discount/Premium | Percent of Days
at Discount/Premium |
| | -5.00% | - | - |
| | -4.50% | - | - |
| | -4.00% | - | - |
| | -3.50% | - | - |
Fund Sold at Discount | -3.00% | - | - |
| -2.50% | - | - |
| -2.00% | - | - |
| -1.50% | - | - |
| -1.00% | - | - |
| -0.50% | 1 | 2.86% |
Sold at Par | 0.00% | - | - |
| 0.50% | 20 | 57.14% |
| 1.00% | 14 | 0.40% |
| 1.50% | - | - |
| 2.00% | - | - |
Fund Sold at Premium | 2.50% | - | - |
| 3.00% | - | - |
| 3.50% | - | - |
| 4.00% | - | - |
| 4.50% | - | - |
| 5.00% | - | - |
Cambria Investment Management
Shareholder Voting Results
(Unaudited)
A special meeting of Fund shareholders was held on June 22, 2018, with adjournment and continuation on July 20, 2018 and August 7, 2018, for certain proposals related to each of the Funds, except Cambria Trinity ETF, which commenced operations on September 10, 2018. All of the proposals presented at the special meeting and adjournments were ultimately approved by Fund shareholders. The percentages shown below represent the percent of voting shares present at the meeting that voted for each proposal. The proposals acted upon by shareholders and the results of the shareholder vote were as follows:
Proposal 1
Fund shareholders elected Mebane Faber to serve as interested trustee of Cambria ETF Trust (the “Trust”). Mr. Faber joined Dennis Schmal and Eric Leake, who continued to serve in their roles as independent trustees of the Trust.
Fund | Votes
For | Votes Against/
Withheld | Votes
Abstain | Broker Non-Votes |
All Funds | 19,412,530 | 146,552 | 0 | 0 |
Proposal 2
Shareholders of each Fund approved a new investment advisory agreement between the Trust and Cambria Investment Management, L.P.
Fund | Votes
For | Votes Against/
Withheld | Votes
Abstain | Broker Non-Votes |
Cambria Shareholder Yield ETF | 1,761,386 | 22,548 | 36,338 | 838,320 |
Cambria Foreign Shareholder Yield ETF | 1,016,680 | 495 | 2,604 | 451,515 |
Cambria Emerging Shareholder Yield ETF | 622,312 | 789 | 45 | 124,212 |
Cambria Sovereign Bond ETF | 406,853 | 0 | 219 | 107,789 |
Cambria Global Value ETF | 3,432,705 | 40,898 | 42,330 | 1,435,757 |
Cambria Global Momentum ETF | 2,034,890 | 1,850 | 11,015 | 668,854 |
Cambria Value and Momentum ETF | 639,162 | 3,682 | 8,320 | 289,684 |
Cambria Global Asset Allocation ETF | 1,124,085 | 3,316 | 19,028 | 521,341 |
Cambria Tail Risk ETF | 486,032 | 1,852 | 9,439 | 208,594 |
Cambria Core Equity ETF | 2,589,125 | 1,208 | 3,610 | 245,447 |

Investment Adviser:
Cambria Investment Management, L.P.
2321 Rosecrans Avenue
Suite 3225
El Segundo, CA 90245
Distributor:
SEI Investments Distribution Co.
One Freedom Valley Drive
Oaks, PA 19456
Legal Counsel:
Morgan, Lewis & Bockius LLP
1111 Pennsylvania Avenue, NW
Washington, District of Columbia 20004-2541
Independent Registered Public Accounting Firm:
Cohen & Company, Ltd.
1350 Euclid Avenue, Suite 800
Cleveland, Ohio 44115
This information must be preceded or accompanied by a current prospectus.
CIM-AR-001-0600
Not applicable for semi-annual report.
Item 3. | Audit Committee Financial Expert. |
Not applicable for semi-annual report.
Item 4. | Principal Accountant Fees and Services. |
Not applicable for semi-annual report.
Item 5. | Audit Committee of Listed Registrants. |
Not applicable to open-end management investment companies.
Item 6. | Schedule of Investments. |
Schedule of Investments is included as part of the Report to Shareholders filed under Item 1 of this form.
Item 7. | Disclosure of Proxy Voting Policies and Procedures for Closed-End Management Investment Companies. |
Not applicable to open-end management investment companies.
Item 8. | Portfolio Managers of Closed-End Management Investment Companies. |
Not applicable to open-end management investment companies.
Item 9. | Purchases of Equity Securities by Closed-End Management Company and Affiliated Purchasers. |
Not applicable to open-end management investment companies.
Item 10. | Submission of Matters to a Vote of Security Holders. |
There have been no changes to the procedures by which shareholders may recommend nominees to the Registrant’s Board of Trustees during the period covered by this report.
Item 11. | Controls and Procedures. |
(a) The Registrant’s principal executive and principal financial officers, or persons performing similar functions, have concluded that the Registrant’s disclosure controls and procedures (as defined in Rule 30a-3(c) under the Act (17 CFR 270.30a-3(c))), as of a date within 90 days of the filing date of the report, are effective based on the evaluation of these controls and procedures required by Rule 30a-3(b) under the Act (17 CFR 270.30a-3(b)) and Rules 13a-15(b) or 15d-15(b) under the Exchange Act (17 CFR 240.13a-15(b) or 240.15d-15(b)).
(b) There has been no change in the Registrant’s internal control over financial reporting (as defined in Rule 30a-3(d) under the Act (17 CFR 270.30a-3(d)) that occurred during the period covered by this report that has materially affected, or is reasonably likely to materially affect, the Registrant’s internal control over financial reporting.
Item 12. | Disclosure of Securities Lending Activities for Closed-End Management Investment Companies. |
Not applicable to open-end management investment companies.
(a)(1) Not applicable for semi-annual report.
(a)(2) Separate certifications for the principal executive officer and the principal financial officer of the Registrant, as required by Rule 30a-2(a) under the Investment Company Act of 1940, as amended (17 CFR 270.30a-2(a)), are filed herewith.
(b) Officer certifications, as required by Rule 30a-2(b) under the Investment Company Act of 1940, as amended (17 CFR 270.30a-2(b)), also accompany this filing as Exhibits.
SIGNATURES
Pursuant to the requirements of the Securities Exchange Act of 1934 and the Investment Company Act of 1940, the registrant has duly caused this report to be signed on its behalf by the undersigned, thereunto duly authorized.
(Registrant): | Cambria ETF Trust | |
| | | |
| | | |
By (Signature and Title) : | /s/ Mebane Faber | |
| | Mebane Faber, President | |
Date: January 8, 2019
Pursuant to the requirements of the Securities Exchange Act of 1934 and the Investment Company Act of 1940, this report has been signed below by the following persons on behalf of the registrant and in the capacities and on the dates indicated.
| | | |
By (Signature and Title) : | /s/ Mebane Faber | |
| | Mebane Faber, President | |
Date: January 8, 2019
| | | |
By (Signature and Title) : | /s/ Eric Kleinschmidt | |
| | Eric Kleinschmidt, Principal Financial Officer | |
Date: January 8, 2019