Exhibit 99.1
MANAGEMENT’S DISCUSSION AND ANALYSIS OF FINANCIAL CONDITION
AND RESULTS OF OPERATIONS
This Management’s Discussion and Analysis (“MD&A”) of RESAAS Services Inc. (the “Company”) is dated August 31, 2015. You should read this MD&A in conjunction with our unaudited consolidated financial statements and the related notes thereto for the fiscal quarter ended June 30, 2015. We present our unaudited consolidated financial statements in Canadian dollars and in accordance with International Financial Reporting Standards (“IFRS”), as issued by the International Accounting Standards Board (“IASB”). All references to dollar amounts are in Canadian dollars unless otherwise noted.
This MD&A contains forward-looking statements that involve risks and uncertainties. Such information, although considered to be reasonable by the Company’s management at the time of preparation, may prove to be inaccurate and actual results may differ materially from those anticipated in any forward-looking statements. Additional information on the Company, including our voluntarily-filed AIF, is available on SEDAR at www.sedar.com.
Overview
RESAAS has developed a cloud-based social business software platform for the real estate services industry.
We have created a suite of tools which integrate with the platform, including an enterprise social network, a global referral network, lead generation engine, listing management, client engagement modules, customer relationship management (CRM) tools, analytics, file sharing and an advertising engine. These tools and functionality are made available exclusively to owners of real estate brokerage firms and brokers, licensed real estate agents, and Realtors and are designed to increase user productivity through better communication and collaboration between users.
Our mission is to enable agents, Realtors and brokers to communicate effectively, connect instantly and engage meaningfully with one another through a platform built for their benefit. Our platform allows for instant discussion and debate, both on local and global scale, for facilitating easier and richer communication within the real estate industry. We commenced operations of our website in February 2013 and began full-scale revenue generating activities for the RESAAS platform in January 2015. The RESAAS platform is designed specifically for real estate professionals to instantly connect with other industry professionals and potential business leads in a more modern and socially engaging environment. This real estate services industry platform, which is accessible through our website, allows professional users to set up public-facing profiles, connect with other registered professionals both inside and outside of their firm, add them to their network, generate leads and referrals and post reblasts to their network as well as to their profiles on other major social networking sites such as Facebook, Twitter and LinkedIn, so as to answer questions and announce new listings, open houses, price changes, sale notifications, market reports and new blog articles.
Revenue Generating Services
In January 2015, we began offering premium subscription services to our professional user base. Prior to 2015, we generated nominal revenue from the sale of advertising. While we continue to look for additional streams of revenue and advertising partners, we expect that our revenue generation will primarily come from conversion of our user base to paid premium service subscriptions.
Key Business Metrics
To analyze our business performance, determine financial forecasts, and help develop long-term strategic plans, we review the key business metrics below.
· Professional user — means an individual who has registered on the RESAAS website and has been verified by our team as a professional real estate agent, Realtor or broker.
· Premium user — means a professional user who has upgraded their account to receive access to our premium service package through a monthly or annual subscription payment.
· Premium conversion rate — means the rate at which we convert our current professional user base to premium users.
· Unique real estate content — means unique content that is posted to the RESAAS platform in the form of postings and real estate listings. We do not include comments to original postings or reblasts of the content in this metric.
Factors Affecting Our Performance
Growth in Registered Professional Users in North America. As of December 31, 2014, our professional user base in North America was 280,707. Our user growth rates are affected by digital marketing campaigns and general market penetration. We expect that our user base in North America will continue to increase as we achieve higher market penetration rates but may do so at a slower pace dependent upon our digital marketing activity.
Growth in Users in Other Regions. We anticipate increased user growth in the regions of South America and Europe. In particular, we anticipate activity to significantly increase in Brazil and central Europe where there exists a growing middle class. We intend to establish a local presence in such regions and hire additional staff to further develop brand awareness. In general, new users in regions outside North America do not require material incremental infrastructure investments because we are able to utilize existing infrastructure such as our data centers in the United States and Canada to make our platform available to users.
Conversion to Premium Services. In January 2015, we began efforts to convert our professional user base to paid premium users. Conversion can occur on an individual basis or as a result of agreements with brokerages which provide premium services to multiple users. We expect conversion rates of our existing professional user base to continue to display steady growth as our premium services gain recognition.
User Engagement. Changes in user engagement, such as postings and real estate listings, affect our revenue and financial performance. Growth in user engagement and posting of unique real estate content may increase the opportunities for us to display advertising and our ability to deliver relevant commercial content to users. Growth in user engagement also generally results in increases in our expenses and capital expenditures required to support user activity.
Our key business metrics are as follows:
| 2013 | 2014 | |||||||||||||||||||||||||||||||
Q1 | Q2 | Q3 | Q4 | Q1 | Q2 | Q3 | Q4 | |||||||||||||||||||||||||
| Professional Users | ||||||||||||||||||||||||||||||||
| North America | 7,502 | 8,955 | 14,683 | 64,825 | 176,641 | 228,783 | 265,122 | 280,707 | ||||||||||||||||||||||||
| International | 524 | 619 | 804 | 1,075 | 24,237 | 27,116 | 42,818 | 49,243 | ||||||||||||||||||||||||
| Total | 8,026 | 9,574 | 15,487 | 65,900 | 200,878 | 255,899 | 307,940 | 329,950 | ||||||||||||||||||||||||
| Unique Real Estate Content | ||||||||||||||||||||||||||||||||
| New Added Content | 4,022 | 9,324 | 17,480 | 52,838 | 103,102 | 96,177 | 131,103 | 80,082 | ||||||||||||||||||||||||
| Total Added Content | 4,022 | 13,346 | 30,826 | 83,664 | 186,766 | 282,943 | 414,046 | 494,128 | ||||||||||||||||||||||||
| 2 |
| 2015 | ||||||||
Q1 | Q2 | |||||||
| Professional Users | ||||||||
| North America | 285,254 | 296,474 | ||||||
| International | 51,826 | 64,181 | ||||||
| Total | 337,080 | 360,655 | ||||||
| Unique Real Estate Content | ||||||||
| New Added Content | 65,911 | 86,949 | ||||||
| Total Added Content | 560,039 | 646,988 | ||||||
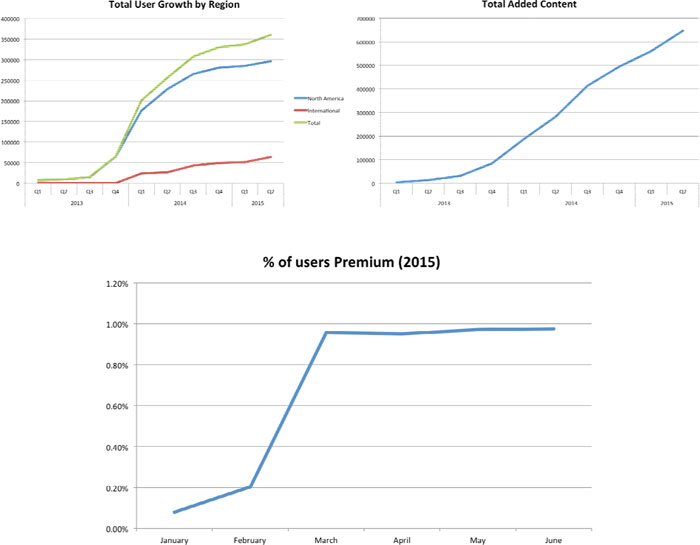
| January | February | March | ||||||||||
| Total Users | 331,544 | 334,420 | 337,080 | |||||||||
| Premium Users | 262 | 685 | 3,230 | |||||||||
| April | May | June | ||||||||||
| Total Users | 343,901 | 345,160 | 360,655 | |||||||||
| Premium Users | 3,268 | 3,351 | 3,523 | |||||||||
| 3 |
Results of Operations
Comparison of the six months ended June 30, 2015 and 2014
The following table summarizes the results of our operations for the six months ended June 30, 2015 and 2014 together with the changes to those items.
| Six Months Ended June 30, | ||||||||
| 2015 | 2014 (Restated – See Below) | |||||||
| Revenue | $ | 88,731 | $ | 2,890 | ||||
| Interest income | 11,131 | 10,618 | ||||||
| Operating expenses | ||||||||
| Amortization | $ | 353,846 | $ | 575,571 | ||||
| Consulting fees | 191,759 | 69,278 | ||||||
| Filing fees | 50,184 | 32,682 | ||||||
| Foreign exchange loss | 12,892 | 26,832 | ||||||
| General and administrative | 769,005 | 606,680 | ||||||
| Management fees | 322,027 | 129,659 | ||||||
| Promotion and advertising | 381,670 | 413,807 | ||||||
| Professional fees | 1,004,278 | 156,143 | ||||||
| Stock-based compensation | 125,295 | 1,114,243 | ||||||
| Travel | 98,316 | 97,467 | ||||||
| Net loss | (3,209,410 | ) | (3,208,854 | ) | ||||
| Basic and diluted loss per share | (0.10 | ) | (0.11 | ) | ||||
| Total current assets | 4,159,880 | 5,434,102 | ||||||
| Total assets | 5,214,330 | 6,170,947 | ||||||
| Total current liabilities | 466,623 | 116,719 | ||||||
| Total liabilities | 470,385 | 116,719 | ||||||
| Working capital | 3,693,257 | 5,317,383 | ||||||
| Cash dividends | — | — | ||||||
The Company has revised comparative figures to include the capitalization of website development costs that were eligible for capitalization but were not capitalized until the third and fourth quarter of 2014. There was no impact on the results for the year ended December 31, 2014.
| For the Six Months Ended June 30, 2014 | ||||||||||||
| As Previously Stated | Restatement | As Adjusted | ||||||||||
| Amortization | $ | 512,627 | $ | 62,944 | $ | 575,571 | ||||||
| General and administrative | 846,908 | (240,228 | ) | 606,680 | ||||||||
| Stock-based compensation | 1,289,788 | (175,545 | ) | 1,114,243 | ||||||||
| Net loss | (3,561,683 | ) | 352,829 | (3,208,854 | ) | |||||||
| Basic and diluted loss per share | (0.12 | ) | 0.01 | (0.11 | ) | |||||||
| Total assets | 5,818,118 | 352,829 | 6,170,947 | |||||||||
| 4 |
Revenue
Revenue consists of payments received from premium service subscriptions and limited advertising revenue generated from our platform. We had minimal revenue for the six months ended June 30, 2014. We had $88,731 of revenue during the six months ended June 30, 2015. We anticipate that revenue will increase with the further commercialization of our platform through conversions of professional users to paid premium services, advertising and enterprise contracts with brokerages.
Operating Expenses
Amortization
Amortization expense consists of the amortization of capitalized costs to develop the Company’s platform.
Amortization expense decreased by $221,725 or 39% to $353,846 for the six months ended June 30, 2015 from $575,571 for the six months ended June 30, 2014. This decrease was due to the Company having a greater amount of website development costs subject to amortization during the six months ended June 30, 2015 as compared to the six months ended June 30, 2014.
Consulting
Consulting expenses consist primarily of costs incurred to third party service providers. Consulting expense increased by $122,481, or 177%, to $191,759 for the six months ended June 30, 2015 from $69,278 for the six months ended June 30, 2014. The increase was the result of the Company engaging additional consultants to assist with the further commercialization of our platform during the six months ended June 30, 2015 as compared to during the six months ended June 30, 2014.
General and Administrative Expenses
General and administrative expenses consist primarily of salaries and benefits related to our executive, finance, business development, human resources and support functions. Other general and administrative expenses include facility-related costs and expenses associated with the requirements of being a listed public company in Canada and insurance.
We anticipate that our general and administrative expenses will increase in the future as we increase our headcount to support our continued research and development and further commercialization of our platform. Additionally as we continue to commercialize our platform we will likely incur increased marketing expenses.
General and administrative expenses increased by $162,325, or 27%, to $769,005 for the six months ended June 30, 2015 from $606,680 for the six months ended June 30, 2014. General and administrative expenses increased primarily as a result of an increase in the amount of staffing and overhead costs incurred during the current period compared to the prior period.
Management Fee Expenses
Management fee expenses consist primarily of salaries and benefits incurred to directors and officers. We expect management fees to increase moderately in the future.
Management fees increased by $192,368 or 148% to $322,027 for the six months ended June 30, 2015 from $129,659 for the six months ended June 30, 2014. The increase in management fees during fiscal 2015 was primarily the result of declaring bonuses of $178,900 to management which were offset by loans owed by management.
Professional Fees
Professional fee expenses consist primarily of costs incurred for legal, accounting and auditing services.
Professional fee expenses increased by $848,135, or 543%, to $1,004,278 for the six months ended June 30, 2015 from $156,143 for the six months ended June 30, 2014. This increase was the result of an increase in the Company’s operations and activity during the six months ended June 30, 2015 and need for additional legal and accounting services.
| 5 |
Stock-Based Compensation
Stock-based compensation consists of the grant date fair value of share-based payment awards granted to employees recognized over the period that the employees unconditionally become entitled to the awards.
Stock-based compensation expense decreased by $988,948 or 89% to $125,295 for the six months ended June 30, 2015 from $1,114,243 for the six months ended June 30, 2014. This decrease was due to no stock options being granted during the six months ended June 30, 2015 as compared to granting of 540,000 stock options during the six months ended June 30, 2014.
Results of Operations
Comparison of the three months ended June 30, 2015 and 2014
The following table summarizes the results of our operations for the three months ended June 30, 2015 and 2014 together with the changes to those items.
| Three Months Ended June 30, | ||||||||
| 2015 | 2014 (Restated – See Below) | |||||||
| Revenue | $ | 47,682 | $ | 2,890 | ||||
| Interest income | 6,492 | 4,468 | ||||||
| Operating expenses | ||||||||
| Amortization | $ | 188,956 | $ | 301,310 | ||||
| Consulting fees | 153,211 | 26,847 | ||||||
| Filing fees | 39,527 | 24,926 | ||||||
| Foreign exchange loss | 7,328 | 15,454 | ||||||
| General and administrative | 376,438 | 310,073 | ||||||
| Management fees | 74,461 | 63,692 | ||||||
| Promotion and advertising | 239,183 | 210,419 | ||||||
| Professional fees | 665,624 | 78,000 | ||||||
| Stock-based compensation | 30,376 | 7,281 | ||||||
| Travel | 57,034 | 35,632 | ||||||
| Net loss | (1,777,964 | ) | (1,066,276 | ) | ||||
| Basic and diluted loss per share | (0.05 | ) | (0.04 | ) | ||||
The Company has revised comparative figures to include the capitalization of website development costs that were eligible for capitalization but were not capitalized until the third and fourth quarter of 2014. There was no impact on the results for the year ended December 31, 2014.
| For the Three Months Ended June 30, 2014 | ||||||||||||
| As Previously Stated | Restatement | As Adjusted | ||||||||||
| Amortization | $ | 256,845 | $ | 44,465 | $ | 301,310 | ||||||
| General and administrative | 430,187 | (120,114 | ) | 310,073 | ||||||||
| Net loss | (1,141,925 | ) | 75,649 | (1,066,276 | ) | |||||||
| Basic and diluted loss per share | (0.04 | ) | — | (0.04 | ) | |||||||
| 6 |
Revenue
Revenue consists of payments received from premium service subscriptions and limited advertising revenue generated from our platform. We had minimal revenue for the three months ended June 30, 2014. We had $47,682 of revenue during the three months ended June 30, 2015. We anticipate that revenue will increase with the further commercialization of our platform through conversions of professional users to paid premium services, advertising and enterprise contracts with brokerages.
Operating Expenses
Amortization
Amortization expense consists of the amortization of capitalized costs to develop the Company’s platform.
Amortization expense decreased by $112,354 or 37% to $188,956 for the three months ended June 30, 2015 from $301,310 for the three months ended June 30, 2014. This decrease was due to the Company having a greater amount of website development costs subject to amortization during the six months ended June 30, 2015 as compared to the six months ended June 30, 2014.
Consulting
Consulting expenses consist primarily of costs incurred to third party service providers. Consulting expense increased by $126,364, or 471%, to $153,211 for the six months ended June 30, 2015 from $26,847 for the six months ended June 30, 2014. The increase was the result of the Company engaging additional consultants during the three months ended June 30, 2015 as compared to during the three months ended June 30, 2014 to assist with the further commercialization of our platform.
General and Administrative Expenses
General and administrative expenses consist primarily of salaries and benefits related to our executive, finance, business development, human resources and support functions. Other general and administrative expenses include facility-related costs and expenses associated with the requirements of being a listed public company in Canada and insurance.
We anticipate that our general and administrative expenses will increase in the future as we increase our headcount to support our continued research and development and further commercialization of our platform. Additionally as we continue to commercialize our platform we will likely incur increased marketing expenses.
General and administrative expenses increased by $66,365, or 21%, to $376,438 for the three months ended June 30, 2015 from $310,073 for the three months ended June 30, 2014. General and administrative expenses increased primarily as a result of an increase in the amount of staffing and overhead costs incurred during the current period compared to the prior period.
Professional Fees
Professional fee expenses consist primarily of costs incurred for legal, accounting and auditing services.
Professional fee expenses increased by $587,624, or 753%, to $665,624 for the three months ended June 30, 2015 from $78,000 for the three months ended June 30, 2014. This increase was the result of an increase in the Company’s operations and activity during the three months ended June 30, 2015 and need for additional legal and accounting services.
| 7 |
Stock-Based Compensation
Stock-based compensation consists of the grant date fair value of share-based payment awards granted to employees recognized over the period that the employees unconditionally become entitled to the awards.
Stock-based compensation expense increased by $23,095 or 317% to $30,376 for the three months ended June 30, 2015 from $7,281 for the three months ended June 30, 2014. This increase was due to the vesting of previously granted stock options. No stock options were granted during the three months ended June 30, 2015 or during the three months ended June 30, 2014.
Travel
Travel expenses consist primarily of costs related to travel. Travel expense increased by $21,402, or 60%, to $57,034 for the three months ended June 30, 2015 from $35,632 for the three months ended June 30, 2014. The increase was the result of increased travel during the three months ended June 30, 2015 as compared to during the three months ended June 30, 2014.
Quarterly Information
Selected consolidated financial information for each of the last eight quarters (unaudited) as prepared in accordance with International Financial Reporting Standards:
| June 30, 2015 $ | March 31, 2015 $ | December 31, 2014 $ | September 30, 2014 $ | |||||||||||||
| Total Assets | 5,214,330 | 5,871,618 | 5,769,732 | 6,001,4021 | ||||||||||||
| Working Capital | 3,693,257 | 4,573,701 | 4,614,970 | 5,356,970 | ||||||||||||
| Revenue | 47,682 | 41,049 | 2,987 | 830 | ||||||||||||
| Net Loss | (1,777,964 | ) | (1,431,446 | ) | (3,190,032 | )1 | (1,441,555 | )1 | ||||||||
| Loss per Share | (0.05 | ) | (0.04 | ) | (0.11 | )1 | (0.05 | )1 | ||||||||
| June 30, 2014 $ | March 31, 2014 $ | December 31, 2013 $ | September 30, 2013 $ | |||||||||||||
| Total Assets | 6,170,9481 | 4,296,2661 | 4,987,381 | 6,035,300 | ||||||||||||
| Working Capital | 5,317,383 | 3,256,670 | 3,975,788 | 4,806,837 | ||||||||||||
| Revenue | 2,890 | — | — | — | ||||||||||||
| Net Loss | (1,066,276 | )1 | (2,142,578 | )1 | (764,562 | ) | (1,572,795 | ) | ||||||||
| Loss per Share | (0.04 | )1 | (0.07 | )1 | (0.03 | ) | (0.05 | ) | ||||||||
1The Company has restated comparative figures to include the capitalization of website development costs that were eligible for capitalization but were not capitalized until the third and fourth quarter of 2014. There was no impact to the year ended 2014 amounts.
Three months ended June 30, 2015 and 2014
For the three months ended June 30, 2015, we posted net loss of $1,777,964 compared to net loss of $1,066,276 for the same period in 2014. Net loss per share was $0.05 (2014 - $0.04). The $711,688 difference in net loss was primarily a result of increased operations and the further commercialization of our platform. This resulted in increases in consulting, general and administrative and professional fees as discussed above. These increases were offset by a decrease in amortization which was $188,956 for the three months ended June 30, 2015 as compared to $301,310 for the three months ended June 30, 2014.
| 8 |
Liquidity and Capital Resources
Sources of Liquidity
Since our inception, we have incurred significant operating losses. We anticipate that we will continue to incur losses for at least the next several years. As a result, we will need additional capital to fund our operations, which we may obtain from additional financings, debt and operations revenue or other sources. To date, we have financed our operations primarily through the issuance of our Common Shares.
As at June 30, 2015, we had total assets of $5,214,330 compared with $5,769,732 as at December 31, 2014. The total assets balance is comparable to the prior period. This decrease was the result of a decrease in cash. We had a cash balance of $4,100,104 and working capital of $3,693,257 at June 30, 2015, compared with a cash balance of $4,517,137 and working capital of $4,614,970 at December 31, 2014. The cash balance and working capital decreased as a result of a decrease in cash as more cash was used in operations during the current year and as a result of an increase in liabilities as result of incurring increased professional fees and consulting expenses.
Our unaudited consolidated financial statements have been prepared on the going concern basis, which assumes that we will be able to realize our assets and discharge our liabilities in the normal course of business. As at June 30, 2015, we had not generated significant revenues, has negative cash flows from operations, and has an accumulated deficit of $21,651,866. The continued operations of the Company are dependent on our ability to generate future cash flows or obtain additional financing. Management is pursuing equity financing. Management is of the opinion that sufficient working capital will be obtained from external financing to meet our liabilities and commitments as they become due, although there is a risk that additional financing will not be available on a timely basis or on terms acceptable to us. These factors, among others, may cast substantial doubt as to the ability of the Company to continue as a going concern.
Related Party Transactions
As of June 30, 2015, we were owed $Nil (December 31, 2014 - $88,500) and $Nil (December 31, 2014 - $88,400), for loans to our Chief Executive Officer and Chief Financial Officer, respectively, which were unsecured, non-interest bearing, and due on demand. The loans were converted to bonus compensation and treated as management fees occurring in March 2015, respectively, for services rendered by each executive in 2013.
During the six months ended June 30, 2015, we incurred management fees of $325,339 (2014 - $129,659), salaries of $46,928 (2014 - $42,555), and a bonus of $9,256 (2014 - $13,517) to our various officers.
During the six months ended June 30, 2015, we recognized stock-based compensation expense of $Nil (2014 - $250,778) for Nil (2014 - 100,000) stock options granted to our officers and directors.
The amounts incurred are in the normal course of operations and have been recorded at their exchange amounts, which are the amounts agreed upon by the transacting parties.
| 9 |
Cash Flows
The following table summarizes the results of our cash flows for the six months ended June 30, 2015 and 2014.
| 2015 | 2014 (Restated – See Below) | |||||||
| Opening balance | $ | 4,517,137 | $ | 3,341,649 | ||||
| Net cash (outflow) from operating activities | (2,402,691 | ) | (1,517,571 | ) | ||||
| Net cash inflow / (outflow) from investing activities | (348,313 | ) | 248,598 | |||||
| Net cash inflow from financing activities | 2,333,971 | 3,120,513 | ||||||
| Closing balance | $ | 4,100,104 | $ | 5,193,189 | ||||
The Company has revised comparative figures to include the capitalization of website development costs that were eligible for capitalization but were not capitalized until the third and fourth quarter of 2014. There was no impact on the results for the year ended December 31, 2014.
| For the Six Months Ended June 30, 2014 | ||||||||||||
As Previously Stated | Restatement | As Adjusted | ||||||||||
| Net cash (outflow) from operating activities | $ | (1,757,799 | ) | $ | 240,228 | $ | (1,517,571 | ) | ||||
| Net cash inflow / (outflow) from investing activities | $ | 488,826 | $ | (240,228 | ) | $ | 248,598 | |||||
Operating Activities
Net cash outflow from operating activities increased by $885,120, or 58%, to $2,402,691 for the six months ended June 30, 2015 compared to $1,517,571 for the six months ended June 30, 2014. This increase was primarily due to increases in general and administrative expenses of $162,325, and in professional fees of $848,135 for the six months ended June 30, 2015 as compared to 2014.
Investing Activities
Net cash outflow for the six months ended June 30, 2015 was $348,313 as compared to a net cash inflow of $248,598 for the six months ended June 30, 2014. The difference relates primarily to proceeds from the redemption of short-term investments of $508,477 during the 2014 period.
Financing Activities
Net cash inflow from financing activities in all periods presented relates to the proceeds received from the various sales of our equity securities, net of expenses. We received $2,158,017 from the exercise of options and warrants during the six months ended June 30, 2015 as compared to $264,250 during the six months ended June 30, 2014. We also received $2,856,263 from share subscriptions during the six months ended June 30, 2014 as compared to $nil during the six months ended June 30, 2015.
| 10 |
Contractual Obligations and Commitments
The following table summarizes our contractual commitments and obligations as of June 30, 2015.
| Payments Due By Period | ||||||||||||||||||||
| Total | Less Than 1 Year | Between 1 and 3 Years | Between 3 and 5 Years | More Than 5 Years | ||||||||||||||||
| Operating lease obligations | $ | 103,183 | $ | 49,514 | $ | 40,428 | $ | 13,241 | $ | — | ||||||||||
| Finance lease obligations | 7,494 | 2,956 | 4,538 | — | — | |||||||||||||||
| Total contractual obligations | $ | 110,677 | $ | 52,470 | $ | 44,966 | $ | 13,241 | $ | — | ||||||||||
Off-Balance Sheet Arrangements
We do not have any, and during the periods presented we did not have any, off-balance sheet arrangements, other than the contractual obligations and commitments described above.
Funding Requirements
We anticipate that our expenses will increase substantially in connection with the expansion of our engineering, sales, marketing and further development of the RESAAS platform.
In addition, our expenses will increase if and as we:
| ● | continue the research and development of internally designed and built tools, features and applications; |
| ● | increase our marketing efforts to identify and develop additional business relationships and opportunities; |
| ● | maintain, expand and protect our intellectual property portfolio; |
| ● | hire additional technical and development personnel; |
| ● | expand our physical presence in the United States and abroad; and |
| ● | add operational, financial and management information systems and personnel, including personnel to support our platform development and planned future commercialization efforts. |
We believe that our existing cash and cash equivalents will be sufficient to enable us to fund our operating expenses and capital expenditure requirements through April 2016. We have based this estimate on assumptions that may prove to be wrong, and we could use our capital resources sooner than we currently expect. Our future capital requirements will depend on many factors, including:
| ● | maintaining, enforcing and protecting our intellectual property rights and defending against any intellectual property-related claims; |
| ● | our ability to establish and maintain collaborations, licensing or other arrangements and the financial terms of such arrangements; |
| ● | the extent to which we acquire or invest in other businesses, products and technologies; |
| 11 |
| ● | the rate of the expansion of our physical presence in the United States and abroad; and |
| ● | the costs of operating as a public company. |
Until such time, if ever, as we can generate substantial revenues, we expect to finance our cash needs through a combination of equity offerings, collaborations, strategic alliances, debt financings, and marketing, distribution or licensing arrangements. We do not have any committed external source of funds. To the extent that we raise additional capital through the sale of equity or convertible debt securities, the ownership interest of our existing shareholders may be diluted, and the terms of these securities may include liquidation or other preferences that adversely affect the rights of holders of our Common Shares. Debt financing, if available, may involve agreements that include covenants limiting or restricting our ability to take specific actions, such as incurring additional debt, making capital expenditures or declaring dividends or other distributions.
If we raise additional funds through collaborations, strategic alliances or marketing, distribution or licensing arrangements with third parties, we may have to relinquish valuable rights to our technologies, future revenue streams, or to grant licenses on terms that may not be favorable to us. If we are unable to raise additional funds through equity or debt financings or other arrangements when needed, we may be required to delay, limit, reduce or terminate our platform development or future commercialization efforts or grant rights to develop and market platform that we would otherwise prefer to develop and market ourselves.
Critical Accounting Policies and Significant Judgments and Estimates
We make estimates and assumptions about the future that affect the reported amounts of assets and liabilities. Estimates and judgments are continually evaluated based on historical experience and other factors, including expectations of future events that are believed to be reasonable under the circumstances. In the future, actual experience may differ from these estimates and assumptions.
The effect of a change in accounting estimate is recognized prospectively by including it in comprehensive income in the period of the change, if the change affects that period only, or in the period of the change and future periods, if the change affects both.
Information about critical judgments in applying accounting policies that have the most significant risk of causing material adjustment to the carrying amounts of assets and liabilities recognized in our consolidated financial statements within the next financial year are discussed below.
(a) Website Development Costs
Website development costs consist of costs incurred to develop Internet websites to earn revenue with respect to our business operations. Costs are capitalized in accordance with SIC Interpretation 32, Intangible Assets – Web Site Cost, and are amortized under IAS 38, Intangible Assets, over its estimated useful life commencing when the Internet website has been completed. We amortize the capitalized costs over their useful life of two years.
(b) Share-based Payments
The grant date fair value of share-based payment awards granted to employees is recognized as a stock-based compensation expense, with a corresponding increase in equity, over the period that the employees unconditionally become entitled to the awards. The amount recognized as an expense is adjusted to reflect the number of awards for which the related service and non-market vesting conditions are expected to be met, such that the amount ultimately recognized as an expense is based on the number of awards that do meet the related service and non-market performance conditions at the vesting date. For share-based payment awards with non-vesting conditions, the grant date fair value of the share-based payment is measured to reflect such conditions and there is no true-up for differences between expected and actual outcomes.
Where equity instruments are granted to parties other than employees, they are recorded by reference to the fair value of the services received. If the fair value of the services received cannot be reliably estimated, we measure the services received by reference to the fair value of the equity instruments granted, measured at the date the counterparty renders service.
| 12 |
All equity-settled share-based payments are reflected in share-based payment reserve, until exercised. Upon exercise, shares are issued from treasury and the amount reflected in share-based payment reserve is credited to share capital, adjusted for any consideration paid.
(c) Impairment of Non-financial Assets
The carrying amounts of our non-financial assets are reviewed at each reporting date to determine whether there is any indication of impairment. If indicators exist, then the asset’s recoverable amount is estimated. The recoverable amounts of the following types of intangible assets are measured annually whether or not there is any indication that they may be impaired:
| ● | an intangible asset with an indefinite useful life |
| ● | an intangible asset not yet available for use |
| ● | goodwill acquired in a business combination |
The recoverable amount of an asset or cash-generating unit is the greater of its value in use and its fair value less costs to sell. In assessing value in use, the estimated future cash flows are discounted to their present value using a pre-tax discount rate that reflects current market assessments of the time value of money and the risks specific to the asset. For the purpose of impairment testing, assets that cannot be tested individually are grouped together into the smallest identifiable group of assets that generates cash inflows from continuing use that are largely independent of the cash inflows of other assets or groups of assets (the cash-generating unit, or “CGU”).
Our corporate assets do not generate separate cash inflows. If there is an indication that a corporate asset may be impaired, then the recoverable amount is determined for the CGU to which the corporate asset belongs.
An impairment loss is recognized if the carrying amount of an asset or its CGU exceeds its estimated recoverable amount. Impairment losses are recognized in profit or loss. Impairment losses recognized in respect of CGUs are allocated first to reduce the carrying amount of any goodwill allocated to the units, and then to reduce the carrying amounts of the other assets in the unit (group of units) on a pro rata basis.
In respect of assets other than goodwill and intangible assets that have indefinite useful lives, impairment losses recognized in prior periods are assessed at each reporting date for any indications that the loss has decreased or no longer exists. An impairment loss is reversed if there has been a change in the estimates used to determine the recoverable amount. An impairment loss is reversed only to the extent that the asset’s carrying amount does not exceed the carrying amount that would have been determined, net of depreciation or amortization, if no impairment loss had been recognized.
New Accounting Pronouncements
Management has considered that the following amendments, revisions and new IFRSs that are mandatory for annual periods beginning after January 1, 2016 or later periods might not have a material effect on our future disclosure, results and financial position:
| ● | IFRS 9, Financial Instruments (New) |
| ● | IFRS 15, Revenue from Contracts with Customers |
Other accounting standards or amendments to existing accounting standards that have been issued but have future effective dates are either not applicable or are not expected to have a significant impact on our financial statements.
| 13 |
Quantitative and Qualitative Disclosures about Financial Risks
Our activities expose us to a variety of financial risks: market risk (including foreign currency risk); cash flow and fair value interest rate risk; credit risk; and liquidity risk. Our principal financial instrument comprises cash and cash equivalents, and this is used to finance our operations. We have various other financial instruments such as trade receivables and payables that arise directly from our operations. The category of loans and receivables contains only trade and other receivables, shown on the face of the balance sheet, all of which mature within one year. We have compared fair value to book value for each class of financial asset and liability and no difference was identified. We have a policy, which has been consistently followed, of not trading in financial instruments.
Interest Rate Risk
We do not hold any derivative instruments to manage interest rate risk.
Foreign Currency Risk
Foreign currency risk refers to the risk that the value of a financial commitment or recognized asset or liability will fluctuate due to changes in foreign currency rates. Our net income and financial position, as expressed in Canadian dollars, are exposed to movements in foreign exchange rates against the U.S. dollar and the euro. We are exposed to foreign currency risk as a result of operating transactions and the translation for foreign bank accounts. We monitor our exposure to foreign exchange risk. Exposures are generally managed through natural hedging via the currency denomination of cash balances and any impact currently is not material to us.
Credit Risk
Our credit risk with respect to customers is limited and we did not have any trade receivables outstanding as of March 31, 2015. Financial instruments that potentially expose us to concentrations of credit risk consist primarily of short-term cash investments and trade accounts receivable.
Liquidity Risk
We have funded our operations since inception primarily through the issuance of equity securities. Until such time as we can generate significant revenue from platform, if ever, we expect to finance our operations through a combination of public or private equity or debt financings or other sources. Adequate additional financing may not be available to us on acceptable terms, or at all. Our inability to raise capital as and when needed would have a negative impact on our financial condition and our ability to pursue our business strategy.
Outstanding Share Data
As at August 31, 2015, we had no Class A preferred shares issued and outstanding.
As at August 31, 2015, we had no Class B preferred shares issued and outstanding.
As at August 31, 2015, we had 33,233,880 Common Shares issued and outstanding.
As at August 31, 2015, we had 2,191,600 stock options and 1,480,903 warrants exercisable and outstanding.
Escrowed Shares
As at August 31, 2015, the Company had 1,950,001 Common Shares held in escrow.
| 14 |
Additional Disclosure for Venture Issuers Without Significant Revenues
During the six months ended June 30, 2015, the material components of general & administrative expenses included rent of $44,399 (2014 - $39,021), employee wages of $468,876 (2014 - $387,020), office expenses of $100,328 (2014 - $102,689), telephone expenses of $30,227 (2014 - $20,420), computer and information technology expenses of $59,563 (2014 - $18,567), automotive expenses of $24,398 (2014 - $14,805), and insurance of $18,511 (2014 - $nil).
| 15 |