Exhibit 99.3
MANAGEMENT’S DISCUSSION AND ANALYSIS OF FINANCIAL CONDITION
AND RESULTS OF OPERATIONS
This Management’s Discussion and Analysis (“MD&A”) of RESAAS Services Inc. (the “Company”, “we”, “our”, “us” or “RESAAS”) is dated May 1, 2017. You should read this MD&A in conjunction with our audited consolidated financial statements and the related notes thereto for the year ended December 31, 2016. We present our audited consolidated financial statements in Canadian dollars and in accordance with International Financial Reporting Standards (“IFRS”), as issued by the International Accounting Standards Board (“IASB”). All references to dollar amounts are in Canadian dollars unless otherwise noted.
This MD&A contains forward-looking statements that involve risks and uncertainties. Such information, although considered to be reasonable by the Company’s management at the time of preparation, may prove to be inaccurate and actual results may differ materially from those anticipated in any forward-looking statements. Additional information on the Company, including our voluntarily-filed AIF, is available on SEDAR at www.sedar.com.
RESAAS has developed a cloud-based social business software platform for the real estate services industry.
We have created a suite of tools which integrate with the platform, including an enterprise social network, a global referral network, lead generation engine, listing management, client engagement modules, customer relationship management (CRM) tools, analytics, file sharing and an advertising engine. These tools and functionality are made available exclusively to owners of real estate brokerage firms and brokers, licensed real estate agents, and Realtors and are designed to increase user productivity through better communication and collaboration between users.
Our mission is to enable agents, Realtors and brokers to communicate effectively, connect instantly and engage meaningfully with one another through a platform built for their benefit. Our platform allows for instant discussion and debate, both on local and global scale, for facilitating easier and richer communication within the real estate industry. We commenced operations of our website in February 2013 and began full-scale revenue generating activities for the RESAAS platform in January 2015.
Our platform is designed with a focus on search engine optimization (SEO), ensuring that changes to our users’ profile pages are indexed by major search engines in real-time. Users are also able to synchronize their accounts with Facebook personal pages, Facebook Business pages, Twitter and LinkedIn. This allows each post on RESAAS to be automatically sent out to those networks as well, should the user choose to do so.
We also offer real estate agents, Realtors and brokers who have registered on our website, and have received a public-facing profile page, the ability to actively market themselves to home buyers and sellers, plus the ability to create, manage and track the performance of their own highly-targeted social advertisements using our internally-built advertising engine. Professional users on RESAAS are able to upload their listings, announce open houses and successful sales, create referrals and generate leads by interacting with professionals in other markets. We have also developed tools that allow non-professionals to interact with our professional user base, such as RESAAS Q&A, which allows prospective clients to ask real estate questions to our professional users.
Revenue Generating Services
In January 2015, we began offering premium subscription services to our professional user base. Prior to 2015, we generated nominal revenue from the sale of advertising. While we continue to look for additional streams of revenue and advertising partners, we expect that our revenue generation will primarily come from enterprise partnerships and conversion of our user base to paid premium service subscriptions.
Key Business Metrics
To analyze our business performance, determine financial forecasts, and help develop long-term strategic plans, we use the following key business metrics:
| · | Professional user — means an individual who has registered on the RESAAS website and has been verified by our team as a professional real estate agent, Realtor or broker. |
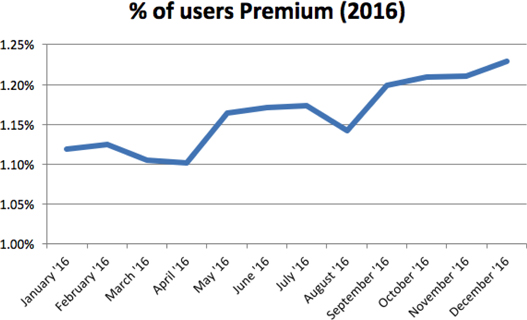
| · | Premium user — means a professional user who has upgraded their account to receive access to our premium service package through a monthly or annual subscription payment. |
| · | Premium conversion rate — means the rate at which we convert our current professional user base to premium users. |
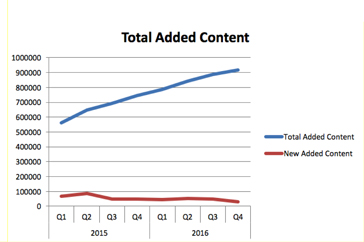
| · | Unique real estate content — means unique content that is posted to the RESAAS platform in the form of postings and real estate listings. We do not include comments to original postings or reblasts of the content in this metric. |
Factors Affecting Our Performance
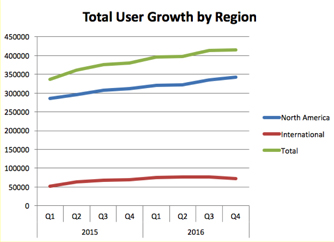
Growth in Registered Professional Users in North America.As of December 31, 2016, our professional user base in North America was 342,713. Our user growth rates are affected by digital marketing campaigns and general market penetration. We expect that our user base in North America will continue to increase as we achieve higher market penetration rates but may do so at a slower pace depending on our digital marketing activity.
Growth in Users in Other Regions. As of December 31, 2016, our professional user base outside of North America was 72,087. We anticipate increased user growth in the regions of South America and Europe. In particular, we anticipate activity to significantly increase in Brazil and central Europe where there exists a growing middle class. We intend to establish a local presence in such regions and hire additional staff to further develop brand awareness. In general, new users in regions outside North America do not require material incremental infrastructure investments because we are able to utilize existing infrastructure such as our data centers in the United States and Canada to make our platform available to users.
Conversion to Premium Services. In January 2015, we began efforts to convert our professional user base to paid premium users. Conversion can occur on an individual basis or as a result of agreements with brokerages which provide premium services to multiple users. We expect conversion rates of our existing professional user base to continue to display steady growth as our premium services gain recognition.
User Engagement. Changes in user engagement, such as postings and real estate listings, affect our revenue and financial performance. Growth in user engagement and posting of unique real estate content may increase the opportunities for us to display advertising and our ability to deliver relevant commercial content to users. Growth in user engagement also generally results in increases in our expenses and capital expenditures required to support user activity.
Our key business metrics are as follows:
| | | | 2013 |
| | | | Q1 | | Q2 | | Q3 | | Q4 |
| Professional Users | | | | | | | | | |
| North America | | | 7,502 | | 8,955 | | 14,683 | | 64,825 |
| International | | | 524 | | 619 | | 804 | | 1,075 |
| Total | | | 8,026 | | 9,574 | | 15,487 | | 65,900 |
| | | | | | | | | | |
| Unique Real Estate Content | | | | | | | | | |
| New Added Content | | | 4,022 | | 9,324 | | 17,480 | | 52,838 |
| Total Added Content | | | 4,022 | | 13,346 | | 30,826 | | 83,664 |
| | | 2014 | |
| | | Q1 | | | Q2 | | | Q3 | | | Q4 | |
| Professional Users | | | | | | | | | | | | | | | | |
| North America | | | 176,641 | | | | 228,783 | | | | 265,122 | | | | 280,707 | |
| International | | | 24,237 | | | | 27,116 | | | | 42,818 | | | | 49,243 | |
| Total | | | 200,878 | | | | 255,899 | | | | 307,940 | | | | 329,950 | |
| | | | | | | | | | | | | | | | | |
| Unique Real Estate Content | | | | | | | | | | | | | | | | |
| New Added Content | | | 103,102 | | | | 96,177 | | | | 131,103 | | | | 80,082 | |
| Total Added Content | | | 186,766 | | | | 282,943 | | | | 414,046 | | | | 494,128 | |
| | | 2015 | |
| | | Q1 | | | Q2 | | | Q3 | | | Q4 | |
| Professional Users | | | | | | | | | | | | | | | | |
| North America | | | 285,254 | | | | 296,474 | | | | 307,854 | | | | 311,378 | |
| International | | | 51,826 | | | | 64,181 | | | | 67,489 | | | | 68,866 | |
| Total | | | 337,080 | | | | 360,655 | | | | 375,343 | | | | 380,244 | |
| | | | | | | | | | | | | | | | | |
| Unique Real Estate Content | | | | | | | | | | | | | | | | |
| New Added Content | | | 65,911 | | | | 86,949 | | | | 46,393 | | | | 49,785 | |
| Total Added Content | | | 560,039 | | | | 646,988 | | | | 693,381 | | | | 743,166 | |
| | | 2016 | |
| | | Q1 | | | Q2 | | | Q3 | | | Q4 | |
| Professional Users | | | | | | | | | | | | | | | | |
| North America | | | 320,865 | | | | 321,653 | | | | 335,585 | | | | 342,713 | |
| International | | | 75,486 | | | | 76,582 | | | | 77,448 | | | | 72,087 | |
| Total | | | 396,351 | | | | 398,235 | | | | 413,033 | | | | 414,800 | |
| | | | | | | | | | | | | | | | | |
| Unique Real Estate Content | | | | | | | | | | | | | | | | |
| New Added Content | | | 44,291 | | | | 53,106 | | | | 46,461 | | | | 30,612 | |
| Total Added Content | | | 787,457 | | | | 840,563 | | | | 887,024 | | | | 917,636 | |
| | | | | | | | | | | | | | | | | |
| | | January 2015 | | | February 2015 | | | March 2015 | |
| Total Users | | | 331,544 | | | | 334,420 | | | | 337,080 | |
| Premium Users | | | 262 | | | | 685 | | | | 3,230 | |
| | | April 2015 | | | May 2015 | | | June 2015 | |
| Total Users | | | 343,901 | | | | 345,160 | | | | 360,655 | |
| Premium Users | | | 3,268 | | | | 3,351 | | | | 3,523 | |
| | | July 2015 | | | August 2015 | | | September 2015 | |
| Total Users | | | 365,383 | | | | 369,358 | | | | 375,797 | |
| Premium Users | | | 3,992 | | | | 4,067 | | | | 4,110 | |
| | | | | | | | | | | | | |
| | | | October 2015 | | | | November 2015 | | | | December 2015 | |
| Total Users | | | 377,363 | | | | 379,521 | | | | 380,244 | |
| Premium Users | | | 4,181 | | | | 4,222 | | | | 4,225 | |
| | | January 2016 | | | February 2016 | | | March 2016 | |
| Total Users | | | 381,093 | | | | 382,089 | | | | 396,351 | |
| Premium Users | | | 4,263 | | | | 4,297 | | | | 4,382 | |
| | | | | | | | | | | | | |
| | | | April 2016 | | | | May 2016 | | | | June 2016 | |
| Total Users | | | 396,941 | | | | 397,608 | | | | 398,235 | |
| Premium Users | | | 4,372 | | | | 4,629 | | | | 4,663 | |
| | | July 2016 | | | August 2016 | | | September 2016 | |
| Total Users | | | 398,816 | | | | 412,411 | | | | 413,033 | |
| Premium Users | | | 4,679 | | | | 4,711 | | | | 4,953 | |
| | | | | | | | | | | | | |
| | | | October 2016 | | | | November 2016 | | | | December 2016 | |
| Total Users | | | 413,614 | | | | 414,048 | | | | 414,800 | |
| Premium Users | | | 5,001 | | | | 5,010 | | | | 5,097 | |
Results of Operations
Comparison of the years ended December 31, 2016, 2015 and 2014
The following table summarizes the results of our operations for the years ended December 31, 2016, 2015 and 2014 together with the changes to those items.
| | | Year Ended December 31, | |
| | | 2016 $ | | | 2015 $ | | | 2014 $ | |
| Revenue | | | 304,719 | | | | 107,192 | | | | 6,707 | |
| Interest income | | | 30,542 | | | | 15,760 | | | | 20,131 | |
| Operating expenses | | | | | | | | | | | | |
| Amortization | | | 1,214,982 | | | | 806,961 | | | | 1,096,941 | |
| Consulting fees | | | 491,015 | | | | 417,459 | | | | 360,962 | |
| Filing fees | | | 94,482 | | | | 45,153 | | | | 79,555 | |
| Foreign exchange loss | | | 20,732 | | | | 8,280 | | | | 7,949 | |
| General and administrative | | | 1,743,275 | | | | 1,616,430 | | | | 1,382,137 | |
| Management fees | | | 397,838 | | | | 468,516 | | | | 276,758 | |
| Promotion and advertising | | | 322,212 | | | | 626,810 | | | | 772,743 | |
| Professional fees | | | 479,479 | | | | 793,469 | | | | 279,159 | |
| Stock-based compensation | | | 3,486,175 | | | | 158,871 | | | | 3,428,438 | |
| Travel | | | 171,808 | | | | 192,244 | | | | 182,637 | |
| Net loss | | | (8,086,737 | ) | | | (5,011,241 | ) | | | (7,840,441 | ) |
| Basic and diluted loss per share | | | (0.21 | ) | | | (0.15 | ) | | | (0.26 | ) |
| Total current assets | | | 6,208,458 | | | | 6,899,195 | | | | 4,755,117 | |
| Total assets | | | 7,853,631 | | | | 7,898,500 | | | | 5,769,732 | |
| Total current liabilities | | | 431,938 | | | | 435,999 | | | | 140,147 | |
| Total liabilities | | | 438,299 | | | | 438,498 | | | | 145,057 | |
| Working capital | | | 5,776,520 | | | | 6,463,196 | | | | 4,614,970 | |
| Cash dividends | | | – | | | | – | | | | – | |
Revenue
Revenue consists of payments received from premium service subscriptions, custom projects and limited advertising revenue generated from our platform. We generated nominal revenue during the year ended December 31, 2014, $107,192 during the year ended December 31, 2015 and $304,719 during the year ended December 31, 2016. We anticipate that revenue will continue to increase with the further commercialization of our platform through conversions of professional users to paid premium services, advertising and enterprise contracts with brokerages.
Interest Income
Interest income consists of interest earned on cash and cash equivalents. We expect the amount of interest income earned to continue to be minimal.
Interest income increased by $14,782 to $30,542 for the year ended December 31, 2016 from $15,760 for the year ended December 31, 2015, and decreased by $4,371 to $15,760 for the year ended December 31, 2015 from $20,131 for the year ended December 31, 2014. The increase during fiscal 2016 was the result of a larger level of cash held. The decrease from fiscal 2014 to 2015 was due to decreased bank interest received as a result of a lower level of cash on hand and a reduction in the amount of interest earned on guaranteed investment certificates as a result of a decrease in both the amount of investment certificates held and the interest rate earned on the investment certificates.
Operating Expenses
Amortization
Amortization expense consists of the amortization of capitalized costs to develop the Company’s platform. The Company expects amortization to be consistent as the Company continues to capitalize the costs incurred to develop its platform.
Amortization expense increased by $408,021 or 51% to $1,214,982 for the year ended December 31, 2016 from $806,961 for the year ended December 31, 2015. This increase was due to the Company having a greater amount of website development costs subject to amortization during the year ended December 31, 2016 as compared to the prior year. Amortization expense decreased by $289,980 or 26% to $806,961 for the year ended December 31, 2015 from $1,096,941 for the year ended December 31, 2014. This decrease was due to the Company having a greater amount of website development costs subject to amortization during the year ended December 31, 2014 as compared to the year ended December 31, 2015.
Consulting
Consulting fees consist of expenses incurred for consultants hired to perform marketing and business development services. We anticipate that consulting fee expenses will continue to increase in the future as the number of consultants we engage increases along with the commercialization of our platform and an increase in our operations.
Consulting fees expense increased by $73,556 or 18% to $491,015 for the year ended December 31, 2016 from $417,459 for the year ended December 31, 2015. This increase was a result of additional consultants providing market development services during the year ended December 31, 2016. Consulting fees expense increased by $56,497 or 16% to $417,459 for the year ended December 31, 2015 from $360,962 for the year ended December 31, 2014. This increase was a result of additional consultants providing business and corporate development services during the year ended December 31, 2015.
Filing Fees
Filing fees consist of expenses associated with being a publicly traded company in Canada and the United States. These expenses include regulatory, listing and compliance and costs. We anticipate these expenses to increase in the future as we increase our operations and if we successfully list on an exchange in the United States.
Filing fees expense increased by $49,329 or 109% to $94,482 for the year ended December 31, 2016 from $45,153 for the year ended December 31, 2015. This increase was due to the Company maintaining additional listings from prior years and exploring other listing options. Filing fees expense decreased by $34,402 or 43% to $45,153 for the year ended December 31, 2015 from $79,555 for the year ended December 31, 2014. This decrease was due to the Company obtaining its OTCQX quotation during the year ended December 31, 2014.
Foreign Exchange Losses
The Company’s functional currency is the Canadian dollar. Foreign exchange losses are the result of the translation or settlement of foreign currency denominated transactions or balances. Foreign currency transactions are primarily undertaken in United States dollars.
Foreign exchange losses increased by a nominal $12,452 or 150% to $20,732 for the year ended December 31, 2016 from $8,280 for the year ended December 31, 2015. This is a minor increase from the prior year. Foreign exchange losses increased by a nominal $331 or 4% to $8,280 for the year ended December 31, 2015 from $7,949 for the year ended December 31, 2014. This is comparable to the prior year.
General and Administrative Expenses
General and administrative expenses consist primarily of salaries and benefits related to our executive, finance, business development, human resources and support functions. Other general and administrative expenses include facility-related costs and expenses associated with the requirements of being a listed public company in Canada and insurance.
We anticipate that our general and administrative expenses will increase in the future as we increase our headcount to support our continued development and further commercialization of our platform.
General and administrative expenses increased by $126,845, or 8%, to $1,743,275 for the year ended December 31, 2016 from $1,616,430 for the year ended December 31, 2015. This increase was primarily a result of bonuses to staff incurred during the year ended December 31, 2016. General and administrative expenses increased by $234,293, or 17%, to $1,616,430 for the year ended December 31, 2015 from $1,382,137 for the year ended December 31, 2014. General and administrative expenses increased primarily as a result of an increase in the amount of staffing and overhead costs incurred during the year ended December 31, 2015 compared to the prior year.
Management Fees
Management fee expenses consist primarily of salaries and benefits incurred to directors and officers. We expect management fees to increase moderately in the future.
Management fees decreased by $70,678 or 15% to $397,838 for the year ended December 31, 2016 from $468,516 for year the ended December 31, 2015. Management fees increased by $191,758 or 69% to $468,516 for the year ended December 31, 2015 from $276,758 for year ended December 31, 2014. The increase in management fees during fiscal 2015 was primarily the result of declaring bonuses of $176,900 to management which were offset by loans owed by management.
Promotion and Advertising
Promotion and advertising expenses consist primarily of costs incurred to market the platform. We anticipate that promotion and advertising expenses will increase with the commercialization of our platform and with an increase in our operations.
Promotion and advertising expense decreased by $304,598 or 49% to $322,212 for the year ended December 31, 2016 from $626,810 for the year ended December 31, 2015. Promotion and advertising expense decreased by $145,933 or 19% to $626,810 for the year ended December 31, 2015 from $772,743 for the year ended December 31, 2014. These decreases were largely due to changing our focus to more enterprise selling during 2015 and 2016 which requires less external advertising.
Professional Fees
Professional fee expenses consist primarily of costs incurred for legal, accounting and auditing services. We anticipate that professional fees will increase as our operations and activity continue to increase.
Professional fee expenses decreased by $313,990, or 40%, to $479,479 for the year ended December 31, 2016 from $793,469 for the year ended December 31, 2015. Professional fees decreased during 2016 as a result of decreased accounting and legal costs as the Company was not undertaking a U.S. listing. Professional fee expenses increased by $514,310, or 184%, to $793,469 for the year ended December 31, 2015 from $279,159 for the year ended December 31, 2014. These increases were the result of an increase in the Company’s operations and activity during the year ended December 31, 2015, which increased the need for additional legal and accounting services.
Stock-Based Compensation
Stock-based compensation consists of the grant date fair value of share-based payment awards granted to employees recognized over the period that the employees unconditionally become entitled to the awards. We anticipate that stock-based compensation expenses will continue to increase in the future as the number of employees and consultants engaged by the Company increases.
Stock-based compensation expense increased by $3,327,304 or 2094% to $3,486,175 for the year ended December 31, 2016 from $158,871 for the year ended December 31, 2015. This increase was due to no stock options being granted during the year ended December 31, 2015 as compared to granting 5,059,950 stock options during the year ended December 31, 2016. Stock-based compensation expense decreased by $3,269,567 or 95% to $158,871 for the year ended December 31, 2015 from $3,428,438 for the year ended December 31, 2014. This decrease was due to no stock options being granted during the year ended December 31, 2015 as compared to granting 2,150,000 stock options during the year ended December 31, 2014.
Travel
Travel expenses consist primarily of costs related to travel. We anticipate that our travel expenses will increase in the future as we further commercialize our platform and attempt to access different markets.
Travel expense decreased by $20,436, or 11%, to $171,808 for the year ended December 31, 2016 from $192,244 for the year ended December 31, 2015. Travel expenses decreased during fiscal 2016 as a result of decreased travel for financing purposes. Travel expense increased by $9,607, or 5%, to $192,244 for the year ended December 31, 2015 from $182,637 for the year ended December 31, 2014. The increased travel expenses during fiscal 2015 were the result of increased travel for the promotion and marketing of the platform, financing and business development during that year.
Quarterly Information
Selected consolidated financial information for each of our last eight quarters (unaudited) as prepared in accordance with IFRS is as follows:
| | | December 31,
2016
$ | | | September 30,
2016
$ | | | June 30,
2016
$ | | | March 31,
2016
$ | |
| Total Assets | | | 7,853,631 | | | | 8,951,582 | | | | 6,202,359 | | | | 6,800,404 | |
| Working Capital | | | 5,776,520 | | | | 7,029,283 | | | | 4,371,115 | | | | 5,532,294 | |
| Revenue | | | 102,518 | | | | 47,091 | | | | 56,729 | | | | 98,381 | |
| Net Loss | | | (1,881,255 | ) | | | (1,295,163 | ) | | | (3,957,267 | ) | | | (953,052 | ) |
| Loss per Share | | | (0.04 | ) | | | (0.03 | ) | | | (0.11 | ) | | | (0.03 | ) |
| | | December 31,
2015
$ | | | September 30,
2015
$ | | | June 30,
2015
$ | | | March 31,
2015
$ | |
| Total Assets | | | 7,898,500 | | | | 4,806,331 | | | | 5,701,514 | | | | 5,871,618 | |
| Working Capital | | | 6,463,196 | | | | 2,882,358 | | | | 3,693,257 | | | | 4,573,701 | |
| Revenue | | | 3,170 | | | | 15,291 | | | | 47,682 | | | | 41,049 | |
| Net Loss | | | (1,230,957 | ) | | | (1,058,058 | ) | | | (1,290,780 | ) | | | (1,431,446 | ) |
| Loss per Share | | | (0.04 | ) | | | (0.03 | ) | | | (0.04 | ) | | | (0.04 | ) |
Three months ended December 31, 2016 and September 30, 2016
At December 31, 2016, total assets were $7,853,631 and working capital was $5,776,520 compared to total assets of $8,951,582 and working capital was $7,029,283 at September 30, 2016. The decrease in total assets and working capital was the result of a decrease in cash as the result of operating expenditures. For the three months ended December 31, 2016, the Company posted a net loss of $1,881,255 compared to a net loss of $1,295,163 for three months ended September 30, 2016. Net loss per share was $0.04 for the three months ended December 31, 2016, compared to $0.03 for the three month period ended September 30, 2016. The increase in net loss was primarily a result an increase in stock-based compensation expense during the three months ended December 31, 2016. This increase was due to granting 1,274,000 options during the three months ended December 31, 2016 compared to none in the comparative period.
Three months ended December 31, 2016 and December 31, 2015
At December 31, 2016, total assets were $7,853,631 and working capital was $5,776,520 compared to total assets of $7,898,500 and working capital of $6,463,196 at December 31, 2015. The decrease in assets from December 31, 2016 to December 31, 2015, was a result of a decrease in cash offset by an increase in website development costs. The decrease in working capital was the result of the decrease in cash. For the three months ended December 31, 2016, the Company posted a net loss of $1,881,255 compared to a net loss of $1,230,957 for three months ended December 31, 2015. The increase in net loss was primarily a result of an increase in stock-based compensation expense during the three months ended December 31, 2016. This increase was due to granting 1,274,000 options during the three months ended December 31, 2016 compared none in the comparative period. The increase in stock-based compensation was offset by an increase in revenues for the three months ended December 31, 2016 compared to the three months ended December 31, 2015. This increase in revenue was a result of the Company further commercializing our platform in fiscal 2016 through the conversion of professional users to paid premium services, and through new enterprise contracts with brokerages.
Liquidity and Capital Resources
Sources of Liquidity
Since our inception, we have incurred significant operating losses. We anticipate that we will continue to incur losses for at least the next several years. As a result, we will need additional capital to fund our operations, which we may obtain from additional financings, debt and operations revenue or other sources. To date, we have financed our operations primarily through the issuance of our common shares.
As at December 31, 2016, we had total assets of $7,853,631 compared with $7,898,500 as at December 31, 2015. The decrease in assets is attributed to an increase in website development costs offset by a decrease in cash. The Company had a cash balance of $6,056,127 and working capital of $5,776,520 at December 31, 2016, compared with a cash balance of $6,820,022 and working capital of $6,463,196 at December 31, 2015. The decrease in cash and working capital was a result of a decrease in cash provided by financing activities from options exercised and proceeds received from a concurrent public offering and private placement during fiscal 2015.
The consolidated financial statements have been prepared on a going concern basis, which assumes that the Company will be able to realize its assets and discharge its liabilities in the normal course of business. As of December 31, 2016, the Company had not yet generated significant revenue or positive cash flow from operations and had an accumulated deficit of $31,540,434. These factors, among others, create substantial doubt as to the ability of the Company to continue as a going concern. Management believes that the proceeds from additional equity financing activities that it is currently pursuing, combined with revenue that the Company expects to generate in subsequent periods, will provide the Company with sufficient working capital to satisfy its liabilities and commitments as they become due for the foreseeable future. There can be no assurances that sufficient equity can be raised on acceptable terms on a timely basis. The Company’s strategy is to mitigate risks and uncertainties and to execute a business plan aimed at revenue growth and managing operating expenses and working capital requirements. Failure to implement this plan could have a material adverse effect on the Company’s financial condition and results of operations.
Taxation
As at December 31, 2016, we had non-capital losses carried forward of $15,344,695 in Canada and the United States which are available to offset future years’ taxable income. These losses expire as follows:
| | | Total
$ | |
| | | | | |
| 2029 | | | 94,951 | |
| 2030 | | | 303,915 | |
| 2031 | | | 592,844 | |
| 2032 | | | 1,535,364 | |
| 2033 | | | 2,201,066 | |
| 2034 | | | 3,173,287 | |
| 2035 | | | 3,683,974 | |
| 2036 | | | 3,759,294 | |
| | | | | |
| | | | 15,344,695 | |
Cash Flows
The following table summarizes the results of our cash flows for the years ended December 31, 2016, 2015 and 2014:
| | | 2016 | | | 2015 | | | 2014 | |
| Opening balance | | $ | 6,820,022 | | | $ | 4,517,137 | | | $ | 3,341,649 | |
| Net cash (outflow) from operating activities | | | (3,515,771 | ) | | | (3,768,074 | ) | | | (3,289,219 | ) |
| Net cash (outflow) from investing activities | | | (1,036,869 | ) | | | (730,421 | ) | | | (109,662 | ) |
| Net cash inflow from financing activities | | | 3,788,745 | | | | 6,801,380 | | | | 4,574,369 | |
| | | | | | | | | | | | | |
| Closing balance | | $ | 6,056,127 | | | $ | 6,820,022 | | | $ | 4,517,137 | |
Operating Activities
Net cash outflow from operating activities decreased by $252,303, or 7%, to $3,515,771 for the year ended December 31, 2016 compared to $3,768,074 for the year ended December 31, 2015. This increase was primarily due to increases in revenue of $197,527 and decreases in promotion and advertising of $304,598 and professional fees of $313,990, as offset by increases in filing fees of $49,329 and consulting fees of $73,556 for the year ended December 31, 2016 as compared to 2015. In addition, the Company had a large increase in accounts payable and accrued liabilities during the year ended December 31, 2015.
Net cash outflow from operating activities increased by $478,855, or 15%, to $3,768,074 for the year ended December 31, 2015 compared to $3,289,219 for the year ended December 31, 2014. This increase was primarily due to increases in consulting fees of $56,497, general and administrative costs of $234,293, management fees of $191,758 and professional fees of $514,310 for the year ended December 31, 2015 as compared to 2014.
Investing Activities
Net cash outflow for the years ended December 31, 2015, 2014 and 2013 includes the net amount of bank interest received on cash deposits and redeemed short-term investments less amounts paid to acquire property and equipment. Cash outflows increased during each of the years ended December 31, 2016 and 2015 as a result of increased in website development expenditures.
Financing Activities
Net cash inflow from financing activities in all periods presented primarily relates to the proceeds received from the various sales of our equity securities, net of expenses. We received $3,792,571 from the sale of equity securities during the year ended December 31, 2016, net of share issuance costs. We received $6,626,467 from the sale of equity securities during the year ended December 31, 2015, net of share issuance costs, and $4,574,369 from the sale of equity securities during the year ended December 31, 2014.
Related Party Transactions
In May 2015, the Company entered into an employment agreement with the then-Chief Executive Officer of the Company, pursuant to which the Chief Executive Officer agreed to serve for an initial term of 24 months in exchange for an annual base salary of $78,000. The Chief Executive Officer is also eligible to participate in all annual bonus, incentive, stock option, savings and retirement plans, policies and programs applicable generally to our senior executives. The Company may terminate the Chief Executive Officer’s employment with or without cause at any time. If the Company terminates the agreement without cause or the Chief Executive Officer resigns for material breach of any of the terms of the employment agreement the Company will continue to pay the Chief Executive Officer his full base salary in effect at the time of such termination, for a period of 15 months as severance pay.
On April 12, 2017, the Chief Executive Officer of the Company resigned from that position and was replaced by the President of the Company. This resignation had no impact on the compensation payable by the Company under the foregoing employment agreement since the Chief Executive Officer continues to serve as the Chairman of the Board.
In May 2015, the Company entered into an employment agreement with the Chief Financial Officer of the Company, pursuant to which the Chief Financial Officer agreed to serve for an initial term of 24 months in exchange for an annual base salary of $78,000. The Chief Financial Officer is also eligible to participate in all annual bonus, incentive, stock option, savings and retirement plans, policies and programs applicable generally to our senior executives. The Company may terminate the Chief Financial Officer’s employment with or without cause at any time. If the Company terminates the agreement without cause or the Chief Financial Officer resigns for material breach of any of the terms of the employment agreement the Company will continue to pay the Chief Financial Officer his full base salary in effect at the time of such termination, for a period of 15 months as severance pay.
In May 2015, the Company entered into an employment agreement with the President of the Company, pursuant to which the President agreed to serve for an initial term of 24 months in exchange for an annual base salary of $120,000. The President is also eligible to participate in all annual bonus, incentive, stock option, savings and retirement plans, policies and programs applicable generally to our senior executives. If the Company terminates the agreement without cause or the President resigns for material breach of any of the terms of the employment agreement the Company will continue to pay the President his full base salary in effect at the time of such termination, for a period of 15 months as severance pay. Additionally, the President’s employment agreement contemplates that he will be awarded options within the first 12 months of his employment to purchase in the aggregate up to 1,750,000 of our common shares equal to our stock price on the date of the respective grant. The vesting schedule and terms of the option grants are at our Board’s discretion and are to be determined at the time of grant. No options have been granted.
As of December 31, 2016, and 2015, we were owed $Nil (December 31, 2014 - $88,500) and $Nil (December 31, 2014 - $88,400), for loans to our Chief Executive Officer and Chief Financial Officer, respectively, which were unsecured, non-interest bearing, and due on demand. The loans were converted to bonus compensation and treated as management fees occurring in March 2015, respectively, for services rendered by each executive in 2013.
During the year ended December 31, 2016, the Company incurred management fees of $397,838 (2015 - $468,516) and salaries of $15,346 (2015 - $123,552) to various officers of the Company.
During the year ended December 31, 2016, we recognized stock-based compensation expense of $275,711 (2015 - $nil) for 260,950 (2015 - Nil) stock options granted to our officers and directors.
The amounts incurred are in the normal course of operations and have been recorded at their exchange amounts, which are the amounts agreed upon by the transacting parties.
Contractual Obligations and Commitments
The following table summarizes our contractual commitments and obligations as of December 31, 2016:
| | | Payments Due By Period | |
| | | | Total | | | | Less Than 1 Year | | | | Between 1 and 3 Years | | | | Between 3 and 5 Years | | | | More Than 5 Years | |
| Operating lease obligations | | $ | 405,083 | | | $ | 147,810 | | | $ | 257,273 | | | $ | – | | | $ | – | |
| | | | | | | | | | | | | | | | | | | | | |
| Finance lease obligations | | | 13,009 | | | | 7,365 | | | | 5,644 | | | | – | | | | – | |
| | | | | | | | | | | | | | | | | | | | | |
| Total contractual obligations | | $ | 418,092 | | | $ | 155,175 | | | $ | 262,917 | | | $ | – | | | $ | – | |
Off-Balance Sheet Arrangements
We do not have any, and during the periods presented we did not have any, off-balance sheet arrangements, other than the contractual obligations and commitments described above.
Funding Requirements
We anticipate that our expenses will increase substantially in connection with the expansion of our engineering, sales, marketing and further development of the RESAAS platform.
In addition, our expenses will increase if and as we:
| · | continue the development of internally designed and built tools, features and applications; |
| · | increase our marketing efforts to identify and develop additional business relationships and opportunities along with the increase in our sales force; |
| · | maintain, expand and protect our intellectual property portfolio; |
| · | hire additional technical and development personnel; |
| · | expand our physical presence in the United States and abroad; and |
| · | add operational, financial and management information systems and personnel, including personnel to support our platform development and planned future commercialization efforts. |
We believe that our existing cash and cash equivalents will be sufficient to enable us to fund our operating expenses and capital expenditure requirements through August 2018. We have based this estimate on assumptions that may prove to be wrong, and we could use our capital resources sooner than we currently expect. Our future capital requirements will depend on many factors, including:
| · | maintaining, enforcing and protecting our intellectual property rights and defending against any intellectual property-related claims; |
| · | our ability to establish and maintain collaborations, licensing or other arrangements and the financial terms of such arrangements; |
| · | the extent to which we acquire or invest in other businesses, products and technologies; |
| · | the rate of the expansion of our physical presence in the United States and abroad; and |
| · | the costs of operating as a public company. |
Until such time, if ever, as we can generate substantial revenues, we expect to finance our cash needs through a combination of equity offerings, collaborations, strategic alliances, debt financings, and marketing, distribution or licensing arrangements. We do not have any committed external source of funds. To the extent that we raise additional capital through the sale of equity or convertible debt securities, the ownership interest of our existing shareholders may be diluted, and the terms of these securities may include liquidation or other preferences that adversely affect the rights of holders of our common shares. Debt financing, if available, may involve agreements that include covenants limiting or restricting our ability to take specific actions, such as incurring additional debt, making capital expenditures or declaring dividends or other distributions.
If we raise additional funds through collaborations, strategic alliances or marketing, distribution or licensing arrangements with third parties, we may have to relinquish valuable rights to our technologies, future revenue streams, or to grant licenses on terms that may not be favorable to us. If we are unable to raise additional funds through equity or debt financings or other arrangements when needed, we may be required to delay, limit, reduce or terminate our platform development or future commercialization efforts or grant rights to develop and market platform that we would otherwise prefer to develop and market ourselves.
Critical Accounting Policies and Significant Judgments and Estimates
We make estimates and assumptions about the future that affect the reported amounts of assets and liabilities. Estimates and judgments are continually evaluated based on historical experience and other factors, including expectations of future events that are believed to be reasonable under the circumstances. In the future, actual experience may differ from these estimates and assumptions.
The effect of a change in accounting estimate is recognized prospectively by including it in comprehensive income in the period of the change, if the change affects that period only, or in the period of the change and future periods, if the change affects both.
Information about critical judgments in applying accounting policies that have the most significant risk of causing material adjustment to the carrying amounts of assets and liabilities recognized in our consolidated financial statements within the next financial year are discussed below.
| (a) | Website Development Costs |
Website development costs consist of costs incurred to develop Internet websites to earn revenue with respect to our business operations. Costs are capitalized in accordance with SIC Interpretation 32,Intangible Assets – Web Site Cost, and are amortized under IAS 38,Intangible Assets, over its estimated useful life commencing when the Internet website has been completed. We amortize the capitalized costs over their useful life of two years.
The grant date fair value of share-based payment awards granted to employees is recognized as a stock-based compensation expense, with a corresponding increase in equity, over the period that the employees unconditionally become entitled to the awards. The amount recognized as an expense is adjusted to reflect the number of awards for which the related service and non-market vesting conditions are expected to be met, such that the amount ultimately recognized as an expense is based on the number of awards that do meet the related service and non-market performance conditions at the vesting date. For share-based payment awards with non-vesting conditions, the grant date fair value of the share-based payment is measured to reflect such conditions and there is no true-up for differences between expected and actual outcomes.
Where equity instruments are granted to parties other than employees, they are recorded by reference to the fair value of the services received. If the fair value of the services received cannot be reliably estimated, we measure the services received by reference to the fair value of the equity instruments granted, measured at the date the counterparty renders service.
All equity-settled share-based payments are reflected in share-based payment reserve, until exercised. Upon exercise, shares are issued from treasury and the amount reflected in share-based payment reserve is credited to share capital, adjusted for any consideration paid.
| (c) | Impairment of Non-financial Assets |
The carrying amounts of our non-financial assets are reviewed at each reporting date to determine whether there is any indication of impairment. If indicators exist, then the asset’s recoverable amount is estimated.
The Company recognizes revenue in accordance with IAS 18,Revenue. Revenue consists of subscription fees, online advertising sales and projects. Revenue from subscription fees and online advertising is recognized only when the amount of revenue can be measured reliably, it is probable that the economic benefits associated with the transaction will flow to the entity, the stage of completion of the transaction at the end of the reporting period can be measured reliably, and the cost incurred for the transaction and the cost to complete the transaction can be measured reliably. Revenues for subscriptions are recognized over the term of the subscription agreement.
Projects consist of customer agreements to provide professional software services, including setup, integration and customization performed on the technology platform. The Company recognizes revenue related to such projects on a percentage of completion basis when the service is delivered to the customer, the fee is fixed and determinable, and collection of the fee is reasonably assured. Deposits received from customers in advance of the delivery of services are recorded as deferred revenue.
The recoverable amount of an asset or cash-generating unit is the greater of its value in use and its fair value less costs to sell. In assessing value in use, the estimated future cash flows are discounted to their present value using a pre-tax discount rate that reflects current market assessments of the time value of money and the risks specific to the asset. For the purpose of impairment testing, assets that cannot be tested individually are grouped together into the smallest identifiable group of assets that generates cash inflows from continuing use that are largely independent of the cash inflows of other assets or groups of assets (the cash-generating unit, or “CGU”).
Our corporate assets do not generate separate cash inflows. If there is an indication that a corporate asset may be impaired, then the recoverable amount is determined for the CGU to which the corporate asset belongs.
An impairment loss is recognized if the carrying amount of an asset or its CGU exceeds its estimated recoverable amount. Impairment losses are recognized in profit or loss. Impairment losses recognized in respect of CGUs are allocated first to reduce the carrying amount of any goodwill allocated to the units, and then to reduce the carrying amounts of the other assets in the unit (group of units) on a pro rata basis.
In respect of assets other than goodwill and intangible assets that have indefinite useful lives, impairment losses recognized in prior periods are assessed at each reporting date for any indications that the loss has decreased or no longer exists. An impairment loss is reversed if there has been a change in the estimates used to determine the recoverable amount. An impairment loss is reversed only to the extent that the asset’s carrying amount does not exceed the carrying amount that would have been determined, net of depreciation or amortization, if no impairment loss had been recognized.
Multiple deliverable arrangements:
The Company enters into arrangements with multiple deliverables that generally include subscriptions and services. Multiple-element arrangements are recognized as the revenue for each unit of accounting is earned based on the relative fair value of each unit of accounting as determined by an internal analysis of prices or by using the residual method.
New Accounting Pronouncements
Management has considered that the following amendments, revisions and new IFRSs that are mandatory for annual periods beginning after January 1, 2017 or later periods might not have a material effect on our future disclosure, results and financial position:
| · | IFRS 9,Financial Instruments (New; to replace IAS 39 and IFRIC 9) is effective for annual periods beginning on or after January 1, 2018. |
| · | IFRS 16,Leases is effective for annual periods beginning on or after January 1, 2019. |
In addition, IFRS 15,Revenue from Contracts with Customersis effective for annual periods beginning on or after January 1, 2018 with early adoption permitted. The Company intends to adopt IFRS 15 and the clarifications in its consolidated financial statements for the annual period beginning on January 1, 2018. The Company has commenced a preliminary assessment of the transition method and alternatives and the potential impact of IFRS 15 on its consolidated financial statements.
Other accounting standards or amendments to existing accounting standards that have been issued but have future effective dates are either not applicable or are not expected to have a significant impact on the Company’s financial statements.
Quantitative and Qualitative Disclosures about Financial Risks
Our activities expose us to a variety of financial risks: market risk (including foreign currency risk), cash flow and fair value interest rate risk, credit risk, and liquidity risk. Our principal financial instrument comprises cash and cash equivalents, and this is used to finance our operations. We have various other financial instruments such as trade receivables and payables that arise directly from our operations. The category of loans and receivables contains only trade and other receivables, shown on the face of the balance sheet, all of which mature within one year. We have compared fair value to book value for each class of financial asset and liability and no difference was identified. We have a policy, which has been consistently followed, of not trading in financial instruments.
Interest Rate Risk
We do not hold any derivative instruments to manage interest rate risk.
Foreign Currency Risk
Foreign currency risk refers to the risk that the value of a financial commitment or recognized asset or liability will fluctuate due to changes in foreign currency rates. Our net income and financial position, as expressed in Canadian dollars, are exposed to movements in foreign exchange rates against the U.S. dollar. We are exposed to foreign currency risk as a result of operating transactions and the translation for foreign bank accounts. We monitor our exposure to foreign exchange risk. Exposures are generally managed through natural hedging via the currency denomination of cash balances and any impact currently is not material to us.
Credit Risk
Our credit risk with respect to customers is limited and we did not have any trade receivables outstanding as of December 31, 2016. Financial instruments that potentially expose us to concentrations of credit risk consist primarily of short-term cash investments and trade accounts receivable.
Liquidity Risk
We have funded our operations since inception primarily through the issuance of equity securities. Until such time as we can generate significant revenue from platform, if ever, we expect to finance our operations through a combination of public or private equity or debt financings or other sources. Adequate additional financing may not be available to us on acceptable terms, or at all. Our inability to raise capital as and when needed would have a negative impact on our financial condition and our ability to pursue our business strategy.
Outstanding Share Data
As at May 1, 2017, we had no Class A preferred shares issued and outstanding.
As at May 1, 2017, we had no Class B preferred shares issued and outstanding.
As at May 1, 2017, we had 39,172,469 common shares issued and outstanding.
As at May 1, 2017, we had 4,985,950 stock options and 4,971,562 warrants exercisable and outstanding.
Additional Disclosure for Venture Issuers Without Significant Revenues
During the year ended December 31, 2016, the material components of general & administrative expenses included rent of $129,201 (2015 - $92,668), employee wages of $925,855 (2015 - $936,819), office expenses of $116,020 (2015 - $211,876), telephone expenses of $44,746 (2015 - $59,763), computer and information technology expenses of $198,941 (2015 - $146,588), automotive expenses of $52,649 (2015 - $43,917), and insurance of $112,359 (2015 - $58,182).