UNITED STATES
SECURITIES AND EXCHANGE COMMISSION
Washington, D.C. 20549
__________________________________________________
FORM 10-K
__________________________________________________ | | | | | |
| ☒ | ANNUAL REPORT PURSUANT TO SECTION 13 OR 15(d) OF THE SECURITIES EXCHANGE ACT OF 1934 |
For the Annual Period Ended December 31, 2024
OR | | | | | |
| ☐ | TRANSITION REPORT PURSUANT TO SECTION 13 OR 15(d) OF THE SECURITIES EXCHANGE ACT OF 1934 |
For the Transition Period from ___ to ___
Commission file number 001-37936
__________________________________________________________________________________________________________________________________________________________________________________________
SMART SAND, INC.
(Exact name of registrant as specified in its charter) | | | | | |
| |
| Delaware | 45-2809926 |
| (State or other jurisdiction of incorporation or organization) | (I.R.S. Employer Identification Number) |
| |
| 1000 Floral Vale Boulevard, Suite 225 | |
| Yardley, Pennsylvania 19067 | (281) 231-2660 |
| (Address of principal executive offices) | (Registrant’s telephone number) |
| | | | | | | | | | | | | | |
| Securities registered pursuant to Section 12(b) of the Act: |
| Title of each class | | Trading Symbol(s) | | Name of each exchange on which registered |
| Common Stock, par value $0.001 per share | | SND | | The Nasdaq Global Select Market |
| | | | |
Securities registered pursuant to Section 12(g) of the Act: None |
| | | | |
Indicate by check mark if the registrant is a well-known seasoned issuer, as defined in Rule 405 of the Securities Act. Yes ¨ No x
Indicate by check mark if the registrant is not required to file reports pursuant to Section 13 or Section 15(d) of the Securities Exchange Act of 1934. Yes ¨ No x
Indicate by check mark whether the registrant (1) has filed all reports required to be filed by Section 13 or 15(d) of the Securities Exchange Act of 1934 during the preceding 12 months (or for such shorter period that the registrant was required to file such reports), and (2) has been subject to such filing requirements for the past 90 days. Yes x No ¨
Indicate by check mark whether the registrant has submitted electronically every Interactive Data File required to be submitted pursuant to Rule 405 of Regulation S-T (§232.405 of this chapter) during the preceding 12 months (or for such shorter period that the registrant was required to submit such files). Yes x No ¨
Indicate by check mark whether the registrant is a large accelerated filer, an accelerated filer, a non-accelerated filer, a smaller reporting company, or an emerging growth company. See the definitions of “large accelerated filer,” “accelerated filer,” “smaller reporting company,” and “emerging growth company” in Rule 12b-2 of the Exchange Act.
| | | | | | | | | | | | | | |
| Large accelerated filer ☐ | Accelerated Filer ☐ | Non-accelerated Filer ý | Smaller reporting company ☒ | Emerging growth company ☐ |
If an emerging growth company, indicate by check mark if the registrant has elected not to use the extended transition period for complying with any new or revised financial accounting standards provided pursuant to Section 13(a) of the Exchange Act. ☐
Indicate by check mark whether the registrant has filed a report on and attestation to its management’s assessment of the effectiveness of its internal control over financial reporting under Section 404(b) of the Sarbanes-Oxley Act (15 U.S.C. 7262(b)) by the registered public accounting firm that prepared or issued its audit report. ☐
If securities are registered pursuant to Section 12(b) of the Act, indicate by check mark whether the financial statements of the registrant included in the filing reflect the correction of an error to previously issued financial statements. ☐
Indicate by check mark whether any of those error corrections are restatements that required a recovery analysis of incentive-based compensation received by any of the registrant’s executive officers during the relevant recovery period pursuant to §240.10D-1(b). ☐
Indicate by check mark whether the registrant is a shell company (as defined in Rule 12b-2 of the Act). Yes ¨ No x
As of June 30, 2024, the last business day of the registrant’s second fiscal quarter of 2024, the aggregate market value of the registrant’s common stock held by non-affiliates of the registrant was $59,961,260 based on the closing price of $2.11 per share, as reported on NASDAQ on that date.
Number of shares of common shares outstanding, par value $0.001 per share as of February 21, 2025 was 42,876,756.
DOCUMENTS INCORPORATED BY REFERENCE
Portions of the registrant’s proxy statement for the 2025 Annual Meeting of Stockholders are incorporated herein by reference in Part III of this Annual Report on Form 10-K. Such proxy statement will be filed with the Securities and Exchange Commission within 120 days of the registrant’s fiscal year ended December 31, 2024.
TABLE OF CONTENTS
Certain Definitions
The following definitions apply throughout this annual report unless the context requires otherwise: | | | | | | | | |
| “We”, “Us”, “Company”, “Smart Sand” or “Our” | | Smart Sand, Inc., a company organized under the laws of Delaware, and its subsidiaries. |
| | |
| “shares”, “stock” | | The common stock of Smart Sand, Inc., nominal value $0.001 per share. |
| | |
| “Former ABL Credit Facility”, “Former ABL Credit Agreement”, “Former ABL Security Agreement” | | The five-year senior secured asset-based lending credit facility (the “Former ABL Credit Facility”) pursuant to: (i) a Former ABL Credit Agreement, dated December 13, 2019, between the Company and Jefferies Finance LLC, as amended from time to time (as amended, the “Former ABL Credit Agreement”); and (ii) a Guarantee and Collateral Agreement, dated December 13, 2019, between the Company and Jefferies Finance LLC, as agent, as amended from time to time (as amended, the “Former ABL Security Agreement”). This facility was terminated on September 3, 2024. |
| | |
| “FCB ABL Credit Facility”, “FCB Credit Agreement”, “FCB Security Agreement” | | The five-year senior secured asset-based credit facility entered into on September 3, 2024 (the “FCB ABL Credit Facility”) pursuant to: (i) a credit agreement among the Company, the subsidiary borrowers and guarantors party thereto, First-Citizens Bank & Trust Company, as issuing bank, swingline lender and agent, and certain other lenders from time to time party thereto (the “FCB Credit Agreement”); and (ii) a guarantee and collateral agreement among the Company, the subsidiary borrowers and guarantors party thereto and First-Citizens Bank & Trust Company, as agent (the “FCB Security Agreement”). |
| | |
| “Oakdale Equipment Financing”, “MLA” | | The five-year Master Lease Agreement, dated December 13, 2019, between Nexseer Capital (“Nexseer”) and related lease schedules in connection therewith (collectively, the “MLA”). The MLA was structured as a sale-leaseback of substantially all of the equipment at the Company’s mining and processing facility located near Oakdale, Wisconsin. The Oakdale Equipment Financing was considered a lease under article 2A of the Uniform Commercial Code but was considered a financing arrangement (and not a lease) for accounting or financial reporting purposes. The MLA and all schedules were paid and full and terminated on June 28, 2024. |
| | |
| “VFI Equipment Financing” | | The four-year Master Lease Agreement, dated May 9, 2024, between Varilease Finance, Inc. (“VFI”) and related lease schedule entered into on June 26, 2024 in connection therewith (collectively, the “VFI Equipment Financing”). The VFI Equipment Financing was structured as a sale-leaseback of specific SmartSystemsTM wellsite proppant storage equipment owned by the Company. The VFI Equipment Financing is considered a lease under article 2A of the Uniform Commercial Code but is considered a financing arrangement (and not a lease) for accounting and financial reporting purposes. |
| | |
| | |
| “Exchange Act” | | The Securities Exchange Act of 1934, as amended. |
| | |
| “Securities Act” | | The Securities Act of 1933, as amended. |
| | |
| | |
| | |
| “FASB”, “ASU”, “ASC”, “GAAP” | | Financial Accounting Standards Board, Accounting Standards Update, Accounting Standards Codification, Accounting Principles Generally Accepted in the United States, respectively. |
Disclaimer Regarding Forward-looking Statements and Risk Factor Summary
This Annual Report on Form 10-K contains forward-looking statements that are subject to risks and uncertainties. All statements other than statements of historical fact included in this Annual Report on Form 10-K are forward-looking statements. Forward-looking statements give our current expectations and projections relating to our financial condition, results of operations, plans, objectives, future performance and business. You can identify forward-looking statements by the fact that they do not relate strictly to historical or current facts. These statements may include words such as “anticipate’’, “estimate’’, “expect”, “project”, “plan”, “intend”, “believe”, “may”, “will”, “should”, “can have”, “likely” and other words and terms of similar meaning in connection with any discussion of the timing or nature of future operating or financial performance or other events. For example, all statements we make relating to our estimated and projected costs, expenditures, cash flows, growth rates and financial results, our plans and objectives for future operations, growth or initiatives, strategies or the expected outcome or impact of pending or threatened litigation are forward-looking statements. All forward-looking statements are subject to risks and uncertainties that may cause actual results to differ materially from those expected, including without limitation:
•fluctuations in demand for frac sand;
•the cyclical nature of our customers’ businesses;
•operating risks that are beyond our control, such as changes in the price and availability of transportation, natural gas or electricity;
•production risks such as unusual or unexpected geological formations or pressures; pit wall failures or rock falls; or unanticipated ground, grade or water conditions at our mines;
•our dependence on our Oakdale mine and processing facility for a significant portion of our current sales;
•decreased usage of rail terminals that we operate;
•the level of activity in the oil and natural gas industries;
•the development of either effective alternative proppants or new processes which reduce or replace the need for frac sand in hydraulic fracturing;
•increased competition from new or existing sources of sand supply, including frac sand mines in areas located close to, or within, the oil and gas basins;
•federal, state and local legislative and regulatory initiatives relating to hydraulic fracturing and the potential for related regulatory action or litigation affecting our customers’ operations, including restrictions on oil and gas development and possible bans on hydraulic fracturing;
•potential negative litigation outcomes;
•scarcity of supplies necessary to run our business;
•barriers to entry in the industrial sand market;
•actions by the Organization of the Petroleum Exporting Countries and/or Russia;
•our rights and ability to mine our properties and process sand and our renewal or receipt of the required permits and approvals from governmental authorities and other third parties;
•our ability to successfully compete in the sand or proppant delivery markets;
•loss of, or reduction in, business from our largest customers;
•increasing costs or a lack of dependability or availability of transportation services and transload network access or infrastructure, including the potential impact of train derailments;
•increases in the prices of, or interruptions in the supply of, natural gas, electricity, diesel fuel, or any other energy sources;
•loss of or diminished access to water;
•our ability to successfully complete acquisitions or integrate acquired businesses;
•our ability to fully protect our intellectual property rights;
•our ability to make capital expenditures to maintain, develop and increase our asset base and our ability to obtain needed capital or financing on satisfactory terms;
•restrictions imposed by our indebtedness on our current and future operations;
•border restrictions;
•global pandemics;
•new or increased tariffs;
•contractual obligations that require us to deliver minimum amounts of frac sand or purchase minimum amounts of products or services;
•the accuracy of our estimates of mineral reserves and resource deposits;
•a shortage of skilled labor and rising costs in the frac sand mining and manufacturing industries;
•our ability to attract and retain key personnel;
•our ability to maintain satisfactory labor relations;
•our ability to maintain effective quality control systems at our mining, processing and production facilities and rail terminals;
•seasonal and severe weather conditions;
•the results of political and civil unrest;
•fluctuations in our sales and results of operations due to seasonality and other factors;
•interruptions or failures in our information technology systems, including cyber-attacks;
•the impact of international or domestic terrorism or an armed conflict, including the conflicts in Ukraine and the Middle East;
•extensive and evolving environmental, mining, health and safety, licensing, reclamation and other regulation (and changes in their enforcement or interpretation);
•silica-related health issues and corresponding litigation;
•our ability to acquire, maintain or renew financial assurances related to the reclamation and restoration of mining property; and
•other factors disclosed in Item I A. “Risk Factors” and elsewhere in this Annual Report on Form 10-K.
We derive many of our forward-looking statements from our operating budgets and forecasts, which are based on many assumptions. While we believe that our assumptions are reasonable, we caution that it is very difficult to predict the effect of known or unknown factors, and it is impossible for us to anticipate all factors that could affect our actual results. The risk factors summarized below could materially harm our business, operating results and/or financial condition, impair our future prospects and/or cause the price of our common stock to decline. These risks are discussed more fully under Item 1A, “Risk Factors” and Item 7, “Management’s Discussion and Analysis of Financial Condition and Results of Operations” in this Annual Report on Form 10-K. Material risks that may affect our business, operating results and financial condition include, but are not necessarily limited to, the following:
•our business and financial performance depend on the level of activity in the oil and natural gas industry;
•a material portion of our revenues have been generated from sales with a limited number of customers;
•we are exposed to the credit risk of our customers;
•our proppant sales are subject to fluctuations in market pricing;
•we face significant competition that may cause us to lose market share;
•we may be required to make substantial capital expenditures to maintain and grow our asset base and we may not realize enough of a return on such capital expenditures to cover their costs;
•the inability to obtain needed capital or financing on satisfactory terms, or at all;
•inaccuracies in estimates of volumes and qualities of our sand reserves could result in lower than expected sales and higher than expected cost of production;
•if we are unable to make acquisitions on economically acceptable terms, our future growth could be limited;
•restrictions in our FCB ABL Credit Facility may limit our ability to capitalize on potential acquisitions and other business opportunities;
•we face distribution and logistical challenges in our business;
•we may be adversely affected by decreased demand for frac sand due to the development of effective alternative proppants or new processes which reduce or replace frac sand in hydraulic fracturing;
•an increase in the supply of frac sand having similar characteristics as the frac sand we produce could make it more difficult for us to renew or replace our existing contracts on favorable terms, or at all;
•our long-term take-or-pay contracts may preclude us from taking advantage of increasing prices for frac sand or mitigating the effect of increased operational costs during the term of those contracts;
•our operations are subject to operational hazards and unforeseen interruptions for which we may not be adequately insured;
•our business relies significantly on railroads to deliver our products, and any delays in rail transportation could adversely impact our business.
•increases in the price or a significant interruption in the supply of natural gas, electricity or any other energy sources, of which our production process consumes large amounts, could adversely impact our production costs;
•increases in the price of diesel fuel could adversely affect our transportation costs;
•a facility closure entails substantial costs, and if we close one of our facilities sooner than anticipated, our results of operations and cash flows may be adversely affected;
•our operations are dependent on our rights and ability to mine our properties and on our having renewed or received the required permits and approvals from governmental authorities and other third parties;
•a shortage of skilled labor together with rising labor costs in the excavation industry, which may further increase operating costs;
•our business may suffer if we lose, or are unable to attract and retain, key personnel;
•failure to maintain effective quality control systems at our mining, processing and production facilities may negatively affect our ability to conduct business;
•seasonal and severe weather conditions may reduce our ability to process and deliver our products;
•our cash flow fluctuates on a seasonal basis, which may limit our ability to operate;
•we do not own the land on which our transload facilities are located, which inherently limits our rights at those facilities;
•a terrorist attack or armed conflict may affect our ability to conduct business;
•diminished access to water may affect our ability to process sand;
•we may be subject to interruptions or failures in our information technology systems, including cyber-attacks;
•if we are unable to fully protect our intellectual property rights, we may suffer a loss in our competitive advantage;
•we may be adversely affected by disputes regarding intellectual property rights of third parties;
•unsatisfactory safety performance may negatively affect our customer relationships and cause us to fail to retain existing customers or attract new customers;
•we may be subject to legal claims, such as personal injury and property damage;
•a financial downturn could negatively affect us;
•our future results will suffer if we do not effectively manage our expanded operations;
•federal, state and local legislative and regulatory initiatives or mandates relating to hydraulic fracturing, such as oil and gas leasing moratoriums, and the potential for related litigation could result in increased costs, additional operating restrictions or delays for our customers, which could cause a decline in the demand for our frac sand or restrict our ability to maximize profits;
•we and our customers are subject to extensive regulations, including environmental and occupational health and safety regulations, that impose, and will continue to impose, significant costs and liabilities, and future regulations, or more stringent enforcement of existing regulations, could increase those costs and liabilities;
•we are subject to the Federal Mine Safety and Health Act of 1977, which imposes stringent health and safety standards on numerous aspects of our operations;
•our inability to acquire, maintain or renew financial assurances related to the reclamation and restoration of mining property may increase cash outlay or limit our ability to operate our processing facilities; and
•climate change legislation and regulatory initiatives could negatively affect our business.
All written and oral forward-looking statements attributable to us, or persons acting on our behalf, are expressly qualified in their entirety by these cautionary statements as well as other cautionary statements that are made from time to time in our other filings with the Securities and Exchange Commission (the “SEC”) and public communications. You should evaluate all forward-looking statements made in this Annual Report on Form 10-K in the context of these risks and uncertainties.
We caution users of the financial statements that the important factors referenced above may not contain all of the factors that may be important to every user. In addition, we cannot make assurances that we will realize the results or developments we expect or anticipate or, even if substantially realized, that they will result in the consequences or affect us or our operations in the way we expect. The forward-looking statements included in this Annual Report on Form 10-K are made only as of the date hereof. We undertake no obligation to update or revise any forward-looking statement as a result of new information, future events or otherwise, except as otherwise required by law.
Additionally, certain information we may disclose either here or elsewhere (such as our website) is informed by certain third-party frameworks or the expectations of various stakeholders and, as such, may not necessarily be material for purposes of our filings with the Securities and Exchange Commission. Particularly in the context of certain ESG matters, there are various approaches to materiality that differ from, and are often more expansive than, the definition under U.S. federal securities laws.
PART I
ITEM 1. — BUSINESS
The Company
We are a fully integrated frac and industrial sand supply and services company. We offer complete mine to wellsite proppant supply and logistics solutions to our frac sand customers. We produce low-cost, high quality Northern White sand, which is a premium sand used as a proppant to enhance hydrocarbon recovery rates in the hydraulic fracturing of oil and natural gas wells and for a variety of industrial applications. We also offer proppant logistics solutions to our customers through our in-basin transloading terminals and our SmartSystemsTM wellsite proppant storage capabilities. In late 2021, we created our Industrial Products Solutions (“IPS”) business in order to diversify our customer base and markets we serve by offering sand for industrial uses.
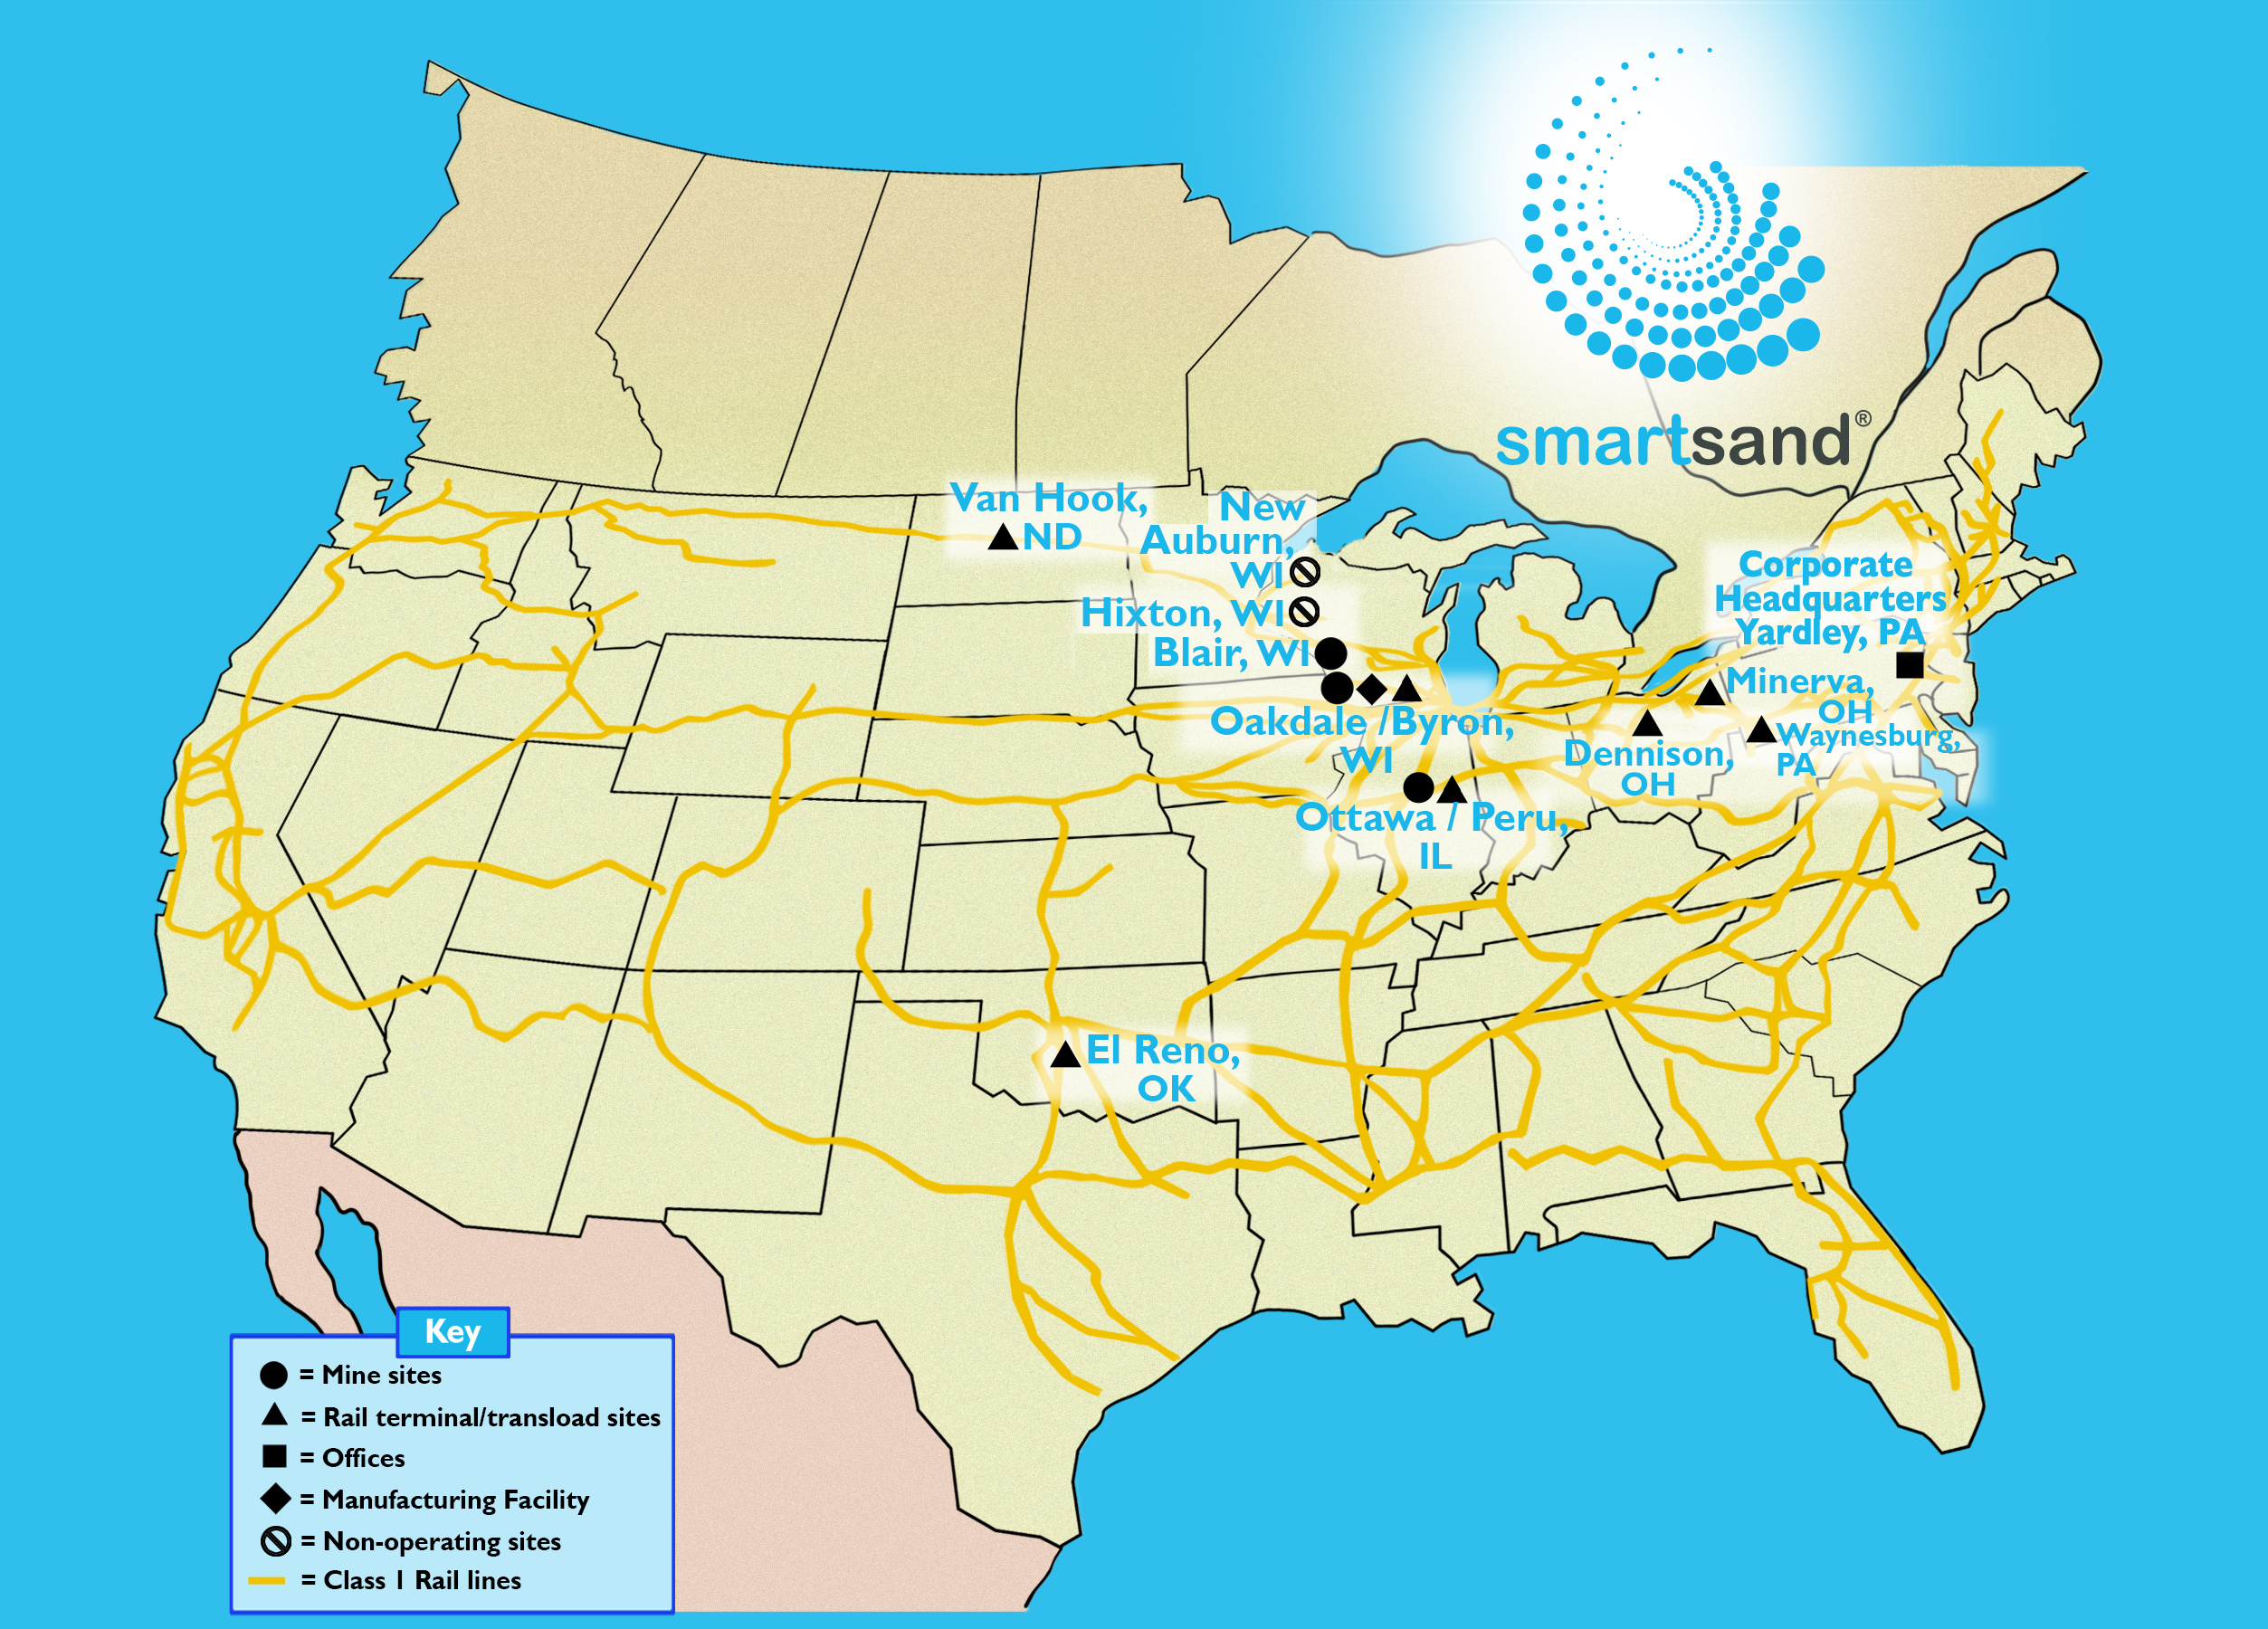
We market our products and services to oil and natural gas exploration and production companies, oilfield service companies and industrial manufacturers. We believe that, among other things, the size and favorable geologic characteristics of our sand reserves, the strategic location and logistical advantages of our facilities, our proprietary SmartDepotTM portable wellsite proppant storage silos, our proprietary SmartPath® wellsite proppant management system, SmartBeltTM conveyor system, access to all Class I rail lines, and the industry experience of our senior management team make us as a highly attractive provider of sand and logistics services.
Operating Segments
Sand Segment
We sell our sand through short-term and long-term contracts or spot sales in the open market. We incorporated in Delaware in July 2011 and began operations at our Oakdale, Wisconsin facility in July 2012 with 1.1 million tons of annual processing capacity. After several expansions our current annual processing capacity at our Oakdale facility is approximately 5.5 million tons. This facility has access to both the Canadian Pacific Class I rail network (through an onsite, unit train capable rail facility) and the Union Pacific Class I rail network (through the Byron, Wisconsin transload facility).
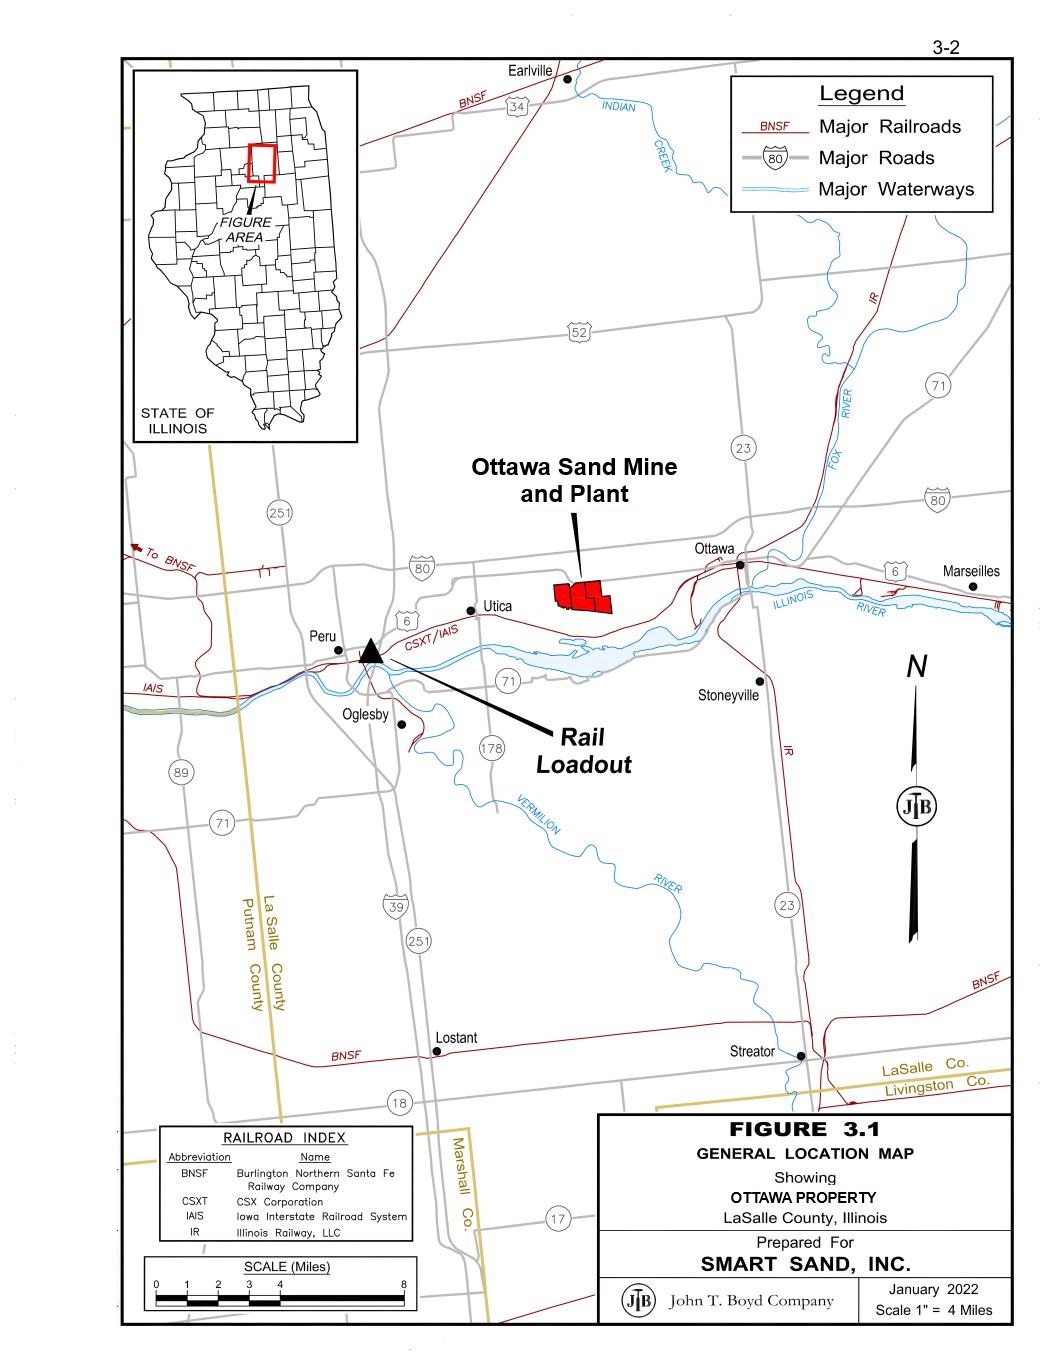
In September 2020, we acquired our Ottawa, Illinois mine and processing facility, which has annual processing capacity of approximately 1.6 million tons and access to the Burlington Northern Santa Fe Class I rail line through the Peru, Illinois transload facility, as well as rights to use a rail terminal located in El Reno, Oklahoma. We began operating the Ottawa facility in October 2020.
In March 2022, we acquired our Blair, Wisconsin mine and processing facility, which has approximately 2.9 million tons of total annual processing capacity and contains an onsite, unit train capable rail terminal with access to the Class 1 Canadian National Railway. We commenced operations at the Blair facility in the second quarter of 2023.
We sell frac sand through a network of in-basin rail terminals. We directly control five in-basin transloading facilities and have access to third party transloading terminals in all operating basins. We operate a unit train capable transloading terminal in Van Hook, North Dakota to service the Bakken Formation in the Williston Basin. The Van Hook terminal became operational in April 2018. In 2020, as part of our acquisition of the Ottawa, Illinois mining facility, we obtained rights to use a rail terminal located in El Reno, Oklahoma. In January 2022, we began operations at a unit train capable transloading terminal in Waynesburg, Pennsylvania to service the Appalachian Basin, including the Marcellus and Utica Formations. We completed an expansion of this terminal in the fourth quarter of 2023. In December 2023, we acquired the rights to operate a unit train capable transloading terminal in Minerva, Ohio, which became operational in the second quarter of 2024. In January 2024, we acquired the rights to operate a unit train capable transloading terminal in Dennison, Ohio, which became operational in the third quarter of 2024.
In late 2021, we started our IPS business to provide sand to customers for various industrial applications, such as glass, foundry, building products, filtration, geothermal, renewables, ceramics, turf & landscape, retail, and recreation. We believe this business provides us with the ability to diversify some of our sales into more stable, consumer-driven products to help mitigate some of the price volatility we are exposed to in the oil and gas markets that we serve. We completed an expansion of our IPS processing at our Ottawa, Illinois plant in the fourth quarter of 2023 to provide blending and cooling capabilities to increase our product offerings in the industrial marketplace.
SmartSystems Segment
We provide wellsite proppant handling solutions services and equipment under flexible contract terms custom tailored to meet the needs of our customers. We also offer our customers portable wellsite storage and management solutions through our
SmartSystems products and services. Our Smart Systems enable customers to unload, store, and deliver proppant at the wellsite and rapidly set up, take down, and transport the entire system. This capability enhances our customers’ efficiency, safety, and reliability. Through our SmartSystems wellsite proppant storage solutions, we offer the SmartDepot and SmartDepotXL™ silo systems, the SmartBelt conveyor, the SmartPath wellsite proppant management system, and our rapid deployment trailers. The SmartDepot silos feature passive and active dust suppression technology and support gravity-fed operation. Our self-contained SmartPath wellsite proppant management system is a mobile sand transloading solution that works with bottom-dump trailers. These systems include a drive-over conveyor, surge bin, silo storage, bucket elevators, and integrated dust collection.
In 2024, we developed new dual bucket elevators to enhance our vertical material handling capabilities. We also increased our silo storage capacity and streamlined proppant delivery directly to the blender. This addition provides greater flexibility for customers with varying wellsite configurations while maintaining the efficiency, safety, and reliability that define our SmartSystems solutions. Our rapid deployment trailers are designed for quick setup, takedown, and transportation of the entire SmartSystem. They detach from the wellsite equipment, allowing for removal from the wellsite during operations. We believe our SmartSystems help customers reduce trucking and related fuel consumption, reducing the carbon footprint of their daily operations.
Market
Beginning in the first quarter of 2022 and continuing through 2024, supply and demand fundamentals have improved and frac sand prices recovered from previous historic lows. There have been modest pricing fluctuations over the periods presented, but we believe the fluctuation is consistent with other commodities in the oilfield services sector.
The ongoing conflicts in Ukraine and the Middle East, as well as economic actions taken by the United States and other countries in connection with such conflicts, and other economic factors could have a negative impact on global oil and natural gas demand, which may lead to volatility in the oil field service sector. We cannot predict if frac sand prices will increase, decrease or stabilize.
Northern White frac sand, which is found predominantly in Wisconsin and limited portions of Minnesota, Illinois, and Missouri, is considered a premium proppant due to its favorable physical characteristics. We believe that regional sand will continue to affect the demand for Northern White sand in some of the oil and natural gas producing basins in which we market our products. However, we believe there will continue to be demand for our high-quality Northern White frac sand. In particular, we currently believe that Northern White frac sand has logistical advantages in the Marcellus, Utica and Bakken Formations in the shale basins of the United States, and the Montney and Douvernay shale basins in Canada. We expect demand for our frac sand to continue to be supported by customers who are focused on long-term well performance and ultimate recovery of reserves from the oil and natural gas wells they are completing, as well as those interested in the efficiency of their logistics supply chain and delivery of sand to the wellsite. Additionally, we believe market trends continue to support increased proppant usage per well drilled due to operator focus on well efficiencies through increasing lengths of drilling laterals, use of simul-fracking techniques and other well enhancement strategies. Finally, we believe that the adoption of our SmartSystems provides improved efficiencies in shipping and storing sand at the wellsite through reduced trucking requirements, which removes traffic from the roads and lowers diesel fuel consumption, thereby providing incremental value to our customers by reducing their carbon emissions.
Demand in the IPS business is relatively stable as customers are spread over a wide range of industries, including glass, foundry, building products, filtration, geothermal, renewables, ceramics, turf & landscape, retail, recreation and more. The IPS business is primarily influenced by macroeconomic drivers such as consumer demand and population growth. We believe that as this business grows, it will provide us with the ability to diversify some of our sales into more stable, consumer-driven products to help mitigate the price volatility that we are exposed to in the oil and gas industry.
Business Strategies
Our principal business objective is to be the premier provider of sustainable Northern White Sand supply and logistics solutions to our customers. We do this through supporting our existing customers, expanding our market share, being a low-cost producer of high-quality Northern White Sand, maintaining low debt leverage and managing efficient and sustainable supply chain logistics from the mine to the wellsite. In late 2021, we expanded our product line to offer IPS. We believe that by executing these business strategies, we will be able to increase long-term stockholder value. We expect to achieve this objective through the following business strategies:
•Diversifying our customer base to include Industrial Product Solutions. In late 2021, we expanded our product offering to provide IPS for industrial customers. IPS is currently approximately 5% of our business. We expect to continue to expand and diversify to serve the vital industrial markets throughout North America, including glass,
foundry, building products, filtration, geothermal, renewables, ceramics, turf & landscape, retail, recreation and more.
•Expanding and optimizing our existing logistics infrastructure and developing additional origination and destination points. We expect to continue to capitalize on our Oakdale facility’s ability to ship on two Class I rail carriers to maximize our product shipments, increase our railcar utilization and lower our transportation costs. We have the ability to simultaneously accommodate multiple unit trains on-site with the Canadian Pacific rail network while also having the ability to ship our frac sand to our customers on a second Class I rail carrier through our transloading facility located on the Union Pacific rail network approximately three miles from our Oakdale operations. This access to two Class I rail carriers from Oakdale provides increased delivery options for our customers, greater competition between our rail carriers and potentially lower freight costs.
Our mine at Ottawa, Illinois and related transloading terminal in Peru, Illinois added new origination and destination points to our existing capabilities and offers additional capability to ship products on a third Class I rail carrier, the BNSF.
Our Blair, Wisconsin mine with onsite rail infrastructure provides us with direct access to the Class 1 Canadian National Railway, allowing us access to all Class 1 rail lines within the United States and Canada. The Blair facility began operations in the second quarter of 2023.
We also operate several terminals throughout the United States, including a multiple unit train capable transloading terminal in Van Hook, North Dakota, which we believe allows us to be one of the most efficient and low-cost sources of frac sand in the Bakken Formation in the Williston Basin. Our Waynesburg, Pennsylvania terminal, which services the Appalachian Basins, including the Marcellus and Utica Formations, became operational in January 2022 and was expanded in the fourth quarter of 2023. We believe this terminal allows us to be one of the most efficient and low-cost sources of frac sand in the Appalachian Basin. Additionally, we obtained access, through a long term lease, to rail terminals in Minerva, Ohio and Dennison, Ohio, which we believe will broaden our ability to offer sand to our customers in the Utica Formation in an efficient and cost-effective manner. Both of the Ohio terminals became operational in 2024. Our El Reno, Oklahoma terminal provides us with the flexibility to send sand to the Woodford and SCOOP/STACK Basins as it is needed by our customers.
Additionally, our SmartSystems wellsite storage and proppant management systems allow us to offer expanded logistics services to our customers. We believe that our SmartSystems reduce trucking and related fuel consumption for our customers, helping them to reduce their carbon footprint in their daily operations.
The benefits of our long-term growth strategy for in-basin delivery of sand include expanding our customer base by marketing through our own terminals, more opportunity for spot sales by forward deploying sand and the opportunity to capture incremental margin on the sale of sand farther down the supply chain by managing the cost of rail, terminal and wellsite storage operations. Additionally, having a presence in-basin gives us an opportunity to have a base of operations from which to market and support our SmartSystems wellsite storage and proppant management solutions. Through the addition of new origination and destination options, we continue evaluating ways to reduce the landed cost of our products in-basin and to the wellsite for our customers while increasing our customized service offerings to provide our customers with additional delivery and pricing alternatives.
•Focusing on organic growth by increasing the utilization of our mine and frac sand processing facilities. We intend to continue pursuing opportunities to maximize the value and the utilization of our Oakdale, Ottawa, and Blair facilities through the addition of new customers and increased sales volumes. Despite the emergence of regional sand in oil and natural gas producing basins, we believe the proppant market continues to offer attractive long-term growth fundamentals for Northern White frac sand in the key operating basins we currently serve due to the logistics advantages in these basins and its superior well results compared to regional sand alternatives. We believe that coupling our premium proppant with long-term sustainable logistics supply services may mitigate the potential cost savings of using regional sand.
Demand for frac sand has continued to moderately increase during 2024. According to Spears and Associates, Inc. (“Spears”), North America proppant demand increased by 7% in 2024 compared to 2023, mirroring an improving hydraulic fracturing market. The primary drivers for the increase in frac sand usage are increased lateral well lengths and increased volume of sand per linear foot of lateral well. The trend is expected to increase moderately in 2025 as well. Additionally, demand may increase over the next five years, which may be driven by increased export capacity of liquid natural gas (“LNG”) and potential increased power demand for data centers.
•Focusing on being a low-cost provider and continuing to make process improvements. We continue to focus on being a low-cost provider, which we believe will allow us to compete effectively for sales of frac and industrial sand and to achieve attractive operating margins. Our low-cost structure results from a number of key attributes, including, among others, (i) our relatively low royalty rates, (ii) our majority of fine mineral reserve deposits, (iii) our access to all Class I rail lines within the United States and Canada, and (iv) our low levels of debt. We have strategically designed our operations to provide for low-cost production, including having dryers and wet plants enclosed in our Oakdale and Ottawa processing facilities that allow for year-round operation at both facilities. This allows us to more efficiently match our wet sand production with our drying capacity and to better utilize our workforce with a goal to reduce the overall cost of production. We continue to invest in capital projects and consider strategic acquisitions that increase efficiencies and offer the opportunity for a high return on investment. In addition, we seek to maximize our mining yields on an ongoing basis by targeting sales volumes that more closely match our reserve gradation in order to minimize waste in our processing. We also continue to evaluate other mining techniques to reduce the overall cost of our mining operations.
•Creating flexible sales activities. We believe that demand for our products will remain strong in basins where regional sand is not an attractive alternative due to the logistics and performance advantages of Northern White Sand, such as the Bakken in North Dakota, the Marcellus and Utica formations in the Appalachian Basin of the Northeast region of the United States, and the Montney and Duvernay shale basins in Canada. We continue to have discussions with operators in these regions regarding new relationships and growth opportunities. We also believe that the long-term benefits of high quality Northern White sand outweighs the short-term cost savings provided by regional sand in the Permian, Eagle Ford and SCOOP/STACK basins. We believe there are additional opportunities for customers in the Permian and other basins, which have regional supply, who are focused on the long-term performance of their production and on the long-term efficiency of their logistics.
While we continue to look for long-term contract opportunities, we intend to continue to focus on shorter term contracts and increase sales in the spot market given the reluctance of many customers to enter into long-term take-or-pay contracts in the current market environment. Having a greater portion of our activity on spot or short-term contracts allows us the opportunity to take advantage of pricing improvements quickly should market fundamentals improve.
Competitive Strengths
We believe that we will be able to successfully execute our business strategies because of the following competitive strengths:
•Long-lived, strategically located, high-quality reserve base. We believe our three sand mines in Oakdale, Wisconsin, Ottawa, Illinois and Blair, Wisconsin have a uniquely desirable combination of large high-quality reserves of fine mesh sand that is contiguous to their production and primary rail loading facilities that are either on site or are in close proximity to the mines.
As of December 31, 2024, we have an estimated life of mine of approximately 60 years at Oakdale, 105 years at Ottawa, and 56 years at Blair, based on our current expected sales volumes. We have the ability to annually process up to approximately 10.0 million tons of sand and we believe our reserve base positions us well to take advantage of current market trends of increasing demand for finer mesh frac sand. We also believe that having our mines, processing facilities and primary rail loading facilities in close proximity provides us with an overall low-cost structure, which enables us to compete effectively for sales of Northern White frac sand and to achieve attractive operating margins.
•Intrinsic logistics advantage. We believe that we are one of the few frac sand producers with a network of facilities custom-designed for the specific purpose of delivering frac sand to all of the major U.S. oil and natural gas producing basins by having rail facilities that can simultaneously accommodate multiple unit trains on site or in close proximity to our mining and processing operations. Our transportation assets at Oakdale have access to two Class I rail lines owned by Canadian Pacific and Union Pacific. We believe our customized on-site logistical configuration yields lower operating and transportation costs of product to our customers between the mine and in basin destinations.
Our Ottawa mine and nearby Peru transloading terminal in Illinois provides us direct access to another Class I rail line with direct access to the Burlington Northern Santa Fe Class I rail line. Additionally, we believe the location of our Ottawa, Illinois facility in close proximity to Greater Chicago and other major Midwestern metropolitan markets and our ability to truck or rail our products from this location allows us to be able to offer competitive pricing for industrial sand application.
The addition of the Blair frac sand mine and related processing facility located in Blair, Wisconsin, which contains an onsite, unit train capable rail terminal with access to the Class 1 Canadian National Railway, has secured our access to provide sand on all Class I rail lines in the United States and Canada.
•Expanded logistics solutions. Our transloading terminal in Van Hook, North Dakota is capable of handling multiple unit trains simultaneously, and we have been providing in-basin sand at this terminal to our customers since operations began in 2018. This terminal has allowed us to expand our customer base and to offer more efficient delivery options to customers operating in the Bakken Formation in the Williston Basin.
In January 2022 we began operating a terminal in Waynesburg, Pennsylvania to service the Appalachian Basin, including the Marcellus and Utica Formations. We believe the Waynesburg terminal allows us to be one of the most efficient and low-cost sources of frac sand in the Appalachian Basin.
We obtained access, through long term leases, to rail terminals in Minerva, Ohio and Dennison, Ohio, which we believe will broaden our ability to offer sand to our customers in the Utica Formation of the Appalachian Basin in an efficient and cost-effective manner. These terminals became operational in 2024.
We also operate a terminal located in El Reno, Oklahoma, which we acquired in 2020, to serve the Woodford and SCOOP/STACK Basins.
We are capable of delivering sand to substantially all onshore operating basins in the United States and Canada. We have direct access to four Class I rail lines in North America and indirect access to all Class I rail lines, which gives us an advantage over many of our competitors by allowing us to offer more competitive pricing and delivery options to our customers.
Our Smart Systems enable customers to unload, store, and deliver proppant at the wellsite and rapidly set up, take down, and transport the entire system. This capability enhances our customers’ efficiency, safety, and reliability. Through our SmartSystems wellsite proppant storage solutions, we offer the SmartDepot and SmartDepotXL silo systems, the SmartBelt conveyor, the SmartPath wellsite proppant management system, and our rapid deployment trailers. The SmartDepot silos feature passive and active dust suppression technology and support gravity-fed operation. Our self-contained SmartPath wellsite proppant management system is a mobile sand transloading solution that works with bottom-dump trailers. These systems include a drive-over conveyor, surge bin, silo storage, bucket elevators, and integrate dust collection. In 2024, we developed new dual bucket elevators to enhance our vertical material handling capabilities. We also increased our silo storage capacity and streamlined proppant delivery directly to the blender. This addition provides greater flexibility for customers with varying wellsite configurations while maintaining the efficiency, safety, and reliability that define our SmartSystems solutions. Our rapid deployment trailers are designed for quick setup, takedown, and transportation of the entire SmartSystem. They detach from the wellsite equipment, allowing for removal from the wellsite during operations. We believe our SmartSystems help customers reduce trucking and related fuel consumption, reducing the carbon footprint of their daily operations.
•Long-term liquidity and financial flexibility. We believe we have sufficient liquidity to support our operations and pursue our growth initiatives. In September 2024, the Company entered into a $30.0 million five-year senior secured asset-based credit facility with First-Citizens Bank & Trust Company. The FCB ABL Credit Facility provides for non-amortizing revolving loans in an aggregate principal amount of up to $30.0 million, subject to a borrowing base comprised of eligible inventory and accounts receivable. As of December 31, 2024, we had cash on hand of $1.6 million and undrawn availability under the FCB ABL Credit Facility of $30.0 million and no outstanding borrowings. The FCB ABL Credit Facility matures in September 2029. Our total available liquidity among cash and available borrowings was $31.6 million as of December 31, 2024.
•Experienced management team. The members of our senior management team bring significant experience to the market environment in which we operate. Their expertise covers a range of disciplines, including industry-specific operating and technical knowledge and experience managing businesses in a variety of operating conditions.
•Focus on safety and environmental stewardship. We aim to maintain a culture that prioritizes safety, the environment and our relationship with the communities in which we operate, actions we believe are critical to the success of our business. We are a Tier 1 participant in The Wisconsin Department of Natural Resources’ Green Tier program, which encourages, recognizes and rewards companies for voluntarily exceeding environmental, health and safety standards. Since 2016, Smart Sand has maintained International Organization for Standardization (“ISO”) ISO 9001 and ISO 14001 registrations for our quality management system and environmental management system programs, respectively, for our Oakdale facility. We earned initial ISO 9001 registration for our Ottawa, Illinois
facility in 2022. We also have attained Green Professional status in Wisconsin’s Green Master sustainability recognition program. We are also members of the Wisconsin Industrial Sand Association, which promotes safe and environmentally responsible sand mining standards.
Our Customers
Our core customers are oil and natural gas exploration and production companies and oilfield service companies. In late 2021, we began diversifying our sand sales to include IPS to customers. While sales of IPS to customers have been a small portion of our overall sand sales since beginning this business, we intend to continue increasing our expansion of IPS in 2025 and beyond. We sell frac sand under long-term take-or-pay contracts as well as in the spot market, and provide proppant logistics solutions through our in-basin transloading terminals and SmartSystems wellsite proppant storage solutions and other logistics services.
Generally, customers under long-term take-or-pay contracts are required to take minimum volumes of sand or make shortfall payments for a specified period of time. We recognize revenue in our results of operations in the period in which the obligation becomes due.
Currently many customers prefer to source their frac sand supply in the spot market or under short-term contractual arrangements at market prices. Should our customer base continue to limit their exposure to longer term contracts, we will continue to focus on shorter term contracts and increasing sales in the spot market.
Customers renting SmartSystems are able to tailor the contract, including adjusting the number of SmartDepot silos, SmartPath wellsite proppant management systems and SmartBelt conveyors to be supplied, to meet their short-term and long-term needs. We recognize rental revenue when the equipment is made available for the customer to use or other obligations in the contract are met.
For the year ended December 31, 2024, Equitable Gas Corporation, Encino Energy and Liberty Oilfield Services, accounted for 31.9%, 13.8% and 10.2%, respectively, of total revenue, and the remainder of our revenues were from 82 customers. For the year ended December 31, 2023, Equitable Gas Corporation and Liberty Oilfield Services accounted for 30.2% and 11.4%, respectively, of our total revenues, and the remainder of our revenues were from 72 customers. For the year ended December 31, 2022, Equitable Gas Corporation, Halliburton Energy Services, Encino Energy, and Liberty Oilfield Services accounted for 22.3%, 15.4%, 14.4% and 13.7%, respectively, of our total revenues, and the remainder of our revenues were from 63 customers. Please read “Risk Factors—Risks Inherent in Our Business—A substantial majority of our revenues have been generated under contracts with a limited number of customers, and the loss of, material nonpayment or nonperformance by or significant reduction in purchases by any of them could adversely affect our business, results of operations and financial condition.”
Capital Plans
We expect 2025 capital expenditures to be between $13.0 million and $17.0 million, consisting primarily of capital for efficiency projects at our mine and processing facilities and our in-basin terminals, along with investments in our facilities to support incremental IPS activity. We expect to fund these capital expenditures with existing cash, cash generated from operations, or borrowings under the FCB ABL Credit Facility or other financing sources, such as equipment finance providers.
Industry Trends Impacting Our Business
Unless otherwise indicated, the information set forth under this section, including all statistical data and related forecasts, is derived from Spears’ “Hydraulic Fracturing Market - Q4 2024” published in the first quarter of 2025. While we are not aware of any misstatements regarding the proppant industry data presented herein, estimates involve risks and uncertainties and are subject to change based on various factors, including those discussed under the heading “Risk Factors.”
Demand Trends
Demand for frac sand continued to moderately increase during 2024. According to Spears, North America proppant demand increased by 7% in 2024 compared to 2023, mirroring an improving hydraulic fracturing market. The primary drivers for the increase in frac sand usage are increased lateral well lengths and increased volume of sand per linear foot of lateral well. The trend is expected to increase moderately in 2025 as well. Additionally, demand may increase over the next five years, which may be driven by increased export capacity of LNG and potential increased power demand for data centers.
Supply Trends
There was considerable consolidation activity including mergers, acquisitions, closures of mines and bankruptcy filings among our peers from 2020 to 2024. Supply and demand for Northern white frac sand was relatively in balance in 2023 and 2024 and this is expected to continue in 2025.
Supplies of high-quality Northern White frac sand are limited to select areas, predominantly in western Wisconsin and limited areas of Minnesota and Illinois. We believe the ability to obtain large contiguous reserves in these areas is a key constraint for potential new Northern White frac sand supply and can be an important supply consideration when assessing the economic viability of a potential frac sand processing facility. Further constraining the supply and throughput of Northern White frac sand is that not all of the large reserve mines have on-site excavation, processing or logistics capabilities, which impact the long-term competitiveness of these mines due to lower efficiency and higher cost structures. Historically, much of the capital investment in Northern White frac sand mines was used for the development of coarser deposits in western Wisconsin, which is inconsistent with the increasing demand for finer mesh frac sand in recent years. As such, we’ve seen competitors in the Northern White frac sand market reduce their capacity by shuttering or idling operations as the shift to finer sands in hydraulic fracturing of oil and natural gas wells and to lower cost regional sand sources has eroded the ongoing economic viability of mines with coarser reserve deposits and inefficient mining and logistics facilities.
Environmental, Social & Governance
Smart Sand already has a strong record of environmental performance. In 2014, we joined the Wisconsin Green Tier program, a marquee public/private partnership, under which the Wisconsin Department of Natural Resources worked with us on a plan to meet applicable legal requirements and to improve our facility from an environmental perspective. In addition to documenting 12 years of compliant operations, we have worked on, among other things, protecting wetlands, reducing usage and impact of heavy equipment, reducing fuel usage of equipment and vehicles and defining best practices for onsite water management. We are also a member of Wisconsin’s sustainability initiative, Green Masters. As part of this program, we have completed a detailed survey of our sustainability and social responsibility activities and started the process of completing carbon inventory. As a mining company, we invest and plan for reclamation, so that the land can be returned to beneficial use. Smart Sand has held ISO 9001/14001-2015 environmental and quality management systems for the past nine years. Smart Sand is also a member of the Wisconsin Industrial Sand Association, a select group of mining companies focused on safety, environmental and public policy.
We believe we provide social value through our excellent employment opportunities. Our first priority is keeping our employees safe, which we implement through daily training and inspections. Our business supports hundreds of families and we are proud to offer rewarding and interesting work with competitive compensation and benefits. We look to promote from within, provide continuous training, promote an inclusive work environment where employees have equal opportunity to succeed regardless of background, and provide every employee with the opportunity to participate in retirement plans and ownership of the Company. Smart Sand is an active charitable partner in the communities in which it operates, making both financial and time investments in those communities.
Permits
We operate in a highly regulated environment overseen by many governmental regulatory and enforcement bodies at the local, state and federal levels. To conduct our operations, we are required to obtain permits and approvals that address environmental, land use and health and safety issues at our operating facilities. Our current and planned areas for excavation at our mining facilities are permitted for extraction of our proven reserves. Portions of our facilities lie in areas designated as wetlands, which will require additional local, state and federal permits prior to mining and reclaiming those areas.
We also must meet requirements for certain international standards concerning safety, greenhouse gases and rail operations. We have voluntarily agreed to meet the standards of the Wisconsin Department of Natural Resources’ Green Tier program, the National Industrial Sand Association (“NISA”) and the Wisconsin Industrial Sand Association. Further, for Oakdale, we have agreed to meet the standards required to maintain our ISO 9001-2015 and ISO 14001-2015 quality/environmental management system registrations. At our Ottawa facility, we have had ISO 9001-2015 quality system registration for three years, and plan to register our ISO 14001-2015 environmental management system in 2025. These voluntary requirements are tracked and managed along with our permits.
While resources invested in securing permits are significant, this cost has not had a material adverse effect on our results of operations or financial condition. We cannot ensure that existing environmental, health and safety (“EHS”) laws and regulations will not be reinterpreted or revised or that new EHS laws and regulations will not be adopted or become applicable to us. Revised or additional EHS requirements that result in increased compliance costs or additional operating restrictions could have a material adverse effect on our business.
Competition
The proppant industry is highly competitive. Please read “Risk Factors—Risks Inherent in Our Business—We face significant competition that may cause us to lose market share.” There are numerous large and small producers in all sand producing regions of North America with whom we compete, many of which also offer solutions for unloading, storing and delivering proppant to the wellsite. Our main competitors include Badger Mining Corporation, HC Minerals, Inc., Covia Holdings Corporation, U.S. Silica Holdings, Inc., Capital Sand Company, Source Energy Services and Solaris Energy Infrastructure, Inc.
Although some of our competitors may have greater financial or natural resources than we do, we believe that we are well-positioned competitively due to our low cost of sand production, low debt levels, logistics infrastructure, high-quality, balanced reserve profile and patented SmartSystems wellsite proppant storage solutions, which offer numerous benefits over our competition. The most important factors on which we compete are our service capabilities, product quality, proven performance, sand characteristics, transportation capabilities, reliability of supply, price, logistics services and the performance of patented SmartSystems wellsite proppant storage solutions technology. Demand for frac sand and logistics solutions and the prices that we will be able to obtain for our products, to the extent not subject to a fixed price or take-or-pay contract, are closely linked to proppant consumption patterns for the completion of oil and natural gas wells in North America. These consumption patterns are influenced by numerous factors, including, among other things, the price for oil and natural gas and hydraulic fracturing activity, including the number of stages completed per well, the lateral length of horizontal wells being completed, and the amount of proppant used per stage. Further, these consumption patterns are also influenced by the location, quality, price and availability of frac sand and other types of proppants such as resin-coated sand and ceramic proppant.
Seasonality
Our business is affected to some extent by seasonal fluctuations in weather that impact the production levels for a portion of our wet sand processing capacity. While our dry plants are able to process finished product volumes evenly throughout the year, our excavation and our wet sand processing activities have historically been limited to primarily non-winter months. As a consequence, we have experienced lower cash operating costs in the first and fourth quarter of each calendar year, and higher cash operating costs in the second and third quarter of each calendar year when we overproduced wet sand to meet demand in the winter months. These higher cash operating costs are capitalized into inventory and expensed when these tons are sold, which can lead to us having higher overall costs in the first and fourth quarters of each calendar year as we expense inventory costs that were previously capitalized. However, we have enclosed, indoor wet plants at our Oakdale and Ottawa processing facilities, which allow us to produce wet sand inventory year-round to support a large portion of our dry sand processing capacity, which may reduce certain effects of this seasonality. We may also sell frac sand for use in oil and natural gas producing basins where severe weather conditions may curtail drilling activities and, as a result, our sales volumes to those areas may be reduced during such severe weather periods. Severe weather can also impact the rail lines which we utilize to ship our sand to our customers in the operating basins and as a result could lead to reduced sales volumes during such severe weather periods. Additionally, over the last several years, exploration and production companies have become more disciplined in their spending patterns relative to their budgets, which has led to some of our customers completing their budgeted spending earlier in the year. This spending discipline could potentially lead to a slowdown in activity by our customers and lower sand demand in the fourth quarter of the year. For a discussion of the impact of weather on our operations, please read “Risk Factors—Seasonal and severe weather conditions could have a material adverse impact on our business, results of operations and financial condition” and “Risk Factors—Our cash flow fluctuates on a seasonal basis.”
Intellectual Property
Our intellectual property primarily consists of trade secrets, know-how and trademarks. We own patents and have patent applications pending related to our SmartSystems wellsite proppant storage solutions. All of the issued patents have an expiration date after August 2030. With respect to our other products, we principally rely on trade secrets, rather than patents, to protect our proprietary processes, methods, documentation and other technologies, as well as certain other business information. For a discussion of the impact of our intellectual property, please read “Risk Factors–If we are unable to fully protect our intellectual property rights, we may suffer a loss in our competitive advantage” and “Risk Factors–We may be adversely affected by disputes regarding intellectual property rights of third parties.”
Insurance
We believe that our insurance coverage is customary for the industry in which we operate and adequate for our business. As is customary in the proppant industry, we review our safety equipment and procedures and carry insurance against most, but not all, risks of our business. Losses and liabilities not covered by insurance would increase our costs. To address the hazards inherent in our business, we maintain insurance coverage that includes physical damage coverage, third-party general liability insurance, employer’s liability, business interruption, environmental and pollution and other coverage, although coverage for
environmental and pollution-related losses is subject to significant limitations. For additional discussion regarding our insurance, please read “Risk Factors–Our operations are subject to operational hazards and unforeseen interruptions for which we may not be adequately insured.”
Environmental and Occupational Health and Safety Regulations
We are subject to stringent and complex federal, state, local and international laws and regulations governing the discharge of materials into the environment or otherwise relating to protection of worker health, safety and the environment. Compliance with these laws and regulations may expose us to significant costs and liabilities and cause us to incur significant capital expenditures in our operations. Any failure to comply with these laws and regulations may result in the assessment of administrative, civil and criminal penalties, imposition of remedial obligations, and the issuance of injunctions delaying or prohibiting operations. Private parties may also have the right to pursue legal actions to enforce compliance as well as to seek damages for non-compliance with environmental laws and regulations or for personal injury or property damage. In addition, the trend in environmental regulation is to place more restrictions on activities that may affect the environment, and thus, any changes in, or more stringent enforcement of, these laws and regulations that result in more stringent and costly pollution control equipment, the occurrence of delays in the permitting or performance of projects, or waste handling, storage, transport, disposal or remediation requirements could have a material adverse effect on our operations and financial position.
We do not believe that compliance by us with federal, state, local or international environmental laws and regulations will have a material adverse effect on our business, financial position or our results of operations or cash flows. We cannot be assured, however, that future events, such as changes in existing laws or enforcement policies, the promulgation of new laws or regulations or the development or discovery of new facts or conditions adverse to our operations will not cause us to incur significant costs. While we are confident in our compliance with current environmental regulations, we acknowledge the potential for policy shifts that could impact our operations. On January 20, 2025, President Trump issued a series of executive orders and memoranda signaling a shift in environmental and energy policy in the United States, including the revocation of approximately 80 Biden-era executive orders related to public health, the environment, climate change and climate-related financial risks. President Trump also declared a “national energy emergency,” directing agencies to expedite conventional energy projects. While the extent of the Trump Administration’s changes to the environmental regulatory landscape in the United States is unknown at this time, it is possible that additional changes in the future could impact our results of operation and those of our customers. The following is a discussion of environmental and worker health and safety laws, as amended from time to time that relate to our operations or those of our customers that could have a material adverse effect on our business.
Air Emissions
Our operations are subject to the federal Clean Air Act (“CAA”) and related state and local laws, which restrict the emission of air pollutants and impose permitting, monitoring and reporting requirements on various sources. Over the next several years, we may be required to incur certain capital expenditures for air pollution control equipment or to address other air emissions-related issues. Changing and increasingly stringent requirements, future non-compliance, or failure to maintain necessary permits or other authorizations could require us to incur substantial costs or suspend or terminate our operations.
Climate Change
In recent years, the U.S. Congress has considered legislation to reduce emissions of greenhouse gases (“GHG”). We are unable to predict actions that may be taken by the Federal government; however, a number of states are addressing GHG emissions, primarily through the development of emission inventories or regional GHG cap and trade programs. Depending on the particular program, we could be required to monitor, report, or control GHG emissions or to purchase and surrender allowances for GHG emissions resulting from our operations. Independent of Congress, the U.S. Environmental Protection Agency (“EPA”) has adopted regulations controlling GHG emissions under its existing authority. Compliance with new legislation may require us to incur substantial costs or suspend or terminate our operations. In addition, various policymakers, including the states of California, Illinois, and New York, have adopted or are considering adopting requirements for in-scope companies to disclose certain climate-related information, including on GHG emissions and climate risks. For example, the U.S. Securities and Exchange Commission (“SEC”) issued a proposed rule in March 2022 that will mandate extensive disclosure of climate-related data, risks, GHG emissions, for certain public companies. The SEC issued a final in March 2024. Multiple lawsuits have been filed and in April 2024, the SEC voluntarily stayed the rules pending the outcome of the litigation.
Additionally, following the issuance of an executive order by President Trump, the U.S. has initiated the process to withdraw from the Paris Agreement, reverting to the position held during President Trump’s first term. The executive order also mandates ending financial commitments under the United Nations Framework Convention on Climate Change and revokes the U.S. International Climate Finance Plan. It is possible that other climate-related reporting regulations applicable to many U.S. companies will continue to take effect.
Water Discharges
The Clean Water Act (“CWA”) and analogous state laws impose restrictions and strict controls with respect to the discharge of pollutants, including spills and leaks of oil and other substances, into state waters or waters of the United States. The discharge of pollutants into regulated waters is prohibited, except in accordance with the terms of a permit issued by the EPA or an analogous state agency. The CWA and regulations implemented thereunder also prohibit the discharge of dredge and fill material into regulated waters, including jurisdictional wetlands, unless authorized by the Army Corps of Engineers (“Corps”) pursuant to an appropriately issued permit. In addition, the CWA and analogous state laws require individual permits or coverage under general permits for discharges of storm water runoff from certain types of facilities. Compliance with new rules and legislation could require us to face increased costs and delays with respect to obtaining permits for expansion activities. Federal and state regulatory agencies can impose administrative, civil and criminal penalties as well as other enforcement mechanisms for non-compliance with discharge permits or other requirements of the CWA and analogous state laws and regulations.
Hydraulic Fracturing
We supply frac sand to hydraulic fracturing operators in the oil and natural gas industry. Hydraulic fracturing is an industry practice that is used to stimulate production of oil and natural gas from low permeability hydrocarbon bearing subsurface rock formations. The hydraulic fracturing process involves the injection of water, proppants, and chemicals under pressure into the formation to fracture the surrounding rock, increase permeability and stimulate production. Although we do not directly engage in hydraulic fracturing activities, our customers purchase our frac sand for use in their hydraulic fracturing activities.
The adoption of new laws or regulations at the federal or state levels imposing reporting obligations on, or otherwise limiting or delaying, the hydraulic fracturing process could make it more difficult to complete natural gas wells, increase our customers’ costs of compliance and doing business, and adversely affect the hydraulic fracturing services they perform, which could negatively impact demand for our frac sand.
Non-Hazardous and Hazardous Wastes
The Resource Conservation and Recovery Act (“RCRA”) and comparable state laws control the management and disposal of hazardous and non-hazardous waste. These laws and regulations govern the generation, storage, treatment, transfer and disposal of wastes that we generate. In the course of our operations, we generate waste that is regulated as non-hazardous waste and hazardous waste, obligating us to comply with applicable standards relating to the management and disposal of such waste. In addition, drilling fluids, produced waters, and most of the other wastes associated with the exploration, development, and production of oil or natural gas, if properly handled, are currently exempt from regulation as hazardous waste under RCRA and, instead, are regulated under RCRA’s less stringent non-hazardous waste provisions, state laws or other federal laws. However, it is possible that certain oil and natural gas drilling and production wastes now classified as non-hazardous could be classified as hazardous waste in the future. A loss of the RCRA exclusion for drilling fluids, produced waters and related waste could result in an increase in our customers’ costs to manage and dispose of generated wastes and a corresponding decrease in their drilling operations, which developments could have a material adverse effect on our business.
Site Remediation
The Comprehensive Environmental Response, Compensation, and Liability Act, as amended (“CERCLA”) and comparable state laws impose strict, joint and several liability without regard to fault or the legality of the original conduct on certain classes of persons that contributed to the release of a hazardous substance into the environment. These persons include the owner and operator of a disposal site where a hazardous substance release occurred and any company that transported, disposed of, or arranged for the transport or disposal of hazardous substances released at the site. Under CERCLA, such persons may be liable for the costs of remediating the hazardous substances that have been released into the environment, for damages to natural resources, and for the costs of certain health studies. In addition, where contamination may be present, it is not uncommon for the neighboring landowners and other third parties to file claims for personal injury, property damage and recovery of response costs. We have not received notification that we may be potentially responsible for cleanup costs under CERCLA at any site.
Endangered Species
The Endangered Species Act (“ESA”) restricts activities that may result in a “take” of the habitat of endangered or threatened species and provides for substantial penalties in cases where listed species are being harmed. Harm under the ESA includes acts that actually kill or injure wildlife as well as significant habitat modification or degradation that significantly
impairs essential behavioral patterns, including breeding, feeding or sheltering. Take prohibitions also protect migratory birds under the Migratory Bird Treaty Act (“MBTA”).
The dunes sagebrush lizard is one example of a species that, if listed as endangered or threatened under the ESA, could impact the operations of our customers. The dunes sagebrush lizard is found in the active and semi-stable shinnery oak dunes of southeastern New Mexico and adjacent portions of Texas, including areas where our customers operate and our frac sand facilities may be located. On May 20, 2024, the United States Fish and Wildlife Service (“USFWS”) listed the dunes sagebrush lizard as an endangered species. In turn the operations of our customers in any area that is designated as the dunes sagebrush lizard’s habitat may be limited, delayed or, in some circumstances, prohibited, and our customers could be required to comply with expensive conservation measures intended to protect the dunes sagebrush lizard and its habitat.
The USFWS has approved several Enhancement of Survival Permits that allow operations in designated habitats to continue if the dunes sagebrush lizard is listed provided that qualification criteria and conservation measures required by such permits are met. One such permit is referred to as the Texas Conservation Plan (“TCP”). The TCP was developed as a voluntary conservation plan for the dunes sagebrush lizard by the Texas Comptroller, which served as the permit holder until the transfer of the TCP to a new permit holder in September 2020. Smart Sand is a participant in the TCP and has enrolled 2,713-acres of its land in Winkler, County, Texas. In January 2021, the USFWS issued a second Enhancement of Survival Permit for operations in West Texas that may affect the dunes sagebrush lizard. These permits cover incidental “take” of the habitat of the dunes sagebrush lizard associated with oil and gas exploration and development, sand mining, renewable energy development and operations, pipeline construction and operations, local government activities, agricultural activities, and general construction activities within the permit area that could affect suitable habitat. Smart Sand’s enrollment in the TCP minimizes the potential that new or more stringent conservation measures or land, water, or resource use restrictions beyond the measures and restrictions in the TCP may be required for that property.
Another species whose recent listing could impact our operations and the operations of our customers is the lesser prairie-chicken. In November 2022, the USFWS formally listed two Distinct Population Segments (“DPSs”) of the lesser prairie-chicken under the ESA. The Southern DPS, the habitat of which includes portions of southeast New Mexico and western Texas, was listed as endangered, while the Northern DPS, the habitat of which spans from northern Texas, through eastern Oklahoma, and into southeastern Colorado and southwestern Nebraska, was listed as threatened. The listed territory of the Southern DPS could overlap with the operating areas of some of our customers.
To the extent species are listed under the ESA or similar state laws, or are protected under the MBTA, or previously unprotected species are designated as threatened or endangered in areas where we or our customers operate, we could experience increased costs arising from species protection measures and delays or limitations in our or our customers’ performance of operations, which could adversely affect or reduce demand for our frac sand. On January 20, 2025, President Trump declared a national energy emergency, directing agencies to maximize the use of emergency consultations under the ESA to facilitate the nation’s fossil fuel energy supply; however, it is not possible to predict the impact of such potential actions on our or our customers’ operations at this time.
Mining and Workplace Safety
Our sand mining operations are subject to mining safety regulation. The U.S. Mining Safety and Health Administration (“MSHA”) is the primary regulatory organization governing frac sand mining and processing. Accordingly, MSHA regulates quarries, surface mines, underground mines and the industrial mineral processing facilities associated with and located at quarries and mines. The mission of MSHA is to administer the provisions of the Federal Mine Safety and Health Act of 1977 as amended by the Mine Improvement and New Emergency Response (MINER) Act of 2006 and to enforce compliance with mandatory miner safety and health standards. As part of MSHA’s oversight, representatives perform at least two unannounced inspections annually for each above-ground facility.
OSHA has promulgated rules for workplace exposure to respirable silica for several other industries. Respirable silica is a known health hazard for workers exposed over long periods. In April 2024, MSHA issued final rules regarding Lowering Miners’ Exposure to Respirable Crystalline Silica and Improving Respiratory Protection, which, among other updates, reduced the exposure limits, required immediate corrective actions if exposure limits are exceeded, required exposure sampling and no-cost medical surveillance, and updated respiratory protection requirements. We were already compliant with the inspections and monitoring of health and safety conditions at our plants. Smart Sand also adheres to the NISA’s respiratory protection program, and ensures that workers are provided with fitted respirators and ongoing radiological monitoring.
Environmental Reviews
Our operations may be subject to broad environmental review under the National Environmental Policy Act, as amended, (“NEPA”). NEPA requires federal agencies to evaluate the environmental impact of all “major federal actions” significantly
affecting the quality of the human environment. The granting of a federal permit for a major development project, such as a mining operation, may be considered a “major federal action” that requires review under NEPA. As part of this evaluation, the federal agency considers a broad array of environmental impacts, including, among other things, impacts on air quality, water quality, wildlife (including threatened and endangered species), historic and archeological resources, geology, socioeconomics, and aesthetics. NEPA also requires the consideration of alternatives to the project. The NEPA review process, especially the preparation of a full environmental impact statement, can be time consuming and expensive. The purpose of the NEPA review process is to inform federal agencies’ decision-making on whether federal approval should be granted for a project and to provide the public with an opportunity to comment on the environmental impacts of a proposed project. Though NEPA requires only that an environmental evaluation be conducted and does not mandate a particular result, a federal agency could decide to deny a permit or impose certain conditions on its approval, based on its environmental review under NEPA, or a third party could challenge the adequacy of a NEPA review and thereby delay the issuance of a federal permit or approval. In January 2020, the White House Council on Environmental Quality (“CEQ”) published a Notice of Proposed Rulemaking that would revise NEPA’s implementing regulations, with the stated purpose of facilitating more efficient and timely NEPA reviews. In July 2020, CEQ issued a final rule implementing the January 2020 proposal. However, several states and environmental groups filed challenges to this rulemaking. CEQ issued an Interim Final Rule in June 2021, which extended the deadline by two years (to September 14, 2023) for federal agencies to develop or update their NEPA implementing procedures to conform to the CEQ regulations. Additionally, in October 2021, the CEQ issued a notice of proposed rulemaking to reintroduce certain requirements removed or reduced by the July 2020 amendments, and the Infrastructure and Investment Jobs Act, Pub.L. 117-58, signed into law in November 2021, codified some of the July 2020 amendments in statutory text. In April 2022, CEQ issued the Phase 1 Final Rule, which finalizes a narrow set of changes to generally restore regulatory provisions that were in effect for decades before the 2020 rule modified them for the first time. In June 2023, the Fiscal Responsibility Act, which reforms NEPA, was signed into law by President Biden, and in May of 2024, CEQ finalized the Phase 2 Rule, which is intended to accelerate the permitting process and, among other changes, clarifies which projects require environmental impact statements and that agencies must consider climate change as part of the review process. Several legal challenges to CEQ’s authority to issue binding regulations under NEPA are ongoing and may impact CEQ’s authority to issue NEPA regulations of any kind. In addition, on January 20, 2025, President Trump ordered CEQ to rescind the May 2024 NEPA regulations and to issue guidance to the departments and agencies on implementing NEPA. President Trump also revoked the 1977 order authorizing CEQ to issue binding regulations under NEPA. At this time, we cannot predict what further revisions, if any, will be made to NEPA’s implementing regulations, and what impacts, if any, they will have on our operations.
State and Local Regulation
We are subject to a variety of state and local environmental review and permitting requirements. Some states, including Wisconsin where our current projects are located, have state laws similar to NEPA; thus, our development of a new site or the expansion of an existing site may be subject to comprehensive state environmental reviews even if it is not subject to NEPA. In some cases, the state environmental review may be more stringent than the federal review. Our operations may require state-law based permits in addition to federal permits, requiring state agencies to consider a range of issues, many the same as federal agencies, including, among other things, a project’s impact on wildlife and their habitats, historic and archaeological sites, aesthetics, agricultural operations, and scenic areas. Wisconsin has specific permitting and review processes for commercial silica mining operations, and state agencies may impose different or additional monitoring or mitigation requirements than federal agencies. The development of new sites and our existing operations also are subject to a variety of local environmental and regulatory requirements, including land use, zoning, building, and transportation requirements.
Demand for frac sand in the oil and natural gas industry drove a significant increase in the production of frac sand. As a result, some local communities expressed concern regarding silica sand mining operations. These concerns have generally included exposure to ambient silica sand dust, truck traffic, water usage and blasting. In response, certain state and local communities have developed or are in the process of developing regulations or zoning restrictions intended to minimize dust from becoming airborne, control the flow of truck traffic, significantly curtail the amount of practicable area for mining activities, provide compensation to local residents for potential impacts of mining activities and, in some cases, ban issuance of new permits for mining activities. To date, we have not experienced any material impact to our existing mining operations or planned capacity expansions as a result of these types of concerns. We would expect this trend to continue as oil and natural gas production increases.
In August 2014, we were accepted as a Tier 1 participant in Wisconsin’s voluntary Green Tier program, which encourages, recognizes and rewards companies for voluntarily exceeding environmental, health and safety legal requirements. Successful Tier 1 participants are required to demonstrate a strong record of environmental compliance, develop and implement an environmental management system meeting certain criteria, conduct and submit annual performance reviews to the Wisconsin Department of Natural Resources, promptly correct any findings of non-compliance discovered during these annual performance reviews, and make certain commitments regarding future environmental program improvements. Our most recent annual report required under the Tier 1 protocol was submitted to the Green Tier Program contact on May 31, 2024.
Employees
As of December 31, 2024, we employed 285 people, of which 25 were employed under a collective bargaining agreement. The current collective bargaining agreements expire April 30, 2027. We offer competitive salaries and a comprehensive package of employee benefits, including bonuses, retirement savings plans, medical, dental, life and disability coverage. We consider our employee relations to be good.
Executive Officers of the Registrant
Charles E. Young
Charles E. Young was named Chief Executive Officer in July 2014. Mr. Young has also served as a director since September 2011. Mr. Young founded Smart Sand, LLC (our predecessor) and served as its President from November 2009 to August 2011. Mr. Young served as our President and Secretary from September 2011 to July 2014. Mr. Young has over 25 years of executive and entrepreneurial experience in the high-technology, telecommunications and renewable energy industries. He previously served as the President and Founder of Premier Building Systems, a construction, solar, geothermal and energy audit company in Pennsylvania and New Jersey from 2006 to 2011. Mr. Young serves as a director for Gravity Oilfield Services, Inc., a privately-held company. Mr. Young received a B.A. in Political Science from Miami University. Mr. Young is the brother of William John Young, our Chief Operating Officer, and James D. Young, our Executive Vice President, General Counsel and Secretary. We believe that Mr. Young’s industry experience and deep knowledge of our business makes him well suited to serve as Chief Executive Officer and Director.
Lee E. Beckelman
Lee E. Beckelman was named Chief Financial Officer in August 2014. From December 2009 to February 2014, Mr. Beckelman served as Executive Vice President and Chief Financial Officer of Hilcorp Energy Company, an exploration and production company. From February 2008 to October 2009, he served as the Executive Vice President and Chief Financial Officer of Price Gregory Services, Incorporated, a crude oil and natural gas pipeline construction firm until its sale to Quanta Services. Prior thereto, Mr. Beckelman served in various roles from 2002 to 2007 at Hanover Compressor Company, an international oilfield service company, until its merger with Universal Compression to form Exterran Holdings. Mr. Beckelman received his BBA in Finance with High Honors from the University of Texas at Austin.
William John Young
William John Young was named Chief Operating Officer in April 2018. Prior to that time, he served as Executive Vice President of Sales and Logistics from October 2016 to April 2018. Mr. Young served as Vice President of Sales and Logistics from May 2014 to September 2016 and Director of Sales from November 2011 to April 2014. Prior to joining us, Mr. Young was a Director of Sales for Comcast Corporation from 2002 to 2011. Mr. Young brings over 25 years of experience in the mining, commercial telecommunications and broadband industries. Mr. Young received a BSc in Biology from Dalhousie University. Mr. Young is the brother of Charles E. Young, our Chief Executive Officer and member of our board of directors, and James D. Young, our Executive Vice President, General Counsel and Secretary.
Robert Kiszka
Robert Kiszka was named Executive Vice President of Operations in May 2014. Previously, Mr. Kiszka served as the Vice President of Operations from September 2011 to May 2014. Mr. Kiszka has over 25 years of construction, real estate, renewable energy and mining experience. Mr. Kiszka has been the owner of A-1 Bracket Group Inc. since 2005 and was a member of Premier Building Systems LLC from 2010 to 2011. Mr. Kiszka attended Pedagogical University in Krakow, Poland and Rutgers University.
Ronald P. Whelan
Ronald P. Whelan was named Executive Vice President of Last Mile Solutions in January 2025. Prior to that time, he served as Executive Vice President of Sales from June 2018 to December 2024, Executive Vice President of Business Development from April 2017 to June 2018, Vice President of Business Development from September 2016 to March 2017 and as Director of Business Development from April 2014 to August 2016. Prior to being named Director of Business Development, Mr. Whelan was the Operations Manager responsible for the design, development and production of the Oakdale facility from November 2011 to April 2014. Before joining Smart Sand, Mr. Whelan ran his own software design company from 2004 to 2011 and was a member of Premier Building Systems LLC from 2008 to 2009. Mr. Whelan has over 20 years of entrepreneurial experience in mining, technology and renewable energy industries. Mr. Whelan received a B.A. in Marketing from Bloomsburg University and M.S. in Instructional Technology from Bloomsburg University.
James D. Young
James D. Young was named Executive Vice President, General Counsel and Secretary in June 2017. Prior to joining us, Mr. Young was a partner of the law firm Fox Rothschild LLP, where he worked for thirteen years and served as our outside general counsel. Mr. Young received a J.D. from Rutgers University School of Law and a B.A. in History and Political Science from the University of Toronto. Mr. Young is the brother of Charles E. Young, our Chief Executive Officer and member of our board of directors, and William John Young, our Chief Operating Officer.
Available Information
Our website address is www.smartsand.com. Our annual reports on Form 10-K, quarterly reports on Form 10-Q, current reports on Form 8-K and amendments to those reports are available on our website, without charge, as soon as reasonably practicable after they are filed electronically with the SEC. The SEC also maintains a website that contains reports, proxy and information statements and other information statements and other information regarding issuers who file electronically with the SEC. The SEC’s website address is www.sec.gov.
ITEM 1A. — RISK FACTORS
Risks Inherent in Our Business
Our business and financial performance depend on the level of activity in the oil and natural gas industry.
Substantially all of our revenues are derived from sales to companies in the oil and natural gas industry. As a result, our operations are dependent on the levels of activity in oil and natural gas exploration, development and production and prevailing oil and natural gas prices. More specifically, the demand for the proppants we produce and our wellsite storage and proppant management solutions is closely related to the number of oil and natural gas wells completed in geological formations where sand-based proppants are used in fracturing activities. These activity levels are affected by both short- and long-term trends in oil and natural gas prices, among other factors.
Oil and natural gas prices and, therefore, the level of exploration, development and production activity, experienced a high level of volatility in recent years. In addition, prices can be affected by a number of factors beyond our control, including weather conditions, seasonal trends, domestic and foreign supply of and demand for natural gas, domestic, local and foreign governmental regulations, tariffs and taxes, including environmental and climate change regulation, among others.
A prolonged reduction in oil and natural gas prices or a sustained lack of key resources that affect drilling activity, whether due to recession, political developments or other events, would generally depress the level of oil and natural gas exploration, development, production and well completion activity and would result in a corresponding decline in the demand for the proppants we produce and our wellsite proppant storage solutions. Such a decline would have a material adverse effect on our business, results of operation and financial condition. The commercial development of economically viable alternative energy sources (such as wind, solar, geothermal, tidal, batteries, fuel cells and biofuels) could have a similar effect. In addition, certain U.S. federal income tax deductions currently available with respect to oil and natural gas exploration and development may be eliminated. Any future decreases in the rate at which oil and natural gas reserves are discovered or developed, whether due to the passage of legislation, increased governmental regulation leading to limitations, or prohibitions on exploration and drilling activity, including hydraulic fracturing, or other factors, could have a material adverse effect on our business and financial condition, even in a stronger oil and natural gas price environment.
A significant portion of our revenues have been generated with a limited number of customers, and the loss of, material nonpayment or nonperformance by or significant reduction in purchases by any of them could adversely affect our business, results of operations and financial condition.
A material portion of our revenues are generated from a limited number of customers. The ability or willingness of each of our customers to maintain their purchases from us will depend on a number of factors that are beyond our control and may include, among other things, the overall operations and financial condition of the counterparty, the condition of the U.S. oil and natural gas exploration and production industry, continuing use of frac sand in hydraulic fracturing operations and general economic conditions. In addition, in depressed market conditions, our customers may reduce the amount of sand they purchase from us or they may be able to obtain comparable products at a lower price. If our customers with long-term contracts experience a significant downturn in their business or financial condition, they may attempt to renegotiate our contracts. For example, certain of our contracts were adjusted in 2020 due to effects of the COVID-19 pandemic, resulting in a combination of
reduced average selling prices per ton, adjustments to take-or-pay volumes and length of contract. If any of our major customers substantially reduces or altogether ceases purchasing our sand and we are not able to generate replacement sales of sand into the market, our business, financial condition and results of operations could be adversely affected until such time as we generate replacement sales in the market. In addition, as contracts expire, depending on market conditions at the time, our contracted customers may choose not to extend these contracts which could lead to a significant reduction of sales volumes and corresponding revenues, cash flows and financial condition if we are not able to replace these contracts with new sales volumes. Even if we were to replace any lost volumes, lower prices for our product could materially reduce our revenues, cash flow and financial condition. Additionally, consolidation and vertical integration of pressure pumpers and exploration and production companies continues in the industry and this trend could lead to fewer overall customers for us to market sand to and negatively impact our sales volumes.
We are exposed to the credit risk of our customers, and any material nonpayment or nonperformance by our customers could adversely affect our business, results of operations and financial condition.
We are subject to the risk of loss resulting from nonpayment or nonperformance by our customers. Our credit procedures and policies may not be adequate to fully eliminate customer credit risk. If we fail to adequately assess the creditworthiness of existing or future customers or unanticipated deterioration in their creditworthiness, any resulting increase in nonpayment or nonperformance by them and our inability to re-market or otherwise use the production could have a material adverse effect on our business, results of operations and financial condition. A decline in natural gas and crude oil prices could negatively impact the financial condition of our customers and sustained lower prices could impact their ability to meet their financial obligations to us. Further, our contract counterparties may not perform or adhere to our existing or future contractual arrangements. To the extent one or more of our contract counterparties is in financial distress or commences bankruptcy proceedings, contracts with these counterparties may be subject to renegotiation or rejection under applicable provisions of the United States Bankruptcy Code. Any material nonpayment or nonperformance by our contract counterparties due to inability or unwillingness to perform or adhere to contractual arrangements could adversely affect our business and results of operations.
We face significant competition that may cause us to lose market share.
The proppant industry is highly competitive. The proppant market is characterized by a small number of large, national producers and a larger number of small, regional or local producers. Competition in this industry is based on price, consistency and quality of product, site location, distribution and logistics capabilities, customer service, reliability of supply, breadth of product offering (including wellsite storage products and services) and technical support.
Some of our competitors have greater financial and other resources than we do. Also, certain of our competitors have emerged from bankruptcy in recent years and may be able to offer more attractive pricing as a result of lower debt obligations. In addition, our larger competitors may develop technology superior to ours or may have production facilities that offer lower-cost transportation to certain customer locations than we do. When the demand for hydraulic fracturing services decreases or the supply of proppant available in the market increases, prices in the frac sand market can materially decrease. Furthermore, oil and natural gas exploration and production companies and other providers of hydraulic fracturing services have acquired and in the future may acquire their own frac sand reserves to fulfill their proppant requirements, and these other market participants may expand their existing frac sand production capacity, all of which would negatively impact demand for our frac sand. In addition, increased competition in the proppant industry could have an adverse impact on our ability to enter into long-term contracts or to enter into contracts on favorable terms. For example, supplies of regional frac sand from our competitors became available in 2018, starting in the Permian Basin of West Texas, and have continued to expand to certain other basins in or near where we sell sand. Regional frac sand has had a negative impact on our ability to sell our Northern White Sand in the Permian Basin or other markets in close proximity to these regional mines. The reduced ability to sell sand in operating basins with regional sand supply has led to increased competition among our competitors in other basins and could lead to pressure to reduce prices to compete effectively.
We may be required to make substantial capital expenditures to maintain and grow our asset base. We may not realize enough of a return on such capital expenditures to cover their costs. Also, the inability to obtain needed capital or financing on satisfactory terms, or at all, could have an adverse effect on our business, results of operations and financial condition.
We rely on cash generated from our operations and the availability of credit to fund our capital expenditures. We have made significant capital expenditures, and expect to make additional capital expenditures in the future. We cannot provide any assurance that we will receive an adequate return on such capital expenditures.
In addition, our ability to maintain existing debt financing or to access the capital markets for future equity or debt offerings may be limited by our financial condition at the time of any such financing or offering, the covenants or borrowing base restrictions contained in our FCB ABL Credit Facility or other current or future debt agreements, adverse market
conditions or other contingencies and uncertainties that are beyond our control. Our failure to obtain the funds necessary to maintain, develop and increase our asset base could adversely impact our business, results of operations and financial condition.
Even if we are able to maintain existing financing or access the capital markets, incurring additional debt may significantly increase our interest expense and financial leverage, and our level of indebtedness could restrict our ability to fund future development and acquisition activities. In addition, the issuance of additional equity interests may result in significant dilution to our existing common stockholders.
Inaccuracies in estimates of volumes and qualities of our sand reserves could result in lower than expected sales and higher than expected cost of production.
We rely on our independent reserve engineers’ prepared estimates of our reserves based on engineering, economic and geological data assembled and analyzed by our engineers and geologists. However, frac sand reserve estimates are by nature imprecise and depend to some extent on statistical inferences drawn from available data, which may prove unreliable. There are numerous uncertainties inherent in estimating quantities and qualities of reserves and non-reserve frac sand deposits and costs to mine recoverable reserves, including many factors beyond our control. Estimates of economically recoverable frac sand reserves necessarily depend on a number of factors and assumptions, all of which may vary considerably from actual results, such as:
•geological and mining conditions and/or effects from prior mining that may not be fully identified by available data or that may differ from experience;
•assumptions concerning future prices of frac sand, operating costs, mining technology improvements, development costs and reclamation costs; and
•assumptions concerning future effects of regulation, including wetland mitigation requirements, the issuance of required permits and the assessment of taxes by governmental agencies.
Any inaccuracy in our independent reserve engineer’s estimates related to our frac sand reserves or non-reserve frac sand deposits could result in lower than expected sales or higher than expected costs. For example, estimates of our proven and probable recoverable sand reserves assume that our revenue and cost structure will remain relatively constant over the life of our reserves. If these assumptions prove to be inaccurate, some or all of our reserves may not be economically mineable, which could have a material adverse effect on our results of operations and cash flows. In addition, our current customer contracts require us to deliver frac sand that meets certain specifications. If estimates of the quality of our reserves, including the volumes of the various specifications of those reserves, prove to be inaccurate, we may incur significantly higher excavation costs without corresponding increases in revenues, we may not be able to meet our contractual obligations, or our facilities may have a shorter than expected reserve life, any of which could have a material adverse effect on our results of operations and cash flows.
Our sand is currently produced at three facilities and our sales are dependent on delivery by railroads. Any adverse developments at our production facilities, rail terminals, or on any rail line could have a material adverse effect on our business, financial condition and results of operations.
All of our sand sales are currently produced at our facilities near Oakdale, Wisconsin, Ottawa, Illinois and Blair, Wisconsin. We ship a substantial portion of our sand through our rail terminals. Any adverse development at these facilities, our rail terminals, or on any of the rail lines we use to deliver our sand due to catastrophic events, weather, or any other event that would cause us to curtail, suspend or terminate operations at such facilities or terminals, could result in us being unable to meet our contracted sand deliveries. Although we have access to more than one Class I rail line, we may not be able to facilitate all shipments of product from one facility. We maintain insurance coverage to cover a portion of these types of risks; however, there are potential risks associated with our operations not covered by insurance. There also may be certain risks covered by insurance where the policy does not reimburse us for all of the costs related to a loss. Downtime or other delays or interruptions to our operations that are not covered by insurance could have a material adverse effect on our business, results of operations and financial condition. In addition, under our long-term take-or-pay contracts, if we are unable to deliver contracted volumes and a customer arranges for delivery from a third party at a higher price, we may be required to pay that customer the difference between our contract price and the price of the third-party product.
If we are unable to make acquisitions on economically acceptable terms, our future growth would be limited.
A portion of our strategy to grow our business is dependent on our ability to make acquisitions. If we are unable to make acquisitions from third parties because we are unable to identify attractive acquisition candidates or negotiate acceptable purchase contracts, we are unable to obtain financing for these acquisitions on economically acceptable terms or we are outbid
by competitors, our future growth may be limited. Any acquisition involves potential risks, some of which are beyond our control, including, among other things:
•mistaken assumptions about revenues and costs, including synergies;
•inability to integrate successfully the businesses we acquire;
•inability to hire, train or retain qualified personnel to manage and operate our business and newly acquired assets;
•the assumption of unknown liabilities;
•limitations on rights to indemnity from the seller;
•mistaken assumptions about the overall costs of equity or debt;
•diversion of management’s attention from other business concerns;
•unforeseen difficulties operating in new product areas or new geographic areas; and
•customer or key employee losses at the acquired businesses.
If we consummate any future acquisitions, our capitalization and results of operations may change significantly, and common stockholders will not have the opportunity to evaluate the economic, financial and other relevant information that we will consider in determining the application of these funds and other resources.
Restrictions in our FCB ABL Credit Facility may limit our ability to capitalize on potential acquisition and other business opportunities.
The operating and financial restrictions and covenants in our FCB ABL Credit Facility could restrict our ability to finance future operations or capital needs or to expand or pursue our business activities. For example, our FCB ABL Credit Facility restricts or limits our ability to:
•grant liens;
•incur additional indebtedness;
•engage in a merger, consolidation or dissolution;
•enter into transactions with affiliates;
•sell or otherwise dispose of assets, businesses and operations;
•materially alter the character of our business as conducted at the time of filing of this annual report; and
•make acquisitions, investments and capital expenditures.
Furthermore, the borrowing base under our FCB ABL Credit Facility is recalculated from time to time based on our eligible accounts receivable and inventory. Decreases in our eligible accounts receivable and inventory may limit our available borrowing levels and may require us to comply with certain financial ratios.
We face distribution and logistical challenges in our business.
Transportation and logistical operating expenses comprise a significant portion of the costs incurred by our customers to deliver frac sand to the wellhead, which could favor suppliers located in close proximity to the customer. As oil and natural gas prices fluctuate, our customers may shift their focus to different resource plays, some of which may be located in geographic areas that do not have well-developed transportation and distribution infrastructure systems, or seek contracts with additional delivery and pricing alternatives including contracts that sell product on an “as-delivered” basis at the target shale basin. Serving our customers in these less-developed areas presents distribution and other operational challenges that may affect our sales and negatively impact our operating costs and any delays we experience in optimizing our logistics infrastructure or developing additional origination and destination points may adversely affect our ability to renew existing contracts with customers seeking additional delivery and pricing alternatives. Disruptions in transportation services, including shortages of railcars, lack of developed infrastructure, weather-related problems, flooding, drought, accidents, mechanical difficulties, strikes, lockouts, bottlenecks, environmental restrictions or other events could affect our ability to timely and cost effectively deliver to our customers and could temporarily impair the ability of our customers to take delivery and, in certain
circumstances, constitute a force majeure event under our customer contracts, permitting our customers to suspend taking delivery of and paying for our frac sand (and in some cases terminating the agreement after a period of time). Additionally, increases in the price of transportation costs, including freight charges, fuel surcharges, transloading fees, terminal switch fees and demurrage costs, could negatively impact operating costs if we are unable to pass those increased costs along to our customers. Accordingly, because we are so dependent on rail infrastructure, if there are disruptions of the rail transportation services utilized by us or our customers, and we or our customers are unable to find alternative transportation providers to transport our products, our business and results of operations could be adversely affected. Further, declining volumes could result in railcar over-capacity, which would lead to railcar storage fees while, at the same time, we would continue to incur lease costs for those railcars in storage. Failure to find long-term solutions to these logistical challenges could adversely affect our ability to respond quickly to the needs of our customers or result in additional increased costs, and thus could negatively impact our business, results of operations and financial condition.
We may be adversely affected by decreased demand for frac sand due to the development of effective alternative proppants or new processes to replace hydraulic fracturing.
Frac sand is a proppant used in the completion and re-completion of oil and natural gas wells to stimulate and maintain oil and natural gas production through the process of hydraulic fracturing. Frac sand is the most commonly used proppant and is less expensive than other proppants, such as resin-coated sand and manufactured ceramics. A significant shift in demand from frac sand to other proppants, or the development of new processes to make hydraulic fracturing more efficient that could replace it altogether, could cause a decline in the demand for the frac sand we produce and result in a material adverse effect on our business, results of operations and financial condition.
An increase in the supply of frac sand having similar characteristics as the frac sand we produce could make it more difficult for us to maintain sales with existing customers or obtain new customers on favorable terms, or at all.
If significant new reserves of frac sand are discovered and developed, and those frac sands have similar characteristics to the frac sand we produce, we may be unable to maintain sales with our existing customers, obtain new customers on favorable terms, or at all. Specifically, if frac sand is oversupplied, our customers may reduce their sales volumes, may not be willing to purchase sand from us, may demand lower prices, any one or combination of the preceding could have a material adverse effect on our business, results of operations and financial condition. For example, new supplies of regional frac sand from our competitors became available in 2018, primarily in the Permian Basin of West Texas. Since then, other regional frac sand mines have opened in or near additional basins where we sell sand. These new supplies have had a negative impact on our ability to sell our Northern White Sand in the Permian Basin or other markets in close proximity to these regional mines.
Our operations are subject to operational hazards and unforeseen interruptions for which we may not be adequately insured.
Our operations are exposed to potential natural disasters, including blizzards, tornadoes, storms, floods, other adverse weather conditions and earthquakes. In addition, our employees could be subject to a COVID-19 or other outbreak at one or more of our facilities. If any of these events were to occur, we could incur substantial losses because of operational downtime, personal injury or loss of life, severe damage to and destruction of property and equipment, and pollution or other environmental damage resulting in curtailment or suspension of our operations.
We are not fully insured against all risks incident to our business, including the risk of our operations being interrupted due to severe weather and natural disasters. Furthermore, we may be unable to maintain or obtain insurance of the type and amount we desire at reasonable rates. As a result of market conditions, premiums and deductibles for some of our insurance policies have increased and could escalate further. In addition, sub-limits have been imposed for certain risks. In some instances, certain insurance could become unavailable or available only for reduced amounts of coverage. If we were to incur a significant liability for which we are not fully insured, it could have a material adverse effect on our business, results of operations and financial condition.
Our production process consumes large amounts of natural gas and electricity. An increase in the price or a significant interruption in the supply of these or any other energy sources could have a material adverse effect on our business, results of operations and financial condition.
Energy costs, primarily natural gas and electricity, represented approximately 7.1% of our total cost of goods sold for the year ended December 31, 2024. Natural gas is currently the primary fuel source used for drying in our frac sand production process. As a result, our profitability will be impacted by the price and availability of natural gas we purchase from third parties. Because we have not contracted for all of our natural gas usage on a fixed-price basis, our costs and profitability will be impacted by fluctuations in prices for natural gas. The price and supply of natural gas is unpredictable and can fluctuate significantly based on domestic, international, political and economic circumstances, as well as other events outside our control,
such as changes in supply and demand due to weather conditions, actions by OPEC, governmental regulations and sanctions, regional production patterns, security threats and environmental concerns. In addition, potential climate change regulations or carbon or emissions taxes could result in higher cost of production for energy, which may be passed on to us in whole or in part. In order to manage the risk of volatile natural gas prices, we may hedge natural gas prices through the use of fixed price supply contracts or derivative financial instruments, such as forwards, swaps and futures. However, these measures carry risk (including nonperformance by counterparties) and do not in any event entirely eliminate the risk of decreased margins as a result natural gas price increases. We further attempt to mitigate these risks by including in our sales contracts fuel surcharges based on natural gas prices exceeding certain benchmarks. A significant increase in the price of energy that is not recovered through an increase in the price of our products or covered through our hedging arrangements or an extended interruption in the supply of natural gas or electricity to our production facilities could have a material adverse effect on our business, results of operations and financial condition.
Increases in the price of diesel fuel may adversely affect our business, results of operations and financial condition.
Diesel fuel costs generally fluctuate with increasing and decreasing world crude oil prices and, accordingly, are subject to political, economic and market factors that are outside of our control. Our operations are dependent on earth moving equipment, locomotives and tractor trailers, and diesel fuel costs are a significant component of the operating expense of these vehicles. Accordingly, increased diesel fuel costs could have an adverse effect on our business, results of operations and financial condition.
A facility closure entails substantial costs, and if we close any of our facilities sooner than anticipated, our results of operations may be adversely affected.
We base our assumptions regarding the life of our facilities on detailed studies that we perform from time to time, but our studies and assumptions may not prove to be accurate. If we close any of our operating facilities sooner than expected, sales may decline. The closure of our operating facilities would involve significant fixed closure costs, including accelerated employment legacy costs, severance-related obligations, reclamation and other environmental costs and the costs of terminating long-term obligations, including energy contracts and equipment leases. We accrue for the costs of reclaiming open pits, stockpiles, non-saleable sand, ponds, roads and other mining support areas over the estimated mining life of our property. If we were to reduce the estimated life of our operating facilities, the fixed facility closure costs would be applied to a shorter period of production, which would increase the cost of production per ton produced and could materially and adversely affect our business, results of operations and financial condition.
Applicable statutes and regulations require that mining property be reclaimed following a mine closure in accordance with specified standards and an approved reclamation plan. The plan addresses matters such as removal of facilities and equipment, regrading, prevention of erosion and other forms of water pollution, re-vegetation and post-mining land use. We may be required to post a surety bond or other form of financial assurance equal to the cost of reclamation as set forth in the approved reclamation plan. The establishment of the final mine closure reclamation liability is based on estimated costs and requires various estimates and assumptions. If our accruals for expected reclamation and other costs associated with facility closures for which we will be responsible were later determined to be insufficient, our business, results of operations and financial condition may be adversely affected.
Our operations are dependent on our rights and ability to mine our properties and on our having renewed or received the required permits and approvals from governmental authorities and other third parties.
We hold numerous governmental, environmental, mining and other permits, water rights and approvals authorizing operations at our mining and operating facilities. For our extraction and processing in Wisconsin and Illinois, we must obtain permits from various federal, tribal, state and local authorities. For example, at the federal level, a Mine Identification Request (MSHA Form 7000-51) must be filed and obtained before mining commences. If wetlands are impacted, a permit from the U.S. Army Corps of Engineers is required. At the state level, a series of permits are required related to air quality, wetlands, water quality (waste water, storm water), grading permits, protected species, archeological assessments and high capacity wells in addition to others depending upon site specific factors and operational detail. At the local level, zoning, building, storm water, erosion control, wellhead protection, road usage and access are all regulated and require permitting to some degree. A non-metallic mining reclamation permit is required. Certain permits or approvals may also require consultation with federal, state, tribal, or local authorities. A decision by a governmental agency or other third party to deny or delay issuing a new or renewed permit or approval, or to revoke or substantially modify an existing permit or approval, could have a material adverse effect on our business, results of operations and financial condition.
Title to, and the area of, mineral properties and water rights may also be disputed. Mineral properties sometimes contain claims or transfer histories that examiners cannot verify. A successful claim that we do not have title to our property or lack appropriate water rights could cause us to lose any rights to explore, develop and extract minerals, without compensation for
our prior expenditures relating to such property. Our business may suffer a material adverse effect in the event we have title deficiencies.
A shortage of skilled labor together with rising labor costs in the excavation industry may further increase operating costs, which could adversely affect our business, results of operations and financial condition.
Efficient sand excavation using modern techniques and equipment requires skilled laborers, preferably with several years of experience and proficiency in multiple tasks, including processing of mined minerals. If there is a shortage of experienced labor in areas in which we operate, we may find it difficult to hire or train the necessary number of skilled laborers to perform our own operations which could have an adverse impact on our business, results of operations and financial condition.
Our business may suffer if we lose, or are unable to attract and retain, key personnel.
We depend to a large extent on the services of our senior management team and other key personnel. Members of our senior management and other key employees bring significant experience to the market environment in which we operate. Competition for management and key personnel is intense, and the pool of qualified candidates is limited. The loss of any of these individuals or the failure to attract additional personnel, as needed, could have a material adverse effect on our operations and could lead to higher labor costs or the use of less-qualified personnel. In addition, if any of our executives or other key employees were to join a competitor or form a competing company, we could lose customers, suppliers, know-how and key personnel. We do not maintain key-man life insurance with respect to any of our employees. Our success is dependent on our ability to continue to attract, employ and retain highly skilled personnel.
Our profitability could be negatively affected if we fail to maintain satisfactory labor relations.
As of December 31, 2024, 25 employees in our Illinois facility operated under a collective bargaining agreement. Our collective bargaining agreement expires on April 30, 2027. While we intend to renew the collective bargaining agreement, if we are unable to renegotiate acceptable terms with these employees in the future, we could experience, among other things, strikes, work stoppages or other slowdowns by our workers and increased operating costs as a result of higher wages, health care costs or benefits paid to our employees. An inability to maintain good relations with our workforce could cause a material adverse effect on our business, financial condition, and results of operations.
Failure to maintain effective quality control systems at our mining, processing and production facilities could have a material adverse effect on our business, results of operations and financial condition.
The performance and quality of our products are critical to the success of our business. These factors depend significantly on the effectiveness of our quality control systems, which, in turn, depends on a number of factors, including the design of our quality control systems, our quality-training program and our ability to ensure that our employees adhere to our quality control policies and guidelines. Any significant failure or deterioration of our quality control systems could have a material adverse effect on our business, results of operations and financial condition.
Seasonal and severe weather conditions could have a material adverse impact on our business, results of operations and financial condition.
Our business could be materially adversely affected by severe weather conditions. Severe weather conditions may affect our customers’ operations, thus reducing their need for our products, impact our operations by resulting in weather-related damage to our facilities and equipment and impact our customers’ ability to take delivery of our products at our plant site. Any weather-related interference with our operations could force us to delay or curtail services and potentially breach our contractual obligations to deliver minimum volumes or result in a loss of productivity and an increase in our operating costs.
In addition, winter weather conditions impact our operations by causing us to reduce our excavation and wet plant related production activities during the winter months. During non-winter months, we excavate excess sand to build a stockpile that will feed the dry plants (along with the sand provided by our year-round wet plant), which continue to operate during the winter months. Unexpected winter conditions (such as winter arriving earlier than expected or lasting longer than expected) may result in us not having a sufficient sand stockpile to operate our dry plants during winter months, which could result in us being unable to deliver our contracted sand amounts during such time and lead to a material adverse effect on our business, results of operations and financial condition. Certain of these events or conditions may also be exacerbated by climate change. For more information, see our risk factor “Climate change could result in various risks for us and our customers.”
Our cash flow fluctuates on a seasonal basis.
Our cash flow is affected by a variety of factors, including weather conditions and seasonal periods. Seasonal fluctuations in weather impact the production levels at our wet processing plant. While our sales and finished product
production levels are contracted evenly throughout the year, our mining and wet sand processing activities are reduced during winter months. As a consequence, we experience lower cash costs in the first and fourth quarter of each calendar year, and higher cash operating costs in the second and third quarter of each calendar year in which we overproduce to meet demand for the winter months.
We do not own the land on which our in-basin transload terminals are located, which could disrupt our operations.
We do not own the land on which our in-basin transload terminals are located and instead own a leasehold interest and right-of-way for the operation of these facilities. Upon expiration, termination or other lapse of our current leasehold terms, we may be unable to renew our existing leases or rights-of-way on terms favorable to us, or at all. Any renegotiation on less favorable terms or inability to enter into new leases on economically acceptable terms upon the expiration, termination or other lapse of our current leases or rights-of-way could cause us to cease operations on the affected land, increase costs related to continuing operations elsewhere and have a material adverse effect on our business, financial condition and results of operations.
A terrorist attack or armed conflict could harm our business.
Global and domestic terrorist activities, anti-terrorist efforts and other armed conflicts could adversely affect the U.S. and global economies and could prevent us from meeting financial and other obligations. We could experience loss of business, delays or defaults in payments from payors or disruptions of fuel supplies and markets if pipelines, production facilities, processing plants, refineries or transportation facilities are direct targets or indirect casualties of an act of terror or war. Such activities could reduce the overall demand for oil and natural gas, which, in turn, could also reduce the demand for our frac sand. Global and domestic terrorist activities and the threat of potential terrorist activities and any resulting physical damage and economic downturn could adversely affect our results of operations, impair our ability to raise capital or otherwise adversely impact our ability to realize certain business strategies.
Diminished access to water may adversely affect our operations or the operations of our customers.
The mining and processing activities at our facilities require significant amounts of water. Additionally, the development of oil and natural gas properties through fracture stimulation likewise requires significant water use. We have obtained water rights that we currently use to service the activities at our operating facilities, and we plan to obtain all required water rights to service other properties we may develop or acquire in the future. However, the amount of water that we and our customers are entitled to use pursuant to water rights must be determined by the appropriate regulatory authorities in the jurisdictions in which we and our customers operate. Such regulatory authorities may amend the regulations regarding such water rights, increase the cost of maintaining such water rights or eliminate our current water rights, and we and our customers may be unable to retain all or a portion of such water rights. These new regulations, which could also affect local municipalities and other industrial operations, could have a material adverse effect on our operating costs and effectiveness if implemented. Such changes in laws, regulations or government policy and related interpretations pertaining to water rights may alter the environment in which we and our customers do business, which may negatively affect our financial condition and results of operations. The availability of water may also change due to various environmental, demographic, or other pressures, including climate change. For more information, see our risk factor “Climate change could result in various risks for us and our customers.”
We may be subject to interruptions or failures in our information technology systems, including cyber-attacks.
We rely on sophisticated information technology systems and infrastructure to support our business, including process control technology. Any of these systems may be susceptible to outages due to fire, floods, power loss, telecommunication failures, usage errors by employees, computer viruses, cyber-attacks or other security breaches, or similar events. If our information technology systems are damaged or cease to function properly, we may have to make a significant investment to fix or replace them, and we may suffer loss of critical data and interruptions or delays in our operations.
We may be the target of attempted cyber-attacks, computer viruses, malicious code, phishing attacks, denial of service attacks and other information security threats. To date, cyber-attacks have not had a material impact on our financial condition, results or business; however, we could suffer material financial or other losses in the future and we are not able to predict the severity of these attacks. The occurrence of a cyber-attack, breach, unauthorized access, misuse, computer virus or other malicious code or other cyber security event could jeopardize or result in the unauthorized disclosure, gathering, monitoring, misuse, corruption, loss or destruction of confidential and other information that belongs to us, our customers, our counterparties, or third-party service providers that is processed and stored in, and transmitted through, our computer systems and networks. The occurrence of such an event could also result in damage to our software, computers or systems, or otherwise cause interruptions or malfunctions in our, our customers’, our counterparties’ or third parties’ operations. This could result in significant losses, loss of customers and business opportunities, reputational damage, litigation, regulatory fines, penalties or
intervention, reimbursement or other compensatory costs, or otherwise adversely affect our business, financial condition or results of operations.
The reliability and capacity of our information technology systems is critical to our operations. Any material disruption in our information technology systems, or delays or difficulties in implementing or integrating new systems or enhancing current systems, could have an adverse effect on our business, and results of operations.
If we are unable to fully protect our intellectual property rights, we may suffer a loss in our competitive advantage.
The commercial success of our SmartSystems wellsite proppant storage solutions depends on patented and proprietary information and technologies, know-how and other intellectual property. Because of the technical nature of this business, we rely on a combination of patent, copyright, trademark and trade secret laws, and restrictions on disclosure to protect our intellectual property. As of December 31, 2024, we had several patents related to our SmartSystems, including patents related to our silo storage system and patents related to lifting and lowering our storage silos. We customarily enter into confidentiality or license agreements with our employees, consultants and corporate partners and control access to and distribution of our design information, documentation and other patented and proprietary information. In addition, in the future we may develop or acquire additional patents or patent portfolios, which could require significant cash expenditures. However, third parties may knowingly or unknowingly infringe our patent or other proprietary rights, or challenge patents or proprietary rights held by us, and pending and future trademark and patent applications may not be approved. Failure to protect, monitor and control the use of our existing intellectual property rights could cause us to lose our competitive advantage and incur significant expenses. It is possible that our competitors or others could independently develop the same or similar technologies or otherwise obtain access to our unpatented technologies. In such case, our trade secrets would not prevent third parties from competing with us. Consequently, our results of operations may be adversely affected. Furthermore, third parties or our employees may infringe or misappropriate our patented or proprietary technologies or other intellectual property rights, which could also harm our business and results of operations. Policing unauthorized use of intellectual property rights can be difficult and expensive, and adequate remedies may not be available.
We may be adversely affected by disputes regarding intellectual property rights of third parties.
Third parties from time to time may initiate litigation against us by asserting that the conduct of our business infringes, misappropriates or otherwise violates intellectual property rights. We may not prevail in any such legal proceedings related to such claims, and our storage systems and related items may be found to infringe, impair, misappropriate, dilute or otherwise violate the intellectual property rights of others. If we are sued for infringement and lose, we could be required to pay substantial damages and/or be enjoined from using or selling the infringing products or technology. Any legal proceeding concerning intellectual property could be protracted and costly regardless of the merits of any claim and is inherently unpredictable and could have a material adverse effect on our financial condition, regardless of its outcome.
If we were to discover that our technologies or products infringe valid intellectual property rights of third parties, we may need to obtain licenses from these parties or substantially re-engineer our products in order to avoid infringement. We may not be able to obtain the necessary licenses on acceptable terms, or at all, or be able to re-engineer our products successfully. If our inability to obtain required licenses for our technologies or products prevents us from selling our products, that could adversely impact our financial condition and results of operations.
We currently rely on a limited number of suppliers for certain equipment and materials to build our SmartSystems, and our reliance on a limited number of suppliers for such equipment and materials exposes us to risks including price and timing of delivery.
We currently rely on a limited number of suppliers for equipment and materials to build our SmartSystems. If demand for our systems or the components necessary to build such systems increases or suppliers of equipment face financial distress or bankruptcy, our suppliers may not be able to provide such equipment on schedule at the current price or at all. In particular, steel is the principal raw material used in the manufacture of our systems, and the price of steel has historically fluctuated on a cyclical basis and will depend on a variety of factors over which we have no control, including trade tariffs. Additionally, we depend on a limited number of suppliers for certain mechanical and electrical components that we use in our systems which may not have direct replacements available from alternate suppliers. If our suppliers are unable to provide the raw materials and components needed to build our systems on schedule at the current price or at all, we could be required to seek other suppliers for the raw materials and components needed to build and operate our systems, which may adversely affect our revenues or increase our costs. Any inability to find alternative components at prices or with quality specifications similar to those deployed today could result in delays or a loss of customers.
Unsatisfactory safety performance may negatively affect our customer relationships and, to the extent we fail to retain existing customers or attract new customers, adversely impact our revenues.
Our ability to retain existing customers and attract new business is dependent on many factors, including our ability to demonstrate that we can reliably and safely operate all aspects of our business in a manner that is consistent with applicable laws, rules and permits, which legal requirements are subject to change. In addition, certain customers require compliance with their internal safety protocols. Existing and potential customers consider the safety record of their third-party service providers to be of high importance in their decision to engage such providers. If one or more accidents were to occur in connection with our business, the affected customer may seek to terminate, cancel or substantially reduce its business with us, which could cause us to lose substantial revenues. Furthermore, our ability to attract new customers may be impaired if such potential customers elect not to engage us because they view our safety record as unacceptable. In addition, it is possible that we will experience multiple or particularly severe accidents in the future, causing our safety record to deteriorate. This may be more likely as we continue to grow, if we experience high employee turnover or labor shortage, or if we hire inexperienced personnel to bolster our staffing needs.
We may be subject to legal claims, such as personal injury and property damage, which could materially adversely affect our financial condition, prospects and results of operations.
As we focus on growing our business, particularly as it relates to our SmartSystems offerings, our business may become increasingly subject to inherent risks that can cause personal injury or loss of life, damage to or destruction of property, equipment or the environment or the suspension of our operations. In addition, we may be subject to legal proceedings with our customers or suppliers, particularly as it relates to contract disputes. Regardless of the merit of particular claims, litigation may be expensive, time consuming, disruptive to our operations and distracting to management.
The outcome of litigation is inherently uncertain. If one or more legal matters were resolved against us or an indemnified third party in a reporting period for amounts in excess of management’s expectations, our financial condition and operating results for that reporting period could be materially adversely affected. Further, such an outcome could result in significant compensatory, punitive or trebled monetary damages, disgorgement of revenue or profits, remedial corporate measures or injunctive relief against us that could materially adversely affect our financial condition and operating results. We maintain what we believe is customary and reasonable insurance to protect our business against these potential losses, but such insurance may not be adequate to cover our liabilities, and we are not fully insured against all risks.
A financial downturn could negatively affect our business, results of operations, financial condition and liquidity.
Actual or anticipated declines in domestic or foreign economic growth rates, regional or worldwide increases in tariffs or other trade restrictions, turmoil affecting the U.S. or global financial systems and markets and a severe economic contraction either regionally or worldwide could materially affect our business and financial condition. These events could impact our ability to finance operations by worsening the actual or anticipated future drop in worldwide oil demand, negatively impacting the price we receive for our products and services, compressing the level of available funding under our FCB ABL Credit Facility, inhibiting our lenders from funding borrowings under our FCB ABL Credit Facility or resulting in our lenders reducing the borrowing base under our FCB ABL Credit Facility. Negative economic conditions could also adversely affect the collectability of our trade receivables or performance by our vendors and suppliers.
Risks Related to Environmental, Mining and Other Regulation
Federal, state and local legislative and regulatory initiatives relating to hydraulic fracturing and the potential for related litigation could result in increased costs, additional operating restrictions or delays for our customers, which could cause a decline in the demand for our frac sand and negatively impact our business, results of operations and financial condition.
We supply frac sand to hydraulic fracturing operators in the oil and natural gas industry. Hydraulic fracturing is an important practice that is used to stimulate production of oil and natural gas from low permeability hydrocarbon bearing subsurface rock formations. The hydraulic fracturing process involves the injection of water, proppants, and chemicals under pressure into the formation to fracture the surrounding rock, increase permeability and stimulate production.
Although we do not directly engage in hydraulic fracturing activities, our customers purchase our frac sand for use in their hydraulic fracturing activities. Hydraulic fracturing is typically regulated by state oil and natural gas commissions and similar agencies. Some states have adopted, and other states are considering adopting, regulations that could impose new or more stringent permitting, disclosure or well construction requirements on hydraulic fracturing operations. Aside from state laws, local land use restrictions may restrict drilling in general or hydraulic fracturing in particular. Municipalities may adopt local
ordinances attempting to prohibit hydraulic fracturing altogether or, at a minimum, to allow such fracturing processes within their jurisdictions to proceed but regulating the time, place and manner of those processes. In addition, federal agencies have started to assert regulatory authority over the process and various studies have been conducted by the EPA, and other federal agencies concerning the potential environmental impacts of hydraulic fracturing activities. While President Trump has expressed a policy agenda supportive of our industry, at the same time, certain environmental groups have suggested that additional laws may be needed and, in some instances, have pursued voter ballot initiatives to more closely and uniformly limit or otherwise regulate the hydraulic fracturing process, and legislation has been proposed by some members of Congress to provide for such regulation.
The adoption of new laws or regulations at the federal, state or local levels imposing reporting obligations on, or otherwise limiting or delaying, the hydraulic fracturing process could make it more difficult to complete natural gas wells, increase our customers’ costs of compliance and doing business, and otherwise adversely affect the hydraulic fracturing services they perform, which could negatively impact demand for our frac sand. In addition, heightened political, regulatory, and public scrutiny of hydraulic fracturing practices could expose us or our customers to increased legal and regulatory proceedings, which could be time-consuming, costly, or result in substantial legal liability or significant reputational harm. We could be directly affected by adverse litigation involving us, or indirectly affected if the cost of compliance limits the ability of our customers to operate. Such costs and scrutiny could directly or indirectly, through reduced demand for our frac sand, have a material adverse effect on our business, financial condition and results of operations.
Tariffs on goods and services between the United States, Canada and Mexico may be detrimental to our business.
Our sales into Canada and Mexico may become subject to retaliatory tariffs if the United States imposes tariffs on imports from Canada and Mexico into the United States. In recent years, the Company has expanded its sales to customers located in Canada and Mexico. If enacted, currently contemplated tariffs, set at 25%, may significantly affect transactions with our customers and vendors located in Canada and Mexico. We expect that our customers would be responsible for the increased cost, which may result in customers sourcing their sand needs from other suppliers within their own countries. We depend on limited foreign vendors, but in the event of tariffs on goods entering the United States, we may face supply chain disruptions for certain purchases from suppliers in Canada and Mexico, which may lead to increased costs and delays, potentially affecting production timelines and profitability.
We and our customers are subject to extensive environmental and occupational health and safety regulations that impose, and will continue to impose, significant costs and liabilities. In addition, future regulations, or more stringent enforcement of existing regulations, could increase those costs and liabilities, which could adversely affect our results of operations.
We are subject to a variety of federal, state, and local regulatory environmental requirements affecting the mining and mineral processing industry, including among others, those relating to employee health and safety, environmental permitting and licensing, air and water emissions, water pollution, waste management, remediation of soil and groundwater contamination, land use, reclamation and restoration of properties, hazardous materials, and natural resources. Some environmental laws impose substantial penalties for noncompliance, and others, such as the federal CERCLA, may impose strict, retroactive, and joint and several liabilities for the remediation of releases of hazardous substances. Liability under CERCLA, or similar state and local laws, may be imposed as a result of conduct that was lawful at the time it occurred or for the conduct of, or conditions caused by, prior operators or other third parties. Failure to properly handle, transport, store, or dispose of hazardous materials or otherwise conduct our operations in compliance with environmental laws could expose us to liability for governmental penalties, cleanup costs, and civil or criminal liability associated with releases of such materials into the environment, damages to property, natural resources and other damages, as well as potentially impair our ability to conduct our operations. In addition, future environmental laws and regulations could restrict our ability to expand our facilities or extract our mineral deposits or could require us to acquire costly equipment or to incur other significant expenses in connection with our business. Future events, including adoption of new, or changes in any existing, environmental requirements (or their interpretation or enforcement) and the costs associated with complying with such requirements, could have a material adverse effect on us.
Any failure by us to comply with applicable environmental laws and regulations may cause governmental authorities to take actions that could adversely impact our operations and financial condition, including:
•issuance of administrative, civil, or criminal penalties;
•denial, modification, or revocation of permits or other authorizations;
•occurrence of delays in permitting or performance of projects;
•imposition of injunctive obligations or other limitations on our operations, including cessation of operations; and
•requirements to perform site investigatory, remedial, or other corrective actions.
Any such regulations could require us to modify existing permits or obtain new permits, implement additional pollution control technology, curtail operations, significantly increase our operating costs, or impose additional operating restrictions among our customers that reduce demand for our services.
We may not be able to comply with any new or amended laws and regulations that are adopted, and any new or amended laws and regulations could have a material adverse effect on our operating results by requiring us to modify our operations or equipment or shut down our facility. Additionally, our customers may not be able to comply with any new or amended laws and regulations, which could cause our customers to curtail or cease operations. We cannot at this time reasonably estimate our costs of compliance or the timing of any costs associated with any new or amended laws and regulations, or any material adverse effect that any new or modified standards will have on our customers and, consequently, on our operations.
Furthermore, the change in presidential administration is leading to shifts in the environmental regulatory landscape. While the impact of these changes on our operations is currently uncertain, initial executive orders and memoranda from the Trump Administration suggest such changes could influence future regulatory developments in our industry.
Silica-related legislation, health issues and litigation could have a material adverse effect on our business, reputation or results of operations.
We are subject to laws and regulations relating to human exposure to crystalline silica. Several federal and state regulatory authorities, including MSHA, have changed and may continue to propose changes in their regulations regarding workplace exposure to crystalline silica, such as permissible exposure limits and required controls and personal protective equipment. We may not be able to comply fully with the amended regulations that were adopted at the federal level, and any new or amended laws and regulations could have a material adverse effect on our operating results by requiring us to modify or cease our operations.
In addition, the inhalation of respirable crystalline silica is associated with the lung disease silicosis. There is evidence of an association between crystalline silica exposure or silicosis and lung cancer and a possible association with other diseases, including immune system disorders such as scleroderma. These health risks have been, and may continue to be, a significant issue confronting the proppant industry. Concerns over silicosis and other potential adverse health effects, as well as concerns regarding potential liability from the use of frac sand, may have the effect of discouraging our customers’ use of our frac sand. The actual or perceived health risks of mining, processing and handling proppants could materially and adversely affect proppant producers, including us, through reduced use of frac sand, the threat of product liability or employee lawsuits, increased scrutiny by federal, state and local regulatory authorities of us and our customers or reduced financing sources available to the frac sand industry.
We are subject to the Federal Mine Safety and Health Act of 1977, which imposes stringent health and safety standards on numerous aspects of our operations.
Our operations are subject to the Federal Mine Safety and Health Act of 1977, as amended by the Mine Improvement and New Emergency Response Act of 2006, which imposes stringent health and safety standards on numerous aspects of mineral extraction and processing operations, including the training of personnel, operating procedures, operating equipment, and other matters. Our failure to comply with such standards, or changes in such standards or the interpretation or enforcement thereof, could have a material adverse effect on our business and financial condition or otherwise impose significant restrictions on our ability to conduct mineral extraction and processing operations.
We and our customers are subject to other extensive regulations, including licensing, plant and wildlife protection and reclamation regulation, that impose, and will continue to impose, significant costs and liabilities. In addition, future regulations, or more stringent enforcement of existing regulations, could increase those costs and liabilities, which could adversely affect our results of operations.
In addition to the regulatory matters described above, we and our customers are subject to extensive governmental regulation on matters such as permitting and licensing requirements, plant and wildlife protection, wetlands protection, reclamation and restoration activities at mining properties after mining is completed, the discharge of materials into the environment, and the effects that mining and hydraulic fracturing have on groundwater quality and availability. Our future success depends, among other things, on the quantity and quality of our frac sand deposits, our ability to extract these deposits profitably, and our customers being able to operate their businesses as they currently do.
In order to obtain permits and renewals of permits in the future, we may be required to prepare and present data to governmental authorities pertaining to the potential adverse impact that any proposed excavation or production activities,
individually or in the aggregate, may have on the environment. Certain approval procedures may require preparation of archaeological surveys, endangered species studies, and other studies to assess the environmental impact of new sites or the expansion of existing sites. Compliance with these regulatory requirements is expensive and significantly lengthens the time needed to develop a site. Finally, obtaining or renewing required permits is sometimes delayed or prevented due to community opposition and other factors beyond our control. The denial of a permit essential to our operations or the imposition of conditions with which it is not practicable or feasible to comply could impair or prevent our ability to develop or expand a site. Significant opposition to a permit by neighboring property owners, members of the public, or other third parties, or delay in the environmental review and permitting process, also could delay or impair our ability to develop or expand a site. New legal requirements, including those related to the protection of the environment, could be adopted that could materially adversely affect our mining operations (including our ability to extract or the pace of extraction of mineral deposits), our cost structure, or our customers’ ability to use our frac sand. Such current or future regulations could have a material adverse effect on our business, and we may not be able to obtain or renew permits in the future.
Our inability to acquire, maintain or renew financial assurances related to the reclamation and restoration of mining property could have a material adverse effect on our business, financial condition and results of operations.
We are generally obligated to restore property in accordance with regulatory standards and our approved reclamation plan after it has been mined. We are required under federal, state, and local laws to maintain financial assurances, such as surety bonds, to secure such obligations. The inability to acquire, maintain or renew such assurances, as required by federal, state, and local laws, could subject us to fines and penalties as well as the revocation of our operating permits. Such inability could result from a variety of factors, including:
•the lack of availability, higher expense, or unreasonable terms of such financial assurances;
•the ability of current and future financial assurance counterparties to increase required collateral; and
•the exercise by financial assurance counterparties of any rights to refuse to renew the financial assurance instruments.
Our inability to acquire, maintain, or renew necessary financial assurances related to the reclamation and restoration of mining property could have a material adverse effect on our business, financial condition, and results of operations.
Climate change could result in various risks for us and our customers.
In recent years, the U.S. Congress has considered legislation to reduce emissions of GHGs, including methane, a primary component of natural gas, and carbon dioxide, a byproduct of the burning of natural gas. It presently appears unlikely that comprehensive climate legislation will be passed by either house of Congress in the near future, although energy legislation and other regulatory initiatives are expected to be proposed that may be relevant to GHG emissions issues. For example, in August 2022, the U.S. Congress passed, and President Biden signed into law, the Inflation Reduction Act of 2022 which appropriates significant federal funding for renewable energy initiatives and, for the first time ever, imposes a fee on GHG emissions from certain facilities. In November of 2024, the EPA released its final rule to implement the methane emissions fee with an effective date of January 17, 2025, for reporting year 2024 emissions. Twenty-three states have filed a lawsuit challenging the rule, and the change in U.S. presidential administration provides additional uncertainty as to the rule’s future. To the extent the fee is retained and implemented, the emissions fee and funding provisions of the law could increase the operating costs of our customers and accelerate the transition away from fossil fuels, which could in turn adversely affect our business and results of operations.
In addition, a number of states are addressing GHG emissions, primarily through the development of emission inventories or regional GHG cap and trade programs. Depending on the particular program, we could be required to control GHG emissions or to purchase and surrender allowances for GHG emissions resulting from our operations. Independent of Congress, the EPA has adopted regulations controlling GHG emissions under its existing authority under the federal CAA. For example, the EPA has adopted regulations under existing provisions of the CAA that, among other things establish construction and operating permit reviews for GHG emissions from certain large stationary sources that are already potential major sources for conventional pollutants. In addition, the EPA has adopted rules requiring the monitoring and reporting of GHG emissions from specified production, processing, transmission and storage facilities in the United States on an annual basis.
In addition, in December 2015, over 190 countries, including the United States, reached an agreement to reduce global GHG emissions, also known as the Paris Agreement. The Paris Agreement entered into force in November 2016 after more than 170 nations, including the United States, ratified or otherwise indicated their intent to be bound by the agreement. While President Trump has initiated action to withdraw the United States from the Paris agreement, this withdrawal is not immediate and may animate stronger actions by various other policymakers. Additionally, several states and geographic regions in the United States have adopted legislation and regulations to reduce emissions of GHGs, including cap and trade regimes and
commitments to contribute to meeting the goals of the Paris Agreement. It is not possible at this time to predict the precise timing and effects of climate change or whether additional climate-related legislation, regulations or other measures will be adopted at the local, state, regional, national and international levels.
Governmental, scientific and public concern over the threat of climate change arising from GHG emissions has also resulted in increasing political risks in the United States, including climate change-related pledges made by certain candidates elected to public office. The Biden Administration implemented various actions to accelerate the energy transition or otherwise increase the risks and costs associated with fossil fuel production. While President Trump has announced plans to reverse certain of these actions, various states and other policymakers are expected to continue to advance policies to promote a transition away from fossil fuels. To the extent that other countries implement the Paris Agreement or local, state, regional, national or international governments impose other climate change regulations on the oil and natural gas industry, it could have an adverse effect on our business because substantial limitations on GHG emissions could adversely affect demand for the oil and natural gas that is produced by our customers. Litigation risks are also increasing, as a number of entities, including government entities and private groups, have sought to bring suit against oil and natural gas companies in state or federal court, alleging, among other things, that such companies created public nuisances by producing fuels that contributed to climate change. Suits have also been brought against such companies under stockholder and consumer protection laws, alleging that companies have been aware of the adverse effects of climate change but failed to adequately disclose those impacts. To the extent these risks impact our customers, we may experience reduced demand for our proppant.
In addition, various policymakers, including the states of California, Illinois, and New York, have adopted or are considering adopting requirements for in-scope companies to disclose certain climate-related information, including on GHG emissions and climate risks. For example, the U.S. Securities and Exchange Commission (“SEC”) issued a proposed rule in March 2022 that will mandate extensive disclosure of climate-related data, risks, GHG emissions, for certain public companies. The SEC issued a final in March 2024. Multiple lawsuits have been filed and in April 2024, the SEC voluntarily stayed the rules pending the outcome of the litigation. It is possible that other climate-related reporting regulations applicable to many U.S. companies will continue to take effect.
Additionally, climate change may increase the frequency and intensity of severe weather events and other natural disasters, as well as contribute to chronic changes (such as to meteorological and hydrological patterns) that may also result in various adverse impacts to our or our customers’ operations.
Finally, in addition to the executive orders discussed above, upon entering office, the Trump Administration issued a series of executive orders that signal a shift in the United States energy, environmental and climate change policy. Among other directives, such executive orders: (i) direct federal agencies to identify and exercise emergency authorities to facilitate conventional energy production, transportation and refining and call for the use of emergency regulations to expedite energy infrastructure projects; (ii) promote energy explorations and production on federal lands and waters; (iii) mandate a review of existing regulations that may burden domestic energy development; and (iv) pause disbursement of funds appropriated through the Inflation Reduction Act and Infrastructure Investment and Jobs Act. The long-term impact of such actions on our customers’ operations, if any, is difficult to predict at this time.
A negative shift in investor sentiment towards the oil and natural gas industry and increased attention to environmental, social and governance (“ESG”) and conservation matters may adversely impact our business.
Increasing attention to climate change, natural capital, human capital, and other ESG matters by various stakeholders, including consumer demand for alternative sources of energy, may result in increased costs, changes in demand for certain products or services, reputational harm, or other adverse impacts to our business. While we engage in certain voluntary initiatives (including disclosures) to improve our ESG profile and respond to stakeholder expectations, such initiatives entail costs and may not ultimately have the desired effect. For example, various initiatives rely on methodologies, standards, or data that are complex, still evolving, and subject to varying interpretations. Our approach to ESG matters also evolves over time, and there can be no guarantee that our approach will align with the expectations or preferences of any particular stakeholder. Stakeholder expectations are not uniform, and are sometimes conflicting. Certain policymakers have also adopted, or are considering adopting, requirements for companies to take certain actions or disclose certain information on ESG matters, particularly related to climate change. For more information, see our risk factor “Climate change legislation and regulatory initiatives could result in increased compliance costs for us and our customers.” However, as with other stakeholders, policymakers’ requirements are divergent and may be interpreted or applied unevenly, which may increase the cost and complexity of compliance, as well as any associated risks. Any failure to successfully navigate these stakeholder and policymaker expectations may result in various harms to our business, including through litigation or enforcement, operational impacts, damage to our reputation, or otherwise.
In addition, organizations that provide information to investors on corporate governance and related matters have developed ratings processes for evaluating companies on their approach to ESG matters. Such ratings are used by some investors to inform their investment and voting decisions. Unfavorable ESG ratings and recent activism directed at shifting funding away from companies with energy-related assets could lead to increased negative investor sentiment toward us or our customers and to the diversion of investment to other industries, which could have a negative impact on our stock price and our or our customers’ access to and costs of capital. Also, institutional lenders may, of their own accord, decide not to provide funding for companies based on climate change, natural capital, or other ESG related concerns, which could affect our or our customers’ access to capital for potential growth projects. Moreover, to the extent ESG matters negatively impact our or the fossil fuel industry’s reputation, we may not be able to compete as effectively to recruit or retain employees, which may adversely affect our operations.
Risks Related to Ownership of Our Common Stock
Our stock price could be volatile, and you may not be able to resell shares of your common stock at or above the price you paid.
The stock markets generally have experienced extreme volatility that has often been unrelated to the operating performance of particular companies. These broad market fluctuations may adversely affect the trading price of our common stock. Volatility in the market price of our common stock may prevent you from being able to sell your common stock at or above the price at which you purchased the stock. As a result, you may suffer a loss on your investment. Securities class action litigation has often been instituted against companies following periods of volatility in the overall market and in the market price of a company’s securities. Such litigation, if instituted against us, could result in very substantial costs, divert our management’s attention and resources and harm our business, operating results and financial condition.
In addition to the risks described in this section, the market price of our common stock may fluctuate significantly in response to a number of factors, most of which we cannot control, including:
•our operating and financial performance;
•quarterly variations in the rate of growth of our financial indicators, such as revenues, EBITDA, Adjusted EBITDA, contribution margin, free cash flow, net income, and net income per share;
•the public reaction to our press releases, our other public announcements, and our filings with the SEC;
•strategic actions by our competitors;
•our failure to meet revenue or earnings estimates by research analysts or other investors;
•changes in revenue or earnings estimates, or changes in recommendations or withdrawal of research coverage, by equity research analysts;
•speculation in the press or investment community;
•the failure of research analysts to cover our common stock;
•sales of our common stock by us or our stockholders, or the perception that such sales may occur;
•changes in accounting principles, policies, guidance, interpretations, or standards;
•additions or departures of key management personnel;
•actions by our stockholders;
•general market conditions, including fluctuations in commodity prices, sand-based proppants, or industrial and recreational sand-based products;
•domestic and international economic, legal and regulatory factors unrelated to our performance; and
•the realization of any risks described under this “Risk Factors” section.
We are subject to certain requirements of Section 404 of the Sarbanes-Oxley Act. If we are unable to timely comply with Section 404 or if the costs related to compliance are significant, our profitability, stock price, results of operations and financial condition could be materially adversely affected.
We are required to comply with certain provisions of Section 404 of the Sarbanes-Oxley Act. Section 404 requires that we document and test our internal control over financial reporting and issue management’s assessment of our internal control over financial reporting. This section also requires that our independent registered public accounting firm opine on those internal controls upon our public float exceeding a certain threshold as set forth in the SEC rules. We are evaluating our existing controls against the standards adopted by the Committee of Sponsoring Organizations of the Treadway Commission. During the course of our ongoing evaluation and integration of the internal control over financial reporting, we may identify areas requiring improvement, and we may have to design enhanced processes and controls to address issues identified through this review.
We believe that the out-of-pocket costs, diversion of management’s attention from running the day-to-day operations and operational changes caused by the need to comply with the requirements of Section 404 of the Sarbanes-Oxley Act could be significant. If the time and costs associated with such compliance exceed our current expectations, our results of operations could be adversely affected.
If we fail to comply with the requirements of Section 404 or if we or our independent registered public accounting firm identify and report such material weaknesses, the accuracy and timeliness of the filing of our annual and quarterly reports may be materially adversely affected and could cause investors to lose confidence in our reported financial information, which could have a negative effect on the stock price of our common stock. In addition, a material weakness in the effectiveness of our internal control over financial reporting could result in an increased chance of fraud and the loss of customers, reduce our ability to obtain financing and require additional expenditures to comply with these requirements, each of which could have a material adverse effect on our business, results of operations and financial condition.
The concentration of our capital stock ownership by our largest stockholders and its affiliates will limit your ability to influence corporate matters.
As of December 31, 2024, our Chief Executive Officer beneficially owns approximately 17.4% of our outstanding common stock. Consequently, our Chief Executive Officer is considered a (“Principal Stockholder”) and will continue to have significant influence over all matters that require approval by our stockholders, including the election of directors and approval of significant corporate transactions. Additionally, we are party to a stockholders’ agreement pursuant to which, so long as the Principal Stockholder maintains certain beneficial ownership levels of our common stock, the Principal Stockholder will have certain rights, including board of directors and committee designation rights and consent rights, including the right to consent to change in control transactions. For additional information, please read “Certain Relationships and Related Party Transactions—Stockholders Agreement” in the prospectus included in our Registration Statement on Form S-1 (Registration No. 333-215554), initially filed with the SEC on January 13, 2017. This concentration of ownership and the rights of Principal Stockholders under the stockholders agreement, will limit your ability to influence corporate matters, and as a result, actions may be taken that you may not view as beneficial.
The price of our common stock may fluctuate significantly, and you could lose all or part of your investment.
As of December 31, 2024, there were 28,570,038 publicly traded shares of common stock held by our public common stockholders. Although our common stock is listed on the NASDAQ, we do not know whether an active trading market will continue to develop or how liquid that market might be. You may not be able to resell your common stock at or above the public offering price. Additionally, the lack of liquidity may result in wide bid-ask spreads, contribute to significant fluctuations in the market price of the common stock and limit the number of investors who are able to buy the common stock.
If securities or industry analysts do not publish research or reports or publish unfavorable research about our business, the price and trading volume of our common stock could decline.
The trading market for our common stock depends in part on the research and reports that securities or industry analysts publish about us or our business. If analysts who cover us downgrade our securities, the price of our securities would likely decline. If analysts ceases to cover us or fails to publish regular reports on us, interest in the purchase of our securities could decrease, which could cause the price of our common stock and other securities and their trading volume to decline.
Our amended and restated certificate of incorporation and amended and restated bylaws, as well as Delaware law, contain provisions that could discourage acquisition bids or merger proposals, which may adversely affect the market price of our common stock.
Our amended and restated certificate of incorporation authorizes our board of directors to issue preferred stock without stockholder approval. If our board of directors elects to issue preferred stock, it could be more difficult for a third party to acquire us. In addition, some provisions of our amended and restated certificate of incorporation and amended and restated bylaws could make it more difficult for a third party to acquire control of us, even if the change of control would be beneficial to our stockholders, including:
•advance notice provisions for stockholder proposals and nominations for elections to the board of directors to be acted upon at meetings of stockholders;
•provisions that divide our board of directors into three classes of directors, with the classes to be as nearly equal in number as possible;
•provisions that prohibit stockholder action by written consent after the date on which our Principal Stockholders collectively cease to beneficially own at least 50% of the voting power of the outstanding shares of our stock entitled to vote;
•provisions that provide that special meetings of stockholders may be called only by the board of directors or, for so long as a Principal Stockholder continues to beneficially own at least 20% of the voting power of the outstanding shares of our stock;
•provisions that provide that our stockholders may only amend our certificate of incorporation or bylaws with the approval of at least 66 2/3% of the voting power of the outstanding shares of our stock entitled to vote, or for so long as our Principal Stockholders collectively continue to beneficially own at least 50% of the voting power of the outstanding shares of our stock entitled to vote, with the approval of a majority of the voting power of the outstanding shares of our stock entitled to vote;
•provisions that provide that the board of directors is expressly authorized to adopt, or to alter or repeal our bylaws; and
•provisions that establish advance notice and certain information requirements for nominations for election to our board of directors or for proposing matters that can be acted upon by stockholders at stockholder meetings.
We cannot guarantee the timing, amount, or payment of dividends on our common stock or the repurchase of our common stock.
Although we recently paid a cash dividend, the timing, declaration, amount and payment of future dividends to stockholders will fall within the discretion of our board of directors. The board’s decisions regarding the payment of dividends will depend on many factors, such as our financial condition, earnings, capital requirements, restrictions in the FCB ABL Credit Facility, industry practice, legal requirements, regulatory constraints and other factors that the board deems relevant. Our ability to pay dividends and repurchase shares under our share repurchase program will depend on our ongoing ability to generate cash from operations and access capital markets. We cannot guarantee that we will pay any dividend or make any repurchases of our common stock in the future.
Future sales of our common stock in the public market could reduce our stock price, and the sale or issuance of equity or convertible securities may dilute your ownership in us.
We may sell additional shares of common stock in subsequent public offerings. We may also issue additional shares of common stock or convertible securities. As of December 31, 2024, we have outstanding 42,899,193 shares of common stock. Our Chief Executive Officer beneficially owns 7,454,581 shares of our common stock, or approximately 17.4% of our total outstanding shares.
In connection with our initial public offering, we filed a registration statement with the SEC on Form S-8 providing for the registration of shares of our common stock issued or reserved for issuance under our equity incentive plans. Subject to the satisfaction of vesting conditions and the requirements of Rule 144, shares registered under the registration statement on Form S-8 will be available for resale immediately in the public market without restriction.
We have provided certain registration rights for the sale of common stock by certain existing stockholders in the future. The sale of these shares could have an adverse impact on the price of our common stock or on any trading market that may develop.
We cannot predict the size of future issuances of our common stock or securities convertible into common stock or the effect, if any, that future issuances and sales of shares of our common stock will have on the market price of our common stock. Sales of substantial amounts of our common stock (including shares issued in connection with an acquisition), or the perception that such sales could occur, may adversely affect prevailing market prices of our common stock.
We may issue preferred stock whose terms could adversely affect the voting power or value of our common stock.
Our amended and restated certificate of incorporation authorizes us to issue, without the approval of our stockholders, one or more classes or series of preferred stock having such designations, preferences, limitations and relative rights, including preferences over our common stock respecting dividends and distributions, as our board of directors may determine. The terms of one or more classes or series of preferred stock could adversely impact the voting power or value of our common stock. For example, we might grant holders of preferred stock the right to elect some number of our directors in all events or on the happening of specified events or the right to veto specified transactions. Similarly, the repurchase or redemption rights or liquidation preferences we might assign to holders of preferred stock could affect the residual value of the common stock.
Our amended and restated certificate of incorporation designates the Court of Chancery of the State of Delaware as the sole and exclusive forum for certain types of actions and proceedings that may be initiated by our stockholders, which could limit our stockholders’ ability to obtain a favorable judicial forum for disputes with us or our directors, officers, employees or agents.
Our amended and restated certificate of incorporation provides that unless we consent in writing to the selection of an alternative forum, the Court of Chancery of the State of Delaware will, to the fullest extent permitted by applicable law, be the sole and exclusive forum for (i) any derivative action or proceeding brought on our behalf, (ii) any action asserting a claim of breach of a fiduciary duty owed by any of our directors, officers, employees or agents to us or our stockholders, (iii) any action asserting a claim arising pursuant to any provision of the Delaware General Corporation Law (the “DGCL”), our amended and restated certificate of incorporation or our bylaws, or (iv) any action asserting a claim against us that is governed by the internal affairs doctrine, in each such case subject to such Court of Chancery having personal jurisdiction over the indispensable parties named as defendants therein. Any person or entity purchasing or otherwise acquiring any interest in shares of our capital stock will be deemed to have notice of, and consented to, the provisions of our amended and restated certificate of incorporation described in the preceding sentence. This choice of forum provision may limit a stockholder’s ability to bring a claim in a judicial forum that it finds favorable for disputes with us or our directors, officers, employees or agents, which may discourage such lawsuits against us and such persons. Alternatively, if a court were to find these provisions of our amended and restated certificate of incorporation inapplicable to, or unenforceable in respect of, one or more of the specified types of actions or proceedings, we may incur additional costs associated with resolving such matters in other jurisdictions, which could adversely affect our business, financial condition or results of operations.
ITEM 1B. — UNRESOLVED STAFF COMMENTS
None.
ITEM 1C. — CYBERSECURITY
We maintain a cyber risk management program designed to identify, assess, manage, mitigate, and respond to cybersecurity threats. Our information technology (“IT”) personnel, together with third party firms, continuously work to identify, assess, and manage cybersecurity risks in alignment with cybersecurity standards, [including the National Institute of Standards and Technology (NIST) Cyber Security Framework, NIST 800-53, NIST 800-82, and International Electrotechnical Commission 62443]. Our executive management team and Board of Directors are periodically updated regarding the status of, and adjustments to, our cybersecurity program.
To protect our technology systems from cybersecurity threats, we use various security tools that help prevent, identify, escalate, investigate, resolve, and recover from identified vulnerabilities and security incidents in a timely manner. These include, but are not limited to, internal reporting, monitoring, and detection tools to assist us in identifying vulnerabilities in our products before they are exploited by malicious threat actors.
We have an Incident Response Plan that defines and documents procedures for assessing, identifying, and managing a cybersecurity incident. In the event there is a cyber security incident, the designated IT personnel and the Incident Response Team will assess the cybersecurity incident’s impact as the basis for assigning a preliminary severity level. Designated IT personnel are also responsible for communicating incidents to other members of management as appropriate. Were a cybersecurity incident to occur that was determined to be material by our Incident Response Team, including executive management, then our Board of Directors would be notified. Should any incidents occur that have a preliminary severity rating of high or critical, our Incident Response Team would confer with our Board of Directors to determine whether to report the cybersecurity incident in our public filings.
Aside from more immediate reporting of material incidents to our Board of Directors as described above, our IT personnel regularly provide our Board of Directors an update on cybersecurity during each of its quarterly meetings regarding the effectiveness of technical and human security controls, cybersecurity training program compliance, internal and third-party cybersecurity incidents, and cybersecurity risks.
Our CFO leads the IT department and together with IT management they have more than 30 years of combined experience in the IT profession.
No unauthorized access to customer, vendor, supplier, joint venture, employee or our data occurred as a result of cybersecurity incidents against us that has had a material adverse effect on our business, operations, or consolidated financial condition. If our systems, or our customers' or suppliers’ systems, for protecting against cybersecurity incidents prove to be insufficient, a cybersecurity incident could have a material adverse effect on our business, operations, or consolidated financial condition. See additional information about our cybersecurity risks under General Risk factors in Item1(a) Risk Factors.
ITEM 2. — PROPERTIES
Overview of our Properties and Logistics
As of December 31, 2024, we owned and operated three frac sand mines and related processing facilities in Oakdale, Wisconsin; Ottawa, Illinois; and Blair, Wisconsin. Also, in addition to the onsite transloading capabilities at our Oakdale and Blair mines, we own nearby transloading facilities in Byron, Wisconsin and Peru, Illinois. We also operate in-basin transloading facilities under long-term lease agreements in Van Hook, North Dakota, Waynesburg, Pennsylvania, and El Reno, Oklahoma. In December 2023, we acquired the rights to operate a unit train capable transloading terminal in Minerva, Ohio. In January 2024, we acquired the rights to operate a unit train capable transloading terminal in Dennison, Ohio. Both Ohio terminals became operational in 2024.
In addition to these currently operating facilities, we also own an idled mine and processing facility in New Auburn, Wisconsin, which contains a higher concentration of coarser sand deposits. We do not consider this site to be a mining property as we have no immediate plans to resume processing frac sand operations at this facility, though its administrative facilities and proximity to our Oakdale facility allow us to utilize the property to create synergies with our existing operations in Wisconsin.
We also own approximately 959 acres in Jackson County, Wisconsin (“Hixton”). The Hixton site is fully permitted to initiate operations and is available for future development. Based on our preliminary testing, we believe there are sufficient quantities on these sites to establish reserves in the future. We have no immediate plans to further develop this site.
We have two long-term surface mining leases for properties located in the Permian Basin in Texas that are available for future development. The first site consists of 1,772 acres in Winkler County, Texas. This location is adjacent to the Texas & New Mexico Railway (TXN) short line with direct access to State Highway 18. The second site consists of 2,447 acres in Crane County, Texas. This location has direct access to Interstate Highway 20. Based on our preliminary testing, we believe there are sufficient quantities on these sites to establish reserves in the future. We have no immediate plans to further develop these sites.
We closed our leased 56,000 square foot facility in Saskatoon, Saskatchewan, Canada where we previously manufactured our SmartSystems wellsite proppant storage solutions. We moved the manufacturing capabilities to existing space at our Oakdale facility in the United States.
The map below shows the locations of our mine sites, rail terminals and transload facilities, manufacturing facilities and administrative facilities.
Summary Overview of Mining Operations
Information concerning our material mining properties in this Annual Report on Form 10-K has been prepared in accordance with the requirements of subpart 1300 of Regulation S-K, which first became applicable to us for the fiscal year ended December 31, 2021. As used in this Annual Report on Form 10-K, the terms “mineral resource”, “mineral reserve”, “proven mineral reserve” and “probable mineral reserve” are defined and used in accordance with subpart 1300 of Regulation S-K. As of December 31, 2024, our individually material mining properties, as determined in accordance with subpart 1300 of Regulation S-K, were the Oakdale, Wisconsin mine and processing facility (“Oakdale”), Ottawa, Illinois mine and processing facility (“Ottawa”), and the Blair, Wisconsin facility (“Blair”).
The information that follows related to the Oakdale, Ottawa and Blair facilities is derived, for the most part from, and in some instances is an extract from, the technical report summaries (“TRSs”) related to such properties prepared in compliance with the Item 601(b)(96) and subpart 1300 of Regulation S-K. Portions of the following information are based on assumptions, qualifications and procedures that are not fully described herein. Reference should be made to the full text of the TRSs, filed as exhibits to this Annual Report on 10-K.
As of December 31, 2024, we had three operating mines and related processing facilities.
Oakdale, Wisconsin
We, through Smart Sand, Inc. and Smart Sand Oakdale, LLC, its wholly-owned subsidiary, operate a surface mine and silica sand processing plant near Oakdale, Wisconsin. The Oakdale mine includes a total of 1,256 acres that are owned outright by Smart Sand, Inc. This ownership includes subsurface mineral and water rights. The site has no leased property. Royalties are paid in the amount of $0.50 per ton of 70-mesh and coarser substrate.
Our Oakdale facility is a surface mining operation involving heavy equipment and the hydraulic transfer of material to the processing plant. The processing plant uses natural gas, propane, and electricity to produce various grades of high-quality Northern White Sand. Our premium sand is used as proppant used to enhance hydrocarbon recovery rates in the hydraulic fracturing of oil and natural gas wells and for a variety of industrial applications, including glass, foundry, building products, filtration, geothermal, renewables, ceramics, turf & landscape, retail, and recreation.
The Oakdale facility operations are predominantly regulated by Monroe County, Wisconsin through the non-metallic mining and reclamation permit. Air emissions are regulated by the Wisconsin Department of Natural Resources, Bureau of Air Management. All required permits are secured, and the site is operating in full compliance.
Ottawa, Illinois
We, through Northern White Sand LLC, a wholly-owned subsidiary of Smart Sand, Inc., operate a surface mine and a silica sand processing plant near Ottawa, Illinois. The Ottawa mine includes a total of 819 acres that are owned outright by us. This ownership includes subsurface mineral and water rights. The site has no leased property. There are no royalties associated with this property.
Our Ottawa facility is a surface mining operation involving heavy equipment and the hydraulic transfer of material to the processing plant. The processing plant uses natural gas, propane, and electricity to produce various grades of high-quality Northern White Sand. Our premium sand is used as proppant used to enhance hydrocarbon recovery rates in the hydraulic fracturing of oil and natural gas wells and for a variety of industrial applications, including glass, foundry, building products, filtration, geothermal, renewables, ceramics, turf & landscape, retail, and recreation.
The Ottawa facility is regulated by the Illinois Department of Natural Resources, which requires a Surface Mining Permit and Reclamation Plan. The mine reclamation plan is submitted to both the LaSalle County, Illinois and Village of Utica, Illinois Boards. Air emissions are regulated by the Illinois Environmental Protection Agency. All required permits are secured, and the site is operating in full compliance.
Blair Wisconsin
We began operating the Blair mine in the second quarter of 2023. The Blair mine includes a total of 1,285 acres that are owned outright by Smart Sand Blair, a wholly-owned subsidiary of Smart Sand, Inc. This ownership includes subsurface mineral and water rights. The site has no leased property. Royalties are paid on certain grades of silica sand in the estimated amount of $1.75/ton with certain minimum annual payments.
Our Blair facility uses a surface mining technique to produce high-quality Northern White Sand. The processing plant uses natural gas, propane, and electricity to make various grades of high-quality Northern White Sand. Our premium sand is used as proppant used to enhance hydrocarbon recovery rates in the hydraulic fracturing of oil and natural gas wells and for a variety of industrial applications, including glass, foundry, building products, filtration, geothermal, renewables, ceramics, turf & landscape, retail, and recreation.
The Blair facility has several active permits including air quality, construction, operations, groundwater extraction, and non-metallic mining and reclamation, which are administered by the Wisconsin Department of Natural Resources. Land use agreements are active for the Cities of Springfield and Preston regarding the hours of operations, blasting, groundwater assurance, noise and traffic. Conditional use permits are active for both Jackson County, Wisconsin and the City of Blair, Wisconsin for the mining and processing of material at the site Blair site. All required permits are secured, and the site is operating in full compliance.
Summary of Annual Production
The table below shows annual dry tons produced at our mining properties for the years ended December 31, 2024, 2023 and 2022. This table does not include mining activity prior to our acquisition of the Blair mine.
| | | | | | | | | | | | | | | | | |
| 2024 | | 2023 | | 2022 |
| (millions of tons) |
| Silica Sand | | | | | |
| Oakdale mine | 4.9 | | 4.6 | | 4.9 |
| Ottawa mine | 0.6 | | 0.9 | | 1.1 |
| Blair mine | 1.7 | | 0.6 | | 0.0 |
| 7.2 | | 6.1 | | 6.0 |
Summary of Mineral Reserves and Resources
Supplies of high-quality Northern White frac sand are limited to select areas, predominantly in western Wisconsin and limited areas of Minnesota and Illinois. All of our sand mines are located in this geographic area. The following table summarizes our mineral reserves as of December 31, 2024:
| | | | | | | | | | | | | | | | | |
| Total Saleable Reserves | Proven Reserves | Probable Reserves |
| (millions of tons) |
| Silica Sand | | | | | |
Oakdale mine (1) | 238 | | 133 | | 105 |
Ottawa mine (2) | 126 | | 94 | | 32 |
Blair mine (3) | 112 | | 112 | | 0 |
| Total Reserves | 476 | | 339 | | 137 |
(1)Economic evaluation for Oakdale is based on $20.00/ton average minegate pricing as of September 2021, with no escalation.
(2)Economic evaluation for Ottawa is based on $20.00/ton average minegate pricing as of September 2021, with no escalation.
(3)Economic evaluation for Blair is based on $36.00/ton average minegate pricing, based on 2023 forecast, with no escalation.
We have no inferred resources.
Material Mine Site Descriptions
Oakdale, Wisconsin
The Oakdale site is a surface proppant sand mining and processing operation located approximately 1 mile southwest of the town of Oakdale, Wisconsin in Monroe County, Wisconsin. Geographically, the Oakdale site is located at approximately 43° 57’06.1” N latitude and 90° 24’13.0” W longitude.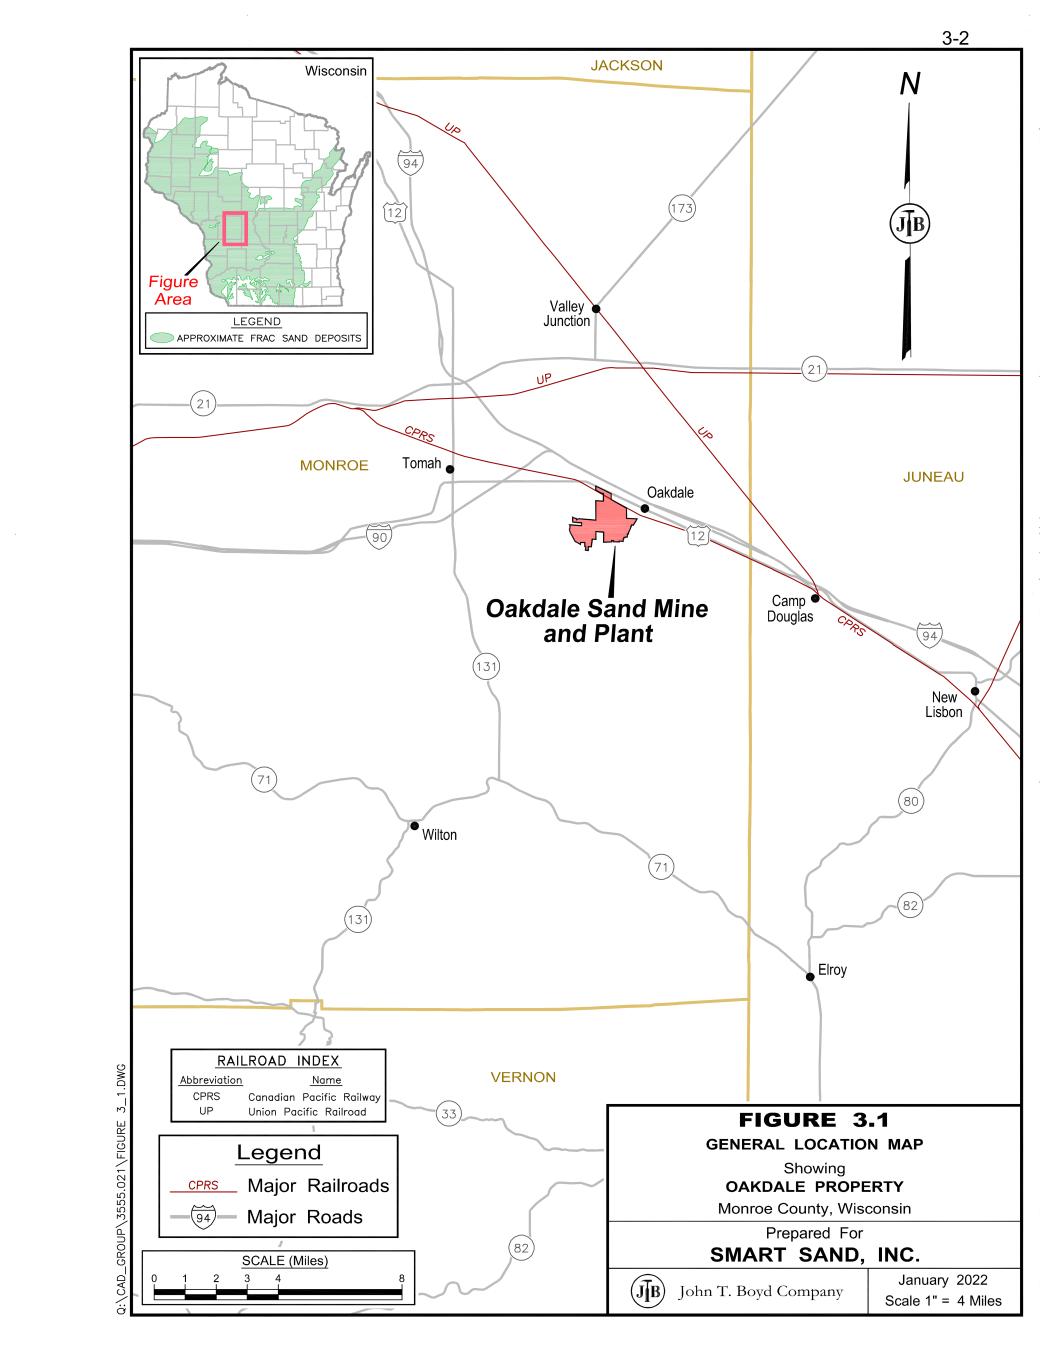
The Oakdale site includes approximately 1,256 acres that we own outright. Royalties are paid in the amount of $0.50 per ton of 70-mesh and coarser substrate. Operations began at our Oakdale site in July 2012 with 1.1 million tons of annual processing capacity. Through multiple expansions, the Oakdale facility currently has an annual processing capacity of 5.5 million tons.
The site is accessible by public roads and a Canadian Pacific railroad spur. Our Oakdale site has an extensive railcar loading, storage, and handling facility. The Oakdale site is connected to the local electrical and natural gas distribution systems. All water onsite is provided through private wells and ponds supplied with recycled process water and groundwater pumped from the active mine. The site has offices holding administrative, engineering, and operations staff. In addition, there are several buildings that house the processing facilities, plant maintenance and support facilities.
We acquired the land and developed the site as a purpose-built silica mine to serve frac sand customers. Since acquiring the facility, we renovated and upgraded its processing capabilities to enable it to produce multiple products through various processing methods, including washing, hydraulic sizing and screening. These techniques allow the Oakdale site to meet a variety of focused specifications on product composition from customers. As such, the Oakdale site services multiple end markets, such as glass, building products, foundry, fillers and extenders, chemicals and oil and gas proppants. We believe that the Oakdale facility and its operating equipment are maintained in good working condition. The total net book value of the Oakdale facility’s real property and tangible assets as of December 31, 2024 was $101.6 million.
Current mining at the Oakdale facility is excavated using conventional surface mining methods. The first step in the mining process is the removal of the overburden from the sandstone layer. This is completed either in-house or by third-party contractors using heavy equipment including excavators, dozers and haul trucks. Next, a third-party contractor is used to drill and blast the sandstone. Heavy equipment, conveyors, hydraulic monitors and pumps are used to transfer the blasted material to the processing plant. At the processing plant, the sand slurry is fed to a surge tank where ultrafine material is removed from the product then pumped to hydrosizers that further separate the sand into coarse and fine particle size fractions. The separated streams are either placed in respective piles, stored on a dewatering slab, or sent to waste depending on product mix desired. The decanted sand is then fed by conveyor or loader to the five available fluidized bed dryers. The dry sand is then classified into final grades using screening units and stored in dedicated silos. A system of conveyors then move sand to a loadout for railcars and trucks. Railcars are on a railspur connected to the Canadian Pacific railroad. Trucking to our Byron transload facility provides access to the Union Pacific railroad.
Several natural and man-made features have been identified in and around the Oakdale site which may limit the mineable areas of the property. These features include setbacks from neighboring properties, right of ways, creeks and wetlands.
To operate active mining operations on the property, the Monroe County, Wisconsin non-metallic reclamation permit requires annual reports to be submitted with information on the reclamation status and to pay annual fees based on disturbed acres. A significant portion of the probable reserves underly current wetland areas. These areas will require mitigation as designated wetlands prior to mining. These reserves are not in our current five-year plan. Air emissions are regulated by the Wisconsin Department of Natural Resources, Bureau of Air Management. We monitor air emissions and have all required permits. The operation also has developed an Environmental Management System and Quality Management System. We have successfully completed the annual outside surveillance audit of our Environmental Management System to the ISO 14001:2015. The Oakdale site has secured necessary permits and is operating in compliance with all required licenses, registrations, and permits.
A summary of Oakdale’s mineral resources and reserves as of December 31, 2024 and 2023 is shown below. | | | | | | | | | | | | | | | | | | | | | | | |
| Year Ended December 31, | | Change |
| 2024 | | 2023 | | Volumes | | Percentage |
| (millions of tons) | | |
| Proven | 133 | | 138 | | -5 | | (4) | % |
| Probable | 105 | | 105 | | 0 | | — | % |
| Saleable | 238 | | 243 | | -5 | | (2) | % |
When estimating mineral reserves, silica product pricing was assumed at $20/ton. Only one commodity (silica sand) is mined, processed and sold at the Oakdale site. Production of silica sand is driven by market demand, and production can be modified in response to that demand. As such, the application of minimum mining thicknesses, maximum stripping ratios (the ratio of waste to sand excavated), or cut-off grades is not generally considered in the estimation of silica sand resources for the Oakdale site. The decrease in reserves from 2023 to 2024 is primarily attributable to excavation and mining activity in 2024. For more information on our resources and reserves, please refer to Exhibit 10.24, the Technical Report Summary for our Oakdale site.
Key assumptions and parameters relating to the mineral reserves at the Oakdale site are discussed in Sections 11.0 and 12.0, respectively, of the Oakdale TRS. Only material that can be economically, safely, and legally extracted is contained in these ore reserve estimates.
Ottawa, Illinois
The Ottawa site is a surface proppant sand mining and processing operation located approximately three miles east of the town of Ottawa, Illinois in LaSalle County, Illinois. Geographically, the Ottawa site is located at approximately 41° 20’48.6” N latitude and 88° 57’18.9” W longitude.
The Ottawa site includes approximately 819 acres that we own outright. The mine site was initially developed in 2014 by Eagle Materials Inc., a Delaware corporation (“Eagle”), as a wash plant that railed wet sand to Corpus Christi, TX. In the summer of 2018, a 1.6 million ton per year dry plant was constructed on site. In September 2020, we acquired the Ottawa Site from Eagle. We began operating the Ottawa, Illinois mine and Peru, Illinois transload facility in October 2020. There are no royalties associated with any minerals at this site. The current annual processing capacity is estimated at 1.6 million tons.
The site is accessible by public roads. There is no rail onsite. All minerals are trucked from the site to a terminal that we own and operate in Peru, Illinois, on the Burlington Northern Santa Fe railroad a few miles away from the mine site. Our Ottawa site includes a wet plant and a dry plant, storage, and handling facility. The Ottawa site is connected to the local electrical and natural gas distribution systems. Water onsite is provided through public works, private wells and ponds supplied with recycled process water and groundwater pumped from the active mine. The site has offices holding administrative, engineering, and operations staff. In addition, there are several buildings that house the processing facilities, plant maintenance and support facilities.
Ottawa production capabilities include ability to produce multiple products through various processing methods, including washing, hydraulic sizing and screening. These production techniques allow the Ottawa site to meet a variety of focused specifications on product composition from customers. As such, the Ottawa site services multiple end markets, such as glass, building products, foundry, fillers and extenders, chemicals and oil and gas proppants. We believe that the Ottawa facility and its operating equipment are maintained in good working condition. The total net book value of the Ottawa facility and related transload real property and tangible assets as of December 31, 2024 was $39.2 million.
Current mining at the Ottawa facility is excavated using conventional surface mining methods. The first step in the mining process is the removal of the overburden from the sandstone layer. This is completed either in-house or by third-party contractors using heavy equipment including excavators, dozers and haul trucks. Next, a third-party contractor is used to drill and blast the sandstone. Heavy equipment is used to transfer the blasted material to the processing plant. At the processing plant, the sand is fed into a crusher, wet screened to remove oversize material and placed in a surge tank where ultra fine material is removed from the product and sent to a thickener as waste. The remaining slurry is pumped to hydrosizers that further hydraulically separate the sand into waste and product streams with the product sent to an enclosed decant shed for dewatering. A drag chain conveyor reclaims sand from the top of the decant pile and conveys the sand to the dryer. Dry sand is then screened into our four primary grades of sand. The finished product is stored in four truck loadout silos. All product leaves the plant via truck. The majority of the product is trucked to a nearby Peru, Illinois rail loadout on the Burlington Northern Santa Fe railroad.
To operate active mining operations on the property, the Illinois Department of Natural Resources requires a Surface Mining Permit. The Surface Mining Permit application requires the operator to submit an annual operating plan that illustrates how the land will be affected by mining operations as well as a reclamation plant that describes how the mined land will be restored for future use. The mine reclamation plan is submitted to the LaSalle County and Village of Utica Boards. The Ottawa operation has obtained the necessary permits. Air emissions are regulated by the Illinois Environmental Protection Agency. A Title V permit for air emissions is currently issued to Northern White Sand, which is our wholly owned subsidiary. We monitor air emissions and have all required permits. The Ottawa site has secured necessary permits and is operating in compliance with all required licenses, registrations, and permits.
A summary of Ottawa’s mineral resources and reserves as of December 31, 2024 and 2023 is shown below. | | | | | | | | | | | | | | | | | | | | | | | |
| Year Ended December 31, | | Change |
| 2024 | | 2023 | | Volumes | | Percentage |
| (millions of tons) | | |
| Proven | 94 | | 95 | | -1 | | (1) | % |
| Probable | 32 | | 32 | | 0 | | — | % |
| Saleable | 126 | | 127 | | -1 | | (1) | % |
When estimating mineral reserves, silica product pricing was assumed at $20/ton. Only one commodity (silica sand) is mined, processed and sold at the Ottawa site. Production of silica sand is driven by market demand, and production can be modified in response to that demand. As such, the application of minimum mining thicknesses, maximum stripping ratios (the ratio of waste to sand excavated), or cut-off grades is not generally considered in the estimation of silica sand resources for the Ottawa site. The decrease in reserves from 2023 to 2024 is primarily attributable to excavation and mining activity in 2024. For more information on our resources and reserves, please refer to Exhibit 10.25, the Technical Report Summary for our Ottawa mine.
Key assumptions and parameters relating to the mineral reserves at the Ottawa site are discussed in Sections 11.0 and 12.0, respectively, of the Utica TRS. Only material that can be economically, safely, and legally extracted is contained in these ore reserve estimates.
Blair, Wisconsin
The Blair site is a surface proppant sand mining and processing operation located approximately 3 miles southwest of the town of Taylor, Wisconsin in Trempealeau County, Wisconsin. Geographically, the Blair site is located at approximately 44° 17’44.0” N latitude and 91° 10’05.5” W longitude.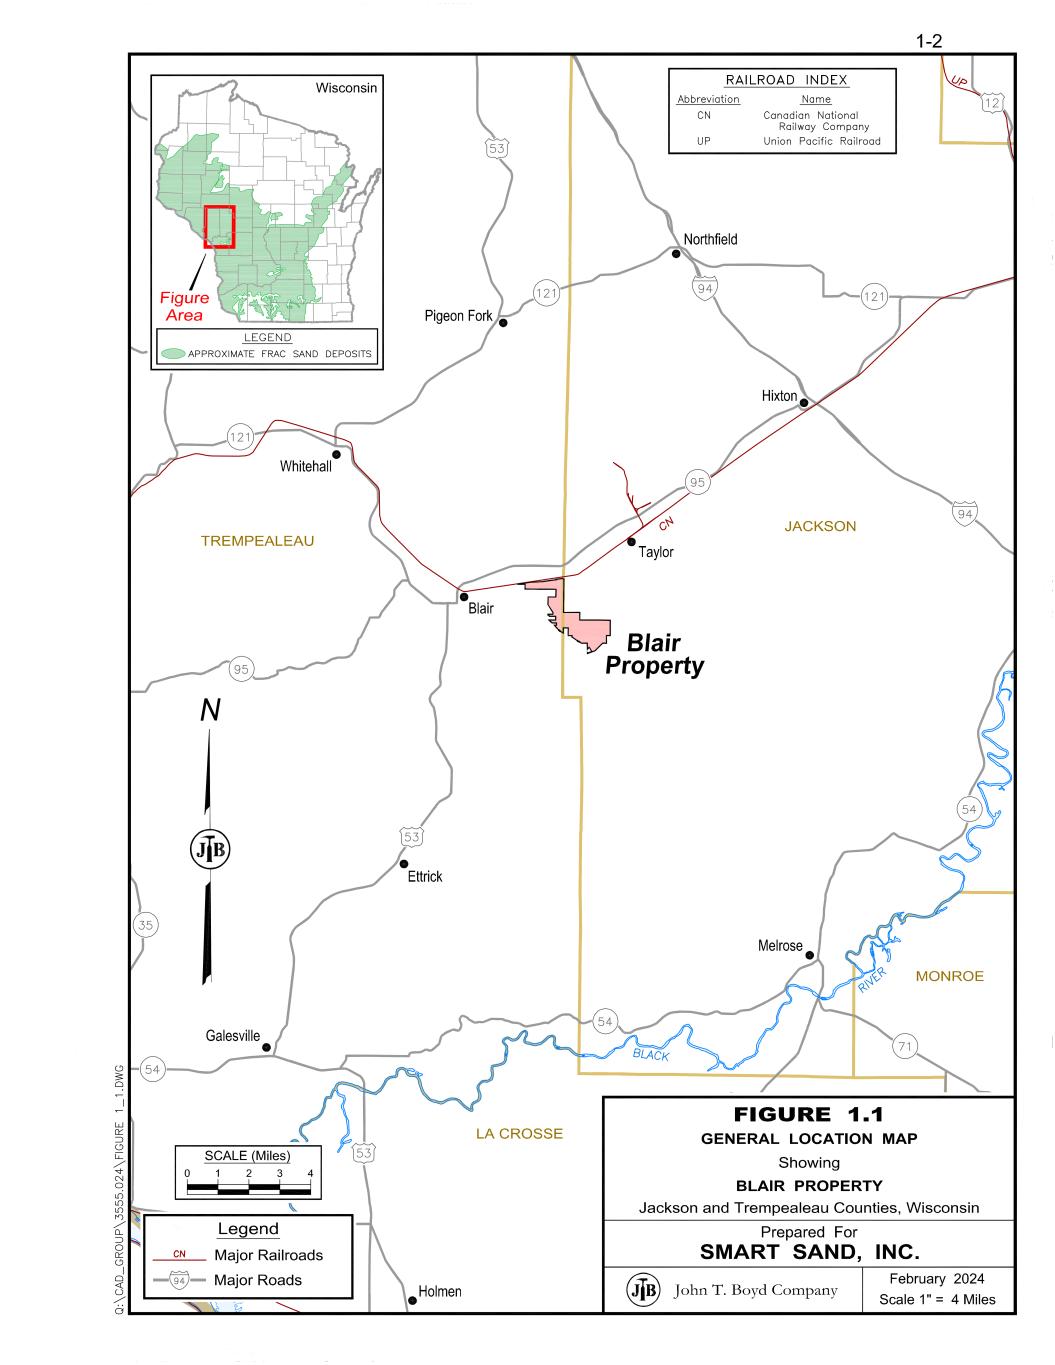
The Blair site includes approximately 1,285 acres that we own outright. The mine site was initially developed in 2016 by HCR and shut down in 2020 due to the COVID-19 pandemic. On March 4, 2022, we acquired the Blair facility. We began operations at the Blair facility in the second quarter of 2023. The Blair facility has approximately 2.9 million tons of total annual processing capacity and contains an onsite, unit train capable rail terminal with access to the Class 1 Canadian National Railway. We pay royalties of approximately $1.75 per ton with certain annual minimum payments.
The site is accessible by public roads and the Canadian National railroad spur. Our Blair site has an extensive railcar loading, storage, and handling facility. The Blair site is connected to the local electrical and natural gas distribution systems. All water onsite is provided through private wells. The site has offices holding administrative, engineering, and operations staff. In addition, there are several buildings that house the processing facilities, plant maintenance and support facilities.
Blair production capabilities include ability to produce multiple products through various processing methods, including washing, hydraulic sizing and screening. These production techniques allow the Blair site to meet a variety of focused specifications on product composition from customers. As such, the Blair site services multiple end markets, such as glass, building products, foundry, fillers and extenders, chemicals and oil and gas proppants. We believe that the Blair facility and its operations have been maintained in good condition. The total net book value of the Blair facility real property and tangible assets as of December 31, 2024 was $18.1 million.
We began operating the Blair facility in the second quarter of 2023. Current mining at the Blair facility is excavated using conventional surface mining methods. The first step in the mining process is the removal of the overburden from the sandstone layer. This is completed either in-house or by third-party contractors using heavy equipment including excavators, dozers and haul trucks. Next, a third-party contractor is used to drill and blast the sandstone. Heavy equipment is used to transfer the blasted material to the crusher for further processing. Conveyors transfer the sand to the wet plant where hydrosizers are used to sort the sand into product and waste streams. The waste stream is further separated by a cyclone where the ultra fines are sent to a thickener and filter press to recover water and the remainder is conveyed to a pile for reclamation purposes. The product stream is dewatered and conveyed to the wet storage piles next to the dry plant. Loaders will feed the two dryers from the decant pile and will screen the sand into four or five grades that are then stored into dedicated silos until loaded into railcars for shipping. Railcars are on a railspur connected to the Canadian National railroad.
To operate active mining operations on the property, a non-metallic mining industrial permit is in place and administered by the Wisconsin Department of Natural Resources in both Jackson and Trempealeau counties. There are also permits for air quality, construction, ground water extraction administered by the Wisconsin Department of Natural Resources. A land use agreement is active for the cities of Springfield and Preston regarding operating hours. A conditional use permit is active for both Jackson County and the City of Blair for the mining and processing of material at the Blair site. A reclamation plan for restoring the site to an agreed upon state is in place with Jackson County and the City of Blair. The Blair site has secured necessary permits and is in compliance with all required licenses, registrations, and permits.
A summary of Blair’s mineral resources and reserves as of December 31, 2024 and 2023 is shown below. | | | | | | | | | | | | | | | | | | | | | | | |
| Year Ended December 31, | | Change |
| 2024 | | 2023 | | Volumes | | Percentage |
| (millions of tons) | | |
| Proven | 112 | | 114 | | -2 | | (2) | % |
| Probable | 0 | | 0 | | 0 | | Not Meaningful |
| Saleable | 112 | | 114 | | -2 | | (2) | % |
When estimating mineral reserves, silica product pricing was assumed at $36/ton, which represents our budget for 2024. Only one commodity (silica sand) is mined, processed and sold at the Blair site. Production of silica sand is driven by market demand, and production can be modified in response to that demand. As such, the application of minimum mining thicknesses, maximum stripping ratios (the ratio of waste to sand excavated), or cut-off grades is not generally considered in the estimation of silica sand resources for the Blair site. The decrease in reserves from 2023 to 2024 is primarily attributable to excavation and mining activity in 2024. For more information on our resources and reserves, please refer to Exhibit 10.26, the Technical Report Summary for our Blair site.
Key assumptions and parameters relating to the mineral reserves at the Blair site are discussed in Sections 11.0 and 12.0, respectively, of the Blair TRS. Only material that can be economically, safely, and legally extracted is contained in these ore reserve estimates.
Internal Controls Disclosure
The current year reported reserves have taken the previously reported amounts and subtracted excavation and mining activity to deduce the 2024 reserves. There have been no material changes to our mining operations or economic considerations since the initial reserves were established in the TRS reports from 2021 and 2022.
Previously established modeling and analysis of our reserves has been developed by our personnel, reviewed by several levels of internal management and, in the case of the three material properties, reviewed by John T. Boyd. This section summarizes the internal control considerations for our development of estimations, including assumptions, used in resource and reserve analysis and modeling.
When determining resources and reserves, as well as the differences between resources and reserves, management developed specific criteria, each of which must be met to qualify as a resource or reserve, respectively. These criteria, such as demonstration of economic viability, repeatable geologic continuity, and meeting generally accepted quality specifications, are specific and attainable, as applicable. Calculations using site specific criteria for the three material properties were reviewed by John T. Boyd. John T. Boyd was provided with our exploration data, geologic models, and volumetric estimates and took a three-step approach to validate our resource and reserve estimates at the four material properties: (1) verified the accuracy of geologic model inputs by comparison with drilling logs and laboratory reports, (2) compared the geologic model with compiled drilling data and (3) prepared a stratigraphic grid model of the geologic unit and independently estimated volumes. All calculations were conducted independently by John T. Boyd, then compared to our internal estimates and found to be within acceptable variance. A detailed description of the methodology used to calculate mineral reserves for the three material properties is provided in the TRSs filed as exhibits to this Annual Report.
For all properties, geographical modeling and mine planning efforts serve as a base assumption for resource and reserve estimates at each location. These outputs have been prepared by both our personnel and third-party consultants, and the methodology is compared to industry best practices. Mine planning decisions, such as mining bench height, execution of mining processes and ground control, are determined and agreed upon by our management. Management adjusts forward-looking models by reference to historic mining results, including reviewing performance versus predicted levels of production from the mineral deposit, and if necessary, reevaluating mining methodologies if production outcomes were not realized as predicted. Ongoing mining and investigation of the mineral deposit, coupled with product quality validation pursuant to industry best practices and customer expectations, provides further empirical evidence as to the homogeneity, continuity and characteristics of the mineral resource. Ongoing quality validation of production also provides a means to monitor for any potential changes in mineral quality.
Management also assesses risks inherent in mineral resource and reserve estimates, such as the accuracy of geological data that is used to support mine planning, identify hazards and inform operations of the presence of mineable deposits. Also, management is aware of risks associated with potential gaps in assessing the completeness of mineral extraction licenses, entitlements or rights, or changes in laws or regulations that could directly impact the ability to assess mineral resources and reserves or impact production levels. Risks inherent in overestimated reserves can impact financial performance when revealed, such as changes in amortization that are based on life of mine estimates.
Based on their review of our cost structure and their extensive experience with similar operations, John T. Boyd concluded that it is reasonable to assume that we will operate under a similar cost structure over the remaining life of our reserves. John T. Boyd further assumed that if our revenue per ton remained relatively constant over the life of the reserves, our current operating margins are sufficient to expect continued profitability throughout the life of our reserves.
ITEM 3. — LEGAL PROCEEDINGS
From time to time we may be involved in litigation relating to claims arising out of our operations in the normal course of business. The disclosure called for by Part I, Item 3 regarding our legal proceedings is incorporated by reference herein from Part II, Item 8. Note 16 - Commitments and Contingencies - Litigation of the notes to the consolidated financial statements in this Form 10-K for the year ended December 31, 2024.
ITEM 4. — MINE SAFETY DISCLOSURES
We are committed to maintaining a culture that prioritizes mine safety. We believe that our commitment to safety, the environment and the communities in which we operate is critical to the success of our business. Our sand mining operations are subject to mining safety regulation. The U.S. Mining Safety and Health Administration (“MSHA”) is the primary regulatory
organization governing frac sand mining and processing. Accordingly, MSHA regulates quarries, surface mines, underground mines and the industrial mineral processing facilities associated with and located at quarries and mines. The mission of MSHA is to administer the provisions of the Federal Mine Safety and Health Act of 1977 as amended by the Mine Improvement and
New Emergency Response (MINER) Act of 2006 and to enforce compliance with mandatory miner safety and health standards. As part of MSHA’s oversight, representatives perform at least two unannounced inspections annually for each above-ground facility.
We are also subject to regulations by the U.S. Occupational Safety and Health Administration (“OSHA”) which has promulgated rules for workplace exposure to respirable silica for several other industries. Respirable silica is a known health hazard for workers exposed over long periods. In 2023, MSHA proposed similar rules, which would, among other updates, reduce the exposure limits, require immediate corrective actions if exposure limits are exceeded, require exposure sampling and no-cost medical surveillance, and update respiratory protection requirements. Airborne respirable silica is associated with work areas at our site and is monitored closely through routine testing and MSHA inspection. We do not expect to need to make any significant changes in operations or infrastructure to comply with the new rules. We also adhere to NISA’s respiratory protection program, and ensures that workers are provided with fitted respirators and ongoing radiological monitoring.
Our operations are subject to the Federal Mine Safety and Health Act of 1977, as amended by the Mine Improvement and New Emergency Response Act of 2006, which imposes stringent health and safety standards on numerous aspects of mineral extraction and processing operations, including the training of personnel, operating procedures, operating equipment, and other matters. Our failure to comply with such standards, or changes in such standards or the interpretation or enforcement thereof, could have a material adverse effect on our business and financial condition or otherwise impose significant restrictions on our ability to conduct mineral extraction and processing operations. Following passage of The Mine Improvement and New Emergency Response Act of 2006, MSHA significantly increased the numbers of citations and orders charged against mining operations. The dollar penalties assessed for citations issued has also increased in recent years. Information concerning mine safety violations or other regulatory matters required by Section 1503(a) of the Dodd-Frank Wall Street Reform and Consumer Protection Act and Item 104 of Regulation S-K (17 CFR 229.104) is included in Exhibit 95.1 to this Report.
PART II
ITEM 5. — MARKET FOR REGISTRANT’S COMMON EQUITY, RELATED STOCKHOLDER MATTERS AND ISSUER PURCHASES OF EQUITY SECURITIES
Shares of our common stock, traded publicly under the symbol, “SND,” have been publicly traded since November 4, 2016, when our common stock was listed and began trading on the NASDAQ Global Select Market (“NASDAQ”). Prior to that date, there was no public market for our stock.
Holders of Record
On February 21, 2025, there were 42,876,756 shares of our common stock outstanding, which were held by approximately 31 stockholders of record. Because many of our shares of common stock are held by brokers and other institutions on behalf of stockholders, we are unable to estimate the total number of stockholders represented by these record holders.
Dividends
Our ability to pay dividends is governed by (i) the provisions of Delaware corporate law, (ii) our Certificate of Incorporation and Bylaws, and (iii) our FCB ABL Credit Facility. Our board of directors declared a special dividend of $0.10 per share of common stock on October 3, 2024, which was paid on October 28, 2024 to stockholders of record at the close of business on October 15, 2024. We can give no assurance that we will pay any cash dividends on our common stock in the future. The future payment of cash dividends on our common stock, if any, is within the discretion of our board of directors and will depend on our earnings, capital requirements, financial condition, restrictions under our FCB ABL Credit Facility and other relevant factors.
Smart Sand, Inc. Comparative Stock Performance Graph
The graph below compares the cumulative total stockholder return on our common stock, the cumulative total return on the Russell 3000 Index and the Standard and Poor’s Small Cap 600 GICS Oil & Gas Equipment & Services Sub-Industry for the last five years.
The graph assumes $100 was invested on December 31, 2019, in our common stock, the Russell 3000, and the Standard and Poor’s Small Cap 600 GICS Oil & Gas Equipment & Services Sub-Industry Index. The cumulative total return assumes the reinvestment of all dividends.
The information contained in this Smart Sand, Inc. Comparative Stock Performance Graph section shall not be deemed to be “soliciting material” or “filed” or incorporated by reference in future filings with the SEC, or subject to the liabilities of
Section 18 of the Exchange Act, except to the extent that we specifically incorporate it by reference into a document filed under the Securities Act or the Exchange Act.
Unregistered Sales of Equity Securities and Use of Proceeds
During the three months ended December 31, 2024, no shares were sold by the Company without registration under the Securities Act of 1933.
Purchases of Equity Securities by the Issuer and Affiliated Purchasers
On October 3, 2024, our board of directors approved an eighteen-month share repurchase program under which we may purchase up to $10.0 million of its ordinary shares (the “Repurchase Program”). Pursuant to the Repurchase Program, we may repurchase ordinary shares from time to time, in amounts, at prices and at such times as we deem appropriate, subject to market conditions and other considerations. We may make repurchases in the open market, privately negotiated transactions, accelerated repurchase programs or structured share repurchase programs. The Repurchase Program will be conducted in compliance with applicable legal requirements and shall be subject to market conditions and other factors. The Repurchase Program does not obligate us to acquire any particular amount of ordinary shares and the Repurchase Program may be modified or suspended at any time at our discretion.
| | | | | | | | | | | | | | | | | | | | | | | | | | |
| | Total number of shares purchased | | Average price paid per share | | Total number of shares purchased as part of publicly announced plans or programs | | Maximum number of shares that may yet be purchased under the plans or programs |
| October 2024 | | — | | | $ | — | | | — | | | 4,444,444 | |
| November 2024 | | — | | | $ | — | | | — | | | 4,444,444 | |
| December 2024 | | — | | | $ | — | | | — | | | 4,444,444 | |
| | — | | | $ | — | | | — | | | |
At December 31, 2024, the maximum number of shares that the Company may repurchase under the current repurchase authority was 4,444,444 shares.
ITEM 6. — RESERVED
SMART SAND, INC.
MANAGEMENT’S DISCUSSION AND ANALYSIS
OF FINANCIAL CONDITION AND RESULTS OF OPERATIONS
(UNAUDITED)
ITEM 7. — MANAGEMENT’S DISCUSSION AND ANALYSIS FINANCIAL CONDITION AND RESULTS OF OPERATIONS
Forward-Looking Statements
The following discussion and analysis of our financial condition and results of operations should be read together with Item 1, “Business,” and Item 8, "Financial Statements and Supplementary Data,” of this Annual Report on Form 10-K.
This discussion contains forward-looking statements as a result of many factors, including those set forth under Item 1, “Business—Forward-Looking Statements” and Item 1A, “Risk Factors,” and elsewhere in this report. These statements are based on current expectations and assumptions that are subject to risks and uncertainties. Actual results could differ materially from those discussed in or implied by forward-looking statements. Factors that could cause or contribute to these differences include those discussed below and elsewhere in this report, particularly in Item 1A, “Risk Factors.”
We use contribution margin, EBITDA, Adjusted EBITDA and free cash flow herein as non-GAAP measures of our financial performance. For further discussion of contribution margin, EBITDA, Adjusted EBITDA and free cash flow, see the section entitled “Non-GAAP Financial Measures.” in this Item 7 of this Annual Report on Form 10-K. We define various terms to simplify the presentation of information in this Report. All share amounts are presented in thousands.
Factors Affecting Comparability of Our Financial Results
Our historical results of operations and cash flows may not be indicative of results of operations and cash flows to be expected in the future, principally for the following reasons:
•Expansion of Operations. As discussed in the section entitled “Recent Developments” in this Item 7 of this Annual Report on form 10-K, in recent years we have added the Blair mine and two new terminals, and expanded our operations into industrial products. This growth and expansion reduces comparability of periods, due to increased revenue, cost of goods sold, operating costs, and capital investments.
•Market Trends. Beginning in the first quarter of 2022 and continuing through 2024, supply and demand fundamentals have improved and frac sand prices recovered from previous historic lows. There have been modest pricing fluctuations over the periods presented, but we believe the fluctuation is consistent with other commodities in the oilfield services sector. High levels of inflation have also led to increasing operating expenses from 2022 through 2024.
Overview
We are a fully integrated frac and industrial sand supply and services company. We offer complete mine to wellsite proppant supply and logistics solutions to our frac sand customers. We produce low-cost, high quality Northern White sand, which is a premium sand used as proppant used to enhance hydrocarbon recovery rates in the hydraulic fracturing of oil and natural gas wells and for a variety of industrial applications. We also offer proppant logistics solutions to our customers through our in-basin transloading terminals and our SmartSystemsTM wellsite storage capabilities. In late 2021, we created our Industrial Products Solutions (“IPS”) business in order to diversify our customer base and markets we serve by offering sand for industrial uses. We market our products and services to oil and natural gas exploration and production companies, oilfield service companies, and industrial manufacturers. We sell our sand through long-term contracts, short-term supply agreements or spot sales in the open market. We provide wellsite proppant storage solutions services and equipment under flexible contract terms custom tailored to meet the needs of our customers. We believe that, among other things: (i) the size and favorable geologic characteristics of our sand reserves; (ii) the strategic location and logistical advantages of our facilities; (iii) our proprietary SmartDepotTM portable wellsite storage silos, SmartPath® wellsite proppant management system, and SmartBeltTM conveyor;
SMART SAND, INC.
MANAGEMENT’S DISCUSSION AND ANALYSIS
OF FINANCIAL CONDITION AND RESULTS OF OPERATIONS
(UNAUDITED)
(iv), access to all Class I rail lines; and (v) the industry experience of our senior management team make us as a highly attractive provider of sand and logistics services.
We incorporated in Delaware in July 2011 and began operations at our Oakdale facility with 1.1 million tons of annual processing capacity in July 2012. After several expansions, our current annual processing capacity at our Oakdale facility is approximately 5.5 million tons of sand. The Oakdale facility contains an onsite, unit train capable rail terminal with access to the Class 1 Canadian Pacific Railway.
In September 2020, we acquired, all of the issued and outstanding interests in Eagle Proppants Holdings from Eagle, which included our Ottawa, Illinois processing facility, which has approximately 1.6 million tons of annual sand processing capacity. We commenced operations at the Ottawa facility in October, 2020.
In March 2022, we acquired all of the issued and outstanding interests in Hi-Crush Blair, LLC, which included our Blair, Wisconsin processing facility. This facility has approximately 2.9 million tons of total annual sand processing capacity and contains an onsite, unit train capable rail terminal with access to the Class 1 Canadian National Railway. We commenced operations at the Blair facility in the second quarter of 2023.
We directly control five in-basin transloading facilities and have access to third party transloading terminals in all operating basins. These terminals allow us to offer more efficient and sustainable delivery options to our customers. We operate a unit train capable transloading terminal in Van Hook, North Dakota to service the Bakken Formation in the Williston Basin. We operate this terminal under a long-term agreement with Canadian Pacific Railway. We now serve the Appalachian Basin through three company-controlled terminals. In January 2022, we began operations at a unit train capable transloading terminal in Waynesburg, Pennsylvania, which we expanded in 2023. In December 2023, we acquired the right to operate a terminal in Minerva, Ohio and in January 2024 we acquired the rights to operate a terminal in Dennison, Ohio. These two Ohio terminals became operational in 2024. We also have rights to use a rail terminal located in El Reno, Oklahoma. Additionally, we have long-standing relationships with third party terminal operators that allow us access to substantially all oil and natural gas exploration production basins of North America.
We also offer our customers portable wellsite storage and management solutions through our SmartSystems products and services. Our Smart Systems enable customers to unload, store, and deliver proppant at the wellsite and rapidly set up, take down, and transport the entire system. This capability enhances our customers’ efficiency, safety, and reliability. Through our SmartSystems wellsite proppant storage solutions, we offer the SmartDepot and SmartDepotXL™ silo systems, the SmartBelt conveyor, the SmartPath wellsite proppant management system, and our rapid deployment trailers. The SmartDepot silos feature passive and active dust suppression technology and support gravity-fed operation. Our self-contained SmartPath wellsite proppant management system is a mobile sand transloading solution that works with bottom-dump trailers. These systems include a drive-over conveyor, surge bin, silo storage, bucket elevators, and integrated dust collection. In 2024, we developed new dual bucket elevators to enhance our vertical material handling capabilities. We also increased our silo storage capacity and streamlined proppant delivery directly to the blender. This addition provides greater flexibility for customers with varying wellsite configurations while maintaining the efficiency, safety, and reliability that define our SmartSystems solutions. Our rapid deployment trailers are designed for quick setup, takedown, and transportation of the entire SmartSystem. They detach from the wellsite equipment, allowing for removal from the wellsite during operations. We believe our SmartSystems help customers reduce trucking and related fuel consumption, reducing the carbon footprint of their daily operations.
We have expanded our product line to offer Industrial Sand through IPS. In 2023, we completed the installation of blending and cooling equipment at our Ottawa, Illinois facility that we believe provides new opportunities to increase our customer base in the IPS business. We expect to continue to expand and diversify to serve the major industrial markets throughout North America, including glass, foundry, building products, filtration, geothermal, renewables, ceramics, turf & landscape, retail, recreation and more in 2025.
Recent Developments
Ohio Transload Terminals
In late 2023 and early 2024, we acquired the rights to operate unit train capable transloading facilities located in Minerva, Ohio and Dennison, Ohio. These sites became operational in 2024 and we believe that they provide us with the opportunity to sell additional sand to existing and potential customers in the Appalachian Basin.
SMART SAND, INC.
MANAGEMENT’S DISCUSSION AND ANALYSIS
OF FINANCIAL CONDITION AND RESULTS OF OPERATIONS
(UNAUDITED)
Blair Mine and Processing Facility
In April 2023, our processing facility located in Blair, Wisconsin became operational. This facility has approximately 2.9 million tons of total annual sand processing capacity and contains an onsite, unit train capable rail terminal with access to the Class 1 Canadian National Railway. We believe this facility provides us with opportunities to expand our customer base in Canada along with other portions of North America.
Assets and Operations
Oakdale, Wisconsin
Our sand reserves in Oakdale include a mix of coarse and fine sand with a majority of the reserves being the finer grades. With demand currently in the frac sand market being primarily for finer mesh sands, we believe our reserve mix provides us relatively higher mining yields and lower processing costs than frac sand mines with predominantly coarse sand reserves. We have approximately 238 million tons of proven and probably recoverable reserves with an estimated life of mine of approximately 60 years, based on expected sales volumes.
Our Oakdale facility is purpose-built to exploit the reserve profile in place and produce high-quality frac sand. Unlike some of our competitors, our primary processing and rail loading facilities are located in close proximity to the mine site, which limits the need for us to truck sand on public roads between the mine and the production facility, between wet and dry processing facilities, or from the processing facility to rail loading facilities. Our on-site transportation assets include approximately nine miles of rail track in a triple-loop configuration and four railcar loading facilities that are connected to a Class I rail line owned by Canadian Pacific. This enables us to simultaneously accommodate multiple unit trains and significantly increases our efficiency in meeting our customers’ frac sand transportation needs. Additionally, we have our unit train capable transload facility approximately three miles from the Oakdale facility in Byron Township, Wisconsin, which provides us with the ability to ship sand to our customers on the Union Pacific rail network. We believe that we are the only sand facility in Wisconsin that has dual served rail capabilities, which should create competition among our rail carriers and allow us to provide more competitive logistics options for our customers.
Ottawa & Peru, Illinois
Our Ottawa facility also has a large high-quality reserve base of primarily fine-mesh sand that is contiguous to the production facility and in close proximity to our Peru transload facility located on the BNSF railway. We have approximately 126 million tons of proven and probable reserves, and an estimated life of mine of approximately 105 years, based on expected sales volumes. Our owned Peru transload facility has significant logistics assets to support our Ottawa operations. This facility is capable of handling multiple unit trains simultaneously and provides access to operating basins in the Western United States. Additionally, the CSX and BNSF rail lines, as well as industrial manufacturers in the greater Chicago area and other Midwestern metropolitan markets are within short trucking distances.
Blair, Wisconsin
Our Blair facility also has a large high-quality reserve base of primarily fine-mesh sand that is contiguous to the production facility and significant logistics assets located on the Canadian National railway. We have approximately 112 million tons of proven and probable reserves and an estimated life of mine of approximately 56 years, based on expected sales volumes. Our Blair facility provides us with significant logistics assets that further increases our logistics advantage, including access to the Canadian National Railway, a Class I rail line. In the second quarter of 2023, we commenced operations at the Blair facility.
Logistics
From our three operating facilities of Oakdale, Ottawa and Blair, we have direct access to four Class I rail lines and all Class I rail lines within the United States and Canada. We believe this allows us to deliver frac sand to all operating basins in North America on a sustainable, efficient and cost-effective basis. We expect to continue to capitalize on our three operating facilities logistics networks to maximize our product shipments, increase our railcar utilization and lower our transportation costs.
SMART SAND, INC.
MANAGEMENT’S DISCUSSION AND ANALYSIS
OF FINANCIAL CONDITION AND RESULTS OF OPERATIONS
(UNAUDITED)
Through our transloading terminal in Van Hook, North Dakota, we provide one of the most efficient and lowest-cost sources of Northern White sand in-basin to customers operating in the Bakken Formation in the Williston Basin. In 2021, we acquired the right to operate the Waynesburg, Pennsylvania terminal. In December 2023, we acquired rights to operate a transloading terminal in Minerva, Ohio. In January 2024 we acquired rights to operate a terminal in Dennison, Ohio. With these three terminals in the Appalachian Basin, we believe we are one of the premier providers of low cost high-quality Northern White Sand serving the Marcellus and Utica formations. We also acquired a rail terminal from the Eagle acquisition located in El Reno, Oklahoma, which allows us to economically provide frac sand to customers operating nearby, including customers using our SmartSystems last mile equipment.
Through our SmartSystems offering, we have the technology, production capacity and management team to compete further in the frac sand supply chain for our customers by offering logistics services from the mine all the way to the wellsite. Our SmartSystems consist of our SmartDepot proppant storage silos, our SmartPath wellsite proppant management system, our SmartBelt conveyor and our rapid deployment trailer system.
We believe our patented SmartDepot silos will outperform our competitors in that they can be set up or taken down rapidly, they include industry-leading passive and active dust suppression technology, they have the capability of gravity-fed operation and they can be filled by both pneumatic and gravity dump trailers. Our trailers detach, which reduces their footprint on the wellsite. In 2020, we developed a self-contained SmartPath wellsite proppant management system, which is a mobile sand transloading system designed to work with bottom dump trailers and features a drive over conveyor, surge bin, silo storage, and integrated dust collection system. In 2024, we developed new dual bucket elevators to enhance our vertical material handling capabilities. We also increased our silo storage capacity and streamlined proppant delivery directly to the blender. This addition provides greater flexibility for customers with varying wellsite configurations while maintaining the efficiency, safety, and reliability that define our SmartSystems solutions. We believe the system has the ability to keep up with any hydraulic fracturing operation. Our SmartBelt conveyor is designed to work with our SmartPath wellsite proppant management system to directly feed sand into the blender. Our rapid deployment trailers are designed for quick setup, takedown and transportation of the entire SmartSystem, and they detach from the wellsite equipment, which allows for removal from the wellsite during operation. We have also developed a proprietary software program, the SmartSystem TrackerTM, which allows our SmartSystems customers to monitor silo-specific information, including location, proppant type and proppant inventory.
Through the expansion of our SmartSystems fleet and other logistics options, we continue evaluating ways to reduce the landed cost of our products in-basin and to the wellsite for our customers while increasing our customized service offerings to provide additional delivery and pricing alternatives, including selling product on an “as-delivered” basis to the wellsite. We believe that our SmartSystems reduce trucking and related fuel consumption for our customers, helping them reduce their carbon footprint in their daily operations.
How We Generate Revenue
We generate revenue by excavating and processing frac sand, which we sell to our customers in the oil and gas industry under short and long-term contracts agreements or as spot sales at prevailing market rates. For in-basin sales, revenues also include a charge for transportation and handling services provided to customers. Our contracts typically contain a minimum volume purchase requirement and provide for delivery of frac sand from one of our processing facilities, transloading terminals or another location specified by our customers. Revenue is generally recognized as products are delivered to customers in accordance with the contract.
We generate revenue from our SmartSystems by renting equipment and providing services to our customers under contract terms tailored to meet their short-term or long-term needs with any number of SmartDepots, SmartPaths, SmartBelts or trailers they require. We recognize revenue when the equipment is made available for the customer to use, services are provided, or other obligations in the contract are met.
In the fourth quarter of 2021, we expanded our product line to begin offering sand through IPS. In 2023, we completed the installation of blending and cooling assets at our Ottawa, Illinois facility that we believe will provide new opportunities to increase our customer base in the IPS business. We expect to continue to expand and diversify to serve the major industrial
SMART SAND, INC.
MANAGEMENT’S DISCUSSION AND ANALYSIS
OF FINANCIAL CONDITION AND RESULTS OF OPERATIONS
(UNAUDITED)
markets throughout North America, including glass, foundry, building products, filtration, geothermal, renewables, ceramics, turf & landscape, retail, recreation and more in 2025.
Costs of Conducting Our Business
The principal direct costs involved in operating our business are freight charges, which include transportation, railcar rental and transload expenses, and production costs, which consists of labor, maintenance, utilities, equipment, excavation and depreciation of our property, plant and equipment. We incur labor costs associated with employees at our processing facilities which represent the most significant cost of converting sand to finished products. Our sand processing and logistics facilities undergo maintenance to minimize unscheduled downtime and ensure the ongoing quality of our sand and ability to meet customer demands. We incur utility costs in connection with the operation of our processing and logistics facilities, primarily electricity and natural gas, which are both susceptible to market fluctuations. We lease equipment in many areas of our operations including some of our mining and hauling equipment and logistics services. Excavation costs relate to the blasting and excavation of sand and other materials in order to retrieve desirable sand products. In addition, other costs including processing costs, overhead allocation, depreciation and depletion are capitalized as a component of inventory and are reflected in cost of goods sold when inventory is sold.
Overall Trends and Outlook
Demand Trends
Demand for frac sand has continued to moderately increase during 2024. According to Spears and Associates, Inc. (“Spears”), North America proppant demand increased by 7% in 2024 compared to 2023, mirroring an improving hydraulic fracturing market. The primary drivers for the increase in frac sand usage are increased lateral well lengths and increased volume of sand per linear foot of lateral well. The trend is expected to increase moderately in 2025 as well. Additionally, demand may increase over the next five years, which may be driven by increased export capacity of LNG and potential increased power demand for data centers.
Supply Trends
Supplies of high-quality Northern White frac sand are limited to select areas, predominantly in western Wisconsin and limited areas of Minnesota and Illinois. We believe the ability to obtain large contiguous reserves in these areas is a key constraint and can be an important supply consideration when assessing the economic viability of a potential frac sand processing facility. Further constraining the supply and throughput of Northern White frac sand is that not all of the large reserve mines have on-site excavation, processing or logistics capabilities, which impact the long-term competitiveness of these mines due to lower efficiency and higher cost structures. Historically, much of the capital investment in Northern White frac sand mines was used for the development of coarser deposits in western Wisconsin, which is inconsistent with the increasing demand for finer mesh frac sand in recent years. As such, we’ve seen competitors in the Northern White frac sand market reduce their capacity by shuttering or idling operations due to the shift to finer sands in hydraulic fracturing of oil and natural gas wells and due to lower cost regional sand sources that has eroded the ongoing economic viability of mines with coarser reserve deposits and inefficient mining and logistics facilities.
Management’s Outlook
In 2021, we started several strategic initiatives to take advantage of the market downturn to set ourselves up for success in future years. These initiatives primarily consisted of growing our asset base and product offerings. We have increased the size of our terminal network by opening our Waynesburg, Pennsylvania transloading terminal in 2022, expanding it in 2023, and adding two transloading terminals at Minerva, Ohio and Dennison, Ohio. With these three terminals in the Appalachian Basin, we believe we are one of the premier providers of low-cost high-quality Northern White Sand into this key market. The Ohio terminals became operational in 2024 and have allowed us to expand our product and logistics offerings in the Utica Formation. We also increased our production capacity with our acquisition of the Blair, Wisconsin mine and processing facility in 2022. This facility, which has approximately 2.9 million tons of total annual sand processing capacity, contains an onsite, unit train capable rail terminal with access to the Class 1 Canadian National Railway and became operational in the second quarter of 2023. With this acquisition, we now have direct access to four Class I rail lines and the ability to access all Class 1 rail lines within the United States and Canada.
SMART SAND, INC.
MANAGEMENT’S DISCUSSION AND ANALYSIS
OF FINANCIAL CONDITION AND RESULTS OF OPERATIONS
(UNAUDITED)
In the fourth quarter of 2021, we expanded our product line to begin offering IPS. Since then, we have worked to expand and diversify our customer base to serve the major industrial markets throughout North America, including glass, foundry, building products, filtration, geothermal, renewables, ceramics, turf & landscape, retail and recreation. Our IPS business has continued to grow after we completed the installation of blending and cooling assets in 2023 and we believe will continue to expand this business in 2025 and beyond.
We expect the demand for frac sand in 2025 to continue to be at healthy levels. We believe higher demand driven by increased laterals and higher amounts of sand per well completed should lead to sand prices remaining relatively stable in 2025.
Beginning in 2021 and continuing throughout 2024, exploration and production companies have been more disciplined in their drilling activity which has led to less volatility in supply and demand imbalance which has stabilized oil and natural gas prices at higher levels. Demand for both frac sand and our SmartSystems is influenced by the number of oil and natural gas wells being drilled and completed, as well as the types of wells that are completed and the volume of sand being used in each well. We expect the Bakken and Marcellus formations as well as the Montney and Douvernay shale basins in Canada to continue to be key markets for us and we look to expand our market share in these key areas through our current strategic initiatives.
The industry trends continue towards drilling and completing wells with longer laterals and more frac stages per lateral foot drilled. This trend is leading to higher volumes of sand per well and the need for oil and natural gas exploration companies to manage larger volumes of sand at the wellsite. We believe these trends support continued demand for frac sand and increased demand for SmartSystems as customers look to create synergies in the time and cost of managing their sand needs at the wellsite.
We generally expect the price of frac sand to fluctuate based on the level of drilling and completions activity for oil and natural gas as well as overall supply for frac sand relative to demand. We believe the supply of sand to be stabilizing or contracting as consolidation in the industry continues. The willingness of exploration and production companies to engage in new drilling is determined by a number of factors, the most important of which are the prevailing and projected prices of oil and natural gas, the cost to drill, complete and operate a well, the availability and cost of capital and environmental and government regulations, as well as their ability to source sand delivered to the wellsite. We generally expect the level of drilling to correlate with long-term trends in commodity prices. Similarly, oil and natural gas production levels nationally and regionally generally tend to correlate with drilling activity.
SMART SAND, INC.
MANAGEMENT’S DISCUSSION AND ANALYSIS
OF FINANCIAL CONDITION AND RESULTS OF OPERATIONS
(UNAUDITED)
GAAP Results of Operations
Year Ended December 31, 2024 compared to the Year Ended December 31, 2023: | | | | | | | | | | | | | | | | | | | | | | | | | | |
| | | Year Ended December 31, | | Change |
| | | 2024 | | 2023 | | Dollars | | Percentage |
| | | (in thousands, except percentage change) |
| Revenues: | | | | | | | | |
| Sand revenue | | $ | 303,590 | | | $ | 287,479 | | | $ | 16,111 | | | 6 | % |
| SmartSystems revenue | | 7,782 | | | 8,494 | | | (712) | | | (8) | % |
| Total revenue | | 311,372 | | | 295,973 | | | 15,399 | | | 5 | % |
| Cost of goods sold: | | | | | | | | |
| Sand cost of goods sold | | 258,812 | | | 247,181 | | | 11,631 | | | 5 | % |
| SmartSystems cost of goods sold | | 7,737 | | | 7,237 | | | 500 | | | 7 | % |
| Total cost of goods sold | | 266,549 | | | 254,418 | | | 12,131 | | | 5 | % |
| Gross profit | | 44,823 | | | 41,555 | | | 3,268 | | | 8 | % |
| Operating expenses: | | | | | | | | |
| Selling, general and administrative | | 38,161 | | | 38,722 | | | (561) | | | (1) | % |
| Depreciation and amortization | | 2,596 | | | 2,535 | | | 61 | | | 2 | % |
| Loss (gain) on disposal of fixed assets, net | | 1,062 | | | 1,802 | | | (740) | | | (41) | % |
| Total operating expenses | | 41,819 | | | 43,059 | | | (1,240) | | | (3) | % |
| Operating income (loss) | | 3,004 | | | (1,504) | | | 4,508 | | | 300 | % |
| Other (expenses) income: | | | | | | | | |
| Interest expense, net | | (1,769) | | | (1,272) | | | (497) | | | 39 | % |
| Loss on extinguishment of debt | | (1,341) | | | — | | | (1,341) | | | Not meaningful |
| Other income | | 358 | | | 524 | | | (166) | | | (32) | % |
| Total other (expenses) income, net | | (2,752) | | | (748) | | | (2,004) | | | 268 | % |
| Income (loss) before income tax benefit | | 252 | | | (2,252) | | | 2,504 | | | 111 | % |
| Income tax expense (benefit) | | (2,740) | | | (6,901) | | | 4,161 | | | 60 | % |
| Net income (loss) | | $ | 2,992 | | | $ | 4,649 | | | $ | (1,657) | | | (36) | % |
Revenue
Total revenue was $311.4 million for the year ended December 31, 2024 compared to $296.0 million for the year ended December 31, 2023.
Sand revenue for the year ended December 31, 2024 increased by 6% to $303.6 million generated from 5.3 million tons of sand sold, as compared to sand revenue for the year ended December 31, 2023 of $287.5 million generated from 4.5 million tons of sand. The increase in sand revenue was primarily due to an increase in sand volumes by 17% from 2023 to 2024. Sand prices declined during the second half of the year, which partially offset the increase in sales volumes.
SmartSystems revenue was $7.8 million for the year ended December 31, 2024, a decline from $8.5 million for the year ended December 31, 2023. The decline was due to lower overall utilization of our SmartSystems fleet in 2024.
SMART SAND, INC.
MANAGEMENT’S DISCUSSION AND ANALYSIS
OF FINANCIAL CONDITION AND RESULTS OF OPERATIONS
(UNAUDITED)
Cost of Goods Sold
Sand cost of goods sold was $258.8 million and $247.2 million, for the years ended December 31, 2024 and December 31, 2023, respectively. The increase was primarily due to higher volumes sold and the related increase in production costs and freight costs that accompany higher volumes.
SmartSystems cost of goods sold was relatively consistent for the year ended December 31, 2024 compared to the year ended December 31, 2023.
Gross Profit
Gross profit was $44.8 million and $41.6 million for the years ended December 31, 2024 and December 31, 2023, respectively. The increase in gross profit for the year ended December 31, 2024 was primarily due to higher sand sales volumes which was partially offset by lower average sale prices of our sand relative to the cost to produce and deliver products to our customers.
Operating Expenses
Operating expenses were $41.8 million and $43.1 million for the years ended December 31, 2024 and December 31, 2023, respectively. Overall, selling, general and administrative costs declined as management continued to focus on cost-cutting measures. Royalties increased due to higher volumes and bank and legal fees were higher as we completed debt refinancing in 2024. Wages, maintenance and insurance costs declined, driven by management efforts to reduce costs. The loss on disposal of assets of $1.1 million for the year ended December 31, 2024 was primarily related to closing our Saskatoon, Canada manufacturing facility and relocating it to the United States. The loss on the disposal of assets of $1.8 million for the year ended December 31, 2023 was primarily related to the reconfiguration of one of our wet plants to increase the efficiency of its operations.
Other Expense / Income
We incurred $1.8 million and $1.3 million of net interest expense for the years ended December 31, 2024 and 2023, respectively. We recorded a $1.3 million loss on extinguishment of debt for the year ended December 31, 2024 related to the payoff of the Oakdale facility, which was refinanced with the VFI Equipment Financing.
Income Tax Benefit
Income tax benefit was $2.7 million for the year ended December 31, 2024 compared to income tax benefit of $6.9 million for the year ended December 31, 2023. For the years ended December 31, 2024 and 2023, our effective tax rate was approximately (1087.3)% and 306.4%, respectively. The computation of the effective tax rate for the years ended December 31, 2024 and 2023 included modifications from the statutory rate such as income tax credits, depletion deductions, and state taxes, NOL carrybacks and carryforwards, among other items.
Net Income (Loss)
Net income was $3.0 million for year ended December 31, 2024 compared to net income of $4.6 million for the year ended December 31, 2023. The change in net income is attributable to an increase in operating income of $4.5 million, which was attributable to an increase in total sand volumes sold and lower operating expenses, partially offset by smaller benefit from income taxes recorded in the current period.
SMART SAND, INC.
MANAGEMENT’S DISCUSSION AND ANALYSIS
OF FINANCIAL CONDITION AND RESULTS OF OPERATIONS
(UNAUDITED)
Year Ended December 31, 2023 Compared to the Year Ended December 31, 2022: | | | | | | | | | | | | | | | | | | | | | | | |
| | Year Ended December 31, | | Change |
| | 2023 | | 2022 | | Dollars | | Percentage |
| | (in thousands, except percentage change) |
| Revenues: | | | | | | | |
| Sand revenue | $ | 287,479 | | | $ | 249,324 | | | $ | 38,155 | | | 15 | % |
| SmartSystems revenue | 8,494 | | | 6,416 | | | 2,078 | | | 32 | % |
| Total revenue | 295,973 | | | 255,740 | | | 40,233 | | | 16 | % |
| Cost of goods sold: | | | | | | | |
| Sand cost of goods sold | 247,181 | | | 220,006 | | | 27,175 | | | 12 | % |
| SmartSystems cost of goods sold | 7,237 | | | 6,143 | | | 1,094 | | | 18 | % |
| Total cost of goods sold | 254,418 | | | 226,149 | | | 28,269 | | | 13 | % |
| Gross profit | 41,555 | | | 29,591 | | | 11,964 | | | 40 | % |
| Operating expenses: | | | | | | | |
| Selling, general and administrative | 38,722 | | | 30,769 | | | 7,953 | | | 26 | % |
| Depreciation and amortization | 2,535 | | | 2,244 | | | 291 | | | 13 | % |
| Loss (gain) on disposal of fixed assets, net | 1,802 | | | (294) | | | 2,096 | | | (713) | % |
| | | | | | | |
| | | | | | | |
| | | | | | | |
| Total operating expenses | 43,059 | | | 32,719 | | | 10,340 | | | 32 | % |
| Operating income (loss) | (1,504) | | | (3,128) | | | 1,624 | | | (52) | % |
| Other (expenses) income: | | | | | | | |
| | | | | | | |
| Interest expense, net | (1,272) | | | (1,608) | | | 336 | | | (21) | % |
| Other income | 524 | | | 828 | | | (304) | | | (37) | % |
| Total other (expenses) income, net | (748) | | | (780) | | | 32 | | | (4) | % |
| Income (loss) before income tax benefit | (2,252) | | | (3,908) | | | 1,656 | | | (42) | % |
| Income tax expense (benefit) | (6,901) | | | (3,205) | | | (3,696) | | | 115 | % |
| Net income (loss) | $ | 4,649 | | | $ | (703) | | | $ | 5,352 | | | (761) | % |
Revenue
Total revenue was $296.0 million for the year ended December 31, 2023 compared to $255.7 million for the year ended December 31, 2022.
Sand revenue for the year ended December 31, 2023 was $287.5 million on approximately 4.5 million tons of sand compared to sand revenue for the year ended December 31, 2022 of $249.3 million on approximately 4.3 million tons of sand. The increase in revenue for 2023 was a result of higher total volumes sold and higher sand prices. Sand volumes increased by 4% from 2022 to 2023. Additionally sand prices increased in 2023 due to a shift in supply and demand, which we believe was driven by increased prices in oil and natural gas leading to increased completion activity of new oil and natural gas wells.
SmartSystems revenue was $8.5 million for the year ended December 31, 2023, which was an increase from $6.4 million for the year ended December 31, 2022, primarily attributable to higher overall utilization of our SmartSystems fleet in 2023.
SMART SAND, INC.
MANAGEMENT’S DISCUSSION AND ANALYSIS
OF FINANCIAL CONDITION AND RESULTS OF OPERATIONS
(UNAUDITED)
Cost of Goods Sold
Sand cost of goods sold was $247.2 million and $220.0 million, for the years ended December 31, 2023 and December 31, 2022, respectively. The increase was primarily due to higher volumes sold and the related increase in production costs and freight costs that accompany higher volumes.
SmartSystems cost of goods sold was $7.2 million and $6.1 million, for the years ended December 31, 2023 and December 31, 2022, respectively. The increase in costs was primarily attributable to higher overall utilization of our SmartSystems fleet in 2023.
Gross Profit
Gross profit was $41.6 million and $29.6 million for the years ended December 31, 2023 and 2022, respectively. The increase in gross profit for the year ended December 31, 2023 was primarily due to higher sales volumes and higher average sale prices of our sand relative to the cost to produce and deliver products to our customers.
Operating Expenses
Operating expenses were $43.1 million and $32.7 million for the years ended December 31, 2023 and December 31, 2022, respectively. Selling, general and administrative expenses increased to $38.7 million for the year ended December 31, 2023, as compared to $30.8 million for the year ended December 31, 2022, primarily due to increased staffing to support our expanded operations, higher maintenance costs, royalty payments, insurance, and other costs primarily related to the addition of our Blair facility. In 2023, we recorded a $1.8 million net loss on disposal of fixed assets, which was primarily due to a reconfiguration of one of our wet plants to increase the efficiency of its operations.
Interest Expense
We incurred $1.3 million and $1.6 million of net interest expense for the years ended December 31, 2023 and 2022, respectively.
Income Tax Benefit
Income tax benefit was $6.9 million for the year ended December 31, 2023 compared to income tax benefit of $3.2 million for the year ended December 31, 2022. For the years ended December 31, 2023 and 2022, our effective tax rate was approximately 306.4% and 82.0%, respectively, based on the annual effective tax rate net of discrete federal and state taxes. The computation of the effective tax rate for the year ended December 31, 2023 and 2022 included modifications from the statutory rate such as income tax credits, depletion deductions, NOL carrybacks and carryforwards and state income taxes, among other items.
Net Income
Net Income was $4.6 million for year ended December 31, 2023 compared to net loss of $(0.7) million for the year ended December 31, 2022. The increase in net income is attributable to an increase in total volumes sold and higher average sale prices of our sand, which was partially offset by higher operating costs due to the opening of the Blair facility. Additionally, a larger benefit from income taxes was recorded in the current period.
Non-GAAP Financial Measures
Contribution margin, EBITDA, Adjusted EBITDA and free cash flow are not financial measures presented in accordance with GAAP. We believe that the presentation of these non-GAAP financial measures will provide useful information to investors in assessing our financial condition and results of operations. Gross profit is the GAAP measure most directly comparable to contribution margin, net income is the GAAP measure most directly comparable to EBITDA and Adjusted EBITDA and net cash provided by operating activities is the GAAP measure most directly comparable to free cash flow. Our non-GAAP financial measures should not be considered as alternatives to the most directly comparable GAAP financial measures. Each of these non-GAAP financial measures has important limitations as analytical tools because they exclude some but not all items that affect the most directly comparable GAAP financial measures. You should not consider contribution margin, EBITDA, Adjusted EBITDA or free cash flow in isolation or as substitutes for an analysis of our results as reported
SMART SAND, INC.
MANAGEMENT’S DISCUSSION AND ANALYSIS
OF FINANCIAL CONDITION AND RESULTS OF OPERATIONS
(UNAUDITED)
under GAAP. Because contribution margin, EBITDA, Adjusted EBITDA and free cash flow may be defined differently by other companies in our industry, our definitions of these non-GAAP financial measures may not be comparable to similarly titled measures of other companies, thereby diminishing their utility.
Contribution Margin
We use contribution margin, which we define as total revenues less costs of goods sold excluding depreciation, depletion and accretion of asset retirement obligations, to measure our financial and operating performance. Contribution margin excludes other operating expenses and income, including costs not directly associated with the operations of our business such as accounting, human resources, information technology, legal, sales and other administrative activities.
Gross profit is the GAAP measure most directly comparable to contribution margin. Contribution margin should not be considered an alternative to gross profit presented in accordance with GAAP. Because contribution margin may be defined differently by other companies in our industry, our definition of contribution margin may not be comparable to similarly titled measures of other companies, thereby diminishing its utility. The following table presents a reconciliation of contribution margin to gross profit. | | | | | | | | | | | | | | | | | |
| | Year Ended December 31, |
| | 2024 | | 2023 | | 2022 |
| (in thousands) |
| Revenue | $ | 311,372 | | | $ | 295,973 | | | $ | 255,740 | |
| Cost of goods sold | 266,549 | | | 254,418 | | | 226,149 | |
| Gross profit | 44,823 | | | 41,555 | | | 29,591 | |
| Depreciation, depletion, and accretion of asset retirement obligations included in cost of goods sold | 26,861 | | | 25,469 | | | 25,038 | |
| Contribution margin | $ | 71,684 | | | $ | 67,024 | | | $ | 54,629 | |
| Contribution margin per ton | $ | 13.62 | | | $ | 14.85 | | | $ | 12.61 | |
| Total tons sold | 5,263 | | | 4,514 | | | 4,333 | |
Contribution margin was $71.7 million, or $13.62 per ton sold, for the year ended December 31, 2024 compared to $67.0 million, or $14.85 per ton sold, for the year ended December 31, 2023. The increase in overall contribution margin for the year ended December 31, 2024, as compared to the prior year, was primarily due to higher sales volumes, which was partially offset by lower average sale prices per ton, which also caused the decline in contribution margin per ton.
Contribution margin was $67.0 million, or $14.85 per ton sold, for the year ended December 31, 2023 compared to $54.6 million, or $12.61 per ton sold, for the year ended December 31, 2022. The increase in overall contribution margin and contribution margin per ton sold for the year ended December 31, 2023, as compared to the prior year, was primarily due to higher sales volumes and higher average sale prices, production cost savings, partially offset by higher freight costs.
EBITDA and Adjusted EBITDA
We define EBITDA as net income, plus: (i) depreciation, depletion and amortization expense; (ii) income tax expense (benefit) and other results of operations based taxes; (iii) interest expense. We define Adjusted EBITDA as EBITDA, plus: (i) gain or loss on sale of fixed assets or discontinued operations; (ii) integration and transition costs associated with specified transactions; (iii) equity compensation; (iv) acquisition and development costs; (v) non-recurring cash charges related to restructuring, retention and other similar actions; (vi) earn-out, contingent consideration obligations and other acquisition and development costs; and (vii) non-cash charges and unusual or non-recurring charges. Adjusted EBITDA is used as a supplemental financial measure by management and by external users of our financial statements, such as investors and commercial banks, to assess:
•the financial performance of our assets without regard to the impact of financing methods, capital structure or historical cost basis of our assets;
SMART SAND, INC.
MANAGEMENT’S DISCUSSION AND ANALYSIS
OF FINANCIAL CONDITION AND RESULTS OF OPERATIONS
(UNAUDITED)
•the viability of capital expenditure projects and the overall rates of return on alternative investment opportunities;
•our ability to incur and service debt and fund capital expenditures;
•our operating performance as compared to those of other companies in our industry without regard to the impact of financing methods or capital structure; and
•our debt covenant compliance, as Adjusted EBITDA is a key component of critical covenants to the ABL Credit Facility.
We believe that our presentation of EBITDA and Adjusted EBITDA will provide useful information to investors in assessing our financial condition and results of operations. Net income is the GAAP measure most directly comparable to EBITDA and Adjusted EBITDA. EBITDA and Adjusted EBITDA should not be considered alternatives to net income presented in accordance with GAAP. Because EBITDA and Adjusted EBITDA may be defined differently by other companies in our industry, our definitions of EBITDA and Adjusted EBITDA may not be comparable to similarly titled measures of other companies, thereby diminishing their utility. The following table presents a reconciliation of EBITDA and Adjusted EBITDA to net income for each of the periods indicated. | | | | | | | | | | | | | | | | | |
| | Year Ended December 31, |
| | 2024 | | 2023 | | 2022 |
| | (in thousands) |
| Net income (loss) | $ | 2,992 | | | $ | 4,649 | | | $ | (703) | |
| Depreciation, depletion and amortization | 28,735 | | | 27,363 | | | 26,521 | |
| Income tax benefit and other taxes | (2,740) | | | (6,901) | | | (3,205) | |
| Interest expense | 1,838 | | | 1,532 | | | 1,661 | |
| EBITDA | $ | 30,825 | | | $ | 26,643 | | | $ | 24,274 | |
| Net loss (gain) on sale of fixed assets | 1,062 | | | 1,802 | | | (294) | |
| Equity compensation | 2,855 | | | 3,391 | | | 2,729 | |
| Royalty stock issuance | — | | | — | | | 639 | |
Acquisition and development costs (1) | 325 | | | 545 | | | 675 | |
| Bank and legal costs related to financing not closed | 1,294 | | | — | | | — | |
| Cash charges related to restructuring and retention | 149 | | | 32 | | | 137 | |
| Accretion of asset retirement obligations | 996 | | | 904 | | | 758 | |
| Loss on extinguishment of debt | 1,341 | | | — | | | — | |
| Adjusted EBITDA | $ | 38,847 | | | $ | 33,317 | | | $ | 28,918 | |
(1) Represents costs incurred related to the business combinations and current development project activities. The year ended December 31, 2024 includes $308 related to a disposal from the Eagle Materials acquisition. The year ended December 31, 2023 includes $271 of costs related to the asst acquisition of the Blair facility and $274 related to the Minerva, Ohio terminal.
_________________________
Adjusted EBITDA was $38.8 million for the year ended December 31, 2024 compared to $33.3 million for the year ended December 31, 2023. The increase in Adjusted EBITDA for the year ended December 31, 2024, as compared to the prior year, was primarily due to higher sales volumes and production costs savings, partially offset by declining average selling prices in the second half of 2024.
Adjusted EBITDA was $33.3 million for the year ended December 31, 2023 compared to $28.9 million for the year ended December 31, 2022. The increase in Adjusted EBITDA for the year ended December 31, 2023, as compared to the prior year, was primarily due to higher sales volumes and production costs savings, partially offset by higher freight costs.
SMART SAND, INC.
MANAGEMENT’S DISCUSSION AND ANALYSIS
OF FINANCIAL CONDITION AND RESULTS OF OPERATIONS
(UNAUDITED)
Free Cash Flow
Free cash flow, which we define as net cash provided by operating activities less purchases of property, plant and equipment, is used as a supplemental financial measure by our management and by external users of our financial statements, such as investors and commercial banks, to measure the liquidity of our business.
Net cash provided by operating activities is the GAAP measure most directly comparable to free cash flows. Free cash flows should not be considered an alternative to net cash provided by operating activities presented in accordance with GAAP. Because free cash flows may be defined differently by other companies in our industry, our definition of free cash flows may not be comparable to similarly titled measures of other companies, thereby diminishing its utility. The following table presents a reconciliation of free cash flows to net cash provided by operating activities. | | | | | | | | | | | | | | | | | |
| Year Ended December 31, |
| 2024 | | 2023 | | 2022 |
| (in thousands) |
| Net cash provided by operating activities | $ | 17,864 | | | $ | 30,991 | | | $ | 5,420 | |
| Acquisition of Blair facility | — | | | — | | | (6,547) | |
| Purchases of property, plant and equipment | (7,010) | | | (23,031) | | | (12,731) | |
| Free cash flow | $ | 10,854 | | | $ | 7,960 | | | $ | (13,858) | |
Free cash flow was $10.9 million for the year ended December 31, 2024. Net cash provided by operating activities decreased to $17.9 million in 2024, compared to $31.0 million in 2023, primarily due to working capital pressure as a result of higher sales volumes in the fourth quarter of 2024. Our accounts receivables convert to cash slower than our payables related to sand shipments, which results in lower free cash flows in months immediately following increasing sales activity. Capital expenditures for the year ended December 31, 2024 were $7.0 million compared to $23.0 million for the year ended December 31, 2023, primarily due to less growth-related capital spent in 2024 and management’s continued focus on managing costs.
Free cash flow was $8.0 million for the year ended December 31, 2023. Net cash provided by operating activities increased to $31.0 million in 2023, compared to $5.4 million in 2022, primarily due to higher cash generated from increased sales volumes and higher sales prices. In 2022, net cash provided by operating activities was lower primarily due to an increase in working capital requirements early in the year to support a significant increase in sales volumes. Capital expenditures for the year ended December 31, 2023 were $23.0 million compared to $12.7 million for the year ended December 31, 2022.
Liquidity and Capital Resources
In September 2024 we refinanced the $20.0 million Former ABL Credit Facility to the new $30.0 million FCB ABL Credit Facility. Our primary sources of liquidity are cash flow generated from operations, availability under the FCB ABL Credit Facility and other equipment financing sources. As of December 31, 2024, cash on hand was $1.6 million and we had $30.0 million in undrawn availability under the ABL Credit Facility.
Based on our balance sheet, cash flows, current market conditions, and information available to us at this time, we believe that we have sufficient liquidity and other available capital resources, to meet our cash needs for the next twelve months, including continued investment in efficiency projects at our Oakdale, Blair and Ottawa facilities, as well as expansion and customization of our newly acquired Ohio terminals.
Material Cash Requirements
Dividends and Share Repurchase Program
On October 3, 2024, our board of directors declared a special dividend of $0.10 per share of common stock, which was paid on October 28, 2024 to stockholders of record at the close of business on October 15, 2024. The initial dividend payment was approximately $3.9 million.
SMART SAND, INC.
MANAGEMENT’S DISCUSSION AND ANALYSIS
OF FINANCIAL CONDITION AND RESULTS OF OPERATIONS
(UNAUDITED)
On October 3, 2024, our board of directors also approved the eighteen-month Repurchase Program. Pursuant to the Repurchase Program, we may repurchase up to $10.0 million of our ordinary shares from time to time, in amounts, at prices and at such times as management deems appropriate, subject to market conditions and other considerations. Management may make repurchases in the open market, privately negotiated transactions, accelerated repurchase programs or structured share repurchase programs.
The Repurchase Program will be conducted in compliance with applicable legal requirements and shall be subject to market conditions and other factors. The Repurchase Program does not obligate management to acquire any particular amount of ordinary shares and the Repurchase Program may be modified or suspended at any time.
Capital Requirements
We expect 2025 capital expenditures, excluding any acquisitions, to be between $13.0 million and $17.0 million, consisting primarily of capital to open new mining areas for development, efficiency projects at Oakdale, Blair and Ottawa facilities, expansion and customization of our newly acquired Ohio terminals and potential investment in one or more new terminals. We expect to fund these capital expenditures with existing cash, cash generated from operations, borrowings under the FCB ABL Credit Facility or other financing sources, such as equipment finance providers.
Indebtedness
We have two primary debt facilities including the VFI Equipment Financing and our FCB ABL Credit Facility. Our VFI Equipment Financing is secured by the majority of our SmartSystems equipment. The outstanding balance under the VFI Equipment Financing as of December 31, 2024 was $8.6 million. The VFI facility amortizes to one dollar in 2028. Minimum cash payments on this facility in 2025 are $2.9 million. There were no borrowings outstanding on our FCB ABL Credit Facility as of December 31, 2024.
Operating Leases
We use leases primarily to procure certain office space, railcars and heavy equipment as part of our operations. The majority of our lease payments are fixed and determinable. Our operating lease liabilities as of December 31, 2024 were $24.5 million. Minimum cash payments on operating leases in 2025 are $11.4 million.
Mineral Rights Property
The Company is obligated under certain contracts for minimum payments for the right to use land for extractive activities. The annual minimum payments under these contracts is approximately $2.5 million per year for the next 12 years.
Off-Balance Sheet Arrangements
We had $19.7 million and $18.9 million of outstanding performance bonds as of each of the years ended December 31, 2024 and 2023, respectively. These performance bonds assure our performance under our reclamation plan, maintenance and restoration of public roadways.
Environmental Matters
We are subject to various federal, state and local laws and regulations governing, among other things, hazardous materials, air and water emissions, environmental contamination and reclamation and the protection of the environment and natural resources. We have made, and expect to make in the future, expenditures to comply with such laws and regulations, but cannot predict the full amount of such future expenditures.
Seasonality
Our business is affected to some extent by seasonal fluctuations in weather that impact the production levels for a portion of our wet sand processing capacity. While our dry plants are able to process finished product volumes evenly throughout the year, our excavation and our wet sand processing activities have historically been limited to primarily non-winter months. As a
SMART SAND, INC.
MANAGEMENT’S DISCUSSION AND ANALYSIS
OF FINANCIAL CONDITION AND RESULTS OF OPERATIONS
(UNAUDITED)
consequence, we have experienced lower cash operating costs in the first and fourth quarter of each calendar year, and higher cash operating costs in the second and third quarter of each calendar year when we overproduce wet sand to meet dry sand demand in the winter months. These higher cash operating costs are capitalized into inventory and expensed when these tons are sold, which can lead to us having higher overall cost of production in the first and fourth quarters of each calendar year as we expense inventory costs that were previously capitalized. We have indoor wet processing facilities at our Oakdale and Ottawa plant locations that allow us to produce wet sand inventory year-round to support a portion of our dry sand processing capacity, which may reduce certain of the effects of this seasonality. We may also sell frac sand for use in oil and natural gas producing basins where severe weather conditions may curtail drilling activities and, as a result, our sales volumes to those areas may be reduced during such severe weather periods. Additionally, over the last several years, exploration and production companies have become more disciplined in their spending patterns relative to their budgets, which has led to some of our customers completing their budgeted spending earlier in the year. This spending discipline could potentially lead to a slowdown in activity by our customers and lower sand demand in the fourth quarter of the year.
Customer Concentration
For the year ended December 31, 2024, Equitable Gas Corporation, Encino Energy and Liberty Oilfield Services accounted for 31.9%, 13.8% and 10.2% respectively, of total revenue. For the year ended December 31, 2023, Equitable Gas Corporation and Liberty Oilfield Services accounted for 30.2% and 11.4%, respectively, of total revenue. For the year ended December 31, 2022, Equitable Gas Corporation, Halliburton Energy Services, Encino Energy, and Liberty Oilfield Services accounted for 22.3%, 15.4%, 14.4% and 13.7% respectively, of total revenue.
Critical Accounting Estimates
The discussion and analysis of our financial condition and results of operations is based on our consolidated financial statements, which have been prepared in accordance with GAAP. The preparation of these financial statements requires us to make estimates and assumptions that affect the reported amounts of assets and liabilities and the disclosure of contingent assets and liabilities at the dates of the financial statements and the reported revenues and expenses during the reporting periods. We evaluate these estimates and assumptions on an ongoing basis and base our estimates on historical experience, current conditions and various other assumptions that we believe to be reasonable under the circumstances. The results of these estimates form the basis for making judgments about the carrying values of assets and liabilities as well as identifying and assessing the accounting treatment with respect to commitments and contingencies. Our actual results may materially differ from these estimates.
Listed below are the accounting estimates that we believe are critical to our financial statements due to the degree of uncertainty regarding the estimates or assumptions involved.
Asset Retirement Obligation
We estimate the future cost of dismantling, restoring and reclaiming operating excavation sites and related facilities in accordance with federal, state and local regulatory requirements and recognize reclamation obligations when extraction occurs and record them as liabilities at estimated fair value. In addition, a corresponding increase in the carrying amount of the related asset is recorded and depreciated over such asset’s useful life or the estimated number of years of extraction. The reclamation liability is accreted to expense over the estimated productive life of the related asset and is subject to adjustments to reflect changes in value resulting from the passage of time and revisions to the estimates of either the timing or amount of the reclamation costs. If the asset retirement obligation is settled for more or less than the carrying amount of the liability, a loss or gain will be recognized, respectively. The asset retirement obligation estimate is calculated by estimating the cost to reclaim an area as of the estimation date and inflating that cost to an estimated reclamation date, then discounting that inflated cost back to the reporting period date. Changes in the current estimate or the interest rates used for inflation or discount can have a material effect on the liability reported. In addition, due to the nature or our business, changes in mine planning can result in changes to our estimated future reclamation dates.
SMART SAND, INC.
MANAGEMENT’S DISCUSSION AND ANALYSIS
OF FINANCIAL CONDITION AND RESULTS OF OPERATIONS
(UNAUDITED)
Inventory Valuation
Sand inventory is stated at the lower of cost or net realizable value using the average cost method. Costs applied to inventory include direct excavation costs, processing costs, overhead allocation, depreciation and depletion. Reserves are estimated for moisture loss and waste during production. Stockpile tonnages are calculated by measuring the number of tons added and removed from the stockpile. Tonnages are verified periodically by a survey. Costs are calculated on a per ton basis and are applied to the stockpiles based on the number of tons in the stockpile. There was no writedown of inventory value based on the lower of cost or net realizable value calculation.
Impairment of Long-Lived Assets
We periodically evaluate whether current events or circumstances indicate that the carrying value of our long-lived assets may not be recoverable. If circumstances indicate that the carrying value may not be recoverable, we estimate future undiscounted net cash flows, estimated future sales prices (considering historical and current prices, price trends and related factors) and anticipated operating costs and capital expenditures. If the carrying value of our long-lived assets is less than the undiscounted cash flows, the assets are measured at fair value and an impairment is recorded if that fair value is less than the carrying value. During the year ended December 31, 2024, we did not record any impairment charges based on the analysis of our long-lived assets.
Income Taxes
Under the balance sheet approach to provide for income taxes, we recognize deferred tax assets and liabilities for the expected future tax consequences of net operating loss carryforwards and temporary differences between the carrying amounts and the tax bases of assets and liabilities. In assessing the realizability of deferred tax assets, we consider whether it is more likely than not that some portion or all of the deferred tax assets will not be realized. The ultimate realization of deferred tax assets is dependent upon the generation of future taxable income during the period in which those temporary differences become deductible. If we determine it is more likely than not that we will not be able to realize the benefits of the deductible temporary differences, we would record a valuation allowance against the net deferred tax asset.
We recognize uncertain tax positions at the largest amount that, in our judgment, is more-likely-than-not to be required to be recognized upon examination by a taxing authority.
We have recorded a liability of $2.2 million for uncertain tax positions included in deferred tax liabilities, long-term, net on our consolidated balance sheet as of December 31, 2024 and 2023, related to our depletion deduction methodology, and a corresponding increase to the income tax expense on our consolidated statements of operations.
As of December 31, 2024, we determined it is more likely than not that we will not be able to fully realize the benefits of certain existing deductible temporary differences and have recorded a valuation allowance against the deferred tax liabilities, long-term, net on our consolidated balance sheet in the amount of $2.2 million. The valuation allowance as of December 31, 2023 was $0.9 million. The corresponding increase to the income tax benefit on our consolidated statements of operations for the year ended December 31, 2024 was $1.3 million.
ITEM 7A. — QUANTITATIVE AND QUALITATIVE DISCLOSURES ABOUT MARKET RISK
Market risk is the risk of loss arising from adverse changes in market rates and prices. Historically, our risks have been predominantly related to potential changes in the fair value of our long-term debt due to fluctuations in applicable market interest rates. Going forward our market risk exposure generally will be limited to those risks that arise in the normal course of business, as we do not engage in speculative, non-operating transactions, nor do we utilize financial instruments or derivative instruments for trading purposes.
Commodity Price Risk
The market for proppant and proppant storage equipment is indirectly exposed to fluctuations in the prices of crude oil and natural gas to the extent such fluctuations impact drilling and completion activity levels and thus impact the activity levels of our customers in the oilfield services and exploration and production industries. Additionally the price fluctuations of natural gas, electricity, as well as diesel prices impact the overall cost of conducting our business. At times, we hedge a portion of our estimated indirect exposure to commodity price risk by entering into fixed price contracts for natural gas, propane and electricity.
Interest Rate Risk
The majority of our debt is financed under fixed interest rates. Borrowings under the FCB ABL Credit Facility bear interest at a rate equal to the secured overnight financing rate (“SOFR”) plus a margin of 2.75% or Prime plus a margin of 1.75%. There were no outstanding borrowings under our FCB ABL Credit Facility as of December 31, 2024. We do not believe this represents a material interest rate risk.
Credit Risk
This concentration of counterparties operating in a single industry may increase our overall exposure to credit risk, in that the counterparties may be similarly affected by changes in economic, regulatory or other conditions. If a customer defaults or if any of our contracts expire in accordance with its terms, and we are unable to renew or replace these contracts or the related sales volumes, our gross profit and cash flows may be adversely affected.
Foreign Currency Risk
Our revenues and expenses are primarily in United States dollars; however, certain transactions are transacted in Canada dollars. Thus, revenues, operating expenses, the results of operations, assets and liabilities may be affected to the extent that they are not hedged by the rise and fall of the relative value of the United States dollar to the Canada dollar. During the years ended December 31, 2024, 2023 and 2022, revenue, expenses, assets and liabilities transacted in Canada dollars were immaterial to the results of operations.
ITEM 8. — FINANCIAL STATEMENTS AND SUPPLEMENTARY DATA
The following Consolidated Financial Statements are filed as part of this Annual Report on Form 10-K:
Report of Independent Registered Public Accounting Firm
Board of Directors and Stockholders
Smart Sand, Inc.
Opinion on the financial statements
We have audited the accompanying consolidated balance sheets of Smart Sand, Inc. (a Delaware corporation) and subsidiaries (the “Company”) as of December 31, 2024 and 2023, the related consolidated statements of operations, comprehensive income (loss), changes in stockholders’ equity, and cash flows for each of the three years in the period ended December 31, 2024, and the related notes and financial statement schedule included under Item 15(a) (collectively referred to as the “consolidated financial statements”). In our opinion, the consolidated financial statements present fairly, in all material respects, the financial position of the Company as of December 31, 2024 and 2023, and the results of its operations and its cash flows for each of the three years in the period ended December 31, 2024, in conformity with accounting principles generally accepted in the United States of America.
Basis for opinion
These consolidated financial statements are the responsibility of the Company’s management. Our responsibility is to express an opinion on the Company’s consolidated financial statements based on our audits. We are a public accounting firm registered with the Public Company Accounting Oversight Board (United States) (“PCAOB”) and are required to be independent with respect to the Company in accordance with the U.S. federal securities laws and the applicable rules and regulations of the Securities and Exchange Commission and the PCAOB.
We conducted our audits in accordance with the standards of the PCAOB. Those standards require that we plan and perform the audit to obtain reasonable assurance about whether the financial statements are free of material misstatement, whether due to error or fraud. The Company is not required to have, nor were we engaged to perform, an audit of its internal control over financial reporting. As part of our audits we are required to obtain an understanding of internal control over financial reporting but not for the purpose of expressing an opinion on the effectiveness of the Company’s internal control over financial reporting. Accordingly, we express no such opinion.
Our audits included performing procedures to assess the risks of material misstatement of the financial statements, whether due to error or fraud, and performing procedures that respond to those risks. Such procedures included examining, on a test basis, evidence regarding the amounts and disclosures in the financial statements. Our audits also included evaluating the accounting principles used and significant estimates made by management, as well as evaluating the overall presentation of the financial statements. We believe that our audits provide a reasonable basis for our opinion.
Critical audit matter
Critical audit matters are matters arising from the current period audit of the financial statements that were communicated or required to be communicated to the audit committee and that: (1) relate to accounts or disclosures that are material to the financial statements and (2) involved our especially challenging, subjective, or complex judgments. We determined that there are no critical audit matters.
/s/ GRANT THORNTON LLP
We have served as the Company’s auditor since 2014.
Philadelphia, Pennsylvania
March 3, 2025
SMART SAND, INC.
CONSOLIDATED BALANCE SHEETS | | | | | | | | | | | |
| | December 31, |
| | 2024 | | 2023 |
| | (in thousands of U.S. dollars) |
| Assets | | | |
| Current assets: | | | |
| Cash and cash equivalents | $ | 1,554 | | | $ | 6,072 | |
| Accounts receivable | 40,981 | | | 23,231 | |
| Unbilled receivables | 5,311 | | | 2,561 | |
| Inventory | 25,044 | | | 26,823 | |
| Prepaid expenses and other current assets | 2,635 | | | 3,217 | |
| Total current assets | 75,525 | | | 61,904 | |
| Property, plant and equipment, net | 236,692 | | | 255,092 | |
| Operating lease right-of-use assets | 23,153 | | | 23,265 | |
| Intangible assets, net | 5,084 | | | 5,876 | |
| Other assets | 1,092 | | | 163 | |
| Total assets | $ | 341,546 | | | $ | 346,300 | |
| Liabilities and Stockholders’ Equity | | | |
| Current liabilities: | | | |
| Accounts payable | $ | 16,988 | | | $ | 16,041 | |
| Accrued expenses and other liabilities | 12,561 | | | 11,024 | |
| Deferred revenue | 54 | | | 1,154 | |
| | | |
| Current portion of long-term debt | 3,554 | | | 15,711 | |
| Current portion of operating lease liabilities | 10,053 | | | 10,536 | |
| Total current liabilities | 43,210 | | | 54,466 | |
| | | |
| Long-term debt | 9,130 | | | 3,449 | |
| Long-term operating lease liabilities | 14,486 | | | 14,056 | |
| Deferred tax liabilities, net | 9,316 | | | 12,101 | |
| Asset retirement obligation | 21,292 | | | 19,923 | |
| | | |
| Other non-current liabilities | 302 | | | 38 | |
| Total liabilities | 97,736 | | | 104,033 | |
| Commitments and contingencies (Note 16) | | | |
| Stockholders’ equity | | | |
Common stock, $0.001 par value, 350,000,000 shares authorized; 46,644,853 issued and 39,067,094 outstanding at December 31, 2024; 45,858,022 issued and 38,486,762 outstanding at December 31, 2023 | 39 | | | 39 | |
Treasury stock, at cost, 7,577,759 and 7,371,260 shares at December 31, 2024 and 2023, respectively | (14,671) | | | (14,249) | |
| Additional paid-in capital | 185,263 | | | 181,973 | |
| Retained earnings | 73,239 | | | 74,539 | |
| Accumulated other comprehensive loss | (60) | | | (35) | |
| Total stockholders’ equity | 243,810 | | | 242,267 | |
| Total liabilities and stockholders’ equity | $ | 341,546 | | | $ | 346,300 | |
The accompanying notes are an integral part of these consolidated financial statements.
SMART SAND, INC.
CONSOLIDATED STATEMENTS OF OPERATIONS | | | | | | | | | | | | | | | | | |
| | Year Ended December 31, |
| | 2024 | | 2023 | | 2022 |
| | (in thousands of U.S. dollars, except per share amounts) |
| Revenues: | | | | | |
| Sand revenue | $ | 303,590 | | | $ | 287,479 | | | $ | 249,324 | |
| SmartSystems revenue | 7,782 | | | 8,494 | | | 6,416 | |
| Total revenue | 311,372 | | | 295,973 | | | 255,740 | |
| Cost of goods sold: | | | | | |
| Sand cost of goods sold | 258,812 | | | 247,181 | | | 220,006 | |
| SmartSystems cost of goods sold | 7,737 | | | 7,237 | | | 6,143 | |
| Total cost of goods sold | 266,549 | | | 254,418 | | | 226,149 | |
| Gross profit | 44,823 | | | 41,555 | | | 29,591 | |
| Operating expenses: | | | | | |
| Selling, general and administrative | 38,161 | | | 38,722 | | | 30,769 | |
| Depreciation and amortization | 2,596 | | | 2,535 | | | 2,244 | |
| Loss (gain) on disposal of fixed assets, net | 1,062 | | | 1,802 | | | (294) | |
| Total operating expenses | 41,819 | | | 43,059 | | | 32,719 | |
| Operating income (loss) | 3,004 | | | (1,504) | | | (3,128) | |
| Other (expenses) income: | | | | | |
| Interest expense, net | (1,769) | | | (1,272) | | | (1,608) | |
| Loss on extinguishment of debt | (1,341) | | | — | | | — | |
| Other income | 358 | | | 524 | | | 828 | |
| Total other (expenses) income, net | (2,752) | | | (748) | | | (780) | |
| Income (loss) before income tax benefit | 252 | | | (2,252) | | | (3,908) | |
| Income tax expense (benefit) | (2,740) | | | (6,901) | | | (3,205) | |
| Net income (loss) | $ | 2,992 | | | $ | 4,649 | | | $ | (703) | |
| Net income (loss) per common share: | | | | | |
| Basic | $ | 0.08 | | | $ | 0.12 | | | $ | (0.02) | |
| Diluted | $ | 0.08 | | | $ | 0.12 | | | $ | (0.02) | |
| Weighted-average number of common shares: | | | | | |
| Basic | 38,809 | | | 38,948 | | | 42,408 | |
| Diluted | 39,084 | | | 39,046 | | | 42,408 | |
| | | | | |
| | | | | |
| | | | | |
| | | | | |
| | | | | |
| | | | | |
| | | | | |
| | | | | |
| | | | | |
The accompanying notes are an integral part of these consolidated financial statements.
SMART SAND, INC.
CONSOLIDATED STATEMENTS OF COMPREHENSIVE INCOME (LOSS) | | | | | | | | | | | | | | | | | |
| Year Ended December 31, |
| 2024 | | 2023 | | 2022 |
| (in thousands of U.S. dollars) |
| Net income (loss) | $ | 2,992 | | | $ | 4,649 | | | $ | (703) | |
| Other comprehensive income (loss): | | | | | |
| Foreign currency translation adjustment | (25) | | | (262) | | | (347) | |
| Comprehensive income (loss) | $ | 2,967 | | | $ | 4,387 | | | $ | (1,050) | |
The accompanying notes are an integral part of these consolidated financial statements.
SMART SAND, INC.
CONSOLIDATED STATEMENTS OF CHANGES IN STOCKHOLDERS’ EQUITY
| | | | | | | | | | | | | | | | | | | | | | | | | | | | | | | | | | | | | | | | | | | | | | | |
| | Common Stock | | Treasury Stock | | Additional Paid-In Capital | | Retained
Earnings
| | Accumulated Other Comprehensive Income (Loss) | | Total Stockholders’ Equity |
| | Outstanding Shares | | Par Value | | Shares | | Amount | | | | |
| | (in thousands of U.S. dollars, except share amounts) |
| Balance at December 31, 2021 | 42,012,813 | | | $ | 42 | | | 1,777,001 | | | $ | (4,535) | | | $ | 174,486 | | | $ | 70,593 | | | $ | 574 | | | $ | 241,160 | |
| Foreign currency translation adjustment | — | | | — | | | | | — | | | — | | | — | | | (347) | | | (347) | |
| Acquisition stock issuance | 300,000 | | | — | | | — | | | — | | | 639 | | | — | | | — | | | 639 | |
| Vesting of restricted stock | 974,730 | | | 1 | | | — | | | — | | | — | | | — | | | — | | | 1 | |
| Stock-based compensation | — | | | — | | | — | | | — | | | 3,184 | | | — | | | — | | | 3,184 | |
| Employee stock purchase plan compensation | — | | | — | | | — | | | — | | | 25 | | | — | | | — | | | 25 | |
| Employee stock purchase plan issuance | 34,523 | | | — | | | — | | | — | | | 52 | | | — | | | — | | | 52 | |
| Restricted stock buy back | (233,960) | | | — | | | 233,960 | | | (540) | | | — | | | — | | | — | | | (540) | |
| | | | | | | | | | | | | | | |
| Net loss | — | | | — | | | — | | | — | | | — | | | (703) | | | — | | | (703) | |
| Balance at December 31, 2022 | 43,088,106 | | | $ | 43 | | | 2,010,961 | | | $ | (5,075) | | | $ | 178,386 | | | $ | 69,890 | | | $ | 227 | | | $ | 243,471 | |
| Foreign currency translation adjustment | — | | | — | | | — | | | — | | | — | | | — | | | (262) | | | (262) | |
| Vesting of restricted stock | 720,534 | | | 1 | | | — | | | — | | | — | | | — | | | — | | | 1 | |
| Stock-based compensation | — | | | — | | | — | | | — | | | 3,507 | | | — | | | — | | | 3,507 | |
| Employee stock purchase plan compensation | — | | | — | | | — | | | — | | | 24 | | | — | | | — | | | 24 | |
| Employee stock purchase plan issuance | 38,421 | | | — | | | — | | | — | | | 56 | | | — | | | — | | | 56 | |
| Purchase of treasury stock | (5,175,688) | | | (5) | | | 5,175,688 | | | (8,845) | | | — | | | — | | | — | | | (8,850) | |
| Restricted stock buy back | (184,611) | | | — | | | 184,611 | | | (329) | | | — | | | — | | | — | | | (329) | |
| Net Income | — | | | — | | | — | | | — | | | — | | | 4,649 | | | — | | | 4,649 | |
| Balance at December 31, 2023 | 38,486,762 | | | $ | 39 | | | 7,371,260 | | | $ | (14,249) | | | $ | 181,973 | | | $ | 74,539 | | | $ | (35) | | | $ | 242,267 | |
| Foreign currency translation adjustment | — | | | — | | | — | | | — | | | — | | | — | | | (25) | | | (25) | |
| Cash dividends declared ($0.10 per share) | — | | | — | | | — | | | — | | | — | | | (4,292) | | | — | | | (4,292) | |
| Vesting of restricted stock | 753,315 | | | — | | | — | | | — | | | — | | | — | | | — | | | — | |
| Stock-based compensation | — | | | — | | | — | | | — | | | 3,216 | | | — | | | — | | | 3,216 | |
| Employee stock purchase plan compensation | — | | | — | | | — | | | — | | | 23 | | | — | | | — | | | 23 | |
| Employee stock purchase plan issuance | 33,516 | | | — | | | — | | | — | | | 51 | | | — | | | — | | | 51 | |
| | | | | | | | | | | | | | | |
| Restricted stock buy back | (206,499) | | | — | | | 206,499 | | | (422) | | | — | | | — | | | — | | | (422) | |
| Net income | — | | | — | | | — | | | — | | | — | | | 2,992 | | | — | | | 2,992 | |
| Balance at December 31, 2024 | 39,067,094 | | | $ | 39 | | | 7,577,759 | | | $ | (14,671) | | | $ | 185,263 | | | $ | 73,239 | | | $ | (60) | | | $ | 243,810 | |
The accompanying notes are an integral part of these consolidated financial statements.
SMART SAND, INC.
CONSOLIDATED STATEMENTS OF CASH FLOWS | | | | | | | | | | | | | | | | | |
| | Year Ended December 31, |
| | 2024 | | 2023 | | 2022 |
| | (in thousands of U.S. dollars) |
| Operating activities: | | | | | |
| Net income (loss) | $ | 2,992 | | | $ | 4,649 | | | $ | (703) | |
| Adjustments to reconcile net (loss) income to net cash provided by operating activities: | | | | | |
| Depreciation, depletion and accretion of asset retirement obligation | 28,936 | | | 27,472 | | | 26,488 | |
| | | | | |
| Amortization of intangible assets | 792 | | | 793 | | | 792 | |
| Net loss (gain) on disposal of assets | 1,062 | | | 1,802 | | | (294) | |
| | | | | |
| Amortization of deferred financing cost | 145 | | | 105 | | | 105 | |
| Accretion of debt discount | 92 | | | 186 | | | 186 | |
| Loss on extinguishment of debt | 1,341 | | | — | | | — | |
| Deferred income taxes | (2,784) | | | (6,137) | | | (4,196) | |
| Stock-based compensation, net | 3,216 | | | 3,507 | | | 3,184 | |
| Employee stock purchase plan compensation | 23 | | | 24 | | | 25 | |
| Changes in assets and liabilities: | | | | | |
| Accounts receivable | (17,750) | | | 12,672 | | | (18,264) | |
| Unbilled receivables | (2,750) | | | (2,640) | | | 1,805 | |
| Inventory | 1,779 | | | (6,638) | | | (5,161) | |
| Prepaid expenses and other assets | 212 | | | 1,996 | | | 6,524 | |
| Deferred revenue | (1,101) | | | (5,805) | | | (9,311) | |
| Settlement of asset retirement obligation | — | | | (197) | | | — | |
| Accounts payable | 53 | | | 1,974 | | | 5,244 | |
| Accrued expenses and other liabilities | 1,606 | | | (2,772) | | | (1,004) | |
| | | | | |
| Net cash provided by operating activities | 17,864 | | | 30,991 | | | 5,420 | |
| Investing activities: | | | | | |
| Acquisition, net of cash acquired | — | | | — | | | (6,547) | |
| Purchases of property, plant and equipment | (7,010) | | | (23,031) | | | (12,731) | |
| Proceeds from disposal of assets | 89 | | | 129 | | | 1,070 | |
| Net cash used in investing activities | (6,921) | | | (22,902) | | | (18,208) | |
| Financing activities: | | | | | |
| Dividend payments to stockholders | (3,902) | | | — | | | — | |
| Proceeds from the issuance of notes payable | 9,755 | | | — | | | — | |
| Repayments of notes payable | (10,263) | | | (10,435) | | | (7,325) | |
| Proceeds from revolving credit facility | 30,975 | | | 23,000 | | | 10,000 | |
| Repayment of revolving credit facility | (38,975) | | | (15,000) | | | (10,000) | |
| Payments under finance leases | (221) | | | (394) | | | (116) | |
| Payment of deferred financing and debt issuance costs | (1,232) | | | — | | | — | |
| Payment for debt extinguishment costs | (1,227) | | | — | | | — | |
| Employee stock purchase plan issuance | 51 | | | 56 | | | 52 | |
| Royalty stock issuance | — | | | — | | | 639 | |
| Purchase of treasury stock | (422) | | | (4,754) | | | (540) | |
| Net cash used in financing activities | (15,461) | | | (7,527) | | | (7,290) | |
| | | | | |
| Net increase in cash and cash equivalents | (4,518) | | | 562 | | | (20,078) | |
| Cash and cash equivalents at beginning of year | 6,072 | | | 5,510 | | | 25,588 | |
| Cash and cash equivalents at end of year | $ | 1,554 | | | $ | 6,072 | | | $ | 5,510 | |
The accompanying notes are an integral part of these consolidated financial statements.
SMART SAND, INC.
NOTES TO CONSOLIDATED FINANCIAL STATEMENTS
(in thousands of U.S. dollars, except per share data)
NOTE 1 — Organization and Nature of Business
The Company was incorporated in July 2011 and is headquartered in Yardley, Pennsylvania. The Company primarily operates as a fully integrated frac and industrial sand supply and services company. The Company offers complete mine to wellsite proppant supply and logistics solutions to our frac sand customers. These operations include the excavation, processing and sale of sand, or proppant, for use in hydraulic fracturing operations as well as proppant logistics and wellsite storage solutions through its SmartSystemsTM products and services. In late 2021, the Company created its Industrial Products Solutions (“IPS”) business to diversify its customer base and markets it serves by offering sand to customers for industrial uses, such as glass, foundry, building products, filtration, geothermal, renewables, ceramics, turf & landscape, retail, and recreation.
Sand Mines and Processing Facilities
The Company’s integrated Oakdale facility, with on-site rail infrastructure and wet and dry sand processing facilities, has access to two Class I rail lines which enable the Company to process and cost effectively deliver products to its customers. The Company completed construction of the first phase of its mine and processing facility near Oakdale, Wisconsin and commenced operations in July 2012, and subsequently expanded its operations in 2014, 2015 and 2018. Currently, the annual processing capacity at the Company’s Oakdale facility is approximately 5.5 million tons.
In September 2020, the Company acquired two frac sand mines and related processing facilities in Ottawa, Illinois and New Auburn, Wisconsin. The Ottawa facility has an annual processing capacity of 1.6 million tons and access to the Burlington Northern Santa Fe (“BNSF”) Class I rail line through the Peru, Illinois transload facility. The Company began operating the Ottawa, Illinois mine and Peru, Illinois transload facility in October 2020. The Company has no plans to operate the New Auburn Facility for the foreseeable future.
In March 2022, the Company acquired its Blair, Wisconsin facility, whose primary assets consisted of an idle frac sand mine and related processing facility. The Blair facility has approximately 2.9 million tons of total annual processing capacity and contains an onsite, unit train capable rail terminal with access to the Class 1 Canadian National Railway. The Company began operations at Blair in the second quarter of 2023.
Through its three operating facilities, the Company has direct access to four Class I rail lines and the ability to access all Class 1 rail lines within the United States and Canada.
The Company also offers proppant logistics solutions to its customers through, among other things, its in-basin transloading terminals and its SmartSystemsTM wellsite proppant storage and management capabilities.
Transload & Logistics Solutions
In March 2018, the Company acquired the rights to operate a unit train capable transloading terminal in Van Hook, North Dakota to service the Bakken Formation in the Williston Basin and began providing Northern White Sand in-basin in April 2018.
In September 2020, the Company acquired the rights to use a rail terminal located in El Reno, Oklahoma.
In September 2021, the Company acquired the rights to construct and operate a transloading terminal in Waynesburg, Pennsylvania to service the Appalachian Basin, including the Marcellus and Utica Formations. The Company began providing sand to customers through this terminal in January 2022 and expanded the facility’s capacity in late 2023.
In December 2023 and January 2024, the Company acquired rights to use transloading terminals in Minerva, Ohio and Dennison, Ohio, respectively and commenced operations servicing the Appalachian Basin in 2024.
In June 2018, the Company acquired substantially all of the assets of Quickthree Solutions, Inc., (“Quickthree”), a manufacturer of portable vertical proppant storage solution systems. Quickthree formed the basis for the Company’s SmartSystems under which it offers various proppant storage solutions that create efficiencies, flexibility, enhanced safety and reliability for customers by providing the capability to unload, store and deliver proppant at the wellsite, as well as the ability to rapidly set up, takedown and transport the entire system. The SmartDepotTM silo includes passive and active dust suppression technology, along with the capability of gravity-fed operation. The self-contained SmartPathTM wellsite proppant management system is a mobile sand transloading system designed to work with bottom dump trailers and features a drive over conveyor, surge bin, silo storage and integrated dust collection system. In 2024, we developed new dual bucket elevators to enhance our
SMART SAND, INC.
NOTES TO CONSOLIDATED FINANCIAL STATEMENTS
(in thousands of U.S. dollars, except per share data)
vertical material handling capabilities. We also increased our silo storage capacity and streamlined proppant delivery directly to the blender. This addition provides greater flexibility for customers with varying wellsite configurations while maintaining the efficiency, safety, and reliability that define our SmartSystems solutions. The SmartBeltTM conveyor works in conjunction with the SmartPath wellsite proppant management system to provide sand directly into the blender on the wellsite. Rapid deployment trailers are designed for quick setup, takedown and transportation of the entire SmartSystem, and they detach from the wellsite equipment, which allows for removal from the wellsite during operation. A proprietary software program, the SmartSystem TrackerTM, allows customers to monitor silo-specific information, including location, proppant type and proppant inventory.
NOTE 2 — Summary of Significant Accounting Policies
Basis of Presentation and Consolidation
The accompanying consolidated financial statements (“financial statements”) of the Company have been prepared in accordance with GAAP and pursuant to the rules and regulations of the SEC. The accompanying financial statements include those of our controlled subsidiaries. The intercompany accounts and transactions have been eliminated. In the opinion of management, all adjustments and disclosures necessary for a fair presentation of these financial statements have been included.
The Company has reclassified the prior year financial statement presentation to conform to the current financial statement presentation. These reclassifications have no effect on previously reported net income.
Use of Estimates
The preparation of financial statements in accordance with GAAP requires management to make estimates and assumptions that affect the reported amounts of assets and liabilities and disclosure of contingent liabilities at the date of the consolidated financial statements, and the reported amounts of revenues and expenses during the reporting period. Significant estimates used in the preparation of these financial statements include, but are not limited to: depreciation and amortization associated with property, plant and equipment and definite-lived intangible assets; impairment considerations of intangible assets; estimated cost of future asset retirement obligations; fair value of acquired assets and assumed liabilities; stock-based compensation; recoverability of deferred tax assets; inventory reserve; collectability of receivables; and certain liabilities.
Actual results could differ from management’s best estimates as additional information or actual results become available in the future, and those differences could be material. The Company is currently unable to estimate the impact of current or future events on its future financial position and results of operations. Therefore, the Company can give no assurances that current or future events will not have a material adverse effect on its financial position or results of operations.
Revenue Recognition
Revenues are generally recognized when control of the promised goods or services is transferred to our customers, the amount of which reflects the consideration the Company expects to be entitled to in exchange for those goods or services.
Sand Revenue
The Company derives its sand sales revenue by mining and processing sand. Its revenues are primarily a function of the price per ton realized and the volumes sold. The singular performance obligation for sand sold is determined by each individual purchase order and the respective products ordered, with revenue being recognized at a point-in-time when the obligation under the terms of the agreement is satisfied and the product control is transferred to our customer. For sand delivered at one of the Company’s facilities, title passes as the product is loaded into railcars or trucks hired by the customer or provided by the Company and revenue is recognized when title transfers at the Company’s facility. For sand delivered in-basin, the Company recognizes revenue when title passes to the customer at the transload facility or in the customer’s truck, depending on the level of logistics services provided to the customer. The amount invoiced reflects product, transportation and any other additional handling services, such as storage or transloading the product from railcar to truck.
Prices under the Company’s long-term agreements with customers are generally fixed but may contain provisions allowing for adjustments including: (i) annual percentage price increases; and/or (ii) market factor adjustments, including volume pricing adjustments, natural gas surcharge/reduction, propane surcharge/reduction, or rail surcharge which are applied if prices moved beyond benchmarks established in the contract.
SMART SAND, INC.
NOTES TO CONSOLIDATED FINANCIAL STATEMENTS
(in thousands of U.S. dollars, except per share data)
The Company requires certain customers to pay a monthly reservation charge based on a minimum contractual volume over the remaining life of their contract, which may be applied as a per ton credit to the sales price up to a certain contractually specified monthly volume or credited against any applicable shortfall payments. Standard collection terms are net 30 days, although extended terms are offered in competitive situations. The Company recognizes revenue when the customer no longer has the right to use the reservation charge towards sand sales or shortfall payments.
SmartSystems Revenue
SmartSystems revenues are primarily from the rental of our patented SmartSystems equipment and related services provided to customers, which is typically earned under fixed monthly rental fees or daily rates for equipment and services for the delivery, proppant management and maintenance on the equipment. The singular performance obligation of SmartSystems revenue is providing the equipment and related to services to customers. Revenues are recognized as the performance obligations are satisfied under the terms of the customer contract.
Contract Balances
The timing of revenue recognition, billings and cash collections results in billed accounts receivable, unbilled receivables, and deferred revenue on the consolidated balance sheet. Occasionally, billing occurs subsequent to revenue recognition, though certain billing occurs in advance, resulting in unbilled receivables and deferred revenue, respectively. In addition, the Company sometimes receives shortfall payments from or offers pricing concessions to its customers, which may result in deferred revenue until the Company recognizes such revenue when performance obligations are met in accordance with the contract.
Deferred Revenues
The Company receives advance payments from certain customers in order to secure and procure a reliable provision and delivery of product. The Company classifies such advances as current or noncurrent liabilities depending upon the anticipated timing of delivery of the supplied product. Deferred revenue is recognized as revenue when performance obligations are met in accordance with the contract.
Deferred revenue recognition is as follows: | | | | | | | | | | | | | | | | | |
| December 31, 2024 | | December 31, 2023 |
| Total deferred revenue | | $ | 54 | | | Total deferred revenue | $ | 1,154 | |
| | | | Recognized in 2024 | 1,154 | |
| Expected recognition: | | | | | |
| 2025 | | 54 | | | | |
| | $ | 54 | | | | $ | 1,154 | |
Performance Obligations
A performance obligation is a promise in a contract to transfer a distinct good or service to the customer, and is the unit of account in accordance with ASC 606. A contract’s transaction price is allocated to each distinct performance obligation and recognized as revenue when, or as, each performance obligation is satisfied. The Company’s contracts may include a single performance obligation in a single contract whereby the allocation of transaction price is not necessary. The Company’s contracts may also contain multiple elements in a single contract or multiple contracts. For contracts with multiple performance obligations, the transaction price is allocated to each performance obligation identified in the contract based on relative standalone selling prices, or estimates of such prices, and recognize the related revenue as control of each individual product or service is transferred to the customer, in satisfaction of the corresponding performance obligations. As of December 31, 2024, the Company had $120,089 in estimated unsatisfied performance obligations related to contracts with customers. The Company expects to perform these obligations and recognize this revenue of approximately $120,089 during the year ended December 31, 2025. These estimates include all open contracts as of December 31, 2024. Actual amounts earned may vary from these estimates as our contract prices include provisions for pricing changes discussed above.
SMART SAND, INC.
NOTES TO CONSOLIDATED FINANCIAL STATEMENTS
(in thousands of U.S. dollars, except per share data)
Taxes Collected from Customers and Remitted to Governmental Authorities
We exclude from our measurement of transaction prices all taxes assessed by governmental authorities that are both (i) imposed on and concurrent with a specific revenue-producing transaction and (ii) collected from customers.
Significant Judgments
Accounting for long-term contracts involves the use of various techniques to estimate total contract revenue, costs and satisfaction of performance obligations. The Company satisfies its performance obligation and subsequently recognizes revenue, at a point in time, upon shipment of the products as the customer obtains control over the goods once the sand is loaded into the railcars or sand is delivered to the customer’s destination.
Cash and Cash Equivalents
The Company considers all short-term, highly liquid investments with an original maturity of three months or less to be cash equivalents. Cash is maintained at financial institutions and, at times, balances may exceed federally insured limits.
Accounts and Unbilled Receivables
Accounts receivable represents customer transactions that have been invoiced in accordance with our typical monthly close procedures; unbilled receivables represent receivables recorded after our typical monthly close procedures. Accounts receivable are due in accordance with terms agreed upon with customers, and are stated at amounts due from customers net of any allowance for credit losses. The Company considers accounts outstanding longer than the payment terms past due.
In January 2023, the Company adopted ASU 2016-13, Financial Instruments - Credit Losses (Topic 326), which modifies how companies recognize expected credit losses on financial instruments and other commitments to extend credit held by an entity at each reporting date. Effective with this amendment, the Company records an allowance for credit losses and deducts that amount from its accounts receivable balance and a related expense will be recognized in selling, general and administrative expenses on the income statement.
Prior to 2023, GAAP required incurred loss methodology whereby companies are prohibited from recording an expected loss until it is probable that the loss has been incurred. Accounts receivable are written off when they are deemed uncollectible, and payments subsequently received on such receivables are credited to bad debt expense.
Under both methodologies, the Company determines the allowance by considering a number of factors, including the length of time trade accounts receivable are past due, previous loss history, a customer’s current ability to pay its obligation, and the condition of the general economy and the industry as a whole. As of December 31, 2024 and 2023, there were no unbilled receivables included in deferred revenue. As of December 31, 2024 and 2023, there was no allowance for credit losses. The Company recorded $163, $0, and $1 for the years ended December 31, 2024, 2023, and 2022, respectively as non-cash bad debt expense.
Transportation
Transportation costs are classified as cost of goods sold. Transportation costs consist of railway transportation and transload costs to deliver products to customers. Cost of sales generated from shipping was $144,108, $118,616 and $57,770 for the years ended December 31, 2024, 2023 and 2022, respectively.
Inventories
The Company’s sand inventory consists of raw material (sand that has been excavated but not processed), work-in-progress (sand that has undergone some but not all processing) and finished goods (sand that has been completely processed and is ready for sale). Costs applied to sand inventory include direct excavation costs, processing costs, overhead allocation, depreciation and depletion, transportation and additional service costs, as applicable. Stockpile tonnages are calculated by measuring the number of tons added and removed from the stockpile. Costs are calculated on a per ton basis and are applied to the stockpiles based on the number of tons in the stockpile. The Company performs periodic surveys to verify the quantity of sand inventory on hand. Due to variation in sand density and moisture content and production processes utilized to manufacture the Company’s products, physical inventories will not necessarily detect all variances. To mitigate this risk, the Company recognizes a yield adjustment on its inventories. Sand inventory is stated at the lower of cost or net realizable value using the average cost method. There was no write-down of inventory value based on the lower of cost or net realizable value calculation
SMART SAND, INC.
NOTES TO CONSOLIDATED FINANCIAL STATEMENTS
(in thousands of U.S. dollars, except per share data)
for the years ended December 31, 2024, 2023 and 2022. The Company also performs an analysis on its existing inventory and estimates the expected production yield based on waste sand produced to determine if it has obsolete inventory. There was no inventory impairment due to obsolescence for the years ended December 31, 2024, 2023 or 2022.
The spare parts inventory consists of critical spare parts. Spare parts inventory is accounted for on a first-in, first-out basis.
Deferred Financing Charges
Direct costs incurred in connection with the Company’s debt are capitalized amortized using the straight-line method, which approximates the effective interest method, over the term of the debt. Amortization expense of the deferred financing and debt discount charges of $237, $291, and $291 are included in interest expense as of December 31, 2024, 2023 and 2022, respectively. Costs related to the FCB ABL Credit Facility are presented in other assets on the balance sheet rather than an offset to the debt balance for consistent reporting when there is no balance on the FCB ABL Credit Facility.
Financial Instruments
The carrying value of the Company’s financial instruments, consisting of cash, accounts receivable, accounts payable, accrued expenses, and debt approximates their fair value due to the short maturity of such instruments. Unless otherwise noted, it is management’s opinion that the Company is not exposed to significant interest, currency or credit risks arising from these financial instruments.
Property, Plant and Equipment
Property, plant and equipment are recorded at cost. Deferred stripping costs are amortized over the estimated life of the mining area to which they apply. Construction in progress is primarily comprised of machinery and equipment which has not been placed in service and is not depreciated until the related assets or improvements are ready to be placed in service. Depreciation is calculated using the straight-line method over the estimated useful lives of the property, plant and equipment, which are: | | | | | |
| | Years |
| Machinery, equipment and tooling | 3-15 |
| SmartSystems | 5-15 |
| Vehicles | 3-5 |
| Furniture and fixtures | 3-10 |
| Plant and buildings | 5-15 |
| Real estate properties | 10-40 |
| Railroad and sidings | 30 |
| Land improvements | 10 |
| Deferred stripping costs | 1-9 |
Expenditures for maintenance and repairs are charged against income as incurred; betterments that increase the value or materially extend the life of the related assets are capitalized. Upon sale or disposition of property and equipment, the cost and related accumulated depreciation and amortization are removed from the accounts and any resulting gain or loss is recognized in the consolidated statements of operations.
Acquisitions
The Company determines whether a transaction or other event is a business combination, which requires that the assets acquired and liabilities assumed constitute a business. Each business combination is then accounted for by applying the acquisition method. If the assets acquired are not a business, the Company accounts for the transaction or other event as an asset acquisition. Under both methods, the Company recognizes the identifiable assets acquired, the liabilities assumed, contingent considerations and any non-controlling interest in the acquired entity. In addition, for transactions that are business combinations, the Company evaluates the existence of goodwill or a gain from a bargain purchase. The Company capitalizes acquisition-related costs and fees associated with asset acquisitions and expenses acquisition-related costs and fees associated with business combinations in the period in which they are incurred.
SMART SAND, INC.
NOTES TO CONSOLIDATED FINANCIAL STATEMENTS
(in thousands of U.S. dollars, except per share data)
Long-Lived Assets, Including Definite-Lived Intangible Assets
Long-lived assets are evaluated for impairment whenever events or changes in circumstances indicate that the carrying amount of the assets may not be recoverable through the estimated undiscounted future cash flows derived from such assets. Definite-lived intangible assets primarily consist of developed technology. For long-lived assets used in operations, impairment losses are only recorded if the asset’s carrying amount is not recoverable through its undiscounted, probability-weighted future cash flows. The Company measures the impairment loss based on the difference between the carrying amount and the estimated fair value. When an impairment exists, the related assets are written down to fair value.
Acquired finite-lived intangible assets are amortized on a straight-line basis over the following periods: | | | | | | | | |
| | Estimated Useful Life (Years) |
| Developed technology | | 13 |
| | |
There were no impairments of long-lived assets or definite-lived intangible assets during the years ended December 31, 2024, 2023 and 2022.
Leases
Lessee
The Company uses leases primarily to procure certain office space, railcars and heavy equipment as part of its operations. The majority of its lease payments are fixed and determinable with certain of its lease payments containing immaterial variable payments based on the number of hours the equipment is used. Certain of its leases have options that allow for renewal at market rates, purchase at fair market value or termination of the lease. The Company must determine that it is reasonably certain that a lease option will be exercised for such an option to be included in the right-of-use asset or lease liability. The Company is not reasonably certain that any of its lease options will be exercised and, as such, has not included those options in its right-of-use assets or lease liabilities. Certain of its equipment leases contain residual value guarantees which guarantee various parts of heavy equipment will have a remaining life when the equipment is returned to the lessor. It is possible that the Company could owe additional amounts to the lessor upon return of equipment. There are no restrictions or covenants imposed by any of the Company’s leases.
The Company evaluates contracts during the negotiation process and when they are executed to determine the existence of leases. A contract contains a lease when it conveys the right to use property, plant or equipment for a stated period of time in exchange for consideration. Leases with an initial term of twelve months or less are not recorded on the balance sheet. The Company recognizes lease expense on a straight-line basis over the term of the lease. The Company evaluates the classification of its leases at the commencement date and includes both lease and non-lease components in its calculation of consideration in the contract for all classes of operating leases.
The Company applies a discount rate to operating leases by class of asset, which is its incremental borrowing rate. The Company determines its incremental borrowing rate based on an average of collateralized borrowing rates offered by various lenders. The Company considers the nature of the assets and the life of the leases and determines the incremental borrowing rate among its classes of assets. See Note 9 — Leases for additional disclosures regarding the Company’s leasing activity.
The Company is obligated under certain contracts for minimum payments for the right to use land for extractive activities, which is not within the scope of leases under ASC 842. See Note 16 — Commitments and Contingencies for additional disclosures regarding these obligations.
Lessor
The Company manufactures SmartSystems and offers the equipment for lease. The Company negotiates the terms of its leases on a case-by-case basis. There are no significant options that are reasonably certain to be exercised, residual value guarantees, restrictions or covenants in its lease contracts and have, therefore, not been included in its accounting for the leases.
Fair Value Measurements
The Company has categorized its assets and liabilities that are measured at fair value on a recurring and non-recurring basis into a three-level fair value hierarchy, of which the first two are considered observable and the last unobservable, which are as follows:
SMART SAND, INC.
NOTES TO CONSOLIDATED FINANCIAL STATEMENTS
(in thousands of U.S. dollars, except per share data)
•Level 1—Inputs are unadjusted quoted prices in active markets for identical assets or liabilities that the Company has the ability to access at the measurement date;
•Level 2—Inputs other than Level 1 that are observable, either directly or indirectly, such as quoted prices for similar assets or liabilities in active markets, quoted prices for identical or similar assets or liabilities in markets that are not active or other inputs corroborated by observable market data for substantially the full term of the assets or liabilities; and
•Level 3—Unobservable inputs that reflect the Company’s assumptions that market participants would use in pricing assets or liabilities based on the best information available.
The Company had no financial instruments carried at fair value as of December 31, 2024 and 2023.
Asset Retirement Obligation
The Company estimates the future cost of dismantling, restoring and reclaiming operating excavation sites and related facilities in accordance with federal, state and local regulatory requirements and recognizes reclamation obligations when disturbance occurs and records them as liabilities at estimated fair value. In addition, a corresponding increase in the carrying amount of the related asset is recorded and depreciated over such asset’s useful life or the estimated number of years of extraction. The reclamation liability is accreted to expense over the estimated productive life of the related asset and is subject to adjustments to reflect changes in value resulting from the passage of time and revisions to the estimates of either the timing or amount of the reclamation costs. If the asset retirement obligation is settled for more or less than the carrying amount of the liability, a loss or gain will be recognized, respectively.
Stock-Based Compensation
The Company issues restricted stock to certain employees and members of the board of directors of the Company (the “Board”) for their services on the Board. The Company estimates the grant date fair value of each share of restricted stock at issuance. For awards subject to service-based vesting conditions, the Company recognizes, in the consolidated statements of operations, stock-based compensation expense equal to the grant date fair value of the award on a straight-line basis over the requisite service period, which is generally the vesting term. For awards subject to both performance and service-based vesting conditions, the Company recognizes stock-based compensation expense on a straight-line basis unless it is probable that the performance condition will not be achieved. Forfeitures are accounted for when they occur. The Company uses the market price of its shares as the grant date fair value for restricted stock awards.
Income Taxes
The Company applies the provisions of ASC 740, “Income Taxes” (“ASC 740”), which principally utilizes a balance sheet approach to provide for income taxes. Under this method, deferred tax assets and liabilities are recognized for the expected future tax consequences of net operating loss carryforwards and temporary differences between the carrying amounts and the tax bases of assets and liabilities.
ASC 740 clarifies the accounting for uncertainty in income taxes recognized in an enterprise’s financial statements. The impact of an uncertain income tax position on the income tax returns must be recognized at the largest amount that is more-likely-than-not to be required to be recognized upon audit by the relevant taxing authority. This standard also provides guidance on derecognition, measurement, classification, interest and penalties, accounting for interim periods, disclosure and transition issues with respect to tax positions. The Company includes interest and penalties as a component of income tax expense in the consolidated statements of operations. For the periods presented, immaterial interest and penalties were recorded.
Environmental Matters
The Company is subject to various federal, state and local laws and regulations relating to the protection of the environment. Management has established procedures for the ongoing evaluation of the Company’s operations, to identify potential environmental exposures and to comply with regulatory policies and procedures. Environmental expenditures that relate to current operations are expensed or capitalized as appropriate. Expenditures that relate to an existing condition caused by past operations and do not contribute to current or future revenue generation are expensed as incurred. Liabilities are recorded when environmental costs are probable, and the costs can be reasonably estimated. The Company maintains insurance which may cover, in whole or in part, certain environmental expenditures. As of December 31, 2024 and 2023, there were no material probable environmental matters.
SMART SAND, INC.
NOTES TO CONSOLIDATED FINANCIAL STATEMENTS
(in thousands of U.S. dollars, except per share data)
Basic and Diluted Net Income Per Share of Common Stock
Basic net income per share of common stock is computed by dividing net income attributable to common stockholders by the weighted-average number of shares of common stock outstanding during the period, excluding the dilutive effects of restricted stock. Diluted net income per share of common stock is computed by dividing the net income attributable to common stockholders by the sum of the weighted-average number of shares of common stock outstanding during the period plus the potential dilutive effects of restricted stock outstanding during the period calculated in accordance with the treasury stock method, although these shares and restricted stock are excluded if their effect is anti-dilutive. The number of shares underlying equity-based awards that were excluded from the calculation of diluted earnings per share for the years ended December 31, 2024, 2023, 2022 was 1,158, 1,719 and 2,317, respectively as their effect would be anti-dilutive. The following table reconciles the weighted-average common shares outstanding used in the calculation of basic net income per share to the weighted average common shares outstanding used in the calculation of diluted net income per share: | | | | | | | | | | | | | | | | | |
| | Year Ended December 31, |
| | 2024 | | 2023 | | 2022 |
| Weighted average common shares outstanding | 38,809 | | | 38,948 | | | 42,408 | |
| | | | | |
| Assumed conversion of restricted stock | 275 | | | 98 | | | — | |
| Diluted weighted average common stock outstanding | 39,084 | | | 39,046 | | | 42,408 | |
Employee Retention Credit
The Company qualified for federal government assistance through employee retention credit provisions of the Consolidated Appropriations Act of 2021. During the year ended December 31, 2021, the Company recorded $5,026 of employee retention credits in other income on its consolidated statements of operations, of which $522 remained included in prepaid expenses and other current assets on the consolidated balance sheet as of December 31, 2024. The calculation of the credit is based on employees continued employment and represents a portion of the wages paid to them. For income tax purposes, the credit will result in decreased expense related to the wages it offsets in the period received.
Recent Accounting Pronouncements
Adopted
In November 2023, the FASB issued ASU 2023-07, Segment Reporting, which updates various reportable disclosure requirements, primarily through incremental disclosures of segment expenses in both annual and interim reporting. The Company has adopted this ASU in the current financial statements and added the additional required disclosures in Note 11 of these financial statements.
Not yet adopted
In December 2023, the FASB issued ASU 2023-09, Income Taxes, which updates various disclosures including enhancing the income tax rate reconciliation and income taxes paid disclosures by requiring greater disaggregation of information. The other amendments in this Update are intended to improve the effectiveness and comparability of disclosures. The Update is effective for the Company for the annual reporting period beginning January 1, 2025 and for interim periods beginning January 1, 2026. While the Company is still in the process of evaluating the effects of ASU 2023-07 and its related updates on the consolidated financial statements, at the time of adoption, it believes the primary effect will be updated note disclosures.
In November 2024, the FASB issued ASU 2024-03, Income Statement - Reporting Comprehensive Income - Expense Disaggregation Disclosures, which updates various disclosures including enhancing the disclosure of certain costs and expenses in the notes to the financial statements. The Update is effective for the Company for its annual financial statements for 2027 and interim periods thereafter. Early adoption is permitted. While the Company is still in the process of evaluating the effects of ASU 2024-03, at the time of adoption, it believes the primary effect will be disaggregation of the cost of goods sold and selling, general and administrative line items on the face of the financial statements or within the notes to the financial statements.
SMART SAND, INC.
NOTES TO CONSOLIDATED FINANCIAL STATEMENTS
(in thousands of U.S. dollars, except per share data)
NOTE 3 — Inventories
Inventories consisted of the following: | | | | | | | | | | | |
| December 31, |
| | 2024 | | 2023 |
| Raw material | $ | 584 | | | $ | 467 | |
| Work in progress | 6,740 | | | 9,391 | |
| Finished goods | 6,507 | | | 8,244 | |
| Spare parts | 11,213 | | | 8,721 | |
| Total inventory | $ | 25,044 | | | $ | 26,823 | |
NOTE 4 — Prepaid Expenses and Other Current Assets
Prepaid expenses and other current assets consisted of the following: | | | | | | | | | | | |
| December 31, |
| 2024 | | 2023 |
| Prepaid insurance | $ | 804 | | | $ | 1,494 | |
| Prepaid expenses | 1,005 | | | 910 | |
| Prepaid income taxes, net | 94 | | | — | |
| Other receivables | 732 | | | 813 | |
| | | |
| Total prepaid expenses and other current assets | $ | 2,635 | | | $ | 3,217 | |
SMART SAND, INC.
NOTES TO CONSOLIDATED FINANCIAL STATEMENTS
(in thousands of U.S. dollars, except per share data)
NOTE 5 — Property, Plant and Equipment, net
Net property, plant and equipment consists of: | | | | | | | | | | | |
| | December 31, |
| | 2024 | | 2023 |
| Machinery, equipment and tooling | $ | 43,041 | | | $ | 40,632 | |
| SmartSystems | 32,551 | | | 30,651 | |
| Vehicles | 3,961 | | | 4,082 | |
| Furniture and fixtures | 1,368 | | | 1,466 | |
| Plant and buildings | 218,546 | | | 213,756 | |
| Real estate properties | 7,161 | | | 7,209 | |
| Railroad and sidings | 35,728 | | | 35,491 | |
| Land and land improvements | 40,627 | | | 40,519 | |
| Asset retirement obligation | 23,283 | | | 22,910 | |
| Mineral properties | 7,442 | | | 7,442 | |
| Deferred stripping costs | 4,434 | | | 3,802 | |
| Construction in progress | 3,216 | | | 6,270 | |
| 421,358 | | | 414,230 | |
| Less: accumulated depreciation and depletion | 184,666 | | | 159,138 | |
| Total property, plant and equipment, net | $ | 236,692 | | | $ | 255,092 | |
Depreciation expense was $27,903, $26,533 and $25,693 for the years ended December 31, 2024, 2023 and 2022, respectively. Depletion expense was $37, $35 and $36 for the years ended December 31, 2024, 2023 and 2022, respectively.
The Company capitalized no interest expense associated with the construction of new property, plant and equipment for the years ended December 31, 2024, 2023 and 2022.
NOTE 6 — Intangible Assets, net
The following table reflects the changes in the net carrying amounts of the Company’s intangible assets for the year ended December 31, 2024. | | | | | | | | | | | | | | | | | | | | | | | | | | | | | | | | |
| | Balance at December 31, 2023 | | Assets Acquired Pursuant to Business Combination | | Impairment Charges | | Amortization Expense | | Balance at December 31, 2024 |
| Developed technology | | $ | 5,876 | | | $ | — | | | $ | — | | | $ | 792 | | | $ | 5,084 | |
| | $ | 5,876 | | | $ | — | | | $ | — | | | $ | 792 | | | $ | 5,084 | |
The following table reflects the changes in the net carrying amounts of the Company’s finite-lived intangible assets for the year ended December 31, 2023. | | | | | | | | | | | | | | | | | | | | | | | | | | | | | | | | |
| | Balance at December 31, 2022 | | Assets Acquired Pursuant to Business Combination | | Impairment Charges | | Amortization Expense | | Balance at December 31, 2023 |
| Developed technology | | $ | 6,669 | | | $ | — | | | $ | — | | | $ | 793 | | | $ | 5,876 | |
| | $ | 6,669 | | | $ | — | | | $ | — | | | $ | 793 | | | $ | 5,876 | |
SMART SAND, INC.
NOTES TO CONSOLIDATED FINANCIAL STATEMENTS
(in thousands of U.S. dollars, except per share data)
The following table reflects the carrying amounts of the Company's finite-lived intangible assets at December 31, 2024 and 2023. | | | | | | | | | | | | | | | | | | | | | | | | | | |
| | December 31, 2024 | | December 31, 2023 |
| | Gross Carrying Amount | | Accumulated Amortization | | Gross Carrying Amount | | Accumulated Amortization |
| Developed technology | | $ | 10,300 | | | $ | (5,216) | | | $ | 10,300 | | | (4,424) | |
| | $ | 10,300 | | | $ | (5,216) | | | $ | 10,300 | | | $ | (4,424) | |
The Company uses the straight-line method to determine the amortization expense for its definite-lived intangible assets. The weighted-average remaining useful life for the intangible assets is 6.4 years. Amortization expense related to the purchased intangible assets was $792, $793 and $792 for the year ended December 31, 2024, 2023, and 2022, respectively.
The table below reflects the future estimated amortization expense for amortizable intangible assets as of December 31, 2024. | | | | | |
| Year ending December 31, | |
| 2025 | $ | 792 | |
| 2026 | 792 | |
| 2027 | 792 | |
| 2028 | 792 | |
| 2029 | 792 | |
| Thereafter | 1,124 | |
| Total | $ | 5,084 | |
NOTE 7 — Accrued and Other Expense
Accrued and other expense consists of the following: | | | | | | | | | | | |
| | December 31, |
| | 2024 | | 2023 |
| Employee related expenses | $ | 1,630 | | | $ | 1,767 | |
| Accrued equipment expense | 291 | | | 524 | |
| Accrued professional fees | 443 | | | 461 | |
| Accrued royalties | 3,224 | | | 3,149 | |
| Accrued freight and delivery charges | 2,331 | | | 2,066 | |
| Accrued real estate tax | 960 | | | 1,044 | |
| Accrued utilities | 1,405 | | | 604 | |
| Sales tax liability | 158 | | | 486 | |
| Income taxes payable | 852 | | | 865 | |
| Other accrued liabilities | 1,267 | | | 58 | |
| Total accrued liabilities | $ | 12,561 | | | $ | 11,024 | |
SMART SAND, INC.
NOTES TO CONSOLIDATED FINANCIAL STATEMENTS
(in thousands of U.S. dollars, except per share data)
NOTE 8 — Debt
Current portion of long-term debt current consists of the following: | | | | | | | | | | | |
| | December 31, |
| | 2024 | | 2023 |
| Former ABL Credit Facility | $ | — | | | $ | 8,000 | |
| VFI Equipment Financing | 2,286 | | | — | |
| Oakdale Equipment Financing | — | | | 6,462 | |
| Notes payable | 1,036 | | | 1,011 | |
| Finance leases | 232 | | | 238 | |
| Current portion of long-term debt | $ | 3,554 | | | $ | 15,711 | |
Long-term debt consists of the following: | | | | | | | | | | | |
| | December 31, |
| | 2024 | | 2023 |
| FCB ABL Credit Facility | $ | — | | | $ | — | |
| VFI Equipment Financing, net | 6,294 | | | — | |
| Oakdale Equipment Financing | — | | | 1,388 | |
| Notes payable | 2,523 | | | 1,519 | |
| Finance lease | 313 | | | 542 | |
| Long-term debt | $ | 9,130 | | | $ | 3,449 | |
FCB ABL Credit Facility
On September 3, 2024, the Company entered into a $30,000 five-year senior secured asset-based credit facility with First-Citizens Bank & Trust Company. The FCB ABL Credit Facility provides for non-amortizing revolving loans in an aggregate principal amount of up to $30,000, subject to a borrowing base comprised of eligible inventory and accounts receivable. Additionally, obligations under the FCB ABL Credit Facility are guaranteed by certain of our wholly-owned domestic subsidiaries and secured by a first-priority security interest in certain non-real estate assets. Borrowings under the FCB ABL Credit Facility bear interest at a rate equal to the secured overnight financing rate (“SOFR”) plus a margin of 2.75%.
The ABL Credit Facility contains a number of covenants that, among other things, restrict our ability to incur liens or other indebtedness, make certain restricted payments, merge or consolidate and dispose of assets. In addition, the FCB ABL Credit Facility requires us in certain limited circumstances to maintain a minimum fixed charge coverage ratio of 1.1 to 1.0. The FCB ABL Credit Facility also contains certain affirmative covenants and events of default customary for facilities of this type. The Company was compliant with all requirements of this facility.
The available borrowing amount under the FCB ABL Credit Facility as of December 31, 2024 was $30,000 and is based on the Company’s eligible accounts receivable and inventory. The Company had no borrowings outstanding and $30,000 available to be drawn under this facility as of December 31, 2024. As of December 31, 2024, the Company was in compliance with all financial covenants. The weighted average interest rate on our variable rate debt under the Former ABL Facility and this FCB ABL credit facility for the years ended December 31, 2024 and 2023 was 8.20% and 4.81%, respectively.
Former ABL Credit Facility
On December 13, 2019, the Company entered into a $20,000 five-year senior secured asset-based credit facility with Jefferies Finance LLC. This facility was terminated on September 3, 2024.
SMART SAND, INC.
NOTES TO CONSOLIDATED FINANCIAL STATEMENTS
(in thousands of U.S. dollars, except per share data)
VFI Equipment Financing
On June 28, 2024, the Company entered into an equipment financing arrangement with VFI with a principal amount of $10,000. The VFI Equipment Financing is legally comprised of a Master Lease Agreement and one lease schedule. The VFI Equipment Financing is considered a lease under article 2A of the Uniform Commercial Code but is considered a financing arrangement for accounting and financial reporting purposes, and not a lease. The collateral under the VFI Equipment Financing includes the majority of the Company’s SmartSystems equipment. The VFI Equipment Financing bears interest at a fixed rate of 8.56%. The Company used the net proceeds to repay in full and terminate the Oakdale Equipment Financing, and the remainder was added to working capital. The VFI Equipment Financing amortizes to one dollar and will be paid in full on on May 8, 2028. The Company has the right to reacquire the underlying equipment on the lease schedule upon maturity for one dollar.
Oakdale Equipment Financing
On December 13, 2019, the Company received net proceeds of $23,000 in an equipment financing arrangement with Nexseer. Substantially all of the Company’s mining and processing equipment at its Oakdale facility was pledged as collateral under the Oakdale Equipment Financing. The Oakdale Equipment Financing bore interest at a fixed rate of 5.79%. This facility was paid in full and terminated on June 28, 2024.
Notes Payable
Notes payable primarily include various financing arrangements to finance the Company’s purchased heavy equipment. All notes payable bear interest at fixed rates between 3.99% and 7.49%.
Finance Leases
See Note 9 - Leases for additional information about the Company’s finance leases.
Future minimum payments as of December 31, 2024 are as follows: | | | | | | | | | | | | | | | | | | | | | | | | | | | | | |
| Year Ended December 31, | FCB ABL Credit Facility | | VFI Equipment Financing | | Notes Payable | | Finance Leases | | Total |
| 2025 | $ | — | | | $ | 2,940 | | | $ | 1,217 | | | $ | 273 | | | $ | 4,430 | |
| 2026 | — | | | 2,940 | | | 1,148 | | | 262 | | | 4,350 | |
| 2027 | — | | | 2,940 | | | 888 | | | 65 | | | 3,893 | |
| 2028 | — | | | 1,225 | | | 547 | | | 7 | | | 1,779 | |
| 2029 and thereafter | — | | | — | | | 239 | | | — | | | 239 | |
| Total minimum payments | — | | | 10,045 | | | 4,039 | | | 607 | | | 14,691 | |
| Amount representing interest | — | | | (1,362) | | | (480) | | | (62) | | | (1,904) | |
| Amount representing unamortized lender fees | — | | | (103) | | | — | | | — | | | (103) | |
| Present value of payments | | | | | | | 545 | | | |
| Less: current portion | — | | | (2,286) | | | (1,036) | | | (232) | | | (3,554) | |
| Total long-term debt, net | $ | — | | | $ | 6,294 | | | $ | 2,523 | | | $ | 313 | | | $ | 9,130 | |
NOTE 9 — Leases
Lessee
At December 31, 2024 and 2023, the operating and financing components of the Company’s right-of-use assets and lease liabilities on the consolidated balance sheet are as follows:
SMART SAND, INC.
NOTES TO CONSOLIDATED FINANCIAL STATEMENTS
(in thousands of U.S. dollars, except per share data)
| | | | | | | | | | | | | | | | | | | | |
| | Balance Sheet Location | | December 31, |
| | | | 2024 | | 2023 |
| Right-of-use assets | | | | | | |
| Operating | | Operating right-of-use assets | | $ | 23,153 | | | $ | 23,265 | |
| Financing | | Property, plant and equipment, net | | 582 | | | 908 | |
| Total right-of use assets | | | | $ | 23,735 | | | $ | 24,173 | |
| | | | | | |
| Lease liabilities | | | | | | |
| Operating | | Operating lease liabilities, current and long-term portions | | $ | 24,539 | | | $ | 24,592 | |
| Financing | | Long-term debt, current and long-term portions | | 545 | | | 780 | |
| Total lease liabilities | | | | $ | 25,084 | | | $ | 25,372 | |
Operating lease costs are recorded in a single expense on the statements of operations and allocated to the right-of-use assets and the related lease liabilities as depreciation expense and interest expense, respectively. Lease cost recognized in the consolidated statements of operations for the years ended December 31, 2024 and 2023 is as follows: | | | | | | | | | | | | | | |
| | |
| | 2024 | | 2023 |
| Finance lease cost | | | | |
| Amortization of right-of-use assets | | $ | 232 | | | $ | 292 | |
| Interest on lease liabilities | | 62 | | | 74 | |
| Operating lease cost | | 13,597 | | | 13,797 | |
| Short-term lease cost | | 22 | | | 36 | |
| | | | |
| | | | |
| Total lease cost | | $ | 13,913 | | | $ | 14,199 | |
SMART SAND, INC.
NOTES TO CONSOLIDATED FINANCIAL STATEMENTS
(in thousands of U.S. dollars, except per share data)
Other information related to the Company’s leasing activity for year ended December 31, 2024 and 2023 is as follows: | | | | | | | | | | | | | | |
| | Year ended December 31, |
| | 2024 | | 2023 |
| Cash paid for amounts included in the measurement of lease liabilities | | | | |
| Operating cash flows used for finance leases | | $ | 63 | | | $ | 73 | |
| Operating cash flows used for operating leases | | $ | 13,523 | | | $ | 14,928 | |
| Financing cash flows used for finance leases | | $ | 221 | | | $ | 394 | |
| | | | |
| Right-of-use assets obtained in exchange for new finance lease liabilities | | $ | 62 | | | $ | 492 | |
| Right-of-use assets obtained in exchange for new operating lease liabilities | | $ | 12,380 | | | $ | 9,569 | |
| | | | |
| Weighted average remaining lease term - finance leases | | 2.3 years | | 3.3 years |
| Weighted average discount rate - finance leases | | 9.53 | % | | 9.71 | % |
| Weighted average remaining lease term - operating leases | | 2.9 years | | 2.7 years |
| Weighted average discount rate - operating leases | | 7.27 | % | | 6.51 | % |
Maturities of the Company’s lease liabilities as of December 31, 2024 are as follows: | | | | | | | | | | | | | | | | | | | | |
| Year | | Operating Leases | | Finance Leases | | Total |
| 2025 | | $ | 11,433 | | | $ | 273 | | | $ | 11,706 | |
| 2026 | | 7,508 | | | 262 | | | 7,770 | |
| 2027 | | 4,629 | | | 65 | | | 4,694 | |
| 2028 | | 2,536 | | | 7 | | | 2,543 | |
| 2029 | | 1,194 | | | — | | | 1,194 | |
| Thereafter | | — | | | — | | | — | |
| Total cash lease payments | | 27,300 | | | 607 | | | 27,907 | |
| Less: amounts representing interest | | (2,762) | | | (62) | | | (2,824) | |
| Total lease liabilities | | $ | 24,539 | | | $ | 545 | | | $ | 25,084 | |
SMART SAND, INC.
NOTES TO CONSOLIDATED FINANCIAL STATEMENTS
(in thousands of U.S. dollars, except per share data)
NOTE 10 — Asset Retirement Obligation
The Company had a post-closure reclamation and site restoration obligation of $21,292 as of December 31, 2024. The following is a reconciliation of the total reclamation liability for asset retirement obligations. | | | | | |
| |
| Balance at December 31, 2022 | $ | 18,888 | |
| Additions and revisions of prior estimates | 328 | |
| Accretion expenses | 904 | |
| Settlement of liability | (197) | |
| Balance at December 31, 2023 | $ | 19,923 | |
| Additions and revisions of prior estimates | 373 | |
| Accretion expenses | 996 | |
| |
| Balance at December 31, 2024 | $ | 21,292 | |
NOTE 11 — Segment Reporting
The Company has two reportable segments, Sand and SmartSystems as of December 31, 2024. The Company evaluates its segment reporting on an ongoing basis and has changed its reporting in the current period and applied that reporting retrospectively to the prior periods presented. The accounting policies for the segments are not different from the accounting policies for the Company. The Company does not currently provide asset information by reportable segment as it does not routinely evaluate the total asset position by segment. The Company’s operations in foreign countries are immaterial. The chief operating decision maker (“CODM”) is Charles Young, the Company’s chief executive officer. The CODM regularly reviews the Company’s GAAP financial statements, as well as the non-GAAP reporting measures when considering the profit and loss of the company and uses this information in deciding how to allocate resources.
The Sand segment includes both frac sand sales and IPS sales. The sand production process begins the same way for each of these revenue streams. Frac Sand consists of four primary sizes of sand, called grades. IPS begins with these same frac sand grades and may contain additional sizes or custom blends of a variety of grades.
The SmartSystems segment revenue is primarily from the rental of our patented SmartSystems equipment and related services provided to customers. This segment offers customers portable wellsite storage and management solutions that enable customers to unload, store, and deliver proppant at the wellsite.
During the year ended December 31, 2024, three of the Company’s customer had revenues of more than 10%. Of these three customers, one had revenues in both Sand and SmartSystems segments and two had revenues in the Sand Segment.
SMART SAND, INC.
NOTES TO CONSOLIDATED FINANCIAL STATEMENTS
(in thousands of U.S. dollars, except per share data)
The following tables present additional segment information for the year ended December 31, 2024 and a reconciliation to amounts on the Consolidated Statement of Operations. | | | | | | | | | | | | | | | | | |
| Sand | | SmartSystems | | Total |
| Revenue | $ | 303,590 | | | $ | 7,782 | | | $ | 311,372 | |
| | | | | |
| Segment cost of goods sold | | | | | |
| Logistics costs | $ | 154,628 | | | $ | — | | | $ | 154,628 | |
| Production costs | 78,919 | | | — | | | 78,919 | |
| Depreciation, depletion, and accretion of asset retirement obligations | 24,727 | | | 2,134 | | | 26,861 | |
| Other costs | 538 | | | 5,603 | | | 6,141 | |
| Total cost of goods sold | $ | 258,812 | | | $ | 7,737 | | | $ | 266,549 | |
| | | | | |
| Gross profit | $ | 44,778 | | | $ | 45 | | | $ | 44,823 | |
| Total operating expenses | | | | | 41,819 | |
| Total other (expenses) income, net | | | | | (2,752) | |
| Income tax expense (benefit) | | | | | (2,740) | |
| Net income (loss) | | | | | $ | 2,992 | |
| | | | | |
| Additions to property, plant and equipment | $ | 8,249 | | | $ | 1,237 | | | |
The following tables present additional segment information for the year ended December 31, 2023 and a reconciliation to amounts on the Consolidated Statement of Operations. | | | | | | | | | | | | | | | | | |
| Sand | | SmartSystems | | Total |
| Revenue | $ | 287,479 | | | $ | 8,494 | | | $ | 295,973 | |
| | | | | |
| Segment cost of goods sold | | | | | |
| Logistics costs | $ | 152,260 | | | $ | — | | | $ | 152,260 | |
| Production costs | 70,298 | | | — | | | 70,298 | |
| Depreciation, depletion, and accretion of asset retirement obligations | 23,287 | | | 2,182 | | | 25,469 | |
| Other costs | 1,336 | | | 5,055 | | | 6,391 | |
| Total cost of goods sold | $ | 247,181 | | | $ | 7,237 | | | $ | 254,418 | |
| | | | | |
| Gross profit | $ | 40,298 | | | $ | 1,257 | | | $ | 41,555 | |
| Total operating expenses | | | | | 43,059 | |
| Total other (expenses) income, net | | | | | (748) | |
| Income tax expense (benefit) | | | | | (6,901) | |
| Net income (loss) | | | | | $ | 4,649 | |
| | | | | |
| Additions to property, plant and equipment | $ | 19,700 | | | $ | 3,756 | | | |
SMART SAND, INC.
NOTES TO CONSOLIDATED FINANCIAL STATEMENTS
(in thousands of U.S. dollars, except per share data)
The following tables present additional segment information for the year ended December 31, 2022 and a reconciliation to amounts on the Consolidated Statement of Operations. | | | | | | | | | | | | | | | | | |
| Sand | | SmartSystems | | Total |
| Revenue | $ | 249,324 | | | $ | 6,416 | | | $ | 255,740 | |
| | | | | |
| Segment cost of goods sold | | | | | |
| Logistics costs | $ | 130,729 | | | $ | — | | | $ | 130,729 | |
| Production costs | 64,937 | | | — | | | 64,937 | |
| Depreciation, depletion, and accretion of asset retirement obligations | 22,895 | | | 2,143 | | | 25,038 | |
| Other costs | 1,445 | | | 4,000 | | | 5,445 | |
| Total cost of goods sold | $ | 220,006 | | | $ | 6,143 | | | $ | 226,149 | |
| | | | | |
| Gross profit | $ | 29,318 | | | $ | 273 | | | $ | 29,591 | |
| Total operating expenses | | | | | 32,719 | |
| Total other (expenses) income, net | | | | | (780) | |
| Income tax expense (benefit) | | | | | (3,205) | |
| Net income (loss) | | | | | $ | (703) | |
| | | | | |
| Additions to property, plant and equipment | $ | 18,145 | | | $ | 804 | | | |
NOTE 12 — Concentrations
As of December 31, 2024, four customers accounted for 84% of the Company’s total accounts and unbilled receivables. As of December 31, 2023, four customers accounted for 70% of the Company’s total accounts and unbilled receivables.
During the year ended December 31, 2024, 56% of the Company’s revenues were earned from three customers. During the years ended December 31, 2023 and 2022, 42% and 60% of the Company’s revenues were earned from two and four customers, respectively.
As of December 31, 2024, one vendor accounted for 17% of the Company’s accounts payable. As of December 31, 2023, one vendor accounted for 11% of the Company’s accounts payable.
During the year ended December 31, 2024, two vendors accounted for 35%, of the Company’s cost of goods sold. During the year ended December 31, 2023 and 2022, two and two vendors accounted for 32% and 34%, respectively, of the Company’s cost of goods sold.
The Company’s primary product is Northern White frac sand and its mining operations are limited to Wisconsin and Illinois. There is a risk of loss if there are significant environmental, legal or economic changes to this geographic area.
As of December 31, 2024, the Company employed 285 people, of which 25 were employed under collective bargaining agreements. The current collective bargaining agreements expire April 30, 2025.
NOTE 13 — Stock-Based Compensation
Equity Incentive Plan
In November 2016, in connection with its initial public offering, the Company adopted the 2016 Omnibus Incentive Plan (“2016 Plan”) which provides for the issuance of Awards (as defined in the 2016 Plan) of up to a maximum of 3,911 shares of the Company’s common stock to employees, non-employee members of the Board and consultants of the Company. On April 3, 2020, the Company’s Board adopted an amendment to the 2016 Plan to increase the available shares of common stock
SMART SAND, INC.
NOTES TO CONSOLIDATED FINANCIAL STATEMENTS
(in thousands of U.S. dollars, except per share data)
authorized for issuance by an additional 2,088 shares. On April 22, 2022, the Company’s board of directors adopted an amendment to the 2016 Plan to increase the available shares of common stock authorized for issuance by an additional 3,900 shares. The awards can be issued in the form of incentive stock options, non-qualified stock options or restricted stock.
During 2024, there were 2,396 shares of restricted stock issued under 2016 Plan. During 2023 and 2022, 810 and 1,172 shares of restricted stock were issued under the 2016 Plan, respectively. The grant date fair value of all restricted stock outstanding during the year ended December 31, 2024 was between $1.65 and $4.57 per share. The shares issued in 2024, vest over one to four years from their respective grant dates and their grant date fair value was the actual market price of the Company’s shares. The total number of shares and their respective values that vested during the years ended December 31, 2024, 2023 and 2022 were 753 at $1,542, 721 at $1,282 and 975 at $2,275, respectively.
The Company recognized $3,216, $3,507 and $3,184 of compensation expense for the restricted stock during 2024, 2023 and 2022, respectively, in cost of goods sold and operating expenses on the consolidated statements of operations. At December 31, 2024, the Company had unrecognized compensation expense of $5,284 related to granted but unvested stock awards. That expense is expected to be recognized as follows: | | | | | |
| Year Ended December 31, | |
| 2025 | $ | 2,643 | |
| 2026 | 1,661 | |
| 2027 | 784 | |
| 2028 | 196 | |
| 2029 | — | |
| $ | 5,284 | |
The following table summarizes restricted stock activity under the 2016 Plan from January 1, 2023 through December 31, 2024: | | | | | | | | | | | |
| | Number of Shares | | Weighted Average |
| Unvested, January 1, 2023 | 2,730 | | | $ | 3.06 | |
| Granted | 810 | | | $ | 1.69 | |
| Vested | (721) | | | $ | 2.74 | |
| Forfeiture | (189) | | | $ | 2.80 | |
| Unvested, December 31, 2023 | 2,630 | | | $ | 2.89 | |
| Granted | 2,396 | | | $ | 1.97 | |
| Vested | (753) | | | $ | 2.81 | |
| Forfeiture | (441) | | | $ | 2.92 | |
| Unvested December 31, 2024 | 3,832 | | | $ | 2.39 | |
Employee Stock Purchase Plan
Shares of the Company’s common stock may be purchased by eligible employees under the Company’s 2016 Employee Stock Purchase Plan in six-month intervals at a purchase price equal to 85% of the lesser of the fair market value of the Company’s common stock on either the first day or the last day of each six-month offering period. Employee purchases may not exceed 20% of their gross compensation during an offering period.
SMART SAND, INC.
NOTES TO CONSOLIDATED FINANCIAL STATEMENTS
(in thousands of U.S. dollars, except per share data)
NOTE 14 — Income Taxes
The provision for income taxes consists of the following: | | | | | | | | | | | | | | | | | |
| | Year Ended December 31, |
| | 2024 | | 2023 | | 2022 |
| Current | | | | | |
| Federal | $ | (226) | | | $ | (181) | | | $ | 96 | |
| State and local | 32 | | | (969) | | | 895 | |
| Foreign | 239 | | | 386 | | | — | |
| Total current (benefit) expense | 45 | | | (764) | | | 991 | |
| Deferred | | | | | |
| Federal | (2,650) | | | (4,869) | | | (3,148) | |
| State and local | (135) | | | (1,268) | | | (1,048) | |
| Foreign | — | | | — | | | — | |
| Total deferred income tax benefit | (2,785) | | | (6,137) | | | (4,196) | |
| Total income tax benefit | $ | (2,740) | | | $ | (6,901) | | | $ | (3,205) | |
Income tax expense differs from the amounts computed by applying the statutory income tax rates to pretax income. The statutory income tax rates were 21% for the years ended December 31, 2024, 2023 and 2022. The reconciliations from the applicable statutory income tax rates to income tax (benefit) expense are as follows: | | | | | | | | | | | | | | | | | |
| | Year Ended December 31, |
| | 2024 | | 2023 | | 2022 |
| At statutory rate | $ | 53 | | | $ | (473) | | | $ | (821) | |
| State taxes, net of U.S. federal benefit | (176) | | | (1,554) | | | (162) | |
| Foreign taxes | 189 | | | 305 | | | — | |
| Federal tax deductions | (3,507) | | | (3,231) | | | (3,299) | |
| Change in applicable tax rate | 8 | | | (436) | | | 26 | |
| Provision to return permanent difference | 4 | | | (810) | | | (17) | |
| R&D credits | (166) | | | (149) | | | (209) | |
| Fuel tax credit | (226) | | | (181) | | | (142) | |
| | | | | |
| | | | | |
| | | | | |
| Unrecognized tax benefits | — | | | — | | | 70 | |
| NOL carryback/carryforward | 1,265 | | | (714) | | | 14 | |
| Nondeductible asset basis | (184) | | | 342 | | | 909 | |
| Compensation deduction limitation | — | | | — | | | 426 | |
| | | | | |
| Total income tax benefit | $ | (2,740) | | | $ | (6,901) | | | $ | (3,205) | |
Deferred income taxes reflect the net tax effects of loss and credit carry-forwards and temporary differences between the carrying amounts of assets and liabilities for financial reporting purposes and the amounts used for income tax purposes.
SMART SAND, INC.
NOTES TO CONSOLIDATED FINANCIAL STATEMENTS
(in thousands of U.S. dollars, except per share data)
Significant components of the Company’s deferred tax assets for federal and state income taxes are as follows: | | | | | | | | | | | |
| | Year Ended December 31, |
| | 2024 | | 2023 |
| Deferred tax assets: | | | |
| Reserves and accruals | $ | 1,858 | | | $ | 1,928 | |
| Prepaid expenses and other | 1,819 | | | 1,373 | |
| Federal net operating losses | 15,877 | | | 15,980 | |
| State net operating losses | 2,032 | | | 1,595 | |
| Operating lease liabilities | 5,925 | | | 5,688 | |
| Total gross deferred tax assets | 27,511 | | | 26,564 | |
| Less valuation allowance | (2,156) | | | (874) | |
| Total net deferred tax assets | 25,355 | | | 25,690 | |
| Deferred tax liabilities: | | | |
| | | |
| Depreciation and amortization | (29,030) | | | (32,361) | |
| Foreign net operating losses | (50) | | | (50) | |
| Operating lease right-of-use assets | (5,591) | | | (5,380) | |
| Total deferred tax liabilities | (34,671) | | | (37,791) | |
| | | |
| Deferred tax liabilities, long-term, net | $ | (9,316) | | | $ | (12,101) | |
In assessing the realizability of deferred tax assets, the Company considered whether it is more likely than not that some portion or all of the deferred tax assets will not be realized. The ultimate realization of deferred tax assets is dependent upon the generation of future taxable income during the period in which those temporary differences become deductible. A valuation allowance should be recorded if, based on the weight of all positive and negative evidence, it is more likely than not that some portion or all of a deferred tax asset will not be related. At December 31, 2024 and December 31, 2023, the Company determined it was more likely than not that it will not be able to fully realize the benefits of certain existing deductible temporary differences and has recorded a partial valuation allowance against the gross deferred tax assets on its consolidated balance sheet in the amount of $2,156 and $874, respectively. As of December 31, 2024, the Company’s U.S. federal net operating loss carryforwards may be carried forward indefinitely and the majority or its state net operating loss carryforwards and federal tax credits will expire at various dates from December 31, 2032 through December 31, 2044 with the remaining being carried forward indirectly.
The Company has recorded a liability of $2,240 for unrecognized tax benefits for uncertain tax positions included on its consolidated balance sheet as of December 31, 2024 and 2023. The liability for unrecognized tax benefits would change the effective tax rate if recognized. A reconciliation of the beginning and ending amounts of unrecognized tax benefits is as follows:
| | | | | | | | |
| | Unrecognized tax benefits |
| Balance at December 31, 2022 | | $ | 2,240 | |
| Additions based on prior year positions | | — | |
| Decreases due to settlements and /or reduction in reserves | | — | |
| Balance at December 31, 2023 | | $ | 2,240 | |
| Additions based on prior year positions | | — | |
| Decreases due to settlements and /or reduction in reserves | | — | |
| Balance at December 31, 2024 | | $ | 2,240 | |
The Company’s federal income tax returns subsequent to 2020 remain open to audit by taxing authorities. The Company has not been informed that its tax returns are the subject of any audit or investigation by taxing authorities.
SMART SAND, INC.
NOTES TO CONSOLIDATED FINANCIAL STATEMENTS
(in thousands of U.S. dollars, except per share data)
NOTE 15 — Retirement Benefits
U.S. Defined Contribution Plan
The Company is the sponsor of a defined contribution plan, subject to the provisions of the Employee Retirement Income Security Act of 1974, that covers substantially all U.S. employees over the age of 21 that have been employed for at least 90 days. The plan allows participants to make pre-tax and Roth after-tax contributions and the Company provides 100% matching on the first 3% and 50% matching on the next 2% of employee’s eligible deferred compensation. Employees are immediately vested in both their contributions and the Company’s matching contributions. In accordance with the provisions of the plan, the Company may make additional discretionary contributions to the accounts of its participants. There were no additional discretionary contributions during the years ended December 31, 2024, 2023 and 2022. During the years ended December 31, 2024, 2023 and 2022, the Company made matching contributions of $952, $677 and $572, respectively to its U.S. Defined Contribution Plan.
NOTE 16 — Commitments and Contingencies
Future Minimum Commitments
The Company is obligated under certain contracts for minimum payments for the right to use land for extractive activities, which is not within the scope of leases under ASC 842. Future minimum annual commitments under such contracts at December 31, 2024 are as follows: | | | | | |
| |
| 2025 | $ | 2,462 | |
| 2026 | 2,456 | |
| 2027 | 2,449 | |
| 2028 | 2,275 | |
| 2029 | 2,275 | |
| Thereafter | 17,431 | |
| Total future minimum annual commitments under these obligations | $ | 29,348 | |
Litigation
In addition to the matters described below, the Company may be subject to various legal proceedings, claims and governmental inspections, audits or investigations arising out of our operations in the normal course of business, which cover matters such as general commercial, governmental and trade regulations, product liability, environmental, intellectual property, employment and other actions. Although the outcomes of these routine claims cannot be predicted with certainty, in the opinion of management, the ultimate resolution of these matters will not have a material adverse effect on our financial statements.
Cory Berg, et al. v. Hi-Crush Blair LLC, LLC et al., Case No. 2019-cv-65, Trempealeau County, Wisconsin
Leland Drangstveit, et al. v. Hi-Crush Blair, LLC, et al., Case No. 2019-cv-66, Trempealeau County, Wisconsin
On April 22, 2019 and September 29, 2021, Cory Berg, et al. and Leland Drangstveit, et al., respectively (collectively, the “Plaintiffs”), filed complaints and an amended complaint in separate actions against Blair, certain of its subcontractors and its and their respective insurance companies in the Circuit Court of the State of Wisconsin in and for Trempealeau County (Case Nos. 19-CV-65 and 19-CV-66, respectively). The Plaintiffs allege that Blair and its subcontractors were negligent and created a nuisance by, among other things, generating excessive noise, light and dust. The Plaintiffs are seeking unspecified monetary damages and other relief. The insurance companies included as defendants have asserted counterclaims seeking declarations as to their rights and liabilities under their respective applicable commercial general liability insurance policies. HCR has agreed under the Purchase Agreement to indemnify the Company for any actions or omissions of HCR or its affiliates (including Blair) that occurred prior to the closing of the Company’s acquisition of Blair. In late August, several of the defendants, including Blair, agreed to settlement terms with the Plaintiffs, and the parties expect to finalize settlement paperwork in the first quarter of 2025, which will result in a dismissal with prejudice of all claims against Blair.
SMART SAND, INC.
NOTES TO CONSOLIDATED FINANCIAL STATEMENTS
(in thousands of U.S. dollars, except per share data)
Bonds
The Company has performance bonds with various public and private entities regarding reclamation, permitting and maintenance of public roadways. Total performance bonds as of December 31, 2024 was $19,727.
NOTE 17 — Supplemental Disclosures of Cash Flow information
Supplemental disclosures regarding cash flow information and non-cash investing and financing activities are as follows: | | | | | | | | | | | | | | | | | |
| Year Ended December 31, |
| 2024 | | 2023 | | 2022 |
| Cash paid for interest | $ | 1,413 | | | $ | 1,116 | | | $ | 1,239 | |
| Cash paid for income taxes | $ | (78) | | | $ | 211 | | | $ | 187 | |
| Non-cash investing activities: | | | | | |
| Asset retirement obligation | $ | 871 | | | $ | 328 | | | $ | 1,975 | |
| Non-cash financing activities: | | | | | |
| Equipment purchased with debt | $ | 2,214 | | | $ | 1,206 | | | $ | 445 | |
| Capitalized expenditures in accounts payable and accrued expenses | $ | 1,096 | | | $ | 834 | | | $ | 958 | |
| Treasury stock purchased with debt | $ | — | | | $ | 4,425 | | | $ | — | |
ITEM 9. — CHANGES IN AND DISAGREEMENTS WITH ACCOUNTANTS AND FINANCIAL DISCLOSURE
None.
ITEM 9A. — CONTROLS AND PROCEDURES
Evaluation of Disclosure Controls and Procedures
Our management, with the participation of our Chief Executive Officer and Chief Financial Officer, has evaluated the effectiveness of our disclosure controls and procedures (as defined in Rules 13a-15(e) and 15d-15(e) under the Exchange Act) as of the end of the period covered by this Annual Report on Form 10-K. Based on such evaluation, our Chief Executive Officer and Chief Financial Officer have concluded that as of such date, our disclosure controls and procedures were effective.
Management’s Report on Internal Control Over Financial Reporting
Our management is responsible for establishing and maintaining adequate internal control over financial reporting, as defined in Rules 13a-15(f) and 15d-15(f) of the Exchange Act. Our internal control over financial reporting is a process designed under the supervision of our Chief Executive Officer and Chief Financial Officer to provide reasonable assurance regarding the reliability of financial reporting and the preparation of financial statements for external purposes in accordance with generally accepted accounting principles.
Because of its inherent limitations, internal control over financial reporting may not detect or prevent misstatements. Also, projections of any evaluation of the effectiveness to future periods are subject to risk that controls may become inadequate because of changes in conditions, or that the degree of compliance with the policies or procedures may deteriorate.
As of December 31, 2024, our management assessed the effectiveness of our internal control over financial reporting based on the criteria for effective internal control over financial reporting established in Internal Control - Integrated Framework, issued by the Committee of Sponsoring Organizations of the Treadway Commission in 2013. Based on its assessment, management determined that we maintained effective internal control over financial reporting as of December 31, 2024.
Our independent registered public accounting firm is not yet required to formally attest to the effectiveness of our internal controls over financial reporting, and will not be required to do so for as long as we are a smaller reporting company as defined in Rule 12b-2 of the Exchange Act.
Changes in Internal Controls Over Financial Reporting
There have been no changes in our internal control over financial reporting for the three months ended December 31, 2024 that have materially affected, or are reasonably likely to materially affect, our internal control over financial reporting. Effective July 1, 2024, the Company upgraded its enterprise management and accounting system. Management has maintained its control environment during this transition through risk evaluation, monitoring, communication and separation of duties. Detective and preventative controls have been maintained or enhanced in the new system. We will continue to evaluate whether there are changes that materially affect or are reasonably likely to have materially affected, our internal control over financial reporting.
ITEM 9B. — OTHER INFORMATION
Information Required to be Disclosed on Form 8-K for the Fiscal Quarter Ended December 31, 2023, But Not Reported.
None.
Trading Plans
During the three months ended December 31, 2024, none of our directors or officers (as defined in Rule 16a-1(f) of the Securities Exchange Act of 1934) informed us of the adoption or termination of a “Rule 10b5-1 trading arrangement” or “non-Rule 10b5-1 trading arrangement,” as defined in Item 408 of Regulation S-K.
ITEM 9C. — DISCLOSURES REGARDING FOREIGN JURISDICTIONS THAT PREVENT INSPECTIONS
None.
PART III
ITEM 10. — DIRECTORS, EXECUTIVE OFFICERS AND CORPORATE GOVERNANCE
The information required by this item with respect to directors and corporate governance will be set forth under “Proposal No. 1: Election of Directors” in the 2025 Proxy Statement and is incorporated herein by reference.
The information required by this item with respect to executive officers of Smart Sand, Inc., pursuant to instruction 3 of paragraph (b) of Item 401 of Regulation S-K, is set forth following Part I, Item 1 of this Annual Report on Form 10-K under “Executive Officers of the Registrant”.
The information required by this item regarding Section 16(a) beneficial ownership reporting compliance will be set forth under “Section 16(a) Beneficial Ownership Reporting Compliance” in the 2025 Proxy Statement and is incorporated herein by reference.
The Company has adopted an Insider Trading Compliance Policy that governs the purchase, sale, and/or other dispositions of our securities by directors, officers, and employees that is reasoanbly designed to promote compliance with insider trading laws, rules and regulations and NASDAQ listing standards. A copy of our Insider Trading Compliance Policy is filed as Exhibit 19 to this report.
ITEM 11. — EXECUTIVE COMPENSATION
The information required by this item will be set forth under “Executive Compensation” in the 2025 Proxy Statement and is incorporated herein by reference.
ITEM 12. — SECURITY OWNERSHIP OF CERTAIN BENEFICIAL OWNERS AND MANAGEMENT AND RELATED STOCKHOLDER MATTERS
The Equity Compensation Plan Information table required pursuant to Item 201(d) of Regulation S-K will be set forth in the 2025 Proxy Statement and is incorporated herein by reference.
The information required by Item 403 of Regulation S-K regarding security ownership of certain beneficial owners and management will be set forth under “Principal Stockholders” in the 2023 Proxy Statement and is incorporated herein by reference.
ITEM 13. — CERTAIN RELATIONSHIPS AND RELATED TRANSACTIONS, AND DIRECTOR INDEPENDENCE
The information required by this item will be set forth under “Certain Relationships and Transactions with Related Persons” and “Corporate Governance” in the 2025 Proxy Statement and is incorporated herein by reference.
ITEM 14. — PRINCIPAL ACCOUNTANT FEES AND SERVICES
The information required by this item will be set forth under “Ratification of the Selection of Grant Thornton LLP as the Company’s Independent Registered Public Accounting Firm for the Year Ending December 31, 2024” in the 2025 Proxy Statement and is incorporated herein by reference.
PART IV
ITEM 15. — EXHIBITS, FINANCIAL STATEMENT SCHEDULES
(a)Financial Statements
(1)The Consolidated Financial Statements are included in Part II, Item 8 of this Annual Report on Form 10-K.
(2)Financial Statement Schedules:
SCHEDULE II - VALUATION AND QUALIFYING ACCOUNTS
| | | | | | | | | | | | | | | | | | | | | | | | | | |
| | Balance at Beginning of the Year | | Charged to cost and expenses | | Additions (Deductions) | | Balance at End of the Year |
| Year Ended December 31, 2023 | | | | | | | | |
| Deferred tax asset valuation allowance | | $ | 1,588 | | | $ | — | | | $ | (714) | | | $ | 874 | |
| Year Ended December 31, 2024 | | | | | | | | |
| Deferred tax asset valuation allowance | | $ | 874 | | | $ | — | | | $ | 1,282 | | | $ | 2,156 | |
(b)Exhibits
| | | | | | | | |
| 2.1 | | |
| 2.2 | | |
| 3.1 | | |
| 3.2 | | |
| 4.1 | | |
| 4.2 | | |
| 4.3* | | |
| 10.1† | | |
| 10.2† | | |
| 10.3† | | |
| 10.4† | | |
| 10.5 | | |
| 10.6 | | |
| | | | | | | | |
| 10.7 | | |
| 10.8 | | |
| 10.9 | | ABL Credit Agreement, dated December 13, 2019, among Smart Sand, Inc., the subsidiary borrowers and guarantors party thereto, Jefferies Finance LLC, as issuing bank, swingline lender and agent, and certain other lenders from time to time party thereto (incorporated by reference to Exhibit 10.14 to Smart Sand, Inc.’s Annual Report of Form 10-K filed with the SEC on March 14, 2020) |
| 10.10 | | |
| 10.11 | | |
| 10.12 | | |
| 10.13 | | |
| 10.14 | | |
| 10.15‡ | | |
| 10.16† | | |
| 10.17† | | |
| 10.18† | | |
| 10.19‡ | | |
| 10.20‡ | | |
| 10.21 | | |
| 10.22 | | |
| 10.23‡ | | |
| 10.24‡ | | |
| | | | | | | | |
| 10.25‡ | | |
| 10.26 | | |
| 10.27 | | |
| 10.28 | | |
| 10.29 | | ABL Credit Agreement, dated September 3, 2024, among Smart Sand, Inc., the subsidiary borrowers and guarantors party thereto, First-Citizens Bank & Trust Company, an issuing bank, swingline lender and agent, and certain other lenders from time to time party thereto (incorporation by reference to Exhibit 10.1 to Smart Sand Inc.’s Current Report on Form 8-K filed with the SEC on September 9, 2024) |
| 19.1* | | |
| 21.1* | | |
| 23.1* | | |
| 23.2* | | |
| 31.1* | | |
| 31.2* | | |
32.1*t | | |
32.2*t | | |
| 95.1* | | |
| 97.1 | | |
| 101.INS* | | XBRL Instance Document |
| 101.SCH* | | XBRL Taxonomy Extension Schema |
| 101.CAL* | | XBRL Taxonomy Extension Calculation Linkbase |
| 101.DEF* | | XBRL Taxonomy Extension Definition Linkbase |
| 101.LAB* | | XBRL Taxonomy Extension Label Linkbase |
| 101.PRE* | | XBRL Taxonomy Extension Presentation Linkbase |
| 104* | | Cover Page Interactive Data File (formatted as Inline XBRL and contained in Exhibit 101) |
| | | | | |
| * | Filed herewith |
| † | Compensatory plan, contract or arrangement. |
| ‡ | Certain portions have been omitted pursuant to a confidential treatment request. Omitted information has been separately filed with the Securities and Exchange Commission. |
| t | This certification is deemed not filed for purposes of section 18 of the Securities Exchange Act of 1934, as amended (Exchange Act), or otherwise subject to the liability of that section, nor shall it be deemed incorporated by reference into any filing under the Securities Act of 1933, as amended or the Exchange Act. |
ITEM 16. — FORM 10-K SUMMARY
None.
Signatures
Date: March 3, 2025
Pursuant to the requirements of Section 13 or 15(d) of the Securities Exchange Act of 1934, the registrant has duly caused this report to be signed on its behalf by the undersigned, thereunto duly authorized.
| | | | | | | | |
| /s/ Charles E. Young | | /s/ Lee E. Beckelman |
| Charles E. Young, | | Lee E. Beckelman |
| Director and Chief Executive Officer | | Chief Financial Officer |
| (Principal Executive Officer) | | (Principal Financial Officer) |
| | | |
| /s/ Christopher Green | | /s/ Frank Porcelli |
| Christopher Green | | Frank Porcelli |
| Controller and Vice President of Accounting | | Director |
| (Principal Accounting Officer) | | |
| | |
| /s/ Andrew Speaker | | /s/ Sharon Spurlin |
| Andrew Speaker | | Sharon Spurlin |
| Director | | Director |
| (Chairman of the Board) | | |
| | |
| /s/ Timothy J. Pawlenty | | |
| Timothy J. Pawlenty | | |
| Director | | |
| | |