Exhibit 99.1
|

Investor Presentation
November 2014
|
Safe Harbor Statement
Cautionary Statement Regarding Risks and Uncertainties That May Affect Future Results
This presentation may contain forward-looking statements within the meaning of the Private Securities Litigation Reform Act of 1995 about the business, financial condition and prospects of Enova International, Inc. (“Enova” or the “Company”). These forward-looking statements give current expectations or forecasts of future events and reflect the views and assumptions of the Company’s senior management with respect to the business, financial condition and prospects of the Company as of the date of this presentation and are not guarantees of future performance. The actual results of the Company could differ materially from those indicated by such forward -looking statements because of various risks and uncertainties applicable to the Company’s business, including, without limitation, those risks and uncertai nties indicated in the Company’s filings with the Securities and Exchange Commission (“SEC”), especially the Registration Statement on Form 10 f iled with the
SEC on July 31, 2014 (as subsequently amended and declared effective on October 24, 2014) and Forms 8-K. These risks and uncertainties are beyond the ability of the Company to control, and, in many cases, the Company cannot predict all of the risks and uncertainties that could cause its actual results to differ materially from those indicated by the forward -looking statements. When used in this presentation, the words
“believes,” “estimates,” “plans,” “expects,” “anticipates” and similar expressions or variations as they relate to the Company or its management are intended to identify forward-looking statements. The Company cautions you not to put undue reliance on these statements. The Company disclaims any intention or obligation to update or revise any forward -looking statements after the date of this presentation.
Non-GAAP Financial Information
In addition to the financial information prepared in conformity with generally accepted accounting principles in the United S tates (“GAAP”), the Company provides cash flow from operating activities less net consumer loans originated, acquired and repaid and purchases of property and equipment (“free cash flow”) and net income excluding depreciation, amortization, interest, foreign currency transaction gains or losses and taxes (“Adjusted EBITDA”), which are not considered measures of financial performance under GAAP. Management uses these non-GAAP financial measures for internal managerial purposes and believes that their presentation is meaningful and useful in understanding the activities and business metrics of the Company’s operations. Management believes that these non-GAAP financial measures reflect an additional way of viewing aspects of the Company’s business that, when viewed with the Company’s GAAP results, provides a more complete understanding of factors and trends affecting the Company’s business.
Management provides such non-GAAP financial information for informational purposes and to enhance understanding of the Company’s
GAAP consolidated financial statements. Readers should consider the information in addition to, but not instead of, the Comp any’s financial statements prepared in accordance with GAAP. This non-GAAP financial information may be determined or calculated differently by other companies, limiting the usefulness of those measures for comparative purposes. A table reconciling such non-GAAP financial measures is available in the appendix.
2
|
Company Highlights
Proven Technology and Analytics with 10 Years of Data
Proprietary Online Model Enables Rapid Expansion at Low Cost
Large Addressable Market with Robust Global Trends
Strong Cash Flow Reinvested in Growth
Superior Financials with Strong Growth in Revenues and Profits
Experienced, Successful Leadership Team
3
|
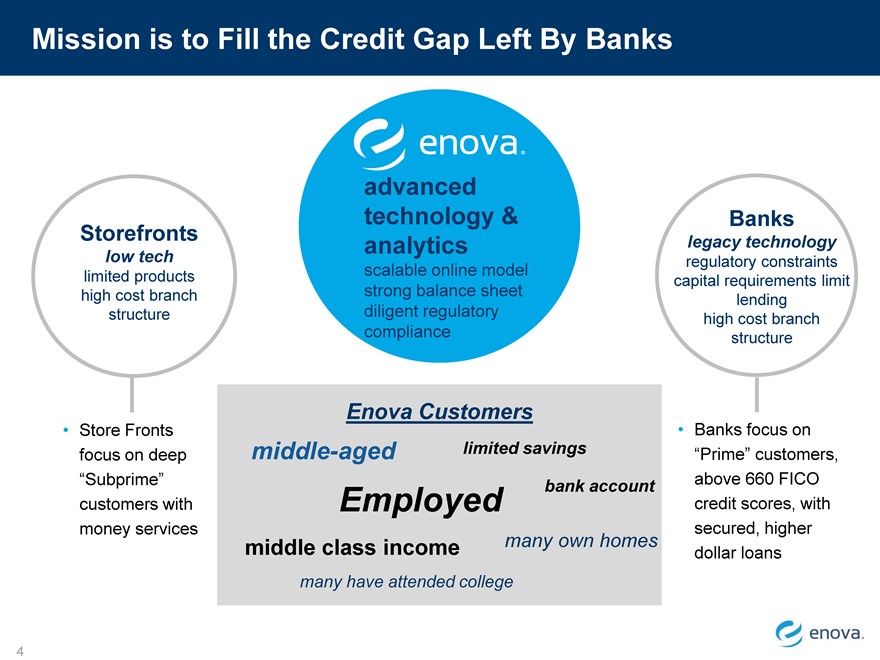
Mission is to Fill the Credit Gap Left By Banks
Storefronts
low tech limited products high cost branch structure
Store Fronts focus on deep
“Subprime” customers with money services
advanced technology & analytics
scalable online model strong balance sheet diligent regulatory compliance
Banks
legacy technology regulatory constraints capital requirements limit lending high cost branch structure
Banks focus on
“Prime” customers, above 660 FICO credit scores, with secured, higher dollar loans
Enova Customers
middle-aged limited savings
Employed bank account
middle class income many own homes
many have attended college
4
|
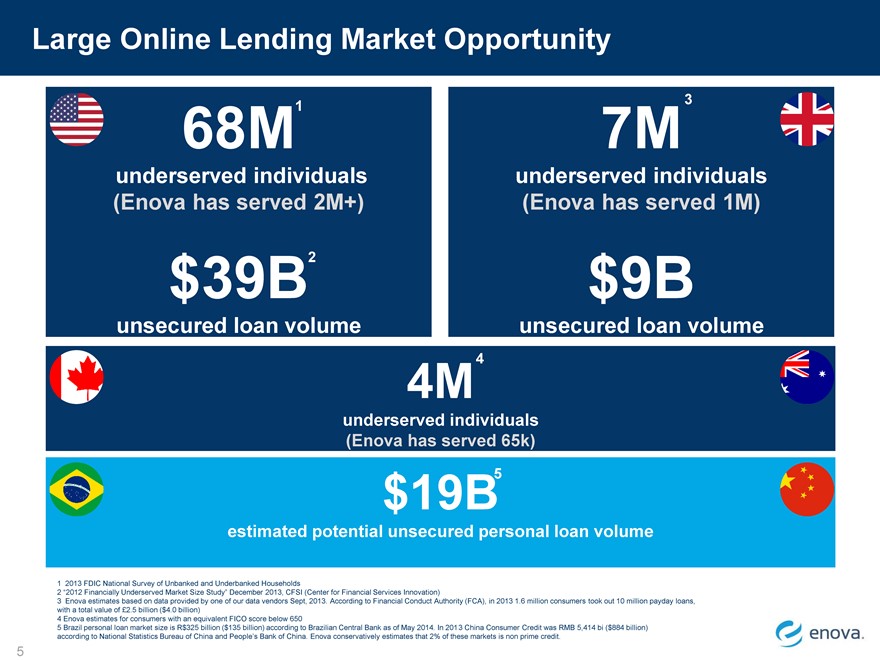
Large Online Lending Market Opportunity
68M1 7M 3
underserved individuals underserved individuals
(Enova has served 2M+) (Enova has served 1M)
$39B2 $9B
unsecured loan volume unsecured loan volume
4M4
underserved individuals
(Enova has served 65k)
$19B5
estimated potential unsecured personal loan volume
1 2013 FDIC National Survey of Unbanked and Underbanked Households
2 “2012 Financially Underserved Market Size Study” December 2013, CFSI (Center for Financial Services Innovation)
3 Enova estimates based on data provided by one of our data vendors Sept, 2013. According to Financial Conduct Authority (FCA), in 2013 1.6 million consumers took out 10 million payday loans, with a total value of £2.5 billion ($4.0 billion)
4 Enova estimates for consumers with an equivalent FICO score below 650
5 Brazil personal loan market size is R$325 billion ($135 billion) according to Brazilian Central Bank as of May 2014. In 2013 China Consumer Credit was RMB 5,414 bi ($884 billion) according to National Statistics Bureau of China and People’s Bank of China. Enova conservatively estimates that 2% of these markets is non prime credit.
5
|

Three Core Products
Average loan size: $515
Short-Term Loans
Single payment loans Term:Generally 7—90 days
2004 2007 2009 2009
Average loan size: $1,399
Term: Generally 2—12 months 2008 2010 2013
Installment Loans
Fully amortizing installment loan Average _Near-Prime_ loan size: $3,344
Term: Generally 12—36 months, with 2012
certain loans up to 60 months
Average draw size: $273
Lines of Credit Term:
Borrow as often as needed in U.S.: Open 2010 2014
increments up to customers_
available credit limits U.K.: 1 _ 10 months
Note: time period for average loan size, average draw size and term is nine months ended September, 30, 2014.
6
|
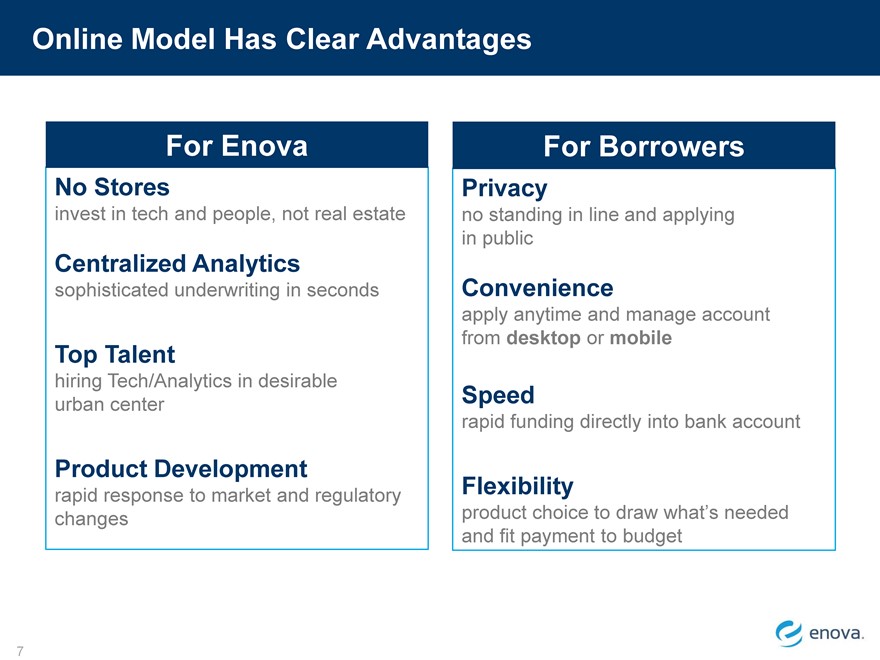
Online Model Has Clear Advantages
For Enova
No Stores
invest in tech and people, not real estate
Centralized Analytics
sophisticated underwriting in seconds
Top Talent
hiring Tech/Analytics in desirable urban center
Product Development
rapid response to market and regulatory changes
For Borrowers
Privacy
no standing in line and applying in public
Convenience
apply anytime and manage account from desktop or mobile
Speed
rapid funding directly into bank account
Flexibility
product choice to draw what_s needed and fit payment to budget
7
|
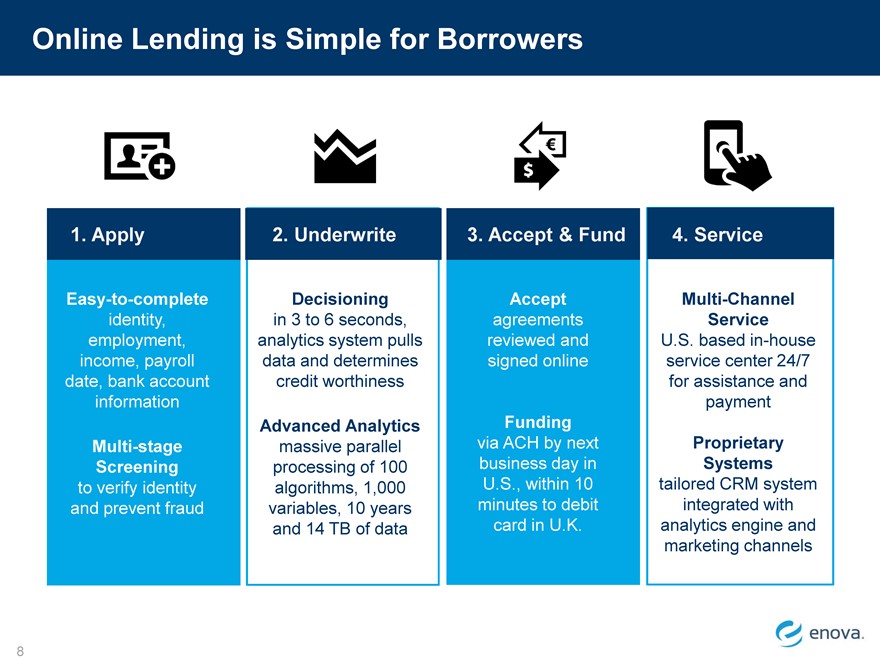
Online Lending is Simple for Borrowers
1. Apply
Easy-to-complete identity, employment, income, payroll date, bank account information
Multi-stage Screening to verify identity and prevent fraud
2. Underwrite
Decisioning in 3 to 6 seconds, analytics system pulls data and determines credit worthiness
Advanced Analytics massive parallel processing of 100 algorithms, 1,000 variables, 10 years and 14 TB of data
3. Accept & Fund
Accept agreements reviewed and signed online
Funding via ACH by next business day in U.S., within 10 minutes to debit card in U.K.
4. Service
Multi-Channel Service
U.S. based in-house service center 24/7 for assistance and payment
Proprietary Systems tailored CRM system integrated with analytics engine and marketing channels
8
|

Focused on Key Strategies
9
Strategy
Drive efficient
Execution
with Technology and Analytics
Diversify
Products and Geographies
Innovate
Products and Internal Functions
|
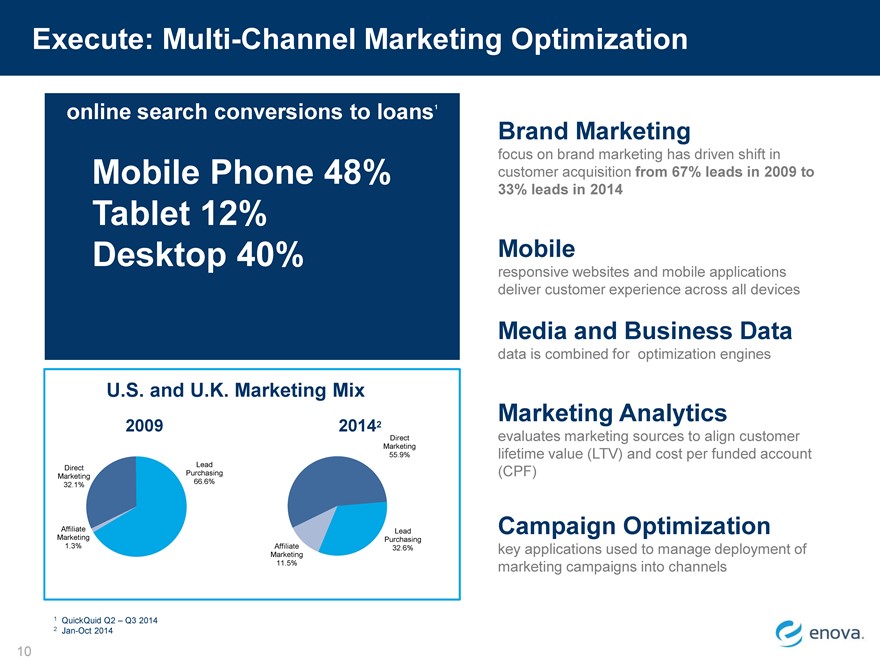
Execute: Multi-Channel Marketing Optimization
online search conversions to loans1
Mobile Phone 48% Tablet 12% Desktop 40%
U.S. and U.K. Marketing Mix
2009 20142
Direct
Marketing
55.9%
Direct Lead
Marketing Purchasing
32.1% 66.6%
Affiliate Lead
Marketing Purchasing
1.3% Affiliate 32.6%
Marketing
11.5%
Brand Marketing
focus on brand marketing has driven shift in customer acquisition from 67% leads in 2009 to 33% leads in 2014
Mobile
responsive websites and mobile applications deliver customer experience across all devices
Media and Business Data
data is combined for optimization engines
Marketing Analytics
evaluates marketing sources to align customer lifetime value (LTV) and cost per funded account (CPF)
Campaign Optimization
key applications used to manage deployment of marketing campaigns into channels
10
|
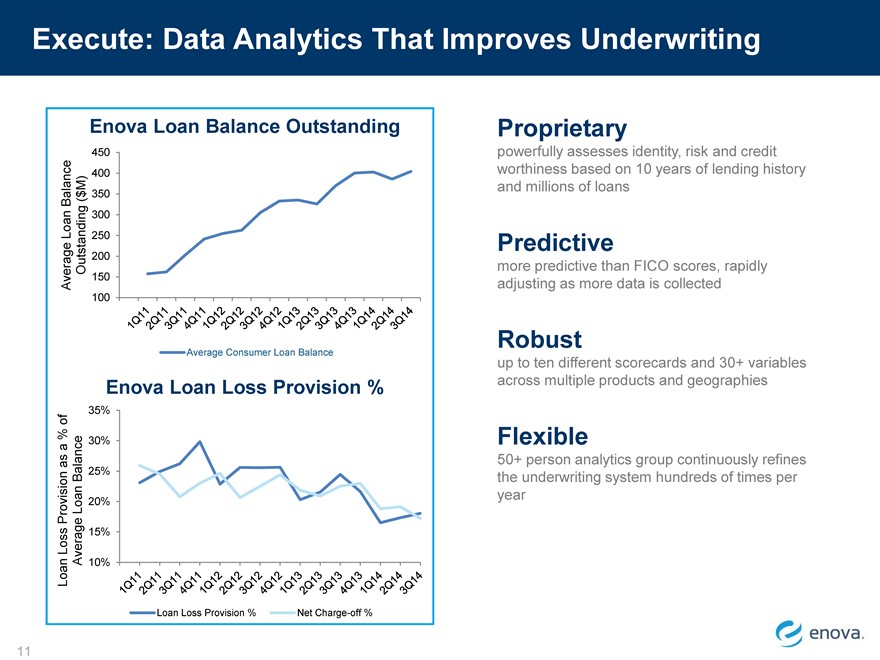
Execute: Data Analytics That Improves Underwriting
Enova Loan Balance Outstanding
450
Enova Customer Service Satisfaction 2013
100%
90%
80%
70%
60%
Jan Feb Mar Apr May Jun Jul Aug Sep Oct Nov Dec
Loan Loss Provision %
Net Charge-off %
Proprietary
powerfully assesses identity, risk and credit worthiness based on 10 years of lending history and millions of loans
Predictive
more predictive than FICO scores, rapidly adjusting as more data is collected
Robust
up to ten different scorecards and 30+ variables across multiple products and geographies
Flexible
50+ person analytics group continuously refines the underwriting system hundreds of times per year
11
|
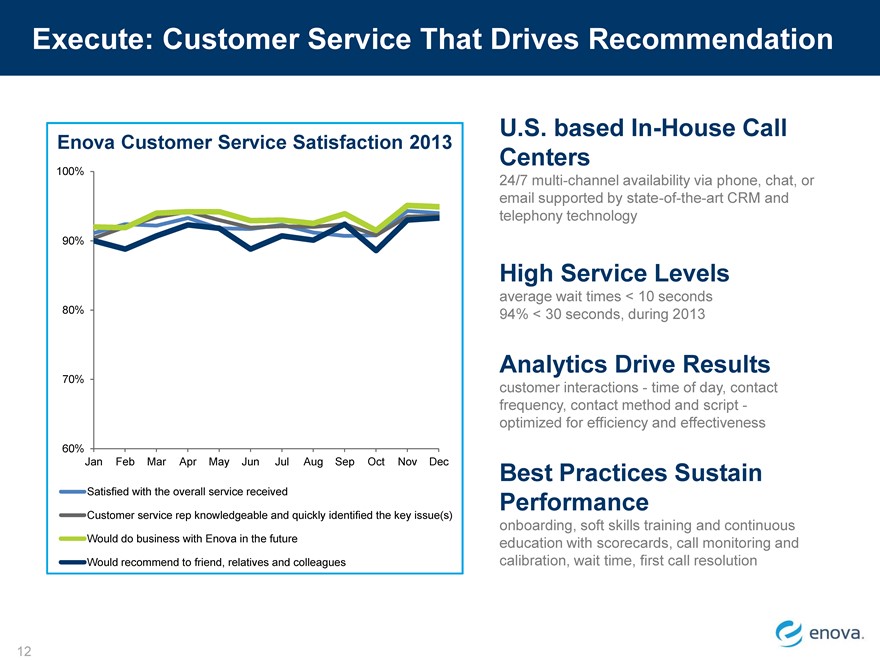
Execute: Customer Service That Drives Recommendation
Enova Customer Service
Satisfaction 2013
100%
90%
80%
70%
60%
Jan Feb Mar Apr May Jun
Jul
Aug Sep Oct Nov Dec
Satisfied with the overall service received
Customer service rep knowledgeable and quickly identified the key issue(s) Would do business with Enova in the future Would recommend to friend, relatives and colleagues
U.S. based In-House Call
Centers
24/7 multi-channel availability via phone, chat, or email supported by state-of-the-art CRM and telephony technology
High Service Levels
average wait times < 10 seconds 94% < 30 seconds, during 2013
Analytics Drive Results
customer interactions—time of day, contact frequency, contact method and script—optimized for efficiency and effectiveness
Best Practices Sustain Performance
onboarding, soft skills training and continuous education with scorecards, call monitoring and calibration, wait time, first call resolution
12
|
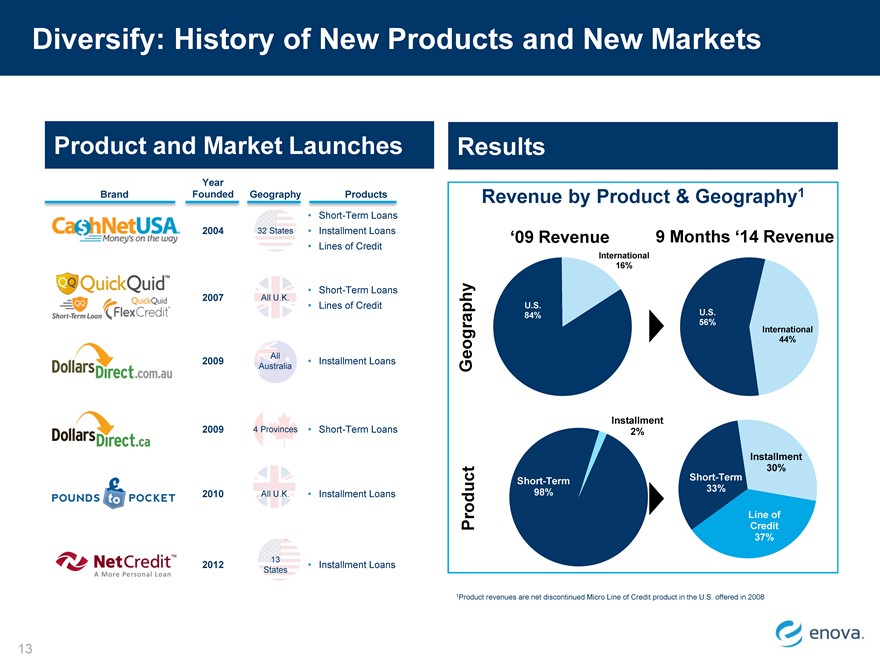
Diversify: History of New Products and New Markets
Product and Market Launches
Year
Brand
Founded
Geography
2004
32 States
2007
All U.K.
2009
All
Australia
20094Provinces
2010
All U.K.
2012
13
States
[Graphic Appears Here]
Short-Term Loans
Installment Loans
Lines of Credit
Short-Term Loans
Lines of Credit
Installment Loans
Short-Term Loans
Installment Loans
Installment Loans
Results
Revenue by Product & Geography1
_09 Revenue
9 Months _14 Revenue
International
16%
U.S.
84%
U.S.
56%
International
Geography
44%
Installment
0%2%
Installment
30%
Short-Term
Short-Term
98%
33%
Line of
Product
Credit
37%
1Product revenues are net discontinued Micro Line of Credit product in the U.S. offered in 2008
13
|
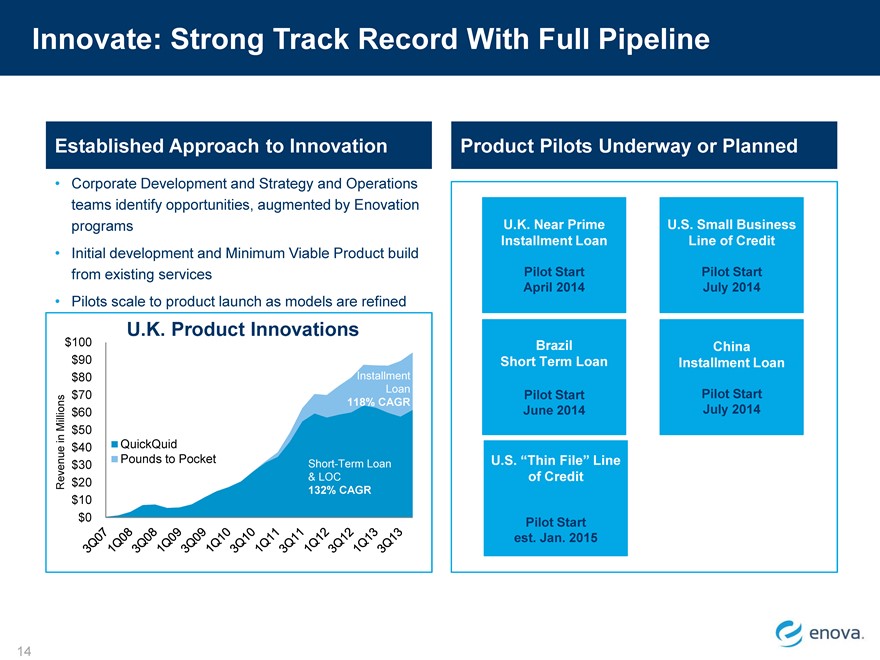
Innovate: Strong Track Record With Full Pipeline
Established Approach to Innovation
U.K. Product Innovations
$100
$90
$80
Installment
Loan
$70
118% CAGR
$60
$50
$40
QuickQuid
$30
Pounds to Pocket
Short-Term Loan
Revenue in Millions
$20
& LOC
132% CAGR
$10
$0
Product Pilots Underway or Planned
14
Corporate Development and Strategy and Operations teams identify opportunities, augmented by Enovation programs Initial development and Minimum Viable Product build from existing services Pilots scale to product launch as models are refined
U.K. Near Prime
U.S. Small Business
Installment Loan
Line of Credit
Pilot Start
Pilot Start
April 2014
July 2014
Brazil
China
Short Term Loan
Installment Loan
Pilot Start
Pilot Start
June 2014
July 2014
U.S. _Thin File_ Lineof Credit
Pilot Startest. Jan. 2015
|
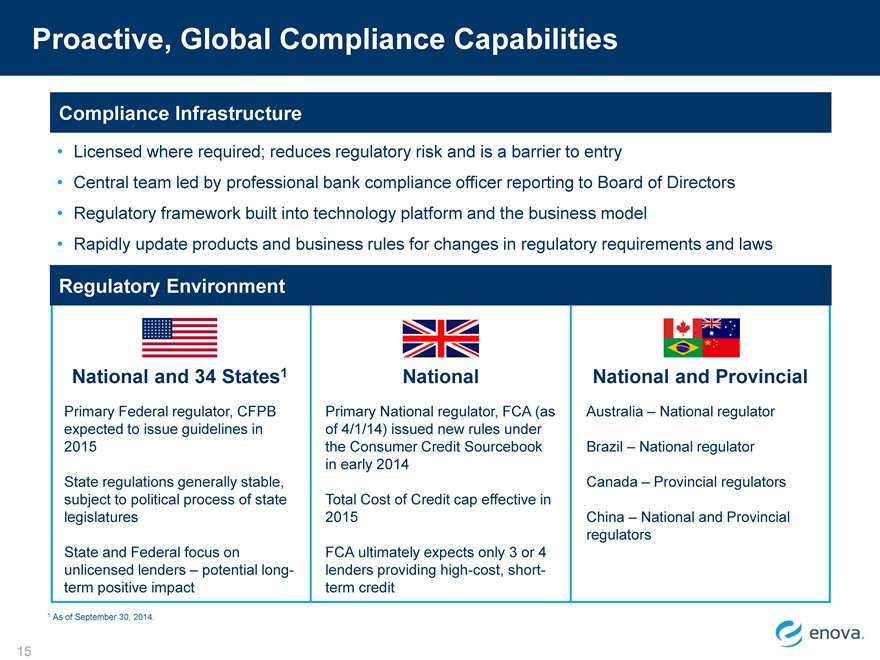
Proactive, Global Compliance Capabilities
Compliance Infrastructure
Regulatory Environment
National and 34 States 1
National
National and Provincial
Primary Federal regulator, CFPB
Primary National regulator, FCA (as
Australia _ National regulator
expected to issue guidelines in
of 4/1/14) issued new rules under
2015
the Consumer Credit Sourcebook
Brazil _ National regulator
in early 2014
State regulations generally stable,
Canada _ Provincial regulators
subject to political process of state
Total Cost of Credit cap effective in
legislatures
2015
China _ National and Provincial
regulators
State and Federal focus on
FCA ultimately expects only 3 or 4
unlicensed lenders _ potential long-
lenders providing high-cost, short-
term positive impact
term credit
1 As of September 30, 2014.
15
Licensed where required; reduces regulatory risk and is a barrier to entry
Central team led by professional bank compliance officer reporting to Board of Directors Regulatory framework built into technology platform and the business model Rapidly update products and business rules for changes in regulatory requirements and laws
|
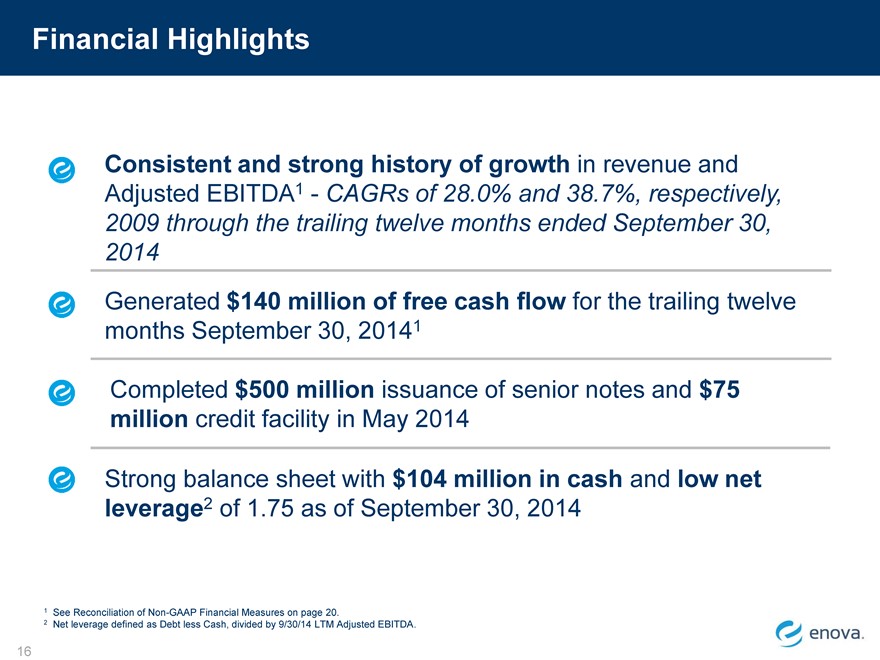
Financial Highlights
Consistent and strong history of growth in revenue and Adjusted EBITDA1—CAGRs of 28.0% and 38.7%, respectively, 2009 through the trailing twelve months ended September 30, 2014
Generated $140 million of free cash flow for the trailing twelve
months September 30, 20141
Completed $500 million issuance of senior notes and $75 million credit facility in May 2014
Strong balance sheet with $104 million in cash and low net leverage2 of 1.75 as of September 30, 2014
See Reconciliation of Non-GAAP Financial Measures on page 20.
Net leverage defined as Debt less Cash, divided by 9/30/14 LTM Adjusted EBITDA.
16
|
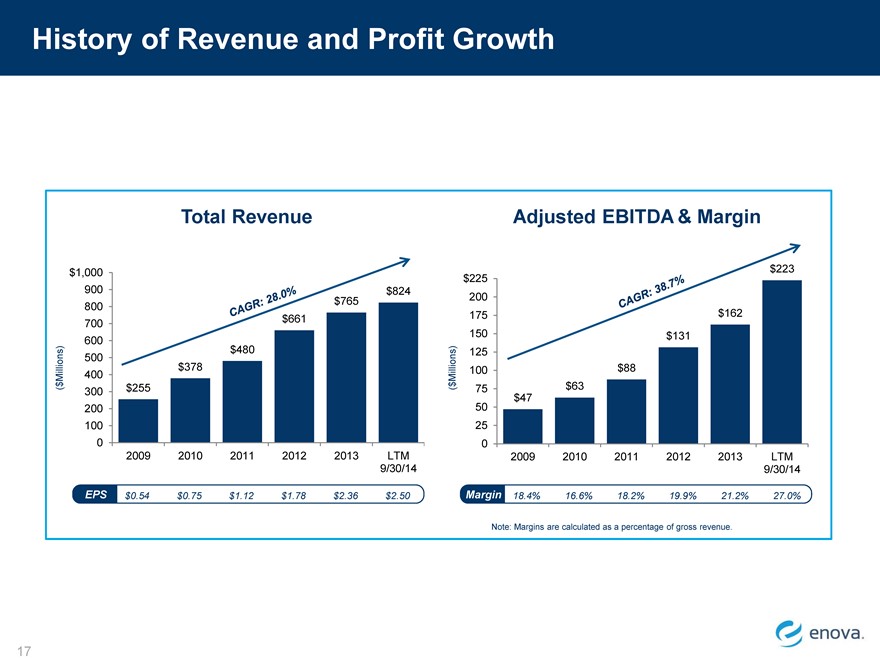
History of Revenue and Profit Growth
Total Revenue Adjusted EBITDA & Margin
$1,000 $223
$225
900 $824
800 $765 200
$661 175 $162
700
600 150 $131
500 $480 125
Millions) 400 $378 Millions) 100 $88
$
( $ 300 $255 ( 75 $63
$47
200 50
100 25
0 0
2009 2010 2011 2012 2013 LTM 2009 2010 2011 2012 2013 LTM
9/30/14 9/30/14
EPS $0.54 $0.75 $1.12 $1.78 $2.36 $2.50 Margin 18.4% 16.6% 18.2% 19.9% 21.2% 27.0%
Note: Margins are calculated as a percentage of gross revenue.
17
|
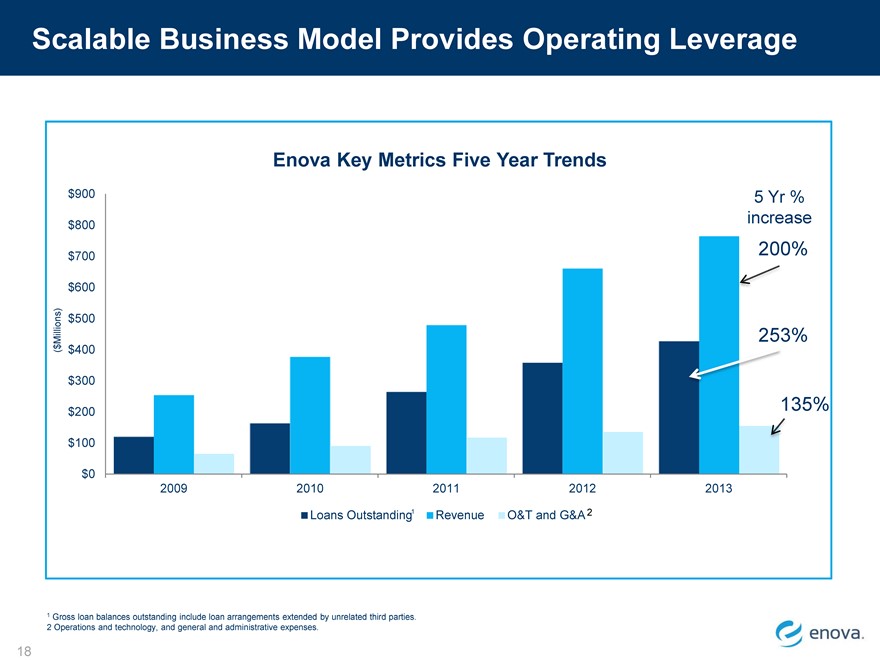
Scalable Business Model Provides Operating Leverage
Enova Key Metrics Five Year Trends
$900 5 Yr %
$800 increase
$700 200%
$600
$500
Millions) 253%
( $ $400
$300
$200 135%
$100
$0
2009 2010 2011 2012 2013
Loans Outstanding1 Revenue O&T and G&A 2
1 Gross loan balances outstanding include loan arrangements extended by unrelated third parties.
2 Operations and technology, and general and administrative expenses.
18
|

Appendix
19
|
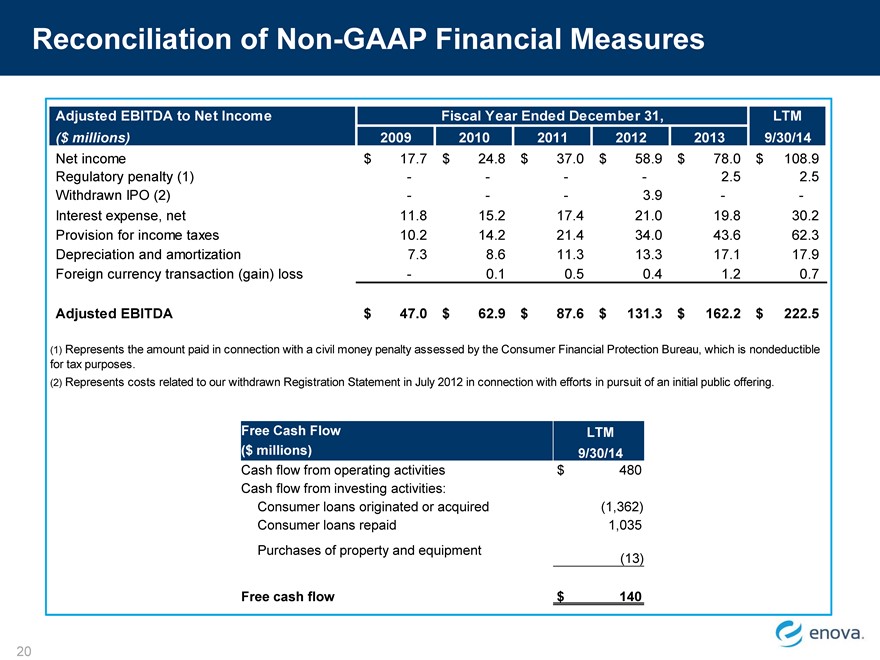
Reconciliation of Non-GAAP Financial Measures
Adjusted EBITDA to Net Income Fiscal Year Ended December 31, LTM
($ millions) 2009 2010 2011 2012 2013 9/30/14
Net income $ 17.7 $ 24.8 $ 37.0 $ 58.9 $ 78.0 $ 108.9
Regulatory penalty (1) - - - - 2.5 2.5
Withdrawn IPO (2) - - - 3.9 - -
Interest expense, net 11.8 15.2 17.4 21.0 19.8 30.2
Provision for income taxes 10.2 14.2 21.4 34.0 43.6 62.3
Depreciation and amortization 7.3 8.6 11.3 13.3 17.1 17.9
Foreign currency transaction (gain) loss - 0.1 0.5 0.4 1.2 0.7
Adjusted EBITDA $ 47.0 $ 62.9 $ 87.6 $ 131.3 $ 162.2 $ 222.5
(1) Represents the amount paid in connection with a civil money penalty assessed by the Consumer Financial Protection Bureau, which is nondeductible
for tax purposes.
(2) Represents costs related to our withdrawn Registration Statement in July 2012 in connection with efforts in pursuit of an initial public offering.
Free Cash Flow LTM
($ millions) 9/30/14
Cash flow from operating activities $ 480
Cash flow from investing activities:
Consumer loans originated or acquired (1,362)
Consumer loans repaid 1,035
Purchases of property and equipment (13)
Free cash flow $ 140
(1) Represents the amount paid in connection with a civil money penalty assessed by the Consumer Financial Protection Bureau, which is nondeductible for tax purposes.
(2) Represents costs related to our withdrawn Registration Statement in July 2012 in connection with efforts in pursuit of an initial public offering.
20
|

THANK YOU