UNITED STATES
SECURITIES AND EXCHANGE COMMISSION
WASHINGTON, D.C. 20549
FORM N-CSR
CERTIFIED SHAREHOLDER REPORT OF REGISTERED
MANAGEMENT INVESTMENT COMPANIES
Investment Company Act file number 811-22609
Oppenheimer Global High Yield Fund
(Exact name of registrant as specified in charter)
6803 South Tucson Way, Centennial, Colorado 80112-3924
(Address of principal executive offices) (Zip code)
Arthur S. Gabinet
OFI Global Asset Management, Inc.
225 Liberty Street, New York, New York 10281-1008
(Name and address of agent for service)
Registrant’s telephone number, including area code: (303) 768-3200
Date of fiscal year end: May 31
Date of reporting period: 5/29/2015
Item 1. Reports to Stockholders.
Class A Shares
AVERAGE ANNUAL TOTAL RETURNS AT 5/29/15*
Class A Shares of the Fund | |||||||||||||||
| Without Sales Charge | With Sales Charge |
J.P. Morgan Global | |||||||||||||
1-Year
| -0.07 | % | -4.81 | % | 1.49 | % | |||||||||
Since Inception (11/8/13)
| 3.23 | 0.07 | 5.04 | ||||||||||||
Performance data quoted represents past performance, which does not guarantee future results. The investment return and principal value of an investment in the Fund will fluctuate so that an investor’s shares, when redeemed, may be worth more or less than their original cost. Fund returns include changes in share price, reinvested distributions, and a 4.75% maximum applicable sales charge except where “without sales charge” is indicated. Returns do not consider capital gains or income taxes on an individual’s investment. For performance data current to the most recent month-end, visit oppenheimerfunds.com or call 1.800.CALL OPP (225.5677).
*May 29, 2015, was the last business day of the Fund’s fiscal year end. See Note 2 of the accompanying Notes to Financial Statements. Index returns are calculated through May 31, 2015.
2 OPPENHEIMER GLOBAL HIGH YIELD FUND
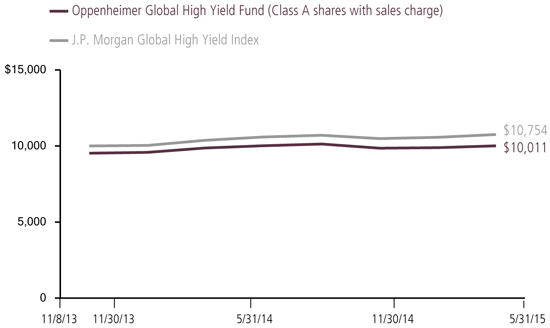
The Fund’s Class A shares (without sales charge) produced a return of -0.07% during the reporting period. In comparison, the J.P. Morgan Global High Yield Index (the “Index”) returned 1.49%.
MARKET OVERVIEW
In 2014, the U.S. Federal Reserve (the “Fed”) began reducing its monthly purchases of U.S. government Treasuries and mortgage-backed securities (“MBS”) in steady $10 billion increments, and completed the process at the end of October, thereby ending the quantitative easing (“QE”) program’s purchases. While economic growth in the U.S. remained largely on track, it slowed in other areas, including Europe, and parts of both Latin America and Asia Pacific. Interest rates in core Europe dropped significantly, and turned negative in many cases. The U.S. dollar rallied strongly against most currencies, including the euro, and Japanese yen. In many cases, the large move in currencies represented buying of the U.S. dollar due to a
positive U.S. economic outlook compared to weakening growth prospects elsewhere, in addition to anticipated higher rates in the U.S. The euro was challenged by persistent weakness in Europe and elevated concerns about deflation. Other nations faced headwinds as well. Japan’s economy remained moribund and falling commodity prices pressured natural resource exporters such as Brazil, Russia and Australia. Russia was also under pressure due to sanctions related to hostilities in eastern Ukraine and Crimea, and the precipitous drop in oil prices. Even countries with positive economic fundamentals saw their currencies drop versus the dollar.
COMPARISON OF CHANGE IN VALUE OF $10,000 HYPOTHETICAL INVESTMENTS IN:
3 OPPENHEIMER GLOBAL HIGH YIELD FUND
The opening months of 2015 were marked by cooling U.S. growth after the strong fourth quarter of 2014. The dollar continued to strengthen significantly during this time against most of the U.S.’s major trading partners, which acted as a drag on growth. Businesses, especially U.S. firms with revenues dependent on exporting goods and services, cited this as a headwind. European Central Bank (“ECB”) President Mario Draghi announced the purchase of €60 billion a month in sovereign bonds from Eurozone countries for at least 19 months, a form of QE that is projected to increase the ECB’s balance sheet by over €1 trillion. The announcement and implementation of these extraordinary monetary policies had a significant impact on financial markets, with European markets rallying and the euro falling against most major trading partners. Fed Chairwoman Janet Yellen reaffirmed that the Fed plans to raise U.S. rates during 2015 despite any near-term weakness in first quarter Gross Domestic Product and employment growth. The Fed has made it clear, however, that it will remain flexible on the timing and extent of rate hikes for the remainder of 2015.
FUND REVIEW
During the reporting period, the Fund’s largest allocation was the U.S. high yield bonds. The U.S. high yield sleeve detracted from performance due to our exposure to the energy sector. As mentioned earlier, energy
had a weak reporting period due to the sharp drop in oil prices. Our exposure to second lien bonds in the energy sector that were not held by the benchmark detracted from performance. We decreased our allocation to energy and to second lien debt in the sector during the reporting period. At period end, our exposure to energy consisted of roughly 11% of the Fund. Also detracting from performance was a position in an unsecured note of a specialty retailer that had a difficult reporting period. We exited our position in the holding during the reporting period.
Positive contributors to performance among U.S. high yield bonds were our underweight position relative to the Index in the metals and mining sector, which experienced declines amid weakening demand in China. In addition, the Fund outperformed the Index within the gaming sector, as we did not have exposure to one of the largest gaming companies in the Index that lost over 50% this reporting period.
Our emerging market corporate bond sleeve produced a negative absolute return and underperformed the Index. The underperformance stemmed primarily from security selection and an overweight position in Russia, which had a tumultuous period, as mentioned earlier. Underweight positions and security selection in China and Hong Kong also detracted. The Fund outperformed the Index in Mexico and Chile, where overweight
4 OPPENHEIMER GLOBAL HIGH YIELD FUND
positions and security selection benefited. Also contributing positively to Fund performance was an out of benchmark position in Barbados. On a sector basis, industrials was a top detractor, as one of the Fund’s holdings defaulted. We no longer held the security at period end. In addition, energy and metals and mining detracted from Fund performance. The energy sector was hit hard in general this reporting period, and the Fund’s security selection underperformed the Index. In metals and mining, security selection resulted in the underperformance versus the Index. Top performers included overweight positions and security selection in the cable and satellite plus food and beverages sectors. An overweight position in paper and packaging also contributed positively to performance relative to the Index.
STRATEGY & OUTLOOK
At period end, the Fund continues to have its largest allocation to U.S. high yield. We increased our exposure to BB-rated bonds this reporting period, and at period end the Fund has its largest allocation to BB-rated bonds, followed by B-rated bonds and CCC-rated bonds. This was largely the result of our move out of second-lien bonds in the energy sector, and opportunistic purchasing of BB-rated issues when the market weakened in the late fourth quarter of 2014 and early first quarter of 2015.
Within our U.S. high yield allocation, our largest overweight positions relative to the Index at period end were industrials and broadcasting. The overweight in industrials is supported by the overall macroeconomic outlook for domestic manufacturing, with a particular focus on favorable fundamentals in the aerospace subsector. Many companies in the broadcasting sector continue to post solid fundamental performance. We believe the outlook for broadcasting is bright given the expectation of higher advertising spending as the election cycle picks up. Our biggest underweights relative to the Index at period end were metals and mining, energy, and retail. Our underweights in metals and mining and energy were driven by concerns about volatility in commodity prices and, in the case of metals and mining, weakening demand in China. The underweight in retail reflects soft consumer spending and mediocre mall-traffic trends.
Among emerging market corporate high yield bonds, we maintain a defensive positioning, with an overweight in longer-dated BB-rated bonds against an underweight in bonds rated B and below. We expect a trend of rising default rates over the next year due to weaker growth, lower commodity prices and foreign exchange volatility, which we believe will impact the weaker and more marginal companies. We favor export-oriented companies in countries where currency
5 OPPENHEIMER GLOBAL HIGH YIELD FUND
corrections have reduced their local costs significantly, including Brazilian pulp and paper and Russian metals and mining. We offset this with a sizeable underweight in financials in both Russia and Brazil, where we believe recession will cause some damage to domestically-oriented companies and deterioration in banks’ asset quality.
 |
Michael A. Mata Portfolio Manager |  |
Young-Sup Lee Portfolio Manager | |||||||
 |
Chris Kelly, CFA Portfolio Manager | |||||||||
6 OPPENHEIMER GLOBAL HIGH YIELD FUND
PORTFOLIO ALLOCATION
| Non-Convertible Corporate Bonds and Notes | 97.8% | |||
| Corporate Loans | 2.1 | |||
| Foreign Government Obligations | 0.1 |
Portfolio holdings and allocations are subject to change. Percentages are as of May 29, 2015, and are based on the total market value of investments.
TOP TEN GEOGRAPHICAL HOLDINGS
| United States | 74.4% | |||
| Russia | 2.9 | |||
| Canada | 2.8 | |||
| Brazil | 2.3 | |||
| Netherlands | 1.5 | |||
| Luxembourg | 1.5 | |||
| China | 1.5 | |||
| India | 1.4 | |||
| Colombia | 1.4 | |||
| United Kingdom | 1.1 |
Portfolio holdings and allocation are subject to change. Percentages are as of May 29, 2015, and are based on total market value of investments.
CREDIT RATING BREAKDOWN
| NRSRO
| |||
| BBB | 6.6% | |||
| BB | 47.0 | |||
| B | 36.7 | |||
| CCC | 8.9 | |||
| D | 0.1 | |||
| Unrated | 0.7 | |||
| Total | 100.0% | |||
The percentages above are based on the market value of the Fund’s securities as of May 29, 2015, and are subject to change. Except for securities labeled “Unrated,” and except for certain securities issued or guaranteed by a foreign sovereign, all securities have been rated by at least one Nationally Recognized Statistical Rating Organization (“NRSRO”), such as Standard & Poor’s (“S&P”). For securities rated only by an NRSRO other than S&P, OppenheimerFunds, Inc. (the “Sub-Adviser”) converts that rating to the equivalent S&P rating. If two or more NRSROs have assigned a rating to a security, the highest S&P equivalent rating is used. Unrated securities issued or guaranteed by a foreign sovereign are assigned a credit rating equal to the highest NRSRO rating assigned to that foreign sovereign. For securities not rated by an NRSRO, the Sub-Adviser uses its own credit analysis to assign ratings in categories similar to those of S&P. The use of similar categories is not an indication that the Sub-Adviser’s credit analysis process is consistent or comparable with any NRSRO’s process were that NRSRO to rate the same security. Fund assets invested in Oppenheimer Institutional Money Market Fund are assigned that fund’s S&P rating, which is currently AAA. For the purposes of this table, “investment-grade” securities are securities rated within the NRSROs’ four highest rating categories (AAA, AA, A and BBB). Unrated securities do not necessarily indicate low credit quality, and may or may not be the equivalent of investment-grade. Please consult the Fund’s prospectus and Statement of Additional Information for further information.
*May 29, 2015, was the last business day of the Fund’s fiscal year end. See Note 2 of the accompanying Notes to Financial Statements.
7 OPPENHEIMER GLOBAL HIGH YIELD FUND
REGIONAL ALLOCATION
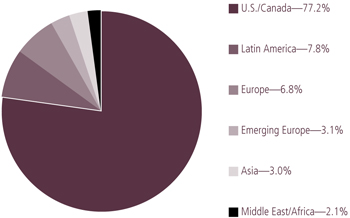
Portfolio holdings and allocations are subject to change. Percentages are as of May 29, 2015, and are based on the total market value of investments.
8 OPPENHEIMER GLOBAL HIGH YIELD FUND
Share Class Performance
AVERAGE ANNUAL TOTAL RETURNS WITHOUT SALES CHARGE AS OF 5/29/15
| Inception Date | 1-Year | Since Inception | ||||||||||
| Class A (OGYAX) | 11/8/13 | -0.07% | 3.23% | |||||||||
| Class C (OGYCX) | 11/8/13 | -0.76% | 2.57% | |||||||||
| Class I (OGYIX) | 11/8/13 | 0.28% | 3.58% | |||||||||
| Class R (OGYNX) | 11/8/13 | -0.31% | 2.99% | |||||||||
| Class Y (OGYYX) | 11/8/13 | 0.23% | 3.54% | |||||||||
AVERAGE ANNUAL TOTAL RETURNS WITH SALES CHARGE AS OF 5/29/15
| Inception Date | 1-Year | Since Inception | ||||||||||
| Class A (OGYAX) | 11/8/13 | -4.81% | 0.07% | |||||||||
| Class C (OGYCX) | 11/8/13 | -1.71% | 2.57% | |||||||||
| Class I (OGYIX) | 11/8/13 | 0.28% | 3.58% | |||||||||
| Class R (OGYNX) | 11/8/13 | -1.26% | 2.99% | |||||||||
| Class Y (OGYYX) | 11/8/13 | 0.23% | 3.54% | |||||||||
STANDARDIZED YIELDS
For the 30 Days Ended 5/31/15
| Class A | 4.58% �� | |||
| Class C | 4.11 | |||
| Class I | 5.16 | |||
| Class R | 4.58 | |||
| Class Y | 5.12 |
Performance data quoted represents past performance, which does not guarantee future results. The investment return and principal value of an investment in the Fund will fluctuate so that an investor’s shares, when redeemed, may be worth more or less than their original cost. Current performance may be lower or higher than the performance quoted. Returns do not consider capital gains or income taxes on an individual’s investment. For performance data current to the most recent month-end, visit oppenheimerfunds.com or call 1.800.CALL OPP (225.5677). Fund returns include changes in share price, reinvested distributions, and the applicable sales charge: for Class A shares, the current maximum initial sales charge of 4.75% and for Class C shares, the 1% contingent deferred sales charge for the 1-year period. Prior to 7/1/14, Class R shares were named Class N shares. Beginning 7/1/14, new purchases of Class R shares will no longer be subject to a CDSC upon redemption (any CDSC will remain in effect for purchases prior to 7/1/14). There is no sales charge for Class I and Class Y shares. Returns for periods of less than one year are cumulative and not annualized.
Standardized yield is based on net investment income for the 30-day period ended 5/31/15 and the maximum offering price at the end of the period for Class A shares and the net asset value for Class C, Class R, Class I and Class Y shares. Each result is compounded semiannually and then annualized. Falling share prices will tend to artificially raise yields.
9 OPPENHEIMER GLOBAL HIGH YIELD FUND
The Fund’s performance is compared to the performance of the J.P. Morgan Global High Yield Index. The J.P. Morgan Global High Yield Index is designed to mirror the investable universe of the U.S. dollar global high yield corporate debt market, including domestic and international issues. The Index is unmanaged and cannot be purchased directly by investors. While index comparisons may be useful to provide a benchmark for the Fund’s performance, it must be noted that the Fund’s investments are not limited to the investments comprising the Index. Index performance includes reinvestment of income, but does not reflect transaction costs, fees, expenses or taxes. Index performance is shown for illustrative purposes only as a benchmark for the Fund’s performance, and does not predict or depict performance of the Fund. The Fund’s performance reflects the effects of the Fund’s business and operating expenses.
The Fund’s investment strategy and focus can change over time. The mention of specific fund holdings does not constitute a recommendation by OppenheimerFunds, Inc. or its affiliates.
Before investing in any of the Oppenheimer funds, investors should carefully consider a fund’s investment objectives, risks, charges and expenses. Fund prospectuses and summary prospectuses contain this and other information about the funds, and may be obtained by asking your financial advisor, visiting oppenheimerfunds.com, or calling 1.800.CALL OPP (225.5677). Read prospectuses and summary prospectuses carefully before investing.
Shares of Oppenheimer funds are not deposits or obligations of any bank, are not guaranteed by any bank, are not insured by the FDIC or any other agency, and involve investment risks, including the possible loss of the principal amount invested.
10 OPPENHEIMER GLOBAL HIGH YIELD FUND
Fund Expenses. As a shareholder of the Fund, you incur two types of costs: (1) transaction costs, which may include sales charges (loads) on purchase payments and/or contingent deferred sales charges on redemptions; and (2) ongoing costs, including management fees; distribution and service fees; and other Fund expenses. These examples are intended to help you understand your ongoing costs (in dollars) of investing in the Fund and to compare these costs with the ongoing costs of investing in other mutual funds.
The examples are based on an investment of $1,000.00 invested at the beginning of the period and held for the entire 6-month period ended May 29, 2015.
Actual Expenses. The first section of the table provides information about actual account values and actual expenses. You may use the information in this section for the class of shares you hold, together with the amount you invested, to estimate the expense that you paid over the period. Simply divide your account value by $1,000.00 (for example, an $8,600.00 account value divided by $1,000.00 = 8.60), then multiply the result by the number in the first section under the heading entitled “Expenses Paid During 6 Months Ended May 29, 2015” to estimate the expenses you paid on your account during this period.
Hypothetical Example for Comparison Purposes. The second section of the table provides information about hypothetical account values and hypothetical expenses based on the Fund’s actual expense ratio for each class of shares, and an assumed rate of return of 5% per year for each class before expenses, which is not the Fund’s actual return. The hypothetical account values and expenses may not be used to estimate the actual ending account balance or expenses you paid for the period. You may use this information to compare the ongoing costs of investing in the Fund and other funds. To do so, compare this 5% hypothetical example for the class of shares you hold with the 5% hypothetical examples that appear in the shareholder reports of the other funds.
Please note that the expenses shown in the table are meant to highlight your ongoing costs only and do not reflect any transactional costs, such as front-end or contingent deferred sales charges (loads). Therefore, the “hypothetical” section of the table is useful in comparing ongoing costs only, and will not help you determine the relative total costs of owning different funds. In addition, if these transactional costs were included, your costs would have been higher.
11 OPPENHEIMER GLOBAL HIGH YIELD FUND
| Actual | Beginning Value | Ending Account Value May 29, 2015 | Expenses Paid During 6 Months Ended May 29, 2015 | |||||||||
| ||||||||||||
Class A | $ | 1,000.00 | $ | 1,015.70 | $ | 5.73 | ||||||
| ||||||||||||
Class C | 1,000.00 | 1,012.20 | 9.17 | |||||||||
| ||||||||||||
Class I | 1,000.00 | 1,017.40 | 3.99 | |||||||||
| ||||||||||||
Class R | 1,000.00 | 1,014.40 | 6.93 | |||||||||
| ||||||||||||
Class Y | 1,000.00 | 1,017.20 | 4.19 | |||||||||
Hypothetical | ||||||||||||
(5% return before expenses) | ||||||||||||
| ||||||||||||
Class A | 1,000.00 | 1,018.99 | 5.74 | |||||||||
| ||||||||||||
Class C | 1,000.00 | 1,015.58 | 9.19 | |||||||||
| ||||||||||||
Class I | 1,000.00 | 1,020.71 | 3.99 | |||||||||
| ||||||||||||
Class R | 1,000.00 | 1,017.80 | 6.94 | |||||||||
| ||||||||||||
Class Y | 1,000.00 | 1,020.52 | 4.19 | |||||||||
Expenses are equal to the Fund’s annualized expense ratio for that class, multiplied by the average account value over the period, multiplied by 180/365 (to reflect the one-half year period). Those annualized expense ratios, excluding indirect expenses from affiliated funds, based on the 6-month period ended May 29, 2015 are as follows:
| Class | Expense Ratios | |||
| ||||
Class A | 1.15% | |||
| ||||
Class C | 1.84 | |||
| ||||
Class I | 0.80 | |||
| ||||
Class R | 1.39 | |||
| ||||
Class Y | 0.84 | |||
| ||||
The expense ratios reflect voluntary and/or contractual waivers and/or reimbursements of expenses by the Fund’s Manager. Some of these undertakings may be modified or terminated at any time, as indicated in the Fund’s prospectus. The “Financial Highlights” tables in the Fund’s financial statements, included in this report, also show the gross expense ratios, without such waivers or reimbursements and reduction to custodian expenses, if applicable.
12 OPPENHEIMER GLOBAL HIGH YIELD FUND
STATEMENT OF INVESTMENTS May 29, 2015*
| Principal Amount | Value | |||||||
| ||||||||
| Foreign Government Obligation—0.1% | ||||||||
| Republic of Ecuador International Bonds, 10.50%, 3/24/201 (Cost 37,710) | $ | 35,000 | $ | 36,925 | ||||
| ||||||||
| Corporate Loans—2.1% | ||||||||
| ||||||||
| Affinion Group, Inc., Sr. Sec. Credit Facilities 2nd Lien Term Loan, 8.50%, 10/31/182,3 | 10,000 | 9,066 | ||||||
| ||||||||
| Amaya BV, Sr. Sec. Credit Facilities 2nd Lien Term Loan, 8.00%, 7/29/222 | 15,000 | 15,202 | ||||||
| ||||||||
| Asurion LLC, Sr. Sec. Credit Facilities 2nd Lien Term Loan, 8.50%, 3/3/212 | 217,413 | 223,222 | ||||||
| ||||||||
| Caesars Entertainment Operating Co., Inc., Sr. Sec. Credit Facilities 1st Lien Term Loan, Tranche B7, 1.50%, 1/29/182 | 44,775 | 41,519 | ||||||
| ||||||||
| Caesars Entertainment Resort Properties LLC, Sr. Sec. Credit Facilities 1st Lien Term Loan, Tranche B, 7.00%, 10/11/202 | 212,313 | 204,749 | ||||||
| ||||||||
| Caesars Growth Properties Holdings LLC, Sr. Sec. Credit Facilities 1st Lien Term Loan, 6.25%, 5/10/212 | 41,685 | 37,517 | ||||||
| ||||||||
| Clear Channel Communications, Inc., Extended Sr. Sec. Credit Facilities 1st Lien Term Loan, Tranche D, 6.922%, 1/30/192 | 205,000 | 192,590 | ||||||
| ||||||||
| Deluxe Entertainment Services, Sr. Sec. Credit Facilities 1st Lien Term Loan, Tranche B, 6.50%, 2/26/202 | 70,042 | 68,554 | ||||||
| ||||||||
| IPC Corp., Sr. Sec. Credit Facilities 1st Lien Term Loan, 5.50%, 8/6/212,3 | 55,000 | 54,725 | ||||||
| ||||||||
| NewPage Corp., Sr. Sec. Credit Facilities 1st Lien Term Loan, 9.50%, 2/5/212,3 | 38,481 | 33,310 | ||||||
| ||||||||
| Quicksilver Resources, Inc., Sr. Sec. Credit Facilities 2nd Lien Term Loan, 7.00%, 6/21/192,4 | 155,000 | 103,075 | ||||||
| ||||||||
| Radnet Management, Inc., Sr. Sec. Credit Facilities 2nd Lien Term Loan, Tranche B, 8.00%, 3/25/212 | 20,000 | 19,825 | ||||||
| ||||||||
| TWCC Holding Corp., Sr. Sec. Credit Facilities 2nd Lien Term Loan, 7.00%, 6/26/202 | 105,000 | 96,862 | ||||||
|
| |||||||
| Total Corporate Loans (Cost $1,172,357) | 1,100,216 | |||||||
| ||||||||
| Corporate Bonds and Notes—95.2% | ||||||||
| ||||||||
| Consumer Discretionary—19.1% | ||||||||
| ||||||||
| Auto Components—2.0% | ||||||||
| ||||||||
| Affinia Group, Inc., 7.75% Sr. Unsec. Nts., 5/1/21 | 145,000 | 151,887 | ||||||
| ||||||||
| Gates Global LLC/Gates Global Co., 6% Sr. Unsec. Nts., 7/15/221 | 195,000 | 180,863 | ||||||
| ||||||||
| Goodyear Tire & Rubber Co., 8.25% Sr. Unsec. Nts., 8/15/20 | 85,000 | 89,675 | ||||||
| ||||||||
| Icahn Enterprises LP/Icahn Enterprises Finance Corp., 5.875% Sr. Unsec. Nts., 2/1/22 | 250,000 | 263,125 | ||||||
| ||||||||
| Lear Corp., 4.75% Sr. Unsec. Nts., 1/15/23 | 150,000 | 152,625 | ||||||
| ||||||||
| MPG Holdco I, Inc., 7.375% Sr. Unsec. Nts., 10/15/221 | 190,000 | 204,250 | ||||||
|
| |||||||
| 1,042,425 | ||||||||
| ||||||||
| Automobiles—0.7% | ||||||||
| ||||||||
| General Motors Co., 5% Sr. Unsec. Nts., 4/1/35 | 145,000 | 146,381 | ||||||
| ||||||||
| Jaguar Land Rover Automotive plc, 5.625% Sr. Unsec. Nts., 2/1/231 | 100,000 | 107,000 | ||||||
13 OPPENHEIMER GLOBAL HIGH YIELD FUND
STATEMENT OF INVESTMENTS Continued
| Principal Amount | Value | |||||||
| ||||||||
| Automobiles (Continued) | ||||||||
| ||||||||
| ZF North America Capital, Inc., 4.50% Sr. Unsec. Nts., 4/29/221 | $ | 110,000 | $ | 112,337 | ||||
|
| |||||||
| 365,718 | ||||||||
| ||||||||
| Distributors—0.2% | ||||||||
| ||||||||
| LKQ Corp., 4.75% Sr. Unsec. Nts., 5/15/23 | 119,000 | 117,513 | ||||||
| ||||||||
| Hotels, Restaurants & Leisure—4.2% | ||||||||
| ||||||||
| 1011778 B.C. ULC/New Red Finance, Inc., 6% Sec. Nts., 4/1/221 | 145,000 | 150,728 | ||||||
| ||||||||
| Boyd Gaming Corp.: | ||||||||
| 6.875% Sr. Unsec. Nts., 5/15/23 | 70,000 | 71,575 | ||||||
| 9.125% Sr. Unsec. Nts., 12/1/18 | 30,000 | 31,414 | ||||||
| ||||||||
| Caesars Entertainment Resort Properties LLC/Caesars Entertainment Resort Prope, 11% Sec. Nts., 10/1/21 | 65,000 | 60,892 | ||||||
| ||||||||
| Caesars Growth Properties Holdings LLC/Caesars Growth Properties Finance, Inc., 9.375% Sec. Nts., 5/1/221 | 45,000 | 37,013 | ||||||
| ||||||||
| Carlson Wagonlit BV, 6.875% Sr. Sec. Nts., 6/15/191 | 140,000 | 147,700 | ||||||
| ||||||||
| Churchill Downs, Inc., 5.375% Sr. Unsec. Nts., 12/15/21 | 105,000 | 108,150 | ||||||
| ||||||||
| Greektown Holdings LLC/Greektown Mothership Corp., 8.875% Sr. Sec. Nts., 3/15/191 | 150,000 | 159,375 | ||||||
| ||||||||
| Hilton Worldwide Finance LLC/Hilton Worldwide Finance Corp., 5.625% Sr. Unsec. Nts., 10/15/21 | 120,000 | 127,050 | ||||||
| ||||||||
| International Game Technology plc, 6.25% Sr. Sec. Nts., 2/15/221 | 110,000 | 107,250 | ||||||
| ||||||||
| Isle of Capri Casinos, Inc.: | ||||||||
| 5.875% Sr. Unsec. Nts., 3/15/21 | 35,000 | 36,400 | ||||||
| 5.875% Sr. Unsec. Nts., 3/15/215 | 15,000 | 15,600 | ||||||
| ||||||||
| Landry’s, Inc., 9.375% Sr. Unsec. Nts., 5/1/201 | 205,000 | 221,656 | ||||||
| ||||||||
| MCE Finance Ltd., 5% Sr. Unsec. Nts., 2/15/211 | 90,000 | 87,187 | ||||||
| ||||||||
| MGM Resorts International: | ||||||||
| 6.00% Sr. Unsec. Nts., 3/15/23 | 105,000 | 109,331 | ||||||
| 6.625% Sr. Unsec. Nts., 12/15/21 | 45,000 | 48,600 | ||||||
| 6.75% Sr. Unsec. Nts., 10/1/20 | 90,000 | 98,100 | ||||||
| ||||||||
| MTR Gaming Group, Inc., 11.50% Sec. Nts., 8/1/19 | 100,000 | 107,250 | ||||||
| ||||||||
| NCL Corp. Ltd., 5.25% Sr. Unsec. Nts., 11/15/191 | 50,000 | 51,935 | ||||||
| ||||||||
| PF Chang’s China Bistro, Inc., 10.25% Sr. Unsec. Nts., 6/30/201 | 60,000 | 62,100 | ||||||
| ||||||||
| Pinnacle Entertainment, Inc., 6.375% Sr. Unsec. Nts., 8/1/21 | 95,000 | 101,888 | ||||||
| ||||||||
| Viking Cruises Ltd., 8.50% Sr. Unsec. Nts., 10/15/221 | 130,000 | 145,925 | ||||||
| ||||||||
| Wynn Macau Ltd., 5.25% Sr. Unsec. Nts., 10/15/211 | 125,000 | 122,187 | ||||||
|
| |||||||
| 2,209,306 | ||||||||
| ||||||||
| Household Durables—2.0% | ||||||||
| ||||||||
| Arcelik AS, 5% Sr. Unsec. Nts., 4/3/231 | 100,000 | 96,583 | ||||||
| ||||||||
| Jarden Corp., 6.125% Sr. Unsec. Nts., 11/15/22 | 50,000 | 52,312 | ||||||
| ||||||||
| K Hovnanian Enterprises, Inc.: | ||||||||
| 7.00% Sr. Unsec. Nts., 1/15/191 | 40,000 | 37,600 | ||||||
| 9.125% Sec. Nts., 11/15/205 | 135,000 | 143,438 | ||||||
| ||||||||
| KB Home: | ||||||||
| 7.00% Sr. Unsec. Nts., 12/15/21 | 75,000 | 78,375 | ||||||
| 7.625% Sr. Unsec. Nts., 5/15/23 | 140,000 | 145,600 | ||||||
| ||||||||
| Lennar Corp., 4.75% Sr. Unsec. Nts., 11/15/22 | 220,000 | 219,175 | ||||||
| ||||||||
| Meritage Homes Corp., 7.15% Sr. Unsec. Nts., 4/15/20 | 130,000 | 141,050 | ||||||
14 OPPENHEIMER GLOBAL HIGH YIELD FUND
| Principal Amount | Value | |||||||
| ||||||||
| Household Durables (Continued) | ||||||||
| ||||||||
| Taylor Morrison Communities, Inc./Monarch Communities, Inc., 5.25% Sr. Unsec. Nts., 4/15/211 | $ | 150,000 | $ | 151,500 | ||||
|
| |||||||
| 1,065,633 | ||||||||
| ||||||||
| Media—6.5% | ||||||||
| ||||||||
| Altice Financing SA, 6.50% Sec. Nts., 1/15/221 | 210,000 | 216,300 | ||||||
| ||||||||
| Altice Finco SA, 8.125% Sec. Nts., 1/15/241 | 70,000 | 73,675 | ||||||
| ||||||||
| CCO Holdings LLC/CCO Holdings Capital Corp.: | ||||||||
| 5.125% Sr. Unsec. Nts., 5/1/231 | 160,000 | 161,400 | ||||||
| 5.75% Sr. Unsec. Nts., 9/1/23 | 70,000 | 72,450 | ||||||
| ||||||||
| Cumulus Media Holdings, Inc., 7.75% Sr. Unsec. Nts., 5/1/19 | 40,000 | 37,750 | ||||||
| ||||||||
| DISH DBS Corp., 5.875% Sr. Unsec. Nts., 11/15/24 | 425,000 | 427,125 | ||||||
| ||||||||
| DreamWorks Animation SKG, Inc., 6.875% Sr. Unsec. Nts., 8/15/201 | 105,000 | 105,525 | ||||||
| ||||||||
| Entercom Radio LLC, 10.50% Sr. Unsec. Nts., 12/1/19 | 40,000 | 43,700 | ||||||
| ||||||||
| Gannett Co., Inc., 5.50% Sr. Unsec. Nts., 9/15/241 | 70,000 | 71,400 | ||||||
| ||||||||
| Gray Television, Inc., 7.50% Sr. Unsec. Nts., 10/1/20 | 200,000 | 214,000 | ||||||
| ||||||||
| iHeartCommunications, Inc., 9% Sr. Sec. Nts., 12/15/19 | 170,000 | 167,663 | ||||||
| ||||||||
| LIN Television Corp., 6.375% Sr. Unsec. Nts., 1/15/21 | 220,000 | 227,975 | ||||||
| ||||||||
| Nexstar Broadcasting, Inc.: | ||||||||
| 6.125% Sr. Unsec. Nts., 2/15/221 | 70,000 | 73,325 | ||||||
| 6.875% Sr. Unsec. Nts., 11/15/20 | 140,000 | 149,450 | ||||||
| ||||||||
| Numericable SFR SAS, 6% Sr. Sec. Nts., 5/15/221 | 420,000 | 425,250 | ||||||
| ||||||||
| Sinclair Television Group, Inc.: | ||||||||
| 5.375% Sr. Unsec. Nts., 4/1/21 | 45,000 | 45,956 | ||||||
| 5.625% Sr. Unsec. Nts., 8/1/241 | 75,000 | 76,125 | ||||||
| 6.125% Sr. Unsec. Nts., 10/1/22 | 215,000 | 227,900 | ||||||
| ||||||||
| Univision Communications, Inc., 8.50% Sr. Unsec. Nts., 5/15/211 | 60,000 | 64,200 | ||||||
| ||||||||
| UPCB Finance V Ltd., 7.25% Sr. Sec. Nts., 11/15/211 | 198,000 | 216,810 | ||||||
| ||||||||
| UPCB Finance VI Ltd., 6.875% Sr. Sec. Nts., 1/15/221 | 148,500 | 160,937 | ||||||
| ||||||||
| VTR Finance BV, 6.875% Sr. Sec. Nts., 1/15/241 | 120,000 | 125,250 | ||||||
|
| |||||||
| 3,384,166 | ||||||||
| ||||||||
| Multiline Retail—0.7% | ||||||||
| ||||||||
| Family Tree Escrow LLC, 5.75% Sr. Sec. Nts., 3/1/231 | 215,000 | 227,631 | ||||||
| ||||||||
| Neiman Marcus Group Ltd., Inc., 8.75% Sr. Unsec. Nts., 10/15/211,6 | 125,000 | 135,625 | ||||||
|
| |||||||
| 363,256 | ||||||||
| ||||||||
| Specialty Retail—2.0% | ||||||||
| ||||||||
| Apex Tool Group LLC, 7% Sr. Unsec. Nts., 2/1/211 | 190,000 | 174,325 | ||||||
| ||||||||
| CST Brands, Inc., 5% Sr. Unsec. Nts., 5/1/23 | 65,000 | 66,463 | ||||||
| ||||||||
| GameStop Corp., 5.50% Sr. Unsec. Nts., 10/1/191 | 125,000 | 130,156 | ||||||
| ||||||||
| L Brands, Inc., 6.625% Sr. Unsec. Nts., 4/1/21 | 195,000 | 221,325 | ||||||
| ||||||||
| Michaels Stores, Inc., 5.875% Sr. Sub. Nts., 12/15/201 | 214,000 | 226,840 | ||||||
| ||||||||
| Sally Holdings LLC/Sally Capital, Inc., 5.75% Sr. Unsec. Nts., 6/1/22 | 70,000 | 74,900 | ||||||
| ||||||||
| Stackpole International Intermediate Co., 7.75% Sr. Sec. Nts., 10/15/211 | 170,000 | 170,212 | ||||||
|
| |||||||
| 1,064,221 | ||||||||
| ||||||||
| Textiles, Apparel & Luxury Goods—0.8% | ||||||||
| ||||||||
| American Achievement Corp., 10.875% Sec. Nts., 4/15/161 | 45,000 | 43,931 | ||||||
15 OPPENHEIMER GLOBAL HIGH YIELD FUND
STATEMENT OF INVESTMENTS Continued
| Principal Amount | Value | |||||||
| ||||||||
| Textiles, Apparel & Luxury Goods (Continued) | ||||||||
| ||||||||
| Levi Strauss & Co.: | ||||||||
| 5.00% Sr. Unsec. Nts., 5/1/251 | $ | 110,000 | $ | 110,138 | ||||
| 6.875% Sr. Unsec. Nts., 5/1/22 | 25,000 | 27,375 | ||||||
| ||||||||
| Polymer Group, Inc., 6.875% Sr. Unsec. Nts., 6/1/191 | 30,000 | 28,087 | ||||||
| ||||||||
| PVH Corp., 4.50% Sr. Unsec. Unsub. Nts., 12/15/22 | 90,000 | 91,800 | ||||||
| ||||||||
| Springs Industries, Inc., 6.25% Sr. Sec. Nts., 6/1/21 | 130,000 | 128,700 | ||||||
|
| |||||||
| 430,031 | ||||||||
| ||||||||
| Consumer Staples—2.9% | ||||||||
| ||||||||
| Beverages—0.3% | ||||||||
| ||||||||
| Constellation Brands, Inc.: | ||||||||
| 4.25% Sr. Unsec. Nts., 5/1/23 | 100,000 | 101,250 | ||||||
| 4.75% Sr. Unsec. Nts., 11/15/24 | 75,000 | 77,906 | ||||||
|
| |||||||
| 179,156 | ||||||||
| ||||||||
| Food & Staples Retailing—0.7% | ||||||||
| ||||||||
| Ingles Markets, Inc., 5.75% Sr. Unsec. Nts., 6/15/23 | 45,000 | 46,912 | ||||||
| ||||||||
| Rite Aid Corp.: | ||||||||
| 6.125% Sr. Unsec. Nts., 4/1/231 | 110,000 | 114,813 | ||||||
| 6.75% Sr. Unsec. Nts., 6/15/21 | 170,000 | 179,350 | ||||||
|
| |||||||
| 341,075 | ||||||||
| ||||||||
| Food Products—1.2% | ||||||||
| ||||||||
| Chiquita Brands International, Inc./Chiquita Brands LLC, 7.875% Sr. Sec. Nts., 2/1/21 | 58,000 | 63,292 | ||||||
| ||||||||
| HJ Heinz Co.: | ||||||||
| 4.25% Sec. Nts., 10/15/20 | 265,000 | 271,459 | ||||||
| 4.875% Sec. Nts., 2/15/251 | 105,000 | 113,400 | ||||||
| ||||||||
| Pilgrim’s Pride Corp., 5.75% Sr. Unsec. Nts., 3/15/251 | 45,000 | 45,788 | ||||||
| ||||||||
| Post Holdings, Inc., 7.375% Sr. Unsec. Nts., 2/15/22 | 145,000 | 148,927 | ||||||
|
| |||||||
| 642,866 | ||||||||
| ||||||||
| Household Products—0.2% | ||||||||
| ||||||||
| Spectrum Brands, Inc.: | ||||||||
| 6.125% Sr. Unsec. Nts., 12/15/241 | 25,000 | 26,688 | ||||||
| 6.375% Sr. Unsec. Nts., 11/15/20 | 80,000 | 85,800 | ||||||
|
| |||||||
| 112,488 | ||||||||
| ||||||||
| Personal Products—0.2% | ||||||||
| ||||||||
| Revlon Consumer Products Corp., 5.75% Sr. Unsec. Nts., 2/15/21 | 110,000 | 110,825 | ||||||
| ||||||||
| Tobacco—0.3% | ||||||||
| ||||||||
| Vector Group Ltd., 7.75% Sr. Sec. Nts., 2/15/21 | 140,000 | 151,025 | ||||||
| ||||||||
| Energy—12.0% | ||||||||
| ||||||||
| Energy Equipment & Services—0.9% | ||||||||
| ||||||||
| Eletson Holdings, 9.625% Sr. Sec. Nts., 1/15/225 | 170,000 | 167,025 | ||||||
| ||||||||
| Exterran Partners LP/EXLP Finance Corp., 6% Sr. Unsec. Nts., 4/1/21 | 45,000 | 44,213 | ||||||
| ||||||||
| Hornbeck Offshore Services, Inc., 5.875% Sr. Unsec. Nts., 4/1/20 | 85,000 | 79,262 | ||||||
| ||||||||
| Odebrecht Offshore Drilling Finance Ltd., 6.625% Sr. Sec. Nts., 10/1/221 | 128,115 | 115,047 | ||||||
16 OPPENHEIMER GLOBAL HIGH YIELD FUND
| Principal Amount | Value | |||||||
| ||||||||
| Energy Equipment & Services (Continued) | ||||||||
| ||||||||
| Precision Drilling Corp., 6.625% Sr. Unsec. Nts., 11/15/20 | $ | 45,000 | $ | 44,775 | ||||
|
| |||||||
| 450,322 | ||||||||
| ||||||||
| Oil, Gas & Consumable Fuels—11.1% | ||||||||
| ||||||||
| Antero Resources Corp., 6% Sr. Unsec. Nts., 12/1/20 | 65,000 | 66,950 | ||||||
| ||||||||
| Baytex Energy Corp., 5.125% Sr. Unsec. Nts., 6/1/211 | 30,000 | 29,325 | ||||||
| ||||||||
| Bill Barrett Corp., 7.625% Sr. Unsec. Nts., 10/1/19 | 140,000 | 134,400 | ||||||
| ||||||||
| California Resources Corp.: | ||||||||
| 5.00% Sr. Unsec. Nts., 1/15/20 | 255,000 | 244,163 | ||||||
| 5.50% Sr. Unsec. Nts., 9/15/21 | 100,000 | 95,250 | ||||||
| 6.00% Sr. Unsec. Nts., 11/15/24 | 10,000 | 9,250 | ||||||
| ||||||||
| Carrizo Oil & Gas, Inc., 7.50% Sr. Unsec. Nts., 9/15/20 | 85,000 | 90,419 | ||||||
| ||||||||
| Chaparral Energy, Inc., 7.625% Sr. Unsec. Nts., 11/15/22 | 65,000 | 52,325 | ||||||
| ||||||||
| Chesapeake Energy Corp.: | ||||||||
| 4.875% Sr. Unsec. Nts., 4/15/22 | 90,000 | 86,175 | ||||||
| 5.375% Sr. Unsec. Nts., 6/15/21 | 65,000 | 64,350 | ||||||
| ||||||||
| Cloud Peak Energy Resources LLC/Cloud Peak Energy Finance Corp., 8.50% Sr. Unsec. Nts., 12/15/19 | 55,000 | 52,662 | ||||||
| ||||||||
| Concho Resources, Inc., 5.50% Sr. Unsec. Unsub. Nts., 4/1/23 | 135,000 | 137,700 | ||||||
| ||||||||
| CONSOL Energy, Inc., 5.875% Sr. Unsec. Nts., 4/15/22 | 90,000 | 84,994 | ||||||
| ||||||||
| Cosan Luxembourg SA, 5% Sr. Unsec. Nts., 3/14/231 | 250,000 | 236,791 | ||||||
| ||||||||
| Crestwood Midstream Partners LP/Crestwood Midstream Finance Corp.: | ||||||||
| 6.00% Sr. Unsec. Nts., 12/15/20 | 25,000 | 26,313 | ||||||
| 6.125% Sr. Unsec. Nts., 3/1/22 | 45,000 | 47,194 | ||||||
| ||||||||
| Denbury Resources, Inc., 5.50% Sr. Sub. Nts., 5/1/22 | 115,000 | 110,328 | ||||||
| ||||||||
| Energy Transfer Equity LP: | ||||||||
| 5.875% Sr. Sec. Nts., 1/15/24 | 50,000 | 53,375 | ||||||
| 7.50% Sr. Sec. Nts., 10/15/20 | 75,000 | 86,062 | ||||||
| ||||||||
| Energy XXI Gulf Coast, Inc., 11% Sec. Nts., 3/15/201 | 60,000 | 55,200 | ||||||
| ||||||||
| EP Energy LLC/Everest Acquisition Finance, Inc.: | ||||||||
| 6.375% Sr. Unsec. Nts., 6/15/231 | 65,000 | 65,163 | ||||||
| 7.75% Sr. Unsec. Nts., 9/1/22 | 90,000 | 94,950 | ||||||
| 9.375% Sr. Unsec. Nts., 5/1/20 | 100,000 | 109,250 | ||||||
| ||||||||
| Gazprom OAO Via Gaz Capital SA, 4.95% Sr. Unsec. Nts., 7/19/221 | 250,000 | 235,937 | ||||||
| ||||||||
| Genesis Energy LP/Genesis Energy Finance Corp., 5.75% Sr. Unsec. Nts., 2/15/21 | 50,000 | 50,250 | ||||||
| ||||||||
| Halcon Resources Corp., 8.875% Sr. Unsec. Nts., 5/15/21 | 145,000 | 102,588 | ||||||
| ||||||||
| Jones Energy Holdings LLC/Jones Energy Finance Corp., 6.75% Sr. Unsec. Nts., 4/1/22 | 45,000 | 44,719 | ||||||
| ||||||||
| Laredo Petroleum, Inc.: | ||||||||
| 5.625% Sr. Unsec. Nts., 1/15/22 | 70,000 | 70,525 | ||||||
| 6.25% Sr. Unsec. Nts., 3/15/23 | 130,000 | 134,875 | ||||||
| ||||||||
| LBC Tank Terminals Holding Netherlands BV, 6.875% Sr. Unsec. Nts., 5/15/235 | 175,000 | 182,000 | ||||||
| ||||||||
| Linn Energy LLC/Linn Energy Finance Corp., 7.75% Sr. Unsec. Nts., 2/1/21 | 235,000 | 203,862 | ||||||
| ||||||||
| MarkWest Energy Partners LP/MarkWest Energy Finance Corp., 4.50% Sr. Unsec. Nts., 7/15/23 | 110,000 | 109,175 | ||||||
| ||||||||
| MEG Energy Corp., 6.50% Sr. Unsec. Nts., 3/15/211 | 90,000 | 87,750 | ||||||
| ||||||||
| Memorial Production Partners LP/Memorial Production Finance Corp., 7.625% Sr. Unsec. Nts., 5/1/21 | 45,000 | 44,325 | ||||||
17 OPPENHEIMER GLOBAL HIGH YIELD FUND
STATEMENT OF INVESTMENTS Continued
| Principal Amount | Value | |||||||
| ||||||||
| Oil, Gas & Consumable Fuels (Continued) | ||||||||
| ||||||||
| Murray Energy Corp., 11.25% Sr. Sec. Nts., 4/15/211 | $ | 240,000 | $ | 232,200 | ||||
| ||||||||
| Navios Maritime Acquisition Corp./Navios Acquisition Finance US, Inc., 8.125% Sr. Sec. Nts., 11/15/211 | 100,000 | 102,250 | ||||||
| ||||||||
| Newfield Exploration Co., 5.625% Sr. Unsec. Nts., 7/1/24 | 85,000 | 89,887 | ||||||
| ||||||||
| Oasis Petroleum, Inc., 6.875% Sr. Unsec. Nts., 1/15/23 | 105,000 | 107,100 | ||||||
| ||||||||
| Pacific Rubiales Energy Corp., 5.625% Sr. Unsec. Nts., 1/19/251 | 300,000 | 241,500 | ||||||
| ||||||||
| Peabody Energy Corp., 6% Sr. Unsec. Nts., 11/15/18 | 120,000 | 85,800 | ||||||
| ||||||||
| Penn Virginia Corp., 8.50% Sr. Unsec. Nts., 5/1/20 | 85,000 | 80,963 | ||||||
| ||||||||
| QEP Resources, Inc., 5.25% Sr. Unsec. Nts., 5/1/23 | 90,000 | 90,450 | ||||||
| ||||||||
| Range Resources Corp.: | ||||||||
| 5.00% Sr. Sub. Nts., 8/15/22 | 45,000 | 45,000 | ||||||
| 5.00% Sr. Sub. Nts., 3/15/23 | 15,000 | 15,075 | ||||||
| ||||||||
| Rice Energy, Inc., 6.25% Sr. Unsec. Nts., 5/1/22 | 45,000 | 46,378 | ||||||
| ||||||||
| Rosetta Resources, Inc., 5.625% Sr. Unsec. Nts., 5/1/21 | 70,000 | 74,557 | ||||||
| ||||||||
| Sabine Pass Liquefaction LLC: | ||||||||
| 5.625% Sr. Sec. Nts., 3/1/251 | 220,000 | 220,825 | ||||||
| 5.75% Sr. Sec. Nts., 5/15/24 | 25,000 | 25,531 | ||||||
| ||||||||
| Sanchez Energy Corp.: | ||||||||
| 6.125% Sr. Unsec. Nts., 1/15/23 | 45,000 | 42,975 | ||||||
| 7.75% Sr. Unsec. Nts., 6/15/21 | 50,000 | 51,250 | ||||||
| ||||||||
| SandRidge Energy, Inc., 7.51% Sr. Unsec. Nts., 3/15/21 | 77,000 | 44,467 | ||||||
| ||||||||
| SM Energy Co., 6.50% Sr. Unsec. Nts., 1/1/23 | 80,000 | 83,600 | ||||||
| ||||||||
| Summit Midstream Holdings LLC/Summit Midstream Finance Corp., 5.50% Sr. Unsec. Nts., 8/15/22 | 55,000 | 53,075 | ||||||
| ||||||||
| Targa Resources Partners LP/Targa Resources Partners Finance Corp.: | ||||||||
| 4.125% Sr. Unsec. Nts., 11/15/191 | 110,000 | 110,550 | ||||||
| 5.00% Sr. Unsec. Nts., 1/15/181 | 85,000 | 88,188 | ||||||
| ||||||||
| Tesoro Logistics LP/Tesoro Logistics Finance Corp.: | ||||||||
| 5.875% Sr. Unsec. Nts., 10/1/20 | 39,000 | 41,028 | ||||||
| 6.25% Sr. Unsec. Nts., 10/15/221 | 30,000 | 31,875 | ||||||
| ||||||||
| Whiting Petroleum Corp., 5.75% Sr. Unsec. Nts., 3/15/21 | 70,000 | 71,575 | ||||||
| ||||||||
| Williams Partners LP/ACMP: | ||||||||
| 4.875% Sr. Unsec. Nts., 3/15/24 | 30,000 | 30,494 | ||||||
| 6.125% Sr. Unsec. Nts., 7/15/22 | 65,000 | 69,983 | ||||||
| ||||||||
| WPX Energy, Inc.: | ||||||||
| 5.25% Sr. Unsec. Nts., 9/15/24 | 40,000 | 38,200 | ||||||
| 6.00% Sr. Unsec. Nts., 1/15/22 | 65,000 | 65,812 | ||||||
| ||||||||
| YPF SA, 8.50% Sr. Unsec. Nts., 7/28/251 | 265,000 | 271,546 | ||||||
|
| |||||||
| 5,850,729 | ||||||||
| ||||||||
| Financials—12.0% | ||||||||
| ||||||||
| Capital Markets���1.8% | ||||||||
| ||||||||
| Drawbridge Special Opportunities Fund LP/Drawbridge Special Opportunities Finance Corp., 5% Sr. Unsec. Nts., 8/1/211 | 125,000 | 125,312 | ||||||
| ||||||||
| KCG Holdings, Inc., 6.875% Sr. Sec. Nts., 3/15/201 | 205,000 | 196,185 | ||||||
| ||||||||
| MPH Acquisition Holdings LLC, 6.625% Sr. Unsec. Nts., 4/1/221 | 145,000 | 153,700 | ||||||
| ||||||||
| Prospect Medical Holdings, Inc., 8.375% Sr. Sec. Nts., 5/1/191 | 180,000 | 191,925 | ||||||
| ||||||||
| Signode Industrial Group Lux SA/Signode Industrial Group US, Inc., 6.375% Sr. Unsec. Nts., 5/1/221 | 55,000 | 55,275 | ||||||
| ||||||||
| Springleaf Finance Corp., 5.25% Sr. Unsec. Nts., 12/15/19 | 155,000 | 157,325 | ||||||
18 OPPENHEIMER GLOBAL HIGH YIELD FUND
| Principal Amount | Value | |||||||
| ||||||||
| Capital Markets (Continued) | ||||||||
| ||||||||
| Walter Investment Management Corp., 7.875% Sr. Unsec. Nts., 12/15/21 | $ | 70,000 | $ | 65,100 | ||||
|
| |||||||
| 944,822 | ||||||||
| ||||||||
| Commercial Banks—2.8% | ||||||||
| ||||||||
| Banco ABC Brasil SA, 7.875% Sub. Nts., 4/8/201 | 175,000 | 183,312 | ||||||
| ||||||||
| Bancolombia SA, 5.125% Unsec. Sub. Nts., 9/11/22 | 215,000 | 220,891 | ||||||
| ||||||||
| CIT Group, Inc., 5% Sr. Unsec. Nts., 8/15/22 | 230,000 | 236,900 | ||||||
| ||||||||
| Constellis Holdings LLC/Constellis Finance Corp., 9.75% Sr. Sec. Nts., 5/15/201 | 110,000 | 109,313 | ||||||
| ||||||||
| CorpGroup Banking SA, 6.75% Sr. Unsec. Nts., 3/15/231 | 215,000 | 212,508 | ||||||
| ||||||||
| ICICI Bank Ltd., 6.375% Jr. Sub. Nts., 4/30/221,2 | 205,000 | 213,003 | ||||||
| ||||||||
| Moon Wise Global Ltd., 9% Sub Perpetual Bonds2,7 | 205,000 | 218,889 | ||||||
| ||||||||
| Turkiye Vakiflar Bankasi TAO, 6.875% Sub. Nts., 2/3/251,2 | 100,000 | 99,970 | ||||||
|
| |||||||
| 1,494,786 | ||||||||
| ||||||||
| Consumer Finance—2.4% | ||||||||
| ||||||||
| Ahern Rentals, Inc., 7.375% Sec. Nts., 5/15/231 | 110,000 | 110,550 | ||||||
| ||||||||
| Ally Financial, Inc.: | ||||||||
| 4.625% Sr. Unsec. Nts., 5/19/22 | 115,000 | 115,144 | ||||||
| 5.125% Sr. Unsec. Nts., 9/30/24 | 150,000 | 153,937 | ||||||
| 7.50% Sr. Unsec. Nts., 9/15/20 | 104,000 | 122,200 | ||||||
| ||||||||
| Cash America International, Inc., 5.75% Sr. Unsec. Nts., 5/15/18 | 30,000 | 30,675 | ||||||
| ||||||||
| Navient Corp.: | ||||||||
| 5.875% Sr. Unsec. Nts., 10/25/24 | 315,000 | 301,613 | ||||||
| 6.125% Sr. Unsec. Nts., 3/25/24 | 100,000 | 97,500 | ||||||
| ||||||||
| Speedy Cash Intermediate Holdings Corp., 10.75% Sec. Nts., 5/15/181 | 210,000 | 204,225 | ||||||
| ||||||||
| TMX Finance LLC/TitleMax Finance Corp., 8.50% Sr. Sec. Nts., 9/15/181 | 135,000 | 115,020 | ||||||
|
| |||||||
| 1,250,864 | ||||||||
| ||||||||
| Diversified Financial Services—1.3% | ||||||||
| ||||||||
| Banco BTG Pactual SA (Cayman Islands), 5.75% Sub. Nts., 9/28/221 | 225,000 | 210,937 | ||||||
| ||||||||
| InRetail Consumer, 5.25% Sr. Unsec. Nts., 10/10/211 | 40,000 | 41,700 | ||||||
| ||||||||
| Intercorp Peru Ltd., 5.875% Sr. Unsec. Nts., 2/12/251 | 220,000 | 221,870 | ||||||
| ||||||||
| Jefferies Finance LLC/JFIN Co.-Issuer Corp., 7.375% Sr. Unsec. Nts., 4/1/201 | 115,000 | 115,863 | ||||||
| ||||||||
| MSCI, Inc., 5.25% Sr. Unsec. Nts., 11/15/241 | 65,000 | 68,006 | ||||||
| ||||||||
| Opal Acquisition, Inc., 8.875% Sr. Unsec. Nts., 12/15/211 | 25,000 | 24,719 | ||||||
|
| |||||||
| 683,095 | ||||||||
| ||||||||
| Insurance—0.8% | ||||||||
| ||||||||
| CNO Financial Group, Inc., 4.50% Sr. Unsec. Nts., 5/30/20 | 115,000 | 119,091 | ||||||
| ||||||||
| HUB International Ltd., 7.875% Sr. Unsec. Nts., 10/1/211 | 130,000 | 134,550 | ||||||
| ||||||||
| National Financial Partners Corp., 9% Sr. Unsec. Nts., 7/15/211 | 140,000 | 142,100 | ||||||
|
| |||||||
| 395,741 | ||||||||
| ||||||||
| Real Estate Investment Trusts (REITs)—1.2% | ||||||||
| ||||||||
| Communications Sales & Leasing, Inc., 8.25% Sr. Unsec. Nts., 10/15/231 | 120,000 | 122,700 | ||||||
| ||||||||
| CTR Partnership LP/CareTrust Capital Corp., 5.875% Sr. Unsec. Nts., 6/1/21 | 70,000 | 72,275 | ||||||
19 OPPENHEIMER GLOBAL HIGH YIELD FUND
STATEMENT OF INVESTMENTS Continued
| Principal Amount | Value | |||||||
| ||||||||
| Real Estate Investment Trusts (REITs) (Continued) | ||||||||
| ||||||||
| GLP Capital LP/GLP Financing II, Inc., 4.875% Sr. Unsec. Nts., 11/1/20 | $ | 125,000 | $ | 130,000 | ||||
| ||||||||
| iStar Financial, Inc., 4.875% Sr. Unsec. Nts., 7/1/18 | 110,000 | 108,900 | ||||||
| ||||||||
| Outfront Media Capital LLC/Outfront Media Capital Corp., 5.875% Sr. Unsec. Nts., 3/15/25 | 210,000 | 222,338 | ||||||
|
| |||||||
| 656,213 | ||||||||
| ||||||||
| Real Estate Management & Development—1.4% | ||||||||
| ||||||||
| Brookfield Residential Properties, Inc., 6.50% Sr. Unsec. Nts., 12/15/201 | 165,000 | 170,363 | ||||||
| ||||||||
| Jafz Sukuk Ltd., 7% Sr. Unsec. Nts., 6/19/19 | 140,000 | 161,123 | ||||||
| ||||||||
| Logan Property Holdings Co. Ltd., 11.25% Sr. Unsec. Nts., 6/4/19 | 210,000 | 215,343 | ||||||
| ||||||||
| Realogy Group LLC/Realogy Co.-Issuer Corp., 5.25% Sr. Unsec. Nts., 12/1/211 | 50,000 | 51,125 | ||||||
| ||||||||
| Sukuk Funding No. 3 Ltd., 4.348% Sr. Unsec. Nts., 12/3/18 | 155,000 | 163,868 | ||||||
|
| |||||||
| 761,822 | ||||||||
| ||||||||
| Thrifts & Mortgage Finance—0.3% | ||||||||
| ||||||||
| Jefferies Finance LLC/JFIN Co.-Issuer Corp., 6.875% Sr. Unsec. Nts., 4/15/221 | 20,000 | 19,425 | ||||||
| ||||||||
| Quicken Loans, Inc., 5.75% Sr. Unsec. Nts., 5/1/251 | 115,000 | 115,431 | ||||||
|
| |||||||
| 134,856 | ||||||||
| ||||||||
| Health Care—6.8% | ||||||||
| ||||||||
| Biotechnology—0.1% | ||||||||
| ||||||||
| Universal Hospital Services, Inc., 7.625% Sec. Nts., 8/15/203 | 40,000 | 37,250 | ||||||
| ||||||||
| Health Care Equipment & Supplies—0.1% | ||||||||
| ||||||||
| DJO Finco, Inc./DJO Finance LLC/DJO Finance Corp., 8.125% Sec. Nts., 6/15/211 | 70,000 | 72,275 | ||||||
| ||||||||
| Health Care Providers & Services—4.5% | ||||||||
| ||||||||
| Acadia Healthcare Co., Inc., 5.625% Sr. Unsec. Nts., 2/15/231 | 50,000 | 51,375 | ||||||
| ||||||||
| Amsurg Corp., 5.625% Sr. Unsec. Nts., 7/15/22 | 35,000 | 35,963 | ||||||
| ||||||||
| Centene Corp., 4.75% Sr. Unsec. Nts., 5/15/22 | 140,000 | 147,700 | ||||||
| ||||||||
| CHS/Community Health Systems, Inc., 7.125% Sr. Unsec. Nts., 7/15/20 | 285,000 | 304,594 | ||||||
| ||||||||
| DaVita HealthCare Partners, Inc.: | ||||||||
| 5.00% Sr. Unsec. Nts., 5/1/25 | 60,000 | 59,625 | ||||||
| 5.125% Sr. Unsec. Nts., 7/15/24 | 30,000 | 30,375 | ||||||
| 5.75% Sr. Unsec. Nts., 8/15/22 | 145,000 | 154,787 | ||||||
| ||||||||
| Envision Healthcare Corp., 5.125% Sr. Unsec. Nts., 7/1/221 | 115,000 | 118,738 | ||||||
| ||||||||
| ExamWorks Group, Inc., 5.625% Sr. Unsec. Nts., 4/15/23 | 60,000 | 61,575 | ||||||
| ||||||||
| FGI Operating Co. LLC/FGI Finance, Inc., 7.875% Sec. Nts., 5/1/20 | 160,000 | 128,800 | ||||||
| ||||||||
| HCA, Inc.: | ||||||||
| 5.375% Sr. Unsec. Nts., 2/1/25 | 160,000 | 165,200 | ||||||
| 7.50% Sr. Unsec. Nts., 2/15/22 | 135,000 | 158,287 | ||||||
| ||||||||
| HealthSouth Corp., 5.75% Sr. Unsec. Nts., 11/1/24 | 55,000 | 56,994 | ||||||
| ||||||||
| IASIS Healthcare LLC/IASIS Capital Corp., 8.375% Sr. Unsec. Nts., 5/15/19 | 145,000 | 151,978 | ||||||
| ||||||||
| Kindred Healthcare, Inc., 6.375% Sr. Unsec. Nts., 4/15/22 | 55,000 | 56,306 | ||||||
| ||||||||
| LifePoint Health, Inc., 5.50% Sr. Unsec. Nts., 12/1/21 | 100,000 | 105,375 | ||||||
| ||||||||
| Omnicare, Inc., 4.75% Sr. Unsec. Nts., 12/1/22 | 30,000 | 32,700 | ||||||
| ||||||||
| Select Medical Corp., 6.375% Sr. Unsec. Nts., 6/1/21 | 175,000 | 176,750 | ||||||
20 OPPENHEIMER GLOBAL HIGH YIELD FUND
| Principal Amount | Value | |||||||
| ||||||||
| Health Care Providers & Services (Continued) | ||||||||
| ||||||||
| Tenet Healthcare Corp.: | ||||||||
| 6.00% Sr. Sec. Nts., 10/1/20 | $ | 90,000 | $ | 96,525 | ||||
| 8.125% Sr. Unsec. Nts., 4/1/22 | 190,000 | 207,575 | ||||||
| ||||||||
| Universal Health Services, Inc., 4.75% Sr. Sec. Nts., 8/1/221 | 85,000 | 88,931 | ||||||
|
| |||||||
| 2,390,153 | ||||||||
| ||||||||
| Life Sciences Tools & Services—0.2% | ||||||||
| ||||||||
| Quintiles Transnational Corp., 4.875% Sr. Unsec. Nts., 5/15/231 | 88,000 | 89,540 | ||||||
| ||||||||
| Pharmaceuticals—1.9% | ||||||||
| ||||||||
| Concordia Healthcare Corp., 7% Sr. Unsec. Nts., 4/15/231 | 85,000 | 85,744 | ||||||
| ||||||||
| DPx Holdings BV, 7.50% Sr. Unsec. Nts., 2/1/221 | 45,000 | 47,250 | ||||||
| ||||||||
| Endo Finance LLC/Endo Finco, Inc., 5.375% Sr. Unsec. Nts., 1/15/231 | 110,000 | 107,800 | ||||||
| ||||||||
| Endo Finance LLC/Endo Ltd./Endo Finco, Inc., 6% Sr. Unsec. Nts., 2/1/251 | 110,000 | 111,925 | ||||||
| ||||||||
| Mallinckrodt International Finance SA/Mallinckrodt CB LLC: | ||||||||
| 4.875% Sr. Unsec. Nts., 4/15/201 | 60,000 | 61,650 | ||||||
| 5.50% Sr. Unsec. Nts., 4/15/251 | 60,000 | 60,570 | ||||||
| 5.75% Sr. Unsec. Nts., 8/1/221 | 155,000 | 162,944 | ||||||
| ||||||||
| Valeant Pharmaceuticals International, Inc.: | ||||||||
| 5.375% Sr. Unsec. Nts., 3/15/201 | 45,000 | 47,025 | ||||||
| 5.50% Sr. Unsec. Nts., 3/1/231 | 120,000 | 122,700 | ||||||
| 5.875% Sr. Unsec. Nts., 5/15/231 | 45,000 | 46,744 | ||||||
| 7.25% Sr. Unsec. Nts., 7/15/221 | 115,000 | 123,481 | ||||||
|
| |||||||
| 977,833 | ||||||||
| ||||||||
| Industrials—14.5% | ||||||||
| ||||||||
| Aerospace & Defense—2.7% | ||||||||
| ||||||||
| Aerojet Rocketdyne Holdings, Inc., 7.125% Sec. Nts., 3/15/21 | 205,000 | 220,375 | ||||||
| ||||||||
| CBC Ammo LLC/CBC FinCo, Inc., 7.25% Sr. Unsec. Nts., 11/15/211 | 230,000 | 215,625 | ||||||
| ||||||||
| Erickson, Inc., 8.25% Sec. Nts., 5/1/20 | 145,000 | 110,562 | ||||||
| ||||||||
| Huntington Ingalls Industries, Inc., 7.125% Sr. Unsec. Unsub. Nts., 3/15/21 | 70,000 | 75,250 | ||||||
| ||||||||
| KLX, Inc., 5.875% Sr. Unsec. Nts., 12/1/221 | 150,000 | 152,438 | ||||||
| ||||||||
| Kratos Defense & Security Solutions, Inc., 7% Sr. Sec. Nts., 5/15/19 | 125,000 | 111,875 | ||||||
| ||||||||
| LMI Aerospace, Inc., 7.375% Sec. Nts., 7/15/191 | 110,000 | 110,000 | ||||||
| ||||||||
| Sequa Corp., 7% Sr. Unsec. Nts., 12/15/171 | 120,000 | 79,800 | ||||||
| ||||||||
| Spirit AeroSystems, Inc., 5.25% Sr. Unsec. Nts., 3/15/22 | 125,000 | 131,875 | ||||||
| ||||||||
| TransDigm, Inc., 6% Sr. Sub. Nts., 7/15/22 | 105,000 | 106,575 | ||||||
| ||||||||
| Triumph Group, Inc., 5.25% Sr. Unsec. Nts., 6/1/22 | 125,000 | 124,375 | ||||||
|
| |||||||
| 1,438,750 | ||||||||
| ||||||||
| Air Freight & Couriers—0.7% | ||||||||
| ||||||||
| CEVA Group plc, 7% Sr. Sec. Nts., 3/1/211 | 270,000 | 268,650 | ||||||
| ||||||||
| XPO Logistics, Inc., 7.875% Sr. Unsec. Nts., 9/1/191 | 90,000 | 96,975 | ||||||
|
| |||||||
| 365,625 | ||||||||
| ||||||||
| Airlines—0.5% | ||||||||
| ||||||||
| Air Canada, 6.75% Sr. Sec. Nts., 10/1/191 | 200,000 | 214,000 | ||||||
| ||||||||
| Air Medical Merger Sub Corp., 6.375% Sr. Unsec. Nts., 5/15/231 | 60,000 | 58,050 | ||||||
|
| |||||||
| 272,050 | ||||||||
21 OPPENHEIMER GLOBAL HIGH YIELD FUND
STATEMENT OF INVESTMENTS Continued
| Principal Amount | Value | |||||||
| ||||||||
| Building Products—1.1% | ||||||||
| ||||||||
| Building Materials Corp. of America, 5.375% Sr. Unsec. Nts., 11/15/241 | $ | 170,000 | $ | 172,230 | ||||
| ||||||||
| CPG Merger Sub LLC, 8% Sr. Unsec. Nts., 10/1/211 | 95,000 | 100,225 | ||||||
| ||||||||
| Nortek, Inc., 8.50% Sr. Unsec. Nts., 4/15/21 | 135,000 | 146,981 | ||||||
| ||||||||
| Roofing Supply Group LLC/Roofing Supply Finance, Inc., 10% Sr. Unsec. Nts., 6/1/201 | 85,000 | 87,763 | ||||||
| ||||||||
| USG Corp., 5.50% Sr. Unsec. Nts., 3/1/251 | 60,000 | 62,325 | ||||||
|
| |||||||
| 569,524 | ||||||||
| ||||||||
| Commercial Services & Supplies—3.7% | ||||||||
| ||||||||
| ADT Corp. (The), 5.25% Sr. Unsec. Nts., 3/15/20 | 215,000 | 228,706 | ||||||
| ||||||||
| Affinion Group, Inc., 7.875% Sr. Unsec. Nts., 12/15/18 | 105,000 | 74,025 | ||||||
| ||||||||
| Cenveo Corp.: | ||||||||
| 6.00% Sr. Sec. Nts., 8/1/191 | 115,000 | 109,825 | ||||||
| 8.50% Sec. Nts., 9/15/221 | 100,000 | 84,875 | ||||||
| ||||||||
| Clean Harbors, Inc., 5.25% Sr. Unsec. Unsub. Nts., 8/1/20 | 200,000 | 206,500 | ||||||
| ||||||||
| First Data Corp., 6.75% Sr. Sec. Nts., 11/1/201 | 307,000 | 328,490 | ||||||
| ||||||||
| Garda World Security Corp., 7.25% Sr. Unsec. Nts., 11/15/211 | 200,000 | 197,000 | ||||||
| ||||||||
| Monitronics International, Inc., 9.125% Sr. Unsec. Nts., 4/1/20 | 155,000 | 153,063 | ||||||
| ||||||||
| Quad/Graphics, Inc., 7% Sr. Unsec. Nts., 5/1/22 | 110,000 | 108,350 | ||||||
| ||||||||
| R.R. Donnelley & Sons Co., 7.875% Sr. Unsec. Nts., 3/15/21 | 110,000 | 126,500 | ||||||
| ||||||||
| West Corp., 5.375% Sr. Unsec. Nts., 7/15/221 | 320,000 | 311,600 | ||||||
|
| |||||||
| 1,928,934 | ||||||||
| ||||||||
| Electrical Equipment—0.8% | ||||||||
| ||||||||
| EnerSys, 5% Sr. Unsec. Nts., 4/30/231 | 110,000 | 111,650 | ||||||
| ||||||||
| General Cable Corp., 5.75% Sr. Unsec. Nts., 10/1/22 | 175,000 | 161,000 | ||||||
| ||||||||
| Sensata Technologies BV, 5.625% Sr. Unsec. Nts., 11/1/241 | 120,000 | 128,400 | ||||||
|
| |||||||
| 401,050 | ||||||||
| ||||||||
| Machinery—2.1% | ||||||||
| ||||||||
| Actuant Corp., 5.625% Sr. Unsec. Nts., 6/15/22 | 85,000 | 87,550 | ||||||
| ||||||||
| Amsted Industries, Inc., 5% Sr. Unsec. Nts., 3/15/225 | 150,000 | 153,000 | ||||||
| ||||||||
| Cleaver-Brooks, Inc., 8.75% Sr. Sec. Nts., 12/15/191 | 135,000 | 136,687 | ||||||
| ||||||||
| EnPro Industries, Inc., 5.875% Sr. Unsec. Nts., 9/15/225 | 105,000 | 109,463 | ||||||
| ||||||||
| Meritor, Inc., 6.25% Sr. Unsec. Nts., 2/15/24 | 190,000 | 194,038 | ||||||
| ||||||||
| Navistar International Corp., 8.25% Sr. Unsec. Nts., 11/1/21 | 205,000 | 206,025 | ||||||
| ||||||||
| Terex Corp., 6% Sr. Unsec. Nts., 5/15/21 | 125,000 | 127,812 | ||||||
| ||||||||
| Xerium Technologies, Inc., 8.875% Sr. Unsec. Nts., 6/15/18 | 95,000 | 98,741 | ||||||
|
| |||||||
| 1,113,316 | ||||||||
| ||||||||
| Marine—0.3% | ||||||||
| ||||||||
| Navios Maritime Holdings, Inc./Navios Maritime Finance II US, Inc., 7.375% Sr. Nts., 1/15/221 | 165,000 | 151,388 | ||||||
| ||||||||
| Professional Services—0.3% | ||||||||
| ||||||||
| FTI Consulting, Inc., 6% Sr. Unsec. Nts., 11/15/22 | 145,000 | 154,606 | ||||||
| ||||||||
| Road & Rail—0.8% | ||||||||
| ||||||||
| Avis Budget Car Rental LLC/Avis Budget Finance, Inc., 5.25% Sr. Unsec. Nts., 3/15/251 | 100,000 | 98,375 | ||||||
| ||||||||
| CAR, Inc., 6.125% Sr. Unsec. Nts., 2/4/201 | 220,000 | 227,150 | ||||||
22 OPPENHEIMER GLOBAL HIGH YIELD FUND
| Principal Amount | Value | |||||||
| ||||||||
| Road & Rail (Continued) | ||||||||
| ||||||||
| Kenan Advantage Group, Inc. (The), 8.375% Sr. Unsec. Nts., 12/15/185 | $ | 120,000 | $ | 125,400 | ||||
|
| |||||||
| 450,925 | ||||||||
| ||||||||
| Trading Companies & Distributors—1.5% | ||||||||
| ||||||||
| Fly Leasing Ltd., 6.75% Sr. Unsec. Nts., 12/15/20 | 320,000 | 331,200 | ||||||
| ||||||||
| HD Supply, Inc.: | ||||||||
| 5.25% Sr. Sec. Nts., 12/15/211 | 75,000 | 78,281 | ||||||
| 7.50% Sr. Unsec. Nts., 7/15/201 | 140,000 | 152,075 | ||||||
| ||||||||
| Jurassic Holdings III, Inc., 6.875% Sec. Nts., 2/15/211 | 145,000 | 122,162 | ||||||
| ||||||||
| United Rentals North America, Inc., 4.625% Sr. Sec. Nts., 7/15/23 | 110,000 | 110,413 | ||||||
|
| |||||||
| 794,131 | ||||||||
| ||||||||
| Information Technology—7.8% | ||||||||
| ||||||||
| Communications Equipment—2.5% | ||||||||
| ||||||||
| Alcatel-Lucent USA, Inc., 6.75% Sr. Unsec. Nts., 11/15/201 | 325,000 | 345,719 | ||||||
| ||||||||
| Avaya, Inc., 7% Sr. Sec. Nts., 4/1/191 | 220,000 | 221,100 | ||||||
| ||||||||
| Blue Coat Holdings, Inc., 8.375% Sr. Unsec. Nts., 6/1/231 | 105,000 | 106,313 | ||||||
| ||||||||
| CommScope Technologies Finance LLC, 6% Sr. Sec. Nts., 6/15/251,3 | 50,000 | 50,750 | ||||||
| ||||||||
| CommScope, Inc., 4.375% Sr. Sec. Nts., 6/15/201,3 | 25,000 | 25,281 | ||||||
| ||||||||
| Infor US, Inc., 6.50% Sr. Unsec. Nts., 5/15/221 | 110,000 | 114,554 | ||||||
| ||||||||
| Plantronics, Inc., 5.50% Sr. Unsec. Nts., 5/31/231 | 40,000 | 40,700 | ||||||
| ||||||||
| Project Homestake Merger Corp., 8.875% Sr. Unsec. Nts., 3/1/231 | 80,000 | 80,200 | ||||||
| ||||||||
| ViaSat, Inc., 6.875% Sr. Unsec. Nts., 6/15/20 | 290,000 | 308,850 | ||||||
|
| |||||||
| 1,293,467 | ||||||||
| ||||||||
| Electronic Equipment, Instruments, & Components—1.2% | ||||||||
| ||||||||
| Anixter, Inc., 5.625% Sr. Unsec. Nts., 5/1/19 | 100,000 | 108,000 | ||||||
| ||||||||
| Belden, Inc., 5.50% Sr. Sub. Nts., 9/1/221 | 105,000 | 108,150 | ||||||
| ||||||||
| CDW LLC/CDW Finance Corp., 5% Sr. Unsec. Nts., 9/1/23 | 35,000 | 35,988 | ||||||
| ||||||||
| Zebra Technologies Corp., 7.25% Sr. Unsec. Nts., 10/15/221 | 350,000 | 380,625 | ||||||
|
| |||||||
| 632,763 | ||||||||
| ||||||||
| Internet Software & Services—0.4% | ||||||||
| ||||||||
| EarthLink Holdings Corp., 7.375% Sr. Sec. Nts., 6/1/20 | 150,000 | 157,687 | ||||||
| ||||||||
| Equinix, Inc., 5.375% Sr. Unsec. Nts., 1/1/22 | 75,000 | 78,422 | ||||||
|
| |||||||
| 236,109 | ||||||||
| ||||||||
| IT Services—1.3% | ||||||||
| ||||||||
| Ceridian HCM Holding, Inc., 11% Sr. Unsec. Nts., 3/15/211 | 10,000 | 10,625 | ||||||
| ||||||||
| First Data Corp., 8.25% Sec. Nts., 1/15/211 | 200,000 | 213,750 | ||||||
| ||||||||
| Harland Clarke Holdings Corp., 6.875% Sr. Sec. Nts., 3/1/201 | 160,000 | 161,400 | ||||||
| ||||||||
| WEX, Inc., 4.75% Sr. Unsec. Nts., 2/1/231 | 310,000 | 302,250 | ||||||
|
| |||||||
| 688,025 | ||||||||
| ||||||||
| Semiconductors & Semiconductor Equipment—0.8% | ||||||||
| ||||||||
| Freescale Semiconductor, Inc., 6% Sr. Sec. Nts., 1/15/221 | 130,000 | 140,400 | ||||||
| ||||||||
| Micron Technology, Inc.: | ||||||||
| 5.25% Sr. Unsec. Nts., 8/1/231 | 215,000 | 215,538 | ||||||
| 5.50% Sr. Unsec. Nts., 2/1/251 | 35,000 | 34,821 | ||||||
23 OPPENHEIMER GLOBAL HIGH YIELD FUND
STATEMENT OF INVESTMENTS Continued
Principal Amount | Value | |||||||||
| ||||||||||
| Semiconductors & Semiconductor Equipment (Continued) | ||||||||||
| ||||||||||
| Micron Technology, Inc.: (Continued) | ||||||||||
| 5.875% Sr. Unsec. Nts., 2/15/22 | $ | 20,000 | $ | 21,075 | ||||||
|
| |||||||||
| 411,834 | ||||||||||
| ||||||||||
| Software—0.8% | ||||||||||
| ||||||||||
| Activision Blizzard, Inc., 5.625% Sr. Unsec. Nts., 9/15/211 | 40,000 | 42,850 | ||||||||
| ||||||||||
| Blackboard, Inc., 7.75% Sr. Unsec. Nts., 11/15/195 | 90,000 | 86,850 | ||||||||
| ||||||||||
| BMC Software Finance, Inc., 8.125% Sr. Unsec. Nts., 7/15/211 | 95,000 | 86,331 | ||||||||
| ||||||||||
| Interactive Data Corp., 5.875% Sr. Unsec. Nts., 4/15/191 | 145,000 | 147,719 | ||||||||
| ||||||||||
| TIBCO Software, Inc., 11.375% Sr. Unsec. Nts., 12/1/211 | 40,000 | 41,000 | ||||||||
|
| |||||||||
| 404,750 | ||||||||||
| ||||||||||
| Technology Hardware, Storage & Peripherals—0.8% | ||||||||||
| ||||||||||
| Denali Borrower LLC/Denali Finance Corp., 5.625% Sr. Sec. Nts., 10/15/201 | 400,000 | 425,500 | ||||||||
| ||||||||||
| Materials—11.1% | ||||||||||
| ||||||||||
| Chemicals—2.1% | ||||||||||
| ||||||||||
| ADS Waste Holdings, Inc., 8.25% Sr. Unsec. Nts., 10/1/20 | 210,000 | 222,337 | ||||||||
| ||||||||||
| Chemours Co.: | ||||||||||
| 6.625% Sr. Unsec. Nts., 5/15/231 | 65,000 | 66,138 | ||||||||
| 7.00% Sr. Unsec. Nts., 5/15/251 | 65,000 | 66,300 | ||||||||
| ||||||||||
| Hexion, Inc., 6.625% Sr. Sec. Nts., 4/15/20 | 50,000 | 47,375 | ||||||||
| ||||||||||
| Huntsman International LLC, 5.125% Sr. Unsec. Nts., 11/15/221 | 70,000 | 70,350 | ||||||||
| ||||||||||
| INEOS Group Holdings SA, 6.125% Sr. Unsec. Nts., 8/15/181 | 200,000 | 206,250 | ||||||||
| ||||||||||
| Momentive Performance Materials, Inc., 3.88% Sr. Sec. Nts., 10/24/21 | 90,000 | 81,337 | ||||||||
| ||||||||||
| NOVA Chemicals Corp., 5% Sr. Unsec. Nts., 5/1/251 | 85,000 | 87,337 | ||||||||
| ||||||||||
| Platform Specialty Products Corp., 6.50% Sr. Unsec. Nts., 2/1/221 | 65,000 | 68,575 | ||||||||
| ||||||||||
| Techniplas LLC, 10% Sr. Sec. Nts., 5/1/201 | 125,000 | 127,813 | ||||||||
| ||||||||||
| Tronox Finance LLC, 6.375% Sr. Unsec. Nts., 8/15/20 | 80,000 | 77,200 | ||||||||
|
| |||||||||
| 1,121,012 | ||||||||||
| ||||||||||
| Construction Materials—1.3% | ||||||||||
| ||||||||||
| Cemex SAB de CV: | ||||||||||
| 4.75% Sr. Sec. Nts., 1/11/221 | EUR | 15,000 | 16,879 | |||||||
| 5.70% Sr. Sec. Nts., 1/11/251 | 210,000 | 207,049 | ||||||||
| ||||||||||
| Elementia SAB de CV, 5.50% Sr. Unsec. Nts., 1/15/251 | 230,000 | 234,888 | ||||||||
| ||||||||||
| Union Andina de Cementos SAA, 5.875% Sr. Unsec. Nts., 10/30/211 | 220,000 | 225,225 | ||||||||
|
| |||||||||
| 684,041 | ||||||||||
| ||||||||||
| Containers & Packaging—2.2% | ||||||||||
| ||||||||||
| Ardagh Packaging Finance plc/Ardagh Holdings USA, Inc.: | ||||||||||
| 6.00% Sr. Unsec. Nts., 6/30/211 | 90,000 | 90,900 | ||||||||
| 6.75% Sr. Unsec. Nts., 1/31/211 | 95,000 | 98,325 | ||||||||
| ||||||||||
| Ardagh Packaging Finance plc/Ardagh MP Holdings USA, Inc., 7% Sr. Unsec. Nts., 11/15/201 | 16,765 | 17,268 | ||||||||
| ||||||||||
| Berry Plastics Corp.: | ||||||||||
| 5.125% Sec. Nts., 7/15/233 | 115,000 | 114,713 | ||||||||
| 5.50% Sec. Nts., 5/15/22 | 70,000 | 71,881 | ||||||||
| ||||||||||
| BWAY Holding Co., 9.125% Sr. Unsec. Nts., 8/15/211 | 70,000 | 72,975 | ||||||||
| ||||||||||
| Coveris Holdings SA, 7.875% Sr. Unsec. Nts., 11/1/191 | 70,000 | 71,925 | ||||||||
24 OPPENHEIMER GLOBAL HIGH YIELD FUND
| Principal Amount | Value | |||||||
| ||||||||
| Containers & Packaging (Continued) | ||||||||
| ||||||||
| Crown Americas LLC/Crown Americas Capital Corp. IV, 4.50% Sr. Unsec. Nts., 1/15/23 | $ | 85,000 | $ | 84,362 | ||||
| ||||||||
| Owens-Brockway Glass Container, Inc., 5% Sr. Unsec. Nts., 1/15/221 | 45,000 | 46,069 | ||||||
| ||||||||
| Reynolds Group Issuer, Inc./Reynolds Group Issuer LLC/Reynolds Group Issuer Luxembourg SA: | ||||||||
| 5.75% Sr. Sec. Nts., 10/15/20 | 215,000 | 224,944 | ||||||
| 8.25% Sr. Unsec. Nts., 2/15/21 | 55,000 | 58,231 | ||||||
| 9.875% Sr. Unsec. Nts., 8/15/19 | 25,000 | 26,578 | ||||||
| ||||||||
| Sealed Air Corp.: | ||||||||
| 4.875% Sr. Unsec. Nts., 12/1/221 | 55,000 | 55,550 | ||||||
| 5.125% Sr. Unsec. Nts., 12/1/241 | 55,000 | 56,169 | ||||||
| 6.50% Sr. Unsec. Nts., 12/1/201 | 80,000 | 89,600 | ||||||
|
| |||||||
| 1,179,490 | ||||||||
| ||||||||
| Metals & Mining—4.0% | ||||||||
| ||||||||
| ABJA Investment Co. Pte Ltd., 5.95% Sr. Unsec. Nts., 7/31/24 | 200,000 | 203,002 | ||||||
| ||||||||
| Alcoa, Inc., 5.125% Sr. Unsec. Nts., 10/1/24 | 140,000 | 150,150 | ||||||
| ||||||||
| Aleris International, Inc., 7.875% Sr. Unsec. Nts., 11/1/20 | 95,000 | 99,037 | ||||||
| ||||||||
| ArcelorMittal: | ||||||||
| 6.125% Sr. Unsec. Nts., 6/1/253 | 40,000 | 40,750 | ||||||
| 6.25% Sr. Unsec. Nts., 3/1/21 | 95,000 | 100,581 | ||||||
| ||||||||
| Constellium NV, 5.75% Sr. Unsec. Nts., 5/15/241 | 55,000 | 51,975 | ||||||
| ||||||||
| JMC Steel Group, Inc., 8.25% Sr. Nts., 3/15/181 | 90,000 | 81,787 | ||||||
| ||||||||
| Metalloinvest Finance Ltd., 5.625% Unsec. Nts., 4/17/201 | 155,000 | 141,980 | ||||||
| ||||||||
| Nord Gold NV, 6.375% Sr. Unsec. Nts., 5/7/181 | 245,000 | 242,550 | ||||||
| ||||||||
| Novelis, Inc., 8.75% Sr. Unsec. Nts., 12/15/20 | 85,000 | 90,976 | ||||||
| ||||||||
| OJSC Novolipetsk Steel via Steel Funding Ltd., 4.45% Sr. Unsec. Nts., 2/19/181 | 150,000 | 147,203 | ||||||
| ||||||||
| Polyus Gold International Ltd., 5.625% Sr. Unsec. Nts., 4/29/201 | 250,000 | 241,250 | ||||||
| ||||||||
| Steel Dynamics, Inc., 5.125% Sr. Unsec. Nts., 10/1/21 | 125,000 | 127,188 | ||||||
| ||||||||
| Thompson Creek Metals Co., Inc., 7.375% Sr. Unsec. Nts., 6/1/18 | 55,000 | 48,125 | ||||||
| ||||||||
| Vedanta Resources plc, 8.25% Sr. Unsec. Nts., 6/7/211 | 230,000 | 227,412 | ||||||
| ||||||||
| Wise Metals Group LLC/Wise Alloys Finance Corp., 8.75% Sr. Sec. Nts., 12/15/181 | 80,000 | 85,801 | ||||||
|
| |||||||
| 2,079,767 | ||||||||
| ||||||||
| Paper & Forest Products—1.5% | ||||||||
| ||||||||
| Fibria Overseas Finance Ltd., 5.25% Sr. Unsec. Nts., 5/12/24 | 215,000 | 223,084 | ||||||
| ||||||||
| PaperWorks Industries, Inc., 9.50% Sr. Sec. Nts., 8/15/191 | 90,000 | 91,688 | ||||||
| ||||||||
| Sappi Papier Holding GmbH, 6.625% Sr. Sec. Nts., 4/15/211 | 230,000 | 243,225 | ||||||
| ||||||||
| Suzano Trading Ltd., 5.875% Sr. Unsec. Nts., 1/23/211 | 215,000 | 226,717 | ||||||
|
| |||||||
| 784,714 | ||||||||
| ||||||||
| Telecommunication Services—6.6% | ||||||||
| ||||||||
| Diversified Telecommunication Services—4.3% | ||||||||
| ||||||||
| CenturyLink, Inc., 6.45% Sr. Unsec. Nts., 6/15/21 | 100,000 | 107,125 | ||||||
| ||||||||
| Cequel Communications Holdings I LLC/Cequel Capital Corp., 6.375% Sr. Unsec. Nts., 9/15/201 | 420,000 | 429,975 | ||||||
| ||||||||
| Colombia Telecomunicaciones SA ESP: | ||||||||
| 5.375% Sr. Unsec. Nts., 9/27/221 | 130,000 | 132,275 | ||||||
| 8.50% Sub. Perpetual Bonds1,2,7 | 130,000 | 137,605 | ||||||
| ||||||||
| Columbus International, Inc., 7.375% Sr. Unsec. Nts., 3/30/211 | 205,000 | 222,937 | ||||||
25 OPPENHEIMER GLOBAL HIGH YIELD FUND
STATEMENT OF INVESTMENTS Continued
| Principal Amount | Value | |||||||
| ||||||||
| Diversified Telecommunication Services (Continued) | ||||||||
| ||||||||
| Digicel Ltd., 6.75% Sr. Unsec. Nts., 3/1/231 | $ | 35,000 | $ | 34,825 | ||||
| ||||||||
| Frontier Communications Corp., 7.125% Sr. Unsec. Nts., 1/15/23 | 85,000 | 81,812 | ||||||
| ||||||||
| Intelsat Luxembourg SA, 7.75% Sr. Unsec. Nts., 6/1/21 | 170,000 | 154,063 | ||||||
| ||||||||
| Level 3 Financing, Inc.: | ||||||||
| 5.375% Sr. Unsec. Nts., 8/15/22 | 305,000 | 313,006 | ||||||
| 5.625% Sr. Unsec. Nts., 2/1/231 | 100,000 | 103,625 | ||||||
| ||||||||
| T-Mobile USA, Inc.: | ||||||||
| 6.25% Sr. Unsec. Nts., 4/1/21 | 100,000 | 106,200 | ||||||
| 6.625% Sr. Unsec. Nts., 4/1/23 | 145,000 | 152,975 | ||||||
| ||||||||
| Windstream Services LLC: | ||||||||
| 6.375% Sr. Unsec. Nts., 8/1/23 | 60,000 | 50,625 | ||||||
| 7.75% Sr. Unsec. Nts., 10/15/20 | 65,000 | 66,300 | ||||||
| 7.75% Sr. Unsec. Nts., 10/1/21 | 65,000 | 61,750 | ||||||
| ||||||||
| Zayo Group LLC/Zayo Capital, Inc., 6% Sr. Unsec. Nts., 4/1/231 | 110,000 | 111,044 | ||||||
|
| |||||||
| 2,266,142 | ||||||||
| ||||||||
| Wireless Telecommunication Services—2.3% | ||||||||
| ||||||||
| Digicel Group Ltd., 7.125% Sr. Unsec. Nts., 4/1/221 | 230,000 | 224,250 | ||||||
| ||||||||
| Millicom International Cellular SA, 6% Sr. Unsec. Nts., 3/15/251 | 250,000 | 252,820 | ||||||
| ||||||||
| Mobile Telesystems OJSC via MTS International Funding Ltd., 5% Sr. Unsec. Nts., 5/30/231 | 150,000 | 138,600 | ||||||
| ||||||||
| Sistema JSFC via Sistema International Funding SA, 6.95% Sr. Unsec. Nts., 5/17/191 | 100,000 | 98,050 | ||||||
| ||||||||
| Sprint Corp.: | ||||||||
| 7.25% Sr. Unsec. Nts., 9/15/21 | 125,000 | 126,094 | ||||||
| 7.875% Sr. Unsec. Nts., 9/15/23 | 145,000 | 147,813 | ||||||
| ||||||||
| VimpelCom Holdings BV: | ||||||||
| 5.95% Sr. Unsec. Unsub. Nts., 2/13/231 | 100,000 | 92,750 | ||||||
| 7.504% Sr. Unsec. Nts., 3/1/221 | 150,000 | 152,625 | ||||||
|
| |||||||
| 1,233,002 | ||||||||
| ||||||||
| Utilities—2.4% | ||||||||
| ||||||||
| Electric Utilities—0.0% | ||||||||
| ||||||||
| MMC Energy. Inc., 8.875% Sr. Unsec. Nts., 10/15/204 | 90,000 | 9 | ||||||
| ||||||||
| Gas Utilities—0.1% | ||||||||
| ||||||||
| Ferrellgas LP/Ferrellgas Finance Corp., 6.50% Sr. Unsec. Nts., 5/1/21 | 70,000 | 71,225 | ||||||
| ||||||||
| Independent Power and Renewable Electricity Producers—2.2% | ||||||||
| ||||||||
| AES Corp.: | ||||||||
| 5.50% Sr. Unsec. Nts., 3/15/24 | 95,000 | 95,950 | ||||||
| 7.375% Sr. Unsec. Nts., 7/1/21 | 85,000 | 95,572 | ||||||
| ||||||||
| Atlantic Power Corp., 9% Sr. Unsec. Nts., 11/15/18 | 50,000 | 52,375 | ||||||
| ||||||||
| Calpine Corp.: | ||||||||
| 5.375% Sr. Unsec. Nts., 1/15/23 | 90,000 | 90,900 | ||||||
| 7.875% Sr. Sec. Nts., 1/15/231 | 118,000 | 129,726 | ||||||
| ||||||||
| Dynegy, Inc., 5.875% Sr. Unsec. Nts., 6/1/23 | 110,000 | 110,000 | ||||||
| ||||||||
| Energy Future Intermediate Holding Co. LLC/EFIH Finance, Inc., 11.75% Sec. Nts., 3/1/221,4 | 79,343 | 90,351 | ||||||
| ||||||||
| GenOn Energy, Inc., 9.50% Sr. Unsec. Nts., 10/15/18 | 60,000 | 62,250 | ||||||
26 OPPENHEIMER GLOBAL HIGH YIELD FUND
| Principal Amount | Value | |||||||
| ||||||||
| Independent Power and Renewable Electricity Producers (Continued) | ||||||||
| ||||||||
| Miran Mid-Atlantic Trust, 10.06% Sec. Pass-Through Certificates, Series C, 12/30/28 | $ | 53,586 | $ | 59,082 | ||||
| ||||||||
| NRG Energy, Inc.: | ||||||||
| 6.25% Sr. Unsec. Nts., 7/15/22 | 55,000 | 57,888 | ||||||
| 6.625% Sr. Unsec. Nts., 3/15/23 | 145,000 | 152,975 | ||||||
| ||||||||
| NRG Yield Operating LLC, 5.375% Sr. Unsec. Nts., 8/15/241 | 125,000 | 129,375 | ||||||
|
| |||||||
| 1,126,444 | ||||||||
| ||||||||
| Multi-Utilities—0.1% | ||||||||
| ||||||||
| InterGen NV, 7% Sr. Sec. Nts., 6/30/231 | 55,000 | 52,525 | ||||||
|
| |||||||
| Total Corporate Bonds and Notes (Cost $49,897,300) | 50,101,123 | |||||||
| ||||||||
| Total Investments, at Value (Cost $51,107,367) | 97.4% | 51,238,264 | ||||||
| ||||||||
Net Other Assets (Liabilities) | 2.6 | 1,393,393 | ||||||
|
| |||||||
Net Assets | 100.0% | $ | 52,631,657 | |||||
|
| |||||||
Footnotes to Statement of Investments
* May 29, 2015 represents the last business day of the Fund’s reporting period. See Note 2 of the accompanying Notes.
1. Represents securities sold under Rule 144A, which are exempt from registration under the Securities Act of 1933, as amended. These securities have been determined to be liquid under guidelines established by the Board of Trustees. These securities amount to $25,912,017 or 49.23% of the Fund’s net assets as of May 29, 2015.
| 2. | Represents the current interest rate for a variable or increasing rate security. |
3. All or a portion of the security position is when-issued or delayed delivery to be delivered and settled after May 29, 2015. See Note 4 of the accompanying Notes.
4. This security is not accruing income because the issuer has missed an interest payment on it and/or is not anticipated to make future interest and or principal payments. The rate shown is the original contractual interest rate. See Note 4 of the accompanying Notes.
5. Restricted security. The aggregate value of restricted securities as of May 29, 2015 was $982,776, which represents 1.87% of the Fund’s net assets. See Note 4 of the accompanying Notes. Information concerning restricted securities is as follows:
| Security | Acquisition Dates | Cost | Value | Unrealized Appreciation/ (Depreciation) | ||||||||||||||
| ||||||||||||||||||
| Amsted Industries, Inc., 5% Sr. Unsec. Nts., 3/15/22 | 3/3/14-12/30/14 | $ | 149,162 | $ | 153,000 | $ | 3,838 | |||||||||||
| Blackboard, Inc., 7.75% Sr. Unsec. Nts., 11/15/19 | 11/15/13-5/1/14 | 91,376 | 86,850 | (4,526) | ||||||||||||||
| Eletson Holdings, 9.625% Sr. Sec. Nts., 1/15/22 | 12/12/13-12/18/14 | 167,369 | 167,025 | (344) | ||||||||||||||
| EnPro Industries, Inc., 5.875% Sr. Unsec. Nts., 9/15/22 | 9/11/14-12/17/14 | 104,621 | 109,463 | 4,842 | ||||||||||||||
| Isle of Capri Casinos, Inc., 5.875% Sr. Unsec. Nts., 3/15/21 | 4/7/15 | 15,291 | 15,600 | 309 | ||||||||||||||
| K Hovnanian Enterprises, Inc., 9.125% Sec. Nts., 11/15/20 | 11/13/13-11/18/13 | 142,210 | 143,438 | 1,228 | ||||||||||||||
| Kenan Advantage Group, Inc. (The), 8.375% Sr. Unsec. Nts., 12/15/18 | 12/12/13-1/8/15 | 123,419 | 125,400 | 1,981 | ||||||||||||||
27 OPPENHEIMER GLOBAL HIGH YIELD FUND
STATEMENT OF INVESTMENTS Continued
Footnotes to Statement of Investments (Continued)
| Security | Acquisition Dates | Cost | Value | Unrealized Appreciation/ (Depreciation) | ||||||||||||||
| ||||||||||||||||||
| LBC Tank Terminals Holding Netherlands BV, 6.875% Sr. Unsec. Nts., 5/15/23 | 4/17/14-3/11/15 | $ | 181,875 | $ | 182,000 | $ | 125 | |||||||||||
|
| |||||||||||||||||
| $ | 975,323 | $ | 982,776 | $ | 7,453 | |||||||||||||
|
| |||||||||||||||||
6. Interest or dividend is paid-in-kind, when applicable.
7. This bond has no contractual maturity date, is not redeemable and contractually pays an indefinite stream of interest. Rate reported represents the current interest rate for this variable rate security.
Distribution of investments representing geographic holdings, as a percentage of total investments at value, is as follows:
| Geographic Holdings (Unaudited) | Value | Percent | ||||||||
| United States | $ | 38,100,122 | 74.4% | |||||||
| Russia | 1,490,945 | 2.9 | ||||||||
| Canada | 1,360,715 | 2.8 | ||||||||
| Brazil | 1,195,890 | 2.3 | ||||||||
| Netherlands | 773,549 | 1.5 | ||||||||
| Luxembourg | 752,838 | 1.5 | ||||||||
| China | 748,569 | 1.5 | ||||||||
| India | 734,394 | 1.4 | ||||||||
| Colombia | 732,271 | 1.4 | ||||||||
| United Kingdom | 581,900 | 1.1 | ||||||||
| Ireland | 520,425 | 1.0 | ||||||||
| Peru | 488,795 | 1.0 | ||||||||
| Mexico | 458,816 | 0.9 | ||||||||
| France | 425,250 | 0.8 | ||||||||
| Chile | 337,758 | 0.7 | ||||||||
| United Arab Emirates | 324,991 | 0.6 | ||||||||
| Israel | 289,975 | 0.6 | ||||||||
| Argentina | 271,546 | 0.5 | ||||||||
| Jamaica | 259,075 | 0.5 | ||||||||
| South Africa | 243,225 | 0.5 | ||||||||
| Barbados | 222,937 | 0.4 | ||||||||
| Turkey | 196,553 | 0.4 | ||||||||
| Belgium | 182,000 | 0.4 | ||||||||
| Greece | 167,025 | 0.3 | ||||||||
| Macau | 122,187 | 0.2 | ||||||||
| Germany | 112,338 | 0.2 | ||||||||
| Jersey, Channel Islands | 107,250 | 0.1 | ||||||||
| Ecuador | 36,925 | 0.1 | ||||||||
|
| |||||||||
| Total | $ | 51,238,264 | 100.0% | |||||||
|
| |||||||||
| Forward Currency Exchange Contracts as of May 29, 2015 |
| Counterparty | Settlement Month(s) | Currency Purchased (000’s) | Currency Sold (000’s) | Unrealized Appreciation | ||||||||||||
| ||||||||||||||||
| JPM | 06/2015 | USD | 19 | EUR | 15 | $ | 2,119 | |||||||||
28 OPPENHEIMER GLOBAL HIGH YIELD FUND
Glossary:
Counterparty Abbreviations
| JPM | JPMorgan Chase Bank NA | |
Currency abbreviations indicate amounts reporting in currencies | ||
| EUR | Euro | |
See accompanying Notes to Financial Statements.
29 OPPENHEIMER GLOBAL HIGH YIELD FUND
STATEMENT OF ASSETS AND LIABILITIES May 29, 20151
| ||||
| Assets | ||||
| Investments, at value (cost $51,107,367)—see accompanying statement of investments | $ | 51,238,264 | ||
| ||||
| Cash | 567,341 | |||
| ||||
| Unrealized appreciation on forward currency exchange contracts | 2,119 | |||
| ||||
| Receivables and other assets: | ||||
| Interest | 772,496 | |||
| Investments sold on a when-issued or delayed delivery basis | 399,913 | |||
| Shares of beneficial interest sold | 152,633 | |||
| Other | 9,956 | |||
|
| |||
| Total assets | 53,142,722 | |||
| ||||
| Liabilities | ||||
| Payables and other liabilities: | ||||
| Investments purchased on a when-issued or delayed delivery basis | 344,070 | |||
| Dividends | 103,063 | |||
| Legal, auditing and other professional fees | 27,887 | |||
| Distribution and service plan fees | 7,571 | |||
| Shareholder communications | 5,439 | |||
| Shares of beneficial interest redeemed | 4,213 | |||
| Trustees’ compensation | 1,716 | |||
| Other | 17,106 | |||
|
| |||
| Total liabilities | 511,065 | |||
| ||||
| Net Assets | $ | 52,631,657 | ||
|
| |||
| ||||
| Composition of Net Assets | ||||
| Par value of shares of beneficial interest | $ | 5,397 | ||
| ||||
| Additional paid-in capital | 53,625,506 | |||
| ||||
| Accumulated net investment income | 6,001 | |||
| ||||
| Accumulated net realized loss on investments and foreign currency transactions | (1,138,263) | |||
| ||||
| Net unrealized appreciation on investments and translation of assets and liabilities denominated in foreign currencies | 133,016 | |||
|
| |||
| Net Assets | $ | 52,631,657 | ||
|
| |||
1. May 29, 2015 represents the last business day of the Fund’s reporting period. See Note 2 of the accompanying Notes.
30 OPPENHEIMER GLOBAL HIGH YIELD FUND
| ||||
| Net Asset Value Per Share | ||||
| Class A Shares: | ||||
| Net asset value and redemption price per share (based on net assets of $31,973,361 and 3,278,769 shares of beneficial interest outstanding) | $9.75 | |||
| Maximum offering price per share (net asset value plus sales charge of 4.75% of offering price) | $10.24 | |||
| ||||
| Class C Shares: | ||||
| Net asset value, redemption price (excludes applicable contingent deferred sales charge) and offering price per share (based on net assets of $3,875,826 and 397,626 shares of beneficial interest outstanding) | $9.75 | |||
| ||||
| Class I Shares: | ||||
| Net asset value, redemption price and offering price per share (based on net assets of $15,271,627 and 1,566,063 shares of beneficial interest outstanding) | $9.75 | |||
| ||||
| Class R Shares: | ||||
| Net asset value, redemption price (excludes applicable contingent deferred sales charge) and offering price per share (based on net assets of $378,675 and 38,827 shares of beneficial interest outstanding) | $9.75 | |||
| ||||
| Class Y Shares: | ||||
| Net asset value, redemption price and offering price per share (based on net assets of $1,132,168 and 116,107 shares of beneficial interest outstanding) | $9.75 | |||
See accompanying Notes to Financial Statements.
31 OPPENHEIMER GLOBAL HIGH YIELD FUND
STATEMENT OF OPERATIONS For the Period Ended May 29, 20151
| ||||
| Investment Income | ||||
| Interest (net of foreign withholding taxes of $1,676) | $ | 2,546,695 | ||
| ||||
| Dividends | 8,403 | |||
|
| |||
| Total investment income |
| 2,555,098
|
| |
| ||||
| Expenses | ||||
| Management fees | 315,194 | |||
| ||||
| Distribution and service plan fees: | ||||
| Class A | 15,708 | |||
| Class C | 26,181 | |||
| Class R2 | 1,142 | |||
| ||||
| Transfer and shareholder servicing agent fees: | ||||
| Class A | 68,410 | |||
| Class C | 5,761 | |||
| Class I | 2,208 | |||
| Class R2 | 513 | |||
| Class Y | 1,586 | |||
| ||||
| Shareholder communications: | ||||
| Class A | 16,529 | |||
| Class C | 7,237 | |||
| Class I | 35 | |||
| Class R2 | 1,584 | |||
| Class Y | 1,612 | |||
| ||||
| Custodian fees and expenses | 64,941 | |||
| ||||
| Legal, auditing and other professional fees | 47,762 | |||
| ||||
| Trustees’ compensation | 9,824 | |||
| ||||
| Other | 12,010 | |||
|
| |||
| Total expenses | 598,237 | |||
| Less reduction to custodian expenses | (510) | |||
| Less waivers and reimbursements of expenses | (123,429) | |||
|
| |||
| Net expenses | 474,298 | |||
| ||||
| Net Investment Income | 2,080,800 | |||
| ||||
| Realized and Unrealized Gain (Loss) | ||||
| Net realized gain (loss) on: | ||||
| Investments from: | ||||
| Unaffiliated companies | (1,091,647) | |||
| Foreign currency transactions | 3,728 | |||
|
| |||
| Net realized loss | (1,087,919) | |||
| ||||
| Net change in unrealized appreciation/depreciation on: | ||||
| Investments | (605,257) | |||
| Translation of assets and liabilities denominated in foreign currencies | (384) | |||
|
| |||
Net change in unrealized appreciation/depreciation
|
| (605,641)
|
| |
| ||||
| Net Increase in Net Assets Resulting from Operations | $ | 387,240 | ||
|
| |||
1. May 29, 2015 represents the last business day of the Fund’s reporting period. See Note 2 of the accompanying Notes.
2. Effective July 1, 2014, Class N shares were renamed Class R. See Note 1 of the accompanying Notes.
See accompanying Notes to Financial Statements.
32 OPPENHEIMER GLOBAL HIGH YIELD FUND
STATEMENTS OF CHANGES IN NET ASSETS
Year Ended May 29, 20151 | Period Ended May 30, 20141,2 | |||||||
| ||||||||
| Operations | ||||||||
| Net investment income | $ | 2,080,800 | $ | 725,232 | ||||
| ||||||||
| Net realized loss | (1,087,919) | (47,093) | ||||||
| ||||||||
| Net change in unrealized appreciation/depreciation | (605,641) | 738,657 | ||||||
|
|
|
| |||||
Net increase in net assets resulting from operations
|
| 387,240
|
|
| 1,416,796
|
| ||
| ||||||||
| Dividends and/or Distributions to Shareholders | ||||||||
| Dividends from net investment income: | ||||||||
| Class A | (1,540,850) | (710,063) | ||||||
| Class C | (112,159) | (12,883) | ||||||
| Class I | (379,423) | (280) | ||||||
| Class R3 | (10,968) | (1,217) | ||||||
| Class Y | (37,964) | (6,413) | ||||||
|
| |||||||
|
| (2,081,364)
|
|
| (730,856)
|
| |||
| ||||||||
| Beneficial Interest Transactions | ||||||||
| Net increase in net assets resulting from beneficial interest transactions: | ||||||||
| Class A | 1,573,146 | 31,221,087 | ||||||
| Class C | 2,409,154 | 1,554,673 | ||||||
| Class I | 15,256,867 | — | ||||||
| Class R3 | 273,871 | 104,469 | ||||||
| Class Y | 569,953 | 576,621 | ||||||
|
|
|
| |||||
|
| 20,082,991
|
|
| 33,456,850
|
| |||
| ||||||||
| Net Assets | ||||||||
| Total increase | 18,388,867 | 34,142,790 | ||||||
| ||||||||
| Beginning of period | 34,242,790 | 100,000 4 | ||||||
|
|
|
| |||||
| End of period (including accumulated net investment income of $6,001 and $2,838, respectively) | $ | 52,631,657 | $ | 34,242,790 | ||||
|
| |||||||
1. May 29, 2015 and May 30, 2014 represent the last business days of the Fund’s respective reporting periods. See Note 2 of the accompanying Notes.
2. For the period from November 8, 2013 (commencement of operations) to May 30, 2014.
3. Effective July 1, 2014, Class N shares were renamed Class R. See Note 1 of the accompanying Notes.
4. Reflects the value of the Manager’s initial seed money invested on September 15, 2011.
See accompanying Notes to Financial Statements.
33 OPPENHEIMER GLOBAL HIGH YIELD FUND
| Year Ended | Period Ended | |||||||
| Class A | May 29, 20151 | May 30, 20141,2 | ||||||
| ||||||||
| Per Share Operating Data | ||||||||
| Net asset value, beginning of period | $ | 10.25 | $ | 10.00 | ||||
| ||||||||
| Income (loss) from investment operations: | ||||||||
| Net investment income3 | 0.49 | 0.26 | ||||||
| Net realized and unrealized gain (loss) | (0.50) | 0.25 | ||||||
|
| |||||||
| Total from investment operations | (0.01) | 0.51 | ||||||
| ||||||||
| Dividends and/or distributions to shareholders: | ||||||||
| Dividends from net investment income | (0.49) | (0.26) | ||||||
| ||||||||
| Net asset value, end of period | $ | 9.75 | $ | 10.25 | ||||
|
| |||||||
| ||||||||
| Total Return, at Net Asset Value4 | (0.07)% | 5.17% | ||||||
| ||||||||
| ||||||||
| Ratios/Supplemental Data | ||||||||
| Net assets, end of period (in thousands) | $ | 31,973 | $ | 31,950 | ||||
| ||||||||
| Average net assets (in thousands) | $ | 31,185 | $ | 27,035 | ||||
| ||||||||
| Ratios to average net assets:5 | ||||||||
| Net investment income | 4.94% | 4.64% | ||||||
| Total expenses | 1.40% | 1.49% | ||||||
| Expenses after payments, waivers and/or reimbursements and reduction to custodian expenses | 1.15% | 1.15% | ||||||
| ||||||||
| Portfolio turnover rate | 67 % | 103 % | ||||||
1. May 29, 2015 and May 30, 2014 represent the last business days of the Fund’s respective reporting periods. See Note 2 of the accompanying Notes.
2. For the period from November 8, 2013 (commencement of operations) to May 30, 2014.
3. Per share amounts calculated based on the average shares outstanding during the period.
4. Assumes an initial investment on the business day before the first day of the fiscal period, with all dividends and distributions reinvested in additional shares on the reinvestment date, and redemption at the net asset value calculated on the last business day of the fiscal period. Sales charges are not reflected in the total returns. Total returns are not annualized for periods less than one full year. Returns do not reflect the deduction of taxes that a shareholder would pay on fund distributions or the redemption of fund shares. The returns do not include adjustments in accordance with generally accepted accounting principles required at the period end for financial reporting purposes.
5. Annualized for periods less than one full year.
See accompanying Notes to Financial Statements.
34 OPPENHEIMER GLOBAL HIGH YIELD FUND
| Year Ended | Period Ended | |||||||
| Class C | May 29, 20151 | May 30, 20141,2 | ||||||
| ||||||||
| Per Share Operating Data | ||||||||
| Net asset value, beginning of period | $ | 10.25 | $ | 10.00 | ||||
| ||||||||
| Income (loss) from investment operations: | ||||||||
| Net investment income3 | 0.42 | 0.24 | ||||||
| Net realized and unrealized gain (loss) | (0.50) | 0.24 | ||||||
|
| |||||||
| Total from investment operations | (0.08) | 0.48 | ||||||
| ||||||||
| Dividends and/or distributions to shareholders: | ||||||||
| Dividends from net investment income | (0.42) | (0.23) | ||||||
| ||||||||
| Net asset value, end of period | $ | 9.75 | $ | 10.25 | ||||
|
| |||||||
| ||||||||
| Total Return, at Net Asset Value4 | (0.76)% | 4.84% | ||||||
| ||||||||
| ||||||||
| Ratios/Supplemental Data | ||||||||
| Net assets, end of period (in thousands) | $ | 3,876 | $ | 1,576 | ||||
| ||||||||
| Average net assets (in thousands) | $ | 2,632 | $ | 543 | ||||
| ||||||||
| Ratios to average net assets:5 | ||||||||
| Net investment income | 4.24% | 4.22% | ||||||
| Total expenses | 2.56% | 3.42% | ||||||
| Expenses after payments, waivers and/or reimbursements and reduction to custodian expenses | 1.85% | 1.85% | ||||||
| ||||||||
| Portfolio turnover rate | 67 % | 103 % | ||||||
1. May 29, 2015 and May 30, 2014 represent the last business days of the Fund’s respective reporting periods. See Note 2 of the accompanying Notes.
2. For the period from November 8, 2013 (commencement of operations) to May 30, 2014.
3. Per share amounts calculated based on the average shares outstanding during the period.
4. Assumes an initial investment on the business day before the first day of the fiscal period, with all dividends and distributions reinvested in additional shares on the reinvestment date, and redemption at the net asset value calculated on the last business day of the fiscal period. Sales charges are not reflected in the total returns. Total returns are not annualized for periods less than one full year. Returns do not reflect the deduction of taxes that a shareholder would pay on fund distributions or the redemption of fund shares. The returns do not include adjustments in accordance with generally accepted accounting principles required at the period end for financial reporting purposes.
5. Annualized for periods less than one full year.
See accompanying Notes to Financial Statements
35 OPPENHEIMER GLOBAL HIGH YIELD FUND
FINANCIAL HIGHLIGHTS Continued
| Year Ended | Period Ended | |||||||
| Class I | May 29, 20151 | May 30, 20141,2 | ||||||
| ||||||||
| Per Share Operating Data | ||||||||
| Net asset value, beginning of period | $ | 10.25 | $ | 10.00 | ||||
| ||||||||
| Income (loss) from investment operations: | ||||||||
| Net investment income3 | 0.49 | 0.28 | ||||||
| Net realized and unrealized gain (loss) | (0.47) | 0.25 | ||||||
|
| |||||||
| Total from investment operations | 0.02 | 0.53 | ||||||
| ||||||||
| Dividends and/or distributions to shareholders: | ||||||||
| Dividends from net investment income | (0.52) | (0.28) | ||||||
| ||||||||
| Net asset value, end of period | $ | 9.75 | $ | 10.25 | ||||
|
| |||||||
| ||||||||
| Total Return, at Net Asset Value4 | 0.28% | 5.36% | ||||||
| ||||||||
| ||||||||
| Ratios/Supplemental Data | ||||||||
| Net assets, end of period (in thousands) | $ | 15,272 | $ | 10 | ||||
| ||||||||
| Average net assets (in thousands) | $ | 7,400 | $ | 10 | ||||
| ||||||||
| Ratios to average net assets:5 | ||||||||
| Net investment income | 5.13% | 4.89% | ||||||
| Total expenses | 1.07% | 1.16% | ||||||
| Expenses after payments, waivers and/or reimbursements and reduction to custodian expenses | 0.80% | 0.80% | ||||||
| ||||||||
| Portfolio turnover rate | 67 % | 103 % | ||||||
1. May 29, 2015 and May 30, 2014 represent the last business days of the Fund’s respective reporting periods. See Note 2 of the accompanying Notes.
2. For the period from November 8, 2013 (commencement of operations) to May 30, 2014.
3. Per share amounts calculated based on the average shares outstanding during the period.
4. Assumes an initial investment on the business day before the first day of the fiscal period, with all dividends and distributions reinvested in additional shares on the reinvestment date, and redemption at the net asset value calculated on the last business day of the fiscal period. Sales charges are not reflected in the total returns. Total returns are not annualized for periods less than one full year. Returns do not reflect the deduction of taxes that a shareholder would pay on fund distributions or the redemption of fund shares. The returns do not include adjustments in accordance with generally accepted accounting principles required at the period end for financial reporting purposes.
5. Annualized for periods less than one full year.
See accompanying Notes to Financial Statements.
36 OPPENHEIMER GLOBAL HIGH YIELD FUND
| Year Ended | Period Ended | |||||||
| Class R | May 29, 20151 | May 30, 20141,2 | ||||||
| ||||||||
| Per Share Operating Data | ||||||||
| Net asset value, beginning of period | $ | 10.25 | $ | 10.00 | ||||
| ||||||||
| Income (loss) from investment operations: | ||||||||
| Net investment income3 | 0.46 | 0.26 | ||||||
| Net realized and unrealized gain (loss) | (0.50) | 0.24 | ||||||
|
| |||||||
| Total from investment operations | (0.04) | 0.50 | ||||||
| ||||||||
| Dividends and/or distributions to shareholders: | ||||||||
| Dividends from net investment income | (0.46) | (0.25) | ||||||
| ||||||||
| Net asset value, end of period | $ | 9.75 | $ | 10.25 | ||||
|
| |||||||
| ||||||||
| Total Return, at Net Asset Value4 | (0.31)% | 5.04% | ||||||
| ||||||||
| ||||||||
| Ratios/Supplemental Data | ||||||||
| Net assets, end of period (in thousands) | $ | 379 | $ | 116 | ||||
| ||||||||
| Average net assets (in thousands) | $ | 234 | $ | 47 | ||||
| ||||||||
| Ratios to average net assets:5 | ||||||||
| Net investment income | 4.68% | 4.60% | ||||||
| Total expenses | 2.45% | 1.86% | ||||||
| Expenses after payments, waivers and/or reimbursements and reduction to custodian expenses | 1.39% | 1.40% | ||||||
| ||||||||
| Portfolio turnover rate | 67 % | 103 % | ||||||
1. May 29, 2015 and May 30, 2014 represent the last business days of the Fund’s respective reporting periods. See Note 2 of the accompanying Notes.
2. For the period from November 8, 2013 (commencement of operations) to May 30, 2014.
3. Per share amounts calculated based on the average shares outstanding during the period.
4. Assumes an initial investment on the business day before the first day of the fiscal period, with all dividends and distributions reinvested in additional shares on the reinvestment date, and redemption at the net asset value calculated on the last business day of the fiscal period. Sales charges are not reflected in the total returns. Total returns are not annualized for periods less than one full year. Returns do not reflect the deduction of taxes that a shareholder would pay on fund distributions or the redemption of fund shares. The returns do not include adjustments in accordance with generally accepted accounting principles required at the period end for financial reporting purposes.
5. Annualized for periods less than one full year.
See accompanying Notes to Financial Statements.
37 OPPENHEIMER GLOBAL HIGH YIELD FUND
FINANCIAL HIGHLIGHTS Continued
| Year Ended | Period Ended | |||||||
| Class Y | May 29, 20151 | May 30, 20141,2 | ||||||
| ||||||||
| Per Share Operating Data | ||||||||
| Net asset value, beginning of period | $ | 10.25 | $ | 10.00 | ||||
| ||||||||
| Income (loss) from investment operations: | ||||||||
| Net investment income3 | 0.52 | 0.29 | ||||||
| Net realized and unrealized gain (loss) | (0.50) | 0.24 | ||||||
|
| |||||||
| Total from investment operations | 0.02 | 0.53 | ||||||
| ||||||||
| Dividends and/or distributions to shareholders: | ||||||||
| Dividends from net investment income | (0.52) | (0.28) | ||||||
| ||||||||
| Net asset value, end of period | $ | 9.75 | $ | 10.25 | ||||
|
| |||||||
| ||||||||
| Total Return, at Net Asset Value4 | 0.23% | 5.35% | ||||||
| ||||||||
| ||||||||
| Ratios/Supplemental Data | ||||||||
| Net assets, end of period (in thousands) | $ | 1,132 | $ | 591 | ||||
| ||||||||
| Average net assets (in thousands) | $ | 724 | $ | 219 | ||||
| ||||||||
| Ratios to average net assets:5 | ||||||||
| Net investment income | 5.25% | 5.20% | ||||||
| Total expenses | 1.50% | 1.62% | ||||||
| Expenses after payments, waivers and/or reimbursements and reduction to custodian expenses | 0.84% | 0.84% | ||||||
| ||||||||
| Portfolio turnover rate | 67 % | 103 % | ||||||
1. May 29, 2015 and May 30, 2014 represent the last business days of the Fund’s respective reporting periods. See Note 2 of the accompanying Notes.
2. For the period from November 8, 2013 (commencement of operations) to May 30, 2014.
3. Per share amounts calculated based on the average shares outstanding during the period.
4. Assumes an initial investment on the business day before the first day of the fiscal period, with all dividends and distributions reinvested in additional shares on the reinvestment date, and redemption at the net asset value calculated on the last business day of the fiscal period. Sales charges are not reflected in the total returns. Total returns are not annualized for periods less than one full year. Returns do not reflect the deduction of taxes that a shareholder would pay on fund distributions or the redemption of fund shares. The returns do not include adjustments in accordance with generally accepted accounting principles required at the period end for financial reporting purposes.
5. Annualized for periods less than one full year.
See accompanying Notes to Financial Statements.
38 OPPENHEIMER GLOBAL HIGH YIELD FUND
NOTES TO FINANCIAL STATEMENTS May 29, 2015
1. Organization
Oppenheimer Global High Yield Fund (the “Fund”) is a diversified open-end management investment company registered under the Investment Company Act of 1940 (“1940 Act”), as amended. The Fund’s investment objective is to seek total return. The Fund’s investment adviser is OFI Global Asset Management, Inc. (“OFI Global” or the “Manager”), a wholly-owned subsidiary of OppenheimerFunds, Inc. (“OFI” or the “Sub-Adviser”). The Manager has entered into a sub-advisory agreement with OFI. As of May 29, 2015, approximately 46.5% of the shares of the Fund were owned by the Manager, other funds advised or sub-advised by the Manager or an affiliate of the Manager.
The Fund offers Class A, Class C, Class I, Class R and Class Y shares. As of July 1, 2014, Class N shares were renamed Class R shares. Class N shares subject to a contingent deferred sales charge (“CDSC”) on July 1, 2014, will continue to be subject to a CDSC after the shares are renamed. Purchases of Class R shares occurring on or after July 1, 2014, will not be subject to a CDSC upon redemption. Class A shares are sold at their offering price, which is normally net asset value plus a front-end sales charge. Class C and Class R shares are sold without a front-end sales charge but may be subject to a contingent deferred sales charge (“CDSC”). Class R shares are sold only through retirement plans. Retirement plans that offer Class R shares may impose charges on those accounts. Class I and Class Y shares are sold to certain institutional investors or intermediaries without either a front-end sales charge or a CDSC, however, the intermediaries may impose charges on their accountholders who beneficially own Class I and Class Y shares. All classes of shares have identical rights and voting privileges with respect to the Fund in general and exclusive voting rights on matters that affect that class alone. Earnings, net assets and net asset value per share may differ due to each class having its own expenses, such as transfer and shareholder servicing agent fees and shareholder communications, directly attributable to that class. Class A, C and R shares have separate distribution and/or service plans under which they pay fees. Class I and Class Y shares do not pay such fees.
The following is a summary of significant accounting policies followed in the Fund’s preparation of financial statements in accordance with accounting principles generally accepted in the United States (“U.S. GAAP”).
2. Significant Accounting Policies
Security Valuation. All investments in securities are recorded at their estimated fair value, as described in Note 3.
Reporting Period End Date. The last day of the Fund’s reporting period is the last day the New York Stock Exchange was open for trading during the period. The Fund’s financial statements have been presented through that date to maintain consistency with the Fund’s net asset value calculations used for shareholder transactions.
Foreign Currency Translation. The Fund’s accounting records are maintained in U.S. dollars. The values of securities denominated in foreign currencies and amounts related to the purchase and sale of foreign securities and foreign investment income are translated into U.S. dollars as of the close of the New York Stock Exchange (the “Exchange”), normally 4:00 P.M.
39 OPPENHEIMER GLOBAL HIGH YIELD FUND
NOTES TO FINANCIAL STATEMENTS Continued
2. Significant Accounting Policies (Continued)
Eastern time, on each day the Exchange is open for trading. Foreign exchange rates may be valued primarily using a reliable bank, dealer or service authorized by the Board of Trustees.
Reported net realized gains and losses from foreign currency transactions arise from sales of portfolio securities, sales and maturities of short-term securities, sales of foreign currencies, exchange rate fluctuations between the trade and settlement dates on securities transactions, and the difference between the amounts of dividends, interest, and foreign withholding taxes recorded on the Fund’s books and the U.S. dollar equivalent of the amounts actually received or paid. Net unrealized appreciation and depreciation on the translation of assets and liabilities denominated in foreign currencies arise from changes in the values of assets and liabilities, including investments in securities at fiscal period end, resulting from changes in exchange rates.
The effect of changes in foreign currency exchange rates on investments is separately identified from the fluctuations arising from changes in market values of securities held and reported with all other foreign currency gains and losses in the Fund’s Statement of Operations.
Allocation of Income, Expenses, Gains and Losses. Income, expenses (other than those attributable to a specific class), gains and losses are allocated on a daily basis to each class of shares based upon the relative proportion of net assets represented by such class. Operating expenses directly attributable to a specific class are charged against the operations of that class.
Dividends and Distributions to Shareholders. Dividends and distributions to shareholders, which are determined in accordance with income tax regulations and may differ from U.S. generally accepted accounting principles, are recorded on the ex-dividend date. Income distributions, if any, are declared daily and paid monthly. Capital gain distributions, if any, are declared and paid annually.
Investment Income. Dividend income is recorded on the ex-dividend date or upon ex-dividend notification in the case of certain foreign dividends where the ex-dividend date may have passed. Non-cash dividends included in dividend income, if any, are recorded at the fair market value of the securities received. Interest income is recognized on an accrual basis. Discount and premium, which are included in interest income on the Statement of Operations, are amortized or accreted daily.
Custodian Fees. “Custodian fees and expenses” in the Statement of Operations may include interest expense incurred by the Fund on any cash overdrafts of its custodian account during the period. Such cash overdrafts may result from the effects of failed trades in portfolio securities and from cash outflows resulting from unanticipated shareholder redemption activity. The Fund pays interest to its custodian on such cash overdrafts, to the extent they are not offset by positive cash balances maintained by the Fund, at a rate equal to the Federal Funds Rate plus 0.50%. The “Reduction to custodian expenses” line item, if applicable,
40 OPPENHEIMER GLOBAL HIGH YIELD FUND
2. Significant Accounting Policies (Continued)
represents earnings on cash balances maintained by the Fund during the period. Such interest expense and other custodian fees may be paid with these earnings.
Security Transactions. Security transactions are recorded on the trade date. Realized gains and losses on securities sold are determined on the basis of identified cost.
Indemnifications. The Fund’s organizational documents provide current and former Trustees and officers with a limited indemnification against liabilities arising in connection with the performance of their duties to the Fund. In the normal course of business, the Fund may also enter into contracts that provide general indemnifications. The Fund’s maximum exposure under these arrangements is unknown as this would be dependent on future claims that may be made against the Fund. The risk of material loss from such claims is considered remote.
Federal Taxes. The Fund intends to comply with provisions of the Internal Revenue Code applicable to regulated investment companies and to distribute substantially all of its investment company taxable income, including any net realized gain on investments not offset by capital loss carryforwards, if any, to shareholders. Therefore, no federal income or excise tax provision is required. The Fund files income tax returns in U.S. federal and applicable state jurisdictions. The statute of limitations on the Fund’s tax return filings generally remain open for the three preceding fiscal reporting period ends.
The tax components of capital shown in the following table represent distribution requirements the Fund must satisfy under the income tax regulations, losses the Fund may be able to offset against income and gains realized in future years and unrealized appreciation or depreciation of securities and other investments for federal income tax purposes.
Undistributed Net Investment Income | Undistributed Long-Term Gain | Accumulated Loss Carryforward1,2,3 | Net Unrealized Appreciation Based on cost of Securities and Other Investments for Federal Income Tax Purposes | |||||||||
| ||||||||||||
$12,965 | $— | $1,133,878 | $126,497 | |||||||||
1. As of May 29, 2015, the Fund had $1,133,878 of post-October losses available to offset future realized capital gains, if any.
2. During the fiscal year ended May 29, 2015, the Fund utilized $21,353 of capital loss carryforward to offset capital gains realized in that fiscal year.
3. During the fiscal year ended May 30, 2014, the Fund did not utilize any capital loss carryforward.
Net investment income (loss) and net realized gain (loss) may differ for financial statement and tax purposes. The character of dividends and distributions made during the fiscal year from net investment income or net realized gains are determined in accordance with federal income tax requirements, which may differ from the character of net investment income or net
41 OPPENHEIMER GLOBAL HIGH YIELD FUND
NOTES TO FINANCIAL STATEMENTS Continued
2. Significant Accounting Policies (Continued)
realized gains presented in those financial statements in accordance with GAAP. Also, due to timing of dividends and distributions, the fiscal year in which amounts are distributed may differ from the fiscal year in which the income or net realized gain was recorded by the Fund.
Accordingly, the following amounts have been reclassified for May 29, 2015. Net assets of the Fund were unaffected by the reclassifications.
Increase to Accumulated Net Investment Income | Increase to Accumulated Net Realized Loss on Investments | |||
| ||||
$3,727 | $3,727 | |||
The tax character of distributions paid during the year ended May 31, 2015 and the period ended May 31, 2014 was as follows:
| Year Ended May 31, 2015 | Period Ended May 31, 2014 | |||||||
| ||||||||
Distributions paid from: | ||||||||
Ordinary income | $ | 2,081,364 | $ | 730,856 | ||||
The aggregate cost of securities and other investments and the composition of unrealized appreciation and depreciation of securities and other investments for federal income tax purposes as of May 29, 2015 are noted in the following table. The primary difference between book and tax appreciation or depreciation of securities and other investments, if applicable, is attributable to the tax deferral of losses or tax realization of financial statement unrealized gain or loss.
Federal tax cost of securities | $ | 51,111,767 | ||
Federal tax cost of other investments | 2,119 | |||
|
| |||
Total federal tax cost | $ | 51,113,886 | ||
|
| |||
Gross unrealized appreciation | $ | 918,226 | ||
Gross unrealized depreciation | (791,729) | |||
|
| |||
Net unrealized appreciation | $ | 126,497 | ||
|
|
Use of Estimates. The preparation of financial statements in conformity with accounting principles generally accepted in the United States of America requires management to make estimates and assumptions that affect the reported amounts of assets and liabilities and disclosure of contingent assets and liabilities at the date of the financial statements and the reported amounts of increases and decreases in net assets from operations during the reporting period. Actual results could differ from those estimates.
3. Securities Valuation
The Fund calculates the net asset value of its shares as of the close of the New York Stock Exchange (the “Exchange”), normally 4:00 P.M. Eastern time, on each day the Exchange is open for trading.
42 OPPENHEIMER GLOBAL HIGH YIELD FUND
3. Securities Valuation (Continued)
The Fund’s Board has adopted procedures for the valuation of the Fund’s securities and has delegated the day-to-day responsibility for valuation determinations under those procedures to the Manager. The Manager has established a Valuation Committee which is responsible for determining a “fair valuation” for any security for which market quotations are not “readily available.” The Valuation Committee’s fair valuation determinations are subject to review, approval and ratification by the Fund’s Board at its next regularly scheduled meeting covering the calendar quarter in which the fair valuation was determined.
Valuation Methods and Inputs
Securities are valued using unadjusted quoted market prices, when available, as supplied primarily by third party pricing services or dealers.
The following methodologies are used to determine the market value or the fair value of the types of securities described below:
Securities traded on a registered U.S. securities exchange (including exchange-traded derivatives other than futures and futures options) are valued based on the last sale price of the security reported on the principal exchange on which it is traded, prior to the time when the Fund’s assets are valued. In the absence of a sale, the security is valued at the last sale price on the prior trading day, if it is within the spread of the current day’s closing “bid” and “asked” prices, and if not, at the current day’s closing bid price. A security of a foreign issuer traded on a foreign exchange, but not listed on a registered U.S. securities exchange, is valued based on the last sale price on the principal exchange on which the security is traded, as identified by the third party pricing service used by the Manager, prior to the time when the Fund’s assets are valued. If the last sale price is unavailable, the security is valued at the most recent official closing price on the principal exchange on which it is traded. If the last sales price or official closing price for a foreign security is not available, the security is valued at the mean between the bid and asked price per the exchange or, if not available from the exchange, obtained from two dealers. If bid and asked prices are not available from either the exchange or two dealers, the security is valued by using one of the following methodologies (listed in order of priority): (1) using a bid from the exchange, (2) the mean between the bid and asked price as provided by a single dealer, or (3) a bid from a single dealer.
Shares of a registered investment company that are not traded on an exchange are valued at that investment company’s net asset value per share.
Corporate and government debt securities (of U.S. or foreign issuers) and municipal debt securities, event-linked bonds, loans, mortgage-backed securities, collateralized mortgage obligations, and asset-backed securities are valued at the mean between the “bid” and “asked” prices utilizing evaluated prices obtained from third party pricing services or broker-dealers who may use matrix pricing methods to determine the evaluated prices.
Short-term money market type debt securities with a remaining maturity of sixty days or less are valued at cost adjusted by the amortization of discount or premium to maturity (amortized cost), which approximates market value. Short-term debt securities with a remaining maturity in excess of sixty days are valued at the mean between the “bid” and “asked” prices utilizing evaluated prices obtained from third party pricing services or broker-dealers.
43 OPPENHEIMER GLOBAL HIGH YIELD FUND
NOTES TO FINANCIAL STATEMENTS Continued
3. Securities Valuation (Continued)
Forward foreign currency exchange contracts are valued utilizing current and forward currency rates obtained from third party pricing services. When the settlement date of a contract is an interim date for which a quotation is not available, interpolated values are derived using the nearest dated forward currency rate.
A description of the standard inputs that may generally be considered by the third party pricing vendors in determining their evaluated prices is provided below.
| Security Type | Standard inputs generally considered by third-party pricing vendors | |
| ||
| Corporate debt, government debt, municipal, mortgage-backed and asset-backed securities | Reported trade data, broker-dealer price quotations, benchmark yields, issuer spreads on comparable securities, the credit quality, yield, maturity, and other appropriate factors. | |
| ||
| Loans | Information obtained from market participants regarding reported trade data and broker-dealer price quotations. | |
| ||
| Event-linked bonds | Information obtained from market participants regarding reported trade data and broker-dealer price quotations. | |
If a market value or price cannot be determined for a security using the methodologies described above, or if, in the “good faith” opinion of the Manager, the market value or price obtained does not constitute a “readily available market quotation,” or a significant event has occurred that would materially affect the value of the security, the security is fair valued either (i) by a standardized fair valuation methodology applicable to the security type or the significant event as previously approved by the Valuation Committee and the Fund’s Board or (ii) as determined in good faith by the Manager’s Valuation Committee. The Valuation Committee considers all relevant facts that are reasonably available, through either public information or information available to the Manager, when determining the fair value of a security. Fair value determinations by the Manager are subject to review, approval and ratification by the Fund’s Board at its next regularly scheduled meeting covering the calendar quarter in which the fair valuation was determined. Those fair valuation standardized methodologies include, but are not limited to, valuing securities at the last sale price or initially at cost and subsequently adjusting the value based on: changes in company specific fundamentals, changes in an appropriate securities index, or changes in the value of similar securities which may be further adjusted for any discounts related to security-specific resale restrictions. When possible, such methodologies use observable market inputs such as unadjusted quoted prices of similar securities, observable interest rates, currency rates and yield curves. The methodologies used for valuing securities are not necessarily an indication of the risks associated with investing in those securities nor can it be assured that the Fund can obtain the fair value assigned to a security if it were to sell the security.
To assess the continuing appropriateness of security valuations, the Manager, or its third party service provider who is subject to oversight by the Manager, regularly compares prior day prices, prices on comparable securities, and sale prices to the current day prices and challenges those prices exceeding certain tolerance levels with the third party pricing service or broker source. For those securities valued by fair valuations, whether through a
44 OPPENHEIMER GLOBAL HIGH YIELD FUND
3. Securities Valuation (Continued)
standardized fair valuation methodology or a fair valuation determination, the Valuation Committee reviews and affirms the reasonableness of the valuations based on such methodologies and fair valuation determinations on a regular basis after considering all relevant information that is reasonably available.
Classifications
Each investment asset or liability of the Fund is assigned a level at measurement date based on the significance and source of the inputs to its valuation. Various data inputs are used in determining the value of each of the Fund’s investments as of the reporting period end. These data inputs are categorized in the following hierarchy under applicable financial accounting standards:
1) Level 1-unadjusted quoted prices in active markets for identical assets or liabilities (including securities actively traded on a securities exchange)
2) Level 2-inputs other than unadjusted quoted prices that are observable for the asset or liability (such as unadjusted quoted prices for similar assets and market corroborated inputs such as interest rates, prepayment speeds, credit risks, etc.)
3) Level 3-significant unobservable inputs (including the Manager’s own judgments about assumptions that market participants would use in pricing the asset or liability).
The inputs used for valuing securities are not necessarily an indication of the risks associated with investing in those securities.
The table below categorizes amounts that are included in the Fund’s Statement of Assets and Liabilities as of May 29, 2015 based on valuation input level:
| Level 1— Unadjusted Quoted Prices | Level 2— Other Significant Observable Inputs | Level 3— Significant Inputs | Value | |||||||||||||
| ||||||||||||||||
Assets Table | ||||||||||||||||
Investments, at Value: | ||||||||||||||||
Foreign Government Obligation | $ | — | $ | 36,925 | $ | — | $ | 36,925 | ||||||||
Corporate Loans | — | 1,100,216 | — | 1,100,216 | ||||||||||||
Corporate Bonds and Notes | — | 50,101,114 | 9 | 50,101,123 | ||||||||||||
|
| |||||||||||||||
Total Investments, at Value | — | 51,238,255 | 9 | 51,238,264 | ||||||||||||
Other Financial Instruments: | ||||||||||||||||
Forward currency exchange contracts | — | 2,119 | — | 2,119 | ||||||||||||
|
| |||||||||||||||
Total Assets | $ | — | $ | 51,240,374 | $ | 9 | $ | 51,240,383 | ||||||||
|
| |||||||||||||||
Forward currency exchange contracts and futures contracts, if any, are reported at their unrealized appreciation/depreciation at measurement date, which represents the change in the contract’s value from trade date. All additional assets and liabilities included in the above table are reported at their market value at measurement date.
45 OPPENHEIMER GLOBAL HIGH YIELD FUND
NOTES TO FINANCIAL STATEMENTS Continued
4. Investments and Risks
Loans. The Fund invests in loans made to U.S. and foreign borrowers that are corporations, partnerships or other business entities. The Fund will do so directly as an original lender or by assignment or indirectly through participation agreements or certain derivative instruments. While many of these loans will be collateralized, the Fund can also invest in uncollateralized loans. Loans are often issued in connection with recapitalizations, acquisitions, leveraged buyouts, and refinancing of borrowers. The loans often pay interest at rates that float above (or are adjusted periodically based on) a benchmark that reflects current interest rates although the Fund can also invest in loans with fixed interest rates.
Securities on a When-Issued or Delayed Delivery Basis. The Fund may purchase securities on a “when-issued” basis, and may purchase or sell securities on a “delayed delivery” basis. “When-issued” or “delayed delivery” refers to securities whose terms and indenture are available and for which a market exists, but which are not available for immediate delivery. Delivery and payment for securities that have been purchased by the Fund on a when-issued basis normally takes place within six months and possibly as long as two years or more after the trade date. During this period, such securities do not earn interest, are subject to market fluctuation and may increase or decrease in value prior to their delivery. The purchase of securities on a when-issued basis may increase the volatility of the Fund’s net asset value to the extent the Fund executes such transactions while remaining substantially fully invested. When the Fund engages in when-issued or delayed delivery transactions, it relies on the buyer or seller, as the case may be, to complete the transaction. Their failure to do so may cause the Fund to lose the opportunity to obtain or dispose of the security at a price and yield it considers advantageous. The Fund may also sell securities that it purchased on a when-issued basis or forward commitment prior to settlement of the original purchase.
As of May 29, 2015, the Fund had purchased securities issued on a when-issued or delayed delivery basis and sold securities issued on a delayed delivery basis as follows:
| When-Issued or Delayed Delivery Basis Transactions | ||||
| ||||
Purchased securities | $344,070 | |||
Sold securities | 399,913 | |||
Restricted Securities. As of May 29, 2015, investments in securities included issues that are restricted. A restricted security may have a contractual restriction on its resale and is valued under methods approved by the Board of Trustees as reflecting fair value. Securities that are restricted are marked with an applicable footnote on the Statement of Investments. Restricted securities are reported on a schedule following the Statement of Investments.
Credit Risk. The Fund invests in high-yield, non-investment-grade bonds, which may be subject to a greater degree of credit risk. Credit risk relates to the ability of the issuer to meet interest or principal payments or both as they become due. The Fund may acquire securities that have missed an interest payment, and is not obligated to dispose of securities whose
46 OPPENHEIMER GLOBAL HIGH YIELD FUND
4. Investments and Risks (Continued)
issuers or underlying obligors subsequently miss an interest payment. Information concerning securities not accruing interest as of May 29, 2015 is as follows:
Cost | $ | 233,940 | ||
Market Value | $ | 193,435 | ||
Market Value as % of Net Assets | 0.37% |
5. Risk Exposures and the Use of Derivative Instruments
The Fund’s investment objective not only permits the Fund to purchase investment securities, it also allows the Fund to enter into various types of derivatives contracts, including, but not limited to, futures contracts, forward currency exchange contracts, credit default swaps, interest rate swaps, total return swaps, variance swaps and purchased and written options. In doing so, the Fund will employ strategies in differing combinations to permit it to increase, decrease, or change the level or types of exposure to market risk factors. These instruments may allow the Fund to pursue its objectives more quickly and efficiently than if it were to make direct purchases or sales of securities capable of effecting a similar response to market factors. Such contracts may be entered into through a bilateral over-the-counter (“OTC”) transaction, or through a securities or futures exchange and cleared through a clearinghouse.
Market Risk Factors. In accordance with its investment objectives, the Fund may use derivatives to increase or decrease its exposure to one or more of the following market risk factors:
Commodity Risk. Commodity risk relates to the change in value of commodities or commodity indexes as they relate to increases or decreases in the commodities market. Commodities are physical assets that have tangible properties. Examples of these types of assets are crude oil, heating oil, metals, livestock, and agricultural products.
Credit Risk. Credit risk relates to the ability of the issuer to meet interest and principal payments, or both, as they come due. In general, lower-grade, higher-yield bonds are subject to credit risk to a greater extent than lower-yield, higher-quality bonds.
Equity Risk. Equity risk relates to the change in value of equity securities as they relate to increases or decreases in the general market.
Foreign Exchange Rate Risk. Foreign exchange rate risk relates to the change in the U.S. dollar value of a security held that is denominated in a foreign currency. The U.S. dollar value of a foreign currency denominated security will decrease as the dollar appreciates against the currency, while the U.S. dollar value will increase as the dollar depreciates against the currency.
Interest Rate Risk. Interest rate risk refers to the fluctuations in value of fixed-income securities resulting from the inverse relationship between price and yield. For example, an increase in general interest rates will tend to reduce the market value of already issued fixed-income investments, and a decline in general interest rates will tend to increase their value. In addition, debt securities with longer maturities, which tend to have higher yields, are subject to potentially greater fluctuations in value from changes in interest rates than obligations with shorter maturities.
47 OPPENHEIMER GLOBAL HIGH YIELD FUND
NOTES TO FINANCIAL STATEMENTS Continued
5. Risk Exposures and the Use of Derivative Instruments (Continued)
Volatility Risk. Volatility risk refers to the magnitude of the movement, but not the direction of the movement, in a financial instrument’s price over a defined time period. Large increases or decreases in a financial instrument’s price over a relative time period typically indicate greater volatility risk, while small increases or decreases in its price typically indicate lower volatility risk.
Derivatives may have little or no initial cash investment relative to their market value exposure and therefore can produce significant gains or losses in excess of their cost due to unanticipated changes in the market risk factors and the overall market. This use of embedded leverage allows the Fund to increase its market value exposure relative to its net assets and can substantially increase the volatility of the Fund’s performance. In instances where the Fund is using derivatives to decrease, or hedge, exposures to market risk factors for securities held by the Fund, there are also risks that those derivatives may not perform as expected resulting in losses for the combined or hedged positions. Some derivatives have the potential for unlimited loss, regardless of the size of the Fund’s initial investment.
Additional associated risks from investing in derivatives also exist and potentially could have significant effects on the valuation of the derivative and the Fund. Typically, the associated risks are not the risks that the Fund is attempting to increase or decrease exposure to, per its investment objectives, but are the additional risks from investing in derivatives. Examples of these associated risks are liquidity risk, which is the risk that the Fund will not be able to sell the derivative in the open market in a timely manner, and counterparty credit risk, which is the risk that the counterparty will not fulfill its obligation to the Fund.
The Fund’s actual exposures to these market risk factors and associated risks during the period are discussed in further detail, by derivative type, below.
Forward Currency Exchange Contracts
The Fund may enter into forward currency exchange contracts (“forward contracts”) for the purchase or sale of a foreign currency at a negotiated rate at a future date. Such contracts are traded in the OTC inter-bank currency dealer market.
Forward contracts are reported on a schedule following the Statement of Investments. The unrealized appreciation (depreciation) is reported in the Statement of Assets and Liabilities as a receivable (or payable) and in the Statement of Operations within the change in unrealized appreciation (depreciation). At contract close, the difference between the original cost of the contract and the value at the close date is recorded as a realized gain (loss) in the Statement of Operations.
The Fund has entered into forward contracts with the obligation to purchase specified foreign currencies in the future at a currently negotiated forward rate in order to take a positive investment perspective on the related currency. These forward contracts seek to increase exposure to foreign exchange rate risk.
The Fund has entered into forward contracts with the obligation to purchase specified foreign currencies in the future at a currently negotiated forward rate in order to decrease exposure to foreign exchange rate risk associated with foreign currency denominated securities held by the Fund.
48 OPPENHEIMER GLOBAL HIGH YIELD FUND
5. Risk Exposures and the Use of Derivative Instruments (Continued)
The Fund has entered into forward contracts with the obligation to sell specified foreign currencies in the future at a currently negotiated forward rate in order to take a negative investment perspective on the related currency. These forward contracts seek to increase exposure to foreign exchange rate risk.
The Fund has entered into forward contracts with the obligation to sell specified foreign currencies in the future at a currently negotiated forward rate in order to decrease exposure to foreign exchange rate risk associated with foreign currency denominated securities held by the Fund.
During the year ended May 29, 2015, the Fund had daily average contract amounts on forward contracts to buy and sell of $2,519 and $44,507, respectively.
Additional associated risk to the Fund includes counterparty credit risk. Counterparty credit risk arises from the possibility that the counterparty to a forward contract will default and fail to perform its obligations to the Fund.
Counterparty Credit Risk. Derivative positions are subject to the risk that the counterparty will not fulfill its obligation to the Fund. The Fund intends to enter into derivative transactions with counterparties that the Manager believes to be creditworthy at the time of the transaction.
The Fund’s risk of loss from counterparty credit risk on OTC derivatives is generally limited to the aggregate unrealized gain netted against any collateral held by the Fund. For OTC options purchased, the Fund bears the risk of loss of the amount of the premiums paid plus the positive change in market values net of any collateral held by the Fund should the counterparty fail to perform under the contracts. Options written by the Fund do not typically give rise to counterparty credit risk, as options written generally obligate the Fund and not the counterparty to perform.
To reduce counterparty risk with respect to OTC transactions, the Fund has entered into master netting arrangements, established within the Fund’s International Swap and Derivatives Association, Inc. (“ISDA”) master agreements, which allow the Fund to make (or to have an entitlement to receive) a single net payment in the event of default (close-out netting) for outstanding payables and receivables with respect to certain OTC positions in swaps, options, swaptions, and forward currency exchange contracts for each individual counterparty. In addition, the Fund may require that certain counterparties post cash and/or securities in collateral accounts to cover their net payment obligations for those derivative contracts subject to ISDA master agreements. If the counterparty fails to perform under these contracts and agreements, the cash and/or securities will be made available to the Fund.
ISDA master agreements include credit related contingent features which allow counterparties to OTC derivatives to terminate derivative contracts prior to maturity in the event that, for example, the Fund’s net assets decline by a stated percentage or the Fund fails to meet the terms of its ISDA master agreements, which would cause the Fund to accelerate payment of any net liability owed to the counterparty.
For financial reporting purposes, the Fund does not offset derivative assets and derivative liabilities that are subject to netting arrangements in the Statement of Assets and Liabilities.
49 OPPENHEIMER GLOBAL HIGH YIELD FUND
NOTES TO FINANCIAL STATEMENTS Continued
5. Risk Exposures and the Use of Derivative Instruments (Continued)
Bankruptcy or insolvency laws of a particular jurisdiction may impose restrictions on or prohibitions against the right of offset in bankruptcy, insolvency or other events.
The Fund’s risk of loss from counterparty credit risk on exchange-traded derivatives cleared through a clearinghouse and for centrally cleared swaps is generally considered lower than as compared to OTC derivatives. However, counterparty credit risk exists with respect to initial and variation margin deposited/paid by the Fund that is held in futures commission merchant, broker and/or clearinghouse accounts for such exchange-traded derivatives and for centrally cleared swaps.
With respect to centrally cleared swaps, such transactions will be submitted for clearing, and if cleared, will be held in accounts at futures commission merchants or brokers that are members of clearinghouses. While brokers, futures commission merchants and clearinghouses are required to segregate customer margin from their own assets, in the event that a broker, futures commission merchant or clearinghouse becomes insolvent or goes into bankruptcy and at that time there is a shortfall in the aggregate amount of margin held by the broker, futures commission merchant or clearinghouse for all its customers, U.S. bankruptcy laws will typically allocate that shortfall on a pro-rata basis across all the broker’s, futures commission merchant’s or clearinghouse’s customers, potentially resulting in losses to the Fund.
There is the risk that a broker, futures commission merchant or clearinghouse will decline to clear a transaction on the Fund’s behalf, and the Fund may be required to pay a termination fee to the executing broker with whom the Fund initially enters into the transaction. Clearinghouses may also be permitted to terminate centrally cleared swaps at any time. The Fund is also subject to the risk that the broker or futures commission merchant will improperly use the Fund’s assets deposited/paid as initial or variation margin to satisfy payment obligations of another customer. In the event of a default by another customer of the broker or futures commission merchant, the Fund might not receive its variation margin payments from the clearinghouse, due to the manner in which variation margin payments are aggregated for all customers of the broker/futures commission merchant.
Collateral and margin requirements differ by type of derivative. Margin requirements are established by the broker, futures commission merchant or clearinghouse for exchange-traded and cleared derivatives, including centrally cleared swaps. Brokers, futures commission merchants and clearinghouses can ask for margin in excess of the regulatory minimum, or increase the margin amount, in certain circumstances.
Collateral terms are contract specific for OTC derivatives. For derivatives traded under an ISDA master agreement, the collateral requirements are typically calculated by netting the mark to market amount for each transaction under such agreement and comparing that amount to the value of any collateral currently pledged by the Fund or the counterparty.
For financial reporting purposes, cash collateral that has been pledged to cover obligations of the Fund, if any, is reported separately on the Statement of Assets and Liabilities as cash pledged as collateral. Non-cash collateral pledged by the Fund, if any, is noted in the Statement of Investments. Generally, the amount of collateral due from or to a party must exceed a minimum transfer amount threshold (e.g. $250,000) before a transfer has to be made. To the extent amounts due to the Fund from its counterparties are not fully
50 OPPENHEIMER GLOBAL HIGH YIELD FUND
5. Risk Exposures and the Use of Derivative Instruments (Continued)
collateralized, contractually or otherwise, the Fund bears the risk of loss from counterparty nonperformance.
The following table presents by counterparty the Fund’s OTC derivative assets net of the related collateral pledged by the Fund at May 29, 2015:
| Counterparty | Gross Amounts Not Offset in the Statement of Assets & Liabilities* | Net Amount | ||||||
| ||||||||
JPMorgan Chase Bank NA | $ 2,119 | $ 2,119 | ||||||
*OTC derivatives are reported gross on the Statement of Assets and Liabilities. Exchange traded options and margin related to cleared swaps and futures are excluded from these reported amounts.
The following table presents the valuations of derivative instruments by risk exposure as reported within the Statement of Assets and Liabilities as of May 29, 2015:
Asset Derivatives | ||||||||
Derivatives Not Accounted for as Hedging Instruments | Statement of Assets and Liabilities Location | Value | ||||||
| ||||||||
Forward currency exchange contracts | Unrealized appreciation on forward currency exchange contracts | $ | 2,119 | |||||
The effect of derivative instruments on the Statement of Operations is as follows:
| Amount of Realized Gain or (Loss) Recognized on Derivatives | ||||||||
| ||||||||
Derivatives Not Accounted for as Hedging Instruments | Foreign currency transactions | Total | ||||||
| ||||||||
Forward currency exchange contracts | $ 6,259 | $ 6,259 | ||||||
| Amount of Change in Unrealized Gain or (Loss) Recognized on Derivatives | ||||||||
| ||||||||
Derivatives Not Accounted for as Hedging Instruments | Translation of assets and liabilities denominated in foreign currencies | Total | ||||||
| ||||||||
Forward currency exchange contracts | $ 2,119 | $ 2,119 | ||||||
6. Shares of Beneficial Interest
The Fund has authorized an unlimited number of $0.001 par value shares of beneficial interest of each class. Transactions in shares of beneficial interest were as follows:
| Year Ended May 29, 20151 | Period Ended May 30, 20141,2,3 | |||||||||||||||
| Shares | Amount | Shares | Amount | |||||||||||||
| ||||||||||||||||
Class A | ||||||||||||||||
Sold | 684,359 | $ | 6,750,668 | 3,295,607 | $ | 33,102,284 | ||||||||||
Dividends and/or distributions reinvested | 29,250 | 288,784 | 5,170 | 52,803 | ||||||||||||
Redeemed | (552,560 | ) | (5,466,306 | ) | (189,057 | ) | (1,934,000) | |||||||||
|
| |||||||||||||||
Net increase | 161,049 | $ | 1,573,146 | 3,111,720 | $ | 31,221,087 | ||||||||||
|
| |||||||||||||||
51 OPPENHEIMER GLOBAL HIGH YIELD FUND
NOTES TO FINANCIAL STATEMENTS Continued
6. Shares of Beneficial Interest (Continued)
| Year Ended May 29, 20151 | Period Ended May 30, 20141,2,3 | |||||||||||||||
| Shares | Amount | Shares | Amount | |||||||||||||
| ||||||||||||||||
Class C | ||||||||||||||||
Sold | 311,548 | $ | 3,070,976 | 152,574 | $ | 1,552,390 | ||||||||||
Dividends and/or distributions reinvested | 10,912 | 107,463 | 1,208 | 12,328 | ||||||||||||
Redeemed | (78,630 | ) | (769,285 | ) | (986 | ) | (10,045) | |||||||||
|
| |||||||||||||||
Net increase | 243,830 | $ | 2,409,154 | 152,796 | $ | 1,554,673 | ||||||||||
|
| |||||||||||||||
| ||||||||||||||||
Class I | ||||||||||||||||
Sold | 1,526,067 | $ | 14,879,219 | — | $ | — | ||||||||||
Dividends and/or distributions reinvested | 39,126 | 378,897 | — | — | ||||||||||||
Redeemed | (130 | ) | (1,249 | ) | — | — | ||||||||||
|
| |||||||||||||||
Net increase | 1,565,063 | $ | 15,256,867 | — | $ | — | ||||||||||
|
| |||||||||||||||
| ||||||||||||||||
Class R4 | ||||||||||||||||
Sold | 34,239 | $ | 338,161 | 10,182 | $ | 103,501 | ||||||||||
Dividends and/or distributions reinvested | 1,065 | 10,471 | 95 | 968 | ||||||||||||
Redeemed | (7,754 | ) | (74,761 | ) | — | — | ||||||||||
|
| |||||||||||||||
Net increase | 27,550 | $ | 273,871 | 10,277 | $ | 104,469 | ||||||||||
|
| |||||||||||||||
| ||||||||||||||||
Class Y | ||||||||||||||||
Sold | 130,256 | $ | 1,283,159 | 61,126 | $ | 622,167 | ||||||||||
Dividends and/or distributions reinvested | 3,784 | 37,446 | 601 | 6,134 | ||||||||||||
Redeemed | (75,618 | ) | (750,652 | ) | (5,042 | ) | (51,680) | |||||||||
|
| |||||||||||||||
Net increase | 58,422 | $ | 569,953 | 56,685 | $ | 576,621 | ||||||||||
|
| |||||||||||||||
1. May 29, 2015 and May 30, 2014 represent the last business days of the Fund’s respective reporting periods. See Note 2.
2. For the period from November 8, 2013 (commencement of operations) to May 30, 2014.
3. The Fund sold 6,000 shares of Class A at a value of $60,000 and 1,000 shares each of Class C, Class I, Class R and Class Y at a value of $10,000, respectively, to the Manager upon seeding of the Fund on September 15, 2011. These amounts are not reflected in the table above.
4. Effective July 1, 2014, Class N shares were renamed Class R.
7. Purchases and Sales of Securities
The aggregate cost of purchases and proceeds from sales of securities, other than short-term obligations, for the year ended May 29, 2015 were as follows:
| Purchases | Sales | |||||||
| ||||||||
Investment securities | $46,630,042 | $26,550,345 | ||||||
52 OPPENHEIMER GLOBAL HIGH YIELD FUND
8. Fees and Other Transactions with Affiliates
Management Fees. Under the investment advisory agreement, the Fund pays the Manager a management fee based on the daily net assets of the Fund at an annual rate as shown in the following table:
| Fee Schedule | ||||||
| ||||||
Up to $500 million | 0.75 | % | ||||
Next $500 million | 0.70 | |||||
Next $3 billion | 0.65 | |||||
Over $4 billion | 0.60 | |||||
The Fund’s effective management fee for the fiscal year ended May 29, 2015 was 0.75% of average annual net assets before any applicable waivers.
Sub-Adviser Fees. The Manager has retained the Sub-Adviser to provide the day-to-day portfolio management of the Fund. Under the Sub-Advisory Agreement, the Manager pays the Sub-Adviser an annual fee in monthly installments, equal to a percentage of the investment management fee collected by the Manager from the Fund, which shall be calculated after any investment management fee waivers. The fee paid to the Sub-Adviser is paid by the Manager, not by the Fund.
Transfer Agent Fees. OFI Global (the “Transfer Agent”) serves as the transfer and shareholder servicing agent for the Fund. The Fund pays the Transfer Agent a fee based on annual net assets. Fees incurred and average net assets for each class with respect to these services are detailed in the Statement of Operations and Financial Highlights, respectively.
Sub-Transfer Agent Fees. The Transfer Agent has retained Shareholder Services, Inc., a wholly-owned subsidiary of OFI (the “Sub-Transfer Agent”), to provide the day-to-day transfer agent and shareholder servicing of the Fund. Under the Sub-Transfer Agency Agreement, the Transfer Agent pays the Sub-Transfer Agent an annual fee in monthly installments, equal to a percentage of the transfer agent fee collected by the Transfer Agent from the Fund, which shall be calculated after any applicable fee waivers. The fee paid to the Sub-Transfer Agent is paid by the Transfer Agent, not by the Fund.
Offering and Organizational Costs. The Manager paid all initial offering and organizational costs associated with the registration and seeding of the Fund.
Trustees’ Compensation. The Fund’s Board of Trustees (“Board”) has adopted a compensation deferral plan for Independent Trustees that enables Trustees to elect to defer receipt of all or a portion of the annual compensation they are entitled to receive from the Fund. For purposes of determining the amount owed to the Trustee under the plan, deferred amounts are treated as though equal dollar amounts had been invested in shares of the Fund or in other Oppenheimer funds selected by the Trustee. The Fund purchases shares of the funds selected for deferral by the Trustee in amounts equal to his or her deemed investment, resulting in a Fund asset equal to the deferred compensation liability. Such assets are included
53 OPPENHEIMER GLOBAL HIGH YIELD FUND
NOTES TO FINANCIAL STATEMENTS Continued
8. Fees and Other Transactions with Affiliates (Continued)
as a component of “Other” within the asset section of the Statement of Assets and Liabilities. Deferral of Trustees’ fees under the plan will not affect the net assets of the Fund and will not materially affect the Fund’s assets, liabilities or net investment income per share. Amounts will be deferred until distributed in accordance with the compensation deferral plan.
Distribution and Service Plan (12b-1) Fees. Under its General Distributor’s Agreement with the Fund, OppenheimerFunds Distributor, Inc. (the “Distributor”) acts as the Fund’s principal underwriter in the continuous public offering of the Fund’s classes of shares.
Service Plan for Class A Shares. The Fund has adopted a Service Plan (the “Plan”) for Class A shares pursuant to Rule 12b-1 under the 1940 Act. Under the Plan, the Fund reimburses the Distributor for a portion of its costs incurred for services provided to accounts that hold Class A shares. Reimbursement is made periodically at an annual rate of up to 0.25% of the daily net assets of Class A shares of the Fund. The Distributor currently uses all of those fees to pay dealers, brokers, banks and other financial institutions periodically for providing personal service and maintenance of accounts of their customers that hold Class A shares. Any unreimbursed expenses the Distributor incurs with respect to Class A shares in any fiscal year cannot be recovered in subsequent periods. Fees incurred by the Fund under the Plan are detailed in the Statement of Operations.
Distribution and Service Plans for Class C and Class R Shares. The Fund has adopted Distribution and Service Plans (the “Plans”) for Class C and Class R shares pursuant to Rule 12b-1 under the 1940 Act to compensate the Distributor for distributing those share classes, maintaining accounts and providing shareholder services. Under the Plans, the Fund pays the Distributor an annual asset-based sales charge of 0.75% on Class C shares daily net assets and 0.25% on Class R shares daily net assets. The Fund also pays a service fee under the Plans at an annual rate of 0.25% of daily net assets. The Plans continue in effect from year to year only if the Fund’s Board of Trustees vote annually to approve its continuance at an in person meeting called for that purpose. Fees incurred by the Fund under the Plans are detailed in the Statement of Operations.
Sales Charges. Front-end sales charges and CDSC do not represent expenses of the Fund. They are deducted from the proceeds of sales of Fund shares prior to investment or from redemption proceeds prior to remittance, as applicable. The sales charges retained by the Distributor from the sale of shares and the CDSC retained by the Distributor on the redemption of shares is shown in the following table for the period indicated.
| Year Ended | Class A Front-End | Class A Contingent Deferred Sales Charges Retained by Distributor | Class C Contingent Deferred Sales Charges Retained by Distributor | |||||||||
| ||||||||||||
May 29, 2015 | $15,823 | $925 | $822 | |||||||||
54 OPPENHEIMER GLOBAL HIGH YIELD FUND
8. Fees and Other Transactions with Affiliates (Continued)
Waivers and Reimbursements of Expenses. The Manager has contractually agreed to waive a portion of its management fees and/or reimburse the Fund for certain expenses so that “Expenses after payments, waivers and/or reimbursements and reduction to custodian expenses” (excluding any applicable dividend expense, taxes, interest and fees from borrowing, any subsidiary expenses, Acquired Fund Fees and Expenses, brokerage commissions, extraordinary expenses and certain other Fund expenses) will not exceed 1.15% of average annual net assets for Class A shares, 1.85% for Class C shares, 0.80% for Class I, 1.40% for Class R shares and 0.85% for Class Y shares. During the year ended May 29, 2015, the Manager reimbursed the Fund $77,250, $18,762, $20,188, $2,480 and $4,749 for Class A, Class C, Class I, Class R and Class Y shares, respectively.
Waivers and/or reimbursements may be modified or terminated as set forth according to the terms in the prospectus.
9. Pending Litigation
In 2009, seven class action lawsuits were filed in the U.S. District Court for the District of Colorado against OppenheimerFunds, Inc. (“OFI”), OppenheimerFunds Distributor, Inc., the Fund’s principal underwriter and distributor (the “Distributor”), and certain funds (but not including the Fund) advised by OFI Global Asset Management, Inc. and distributed by the Distributor (the “Defendant Funds”). The lawsuits also named as defendants certain officers and current and former trustees of the respective Defendant Funds. The lawsuits raised claims under federal securities laws and alleged, among other things, that the disclosure documents of the respective Defendant Funds contained misrepresentations and omissions and that the respective Defendant Funds’ investment policies were not followed. The plaintiffs in these actions sought unspecified damages, equitable relief and awards of attorneys’ fees and litigation expenses. The Defendant Funds’ Boards of Trustees also engaged counsel to represent the Funds and the present and former Independent Trustees named in those suits. In March 2014, the parties in six of these lawsuits executed stipulations and agreements of settlement resolving those actions. In July 2014, the court entered an order and final judgment approving the settlements as fair, reasonable and adequate. The settlements do not resolve a seventh outstanding lawsuit relating to Oppenheimer Rochester California Municipal Fund (the “California Fund Suit”). OFI believes the California Fund Suit is without legal merit and is defending the suit vigorously. While it is premature to render any opinion as to the outcome in the California Fund Suit, or whether any costs that OFI may bear in defending the California Fund Suit might not be reimbursed by insurance, OFI believes the California Fund Suit should not impair the ability of OFI or the Distributor to perform their respective duties to the Fund, and that the outcome of the California Fund Suit should not have any material effect on the operations of any of the Oppenheimer funds.
55 OPPENHEIMER GLOBAL HIGH YIELD FUND
REPORT OF INDEPENDENT REGISTERED PUBLIC ACCOUNTING FIRM
The Board of Trustees and Shareholders of Oppenheimer Global High Yield Fund:
We have audited the accompanying statement of assets and liabilities of Oppenheimer Global High Yield Fund, including the statement of investments, as of May 29, 2015, and the related statement of operations for the year then ended, and the statement of changes in net assets and the financial highlights for the year then ended and for the period from November 8, 2013 (commencement of operations) to May 30, 2014. These financial statements and financial highlights are the responsibility of the Fund’s management. Our responsibility is to express an opinion on these financial statements and financial highlights based on our audit.
We conducted our audit in accordance with the standards of the Public Company Accounting Oversight Board (United States). Those standards require that we plan and perform the audit to obtain reasonable assurance about whether the financial statements and financial highlights are free of material misstatement. An audit includes examining, on a test basis, evidence supporting the amounts and disclosures in the financial statements. Our procedures included confirmation of securities owned as of May 29, 2015, by correspondence with the custodian and brokers, or by other appropriate auditing procedures where replies from brokers were not received. An audit also includes assessing the accounting principles used and significant estimates made by management, as well as evaluating the overall financial statement presentation. We believe that our audit provides a reasonable basis for our opinion.
In our opinion, the financial statements and financial highlights referred to above present fairly, in all material respects, the financial position of Oppenheimer Global High Yield Fund as of May 29, 2015, the results of its operations for the year then ended, and the changes in its net assets and the financial highlights for the year then ended and for the period from November 8, 2013 (commencement of operations) to May 30, 2014, in conformity with U.S. generally accepted accounting principles.
| KPMG LLP |
Denver, Colorado |
| July 24, 2015 |
56 OPPENHEIMER GLOBAL HIGH YIELD FUND
FEDERAL INCOME TAX INFORMATION Unaudited
In early 2015, if applicable, shareholders of record received information regarding all dividends and distributions paid to them by the Fund during calendar year 2014.
Dividends, if any, paid by the Fund during the fiscal year ended May 29, 2015 which are not designated as capital gain distributions should be multiplied by the maximum amount allowable but not less than 0.40% to arrive at the amount eligible for the corporate dividend-received deduction.
A portion, if any, of the dividends paid by the Fund during the fiscal year ended May 29, 2015 which are not designated as capital gain distributions are eligible for lower individual income tax rates to the extent that the Fund has received qualified dividend income as stipulated by recent tax legislation. The maximum amount allowable but not less than $8,404 of the Fund’s fiscal year taxable income may be eligible for the lower individual income tax rates. In early 2015, shareholders of record received information regarding the percentage of distributions that are eligible for lower individual income tax rates.
Recent tax legislation allows a regulated investment company to designate distributions not designated as capital gain distributions, as either interest related dividends or short-term capital gain dividends, both of which are exempt from the U.S. withholding tax applicable to non U.S. taxpayers. For the fiscal year ended May 29, 2015, the maximum amount allowable but not less than $1,607,344 of the ordinary distributions to be paid by the Fund qualifies as an interest related dividend.
The foregoing information is presented to assist shareholders in reporting distributions received from the Fund to the Internal Revenue Service. Because of the complexity of the federal regulations which may affect your individual tax return and the many variations in state and local tax regulations, we recommend that you consult your tax advisor for specific guidance.
57 OPPENHEIMER GLOBAL HIGH YIELD FUND
PORTFOLIO PROXY VOTING POLICIES AND PROCEDURES;
UPDATES TO STATEMENTS OF INVESTMENTS Unaudited
The Fund has adopted Portfolio Proxy Voting Policies and Procedures under which the Fund votes proxies relating to securities (“portfolio proxies”) held by the Fund. A description of the Fund’s Portfolio Proxy Voting Policies and Procedures is available (i) without charge, upon request, by calling the Fund toll-free at 1.800.CALL OPP (225.5677), (ii) on the Fund’s website at www.oppenheimerfunds.com, and (iii) on the SEC’s website at www.sec.gov. In addition, the Fund is required to file Form N-PX, with its complete proxy voting record for the 12 months ended June 30th, no later than August 31st of each year. The Fund’s voting record is available (i) without charge, upon request, by calling the Fund toll-free at 1.800.CALL OPP (225.5677), and (ii) in the Form N-PX filing on the SEC’s website at www.sec.gov.
The Fund files its complete schedule of portfolio holdings with the SEC for the first quarter and the third quarter of each fiscal year on Form N-Q. The Fund’s Form N-Q filings are available on the SEC’s website at www.sec.gov. Those forms may be reviewed and copied at the SEC’s Public Reference Room in Washington, D.C. Information on the operation of the Public Reference Room may be obtained by calling 1-800-SEC-0330.
Householding—Delivery of Shareholder Documents
This is to inform you about OppenheimerFunds’ “householding” policy. If more than one member of your household maintains an account in a particular fund, OppenheimerFunds will mail only one copy of the fund’s prospectus (or, if available, the fund’s summary prospectus), annual and semiannual report and privacy policy. The consolidation of these mailings, called householding, benefits your fund through reduced mailing expense, and benefits you by reducing the volume of mail you receive from OppenheimerFunds. Householding does not affect the delivery of your account statements.
Please note that we will continue to household these mailings for as long as you remain an OppenheimerFunds shareholder, unless you request otherwise. If you prefer to receive multiple copies of these materials, please call us at 1.800.CALL-OPP (225-5677). You may also notify us in writing or via email. We will begin sending you individual copies of the prospectus (or, if available, the summary prospectus), reports and privacy policy within 30 days of receiving your request to stop householding.
58 OPPENHEIMER GLOBAL HIGH YIELD FUND
TRUSTEES AND OFFICERS Unaudited
| Name, Position(s) Held with the Funds, Length of Service, Year of Birth | Principal Occupation(s) During the Past 5 Years; Other Trusteeships/Directorships Held; Number of Portfolios in the Funds Complex Currently Overseen | |
| INDEPENDENT TRUSTEES | The address of each Trustee in the chart below is 6803 S. Tucson Way, Centennial, Colorado 80112-3924. Each Trustee serves for an indefinite term, or until his or her resignation, retirement, death or removal. | |
Sam Freedman, Chairman of the Board of Trustees (since 2013) and Trustee (since 2011) Year of Birth: 1940 | Director of Colorado UpLIFT (charitable organization) (since September 1984). Mr. Freedman held several positions with the Sub-Adviser and with subsidiary or affiliated companies of the Sub-Adviser (until October 1994). Oversees 38 portfolios in the OppenheimerFunds complex. Mr. Freedman has served on the Boards of certain Oppenheimer funds since 1996, during which time he has become familiar with the Fund’s (and other Oppenheimer funds’) financial, accounting, regulatory and investment matters and has contributed to the Boards’ deliberations. | |
Jon S. Fossel, Trustee (since 2011) Year of Birth: 1942 | Chairman of the Board (2006-December 2011) and Director (June 2002-December 2011) of UNUMProvident (insurance company); Director of Northwestern Energy Corp. (public utility corporation) (November 2004-December 2009); Director of P.R. Pharmaceuticals (October 1999-October 2003); Director of Rocky Mountain Elk Foundation (non-profit organization) (February 1998-February 2003 and February 2005-February 2007); Chairman and Director (until October 1996) and President and Chief Executive Officer (until October 1995) of the Sub-Adviser; President, Chief Executive Officer and Director of the following: Oppenheimer Acquisition Corp. (“OAC”) (parent holding company of the Sub-Adviser), Shareholders Services, Inc. and Shareholder Financial Services, Inc. (until October 1995). Oversees 38 portfolios in the OppenheimerFunds complex. Mr. Fossel has served on the Boards of certain Oppenheimer funds since 1990, during which time he has become familiar with the Fund’s (and other Oppenheimer funds’) financial, accounting, regulatory and investment matters and has contributed to the Boards’ deliberations. | |
Richard F. Grabish, Trustee (since 2011) Year of Birth: 1948 | Formerly Senior Vice President and Assistant Director of Sales and Marketing (March 1997-December 2007), Director (March 1987-December 2007) and Manager of Private Client Services (June 1985-June 2005) of A.G. Edwards & Sons, Inc. (broker/dealer and investment firm); Chairman and Chief Executive Officer of A.G. Edwards Trust Company, FSB (March 2001-December 2007); President and Vice Chairman of A.G. Edwards Trust Company, FSB (investment adviser) (April 1987-March 2001); President of A.G. Edwards Trust Company, FSB (investment adviser) (June 2005-December 2007). Oversees 38 portfolios in the OppenheimerFunds complex. Mr. Grabish has served on the Boards of certain Oppenheimer funds since 2001, during which time he has become familiar with the Fund’s (and other Oppenheimer funds’) financial, accounting, regulatory and investment matters and has contributed to the Boards’ deliberations. | |
Beverly L. Hamilton, Trustee (since 2011) Year of Birth: 1946 | Trustee of Monterey Institute for International Studies (educational organization) (since February 2000); Board Member of Middlebury College (educational organization) (December 2005-June 2011); Chairman (since 2010) of American Funds’ Emerging Markets Growth Fund, Inc. (mutual fund); | |
59 OPPENHEIMER GLOBAL HIGH YIELD FUND
TRUSTEES AND OFFICERS Unaudited / Continued
Beverly L. Hamilton, Continued | Director of The California Endowment (philanthropic organization) (April 2002-April 2008); Director (February 2002-2005) and Chairman of Trustees (2006-2007) of the Community Hospital of Monterey Peninsula; Director (October 1991-2005); Vice Chairman (2006-2009) of American Funds’ Emerging Markets Growth Fund, Inc. (mutual fund); President of ARCO Investment Management Company (February 1991-April 2000); Member of the investment committees of The Rockefeller Foundation (2001-2006) and The University of Michigan (since 2000); Advisor at Credit Suisse First Boston’s Sprout venture capital unit (venture capital fund) (1994-January 2005); Trustee of MassMutual Institutional Funds (investment company) (1996-June 2004); Trustee of MML Series Investment Fund (investment company) (April 1989-June 2004); Member of the investment committee of Hartford Hospital (2000-2003); and Advisor to Unilever (Holland) pension fund (2000-2003). Oversees 38 portfolios in the OppenheimerFunds complex. Ms. Hamilton has served on the Boards of certain Oppenheimer funds since 2002, during which time she has become familiar with the Fund’s (and other Oppenheimer funds’) financial, accounting, regulatory and investment matters and has contributed to the Boards’ deliberations. | |
Victoria J. Herget, Trustee (since 2012) Year of Birth:1951 | Board Chair (2008-Present) and Director (2004-Present), United Educators (insurance company); Trustee (since 2000) and Chair (since 2010), Newberry Library (independent research library); Trustee, Mather LifeWays (senior living organization) (since 2001); Independent Director of the First American Funds (mutual fund family) (2003-2011); former Managing Director (1993-2001), Principal (1985-1993), Vice President (1978-1985) and Assistant Vice President (1973-1978) of Zurich Scudder Investments (investment adviser) (and its predecessor firms); Trustee (1992-2007), Chair of the Board of Trustees (1999-2007), Investment Committee Chair (1994-1999) and Investment Committee member (2007-2010) of Wellesley College; Trustee, BoardSource (non-profit organization) (2006-2009) and Chicago City Day School (K-8 School) (1994-2005). Oversees 38 portfolios in the OppenheimerFunds complex. Ms. Herget has served on the Boards of certain Oppenheimer funds since 2012, during which time she has become familiar with the Fund’s (and other Oppenheimer funds’) financial, accounting, regulatory and investment matters and has contributed to the Boards’ deliberations. | |
Robert J. Malone, Trustee (since 2011) Year of Birth: 1944 | Chairman of the Board (since 2012) and Director (since August 2005) of Jones International University (educational organization) (since August 2005); Chairman, Chief Executive Officer and Director of Steele Street Bank Trust (commercial banking) (since August 2003); Trustee of the Gallagher Family Foundation (non-profit organization) (since 2000); Board of Directors of Opera Colorado Foundation (non-profit organization) (2008-2012); Director of Colorado UpLIFT (charitable organization) (1986-2010); Director of Jones Knowledge, Inc. (2006-2010); Former Chairman of U.S. Bank-Colorado (subsidiary of U.S. Bancorp and formerly Colorado National Bank) (July 1996-April 1999); Director of Commercial Assets, Inc. (real estate investment trust) (1993-2000); Director of U.S. Exploration, Inc. (oil and gas exploration) (1997-February 2004); Chairman of the Board (1991-1994) and Trustee (1985-1994) of Regis University; and Chairman of the Board (1990-1991 and Trustee (1984-1999) of Young Presidents Organization. Oversees 38 portfolios in the OppenheimerFunds complex. Mr. Malone has served on the Boards of certain Oppenheimer funds since 2002, during which time he has become | |
60 OPPENHEIMER GLOBAL HIGH YIELD FUND
Robert J. Malone, Continued | familiar with the Fund’s (and other Oppenheimer funds’) financial, accounting, regulatory and investment matters and has contributed to the Boards’ deliberations. | |
F. William Marshall, Jr., Trustee (since 2011) Year of Birth: 1942 | Trustee Emeritus of Worcester Polytech Institute (WPI) (private university) (since 2009); Trustee of MassMutual Select Funds (formerly MassMutual Institutional Funds) (investment company) (since 1996), MML Series Investment Fund (investment company) (since 1996) and Mass Mutual Premier Funds (investment company) (since January 2012); President and Treasurer of the SIS Funds (private charitable fund) (January 1999-March 2011); Former Trustee of WPI (1985-2008); Former Chairman of the Board (2004-2006) and Former Chairman of the Investment Committee of WPI (1994-2008); Chairman of SIS Family Bank, F.S.B. (formerly SIS Bank) (commercial bank) (January 1999-July 1999); Executive Vice President of Peoples Heritage Financial Group, Inc. (commercial bank) (January 1999-July 1999); and Former President and Chief Executive Officer of SIS Bancorp. (1993-1999). Oversees 42 portfolios in the OppenheimerFunds complex. Mr. Marshall has served on the Boards of certain Oppenheimer funds since 2000, during which time he has become familiar with the Fund’s (and other Oppenheimer funds’) financial, accounting, regulatory and investment matters and has contributed to the Boards’ deliberations. | |
Karen L. Stuckey, Trustee (since 2012) Year of Birth: 1953 | Partner (1990-2012) of PricewaterhouseCoopers LLP (professional services firm) (held various positions 1975-1990); Trustee (1992-2006) and member of Executive, Nominating and Audit Committees and Chair of Finance Committee of Lehigh University; and member, Women’s Investment Management Forum (professional organization) since inception. Oversees 38 portfolios in the OppenheimerFunds complex. Ms. Stuckey has served on the Boards of certain Oppenheimer funds since 2012, during which time she has become familiar with the Fund’s (and other Oppenheimer funds’) financial, accounting, regulatory and investment matters and has contributed to the Boards’ deliberations. | |
James D. Vaughn, Trustee (since 2012) Year of Birth:1945 | Retired; former managing partner (1994-2001) of Denver office of Deloitte & Touche LLP, (held various positions 1969-1993); Trustee and Chairman of the Audit Committee of Schroder Funds (2003-2012); Board member and Chairman of Audit Committee of AMG National Trust Bank (since 2005); Trustee and Investment Committee member, University of South Dakota Foundation (since 1996); Board member, Audit Committee Member and past Board Chair, Junior Achievement (since 1993); former Board member, Mile High United Way, Boys and Girls Clubs, Boy Scouts, Colorado Business Committee for the Arts, Economic Club of Colorado and Metro Denver Network. Oversees 38 portfolios in the OppenheimerFunds complex. Mr. Vaughn has served on the Boards of certain Oppenheimer funds since 2012, during which time he has become familiar with the Fund’s (and other Oppenheimer funds’) financial, accounting, regulatory and investment matters and has contributed to the Boards’ deliberations. | |
61 OPPENHEIMER GLOBAL HIGH YIELD FUND
TRUSTEES AND OFFICERS Unaudited / Continued
| INTERESTED TRUSTEE AND OFFICER | Mr. Steinmetz is an “Interested Trustee” because he is affiliated with the Manager and the Sub-Adviser by virtue of his positions as Chairman of the Sub-Adviser and officer and director of the Manager. Both as a Trustee and as an officer, Mr. Steinmetz serves for an indefinite term, or until his resignation, retirement, death or removal. Mr. Steinmetz’s address is 225 Liberty Street, New York, New York 10281-1008. | |
Arthur P. Steinmetz, Trustee (since 2015), President and Principal Executive Officer (since 2014) Year of Birth: 1958 | Chairman of the Sub-Adviser (since January 2015); CEO and Chairman of the Manager (since July 2014), President of the Manager (since May 2013), a Director of the Manager (since January 2013), Director of the Sub-Adviser (since July 2014), President, Management Director and CEO of Oppenheimer Acquisition Corp. (the Sub-Adviser’s parent holding company) (since July 2014), and President and Director of OFI SteelPath, Inc. (since January 2013). Chief Investment Officer of the OppenheimerFunds advisory entities from (January 2013-December 2013); Executive Vice President of the Manager (January 2013-May 2013); Chief Investment Officer of the Sub-Adviser (October 2010-December 2012); Chief Investment Officer, Fixed-Income, of the Sub-Adviser (April 2009-October 2010); Executive Vice President of the Sub-Adviser (October 2009-December 2012); Director of Fixed Income of the Sub-Adviser (January 2009-April 2009); and a Senior Vice President of the Sub-Adviser (March 1993-September 2009). An officer of 91 portfolios in the OppenheimerFunds complex. | |
| OTHER OFFICERS OF THE FUND | The addresses of the Officers in the chart below are as follows: for Messrs. Mata, Kelly, Lee, Gabinet, Mss. Sexton and Picciotto, 225 Liberty Street, New York, New York 10281-1008, for Mr. Wixted, 6803 S. Tucson Way, Centennial, Colorado 80112-3924. Each Officer serves for an indefinite term or until his or her resignation, retirement, death or removal. | |
Michael Mata, Vice President (since 2015) Year of Birth: 1963 | Senior Vice President of the Sub-Adviser and the Head of Multi-Sector Fixed Income (since July 2014). Portfolio manager with ING Investment Management and Head of Multi-Sector Fixed-Income (August 2004-December 2013), managing the Global Bond and Core Plus strategies and the macro and quantitative research teams, along with the emerging markets sovereign team. Senior Vice President and Senior Risk Manager at Putnam Investments (March 2000-August 2004) and a Vice President and Risk Manager for Fixed Income Trading at Lehman Brothers (September 1994-March 2000). A portfolio manager and officer of other portfolios in the OppenheimerFunds complex. | |
Chris Kelly, Vice President (since 2015) Year of Birth:1967 | Vice President and Portfolio Manager of the Sub-Adviser since March 2015 and Co-Head of the Global Debt Team since March 2015. Prior to joining the Sub-Adviser, Mr. Kelly was at BlackRock Inc., where he was Deputy Head of Emerging Markets Fixed Income from June 2012 to January 2015. Mr. Kelly was also a portfolio manager and Deputy Chief Investment Officer of Emerging Markets at Fisher Francis Trees and Watts, a BNP Paribas Investment Partner, from February 2008 to April 2012. A portfolio manager and officer of other portfolios in the OppenheimerFunds complex. | |
Young-Sup Lee, Vice President (since 2013) Year of Birth: 1964 | Vice President and Senior Research Analyst of the Sub-Adviser (since April 2009) and co-Team Leader for the Sub-Adviser’s Investment Grade Fixed Income Team (since January 2014). A member of the Sub-Adviser’s Investment Grade Fixed Income Team (April 2009-January 2014). Vice | |
62 OPPENHEIMER GLOBAL HIGH YIELD FUND
Young-Sup Lee, Continued | President and quantitative research analyst for the fixed income credit strategy team at Morgan Stanley (July 1996-July 2008). A portfolio manager and officer of other portfolios in the OppenheimerFunds complex. | |
Arthur S. Gabinet, Secretary and Chief Legal Officer (since 2011) Year of Birth: 1958 | Executive Vice President, Secretary and General Counsel of the Manager (since January 2013); General Counsel OFI SteelPath, Inc. (since January 2013); Executive Vice President (May 2010-December 2012) and General Counsel (since January 2011) of the Sub-Adviser; General Counsel of the Distributor (since January 2011); General Counsel of Centennial Asset Management Corporation (January 2011-December 2012); Executive Vice President (January 2011-December 2012) and General Counsel of HarbourView Asset Management Corporation (since January 2011); Assistant Secretary (since January 2011) and Director (since January 2011) of OppenheimerFunds International Ltd. and OppenheimerFunds plc; Director of Oppenheimer Real Asset Management, Inc. (January 2011-December 2012) and General Counsel (since January 2011); Executive Vice President (January 2011-December 2011) and General Counsel of Shareholder Financial Services, Inc. and Shareholder Services, Inc. (since January 2011); Executive Vice President (January 2011-December 2012) and General Counsel of OFI Private Investments Inc. (since January 2011); Vice President of OppenheimerFunds Legacy Program (January 2011-December 2011); Executive Vice President (January 2011-December 2012) and General Counsel of OFI Institutional Asset Management, Inc. (since January 2011); General Counsel, Asset Management of the Sub-Adviser (May 2010-December 2010); Principal, The Vanguard Group (November 2005-April 2010); District Administrator, U.S. Securities and Exchange Commission (January 2003-October 2005). An officer of 91 portfolios in the OppenheimerFunds complex. | |
Jennifer Sexton, Vice President and Chief Business Officer (since 2014) Year of Birth: 1969 | Senior Vice President of OppenheimerFunds Distributor, Inc. (since June 2014); Vice President of OppenheimerFunds Distributor, Inc. (April 2006-June 2014); Vice President of the Sub-Adviser (January 1998-March 2006); Assistant Vice President of the Sub-Adviser (October 1991-December 1998). An officer of 91 portfolios in the OppenheimerFunds complex. | |
Mary Ann Picciotto, Chief Compliance Officer and Chief Anti-Money Laundering Officer (since 2014) Year of Birth: 1973 | Senior Vice President and Chief Compliance Officer of the Manager (since March 2014); Chief Compliance Officer of the Sub-Adviser, OFI SteelPath, Inc., OFI Global Trust Company, OFI Global Institutional, Inc., Oppenheimer Real Asset Management, Inc., OFI Private Investments, Inc., Harborview Asset Management Corporation, Trinity Investment Management Corporation, and Shareholder Services, Inc. (since March 2014); Managing Director of Morgan Stanley Investment Management Inc. and certain of its various affiliated entities; Chief Compliance Officer of various Morgan Stanley Funds (May 2010-January 2014); Chief Compliance Officer of Morgan Stanley Investment Management Inc. (April 2007-January 2014). An officer of 91 portfolios in the OppenheimerFunds complex. | |
Brian W. Wixted, Treasurer and Principal Financial & Accounting Officer (since 2011) Year of Birth: 1959 | Senior Vice President of the Manager (since January 2013); Treasurer of the Sub-Adviser, HarbourView Asset Management Corporation, Shareholder Financial Services, Inc., Shareholder Services, Inc., and Oppenheimer Real Asset Management, Inc. (March 1999-June 2008), OFI Private Investments, Inc. (March 2000-June 2008), OppenheimerFunds International Ltd. and OppenheimerFunds plc (since May 2000), OFI Institutional Asset Management, Inc. (November 2000-June 2008), and OppenheimerFunds | |
63 OPPENHEIMER GLOBAL HIGH YIELD FUND
TRUSTEES AND OFFICERS Unaudited / Continued
Brian W. Wixted, Continued | Legacy Program (charitable trust program established by the Sub-Adviser) (June 2003-December 2011); Treasurer and Chief Financial Officer of OFI Trust Company (since May 2000); Assistant Treasurer of Oppenheimer Acquisition Corporation (March 1999-June 2008). An officer of 91 portfolios in the OppenheimerFunds complex. | |
| The Fund’s Statement of Additional Information contains additional information about the Fund’s Trustees and Officers and is available without charge upon request, by calling 1.800.CALL OPP (225.5677). | ||
64 OPPENHEIMER GLOBAL HIGH YIELD FUND
OPPENHEIMER GLOBAL HIGH YIELD FUND
| Manager | OFI Global Asset Management, Inc. | |
| Sub-Adviser | OppenheimerFunds, Inc. | |
| Distributor | OppenheimerFunds Distributor, Inc. | |
| Transfer and Shareholder Servicing Agent | OFI Global Asset Management, Inc. | |
| Sub-Transfer Agent | Shareholder Services, Inc. DBA OppenheimerFunds Services | |
Independent Registered Public Accounting Firm | KPMG LLP | |
| Legal Counsel | Ropes & Gray LLP | |
© 2015 OppenheimerFunds, Inc. All rights reserved.
65 OPPENHEIMER GLOBAL HIGH YIELD FUND
As an Oppenheimer fund shareholder, you are entitled to know how we protect your personal information and how we limit its disclosure.
Information Sources
We obtain nonpublic personal information about our shareholders from the following sources:
| ● | Applications or other forms |
| ● | When you create a user ID and password for online account access |
| ● | When you enroll in eDocs Direct, our electronic document delivery service |
| ● | Your transactions with us, our affiliates or others |
| ● | A software program on our website, often referred to as a “cookie,” which indicates which parts of our site you’ve visited |
| ● | When you set up challenge questions to reset your password online |
If you visit oppenheimerfunds.com and do not log on to the secure account information areas, we do not obtain any personal information about you. When you do log on to a secure area, we do obtain your user ID and password to identify you. We also use this information to provide you with products and services you have requested, to inform you about products and services that you may be interested in and assist you in other ways.
We do not collect personal information through our website unless you willingly provide it to us, either directly by email or in those areas of the website that request information. In order to update your personal information (including your mailing address, email address and phone number) you must first log on and visit your user profile.
If you have set your browser to warn you before accepting cookies, you will receive the warning message with each cookie. You can refuse cookies by turning them off in your browser. However, doing so may limit your access to certain sections of our website.
We use cookies to help us improve and manage our website. For example, cookies help us recognize new versus repeat visitors to the site, track the pages visited, and enable some special features on the website. This data helps us provide a better service for our website visitors.
Protection of Information
We do not disclose any non-public personal information (such as names on a customer list) about current or former customers to anyone, except as permitted by law.
Disclosure of Information
Copies of confirmations, account statements and other documents reporting activity in your fund accounts are made available to your financial advisor (as designated by you). We may also use details about you and your investments to help us, our financial service affiliates, or firms that jointly market their financial products and services with ours, to better serve your investment needs or suggest financial services or educational material that may be of interest to you. If this requires us to provide you with an opportunity to “opt in” or “opt out” of such information sharing with a firm not affiliated with us, you will receive notification on how to do so, before any such sharing takes place.
Right of Refusal
We will not disclose your personal information to unaffiliated third parties (except as permitted by law), unless we first offer you a reasonable opportunity to refuse or “opt out” of such disclosure.
66 OPPENHEIMER GLOBAL HIGH YIELD FUND
Internet Security and Encryption
In general, the email services provided by our website are encrypted and provide a secure and private means of communication with us. To protect your own privacy, confidential and/or personal information should only be communicated via email when you are advised that you are using a secure website.
As a security measure, we do not include personal or account information in non-secure emails, and we advise you not to send such information to us in non-secure emails. Instead, you may take advantage of the secure features of our website to encrypt your email correspondence. To do this, you will need to use a browser that supports Secure Sockets Layer (SSL) protocol.
We do not guarantee or warrant that any part of our website, including files available for download, are free of viruses or other harmful code. It is your responsibility to take appropriate precautions, such as use of an anti-virus software package, to protect your computer hardware and software.
| ● | All transactions, including redemptions, exchanges and purchases, are secured by SSL and 256-bit encryption. SSL is used to establish a secure connection between your PC and OppenheimerFunds’ server. It transmits information in an encrypted and scrambled format. |
| ● | Encryption is achieved through an electronic scrambling technology that uses a “key” to code and then decode the data. Encryption acts like the cable converter box you may have on your television set. It scrambles data with a secret code so that no one can make sense of it while it is being transmitted. When the data reaches its destination, the same software unscrambles the data. |
| ● | You can exit the secure area by either closing your browser, or for added security, you can use the Log Out button before you close your browser. |
Other Security Measures
We maintain physical, electronic and procedural safeguards to protect your personal account information. Our employees and agents have access to that information only so that they may offer you products or provide services, for example, when responding to your account questions.
How You Can Help
You can also do your part to keep your account information private and to prevent unauthorized transactions. If you obtain a user ID and password for your account, do not allow it to be used by anyone else. Also, take special precautions when accessing your account on a computer used by others.
Who We Are
This joint notice describes the privacy policies of the Oppenheimer funds, OppenheimerFunds, Inc., each of its investment adviser subsidiaries, OppenheimerFunds Distributor, Inc. and OFI Global Trust Co. It applies to all Oppenheimer fund accounts you presently have, or may open in the future, using your Social Security number—whether or not you remain a shareholder of our funds. This notice was last updated March 2015. In the event it is updated or changed, we will post an updated notice on our website at oppenheimerfunds.com. If you have any questions about this privacy policy, write to us at P.O. Box 5270, Denver, CO 80217-5270, email us by clicking on the Contact Us section of our website at oppenheimerfunds.com or call us at 1.800.CALL OPP (225.5677).
67 OPPENHEIMER GLOBAL HIGH YIELD FUND
THIS PAGE INTENTIONALLY LEFT BLANK.
68 OPPENHEIMER GLOBAL HIGH YIELD FUND
THIS PAGE INTENTIONALLY LEFT BLANK.
69 OPPENHEIMER GLOBAL HIGH YIELD FUND
THIS PAGE INTENTIONALLY LEFT BLANK.
70 OPPENHEIMER GLOBAL HIGH YIELD FUND
THIS PAGE INTENTIONALLY LEFT BLANK.
71 OPPENHEIMER GLOBAL HIGH YIELD FUND

Item 2. Code of Ethics.
The registrant has adopted a code of ethics that applies to the registrant’s principal executive officer, principal financial officer, principal accounting officer or controller or persons performing similar functions.
Item 3. Audit Committee Financial Expert.
The Board of Trustees of the registrant has determined that F. William Marshall, Jr., the Chairman of the Board’s Audit Committee, is the audit committee financial expert and that Mr. Marshall is “independent” for purposes of this Item 3.
Item 4. Principal Accountant Fees and Services.
| (a) | Audit Fees |
The principal accountant for the audit of the registrant’s annual financial statements billed $28,800 in fiscal 2015 and $28,200 in fiscal 2014.
| (b) | Audit-Related Fees |
The principal accountant for the audit of the registrant’s annual financial statements billed no such fees in fiscal 2015 and $7,200 in fiscal 2014.
The principal accountant for the audit of the registrant’s annual financial statements billed $1,061,442 in fiscal 2015 and $871,571 in fiscal 2014 to the registrant’s investment adviser or any entity controlling, controlled by, or under common control with the adviser that provides ongoing services to the registrant.
Such services include: Internal control reviews, GIPS attestation procedures, system conversion testing, and corporate restructuring.
| (c) | Tax Fees |
The principal accountant for the audit of the registrant’s annual financial statements billed no such fees in fiscal 2015 and no such fees in fiscal 2014.
The principal accountant for the audit of the registrant’s annual financial statements billed $559,556 in fiscal 2015 and $386,917 in fiscal 2014 to the registrant’s investment adviser or any entity controlling, controlled by, or under common control with the adviser that provides ongoing services to the registrant.
Such services include: tax compliance, tax planning and tax advice. Tax compliance generally involves preparation of original and amended tax returns, claims for a refund and tax payment-planning services. Tax planning and tax advice includes assistance with tax audits and appeals, tax advice related to mergers and acquisitions and requests for rulings or technical advice from taxing authorities.
| (d) | All Other Fees |
The principal accountant for the audit of the registrant’s annual financial statements billed no such fees in fiscal 2015 and no such fees in fiscal 2014.
The principal accountant for the audit of the registrant’s annual financial statements billed no such fees in fiscal 2015 and no such fees in fiscal 2014 to the registrant’s investment adviser or any entity controlling, controlled by, or under common control with the adviser that provides ongoing services to the registrant.
Such fees would include the cost to the principal accountant of attending audit committee meetings and consultations regarding the registrant’s retirement plan with respect to its Trustees.
| (e) | (1) During its regularly scheduled periodic meetings, the registrant’s audit committee will pre-approve all audit, audit-related, tax and other services to be provided by the principal accountants of the registrant. |
The audit committee has delegated pre-approval authority to its Chairman for any subsequent new engagements that arise between regularly scheduled meeting dates provided that any fees such pre-approved are presented to the audit committee at its next regularly scheduled meeting.
Under applicable laws, pre-approval of non-audit services may be waived provided that: 1) the aggregate amount of all such services provided constitutes no more than five percent of the total amount of fees paid by the registrant to its principal accountant during the fiscal year in which services are provided 2) such services were not recognized by the registrant at the time of engagement as non-audit services and 3) such services are promptly brought to the attention of the audit committee of the registrant and approved prior to the completion of the audit.
(2) 0%
| (f) | Not applicable as less than 50%. |
| (g) | The principal accountant for the audit of the registrant’s annual financial statements billed $1,620,998 in fiscal 2015 and $1,265,688 in fiscal 2014 to the registrant and the registrant’s investment adviser or any entity controlling, controlled by, or under common control with the adviser that provides ongoing services to the registrant related to non-audit fees. Those billings did not include any prohibited non-audit services as defined by the Securities Exchange Act of 1934. |
| (h) | The registrant’s audit committee of the board of Trustees has considered whether the provision of non-audit services that were rendered to the registrant’s investment adviser, and any entity controlling, controlled by, or under common control with the investment adviser that provides ongoing services to the registrant that were not pre-approved pursuant to paragraph (c)(7)(ii) of Rule 2-01 of Regulation S-X is compatible with maintaining the principal accountant’s independence. No such services were rendered. |
Item 5. Audit Committee of Listed Registrants
Not applicable.
Item 6. Schedule of Investments.
a) Not applicable. The complete schedule of investments is included in Item 1 of this Form N-CSR.
b) Not applicable.
Item 7. Disclosure of Proxy Voting Policies and Procedures for Closed-End Management Investment Companies.
Not applicable.
Item 8. Portfolio Managers of Closed-End Management Investment Companies.
Not applicable.
Item 9. Purchases of Equity Securities by Closed-End Management Investment Company and Affiliated Purchasers.
Not applicable.
Item 10. Submission of Matters to a Vote of Security Holders.
The Fund’s Governance Committee Provisions with Respect to Nominations of Directors/Trustees to the Respective Boards
None
Item 11. Controls and Procedures.
Based on their evaluation of the registrant’s disclosure controls and procedures (as defined in rule 30a-3(c) under the Investment Company Act of 1940 (17 CFR 270.30a-3(c)) as of 5/29/2015, the registrant’s principal executive officer and principal financial officer found the registrant’s disclosure controls and procedures to provide reasonable assurances that information required to be disclosed by the registrant in the reports that it files under the Securities Exchange Act of 1934 (a) is accumulated and communicated to registrant’s management, including its principal executive officer and principal financial officer, to allow timely decisions regarding required disclosure, and (b) is recorded, processed, summarized and reported, within the time periods specified in the rules and forms adopted by the U.S. Securities and Exchange Commission.
There have been no changes in the registrant’s internal controls over financial reporting that occurred during the registrant’s second fiscal quarter of the period covered by this report that have materially affected, or are reasonably likely to materially affect, the registrant’s internal control over financial reporting.
Item 12. Exhibits.
| (a) | (1) Exhibit attached hereto. |
(2) Exhibits attached hereto.
(3) Not applicable.
| (b) | Exhibit attached hereto. |
SIGNATURES
Pursuant to the requirements of the Securities Exchange Act of 1934 and the Investment Company Act of 1940, the registrant has duly caused this report to be signed on its behalf by the undersigned, thereunto duly authorized.
Oppenheimer Global High Yield Fund
| By: | /s/ Arthur P. Steinmetz | |
| Arthur P. Steinmetz | ||
| Principal Executive Officer | ||
| Date: | 7/9/2015 | |
Pursuant to the requirements of the Securities Exchange Act of 1934 and the Investment Company Act of 1940, this report has been signed below by the following persons on behalf of the registrant and in the capacities and on the dates indicated.
| By: | /s/ Arthur P. Steinmetz | |
| Arthur P. Steinmetz | ||
| Principal Executive Officer | ||
| Date: | 7/9/2015 | |
| By: | /s/ Brian W. Wixted | |
| Brian W. Wixted | ||
| Principal Financial Officer | ||
| Date: | 7/9/2015 | |