Exhibit 99.1

Shea Homes Reports New Home Sales and Active Selling Communities for the Two Months Ended February 28, 2015 and Other Business Information
Walnut, California, March 9, 2015
Shea Homes, one of America’s largest private homebuilders, today reported new home sales and active selling communities for the two months ended February 28, 2015 and other business information.
New Home Sales and Active Selling Communities for the Two Months Ended February 28, 2015
Home sales orders for the two months ended February 28, 2015 were 404, representing an increase of 34%, compared to 302 for the two months ended February 28, 2014. For January and February of 2015, we had an average of 64 active selling communities compared to 59 for the same period in 2014, representing an increase of 8%. Home sales per community per month were 3.2 for the two months ended February 28, 2015, compared to 2.6 for the two months ended February 28, 2014.
These preliminary home sales orders and active selling community results are unaudited, should not be considered indicative of results for the full quarter or year, and may be adjusted in our financial statements at and for the quarterly period ending March 31, 2015. Actual results may differ materially due to a number of factors, including those referred to in “Forward-Looking Statements” in this news release.
Competitive strengths
Profitable and scalable operating platform with industry leading financial performance
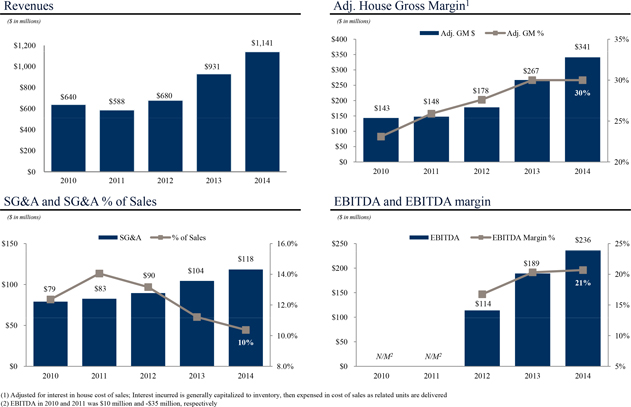
We have an established and scalable operating platform with a focus on operational efficiencies and profitability. The continued implementation and successful execution of our strategies, along with improvements in the U.S. housing market and attractive fundamentals in our markets, have resulted in significant positive operating momentum and profitability metrics that compare favorably to our peers. For the year ended December 31, 2014, we generated an Adjusted House Gross Margin*, excluding interest in cost of sales, of 30.4%, an EBITDA* margin of 20.7% and a pre-tax net income margin of 13.3%. We believe that when compared with the ten largest public U.S. homebuilders, we rank as one of the top three homebuilders across each of these metrics in 2014.
During the most recent downturn that persisted from 2006 through early 2012, we reduced headcount and operating costs through a restructuring of operations, redesigned product offerings and exited or reduced investments in certain geographic markets. We believe we have a low overhead structure and our leaner, more efficient operating structure will continue to enhance near-term and long-term profitability and enable us to effectively compete and operate through housing cycles.
Page 1
Strong presence in attractive housing markets
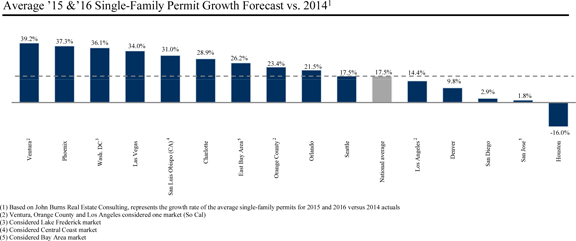
We currently operate in 13 markets, including 10 of the top 20 residential housing markets in the United States based on 2014 single family housing permits as measured by the United States Census Bureau. We believe that our geographic footprint positions us to continue to meaningfully capitalize on the broader national housing market recovery. We are highly disciplined in the selection of our markets, and we believe our land positions and our operations are concentrated in markets that benefit from attractive housing demand drivers including high population and employment growth, positive migration patterns, housing affordability and desirable lifestyle characteristics.
We have strong market share positions and considerable operating experience in the markets in which we compete, with top 10 positions in all of our core single-family markets of Northern California, Southern California, San Diego, Arizona and Colorado in 2014, according to First American Title, Orange County Business Journal, Market Point, RL Brown and The Genesis Group, respectively, and including top-one or top-two positions in San Diego, the Bay Area and Orange County. We believe that maintaining significant market share and being a top-tier builder in our markets enables us to achieve economies of scale as well as differentiate ourselves from most of our competitors, gain access to more attractive land opportunities and attract and retain highly-qualified employees and subcontractors.
Page 2
Strategic and well-located land supply at favorable basis
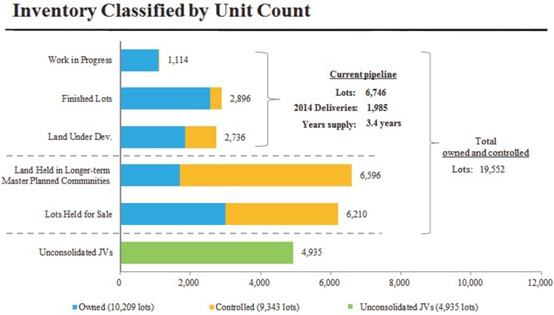
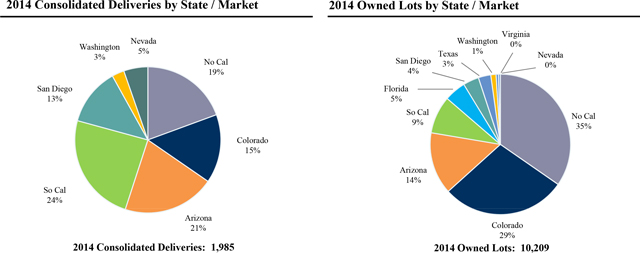
We believe we benefit from a sizeable, high quality and well-located land portfolio at an attractive basis. At December 31, 2014, we owned 10,209 lots, controlled 9,343 lots through option or purchase contract, and owned or controlled an additional 4,935 lots through unconsolidated joint ventures. We have a diverse mix of finished lots available for near-term homebuilding operations, longer-term strategic land positions to support future growth and lots that we intend to opportunistically monetize through sales to other homebuilders. Based on our current operating plans, we believe we own or control 100% of lots required for our projected 2015 deliveries and 98% of lots required for our projected 2016 deliveries. Our meaningful supply of owned and controlled lots positions us for growth and allows us to be selective and to maintain our discipline in identifying new land acquisition opportunities.
Page 3
Product, geographic and customer diversification
We offer a broad portfolio of products, including single-family detached and/or attached homes designed for and marketed to customer segments that include entry-level, move-up, luxury and active lifestyle buyers. We provide a variety of products differentiated by size, design, features and amenities at our traditional housing and active lifestyle developments in our 13 markets across nine states.
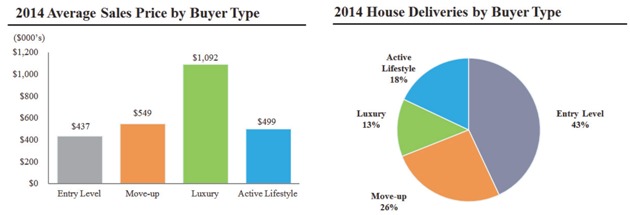
Within each homebuilding community, we utilize a product mix depending on market conditions, studies and opportunities. In determining our product mix in each community, we consider demographic trends, demand for a particular type of product, margins, timing and economic strength of the market. While remaining responsive to market opportunities, we have focused, and intend to continue to focus, our core homebuilding business primarily on entry-level and move-up buyers. For the year ended December 31, 2014, our product mix based upon unit deliveries was 43% entry-level, 39% move-up/luxury and 18% active lifestyle. While 43% of our 2014 deliveries were designed for entry-level buyers, the average selling price of our entry-level homes was $437,000 for the year ended December 31, 2014. Many of our entry-level homes contain a high number of amenities, particularly in California, and are located close to employment centers, which results in the relatively higher price compared to traditional entry-level homes. We believe that our product, geographic and customer diversification allows us to attract multiple customer segments and helps us mitigate the effects of local and regional economic fluctuations. We also believe that our breadth of development, design and construction expertise provides us with the flexibility to respond effectively to changes in consumer preferences and demographics.
Page 4
Customer-focused with a strong brand and a reputation for innovation
We believe we have an established and valuable brand, with a reputation for high quality construction, innovative design and strong customer service. We believe our reputation helps generate interest in each new project we undertake. We position ourselves as the “homebuilder who cares” and believe our approach enhances customer satisfaction, increases referrals and improves brand recognition.
Our overall product strategy is to build and sell homes that demonstrate quality craftsmanship and design and that fit varied budgets and lifestyles. Within each of our markets, we determine the market needs, and we design our communities and homes based on the predominant needs of such customer segments. We operate under four unique brands that showcase innovative home design concepts and reflect our value proposition: homes designed to meet the needs of our customers, with standard energy-efficient features, built in an environmentally-responsible manner. As an example of our innovative and contemporary approach, our newest design-driven brand, Shea3D, allows customers to choose from a variety of interchangeable floor plans, with the ability to reconfigure the core living space to suit multiple lifestyles centered on kitchen-centric design, spaces for entertaining, and indoor / outdoor living. Our SPACES brand, launched in 2009, generally attracts 25-40 year-old buyers with contemporary, practical homes that have flexible floor plans and stylish, energy efficient features at an affordable price point. Trilogy, our active lifestyle brand, has been recognized in 2015 for the third consecutive year as Lifestory Research’s America’s Most Trusted Active Adult Resort Homebuilder.
Deep and experienced management team
We benefit from a strong and experienced senior management team, with our executive officers and division presidents collectively averaging approximately 13 years with Shea and approximately 25 years of homebuilding industry experience. Bert Selva, our Chief Executive Officer, has been with Shea Homes since 1996 and has over 27 years of homebuilding industry experience. Andrew Parnes, our Chief Financial Officer, has been with Shea Homes since 2012 and has over 25 years of homebuilding industry experience, including serving as Executive Vice President and Chief Financial Officer of Standard Pacific Corp., a publicly traded homebuilder, for 19 years. Each division president brings substantial industry knowledge and local market expertise, having been an employee within the Shea Family Owned Companies for an average of more than 13 years. Our management team has guided us through various economic cycles, and we believe that its experience enables us to quickly identify, evaluate and capitalize on market opportunities, attract and retain new customers and adjust to changing national, regional and local business conditions.
Competitive scale and flexibility
We are one of the largest private homebuilders in America. Since our founding in 1968, we have delivered almost 94,000 homes under the Shea Homes brands. Our business model is flexible, as evidenced by our ability to grow and take advantage of good housing market conditions, and our subsequent right-sizing of the business during economic downturn. We believe this scale and flexibility allows us to appropriately and efficiently react to changing market conditions.
* See “Reconciliation of Non-GAAP Financial Measures” beginning on page 7
About Shea Homes Limited Partnership
Shea Homes is one of the largest private homebuilders in the nation. Since its founding in 1968, Shea Homes has delivered almost 94,000 homes. Shea Homes builds homes with quality craftsmanship and designs that fit varied lifestyles and budgets. Over the past several years, Shea Homes has been recognized as a leader in customer satisfaction with a reputation for design, quality and service. For more about Shea Homes and its communities, visitwww.sheahomes.com.
The preceding summary of the financial results of Shea Homes Limited Partnership and its subsidiaries does not purport to be complete and is qualified in its entirety by reference to the consolidated financial statements of Shea Homes Limited Partnership and its subsidiaries, available on our website at:http://www.sheahomes.com/investor.
Forward-Looking Statements
This news release contains forward-looking statements and information relating to Shea Homes Limited Partnership and its subsidiaries, which are based on the beliefs of, as well as assumptions made by, and information currently available to, our management.
Page 5
Words such as “anticipate,” “believe,” “estimate,” “expect,” “intend,” “plan,” “anticipate,” “appear” and “project” and similar expressions, as they relate to the Company and its subsidiaries are intended to identify forward-looking statements. These statements reflect the Company’s current views with respect to future events, are not guarantees of future performance and involve risks and uncertainties that are difficult to predict. Further, certain forward-looking statements are based upon assumptions of future events that may not prove to be accurate. Such statements involve known and unknown risks, uncertainties, assumptions and other factors many of which are out of the Company’s and its subsidiaries’ control and are difficult to forecast and that may cause actual results to differ materially from those that may be described or implied. Such factors include but are not limited to: changes in employment levels; changes in the availability of financing for homebuyers; changes in interest rates; changes in consumer confidence; changes in levels of new and existing homes for sale; changes in demographic trends; changes in housing demand; changes in home prices; elimination or reduction of the tax benefits associated with owning a home; litigation risks associated with home warranty and construction defect and other claims; and various other factors, both referenced and not referenced above, and included in the Company’s filings with the Securities and Exchange Commission, including the Company’s Annual Report on Form 10-K and Quarterly Reports on Form 10-Q. Should one or more of these risks or uncertainties materialize, or should underlying assumptions prove incorrect, actual results, performance or achievements may vary materially from those described as anticipated, believed, estimated, expected, intended, planned or projected. Except as required by law, the Company and its subsidiaries neither intend nor assume any obligation to revise or update these forward-looking statements, which speak only as of their dates. Shea Homes the Company and its subsidiaries nonetheless reserve the right to make such updates from time to time by news release, periodic report or other method of public disclosure without the need for specific reference to this news release. No such update shall be deemed to indicate that other statements not addressed by such update remain correct or create an obligation to provide any other updates.
Contact: Andrew Parnes, CFO @ 909-594-0954 orandy.parnes@sheahomes.com
Page 6
RECONCILIATION OF NON-GAAP FINANCIAL MEASURES
(dollars in thousands)
(unaudited)
The following table reconciles revenues, cost of sales and gross margins, as reported and prepared in accordance with GAAP, to the non-GAAP measures of house revenues and house cost of sales, to arrive at House Gross Margin, which excludes land sales, impairments and other transactions; and to adjusted house revenues and adjusted house cost of sales, to arrive at Adjusted House Gross Margin, which adds back interest in house cost of sales:
| | | | | | | | | | | | | | | | |
| | | Year Ended December 31, 2014 | |
| | | Revenues | | | Cost of
Sales | | | Gross
Margin $ | | | Gross
Margin % | |
| | | (Dollars in thousands) | |
Total | | $ | 1,140,606 | | | $ | (885,018 | ) | | $ | 255,588 | | | | 22.4 | % |
Less: Other | | | (581 | ) | | | — | | | | (581 | ) | | | — | |
| | | | | | | | | | | | | | | | |
Homebuilding | | | 1,140,025 | | | | (885,018 | ) | | | 255,007 | | | | 22.4 | % |
Less: Land | | | (14,028 | ) | | | 8,493 | | | | (5,535 | ) | | | 39.5 | % |
Less: Impairment | | | — | | | | 9,035 | | | | 9,035 | | | | — | |
Less: Other Homebuilding(a) | | | (5,978 | ) | | | 21,383 | | | | 15,405 | | | | — | |
| | | | | | | | | | | | | | | | |
House | | $ | 1,120,019 | | | $ | (846,107 | ) | | $ | 273,912 | | | | 24.5 | % |
| | | | | | | | | | | | | | | | |
Add: Interest in house cost of sales | | | — | | | | 66,951 | | | | 66,951 | | | | — | |
| | | | | | | | | | | | | | | | |
Adjusted House | | $ | 1,120,019 | | | $ | (779,156 | ) | | $ | 340,863 | | | | 30.4 | % |
| | | | | | | | | | | | | | | | |
| | | | | | | | | | | | | | | | |
| | | Year Ended December 31, 2013 | |
| | | Revenues | | | Cost of
Sales | | | Gross
Margin $ | | | Gross
Margin % | |
| | | (Dollars in thousands) | |
Total | | $ | 930,610 | | | $ | (709,412 | ) | | $ | 221,198 | | | | 23.8 | % |
Less: Other | | | (913 | ) | | | — | | | | (913 | ) | | | — | |
| | | | | | | | | | | | | | | | |
Homebuilding | | | 929,697 | | | | (709,412 | ) | | | 220,285 | | | | 23.7 | % |
Less: Land | | | (31,462 | ) | | | 17,726 | | | | (13,736 | ) | | | 43.7 | % |
Less: Impairment | | | — | | | | — | | | | — | | | | — | |
Less: Other Homebuilding(a) | | | (3,930 | ) | | | 5,209 | | | | 1,279 | | | | — | |
| | | | | | | | | | | | | | | | |
House | | $ | 894,305 | | | | (686,477 | ) | | | 207,828 | | | | 23.2 | % |
| | | | | | | | | | | | | | | | |
Add: Interest in house cost of sales | | | — | | | | 59,142 | | | | 59,142 | | | | — | |
| | | | | | | | | | | | | | | | |
Adjusted House | | $ | 894,305 | | | $ | (627,335 | ) | | $ | 266,970 | | | | 29.9 | % |
| | | | | | | | | | | | | | | | |
Page 7
| | | | | | | | | | | | | | | | |
| | | Year Ended December 31, 2012 | |
| | | Revenues | | | Cost of
Sales | | | Gross
Margin $ | | | Gross
Margin % | |
| | | (Dollars in thousands) | |
Total | | $ | 680,147 | | | $ | (538,434 | ) | | $ | 141,713 | | | | 20.8 | % |
Less: Other | | | (985 | ) | | | — | | | | (985 | ) | | | — | |
| | | | | | | | | | | | | | | | |
Homebuilding | | | 679,162 | | | | (538,434 | ) | | | 140,728 | | | | 20.7 | % |
Less: Land | | | (32,583 | ) | | | 18,797 | | | | (13,786 | ) | | | 42.3 | % |
Less: Impairment | | | — | | | | — | | | | — | | | | — | |
Less: Other Homebuilding(a) | | | (1,579 | ) | | | 4,730 | | | | 3,151 | | | | — | |
| | | | | | | | | | | | | | | | |
House | | $ | 645,000 | | | | (514,907 | ) | | | 130,093 | | | | 20.2 | % |
| | | | | | | | | | | | | | | | |
Add: Interest in house cost of sales | | | — | | | | 47,770 | | | | 47,770 | | | | — | |
| | | | | | | | | | | | | | | | |
Adjusted House | | $ | 645,000 | | | $ | (467,137 | ) | | $ | 177,863 | | | | 27.6 | % |
| | | | | | | | | | | | | | | | |
| |
| | | Year Ended December 31, 2011 | |
| | | Revenues | | | Cost of
Sales | | | Gross
Margin $ | | | Gross
Margin % | |
| | | (Dollars in thousands) | |
Total | | $ | 587,770 | | | $ | (515,578 | ) | | $ | 72,192 | | | | 12.3 | % |
Less: Other | | | (1,385 | ) | | | — | | | | (1,385 | ) | | | — | |
| | | | | | | | | | | | | | | | |
Homebuilding | | | 586,385 | | | | (515,578 | ) | | | 70,807 | | | | 12.1 | % |
Less: Land | | | (11,261 | ) | | | 8,861 | | | | (2,400 | ) | | | 21.3 | % |
Less: Impairment | | | — | | | | 30,600 | | | | 30,600 | | | | — | |
Less: Other Homebuilding(a) | | | (4,857 | ) | | | 8,802 | | | | 3,945 | | | | — | |
| | | | | | | | | | | | | | | | |
House | | $ | 570,267 | | | | (467,315 | ) | | | 102,952 | | | | 18.1 | % |
| | | | | | | | | | | | | | | | |
Add: Interest in house cost of sales | | | — | | | | 44,688 | | | | 44,688 | | | | — | |
| | | | | | | | | | | | | | | | |
Adjusted House | | $ | 570,267 | | | $ | (422,627 | ) | | $ | 147,640 | | | | 25.9 | % |
| | | | | | | | | | | | | | | | |
| |
| | | Year Ended December 31, 2010 | |
| | | Revenues | | | Cost of
Sales | | | Gross
Margin $ | | | Gross
Margin % | |
| | | (Dollars in thousands) | |
Total | | $ | 639,566 | | | $ | (609,097 | ) | | $ | 30,469 | | | | 4.8 | % |
Less: Other | | | (1,127 | ) | | | — | | | | (1,127 | ) | | | — | |
| | | | | | | | | | | | | | | | |
Homebuilding | | | 638,439 | | | | (609,097 | ) | | | 29,342 | | | | 4.6 | % |
Less: Land | | | (13,116 | ) | | | 7,544 | | | | (5,572 | ) | | | 42.5 | % |
Less: Impairment | | | — | | | | 72,629 | | | | 72,629 | | | | — | |
Less: Other Homebuilding(a) | | | (4,640 | ) | | | 4,827 | | | | 187 | | | | — | |
| | | | | | | | | | | | | | | | |
House | | $ | 620,683 | | | | (524,097 | ) | | | 96,586 | | | | 15.6 | % |
| | | | | | | | | | | | | | | | |
Add: Interest in house cost of sales | | | — | | | | 46,748 | | | | 46,748 | | | | — | |
| | | | | | | | | | | | | | | | |
Adjusted House | | $ | 620,683 | | | $ | (477,349 | ) | | $ | 143,334 | | | | 23.1 | % |
| | | | | | | | | | | | | | | | |
| (a) | Other homebuilding revenues primarily represent fees from unconsolidated joint ventures and managed entities in excess of our costs. Other homebuilding costs of sales primarily represent legal expenses related to completed operations claims. |
Page 8
RECONCILIATION OF NON-GAAP FINANCIAL MEASURES
(dollars in thousands)
(unaudited)
EBITDA is net income before (a) income taxes, (b) depreciation and amortization, (c) expensing of previously capitalized interest included in costs of sales and in equity in income (loss) from unconsolidated joint ventures and (d) interest expense. The following table presents a reconciliation of EBITDA to net income:
| | | | | | | | | | | | | | | | | | | | |
| | | Year Ended December 31, | |
| | | 2014 | | | 2013 | | | 2012 | | | 2011 | | | 2010 | |
| | | (Dollars in thousands) | |
EBITDA: | | | | | | | | | | | | | | | | | | | | |
Net income | | $ | 133,399 | | | $ | 125,939 | | | $ | 29,184 | | | $ | (107,242 | ) | | $ | (55,215 | ) |
Adjustments: | | | | | | | | | | | | | | | | | | | | |
Income tax (benefit) expense | | | 18,213 | | | | (14,101 | ) | | | 616 | | | | (3,069 | ) | | | (3,567 | ) |
Depreciation and amortization | | | 12,630 | | | | 10,608 | | | | 8,638 | | | | 11,296 | | | | 11,557 | |
Interest expense in cost of sales(a) | | | 68,780 | | | | 60,448 | | | | 54,733 | | | | 45,944 | | | | 48,332 | |
Interest expense in equity income (loss) from unconsolidated joint ventures(a) | | | 2,444 | | | | 1,189 | | | | 849 | | | | 1,619 | | | | 484 | |
Interest expense(a) | | | 595 | | | | 5,071 | | | | 19,862 | | | | 16,806 | | | | 8,558 | |
| | | | | | | | | | | | | | | | | | | | |
EBITDA | | $ | 236,061 | | | $ | 189,154 | | | $ | 113,882 | | | $ | (34,646 | ) | | $ | 10,149 | |
| | | | | | | | | | | | | | | | | | | | |
| (a) | Interest incurred is generally capitalized to inventory, then expensed in cost of sales as related units are delivered; or capitalized to investments in unconsolidated joint ventures and charged to equity in income (loss) over the useful life of the joint venture’s assets. Interest is also expensed when assets that qualify for interest capitalization no longer exceed debt. |
Page 9