united states
securities and exchange commission
washington, d.c. 20549
form n-csr
certified shareholder report of registered management
investment companies
Investment Company Act file number 811-22624
Arrow ETF Trust
(Exact name of registrant as specified in charter)
6100 Chevy Chase Drive Suite 100 Laurel, MD 20707
(Address of principal executive offices) (Zip code)
James Ash, Gemini Fund Services, LLC.
80 Arkay Drive, Suite 110, Hauppauge, NY 11788
(Name and address of agent for service)
Registrant's telephone number, including area code: 631-470-2619
Date of fiscal year end: 1/31
Date of reporting period: 1/31/16
Item 1. Reports to Stockholders.
 |
| |
| |
| |
| |
| |
| Arrow Dow Jones Global Yield ETF |
| |
| GYLD |
| |
| |
| |
| |
| |
| |
| |
| |
| |
| Annual Report |
| January 31, 2016 |
| |
| |
| |
| |
| |
| 1-877-277-6933 |
| 1-877-ARROW-FD |
| www.ArrowShares.com |
Dear Shareholder:
We are pleased to present this annual report for the Arrow Dow Jones Global Yield ETF (“GYLD” or “the Fund”) for the year ended January 31, 2016.
GYLD seeks investment results that correspond generally to the price and yield performance, before fees and expenses, of the Dow Jones Global Composite Yield Index.
The Fund’s portfolio is managed to closely replicate the holdings of the Dow Jones Global Composite Yield Index (DJGYLD, the “Index” or the “benchmark”) which sources its return and yield from equally weighted exposure to five sub-indexes. With 30 holdings in each of the five sub-index baskets, the composite Index is comprised of 150 total holdings. From time to time, the Fund holdings may not precisely replicate the composite Index due to factors including, but not limited to, the availability of the holdings, liquidity, currency denominations and other market factors. As of January 31, 2016, the Fund held 137 of the 150 composite Index constituents. 13 additional securities in the portfolio represent similar exposure to those of the benchmark, bringing the portfolio to a total of 152 holdings. Variance in holdings, time and cost of trade execution, management fees and other market factors may lead to portfolio tracking discrepancies from the benchmark. Over the past year, using weekly data, the Fund has tracked the composite Index’s performance with 98.6% correlation.
Management’s Discussion of Fund Performance
All Fund performance is based on net asset value (NAV) and assumes the reinvestment of distributions, without regard to individual taxes or withholdings. Index returns assume reinvestment of distributions, but do not include fees. Individual performance will vary due to a number of factors, including, but not limited to, trading commissions, bid/ask spreads, premium/discounts relative to the NAV, time of trading and other potential market factors—please refer to the Fund’s prospectus for more information.
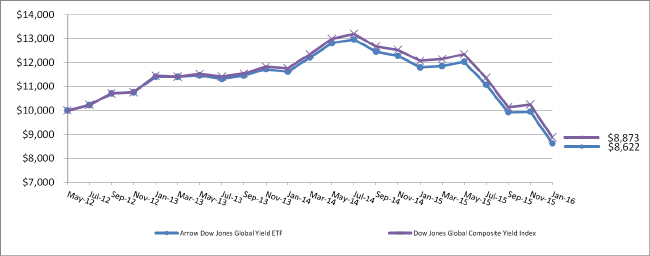
For the period February 1, 2015 through January 31, 2016, the one-year performance of GYLD (NAV) was -27.0% while the Dow Jones Global Composite Yield Index was down -26.6%. Since GYLD’s inception on May 8, 2012 (first trade date), the Fund has an annualized total return of -3.9% and the benchmark Index has returned -3.2%. With significant exposure to energy and high yield instruments, GYLD lagged some of the popular broad-based domestic markets. In general, domestic equity markets and domestic bonds were fairly flat for the year, with only slightly negative returns. For broad market domestic equity comparisons, the U.S. stock market, as represented by the S&P 500 Index, returned a small decline, down -0.7% for the year. The domestic bond market ended the one-year reporting period in a similar fashion, with the Barclay Aggregate Bond Index down -0.2%. Negative returns in the international markets were more pronounced, with the MSCI EAFE (USD Net) equity index losing -8.4% for the year. International bonds struggled as the Barclays Global Aggregate (ex/US) Bond Index returned -3.8% for the year.
For the period February 1, 2015 through January 31, 2016, all five of the category baskets had negative returns on a stand-alone basis. Falling energy prices and a lack of global growth explains the majority of the negative performance inside the portfolio. The effect of a strong U.S. dollar also played a negative role on international exposures. The Global Alternative basket had the largest negative impact on the portfolio as energy prices fell causing the MLP exposure to suffer. The energy markets also influenced the other baskets, with Global Equity and Global Corporate bonds providing significant negative returns to the portfolio. Global Real Estate exposure suffered from a fluctuating rate environment and a general lack of global economic growth. The Sovereign debt basket had the least negative impact with only a moderate decline, providing a somewhat more stable element to the composite portfolio. From an equity sector perspective, telecom consumer staples, consumer staples, and technology were in positive territory for the year. However, the positive returns were not enough
to offset the negative effect of the energy and materials sectors. The remaining sectors were negative as well, albeit moderate by comparison to energy and materials. For the fixed income portion, again, sovereign debt far outperformed global corporate bonds, yet both were negative for the one year period.
The Fund generally pays distributions monthly, or as needed if special distributions are required. As of the last distribution made during the reporting period on January 19, 2016 the Fund’s 30-day SEC yield was 6.85% and the 12-month distribution rate was 11.00%.
For more information about current performance, holdings, or historical premiums/discounts, please visit our website at www.arrowshares.com. We are grateful for your continued confidence in our company.
Sincerely,
 |
| |
| Joseph J. Barrato |
| Chief Executive Officer |
| Arrow Investment Advisors, LLC |
| February 2016 |
| |
| 1095-NLD-3/8/2016 |
Arrow Dow Jones Global Yield ETF
PORTFOLIO REVIEW (Unaudited)
January 31, 2016
The Fund’s performance figures* for the periods ended January 31, 2016, as compared to its benchmark:
| | | | Since Inception** - |
| | One Year | Three Years | January 31, 2016 |
| Arrow Dow Jones Global Yield ETF - NAV | (26.97)% | (8.90)% | (3.89)% |
| Arrow Dow Jones Global Yield ETF - Market Price | (28.60)% | (9.86)% | (4.79)% |
| Dow Jones Global Composite Yield Index *** | (26.51)% | (8.15)% | (3.16)% |
| * | The Fund’s past performance does not guarantee future results. The investment return and principal value of an investment in the Fund will fluctuate so that an investor’s shares, when redeemed, may be worth more or less than their original cost. Current performance of the Fund may be lower or higher than the performance quoted. Performance data current to the most recent month end may be obtained by visiting www.ArrowShares.com or by calling 1-877-277-6933. |
The Fund’s per share net asset value or “NAV” is the value of one share of the Fund as calculated in accordance with the standard formula for valuing mutual fund shares. The NAV return is based on the NAV of the Fund and the market return is based on the market price per share of the Fund. The price used to calculate market return (“Market Price”) is determined by using the midpoint between the highest bid and the lowest offer on the primary stock exchange on which shares of the Fund are listed for trading, as of the time that the Fund’s NAV is calculated. Since shares of the Fund did not trade in the secondary market until after the Fund’s inception, for the period from inception (5/2/2012) to the first day of secondary market trading shares of the Fund, the NAV of the Fund is used as a proxy for the Market Price to calculate market returns. Market and NAV returns assume that dividends and capital gain distributions have been reinvested in the Fund at Market Price and NAV, respectively.
| ** | Commencement of trading is May 8, 2012. |
| *** | The Dow Jones Global Composite Yield Index is constructed by equally weighting the five global high-yield index baskets, each of which is made up of 30 equally weighted components. |
Comparison of the Change in Value of a $10,000 Investment
The Fund’s Top Asset Classes are as follows:
| Asset Class | | % of Net Assets | |
| Energy | | | 27.4 | % |
| Financial | | | 23.0 | % |
| Government | | | 20.9 | % |
| Basic Materials | | | 6.6 | % |
| Utilities | | | 5.5 | % |
| Communications | | | 5.5 | % |
| Industrial | | | 3.7 | % |
| Consumer, Non-cyclical | | | 3.3 | % |
| Consumer, Cyclical | | | 1.8 | % |
| Technology | | | 0.7 | % |
| Diversified | | | 0.5 | % |
| Other, Cash & Cash Equivalents | | | 1.1 | % |
| | | | 100.0 | % |
Please refer to the Portfolio of Investments in this Annual report for a detailed analysis of the Fund’s holdings.
Arrow Dow Jones Global Yield ETF
PORTFOLIO OF INVESTMENTS
January 31, 2016
| Principal ($) | | | | | Value | |
| | | | | BONDS & NOTES - 40.6% | | | | |
| | | | | COSMETICS/PERSONAL CARE - 1.3% | | | | |
| | 778,000 | | | Avon Products, Inc., 6.350%, due 3/15/2020 | | $ | 575,720 | |
| | 864,000 | | | Avon Products, Inc., 6.750%, due 3/15/2023 | | | 555,120 | |
| | | | | | | | 1,130,840 | |
| | | | | ELECTRIC - 1.3% | | | | |
| | 719,000 | | | NRG Energy, Inc., 6.250%, due 5/1/2024 | | | 573,403 | |
| | 1,017,000 | | | Talen Energy Supply LLC, 4.600%, due 12/15/2021 | | | 584,775 | |
| | | | | | | | 1,158,178 | |
| | | | | FOREST PRODUCTS & PAPER - 0.6% | | | | |
| | 833,000 | | | Resolute Forest Products, Inc., 5.875%, due 5/15/2023 | | | 533,120 | |
| | | | | | | | | |
| | | | | INSURANCE - 0.5% | | | | |
| | 684,000 | | | Genworth Holdings, Inc., 7.625%, due 9/24/2021 | | | 468,540 | |
| | | | | | | | | |
| | | | | IRON & STEEL - 1.4% | | | | |
| | 745,000 | | | ArcelorMittal, 6.500%, due 3/1/2021 | | | 605,313 | |
| | 850,000 | | | Vale Overseas Ltd., 4.375%, due 1/11/2022 | | | 590,750 | |
| | | | | | | | 1,196,063 | |
| | | | | MINING - 2.2% | | | | |
| | 753,000 | | | AngloGold Ashanti Holdings PLC., 5.125%, due 8/1/2022 | | | 606,165 | |
| | 944,000 | | | Kinross Gold Corp., 5.950%, due 3/15/2024 | | | 585,280 | |
| | 1,279,000 | | | Teck Resources Ltd., 3.750%, due 2/1/2023 | | | 681,067 | |
| | | | | | | | 1,872,512 | |
| | | | | OIL & GAS - 9.0% | | | | |
| | 796,000 | | | Antero Resources Corp., 5.125%, due 12/1/2022 | | | 670,630 | |
| | 1,084,000 | | | Atwood Oceanics, Inc., 6.500%, due 2/1/2020 | | | 384,820 | |
| | 901,000 | | | Petrobras Global Finance BV., 3.406%, due 3/17/2020 + | | | 626,195 | |
| | 835,000 | | | Petrobras Global Finance BV., 4.875%, due 3/17/2020 | | | 629,381 | |
| | 866,000 | | | Petrobras Global Finance BV., 6.250%, due 3/17/2024 | | | 626,551 | |
| | 779,000 | | | Precision Drilling Corp., 6.625%, due 11/15/2020 | | | 537,510 | |
| | 859,000 | | | QEP Resources, Inc., 5.250%, due 5/1/2023 | | | 584,120 | |
| | 845,000 | | | Range Resources Corp., 5.000%, due 3/15/2023 | | | 659,100 | |
| | 825,000 | | | SM Energy Co., 6.125%, due 11/15/2022 | | | 474,375 | |
| | 945,000 | | | Transocean, Inc., 7.125%, due 12/15/2021 | | | 555,188 | |
| | 842,000 | | | Unit Corp., 6.625%, due 5/15/2021 | | | 547,300 | |
| | 214,000 | | | Whiting Petroleum Corp., 6.500%, due 10/1/2018 | | | 127,865 | |
| | 582,000 | | | Whiting Petroleum Corp., 5.000%, due 3/15/2019 | | | 377,936 | |
| | 882,000 | | | Whiting Petroleum Corp., 5.750%, due 3/15/2021 | | | 553,455 | |
| | 905,000 | | | WPX Energy, Inc., 5.250%, due 9/15/2024 | | | 493,225 | |
| | | | | | | | 7,847,651 | |
| | | | | PIPELINES - 3.4% | | | | |
| | 896,000 | | | Crestwood Midstream Finance Corp., 6.125%, due 3/1/2022 | | | 539,840 | |
| | 797,000 | | | Energy Transfer Equity LP., 5.875%, due 1/15/2024 | | | 621,660 | |
See accompanying notes to financial statements.
Arrow Dow Jones Global Yield ETF
PORTFOLIO OF INVESTMENTS (Continued)
January 31, 2016
| Principal ($) | | | | | Value | |
| | | | | PIPELINES (continued) - 3.4% | | | | |
| | 726,000 | | | Genesis Energy Finance Corp., 6.750%, due 8/1/2022 | | $ | 595,320 | |
| | 713,000 | | | ONEOK, Inc., 7.500%, due 9/1/2023 | | | 579,313 | |
| | 920,000 | | | The Williams Cos, Inc., 4.550% due 6/24/2024 | | | 602,997 | |
| | | | | | | | 2,939,130 | |
| | | | | SOVEREIGN - 20.9% | | | | |
| | 667,000 | | | Brazilian Government International Bond, 5.875%, due 1/15/2019 | | | 692,013 | |
| | 680,000 | | | Brazilian Government International Bond, 4.875%, due 1/22/2021 | | | 649,400 | |
| | 757,000 | | | Brazilian Government International Bond, 2.625%, due 1/5/2023 | | | 598,030 | |
| | 743,000 | | | Brazilian Government International Bond, 4.250%, due 1/7/2025 | | | 623,005 | |
| | 785,000 | | | Brazilian Government International Bond, 5.625%, due 1/7/2041 | | | 588,750 | |
| | 500,000 | | | Columbia Government International Bond, 7.375%, due 3/18/2019 | | | 556,250 | |
| | 560,000 | | | Columbia Government International Bond, 8.125%, due 5/21/2024 | | | 659,400 | |
| | 599,000 | | | Columbia Government International Bond, 6.125%, due 1/18/2041 | | | 557,070 | |
| | 498,000 | | | Hungary Government International Bond, 6.375%, due 3/29/2021 | | | 564,359 | |
| | 546,000 | | | Hungary Government International Bond, 5.375%, due 2/21/2023 | | | 596,887 | |
| | 472,000 | | | Hungary Government International Bond, 7.625%, due 3/29/2041 | | | 643,690 | |
| | 545,000 | | | Israel Government International Bond, 4.500%, due 1/30/2043 | | | 562,031 | |
| | 625,000 | | | Mexican Government International Bond, 3.625%, due 3/15/2022 | | | 628,125 | |
| | 593,000 | | | Mexican Government International Bond, 4.000%, due 10/2/2023 | | | 600,412 | |
| | 632,000 | | | Mexican Government International Bond, 4.750%, due 3/8/2044 | | | 571,960 | |
| | 399,000 | | | Panama Government International Bond, 7.125%, due 1/29/2026 | | | 492,765 | |
| | 505,000 | | | Panama Government International Bond, 8.875%, due 9/30/2027 | | | 701,950 | |
| | 544,000 | | | Peruvian Government International Bond, 7.350%, due 7/21/2025 | | | 682,720 | |
| | 539,000 | | | Peruvian Government International Bond, 4.125%, due 8/25/2027 | | | 532,263 | |
| | 577,000 | | | Poland Government International Bond, 4.000%, due 1/22/2024 | | | 603,499 | |
| | 608,000 | | | South Africa Government International Bond, 6.875%, due 5/27/2019 | | | 658,300 | |
| | 550,000 | | | South Africa Government International Bond, 5.500%, due 3/9/2020 | | | 569,663 | |
| | 749,000 | | | South Africa Government International Bond, 4.665%, due 1/17/2024 | | | 729,339 | |
| | 507,000 | | | South Africa Government International Bond, 5.875%, due 9/16/2025 | | | 528,734 | |
| | 637,000 | | | South Africa Government International Bond, 6.250%, due 3/8/2041 | | | 651,969 | |
| | 579,000 | | | Turkey Government International Bond, 7.000%, due 3/11/2019 | | | 634,358 | |
| | 300,000 | | | Turkey Government International Bond, 7.500%, due 11/7/2019 | | | 337,806 | |
| | 572,000 | | | Turkey Government International Bond, 5.625%, due 3/30/2021 | | | 608,551 | |
| | 891,000 | | | Turkey Government International Bond, 3.250%, due 3/23/2023 | | | 825,451 | |
| | 605,000 | | | Turkey Government International Bond, 6.000%, due 1/14/2041 | | | 625,041 | |
| | | | | | | | 18,273,791 | |
| | | | | | | | | |
| | | | | TOTAL BONDS & NOTES (Cost $40,586,680) | | | 35,419,825 | |
See accompanying notes to financial statements.
Arrow Dow Jones Global Yield ETF
PORTFOLIO OF INVESTMENTS (Continued)
January 31, 2016
| Shares | | | | | Value | |
| | | | | COMMON STOCKS - 39.8% | | | | |
| | | | | BANKS - 0.6% | | | | |
| | 28,329 | | | National Australia Bank Ltd. | | $ | 554,696 | |
| | | | | | | | | |
| | | | | BIOTECHNOLOGY - 0.6% | | | | |
| | 162,563 | | | PDL BioPharma, Inc. | | | 510,448 | |
| | | | | | | | | |
| | | | | CHEMICALS - 0.7% | | | | |
| | 612,607 | | | Synthos SA | | | 579,333 | |
| | | | | | | | | |
| | | | | COAL - 0.6% | | | | |
| | 1,473,343 | | | Indo Tambangraya Megah Tbk | | | 514,355 | |
| | | | | | | | | |
| | | | | COMMERCIAL SERVICES - 0.7% | | | | |
| | 41,637 | | | RR Donnelley & Sons Co. | | | 581,669 | |
| | | | | | | | | |
| | | | | ELECTRIC - 3.5% | | | | |
| | 36,652 | | | CEZ AS | | | 607,626 | |
| | 172,607 | | | EDP - Energias de Portugal SA | | | 600,920 | |
| | 34,373 | | | Engie | | | 546,631 | |
| | 40,500 | | | Fortum OYJ | | | 633,331 | |
| | 47,468 | | | RWE AG | | | 661,130 | |
| | | | | | | | 3,049,638 | |
| | | | | HOLDING COMPANIES - DIVERSIFIED - 0.5% | | | | |
| | 134,300 | | | Keppel Corp Ltd. | | | 473,545 | |
| | | | | | | | | |
| | | | | INSURANCE - 1.9% | | | | |
| | 66,149 | | | Lancashire Holdings Ltd. | | | 584,395 | |
| | 66,808 | | | Powszechny Zaklad Ubezpieczen SA | | | 529,331 | |
| | 6,202 | | | Swiss Re AG | | | 573,889 | |
| | | | | | | | 1,687,615 | |
| | | | | IRON/STEEL - 1.3% | | | | |
| | 249,497 | | | Kumba Iron Ore Ltd. | | | 545,683 | |
| | 53,552 | | | Russel Metals, Inc. | | | 596,462 | |
| | | | | | | | 1,142,145 | |
| | | | | LODGING - 0.7% | | | | |
| | 884,215 | | | SJM Holdings Ltd. | | | 578,475 | |
| | | | | | | | | |
| | | | | MACHINERY - DIVERSIFIED - 0.7% | | | | |
| | 26,096 | | | Turk Traktor ve Ziraat Makineleri AS | | | 639,530 | |
| | | | | | | | | |
| | | | | MEDIA - 0.6% | | | | |
| | 150,236 | | | Television Broadcasts Ltd. | | | 522,337 | |
| | | | | | | | | |
| | | | | OFFICE & BUSINESS EQUIPMENT - 0.7% | | | | |
| | 25,251 | | | Neopost SA | | | 602,552 | |
See accompanying notes to financial statements.
Arrow Dow Jones Global Yield ETF
PORTFOLIO OF INVESTMENTS (Continued)
January 31, 2016
| Shares | | | | | Value | |
| | | | | OIL & GAS - 1.3% | | | | |
| | 49,308 | | | Crescent Point Energy Corp. | | $ | 544,981 | |
| | 29,849 | | | Woodside Petroleum Ltd. | | | 590,587 | |
| | | | | | | | 1,135,568 | |
| | | | | REAL ESTATE - 1.9% | | | | |
| | 798,323 | | | Argosy Property Ltd. | | | 589,555 | |
| | 157,801 | | | Atrium European Real Estate Ltd. | | | 542,202 | |
| | 1 | | | The RMR Group, Inc. * | | | 18 | |
| | 1,938,756 | | | SA Corporate Real Estate Fund Nominees Pty Ltd. | | | 530,344 | |
| | | | | | | | 1,662,119 | |
| | | | | REAL ESTATE INVESTMENT TRUSTS (REITS) - 18.0% | | | | |
| | 63,488 | | | Artis Real Estate Investment Trust | | | 545,823 | |
| | 97,132 | | | Ashford Hospitality Trust | | | 540,054 | |
| | 10,124 | | | Befimmo SCA | | | 578,925 | |
| | 266,372 | | | BWP Trust | | | 578,894 | |
| | 1,520,000 | | | Cambridge Industrial Trust | | | 555,173 | |
| | 20,744 | | | Care Capital Properties, Inc. | | | 621,075 | |
| | 49,244 | | | CBL & Associates Properties, Inc. | | | 529,373 | |
| | 205,638 | | | Charter Hall Retail REIT | | | 598,297 | |
| | 5,703 | | | Cofinimmo NV/SA | | | 619,030 | |
| | 65,261 | | | Crombie Real Estate Investment Trust | | | 618,658 | |
| | 6,727 | | | Fonciere Des Regions | | | 570,021 | |
| | 61,691 | | | Franklin Street Properties Corp. | | | 602,104 | |
| | 671,400 | | | Frasers Commercial Trust | | | 547,042 | |
| | 733,494 | | | Goodman Property Trust | | | 596,323 | |
| | 41,111 | | | H&R Real Estate Investment Trust | | | 551,521 | |
| | 23,717 | | | Hospitality Properties Trust | | | 559,484 | |
| | 217,453 | | | Investa Office Fund | | | 600,347 | |
| | 674,842 | | | Kiwi Property Group Ltd. | | | 598,913 | |
| | 869,700 | | | Mapletree Logistics Trust | | | 574,221 | |
| | 30,632 | | | Mercialys SA | | | 624,545 | |
| | 1,712,715 | | | Prosperity REIT | | | 598,774 | |
| | 43,034 | | | Senior Housing Properties Trust | | | 623,132 | |
| | 1,142,400 | | | Starhill Global REIT | | | 589,776 | |
| | 574,200 | | | Suntec Real Estate Investment Trust | | | 637,238 | |
| | 12,902 | | | Vastned Retail NV | | | 562,691 | |
| | 10,782 | | | Wereldhave NV | | | 587,031 | |
| | 59,004 | | | WP Glimcher, Inc. | | | 535,756 | |
| | | | | | | | 15,744,221 | |
| | | | | RETAIL - 0.6% | | | | |
| | 175,800 | | | Lewis Group Ltd. | | | 481,562 | |
See accompanying notes to financial statements.
Arrow Dow Jones Global Yield ETF
PORTFOLIO OF INVESTMENTS (Continued)
January 31, 2016
| Shares | | | | | Value | |
| | | | | TELECOMMUNICATIONS - 4.9% | | | | |
| | 24,262 | | | CenturyLink, Inc. | | $ | 616,740 | |
| | 92,670 | | | Mobile TeleSystems SP - ADR | | | 648,690 | |
| | 350,080 | | | Orange SA | | | 555,778 | |
| | 268,799 | | | Spark New Zealand Ltd. | | | 585,070 | |
| | 159,222 | | | Telstra Corp., Ltd. | | | 634,576 | |
| | 328,008 | | | Turk Telekomunikasyon AS | | | 598,312 | |
| | 60,306 | | | VTech Holdings Ltd. | | | 603,820 | |
| | | | | | | | 4,242,986 | |
| | | | | | | | | |
| | | | | TOTAL COMMON STOCKS (Cost $45,108,706) | | | 34,702,794 | |
| | | | | | | | | |
| | | | | MASTER LIMITED PARTNERSHIPS - 18.5% | | | | |
| | | | | CHEMICALS - 0.5% | | | | |
| | 77,211 | | | CVR Partners LP | | | 420,028 | |
| | | | | | | | | |
| | | | | COAL - 2.4% | | | | |
| | 29,832 | | | Alliance Holdings GP LP | | | 528,921 | |
| | 204,608 | | | Foresight Energy LP | | | 398,986 | |
| | 517,891 | | | Natural Resource Partners LP | | | 600,754 | |
| | 83,656 | | | Suncoke Energy Partners LP | | | 602,323 | |
| | | | | | | | 2,130,984 | |
| | | | | COMMERCIAL SERVICES - 0.7% | | | | |
| | 22,011 | | | Stonemor Partners LP | | | 646,243 | |
| | | | | | | | | |
| | | | | GAS - 0.6% | | | | |
| | 34,875 | | | Global Partners LP | | | 561,836 | |
| | | | | | | | | |
| | | | | OIL & GAS - 8.4% | | | | |
| | 26,410 | | | Alon USA Partners LP | | | 509,449 | |
| | 678,736 | | | Atlas Resource Partners LP | | | 576,926 | |
| | 29,551 | | | Calumet Specialty Products Partners LP | | | 497,343 | |
| | 30,541 | | | CVR Refining LP | | | 497,207 | |
| | 243,985 | | | EV Energy Partners LP | | | 658,759 | |
| | 392,535 | | | Legacy Reserves LP | | | 514,221 | |
| | 224,887 | | | Memorial Production Partners LP | | | 613,942 | |
| | 23,139 | | | Northern Tier Energy LP | | | 594,672 | |
| | 228,379 | | | SandRidge Permian Trust | | | 621,191 | |
| | 156,804 | | | Seadrill Partners LLC | | | 506,477 | |
| | 24,363 | | | Suburban Propane Partners LP | | | 626,129 | |
| | 97,999 | | | Surgutneftegaz - ADR | | | 587,014 | |
| | 190,834 | | | Vanguard Natural Resources LLC | | | 505,710 | |
| | | | | | | | 7,309,040 | |
| | | | | OIL & GAS SERVICES - 0.6% | | | | |
| | 50,280 | | | Archrock Partners LP | | | 507,828 | |
See accompanying notes to financial statements.
Arrow Dow Jones Global Yield ETF
PORTFOLIO OF INVESTMENTS (Continued)
January 31, 2016
| Shares | | | | | Value | |
| | | | | PIPELINES - 1.8% | | | | |
| | 81,068 | | | American Midstream Partners LP | | $ | 661,515 | |
| | 28,888 | | | Crestwood Equity Partners LP | | | 368,611 | |
| | 15,438 | | | NuStar Energy LP | | | 500,654 | |
| | | | | | | | 1,530,780 | |
| | | | | RETAIL - 0.6% | | | | |
| | 34,732 | | | Ferrellgas Partners LP | | | 553,628 | |
| | | | | | | | | |
| | | | | TRANSPORTATION - 2.9% | | | | |
| | 111,676 | | | Capital Product Partners LP | | | 511,476 | |
| | 47,060 | | | Golar LNG Partners LP | | | 649,428 | |
| | 29,222 | | | Martin Midstream Partners LP | | | 510,216 | |
| | 198,567 | | | Navios Maritime Partners LP | | | 456,704 | |
| | 96,036 | | | Teekay Offshore Partners LP | | | 434,083 | |
| | | | | | | | 2,561,907 | |
| | | | | | | | | |
| | | | | TOTAL MASTER LIMITED PARTNERSHIPS (Cost $27,429,370) | | | 16,222,274 | |
| | | | | | | | | |
| | | | | TOTAL INVESTMENTS - 98.9% (Cost $113,124,756)(a) | | $ | 86,344,893 | |
| | | | | OTHER ASSETS LESS LIABILITIES - 1.1% | | | 965,452 | |
| | | | | NET ASSETS - 100.0% | | $ | 87,310,345 | |
| (a) | Represents cost for financial reporting purposes. Aggregate cost for Federal tax purposes is $124,810,573 and differs from value by net unrealized appreciation (depreciation) of securities as follows: |
| Unrealized Appreciation: | | $ | 1,367,510 | |
| Unrealized Depreciation: | | | (39,833,190 | ) |
| Net Unrealized Depreciation: | | $ | (38,465,680 | ) |
| + | Variable rate security; the rate shown represents the rate at January 31, 2016. |
| * | Non-income producing security. |
ADR - American Depositary Receipt
LLC - Limited Liability Corporation
REIT - Real Estate Investment Trust
See accompanying notes to financial statements.
Arrow Dow Jones Global Yield ETF
STATEMENT OF ASSETS AND LIABILITIES
January 31, 2016
| ASSETS | | | | |
| Investment securities: | | | | |
| At cost | | $ | 113,124,756 | |
| At value | | $ | 86,344,893 | |
| Cash | | | 929,317 | |
| Foreign cash (cost $883,992) | | | 863,263 | |
| Receivable for investments sold | | | 202,350 | |
| Dividends and interest receivable | | | 973,231 | |
| TOTAL ASSETS | | | 89,313,054 | |
| | | | | |
| LIABILITIES | | | | |
| Payable for investments purchased | | | 1,905,277 | |
| Payable for capital shares redeemed | | | 50,724 | |
| Investment advisory fees payable | | | 43,448 | |
| Accrued expenses and other liabilities | | | 3,260 | |
| TOTAL LIABILITIES | | | 2,002,709 | |
| NET ASSETS | | $ | 87,310,345 | |
| | | | | |
| Net Assets Consist Of: | | | | |
| Paid in capital | | $ | 165,114,292 | |
| Undistributed net investment income | | | 320,457 | |
| Accumulated net realized loss from investments and foreign currency transactions | | | (51,322,906 | ) |
| Net unrealized depreciation of investments and foreign currency translations | | | (26,801,498 | ) |
| NET ASSETS | | $ | 87,310,345 | |
| | | | | |
| Net Asset Value Per Share: | | | | |
| Net Assets | | $ | 87,310,345 | |
| Shares of beneficial interest outstanding ($0 par value, unlimited shares authorized) | | | 5,325,000 | |
| Net asset value (Net Assets ÷ Shares Outstanding) | | $ | 16.40 | |
See accompanying notes to financial statements.
Arrow Dow Jones Global Yield ETF
STATEMENT OF OPERATIONS
For the Year Ended January 31, 2016
| INVESTMENT INCOME | | | | |
| Dividends (net of foreign withholding tax of $396,824) | | $ | 9,323,476 | |
| Interest | | | 4,354,872 | |
| TOTAL INVESTMENT INCOME | | | 13,678,348 | |
| | | | | |
| EXPENSES | | | | |
| Investment advisory fees | | | 1,323,062 | |
| TOTAL EXPENSES | | | 1,323,062 | |
| NET INVESTMENT INCOME | | | 12,355,286 | |
| | | | | |
| REALIZED AND UNREALIZED GAIN (LOSS) ON INVESTMENTS AND FOREIGN CURRENCY | | | | |
| Net realized loss on: | | | | |
| In-kind redemptions | | | (2,384,945 | ) |
| Investments | | | (47,791,144 | ) |
| Foreign currency transactions | | | (132,899 | ) |
| | | | (50,308,988 | ) |
| Net change in unrealized appreciation (depreciation) on: | | | | |
| Investments | | | (13,467,407 | ) |
| Foreign currency translations | | | 10,470 | |
| | | | (13,456,937 | ) |
| NET REALIZED AND UNREALIZED LOSS ON INVESTMENTS AND FOREIGN CURRENCY | | | (63,765,925 | ) |
| | | | | |
| NET DECREASE IN NET ASSETS RESULTING FROM OPERATIONS | | $ | (51,410,639 | ) |
See accompanying notes to financial statements.
Arrow Dow Jones Global Yield ETF
STATEMENTS OF CHANGES IN NET ASSETS
| | | For the Year | | | For the Year | |
| | | Ended | | | Ended | |
| | | January 31, 2016 | | | January 31, 2015 | |
| FROM OPERATIONS | | | | | | | | |
| Net investment income | | $ | 12,355,286 | | | $ | 8,671,171 | |
| Net realized loss on investments and foreign currency transactions | | | (50,308,988 | ) | | | (3,959,133 | ) |
| Net change in unrealized depreciation on investments and foreign currency translations | | | (13,456,937 | ) | | | (9,890,218 | ) |
| Net decrease in net assets resulting from operations | | | (51,410,639 | ) | | | (5,178,180 | ) |
| | | | | | | | | |
| DISTRIBUTIONS TO SHAREHOLDERS | | | | | | | | |
| From net investment income | | | (10,722,166 | ) | | | (7,925,396 | ) |
| From return of capital | | | (3,319,252 | ) | | | (2,891,072 | ) |
| Net decrease in net assets resulting from distributions to shareholders | | | (14,041,418 | ) | | | (10,816,468 | ) |
| | | | | | | | | |
| FROM SHARES OF BENEFICIAL INTEREST | | | | | | | | |
| Proceeds from shares sold | | | 74,724,145 | | | | 119,574,123 | |
| Cost of shares redeemed | | | (82,320,467 | ) | | | (37,668,220 | ) |
| Net increase (decrease) in net assets resulting from shares of beneficial interest | | | (7,596,322 | ) | | | 81,905,903 | |
| | | | | | | | | |
| TOTAL INCREASE (DECREASE) IN NET ASSETS | | | (73,048,379 | ) | | | 65,911,255 | |
| | | | | | | | | |
| NET ASSETS | | | | | | | | |
| Beginning of Year | | | 160,358,724 | | | | 94,447,469 | |
| End of Year* | | $ | 87,310,345 | | | $ | 160,358,724 | |
| *Includes undistributed net investment income of: | | $ | 320,457 | | | $ | 634,094 | |
| | | | | | | | | |
| SHARE ACTIVITY | | | | | | | | |
| Shares sold | | | 3,000,000 | | | | 4,425,000 | |
| Shares redeemed | | | (4,275,000 | ) | | | (1,500,000 | ) |
| Net increase (decrease) in shares of beneficial interest outstanding | | | (1,275,000 | ) | | | 2,925,000 | |
See accompanying notes to financial statements.
Arrow Dow Jones Global Yield ETF
FINANCIAL HIGHLIGHTS
Per Share Data and Ratios for a Share of Beneficial Interest Outstanding Throughout each Period
| | | For the Year | | | For the Year | | | For the Year | | | For the Period | |
| | | Ended | | | Ended | | | Ended | | | Ended | |
| | | January 31, 2016 | | | January 31, 2015 | | | January 31, 2014 | | | January 31, 2013 (1) | |
| Net asset value, beginning of period | | $ | 24.30 | | | $ | 25.70 | | | $ | 26.79 | | | $ | 25.00 | |
| Activity from investment operations: | | | | | | | | | | | | | | | | |
| Net investment income (2) | | | 1.53 | | | | 1.52 | | | | 1.51 | | | | 1.02 | |
| Net realized and unrealized gain (loss) on investments and foreign currency | | | (7.71 | ) | | | (1.03 | ) | | | (1.00 | ) | | | 1.85 | |
| Total from investment operations | | | (6.18 | ) | | | 0.49 | | | | 0.51 | | | | 2.87 | |
| Less distributions from: | | | | | | | | | | | | | | | | |
| Net investment income | | | (1.25 | ) | | | (1.43 | ) | | | (1.23 | ) | | | (1.00 | ) |
| Net realized gains | | | — | | | | — | | | | — | | | | (0.08 | ) |
| Return of capital | | | (0.47 | ) | | | (0.46 | ) | | | (0.37 | ) | | | — | |
| Total distributions | | | (1.72 | ) | | | (1.89 | ) | | | (1.60 | ) | | | (1.08 | ) |
| Net asset value, end of period | | $ | 16.40 | | | $ | 24.30 | | | $ | 25.70 | (8) | | $ | 26.79 | (8) |
| Total return (6)(8) | | | (26.97 | )% | | | 1.57 | % | | | 1.94 | % | | | 11.87 | % (4)(7) |
| Net assets, at end of period (000s) | | $ | 87,310 | | | $ | 160,359 | | | $ | 94,447 | | | $ | 34,158 | |
| Ratio of gross expenses to average net assets | | | 0.75 | % | | | 0.75 | % | | | 0.75 | % | | | 0.90 | % (3) |
| Ratio of net expenses to average net assets | | | 0.75 | % | | | 0.75 | % | | | 0.75 | % | | | 0.75 | % (3) |
| Ratio of net investment income to average net assets | | | 6.97 | % | | | 5.73 | % | | | 5.78 | % | | | 5.42 | % (3) |
| Portfolio Turnover Rate (5) | | | 90 | % | | | 87 | % | | | 61 | % | | | 46 | % (4) |
| (1) | The Arrow Dow Jones Global Yield ETF shares commenced operations on May 2, 2012. |
| (2) | Per share amounts calculated using the average shares method, which more appropriately presents the per share data for each period. |
| (5) | Portfolio turnover rate excludes portfolio securities received or delivered as a result of processing capital share transactions in Creation Units. (Note 5) |
| (6) | Total return is calculated assuming a purchase of shares at net asset value on the first day and a sale at net asset value on the last day of the period. |
| (7) | Represents total return based on net asset values per share from commencement of investment operations on May 2, 2012 through January 31, 2013. Total return based on net asset values per share from commencement of trading on the NYSE Arca on May 8, 2012 to January 31, 2013 was 14.05%. |
| (8) | Includes adjustments in accordance with accounting principles generally accepted in the United States of America and, consequently, the net asset value for financial reporting purposes and the returns based upon those net asset values may differ from the net asset values and returns for shareholder transactions. |
See accompanying notes to financial statements.
ARROW DOW JONES GLOBAL YIELD ETF
NOTES TO FINANCIAL STATEMENTS
January 31, 2016
The Arrow Dow Jones Global Yield ETF (the “Fund”) is a diversified series of shares of beneficial interest of Arrow ETF Trust, (formerly Northern Lights ETF Trust) (the “Trust”), a statutory trust organized under the laws of the State of Delaware on August 29, 2011, and is registered under the Investment Company Act of 1940, as amended (the “1940 Act”), as an open-end management investment company. The Fund’s investment objective is to seek investment results that generally correspond (before fees and expenses) to the price and yield performance of the Dow Jones Global Yield Index (the “Index”). The investment objective is non-fundamental. The Fund commenced operation on May 2, 2012.
| 2. | SIGNIFICANT ACCOUNTING POLICIES |
The following is a summary of significant accounting policies followed by the Fund in preparation of its financial statements. These policies are in conformity with accounting principles generally accepted in the United States of America (“GAAP”). The preparation of financial statements requires management to make estimates and assumptions that affect the reported amounts of assets and liabilities and disclosure of contingent assets and liabilities at the date of the financial statements and the reported amounts of income and expenses for the period. Actual results could differ from those estimates. The Fund follows the specialized accounting and reporting requirements under GAAP that are applicable to investment companies.
Securities valuation – Securities listed on an exchange are valued at the last reported sale price at the close of the regular trading session of the exchange on the business day the value is being determined, or in the case of securities listed on NASDAQ at the NASDAQ Official Closing Price (“NOCP”). In the absence of a sale such securities shall be valued at the last bid price on the day of valuation. Debt securities (other than short-term obligations) are valued each day by an independent pricing service approved by the Board of Trustees (the “Board”) using methods which include current market quotations from a major market maker in the securities and based on methods which include the consideration of yields or prices of securities of comparable quality, coupon, maturity and type. Investments valued in currencies other than the U.S. dollar are converted to U.S. dollars using exchange rates obtained from pricing services. If market quotations are not readily available or if the Advisor believes the market quotations are not reflective of market value, securities will be valued at their fair value as determined in good faith by the Trust’s Fair Value Committee and in accordance with the Trust’s Portfolio Securities Valuation Procedures (the “Procedures”). The Board will review the fair value method in use for securities requiring a fair value determination at least quarterly. The Procedures consider, among others, the following factors to determine a security’s fair value: the nature and pricing history (if any) of the security; whether any dealer quotations for the security are available; and possible valuation methodologies that could be used to determine the fair value of the security. Fair value may also be used by the Board if extraordinary events occur after the close of the relevant world market but prior to the NYSE close. Short-term debt obligations having 60 days or less remaining until maturity, at time of purchase, may be valued at amortized cost.
ARROW DOW JONES GLOBAL YIELD ETF
NOTES TO FINANCIAL STATEMENTS (Continued)
January 31, 2016
The Fund utilizes various methods to measure the fair value of all of its investments on a recurring basis. GAAP establishes a hierarchy that prioritizes inputs to valuation methods. The three levels of input are:
Level 1 – Unadjusted quoted prices in active markets for identical assets and liabilities that the Fund has the ability to access.
Level 2 – Observable inputs other than quoted prices included in Level 1 that are observable for the asset or liability, either directly or indirectly. These inputs may include quoted prices for the identical instrument in an inactive market, prices for similar instruments, interest rates, prepayment speeds, credit risk, yield curves, default rates and similar data.
Level 3 – Unobservable inputs for the asset or liability, to the extent relevant observable inputs are not available, representing the Fund’s own assumptions about the assumptions a market participant would use in valuing the asset or liability, and would be based on the best information available.
The availability of observable inputs can vary from security to security and is affected by a wide variety of factors, including, for example, the type of security, whether the security is new and not yet established in the marketplace, the liquidity of markets, and other characteristics particular to the security. To the extent that valuation is based on models or inputs that are less observable or unobservable in the market, the determination of fair value requires more judgment. Accordingly, the degree of judgment exercised in determining fair value is greatest for instruments categorized in Level 3.
The inputs used to measure fair value may fall into different levels of the fair value hierarchy. In such cases, for disclosure purposes, the level in the fair value hierarchy within which the fair value measurement falls in its entirety, is determined based on the lowest level input that is significant to the fair value measurement in its entirety.
The inputs or methodology used for valuing securities are not necessarily an indication of the risk associated with investing in those securities. The following tables summarize the inputs used as of January 31, 2016 for the Fund’s assets measured at fair value:
Arrow Dow Jones Global Yield ETF
| Assets * | | Level 1 | | | Level 2 | | | Level 3 | | | Total | |
| Common Stocks | | $ | 34,702,794 | | | $ | — | | | $ | — | | | $ | 34,702,794 | |
| Master Limited Partnerships | | | 16,222,274 | | | | — | | | | — | | | | 16,222,274 | |
| Bonds & Notes | | | — | | | | 35,419,825 | | | | — | | | | 35,419,825 | |
| Total | | $ | 50,925,068 | | | $ | 35,419,825 | | | $ | — | | | $ | 86,344,893 | |
There were no transfers into or out of Level 1 and Level 2 during the current period presented. It is the Fund’s policy to record transfers into or out of Level 1 and Level 2 at the end of the reporting period.
The Fund did not hold any Level 3 securities during the period.
| * | See Portfolio of Investments for industry classification. |
ARROW DOW JONES GLOBAL YIELD ETF
NOTES TO FINANCIAL STATEMENTS (Continued)
January 31, 2016
Security transactions and related income – Security transactions are accounted for on trade date. Interest income is recognized on an accrual basis. Discounts are accreted and premiums are amortized on securities purchased over the lives of the respective securities. Dividend income is recorded on the ex-dividend date. Realized gains or losses from sales of securities are determined by comparing the identified cost of the security lot sold with the net sales proceeds.
Dividends and distributions to shareholders – Dividends from net investment income, if any, are declared and paid monthly. Distributable net realized capital gains, if any, are declared and distributed annually. Dividends from net investment income and distributions from net realized gains are determined in accordance with federal income tax regulations, which may differ from GAAP. These “book/tax” differences are considered either temporary (e.g., deferred losses) or permanent in nature. To the extent these differences are permanent in nature, such amounts are reclassified within the composition of net assets based on their federal tax-basis treatment; temporary differences do not require reclassification. Monthly distributions in excess of ordinary taxable income are treated as returns of capital. Dividends and distributions to shareholders are recorded on ex-dividend date.
Federal Income Taxes – The Fund intends to continue to comply with the requirements of the Internal Revenue Code applicable to regulated investment companies and to distribute all of its taxable income to its shareholders. Therefore, no provision for federal income tax is required. The Fund recognizes the tax benefits of uncertain tax positions only where the position is “more likely than not” to be sustained assuming examination by tax authorities. Management has analyzed the Fund’s tax positions, and has concluded that no liability for unrecognized tax benefits should be recorded related to uncertain tax positions taken in the Fund’s 2013 – 2015 tax returns or expected to be taken in the Fund’s 2016 tax returns. The Fund identified its major tax jurisdictions as U.S. Federal, Nebraska and foreign jurisdictions where the Fund makes significant investments. The Fund is not aware of any tax positions for which it is reasonably possible that the total amounts of unrecognized tax benefits will change materially in the next twelve months.
Foreign Currency – The accounting records of the Fund are maintained in U.S. dollars. Investment securities and other assets and liabilities denominated in a foreign currency, and income receipts and expense payments are translated into U.S. dollars using the prevailing exchange rate at the London market close. Purchases and sales of securities are translated into U.S. dollars at the contractual currency rates established at the approximate time of the trade. Net realized gains and losses on foreign currency transactions represent net gains and losses from currency realized between the trade and settlement dates on securities transactions, gains and losses on the purchase and sale of foreign currencies and the difference between income accrued versus income received. The effects of changes in foreign currency exchange rates on investments in securities are included with the net realized and unrealized gain or loss on investment securities.
Indemnification – The Trust indemnifies its officers and Trustees for certain liabilities that may arise from the performance of their duties to the Trust. Additionally, in the normal course of business, the Fund enters into contracts that contain a variety of representations and warranties and which provide general indemnities. The Fund’s maximum exposure under these arrangements is unknown, as this would involve future claims that may be made against the Fund that have not yet occurred. However,
ARROW DOW JONES GLOBAL YIELD ETF
NOTES TO FINANCIAL STATEMENTS (Continued)
January 31, 2016
based on experience, the risk of loss due to these warranties and indemnities appears to be remote.
| 3. | INVESTMENT TRANSACTIONS |
For the year ended January 31, 2016, cost of purchases and proceeds from sales of portfolio securities (excluding in-kind transactions and short-term investments), amounted to $154,309,334 and $169,484,428, respectively.
For the year ended January 31, 2016, cost of purchases and proceeds from sales of portfolio securities for in-kind transactions, amounted to $41,513,372 and $31,742,195, respectively.
| 4. | INVESTMENT ADVISORY AGREEMENT / TRANSACTIONS WITH RELATED PARTIES |
The business activities of the Fund are overseen by the Board, which is responsible for the overall management of the Fund. Arrow Investment Advisors, LLC serves as the Fund’s Investment Adviser (the “Adviser”) pursuant to an Investment Advisory Agreement with the Trust (the “Advisory Agreement”). The Trust has entered into a Global Custody Agreement with Brown Brothers Harriman & Co. to serve as Custodian and to act as transfer and shareholder services agent. The Trust has also entered into an Underwriting Agreement with Northern Lights Distributors, LLC to serve as the principal underwriter and distributor for the Trust.
Pursuant to the Advisory Agreement, the Adviser, under the oversight of the Board, directs the daily operations of the Fund and supervises the performance of administrative and professional services provided by others. As compensation for its services and the related expenses borne by the Adviser, the Fund pays the Adviser a unitary management fee, computed and accrued daily and paid monthly, at an annual rate of 0.75% of the Fund’s average daily net assets.
The Adviser’s unitary management fee is designed to pay the Fund’s expenses and to compensate the Adviser for providing service for the Fund. Out of the unitary management fee, the Adviser pays substantially all expenses of the Fund, including the costs of transfer agency, custody, fund administration, legal, audit and other services, acquired fund fees and expenses, and Independent Trustees’ fees, except for payments under each Fund’s 12b-1 plan, brokerage expenses, taxes, interest (including borrowing costs and dividend expenses on securities sold short), litigation expense and other extraordinary expenses (including litigation to which the Trust or the Fund may be a party and indemnification of the Trustees and officers with respect thereto). The Adviser, and not the Fund’s shareholders, would benefit from any reduction in fees paid for third-party services, including reductions based on increases in net assets. For the year ended January 31, 2016, the Independent Trustees received fees in the amount of $15,375.
The Trust, with respect to the Fund, has adopted a distribution and service plan (“Plan”) pursuant to Rule 12b-1 under the 1940 Act. Under the Plan, the Fund is authorized to pay distribution fees to the distributor and other firms that provide distribution and shareholder services (“Service Providers”). If a Service Provider provides these services, the Fund may pay fees at an annual rate not to exceed 0.25% of average daily net assets, pursuant to Rule 12b-1 under the 1940 Act.
ARROW DOW JONES GLOBAL YIELD ETF
NOTES TO FINANCIAL STATEMENTS (Continued)
January 31, 2016
No distribution or service fees are currently paid by the Fund and there are no current plans to impose these fees. In the event Rule 12b-1 fees were charged, over time they would increase the cost of an investment in the Fund.
| 5. | CAPITAL SHARE TRANSACTIONS |
Shares are not individually redeemable and may be redeemed by the Fund at NAV only in large blocks known as “Creation Units.” Shares are created and redeemed by the Fund only in Creation Unit size aggregations of 75,000 shares. Only Authorized Participants are permitted to purchase or redeem Creation Units from the Fund. An Authorized Participant is either (i) a broker-dealer or other participant in the clearing process through the Continuous Net Settlement System of the National Securities Clearing Corporation or (ii) a DTC participant and, in each case, must have executed a Participant Agreement with the Distributor. Such transactions are generally permitted on an in-kind basis, with a balancing cash component to equate the transaction to the NAV per share of the Fund on the transaction date. Cash may be substituted equivalent to the value of certain securities generally when they are not available in sufficient quantity for delivery, not eligible for trading by the Authorized Participant or as a result of other market circumstances. In addition, the Fund may impose transaction fees on purchases and redemptions of Fund shares to cover the custodial and other costs incurred by the Fund in effecting trades. A fixed fee payable to the Custodian may be imposed on each creation and redemption transaction regardless of the number of Creation Units involved in the transaction (“Fixed Fee”). Purchases and redemptions of Creation Units for cash or involving cash-in-lieu are required to pay an additional variable charge to compensate the Fund and its ongoing shareholders for brokerage and market impact expenses relating to Creation Unit transactions (“Variable Charge,” and together with the Fixed Fee, the “Transaction Fees”). Transactions in capital shares for the Fund are disclosed in the Statements of Changes in Net Assets.
The Transaction Fees for the Fund are listed in the table below:
| | Fixed Fee | Variable Charge |
| Fund | $3,170 | 2.00%* |
* The maximum Transaction Fee may be up to 2.00% of the amount invested.
| 6. | DISTRIBUTIONS TO SHAREHOLDERS AND TAX COMPONENTS OF CAPITAL |
The tax character of distributions paid during the following years was as follows:
| | | Fiscal Year Ended | | | Fiscal Year Ended | |
| | | January 31, 2016 | | | January 31, 2015 | |
| Ordinary Income | | $ | 10,722,166 | | | $ | 7,777,222 | |
| Long-Term Capital Gain | | | — | | | | 148,174 | |
| Return of Capital | | | 3,319,252 | | | | 2,891,072 | |
| | | $ | 14,041,418 | | | $ | 10,816,468 | |
ARROW DOW JONES GLOBAL YIELD ETF
NOTES TO FINANCIAL STATEMENTS (Continued)
January 31, 2016
As of January 31, 2016, the components of accumulated earnings/(deficit) on a tax basis were as follows:
| Undistributed | | | Undistributed | | | Capital Loss | | | Other | | | Post October Loss | | | Unrealized | | | Total | |
| Ordinary | | | Long-Term | | | Carry | | | Book/Tax | | | and | | | Appreciation/ | | | Accumulated | |
| Income | | | Gains | | | Forwards | | | Differences | | | Late Year Loss | | | (Depreciation) | | | Earnings/(Deficits) | |
| $ | — | | | $ | — | | | $ | (16,515,970 | ) | | $ | — | | | $ | (22,800,662 | ) | | $ | (38,487,315 | ) | | $ | (77,803,947 | ) |
The difference between book basis and tax basis unrealized depreciation, accumulated net investment income (loss) and accumulated net realized loss from investments and foreign currency transactions is primarily attributable to the tax deferral of losses on wash sales, mark-to-market on passive foreign investment companies, and tax adjustments for real estate investment trusts, partnerships and C-Corporation return of capital distributions.
Capital losses incurred after October 31 within the fiscal year are deemed to arise on the first business day of the following fiscal year for tax purposes. The Fund incurred and elected to defer such capital losses of $22,800,662.
At January 31, 2016, the Fund had capital loss carry forwards for federal income tax purposes available to offset future capital gains as follows:
| Non-Expiring | | | Non-Expiring | | | | |
| Short-Term | | | Long-Term | | | Total | |
| $ | 6,423,610 | | | $ | 10,092,360 | | | $ | 16,515,970 | |
Permanent book and tax differences, primarily attributable to the book/ tax basis treatment of foreign currency gains and tax adjustments for passive foreign investment companies, real estate investment trusts, royalty trusts, partnerships, realized gain (loss) on in-kind redemptions, and C-Corporation return of capital distributions, resulted in reclassification for the year ended January 31, 2016 as follows:
| Paid | | | Undistributed | | | Accumulated | |
| In | | | Net Investment | | | Net Realized Loss From Investments | |
| Capital | | | Income | | | And Foreign Currency Transactions | |
| $ | (3,011,331 | ) | | $ | (1,946,757 | ) | | $ | 4,958,088 | |
| 7. | NEW ACCOUNTING PRONOUNCEMENT |
In May 2015, the FASB issued Accounting Standards Update (“ASU”) No. 2015-07 “Disclosures for Investments in Certain Entities That Calculate Net Asset Value per Share (or Its Equivalent).” Investment companies are permitted to measure the fair value of certain privately offered investments using the NAV per share of the investment. Measuring the fair value of an investment this way is called using the NAV practical expedient. Prior to the amendments in ASU No. 2015-07, investments valued
ARROW DOW JONES GLOBAL YIELD ETF
NOTES TO FINANCIAL STATEMENTS (Continued)
January 31, 2016
using the NAV practical expedient were required to be categorized within the fair value hierarchy. The amendments in ASU No. 2015-07 remove the requirement to categorize within the fair value hierarchy investments measured using the NAV practical expedient. The ASU also removes certain disclosure requirements for investments that qualify, but do not utilize, the NAV practical expedient. The amendments in the ASU are effective for fiscal years beginning after December 15, 2015, and interim periods within those fiscal years. Early adoption is allowed. Management is currently evaluating the impact these changes will have on the Fund’s financial statements and related disclosures.
The Fund is required to recognize in the financial statements the effects of all subsequent events that provide additional evidence about conditions that existed at the date of the Statement of Assets and Liabilities. For non-recognized subsequent events that must be disclosed to keep the financial statement from being misleading, the Fund is required to disclose the nature of the event as well as an estimate of its financial effect, or a statement that such an estimate cannot be made. Subsequent events after the date of the Statement of Assets and Liabilities have been evaluated through the date the financial statements were issued.
Distributions: The Fund’s Board of Trustees declared the following distributions after January 31, 2016:
| Fund | Distribution Per Share | Record Date | Payable Date |
| Arrow Dow Jones Global Yield ETF | $0.1635 | 2/18/2016 | 2/23/2016 |
| Arrow Dow Jones Global Yield ETF | $0.1442 | 3/18/2016 | 3/23/2016 |
Management has determined that there were no other subsequent events to report through the issuance of these financial statements.

REPORT OF INDEPENDENT REGISTERED PUBLIC ACCOUNTING FIRM
To the Board of Trustees of Arrow ETF Trust
and the Shareholders of Arrow Dow Jones Global Yield ETF
We have audited the accompanying statement of assets and liabilities of the Arrow Dow Jones Global Yield ETF, a series of shares of beneficial interest in the Arrow ETF Trust, including the portfolio of investments, as of January 31, 2016, and the related statement of operations for the year then ended, the statements of changes in net assets for each of the years in the two-year period then ended and the financial highlights for each of the years in the three-year period then ended and for the period May 2, 2012 (commencement of operations) to January 31, 2013. These financial statements and financial highlights are the responsibility of the Fund’s management. Our responsibility is to express an opinion on these financial statements and financial highlights based on our audits.
We conducted our audits in accordance with the standards of the Public Company Accounting Oversight Board (United States). Those standards require that we plan and perform the audits to obtain reasonable assurance about whether the financial statements and financial highlights are free of material misstatement. An audit includes examining, on a test basis, evidence supporting the amounts and disclosures in the financial statements. Our procedures included confirmation of securities owned as of January 31, 2016 by correspondence with the custodian or by other appropriate auditing procedures where replies from brokers were not received. An audit also includes assessing the accounting principles used and significant estimates made by management, as well as evaluating the overall financial statement presentation. We believe that our audits provide a reasonable basis for our opinion.
In our opinion, the financial statements and financial highlights referred to above present fairly, in all material respects, the financial position of the Arrow Dow Jones Global Yield ETF as of January 31, 2016, and the results of its operations for the year then ended, the changes in its net assets for each of the years in the two-year period then ended and its financial highlights for each of the years in the three-year period then ended and for the period May 2, 2012 (commencement of operations) to January 2013, in conformity with accounting principles generally accepted in the United States of America.

BBD, LLP
Philadelphia, Pennsylvania
March 30, 2016
Arrow Dow Jones Global Yield ETF
EXPENSE EXAMPLES (Unaudited)
January 31, 2016
As a shareholder of the Fund, you incur two types of costs: (1) transaction costs, including brokerage commissions on purchases and sales of Fund shares; (2) ongoing costs, including a unitary management fee and other Fund expenses. This example is intended to help you understand your ongoing costs (in dollars) of investing in the Fund and to compare these costs with the ongoing costs of investing in other mutual funds.
The example is based on an investment of $1,000 invested at the beginning of the period and held for the entire period from August 1, 2015 through January 31, 2016.
Actual Expenses
The “Actual” expenses line in the table below provides information about actual account values and actual expenses. You may use the information below, together with the amount you invested, to estimate the expenses that you paid over the period. Simply divide your account value by $1,000 (for example, an $8,600 account value divided by $1,000 = 8.6), then multiply the result by the number in the table under the heading entitled “Expenses Paid During Period” to estimate the expenses you paid on your account during this period.
Hypothetical Example for Comparison Purposes
The “Hypothetical” line in the table below provides information about hypothetical account values and hypothetical expenses based on the Fund’s actual expense ratio and an assumed rate of return of 5% per year before expenses, which is not the Fund’s actual return. The hypothetical account values and expenses may not be used to estimate the actual ending account balances or expenses you paid for the period. You may use this information to compare this 5% hypothetical example with the 5% hypothetical examples that appear in the shareholder reports of other funds.
Please note that the expenses shown in the table are meant to highlight your ongoing costs only and do not reflect any transactional costs, such as brokerage commissions paid on purchases and sales of Fund shares. Therefore, the table is useful in comparing ongoing costs only, and will not help you determine the relative total costs of owning different funds. In addition, if these transactional costs were included, your costs would have been higher.
| | Beginning | Ending | Expenses Paid | Expense Ratio |
| | Account Value | Account Value | During Period* | During Period** |
| | 8/1/15 | 1/31/16 | 8/1/15 – 1/31/16 | 8/1/15 – 1/31/16 |
| Actual | $1,000.00 | $778.40 | $3.36 | 0.75% |
| | | | | |
| Hypothetical | | | | |
| (5% return before expenses) | $1,000.00 | $1,021.42 | $3.82 | 0.75% |
| * | Expenses are equal to the average account value over the period, multiplied by the Fund’s annualized expense ratio, multiplied by the number of days in the period (184) divided by the number of days in the fiscal year (365). |
Arrow Dow Jones Global Yield ETF
SUPPLEMENTAL INFORMATION (Unaudited)(Continued)
January 31, 2016
This chart provides information about the Trustees and Officers who oversee the Fund. Officers elected by the Trustees manage the day-to-day operations of the Fund and execute policies formulated by the Trustees. The following is a list of the Trustees and executive officers of the Trust and each person’s principal occupation over the last five years. The address of each Trustee and Officer is 6100 Chevy Chase Drive, Suite 100, Laurel, Maryland 20707, unless otherwise noted.
Independent Trustees
Name, Address
and Year of
Birth | Position(s)
Held with
Trust* | Term of
Office and
Length of
Time Served | Principal Occupation(s)
During the Past Five Years and Current
Directorships | Number of
Funds in the
Fund
Complex***
Overseen by
Trustee | Other
Directorships
held During
the Past Five
Years |
Charles A. Barragato
Year of Birth:
1958 | Trustee | Indefinite/
since March
2014 | Managing Partner, Charles A. Barragato & Co., LLP (public accounting firm) 1983-Present; Research Professor of Accounting, Stony Brook University, 2014-Present; Professor of Accounting, Long Island University, 1986-2014 | 8 | Arrow Investments Trust (since September 2011) |
Paul Montgomery
Year of Birth:
1953 | Trustee | Since
March 2014 | Director of Research Scotia Partners, LLC (since 2012) Managing Member, Theta Investment Research, LLC (2003-2012). | 8 | Arrow Investments Trust (since September 2011) |
Thomas T. Sarkany
Year of Birth:
1946 | Trustee | Since 2012 | Founder and President, TTS Consultants, LLC, 2010 – present | 8 | Arrow Investments Trust (since March 2014), Trustee, Northern Lights Fund Trust IV (since July 2015); Trustee, Northern Lights Fund Trust II (since October 2011); Director, Aquila Distributors since 1981. |
Robert S. Andrialis
Year of Birth:
1944 | Trustee | Since 2012 | Currently Independent Consultant; Formerly President, Secured Growth Quantitative Research, 2011–2014; Independent Consultant 2010-2011 | 8 | Arrow Investments Trust (since March 2014) |
Arrow Dow Jones Global Yield ETF
SUPPLEMENTAL INFORMATION (Unaudited)(Continued)
January 31, 2016
Interested Trustees and Officers
Name,
Address and
Year of Birth | Position(s)
Held with
Trust* | Term of
Office
and
Length
of Time
Served | Principal Occupation
During the Past Five Years and Current Directorships | Number of
Funds in
Fund
Complex***
Overseen
by Trustee | Other
Directorships
held by Trustee
During the Past
Five Years |
Joseph Barrato**
Year of Birth:
1965 | Trustee,
President
& Principal
Executive
Officer | Indefinite
since
Sept.
2011 | Founder and Chief Executive Officer, Arrow Investment Advisor, LLC (registered investment adviser), 2006-present. | 8 | Arrow Investments Trust (since September 2011) |
Sam Singh
Year of Birth:
1976 | Principal
Financial
Officer and
Treasurer | Since Oct
2013 | Vice President, GFS (since January 2015); Assistant Vice President, GFS (2011-2014); Vice President of Fund Administration; BNY Mellon (2007-2011) | N/A | N/A |
Jake Griffith
Year of Birth:
1978 | Secretary | Since
Sept.
2011 | Founder and President, Director of Sales, Arrow (since 2006). | N/A | N/A |
Dawn M. Dennis
Year of Birth:
1966 | Assistant
Secretary | Since
2014 | Senior Paralegal, GFS (since May 2013), Paralegal (from July 2011 through April 2013) | N/A | N/A |
Patrick Bassett
Year Birth:1970 | Chief Compliance
Officer | 1 Year
Term
Since
June
2015 | Chief Compliance Officer of Arrow Investment Advisors, LLC (2008-2014); retired (2014-2015). | N/A | N/A |
| * | The term of office for each Trustee and officer listed above will continue indefinitely until the individual resigns or is removed. |
| ** | Joseph Barrato is considered to be an “interested person” of the Arrow Investment Trust, as that term is defined in the 1940 Act, because he is a controlling interest holder of the investment Advisor to the Fund, Arrow Investment Advisors, LLC. |
| *** | The term “Fund Complex” includes the Arrow ETF Trust (“ARROWETF”) and Arrow Investments Trust. |
The Fund’s Statement of Additional Information includes additional information about the Trustees and is available free of charge, upon request, by calling toll-free at 1-877-277-6933.
Arrow Dow Jones Global Yield ETF
SUPPLEMENTAL INFORMATION (Unaudited)
January 31, 2016
Renewal of the Investment Advisory Agreement between Arrow ETF Trust and Arrow Investment Advisors, LLC
At an in person meeting held September 1, 2015, the Board of Trustees (the “Board” or the “Trustees”) including the Trustees who are not “interested persons”, as such term is defined under Section 2(a)(19) of the Investment Company Act of 1940, as amended (the “Independent Trustees”), considered the renewal of the investment advisory agreement (the “Advisory Agreement”) between the Arrow ETF Trust (the “ETF Trust”) and Arrow Investment Advisors, LLC (the “Advisor”), with respect to the Arrow Dow Jones Global Yield ETF (“DJ ETF”). In its consideration of the Advisory Agreement did not identify any single factor as all-important or controlling, and the following summary does not detail all the matters considered.
Nature, Extent and Quality of Services. The Board examined the nature, extent and quality of the services provided by the Advisor to the ETF Trust. The Trustees discussed the change in personnel in the Advisor and the change in its chief compliance officer. During deliberations, they noted that there was strong communication between the Advisor and the Board. They discussed the recent SEC examination of the Advisor, stating that the results were generally positive. It was noted that there were no material compliance issues since the last renewal and that the Advisor continued to expand its relationships with registered investment Advisors and broker dealers to benefit shareholders. The Trustees noted that the Advisor had reported no litigation or administrative actions during the last 12 months. It was the consensus of the Trustees that they were satisfied with the nature, extent and quality of the services provided to the Fund under the Advisory Agreement.
Fees and Expenses. The Trustees reviewed information regarding the advisory fee noting that the Advisor charges 0.75% for advisory services, which compares favorably to the peer group average of 0.76%, and appears reasonable compared to the Morningstar average fee of 0.60%. They also discussed that, because the Advisor pays nearly all expenses of the Fund, the Fund’s total fees are highly competitive. The Board concluded that the advisory fee is reasonable.
Performance. The Board considered the Advisor’s past performance in connection with the Fund. The Board compared the Fund’s performance to the funds in the Advisor selected peer group. They noted that the Fund had a total return of (0.71)% for the year-to-date period ended June 30, 2015, as compared to the average total return of 0.20% for all funds in the peer group, (1.82)% for all ETFs in the peer group and 1.20% for all mutual funds in the peer group. The Board further noted that the Fund had since inception returns of 4.71% for the 12-month period ended June 30, 2015, as compared to the average yield of 5.16% for all funds in the peer group, 3.87% for all ETFs in the peer group and 5.48% for all mutual funds in the peer group. The Trustees concluded that they were pleased with the Fund’s performance.
Economies of Scale. The Board considered whether there are economies of scale with respect to the management of the Fund and whether there is potential for realization of any further economies of scale. They reviewed the Advisor’s projections for asset growth for the Fund. The Advisor stated that the constraints on the Fund’s growth are similar to other ETF’s.
Profitability. The Board reviewed the Advisor’s estimated profits from its service to GYLD, which was provided in the Board materials. The Board materials also contained the Advisor’s
Arrow Dow Jones Global Yield ETF
SUPPLEMENTAL INFORMATION (Unaudited)(Continued)
January 31, 2016
Consolidated Financial Statements, and the Trustees discussed the Advisor’s financial condition. The Trustees concluded that the modest profits were reasonable.
Conclusion. Having requested and received such information from the Advisor as the Trustees believed to be reasonably necessary to evaluate the terms of the Advisory Agreement, and as assisted by the advice of Counsel, the Trustees concluded that the fee structure is reasonable and that renewal of the Advisory Agreement is in the best interests of the future shareholders of the Fund.
PRIVACY NOTICE
| FACTS | WHAT DOES ARROW ETF TRUST DO WITH YOUR PERSONAL INFORMATION? |
| | |
| Why? | Financial companies choose how they share your personal information. Federal law gives consumers the right to limit some but not all sharing. Federal law also requires us to tell you how we collect, share, and protect your personal information. Please read this notice carefully to understand what we do. |
| | |
| What? | The types of personal information we collect and share depend on the product or service you have with us. This information can include: |
| | ■ Social Security number ■ Assets ■ Retirement Assets ■ Transaction History ■ Checking Account Information | ■ Purchase History ■ Account Balances ■ Account Transactions ■ Wire Transfer Instructions |
| | |
| | When you are no longer our customer, we continue to share your information as described in this notice. |
| | |
| How? | All financial companies need to share customers’ personal information to run their everyday business. In the section below, we list the reasons financial companies can share their customers’ personal information; the reasons Arrow ETF Trust chooses to share; and whether you can limit this sharing. |
| Reasons we can share your personal information | Does Arrow ETF
Trust share? | Can you limit this sharing? |
For our everyday business purposes – such as to process your transactions, maintain your account(s), respond to court orders and legal investigations, or report to credit bureaus | Yes | No |
For our marketing purposes – to offer our products and services to you | No | We don’t share |
| For joint marketing with other financial companies | No | We don’t share |
For our affiliates’ everyday business purposes – information about your transactions and experiences | No | We don’t share |
For our affiliates’ everyday business purposes – information about your creditworthiness | No | We don’t share |
| For nonaffiliates to market to you | No | We don’t share |
| Questions? | Call 1-877-277-6933 |
| Who we are |
| Who is providing this notice? | Arrow ETF Trust |
| What we do |
| How does Arrow ETF Trust protect my personal information? | To protect your personal information from unauthorized access and use, we use security measures that comply with federal law. These measures include computer safeguards and secured files and buildings. Our service providers are held accountable for adhering to strict policies and procedures to prevent any misuse of your nonpublic personal information. |
| How does Arrow ETF Trust collect my personal information? | We collect your personal information, for example, when you ■ Open an account ■ Provide account information ■ Give us your contact information ■ Make deposits or withdrawals from your account ■ Make a wire transfer ■ Tell us where to send the money ■ Tells us who receives the money ■ Show your government-issued ID ■ Show your driver’s license We also collect your personal information from other companies. |
| Why can’t I limit all sharing? | Federal law gives you the right to limit only ■ Sharing for affiliates’ everyday business purposes – information about your creditworthiness ■ Affiliates from using your information to market to you ■ Sharing for nonaffiliates to market to you State laws and individual companies may give you additional rights to limit sharing. |
| Definitions |
| Affiliates | Companies related by common ownership or control. They can be financial and nonfinancial companies. ■ Arrow ETF Trust does not share with our affiliates. |
| Nonaffiliates | Companies not related by common ownership or control. They can be financial and nonfinancial companies ■ Arrow ETF Trust does not share with nonaffiliates so they can market to you. |
| Joint marketing | A formal agreement between nonaffiliated financial companies that together market financial products or services to you. ■ Arrow ETF Trust does not jointly market. |
PROXY VOTING POLICY
Information regarding how the Fund voted proxies relating to portfolio securities for the most recent twelve-month period ended June 30 as well as a description of the policies and procedures that the Fund uses to determine how to vote proxies is available without charge, upon request, by calling 1-877-277-6933 or by referring to the Securities and Exchange Commission’s (“SEC”) website at http://www.sec.gov.
PORTFOLIO HOLDINGS
The Fund files its complete schedules of portfolio holdings with the SEC for the first and third quarters of each fiscal year on Form N-Q. Form N-Q is available on the SEC’s website at http://www.sec.gov and may be reviewed and copied at the SEC’s Public Reference Room in Washington, DC (1-800-SEC-0330). The information on Form N-Q is available without charge, upon request, by calling 1-877-277-6933.
| |
| INVESTMENT ADVISOR |
| Arrow Investment Advisors, LLC |
| 6100 Chevy Chase Drive |
| Suite 100 |
| Laurel, MD 20707 |
| |
| ADMINISTRATOR |
| Gemini Fund Services, LLC |
| 80 Arkay Drive, Suite 110 |
| Hauppauge, NY 11788 |
Item 2. Code of Ethics.
(a) As of the end of the period covered by this report, the registrant has adopted a code of ethics that applies to the registrant's principal executive officer, principal financial officer, principal accounting officer or controller, or persons performing similar functions, regardless of whether these individuals are employed by the registrant or a third party.
(b) For purposes of this item, “code of ethics” means written standards that are reasonably designed to deter wrongdoing and to promote:
(1) Honest and ethical conduct, including the ethical handling of actual or apparent conflicts of interest between personal and professional relationships;
(2) Full, fair, accurate, timely, and understandable disclosure in reports and documents that a registrant files with, or submits to, the Commission and in other public communications made by the registrant;
(3) Compliance with applicable governmental laws, rules, and regulations;
(4) The prompt internal reporting of violations of the code to an appropriate person or persons identified in the code; and
(5) Accountability for adherence to the code.
(c) Amendments: During the period covered by the report, there have not been any amendments to the provisions of the code of ethics.
(d) Waivers: During the period covered by the report, the registrant has not granted any express or implicit waivers from the provisions of the code of ethics.
(e) The Code of Ethics is not posted on Registrant’ website.
(f) A copy of the Code of Ethics is attached as an exhibit.
Item 3. Audit Committee Financial Expert.
(a)(1)ii The Registrant’s board of trustees has determined that Robert S. Andrialis is an audit committee financial expert, as defined in Item 3 of Form N-CSR. Mr. Andrialis is independent for purposes of this Item 3.
(a)(2) Not applicable.
(a)(3) In this regard, no member of the audit committee was identified as having all of the required technical attributes identified in instruction 2 (b) to item 3 of Form N-CSR to qualify as an “audit committee financial expert,” whether through the type of specialized education or experience required by that instruction. At this time, the board believes the experience provided by each member of the audit committee collectively offers the fund adequate oversight by its audit committee given the fund’s level of financial complexity. The board will from time to time reexamine such belief.
Item 4. Principal Accountant Fees and Services.
2015 - $13,500
2014 - $ 11,400
2015 – None
2014 – None
2015 - $ 2,500
2014 - $ 2,000
Preparation of Federal & State income tax returns, assistance with calculation of required income, capital gain and excise distributions and preparation of Federal excise tax returns.
2015 – None
2014 – None
(e) (1) Audit Committee’s Pre-Approval Policies
| | The registrant’s Audit Committee is required to pre-approve all audit services and, when appropriate, any non-audit services (including audit-related, tax and all other services) to the registrant. The registrant’s Audit Committee also is required to pre-approve, when appropriate, any non-audit services (including audit-related, tax and all other services) to its adviser, or any entity controlling, controlled by or under common control with the adviser that provides ongoing services to the registrant, to the extent that the services may be determined to have an impact on the operations or financial reporting of the registrant. Services are reviewed on an engagement by engagement basis by the Audit Committee. |
| (2) | Percentages of Services Approved by the Audit Committee |
| | 2015 | 2014 |
| Audit-Related Fees: | 0.00% | 0.00% |
| Tax Fees: | 0.00% | 0.00% |
| All Other Fees: | 0.00% | 0.00% |
| (f) | During the audit of registrant's financial statements for the most recent fiscal year, less than 50 percent of the hours expended on the principal accountant's engagement were attributed to work performed by persons other than the principal accountant's full-time, permanent employees. |
| (g) | The aggregate non-audit fees billed by the registrant's accountant for services rendered to the registrant, and rendered to the registrant's investment adviser (not including any sub-adviser whose role is primarily portfolio management and is subcontracted with or overseen by another investment adviser), and any entity controlling, controlled by, or under common control with the adviser that provides ongoing services to the registrant: |
| | 2015 - $2,500 |
| | | 2014 - $2,000 |
(h) The registrant's audit committee has considered whether the provision of non-audit services to the registrant's investment adviser (not including any sub-adviser whose role is primarily portfolio management and is subcontracted with or overseen by another investment adviser), and any entity controlling, controlled by, or under common control with the investment adviser that provides ongoing services to the registrant, that were not pre-approved pursuant to paragraph (c)(7)(ii) of Rule 2-01 of Regulation S-X, is compatible with maintaining the principal accountant's independence.
Item 5. Audit Committee of Listed Companies. Not applicable to open-end investment companies.
Item 6. Schedule of Investments. See Item 1.
Item 7. Disclosure of Proxy Voting Policies and Procedures for Closed-End Funds. Not applicable to open-end investment companies.
Item 8. Portfolio Managers of Closed-End Management Investment Companies. Not applicable to open-end investment companies.
Item 9. Purchases of Equity Securities by Closed-End Funds. Not applicable to open-end investment companies.
Item 10. Submission of Matters to a Vote of Security Holders. There were no material changes to the procedures by which Shareholders may recommend nominees to the registrant’s Board of Trustees,
Item 11. Controls and Procedures.
(a) Based on an evaluation of the Registrant’s disclosure controls and procedures as of a date within 90 days of filing date of this Form N-CSR, the principal executive officer and principal financial officer of the Registrant have concluded that the disclosure controls and procedures of the Registrant are reasonably designed to ensure that the information required in filings on Form N-CSR is recorded, processed, summarized, and reported by the filing date, including that information required to be disclosed is accumulated and communicated to the Registrant’s management, including the Registrant’s principal executive officer and principal financial officer, as appropriate to allow timely decisions regarding required disclosure.
(b) There were no significant changes in the Registrant’s internal control over financial reporting that occurred during the Registrant’s last fiscal half-year that have materially affected, or are reasonably likely to materially affect, the Registrant’s internal control over financial reporting.
Item 12. Exhibits.
(a)(1) Code of Ethics herewith.
(a)(2) Certifications required by Section 302 of the Sarbanes-Oxley Act of 2002 (and Item 11(a)(2) of Form N-CSR) are filed herewith.
(a)(3) Not applicable for open-end investment companies.
(b) Certifications required by Section 906 of the Sarbanes-Oxley Act of 2002 (and Item 11(b) of Form N-CSR) are filed herewith.
SIGNATURES
Pursuant to the requirements of the Securities Exchange Act of 1934 and the Investment Company Act of 1940, the registrant has duly caused this report to be signed on its behalf by the undersigned, thereunto duly authorized.
(Registrant) Arrow ETF Trust
By (Signature and Title)
/s/ Joseph Barrato
Joseph Barrato, Principal Executive Officer/President
Date 4/8/16
Pursuant to the requirements of the Securities Exchange Act of 1934 and the Investment Company Act of 1940, this report has been signed below by the following persons on behalf of the registrant and in the capacities and on the dates indicated.
By (Signature and Title)
/s/ Joseph Barrato
Joseph Barrato, Principal Executive Officer/President
Date 4/8/16
By (Signature and Title)
/s/ Sam Singh
Sam Singh, Principal Financial Officer/Treasurer
Date 4/8/16