united states
securities and exchange commission
washington, d.c. 20549
form n-csr
certified shareholder report of registered management
investment companies
Investment Company Act file number 811-22624
Arrow ETF Trust
(Exact name of registrant as specified in charter)
6100 Chevy Chase Drive Suite 100 Laurel, MD 20707
(Address of principal executive offices) (Zip code)
Corporation Service Company
2711 Little Falls Drive
Wilmington, Delaware 19808
(Name and address of agent for service)
Registrant's telephone number, including area code: 301-260-0162
Date of fiscal year end: 1/31
Date of reporting period: 1/31/24
Item 1. Reports to Stockholders.
Arrow Dow Jones Global Yield ETF
GYLD
Annual Report
January 31, 2024
1-877-277-6933
1-877-ARROW-FD
www.ArrowFunds.com
Dear Shareholder:
We are pleased to present this annual report for the Arrow Dow Jones Global Yield ETF (“GYLD” or the “Fund”) for the year ended January 31, 2024.
GYLD seeks investment results that generally correspond to the price and yield performance, before fees and expenses, of the Dow Jones Global Composite Yield Index (the “Index”).
The Fund’s portfolio is managed to generally correspond to the holdings of the Index, which sources its return and yield from equally weighted exposure to five sub-indexes. With 30 holdings in each of the five sub-index baskets, the Index is comprised of 150 total holdings. From time to time, the Fund holdings may not precisely replicate the Index due to factors including, but not limited to, the availability of the holdings, liquidity, currency denominations and other market factors. The Index generally starts with 150 total holdings during its annual reconstitution. Throughout the year, some components may be dropped from the Index if they fail to continue qualifying based on the screening methodology. The next annual Index reconstitution is scheduled for March 31, 2024. Variance in holdings, timing of trades, costs of trade execution, management fees and other factors may lead to portfolio tracking discrepancies from the Index. For the year ended January 31, 2024, using monthly data, the Fund has tracked the composite Index’s performance with 97.6% correlation.
Management’s Discussion of Fund Performance
All Fund performance is based on net asset value (“NAV”) and assumes the reinvestment of distributions, without regard to individual taxes or withholdings. Index returns assume reinvestment of distributions, but do not include fees. Individual performance will vary due to a number of factors including, but not limited to, trading commissions, bid/ask spreads, premiums/discounts relative to NAV, time of trading and other potential market factors—please refer to the Fund’s prospectus for more information.
For the one- year period ended January 31, 2024, the performance of GYLD was 4.41% while the Index was 4.21%. Since GYLD’s inception on May 8, 2012 (first trade date) through January 31, 2024, the Fund has an annualized total return of 1.59% and the Index has returned 2.47%. For broad market domestic equity comparisons, the U.S. stock market, as represented by the S&P 500 Index, returned - 20.82% for the one-year period through January 31, 2024. The domestic bond market ended the one-year reporting period with a loss of 2.10%, as represented by the Bloomberg Barclays U.S. Aggregate Bond Index. Overall, GYLD underperformed some of the popular broad-based international market benchmarks. Returns in the international equity markets were favorable but underperformed the U.S. equity markets, with the MSCI EAFE (USD Net) equity index up 10.58% for the year. On the international bonds front, the Barclays Global Aggregate (ex/US) Bond Index was down -0.18% for the year.
For the one-year period through January 31, 2024, three of the five category baskets had positive returns on a standalone basis. Global Real Estate was down - 6.82% and Global Equity was down -4.21%. Global Alternative Yield was up 23.02%, Global Corporate Debt was up 9.91% and Global Sovereign Debt was up 8.08%. The strength of the Energy Sector continued for most of 2023 on improved Energy Sector margins. The MSCI World Energy Sector ex Australia Index was up over 263% since its COVID low on March 18, 2020. This sustained recovery has been good for the Energy Sector’s dividend rates. 24.17% of the market value of the Fund’s holdings were in the Energy sector at January 31, 2024. The Fund benefited throughout the year from the Energy Sector’s rebound from 2020’s lows and healthy margins.
The Fund generally pays distributions monthly, or as needed if special distributions are required. As of the last distribution made during the reporting period on January 22, 2024, the Fund’s 30-day U.S. Securities and Exchange Commission yield was 9.80% and the 12-month distribution rate was 7.09%.
For more information about current performance, holdings or historical premiums/discounts, please visit our website at www.arrowfunds.com. We are grateful for your continued confidence in our company.
Sincerely,

Joseph J. Barrato
Chief Executive Officer
Arrow Investment Advisors, LLC
March 2024
AD-03242024
Arrow Dow Jones Global Yield ETF
PORTFOLIO REVIEW (Unaudited)
January 31, 2024
The Fund’s performance figures* for the year January 31, 2024, as compared to its benchmark:
| | | | | | Annualized |
| | | Annualized | Annualized | Annualized | Since Inception** - |
| | One Year | Three Years | Five Years | Ten Years | January 31, 2024 |
| Arrow Dow Jones Global Yield ETF - NAV | 4.41% | 5.30% | 1.85% | 0.36% | 1.59% |
| Arrow Dow Jones Global Yield ETF - Market Price | 2.59% | 5.03% | 1.66% | 0.07% | 1.23% |
| Dow Jones Global Composite Yield Index *** | 4.21% | 5.65% | 2.74% | 1.25% | 2.47% |
| * | Past performance does not guarantee future results. The investment return and principal value of an investment in the Fund will fluctuate so that an investor’s shares, when sold, may be worth more or less than their original cost. The returns shown do not reflect the deduction of taxes a shareholder would pay on Fund distributions or on the sale of Fund shares. Current performance of the Fund may be lower or higher than the performance quoted. Performance data current to the most recent month end may be obtained by visiting www.arrowfunds.com or by calling 1-877-277-6933. |
The Fund’s per share net asset value (“NAV”) is the value of one share of the Fund as calculated in accordance with the standard formula for valuing shares. The NAV return is based on the NAV of the Fund and the market return is based on the market price per share of the Fund. The price used to calculate market return (“Market Price”) is determined by using market price or bid/ask as of the market close on the primary stock exchange on which shares of the Fund are listed for trading, as of the time that the Fund’s NAV is calculated. Total returns are calculated with the traded NAV on January 31, 2024. Since shares of the Fund did not trade in the secondary market until after the Fund’s inception, for the period from inception (5/2/2012) to the first day of secondary market trading shares of the Fund, the NAV of the Fund is used as a proxy for the Market Price to calculate market returns. Market and NAV returns assume that dividends and capital gain distributions have been reinvested in the Fund at Market Price and NAV, respectively. Information detailing the number of days the Market Price of the Fund was greater than the Fund’s NAV and the number of days it was less than the Fund’s NAV can be obtained at www.arrowfunds.com. The Fund’s total annual operating expenses are 0.75% per the June 1, 2023 prospectus. Please see the Financial Highlights for a more recent expense ratio.
| ** | Commencement of trading was May 8, 2012. |
| *** | The Dow Jones Global Composite Yield Index is constructed by equally weighting the five global high-yield index baskets, each of which is made up of 30 equally weighted components. Investors cannot invest directly in an index. |
Comparison of the Change in Value of a $10,000 Investment
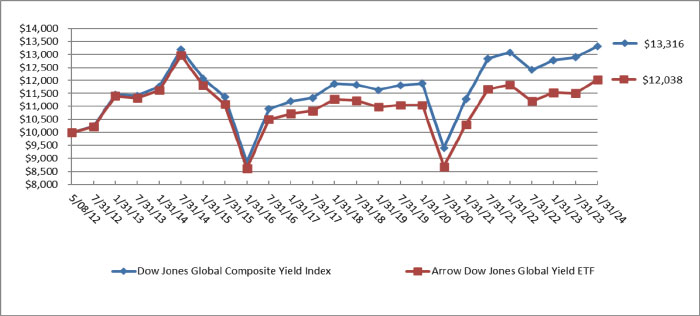
Arrow Dow Jones Global Yield ETF
PORTFOLIO REVIEW (Unaudited) (Continued)
January 31, 2024
The Fund’s Holdings by Country as of January 31, 2024 are as follows:
| Country | | % of Net Assets | |
| United States | | | 51.4 | % |
| South Africa | | | 5.8 | % |
| Brazil | | | 3.6 | % |
| Colombia | | | 3.3 | % |
| Turkey | | | 3.2 | % |
| Canada | | | 3.2 | % |
| Australia | | | 2.9 | % |
| Spain | | | 2.9 | % |
| Panama | | | 2.3 | % |
| Mexico | | | 2.2 | % |
| Indonesia | | | 2.1 | % |
| Taiwan, Province Of China | | | 2.1 | % |
| Hungary | | | 1.9 | % |
| Japan | | | 1.4 | % |
| France | | | 1.4 | % |
| Peru | | | 1.1 | % |
| Sweden | | | 0.8 | % |
| Virgin Islands, British | | | 0.8 | % |
| Cayman Islands | | | 0.8 | % |
| Germany | | | 0.7 | % |
| Italy | | | 0.7 | % |
| Singapore | | | 0.7 | % |
| Denmark | | | 0.7 | % |
| Luxembourg | | | 0.7 | % |
| Israel | | | 0.7 | % |
| Poland | | | 0.6 | % |
| Chile | | | 0.6 | % |
| United Kingdom | | | 0.0 | % * |
| Russian Federation | | | 0.0 | % * |
| Other Assets in Excess of Liabilities | | | 1.4 | % |
| | | | 100.0 | % |
The Fund’s Top Holdings by Sector as of January 31, 2024 are as follows:
| Asset Class | | % of Net Assets | |
| Energy | | | 21.8 | % |
| Real Estate | | | 21.1 | % |
| Sovereign | | | 19.8 | % |
| Materials | | | 9.8 | % |
| Industrials | | | 6.7 | % |
| Consumer Discretionary | | | 4.5 | % |
| Communications | | | 4.0 | % |
| Utilities | | | 3.7 | % |
| Financials | | | 2.9 | % |
| Technology | | | 2.0 | % |
| Health Care | | | 1.6 | % |
| Consumer Staples | | | 0.7 | % |
| Other Assets in Excess of Liabilities | | | 1.4 | % |
| | | | 100.0 | % |
Please refer to the Schedule of Investments in this Annual Report for a detailed listing of the Fund’s holdings.
| ARROW DOW JONES GLOBAL YIELD ETF |
| SCHEDULE OF INVESTMENTS |
| January 31, 2024 |
| Shares | | | | | Fair Value | |
| | | | | COMMON STOCKS — 45.5% | | | | |
| | | | | CHEMICALS - 2.2% | | | | |
| | 28,133 | | | Chemtrade Logistics Income Fund | | $ | 186,048 | |
| | 31,788 | | | ICL Group Ltd. | | | 146,032 | |
| | 4,496 | | | Yara International ASA | | | 149,380 | |
| | | | | | | | 481,460 | |
| | | | | ELECTRIC UTILITIES - 0.7% | | | | |
| | 78,421 | | | A2A SpA | | | 155,952 | |
| | 114,622,657 | | | Federal Grid Company Unified Energy System PJSC(a)(b)(d) | | | — | |
| | | | | | | | 155,952 | |
| | | | | GAS & WATER UTILITIES - 1.4% | | | | |
| | 38,084 | | | Cia de Saneamento de Minas Gerais-COPASA | | | 163,805 | |
| | 9,506 | | | Enagas S.A. | | | 154,992 | |
| | | | | | | | 318,797 | |
| | | | | HEALTH CARE FACILITIES & SERVICES - 0.9% | | | | |
| | 22,219 | | | Chartwell Retirement Residences | | | 198,177 | |
| | | | | | | | | |
| | | | | HEALTH CARE REIT - 3.7% | | | | |
| | 14,402 | | | Global Medical REIT, Inc. | | | 145,604 | |
| | 4,520 | | | LTC Properties, Inc. | | | 140,888 | |
| | 29,962 | | | Medical Properties Trust, Inc. | | | 92,882 | |
| | 3,041 | | | National Health Investors, Inc. | | | 161,720 | |
| | 35,892 | | | NorthWest Healthcare Properties Real Estate | | | 130,829 | |
| | 4,681 | | | Omega Healthcare Investors, Inc. | | | 135,749 | |
| | | | | | | | 807,672 | |
| | | | | INDUSTRIAL REIT - 0.7% | | | | |
| | 1,590 | | | Innovative Industrial Properties, Inc. | | | 148,236 | |
| | | | | | | | | |
| | | | | INDUSTRIAL SUPPORT SERVICES - 0.7% | | | | |
| | 109,325 | | | United Tractors Tbk P.T. | | | 158,999 | |
| | | | | | | | | |
| | | | | MEDICAL EQUIPMENT & DEVICES - 0.7% | | | | |
| | 295,614 | | | Riverstone Holdings Ltd. | | | 154,278 | |
| | | | | | | | | |
| | | | | METALS & MINING - 5.6% | | | | |
| | 961,895 | | | Adaro Energy Tbk P.T. | | | 146,296 | |
See accompanying notes to financial statements.
| ARROW DOW JONES GLOBAL YIELD ETF |
| SCHEDULE OF INVESTMENTS (Continued) |
| January 31, 2024 |
| Shares | | | | | Fair Value | |
| | | | | COMMON STOCKS — 45.5% (Continued) | | | | |
| | | | | METALS & MINING - 5.6% (Continued) | | | | |
| | 14,712 | | | African Rainbow Minerals Ltd. | | $ | 145,759 | |
| | 1,008,816 | | | Bukit Asam Tbk P.T. | | | 166,858 | |
| | 15,622 | | | Exxaro Resources Ltd. | | | 156,268 | |
| | 8,089 | | | Fortescue Metals Group Ltd. | | | 158,543 | |
| | 836 | | | Grupa Kety S.A. | | | 142,403 | |
| | 97,321 | | | Indo Tambangraya Megah Tbk P.T. | | | 166,827 | |
| | 4,869 | | | Kumba Iron Ore Ltd. | | | 143,827 | |
| | | | | | | | 1,226,781 | |
| | | | | MULTI ASSET CLASS REIT - 4.1% | | | | |
| | 62,860 | | | Charter Hall Long Wale REIT | | | 154,624 | |
| | 2,941 | | | Covivio | | | 143,507 | |
| | 91,552 | | | Fibra Uno Administracion S.A. de CV | | | 155,507 | |
| | 16,204 | | | Global Net Lease, Inc. | | | 136,924 | |
| | 255,553 | | | Growthpoint Properties Ltd. | | | 161,758 | |
| | 5,521 | | | Vornado Realty Trust | | | 150,116 | |
| | | | | | | | 902,436 | |
| | | | | OFFICE REIT – 5.0% | | | | |
| | 29,591 | | | Brandywine Realty Trust | | | 140,261 | |
| | 25,579 | | | City Office REIT, Inc. | | | 134,290 | |
| | 6,526 | | | Highwoods Properties, Inc. | | | 149,902 | |
| | 17,450 | | | Hudson Pacific Properties, Inc. | | | 142,916 | |
| | 286 | | | Mori Trust Reit, Inc. | | | 145,554 | |
| | 20,718 | | | Office Properties Income Trust | | | 76,035 | |
| | 22,242 | | | Piedmont Office Realty Trust, Inc., Class A | | | 151,246 | |
| | 3,455 | | | SL Green Realty Corporation | | | 155,302 | |
| | | | | | | | 1,095,506 | |
| | | | | OIL & GAS PRODUCERS - 6.8% | | | | |
| | 14,140 | | | Antero Midstream Corporation | | | 173,074 | |
| | 13,845 | | | EnLink Midstream, LLC | | | 166,971 | |
| | 1 | | | Equitrans Midstream Corporation | | | 10 | |
| | 5,558 | | | Hess Midstream, L.P., Class A | | | 187,915 | |
| | 9,900 | | | Kimbell Royalty Partners, L.P. | | | 148,698 | |
| | 4,832 | | | Kinetik Holdings, Inc. | | | 157,137 | |
| | 20,009 | | | Petroleo Brasileiro S.A. | | | 171,679 | |
See accompanying notes to financial statements.
| ARROW DOW JONES GLOBAL YIELD ETF |
| SCHEDULE OF INVESTMENTS (Continued) |
| January 31, 2024 |
| Shares | | | | | Fair Value | |
| | | | | COMMON STOCKS — 45.5% (Continued) | | | | |
| | | | | OIL & GAS PRODUCERS - 6.8% (Continued) | | | | |
| | 17,810 | | | Peyto Exploration & Development Corporation | | $ | 171,836 | |
| | 10,424 | | | Plains GP Holdings, L.P., Class A | | | 168,660 | |
| | 6,754 | | | Sitio Royalties Corporation, Class A | | | 144,063 | |
| | | | | | | | 1,490,043 | |
| | | | | REAL ESTATE OWNERS & DEVELOPERS - 1.5% | | | | |
| | 23,731 | | | NEPI Rockcastle N.V. | | | 159,819 | |
| | 372,490 | | | Samhallsbyggnadsbolaget i Norden A.B. | | | 172,712 | |
| | | | | | | | 332,531 | |
| | | | | RETAIL - DISCRETIONARY - 1.5% | | | | |
| | 56,134 | | | Harvey Norman Holdings Ltd. | | | 162,750 | |
| | 4,432 | | | JB Hi-Fi Ltd. | | | 166,262 | |
| | | | | | | | 329,012 | |
| | | | | RETAIL REIT - 2.8% | | | | |
| | 65,429 | | | Charter Hall Retail REIT | | | 159,656 | |
| | 6,103 | | | Klepierre S.A. | | | 158,856 | |
| | 2,987 | | | Realty Income Corporation | | | 162,463 | |
| | 7,923 | | | SmartCentres Real Estate Investment Trust | | | 145,343 | |
| | | | | | | | 626,318 | |
| | | | | SPECIALTY REIT - 0.7% | | | | |
| | 3,385 | | | EPR Properties | | | 149,854 | |
| | | | | | | | | |
| | | | | STEEL - 0.0%(c) | | | | |
| | 14,212 | | | Severstal PAO(a)(b)(d) | | | — | |
| | | | | | | | | |
| | | | | TECHNOLOGY HARDWARE - 1.3% | | | | |
| | 10,150 | | | Asustek Computer, Inc. | | | 144,449 | |
| | 11,919 | | | Simplo Technology Company Ltd. | | | 154,584 | |
| | | | | | | | 299,033 | |
| | | | | TELECOMMUNICATIONS - 0.0%(c) | | | | |
| | 35,608 | | | Mobile TeleSystems Public Joint Stock Company - ADR(a)(b)(d) | | | — | |
| | | | | | | | | |
| | | | | TRANSPORTATION & LOGISTICS - 5.2% | | | | |
| | 84 | | | AP Moller - Maersk A/S - Series A | | | 152,357 | |
| | 36,615 | | | Globaltrans Investment plc(a)(b)(d) | | | — | |
See accompanying notes to financial statements.
| ARROW DOW JONES GLOBAL YIELD ETF |
| SCHEDULE OF INVESTMENTS (Continued) |
| January 31, 2024 |
| Shares | | | | | Fair Value | |
| | | | | COMMON STOCKS — 45.5% (Continued) | | | | |
| | | | | TRANSPORTATION & LOGISTICS - 5.2% (Continued) | | | | |
| | 1,089 | | | Hapag-Lloyd A.G. | | $ | 163,674 | |
| | 25,517 | | | KNOT Offshore Partners, L.P. | | | 150,550 | |
| | 4,816 | | | Mitsui OSK Lines Ltd. | | | 173,764 | |
| | 4,948 | | | Nippon Yusen KK | | | 171,399 | |
| | 7,557 | | | Star Bulk Carriers Corporation | | | 164,289 | |
| | 57,402 | | | T3EX Global Holdings Corporation | | | 165,766 | |
| | | | | | | | 1,141,799 | |
| | | | | | | | | |
| | | | | TOTAL COMMON STOCKS (Cost $10,767,469) | | | 10,016,884 | |
| | | | | | | | | |
| | | | | MASTER LIMITED PARTNERSHIPS — 13.6% | | | | |
| | | | | GAS & WATER UTILITIES - 0.9% | | | | |
| | 9,240 | | | Suburban Propane Partners, L.P. | | | 183,137 | |
| | | | | | | | | |
| | | | | METALS & MINING - 0.7% | | | | |
| | 7,163 | | | Alliance Resource Partners, L.P. | | | 150,495 | |
| | 1 | | | Natural Resource Partners, L.P. | | | 97 | |
| | | | | | | | 150,592 | |
| | | | | OIL & GAS PRODUCERS - 11.2% | | | | |
| | 9,819 | | | Black Stone Minerals, L.P. | | | 161,032 | |
| | 3,092 | | | Cheniere Energy Partners, L.P. | | | 163,629 | |
| | 7,312 | | | CrossAmerica Partners, L.P. | | | 171,905 | |
| | 4,001 | | | Delek Logistics Partners, L.P. | | | 187,887 | |
| | 5,901 | | | Dorchester Minerals, L.P. | | | 185,409 | |
| | 12,785 | | | Energy Transfer, L.P. | | | 182,826 | |
| | 5,722 | | | Enterprise Products Partners, L.P. | | | 153,121 | |
| | 14,773 | | | Genesis Energy, L.P. | | | 170,333 | |
| | 4,358 | | | Global Partners, L.P. | | | 205,218 | |
| | 4,324 | | | MPLX, L.P. | | | 166,690 | |
| | 9,817 | | | NuStar Energy, L.P. | | | 215,973 | |
| | 11,046 | | | Plains All American Pipeline, L.P. | | | 170,550 | |
| | 2,834 | | | Sunoco, L.P. | | | 168,538 | |
See accompanying notes to financial statements.
| ARROW DOW JONES GLOBAL YIELD ETF |
| SCHEDULE OF INVESTMENTS (Continued) |
| January 31, 2024 |
| Shares | | | | | | | | | | | Fair Value | |
| | | | | MASTER LIMITED PARTNERSHIPS — 13.6% (Continued) | | | | |
| | | | | OIL & GAS PRODUCERS - 11.2% (Continued) | | | | |
| | 5,822 | | | Western Midstream Partners, L.P. | | | | | | | | $ | 167,266 | |
| | | | | | | | | | | | | | 2,470,377 | |
| | | | | OIL & GAS SERVICES & EQUIPMENT - 0.8% | | | | |
| | 7,129 | | | USA Compression Partners, L.P. | | | | | | | | | 177,869 | |
| | | | | | | | | | | | | | | |
| | | | | TOTAL MASTER LIMITED PARTNERSHIPS (Cost $1,080,099) | | | 2,981,975 | |
| | | | | | | | | | | | | | | |
| Principal | | | | | | | Coupon Rate | | | | | |
| Amount ($) | | | | | Spread | | (%) | | Maturity | | Fair Value | |
| | | | | CORPORATE BONDS — 19.7% | | | | | | | | | | |
| | | | | AUTOMOTIVE — 0.7% | | | | | | | | | | |
| | 175,000 | | | Tenneco, Inc. | | | | 8.0000 | | 11/17/28 | | | 153,038 | |
| | | | | | | | | | | | | | | |
| | | | | BANKING — 0.7% | | | | | | | | | | |
| | 170,000 | | | Western Alliance Bancorp(e) | | TSFR3M + 2.250% | | 3.0000 | | 06/15/31 | | | 151,725 | |
| | | | | | | | | | | | | | | |
| | | | | ELECTRIC UTILITIES — 0.7% | | | | | | | | | | |
| | 200,000 | | | EnfraGen Energia Sur S.A. / EnfraGen Spain S.A. | | | | 5.3750 | | 12/30/30 | | | 156,665 | |
| | | | | | | | | | | | | | | |
| | | | | ENGINEERING & CONSTRUCTION — 0.8% | | | | | | | | | | |
| | 200,000 | | | IHS Holding Ltd. | | | | 6.2500 | | 11/29/28 | | | 169,416 | |
| | | | | | | | | | | | | | | |
| | | | | ENTERTAINMENT CONTENT — 1.4% | | | | | | | | | | |
| | 251,000 | | | AMC Networks, Inc. | | | | 4.2500 | | 02/15/29 | | | 193,354 | |
| | 132,000 | | | ViacomCBS, Inc.(e) | | US0003M + 3.899% | | 6.2500 | | 02/28/57 | | | 114,386 | |
| | | | | | | | | | | | | | 307,740 | |
| | | | | FOOD — 0.7% | | | | | | | | | | |
| | 190,000 | | | HLF Financing Sarl, LLC / Herbalife International, | | | | 4.8750 | | 06/01/29 | | | 148,648 | |
| | | | | | | | | | | | | | | |
| | | | | FORESTRY, PAPER & WOOD PRODUCTS — 1.4% | | | | | | | | | | |
| | 165,000 | | | Domtar Corporation | | | | 6.7500 | | 10/01/28 | | | 151,630 | |
| | 175,000 | | | Mercer International, Inc. | | | | 5.1250 | | 02/01/29 | | | 150,419 | |
| | | | | | | | | | | | | | 302,049 | |
See accompanying notes to financial statements.
| ARROW DOW JONES GLOBAL YIELD ETF |
| SCHEDULE OF INVESTMENTS (Continued) |
| January 31, 2024 |
| Principal | | | | | Coupon Rate | | | | | |
| Amount ($) | | | | | (%) | | Maturity | | Fair Value | |
| | | | | CORPORATE BONDS — 19.7% (Continued) | | | | | | | | |
| | | | | LEISURE FACILITIES & SERVICES — 0.8% | | | | | | | | |
| | 200,000 | | | Studio City Finance Ltd. | | 5.0000 | | 01/15/29 | | $ | 170,916 | |
| | | | | | | | | | | | | |
| | | | | OIL & GAS PRODUCERS — 3.0% | | | | | | | | |
| | 250,000 | | | AI Candelaria Spain S.A. | | 5.7500 | | 06/15/33 | | | 193,390 | |
| | 190,150 | | | MC Brazil Downstream Trading S.A.RL | | 7.2500 | | 06/30/31 | | | 146,310 | |
| | 155,000 | | | PDC Energy, Inc. | | 5.7500 | | 05/15/26 | | | 154,764 | |
| | 200,000 | | | SierraCol Energy Andina, LLC | | 6.0000 | | 06/15/28 | | | 168,753 | |
| | | | | | | | | | | | 663,217 | |
| | | | | PUBLISHING & BROADCASTING — 1.4% | | | | | | | | |
| | 172,000 | | | iHeartCommunications, Inc. | | 6.3750 | | 05/01/26 | | | 147,945 | |
| | 215,000 | | | Sinclair Television Group, Inc. | | 4.1250 | | 12/01/30 | | | 165,657 | |
| | | | | | | | | | | | 313,602 | |
| | | | | REAL ESTATE INVESTMENT TRUSTS — 2.6% | | | | | | | | |
| | 182,000 | | | MPT Operating Partnership, L.P. / MPT Finance | | 5.0000 | | 10/15/27 | | | 137,954 | |
| | 235,000 | | | MPT Operating Partnership, L.P. / MPT Finance | | 3.5000 | | 03/15/31 | | | 144,158 | |
| | 175,000 | | | Necessity Retail REIT Inc (The) / American Finance | | 4.5000 | | 09/30/28 | | | 145,446 | |
| | 147,000 | | | Uniti Group L.P. / CSL Capital LLC | | 10.5000 | | 02/15/28 | | | 149,594 | |
| | | | | | | | | | | | 577,152 | |
| | | | | RETAIL - DISCRETIONARY — 1.5% | | | | | | | | |
| | 222,000 | | | Kohl’s Corporation | | 4.6250 | | 05/01/31 | | | 177,841 | |
| | 180,000 | | | Victoria’s Secret & Company | | 4.6250 | | 07/15/29 | | | 152,443 | |
| | | | | | | | | | | | 330,284 | |
| | | | | SPECIALTY FINANCE — 2.2% | | | | | | | | |
| | 180,000 | | | Ally Financial, Inc. | | 6.7000 | | 02/14/33 | | | 180,405 | |
| | 135,000 | | | Navient Corporation | | 11.5000 | | 03/15/31 | | | 147,959 | |
| | 155,000 | | | Starwood Property Trust, Inc. | | 4.7500 | | 03/15/25 | | | 152,036 | |
| | | | | | | | | | | | 480,400 | |
| | | | | TECHNOLOGY SERVICES — 0.7% | | | | | | | | |
| | 160,000 | | | Neptune Bidco US, Inc. | | 9.2900 | | 04/15/29 | | | 152,960 | |
| | | | | | | | | | | | | |
| | | | | TELECOMMUNICATIONS — 1.1% | | | | | | | | |
| | 142,000 | | | Hughes Satellite Systems Corporation | | 5.2500 | | 08/01/26 | | | 120,121 | |
See accompanying notes to financial statements.
| ARROW DOW JONES GLOBAL YIELD ETF |
| SCHEDULE OF INVESTMENTS (Continued) |
| January 31, 2024 |
| Principal | | | | | Coupon Rate | | | | | |
| Amount ($) | | | | | (%) | | Maturity | | Fair Value | |
| | | | | CORPORATE BONDS — 19.7% (Continued) | | | | | | | | |
| | | | | TELECOMMUNICATIONS — 1.1% (Continued) | | | | | | | | |
| | 190,000 | | | Hughes Satellite Systems Corporation | | 6.6250 | | 08/01/26 | | $ | 131,093 | |
| | | | | | | | | | | | 251,214 | |
| | | | | | | | | | | | | |
| | | | | TOTAL CORPORATE BONDS (Cost $4,386,839) | | | | | | | 4,329,026 | |
| | | | | | | | | | | | | |
| | | | | NON U.S. GOVERNMENT & AGENCIES — 19.8% | | | | | | | | |
| | | | | SOVEREIGN — 19.8% | | | | | | | | |
| | 125,000 | | | Brazilian Government International Bond | | 4.2500 | | 01/07/25 | | | 123,547 | |
| | 128,000 | | | Brazilian Government International Bond | | 10.1250 | | 05/15/27 | | | 147,346 | |
| | 200,000 | | | Brazilian Government International Bond | | 5.6250 | | 01/07/41 | | | 180,977 | |
| | 171,000 | | | Chile Government International Bond | | 3.8600 | | 06/21/47 | | | 137,534 | |
| | 170,000 | | | Colombia Government International Bond | | 8.1250 | | 05/21/24 | | | 171,537 | |
| | 200,000 | | | Colombia Government International Bond | | 4.5000 | | 03/15/29 | | | 185,362 | |
| | 200,000 | | | Colombia Government International Bond | | 3.2500 | | 04/22/32 | | | 157,319 | |
| | 200,000 | | | Colombia Government International Bond | | 7.5000 | | 02/02/34 | | | 205,214 | |
| | 174,000 | | | Hungary Government International Bond | | 7.6250 | | 03/29/41 | | | 200,709 | |
| | 200,000 | | | Hungary Government International Bond | | 6.7500 | | 09/25/52 | | | 215,430 | |
| | 190,000 | | | Mexico Government International Bond | | 4.1250 | | 01/21/26 | | | 188,293 | |
| | 140,000 | | | Mexico Government International Bond | | 6.7500 | | 09/27/34 | | | 150,896 | |
| | 1,000 | | | Mexico Government International Bond | | 4.7500 | | 03/08/44 | | | 844 | |
| | 175,000 | | | Mexico Government International Bond | | 4.6000 | | 02/10/48 | | | 141,708 | |
| | 160,000 | | | Panama Government International Bond | | 7.1250 | | 01/29/26 | | | 164,066 | |
| | 140,000 | | | Panama Government International Bond | | 8.8750 | | 09/30/27 | | | 152,797 | |
| | 270,000 | | | Panama Government International Bond | | 3.3620 | | 06/30/31 | | | 210,532 | |
| | 200,000 | | | Panama Government International Bond | | 6.8530 | | 03/28/54 | | | 179,588 | |
| | 100,000 | | | Peruvian Government International Bond | | 7.3500 | | 07/21/25 | | | 103,347 | |
| | 115,000 | | | Peruvian Government International Bond | | 8.7500 | | 11/21/33 | | | 143,855 | |
| | 140,000 | | | Republic of South Africa Government International | | 4.8750 | | 04/14/26 | | | 137,516 | |
| | 200,000 | | | Republic of South Africa Government International | | 5.8750 | | 04/20/32 | | | 184,000 | |
| | 200,000 | | | Republic of South Africa Government International | | 7.3000 | | 04/20/52 | | | 177,234 | |
| | 200,000 | | | Turkey Government International Bond | | 9.1250 | | 07/13/30 | | | 213,685 | |
| | 300,000 | | | Turkey Government International Bond | | 9.3750 | | 01/19/33 | | | 326,787 | |
See accompanying notes to financial statements.
| ARROW DOW JONES GLOBAL YIELD ETF |
| SCHEDULE OF INVESTMENTS (Continued) |
| January 31, 2024 |
| Principal | | | | | Coupon Rate | | | | | |
| Amount ($) | | | | | (%) | | Maturity | | Fair Value | |
| | | | | NON U.S. GOVERNMENT & AGENCIES — 19.8% (Continued) | | | | | | | | |
| | | | | SOVEREIGN — 19.8% (Continued) | | | | | | | | |
| | 200,000 | | | Turkey Government International Bond | | 6.6250 | | 02/17/45 | | $ | 166,185 | |
| | | | | TOTAL NON U.S. GOVERNMENT & AGENCIES (Cost $4,417,342) | | | | | | | 4,366,308 | |
| | | | | | | | | | | | | |
| | | | | TOTAL INVESTMENTS - 98.6% (Cost $20,651,749) | | | | | | $ | 21,694,193 | |
| | | | | OTHER ASSETS IN EXCESS OF LIABILITIES - 1.4% | | | | | | | 310,754 | |
| | | | | NET ASSETS - 100.0% | | | | | | $ | 22,004,947 | |
| ADR | - American Depositary Receipt |
| | |
| A/S | - Anonim Sirketi |
| | |
| LLC | - Limited Liability Company |
| | |
| LP | - Limited Partnership |
| | |
| LTD | - Limited Company |
| | |
| NV | - Naamioze Vennootschap |
| | |
| PJSC | - Public Joint-Stock Company |
| | |
| PLC | - Public Limited Company |
| | |
| PT | - Perseroan Terbatas |
| | |
| REIT | - Real Estate Investment Trust |
| | |
| S/A | - Société Anonyme |
| | |
| SA de CV | - Sociedad Anonima de Capital Variable |
| | |
| TSFR3M | - Term Secured Overnight Financing Rate (SOFR) 3 Month |
| | |
| US0003M | - Intercontinental Exchange London Interbank Offered Rate (ICE LIBOR) USD 3 Month |
| (a) | The fair value of this investment is determined using significant unobservable inputs. |
| (b) | Non-income producing security. |
| (c) | Percentage rounds to less than 0.1%. |
| (d) | Illiquid security. The total fair value of these securities as of January 31, 2024 was $0, representing 0.0% of net assets. |
| (e) | Variable rate security; the rate shown represents the rate on January 31, 2024. |
See accompanying notes to financial statements.
| Arrow Dow Jones Global Yield ETF |
| STATEMENT OF ASSETS AND LIABILITIES |
| January 31, 2024 |
| ASSETS | | | | |
| Investment securities: | | | | |
| At cost | | $ | 20,651,749 | |
| At value | | $ | 21,694,193 | |
| Cash | | | 377,330 | |
| Foreign cash (cost $188,787) | | | 87,689 | |
| Dividends and interest receivable | | | 238,747 | |
| TOTAL ASSETS | | | 22,397,959 | |
| | | | | |
| LIABILITIES | | | | |
| Payable for investments purchased | | | 361,043 | |
| Investment advisory fees payable | | | 31,969 | |
| TOTAL LIABILITIES | | | 393,012 | |
| NET ASSETS | | $ | 22,004,947 | |
| | | | | |
| Net Assets Consist Of: | | | | |
| Paid in capital | | $ | 100,668,496 | |
| Accumulated deficit | | | (78,663,549 | ) |
| NET ASSETS | | $ | 22,004,947 | |
| | | | | |
| Net Asset Value Per Share: | | | | |
| Net Assets | | $ | 22,004,947 | |
| Shares of beneficial interest outstanding ($0 par value, unlimited shares authorized) | | | 1,650,000 | |
| Net asset value, offering and redemption price per share (Net Assets ÷ Shares Outstanding) | | $ | 13.34 | (a) |
| (a) | The NAV shown above differs from the traded NAV on January 31, 2024 due to financial statement rounding and/or financial statement adjustments. |
See accompanying notes to financial statements.
| Arrow Dow Jones Global Yield ETF |
| STATEMENT OF OPERATIONS |
| For the year ended January 31, 2024 |
| INVESTMENT INCOME | | | | |
| Dividends (net of foreign withholding tax of $97,048) | | $ | 808,237 | |
| Interest | | | 592,111 | |
| TOTAL INVESTMENT INCOME | | | 1,400,348 | |
| | | | | |
| EXPENSES | | | | |
| Investment advisory fees | | | 172,713 | |
| TOTAL EXPENSES | | | 172,713 | |
| NET INVESTMENT INCOME | | | 1,227,635 | |
| | | | | |
| REALIZED AND UNREALIZED GAIN (LOSS) ON INVESTMENTS AND FOREIGN CURRENCY | | | | |
| Net realized gain (loss) on: | | | | |
| Investments | | | (1,618,699 | ) |
| Foreign currency transactions | | | 18,102 | |
| | | | (1,600,597 | ) |
| Net change in unrealized appreciation (depreciation) on: | | | | |
| Investments | | | 1,114,970 | |
| Foreign currency translations | | | (30,548 | ) |
| | | | 1,084,422 | |
| NET REALIZED AND UNREALIZED LOSS ON INVESTMENTS AND FOREIGN CURRENCY | | | (516,175 | ) |
| | | | | |
| NET INCREASE IN NET ASSETS RESULTING FROM OPERATIONS | | $ | 711,460 | |
See accompanying notes to financial statements.
| Arrow Dow Jones Global Yield ETF |
| STATEMENTS OF CHANGES IN NET ASSETS |
| | | For the Year | | | For the Year | |
| | | Ended | | | Ended | |
| | | January 31, 2024 | | | January 31, 2023 | |
| FROM OPERATIONS | | | | | | | | |
| Net investment income | | $ | 1,227,635 | | | $ | 1,220,406 | |
| Net realized loss on investments and foreign currency transactions | | | (1,600,597 | ) | | | (448,121 | ) |
| Net change in unrealized appreciation (depreciation) on investments and foreign currency translations | | | 1,084,422 | | | | (2,169,332 | ) |
| Net increase (decrease) in net assets resulting from operations | | | 711,460 | | | | (1,397,047 | ) |
| | | | | | | | | |
| DISTRIBUTIONS TO SHAREHOLDERS | | | | | | | | |
| Total distributions paid | | | (1,663,965 | ) | | | (1,393,403 | ) |
| Net decrease in net assets resulting from distributions to shareholders | | | (1,663,965 | ) | | | (1,393,403 | ) |
| | | | | | | | | |
| FROM SHARES OF BENEFICIAL INTEREST | | | | | | | | |
| Cost of shares redeemed | | | (4,780,379 | ) | | | (5,939,314 | ) |
| Net decrease in net assets resulting from shares of beneficial interest | | | (4,780,379 | ) | | | (5,939,314 | ) |
| | | | | | | | | |
| TOTAL DECREASE IN NET ASSETS | | | (5,732,884 | ) | | | (8,729,764 | ) |
| | | | | | | | | |
| NET ASSETS | | | | | | | | |
| Beginning of Year | | | 27,737,831 | | | | 36,467,595 | |
| End of Year | | $ | 22,004,947 | | | $ | 27,737,831 | |
| | | | | | | | | |
| SHARE ACTIVITY | | | | | | | | |
| Shares redeemed | | | (375,000 | ) | | | (450,000 | ) |
| Net decrease in shares of beneficial interest outstanding | | | (375,000 | ) | | | (450,000 | ) |
See accompanying notes to financial statements.
| Arrow Dow Jones Global Yield ETF |
| FINANCIAL HIGHLIGHTS |
Per Share Data and Ratios for a Share of Beneficial Interest Outstanding Throughout each Year
| | | For the Year | | | For the Year | | | For the Year | | | For the Year | | | For the Year | |
| | | Ended | | | Ended | | | Ended | | | Ended | | | Ended | |
| | | January 31, 2024 | | | January 31, 2023 | | | January 31, 2022 | | | January 31, 2021 | | | January 31, 2020 | |
| Net asset value, beginning of year | | $ | 13.70 | | | $ | 14.73 | | | $ | 13.57 | | | $ | 15.63 | | | $ | 16.87 | |
| Activity from investment operations: | | | | | | | | | | | | | | | | | | | | |
| Net investment income (1) | | | 0.69 | | | | 0.53 | | | | 0.89 | | | | 0.77 | | | | 1.14 | |
| Net realized and unrealized gain (loss) on investments and foreign currency | | | (0.12 | ) | | | (0.94 | ) | | | 1.08 | | | | (1.96 | ) | | | (1.04 | ) |
| Total from investment operations | | | 0.57 | | | | (0.41 | ) | | | 1.97 | | | | (1.19 | ) | | | 0.10 | |
| Less distributions from: | | | | | | | | | | | | | | | | | | | | |
| Net investment income | | | (0.93 | ) | | | (0.62 | ) | | | (0.81 | ) | | | (0.32 | ) | | | (0.95 | ) |
| Return of capital | | | — | | | | — | | | | — | | | | (0.55 | ) | | | (0.39 | ) |
| Total distributions | | | (0.93 | ) | | | (0.62 | ) | | | (0.81 | ) | | | (0.87 | ) | | | (1.34 | ) |
| Net asset value, end of year | | $ | 13.34 | | | $ | 13.70 | | | $ | 14.73 | | | $ | 13.57 | | | $ | 15.63 | |
| Total return (3) | | | 4.72 | % (4) | | | (2.63 | )% (4) | | | 14.60 | % (4) | | | (6.67 | )% | | | 0.59 | % |
| Net assets, at end of year (000s) | | $ | 22,005 | | | $ | 27,738 | | | $ | 36,468 | | | $ | 38,670 | | | $ | 51,577 | |
| Ratio of net expenses to average net assets | | | 0.75 | % | | | 0.75 | % | | | 0.75 | % | | | 0.75 | % | | | 0.75 | % |
| Ratio of net investment income to average net assets | | | 5.33 | % | | | 3.96 | % | | | 5.98 | % | | | 6.33 | % | | | 6.97 | % |
| Portfolio Turnover Rate (2) | | | 78 | % | | | 59 | % | | | 66 | % | | | 80 | % | | | 72 | % |
| (1) | Per share amounts calculated using the average shares method, which more appropriately presents the per share data for each year. |
| (2) | Portfolio turnover rate excludes portfolio securities received or delivered as a result of processing capital share transactions in Creation Units. |
| (3) | Total return is calculated assuming a purchase of shares at net asset value on the first day and a sale at net asset value on the last day of the period. Distributions are assumed, for the purpose of this calculation, to be reinvested at the ex-dividend date net asset value per share on their respective payment dates. |
| (4) | Includes adjustments in accordance with accounting principles generally accepted in the United States of America and, consequently, the net asset value for financial reporting purposes and the returns based upon those net asset values may differ from the net asset values and returns for shareholder transactions. |
See accompanying notes to financial statements.
| ARROW DOW JONES GLOBAL YIELD ETF |
| NOTES TO FINANCIAL STATEMENTS |
| January 31, 2024 |
The Arrow Dow Jones Global Yield ETF (the “Fund”) is a diversified series of shares of beneficial interest of Arrow ETF Trust (the “Trust”), a statutory trust organized under the laws of the State of Delaware on August 29, 2011 and registered under the Investment Company Act of 1940, as amended (the “1940 Act”), as an open-end management investment company. The Fund’s investment objective is to seek investment results that generally correspond (before fees and expenses) to the price and yield performance of the Dow Jones Global Yield Index (the “Index”). The investment objective is non-fundamental. The Fund commenced operations on May 2, 2012.
| 2. | SIGNIFICANT ACCOUNTING POLICIES |
The following is a summary of significant accounting policies followed by the Fund in preparation of its financial statements. These policies are in conformity with accounting principles generally accepted in the United States of America (“GAAP”). The preparation of financial statements requires management to make estimates and assumptions that affect the reported amounts of assets and liabilities and disclosure of contingent assets and liabilities at the date of the financial statements and the reported amounts of income and expenses for the period. Actual results could differ from those estimates. The Fund is an investment company and accordingly follows the investment company accounting and reporting guidance of the Financial Accounting Standards Board (“FASB”) Accounting Standards Codification Topic 946 “Financial Services – Investment Companies” including FASB Accounting Standards Update (“ASU”) 2013-08.
Securities valuation – Securities listed on an exchange are valued at the last reported sale price at the close of the regular trading session of the exchange on the business day the value is being determined, or in the case of securities listed on NASDAQ at the NASDAQ Official Closing Price (“NOCP”). In the absence of a sale, such securities shall be valued at the last bid price on the day of valuation. Debt securities (other than short-term obligations) are valued each day by an independent pricing service approved by the Trust’s Board of Trustees (the “Board”) using methods that include consideration of current market quotations from a major market maker in the securities and consideration of yields or prices of securities of comparable quality, coupon, maturity and type. Investments valued in currencies other than the U.S. dollar are converted to U.S. dollars using exchange rates obtained from pricing services. If market quotations are not readily available or if Arrow Investment Advisors, LLC (the “Advisor”) believes the market quotations are not reflective of market value, securities will be valued at their fair value as determined in good faith by the Advisor and in accordance with the Trust’s Portfolio Securities Valuation Procedures (the “Procedures”) as the Valuation Designee. The Procedures consider, among others, the following factors to determine a security’s fair value: the nature and pricing history (if any) of the security; whether any dealer quotations for the security are available; and possible valuation methodologies that could be used to determine the fair value of the security. Fair value may also be used by the Valuation Designee if extraordinary events occur after the close of the relevant world market but prior to the NYSE close. Short-term debt obligations having 60 days or less remaining until maturity, at time of purchase, may be valued at amortized cost.
| ARROW DOW JONES GLOBAL YIELD ETF |
| NOTES TO FINANCIAL STATEMENTS (Continued) |
| January 31, 2024 |
The Fund utilizes various methods to measure the fair value of all of its investments on a recurring basis. GAAP establishes a hierarchy that prioritizes inputs to valuation methods. The three levels of input are:
Level 1 – Unadjusted quoted prices in active markets for identical assets and liabilities that the Fund has the ability to access.
Level 2 – Observable inputs other than quoted prices included in Level 1 that are observable for the asset or liability, either directly or indirectly. These inputs may include quoted prices for the identical instrument in an inactive market, prices for similar instruments, interest rates, prepayment speeds, credit risk, yield curves, default rates and similar data.
Level 3 – Unobservable inputs for the asset or liability, to the extent relevant observable inputs are not available, representing the Fund’s own assumptions about the assumptions a market participant would use in valuing the asset or liability, and would be based on the best information available.
The availability of observable inputs can vary from security to security and is affected by a wide variety of factors, including, for example, the type of security, whether the security is new and not yet established in the marketplace, the liquidity of markets, and other characteristics particular to the security. To the extent that valuation is based on models or inputs that are less observable or unobservable in the market, the determination of fair value requires more judgment. Accordingly, the degree of judgment exercised in determining fair value is greatest for instruments categorized in Level 3.
The inputs used to measure fair value may fall into different levels of the fair value hierarchy. In such cases, for disclosure purposes, the level in the fair value hierarchy within which the fair value measurement falls in its entirety, is determined based on the lowest level input that is significant to the fair value measurement in its entirety.
The inputs or methodology used for valuing securities are not necessarily an indication of the risk associated with investing in those securities. The following table summarizes the inputs used as of January 31, 2024 for the Fund’s assets measured at fair value:
| Assets * | | Level 1 | | | Level 2 | | | Level 3 | | | Total | |
| Common Stocks + | | $ | 10,016,884 | | | $ | — | | | $ | — | | | $ | 10,016,884 | |
| Corporate Bonds | | | — | | | | 4,329,026 | | | | — | | | | 4,329,026 | |
| Master Limited Partnerships | | | 2,981,975 | | | | — | | | | — | | | | 2,981,975 | |
| Non U.S. Government & Agencies | | | — | | | | 4,366,308 | | | | — | | | | 4,366,308 | |
| Total | | $ | 12,998,859 | | | $ | 8,695,334 | | | $ | — | | | $ | 21,694,193 | |
| * | See Schedule of Investments for industry classification. |
| + | Includes Level 3 securities valued at $0. |
| ARROW DOW JONES GLOBAL YIELD ETF |
| NOTES TO FINANCIAL STATEMENTS (Continued) |
| January 31, 2024 |
The following is a reconciliation for the Fund for which Level 3 inputs were used in determining value:
| | | Beginning | | | | | | | | | | | | | | | | | | | | | Ending | |
| | | balance | | | Total | | | Change in | | | | | | | | | | | | Net transfers | | | balance | |
| | | January 31, | | | Realized | | | unrealized | | | | | | Net | | | | | | in/(out) of | | | January | |
| | | 2023 | | | Gain/(Loss) | | | appreciation | | | Conversion | | | Purchases | | | Net Sales | | | Level 3 | | | 31, 2024 | |
| Federal Grid Company Unified Energy System PJSC | | $ | — | | | $ | — | | | $ | — | | | $ | — | | | $ | — | | | $ | — | | | $ | — | | | $ | — | |
| Globaltrans Investment plc | | | — | | | | — | | | | — | | | | — | | | | — | | | | — | | | | — | | | | — | |
| Mobile TeleSystems Public Joint Stock Company | | | — | | | | — | | | | — | | | | — | | | | — | | | | — | | | | — | | | | — | |
| Severstal PAO | | | — | | | | — | | | | — | | | | — | | | | — | | | | — | | | | — | | | | — | |
| Shimao Group Holdings Ltd. | | | 203,870 | | | | (167,934 | ) | | | 32,181 | | | | — | | | | — | | | | (68,117 | ) | | | — | | | | — | |
| Sunac Chaina Holdings Ltd. | | | 197,759 | | | | (139,019 | ) | | | 31,138 | | | | — | | | | — | | | | (89,878 | ) | | | — | | | | — | |
Quantitative disclosures of unobservable inputs and assumptions used by the Fund are below:
| | | | | | | | | | Single Input or |
| Common Stock | | Fair Value | | | Valuation Techniques | | Unobservable Input | | Range of Inputs |
| Federal Grid Company Unified Energy System PJSC | | $ | — | | | Expected Recovery | | Discount for Lack of Marketability | | 100% |
| Globaltrans Investment plc | | $ | — | | | Expected Recovery | | Discount for Lack of Marketability | | 100% |
| Mobile TeleSystems Public Joint Stock Company | | $ | — | | | Expected Recovery | | Discount for Lack of Marketability | | 100% |
| Severstal PAO | | $ | — | | | Expected Recovery | | Discount for Lack of Marketability | | 100% |
In accordance with the Fund’s investment objectives, the Fund may have increased or decreased exposure to one or more of the following risk factors defined below:
Real Estate Investment Trust Risk (REIT) – Investments in securities of real estate companies involve risks including, among others, adverse changes in national, state or local real estate conditions; obsolescence of properties; changes in the availability, cost and terms of mortgage funds; and the impact of changes in environmental laws. The value of a REIT can depend on the structure of and cash flow generated by the REIT. In addition, like mutual funds, externally managed REITs have expenses, including advisory and administration fees, which are paid by their shareholders. Further, the failure of a company to qualify as a REIT or comply with applicable federal tax requirements could have adverse consequences for the Fund, including significantly reducing return to the Fund on its investment. REITs determine the characterization of their income annually and may characterize a portion of their distributions as a return of capital or capital gain.
Master Limited Partnerships – The Fund invests in master limited partnerships (“MLPs”) which are publicly traded partnerships engaged in, among other things, the transportation, storage and processing of minerals and natural resources, and are treated as partnerships for U.S. federal income tax purposes. By confining their operations to these specific activities, their interests, or units, are able to trade on public securities exchanges exactly like the shares of a corporation, without entity level taxation. To qualify as an MLP and to not be taxed as a corporation, a partnership must receive at least 90% of its income from qualifying sources as set forth in Section 7704(d) of the Internal Revenue Code of 1986, as amended (the “Internal Revenue Code”). These qualifying sources include natural resource based activities such as the processing, transportation and storage of mineral or natural resources. MLPs generally have two classes of owners, the general partner and limited partners. The general partner of an MLP is typically owned by a major energy company, an investment fund, the direct management of the MLP, or is an entity owned by one or more of such parties. The general partner
| ARROW DOW JONES GLOBAL YIELD ETF |
| NOTES TO FINANCIAL STATEMENTS (Continued) |
| January 31, 2024 |
may be structured as a private or publicly traded corporation or other entity. The general partner typically controls the operations and management of the MLP through an up to 2% equity interest in the MLP plus, in many cases, ownership of common units and subordinated units. Limited partners typically own the remainder of the partnership, through ownership of common units, and have a limited role in the partnership’s operations and management.
MLPs are typically structured such that common units and general partner interests have first priority to receive quarterly cash distributions up to an established minimum amount (“minimum quarterly distributions” or “MQD”). Common and general partner interests also accrue arrearages in distributions to the extent the MQD is not paid. Once common and general partner interests have been paid, subordinated units receive distributions of up to the MQD; however, subordinated units do not accrue arrearages. Distributable cash in excess of the MQD is paid to both common and subordinated units and is distributed to both common and subordinated units generally on a pro rata basis. The general partner is also eligible to receive incentive distributions if the general partner operates the business in a manner which results in distributions paid per common unit surpassing specified target levels. As the general partner increases cash distributions to the limited partners, the general partner receives an increasingly higher percentage of the incremental cash distributions. MLPs determine the characterization of their income annually and may characterize a portion of their distributions as a return of capital or capital gain.
Market Risk – The net asset value of the Fund will fluctuate based on changes in the value of the individual securities and ETFs in which the Fund invests. The increasing interconnectivity between global economies and financial markets increases the likelihood that events or conditions in one region or financial market may adversely impact issuers in a different country, region or financial market. Securities in the Fund’s portfolio may underperform due to inflation (or expectations for inflation), interest rates, global demand for particular products or resources, natural disasters, climate change or climate related events, pandemics, epidemics, terrorism, regulatory events and governmental or quasi-governmental actions. The occurrence of global events similar to those in recent years may result in market volatility and may have long term effects on both the U.S. and global financial markets.
Dividends and Distributions to Shareholders – Dividends from net investment income, if any, are declared and paid monthly. Distributable net realized capital gains, if any, are declared and distributed annually. Dividends from net investment income and distributions from net realized gains are determined in accordance with federal income tax regulations, which may differ from GAAP. These “book/tax” differences are considered either temporary (e.g., deferred losses) or permanent in nature. To the extent these differences are permanent in nature, such amounts are reclassified within the composition of net assets based on their federal tax-basis treatment; temporary differences do not require reclassification. Monthly distributions in excess of ordinary taxable income are treated as returns of capital. Dividends and distributions to shareholders are recorded on the ex-dividend date.
Security Transactions and Related Income – Security transactions are accounted for on the trade date. Interest income is recognized on an accrual basis. Discounts and premiums on debt securities are amortized over their respective lives using the effective interest method, except certain callable debt securities that are held at premium and will be amortized to the earliest call date. Dividend
| ARROW DOW JONES GLOBAL YIELD ETF |
| NOTES TO FINANCIAL STATEMENTS (Continued) |
| January 31, 2024 |
income is recorded on the ex-dividend date. Realized gains or losses from sales of securities are determined by comparing the identified cost of the security lot sold with the net sales proceeds. Withholding taxes on foreign dividends have been provided for in accordance with the Fund’s understanding of the applicable country’s tax rules and rates.
Federal Income Taxes – The Fund intends to continue to comply with the requirements of the Internal Revenue Code applicable to regulated investment companies and to distribute all of its taxable income to its shareholders. Therefore, no provision for federal income tax is required. The Fund recognizes the tax benefits of uncertain tax positions only where the position is “more likely than not” to be sustained assuming examination by tax authorities. Management has analyzed the Fund’s tax positions, and has concluded that no liability for unrecognized tax benefits should be recorded related to uncertain tax positions taken on returns filed for open tax years ended January 31, 2021 to January 31, 2023, or expected to be taken in the Fund’s January 31, 2024 year-end tax returns. The Fund identifies its major tax jurisdictions as U.S. federal, and foreign jurisdictions where the Fund makes significant investments. The Fund recognizes interest and penalties, if any, related to unrecognized tax benefits as income tax expenses, in the Statement of Operations. For the year ended January 31, 2024, the Fund did not incur any interest or penalties. The Fund is not aware of any tax positions for which it is reasonably possible that the total amounts of unrecognized tax benefits will change materially in the next twelve months.
Foreign Currency – The accounting records of the Fund are maintained in U.S. dollars. Investment securities and other assets and liabilities denominated in a foreign currency, and income receipts and expense payments are translated into U.S. dollars using the prevailing exchange rate at the London market close. Purchases and sales of securities are translated into U.S. dollars at the contractual currency rates established at the approximate time of the trade. Net realized gains and losses on foreign currency transactions represent net gains and losses from currency realized between the trade and settlement dates on securities transactions, gains and losses on the purchase and sale of foreign currencies and the difference between income accrued versus income received. The effects of changes in foreign currency exchange rates on investments in securities are included with the net realized and unrealized gain or loss on investment securities. Unrealized gains and losses resulting from changes in foreign exchange rates on investments are not isolated from changes in the valuation of securities held.
Indemnification – The Trust indemnifies its officers and Trustees for certain liabilities that may arise from the performance of their duties to the Trust. Additionally, in the normal course of business, the Fund enters into contracts that contain a variety of representations and warranties and which provide general indemnities. The Fund’s maximum exposure under these arrangements is unknown, as this would involve future claims that may be made against the Fund that have not yet occurred. However, based on experience, the risk of loss due to these warranties and indemnities appears to be remote.
| 3. | INVESTMENT TRANSACTIONS |
For the year ended January 31, 2024, cost of purchases and proceeds from sales of portfolio securities (excluding in-kind transactions and short-term investments), amounted to $17,817,014 and $22,237,288, respectively.
| ARROW DOW JONES GLOBAL YIELD ETF |
| NOTES TO FINANCIAL STATEMENTS (Continued) |
| January 31, 2024 |
For the year ended January 31, 2024, cost of purchases and proceeds from sales of portfolio securities for in-kind transactions amounted to $0 and $0, respectively.
| 4. | INVESTMENT ADVISORY AGREEMENT AND TRANSACTIONS WITH RELATED PARTIES |
The business activities of the Fund are overseen by the Board, which is responsible for the overall management of the Fund. The Advisor serves as the Fund’s investment advisor pursuant to an investment advisory agreement with the Trust on behalf of the Fund (the “Advisory Agreement”). The Trust has entered into a Global Custody Agreement with Brown Brothers Harriman & Co. to serve as custodian and to act as transfer and shareholder services agent. The Trust has also entered into an ETF Distribution Agreement (the “Distribution Agreement”) with Archer Distributors, LLC (the “Distributor”) to serve as the distributor for the Fund. Archer Distributors, LLC, an affiliate of the Advisor is also a party to the Distribution Agreement and provides marketing services to the Fund, including responsibility for all the Fund’s marketing and advertising materials.
Pursuant to the Advisory Agreement, the Advisor, under the oversight of the Board, directs the daily operations of the Fund and supervises the performance of administrative and professional services provided by others. As compensation for its services and the related expenses borne by the Advisor, the Fund pays the Advisor a unitary management fee, computed and accrued daily and paid monthly, at an annual rate of 0.75% of the Fund’s average daily net assets. For the year ended January 31, 2024, the Fund incurred $172,713 in advisory fees.
The Advisor’s unitary management fee is designed to pay the Fund’s expenses and to compensate the Advisor for providing services for the Fund. Out of the unitary management fee, the Advisor pays substantially all expenses of the Fund, including the costs of transfer agency, custody, fund administration, legal, audit and other services and Independent Trustees’ fees, except for payment of advisory fees, acquired fund fees and expenses, payments under the Fund’s 12b-1 plan, brokerage expenses, taxes, interest (including borrowing costs and dividend expenses on securities sold short), litigation expense and other extraordinary expenses (including litigation to which the Trust or the Fund may be a party and indemnification of the Trustees and officers with respect thereto). The Advisor, and not the Fund’s shareholders, would benefit from any reduction in fees paid for third-party services, including reductions based on increases in net assets.
The Trust, with respect to the Fund, has adopted a distribution and service plan (“Plan”) pursuant to Rule 12b-1 under the 1940 Act. Under the Plan, the Fund is authorized to pay distribution fees to the Distributor and other firms that provide distribution and shareholder services (“Service Providers”). If a Service Provider provides these services, the Fund may pay fees at an annual rate not to exceed 0.25% of average daily net assets, pursuant to Rule 12b-1 under the 1940 Act. No distribution or service fees are currently paid by the Fund and there are no current plans to impose these fees. In the event Rule 12b-1 fees were charged, over time they would increase the cost of an investment in the Fund.
| ARROW DOW JONES GLOBAL YIELD ETF |
| NOTES TO FINANCIAL STATEMENTS (Continued) |
| January 31, 2024 |
Ultimus Fund Solutions, LLC (“UFS”) – UFS provides administration and fund accounting services to the Fund. Pursuant to a separate servicing agreement with UFS, the Advisor, on behalf of the Fund, pays UFS customary fees for providing administration and fund accounting services to the Fund. Certain officers of the Trust are also officers of UFS, and are not paid any fees directly by the Trust for serving in such capacities.
Blu Giant, LLC ( “Blu Giant”) – Blu Giant, an affiliate of UFS, provides EDGAR conversion and filing services as well as print management services for the Fund on an ad-hoc basis. For the provision of these services, Blu Giant receives customary fees from the Advisor, on behalf of the Fund.
| 5. | CAPITAL SHARE TRANSACTIONS |
Shares are not individually redeemable and may be redeemed by the Fund at NAV only in large blocks known as “Creation Units.” Shares are created and redeemed by the Fund only in Creation Unit size aggregations of 75,000 shares. Only Authorized Participants are permitted to purchase or redeem Creation Units from the Fund. An Authorized Participant is either (i) a broker-dealer or other participant in the clearing process through the Continuous Net Settlement System of the National Securities Clearing Corporation or (ii) a Depository Trust Company participant and, in each case, must have executed a Participant Agreement with the distributor. Such transactions are generally permitted on an in-kind basis, with a balancing cash component to equate the transaction to the NAV per share of the Fund on the transaction date. Cash may be substituted equivalent to the value of certain securities generally when they are not available in sufficient quantity for delivery, not eligible for trading by the Authorized Participant or as a result of other market circumstances. In addition, the Fund may impose transaction fees on purchases and redemptions of Fund shares to cover the custodial and other costs incurred by the Fund in effecting trades. A fixed fee payable to the custodian may be imposed on each creation and redemption transaction regardless of the number of Creation Units involved in the transaction (“Fixed Fee”). Purchases and redemptions of Creation Units for cash or involving cash-in-lieu are required to pay an additional variable charge to compensate the Fund and its ongoing shareholders for brokerage and market impact expenses relating to Creation Unit transactions (“Variable Charge,” and together with the Fixed Fee, the “Transaction Fees”). Transaction Fees may be used to cover the custodial and other costs incurred by the Fund.
The Transaction Fees for the Fund are listed in the table below:
| Fixed Fee | Variable Charge |
| $3,170 | 2.00%* |
| * | The maximum Transaction Fee may be up to 2.00% of the amount invested. |
| ARROW DOW JONES GLOBAL YIELD ETF |
| NOTES TO FINANCIAL STATEMENTS (Continued) |
| January 31, 2024 |
| 6. | DISTRIBUTIONS TO SHAREHOLDERS AND TAX COMPONENTS OF CAPITAL |
Dividends received by the Fund are allocated between investment income, capital gains and return of capital based on estimates. Such estimates are based on information provided by each portfolio company and other industry sources. These estimates may subsequently be revised based on actual allocations received from the portfolio companies after final tax reporting information is received. The
return of capital portion of the dividends is a reduction to investment income that results in an equivalent reduction in the cost basis of the associated investments.
The tax character of distributions paid during the following years was as follows:
| | | Fiscal Year Ended | | | Fiscal Year Ended | |
| | | January 31, 2024 | | | January 31, 2023 | |
| Ordinary Income | | $ | 1,663,965 | | | $ | 1,393,403 | |
| Long-Term Capital Gain | | | — | | | | — | |
| Return of Capital | | | — | | | | — | |
| | | $ | 1,663,965 | | | $ | 1,393,403 | |
As of January 31, 2024, the components of accumulated earnings/(deficit) on a tax basis were as follows:
| Undistributed | | | Undistributed | | | Post October Loss | | | Capital Loss | | | Other | | | Unrealized | | | Total | |
| Ordinary | | | Long-Term | | | and | | | Carry | | | Book/Tax | | | Appreciation/ | | | Distributable Earnings/ | |
| Income | | | Gains | | | Late Year Loss | | | Forwards | | | Differences | | | (Depreciation) | | | (Accumulated Deficit) | |
| $ | 1,221,489 | | | $ | — | | | $ | — | | | $ | (77,528,512 | ) | | $ | — | | | $ | (2,356,526 | ) | | $ | (78,663,549 | ) |
The difference between book basis and tax basis unrealized appreciation, accumulated net investment income (loss) and accumulated net realized loss from investments and foreign currency transactions is primarily attributable to the tax deferral of losses on wash sales, mark-to-market on passive foreign investment companies, and tax adjustments for partnerships and C-Corporation return of capital distributions. The unrealized appreciation (depreciation) in the table above includes unrealized foreign currency losses of $(103,826).
At January 31, 2024, the Fund had capital loss carry forwards for federal income tax purposes available to offset future capital gains as follows:
| Short-Term | | | Long-Term | | | Total | | | CLCF Utilized | |
| $ | 22,329,818 | | | $ | 55,198,694 | | | $ | 77,528,512 | | | $ | — | |
| 7. | AGGREGATE UNREALIZED APPRECIATION AND DEPRECIATION – TAX BASIS |
| | | | Gross Unrealized | | | Gross Unrealized | | | Net Unrealized | |
| Tax Cost | | | Appreciation | | | Depreciation | | | Depreciation | |
| $ | 23,946,893 | | | $ | 3,584,947 | | | $ | (5,837,647 | ) | | $ | (2,252,700 | ) |
| ARROW DOW JONES GLOBAL YIELD ETF |
| NOTES TO FINANCIAL STATEMENTS (Continued) |
| January 31, 2024 |
| 8. | RECENT REUGULATORY UPDATE |
On January 24, 2023, the SEC adopted rule and form amendments to require mutual funds and ETFs to transmit concise and visually engaging streamlined annual and semiannual reports to shareholders that highlight key information. Other information, including financial statements, will not appear in a streamlined shareholder report but must be available online, delivered free of charge upon request, and filed on a semiannual basis on Form N-CSR. The rule and form amendments have a compliance date of July 24, 2024. At this time, management is evaluating the impact of these amendments on the shareholder reports for the Funds.
Subsequent events after the date of the Statement of Assets and Liabilities have been evaluated through the date the financial statements were issued.
Management has determined that no events or transactions occurred requiring adjustment or disclosure in the financial statements, other than the following:
Distributions: The Board declared the following distribution after January 31, 2024:
| Fund | | Distribution Per Share | | Record Date | | Payable Date |
| Arrow Dow Jones Global Yield ETF | | $0.1106 | | 2/20/2024 | | 2/26/2024 |
| Arrow Dow Jones Global Yield ETF | | $0.0834 | | 3/19/2024 | | 3/25/2024 |
REPORT OF INDEPENDENT REGISTERED PUBLIC ACCOUNTING FIRM
To the Shareholders of Arrow Dow Jones Global Yield ETF
and Board of Trustees of Arrow ETF Trust
Opinion on the Financial Statements
We have audited the accompanying statement of assets and liabilities, including the schedule of investments, of Arrow ETF Trust comprising Arrow Dow Jones Global Yield ETF (the “Fund”) as of January 31, 2024, the related statement of operations for the year then ended, the statements of changes in net assets and financial highlights for each of the two years in the period then ended, and the related notes (collectively referred to as the “financial statements”). In our opinion, the financial statements present fairly, in all material respects, the financial position of the Fund as of January 31, 2024, the results of its operations for the year then ended, and the changes in net assets and financial highlights for the two years then ended, in conformity with accounting principles generally accepted in the United States of America.
The Fund’s financial highlights for the years ended January 31, 2022, and prior, were audited by other auditors whose report dated March 31, 2022, expressed an unqualified opinion on those financial statements and financial highlights.
Basis for Opinion
These financial statements are the responsibility of the Fund’s management. Our responsibility is to express an opinion on the Fund’s financial statements based on our audit. We are a public accounting firm registered with the Public Company Accounting Oversight Board (United States) (“PCAOB”) and are required to be independent with respect to the Fund in accordance with the U.S. federal securities laws and the applicable rules and regulations of the Securities and Exchange Commission and the PCAOB.
We conducted our audit in accordance with the standards of the PCAOB. Those standards require that we plan and perform the audit to obtain reasonable assurance about whether the financial statements are free of material misstatement whether due to error or fraud.
Our audit included performing procedures to assess the risks of material misstatement of the financial statements, whether due to error or fraud, and performing procedures that respond to those risks. Such procedures included examining, on a test basis, evidence regarding the amounts and disclosures in the financial statements. Our procedures included confirmation of securities owned as of January 31, 2024, by correspondence with the custodian and broker. Our audit also included evaluating the accounting principles used and significant estimates made by management, as well as evaluating the overall presentation of the financial statements. We believe that our audit provides a reasonable basis for our opinion.
We have served as the Fund’s auditor since 2023.

COHEN & COMPANY, LTD.
Philadelphia, Pennsylvania
March 27, 2024
| ARROW DOW JONES GLOBAL YIELD ETF |
| Additional Information (Unaudited) |
| January 31, 2024 |
FOREIGN TAX CREDIT (Unaudited)
Arrow Dow Jones Global Yield ETF intends to elect to pass through to shareholders the income tax credit for taxes paid to foreign countries. Foreign source income and foreign tax expense per outstanding share as of fiscal years ended January 31, 2024 and January 31, 2023 were as follows:
| For fiscal year ended | | | | | | |
| 1/31/2024 | | Foreign Taxes Paid | | | Foreign Source Income | |
| | | $ | 0.04 | | | $ | 0.35 | |
| | | | | | | | | |
| For fiscal year ended | | | | | | |
| 1/31/2023 | | Foreign Taxes Paid | | | Foreign Source Income | |
| | | $ | 0.02 | | | $ | 0.29 | |
| Arrow Dow Jones Global Yield ETF |
| EXPENSE EXAMPLE (Unaudited) |
| January 31, 2024 |
As a shareholder of the Fund, you incur ongoing costs, including management fees and other Fund expenses. This example is intended to help you understand your ongoing costs (in dollars) of investing in the Fund and to compare these costs with the ongoing costs of investing in other exchange traded funds. This example does not take into account transaction costs, such as brokerage commissions that you may pay on your purchases and sales of shares of the Fund.
The example is based on an investment of $1,000 invested at the beginning of the period and held for the entire period from August 1, 2023 through January 31, 2024.
Actual Expenses
The “Actual” line in the table below provides information about actual account values and actual expenses. You may use the information below, together with the amount you invested, to estimate the expenses that you paid over the period. Simply divide your account value by $1,000 (for example, an $8,600 account value divided by $1,000 = 8.6), then multiply the result by the number in the table under the heading entitled “Expenses Paid During Period” to estimate the expenses you paid on your account during this period.
Hypothetical Example for Comparison Purposes
The “Hypothetical” line in the table below provides information about hypothetical account values and hypothetical expenses based on the Fund’s actual expense ratio and an assumed rate of return of 5% per year before expenses, which is not the Fund’s actual return. The hypothetical account values and expenses may not be used to estimate the actual ending account balances or expenses you paid for the period. You may use this information to compare this 5% hypothetical example with the 5% hypothetical examples that appear in the shareholder reports of other funds.
Please note that the expenses shown in the table are meant to highlight your ongoing costs only and do not reflect any transactional costs. Therefore, the table is useful in comparing ongoing costs only, and will not help you determine the relative total costs of owning different funds. In addition, if these transactional costs were included, your costs would have been higher.
| | | Beginning | | Ending | | Expenses Paid | | Expenses Ratio |
| | | Account Value | | Account Value | | During Period* | | During Period** |
| | | 8/1/2023 | | 1/31/2024 | | 8/1/23 - 1/31/2024 | | 8/1/23 - 1/31/2024 |
| Actual | | $1,000.00 | | $1,046.20 | | $3.86 | | 0.75% |
| Hypothetical | | | | | | | | |
| (5% return before expenses) | | $1,000.00 | | $1,021.43 | | $3.81 | | 0.75% |
| * | “Actual” expense information for the Fund is for the period from August 1, 2023 to January 31, 2024. Actual expenses are equal to the Fund’s annualized net expense ratio multiplied by 184/365 (to reflect the period from August 1, 2023 to January 31, 2024). “Hypothetical” expense information for the Fund is presented on the basis of the full one-half year period to enable comparison to other funds. It is based on assuming the same net expense ratio and average account value over the period, but it is multiplied by 184/365 (to reflect the full half-year period). |
| Arrow Dow Jones Global Yield ETF |
| SUPPLEMENTAL INFORMATION (Unaudited) |
| January 31, 2024 |
FACTORS CONSIDERED BY THE INDEPENDENT TRUSTEES IN APPROVING THE INVESTMENT ADVISORY AGREEMENT
At a meeting held September 27, 2023 (the “Meeting”), the Board of Trustees (the “Board”) including the Trustees who are not “interested persons”, as such term is defined under Section 2(a)(19) of the Investment Company Act of 1940, as amended (the “Independent Trustees”), considered the renewal of the investment advisory agreement (the “Advisory Agreement”) between the Arrow ETF Trust (the “Trust”), and Arrow Investment Advisors, LLC (“Arrow” or the “Adviser”) with respect to the Arrow Dow Jones Global Yield ETF (the “Global Yield ETF” or the “Fund”).
The Board, including the Independent Trustees, unanimously approved continuance of the Advisory Agreement based upon its review of the written materials provided at the Meeting, the reports provided at each quarterly meeting of the Board and the Board’s discussions with key personnel of the Adviser. In their deliberations, the Trustees did not identify any particular information that was all-important or controlling, and individual Trustees may have attributed different weights to the various factors. Below is a summary of the Board’s conclusions regarding various factors relevant to approval of continuance of the Advisory Agreement:
Nature, Extent and Quality of Services. In considering the continuance of the Advisory Agreement, the Board considered the nature, extent and quality of services that Arrow provided to the Fund, including Arrow’s personnel and resources. The Board reviewed the services Arrow provided in serving as investment adviser and the backgrounds of the personnel providing services to the Fund, including portfolio managers. They also reviewed information provided regarding risk management and compliance and regulatory matters. The Board acknowledged Arrow’s efforts and resources with respect to various regulatory initiatives, including with respect to derivatives and valuation. The Board also considered Arrow’s financial position. The Board concluded that the services Arrow provided were satisfactory.
Performance. The Board reviewed performance information the Adviser provided for the Fund compared to the Fund’s Benchmark Index, other relevant indexes, and a group of comparable funds selected by the Adviser (the “Peer Group”) for the year to date, one-, three-, five-, ten-year and since inception periods ended July 31, 2023. The Board also received information on the construction of the Fund’s Peer Group.
The Board reviewed the Fund’s total returns compared to the total returns of its Peer Group and its Benchmark Index (Dow Jones Global Composite Yield Index). The Board considered the performance of the Fund against its Peer Group and its Benchmark Index for the year to date, one-, three-, five-, ten-year and since inception periods. The Board considered the Fund’s strong relative performance over the Peer Group average. The Board concluded that the performance of the Fund was satisfactory.
Fees and Expenses. The Board reviewed the Fund’s contractual advisory fee and expense ratio taking into account the Fund’s net asset size, and reviewed information comparing the advisory fee and expense ratio to those of the Fund’s Peer Group and Morningstar category. The Board observed that the advisory fee was higher but reasonably aligned with the Peer Group average. The Board discussed the level of work involved in management and oversight of the Fund, including services that Arrow performed
| Arrow Dow Jones Global Yield ETF |
| SUPPLEMENTAL INFORMATION (Unaudited)(Continued) |
| January 31, 2024 |
on behalf of the Fund. In light of the information provided and their deliberations, the Board concluded that the Fund’s advisory fee was not unreasonable.
Profitability. The Board reviewed the profitability of Arrow with respect to the Fund. The Board considered the methodology for calculating profitability. Using such methodology, the Board noted that Arrow experienced a loss from the Fund, without considering marketing related costs.
Economies of Scale. The Board considered whether Arrow realized economies of scale with respect to its management of the Fund. The Board noted the Fund had yet reached an asset level where Arrow could likely realize meaningful economies of scale. They considered the constraints on Fund growth, including market environment, limited access to platforms, and Fund size. The Board observed that economies of scale would be considered in the future as the Fund’s asset level grows.
Fall-out Benefits. Because of its relationship with the Fund, Arrow and its affiliates may receive certain benefits. The Board noted that an affiliate of the Adviser serves as underwriter of the Fund and receives modest compensation from Rule 12b-1 payments as a result.
Conclusion. Based on all of the information considered and the conclusions reached, the Board determined that that the continuance of the Advisory Agreement be approved.
| Arrow Dow Jones Global Yield ETF |
| SUPPLEMENTAL INFORMATION (Unaudited) |
| January 31, 2024 |
Unless otherwise noted, the address of each Trustee and Officer is 6100 Chevy Chase Drive, Suite 100, Laurel, MD 20707.
Independent Trustees:
Name, Address,
and Year of Birth | Position(s)/Term
of Office(1) | Principal Occupation(s) During
the Past 5 Years | Number of
Portfolios in
Fund
Complex
Overseen by
Trustee (2) | Other Directorships
Held by Trustee |
Robert Andrialis
Born in 1944 | Trustee since 2014 | Independent Consultant (2016 – present). | 7 | Arrow Investments Trust |
Paul Montgomery
Born in 1953 | Trustee since 2011 | Director of Research, Scotia Partners, LLC (2012 - present). | 7 | Arrow Investments Trust |
Thomas Sarkany
Born in 1946 | Trustee since 2014 | Founder and President, TTS Consultants, LLC (2010 – present). | 7 | Arrow Investments Trust, Northern Lights Fund Trust II, Northern Lights Fund Trust IV; Aquila Distributors, LLC |
| (1) | The term of office for each Trustee will continue indefinitely until the individual resigns or is removed. |
| (2) | The “Fund Complex” includes Arrow Investments Trust, a registered management investment company, in addition to the Trust. |
Arrow Dow Jones Global Yield ETF
SUPPLEMENTAL INFORMATION (Unaudited)(Continued)
January 31, 2024
Interested Trustees and Officers:
Name, Address,
and Year of Birth | Position(s)/Term
of Office(1) | Principal Occupation(s) During
the Past 5 Years | Number of
Funds in the
Fund
Complex
Overseen by
Trustee (2) | Other Directorships
Held by Trustee |
Joseph Barrato*
Born in 1965 | Chairman of the Board, Trustee, President, and Principal Executive Officer since 2011 | Founder and Chief Executive Officer, Arrow Investment Advisors, LLC (2006- present). | 7 | Arrow Investments Trust |
Christopher Lewis
Born in 1970 | Chief Compliance Officer since 2021; Previously from 2016–2018 | Chief Compliance Officer of Fund Complex (2016–2018; 2021–present); Chief Compliance Officer, Arrow Investment Advisors, LLC (2017– 2018; 2021–present); Founder, The Law Offices of Christopher H. Lewis (2019–present); General Counsel, Finitive LLC (2018) | N/A | N/A |
Timothy Burdick(3)
Born in 1986 | Secretary since 2020 | Vice President and Managing Counsel, Ultimus Fund Solutions (2022– present); Assistant Vice President, Ultimus Fund Solutions, LLC (2019 – 2022); Senior Program Compliance Manager, CJ Affiliate (2016-2019). | N/A | N/A |
Sam Singh(3)
Born in 1976 | Principal Financial Officer and Treasurer since 2013 | Vice President, Ultimus Fund Solutions, LLC (2015 - present). | N/A | N/A |
| * | Joseph Barrato is considered to be an “interested person” of the Trust, as that term is defined in the 1940 Act, because he is a controlling interest holder of the investment advisor to the Fund, Arrow Investment Advisors, LLC. |
| (1) | The term of office for each Trustee will continue indefinitely until the individual resigns or is removed. Officers of the Trust are elected annually. |
| (2) | The “Fund Complex” includes Arrow Investments Trust, a registered management investment company, in addition to the Trust. |
| (3) | The business address of this officer is 4221 North 203rd Street, Suite 100, Elkhorn, Nebraska 68022-3474. |
The Fund’s Statement of Additional Information includes additional information about the Trustees and is available free of charge, upon request, by calling toll-free at: 1-877-277-6933.
PRIVACY NOTICE
REV. NOVEMBER 2011
| FACTS | WHAT DOES ARROW ETF TRUST DO WITH YOUR PERSONAL INFORMATION? |
| | |
| Why? | Financial companies choose how they share your personal information. Federal law gives consumers the right to limit some but not all sharing. Federal law also requires us to tell you how we collect, share, and protect your personal information. Please read this notice carefully to understand what we do. |
| | |
| What? | The types of personal information we collect and share depend on the product or service you have with us. This information can include: |
| | ■ Social Security number ■ Assets ■ Retirement Assets ■ Transaction History ■ Checking Account Information | ■ Purchase History ■ Account Balances ■ Account Transactions ■ Wire Transfer Instructions |
| | |
| | When you are no longer our customer, we continue to share your information as described in this notice. |
| | |
| How? | All financial companies need to share customers’ personal information to run their everyday business. In the section below, we list the reasons financial companies can share their customers’ personal information; the reasons Arrow ETF Trust chooses to share; and whether you can limit this sharing. |
| Reasons we can share your personal information | Does Arrow ETF
Trust share? | Can you limit this sharing? |
For our everyday business purposes – such as to process your transactions, maintain your account(s), respond to court orders and legal investigations, or report to credit bureaus | Yes | No |
For our marketing purposes – to offer our products and services to you | No | We don’t share |
| For joint marketing with other financial companies | No | We don’t share |
For our affiliates’ everyday business purposes – information about your transactions and experiences | No | We don’t share |
For our affiliates’ everyday business purposes – information about your creditworthiness | No | We don’t share |
| For nonaffiliates to market to you | No | We don’t share |
| Questions? | Call 1-877-277-6933 |
| Who is providing this notice? | Arrow ETF Trust |
| What we do |
| How does Arrow ETF Trust protect my personal information? | To protect your personal information from unauthorized access and use, we use security measures that comply with federal law. These measures include computer safeguards and secured files and buildings. Our service providers are held accountable for adhering to strict policies and procedures to prevent any misuse of your nonpublic personal information. |
| How does Arrow ETF Trust collect my personal information? | We collect your personal information, for example, when you ■ Open an account ■ Provide account information ■ Give us your contact information ■ Make deposits or withdrawals from your account ■ Make a wire transfer ■ Tell us where to send the money ■ Tells us who receives the money ■ Show your government-issued ID ■ Show your driver’s license We also collect your personal information from other companies. |
| Why can’t I limit all sharing? | Federal law gives you the right to limit only ■ Sharing for affiliates’ everyday business purposes – information about your creditworthiness ■ Affiliates from using your information to market to you ■ Sharing for nonaffiliates to market to you State laws and individual companies may give you additional rights to limit sharing. |
| Definitions |
| Affiliates | Companies related by common ownership or control. They can be financial and nonfinancial companies. ■ Arrow ETF Trust does not share with our affiliates. |
| Nonaffiliates | Companies not related by common ownership or control. They can be financial and nonfinancial companies ■ Arrow ETF Trust does not share with nonaffiliates so they can market to you. |
| Joint marketing | A formal agreement between nonaffiliated financial companies that together market financial products or services to you. ■ Arrow ETF Trust does not jointly market. |
PROXY VOTING POLICY
Information regarding how the Fund voted proxies relating to portfolio securities for the most recent twelve-month period ended June 30 as well as a description of the policies and procedures that the Fund uses to determine how to vote proxies is available without charge, upon request, by calling 1-877-277-6933 or by referring to the Securities and Exchange Commission’s (“SEC”) website at http://www.sec.gov.
PORTFOLIO HOLDINGS
The Fund files a complete schedule of portfolio holdings with the SEC for the first and third quarters of each fiscal year as an exhibit to its reports on Form N-PORT, within sixty days after the end of the period. Form N-PORT reports are available at the SEC’s website at www.sec.gov.
INVESTMENT ADVISOR
Arrow Investment Advisors, LLC
6100 Chevy Chase Drive, Suite 100
Laurel, MD 20707
ADMINISTRATOR
Ultimus Fund Solutions, LLC
225 Pictoria Drive, Suite 450
Cincinnati, OH 45246
GYLD-AR24
Item 2. Code of Ethics.
(a) As of the end of the period covered by this report, the registrant has adopted a code of ethics that applies to the registrant's principal executive officer, principal financial officer, principal accounting officer or controller, or persons performing similar functions, regardless of whether these individuals are employed by the registrant or a third party.
(b) For purposes of this item, “code of ethics” means written standards that are reasonably designed to deter wrongdoing and to promote:
| (1) | Honest and ethical conduct, including the ethical handling of actual or apparent conflicts of interest between personal and professional relationships; |
| (2) | Full, fair, accurate, timely, and understandable disclosure in reports and documents that a registrant files with, or submits to, the Commission and in other public communications made by the registrant; |
(3) Compliance with applicable governmental laws, rules, and regulations;
| (4) | The prompt internal reporting of violations of the code to an appropriate person or persons identified in the code; and |
(5) Accountability for adherence to the code.
(c) Amendments: During the period covered by the report, there have not been any amendments to the provisions of the code of ethics.
(d) Waivers: During the period covered by the report, the registrant has not granted any express or implicit waivers from the provisions of the code of ethics.
(e) The Code of Ethics is not posted on Registrant’ website.
(f) A copy of the Code of Ethics is attached as an exhibit.
Item 3. Audit Committee Financial Expert.
(a)(1)ii The Registrant’s board of trustees has determined that Robert S. Andrialis is an audit committee financial expert, as defined in Item 3 of Form N-CSR. Mr. Andrialis is independent for purposes of this Item 3.
Item 4. Principal Accountant Fees and Services.
2024 - $14,500
2023 - $14,500
2024 - None
2023 – None
2024 - $ 3,000
2023 - $ 3,000
Preparation of Federal & State income tax returns, assistance with calculation of required income, capital gain and excise distributions and preparation of Federal excise tax returns.
2024 - None
2023 – None
| (e) | (1) Audit Committee’s Pre-Approval Policies |
The registrant’s Audit Committee is required to pre-approve all audit services and, when appropriate, any non-audit services (including audit-related, tax and all other services) to the registrant. The registrant’s Audit Committee also is required to pre-approve, when appropriate, any non-audit services (including audit-related, tax and all other services) to its adviser, or any entity controlling, controlled by or under common control with the adviser that provides ongoing services to the registrant, to the extent that the services may be determined to have an impact on the operations or financial reporting of the registrant. Services are reviewed on an engagement by engagement basis by the Audit Committee.
| (2) | Percentages of Services Approved by the Audit Committee |
2024 2023
Audit-Related Fees: 0.00% 0.00%
Tax Fees: 0.00% 0.00%
All Other Fees: 0.00% 0.00%
| (f) | During the audit of registrant's financial statements for the most recent fiscal year, less than 50 percent of the hours expended on the principal accountant's engagement were attributed to work performed by persons other than the principal accountant's full-time, permanent employees. |
| (g) | The aggregate non-audit fees billed by the registrant's accountant for services rendered to the registrant, and rendered to the registrant's investment adviser (not including any sub-adviser whose role is primarily portfolio management and is subcontracted with or overseen by another investment adviser), and any entity controlling, controlled by, or under common control with the adviser that provides ongoing services to the registrant: |
2024 - $3,000
2023 - $3,000
(h) The registrant's audit committee has considered whether the provision of non-audit services to the registrant's investment adviser (not including any sub-adviser whose role is primarily portfolio management and is subcontracted with or overseen by another investment adviser), and any entity controlling, controlled by, or under common control with the investment adviser that provides ongoing services to the registrant, that were not pre-approved pursuant to paragraph (c)(7)(ii) of Rule 2-01 of Regulation S-X, is compatible with maintaining the principal accountant's independence.
(i) Not applicable.
(j) Not applicable.
Item 5. Audit Committee of Listed Companies. The registrant is an issuer as defined in Rule 10A-3 under the Securities Exchange Act of 1934, as amended (the “Exchange Act”) and has a separately-designated standing audit committee established in accordance with Section 3(a)(58)A of the Exchange Act. The registrant’s audit committee members are Robert S. Andrialis, Paul Montgomery and Thomas T. Sarkany.
Item 6. Schedule of Investments. See Item 1.
Item 7. Disclosure of Proxy Voting Policies and Procedures for Closed-End Funds. Not applicable to open-end investment companies.
Item 8. Portfolio Managers of Closed-End Management Investment Companies. Not applicable to open-end investment companies.
Item 9. Purchases of Equity Securities by Closed-End Funds. Not applicable to open-end investment companies.
Item 10. Submission of Matters to a Vote of Security Holders. There were no material changes to the procedures by which Shareholders may recommend nominees to the registrant’s Board of Trustees.
Item 11. Controls and Procedures.
(a) Based on an evaluation of the Registrant’s disclosure controls and procedures as of a date within 90 days of filing date of this Form N-CSR, the principal executive officer and principal financial officer of the Registrant have concluded that the disclosure controls and procedures of the Registrant are reasonably designed to ensure that the information required in filings on Form N-CSR is recorded, processed, summarized, and reported by the filing date, including that information required to be disclosed is accumulated and communicated to the Registrant’s management, including the Registrant’s principal executive officer and principal financial officer, as appropriate to allow timely decisions regarding required disclosure.
(b) There were no significant changes in the Registrant’s internal control over financial reporting that occurred during the period covered by this report that have materially affected, or are reasonably likely to materially affect, the Registrant’s internal control over financial reporting.
Item 12. Disclosure of Securities Lending Activities for Closed-End Management Investment Companies. - Not applicable to open-end investment companies.
Item 13. Exhibits.
(a)(1) Code of Ethics herewith.
(a)(2) Certifications required by Section 302 of the Sarbanes-Oxley Act of 2002 (and Item 11(a)(2) of Form N-CSR) are filed herewith.
(a)(3) Not applicable for open-end investment companies.
(b) Certifications required by Section 906 of the Sarbanes-Oxley Act of 2002 (and Item 11(b) of Form N-CSR) are filed herewith.
SIGNATURES
Pursuant to the requirements of the Securities Exchange Act of 1934 and the Investment Company Act of 1940, the registrant has duly caused this report to be signed on its behalf by the undersigned, thereunto duly authorized.
(Registrant) Arrow ETF Trust
By (Signature and Title)
/s/ Joseph Barrato
Joseph Barrato, Principal Executive Officer/President
Date 4/9/2024
Pursuant to the requirements of the Securities Exchange Act of 1934 and the Investment Company Act of 1940, this report has been signed below by the following persons on behalf of the registrant and in the capacities and on the dates indicated.
By (Signature and Title)
/s/ Joseph Barrato
Joseph Barrato, Principal Executive Officer/President
Date 4/9/2024
By (Signature and Title)
/s/ Sam Singh
Sam Singh, Principal Financial Officer/Treasurer
Date 4/9/2024