UNITED STATES
SECURITIES AND EXCHANGE COMMISSION
Washington, D.C. 20549
FORM N-CSR
CERTIFIED SHAREHOLDER REPORT OF REGISTERED
MANAGEMENT INVESTMENT COMPANIES
Investment Company Act file number | 811-22613 |
|
Curian Variable Series Trust |
(Exact name of registrant as specified in charter) |
|
7601 Technology Way, Denver, Colorado | | 80237 |
(Address of principal executive offices) | | (Zip code) |
|
Daniel W. Koors Jackson National Asset Management, LLC 225 West Wacker Drive, Suite 1200 Chicago, Illinois 60606 |
(Name and address of agent for service) |
|
Registrant’s telephone number, including area code: | (312) 338-5800 | |
|
Date of fiscal year end: | December 31 | |
|
Date of reporting period: | December 31, 2014 | |
| | | | | | | | |
Form N-CSR is to be used by management investment companies to file reports with the Commission not later than 10 days after the transmission to stockholders of any report that is required to be transmitted to stockholders under Rule 30e-1 under the Investment Company Act of 1940 (17 CFR 270.30e-1). The Commission may use the information provided on Form N-CSR in its regulatory, disclosure review, inspection, and policymaking roles.
A registrant is required to disclose the information specified by Form N-CSR, and the Commission will make this information public. A registrant is not required to respond to the collection of information contained in Form N-CSR unless the Form displays a currently valid Office of Management and Budget (“OMB”) control number. Please direct comments concerning the accuracy of the information collection burden estimate and any suggestions for reducing the burden to Secretary, Securities and Exchange Commission, 450 Fifth Street, NW, Washington, DC 20549-0609. The OMB has reviewed this collection of information under the clearance requirements of 44 U.S.C. §3507.
Item 1. Report to Shareholders.

| ACCESS. STORAGE. SECURITY. |
CHOOSE THE INBOX.
NOT THE MAILBOX.
Less waste. More convenience.
Three easy ways to go paperless:
1. Mail this postage-paid card | | 2. Call 1-866-349-4564 | | 3. Visit jackson.com |
I consent to receive by electronic delivery:
o ALL DOCUMENTS | o Periodic and immediate confirmations | o Prospectuses and prospectus supplements |
| o Annual and semi-annual reports | o Other contract-related correspondence |
This consent will continue unless and until revoked and will cover delivery to you in the form of an e-mail or by notice to you of a document’s availability on Jackson National Life Insurance Company®’s (also referred to as Jackson®) Web site. You may revoke your consent to electronic delivery at any time with respect to any or all of the documents. Paper delivery of such documents will commence after receipt of your revocation of consent to electronic delivery. Please contact the appropriate Jackson Service Center or go to www.jackson.com to update your e-mail address, revoke your consent to electronic delivery, or request paper copies. Certain types of correspondence may continue to be delivered by the United States Postal Service for compliance reasons. Registration on Jackson’s Web site (www.jackson.com) is required for electronic delivery of contract-related correspondence.
Fold Here
Please write legibly.
E-mail address:
I (We) will notify Jackson of any change to this e-mail address.
Name:
Address:
Policy Number:
Phone Number:
The computer hardware and software requirements that are necessary to receive, process and retain electronic communications that are subject to this consent are as follows: To view and download material electronically, you must have a computer with Internet access, an active e-mail account and Adobe Acrobat Reader. If you don’t already have Adobe Acrobat Reader, you can download it free from www.adobe.com. We may need to notify you of a document’s availability through e-mail. You may request paper copies, whether or not you consent or revoke your consent for electronic delivery, at any time and at no charge. There is no charge for electronic delivery, although you may incur the costs of Internet access and of such computer, and related hardware and software, as may be necessary for you to receive, process, and retain electronic documents and communications from Jackson. Please ensure that you have provided Jackson with a current e-mail address. To notify Jackson of any changes to this e-mail address, revoke your consent to electronic delivery or request paper copies, call the Jackson Service Center at 800/644-4565 or visit www.jackson.com. Even if you have given Jackson consent, we are not required to make electronic delivery and we have the right to deliver any document or communication in paper form. Electronic delivery may not be available on all policies. This consent will need to be supplemented by specific electronic consent upon receipt of any of these means of electronic delivery or notice of availability.
ANNUAL REPORT
December 31, 2014
Curian Variable Series Trust®
· Master Feeder Funds and Fund of Funds
· Sub-Advised Funds
This report is for the general information of qualified and nonqualified plan participants, as well as contract/policy owners of Elite Access® and Elite Access (NY). Jackson is the marketing name for Jackson National Life Insurance Company (Home Office: Lansing, Michigan) and Jackson National Life Insurance Company® of New York (Home Office: Purchase, New York).
Issued by Jackson National Life Insurance Company 1 Corporate Way, Lansing, MI 48951 | 
|

| | NO POSTAGE
NECESSARY
IF MAILED
IN THE
UNITED STATES |
BUSINESS REPLY MAIL
FIRST-CLASS MAIL PERMIT NO. 600 LANSING MI
POSTAGE WILL BE PAID BY ADDRESSEE
| JACKSON |
| PO BOX 24068 |
| LANSING MI 48909-9979 |
| 
|
Fold Here
Curian Variable Series Trust
December 31, 2014
President’s Letter

Dear Investor,
Enclosed is the annual report for the Curian Variable Series Trust covering the year ended December 31, 2014, together with Management’s Discussion of Fund Performance for each of the Funds.
After a challenging start to 2014, the U.S. economy showed signs of continued improvement over the course of the year. After contracting by 2.1% in the 1st quarter due in part to extreme cold weather across much of the nation, U.S. gross domestic product growth accelerated to an annualized rate of 4.6% in the 2nd quarter and 5.0% in the 3rd quarter, a pace of growth not seen since 2003. The unemployment rate dropped to six-year lows, falling from 6.7% to 5.6%, while an estimated 242,000 new jobs were added each month. The housing market continued its rebound, albeit at a slower pace of growth than 2013. As a result of the mostly strong U.S. data, consumer confidence increased to levels not seen since 2007. Amid the improvement in the economic landscape in the U.S., the U.S. Federal Reserve (“Fed”) announced the conclusion of its quantitative easing program, better known as QE3.
Against this backdrop, U.S. equities, as measured by the Russell 3000 Index, gained 12.56% while setting new record highs and marking their sixth consecutive year of gains. All major equity sectors were positive for the year, with the exception of energy. The market’s advance was led by large cap equities, as evidenced by the 13.24% return of the Russell 1000 Index, compared with the 4.89% return for the Russell 2000 Index, a proxy for small cap equities. Value and growth equities posted similar gains for the year, as the Russell 3000 Value Index and Russell 3000 Growth Index gained 12.70% and 12.44%, respectively.
Despite the continued growth in the U.S., most international markets were hampered by slowing growth, geopolitical tensions, falling commodity prices and deflation in some areas, including the Eurozone. Growth was also mixed for emerging market countries. China, now the world’s largest economy, once again produced strong economic growth during the year, as real GDP grew by an estimated 7.3%. Meanwhile, Russia suffered from slowing growth and a sharply weaker currency as a result of lower energy prices and economic sanctions from the U.S. and Europe. International equities, as measured by the MSCI All Country World ex-U.S. Index, returned -3.87%, including -2.19% for emerging markets equities and -4.32% for developed market equities. While the index returned 6.05% in local currency terms, international equities were negatively impacted by a stronger U.S. Dollar resulting from stronger growth in the U.S. and increasing policy divergence between the Fed, European Central Bank, and Bank of Japan.
U.S. fixed income securities, as measured by the Barclays U.S. Aggregate Bond Index, enjoyed a surprisingly strong year, returning 5.97%. Despite near consensus expectations of rising interest rates by economists and market participants, long-term Treasury yields fell sharply due to the convergence of several factors, including collapsing yields in Europe, below-expected inflation and increased pension demand. Most sectors within the fixed income markets produced gains during the year, although high yield bonds underperformed due to rising credit concerns which were exacerbated by a sharp drop in oil prices late in the year. Non-U.S. Dollar denominated strategies significantly underperformed as the U.S. Dollar strengthened against most currencies.
Alternative investments, as measured by the Credit Suisse Hedge Fund Index, gained 4.13% during the year. Among the best performing alternative strategies were managed futures, long/short equity and global macro. Among the worst performing strategies were commodities, event-driven, merger arbitrage and short-biased equities.
Looking ahead to 2015, we expect to see divergent paths in economic growth and monetary policy across the globe. The U.S. and UK recoveries should continue to progress, and we expect monetary policies to begin to normalize in those countries, while the Eurozone and Japan are faced with anemic growth and potential for deflation, likely resulting in an expansion of their quantitative easing programs. We also expect dispersion in emerging markets due to differences in economic reforms and challenging conditions for countries more tied to commodity prices that remain under pressure.
These divergent trends in the macro environment could lead to greater volatility in 2015. While that can cause gyrations in returns over the short term, it could also present opportunities for active managers to take advantage of valuation anomalies.
Thank you for choosing Jackson for your investment needs.

Mark D. Nerud
President and Chief Executive Officer
Curian Variable Series Trust

Curian Guidance Funds
Curian Capital, LLC
(Unaudited)
Market Summary: Most domestic market fundamentals improved throughout the year as the U.S. Federal Reserve ("Fed") brought the monetary easing process to an end in October. An improving job market, earnings growth and gross domestic product ("GDP") growth proved to be ample substitute for the declining stimulus. U.S. large cap stocks posted strong gains in 2014 causing most diversification decisions to detract from overall performance. Small cap equities generally produced less than half the return of large cap equities even with a very strong fourth quarter rally. While value equities and growth equities swapped the leadership position several times throughout the year, they ended the calendar year with similar returns.
U.S. government bonds and investment grade bonds regained the core leadership in the fixed income asset class. A steady interest rate decline in 2014 helped the Barclays U.S. Aggregate Bond Index deliver an attractive positive return for the year. The yield curve experienced a steady flattening as the 10 year U.S. Treasury yield dropped over 87 basis points ("bps") to end the year at 2.17%. The Fed remained inactive on the front of the curve leaving the Fed funds rate near zero. High yield spreads widened in the second half of the year as falling oil prices put pressure on many of the energy dependent issuers.
International investments lagged the U.S. in 2014 as weak currencies and economies hampered returns. European recessionary environment and sporadic Japanese tax policy lead to lower nominal returns among the developed international domains. The weak Euro and Japanese Yen drove U.S. Dollar based returns into negative territory for both the MSCI All Country World ex USA Index and MSCI EAFE Index. Slowing China growth and weak commodity performance translated into negative emerging market performance as well.
The HFRI Fund Weighted Composite Index returned 3.33% for the year as the top contributing categories within this index included Equity Hedge – Technology & Healthcare and Macro – Systematic Diversified. The largest detractors for the year included Equity Hedge – Energy & Basic Materials, Equity Hedge – Short Bias and Event Driven – Distressed & Restructuring. Global real estate investment trusts ("REIT") outperformed the S&P 500 Index during 2014 while broad based commodities suffered a second consecutive negative year, largely driven by weakness in energy markets.
Portfolio Manager Commentary: Curian Guidance – Interest Rate Opportunities Fund, Curian Guidance – Multi-Strategy Income Fund, Curian Guidance – Equity Income Fund, Curian Guidance – Conservative Fund, Curian Guidance – Moderate Fund, Curian Guidance – Growth Fund, Curian Guidance – Moderate Growth Fund, Curian Guidance – Maximum Growth Fund, Curian Guidance – Tactical Moderate Growth Fund, Curian Guidance – Tactical Maximum Growth Fund, Curian Guidance – Institutional Alt 65 Fund, Curian Guidance – Alt 100 Conservative Fund, Curian Guidance – Alt 100 Moderate Fund, and Curian Guidance – Alt 100 Growth Fund, Curian Guidance – International Conservative Fund, Curian Guidance – International Moderate Fund, Curian Guidance – International Growth Fund, Curian Guidance – Equity 100 Fund, Curian Guidance – Fixed Income 100 Fund, Curian Guidance – Real Assets Fund (collectively "Curian Guidance Funds") seek to achieve their investment objectives by investing in shares of a diversified group of affiliated Funds ("Underlying Funds"). The Underlying Funds in which each Fund may invest are a separate series of Curian Variable Series Trust, JNL Series Trust, JNL Variable Fund LLC or JNL Investors Series Trust. Each Curian Guidance Fund's percentage allocation among the Underlying Funds are determined by the Adviser based on long term market and economic conditions, historical and expected long term performance of each Underlying Fund, as well as diversification to control overall portfolio risk exposure. The Schedules of Investments and Financial Statements for the Underlying Funds are available at www.jackson.com or on the SEC's website at www.sec.gov.
Curian Guidance – Interest Rate Opportunities Fund
Portfolio Composition†:
Alternative | | | 67.0 | % | |
Domestic Fixed Income | | | 25.0 | | |
International Fixed Income | | | 8.0 | | |
Total Investments | | | 100.0 | % | |
†Total Investments as of December 31, 2014.
For the year ended December 31, 2014, Curian Guidance – Interest Rate Opportunities Fund underperformed its primary benchmark by posting a return of 1.05% compared to 5.97% for the Barclays U.S. Aggregate Bond Index and underperformed its other benchmark, the BofA Merrill Lynch U.S. Corporate 1-3 Year Index, which returned 1.19%. The Fund underperformed its blended benchmark return of 1.27% for the 60% HFRX Fixed Income-Credit Index and 40% Barclays U.S. Aggregate Bond Index. The Fund's investment objective is to seek total return primarily through strategies that invest in fixed income oriented securities, as well as other asset classes and strategies through investment in other funds ("Underlying Funds").
The Fund underperformed the Barclays U.S. Aggregate Bond Index for the year due to the reduced duration of the Fund versus this benchmark, which hurt the Fund in a period of falling interest rates. The Fund underperformed the BofA Merrill Lynch U.S. Corporate 1-3 Year benchmark, which is comprised of short term bonds. On the positive side, the Fund benefited from the equity
exposure of its investments in underlying REITs, infrastructure and covered call funds; namely, JNL/Invesco Global Real Estate Fund, JNL/Brookfield Global Infrastructure and MLP Fund and Curian/FAMCO Flex Core Covered Call Fund, which posted returns of 15.03%, 7.35% and 8.84%, respectively. Looking at areas of weak performance, the Fund was negatively impacted by emerging market debt and exposure to credit long short funds. Specifically, losses of -4.94%, -1.43% and -4.42% were posted by JNL/Goldman Sachs Emerging Markets Debt Fund, Curian Long Short Credit Fund and Curian/UBS Global Long Short Fixed Income Opportunities Fund, respectively.
Since inception, the Fund's allocation to fixed income was reduced by 8% and was added to alternative strategies. This change was largely as a result of cutting JNL/PIMCO Real Return Fund from a 20% weight to a 10% weight. The mix of alternative strategies was also changed in order to make room for the addition of Curian/UBS Global Long Short Fixed Income Opportunities Fund.
Curian Guidance – Multi-Strategy Income Fund
Portfolio Composition†:
Domestic Fixed Income | | | 46.0 | % | |
Global Fixed Income | | | 24.5 | | |
Alternative | | | 20.1 | | |
International Fixed Income | | | 9.4 | | |
Total Investments | | | 100.0 | % | |
†Total Investments as of December 31, 2014.
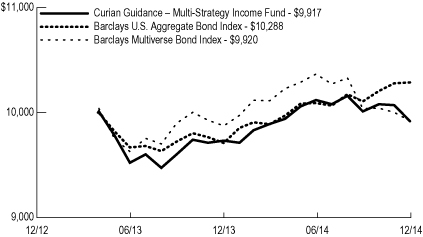
For the year ended December 31, 2014, Curian Guidance – Multi-Strategy Income Fund underperformed its primary benchmark by posting a return of 1.93% compared to 5.97% for the Barclays U.S. Aggregate Bond Index and outperformed its other benchmark, the Barclays Multiverse Bond Index, which returned 0.48%. The Fund's investment objective is to seek total return primarily through strategies that invest in fixed income oriented securities, as well as other asset classes and strategies through investment in other funds (the "Underlying Funds").
The performance of the Fund was negatively impacted by its exposure to emerging market debt and its investments in credit long short funds; namely, Curian Long Short Credit Fund and Curian/UBS Global Long Short Fixed Income Opportunities Fund, which posted returns of -1.43% and -4.42%, respectively. Fixed income Underlying Funds with overweight allocations to junk bonds and/or underweight allocations to duration found 2014 to be a challenging year as long duration and investment grade fixed income delivered relative outperformance. The Fund's largest positions, Curian/DoubleLine Total Return Fund and JNL/Franklin Templeton Global Multisector Bond Fund, returned 6.49% and -0.45%, respectively. Underlying Funds that delivered relative underperformance included JNL/PPM America Floating Rate Income Fund and JNL/PPM America High Yield Bond Fund, which returned 0.12% and 0.13%, respectively. Funds that contributed positively to performance included JNL/Invesco Global

Curian Guidance Funds (continued)
Curian Capital, LLC
(Unaudited)
Real Estate Fund, JNL/Brookfield Global Infrastructure and MLP Fund and Curian/FAMCO Flex Core Covered Call Fund, which posted returns of 15.03%, 7.35% and 8.84%, respectively.
Since inception, the Fund's allocation to fixed income was reduced by 2% and this exposure was added to alternative strategies. This change was largely as a result of cutting JNL/PIMCO Real Return Fund from a 6% weight to a 3% weight. The mix of alternative strategies was also changed in order to make room for the addition of Curian/UBS Global Long Short Fixed Income Opportunities Fund.
Curian Guidance – Equity Income Fund
Portfolio Composition†:
Global Equity | | | 39.9 | % | |
Alternative | | | 35.1 | | |
Domestic Equity | | | 25.0 | | |
Total Investments | | | 100.0 | % | |
†Total Investments as of December 31, 2014.
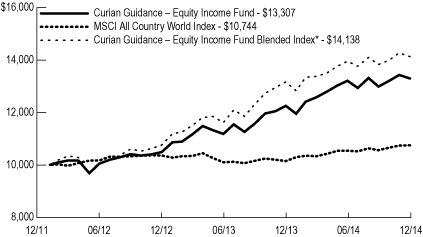
For the year ended December 31, 2014, Curian Guidance – Equity Income Fund outperformed its primary benchmark by posting a return of 8.62% compared to 4.17% for the MSCI All Country World Index. The Fund outperformed its blended benchmark return of 7.31% for the 55% S&P 500 Index, 25% MSCI EAFE Index and 20% Barclays U.S. Aggregate Bond Index. The Fund's investment objective is to seek a potentially rising stream of income by investing in a selection of companies with a multiple year history of increasing their dividend payouts over the long term with some risk control through investment in other funds (the "Underlying Funds").
The Fund outperformed the MSCI All Country World Index primarily due to an overweight positioning in U.S. equities relative to the benchmark. The Fund also outperformed its blended benchmark because the blended benchmark has a larger allocation to fixed income (20%) versus the Fund (0%). The Fund's largest position, Curian/Epoch Global Shareholder Yield Fund, posted a return of 6.05%. The next two largest holdings, Curian/FAMCO Flex Core Covered Call Fund and Curian/The Boston Company Equity Income Fund, posted returns of 8.84% and 11.07%, respectively. JNL/Invesco Global Real Estate Fund was the top performing alternative and posted a 15.03% return, while JNL/T. Rowe Price Value Fund was the highest performing traditional equity position and posted a return of 13.24% for the year.
Since inception in 2012, the Fund's allocation to Curian Dynamic Risk Advantage – Diversified Fund was reduced from 30% to 15%, then eliminated in 2014 and was primarily reallocated into domestic equity. Additions to the alternative allocations in real estate and covered call strategies were also made at the expense of eliminating the allocation to risk managed Underlying Funds. These off benchmark allocations to alternatives have been made in order to add an element of diversification to the Fund.
Curian Guidance – Conservative Fund
Portfolio Composition†:
Domestic Fixed Income | | | 35.8 | % | |
Alternative | | | 34.9 | | |
Global Fixed Income | | | 19.5 | | |
International Fixed Income | | | 9.8 | | |
Total Investments | | | 100.0 | % | |
†Total Investments as of December 31, 2014.
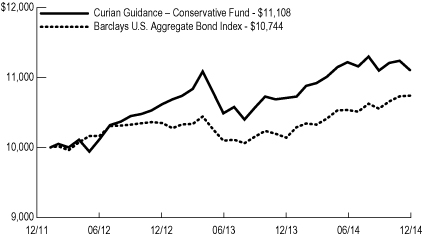
For the year ended December 31, 2014, Curian Guidance – Conservative Fund underperformed its benchmark by posting a return of 3.71% compared to 5.97% for the Barclays U.S. Aggregate Bond Index. The Fund's investment objective is to seek the generation of income through investment in other funds (the "Underlying Funds").
Despite the decrease in interest rates during the year, the Fund underperformed its benchmark due to its allocation to emerging market and international debt. The Fund's largest position, Curian/DoubleLine Total Return Fund returned 6.49%. The top performing fixed income holding was Curian/PIMCO Credit Income Fund, which returned 7.61%. Also contributing positively to performance was JNL/Invesco Global Real Estate Fund, Curian/FAMCO Flex Core Covered Call Fund and Curian Dynamic Risk Advantage – Diversified Fund, posting returns of 15.03%, 8.84%, and 5.17%, respectively. Underlying Funds that delivered relative underperformance included JNL/PPM America Floating Rate Income Fund and JNL/PPM America High Yield Bond Fund, which returned 0.12% and 0.13%, respectively.
During the year, changes were made within fixed income in order to diversify the Fund's geographic allocation by increasing its exposure to international debt. Allocation changes were also made in order to increase the credit quality of the Fund and reduce its exposure to credit. The allocations to JNL/PPM America High Yield Bond Fund and JNL/PPM America Floating Rate Income Fund were reduced in order to allow for a new 10% allocation to JNL/Goldman Sachs Emerging Markets Debt Fund.
Curian Guidance – Moderate Fund
Portfolio Composition†:
Alternative | | | 32.5 | % | |
Domestic Equity | | | 25.0 | | |
Domestic Fixed Income | | | 13.7 | | |
International Equity | | | 12.2 | | |
Global Fixed Income | | | 7.5 | | |
Emerging Markets Equity | | | 5.3 | | |
International Fixed Income | | | 3.8 | | |
Total Investments | | | 100.0 | % | |
†Total Investments as of December 31, 2014.
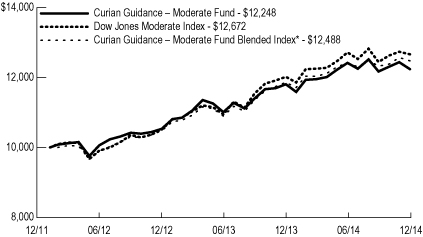
For the year ended December 31, 2014, Curian Guidance – Moderate Fund underperformed its primary benchmark by posting a return of 3.71% compared to 5.35% for the Dow Jones Moderate Index. The Fund underperformed its blended benchmark return of 5.28% for the 25% S&P 500 Index, 20% MSCI EAFE Index, 35%
Barclays U.S. Aggregate Bond Index and 20% Credit Suisse Hedge Fund Index. The Fund's investment objective is to seek a balance between the generation of income and the long term growth of capital through investment in other funds (the "Underlying Funds").
The Fund underperformed the Dow Jones Moderate Index due to the fact that the benchmark has a higher equity allocation (60%) versus the Fund (43%) and equity performed well in 2014. The Fund's relatively larger international exposure also hurt performance as international equities and fixed income lagged their domestic counterparts in 2014. The Fund's largest contributor during the year, the JNL/S&P 4 strategy, includes JNL/S&P Competitive Advantage Fund, JNL/S&P Dividend Income & Growth Fund, JNL/S&P Intrinsic Value Fund and JNL/S&P Total Yield Fund, which returned 10.06%, 13.70%, 18.04% and 15.89%, respectively. Other positive contributors included JNL/PPM America Mid Cap Value Fund and JNL/JPMorgan MidCap Growth Fund, which returned 10.45% and 11.19%, respectively. Alternative allocation performance was mixed. Commodity related funds such as JNL/BlackRock Commodity Securities Strategy Fund and Curian/Van Eck International Gold Fund returned -14.25% and -6.13%, respectively. Conversely, interest rate sensitive funds such as JNL/Brookfield Global Infrastructure and MLP Fund and JNL/Invesco Global Real Estate Fund returned 7.35% and 15.03%, respectively.
During the year, the overall asset allocations to global equities were increased at the expense of risk management strategies. Within the equity allocation, changes were made to favor large cap domestic equities and to reduce emerging market equities. Within the fixed income allocation, changes were made in order to shorten duration and reduce the Fund's sensitivity to rising interest rates. Alternative allocations were adjusted in order to make room for the addition of JNL/Boston Partners Global Long Short Equity Fund.
Curian Guidance – Growth Fund
Portfolio Composition†:
Domestic Equity | | | 36.9 | % | |
Alternative | | | 27.6 | | |
International Equity | | | 17.8 | | |
Emerging Markets Equity | | | 7.7 | | |
Domestic Fixed Income | | | 5.5 | | |
Global Fixed Income | | | 3.0 | | |
International Fixed Income | | | 1.5 | | |
Total Investments | | | 100.0 | % | |
†Total Investments as of December 31, 2014.
For the year ended December 31, 2014, Curian Guidance – Growth Fund underperformed its primary benchmark by posting a return of 4.16% compared to 5.90% for the Dow Jones Moderately Aggressive Index. The Fund underperformed its blended benchmark return of 4.88% for the 35% S&P 500 Index, 30% MSCI EAFE Index, 15% Barclays U.S. Aggregate Bond Index and 20% Credit Suisse Hedge Fund Index. The Fund's

Curian Guidance Funds (continued)
Curian Capital, LLC
(Unaudited)
investment objective is to seek long term growth of capital through an allocation in stocks and other asset classes and strategies through investment in other funds (the "Underlying Funds").
The Fund underperformed the Dow Jones Moderately Aggressive Index due to the fact that the benchmark has a higher equity allocation (80%) versus the Fund (63%) and equity performed well in 2014. The Fund's relatively larger international exposure also hurt performance as international equities and fixed income lagged their domestic counterparts in 2014. The Fund's largest contributor during the year, the JNL/S&P 4 strategy, includes JNL/S&P Competitive Advantage Fund, JNL/S&P Dividend Income & Growth Fund, JNL/S&P Intrinsic Value Fund and JNL/S&P Total Yield Fund, which returned 10.06%, 13.70%, 18.04% and 15.89%, respectively. Other positive contributors included, JNL/PPM America Mid Cap Value Fund and JNL/JPMorgan MidCap Growth Fund, which returned 10.45% and 11.19%, respectively. Alternative allocation performance was mixed. Commodity related funds such as JNL/BlackRock Commodity Securities Strategy Fund and Curian/Van Eck International Gold Fund returned -14.25% and -6.13%, respectively. Conversely, interest rate sensitive funds such as JNL/Brookfield Global Infrastructure and MLP Fund and JNL/Invesco Global Real Estate Fund returned 7.35% and 15.03%, respectively.
During the year, the overall asset allocations to global equities were increased at the expense of risk management strategies. Within the equity allocation, changes were made to favor large cap domestic equities and to reduce emerging market equities. Within the fixed income allocation, changes were made in order to shorten duration and reduce the Fund's sensitivity to rising interest rates. Alternative allocations were adjusted in order to make room for the addition of JNL/Boston Partners Global Long Short Equity Fund.
Curian Guidance – Moderate Growth Fund
Portfolio Composition†:
Domestic Equity | | | 33.0 | % | |
Alternative | | | 30.1 | | |
International Equity | | | 15.3 | | |
Domestic Fixed Income | | | 8.2 | | |
Emerging Markets Equity | | | 6.6 | | |
Global Fixed Income | | | 4.5 | | |
International Fixed Income | | | 2.3 | | |
Total Investments | | | 100.0 | % | |
†Total Investments as of December 31, 2014.
For the year ended December 31, 2014, Curian Guidance – Moderate Growth Fund underperformed its primary benchmark by posting a return of 4.11% compared to 5.35% for the Dow Jones Moderate Index. The Fund underperformed its blended benchmark return of 5.08% for the 30% S&P 500 Index, 25% MSCI EAFE Index, 25% Barclays U.S. Aggregate Bond Index, 20% Credit Suisse Hedge Fund Index. The Fund's investment objective is to seek long term growth of capital by investing in other funds (the "Underlying Funds") that offer a broad array of stock, bond and other
asset classes and strategies.
The Fund underperformed the Dow Jones Moderate Index due to the fact that the benchmark has a higher equity allocation (60%) versus the Fund (55%) and equity performed well in 2014. The Fund's relatively larger international exposure also hurt performance as international equities and fixed income lagged compared to their domestic counterparts in 2014. The Fund's largest contributor during the year, the JNL/S&P 4 strategy, includes JNL/S&P Competitive Advantage Fund, JNL/S&P Dividend Income & Growth Fund, JNL/S&P Intrinsic Value Fund and JNL/S&P Total Yield Fund, which returned 10.06%, 13.70%, 18.04% and 15.89%, respectively. Other positive contributors included JNL/PPM America Mid Cap Value Fund and JNL/JPMorgan MidCap Growth Fund, which returned 10.45% and 11.19%, respectively. Alternative allocation performance was mixed. Commodity related funds such as JNL/BlackRock Commodity Securities Strategy Fund and Curian/Van Eck International Gold Fund returned -14.25% and -6.13%, respectively. Conversely, interest rate sensitive funds such as JNL/Brookfield Global Infrastructure and MLP Fund and JNL/Invesco Global Real Estate Fund returned 7.35% and 15.03%, respectively.
During the year, the overall asset allocations to global equities were increased at the expense of risk management strategies. Within the equity allocation, changes were made to favor large cap domestic equities and to reduce emerging market equities. Within the fixed income allocation, changes were made in order to shorten duration and reduce the Fund's sensitivity to rising interest rates. Alternative allocations were adjusted in order to make room for the addition of JNL/Boston Partners Global Long Short Equity Fund.
Curian Guidance – Maximum Growth Fund
Portfolio Composition†:
Domestic Equity | | | 47.1 | % | |
International Equity | | | 22.8 | | |
Alternative | | | 20.1 | | |
Emerging Markets Equity | | | 10.0 | | |
Total Investments | | | 100.0 | % | |
†Total Investments as of December 31, 2014.
For the year ended December 31, 2014, Curian Guidance – Maximum Growth Fund underperformed its primary benchmark by posting a return of 4.26% compared to 5.90% for the Dow Jones Moderately Aggressive Index. The Fund underperformed its blended benchmark return of 4.77% for the 40% S&P 500 Index, 35% MSCI EAFE Index, 10% Barclays U.S. Aggregate Bond Index and 15% Credit Suisse Hedge Fund Index. The Fund's investment objective is to seek long term growth of capital through an allocation in stocks and other asset classes and strategies through investment in other funds (the "Underlying Funds").
The Fund underperformed the Dow Jones Moderately Aggressive Index due to the fact that
the benchmark has a higher fixed income allocation (20%) versus the Fund (0%) and fixed income performed well in 2014. The Fund's relatively larger international exposure also hurt performance as international equities and fixed income lagged their domestic counterparts in 2014. The Fund's largest contributor during the year, the JNL/S&P 4 strategy, includes JNL/S&P Competitive Advantage Fund, JNL/S&P Dividend Income & Growth Fund, JNL/S&P Intrinsic Value Fund and JNL/S&P Total Yield Fund, which returned 10.06%, 13.70%, 18.04% and 15.89%, respectively. Other positive contributors included JNL/PPM America Mid Cap Value Fund and JNL/JPMorgan MidCap Growth Fund, which returned 10.45% and 11.19%, respectively. Alternative allocation performance was mixed. Commodity related funds such as JNL/BlackRock Commodity Securities Strategy Fund and Curian/Van Eck International Gold Fund decline to return -14.25% and -6.13%, respectively. Conversely, interest rate sensitive funds such as JNL/Brookfield Global Infrastructure and MLP Fund and JNL/Invesco Global Real Estate Fund gained 7.35% and 15.03%, respectively.
During the year, the overall allocations to global equity and fixed income were unchanged. Within the equity allocation, changes were made to favor large cap domestic equities and to reduce emerging market equities. Within the alternative allocation, changes were made in order to reduce allocations to long short credit funds in lieu of funds with greater equity market sensitivity such as covered call and convertible arbitrage strategies. Alternative allocations were also adjusted in order to make room for the addition of JNL/Boston Partners Global Long Short Equity Fund.
Curian Guidance – Tactical Moderate Growth Fund
Portfolio Composition†:
Domestic Equity | | | 49.9 | % | |
Alternative | | | 35.0 | | |
International Equity | | | 10.8 | | |
Emerging Markets Equity | | | 4.0 | | |
Domestic Fixed Income | | | 0.3 | | |
Total Investments | | | 100.0 | % | |
†Total Investments as of December 31, 2014.
For the year ended December 31, 2014, Curian Guidance – Tactical Moderate Growth Fund underperformed its primary benchmark by posting a return of 4.44% compared to 5.35% for the Dow Jones Moderate Index. The Fund underperformed its blended benchmark return of 6.22% for the 25% S&P 500 Index, 10% MSCI EAFE Index, 35% Barclays U.S. Aggregate Bond Index, 30% Credit Suisse Hedge Fund Index. The Fund's investment objective is to seek long term growth of capital through a broad and flexible allocation in stocks, bonds and other asset classes and strategies through investment in other funds (the "Underlying Funds").
The Fund underperformed the Dow Jones Moderate Index due to the fact that the benchmark had a higher allocation to equity versus the Fund

Curian Guidance Funds (continued)
Curian Capital, LLC
(Unaudited)
during the year and equity performed well in 2014. The Dow Jones Moderate Index also had a higher allocation to domestic fixed income versus the Fund during the year and domestic fixed income performed well in 2014. The Fund's largest allocations at year end, JNL/Mellon Capital S&P 500 Index Fund and JNL/Mellon Capital S&P 400 Mid Cap Index Fund, were also the largest contributors returning 13.07% and 9.23%, respectively. Alternative allocation performance was mixed. Commodity related funds such as JNL/BlackRock Commodity Securities Strategy Fund and Curian/Van Eck International Gold Fund returned -14.25% and -6.13%, respectively. Conversely, interest rate sensitive funds such as JNL/Brookfield Global Infrastructure and MLP Fund and JNL/Invesco Global Real Estate Fund returned 7.35% and 15.03%, respectively.
During the year, the overall allocations to global equity and fixed income were unchanged. Within the equity allocation, changes were made to favor large cap domestic equities and to reduce emerging market equities. Within the alternative allocation, changes were made in order to reduce allocations to long short credit funds in lieu of funds with greater equity market sensitivity such as covered call and convertible arbitrage strategies. Alternative allocations were also adjusted in order to make room for the addition of JNL/Boston Partners Global Long Short Equity Fund.
Curian Guidance – Tactical Maximum Growth Fund
Portfolio Composition†:
Domestic Balanced | | | 24.9 | % | |
Global Balanced | | | 24.9 | | |
Domestic Equity | | | 22.6 | | |
Alternative | | | 20.1 | | |
International Equity | | | 6.0 | | |
Emerging Markets Equity | | | 1.5 | | |
Total Investments | | | 100.0 | % | |
†Total Investments as of December 31, 2014.
For the year ended December 31, 2014, Curian Guidance – Tactical Maximum Growth Fund underperformed its primary benchmark by posting a return of 3.78% compared to 5.90% for the Dow Jones Moderately Aggressive Index. The Fund underperformed its blended benchmark return of 6.03% for the 30% S&P 500 Index, 15% MSCI EAFE Index, 25% Barclays U.S. Aggregate Bond Index and 30% Credit Suisse Hedge Fund Index. The Fund's investment objective is to seek long term growth of capital through a flexible, and potentially concentrated, allocation in stocks, bonds and other asset classes and strategies through investment in other funds (the "Underlying Funds").
The Fund underperformed the Dow Jones Moderately Aggressive Index due to the fact that the benchmark had a higher allocation to equity versus the Fund during the year and equity performed well in 2014. The tactically managed JNL/Ivy Asset Strategy Fund and Curian/T. Rowe Price Capital Appreciation Fund posted mixed per-
formance returning -4.04% and 11.63%, respectively. The largest allocations to alternatives included JNL/Red Rocks Listed Private Equity Fund and Curian/FAMCO Flex Core Covered Call Fund, which posted returns of 0.62% and 8.84%, respectively. Other alternative allocations delivered mixed performance. Commodity related funds such as JNL/BlackRock Commodity Securities Strategy Fund and Curian/Van Eck International Gold Fund returned -14.25% and -6.13%, respectively. Conversely, interest rate sensitive funds such as JNL/Brookfield Global Infrastructure and MLP Fund and JNL/Invesco Global Real Estate Fund returned 7.35% and 15.03%, respectively.
During the year, the overall allocations to global equity and fixed income were unchanged. Within the equity allocation, changes were made to favor mid cap domestic equities and emerging market equities. Within the alternative allocation, changes were made in order to reduce allocations to long short credit funds in lieu of funds with greater equity market sensitivity such as covered call and convertible arbitrage strategies. Alternative allocations were also adjusted in order to make room for the addition of JNL/Boston Partners Global Long Short Equity Fund.
Curian Guidance – Institutional Alt 65 Fund
Portfolio Composition†:
Alternative | | | 64.8 | % | |
Domestic Equity | | | 15.4 | | |
International Equity | | | 7.0 | | |
Domestic Fixed Income | | | 5.5 | | |
Global Fixed Income | | | 3.0 | | |
Emerging Markets Equity | | | 2.9 | | |
International Fixed Income | | | 1.4 | | |
Total Investments | | | 100.0 | % | |
†Total Investments as of December 31, 2014.
For the year ended December 31, 2014, Curian Guidance – Institutional Alt 65 Fund underperformed its primary benchmark by posting a return of 2.60% compared to 4.13% for the Credit Suisse Hedge Fund Index. The Fund underperformed its blended benchmark return of 4.81% for the 15% S&P 500 Index, 10% MSCI EAFE Index, 10% Barclays U.S. Aggregate Bond Index and 65% Credit Suisse Hedge Fund Index. The Fund's investment objective is to seek long term growth of capital and income through investment in other funds (the "Underlying Funds"). Under normal market conditions, the Fund allocates approximately 35% of its assets to Underlying Funds that invest primarily in traditional asset classes, allocating approximately 0% to 10% in fixed income securities, 15% to 25% in U.S. equity securities and 0% to 10% in international securities. Under normal market conditions, the Fund allocates approximately 65% of its assets to Underlying Funds that invest in the non-traditional asset classes.
The Fund underperformed the Credit Suisse Hedge Fund Index due to the fact that the benchmark had a lower allocation to international equity
(0%) versus the Fund (10%) and international equity performed poorly in 2014. The Fund's largest contributor during the year, the JNL/S&P 4 strategy, includes JNL/S&P Competitive Advantage Fund, JNL/S&P Dividend Income & Growth Fund, JNL/S&P Intrinsic Value Fund and JNL/S&P Total Yield Fund, which returned 10.06%, 13.70%, 18.04% and 15.89%, respectively. The largest allocations to alternatives included JNL/Red Rocks Listed Private Equity Fund and Curian/FAMCO Flex Core Covered Call Fund, which posted returns of 0.62% and 8.84%, respectively. Other alternative allocations delivered mixed performance. Commodity related funds such as JNL/BlackRock Commodity Securities Strategy Fund and Curian/Van Eck International Gold Fund returned -14.25% and -6.13%, respectively. Conversely, interest rate sensitive funds such as JNL/Brookfield Global Infrastructure and MLP Fund and JNL/Invesco Global Real Estate Fund returned 7.35% and 15.03%, respectively.
During the year, the overall allocations to global equity and fixed income were changed in order to increase equity exposure and reduce fixed income exposure. Within the equity allocation, changes were made to favor large cap domestic equities and to reduce frontier market equities. Within the alternative allocation, changes were made in order to reduce allocations to long short credit funds in lieu of funds with greater equity market sensitivity such as covered call and convertible arbitrage strategies. Alternative allocations were also adjusted in order to make room for the addition of JNL/Boston Partners Global Long Short Equity Fund. Alternative asset allocations, such as listed private equity, infrastructure and real estate funds, were increased at the expense of alternative strategy allocations, such as equity hedge and relative value funds.
Curian Guidance – Alt 100 Conservative Fund
Portfolio Composition†:
Alternative | | | 100.0 | % | |
Total Investments | | | 100.0 | % | |
†Total Investments as of December 31, 2014.
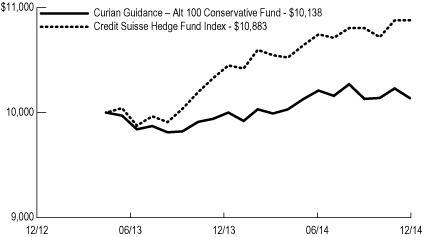
For the year ended December 31, 2014, Curian Guidance – Alt 100 Conservative Fund underperformed its benchmark by posting a return of 1.38% compared to 4.13% for the Credit Suisse Hedge Fund Index. The Fund's investment objective is to seek long term growth of capital consistent with capital preservation, through investment in other funds (the "Underlying Funds"). Under normal market conditions, the Fund may allocate 100% of its assets to the Underlying Funds that invest in non-traditional asset classes.
The Fund underperformed the Credit Suisse Hedge Fund Index due to the fact that the benchmark had relatively larger weights in macro strategies, such as managed futures and currency strategies, and relatively smaller weights in long only pure play commodity and commodity related equities. The Fund's largest holding at year end,

Curian Guidance Funds (continued)
Curian Capital, LLC
(Unaudited)
JNL/Boston Partners Global Long Short Equity Fund was added in the fall. The Fund's next largest holdings at year end included JNL/AQR Managed Futures Strategy Fund and Curian/FAMCO Flex Core Covered Call Fund, which returned 9.09% and 8.84%, respectively. Other alternative allocations delivered mixed performance. Commodity related funds such as JNL/BlackRock Commodity Securities Strategy Fund and Curian/Van Eck International Gold Fund returned -14.25% and -6.13%, respectively. Conversely, interest rate sensitive funds such as JNL/Brookfield Global Infrastructure and MLP Fund and JNL/Invesco Global Real Estate Fund returned 7.35% and 15.03%, respectively.
During the year, changes were made in order to reduce allocations to long short credit funds in order to make room for the addition of JNL/Boston Partners Global Long Short Equity Fund. The Curian/Neuberger Berman Risk Balanced Commodity Strategy Fund and JNL/BlackRock Commodity Securities Strategy Fund were both added in order to increase the Fund's allocation to alternative assets. Within the alternative strategy allocation, the Curain/PineBridge Merger Arbitrage Fund and the JNL/Mellon Capital Global Alpha Fund were both removed due to lackluster performance.
Curian Guidance – Alt 100 Moderate Fund
Portfolio Composition†:
Alternative | | | 100.0 | % | |
Total Investments | | | 100.0 | % | |
†Total Investments as of December 31, 2014.
For the year ended December 31, 2014, Curian Guidance – Alt 100 Moderate Fund underperformed its primary benchmark by posting a return of 2.27% compared to 4.13% for the Credit Suisse Hedge Fund Index. The Fund underperformed its blended benchmark return of 3.04% for the 80% Credit Suisse Hedge Fund Index, 10% FTSE EPRA/NAREIT Developed Index and 10% Bloomberg Commodity Index. The Fund's investment objective is to seek long term growth of capital through investment in other funds (the "Underlying Funds"). Under normal market conditions, the Fund may allocate 100% of its assets to the Underlying Funds that invest in non-traditional asset classes.
The Fund underperformed the Credit Suisse Hedge Fund Index due to the fact that the benchmark had relatively larger weights in macro strategies and relatively smaller weights in long only pure play commodity and commodity related equities. The Fund's largest holding at year end, JNL/Boston Partners Global Long Short Equity Fund was added in the fall. The Fund's next largest holdings at year end included JNL/Red Rocks Listed Private Equity Fund and Curian/FAMCO Flex Core Covered Call Fund, which returned 0.62% and 8.84%, respectively. Other alternative allocations delivered mixed performance. Commodity related funds such as JNL/BlackRock Commodity Securities Strategy Fund and
Curian/Van Eck International Gold Fund returned -14.25% and -6.13%, respectively. Conversely, interest rate sensitive funds such as JNL/Brookfield Global Infrastructure and MLP Fund and JNL/Invesco Global Real Estate Fund returned 7.35% and 15.03%, respectively.
During the year, changes were made in order to reduce allocations to long short credit funds in order to make room for the addition of JNL/Boston Partners Global Long Short Equity Fund. One of the Fund's macro strategies, JNL/AQR Managed Futures Strategy Fund was reduced in weight in order to supplement the Fund's relative value allocation with an increased allocation to the Curian/Nicholas Convertible Arbitrage Fund. Additionally, changes were made to remove Curian/Franklin Templeton Natural Resources Fund in order to add the Curian/Neuberger Berman Risk Balanced Commodity Fund.
Curian Guidance – Alt 100 Growth Fund
Portfolio Composition†:
Alternative | | | 100.0 | % | |
Total Investments | | | 100.0 | % | |
†Total Investments as of December 31, 2014.
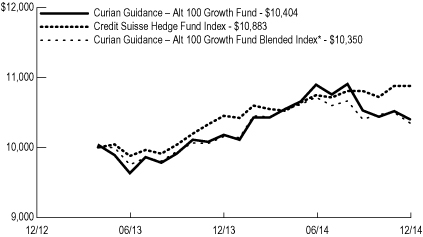
For the year ended December 31, 2014, Curian Guidance – Alt 100 Growth Fund underperformed its primary benchmark by posting a return of 2.20% compared to 4.13% for the Credit Suisse Hedge Fund Index. The Fund outperformed its blended benchmark return of 1.91% for the 60% Credit Suisse Hedge Fund Index, 20% FTSE EPRA/NAREIT Developed Index and 20% Bloomberg Commodity Index. The Fund's investment objective is to seek long term growth of capital through investment in other funds (the "Underlying Funds"). Under normal market conditions, the Fund may allocate 100% of its assets to the Underlying Funds that invest in non-traditional asset classes.
The Fund underperformed the Credit Suisse Hedge Fund Index due to the fact that the benchmark had relatively larger weights in macro strategies and relatively smaller weights in long only pure play commodity and commodity related equities. The Fund's largest holdings at year end included JNL/Red Rocks Listed Private Equity Fund and Curian/FAMCO Flex Core Covered Call Fund, which returned 0.62% and 8.84%, respectively. Other alternative allocations delivered mixed performance. Commodity related funds such as JNL/BlackRock Commodity Securities Strategy Fund and Curian/Van Eck International Gold Fund returned -14.25% and -6.13%, respectively. Conversely, interest rate sensitive funds such as JNL/Brookfield Global Infrastructure and MLP Fund and JNL/Invesco Global Real Estate Fund returned 7.35% and 15.03%, respectively.
During the year, changes were made in order to reduce allocations to long short credit funds in order to make room for the addition of JNL/Boston Partners Global Long Short Equity Fund. One of the Fund's macro strategies, JNL/AQR Managed Futures Strategy Fund, was reduced in weight in
order to supplement the Fund's relative value allocation with an increased allocation to the Curian/Nicholas Convertible Arbitrage Fund. Additionally, changes were made to remove Curian/Franklin Templeton Natural Resources Fund in order to add the Curian/Neuberger Berman Risk Balanced Commodity Fund.
Curian Guidance – International Conservative Fund
Portfolio Composition†:
International Fixed Income | | | 60.2 | % | |
International Equity | | | 20.9 | | |
Alternative | | | 14.9 | | |
Emerging Markets Equity | | | 4.0 | �� | |
Total Investments | | | 100.0 | % | |
†Total Investments as of December 31, 2014.
For the year ended December 31, 2014, Curian Guidance – International Conservative Fund underperformed its primary benchmark by posting a return of -2.03% compared to 4.78% for the Dow Jones Moderately Conservative Index. The Fund outperformed its blended benchmark return of -2.87% for the 20% MSCI All Country World ex U.S. Index and 80% Citigroup World Government Bond ex U.S. Index. The Fund's investment objective is to seek total return, consistent with preservation of capital, through a predominant allocation in international bonds, stocks and other asset classes and strategies through investment in other funds (the "Underlying Funds").
The Fund underperformed the Dow Jones Moderately Conservative Index during the year largely because the index is comprised with a large U.S. equity and fixed income bias, while the Fund has no allocation to domestic securities of any kind during a year when international asset classes lagged their domestic counterparts. The Fund's largest position at year end, Curian/Baring International Fixed Income Fund returned -2.59%. Other holdings posting declines included JNL/Goldman Sachs Emerging Markets Debt Fund, JNL/Lazard Emerging Markets Fund and Curian/Lazard International Strategic Equity Fund, which returned -4.94%, -5.26% and -1.42%, respectively. Within the alternatives, Curian/Neuberger Berman Currency Fund posted a return of 3.37%, while Curian/CenterSquare International Real Estate Securities Fund posted a return of 0.80% during the year.
Since inception, the asset class allocations have remained unchanged.
Curian Guidance – International Moderate Fund
Portfolio Composition†:
International Fixed Income | | | 40.1 | % | |
International Equity | | | 32.9 | | |
Emerging Markets Equity | | | 19.0 | | |
Alternative | | | 8.0 | | |
Total Investments | | | 100.0 | % | |
†Total Investments as of December 31, 2014.
For the year ended December 31, 2014, Curian Guidance – International Moderate Fund

Curian Guidance Funds (continued)
Curian Capital, LLC
(Unaudited)
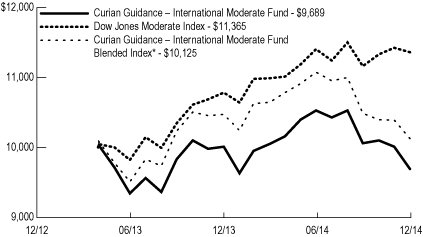
underperformed its primary benchmark by posting a return of -3.20% compared to 5.35% for the Dow Jones Moderate Index. The Fund outperformed its blended benchmark return of -3.32% for the 60% MSCI All Country World ex U.S. Index and 40% Citigroup World Government Bond ex U.S. Index. The Fund's investment objective is to seek total return through a predominant allocation in international stocks, bonds and other asset classes and strategies through investment in other funds (the "Underlying Funds").
The Fund underperformed the Dow Jones Moderate Index during the year largely because the index is comprised with a large U.S. equity and fixed income bias, while the Fund has no allocation to domestic securities of any kind during a year when international asset classes lagged their domestic counterparts. The Fund's largest position at year end, Curian/Baring International Fixed Income Fund returned -2.59%. Other holdings posting declined returns included JNL/Goldman Sachs Emerging Markets Debt Fund, JNL/Lazard Emerging Markets Fund and Curian/Lazard International Strategic Equity Fund, which returned -4.94%, -5.26% and -1.42%, respectively. The largest detractors in the Fund for the year were Curian/Ashmore Emerging Market Small Cap Equity Fund and Curian/Franklin Templeton Frontier Markets Fund, which returned -9.54% and -14.98%, respectively. Within the alternatives, Curian/Neuberger Berman Currency Fund posted a return of 3.37%, while Curian/CenterSquare International Real Estate Securities Fund posted a return of 0.80% during the year.
During the year, the removal of esoteric regional equity market exposures from the Fund contributed to performance. Curian/Aberdeen Latin America Fund, Curian/Schroder Emerging Europe Fund and JNL/Eastspring Investments China-India Fund were all removed in the first quarter in favor of allocations in international developed countries.
Curian Guidance – International Growth Fund
Portfolio Composition†:
International Equity | | | 44.7 | % | |
Emerging Markets Equity | | | 27.2 | | |
International Fixed Income | | | 20.1 | | |
Alternative | | | 8.0 | | |
Total Investments | | | 100.0 | % | |
†Total Investments as of December 31, 2014.
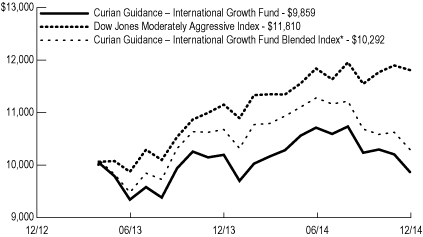
For the year ended December 31, 2014, Curian Guidance – International Growth Fund underperformed its primary benchmark by posting a return of -3.25% compared to 5.90% for the Dow Jones Moderately Aggressive Index. The Fund outperformed its blended benchmark return of -3.58% for the 80% MSCI All Country World ex U.S. Index and 20% Citigroup World Government Bond ex U.S. Index. The Fund's investment objective is to seek long term growth of capital through a predominant allocation in international stocks and other asset classes and strategies through
investment in other funds (the "Underlying Funds").
The Fund underperformed the Dow Jones Moderately Aggressive Index during the year largely because the index is comprised with a large U.S. equity and fixed income bias, while the Fund has no allocation to domestic securities of any kind during a year when international assets classes lagged their domestic counterparts. The Fund's largest positions at year end, JNL/Invesco International Growth Fund and Curian/Lazard International Strategic Equity Fund, posted mixed returns of 0.24% and -1.42%, respectively. Other Underlying Funds posting declined returns included JNL/Goldman Sachs Emerging Markets Debt Fund and JNL/Lazard Emerging Markets Fund, which returned -4.94% and -5.26%, respectively. The largest detractors in the Fund for the year were Curian/Ashmore Emerging Market Small Cap Equity Fund and Curian/Franklin Templeton Frontier Markets Fund, which returned -9.54% and -14.98%, respectively. Within the alternatives, Curian/Neuberger Berman Currency Fund posted a return of 3.37%, while Curian/CenterSquare International Real Estate Securities Fund posted a return of 0.80% during the year.
During the year, the removal of esoteric regional equity market exposures from the Fund contributed to performance. Curian/Aberdeen Latin America Fund, Curian/Schroder Emerging Europe Fund and JNL/Eastspring Investments China-India Fund were all removed in the first quarter in favor of allocations in international developed countries.
Curian Guidance – Equity 100 Fund
Portfolio Composition†:
Domestic Equity | | | 59.9 | % | |
International Equity | | | 28.0 | | |
Emerging Markets Equity | | | 12.1 | | |
Total Investments | | | 100.0 | % | |
†Total Investments as of December 31, 2014.
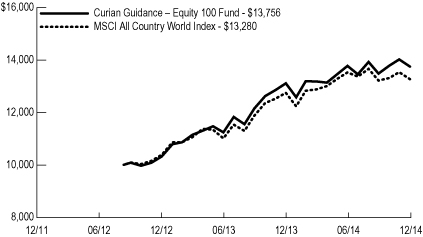
For the year ended December 31, 2014, Curian Guidance – Equity 100 Fund outperformed its benchmark by posting a return of 4.84% compared to 4.17% for the MSCI All Country World Index. The Fund's investment objective is to seek long term growth of capital through investment in other funds (the "Underlying Funds") with an equity orientation.
The Fund outperformed its benchmark during the year due to the strong performance of its domestic Underlying Funds. Performance of the Fund also benefitted from its overweight to domestic equity versus the benchmark, as domestic stocks outperformed non U.S. stocks during 2014. In addition, a bias to large cap stocks also benefitted performance. The Fund's largest contributor during the year, the JNL/S&P 4 strategy, includes JNL/S&P Competitive Advantage Fund, JNL/S&P Dividend Income & Growth Fund, JNL/S&P Intrinsic Value Fund and JNL/S&P Total Yield Fund, which returned 10.06%, 13.70%, 18.04% and 15.89%, respectively. Other positive contributors included, JNL/PPM America Mid Cap Value
Fund and JNL/JPMorgan MidCap Growth Fund, which returned 10.45% and 11.19%, respectively. The largest detractors in the Fund for the year were Curian/Ashmore Emerging Market Small Cap Equity Fund and Curian/Franklin Templeton Frontier Markets Fund, which returned -9.54% and -14.98%, respectively.
During the year, the Fund's domestic equity allocation was reduced to 60% from 74%. The Fund also replaced its investments in passively managed index funds with investments in actively managed equity funds.
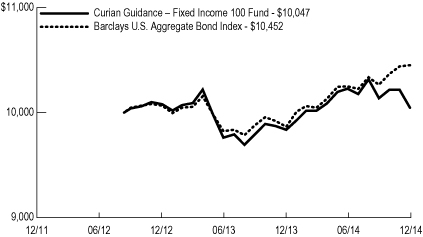
Curian Guidance – Fixed Income 100 Fund
Portfolio Composition†:
Domestic Fixed Income | | | 55.0 | % | |
Global Fixed Income | | | 30.0 | | |
International Fixed Income | | | 15.0 | | |
Total Investments | | | 100.0 | % | |
†Total Investments as of December 31, 2014.
For the year ended December 31, 2014, Curian Guidance – Fixed Income 100 Fund underperformed its benchmark by posting a return of 2.14% compared to 5.97% for the Barclays U.S. Aggregate Bond Index. The Fund's investment objective is to seek income and total return through investment in other funds (the "Underlying Funds") with a fixed income orientation.
The Fund underperformed its benchmark during the year due to the Fund's allocation to international debt that underperformed its domestic counterparts. The Fund's largest allocation at year end, Curian/DoubleLine Total Return Fund, posted a return of 6.49%. Other positive contributors included Curian/PIMCO Credit Income Fund and JNL/Neuberger Berman Strategic Income Fund, which returned 7.61% and 4.90%, respectively. The Fund's international exposure and detractors to performance, including JNL/Franklin Templeton Global Multisector Bond Fund and JNL/Goldman Sachs Emerging Markets Debt Fund, posted returns of -0.45% and -4.94%, respectively. Other laggards included non-investment grade allocations to JNL/PPM America High Yield Bond Fund and JNL/PPM America Floating Rate Income Fund, which posted returns of 0.13% and 0.12%, respectively.
During the year, a significant portion of the Fund's government exposure was reduced by the elimination of JNL/Mellon Capital Bond Index Fund, JNL/JPMorgan U.S. Government & Quality Bond Fund, JNL/PIMCO Real Return Fund and JNL/T. Rowe Price Short-Term Bond Fund. Sharp increases in international debt allocations were made in JNL/Franklin Templeton Global Multisector Bond Fund and JNL/Goldman Sachs Emerging Markets Debt Fund in order to diversify the Fund's geographical exposure. The Curian/PIMCO Credit Income Fund was also sharply reduced during the year.

Curian Guidance Funds (continued)
Curian Capital, LLC
(Unaudited)
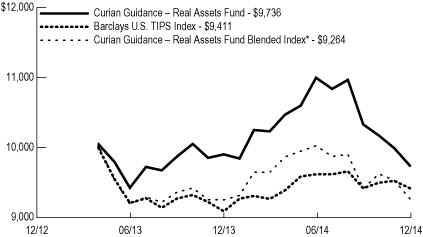
Curian Guidance – Real Assets Fund
Portfolio Composition†:
Alternative | | | 90.0 | % | |
Domestic Fixed Income | | | 10.0 | | |
Total Investments | | | 100.0 | % | |
†Total Investments as of December 31, 2014.
For the year ended December 31, 2014, Curian Guidance – Real Assets Fund underperformed its primary benchmark by posting a return of -1.65% compared to 3.64% for the Barclays U.S. TIPS Index. The Fund underperformed its blended benchmark return of 0.19% for the 33% FTSE EPRA/NAREIT Developed Index, 33% Bloomberg Commodity Index and 34% Barclays U.S. TIPS Index. The Fund's investment objective is to seek long term real return through an allocation in stocks and other asset classes and
strategies through investment in other funds (the "Underlying Funds").
The Fund underperformed the Barclays U.S. TIPS Index during the year due to the Fund's allocation in long only pure play commodity and commodity related equities, which declined in parity with commodity markets. Alternative asset allocation performance was mixed. Commodity related funds such as JNL/BlackRock Commodity Securities Strategy Fund and Curian/Van Eck International Gold Fund returned -14.25% and -6.13%, respectively. Conversely, interest rate sensitive funds such as JNL/Brookfield Global Infrastructure and MLP Fund and JNL/Invesco Global Real Estate Fund returned 7.35% and 15.03%, respectively. On the other hand, alternative strategy performance was strong as
Curian/Eaton Vance Global Macro Absolute Return Advantage Fund and Curian/Neuberger Berman Currency Fund returned 4.73% and 3.37%, respectively.
During the year, Curian/Franklin Templeton Natural Resources Fund was removed in exchange for Curian/Neuberger Berman Risk Balanced Commodity Fund. The Fund's allocations were shifted in order to reduce the Fund's dependency on rising oil prices which was accretive to performance as energy prices collapsed in the second half of the year. The Fund also cut Curian/Neuberger Berman Currency Fund's allocation in half in order to shift the Fund's allocation into more equity related alternative assets.
Curian Guidance – Interest Rate Opportunities Fund

*60% HFRX Fixed Income-Credit Index, 40% Barclays U.S. Aggregate Bond Index
Average Annual Total Returns | |
| 1 Year | | | 1.05 | % | |
Since Inception | | | -0.34 | % | |
(Inception date April 29, 2013) | |
Past performance is not predictive of future performance. Investment return and principal value will fluctuate so that an investor's shares, when redeemed, may be worth more or less than their original cost. Performance numbers are net of all Fund operating expenses, but not do not reflect the deduction of insurance charges.

Curian Guidance Funds (continued)
Curian Capital, LLC
(Unaudited)
Curian Guidance – Multi-Strategy Income Fund
Average Annual Total Returns | |
| 1 Year | | | 1.93 | % | |
Since Inception | | | -0.49 | % | |
(Inception date April 29, 2013) | |
Curian Guidance – Equity Income Fund
*55% S&P 500 Index, 25% MSCI EAFE Index, 20% Barclays U.S. Aggregate Bond Index
Average Annual Total Returns | |
| 1 Year | | | 8.62 | | |
Since Inception | | | 10.35 | | |
(Inception date February 6, 2012) | |
Curian Guidance – Conservative Fund
Average Annual Total Returns | |
| 1 Year | | | 3.71 | % | |
Since Inception | | | 3.69 | % | |
(Inception date February 6, 2012) | |
Past performance is not predictive of future performance. Investment return and principal value will fluctuate so that an investor's shares, when redeemed, may be worth more or less than their original cost. Performance numbers are net of all Fund operating expenses, but not do not reflect the deduction of insurance charges.

Curian Guidance Funds (continued)
Curian Capital, LLC
(Unaudited)
Curian Guidance – Moderate Fund
*25% S&P 500 Index, 20% MSCI EAFE Index, 35% Barclays U.S. Aggregate Bond Index, 20% Credit Suisse Hedge Fund Index
Average Annual Total Returns | |
| 1 Year | | | 3.71 | % | |
Since Inception | | | 7.24 | % | |
(Inception date February 6, 2012) | |
Curian Guidance – Growth Fund

*35% S&P 500 Index, 30% MSCI EAFE Index, 15% Barclays U.S. Aggregate Bond Index, 20% Credit Suisse Hedge Fund Index
Average Annual Total Returns | |
| 1 Year | | | 4.16 | % | |
Since Inception | | | 8.11 | % | |
(Inception date April 29, 2013) | |
Past performance is not predictive of future performance. Investment return and principal value will fluctuate so that an investor's shares, when redeemed, may be worth more or less than their original cost. Performance numbers are net of all Fund operating expenses, but not do not reflect the deduction of insurance charges.

Curian Guidance Funds (continued)
Curian Capital, LLC
(Unaudited)
Curian Guidance – Moderate Growth Fund

*30% S&P 500 Index, 25% MSCI EAFE Index, 25% Barclays U.S. Aggregate Bond Index, 20% Credit Suisse Hedge Fund Index
Average Annual Total Returns | |
| 1 Year | | | 4.11 | % | |
Since Inception | | | 7.25 | % | |
(Inception date February 6, 2012) | |
Curian Guidance – Maximum Growth Fund
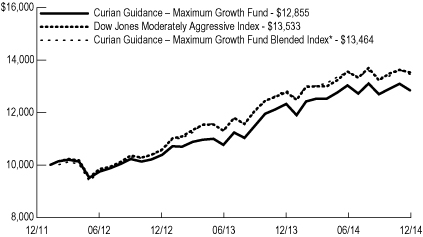
*40% S&P 500 Index, 35% MSCI EAFE Index, 10% Barclays U.S. Aggregate Bond Index, 15% Credit Suisse Hedge Fund Index
Average Annual Total Returns | |
| 1 Year | | | 4.26 | % | |
Since Inception | | | 9.04 | % | |
(Inception date February 6, 2012) | |
Past performance is not predictive of future performance. Investment return and principal value will fluctuate so that an investor's shares, when redeemed, may be worth more or less than their original cost. Performance numbers are net of all Fund operating expenses, but not do not reflect the deduction of insurance charges.

Curian Guidance Funds (continued)
Curian Capital, LLC
(Unaudited)
Curian Guidance – Tactical Moderate Growth Fund
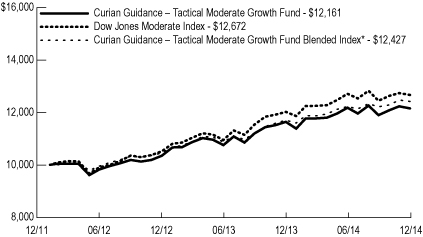
*25% S&P 500 Index, 10% MSCI EAFE Index, 35% Barclays U.S. Aggregate Bond Index, 30% Credit Suisse Hedge Fund Index
Average Annual Total Returns | |
| 1 Year | | | 4.44 | % | |
Since Inception | | | 6.98 | % | |
(Inception date February 6, 2012) | |
Curian Guidance – Tactical Maximum Growth Fund

*30% S&P 500 Index, 15% MSCI EAFE Index, 25% Barclays U.S. Aggregate Bond Index, 30% Credit Suisse Hedge Fund Index
Average Annual Total Returns | |
| 1 Year | | | 3.78 | % | |
Since Inception | | | 7.34 | % | |
(Inception date February 6, 2012) | |
Past performance is not predictive of future performance. Investment return and principal value will fluctuate so that an investor's shares, when redeemed, may be worth more or less than their original cost. Performance numbers are net of all Fund operating expenses, but not do not reflect the deduction of insurance charges.

Curian Guidance Funds (continued)
Curian Capital, LLC
(Unaudited)
Curian Guidance – Institutional Alt 65 Fund
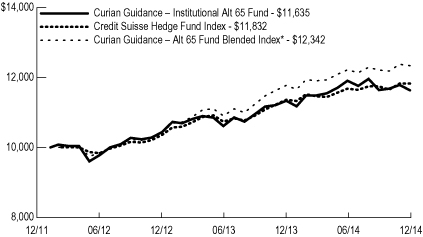
*15% S&P 500 Index, 10% MSCI EAFE Index, 10% Barclays U.S. Aggregate Bond Index, 65% Credit Suisse Hedge Fund Index
Average Annual Total Returns | |
| 1 Year | | | 2.60 | % | |
Since Inception | | | 5.36 | % | |
(Inception date February 6, 2012) | |
Curian Guidance – Alt 100 Conservative Fund
Average Annual Total Returns | |
| 1 Year | | | 1.38 | % | |
Since Inception | | | 0.82 | % | |
(Inception date April 29, 2013) | |
Past performance is not predictive of future performance. Investment return and principal value will fluctuate so that an investor's shares, when redeemed, may be worth more or less than their original cost. Performance numbers are net of all Fund operating expenses, but not do not reflect the deduction of insurance charges.

Curian Guidance Funds (continued)
Curian Capital, LLC
(Unaudited)
Curian Guidance – Alt 100 Moderate Fund

*80% Credit Suisse Hedge Fund Index, 10% FTSE EPRA/NAREIT Developed Index, 10% Bloomberg Commodity Index
Average Annual Total Returns | |
| 1 Year | | | 2.27 | % | |
Since Inception | | | 2.91 | % | |
(Inception date February 6, 2012) | |
Curian Guidance – Alt 100 Growth Fund
*60% Credit Suisse Hedge Fund Index, 20% FTSE EPRA/NAREIT Developed Index, 20% Bloomberg Commodity Index
Average Annual Total Returns | |
| 1 Year | | | 2.20 | % | |
Since Inception | | | 2.39 | % | |
(Inception date April 29, 2013) | |
Past performance is not predictive of future performance. Investment return and principal value will fluctuate so that an investor's shares, when redeemed, may be worth more or less than their original cost. Performance numbers are net of all Fund operating expenses, but not do not reflect the deduction of insurance charges.

Curian Guidance Funds (continued)
Curian Capital, LLC
(Unaudited)
Curian Guidance – International Conservative Fund

*20% MSCI All Country World ex U.S. Index, 80% Citigroup World Government Bond ex U.S. Index
Average Annual Total Returns | |
| 1 Year | | | -2.03 | % | |
Since Inception | | | -2.34 | % | |
(Inception date April 29, 2013) | |
Curian Guidance – International Moderate Fund
*60% MSCI All Country World ex U.S. Index, 40% Citigroup World Government Bond ex U.S. Index
Average Annual Total Returns | |
| 1 Year | | | -3.20 | % | |
Since Inception | | | -1.87 | % | |
(Inception date April 29, 2013) | |
Past performance is not predictive of future performance. Investment return and principal value will fluctuate so that an investor's shares, when redeemed, may be worth more or less than their original cost. Performance numbers are net of all Fund operating expenses, but not do not reflect the deduction of insurance charges.

Curian Guidance Funds (continued)
Curian Capital, LLC
(Unaudited)
Curian Guidance – International Growth Fund
*80% MSCI All Country World ex U.S. Index, 20% Citigroup World Government Bond ex U.S. Index
Average Annual Total Returns | |
| 1 Year | | | -3.25 | % | |
Since Inception | | | -0.85 | % | |
(Inception date April 29, 2013) | |
Curian Guidance – Equity 100 Fund
Average Annual Total Returns | |
| 1 Year | | | 4.84 | % | |
Since Inception | | | 14.83 | % | |
(Inception date September 10, 2012) | |
Past performance is not predictive of future performance. Investment return and principal value will fluctuate so that an investor's shares, when redeemed, may be worth more or less than their original cost. Performance numbers are net of all Fund operating expenses, but not do not reflect the deduction of insurance charges.

Curian Guidance Funds (continued)
Curian Capital, LLC
(Unaudited)
Curian Guidance – Fixed Income 100 Fund
Average Annual Total Returns | |
| 1 Year | | | 2.14 | % | |
Since Inception | | | 0.20 | % | |
(Inception date September 10, 2012) | |
Curian Guidance – Real Assets Fund
*33% FTSE EPRA/NAREIT Developed Index, 33% Bloomberg Commodity Index, 34% Barclays U.S. TIPS Index
Average Annual Total Returns | |
| 1 Year | | | -1.65 | % | |
Since Inception | | | -1.58 | % | |
(Inception date April 29, 2013) | |
Past performance is not predictive of future performance. Investment return and principal value will fluctuate so that an investor's shares, when redeemed, may be worth more or less than their original cost. Performance numbers are net of all Fund operating expenses, but not do not reflect the deduction of insurance charges.

Curian/American Funds
Capital Research and Management Company
(Unaudited)
Curian/American Funds® Global Growth Fund
Portfolio Composition†:
Global Equity | | | 100.0 | % | |
Total Investments | | | 100.0 | % | |
†Total Investments as of December 31, 2014.
Portfolio Manager Commentary: For the year ended December 31, 2014, Curian/American Funds Global Growth Fund underperformed its benchmark by posting a return of 2.06% compared to 4.17% for the MSCI All Country World Index.
The Fund seeks long-term growth of capital through exclusive investment in Class 1 shares of the American Funds Insurance Series® – Global Growth
FundSM (the "Master Fund"). The performance of the Fund is directly related to the performance of the Master Fund. The financial statements of the Master Fund, including the Schedule of Investments and portfolio manager commentary, are provided separately and should be read in conjunction with the Fund's financial statements.
Curian/American Funds® Growth Fund
Portfolio Composition†:
Domestic Equity | | | 100.0 | % | |
Total Investments | | | 100.0 | % | |
†Total Investments as of December 31, 2014.
Portfolio Manager Commentary: For the year ended December 31, 2014, Curian/American Funds Growth Fund underperformed its benchmark by posting a return of 7.98% compared to 13.69% for the S&P 500 Index.
The Fund seeks growth of capital through exclusive investment in Class 1 shares of the American Funds Insurance Series® – Growth FundSM (the
"Master Fund"). The performance of the Fund is directly related to the performance of the Master Fund. The financial statements of the Master Fund, including the Schedule of Investments and portfolio manager commentary, are provided separately and should be read in conjunction with the Fund's financial statements.

Curian/American Funds (continued)
Capital Research and Management Company
(Unaudited)
Curian/American Funds® Global Growth Fund

Average Annual Total Returns* | |
| 1 Year | | | 2.06 | | |
Since Inception | | | 9.38 | | |
(Inception date September 16, 2013) | |
Curian/American Funds® Growth Fund

Average Annual Total Returns* | |
| 1 Year | | | 7.98 | % | |
Since Inception | | | 14.81 | % | |
(Inception date February 6, 2012) | |
Past performance is not predictive of future performance. Investment return and principal value will fluctuate so that an investor's shares, when redeemed, may be worth more or less than their original cost. Performance numbers are net of all Fund operating expenses, but not do not reflect the deduction of insurance charges.
*The Fund's investment adviser waived certain expenses of the Fund. Performance results shown reflect the waiver, without which they would have been lower.
Curian Variable Series Trust Master Feeder Funds and Fund of Funds
Schedules of Investments (in thousands)
December 31, 2014
Curian Guidance - Interest Rate Opportunities Fund
| | Shares | | Value | |
INVESTMENT COMPANIES - 100.0% | | | | | |
| | | | | |
ALTERNATIVE - 67.0% | | | | | |
Curian Long Short Credit Fund (2.3%) (a) | | 852 | | $ | 8,264 | |
Curian/BlackRock Global Long Short Credit Fund (2.2%) (a) | | 809 | | 8,271 | |
Curian/FAMCO Flex Core Covered Call Fund (1.0%) (a) | | 208 | | 2,572 | |
Curian/UBS Global Long Short Fixed Income Opportunities Fund (4.8%) (a) | | 870 | | 8,279 | |
JNL/Brookfield Global Infrastructure and MLP Fund - Class A (0.2%) (a) | | 202 | | 3,103 | |
JNL/Invesco Global Real Estate Fund - Class A (0.2%) (a) | | 379 | | 4,108 | |
| | | | 34,597 | |
DOMESTIC FIXED INCOME - 25.0% | | | | | |
JNL/PIMCO Real Return Fund - Class A (0.3%) (a) | | 496 | | 5,187 | |
JNL/PPM America Floating Rate Income Fund - Class A (0.5%) (a) | | 728 | | 7,753 | |
| | | | 12,940 | |
INTERNATIONAL FIXED INCOME - 8.0% | | | | | |
JNL/Goldman Sachs Emerging Markets Debt Fund - Class A (0.6%) (a) | | 394 | | 4,128 | |
Total Investment Companies (cost $52,861) | | | | 51,665 | |
Total Investments - 100.0% (cost $52,861) | | | | 51,665 | |
Other Assets and Liabilities - Net - (0.0%) | | | | (12 | ) |
Total Net Assets - 100.0% | | | | $ | 51,653 | |
Curian Guidance - Multi-Strategy Income Fund
INVESTMENT COMPANIES - 100.0% | | | | | |
| | | | | |
ALTERNATIVE - 20.1% | | | | | |
Curian Long Short Credit Fund (0.5%) (a) | | 196 | | $ | 1,907 | |
Curian/BlackRock Global Long Short Credit Fund (0.5%) (a) | | 187 | | 1,907 | |
Curian/FAMCO Flex Core Covered Call Fund (0.2%) (a) | | 48 | | 595 | |
Curian/UBS Global Long Short Fixed Income Opportunities Fund (1.1%) (a) | | 200 | | 1,907 | |
JNL/Brookfield Global Infrastructure and MLP Fund - Class A (0.1%) (a) | | 47 | | 718 | |
JNL/Invesco Global Real Estate Fund - Class A (0.0%) (a) | | 88 | | 952 | |
| | | | 7,986 | |
DOMESTIC FIXED INCOME - 46.0% | | | | | |
Curian/DoubleLine Total Return Fund (0.5%) (a) | | 524 | | 5,565 | |
Curian/PIMCO Credit Income Fund (4.7%) (a) | | 382 | | 4,175 | |
JNL/PIMCO Real Return Fund - Class A (0.1%) (a) | | 114 | | 1,194 | |
JNL/PPM America Floating Rate Income Fund - Class A (0.3%) (a) | | 429 | | 4,569 | |
JNL/PPM America High Yield Bond Fund - Class A (0.1%) (a) | | 418 | | 2,780 | |
| | | | 18,283 | |
GLOBAL FIXED INCOME - 24.5% | | | | | |
JNL/Franklin Templeton Global Multisector Bond Fund - Class A (0.3%) (a) | | 483 | | 5,560 | |
JNL/Neuberger Berman Strategic Income Fund - Class A (0.6%) (a) | | 383 | | 4,171 | |
| | | | 9,731 | |
INTERNATIONAL FIXED INCOME - 9.4% | | | | | |
JNL/Goldman Sachs Emerging Markets Debt Fund - Class A (0.6%) (a) | | 357 | | 3,733 | |
Total Investment Companies (cost $40,457) | | | | 39,733 | |
Total Investments - 100.0% (cost $40,457) | | | | 39,733 | |
Other Assets and Liabilities - Net - (0.0%) | | | | (9 | ) |
Total Net Assets - 100.0% | | | | $ | 39,724 | |
Curian Guidance - Equity Income Fund
INVESTMENT COMPANIES - 100.0% | | | | | |
| | | | | |
ALTERNATIVE - 35.1% | | | | | |
Curian/FAMCO Flex Core Covered Call Fund (5.7%) (a) | | 1,139 | | $ | 14,063 | |
JNL/Brookfield Global Infrastructure and MLP Fund - Class A (0.3%) (a) | | 230 | | 3,526 | |
JNL/Invesco Global Real Estate Fund - Class A (0.3%) (a) | | 646 | | 7,010 | |
| | | | 24,599 | |
DOMESTIC EQUITY - 25.0% | | | | | |
Curian/The Boston Company Equity Income Fund (17.1%) (a) | | 732 | | 10,509 | |
JNL/T. Rowe Price Value Fund - Class A (0.2%) (a) | | 406 | | 7,009 | |
| | | | 17,518 | |
GLOBAL EQUITY - 39.9% | | | | | |
Curian/Epoch Global Shareholder Yield Fund (48.8%) (a) | | 2,366 | | 27,992 | |
Total Investment Companies (cost $65,721) | | | | 70,109 | |
Total Investments - 100.0% (cost $65,721) | | | | 70,109 | |
Other Assets and Liabilities - Net - (0.0%) | | | | (18 | ) |
Total Net Assets - 100.0% | | | | $ | 70,091 | |
Curian Guidance - Conservative Fund
INVESTMENT COMPANIES - 100.0% | | | | | |
| | | | | |
ALTERNATIVE - 34.9% | | | | | |
Curian Dynamic Risk Advantage - Diversified Fund (3.0%) (a) | | 980 | | $ | 10,507 | |
Curian/BlackRock Global Long Short Credit Fund (2.8%) (a) | | 1,034 | | 10,563 | |
Curian/FAMCO Flex Core Covered Call Fund (3.0%) (a) | | 593 | | 7,328 | |
JNL/Invesco Global Real Estate Fund - Class A (0.2%) (a) | | 385 | | 4,175 | |
JNL/Red Rocks Listed Private Equity Fund - Class A (0.5%) (a) | | 386 | | 4,215 | |
| | | | 36,788 | |
DOMESTIC FIXED INCOME - 35.8% | | | | | |
Curian/DoubleLine Total Return Fund (1.4%) (a) | | 1,592 | | 16,906 | |
| | | | | | |
See accompanying Notes to Financial Statements.
| | Shares | | Value | |
Curian/PIMCO Credit Income Fund (11.7%) (a) | | 947 | | 10,360 | |
JNL/PPM America Floating Rate Income Fund - Class A (0.2%) (a) | | 337 | | 3,590 | |
JNL/PPM America High Yield Bond Fund - Class A (0.3%) (a) | | 1,030 | | 6,850 | |
| | | | 37,706 | |
GLOBAL FIXED INCOME - 19.5% | | | | | |
JNL/Franklin Templeton Global Multisector Bond Fund - Class A (0.7%) (a) | | 1,191 | | 13,711 | |
JNL/Neuberger Berman Strategic Income Fund - Class A (1.0%) (a) | | 630 | | 6,862 | |
| | | | 20,573 | |
INTERNATIONAL FIXED INCOME - 9.8% | | | | | |
JNL/Goldman Sachs Emerging Markets Debt Fund - Class A (1.6%) (a) | | 990 | | 10,352 | |
Total Investment Companies (cost $106,492) | | | | 105,419 | |
Total Investments - 100.0% (cost $106,492) | | | | 105,419 | |
Other Assets and Liabilities - Net - (0.0%) | | | | (27 | ) |
Total Net Assets - 100.0% | | | | $ | 105,392 | |
| | | | | | |
Curian Guidance - Moderate Fund
INVESTMENT COMPANIES - 100.0% | | | | | |
| | | | | |
ALTERNATIVE - 32.5% | | | | | |
Curian Dynamic Risk Advantage - Diversified Fund (7.6%) (a) | | 2,501 | | $ | 26,812 | |
Curian Long Short Credit Fund (0.9%) (a) | | 332 | | 3,222 | |
Curian/AQR Risk Parity Fund (3.9%) (a) | | 648 | | 6,796 | |
Curian/BlackRock Global Long Short Credit Fund (0.8%) (a) | | 316 | | 3,227 | |
Curian/Eaton Vance Global Macro Absolute Return Advantage Fund (1.3%) (a) | | 539 | | 5,376 | |
Curian/FAMCO Flex Core Covered Call Fund (3.9%) (a) | | 780 | | 9,627 | |
Curian/Neuberger Berman Risk Balanced Commodity Strategy Fund (2.0%) (a) | | 457 | | 3,541 | |
Curian/Nicholas Convertible Arbitrage Fund (1.6%) (a) | | 704 | | 7,161 | |
Curian/UBS Global Long Short Fixed Income Opportunities Fund (1.9%) (a) | | 339 | | 3,225 | |
Curian/Van Eck International Gold Fund (3.7%) (a) | | 693 | | 3,041 | |
JNL/AQR Managed Futures Strategy Fund - Class A (1.3%) (a) | | 670 | | 6,898 | |
JNL/BlackRock Commodity Securities Fund - Class A (0.3%) (a) | | 373 | | 3,569 | |
JNL/Boston Partners Global Long Short Equity Fund - Class A (2.8%) (a) | | 1,085 | | 10,696 | |
JNL/Brookfield Global Infrastructure and MLP Fund - Class A (0.6%) (a) | | 472 | | 7,240 | |
JNL/Invesco Global Real Estate Fund - Class A (0.3%) (a) | | 656 | | 7,113 | |
JNL/Red Rocks Listed Private Equity Fund - Class A (1.1%) (a) | | 819 | | 8,933 | |
| | | | 116,477 | |
DOMESTIC EQUITY - 25.0% | | | | | |
JNL/Franklin Templeton Small Cap Value Fund - Class A (0.3%) (a) | | 238 | | 3,609 | |
JNL/Invesco Small Cap Growth Fund - Class A (0.4%) (a) | | 175 | | 3,573 | |
JNL/JPMorgan MidCap Growth Fund - Class A (0.5%) (a) | | 201 | | 6,434 | |
JNL/PPM America Mid Cap Value Fund - Class A (1.6%) (a) | | 416 | | 6,460 | |
JNL/S&P Competitive Advantage Fund - Class A (0.4%) (a) | | 634 | | 10,712 | |
JNL/S&P Dividend Income & Growth Fund - Class A (0.2%) (a) | | 700 | | 10,686 | |
JNL/S&P Intrinsic Value Fund - Class A (0.4%) (a) | | 648 | | 10,724 | |
JNL/S&P Total Yield Fund - Class A (0.6%) (a) | | 718 | | 10,816 | |
JNL/T. Rowe Price Established Growth Fund - Class A (0.5%) (a) | | 796 | | 26,426 | |
| | | | 89,440 | |
DOMESTIC FIXED INCOME - 13.7% | | | | | |
Curian/DoubleLine Total Return Fund (1.8%) (a) | | 2,061 | | 21,894 | |
Curian/PIMCO Credit Income Fund (15.4%) (a) | | 1,248 | | 13,656 | |
JNL/PPM America Floating Rate Income Fund - Class A (0.3%) (a) | | 438 | | 4,660 | |
JNL/PPM America High Yield Bond Fund - Class A (0.3%) (a) | | 1,346 | | 8,951 | |
| | | | 49,161 | |
EMERGING MARKETS EQUITY - 5.3% | | | | | |
Curian/Ashmore Emerging Market Small Cap Equity Fund (8.5%) (a) | | 351 | | 3,256 | |
Curian/Franklin Templeton Frontier Markets Fund (4.5%) (a) | | 346 | | 3,251 | |
JNL/Lazard Emerging Markets Fund - Class A (0.9%) (a) | | 1,257 | | 12,532 | |
| | | | 19,039 | |
GLOBAL FIXED INCOME - 7.5% | | | | | |
JNL/Franklin Templeton Global Multisector Bond Fund - Class A (0.9%) (a) | | 1,554 | | 17,892 | |
JNL/Neuberger Berman Strategic Income Fund - Class A (1.3%) (a) | | 823 | | 8,962 | |
| | | | 26,854 | |
INTERNATIONAL EQUITY - 12.2% | | | | | |
Curian/Lazard International Strategic Equity Fund (17.5%) (a) | | 1,900 | | 21,719 | |
JNL/Invesco International Growth Fund - Class A (1.4%) (a) | | 1,710 | | 21,768 | |
| | | | 43,487 | |
INTERNATIONAL FIXED INCOME - 3.8% | | | | | |
JNL/Goldman Sachs Emerging Markets Debt Fund - Class A (2.1%) (a) | | 1,299 | | 13,587 | |
Total Investment Companies (cost $361,138) | | | | 358,045 | |
Total Investments - 100.0% (cost $361,138) | | | | 358,045 | |
Other Assets and Liabilities - Net - (0.0%) | | | | (88 | ) |
Total Net Assets - 100.0% | | | | $ | 357,957 | |
Curian Guidance - Growth Fund
INVESTMENT COMPANIES - 100.0% | | | | | |
| | | | | |
ALTERNATIVE - 27.6% | | | | | |
Curian Dynamic Risk Advantage - Diversified Fund (1.2%) (a) | | 388 | | $ | 4,157 | |
Curian Long Short Credit Fund (0.4%) (a) | | 138 | | 1,336 | |
Curian/AQR Risk Parity Fund (1.6%) (a) | | 270 | | 2,830 | |
Curian/BlackRock Global Long Short Credit Fund (0.4%) (a) | | 131 | | 1,338 | |
| | | | | | |
See accompanying Notes to Financial Statements.
| | Shares | | Value | |
Curian/Eaton Vance Global Macro Absolute Return Advantage Fund (0.6%) (a) | | 235 | | 2,342 | |
Curian/FAMCO Flex Core Covered Call Fund (2.2%) (a) | | 443 | | 5,470 | |
Curian/Neuberger Berman Risk Balanced Commodity Strategy Fund (1.2%) (a) | | 278 | | 2,154 | |
Curian/Nicholas Convertible Arbitrage Fund (0.6%) (a) | | 262 | | 2,670 | |
Curian/UBS Global Long Short Fixed Income Opportunities Fund (0.8%) (a) | | 141 | | 1,340 | |
Curian/Van Eck International Gold Fund (2.8%) (a) | | 513 | | 2,252 | |
JNL/AQR Managed Futures Strategy Fund - Class A (0.6%) (a) | | 278 | | 2,862 | |
JNL/BlackRock Commodity Securities Fund - Class A (0.2%) (a) | | 225 | | 2,151 | |
JNL/Boston Partners Global Long Short Equity Fund - Class A (0.7%) (a) | | 286 | | 2,821 | |
JNL/Brookfield Global Infrastructure and MLP Fund - Class A (0.3%) (a) | | 217 | | 3,332 | |
JNL/Invesco Global Real Estate Fund - Class A (0.2%) (a) | | 305 | | 3,308 | |
JNL/Red Rocks Listed Private Equity Fund - Class A (0.6%) (a) | | 503 | | 5,493 | |
| | | | 45,856 | |
DOMESTIC EQUITY - 36.9% | | | | | |
JNL/Franklin Templeton Small Cap Value Fund - Class A (0.2%) (a) | | 164 | | 2,496 | |
JNL/Invesco Small Cap Growth Fund - Class A (0.3%) (a) | | 122 | | 2,483 | |
JNL/JPMorgan MidCap Growth Fund - Class A (0.3%) (a) | | 135 | | 4,312 | |
JNL/PPM America Mid Cap Value Fund - Class A (1.1%) (a) | | 277 | | 4,309 | |
JNL/S&P Competitive Advantage Fund - Class A (0.3%) (a) | | 432 | | 7,300 | |
JNL/S&P Dividend Income & Growth Fund - Class A (0.2%) (a) | | 476 | | 7,268 | |
JNL/S&P Intrinsic Value Fund - Class A (0.3%) (a) | | 440 | | 7,275 | |
JNL/S&P Total Yield Fund - Class A (0.4%) (a) | | 485 | | 7,305 | |
JNL/T. Rowe Price Established Growth Fund - Class A (0.4%) (a) | | 559 | | 18,559 | |
| | | | 61,307 | |
DOMESTIC FIXED INCOME - 5.5% | | | | | |
Curian/DoubleLine Total Return Fund (0.3%) (a) | | 394 | | 4,184 | |
Curian/PIMCO Credit Income Fund (2.8%) (a) | | 230 | | 2,512 | |
JNL/PPM America Floating Rate Income Fund - Class A (0.1%) (a) | | 78 | | 836 | |
JNL/PPM America High Yield Bond Fund - Class A (0.1%) (a) | | 251 | | 1,667 | |
| | | | 9,199 | |
EMERGING MARKETS EQUITY - 7.7% | | | | | |
Curian/Ashmore Emerging Market Small Cap Equity Fund (5.7%) (a) | | 237 | | 2,191 | |
Curian/Franklin Templeton Frontier Markets Fund (3.1%) (a) | | 234 | | 2,199 | |
JNL/Lazard Emerging Markets Fund - Class A (0.6%) (a) | | 852 | | 8,497 | |
| | | | 12,887 | |
GLOBAL FIXED INCOME - 3.0% | | | | | |
JNL/Franklin Templeton Global Multisector Bond Fund - Class A (0.2%) (a) | | 290 | | 3,337 | |
JNL/Neuberger Berman Strategic Income Fund - Class A (0.3%) (a) | | 153 | | 1,672 | |
| | | | 5,009 | |
INTERNATIONAL EQUITY - 17.8% | | | | | |
Curian/Lazard International Strategic Equity Fund (11.9%) (a) | | 1,290 | | 14,750 | |
JNL/Invesco International Growth Fund - Class A (1.0%) (a) | | 1,161 | | 14,774 | |
| | | | 29,524 | |
INTERNATIONAL FIXED INCOME - 1.5% | | | | | |
JNL/Goldman Sachs Emerging Markets Debt Fund - Class A (0.4%) (a) | | 240 | | 2,508 | |
Total Investment Companies (cost $169,914) | | | | 166,290 | |
Total Investments - 100.0% (cost $169,914) | | | | 166,290 | |
Other Assets and Liabilities - Net - (0.0%) | | | | (39 | ) |
Total Net Assets - 100.0% | | | | $ | 166,251 | |
| | | | | | |
Curian Guidance - Moderate Growth Fund
INVESTMENT COMPANIES - 100.0% | | | | | |
| | | | | |
ALTERNATIVE - 30.1% | | | | | |
Curian Dynamic Risk Advantage - Diversified Fund (7.2%) (a) | | 2,350 | | $ | 25,187 | |
Curian Long Short Credit Fund (1.3%) (a) | | 468 | | 4,538 | |
Curian/AQR Risk Parity Fund (5.5%) (a) | | 914 | | 9,575 | |
Curian/BlackRock Global Long Short Credit Fund (1.2%) (a) | | 444 | | 4,543 | |
Curian/Eaton Vance Global Macro Absolute Return Advantage Fund (1.8%) (a) | | 759 | | 7,565 | |
Curian/FAMCO Flex Core Covered Call Fund (5.5%) (a) | | 1,099 | | 13,573 | |
Curian/Neuberger Berman Risk Balanced Commodity Strategy Fund (2.8%) (a) | | 646 | | 5,000 | |
Curian/Nicholas Convertible Arbitrage Fund (2.3%) (a) | | 991 | | 10,083 | |
Curian/UBS Global Long Short Fixed Income Opportunities Fund (2.6%) (a) | | 477 | | 4,540 | |
Curian/Van Eck International Gold Fund (5.2%) (a) | | 964 | | 4,234 | |
JNL/AQR Managed Futures Strategy Fund - Class A (1.9%) (a) | | 964 | | 9,917 | |
JNL/BlackRock Commodity Securities Fund - Class A (0.4%) (a) | | 525 | | 5,027 | |
JNL/Boston Partners Global Long Short Equity Fund - Class A (3.9%) (a) | | 1,529 | | 15,076 | |
JNL/Brookfield Global Infrastructure and MLP Fund - Class A (0.8%) (a) | | 660 | | 10,138 | |
JNL/Invesco Global Real Estate Fund - Class A (0.5%) (a) | | 926 | | 10,044 | |
JNL/Red Rocks Listed Private Equity Fund - Class A (1.5%) (a) | | 1,153 | | 12,582 | |
| | | | 151,622 | |
DOMESTIC EQUITY - 33.0% | | | | | |
JNL/Franklin Templeton Small Cap Value Fund - Class A (0.6%) (a) | | 434 | | 6,596 | |
JNL/Invesco Small Cap Growth Fund - Class A (0.7%) (a) | | 321 | | 6,543 | |
JNL/JPMorgan MidCap Growth Fund - Class A (0.9%) (a) | | 363 | | 11,581 | |
JNL/PPM America Mid Cap Value Fund - Class A (3.0%) (a) | | 746 | | 11,598 | |
| | | | | | |
See accompanying Notes to Financial Statements.
| | Shares | | Value | |
JNL/S&P Competitive Advantage Fund - Class A (0.7%) (a) | | 1,193 | | 20,139 | |
JNL/S&P Dividend Income & Growth Fund - Class A (0.5%) (a) | | 1,316 | | 20,097 | |
JNL/S&P Intrinsic Value Fund - Class A (0.8%) (a) | | 1,217 | | 20,141 | |
JNL/S&P Total Yield Fund - Class A (1.1%) (a) | | 1,346 | | 20,284 | |
JNL/T. Rowe Price Established Growth Fund - Class A (1.0%) (a) | | 1,485 | | 49,296 | |
| | | | 166,275 | |
DOMESTIC FIXED INCOME - 8.2% | | | | | |
Curian/DoubleLine Total Return Fund (1.5%) (a) | | 1,714 | | 18,195 | |
Curian/PIMCO Credit Income Fund (13.1%) (a) | | 1,064 | | 11,638 | |
JNL/PPM America Floating Rate Income Fund - Class A (0.3%) (a) | | 379 | | 4,038 | |
JNL/PPM America High Yield Bond Fund - Class A (0.3%) (a) | | 1,137 | | 7,563 | |
| | | | 41,434 | |
EMERGING MARKETS EQUITY - 6.6% | | | | | |
Curian/Ashmore Emerging Market Small Cap Equity Fund (14.6%) (a) | | 604 | | 5,603 | |
Curian/Franklin Templeton Frontier Markets Fund (7.8%) (a) | | 596 | | 5,601 | |
JNL/Lazard Emerging Markets Fund - Class A (1.7%) (a) | | 2,223 | | 22,162 | |
| | | | 33,366 | |
GLOBAL FIXED INCOME - 4.5% | | | | | |
JNL/Franklin Templeton Global Multisector Bond Fund - Class A (0.7%) (a) | | 1,313 | | 15,116 | |
JNL/Neuberger Berman Strategic Income Fund - Class A (1.1%) (a) | | 695 | | 7,570 | |
| | | | 22,686 | |
INTERNATIONAL EQUITY - 15.3% | | | | | |
Curian/Lazard International Strategic Equity Fund (31.2%) (a) | | 3,381 | | 38,642 | |
JNL/Invesco International Growth Fund - Class A (2.5%) (a) | | 3,041 | | 38,711 | |
| | | | 77,353 | |
INTERNATIONAL FIXED INCOME - 2.3% | | | | | |
JNL/Goldman Sachs Emerging Markets Debt Fund - Class A (1.8%) (a) | | 1,107 | | 11,580 | |
Total Investment Companies (cost $504,827) | | | | 504,316 | |
Total Investments - 100.0% (cost $504,827) | | | | 504,316 | |
Other Assets and Liabilities - Net - (0.0%) | | | | (126 | ) |
Total Net Assets - 100.0% | | | | $ | 504,190 | |
| | | | | | |
Curian Guidance - Maximum Growth Fund
INVESTMENT COMPANIES - 100.0% | | | | | |
| | | | | |
ALTERNATIVE - 20.1% | | | | | |
Curian Long Short Credit Fund (0.2%) (a) | | 87 | | $ | 840 | |
Curian/AQR Risk Parity Fund (0.9%) (a) | | 148 | | 1,552 | |
Curian/BlackRock Global Long Short Credit Fund (0.2%) (a) | | 82 | | 840 | |
Curian/Eaton Vance Global Macro Absolute Return Advantage Fund (0.3%) (a) | | 133 | | 1,321 | |
Curian/FAMCO Flex Core Covered Call Fund (1.3%) (a) | | 261 | | 3,222 | |
Curian/Neuberger Berman Risk Balanced Commodity Strategy Fund (0.7%) (a) | | 152 | | 1,175 | |
Curian/Nicholas Convertible Arbitrage Fund (0.4%) (a) | | 165 | | 1,678 | |
Curian/UBS Global Long Short Fixed Income Opportunities Fund (0.5%) (a) | | 88 | | 841 | |
Curian/Van Eck International Gold Fund (1.5%) (a) | | 283 | | 1,243 | |
JNL/AQR Managed Futures Strategy Fund - Class A (0.3%) (a) | | 158 | | 1,631 | |
JNL/BlackRock Commodity Securities Fund - Class A (0.1%) (a) | | 125 | | 1,192 | |
JNL/Boston Partners Global Long Short Equity Fund - Class A (0.4%) (a) | | 157 | | 1,548 | |
JNL/Brookfield Global Infrastructure and MLP Fund - Class A (0.1%) (a) | | 126 | | 1,930 | |
JNL/Invesco Global Real Estate Fund - Class A (0.1%) (a) | | 176 | | 1,909 | |
JNL/Red Rocks Listed Private Equity Fund - Class A (0.4%) (a) | | 285 | | 3,115 | |
| | | | 24,037 | |
DOMESTIC EQUITY - 47.1% | | | | | |
JNL/Franklin Templeton Small Cap Value Fund - Class A (0.2%) (a) | | 151 | | 2,298 | |
JNL/Invesco Small Cap Growth Fund - Class A (0.2%) (a) | | 112 | | 2,276 | |
JNL/JPMorgan MidCap Growth Fund - Class A (0.3%) (a) | | 124 | | 3,955 | |
JNL/PPM America Mid Cap Value Fund - Class A (1.0%) (a) | | 256 | | 3,973 | |
JNL/S&P Competitive Advantage Fund - Class A (0.2%) (a) | | 398 | | 6,726 | |
JNL/S&P Dividend Income & Growth Fund - Class A (0.2%) (a) | | 438 | | 6,687 | |
JNL/S&P Intrinsic Value Fund - Class A (0.3%) (a) | | 407 | | 6,731 | |
JNL/S&P Total Yield Fund - Class A (0.4%) (a) | | 449 | | 6,768 | |
JNL/T. Rowe Price Established Growth Fund - Class A (0.3%) (a) | | 510 | | 16,943 | |
| | | | 56,357 | |
EMERGING MARKETS EQUITY - 10.0% | | | | | |
Curian/Ashmore Emerging Market Small Cap Equity Fund (5.3%) (a) | | 222 | | 2,057 | |
Curian/Franklin Templeton Frontier Markets Fund (2.9%) (a) | | 219 | | 2,063 | |
JNL/Lazard Emerging Markets Fund - Class A (0.6%) (a) | | 791 | | 7,888 | |
| | | | 12,008 | |
INTERNATIONAL EQUITY - 22.8% | | | | | |
Curian/Lazard International Strategic Equity Fund (10.9%) (a) | | 1,183 | | 13,522 | |
JNL/Invesco International Growth Fund - Class A (0.9%) (a) | | 1,086 | | 13,821 | |
| | | | 27,343 | |
Total Investment Companies (cost $120,453) | | | | 119,745 | |
Total Investments - 100.0% (cost $120,453) | | | | 119,745 | |
Other Assets and Liabilities - Net - (0.0%) | | | | (30 | ) |
Total Net Assets - 100.0% | | | | $ | 119,715 | |
See accompanying Notes to Financial Statements.
Curian Guidance - Tactical Moderate Growth Fund
| | Shares | | Value | |
INVESTMENT COMPANIES - 100.0% | | | | | |
| | | | | |
ALTERNATIVE - 35.0% | | | | | |
Curian Dynamic Risk Advantage - Diversified Fund (8.6%) (a) | | 2,817 | | $ | 30,203 | |
Curian Long Short Credit Fund (0.8%) (a) | | 279 | | 2,709 | |
Curian/AQR Risk Parity Fund (3.2%) (a) | | 543 | | 5,690 | |
Curian/BlackRock Global Long Short Credit Fund (0.7%) (a) | | 266 | | 2,713 | |
Curian/Eaton Vance Global Macro Absolute Return Advantage Fund (1.1%) (a) | | 454 | | 4,522 | |
Curian/FAMCO Flex Core Covered Call Fund (3.3%) (a) | | 658 | | 8,130 | |
Curian/Neuberger Berman Risk Balanced Commodity Strategy Fund (1.6%) (a) | | 375 | | 2,901 | |
Curian/Nicholas Convertible Arbitrage Fund (1.4%) (a) | | 592 | | 6,022 | |
Curian/UBS Global Long Short Income Opportunities Fund (1.6%) (a) | | 284 | | 2,708 | |
Curian/Van Eck International Gold Fund (3.0%) (a) | | 556 | | 2,439 | |
JNL/ Boston Partners Global Long Short Equity Fund - Class A (2.3%) (a) | | 909 | | 8,965 | |
JNL/AQR Managed Futures Strategy Fund - Class A (1.1%) (a) | | 566 | | 5,819 | |
JNL/BlackRock Commodity Securities Fund - Class A (0.3%) (a) | | 314 | | 3,001 | |
JNL/Brookfield Global Infrastructure and MLP Fund - Class A (0.5%) (a) | | 396 | | 6,080 | |
JNL/Invesco Global Real Estate Fund - Class A (0.3%) (a) | | 553 | | 6,003 | |
JNL/Red Rocks Listed Private Equity Fund - Class A (0.9%) (a) | | 691 | | 7,541 | |
| | | | 105,446 | |
DOMESTIC EQUITY - 49.9% | | | | | |
JNL/Mellon Capital S&P 400 Mid Cap Index Fund - Class A (2.9%) (a) | | 2,864 | | 54,414 | |
JNL/Mellon Capital S&P 500 Index Fund - Class A (1.6%) (a) | | 3,819 | | 65,338 | |
JNL/Mellon Capital Small Cap Index Fund - Class A (1.6%) (a) | | 1,745 | | 30,475 | |
| | | | 150,227 | |
DOMESTIC FIXED INCOME - 0.3% | | | | | |
JNL/Mellon Capital Bond Index Fund - Class A (0.1%) (a) | | 64 | | 750 | |
| | | | | |
EMERGING MARKETS EQUITY - 4.0% | | | | | |
JNL/Mellon Capital Emerging Markets Index Fund - Class A (1.5%) (a) | | 1,242 | | 12,021 | |
| | | | | |
INTERNATIONAL EQUITY - 10.8% | | | | | |
JNL/Mellon Capital International Index Fund - Class A (1.5%) (a) | | 2,470 | | 32,584 | |
Total Investment Companies (cost $296,221) | | | | 301,028 | |
Total Investments - 100.0% (cost $296,221) | | | | 301,028 | |
Other Assets and Liabilities - Net - (0.0%) | | | | (79 | ) |
Total Net Assets - 100.0% | | | | $ | 300,949 | |
Curian Guidance - Tactical Maximum Growth Fund
INVESTMENT COMPANIES - 100.0% | | | | | |
| | | | | |
ALTERNATIVE - 20.1% | | | | | |
Curian Long Short Credit Fund (0.2%) (a) | | 72 | | $ | 693 | |
Curian/AQR Risk Parity Fund (0.7%) (a) | | 122 | | 1,281 | |
Curian/BlackRock Global Long Short Credit Fund (0.2%) (a) | | 68 | | 693 | |
Curian/Eaton Vance Global Macro Absolute Return Advantage Fund (0.3%) (a) | | 110 | | 1,092 | |
Curian/FAMCO Flex Core Covered Call Fund (1.1%) (a) | | 216 | | 2,662 | |
Curian/Neuberger Berman Risk Balanced Commodity Strategy Fund (0.5%) (a) | | 125 | | 971 | |
Curian/Nicholas Convertible Arbitrage Fund (0.3%) (a) | | 136 | | 1,384 | |
Curian/UBS Global Long Short Fixed Income Opportunities Fund (0.4%) (a) | | 73 | | 693 | |
Curian/Van Eck International Gold Fund (1.3%) (a) | | 234 | | 1,027 | |
JNL/AQR Managed Futures Strategy Fund - Class A (0.3%) (a) | | 127 | | 1,303 | |
JNL/BlackRock Commodity Securities Fund - Class A (0.1%) (a) | | 103 | | 989 | |
JNL/Boston Partners Global Long Short Equity Fund - Class A (0.3%) (a) | | 129 | | 1,276 | |
JNL/Brookfield Global Infrastructure and MLP Fund - Class A (0.1%) (a) | | 104 | | 1,602 | |
JNL/Invesco Global Real Estate Fund - Class A (0.1%) (a) | | 145 | | 1,572 | |
JNL/Red Rocks Listed Private Equity Fund - Class A (0.3%) (a) | | 235 | | 2,568 | |
| | | | 19,806 | |
DOMESTIC BALANCED - 24.9% | | | | | |
Curian/T. Rowe Price Capital Appreciation Fund (21.8%) (a) | | 2,163 | | 24,611 | |
| | | | | |
DOMESTIC EQUITY - 22.6% | | | | | |
JNL/Franklin Templeton Small Cap Value Fund - Class A (0.2%) (a) | | 115 | | 1,752 | |
JNL/Invesco Small Cap Growth Fund - Class A (0.3%) (a) | | 122 | | 2,482 | |
JNL/JPMorgan MidCap Growth Fund - Class A (0.1%) (a) | | 47 | | 1,490 | |
JNL/PPM America Mid Cap Value Fund - Class A (0.5%) (a) | | 128 | | 1,991 | |
JNL/T. Rowe Price Established Growth Fund - Class A (0.2%) (a) | | 231 | | 7,660 | |
JNL/T. Rowe Price Value Fund - Class A (0.2%) (a) | | 401 | | 6,923 | |
| | | | 22,298 | |
EMERGING MARKETS EQUITY - 1.5% | | | | | |
JNL/Lazard Emerging Markets Fund - Class A (0.1%) (a) | | 149 | | 1,487 | |
| | | | | |
GLOBAL BALANCED - 24.9% | | | | | |
JNL/Ivy Asset Strategy Fund - Class A (0.8%) (a) | | 1,798 | | 24,528 | |
| | | | | | |
See accompanying Notes to Financial Statements.
| | Shares | | Value | |
INTERNATIONAL EQUITY - 6.0% | | | | | |
JNL/Invesco International Growth Fund - Class A (0.4%) (a) | | 464 | | 5,907 | |
Total Investment Companies (cost $97,272) | | | | 98,637 | |
Total Investments - 100.0% (cost $97,272) | | | | 98,637 | |
Other Assets and Liabilities - Net - (0.0%) | | | | (25 | ) |
Total Net Assets - 100.0% | | | | $ | 98,612 | |
| | | | | | |
Curian Guidance - Institutional Alt 65 Fund
INVESTMENT COMPANIES - 100.0% | | | | | |
| | | | | |
ALTERNATIVE - 64.8% | | | | | |
Curian Long Short Credit Fund (0.9%) (a) | | 320 | | $ | 3,101 | |
Curian/AQR Risk Parity Fund (3.7%) (a) | | 615 | | 6,445 | |
Curian/BlackRock Global Long Short Credit Fund (0.8%) (a) | | 306 | | 3,126 | |
Curian/Eaton Vance Global Macro Absolute Return Advantage Fund (1.2%) (a) | | 499 | | 4,975 | |
Curian/FAMCO Flex Core Covered Call Fund (3.8%) (a) | | 759 | | 9,377 | |
Curian/Neuberger Berman Risk Balanced Commodity Strategy Fund (1.7%) (a) | | 402 | | 3,113 | |
Curian/Nicholas Convertible Arbitrage Fund (1.5%) (a) | | 638 | | 6,492 | |
Curian/UBS Global Long Short Fixed Income Opportunities Fund (1.8%) (a) | | 326 | | 3,108 | |
Curian/Van Eck International Gold Fund (3.1%) (a) | | 568 | | 2,494 | |
JNL/AQR Managed Futures Strategy Fund - Class A (1.3%) (a) | | 669 | | 6,887 | |
JNL/BlackRock Commodity Securities Fund - Class A (0.3%) (a) | | 331 | | 3,169 | |
JNL/Boston Partners Global Long Short Equity Fund - Class A (2.6%) (a) | | 1,016 | | 10,015 | |
JNL/Brookfield Global Infrastructure and MLP Fund - Class A (0.5%) (a) | | 433 | | 6,649 | |
JNL/Invesco Global Real Estate Fund - Class A (0.3%) (a) | | 633 | | 6,863 | |
JNL/Red Rocks Listed Private Equity Fund - Class A (1.0%) (a) | | 790 | | 8,615 | |
| | | | 84,429 | |
DOMESTIC EQUITY - 15.4% | | | | | |
JNL/Franklin Templeton Small Cap Value Fund - Class A (0.1%) (a) | | 53 | | 798 | |
JNL/Invesco Small Cap Growth Fund - Class A (0.1%) (a) | | 39 | | 800 | |
JNL/JPMorgan MidCap Growth Fund - Class A (0.1%) (a) | | 46 | | 1,463 | |
JNL/PPM America Mid Cap Value Fund - Class A (0.4%) (a) | | 95 | | 1,469 | |
JNL/S&P Competitive Advantage Fund - Class A (0.1%) (a) | | 143 | | 2,414 | |
JNL/S&P Dividend Income & Growth Fund - Class A (0.1%) (a) | | 156 | | 2,387 | |
JNL/S&P Intrinsic Value Fund - Class A (0.1%) (a) | | 146 | | 2,418 | |
JNL/S&P Total Yield Fund - Class A (0.1%) (a) | | 160 | | 2,413 | |
JNL/T. Rowe Price Established Growth Fund - Class A (0.1%) (a) | | 179 | | 5,948 | |
| | | | 20,110 | |
DOMESTIC FIXED INCOME - 5.5% | | | | | |
Curian/DoubleLine Total Return Fund (0.3%) (a) | | 308 | | 3,273 | |
Curian/PIMCO Credit Income Fund (2.2%) (a) | | 179 | | 1,962 | |
JNL/PPM America Floating Rate Income Fund - Class A (0.0%) (a) | | 61 | | 650 | |
JNL/PPM America High Yield Bond Fund - Class A (0.0%) (a) | | 193 | | 1,281 | |
| | | | 7,166 | |
EMERGING MARKETS EQUITY - 2.9% | | | | | |
Curian/Ashmore Emerging Market Small Cap Equity Fund (1.6%) (a) | | 68 | | 634 | |
Curian/Franklin Templeton Frontier Markets Fund (0.8%) (a) | | 64 | | 603 | |
JNL/Lazard Emerging Markets Fund - Class A (0.2%) (a) | | 249 | | 2,477 | |
| | | | 3,714 | |
GLOBAL FIXED INCOME - 3.0% | | | | | |
JNL/Franklin Templeton Global Multisector Bond Fund - Class A (0.1%) (a) | | 223 | | 2,572 | |
JNL/Neuberger Berman Strategic Income Fund - Class A (0.2%) (a) | | 120 | | 1,306 | |
| | | | 3,878 | |
INTERNATIONAL EQUITY - 7.0% | | | | | |
Curian/Lazard International Strategic Equity Fund (3.7%) (a) | | 396 | | 4,524 | |
JNL/Invesco International Growth Fund - Class A (0.3%) (a) | | 358 | | 4,552 | |
| | | | 9,076 | |
INTERNATIONAL FIXED INCOME - 1.4% | | | | | |
JNL/Goldman Sachs Emerging Markets Debt Fund - Class A (0.3%) (a) | | 180 | | 1,882 | |
Total Investment Companies (cost $130,779) | | | | 130,255 | |
Total Investments - 100.0% (cost $130,779) | | | | 130,255 | |
Other Assets and Liabilities - Net - (0.0%) | | | | (35 | ) |
Total Net Assets - 100.0% | | | | $ | 130,220 | |
Curian Guidance - Alt 100 Conservative Fund
INVESTMENT COMPANIES - 100.0% | | | | | |
| | | | | |
ALTERNATIVE - 100.0% | | | | | |
Curian Long Short Credit Fund (0.5%) (a) | | 169 | | $ | 1,642 | |
Curian/AQR Risk Parity Fund (1.8%) (a) | | 309 | | 3,237 | |
Curian/BlackRock Global Long Short Credit Fund (0.4%) (a) | | 161 | | 1,645 | |
Curian/Eaton Vance Global Macro Absolute Return Advantage Fund (0.6%) (a) | | 260 | | 2,595 | |
Curian/FAMCO Flex Core Covered Call Fund (1.3%) (a) | | 261 | | 3,225 | |
Curian/Neuberger Berman Currency Fund (0.9%) (a) | | 181 | | 1,829 | |
Curian/Neuberger Berman Risk Balanced Commodity Strategy Fund (0.4%) (a) | | 93 | | 721 | |
Curian/Nicholas Convertible Arbitrage Fund (0.7%) (a) | | 319 | | 3,246 | |
Curian/UBS Global Long Short Fixed Income Opportunities Fund (1.0%) (a) | | 173 | | 1,646 | |
JNL/AQR Managed Futures Strategy Fund - Class A (0.6%) (a) | | 317 | | 3,263 | |
| | | | | | |
See accompanying Notes to Financial Statements.
| | Shares | | Value | |
JNL/BlackRock Commodity Securities Fund - Class A (0.1%) (a) | | 76 | | 732 | |
JNL/Boston Partners Global Long Short Equity Fund - Class A (1.7%) (a) | | 654 | | 6,451 | |
JNL/Brookfield Global Infrastructure and MLP Fund - Class A (0.2%) (a) | | 145 | | 2,224 | |
JNL/Invesco Global Real Estate Fund - Class A (0.1%) (a) | | 200 | | 2,166 | |
JNL/Red Rocks Listed Private Equity Fund - Class A (0.2%) (a) | | 167 | | 1,819 | |
Total Investment Companies (cost $36,845) | | | | 36,441 | |
Total Investments - 100.0% (cost $36,845) | | | | 36,441 | |
Other Assets and Liabilities - Net - (0.0%) | | | | (8 | ) |
Total Net Assets - 100.0% | | | | $ | 36,433 | |
| | | | | | |
Curian Guidance - Alt 100 Moderate Fund
INVESTMENT COMPANIES - 100.0% | | | | | | |
| | | | | | |
ALTERNATIVE - 100.0% | | | | | | |
Curian Long Short Credit Fund (3.5%) (a) | | 1,293 | | $ | 12,541 | |
Curian/AQR Risk Parity Fund (15.2%) (a) | | 2,549 | | 26,718 | |
Curian/BlackRock Global Long Short Credit Fund (3.3%) (a) | | 1,230 | | 12,572 | |
Curian/Eaton Vance Global Macro Absolute Return Advantage Fund (5.0%) (a) | | 2,104 | | 20,980 | |
Curian/FAMCO Flex Core Covered Call Fund (15.6%) (a) | | 3,123 | | 38,570 | |
Curian/Neuberger Berman Risk Balanced Commodity Strategy Fund (7.5%) (a) | | 1,732 | | 13,406 | |
Curian/Nicholas Convertible Arbitrage Fund (6.1%) (a) | | 2,639 | | 26,836 | |
Curian/UBS Global Long Short Fixed Income Opportunities Fund (7.3%) (a) | | 1,318 | | 12,551 | |
Curian/Van Eck International Gold Fund (13.1%) (a) | | 2,423 | | 10,637 | |
JNL/ Boston Partners Global Long Short Equity Fund - Class A (10.9%) (a) | | 4,226 | | 41,670 | |
JNL/AQR Managed Futures Strategy Fund - Class A (5.5%) (a) | | 2,740 | | 28,189 | |
JNL/BlackRock Commodity Securities Fund - Class A (1.2%) (a) | | 1,436 | | 13,741 | |
JNL/Brookfield Global Infrastructure and MLP Fund - Class A (2.1%) (a) | | 1,830 | | 28,084 | |
JNL/Invesco Global Real Estate Fund - Class A (1.4%) (a) | | 2,580 | | 27,991 | |
JNL/Red Rocks Listed Private Equity Fund - Class A (4.1%) (a) | | 3,225 | | 35,181 | |
Total Investment Companies (cost $351,856) | | | | 349,667 | |
Total Investments - 100.0% (cost $351,856) | | | | 349,667 | |
Other Assets and Liabilities - Net - (0.0%) | | | | (94 | ) |
Total Net Assets - 100.0% | | | | $ | 349,573 | |
Curian Guidance - Alt 100 Growth Fund
INVESTMENT COMPANIES - 100.0% | | | | | | |
| | | | | | |
ALTERNATIVE - 100.0% | | | | | | |
Curian Long Short Credit Fund (1.0%) (a) | | 367 | | $ | 3,557 | |
Curian/AQR Risk Parity Fund (4.1%) (a) | | 687 | | 7,198 | |
Curian/BlackRock Global Long Short Credit Fund (0.9%) (a) | | 348 | | 3,559 | |
Curian/Eaton Vance Global Macro Absolute Return Advantage Fund (1.5%) (a) | | 617 | | 6,156 | |
Curian/FAMCO Flex Core Covered Call Fund (5.8%) (a) | | 1,155 | | 14,267 | |
Curian/Neuberger Berman Risk Balanced Commodity Strategy Fund (2.9%) (a) | | 678 | | 5,245 | |
Curian/Nicholas Convertible Arbitrage Fund (1.8%) (a) | | 752 | | 7,650 | |
Curian/UBS Global Long Short Fixed Income Opportunities Fund (2.1%) (a) | | 373 | | 3,553 | |
Curian/Van Eck International Gold Fund (6.7%) (a) | | 1,251 | | 5,492 | |
JNL/AQR Managed Futures Strategy Fund - Class A (1.4%) (a) | | 727 | | 7,478 | |
JNL/BlackRock Commodity Securities Fund - Class A (0.5%) (a) | | 561 | | 5,369 | |
JNL/Boston Partners Global Long Short Equity Fund - Class A (1.9%) (a) | | 730 | | 7,193 | |
JNL/Brookfield Global Infrastructure and MLP Fund - Class A (0.7%) (a) | | 566 | | 8,688 | |
JNL/Invesco Global Real Estate Fund - Class A (0.4%) (a) | | 796 | | 8,638 | |
JNL/Red Rocks Listed Private Equity Fund - Class A (1.7%) (a) | | 1,292 | | 14,096 | |
Total Investment Companies (cost $111,771) | | | | 108,139 | |
Total Investments - 100.0% (cost $111,771) | | | | 108,139 | |
Other Assets and Liabilities - Net - (0.0%) | | | | (26 | ) |
Total Net Assets - 100.0% | | | | $ | 108,113 | |
Curian Guidance - International Conservative Fund
INVESTMENT COMPANIES - 100.0% | | | | | | |
| | | | | | |
ALTERNATIVE - 14.9% | | | | | | |
Curian/CenterSquare International Real Estate Securities Fund (2.5%) (a) | | 55 | | $ | 490 | |
Curian/Neuberger Berman Currency Fund (0.1%) (a) | | 24 | | 246 | |
| | | | 736 | |
EMERGING MARKETS EQUITY - 4.0% | | | | | |
JNL/Lazard Emerging Markets Fund - Class A (0.0%) (a) | | 20 | | 197 | |
| | | | | |
INTERNATIONAL EQUITY - 20.9% | | | | | |
Curian/Lazard International Strategic Equity Fund (0.3%) (a) | | 34 | | 391 | |
JNL/Invesco International Growth Fund - Class A (0.0%) (a) | | 50 | | 636 | |
| | | | 1,027 | |
INTERNATIONAL FIXED INCOME - 60.2% | | | | | |
Curian/Baring International Fixed Income Fund (9.1%) (a) | | 239 | | 2,223 | |
JNL/Goldman Sachs Emerging Markets Debt Fund - Class A (0.1%) (a) | | 70 | | 739 | |
| | | | 2,962 | |
Total Investment Companies (cost $5,161) | | | | 4,922 | |
Total Investments - 100.0% (cost $5,161) | | | | 4,922 | |
Other Assets and Liabilities - Net - (0.0%) | | | | (1 | ) |
Total Net Assets - 100.0% | | | | $ | 4,921 | |
See accompanying Notes to Financial Statements.
Curian Guidance - International Moderate Fund
| | Shares | | Value | |
INVESTMENT COMPANIES - 100.0% | | | | | | |
| | | | | | |
ALTERNATIVE - 8.0% | | | | | | |
Curian/CenterSquare International Real Estate Securities Fund (2.8%) (a) | | 61 | | $ | 549 | |
Curian/Neuberger Berman Currency Fund (0.2%) (a) | | 33 | | 331 | |
| | | | 880 | |
EMERGING MARKETS EQUITY - 19.1% | | | | | |
Curian/Ashmore Emerging Market Small Cap Equity Fund (1.7%) (a) | | 72 | | 666 | |
Curian/Franklin Templeton Frontier Markets Fund (0.8%) (a) | | 59 | | 553 | |
JNL/Lazard Emerging Markets Fund - Class A (0.1%) (a) | | 88 | | 880 | |
| | | | 2,099 | |
INTERNATIONAL EQUITY - 32.9% | | | | | |
Curian/Lazard International Strategic Equity Fund (1.2%) (a) | | 134 | | 1,537 | |
JNL/Eastspring Investments Asia ex-Japan Fund - Class A (0.4%) (a) | | 70 | | 550 | |
JNL/Invesco International Growth Fund - Class A (0.1%) (a) | | 121 | | 1,538 | |
| | | | 3,625 | |
INTERNATIONAL FIXED INCOME - 40.0% | | | | | |
Curian/Baring International Fixed Income Fund (11.3%) (a) | | 296 | | 2,762 | |
JNL/Goldman Sachs Emerging Markets Debt Fund - Class A (0.3%) (a) | | 158 | | 1,651 | |
| | | | 4,413 | |
Total Investment Companies (cost $11,682) | | | | 11,017 | |
Total Investments - 100.0% (cost $11,682) | | | | 11,017 | |
Other Assets and Liabilities - Net - (0.0%) | | | | (2 | ) |
Total Net Assets - 100.0% | | | | $ | 11,015 | |
Curian Guidance - International Growth Fund
INVESTMENT COMPANIES - 100.0% | | | | | | |
| | | | | | |
ALTERNATIVE - 8.0% | | | | | | |
Curian/CenterSquare International Real Estate Securities Fund (2.0%) (a) | | 45 | | $ | 402 | |
Curian/Neuberger Berman Currency Fund (0.1%) (a) | | 24 | | 243 | |
| | | | 645 | |
EMERGING MARKETS EQUITY - 27.2% | | | | | |
Curian/Ashmore Emerging Market Small Cap Equity Fund (2.1%) (a) | | 88 | | 817 | |
Curian/Franklin Templeton Frontier Markets Fund (0.7%) (a) | | 53 | | 494 | |
JNL/Lazard Emerging Markets Fund - Class A (0.1%) (a) | | 89 | | 887 | |
| | | | 2,198 | |
INTERNATIONAL EQUITY - 44.7% | | | | | |
Curian/Lazard International Strategic Equity Fund (1.2%) (a) | | 133 | | 1,522 | |
JNL/Eastspring Investments Asia ex-Japan Fund - Class A (0.4%) (a) | | 72 | | 567 | |
JNL/Invesco International Growth Fund - Class A (0.1%) (a) | | 120 | | 1,525 | |
| | | | 3,614 | |
INTERNATIONAL FIXED INCOME - 20.1% | | | | | |
Curian/Baring International Fixed Income Fund (4.6%) (a) | | 122 | | 1,136 | |
JNL/Goldman Sachs Emerging Markets Debt Fund - Class A (0.1%) (a) | | 46 | | 486 | |
| | | | 1,622 | |
Total Investment Companies (cost $8,501) | | | | 8,079 | |
Total Investments - 100.0% (cost $8,501) | | | | 8,079 | |
Other Assets and Liabilities - Net - (0.0%) | | | | (2 | ) |
Total Net Assets - 100.0% | | | | $ | 8,077 | |
Curian Guidance - Equity 100 Fund
INVESTMENT COMPANIES - 100.0% | | | | | | |
| | | | | | |
DOMESTIC EQUITY - 59.9% | | | | | | |
JNL/Franklin Templeton Small Cap Value Fund - Class A (0.2%) (a) | | 133 | | $ | 2,027 | |
JNL/Invesco Small Cap Growth Fund - Class A (0.2%) (a) | | 99 | | 2,011 | |
JNL/JPMorgan MidCap Growth Fund - Class A (0.3%) (a) | | 110 | | 3,524 | |
JNL/PPM America Mid Cap Value Fund - Class A (0.9%) (a) | | 227 | | 3,529 | |
JNL/S&P Competitive Advantage Fund - Class A (0.2%) (a) | | 358 | | 6,040 | |
JNL/S&P Dividend Income & Growth Fund - Class A (0.1%) (a) | | 395 | | 6,027 | |
JNL/S&P Intrinsic Value Fund - Class A (0.2%) (a) | | 364 | | 6,026 | |
JNL/S&P Total Yield Fund - Class A (0.3%) (a) | | 402 | | 6,061 | |
JNL/T. Rowe Price Established Growth Fund - Class A (0.3%) (a) | | 454 | | 15,085 | |
| | | | 50,330 | |
EMERGING MARKETS EQUITY - 12.1% | | | | | |
Curian/Ashmore Emerging Market Small Cap Equity Fund (4.4%) (a) | | 184 | | 1,701 | |
Curian/Franklin Templeton Frontier Markets Fund (2.4%) (a) | | 181 | | 1,702 | |
JNL/Lazard Emerging Markets Fund - Class A (0.5%) (a) | | 675 | | 6,732 | |
| | | | 10,135 | |
INTERNATIONAL EQUITY - 28.0% | | | | | |
Curian/Lazard International Strategic Equity Fund (9.5%) (a) | | 1,026 | | 11,731 | |
JNL/Invesco International Growth Fund - Class A (0.8%) (a) | | 923 | | 11,747 | |
| | | | 23,478 | |
Total Investment Companies (cost $87,211) | | | | 83,943 | |
Total Investments - 100.0% (cost $87,211) | | | | 83,943 | |
Other Assets and Liabilities - Net - (0.0%) | | | | (21 | ) |
Total Net Assets - 100.0% | | | | $ | 83,922 | |
See accompanying Notes to Financial Statements.
Curian Guidance - Fixed Income 100 Fund
| | Shares | | Value | |
INVESTMENT COMPANIES - 100.0% | | | | | | |
| | | | | | |
DOMESTIC FIXED INCOME - 55.0% | | | | | | |
Curian/DoubleLine Total Return Fund (1.0%) (a) | | 1,138 | | $ | 12,089 | |
Curian/PIMCO Credit Income Fund (8.2%) (a) | | 663 | | 7,254 | |
JNL/PPM America Floating Rate Income Fund - Class A (0.1%) (a) | | 227 | | 2,416 | |
JNL/PPM America High Yield Bond Fund - Class A (0.2%) (a) | | 726 | | 4,826 | |
| | | | 26,585 | |
GLOBAL FIXED INCOME - 30.0% | | | | | |
JNL/Franklin Templeton Global Multisector Bond Fund - Class A (0.5%) (a) | | 839 | | 9,659 | |
JNL/Neuberger Berman Strategic Income Fund - Class A (0.7%) (a) | | 444 | | 4,833 | |
| | | | 14,492 | |
INTERNATIONAL FIXED INCOME - 15.0% | | | | | |
JNL/Goldman Sachs Emerging Markets Debt Fund - Class A (1.1%) (a) | | 692 | | 7,236 | |
Total Investment Companies (cost $50,002) | | | | 48,313 | |
Total Investments - 100.0% (cost $50,002) | | | | 48,313 | |
Other Assets and Liabilities - Net - (0.0%) | | | | (12 | ) |
Total Net Assets - 100.0% | | | | $ | 48,301 | |
Curian Guidance - Real Assets Fund
INVESTMENT COMPANIES - 100.0% | | | | | | |
| | | | | | |
ALTERNATIVE - 90.0% | | | | | | |
Curian/CenterSquare International Real Estate Securities Fund (5.7%) (a) | | 126 | | $ | 1,130 | |
Curian/Eaton Vance Global Macro Absolute Return Advantage Fund (0.3%) (a) | | 114 | | 1,132 | |
Curian/Neuberger Berman Currency Fund (0.3%) (a) | | 56 | | 566 | |
Curian/Neuberger Berman Risk Balanced Commodity Strategy Fund (0.9%) (a) | | 218 | | 1,686 | |
Curian/Van Eck International Gold Fund (1.1%) (a) | | 208 | | 914 | |
JNL/BlackRock Commodity Securities Fund - Class A (0.2%) (a) | | 176 | | 1,688 | |
JNL/Brookfield Global Infrastructure and MLP Fund - Class A (0.1%) (a) | | 125 | | 1,922 | |
JNL/Invesco Global Real Estate Fund - Class A (0.1%) (a) | | 104 | | 1,126 | |
| | | | 10,164 | |
DOMESTIC FIXED INCOME - 10.0% | | | | | |
JNL/PIMCO Real Return Fund - Class A (0.1%) (a) | | 108 | | 1,133 | |
Total Investment Companies (cost $12,243) | | | | 11,297 | |
Total Investments - 100.0% (cost $12,243) | | | | 11,297 | |
Other Assets and Liabilities - Net - (0.0%) | | | | (3 | ) |
Total Net Assets - 100.0% | | | | $ | 11,294 | |
Curian/American Funds Global Growth Fund
INVESTMENT COMPANIES - 100.0% | | | | | | |
| | | | | | |
GLOBAL EQUITY - 100.0% | | | | | | |
American Funds Insurance Series - Global Growth Fund - Class 1 | | 1,201 | | $ | 33,009 | |
Total Investment Companies (cost $34,171) | | | | 33,009 | |
Total Investments - 100.0% (cost $34,171) | | | | 33,009 | |
Other Assets and Liabilities - Net - (0.0%) | | | | (10 | ) |
Total Net Assets - 100.0% | | | | $ | 32,999 | |
Curian/American Funds Growth Fund
INVESTMENT COMPANIES - 100.0% | | | | | | |
| | | | | | |
DOMESTIC EQUITY - 100.0% | | | | | | |
American Funds Insurance Series - Growth Fund - Class 1 | | 1,324 | | $ | 106,124 | |
Total Investment Companies (cost $98,052) | | | | 106,124 | |
Total Investments - 100.0% (cost $98,052) | | | | 106,124 | |
Other Assets and Liabilities - Net - (0.0%) | | | | (51 | ) |
Total Net Assets - 100.0% | | | | $ | 106,073 | |
(a) | At December 31, 2014, the Fund’s percentage ownership of the underlying affiliated fund is presented parenthetically. The Fund does not invest in the underlying affiliated funds for the purpose of exercising management or control. Percentages reflecting 0.0% represent amounts less than 0.05%. |
Abbreviations:
MLP - Master Limited Partnership
See accompanying Notes to Financial Statements.
Curian Variable Series Trust Master Feeder Funds and Fund of Funds
Statements of Assets and Liabilities (in thousands, except net asset value per share)
December 31, 2014
| | Curian
Guidance -
Interest Rate
Opportunities
Fund | | Curian
Guidance -
Multi-Strategy
Income Fund | | Curian
Guidance -
Equity Income
Fund | | Curian
Guidance -
Conservative
Fund | | Curian
Guidance -
Moderate
Fund | | Curian
Guidance -
Growth Fund | |
Assets | | | | | | | | | | | | | |
Investments - unaffiliated, at value (a) | | $ | — | | $ | — | | $ | — | | $ | — | | $ | — | | $ | — | |
Investments - affiliated, at value (b) | | 51,665 | | 39,733 | | 70,109 | | 105,419 | | 358,045 | | 166,290 | |
Total investments, at value (c) | | 51,665 | | 39,733 | | 70,109 | | 105,419 | | 358,045 | | 166,290 | |
Receivable for investments sold | | — | | — | | — | | 17 | | — | | — | |
Receivable for fund shares sold | | 36 | | 116 | | 48 | | 12 | | 453 | | 145 | |
Receivable from adviser | | — | | — | | — | | — | | — | | — | |
Other assets | | 1 | | — | | — | | 1 | | 2 | | 1 | |
Total assets | | 51,702 | | 39,849 | | 70,157 | | 105,449 | | 358,500 | | 166,436 | |
Liabilities | | | | | | | | | | | | | |
Payable for advisory fees | | 7 | | 5 | | 9 | | 13 | | 45 | | 21 | |
Payable for administrative fees | | 4 | | 2 | | 6 | | 9 | | 30 | | 14 | |
Payable for 12b-1 fee | | — | | — | | — | | — | | — | | — | |
Payable for investment securities purchased | | 32 | | 61 | | 44 | | — | | 319 | | 132 | |
Payable for fund shares redeemed | | 4 | | 55 | | 4 | | 30 | | 133 | | 13 | |
Payable for trustee fees | | 1 | | 1 | | 2 | | 3 | | 10 | | 3 | |
Payable for chief compliance officer fees | | — | | — | | — | | — | | 1 | | — | |
Payable for other expenses | | 1 | | 1 | | 1 | | 2 | | 5 | | 2 | |
Total liabilities | | 49 | | 125 | | 66 | | 57 | | 543 | | 185 | |
Net assets | | $ | 51,653 | | $ | 39,724 | | $ | 70,091 | | $ | 105,392 | | $ | 357,957 | | $ | 166,251 | |
Net assets consist of: | | | | | | | | | | | | | |
Paid-in capital | | $ | 51,956 | | $ | 39,739 | | $ | 63,684 | | $ | 103,727 | | $ | 345,919 | | $ | 161,066 | |
Undistributed net investment income | | 496 | | 600 | | 740 | | 1,477 | | 6,393 | | 3,350 | |
Accumulated net realized gain | | 397 | | 109 | | 1,279 | | 1,261 | | 8,738 | | 5,459 | |
Net unrealized appreciation (depreciation) on investments | | (1,196 | ) | (724 | ) | 4,388 | | (1,073 | ) | (3,093 | ) | (3,624 | ) |
| | $ | 51,653 | | $ | 39,724 | | $ | 70,091 | | $ | 105,392 | | $ | 357,957 | | $ | 166,251 | |
Shares outstanding (no par value), unlimited shares authorized | | 5,278 | | 4,065 | | 5,549 | | 9,641 | | 30,054 | | 14,675 | |
Net asset value per share | | $ | 9.79 | | $ | 9.77 | | $ | 12.63 | | $ | 10.93 | | $ | 11.91 | | $ | 11.33 | |
(a) Investments - unaffiliated, at cost | | $ | — | | $ | — | | $ | — | | $ | — | | $ | — | | $ | — | |
(b) Investments - affiliated, at cost | | 52,861 | | 40,457 | | 65,721 | | 106,492 | | 361,138 | | 169,914 | |
(c) Total investments, at cost | | $ | 52,861 | | $ | 40,457 | | $ | 65,721 | | $ | 106,492 | | $ | 361,138 | | $ | 169,914 | |
See accompanying Notes to Financial Statements.
| | Curian
Guidance -
Moderate
Growth Fund | | Curian
Guidance -
Maximum
Growth Fund | | Curian
Guidance -
Tactical
Moderate
Growth Fund | | Curian
Guidance -
Tactical
Maximum
Growth Fund | | Curian
Guidance -
Institutional
Alt 65 Fund | | Curian
Guidance - Alt
100
Conservative
Fund | |
Assets | | | | | | | | | | | | | |
Investments - unaffiliated, at value (a) | | $ | — | | $ | — | | $ | — | | $ | — | | $ | — | | $ | — | |
Investments - affiliated, at value (b) | | 504,316 | | 119,745 | | 301,028 | | 98,637 | | 130,255 | | 36,441 | |
Total investments, at value (c) | | 504,316 | | 119,745 | | 301,028 | | 98,637 | | 130,255 | | 36,441 | |
Receivable for investments sold | | — | | — | | — | | — | | — | | 6 | |
Receivable for fund shares sold | | 1,219 | | 68 | | 26 | | 10 | | 83 | | 12 | |
Receivable from adviser | | — | | — | | — | | — | | — | | — | |
Other assets | | 2 | | 1 | | 1 | | 1 | | 1 | | 1 | |
Total assets | | 505,537 | | 119,814 | | 301,055 | | 98,648 | | 130,339 | | 36,460 | |
Liabilities | | | | | | | | | | | | | |
Payable for advisory fees | | 63 | | 15 | | 38 | | 12 | | 17 | | 5 | |
Payable for administrative fees | | 42 | | 11 | | 25 | | 9 | | 11 | | 2 | |
Payable for 12b-1 fee | | — | | — | | — | | — | | — | | — | |
Payable for investment securities purchased | | 1,048 | | 35 | | 8 | | 6 | | 79 | | — | |
Payable for fund shares redeemed | | 171 | | 32 | | 18 | | 4 | | 4 | | 18 | |
Payable for trustee fees | | 15 | | 4 | | 11 | | 3 | | 6 | | 1 | |
Payable for chief compliance officer fees | | 1 | | — | | 1 | | — | | — | | — | |
Payable for other expenses | | 7 | | 2 | | 5 | | 2 | | 2 | | 1 | |
Total liabilities | | 1,347 | | 99 | | 106 | | 36 | | 119 | | 27 | |
Net assets | | $ | 504,190 | | $ | 119,715 | | $ | 300,949 | | $ | 98,612 | | $ | 130,220 | | $ | 36,433 | |
Net assets consist of: | | | | | | | | | | | | | |
Paid-in capital | | $ | 481,290 | | $ | 111,229 | | $ | 284,671 | | $ | 91,287 | | $ | 121,964 | | $ | 36,025 | |
Undistributed net investment income | | 9,782 | | 2,626 | | 3,466 | | 1,455 | | 2,286 | | 434 | |
Accumulated net realized gain | | 13,629 | | 6,568 | | 8,005 | | 4,505 | | 6,494 | | 378 | |
Net unrealized appreciation (depreciation) on investments | | (511 | ) | (708 | ) | 4,807 | | 1,365 | | (524 | ) | (404 | ) |
| | $ | 504,190 | | $ | 119,715 | | $ | 300,949 | | $ | 98,612 | | $ | 130,220 | | $ | 36,433 | |
Shares outstanding (no par value), unlimited shares authorized | | 42,196 | | 9,669 | | 26,142 | | 8,364 | | 11,473 | | 3,611 | |
Net asset value per share | | $ | 11.95 | | $ | 12.38 | | $ | 11.51 | | $ | 11.79 | | $ | 11.35 | | $ | 10.09 | |
(a) Investments - unaffiliated, at cost | | $ | — | | $ | — | | $ | — | | $ | — | | $ | — | | $ | — | |
(b) Investments - affiliated, at cost | | 504,827 | | 120,453 | | 296,221 | | 97,272 | | 130,779 | | 36,845 | |
(c) Total investments, at cost | | $ | 504,827 | | $ | 120,453 | | $ | 296,221 | | $ | 97,272 | | $ | 130,779 | | $ | 36,845 | |
See accompanying Notes to Financial Statements.
| | Curian
Guidance - Alt
100 Moderate
Fund | | Curian
Guidance - Alt
100 Growth
Fund | | Curian
Guidance -
International
Conservative
Fund | | Curian
Guidance -
International
Moderate
Fund | | Curian
Guidance -
International
Growth Fund | | Curian
Guidance -
Equity 100
Fund | |
Assets | | | | | | | | | | | | | |
Investments - unaffiliated, at value (a) | | $ | — | | $ | — | | $ | — | | $ | — | | $ | — | | $ | — | |
Investments - affiliated, at value (b) | | 349,667 | | 108,139 | | 4,922 | | 11,017 | | 8,079 | | 83,943 | |
Total investments, at value (c) | | 349,667 | | 108,139 | | 4,922 | | 11,017 | | 8,079 | | 83,943 | |
Receivable for investments sold | | 41 | | — | | — | | — | | — | | — | |
Receivable for fund shares sold | | 45 | | 232 | | 5 | | 39 | | 2 | | 113 | |
Receivable from adviser | | — | | — | | — | | — | | — | | — | |
Other assets | | 2 | | 1 | | — | | 1 | | — | | — | |
Total assets | | 349,755 | | 108,372 | | 4,927 | | 11,057 | | 8,081 | | 84,056 | |
Liabilities | | | | | | | | | | | | | |
Payable for advisory fees | | 44 | | 14 | | 1 | | 1 | | 1 | | 11 | |
Payable for administrative fees | | 30 | | 9 | | — | | 1 | | 1 | | 7 | |
Payable for 12b-1 fee | | — | | — | | — | | — | | — | | — | |
Payable for investment securities purchased | | — | | 208 | | 5 | | 37 | | 2 | | 77 | |
Payable for fund shares redeemed | | 86 | | 24 | | — | | 2 | | — | | 36 | |
Payable for trustee fees | | 15 | | 2 | | — | | — | | — | | 2 | |
Payable for chief compliance officer fees | | 1 | | — | | — | | — | | — | | — | |
Payable for other expenses | | 6 | | 2 | | — | | 1 | | — | | 1 | |
Total liabilities | | 182 | | 259 | | 6 | | 42 | | 4 | | 134 | |
Net assets | | $ | 349,573 | | $ | 108,113 | | $ | 4,921 | | $ | 11,015 | | $ | 8,077 | | $ | 83,922 | |
Net assets consist of: | | | | | | | | | | | | | |
Paid-in capital | | $ | 341,082 | | $ | 107,937 | | $ | 5,108 | | $ | 11,421 | | $ | 8,264 | | $ | 77,511 | |
Undistributed net investment income | | 5,162 | | 1,807 | | 32 | | 124 | | 94 | | 1,980 | |
Accumulated net realized gain | | 5,518 | | 2,001 | | 20 | | 135 | | 141 | | 7,699 | |
Net unrealized appreciation (depreciation) on investments | | (2,189 | ) | (3,632 | ) | (239 | ) | (665 | ) | (422 | ) | (3,268 | ) |
| | $ | 349,573 | | $ | 108,113 | | $ | 4,921 | | $ | 11,015 | | $ | 8,077 | | $ | 83,922 | |
Shares outstanding (no par value), unlimited shares authorized | | 32,970 | | 10,451 | | 518 | | 1,148 | | 826 | | 6,378 | |
Net asset value per share | | $ | 10.60 | | $ | 10.34 | | $ | 9.51 | | $ | 9.59 | | $ | 9.78 | | $ | 13.16 | |
(a) Investments - unaffiliated, at cost | | $ | — | | $ | — | | $ | — | | $ | — | | $ | — | | $ | — | |
(b) Investments - affiliated, at cost | | 351,856 | | 111,771 | | 5,161 | | 11,682 | | 8,501 | | 87,211 | |
(c) Total investments, at cost | | $ | 351,856 | | $ | 111,771 | | $ | 5,161 | | $ | 11,682 | | $ | 8,501 | | $ | 87,211 | |
See accompanying Notes to Financial Statements.
| | Curian
Guidance -
Fixed Income
100 Fund | | Curian
Guidance -
Real Assets
Fund | | Curian/
American
Funds Global
Growth
Fund(d) | | Curian/
American
Funds Growth
Fund(d) | |
Assets | | | | | | | | | |
Investments - unaffiliated, at value (a) | | $ | — | | $ | — | | $ | 33,009 | | $ | 106,124 | |
Investments - affiliated, at value (b) | | 48,313 | | 11,297 | | — | | — | |
Total investments, at value (c) | | 48,313 | | 11,297 | | 33,009 | | 106,124 | |
Receivable for investments sold | | 12 | | 56 | | — | | — | |
Receivable for fund shares sold | | — | | — | | 431 | | 128 | |
Receivable from adviser | | — | | — | | 17 | | 44 | |
Other assets | | — | | — | | — | | 1 | |
Total assets | | 48,325 | | 11,353 | | 33,457 | | 106,297 | |
Liabilities | | | | | | | | | |
Payable for advisory fees | | 6 | | 1 | | 21 | | 74 | |
Payable for administrative fees | | 4 | | 1 | | 3 | | 9 | |
Payable for 12b-1 fee | | — | | — | | 2 | | 8 | |
Payable for investment securities purchased | | — | | — | | 426 | | 17 | |
Payable for fund shares redeemed | | 12 | | 56 | | 5 | | 111 | |
Payable for trustee fees | | 1 | | — | | 1 | | 3 | |
Payable for chief compliance officer fees | | — | | — | | — | | — | |
Payable for other expenses | | 1 | | 1 | | — | | 2 | |
Total liabilities | | 24 | | 59 | | 458 | | 224 | |
Net assets | | $ | 48,301 | | $ | 11,294 | | $ | 32,999 | | $ | 106,073 | |
Net assets consist of: | | | | | | | | | |
Paid-in capital | | $ | 49,148 | | $ | 12,004 | | $ | 32,176 | | $ | 93,173 | |
Undistributed net investment income | | 843 | | 69 | | 288 | | 784 | |
Accumulated net realized gain | | (1 | ) | 167 | | 1,697 | | 4,044 | |
Net unrealized appreciation (depreciation) on investments | | (1,689 | ) | (946 | ) | (1,162 | ) | 8,072 | |
| | $ | 48,301 | | $ | 11,294 | | $ | 32,999 | | $ | 106,073 | |
Shares outstanding (no par value), unlimited shares authorized | | 4,890 | | 1,171 | | 2,944 | | 7,137 | |
Net asset value per share | | $ | 9.88 | | $ | 9.64 | | $ | 11.21 | | $ | 14.86 | |
(a) Investments - unaffiliated, at cost | | $ | — | | $ | — | | $ | 34,171 | | $ | 98,052 | |
(b) Investments - affiliated, at cost | | 50,002 | | 12,243 | | — | | — | |
(c) Total investments, at cost | | $ | 50,002 | | $ | 12,243 | | $ | 34,171 | | $ | 98,052 | |
(d) The Master Funds for the Curian/American Funds Master Feeder Funds are the Class 1 shares of the corresponding American Fund Insurance Series Fund. These financial statements should be read in conjunction with each Master Fund’s shareholder report.
See accompanying Notes to Financial Statements.
Curian Variable Series Trust Master Feeder Funds and Fund of Funds
Statements of Operations (in thousands)
For the Year Ended December 31, 2014
| | Curian
Guidance -
Interest Rate
Opportunities
Fund | | Curian
Guidance -
Multi-Strategy
Income Fund | | Curian
Guidance -
Equity Income
Fund | | Curian
Guidance -
Conservative
Fund | | Curian
Guidance -
Moderate Fund | | Curian
Guidance -
Growth Fund | |
Investment income | | | | | | | | | | | | | |
Dividends from affiliated investments | | $ | 497 | | $ | 616 | | $ | 159 | | $ | 1,578 | | $ | 3,516 | | $ | 1,424 | |
Dividends received from master fund | | — | | — | | — | | — | | — | | — | |
Total investment income | | 497 | | 616 | | 159 | | 1,578 | | 3,516 | | 1,424 | |
| | | | | | | | | | | | | |
Expenses | | | | | | | | | | | | | |
Advisory fees | | 67 | | 46 | | 87 | | 118 | | 409 | | 162 | |
Administrative fees | | 45 | | 30 | | 58 | | 79 | | 274 | | 109 | |
12b-1 fees | | — | | — | | — | | — | | — | | — | |
Legal fees | | 1 | | 1 | | 2 | | 3 | | 10 | | 3 | |
Trustee fees | | 4 | | 3 | | 6 | | 7 | | 25 | | 10 | |
Other expenses | | 1 | | 2 | | 1 | | 2 | | 7 | | 3 | |
Total expenses | | 118 | | 82 | | 154 | | 209 | | 725 | | 287 | |
Expense waived by Adviser | | — | | — | | — | | — | | — | | — | |
Net expenses | | 118 | | 82 | | 154 | | 209 | | 725 | | 287 | |
Net investment income | | 379 | | 534 | | 5 | | 1,369 | | 2,791 | | 1,137 | |
| | | | | | | | | | | | | |
Realized and unrealized gain (loss) | | | | | | | | | | | | | |
Net realized gain (loss) on: | | | | | | | | | | | | | |
Unaffiliated investments | | — | | — | | — | | — | | — | | — | |
Affiliated investments | | 135 | | 35 | | 521 | | 841 | | 2,793 | | 1,726 | |
Distributions from affiliated investment companies | | 436 | | 219 | | 1,497 | | 657 | | 9,694 | | 5,978 | |
Net change in unrealized appreciation (depreciation) on Investments | | (865 | ) | (462 | ) | 2,511 | | (701 | ) | (6,997 | ) | (5,410 | ) |
Net realized and unrealized gain (loss) | | (294 | ) | (208 | ) | 4,529 | | 797 | | 5,490 | | 2,294 | |
Net increase (decrease) in net assets from operations | | $ | 85 | | $ | 326 | | $ | 4,534 | | $ | 2,166 | | $ | 8,281 | | $ | 3,431 | |
See accompanying Notes to Financial Statements.
| | Curian
Guidance -
Moderate
Growth Fund | | Curian
Guidance -
Maximum
Growth Fund | | Curian
Guidance -
Tactical
Moderate
Growth Fund | | Curian
Guidance -
Tactical
Maximum
Growth Fund | | Curian
Guidance -
Institutional
Alt 65 Fund | | Curian
Guidance –
Alt 100
Conservative
Fund | |
Investment income | | | | | | | | | | | | | |
Dividends from affiliated investments | | $ | 4,435 | | $ | 884 | | $ | 3,492 | | $ | 805 | | $ | 1,432 | | $ | 284 | |
Dividends received from master fund | | — | | — | | — | | — | | — | | — | |
Total investment income | | 4,435 | | 884 | | 3,492 | | 805 | | 1,432 | | 284 | |
| | | | | | | | | | | | | |
Expenses | | | | | | | | | | | | | |
Advisory fees | | 587 | | 145 | | 409 | | 130 | | 189 | | 42 | |
Administrative fees | | 392 | | 97 | | 273 | | 87 | | 126 | | 26 | |
12b-1 fees | | — | | — | | — | | — | | — | | — | |
Legal fees | | 13 | | 4 | | 11 | | 3 | | 5 | | 1 | |
Trustee fees | | 37 | | 9 | | 26 | | 8 | | 12 | | 3 | |
Other expenses | | 12 | | 3 | | 9 | | 2 | | 3 | | 1 | |
Total expenses | | 1,041 | | 258 | | 728 | | 230 | | 335 | | 73 | |
Expense waived by Adviser | | — | | — | | — | | — | | — | | — | |
Net expenses | | 1,041 | | 258 | | 728 | | 230 | | 335 | | 73 | |
Net investment income | | 3,394 | | 626 | | 2,764 | | 575 | | 1,097 | | 211 | |
| | | | | | | | | | | | | |
Realized and unrealized gain (loss) | | | | | | | | | | | | | |
Net realized gain (loss) on: | | | | | | | | | | | | | |
Unaffiliated investments | | — | | — | | — | | — | | — | | — | |
Affiliated investments | | 3,514 | | 3,385 | | 5,081 | | 1,926 | | 4,860 | | 92 | |
Distributions from affiliated investment companies | | 16,906 | | 5,294 | | 4,457 | | 3,626 | | 3,359 | | 565 | |
Net change in unrealized appreciation (depreciation) on Investments | | (10,147 | ) | (5,465 | ) | (598 | ) | (2,945 | ) | (6,422 | ) | (509 | ) |
Net realized and unrealized gain (loss) | | 10,273 | | 3,214 | | 8,940 | | 2,607 | | 1,797 | | 148 | |
Net increase (decrease) in net assets from operations | | $ | 13,667 | | $ | 3,840 | | $ | 11,704 | | $ | 3,182 | | $ | 2,894 | | $ | 359 | |
See accompanying Notes to Financial Statements.
| | Curian
Guidance –
Alt 100
Moderate Fund | | Curian
Guidance –
Alt 100 Growth
Fund | | Curian
Guidance -
International
Conservative
Fund | | Curian
Guidance -
International
Moderate Fund | | Curian
Guidance -
International
Growth Fund | | Curian
Guidance -
Equity 100
Fund | |
Investment income | | | | | | | | | | | | | |
Dividends from affiliated investments | | $ | 4,060 | | $ | 1,442 | | $ | 38 | | $ | 104 | | $ | 76 | | $ | 493 | |
Dividends received from master fund | | — | | — | | — | | — | | — | | — | |
Total investment income | | 4,060 | | 1,442 | | 38 | | 104 | | 76 | | 493 | |
| | | | | | | | | | | | | |
Expenses | | | | | | | | | | | | | |
Advisory fees | | 488 | | 114 | | 5 | | 12 | | 10 | | 106 | |
Administrative fees | | 326 | | 76 | | 4 | | 9 | | 7 | | 71 | |
12b-1 fees | | — | | — | | — | | — | | — | | — | |
Legal fees | | 12 | | 2 | | 1 | | — | | — | | 3 | |
Trustee fees | | 32 | | 7 | | — | | 1 | | 1 | | 7 | |
Other expenses | | 10 | | 2 | | — | | — | | — | | 1 | |
Total expenses | | 868 | | 201 | | 10 | | 22 | | 18 | | 188 | |
Expense waived by Adviser | | — | | — | | — | | — | | — | | — | |
Net expenses | | 868 | | 201 | | 10 | | 22 | | 18 | | 188 | |
Net investment income | | 3,192 | | 1,241 | | 28 | | 82 | | 58 | | 305 | |
| | | | | | | | | | | | | |
Realized and unrealized gain (loss) | | | | | | | | | | | | | |
Net realized gain (loss) on: | | | | | | | | | | | | | |
Unaffiliated investments | | — | | — | | — | | — | | — | | — | |
Affiliated investments | | 3,269 | | 749 | | 9 | | 87 | | 111 | | 5,116 | |
Distributions from affiliated investment companies | | 6,276 | | 1,935 | | 22 | | 107 | | 78 | | 4,337 | |
Net change in unrealized appreciation (depreciation) on Investments | | (6,717 | ) | (4,047 | ) | (232 | ) | (695 | ) | (566 | ) | (6,210 | ) |
Net realized and unrealized gain (loss) | | 2,828 | | (1,363 | ) | (201 | ) | (501 | ) | (377 | ) | 3,243 | |
Net increase (decrease) in net assets from operations | | $ | 6,020 | | $ | (122 | ) | $ | (173 | ) | $ | (419 | ) | $ | (319 | ) | $ | 3,548 | |
See accompanying Notes to Financial Statements.
| | Curian
Guidance -
Fixed Income
100 Fund | | Curian
Guidance -
Real Assets
Fund | | Curian/
American
Funds Global
Growth Fund(a) | | Curian/
American
Funds Growth
Fund (a) | |
Investment income | | | | | | | | | |
Dividends from affiliated investments | | $ | 867 | | $ | 70 | | $ | — | | $ | — | |
Dividends received from master fund | | — | | — | | 385 | | 1,317 | |
Total investment income | | 867 | | 70 | | 385 | | 1,317 | |
| | | | | | | | | |
Expenses | | | | | | | | | |
Advisory fees | | 57 | | 14 | | 151 | | 632 | |
Administrative fees | | 38 | | 10 | | 18 | | 74 | |
12b-1 fees | | — | | — | | 47 | | 186 | |
Legal fees | | 1 | | — | | 1 | | 3 | |
Trustee fees | | 3 | | 1 | | 2 | | 7 | |
Other expenses | | 1 | | 1 | | 1 | | 2 | |
Total expenses | | 100 | | 26 | | 220 | | 904 | |
Expense waived by Adviser | | — | | — | | (123 | ) | (372 | ) |
Net expenses | | 100 | | 26 | | 97 | | 532 | |
Net investment income | | 767 | | 44 | | 288 | | 785 | |
| | | | | | | | | |
Realized and unrealized gain (loss) | | | | | | | | | |
Net realized gain (loss) on: | | | | | | | | | |
Unaffiliated investments | | — | | — | | 4 | | 653 | |
Affiliated investments | | 326 | | 109 | | — | | — | |
Distributions from unaffiliated investment companies | | — | | — | | 1,693 | | 3,395 | |
Distributions from affiliated investment companies | | 255 | | 91 | | — | | — | |
Net change in unrealized appreciation (depreciation) on Investments | | (973 | ) | (912 | ) | (1,362 | ) | 1,309 | |
Net realized and unrealized gain (loss) | | (392 | ) | (712 | ) | 335 | | 5,357 | |
Net increase (decrease) in net assets from operations | | $ | 375 | | $ | (668 | ) | $ | 623 | | $ | 6,142 | |
(a) The Master Funds for the Curian/American Funds Master Feeder Funds are the Class 1 shares of the corresponding American Fund Insurance Series Fund. These financial statements should be read in conjunction with each Master Fund’s shareholder report.
See accompanying Notes to Financial Statements.
Curian Variable Series Trust Master Feeder Funds and Fund of Funds
Statements of Changes in Net Assets (in thousands)
For the Year Ended December 31, 2014
| | Curian
Guidance -
Interest Rate
Opportunities
Fund | | Curian
Guidance -
Multi-Strategy
Income Fund | | Curian
Guidance -
Equity Income
Fund | | Curian
Guidance -
Conservative
Fund | | Curian
Guidance -
Moderate Fund | | Curian
Guidance -
Growth Fund | |
Operations | | | | | | | | | | | | | |
Net investment income | | $ | 379 | | $ | 534 | | $ | 5 | | $ | 1,369 | | $ | 2,791 | | $ | 1,137 | |
Net realized gain | | 571 | | 254 | | 2,018 | | 1,498 | | 12,487 | | 7,704 | |
Net change in unrealized appreciation (depreciation) | | (865 | ) | (462 | ) | 2,511 | | (701 | ) | (6,997 | ) | (5,410 | ) |
Net increase (decrease) in net assets from operations | | 85 | | 326 | | 4,534 | | 2,166 | | 8,281 | | 3,431 | |
Distributions to shareholders | | | | | | | | | | | | | |
From net investment income | | (735 | ) | (507 | ) | (2,317 | ) | (670 | ) | (2,131 | ) | (510 | ) |
From net realized gain | | (64 | ) | (57 | ) | (958 | ) | (316 | ) | (6,379 | ) | (404 | ) |
Total distributions to shareholders | | (799 | ) | (564 | ) | (3,275 | ) | (986 | ) | (8,510 | ) | (914 | ) |
Share transactions(1) | | | | | | | | | | | | | |
Proceeds from sale of shares | | 33,473 | | 25,862 | | 28,701 | | 71,306 | | 220,873 | | 132,919 | |
Reinvestment of distributions | | 799 | | 564 | | 3,275 | | 986 | | 8,510 | | 914 | |
Cost of shares redeemed | | (13,252 | ) | (7,806 | ) | (9,921 | ) | (26,316 | ) | (52,739 | ) | (17,067 | ) |
Change in net assets from share transactions | | 21,020 | | 18,620 | | 22,055 | | 45,976 | | 176,644 | | 116,766 | |
Change in net assets | | 20,306 | | 18,382 | | 23,314 | | 47,156 | | 176,415 | | 119,283 | |
Net assets beginning of year | | 31,347 | | 21,342 | | 46,777 | | 58,236 | | 181,542 | | 46,968 | |
Net assets end of year | | $ | 51,653 | | $ | 39,724 | | $ | 70,091 | | $ | 105,392 | | $ | 357,957 | | $ | 166,251 | |
Undistributed net investment income | | $ | 496 | | $ | 600 | | $ | 740 | | $ | 1,477 | | $ | 6,393 | | $ | 3,350 | |
(1) Share transactions | | | | | | | | | | | | | |
Shares sold | | 3,334 | | 2,599 | | 2,238 | | 6,474 | | 18,276 | | 11,807 | |
Reinvestment of distributions | | 81 | | 57 | | 257 | | 90 | | 707 | | 80 | |
Shares redeemed | | (1,321 | ) | (783 | ) | (780 | ) | (2,397 | ) | (4,359 | ) | (1,506 | ) |
Change in shares | | 2,094 | | 1,873 | | 1,715 | | 4,167 | | 14,624 | | 10,381 | |
Purchase and sales of investment securities (excluding short-term securities): | | | | | | | | | | | | | |
Purchase of securities | | $ | 26,752 | | $ | 21,508 | | $ | 30,863 | | $ | 74,429 | | $ | 267,587 | | $ | 155,405 | |
Proceeds from sales of securities | | 5,714 | | 2,697 | | 10,578 | | 27,408 | | 86,943 | | 32,414 | |
| | | | | | | | | | | | | | | | | | | |
See accompanying Notes to Financial Statements.
| | Curian
Guidance -
Moderate
Growth Fund | | Curian
Guidance -
Maximum
Growth Fund | | Curian
Guidance -
Tactical
Moderate
Growth Fund | | Curian
Guidance -
Tactical
Maximum
Growth Fund | | Curian
Guidance -
Institutional Alt
65 Fund | | Curian
Guidance –
Alt 100
Conservative
Fund | |
Operations | | | | | | | | | | | | | |
Net investment income | | $ | 3,394 | | $ | 626 | | $ | 2,764 | | $ | 575 | | $ | 1,097 | | $ | 211 | |
Net realized gain | | 20,420 | | 8,679 | | 9,538 | | 5,552 | | 8,219 | | 657 | |
Net change in unrealized appreciation (depreciation) | | (10,147 | ) | (5,465 | ) | (598 | ) | (2,945 | ) | (6,422 | ) | (509 | ) |
Net increase (decrease) in net assets from operations | | 13,667 | | 3,840 | | 11,704 | | 3,182 | | 2,894 | | 359 | |
Distributions to shareholders | | | | | | | | | | | | | |
From net investment income | | (2,808 | ) | (636 | ) | (2,383 | ) | (475 | ) | (1,051 | ) | (155 | ) |
From net realized gain | | (8,308 | ) | (3,486 | ) | (12,185 | ) | (3,427 | ) | (1,721 | ) | (12 | ) |
Total distributions to shareholders | | (11,116 | ) | (4,122 | ) | (14,568 | ) | (3,902 | ) | (2,772 | ) | (167 | ) |
Share transactions(1) | | | | | | | | | | | | | |
Proceeds from sale of shares | | 272,539 | | 61,979 | | 96,247 | | 38,756 | | 36,150 | | 26,365 | |
Reinvestment of distributions | | 11,116 | | 4,122 | | 14,568 | | 3,902 | | 2,772 | | 167 | |
Cost of shares redeemed | | (48,144 | ) | (15,948 | ) | (43,519 | ) | (14,466 | ) | (21,352 | ) | (8,695 | ) |
Change in net assets from share transactions | | 235,511 | | 50,153 | | 67,296 | | 28,192 | | 17,570 | | 17,837 | |
Change in net assets | | 238,062 | | 49,871 | | 64,432 | | 27,472 | | 17,692 | | 18,029 | |
Net assets beginning of year | | 266,128 | | 69,844 | | 236,517 | | 71,140 | | 112,528 | | 18,404 | |
Net assets end of year | | $ | 504,190 | | $ | 119,715 | | $ | 300,949 | | $ | 98,612 | | $ | 130,220 | | $ | 36,433 | |
Undistributed net investment income | | $ | 9,782 | | $ | 2,626 | | $ | 3,466 | | $ | 1,455 | | $ | 2,286 | | $ | 434 | |
(1) Share transactions | | | | | | | | | | | | | |
Shares sold | | 22,609 | | 4,929 | | 8,168 | | 3,226 | | 3,129 | | 2,615 | |
Reinvestment of distributions | | 920 | | 329 | | 1,258 | | 327 | | 242 | | 16 | |
Shares redeemed | | (4,005 | ) | (1,267 | ) | (3,707 | ) | (1,202 | ) | (1,854 | ) | (860 | ) |
Change in shares | | 19,524 | | 3,991 | | 5,719 | | 2,351 | | 1,517 | | 1,771 | |
Purchase and sales of investment securities (excluding short-term securities): | | | | | | | | | | | | | |
Purchase of securities | | $ | 374,797 | | $ | 99,610 | | $ | 252,261 | | $ | 63,704 | | $ | 81,856 | | $ | 34,958 | |
Proceeds from sales of securities | | 130,069 | | 47,652 | | 192,315 | | 35,214 | | 62,608 | | 16,510 | |
| | | | | | | | | | | | | | | | | | | |
See accompanying Notes to Financial Statements.
| | Curian
Guidance –
Alt 100
Moderate Fund | | Curian
Guidance –
Alt 100 Growth
Fund | | Curian
Guidance -
International
Conservative
Fund | | Curian
Guidance -
International
Moderate Fund | | Curian
Guidance -
International
Growth Fund | | Curian
Guidance -
Equity 100
Fund | |
Operations | | | | | | | | | | | | | |
Net investment income | | $ | 3,192 | | $ | 1,241 | | $ | 28 | | $ | 82 | | $ | 58 | | $ | 305 | |
Net realized gain | | 9,545 | | 2,684 | | 31 | | 194 | | 189 | | 9,453 | |
Net change in unrealized appreciation (depreciation) | | (6,717 | ) | (4,047 | ) | (232 | ) | (695 | ) | (566 | ) | (6,210 | ) |
Net increase (decrease) in net assets from operations | | 6,020 | | (122 | ) | (173 | ) | (419 | ) | (319 | ) | 3,548 | |
Distributions to shareholders | | | | | | | | | | | | | |
From net investment income | | (3,545 | ) | (637 | ) | (37 | ) | (92 | ) | (50 | ) | (434 | ) |
From net realized gain | | (4,221 | ) | (25 | ) | (13 | ) | (21 | ) | (15 | ) | (3,117 | ) |
Total distributions to shareholders | | (7,766 | ) | (662 | ) | (50 | ) | (113 | ) | (65 | ) | (3,551 | ) |
Share transactions(1) | | | | | | | | | | | | | |
Proceeds from sale of shares | | 116,010 | | 79,988 | | 3,843 | | 9,868 | | 6,040 | | 43,948 | |
Reinvestment of distributions | | 7,766 | | 662 | | 50 | | 113 | | 65 | | 3,551 | |
Cost of shares redeemed | | (62,962 | ) | (10,272 | ) | (684 | ) | (3,691 | ) | (2,349 | ) | (15,081 | ) |
Change in net assets from share transactions | | 60,814 | | 70,378 | | 3,209 | | 6,290 | | 3,756 | | 32,418 | |
Change in net assets | | 59,068 | | 69,594 | | 2,986 | | 5,758 | | 3,372 | | 32,415 | |
Net assets beginning of year | | 290,505 | | 38,519 | | 1,935 | | 5,257 | | 4,705 | | 51,507 | |
Net assets end of year | | $ | 349,573 | | $ | 108,113 | | $ | 4,921 | | $ | 11,015 | | $ | 8,077 | | $ | 83,922 | |
Undistributed net investment income | | $ | 5,162 | | $ | 1,807 | | $ | 32 | | $ | 124 | | $ | 94 | | $ | 1,980 | |
(1) Share transactions | | | | | | | | | | | | | |
Shares sold | | 10,660 | | 7,586 | | 385 | | 977 | | 589 | | 3,302 | |
Reinvestment of distributions | | 727 | | 63 | | 5 | | 12 | | 6 | | 266 | |
Shares redeemed | | (5,814 | ) | (981 | ) | (69 | ) | (366 | ) | (231 | ) | (1,120 | ) |
Change in shares | | 5,573 | | 6,668 | | 321 | | 623 | | 364 | | 2,448 | |
Purchase and sales of investment securities (excluding short-term securities): | | | | | | | | | | | | | |
Purchase of securities | | $ | 203,650 | | $ | 97,011 | | $ | 3,762 | | $ | 9,109 | | $ | 6,421 | | $ | 130,355 | |
Proceeds from sales of securities | | 141,145 | | 24,106 | | 553 | | 2,742 | | 2,593 | | 96,843 | |
| | | | | | | | | | | | | | | | | | | |
See accompanying Notes to Financial Statements.
| | Curian
Guidance -
Fixed Income
100 Fund | | Curian
Guidance -
Real Assets
Fund | | Curian/
American
Funds Global
Growth Fund(a) | | Curian/
American
Funds Growth
Fund(a) | |
Operations | | | | | | | | | |
Net investment income | | $ | 767 | | $ | 44 | | $ | 288 | | $ | 785 | |
Net realized gain | | 581 | | 200 | | 1,697 | | 4,048 | |
Net change in unrealized appreciation (depreciation) | | (973 | ) | (912 | ) | (1,362 | ) | 1,309 | |
Net increase (decrease) in net assets from operations | | 375 | | (668 | ) | 623 | | 6,142 | |
Distributions to shareholders | | | | | | | | | |
From net investment income | | (565 | ) | (106 | ) | (44 | ) | (212 | ) |
From net realized gain | | — | | (10 | ) | (1 | ) | (150 | ) |
Total distributions to shareholders | | (565 | ) | (116 | ) | (45 | ) | (362 | ) |
Share transactions(1) | | | | | | | | | |
Proceeds from sale of shares | | 36,175 | | 11,132 | | 32,201 | | 69,239 | |
Reinvestment of distributions | | 565 | | 116 | | 45 | | 362 | |
Cost of shares redeemed | | (11,559 | ) | (4,455 | ) | (5,180 | ) | (17,904 | ) |
Change in net assets from share transactions | | 25,181 | | 6,793 | | 27,066 | | 51,697 | |
Change in net assets | | 24,991 | | 6,009 | | 27,644 | | 57,477 | |
Net assets beginning of year | | 23,310 | | 5,285 | | 5,355 | | 48,596 | |
Net assets end of year | | $ | 48,301 | | $ | 11,294 | | $ | 32,999 | | $ | 106,073 | |
Undistributed net investment income | | $ | 843 | | $ | 69 | | $ | 288 | | $ | 784 | |
(1) Share transactions | | | | | | | | | |
Shares sold | | 3,597 | | 1,065 | | 2,921 | | 4,853 | |
Reinvestment of distributions | | 57 | | 12 | | 4 | | 24 | |
Shares redeemed | | (1,145 | ) | (440 | ) | (468 | ) | (1,259 | ) |
Change in shares | | 2,509 | | 637 | | 2,457 | | 3,618 | |
Purchase and sales of investment securities (excluding short-term securities): | | | | | | | | | |
Purchase of securities | | $ | 65,098 | | $ | 11,189 | | $ | 29,552 | | $ | 57,945 | |
Proceeds from sales of securities | | 39,457 | | 4,374 | | 541 | | 2,405 | |
| | | | | | | | | | | | | |
(a) The Master Funds for the Curian/American Funds Master Feeder Funds are the Class 1 shares of the corresponding American Fund Insurance Series Fund. These financial statements should be read in conjunction with each Master Fund’s shareholder report.
See accompanying Notes to Financial Statements.
Curian Variable Series Trust Master Feeder Funds and Fund of Funds
Statements of Changes in Net Assets (in thousands)
For the Year Ended December 31, 2013
| | Curian
Guidance -
Interest Rate
Opportunities
Fund (a) | | Curian
Guidance -
Multi-Strategy
Income
Fund (a) | | Curian
Guidance -
Equity Income
Fund | | Curian
Guidance -
Conservative
Fund | | Curian
Guidance -
Moderate Fund | | Curian
Guidance -
Growth
Fund (a) | |
Operations | | | | | | | | | | | | | |
Net investment income | | $ | 346 | | $ | 377 | | $ | 609 | | $ | 614 | | $ | 1,603 | | $ | 351 | |
Net realized gain (loss) | | 396 | | 108 | | 2,668 | | 246 | | 6,792 | | 531 | |
Net change in unrealized appreciation (depreciation) | | (331 | ) | (262 | ) | 1,623 | | (711 | ) | 3,274 | | 1,786 | |
Net increase (decrease) in net assets from operations | | 411 | | 223 | | 4,900 | | 149 | | 11,669 | | 2,668 | |
Distributions to shareholders | | | | | | | | | | | | | |
From net investment income | | — | | — | | (164 | ) | (333 | ) | (520 | ) | — | |
From net realized gain | | — | | — | | (23 | ) | (32 | ) | (33 | ) | — | |
Total distributions to shareholders | | — | | — | | (187 | ) | (365 | ) | (553 | ) | — | |
Share transactions(1) | | | | | | | | | | | | | |
Proceeds from sale of shares | | 34,497 | | 24,739 | | 31,597 | | 54,463 | | 142,014 | | 49,468 | |
Reinvestment of distributions | | — | | — | | 187 | | 365 | | 553 | | — | |
Cost of shares redeemed | | (3,561 | ) | (3,620 | ) | (7,576 | ) | (21,759 | ) | (22,251 | ) | (5,168 | ) |
Change in net assets from share transactions | | 30,936 | | 21,119 | | 24,208 | | 33,069 | | 120,316 | | 44,300 | |
Change in net assets | | 31,347 | | 21,342 | | 28,921 | | 32,853 | | 131,432 | | 46,968 | |
Net assets beginning of year | | — | | — | | 17,856 | | 25,383 | | 50,110 | | — | |
Net assets end of year | | $ | 31,347 | | $ | 21,342 | | $ | 46,777 | | $ | 58,236 | | $ | 181,542 | | $ | 46,968 | |
Undistributed net investment income | | $ | 735 | | $ | 508 | | $ | 2,314 | | $ | 668 | | $ | 2,125 | | $ | 509 | |
(1) Share transactions | | | | | | | | | | | | | |
Shares sold | | 3,550 | | 2,568 | | 2,776 | | 5,097 | | 12,595 | | 4,780 | |
Reinvestment of distributions | | — | | — | | 16 | | 35 | | 48 | | — | |
Shares redeemed | | (366 | ) | (376 | ) | (660 | ) | (2,048 | ) | (1,971 | ) | (486 | ) |
Change in shares | | 3,184 | | 2,192 | | 2,132 | | 3,084 | | 10,672 | | 4,294 | |
Purchase and sales of investment securities (excluding short-term securities): | | | | | | | | | | | | | |
Purchase of securities | | $ | 35,402 | | $ | 25,525 | | $ | 34,043 | | $ | 72,806 | | $ | 207,635 | | $ | 48,273 | |
Proceeds from sales of securities | | 3,675 | | 3,845 | | 7,028 | | 39,337 | | 84,794 | | 3,097 | |
| | | | | | | | | | | | | | | | | | | |
(a) Period from April 29, 2013 (commencement of operations).
See accompanying Notes to Financial Statements.
| | Curian
Guidance -
Moderate
Growth Fund | | Curian
Guidance -
Maximum
Growth Fund | | Curian
Guidance -
Tactical
Moderate
Growth Fund | | Curian
Guidance -
Tactical
Maximum
Growth Fund | | Curian
Guidance -
Institutional Alt
65 Fund | | Curian
Guidance -
Institutional Alt
100
Conservative
Fund (a) | |
Operations | | | | | | | | | | | | | |
Net investment income | | $ | 1,963 | | $ | 318 | | $ | 2,169 | | $ | 405 | | $ | 889 | | $ | 133 | |
Net realized gain (loss) | | 8,795 | | 3,707 | | 11,648 | | 3,366 | | 1,386 | | (22 | ) |
Net change in unrealized appreciation (depreciation) | | 7,919 | | 4,281 | | 4,563 | | 3,576 | | 4,703 | | 105 | |
Net increase (decrease) in net assets from operations | | 18,677 | | 8,306 | | 18,380 | | 7,347 | | 6,978 | | 216 | |
Distributions to shareholders | | | | | | | | | | | | | |
From net investment income | | (319 | ) | (80 | ) | (628 | ) | — | | (152 | ) | — | |
From net realized gain | | (277 | ) | (76 | ) | (600 | ) | (30 | ) | (234 | ) | — | |
Total distributions to shareholders | | (596 | ) | (156 | ) | (1,228 | ) | (30 | ) | (386 | ) | — | |
Share transactions(1) | | | | | | | | | | | | | |
Proceeds from sale of shares | | 203,613 | | 48,886 | | 178,640 | | 52,001 | | 76,316 | | 20,685 | |
Reinvestment of distributions | | 596 | | 156 | | 1,228 | | 30 | | 386 | | — | |
Cost of shares redeemed | | (26,336 | ) | (8,666 | ) | (35,101 | ) | (9,569 | ) | (19,830 | ) | (2,497 | ) |
Change in net assets from share transactions | | 177,873 | | 40,376 | | 144,767 | | 42,462 | | 56,872 | | 18,188 | |
Change in net assets | | 195,954 | | 48,526 | | 161,919 | | 49,779 | | 63,464 | | 18,404 | |
Net assets beginning of year | | 70,174 | | 21,318 | | 74,598 | | 21,361 | | 49,064 | | — | |
Net assets end of year | | $ | 266,128 | | $ | 69,844 | | $ | 236,517 | | $ | 71,140 | | $ | 112,528 | | $ | 18,404 | |
Undistributed net investment income | | $ | 2,794 | | $ | 635 | | $ | 2,373 | | $ | 473 | | $ | 1,026 | | $ | 155 | |
(1) Share transactions | | | | | | | | | | | | | |
Shares sold | | 18,295 | | 4,371 | | 16,278 | | 4,801 | | 7,035 | | 2,093 | |
Reinvestment of distributions | | 52 | | 13 | | 108 | | 3 | | 35 | | — | |
Shares redeemed | | (2,340 | ) | (760 | ) | (3,178 | ) | (872 | ) | (1,813 | ) | (253 | ) |
Change in shares | | 16,007 | | 3,624 | | 13,208 | | 3,932 | | 5,257 | | 1,840 | |
Purchase and sales of investment securities (excluding short-term securities): | | | | | | | | | | | | | |
Purchase of securities | | $ | 297,697 | | $ | 90,433 | | $ | 338,713 | | $ | 93,029 | | $ | 97,973 | | $ | 22,526 | |
Proceeds from sales of securities | | 115,890 | | 49,011 | | 191,144 | | 49,712 | | 39,959 | | 4,175 | |
| | | | | | | | | | | | | | | | | | | |
(a) Period from April 29, 2013 (commencement of operations).
See accompanying Notes to Financial Statements.
| | Curian
Guidance -
Institutional Alt
100 Moderate
Fund | | Curian
Guidance -
Institutional Alt
100 Growth
Fund (a) | | Curian
Guidance -
International
Opportunities
Conservative
Fund (a) | | Curian
Guidance -
International
Opportunities
Moderate
Fund (a) | | Curian
Guidance -
International
Opportunities
Growth
Fund (a) | | Curian
Guidance -
Equity 100
Fund | |
Operations | | | | | | | | | | | | | |
Net investment income | | $ | 3,074 | | $ | 572 | | $ | 31 | | $ | 76 | | $ | 44 | | $ | 381 | |
Net realized gain (loss) | | 2,787 | | (27 | ) | 12 | | 20 | | 9 | | 3,092 | |
Net change in unrealized appreciation (depreciation) | | 2,042 | | 415 | | (7 | ) | 30 | | 144 | | 2,906 | |
Net increase (decrease) in net assets from operations | | 7,903 | | 960 | | 36 | | 126 | | 197 | | 6,379 | |
Distributions to shareholders | | | | | | | | | | | | | |
From net investment income | | (64 | ) | — | | — | | — | | — | | (29 | ) |
From net realized gain | | (651 | ) | — | | — | | — | | — | | (13 | ) |
Total distributions to shareholders | | (715 | ) | — | | — | | — | | — | | (42 | ) |
Share transactions(1) | | | | | | | | | | | | | |
Proceeds from sale of shares | | 193,160 | | 41,415 | | 2,426 | | 5,914 | | 5,118 | | 47,736 | |
Reinvestment of distributions | | 715 | | — | | — | | — | | — | | 42 | |
Cost of shares redeemed | | (52,574 | ) | (3,856 | ) | (527 | ) | (783 | ) | (610 | ) | (6,445 | ) |
Change in net assets from share transactions | | 141,301 | | 37,559 | | 1,899 | | 5,131 | | 4,508 | | 41,333 | |
Change in net assets | | 148,489 | | 38,519 | | 1,935 | | 5,257 | | 4,705 | | 47,670 | |
Net assets beginning of year | | 142,016 | | — | | — | | — | | — | | 3,837 | |
Net assets end of year | | $ | 290,505 | | $ | 38,519 | | $ | 1,935 | | $ | 5,257 | | $ | 4,705 | | $ | 51,507 | |
Undistributed net investment income | | $ | 3,433 | | $ | 636 | | $ | 37 | | $ | 92 | | $ | 50 | | $ | 432 | |
(1) Share transactions | | | | | | | | | | | | | |
Shares sold | | 18,492 | | 4,171 | | 251 | | 605 | | 524 | | 4,090 | |
Reinvestment of distributions | | 69 | | — | | — | | — | | — | | 3 | |
Shares redeemed | | (5,041 | ) | (388 | ) | (54 | ) | (80 | ) | (62 | ) | (535 | ) |
Change in shares | | 13,520 | | 3,783 | | 197 | | 525 | | 462 | | 3,558 | |
Purchase and sales of investment securities (excluding short-term securities): | | | | | | | | | | | | | |
Purchase of securities | | $ | 280,269 | | $ | 46,198 | | $ | 2,307 | | $ | 5,691 | | $ | 4,837 | | $ | 75,449 | |
Proceeds from sales of securities | | 136,040 | | 7,984 | | 366 | | 454 | | 267 | | 33,097 | |
| | | | | | | | | | | | | | | | | | | |
(a) Period from April 29, 2013 (commencement of operations).
See accompanying Notes to Financial Statements.
| | Curian
Guidance -
Fixed Income
100 Fund | | Curian
Guidance -
Real Assets
Fund (a) | | Curian/
American
Funds Global
Growth
Fund (b)(c) | | Curian/
American
Funds Growth
Fund(c) | |
Operations | | | | | | | | | |
Net investment income | | $ | 528 | | $ | 32 | | $ | 43 | | $ | 211 | |
Net realized gain (loss) | | (470 | ) | 76 | | 1 | | 152 | |
Net change in unrealized appreciation (depreciation) | | (615 | ) | (34 | ) | 200 | | 6,480 | |
Net increase (decrease) in net assets from operations | | (557 | ) | 74 | | 244 | | 6,843 | |
Distributions to shareholders | | | | | | | | | |
From net investment income | | (102 | ) | — | | — | | (49 | ) |
From net realized gain | | (5 | ) | — | | — | | — | |
Total distributions to shareholders | | (107 | ) | — | | — | | (49 | ) |
Share transactions(1) | | | | | | | | | |
Proceeds from sale of shares | | 27,271 | | 5,669 | | 5,363 | | 37,717 | |
Reinvestment of distributions | | 107 | | — | | — | | 49 | |
Cost of shares redeemed | | (9,803 | ) | (458 | ) | (252 | ) | (6,393 | ) |
Change in net assets from share transactions | | 17,575 | | 5,211 | | 5,111 | | 31,373 | |
Change in net assets | | 16,911 | | 5,285 | | 5,355 | | 38,167 | |
Net assets beginning of year | | 6,399 | | — | | — | | 10,429 | |
Net assets end of year | | $ | 23,310 | | $ | 5,285 | | $ | 5,355 | | $ | 48,596 | |
Undistributed net investment income | | $ | 564 | | $ | 106 | | $ | 44 | | $ | 211 | |
(1) Share transactions | | | | | | | | | |
Shares sold | | 2,730 | | 580 | | 511 | | 3,059 | |
Reinvestment of distributions | | 11 | | — | | — | | 4 | |
Shares redeemed | | (995 | ) | (46 | ) | (24 | ) | (520 | ) |
Change in shares | | 1,746 | | 534 | | 487 | | 2,543 | |
Purchase and sales of investment securities (excluding short-term securities): | | | | | | | | | |
Purchase of securities | | $ | 33,835 | | $ | 5,565 | | $ | 5,171 | | $ | 32,463 | |
Proceeds from sales of securities | | 15,752 | | 242 | | 15 | | 907 | |
| | | | | | | | | | | | | |
(a) Period from April 29, 2013 (commencement of operations).
(b) Period from September 16, 2013 (commencement of operations).
(c) The Master Funds for the Curian American Master Feeder Funds are the Class 1 shares of the corresponding American Funds Insurance Series Fund. These financial statements should be read in conjunction with each Master Fund’s shareholder report.
See accompanying Notes to Financial Statements.
Curian Variable Series Trust Master Feeder Funds and Fund of Funds
Financial Highlights
For a Share Outstanding
| | | | Increase (Decrease) from
Investment Operations | | Distributions from | | | | | | Supplemental Data | | Ratios(a)(e) | |
Period
Ended | | Net Asset
Value,
Beginning
of Period | | Net
Investment
Income
(Loss)(b) | | Net Realized
& Unrealized
Gain (Loss) | | Total from
Investment
Operations | | Net
Investment
Income | | Net Realized
Gain on
Investment
Transactions | | Net Asset
Value,
End
of Period | | Total
Return(c) | | Net Assets,
End of
Period (in
thousands) | | Portfolio
Turnover(d) | | Net
Expenses to
Average
Net Assets | | Total
Expenses to
Average Net
Assets | | Net
Investment
Income (Loss)
to Average
Net Assets | |
Curian Guidance - Interest Rate Opportunities Fund |
| | | | | | | | | | | | | | | | | | | | | | | | | | | |
12/31/2014 | | $ | 9.84 | | $ | 0.09 | | $ | 0.01 | | $ | 0.10 | | $ | (0.14 | ) | $ | (0.01 | ) | $ | 9.79 | | 1.05 | % | $ | 51,653 | | 13 | % | 0.27 | % | 0.27 | % | 0.85 | % |
12/31/2013‡ | | 10.00 | | 0.21 | | (0.37 | ) | (0.16 | ) | — | | — | | 9.84 | | (1.60 | ) | 31,347 | | 25 | | 0.42 | | 0.42 | | 3.14 | |
|
Curian Guidance - Multi-Strategy Income Fund |
| | | | | | | | | | | | | | | | | | | | | | | | | | | |
12/31/2014 | | 9.73 | | 0.17 | | 0.02 | | 0.19 | | (0.13 | ) | (0.02 | ) | 9.77 | | 1.93 | | 39,724 | | 9 | | 0.27 | | 0.27 | | 1.75 | |
12/31/2013‡ | | 10.00 | | 0.29 | | (0.56 | ) | (0.27 | ) | — | | — | | 9.73 | | (2.70 | ) | 21,342 | | 35 | | 0.42 | | 0.42 | | 4.48 | |
|
Curian Guidance - Equity Income Fund |
| | | | | | | | | | | | | | | | | | | | | | | | | | | |
12/31/2014 | | 12.20 | | 0.00 | | 1.05 | | 1.05 | | (0.44 | ) | (0.18 | ) | 12.63 | | 8.62 | | 70,091 | | 18 | | 0.27 | | 0.27 | | 0.01 | |
12/31/2013 | | 10.49 | | 0.21 | | 1.55 | | 1.76 | | (0.04 | ) | (0.01 | ) | 12.20 | | 16.79 | | 46,777 | | 21 | | 0.42 | | 0.42 | | 1.84 | |
12/31/2012* | | 10.00 | | 0.16 | | 0.33 | | 0.49 | | — | | — | | 10.49 | | 4.90 | | 17,856 | | 11 | | 0.46 | | 0.46 | | 1.75 | |
|
Curian Guidance - Conservative Fund |
| | | | | | | | | | | | | | | | | | | | | | | | | | | |
12/31/2014 | | 10.64 | | 0.19 | | 0.20 | | 0.39 | | (0.07 | ) | (0.03 | ) | 10.93 | | 3.71 | | 105,392 | | 35 | | 0.27 | | 0.27 | | 1.74 | |
12/31/2013 | | 10.62 | | 0.15 | | (0.06 | ) | 0.09 | | (0.06 | ) | (0.01 | ) | 10.64 | | 0.85 | | 58,236 | | 88 | | 0.42 | | 0.42 | | 1.37 | |
12/31/2012* | | 10.00 | | 0.26 | | 0.36 | | 0.62 | | — | | — | | 10.62 | | 6.20 | | 25,383 | | 5 | | 0.46 | | 0.46 | | 2.75 | |
|
Curian Guidance - Moderate Fund |
| | | | | | | | | | | | | | | | | | | | | | | | | | | |
12/31/2014 | | 11.77 | | 0.12 | | 0.32 | | 0.44 | | (0.08 | ) | (0.22 | ) | 11.91 | | 3.71 | | 357,957 | | 32 | | 0.27 | | 0.27 | | 1.02 | |
12/31/2013 | | 10.53 | | 0.16 | | 1.12 | | 1.28 | | (0.04 | ) | (0.00 | )(g) | 11.77 | | 12.15 | | 181,542 | | 77 | | 0.42 | | 0.42 | | 1.45 | |
12/31/2012* | | 10.00 | | 0.22 | | 0.31 | | 0.53 | | — | | — | | 10.53 | | 5.30 | | 50,110 | | 7 | | 0.46 | | 0.46 | | 2.40 | |
|
Curian Guidance - Growth Fund |
| | | | | | | | | | | | | | | | | | | | | | | | | | | |
12/31/2014 | | 10.94 | | 0.12 | | 0.34 | | 0.46 | | (0.04 | ) | (0.03 | ) | 11.33 | | 4.16 | | 166,251 | | 30 | | 0.26 | | 0.26 | | 1.05 | |
12/31/2013‡ | | 10.00 | | 0.18 | | 0.76 | | 0.94 | | — | | — | | 10.94 | | 9.40 | | 46,968 | | 16 | | 0.42 | | 0.42 | | 2.47 | |
|
Curian Guidance - Moderate Growth Fund |
| | | | | | | | | | | | | | | | | | | | | | | | | | | |
12/31/2014 | | 11.74 | | 0.10 | | 0.39 | | 0.49 | | (0.07 | ) | (0.21 | ) | 11.95 | | 4.11 | | 504,190 | | 33 | | 0.27 | | 0.27 | | 0.87 | |
12/31/2013 | | 10.53 | | 0.13 | | 1.10 | | 1.23 | | (0.01 | ) | (0.01 | ) | 11.74 | | 11.76 | | 266,128 | | 70 | | 0.42 | | 0.42 | | 1.18 | |
12/31/2012* | | 10.00 | | 0.09 | | 0.44 | | 0.53 | | — | | — | | 10.53 | | 5.30 | | 70,174 | | 14 | | 0.46 | | 0.46 | | 1.03 | |
|
Curian Guidance - Maximum Growth Fund |
| | | | | | | | | | | | | | | | | | | | | | | | | | | |
12/31/2014 | | 12.30 | | 0.08 | | 0.45 | | 0.53 | | (0.07 | ) | (0.38 | ) | 12.38 | | 4.26 | | 119,715 | | 49 | | 0.27 | | 0.27 | | 0.65 | |
12/31/2013 | | 10.38 | | 0.08 | | 1.86 | | 1.94 | | (0.01 | ) | (0.01 | ) | 12.30 | | 18.78 | | 69,844 | | 108 | | 0.42 | | 0.42 | | 0.70 | |
12/31/2012* | | 10.00 | | 0.09 | | 0.29 | | 0.38 | | — | | — | | 10.38 | | 3.80 | | 21,318 | | 9 | | 0.46 | | 0.46 | | 0.94 | |
|
Curian Guidance - Tactical Moderate Growth Fund |
| | | | | | | | | | | | | | | | | | | | | | | | | | | |
12/31/2014 | | 11.58 | | 0.12 | | 0.40 | | 0.52 | | (0.10 | ) | (0.49 | ) | 11.51 | | 4.44 | | 300,949 | | 71 | | 0.27 | | 0.27 | | 1.01 | |
12/31/2013 | | 10.34 | | 0.14 | | 1.16 | | 1.30 | �� | (0.03 | ) | (0.03 | ) | 11.58 | | 12.62 | | 236,517 | | 116 | | 0.42 | | 0.42 | | 1.31 | |
12/31/2012* | | 10.00 | | 0.18 | | 0.16 | | 0.34 | | — | | — | | 10.34 | | 3.40 | | 74,598 | | 30 | | 0.46 | | 0.46 | | 2.02 | |
|
Curian Guidance - Tactical Maximum Growth Fund |
| | | | | | | | | | | | | | | | | | | | | | | | | | | |
12/31/2014 | | 11.83 | | 0.08 | | 0.37 | | 0.45 | | (0.06 | ) | (0.43 | ) | 11.79 | | 3.78 | | 98,612 | | 41 | | 0.27 | | 0.27 | | 0.67 | |
12/31/2013 | | 10.26 | | 0.10 | | 1.48 | | 1.58 | | — | | (0.01 | ) | 11.83 | | 15.35 | | 71,140 | | 108 | | 0.42 | | 0.42 | | 0.88 | |
12/31/2012* | | 10.00 | | (0.02 | ) | 0.28 | | 0.26 | | — | | — | | 10.26 | | 2.60 | | 21,361 | | 17 | | 0.46 | | 0.46 | | (0.22 | ) |
|
Curian Guidance - Institutional Alt 65 Fund |
| | | | | | | | | | | | | | | | | | | | | | | | | | | |
12/31/2014 | | 11.30 | | 0.10 | | 0.19 | | 0.29 | | (0.09 | ) | (0.15 | ) | 11.35 | | 2.60 | | 130,220 | | 50 | | 0.27 | | 0.27 | | 0.87 | |
12/31/2013 | | 10.44 | | 0.11 | | 0.79 | | 0.90 | | (0.02 | ) | (0.02 | ) | 11.30 | | 8.63 | | 112,528 | | 46 | | 0.42 | | 0.42 | | 1.01 | |
12/31/2012* | | 10.00 | | 0.04 | | 0.40 | | 0.44 | | — | | — | | 10.44 | | 4.40 | | 49,064 | | 19 | | 0.46 | | 0.46 | | 0.47 | |
|
Curian Guidance - Alt 100 Conservative Fund |
| | | | | | | | | | | | | | | | | | | | | | | | | | | |
12/31/2014 | | 10.00 | | 0.08 | | 0.06 | | 0.14 | | (0.05 | ) | (0.00 | )(g) | 10.09 | | 1.38 | | 36,433 | | 60 | | 0.27 | | 0.27 | | 0.76 | |
12/31/2013‡ | | 10.00 | | 0.13 | | (0.13 | ) | 0.00 | | — | | — | | 10.00 | | 0.00 | | 18,404 | | 46 | | 0.42 | | 0.42 | | 1.95 | |
| | | | | | | | | | | | | | | | | | | | | | | | | | | | | | | | | | | |
See accompanying Notes to Financial Statements.
| | | | Increase (Decrease) from
Investment Operations | | Distributions from | | | | | | Supplemental Data | | Ratios(a)(e) | |
Period
Ended | | Net Asset
Value,
Beginning
of Period | | Net
Investment
Income
(Loss)(b) | | Net Realized
& Unrealized
Gain (Loss) | | Total from
Investment
Operations | | Net
Investment
Income | | Net Realized
Gain on
Investment
Transactions | | Net Asset
Value,
End
of Period | | Total
Return(c) | | Net Assets,
End of
Period (in
thousands) | | Portfolio
Turnover(d) | | Net
Expenses to
Average
Net Assets | | Total
Expenses to
Average
Net
Assets | | Net Investment
Income
(Loss) to
Average Net
Assets | |
Curian Guidance - Alt 100 Moderate Fund |
|
12/31/2014 | | $ | 10.60 | | $ | 0.11 | | $ | 0.13 | | $ | 0.24 | | $ | (0.11 | ) | $ | (0.13 | ) | $ | 10.60 | | 2.27 | % | $ | 349,573 | | 43 | % | 0.27 | % | 0.27 | % | 0.98 | % |
12/31/2013 | | 10.23 | | 0.13 | | 0.26 | | 0.39 | | (0.00 | )(g) | (0.02 | ) | 10.60 | | 3.88 | | 290,505 | | 57 | | 0.42 | | 0.42 | | 1.28 | |
12/31/2012* | | 10.00 | | (0.02 | ) | 0.25 | | 0.23 | | — | | — | | 10.23 | | 2.30 | | 142,016 | | 14 | | 0.46 | | 0.46 | | (0.23 | ) |
| | | | | | | | | | | | | | | | | | | | | | | | | | | |
Curian Guidance - Alt 100 Growth Fund |
| | | | | | | | | | | | | | | | | | | | | | | | | | | |
12/31/2014 | | 10.18 | | 0.17 | | 0.05 | | 0.22 | | (0.06 | ) | (0.00 | )(g) | 10.34 | | 2.20 | | 108,113 | | 32 | | 0.27 | | 0.27 | | 1.64 | |
12/31/2013‡ | | 10.00 | | 0.30 | | (0.12 | ) | 0.18 | | — | | — | | 10.18 | | 1.80 | | 38,519 | | 45 | | 0.42 | | 0.42 | | 4.37 | |
| | | | | | | | | | | | | | | | | | | | | | | | | | | |
Curian Guidance - International Conservative Fund |
| | | | | | | | | | | | | | | | | | | | | | | | | | | |
12/31/2014 | | 9.81 | | 0.08 | | (0.27 | ) | (0.19 | ) | (0.08 | ) | (0.03 | ) | 9.51 | | (2.03 | ) | 4,921 | | 16 | | 0.27 | | 0.27 | | 0.82 | |
12/31/2013‡ | | 10.00 | | 0.26 | | (0.45 | ) | (0.19 | ) | — | | — | | 9.81 | | (1.90 | ) | 1,935 | | 36 | | 0.42 | | 0.42 | | 4.02 | |
| | | | | | | | | | | | | | | | | | | | | | | | | | | |
Curian Guidance - International Moderate Fund |
| | | | | | | | | | | | | | | | | | | | | | | | | | | |
12/31/2014 | | 10.01 | | 0.10 | | (0.42 | ) | (0.32 | ) | (0.08 | ) | (0.02 | ) | 9.59 | | (3.20 | ) | 11,015 | | 33 | | 0.27 | | 0.27 | | 0.98 | |
12/31/2013‡ | | 10.00 | | 0.31 | | (0.30 | ) | 0.01 | | — | | — | | 10.01 | | 0.10 | | 5,257 | | 20 | | 0.42 | | 0.42 | | 4.60 | |
| | | | | | | | | | | | | | | | | | | | | | | | | | | |
Curian Guidance - International Growth Fund |
| | | | | | | | | | | | | | | | | | | | | | | | | | | |
12/31/2014 | | 10.19 | | 0.09 | | (0.42 | ) | (0.33 | ) | (0.06 | ) | (0.02 | ) | 9.78 | | (3.25 | ) | 8,077 | | 38 | | 0.27 | | 0.27 | | 0.85 | |
12/31/2013‡ | | 10.00 | | 0.17 | | 0.02 | | 0.19 | | — | | — | | 10.19 | | 1.90 | | 4,705 | | 12 | | 0.42 | | 0.42 | | 2.55 | |
| | | | | | | | | | | | | | | | | | | | | | | | | | | |
Curian Guidance - Equity 100 Fund |
| | | | | | | | | | | | | | | | | | | | | | | | | | | |
12/31/2014 | | 13.11 | | 0.06 | | 0.58 | | 0.64 | | (0.07 | ) | (0.52 | ) | 13.16 | | 4.84 | | 83,922 | | 137 | | 0.27 | | 0.27 | | 0.43 | |
12/31/2013 | | 10.32 | | 0.17 | | 2.63 | | 2.80 | | (0.01 | ) | (0.00 | )(g) | 13.11 | | 27.15 | | 51,507 | | 125 | | 0.42 | | 0.42 | | 1.44 | |
12/31/2012† | | 10.00 | | 0.25 | | 0.07 | | 0.32 | | — | | — | | 10.32 | | 3.20 | | 3,837 | | 6 | | 0.48 | | 0.48 | | 8.23 | |
| | | | | | | | | | | | | | | | | | | | | | | | | | | |
Curian Guidance - Fixed Income 100 Fund |
| | | | | | | | | | | | | | | | | | | | | | | | | | | |
12/31/2014 | | 9.79 | | 0.20 | | 0.01 | | 0.21 | | (0.12 | ) | — | | 9.88 | | 2.14 | | 48,301 | | 105 | | 0.27 | | 0.27 | | 2.03 | |
12/31/2013 | | 10.08 | | 0.28 | | (0.53 | ) | (0.25 | ) | (0.04 | ) | (0.00 | )(g) | 9.79 | | (2.42 | ) | 23,310 | | 86 | | 0.42 | | 0.42 | | 2.85 | |
12/31/2012† | | 10.00 | | 0.38 | | (0.30 | ) | 0.08 | | — | | — | | 10.08 | | 0.80 | | 6,399 | | 1 | | 0.44 | | 0.44 | | 12.40 | |
| | | | | | | | | | | | | | | | | | | | | | | | | | | |
Curian Guidance - Real Assets Fund |
| | | | | | | | | | | | | | | | | | | | | | | | | | | |
12/31/2014 | | 9.90 | | 0.05 | | (0.21 | ) | (0.16 | ) | (0.09 | ) | (0.01 | ) | 9.64 | | (1.65 | ) | 11,294 | | 47 | | 0.27 | | 0.27 | | 0.47 | |
12/31/2013‡ | | 10.00 | | 0.13 | | (0.23 | ) | (0.10 | ) | — | | — | | 9.90 | | (1.00 | ) | 5,285 | | 10 | | 0.42 | | 0.42 | | 1.90 | |
| | | | | | | | | | | | | | | | | | | | | | | | | | | |
Curian/American Funds Global Growth Fund(f) |
| | | | | | | | | | | | | | | | | | | | | | | | | | | |
12/31/2014 | | 11.00 | | 0.17 | | 0.06 | | 0.23 | | (0.02 | ) | (0.00 | )(g) | 11.21 | | 2.06 | | 32,999 | | 3 | | 0.51 | | 1.16 | | 1.53 | |
12/31/2013^ | | 10.00 | | 0.22 | | 0.78 | | 1.00 | | — | | — | | 11.00 | | 10.00 | | 5,355 | | 1 | | 0.62 | | 1.27 | | 7.03 | |
| | | | | | | | | | | | | | | | | | | | | | | | | | | |
Curian/American Funds Growth Fund(f) |
| | | | | | | | | | | | | | | | | | | | | | | | | | | |
12/31/2014 | | 13.81 | | 0.15 | | 0.95 | | 1.10 | | (0.03 | ) | (0.02 | ) | 14.86 | | 7.98 | | 106,073 | | 3 | | 0.72 | | 1.22 | | 1.06 | |
12/31/2013 | | 10.68 | | 0.10 | | 3.04 | | 3.14 | | (0.01 | ) | — | | 13.81 | | 29.45 | | 48,596 | | 4 | | 0.82 | | 1.32 | | 0.81 | |
12/31/2012* | | 10.00 | | 0.20 | | 0.48 | | 0.68 | | — | | — | | 10.68 | | 6.80 | | 10,429 | | 10 | | 0.85 | | 1.35 | | 2.14 | |
| | | | | | | | | | | | | | | | | | | | | | | | | | | | | | | | | | | |
* Commenced operations on February 6, 2012.
† Commenced operations on September 10, 2012.
‡ Commenced operations on April 29, 2013.
^ Commenced operations on September 16, 2013.
(a) Annualized for periods less than one year.
(b) Per share data calculated using average shares method.
(c) Total return assumes reinvestment of all distributions for the period. Total return is not annualized for periods less than one year and does not reflect payment of the expenses that apply to the variable accounts or any annuity charges.
(d) Portfolio turnover is not annualized for periods of less than one year. Portfolio turnover rate is based on the Feeder Fund’s or Fund of Funds’ purchases or sales of the Master Fund or Underlying Funds, respectively.
(e) Ratios of net investment income and expenses to average net assets do not include the impact of the Master Fund’s or Underlying Funds’ expenses.
(f) The Master Funds for the Curian American Master Feeder Funds are the Class 1 shares of the corresponding American Fund Insurance Series Fund. These financial statements should be read in conjunction with each Master Fund’s shareholder report.
(g) Amount represents less than $0.005.
See accompanying Notes to Financial Statements.
Curian Variable Series Trust Master Feeder Funds and Fund of Funds
Notes to Financial Statements
December 31, 2014
NOTE 1. ORGANIZATION
The Curian Variable Series Trust (the “Trust”) is an open-end investment management company organized under the laws of the Commonwealth of Massachusetts, by a Declaration of Trust, dated September 7, 2011. The Trust is registered with the U.S. Securities and Exchange Commission (“SEC”) under the Investment Company Act of 1940, as amended (“1940 Act”), and its shares are registered under the Securities Act of 1933, as amended (“1933 Act”). The Trust operates as a series company, and at December 31, 2014 consisted of 55 separate funds. The information presented in these financial statements pertains to the following 22 separate funds (each a “Fund,” and collectively, “Funds”): Curian Guidance - Interest Rate Opportunities Fund, Curian Guidance - Multi-Strategy Income Fund, Curian Guidance - Equity Income Fund, Curian Guidance - Conservative Fund, Curian Guidance - Moderate Fund, Curian Guidance - Growth Fund, Curian Guidance - Moderate Growth Fund, Curian Guidance - Maximum Growth Fund, Curian Guidance - Tactical Moderate Growth Fund, Curian Guidance - Tactical Maximum Growth Fund, Curian Guidance - Institutional Alt 65 Fund, Curian Guidance - Alt 100 Conservative Fund, Curian Guidance - Alt 100 Moderate Fund, Curian Guidance - Alt 100 Growth Fund, Curian Guidance - International Conservative Fund, Curian Guidance - International Moderate Fund, Curian Guidance - International Growth Fund, Curian Guidance - Equity 100 Fund, Curian Guidance - Fixed Income 100 Fund and Curian Guidance - Real Assets Fund (these Funds are collectively known as “Curian Guidance Funds”); Curian/American Funds Global Growth Fund and Curian/American Funds Growth Fund (these Funds are collectively known as “Curian/American Funds Master Feeder Funds”). Each Fund represents shares of beneficial interest in a separate portfolio of securities and other assets, each with its own investment objective.
Curian Capital, LLC (“Curian,” the “Adviser” or “Administrator”), a wholly-owned subsidiary of Jackson National Life Insurance Company® (“Jackson”), serves as investment adviser and administrator to the Funds. Jackson is an indirect wholly owned subsidiary of Prudential plc, a publicly traded company incorporated in the United Kingdom. Prudential plc is not affiliated in any manner with Prudential Financial Inc., a company whose principal place of business is the United States of America. The Funds offer only one class of shares. Shares of each Fund are sold to life insurance company separate accounts to fund the benefits of variable annuity contracts. Shares may also be sold directly to qualified and non-qualified retirement plans.
Each of the Curian Guidance Funds operates under a “Fund of Funds” structure, investing substantially all of its assets in other affiliated Funds (each, an “Underlying Fund,” and, collectively, the “Underlying Funds”) advised by Curian or Jackson National Asset Management, LLC (“JNAM”), a subsidiary of Jackson and an affiliate of Curian.
The Curian/American Funds Master Feeder Funds operate as “Feeder Funds” and seek to achieve their respective investment objectives by investing primarily all their investable assets in a separate mutual fund (“Master Fund”). Each Curian/American Funds Master Feeder Fund’s Master Fund is a series of the American Funds Insurance Series®, a registered open-end management investment company that has the same investment objective as each corresponding Feeder Fund. Each Master Fund directly acquires securities and the Feeder Fund, by investing in the Master Fund, acquires an indirect interest in those securities. As of December 31, 2014, Curian/American Funds Global Growth Fund owned 0.59% of its corresponding Master Fund and Curian/American Funds Growth Fund owned 0.47% of its corresponding Master Fund. The Master Funds’ Schedule of Investments, Financial Statements and accounting policies are outlined in each Master Fund’s annual shareholder report, which accompanies this report. This report should be read in conjunction with the Master Funds’ annual shareholder reports.
The Curian/American Funds Master Feeder Funds are diversified Funds for purposes of the 1940 Act. The Curian Guidance Funds are non-diversified.
Effective September 15, 2014, the following Funds’ names were changed: Curian Guidance — Institutional Alt 100 Conservative Fund changed to Curian Guidance — Alt 100 Conservative Fund; Curian Guidance — Institutional Alt 100 Moderate Fund changed to Curian Guidance — Alt 100 Moderate Fund; Curian Guidance — Institutional Alt 100 Growth Fund changed to Curian Guidance — Alt 100 Growth Fund; Curian Guidance — International Opportunities Conservative Fund changed to Curian Guidance — International Conservative Fund; Curian Guidance — International Opportunities Moderate Fund changed to Curian Guidance — International Moderate Fund; and Curian Guidance — International Opportunities Growth Fund changed to Curian Guidance — International Growth Fund.
NOTE 2. SIGNIFICANT ACCOUNTING POLICIES
The Funds are investment companies and follow accounting and reporting guidance under Financial Accounting Standards Board (“FASB”) Accounting Standards Codification (“ASC”) Topic 946, “Financial Services-Investment Companies”. The following is a summary of significant accounting policies consistently followed by the Funds in the preparation of their financial statements in conformity with U.S. generally accepted accounting principles (“GAAP”).
Security Valuation and Fair Value Measurement - Curian has entered into a sub-administration and fund accounting services agreement on behalf of the Funds with Jackson Fund Services (“JFS” or “Sub-Administrator”), a division of JNAM. Under the Trust’s valuation policy and procedures, the Trust’s Board of Trustees (“Board” or “Trustees”) has delegated the daily operational oversight of the securities valuation function to the Pricing Committee of JFS (“Pricing Committee”), which consists of certain officers of the Trust and JNAM management. The Pricing Committee is responsible for determining fair valuations for any security for which market quotations are not readily available. For those securities fair valued under procedures adopted by the Board, the Pricing Committee reviews and affirms the reasonableness of the fair valuation determinations after considering all relevant information that is reasonably available. The Pricing Committee’s fair valuation determinations are subject to review, at the latest, by the Board at its next regularly scheduled meeting covering the calendar quarter in which the fair valuation was determined.
The net asset value (“NAV”) of each Fund shall be determined as of the close of trading (generally, 4:00 PM Eastern Time) on each day the New York Stock Exchange (“NYSE”) is open for trading. The Curian Guidance Funds’ investments in the Underlying Funds are valued at the daily NAV of the applicable Underlying Fund determined as of the close of the NYSE on each valuation date. Valuation of investments by the Underlying Funds is discussed in the annual report of the Underlying Funds. Each Feeder Fund’s investment in its corresponding Master Fund is valued at the daily NAV per share of the Master
Curian Variable Series Trust Master Feeder Funds and Fund of Funds
Notes to Financial Statements
December 31, 2014
Fund determined as of the close of the NYSE on each valuation date. Valuation of the investments by the Master Fund is discussed in each Master Fund’s annual shareholder report, which accompanies this report.
FASB ASC Topic 820, “Fair Value Measurement” establishes a single authoritative definition of fair value, sets out a framework for measuring fair value and requires additional disclosures about fair value measurements. Various inputs are used in determining the value of a Fund’s investments under FASB ASC Topic 820 guidance and are summarized into 3 broad categories. Level 1 includes valuations based on quoted prices of identical securities in active markets, including valuations for investments in mutual funds. Investments in the Underlying Funds and Master Funds are categorized as Level 1 within FASB ASC Topic 820 fair value hierarchy. The Level 1 valuation assets for the Funds can be referenced in the Schedules of Investments. There were no Level 2 or Level 3 investments in these Funds.
Distributions to Shareholders - The amount and timing of distributions are determined in accordance with federal income tax regulations, which may differ from GAAP. Dividends from net investment income are generally declared and paid annually, but may be paid more frequently to avoid excise tax. Distributions of net realized capital gains, if any, will be distributed at least annually, to the extent they exceed available capital loss carry forwards. Capital gains distributions received from the Underlying Funds are recorded as net realized gain from affiliated investments in the Statements of Operations.
Security Transactions and Investment Income - Security transactions are recorded on the trade date for financial reporting purposes. Dividend income is recorded on the ex-dividend date. Realized gains and losses are determined on the specific identification basis.
Expenses - Expenses are recorded on an accrual basis. Expenses of the Trust that are directly attributable to a specific Fund are charged to that Fund. Other Trust level expenses are allocated to the Funds based on the average daily net assets of each Fund.
Expenses in Master Funds and Fund of Funds - Because each Feeder Fund invests substantially all of its assets in a Master Fund, the Feeder Fund shareholders bear the fees and expenses of each respective Master Fund in which the Feeder Fund invests. Such expenses are not included in the Statements of Operations, but are incurred indirectly because they are considered in the calculation of the NAV of the respective Master Fund. As a result, the Feeder Funds’ actual expenses may be higher than those of other mutual funds that invest directly in securities. A similar situation exists for Curian Guidance Funds as it relates to the expenses associated with the investments in Underlying Funds.
Guarantees and Indemnifications - In the normal course of business, the Trust may enter into contracts that contain a variety of representations which provide general indemnifications for certain liabilities. Under the Trust’s organizational documents, its officers and Trustees are indemnified against certain liabilities arising out of the performance of their duties to the Funds. However, since their commencement of operations, the Funds have not had claims or losses pursuant to its contracts and expect the risk of loss to be remote. The Funds’ maximum exposure under these arrangements is unknown since the amount of any future claims that may be made against the Funds cannot be determined and the Funds have no historical basis for predicting the likelihood of any such claims.
Use of Estimates - The preparation of financial statements in conformity with GAAP requires management to make estimates and assumptions that affect the reported amounts of assets and liabilities and disclosure of contingent assets and liabilities at the date of the financial statements and the reported amounts of increases and decreases in net assets from operations during the reporting period. Actual results could differ from those estimates.
NOTE 3. CERTAIN RISKS
Market Risk - In the normal course of business, the Master Funds and Underlying Funds trade financial instruments and enter into financial transactions where the risk of potential loss exists due to changes in the market (“market risk”). The value of securities held by the Master Funds and Underlying Funds may decline in response to certain events, including those directly involving the companies whose securities are owned by a Master Fund or Underlying Fund; conditions affecting the general economy; overall market changes; local, regional or global political, social or economic instability; and currency, interest rate and price fluctuations.
Credit and Counterparty Risk - In the normal course of business, the Master Funds or Underlying Funds trade financial instruments and enter into financial transactions where the risk of potential loss exists due to failure of the other party to a transaction to perform (“credit risk”). Similar to credit risk, a Master Fund or Underlying Fund may be exposed to the risk that an institution or other entity with which the Master Fund or Underlying Fund has unsettled or open transactions will default (“counterparty risk”). Financial assets, which potentially expose a Master Fund or Underlying Fund to credit risk, consist principally of investments and cash due from counterparties. The potential loss could exceed the value of the financial assets and liabilities recorded in the Master Fund’s or Underlying Fund’s financial statements. A Master Fund or Underlying Fund manages counterparty risk by entering into agreements only with counterparties that it believes have the financial resources to honor their obligations and by monitoring the financial stability of those counterparties. A Master Fund’s or Underlying Fund’s Adviser and Sub-Advisers attempt to mitigate counterparty risk by (i) periodically assessing the creditworthiness of its trading partners, (ii) monitoring and/or limiting the amount of its net exposure to each individual counterparty based on its assessment and (iii) requiring collateral from the counterparty for certain transactions. In order to preserve certain safeguards for non-standard settlement trades, the Master Fund and Underlying Fund restrict their exposure to credit and counterparty losses by entering into master netting agreements with counterparties with whom they undertake a significant volume of transactions. In the event of default, the total market value exposure would be offset against collateral exchanged to date, which would result in a net receivable/(payable) that would be due from/to the counterparty. The extent of a Master Fund’s or Underlying Fund’s exposure to credit and counterparty risks in respect to financial assets is incorporated within their carrying value as recorded in each Master Fund’s or Underlying Fund’s Statement of Assets and Liabilities. For certain derivative contracts held by a Master Fund or Underlying Fund, the potential loss could exceed the value of the financial assets recorded in their financial statements.
Curian Variable Series Trust Master Feeder Funds and Fund of Funds
Notes to Financial Statements
December 31, 2014
Underlying Fund Investment Risks - Each Fund’s prospectus includes a discussion of the principal investment risks of the Master Fund or Underlying Fund in which it invests. Additional risks associated with a Master Fund’s or Underlying Fund’s investments are described within the respective Master Fund’s or Underlying Fund’s annual shareholder report.
Feeder Funds and Fund of Funds Risks - The value of an investment in a Feeder Fund changes with the value of the corresponding Master Fund and its investments. The value of an investment in the Curian Guidance Funds changes with the values of the corresponding Underlying Funds and their investments. The Master Fund’s and Underlying Fund’s shares may be purchased by other investment companies and shareholders. In some cases, the Master Fund or Underlying Fund may experience large subscriptions or redemptions due to allocation changes or rebalancing. While it is impossible to predict the overall impact of these transactions over time, there could be adverse effects on Fund performance.
NOTE 4. INVESTMENT ADVISORY FEES AND TRANSACTIONS WITH AFFILIATES
Advisory and Administration Fee - The Trust has an investment advisory and management agreement and administration agreement with Curian. Pursuant to the advisory agreement, each Fund pays Curian an annual fee, accrued daily and paid monthly, based on a specified percentage of the average daily net assets of each Fund. The following is a schedule of the fees each Fund is currently obligated to pay Curian:
| | Assets | | Advisory Fee | |
Curian Guidance Funds | | $0 to $500 million
Over $500 million | | 0.15 0.10 | % |
Curian/American Funds Global Growth Fund | | $0 to $1 billion
Over $1 billion | | 0.80 0.75 | |
Curian/American Funds Growth Fund | | $0 to $1 billion
Over $1 billion | | 0.85 0.80 | |
Pursuant to the administration agreement, Curian receives an annual fee, accrued daily and paid monthly, at an annual rate of 0.10% of the average daily net assets of each Fund. In return for the fees paid under the administration agreement, Curian provides or procures all necessary administrative functions and services for the operation of the Funds. Subject to the oversight of the Board, Curian is responsible for managing the Funds’ business affairs and providing day-to-day administrative services to the Funds either directly or through others selected by it for the Funds. In addition, Curian, at its own expense, arranges for legal, audit, fund accounting, transfer agency, custody (except overdraft and interest expense), printing and mailing, errors and omissions insurance and all other services necessary for the operation of each Fund. Each Fund is responsible for registration fees, interest and taxes, other non-operating expenses, independent trustee liability insurance, the fees and expenses of the independent Trustees and independent legal counsel to the independent Trustees, the costs associated with the Chief Compliance Officer and certain nonrecurring or extraordinary expenses.
Fee Waivers - Curian entered into a contractual agreement to waive 0.50% of advisory fees for Curian/American Funds Growth Fund and 0.65% of advisory fees for Curian/American Funds Global Growth Fund. None of the waived fees can be recaptured by Curian. The amount of expenses waived for each Fund during the current year is recorded as an expense waiver in each Fund’s Statement of Operations.
Other Service Providers - Curian has entered into a sub-administration and fund accounting services agreement with JFS, and is responsible for the compensation of JFS for services provided pursuant to such agreement. Curian pays JFS for such services through the fees earned pursuant to the administration agreement. The Trust has a fund compliance services agreement with JFS. Pursuant to the fund compliance services agreement, JFS provides compliance oversight services to the Trust. JPMorgan Chase Bank, N.A. (“JPM Chase”) acts as custodian for the Funds.
Distribution Agreement - The Curian/American Funds Master Feeder Funds have a Distribution Agreement, under the provisions of Rule 12b-1 under the 1940 Act, with Jackson National Life Distributors LLC (the “Distributor” or “JNLD”), an affiliate of the Adviser, for the purpose of reimbursement of certain distribution and related service expenses from the sale and distribution of each Fund’s shares. Under the Rule 12b-1 fee plan, each Fund accrues the Rule 12b-1 fee daily, at the maximum annual rate of 0.25% of the average daily net assets of the Fund, and pays the fee monthly to JNLD. Amounts charged pursuant to the Distribution Plan are reflected as 12b-1 fees in each Fund’s Statement of Operations.
Deferred Compensation Plan - The Funds adopted a Deferred Compensation Plan whereby an independent Trustee may defer the receipt of all or a portion of their compensation. These deferred amounts, which remain as liabilities of the Funds, are treated as if invested and reinvested in shares of one or more affiliated funds at the discretion of the applicable Trustee. These amounts represent general, unsecured liabilities of the Funds and vary according to the total returns of the selected Funds. Liabilities related to deferred balances are included in payable for trustee fees in the Statements of Assets and Liabilities. Increases or decreases related to the changes in value of deferred balances are included in trustee fees set forth in the Statements of Operations.
Curian Variable Series Trust Master Feeder Funds and Fund of Funds
Notes to Financial Statements
December 31, 2014
Investments in Affiliates - The Curian Guidance Funds invested solely in shares of other affiliated Funds advised by Curian or JNAM. The following table details each Fund’s long term investments in affiliates (in thousands) held during the year ended December 31, 2014.
Affiliate | | Value
Beginning
of Period | | Purchases | | Sales
Proceeds | | Distributions
from Funds | | Realized
Gain/Loss
from Sales | | Value End of
Period | |
Curian Guidance - Interest Rate Opportunities Fund | | | | | | | | | | | | | |
Curian Long Short Credit Fund | | $ | 5,016 | | $ | 4,421 | | $ | 736 | | $ | 268 | | $ | 39 | | $ | 8,264 | |
Curian/BlackRock Global Long Short Credit Fund | | 5,016 | | 3,918 | | 702 | | — | | 27 | | 8,271 | |
Curian/FAMCO Flex Core Covered Call Fund | | 1,568 | | 1,265 | | 464 | | 1 | | 45 | | 2,572 | |
Curian/UBS Global Long Short Fixed Income Opportunities Fund | | 5,017 | | 4,435 | | 833 | | — | | (20 | ) | 8,279 | |
JNL/Brookfield Global Infrastructure and MLP Fund - Class A | | 1,882 | | 1,851 | | 674 | | 104 | | 103 | | 3,103 | |
JNL/Goldman Sachs Emerging Markets Debt Fund - Class A | | 2,508 | | 2,407 | | 392 | | 163 | | (67 | ) | 4,128 | |
JNL/Invesco Global Real Estate Fund - Class A | | 2,508 | | 2,132 | | 849 | | 167 | | 49 | | 4,108 | |
JNL/PIMCO Real Return Fund - Class A | | 3,135 | | 2,418 | | 415 | | 37 | | (50 | ) | 5,187 | |
JNL/PPM America Floating Rate Income Fund - Class A | | 4,707 | | 3,905 | | 649 | | 193 | | 9 | | 7,753 | |
| | $ | 31,357 | | $ | 26,752 | | $ | 5,714 | | $ | 933 | | $ | 135 | | $ | 51,665 | |
Curian Guidance - Multi-Strategy Income Fund | | | | | | | | | | | | | |
Curian Long Short Credit Fund | | $ | 1,024 | | $ | 1,099 | | $ | 122 | | $ | 59 | | $ | 7 | | $ | 1,907 | |
Curian/BlackRock Global Long Short Credit Fund | | 1,025 | | 999 | | 123 | | — | | 5 | | 1,907 | |
Curian/DoubleLine Total Return Fund | | 2,988 | | 2,688 | | 346 | | 14 | | 13 | | 5,565 | |
Curian/FAMCO Flex Core Covered Call Fund | | 320 | | 301 | | 69 | | — | | 6 | | 595 | |
Curian/PIMCO Credit Income Fund | | 2,241 | | 1,981 | | 260 | | 2 | | 13 | | 4,175 | |
Curian/UBS Global Long Short Fixed Income Opportunities Fund | | 1,025 | | 1,095 | | 141 | | — | | (3 | ) | 1,907 | |
JNL/Brookfield Global Infrastructure and MLP Fund - Class A | | 388 | | 438 | | 114 | | 23 | | 19 | | 718 | |
JNL/Franklin Templeton Global Multisector Bond Fund -Class A | | 2,988 | | 3,166 | | 370 | | 190 | | (2 | ) | 5,560 | |
JNL/Goldman Sachs Emerging Markets Debt Fund - Class A | | 2,006 | | 2,270 | | 201 | | 141 | | (38 | ) | 3,733 | |
JNL/Invesco Global Real Estate Fund - Class A | | 512 | | 517 | | 142 | | 37 | | 9 | | 952 | |
JNL/Neuberger Berman Strategic Income Fund - Class A | | 2,241 | | 2,097 | | 255 | | 45 | | 13 | | 4,171 | |
JNL/PIMCO Real Return Fund - Class A | | 640 | | 619 | | 73 | | 8 | | (8 | ) | 1,194 | |
JNL/PPM America Floating Rate Income Fund - Class A | | 2,457 | | 2,514 | | 282 | | 109 | | 4 | | 4,569 | |
JNL/PPM America High Yield Bond Fund - Class A | | 1,494 | | 1,724 | | 199 | | 207 | | (3 | ) | 2,780 | |
| | $ | 21,349 | | $ | 21,508 | | $ | 2,697 | | $ | 835 | | $ | 35 | | $ | 39,733 | |
Curian Guidance - Equity Income Fund | | | | | | | | | | | | | |
Curian Dynamic Risk Advantage - Diversified Fund | | $ | 7,015 | | $ | 699 | | $ | 7,820 | | $ | — | | $ | 56 | | $ | — | |
Curian/Epoch Global Shareholder Yield Fund | | 16,374 | | 11,835 | | 826 | | 503 | | 123 | | 27,992 | |
Curian/FAMCO Flex Core Covered Call Fund | | 7,017 | | 6,480 | | 412 | | 3 | | 65 | | 14,063 | |
Curian/The Boston Company Equity Income Fund | | 7,019 | | 3,301 | | 417 | | 358 | | 135 | | 10,509 | |
JNL/Brookfield Global Infrastructure and MLP Fund - Class A | | 2,350 | | 1,325 | | 178 | | 117 | | 26 | | 3,526 | |
JNL/Invesco Global Real Estate Fund - Class A | | 2,339 | | 4,979 | | 673 | | 281 | | 92 | | 7,010 | |
JNL/T. Rowe Price Value Fund - Class A | | 4,679 | | 2,242 | | 252 | | 394 | | 24 | | 7,009 | |
| | $ | 46,793 | | $ | 30,863 | | $ | 10,578 | | $ | 1,656 | | $ | 521 | | $ | 70,109 | |
Curian Guidance - Conservative Fund | | | | | | | | | | | | | |
Curian Dynamic Risk Advantage - Diversified Fund | | $ | 5,820 | | $ | 5,226 | | $ | 902 | | $ | 7 | | $ | 23 | | $ | 10,507 | |
Curian/BlackRock Global Long Short Credit Fund | | 5,819 | | 5,432 | | 726 | | — | | 24 | | 10,563 | |
Curian/DoubleLine Total Return Fund | | 8,714 | | 8,922 | | 1,395 | | 45 | | 48 | | 16,906 | |
Curian/FAMCO Flex Core Covered Call Fund | | 1,173 | | 6,436 | | 805 | | 2 | | 62 | | 7,328 | |
Curian/PIMCO Credit Income Fund | | 5,868 | | 5,138 | | 1,163 | | 4 | | (13 | ) | 10,360 | |
JNL/Franklin Templeton Global Multisector Bond Fund - Class A | | 5,828 | | 9,301 | | 772 | | 481 | | (16 | ) | 13,711 | |
JNL/Goldman Sachs Emerging Markets Debt Fund - Class A | | — | | 11,673 | | 141 | | 404 | | (4 | ) | 10,352 | |
JNL/Invesco Global Real Estate Fund - Class A | | 4,663 | | 3,447 | | 4,429 | | 167 | | 296 | | 4,175 | |
JNL/Neuberger Berman Strategic Income Fund - Class A | | 8,729 | | 6,172 | | 8,422 | | 76 | | 317 | | 6,862 | |
JNL/PPM America Floating Rate Income Fund - Class A | | 5,824 | | 2,478 | | 4,631 | | 88 | | 62 | | 3,590 | |
JNL/PPM America High Yield Bond Fund - Class A | | 5,819 | | 5,311 | | 3,775 | | 508 | | 54 | | 6,850 | |
JNL/Red Rocks Listed Private Equity Fund — Class A | | — | | 4,893 | | 247 | | 453 | | (12 | ) | 4,215 | |
| | $ | 58,257 | | $ | 74,429 | | $ | 27,408 | | $ | 2,235 | | $ | 841 | | $ | 105,419 | |
Curian Guidance - Moderate Fund | | | | | | | | | | | | | |
Curian Dynamic Risk Advantage - Diversified Fund | | $ | 27,200 | | $ | 15,745 | | $ | 17,231 | | $ | 17 | | $ | 267 | | $ | 26,812 | |
Curian Long Short Credit Fund | | 3,626 | | 4,075 | | 4,350 | | 102 | | 166 | | 3,222 | |
Curian/AQR Risk Parity Fund | | 3,623 | | 3,499 | | 375 | | 232 | | 34 | | 6,796 | |
Curian/Ashmore Emerging Market Small Cap Equity Fund | | 1,096 | | 3,279 | | 756 | | 47 | | 17 | | 3,256 | |
Curian/BlackRock Global Long Short Credit Fund | | 3,627 | | 2,385 | | 2,833 | | — | | 93 | | 3,227 | |
Curian/DoubleLine Total Return Fund | | 10,871 | | 12,648 | | 2,421 | | 58 | | 36 | | 21,894 | |
Curian/Eaton Vance Global Macro Absolute Return Advantage Fund | | 4,537 | | 3,159 | | 2,590 | | — | | (52 | ) | 5,376 | |
Curian/FAMCO Flex Core Covered Call Fund | | — | | 9,194 | | 247 | | 2 | | 16 | | 9,627 | |
Curian/Franklin Templeton Frontier Markets Fund | | 1,097 | | 5,070 | | 1,923 | | 328 | | 74 | | 3,251 | |
Curian Variable Series Trust Master Feeder Funds and Fund of Funds
Notes to Financial Statements
December 31, 2014
Affiliate | | Value
Beginning
of Period | | Purchases | | Sales
Proceeds | | Distributions
from Funds | | Realized
Gain/Loss
from Sales | | Value End of
Period | |
Curian Guidance - Moderate Fund (continued) | | | | | | | | | | | | | |
Curian/Franklin Templeton Natural Resources Fund | | $ | 1,369 | | $ | 835 | | $ | 2,372 | | $ | — | | $ | 240 | | $ | — | |
Curian/Lazard International Strategic Equity Fund | | 7,637 | | 15,293 | | 900 | | 9 | | 127 | | 21,719 | |
Curian/Neuberger Berman Currency Fund | | 1,814 | | 13 | | 1,835 | | — | | (23 | ) | — | |
Curian/Neuberger Berman Risk Balanced Commodity Strategy Fund | | — | | 4,390 | | 11 | | — | | (2 | ) | 3,541 | |
Curian/Nicholas Convertible Arbitrage Fund | | 2,266 | | 5,301 | | 86 | | 179 | | (1 | ) | 7,161 | |
Curian/PIMCO Credit Income Fund | | 8,172 | | 6,557 | | 1,745 | | 5 | | (39 | ) | 13,656 | |
Curian/PineBridge Merger Arbitrage Fund | | 2,267 | | 565 | | 2,833 | | — | | (9 | ) | — | |
Curian/UBS Global Long Short Fixed Income Opportunities Fund | | 3,629 | | 3,062 | | 3,352 | | — | | (10 | ) | 3,225 | |
Curian/Van Eck International Gold Fund | | 1,389 | | 2,692 | | 766 | | 8 | | (91 | ) | 3,041 | |
JNL/AQR Managed Futures Strategy Fund — Class A | | 4,532 | | 4,535 | | 2,342 | | 574 | | (133 | ) | 6,898 | |
JNL/BlackRock Commodity Securities Strategy Fund - Class A | | 1,363 | | 2,902 | | 93 | | — | | 1 | | 3,569 | |
JNL/Boston Partners Global Long Short Equity Fund - Class A | | — | | 10,928 | | 101 | | — | | — | | 10,696 | |
JNL/Brookfield Global Infrastructure and MLP Fund - Class A | | 2,729 | | 4,723 | | 166 | | 233 | | 21 | | 7,240 | |
JNL/DFA U.S. Core Equity Fund - Class A | | 6,539 | | 7,421 | | 14,777 | | — | | 1,345 | | — | |
JNL/Franklin Templeton Global Multisector Bond Fund - Class A | | 10,887 | | 9,808 | | 2,028 | | 624 | | (57 | ) | 17,892 | |
JNL/Franklin Templeton Small Cap Value Fund - Class A | | 1,307 | | 2,726 | | 154 | | 305 | | 27 | | 3,609 | |
JNL/Goldman Sachs Emerging Markets Debt Fund - Class A | | 5,438 | | 10,640 | | 1,084 | | 527 | | (257 | ) | 13,587 | |
JNL/Invesco Global Real Estate Fund - Class A | | 2,722 | | 4,231 | | 220 | | 284 | | 9 | | 7,113 | |
JNL/Invesco International Growth Fund - Class A | | 7,638 | | 14,636 | | 244 | | 216 | | 30 | | 21,768 | |
JNL/Invesco Small Cap Growth Fund - Class A | | 1,307 | | 2,288 | | 149 | | 125 | | 33 | | 3,573 | |
JNL/JPMorgan MidCap Growth Fund - Class A | | 1,965 | | 4,674 | | 214 | | 474 | | 55 | | 6,434 | |
JNL/Lazard Emerging Markets Fund - Class A | | 4,356 | | 11,506 | | 2,321 | | 493 | | 99 | | 12,532 | |
JNL/Mellon Capital Global Alpha Fund — Class A | | 1,362 | | 435 | | 1,690 | | — | | (114 | ) | — | |
JNL/Neuberger Berman Strategic Income Fund - Class A | | 8,160 | | 5,999 | | 5,498 | | 99 | | 148 | | 8,962 | |
JNL/PPM America Floating Rate Income Fund - Class A | | 5,445 | | 4,108 | | 4,797 | | 114 | | 113 | | 4,660 | |
JNL/PPM America High Yield Bond Fund - Class A | | 5,505 | | 5,396 | | 1,145 | | 667 | | 4 | | 8,951 | |
JNL/PPM America Mid Cap Value Fund - Class A | | 1,961 | | 4,607 | | 245 | | 364 | | 62 | | 6,460 | |
JNL/Red Rocks Listed Private Equity Fund — Class A | | 4,550 | | 6,559 | | 1,189 | | 955 | | 124 | | 8,933 | |
JNL/S&P Competitive Advantage Fund - Class A | | 3,266 | | 7,715 | | 293 | | 921 | | 61 | | 10,712 | |
JNL/S&P Dividend Income & Growth Fund — Class A | | 3,265 | | 7,252 | | 179 | | 600 | | 24 | | 10,686 | |
JNL/S&P Intrinsic Value Fund - Class A | | 3,267 | | 7,551 | | 352 | | 1,062 | | 98 | | 10,724 | |
JNL/S&P Total Yield Fund - Class A | | 3,267 | | 8,150 | | 350 | | 1,378 | | 94 | | 10,816 | |
JNL/T. Rowe Price Established Growth Fund - Class A | | 6,553 | | 21,035 | | 686 | | 2,208 | | 163 | | 26,426 | |
| | $ | 181,604 | | $ | 267,587 | | $ | 86,943 | | $ | 13,210 | | $ | 2,793 | | $ | 358,045 | |
Curian Guidance - Growth Fund | | | | | | | | | | | | | |
Curian Dynamic Risk Advantage - Diversified Fund | | $ | 4,698 | | $ | 5,242 | | $ | 5,956 | | $ | 3 | | $ | 132 | | $ | 4,157 | |
Curian Long Short Credit Fund | | 939 | | 1,942 | | 1,483 | | 41 | | 48 | | 1,336 | |
Curian/AQR Risk Parity Fund | | 1,174 | | 2,603 | | 909 | | 95 | | 42 | | 2,830 | |
Curian/Ashmore Emerging Market Small Cap Equity Fund | | 517 | | 2,288 | | 384 | | 32 | | 18 | | 2,191 | |
Curian/BlackRock Global Long Short Credit Fund | | 705 | | 1,643 | | 1,016 | | — | | 30 | | 1,338 | |
Curian/DoubleLine Total Return Fund | | 939 | | 3,215 | | 89 | | 11 | | 3 | | 4,184 | |
Curian/Eaton Vance Global Macro Absolute Return Advantage Fund | | 1,174 | | 1,881 | | 804 | | — | | 4 | | 2,342 | |
Curian/FAMCO Flex Core Covered Call Fund | | — | | 5,250 | | 109 | | 1 | | 6 | | 5,470 | |
Curian/Franklin Templeton Frontier Markets Fund | | 517 | | 3,281 | | 956 | | 217 | | 44 | | 2,199 | |
Curian/Franklin Templeton Natural Resources Fund | | 470 | | 496 | | 1,039 | | — | | 92 | | — | |
Curian/Lazard International Strategic Equity Fund | | 3,617 | | 12,114 | | 712 | | 6 | | 112 | | 14,750 | |
Curian/Neuberger Berman Risk Balanced Commodity Strategy Fund | | — | | 2,659 | | 25 | | — | | (1 | ) | 2,154 | |
Curian/Nicholas Convertible Arbitrage Fund | | 587 | | 2,420 | | 218 | | 65 | | 2 | | 2,670 | |
Curian/PIMCO Credit Income Fund | | 705 | | 1,776 | | 66 | | 1 | | 3 | | 2,512 | |
Curian/UBS Global Long Short Fixed Income Opportunities Fund | | 1,174 | | 1,948 | | 1,747 | | — | | 5 | | 1,340 | |
Curian/Van Eck International Gold Fund | | 476 | | 2,563 | | 479 | | 6 | | — | | 2,252 | |
JNL/AQR Managed Futures Strategy Fund — Class A | | 939 | | 2,356 | | 538 | | 234 | | (7 | ) | 2,862 | |
JNL/BlackRock Commodity Securities Strategy Fund - Class A | | 470 | | 2,112 | | 59 | | — | | 6 | | 2,151 | |
JNL/Boston Partners Global Long Short Equity Fund - Class A | | — | | 2,868 | | 13 | | — | | — | | 2,821 | |
JNL/Brookfield Global Infrastructure and MLP Fund - Class A | | 940 | | 2,566 | | 108 | | 106 | | 19 | | 3,332 | |
JNL/DFA U.S. Core Equity Fund - Class A | | 3,101 | | 6,366 | | 9,938 | | — | | 642 | | — | |
JNL/Franklin Templeton Global Multisector BondFund - Class A | | 940 | | 2,614 | | 68 | | 114 | | — | | 3,337 | |
JNL/Franklin Templeton Small Cap Value Fund - Class A | | 620 | | 2,107 | | 42 | | 209 | | 7 | | 2,496 | |
JNL/Goldman Sachs Emerging Markets Debt Fund - Class A | | 470 | | 2,336 | | 40 | | 95 | | (7 | ) | 2,508 | |
JNL/Invesco Global Real Estate Fund - Class A | | 939 | | 2,308 | | 78 | | 129 | | 2 | | 3,308 | |
JNL/Invesco International Growth Fund - Class A | | 3,617 | | 11,632 | | 204 | | 143 | | 28 | | 14,774 | |
JNL/Invesco Small Cap Growth Fund - Class A | | 620 | | 1,840 | | 54 | | 86 | | 10 | | 2,483 | |
Curian Variable Series Trust Master Feeder Funds and Fund of Funds
Notes to Financial Statements
December 31, 2014
Affiliate | | Value
Beginning
of Period | | Purchases | | Sales
Proceeds | | Distributions
from Funds | | Realized
Gain/Loss
from Sales | | Value End of
Period | |
Curian Guidance - Growth Fund (continued) | | | | | | | | | | | | | |
JNL/JPMorgan MidCap Growth Fund - Class A | | $ | 930 | | $ | 3,491 | | $ | 86 | | $ | 313 | | $ | 19 | | $ | 4,312 | |
JNL/Lazard Emerging Markets Fund - Class A | | 2,067 | | 8,893 | | 1,688 | | 328 | | 126 | | 8,497 | |
JNL/Neuberger Berman Strategic Income Fund - Class A | | 705 | | 1,678 | | 746 | | 18 | | 40 | | 1,672 | |
JNL/PPM America Floating Rate Income Fund - Class A | | 470 | | 1,111 | | 725 | | 20 | | 9 | | 836 | |
JNL/PPM America High Yield Bond Fund - Class A | | 470 | | 1,392 | | 32 | | 123 | | (1 | ) | 1,667 | |
JNL/PPM America Mid Cap Value Fund - Class A | | 930 | | 3,399 | | 93 | | 240 | | 20 | | 4,309 | |
JNL/Red Rocks Listed Private Equity Fund — Class A | | 1,762 | | 5,057 | | 705 | | 575 | | 71 | | 5,493 | |
JNL/S&P Competitive Advantage Fund - Class A | | 1,550 | | 5,891 | | 161 | | 616 | | 24 | | 7,300 | |
JNL/S&P Dividend Income & Growth Fund — Class A | | 1,550 | | 5,710 | | 156 | | 400 | | 17 | | 7,268 | |
JNL/S&P Intrinsic Value Fund - Class A | | 1,550 | | 5,777 | | 173 | | 710 | | 35 | | 7,275 | |
JNL/S&P Total Yield Fund - Class A | | 1,550 | | 6,141 | | 151 | | 920 | | 30 | | 7,305 | |
JNL/T. Rowe Price Established Growth Fund - Class A | | 3,101 | | 16,439 | | 564 | | 1,545 | | 96 | | 18,559 | |
| | $ | 46,983 | | $ | 155,405 | | $ | 32,414 | | $ | 7,402 | | $ | 1,726 | | $ | 166,290 | |
Curian Guidance - Moderate Growth Fund | | | | | | | | | | | | | |
Curian Dynamic Risk Advantage - Diversified Fund | | $ | 39,818 | | $ | 19,822 | | $ | 35,898 | | $ | 16 | | $ | 164 | | $ | 25,187 | |
Curian Long Short Credit Fund | | 5,308 | | 5,548 | | 6,139 | | 145 | | 244 | | 4,538 | |
Curian/AQR Risk Parity Fund | | 5,303 | | 4,699 | | 511 | | 329 | | 46 | | 9,575 | |
Curian/Ashmore Emerging Market Small Cap Equity Fund | | 2,148 | | 5,442 | | 1,356 | | 81 | | 31 | | 5,603 | |
Curian/BlackRock Global Long Short Credit Fund | | 5,308 | | 3,223 | | 4,061 | | — | | 128 | | 4,543 | |
Curian/DoubleLine Total Return Fund | | 10,606 | | 9,918 | | 3,016 | | 48 | | 26 | | 18,195 | |
Curian/Eaton Vance Global Macro Absolute Return Advantage Fund | | 6,642 | | 4,183 | | 3,642 | | — | | (88 | ) | 7,565 | |
Curian/FAMCO Flex Core Covered Call Fund | | — | | 12,871 | | 256 | | 3 | | 16 | | 13,573 | |
Curian/Franklin Templeton Frontier Markets Fund | | 2,142 | | 8,658 | | 3,489 | | 567 | | 208 | | 5,601 | |
Curian/Franklin Templeton Natural Resources Fund | | 2,004 | | 1,207 | | 3,459 | | — | | 351 | | — | |
Curian/Lazard International Strategic Equity Fund | | 14,972 | | 24,660 | | 380 | | 17 | | 52 | | 38,642 | |
Curian/Neuberger Berman Currency Fund | | 2,655 | | 10 | | 2,676 | | — | | (30 | ) | — | |
Curian/Neuberger Berman Risk Balanced Commodity Strategy Fund | | — | | 6,190 | | 4 | | — | | (1 | ) | 5,000 | |
Curian/Nicholas Convertible Arbitrage Fund | | 3,317 | | 7,297 | | 78 | | 254 | | 2 | | 10,083 | |
Curian/PIMCO Credit Income Fund | | 7,957 | | 5,301 | | 2,207 | | 5 | | (106 | ) | 11,638 | |
Curian/PineBridge Merger Arbitrage Fund | | 3,319 | | 829 | | 4,149 | | — | | (7 | ) | — | |
Curian/UBS Global Long Short Fixed Income Opportunities Fund | | 5,313 | | 4,120 | | 4,728 | | — | | (20 | ) | 4,540 | |
Curian/Van Eck International Gold Fund | | 2,035 | | 3,039 | | 453 | | 12 | | (245 | ) | 4,234 | |
JNL/AQR Managed Futures Strategy Fund — Class A | | 6,638 | | 6,116 | | 3,058 | | 819 | | (42 | ) | 9,917 | |
JNL/BlackRock Commodity Securities Strategy Fund - Class A | | 1,995 | | 3,910 | | 35 | | — | | 4 | | 5,027 | |
JNL/Boston Partners Global Long Short Equity Fund - Class A | | — | | 15,319 | | 55 | | — | | — | | 15,076 | |
JNL/Brookfield Global Infrastructure and MLP Fund - Class A | | 4,012 | | 6,215 | | 40 | | 330 | | 8 | | 10,138 | |
JNL/DFA U.S. Core Equity Fund - Class A | | 12,769 | | 11,984 | | 26,217 | | — | | 2,508 | | — | |
JNL/Franklin Templeton Global Multisector Bond Fund - Class A | | 10,626 | | 7,894 | | 2,739 | | 532 | | (42 | ) | 15,116 | |
JNL/Franklin Templeton Small Cap Value Fund - Class A | | 2,552 | | 4,620 | | 67 | | 562 | | 15 | | 6,596 | |
JNL/Goldman Sachs Emerging Markets Debt Fund - Class A | | 5,306 | | 8,874 | | 1,395 | | 453 | | (372 | ) | 11,580 | |
JNL/Invesco Global Real Estate Fund - Class A | | 3,986 | | 5,664 | | 155 | | 404 | | 6 | | 10,044 | |
JNL/Invesco International Growth Fund - Class A | | 14,914 | | 24,322 | | 1 | | 387 | | — | | 38,711 | |
JNL/Invesco Small Cap Growth Fund - Class A | | 2,554 | | 3,828 | | 59 | | 232 | | 17 | | 6,543 | |
JNL/JPMorgan MidCap Growth Fund - Class A | | 3,837 | | 7,816 | | 70 | | 861 | | 21 | | 11,581 | |
JNL/Lazard Emerging Markets Fund - Class A | | 8,505 | | 19,115 | | 3,622 | | 878 | | 131 | | 22,162 | |
JNL/Mellon Capital Global Alpha Fund - Class A | | 1,995 | | 636 | | 2,472 | | — | | (166 | ) | — | |
JNL/Neuberger Berman Strategic Income Fund - Class A | | 7,962 | | 4,827 | | 5,486 | | 84 | | 118 | | 7,570 | |
JNL/PPM America Floating Rate Income Fund - Class A | | 5,313 | | 3,328 | | 4,519 | | 100 | | 106 | | 4,038 | |
JNL/PPM America High Yield Bond Fund - Class A | | 5,477 | | 4,460 | | 1,699 | | 564 | | (91 | ) | 7,563 | |
JNL/PPM America Mid Cap Value Fund - Class A | | 3,832 | | 7,639 | | 101 | | 661 | | 34 | | 11,598 | |
JNL/Red Rocks Listed Private Equity Fund — Class A | | 6,662 | | 8,863 | | 1,530 | | 1,359 | | 432 | | 12,582 | |
JNL/S&P Competitive Advantage Fund - Class A | | 6,377 | | 13,806 | | 28 | | 1,748 | | 4 | | 20,139 | |
JNL/S&P Dividend Income & Growth Fund — Class A | | 6,376 | | 13,131 | | 9 | | 1,135 | | 1 | | 20,097 | |
JNL/S&P Intrinsic Value Fund - Class A | | 6,387 | | 13,420 | | 53 | | 2,024 | | 12 | | 20,141 | |
JNL/S&P Total Yield Fund - Class A | | 6,379 | | 14,509 | | 32 | | 2,617 | | 8 | | 20,284 | |
JNL/T. Rowe Price Established Growth Fund - Class A | | 12,920 | | 37,484 | | 125 | | 4,114 | | 31 | | 49,296 | |
| | $ | 266,221 | | $ | 374,797 | | $ | 130,069 | | $ | 21,341 | | $ | 3,514 | | $ | 504,316 | |
Curian Guidance - Maximum Growth Fund | | | | | | | | | | | | | |
Curian Focused International Equity Fund | | $ | 8,065 | | $ | 4,549 | | $ | 12,825 | | $ | — | | $ | 557 | | $ | — | |
Curian Focused U.S. Equity Fund | | 6,563 | | 3,703 | | 10,479 | | — | | 719 | | — | |
Curian Long Short Credit Fund | | 1,116 | | 705 | | 949 | | 27 | | 48 | | 840 | |
Curian/AQR Risk Parity Fund | | 1,395 | | 959 | | 813 | | 54 | | 25 | | 1,552 | |
Curian/Ashmore Emerging Market Small Cap Equity Fund | | 1,157 | | 1,720 | | 587 | | 30 | | (2 | ) | 2,057 | |
Curian/BlackRock Global Long Short Credit Fund | | 837 | | 593 | | 601 | | — | | 23 | | 840 | |
Curian Variable Series Trust Master Feeder Funds and Fund of Funds
Notes to Financial Statements
December 31, 2014
Affiliate | | Value
Beginning
of Period | | Purchases | | Sales
Proceeds | | Distributions
from Funds | | Realized
Gain/Loss
from Sales | | Value End of
Period | |
Curian Guidance - Maximum Growth Fund (continued) | | | | | | | | | | | | | |
Curian/Eaton Vance Global Macro Absolute Return Advantage Fund | | $ | 1,397 | | $ | 650 | | $ | 783 | | $ | — | | $ | (36 | ) | $ | 1,321 | |
Curian/FAMCO Flex Core Covered Call Fund | | — | | 3,025 | | 32 | | 1 | | 2 | | 3,222 | |
Curian/Franklin Templeton Frontier Markets Fund | | 1,160 | | 2,967 | | 1,430 | | 211 | | 113 | | 2,063 | |
Curian/Franklin Templeton Natural Resources Fund | | 421 | | 382 | | 879 | | — | | 101 | | — | |
Curian/Lazard International Strategic Equity Fund | | 8,075 | | 6,756 | | 1,081 | | 6 | | 145 | | 13,522 | |
Curian/Neuberger Berman Risk Balanced Commodity Strategy Fund | | — | | 1,476 | | 15 | | — | | (1 | ) | 1,175 | |
Curian/Nicholas Convertible Arbitrage Fund | | 698 | | 1,267 | | 213 | | 43 | | 5 | | 1,678 | |
Curian/UBS Global Long Short Fixed Income Opportunities Fund | | 1,397 | | 725 | | 1,252 | | — | | (2 | ) | 841 | |
Curian/Van Eck International Gold Fund | | 428 | | 1,263 | | 322 | | 3 | | (13 | ) | 1,243 | |
JNL/AQR Managed Futures Strategy Fund — Class A | | 1,116 | | 941 | | 459 | | 133 | | (13 | ) | 1,631 | |
JNL/BlackRock Commodity Securities Strategy Fund - Class A | | 420 | | 978 | | 18 | | — | | 2 | | 1,192 | |
JNL/Boston Partners Global Long Short Equity Fund - Class A | | — | | 1,581 | | 13 | | — | | — | | 1,548 | |
JNL/Brookfield Global Infrastructure and MLP Fund - Class A | | 1,119 | | 841 | | 42 | | 63 | | 13 | | 1,930 | |
JNL/DFA U.S. Core Equity Fund - Class A | | 6,569 | | 3,240 | | 10,401 | | — | | 1,103 | | — | |
JNL/Franklin Templeton Small Cap Value Fund - Class A | | 1,313 | | 1,230 | | 65 | | 196 | | 11 | | 2,298 | |
JNL/Invesco Global Real Estate Fund - Class A | | 1,117 | | 777 | | 114 | | 77 | | 5 | | 1,909 | |
JNL/Invesco International Growth Fund - Class A | | — | | 14,424 | | 3 | | 139 | | — | | 13,821 | |
JNL/Invesco Small Cap Growth Fund - Class A | | 1,313 | | 952 | | 76 | | 81 | | 16 | | 2,276 | |
JNL/JPMorgan MidCap Growth Fund - Class A | | 1,973 | | 2,077 | | 129 | | 295 | | 42 | | 3,955 | |
JNL/Lazard Emerging Markets Fund - Class A | | 4,608 | | 5,850 | | 1,930 | | 313 | | 102 | | 7,888 | |
JNL/PPM America Mid Cap Value Fund - Class A | | 1,970 | | 2,000 | | 105 | | 226 | | 36 | | 3,973 | |
JNL/Red Rocks Listed Private Equity Fund — Class A | | 2,516 | | 2,141 | | 1,210 | | 337 | | 265 | | 3,115 | |
JNL/S&P Competitive Advantage Fund - Class A | | 3,281 | | 3,545 | | 130 | | 587 | | 22 | | 6,726 | |
JNL/S&P Dividend Income & Growth Fund — Class A | | 3,280 | | 3,257 | | 113 | | 379 | | 14 | | 6,687 | |
JNL/S&P Intrinsic Value Fund - Class A | | 3,282 | | 3,402 | | 168 | | 678 | | 42 | | 6,731 | |
JNL/S&P Total Yield Fund - Class A | | 3,282 | | 3,748 | | 148 | | 877 | | 38 | | 6,768 | |
JNL/T. Rowe Price Established Growth Fund - Class A | | — | | 17,886 | | 267 | | 1,422 | | 3 | | 16,943 | |
| | $ | 69,868 | | $ | 99,610 | | $ | 47,652 | | $ | 6,178 | | $ | 3,385 | | $ | 119,745 | |
Curian Guidance - Tactical Moderate Growth Fund | | | | | | | | | | | | | |
Curian Dynamic Risk Advantage - Diversified Fund | | $ | 23,525 | | $ | 6,186 | | $ | 795 | | $ | 20 | | $ | 24 | | $ | 30,203 | |
Curian Long Short Credit Fund | | 4,703 | | 2,198 | | 4,108 | | 87 | | 162 | | 2,709 | |
Curian/AQR Risk Parity Fund | | 4,694 | | 1,271 | | 447 | | 198 | | 40 | | 5,690 | |
Curian/BlackRock Global Long Short Credit Fund | | 4,703 | | 986 | | 3,039 | | — | | 79 | | 2,713 | |
Curian/Eaton Vance Global Macro Absolute Return Advantage Fund | | 5,886 | | 1,310 | | 2,923 | | — | | (100 | ) | 4,522 | |
Curian/FAMCO Flex Core Covered Call Fund | | — | | 8,651 | | 1,157 | | 2 | | 24 | | 8,130 | |
Curian/Franklin Templeton Natural Resources Fund | | 1,775 | | 818 | | 2,825 | | — | | 331 | | — | |
Curian/Neuberger Berman Currency Fund | | 2,351 | | — | | 2,351 | | — | | (31 | ) | — | |
Curian/Neuberger Berman Risk Balanced Commodity Strategy Fund | | — | | 3,702 | | 59 | | — | | (4 | ) | 2,901 | |
Curian/Nicholas Convertible Arbitrage Fund | | 2,939 | | 3,533 | | 187 | | 153 | | 5 | | 6,022 | |
Curian/PineBridge Merger Arbitrage Fund | | 2,941 | | 247 | | 3,184 | | — | | (15 | ) | — | |
Curian/UBS Global Long Short Fixed Income Opportunities Fund | | 4,710 | | 1,413 | | 3,306 | | — | | (11 | ) | 2,708 | |
Curian/Van Eck International Gold Fund | | 1,800 | | 2,026 | | 1,290 | | 7 | | (142 | ) | 2,439 | |
JNL/AQR Managed Futures Strategy Fund — Class A | | 5,887 | | 2,382 | | 2,498 | | 499 | | (47 | ) | 5,819 | |
JNL/BlackRock Commodity Securities Strategy Fund - Class A | | 1,768 | | 1,900 | | 215 | | — | | 11 | | 3,001 | |
JNL/Boston Partners Global Long Short Equity Fund - Class A | | — | | 9,218 | | 131 | | — | | (1 | ) | 8,965 | |
JNL/Brookfield Global Infrastructure and MLP Fund - Class A | | 3,553 | | 2,660 | | 218 | | 197 | | 61 | | 6,080 | |
JNL/Invesco Global Real Estate Fund - Class A | | 3,536 | | 2,506 | | 486 | | 244 | | 35 | | 6,003 | |
JNL/Mellon Capital Bond Index Fund - Class A | | 23,525 | | 21,886 | | 46,071 | | 30 | | 681 | | 750 | |
JNL/Mellon Capital Emerging Markets Index Fund - Class A | | 18,872 | | 15,197 | | 20,449 | | 64 | | (1,028 | ) | 12,021 | |
JNL/Mellon Capital Global Alpha Fund - Class A | | 1,769 | | 258 | | 1,897 | | — | | (144 | ) | — | |
JNL/Mellon Capital International Index - Class A | | 37,988 | | 34,621 | | 37,827 | | 1,053 | | 2,351 | | 32,584 | |
JNL/Mellon Capital S&P 400 Mid Cap Index Fund - Class A | | 22,603 | | 38,994 | | 7,709 | | 3,454 | | 836 | | 54,414 | |
JNL/Mellon Capital S&P 500 Index Fund - Class A | | 28,341 | | 41,392 | | 10,174 | | 813 | | 1,641 | | 65,338 | |
JNL/Mellon Capital Small Cap Index Fund — Class A | | 22,811 | | 30,544 | | 23,058 | | 302 | | (79 | ) | 30,475 | |
JNL/Red Rocks Listed Private Equity Fund — Class A | | 5,919 | | 3,926 | | 1,475 | | 826 | | 402 | | 7,541 | |
JNL/WMC Money Market Fund - Class A | | — | | 14,436 | | 14,436 | | — | | — | | — | |
| | $ | 236,599 | | $ | 252,261 | | $ | 192,315 | | $ | 7,949 | | $ | 5,081 | | $ | 301,028 | |
Curian Guidance - Tactical Maximum Growth Fund | | | | | | | | | | | | | |
Curian Long Short Credit Fund | | $ | 1,129 | | $ | 431 | | $ | 844 | | $ | 22 | | $ | 43 | | $ | 693 | |
Curian/AQR Risk Parity Fund | | 1,125 | | 712 | | 579 | | 44 | | 26 | | 1,281 | |
Curian/BlackRock Global Long Short Credit Fund | | 1,129 | | 376 | | 827 | | — | | 24 | | 693 | |
Curian/Eaton Vance Global Macro Absolute Return Advantage Fund | | 1,413 | | 450 | | 821 | | — | | (35 | ) | 1,092 | |
Curian Variable Series Trust Master Feeder Funds and Fund of Funds
Notes to Financial Statements
December 31, 2014
Affiliate | | Value
Beginning
of Period | | Purchases | | Sales
Proceeds | | Distributions
from Funds | | Realized
Gain/Loss
from Sales | | Value End of��
Period | |
Curian Guidance -Tactical Maximum Growth Fund (continued) | | | | | | | | | | | | | |
Curian/FAMCO Flex Core Covered Call Fund | | $ | — | | $ | 3,140 | | $ | 669 | | $ | 1 | | $ | 17 | | $ | 2,662 | |
Curian/Franklin Templeton Natural Resources Fund | | 429 | | 382 | | 886 | | — | | 103 | | — | |
Curian/Neuberger Berman Currency Fund | | 564 | | 3 | | 567 | | — | | (11 | ) | — | |
Curian/Neuberger Berman Risk Balanced Commodity StrategyFund | | — | | 1,249 | | 39 | | — | | (4 | ) | 971 | |
Curian/Nicholas Convertible Arbitrage Fund | | 706 | | 985 | | 249 | | 35 | | 5 | | 1,384 | |
Curian/PineBridge Merger Arbitrage Fund | | 707 | | 5 | | 710 | | — | | (5 | ) | — | |
Curian/T. Rowe Price Capital Appreciation Fund | | 17,716 | | 6,761 | | 1,497 | | 744 | | 144 | | 24,611 | |
Curian/UBS Global Long Short Fixed Income OpportunitiesFund | | 1,131 | | 453 | | 864 | | — | | (3 | ) | 693 | |
Curian/Van Eck International Gold Fund | | 435 | | 1,267 | | 638 | | 3 | | 14 | | 1,027 | |
JNL/AQR Managed Futures Strategy Fund — Class A | | 1,423 | | 741 | | 883 | | 110 | | (21 | ) | 1,303 | |
JNL/BlackRock Commodity Securities Strategy Fund - Class A | | 426 | | 971 | | 277 | | — | | 33 | | 989 | |
JNL/Boston Partners Global Long Short Equity Fund - Class A | | — | | 1,337 | | 45 | | — | | — | | 1,276 | |
JNL/Brookfield Global Infrastructure and MLP Fund - Class A | | 862 | | 845 | | 141 | | 52 | | 33 | | 1,602 | |
JNL/Franklin Templeton Small Cap Value Fund - Class A | | 1,771 | | 2,405 | | 2,193 | | 172 | | 14 | | 1,752 | |
JNL/Invesco Global Real Estate Fund - Class A | | 851 | | 762 | | 164 | | 63 | | 6 | | 1,572 | |
JNL/Invesco International Growth Fund - Class A | | 5,348 | | 5,099 | | 4,587 | | 49 | | 335 | | 5,907 | |
JNL/Invesco Small Cap Growth Fund - Class A | | 2,169 | | 2,505 | | 2,207 | | 88 | | 121 | | 2,482 | |
JNL/Ivy Asset Strategy Fund - Class A | | 17,856 | | 10,075 | | 1,088 | | 1,454 | | 149 | | 24,528 | |
JNL/JPMorgan MidCap Growth Fund - Class A | | — | | 2,089 | | 580 | | 111 | | 14 | | 1,490 | |
JNL/Lazard Emerging Markets Fund - Class A | | 2,832 | | 2,092 | | 3,109 | | 59 | | (177 | ) | 1,487 | |
JNL/Mellon Capital Global Alpha Fund - Class A | | 426 | | 3 | | 423 | | — | | (8 | ) | — | |
JNL/PPM America Mid Cap Value Fund - Class A | | — | | 2,561 | | 572 | | 85 | | 10 | | 1,991 | |
JNL/Red Rocks Listed Private Equity Fund — Class A | | 1,431 | | 1,981 | | 541 | | 278 | | 129 | | 2,568 | |
JNL/T. Rowe Price Established Growth Fund - Class A | | 5,154 | | 6,327 | | 3,787 | | 645 | | 508 | | 7,660 | |
JNL/T. Rowe Price Value Fund - Class A | | 4,132 | | 5,878 | | 3,611 | | 416 | | 462 | | 6,923 | |
JNL/WMC Money Market Fund - Class A | | — | | 1,819 | | 1,816 | | — | | — | | — | |
| | $ | 71,165 | | $ | 63,704 | | $ | 35,214 | | $ | 4,431 | | $ | 1,926 | | $ | 98,637 | |
Curian Guidance - Institutional Alt 65 Fund | | | | | | | | | | | | | |
Curian Long Short Credit Fund | | $ | 5,818 | | $ | 1,240 | | $ | 3,865 | | $ | 101 | | $ | 132 | | $ | 3,101 | |
Curian/AQR Risk Parity Fund | | 5,802 | | 1,008 | | 605 | | 228 | | 51 | | 6,445 | |
Curian/Ashmore Emerging Market Small Cap Equity Fund | | — | | 720 | | 8 | | 9 | | — | | 634 | |
Curian/BlackRock Global Long Short Credit Fund | | 5,817 | | 988 | | 3,765 | | — | | 106 | | 3,126 | |
Curian/DFA U.S. Micro Cap Fund | | 1,137 | | 283 | | 1,393 | | — | | 269 | | — | |
Curian/DoubleLine Total Return Fund | | 3,907 | | 755 | | 1,629 | | 9 | | 75 | | 3,273 | �� |
Curian/Eaton Vance Global Macro Absolute Return AdvantageFund | | 7,279 | | 1,091 | | 3,695 | | — | | (114 | ) | 4,975 | |
Curian/FAMCO Flex Core Covered Call Fund | | 3,658 | | 5,516 | | 561 | | 2 | | 42 | | 9,377 | |
Curian/Franklin Templeton Frontier Markets Fund | | 1,136 | | 332 | | 742 | | 65 | | 162 | | 603 | |
Curian/Franklin Templeton Natural Resources Fund | | 2,212 | | 825 | | 3,329 | | — | | 421 | | — | |
Curian/Lazard International Strategic Equity Fund | | — | | 4,712 | | 124 | | 2 | | (2 | ) | 4,524 | |
Curian/Neuberger Berman Currency Fund | | 2,907 | | 2 | | 2,920 | | — | | (37 | ) | — | |
Curian/Neuberger Berman Risk Balanced Commodity StrategyFund | | — | | 4,031 | | 69 | | — | | (4 | ) | 3,113 | |
Curian/Nicholas Convertible Arbitrage Fund | | 3,636 | | 3,396 | | 256 | | 167 | | 9 | | 6,492 | |
Curian/PIMCO Credit Income Fund | | — | | 2,063 | | 133 | | 1 | | 1 | | 1,962 | |
Curian/PineBridge Merger Arbitrage Fund | | 3,638 | | 777 | | 4,395 | | — | | (26 | ) | — | |
Curian/UBS Global Long Short Fixed Income OpportunitiesFund | | 5,825 | | 1,219 | | 3,807 | | — | | (12 | ) | 3,108 | |
Curian/Van Eck International Gold Fund | | 2,236 | | 1,330 | | 941 | | 7 | | (243 | ) | 2,494 | |
JNL/AQR Managed Futures Strategy Fund — Class A | | 7,334 | | 2,479 | | 2,968 | | 582 | | 49 | | 6,887 | |
JNL/BlackRock Commodity Securities Strategy Fund - Class A | | 2,192 | | 1,635 | | 156 | | — | | 21 | | 3,169 | |
JNL/Boston Partners Global Long Short Equity Fund - Class A | | — | | 10,447 | | 285 | | — | | (7 | ) | 10,015 | |
JNL/Brookfield Global Infrastructure and MLP Fund - Class A | | 3,717 | | 3,243 | | 297 | | 224 | | 86 | | 6,649 | |
JNL/Franklin Templeton Global Multisector BondFund - Class A | | 7,285 | | 1,469 | | 6,187 | | 93 | | 257 | | 2,572 | |
JNL/Franklin Templeton International Small Cap GrowthFund - Class A | | 1,135 | | 249 | | 1,348 | | — | | 213 | | — | |
JNL/Franklin Templeton Small Cap Value Fund - Class A | | 1,685 | | 490 | | 1,311 | | 69 | | 337 | | 798 | |
JNL/Goldman Sachs Emerging Markets Debt Fund - Class A | | — | | 2,190 | | 76 | | 77 | | (1 | ) | 1,882 | |
JNL/Invesco Global Real Estate Fund - Class A | | 3,650 | | 3,430 | | 696 | | 280 | | 87 | | 6,863 | |
JNL/Invesco International Growth Fund - Class A | | 6,257 | | 1,195 | | 2,963 | | 47 | | 624 | | 4,552 | |
JNL/Invesco Small Cap Growth Fund - Class A | | 1,697 | | 423 | | 1,398 | | 29 | | 390 | | 800 | |
JNL/JPMorgan MidCap Growth Fund - Class A | | — | | 1,607 | | 79 | | 111 | | (1 | ) | 1,463 | |
JNL/Lazard Emerging Markets Fund - Class A | | 1,684 | | 1,270 | | 203 | | 104 | | 5 | | 2,477 | |
JNL/Mellon Capital Global Alpha Fund - Class A | | 2,192 | | 310 | | 2,340 | | — | | (185 | ) | — | |
JNL/Neuberger Berman Strategic Income Fund - Class A | | — | | 1,387 | | 69 | | 15 | | — | | 1,306 | |
JNL/PPM America Floating Rate Income Fund - Class A | | 1,119 | | 244 | | 705 | | 16 | | 20 | | 650 | |
Curian Variable Series Trust Master Feeder Funds and Fund of Funds
Notes to Financial Statements
December 31, 2014
Affiliate | | Value
Beginning
of Period | | Purchases | | Sales
Proceeds | | Distributions
from Funds | | Realized
Gain/Loss
from Sales | | Value End of
Period | |
Curian Guidance - Institutional Alt 65 Fund (continued) | | | | | | | | | | | | | |
JNL/PPM America High Yield Bond Fund - Class A | | $ | 1,134 | | $ | 318 | | $ | 71 | | $ | 96 | | $ | (1 | ) | $ | 1,281 | |
JNL/PPM America Mid Cap Value Fund - Class A | | — | | 1,596 | | 83 | | 85 | | (2 | ) | 1,469 | |
JNL/Red Rocks Listed Private Equity Fund — Class A | | 5,157 | | 4,759 | | 374 | | 948 | | 93 | | 8,615 | |
JNL/S&P Competitive Advantage Fund - Class A | | — | | 2,644 | | 151 | | 215 | | (2 | ) | 2,414 | |
JNL/S&P Dividend Income & Growth Fund — Class A | | — | | 2,553 | | 135 | | 138 | | (1 | ) | 2,387 | |
JNL/S&P Intrinsic Value Fund - Class A | | — | | 2,680 | | 150 | | 249 | | (2 | ) | 2,418 | |
JNL/S&P Total Yield Fund - Class A | | — | | 2,744 | | 115 | | 321 | | (4 | ) | 2,413 | |
JNL/T. Rowe Price Established Growth Fund - Class A | | 5,689 | | 1,513 | | 1,296 | | 501 | | 379 | | 5,948 | |
JNL/T. Rowe Price Value Fund - Class A | | 5,634 | | 693 | | 6,915 | | — | | 1,675 | | — | |
| | $ | 112,569 | | $ | 81,856 | | $ | 62,608 | | $ | 4,791 | | $ | 4,860 | | $ | 130,255 | |
Curian Guidance - Alt 100 Conservative Fund | | | | | | | | | | | | | |
Curian Long Short Credit Fund | | $ | 1,472 | | $ | 1,556 | | $ | 1,315 | | $ | 51 | | $ | 74 | | $ | 1,642 | |
Curian/AQR Risk Parity Fund | | 1,471 | | 2,092 | | 325 | | 108 | | 27 | | 3,237 | |
Curian/BlackRock Global Long Short Credit Fund | | 1,840 | | 1,236 | | 1,454 | | — | | 51 | | 1,645 | |
Curian/Eaton Vance Global Macro Absolute Return AdvantageFund | | 1,473 | | 1,580 | | 572 | | — | | 10 | | 2,595 | |
Curian/FAMCO Flex Core Covered Call Fund | | — | | 3,445 | | 445 | | 1 | | 23 | | 3,225 | |
Curian/Neuberger Berman Currency Fund | | 1,472 | | 1,101 | | 793 | | — | | (9 | ) | 1,829 | |
Curian/Neuberger Berman Risk Balanced Commodity StrategyFund | | — | | 1,613 | | 677 | | — | | (55 | ) | 721 | |
Curian/Nicholas Convertible Arbitrage Fund | | 1,471 | | 2,723 | | 813 | | 80 | | 12 | | 3,246 | |
Curian/PineBridge Merger Arbitrage Fund | | 1,656 | | 855 | | 2,506 | | — | | (8 | ) | — | |
Curian/The Boston Company Multi Alpha Market NeutralEquity Fund | | 737 | | 256 | | 974 | | — | | (8 | ) | — | |
Curian/UBS Global Long Short Fixed Income OpportunitiesFund | | 1,105 | | 1,911 | | 1,315 | | — | | (1 | ) | 1,646 | |
JNL/AQR Managed Futures Strategy Fund — Class A | | 1,839 | | 2,145 | | 806 | | 265 | | (6 | ) | 3,263 | |
JNL/BlackRock Commodity Securities Strategy Fund - Class A | | — | | 888 | | 23 | | — | | (3 | ) | 732 | |
JNL/Boston Partners Global Long Short Equity Fund - Class A | | — | | 6,851 | | 324 | | — | | (2 | ) | 6,451 | |
JNL/Brookfield Global Infrastructure and MLP Fund - Class A | | 554 | | 2,167 | | 475 | | 70 | | 62 | | 2,224 | |
JNL/Invesco Global Real Estate Fund - Class A | | 552 | | 2,034 | | 525 | | 84 | | 19 | | 2,166 | |
JNL/Mellon Capital Global Alpha Fund - Class A | | 1,845 | | 1,130 | | 2,877 | | — | | (103 | ) | — | |
JNL/Red Rocks Listed Private Equity Fund — Class A | | 923 | | 1,375 | | 291 | | 190 | | 9 | | 1,819 | |
| | $ | 18,410 | | $ | 34,958 | | $ | 16,510 | | $ | 849 | | $ | 92 | | $ | 36,441 | |
Curian Guidance - Alt 100 Moderate Fund | | | | | | | | | | | | | |
Curian Long Short Credit Fund | | $ | 23,082 | | $ | 8,939 | | $ | 19,104 | | $ | 405 | | $ | 696 | | $ | 12,541 | |
Curian/AQR Risk Parity Fund | | 22,952 | | 4,833 | | 1,956 | | 932 | | 151 | | 26,718 | |
Curian/BlackRock Global Long Short Credit Fund | | 23,047 | | 3,360 | | 14,138 | | — | | 362 | | 12,572 | |
Curian/Eaton Vance Global Macro Absolute Return AdvantageFund | | 28,842 | | 4,581 | | 13,635 | | — | | (422 | ) | 20,980 | |
Curian/FAMCO Flex Core Covered Call Fund | | — | | 37,044 | | 1,616 | | 9 | | 97 | | 38,570 | |
Curian/Franklin Templeton Natural Resources Fund | | 8,815 | | 3,074 | | 13,031 | | — | | 1,708 | | — | |
Curian/Neuberger Berman Currency Fund | | 11,495 | | 69 | | 11,612 | | — | | (166 | ) | — | |
Curian/Neuberger Berman Risk Balanced Commodity StrategyFund | | — | | 17,143 | | 268 | | — | | (11 | ) | 13,406 | |
Curian/Nicholas Convertible Arbitrage Fund | | 14,399 | | 14,191 | | 591 | | 688 | | 23 | | 26,836 | |
Curian/PineBridge Merger Arbitrage Fund | | 14,409 | | 866 | | 15,275 | | — | | (20 | ) | — | |
Curian/UBS Global Long Short Fixed Income OpportunitiesFund | | 23,096 | | 5,242 | | 15,277 | | — | | (176 | ) | 12,551 | |
Curian/Van Eck International Gold Fund | | 8,759 | | 4,937 | | 2,628 | | 29 | | (1,174 | ) | 10,637 | |
JNL/AQR Managed Futures Strategy Fund — Class A | | 29,423 | | 9,602 | | 11,059 | | 2,374 | | 333 | | 28,189 | |
JNL/BlackRock Commodity Securities Strategy Fund - Class A | | 8,730 | | 7,345 | | 280 | | — | | 33 | | 13,741 | |
JNL/Boston Partners Global Long Short Equity Fund - Class A | | — | | 42,895 | | 642 | | — | | (11 | ) | 41,670 | |
JNL/Brookfield Global Infrastructure and MLP Fund - Class A | | 17,816 | | 10,920 | | 1,186 | | 916 | | 298 | | 28,084 | |
JNL/Invesco Global Real Estate Fund - Class A | | 17,401 | | 10,651 | | 2,218 | | 1,140 | | 287 | | 27,991 | |
JNL/Mellon Capital Global Alpha Fund - Class A | | 8,715 | | 1,017 | | 9,096 | | — | | (722 | ) | — | |
JNL/Red Rocks Listed Private Equity Fund — Class A | | 29,629 | | 16,941 | | 7,533 | | 3,843 | | 1,983 | | 35,181 | |
| | $ | 290,610 | | $ | 203,650 | | $ | 141,145 | | $ | 10,336 | | $ | 3,269 | | $ | 349,667 | |
Curian Guidance - Alt 100 Growth Fund | | | | | | | | | | | | | |
Curian Long Short Credit Fund | | $ | 3,080 | | $ | 4,483 | | $ | 3,841 | | $ | 115 | | $ | 155 | | $ | 3,557 | |
Curian/AQR Risk Parity Fund | | 3,850 | | 5,699 | | 2,250 | | 251 | | 53 | | 7,198 | |
Curian/BlackRock Global Long Short Credit Fund | | 2,310 | | 3,769 | | 2,549 | | — | | 92 | | 3,559 | |
Curian/Eaton Vance Global Macro Absolute Return AdvantageFund | | 3,851 | | 4,224 | | 2,169 | | — | | (8 | ) | 6,156 | |
Curian/FAMCO Flex Core Covered Call Fund | | — | | 13,522 | | 201 | | 3 | | 14 | | 14,267 | |
Curian/Franklin Templeton Natural Resources Fund | | 1,541 | | 1,245 | | 3,042 | | — | | 318 | | — | |
Curian/Neuberger Berman Risk Balanced Commodity StrategyFund | | — | | 6,495 | | 4 | | — | | (1 | ) | 5,245 | |
Curian Variable Series Trust Master Feeder Funds and Fund of Funds
Notes to Financial Statements
December 31, 2014
Affiliate | | Value
Beginning
of Period | | Purchases | | Sales
Proceeds | | Distributions
from Funds | | Realized
Gain/Loss
from Sales | | Value End of
Period | |
Curian Guidance - Alt 100 Growth Fund (continued) | | | | | | | | | | | | | |
Curian/Nicholas Convertible Arbitrage Fund | | $ | 1,925 | | $ | 6,664 | | $ | 588 | | $ | 196 | | $ | 4 | | $ | 7,650 | |
Curian/UBS Global Long Short Fixed Income OpportunitiesFund | | 3,851 | | 4,439 | | 4,632 | | — | | 14 | | 3,553 | |
Curian/Van Eck International Gold Fund | | 1,564 | | 5,290 | | 594 | | 15 | | (83 | ) | 5,492 | |
JNL/AQR Managed Futures Strategy Fund — Class A | | 3,080 | | 5,770 | | 1,615 | | 626 | | (19 | ) | 7,478 | |
JNL/BlackRock Commodity Securities Strategy Fund - Class A | | 1,541 | | 4,861 | | 116 | | — | | 1 | | 5,369 | |
JNL/Boston Partners Global Long Short Equity Fund - Class A | | — | | 7,337 | | 66 | | — | | (1 | ) | 7,193 | |
JNL/Brookfield Global Infrastructure and MLP Fund - Class A | | 3,081 | | 5,805 | | 71 | | 285 | | 6 | | 8,688 | |
JNL/Invesco Global Real Estate Fund - Class A | | 3,081 | | 5,252 | | 125 | | 350 | | (2 | ) | 8,638 | |
JNL/Red Rocks Listed Private Equity Fund — Class A | | 5,777 | | 12,156 | | 2,243 | | 1,536 | | 206 | | 14,096 | |
| | $ | 38,532 | | $ | 97,011 | | $ | 24,106 | | $ | 3,377 | | $ | 749 | | $ | 108,139 | |
Curian Guidance - International Conservative Fund | | | | | | | | | | | | | |
Curian/Baring International Fixed Income Fund | | $ | 871 | | $ | 1,664 | | $ | 209 | | $ | 3 | | $ | 3 | | $ | 2,223 | |
Curian/CenterSquare International REIT Fund | | 194 | | 359 | | 48 | | 15 | | 2 | | 490 | |
Curian/Lazard International Strategic Equity Fund | | 155 | | 271 | | 29 | | — | | 4 | | 391 | |
Curian/Neuberger Berman Currency Fund | | 194 | | 203 | | 156 | | — | | (1 | ) | 246 | |
JNL/Goldman Sachs Emerging Markets Debt Fund - Class A | | 290 | | 568 | | 46 | | 28 | | (6 | ) | 739 | |
JNL/Invesco International Growth Fund - Class A | | 155 | | 541 | | 47 | | 6 | | 6 | | 636 | |
JNL/Lazard Emerging Markets Fund - Class A | | 77 | | 156 | | 18 | | 8 | | 1 | | 197 | |
| | $ | 1,936 | | $ | 3,762 | | $ | 553 | | $ | 60 | | $ | 9 | | $ | 4,922 | |
Curian Guidance - International Moderate Fund | | | | | | | | | | | | | |
Curian/Aberdeen Latin America Fund | | $ | 158 | | $ | 65 | | $ | 235 | | $ | — | | $ | 7 | | $ | — | |
Curian/Ashmore Emerging Market Small Cap Equity Fund | | 317 | | 534 | | 116 | | 10 | | 9 | | 666 | |
Curian/Baring International Fixed Income Fund | | 1,313 | | 2,070 | | 505 | | 4 | | 10 | | 2,762 | |
Curian/CenterSquare International REIT Fund | | 263 | | 415 | | 115 | | 17 | | 5 | | 549 | |
Curian/Franklin Templeton Frontier Markets Fund | | 264 | | 527 | | 94 | | 58 | | 8 | | 553 | |
Curian/Lazard International Strategic Equity Fund | | 421 | | 1,453 | | 314 | | 1 | | 32 | | 1,537 | |
Curian/Neuberger Berman Currency Fund | | 157 | | 230 | | 65 | | — | | — | | 331 | |
Curian/Schroder Emerging Europe Fund | | 158 | | 76 | | 218 | | — | | (11 | ) | — | |
JNL/Eastspring Investments Asia ex-Japan Fund - Class A | | 315 | | 384 | | 168 | | 5 | | 8 | | 550 | |
JNL/Eastspring Investments China-India Fund - Class A | | 158 | | 60 | | 218 | | — | | 8 | | — | |
JNL/Goldman Sachs Emerging Markets Debt Fund - Class A | | 788 | | 1,255 | | 230 | | 66 | | (32 | ) | 1,651 | |
JNL/Invesco International Growth Fund - Class A | | 684 | | 1,175 | | 305 | | 16 | | 36 | | 1,538 | |
JNL/Lazard Emerging Markets Fund - Class A | | 263 | | 865 | | 159 | | 34 | | 7 | | 880 | |
| | $ | 5,259 | | $ | 9,109 | | $ | 2,742 | | $ | 211 | | $ | 87 | | $ | 11,017 | |
Curian Guidance - International Growth Fund | | | | | | | | | | | | | |
Curian/Aberdeen Latin America Fund | | $ | 329 | | $ | 125 | | $ | 472 | | $ | — | | $ | 8 | | $ | — | |
Curian/Ashmore Emerging Market Small Cap Equity Fund | | 472 | | 566 | | 131 | | 12 | | 11 | | 817 | |
Curian/Baring International Fixed Income Fund | | 656 | | 774 | | 244 | | 1 | | 3 | | 1,136 | |
Curian/CenterSquare International REIT Fund | | 236 | | 255 | | 78 | | 12 | | 4 | | 402 | |
Curian/Franklin Templeton Frontier Markets Fund | | 284 | | 422 | | 81 | | 51 | | 8 | | 494 | |
Curian/Lazard International Strategic Equity Fund | | 471 | | 1,334 | | 252 | | 1 | | 33 | | 1,522 | |
Curian/Neuberger Berman Currency Fund | | 141 | | 153 | | 58 | | — | | — | | 243 | |
Curian/Schroder Emerging Europe Fund | | 187 | | 85 | | 253 | | — | | (11 | ) | — | |
JNL/Eastspring Investments Asia ex-Japan Fund - Class A | | 377 | | 349 | | 178 | | 6 | | 10 | | 567 | |
JNL/Eastspring Investments China-India Fund - Class A | | 236 | | 78 | | 312 | | — | | 12 | | — | |
JNL/Goldman Sachs Emerging Markets Debt Fund - Class A | | 281 | | 339 | | 86 | | 19 | | (14 | ) | 486 | |
JNL/Invesco International Growth Fund - Class A | | 707 | | 1,108 | | 264 | | 16 | | 36 | | 1,525 | |
JNL/Lazard Emerging Markets Fund - Class A | | 329 | | 833 | | 184 | | 36 | | 11 | | 887 | |
| | $ | 4,706 | | $ | 6,421 | | $ | 2,593 | | $ | 154 | | $ | 111 | | $ | 8,079 | |
Curian Guidance - Equity 100 Fund | | | | | | | | | | | | | |
Curian/Ashmore Emerging Market Small Cap Equity Fund | | $ | — | | $ | 1,929 | | $ | 31 | | $ | 25 | | $ | (2 | ) | $ | 1,701 | |
Curian/Franklin Templeton Frontier Markets Fund | | — | | 2,252 | | 17 | | 174 | | (3 | ) | 1,702 | |
Curian/Lazard International Strategic Equity Fund | | — | | 12,256 | | 374 | | 5 | | 6 | | 11,731 | |
JNL/DFA U.S. Core Equity Fund - Class A | | — | | 9,639 | | 9,737 | | — | | 97 | | — | |
JNL/Franklin Templeton Small Cap Value Fund - Class A | | 4,379 | | 5,402 | | 7,392 | | 176 | | 131 | | 2,027 | |
JNL/Invesco International Growth Fund - Class A | | 4,895 | | 11,528 | | 4,515 | | 118 | | 346 | | 11,747 | |
JNL/Invesco Small Cap Growth Fund - Class A | | 5,410 | | 4,531 | | 7,933 | | 72 | | 266 | | 2,011 | |
JNL/JPMorgan MidCap Growth Fund - Class A | | — | | 4,438 | | 867 | | 265 | | 7 | | 3,524 | |
JNL/Lazard Emerging Markets Fund - Class A | | 7,729 | | 6,946 | | 6,644 | | 268 | | (526 | ) | 6,732 | |
JNL/Mellon Capital International Index - Class A | | 4,637 | | 9,583 | | 14,580 | | — | | 586 | | — | |
JNL/Mellon Capital S&P 400 Mid Cap Index Fund - Class A | | — | | 3,632 | | 3,804 | | — | | 171 | | — | |
JNL/Mellon Capital S&P 500 Index Fund - Class A | | 14,427 | | 6,179 | | 21,805 | | — | | 2,646 | | — | |
JNL/PPM America Mid Cap Value Fund - Class A | | — | | 4,442 | | 907 | | 203 | | 6 | | 3,529 | |
JNL/S&P Competitive Advantage Fund - Class A | | — | | 6,525 | | 304 | | 528 | | 9 | | 6,040 | |
JNL/S&P Dividend Income & Growth Fund — Class A | | — | | 6,354 | | 254 | | 344 | | 6 | | 6,027 | |
JNL/S&P Intrinsic Value Fund - Class A | | — | | 6,596 | | 315 | | 604 | | 13 | | 6,026 | |
JNL/S&P Total Yield Fund - Class A | | — | | 6,825 | | 247 | | 788 | | 7 | | 6,061 | |
Curian Variable Series Trust Master Feeder Funds and Fund of Funds
Notes to Financial Statements
December 31, 2014
Affiliate | | Value
Beginning
of Period | | Purchases | | Sales
Proceeds | | Distributions
from Funds | | Realized
Gain/Loss
from Sales | | Value End of
Period | |
Curian Guidance - Equity 100 Fund (continued) | | | | | | | | | | | | | |
JNL/T. Rowe Price Established Growth Fund - Class A | | $ | 6,183 | | $ | 12,208 | | $ | 3,210 | | $ | 1,260 | | $ | 376 | | $ | 15,085 | |
JNL/T. Rowe Price Value Fund - Class A | | 3,864 | | 9,090 | | 13,907 | | — | | 974 | | — | |
| | $ | 51,524 | | $ | 130,355 | | $ | 96,843 | | $ | 4,830 | | $ | 5,116 | | $ | 83,943 | |
Curian Guidance - Fixed Income 100 Fund | | | | | | | | | | | | | |
Curian/DoubleLine Total Return Fund | | $ | — | | $ | 12,460 | | $ | 585 | | $ | 32 | | $ | 14 | | $ | 12,089 | |
Curian/PIMCO Credit Income Fund | | 6,991 | | 11,238 | | 11,693 | | 3 | | 319 | | 7,254 | |
JNL/Franklin Templeton Global Multisector BondFund - Class A | | — | | 10,566 | | 369 | | 335 | | (3 | ) | 9,659 | |
JNL/Goldman Sachs Emerging Markets Debt Fund - Class A | | 233 | | 8,125 | | 271 | | 280 | | (25 | ) | 7,236 | |
JNL/JPMorgan U.S. Government & Quality BondFund - Class A | | 3,495 | | 2,405 | | 6,010 | | — | | (94 | ) | — | |
JNL/Mellon Capital Bond Index Fund - Class A | | 3,496 | | 4,945 | | 8,622 | | — | | 66 | | — | |
JNL/Neuberger Berman Strategic Income Fund - Class A | | — | | 5,006 | | 131 | | 53 | | — | | 4,833 | |
JNL/PIMCO Real Return Fund - Class A | | — | | 444 | | 447 | | — | | 3 | | — | |
JNL/PPM America Floating Rate Income Fund - Class A | | 2,334 | | 3,043 | | 2,905 | | 59 | | 45 | | 2,416 | |
JNL/PPM America High Yield Bond Fund - Class A | | 2,571 | | 3,963 | | 1,290 | | 360 | | 2 | | 4,826 | |
JNL/T. Rowe Price Short-Term Bond Fund — Class A | | 4,198 | | 2,903 | | 7,134 | | — | | (1 | ) | — | |
| | $ | 23,318 | | $ | 65,098 | | $ | 39,457 | | $ | 1,122 | | $ | 326 | | $ | 48,313 | |
Curian Guidance - Real Assets Fund | | | | | | | | | | | | | |
Curian/CenterSquare International REIT Fund | | $ | 423 | | $ | 1,038 | | $ | 290 | | $ | 35 | | $ | 7 | | $ | 1,130 | |
Curian/Eaton Vance Global Macro Absolute Return AdvantageFund | | 528 | | 833 | | 282 | | — | | 5 | | 1,132 | |
Curian/Franklin Templeton Natural Resources Fund | | 529 | | 263 | | 852 | | — | | 82 | | — | |
Curian/Neuberger Berman Currency Fund | | 528 | | 596 | | 576 | | — | | (2 | ) | 566 | |
Curian/Neuberger Berman Risk Balanced Commodity StrategyFund | | — | | 2,273 | | 136 | | — | | (18 | ) | 1,686 | |
Curian/Van Eck International Gold Fund | | 375 | | 1,068 | | 366 | | 3 | | (24 | ) | 914 | |
JNL/BlackRock Commodity Securities Strategy Fund - Class A | | 951 | | 1,671 | | 611 | | — | | 27 | | 1,688 | |
JNL/Brookfield Global Infrastructure and MLP Fund - Class A | | 898 | | 1,525 | | 481 | | 66 | | 71 | | 1,922 | |
JNL/Invesco Global Real Estate Fund - Class A | | 422 | | 979 | | 335 | | 48 | | 19 | | 1,126 | |
JNL/PIMCO Real Return Fund - Class A | | 633 | | 943 | | 445 | | 9 | | (58 | ) | 1,133 | |
| | $ | 5,287 | | $ | 11,189 | | $ | 4,374 | | $ | 161 | | $ | 109 | | $ | 11,297 | |
NOTE 5. BORROWING ARRANGEMENTS
The Trust entered into a Syndicated Credit Agreement (“SCA”) with a group of lenders. The Funds participate in the SCA with other funds managed by JNAM and Curian in a credit facility which is available solely to finance shareholder redemptions or for other temporary or emergency purposes. Effective June 6, 2014, the Funds may borrow up to the lesser of $450,000,000, the amount available under the facility; the limits set for borrowing by the Funds’ prospectuses and the 1940 Act; or an amount prescribed within the SCA. Prior to June 6, 2014, the amount available under the facility was $300,000,000. Also effective June 6, 2014, Curian/American Funds Global Growth Fund was added to the SCA. Prior to this date, the Fund did not participate in the SCA. Interest on borrowings is payable at the Federal Funds Rate plus the amount by which the one month London Interbank Offer Rate (“LIBOR”) exceeds the Federal Funds rate plus 1.00% on an annualized basis. The Funds pay an annual fee of 0.075% of the available commitments and an annual administration fee to JPM Chase. These expenses are allocated to the participating Funds based on each Fund’s net assets as a percentage of the participating Funds’ total net assets and are included in other expenses in each Fund’s Statement of Operations. No amounts were borrowed under the facility during the year.
NOTE 6. INCOME TAX MATTERS
Each Fund is a separate taxpayer for federal income tax purposes. Each Fund intends to qualify as a regulated investment company (“RIC”) and to distribute substantially all net investment income and net capital gains, if any, to its shareholders and otherwise comply with Subchapter M of the Internal Revenue Code of 1986, as amended, applicable to regulated investment companies. Therefore, no federal income tax provision is required. Under current tax law, interest, dividends and capital gains paid by the Funds are not currently taxable to shareholders when left to accumulate within a variable annuity contract or variable life insurance policies.
Curian Variable Series Trust Master Feeder Funds and Fund of Funds
Notes to Financial Statements
December 31, 2014
The following information is presented on an income tax basis (in thousands). Differences between amounts for financial statements and federal income tax purposes are primarily due to timing and character differences in recognizing certain gains and losses on investment transactions. Permanent differences between financial statement and federal income tax reporting are reclassified within the capital accounts based on their federal income tax treatment. Temporary differences do not require reclassification. Permanent differences may include but are not limited to the following: net operating losses, consent dividends and distribution adjustments. These reclassifications have no impact on net assets.
| | Net Increase (Decrease) | |
| | Undistributed
Net Investment
Income | | Accumulated
Net Realized
Gain (Loss) | | Paid-in Capital | |
Curian Guidance - Interest Rate Opportunities Fund | | $ | 117 | | $ | (117 | ) | $ | — | |
Curian Guidance - Multi-Strategy Income Fund | | 65 | | (65 | ) | — | |
Curian Guidance - Equity Income Fund | | 738 | | (738 | ) | — | |
Curian Guidance - Conservative Fund | | 110 | | (110 | ) | — | |
Curian Guidance - Moderate Fund | | 3,608 | | (3,608 | ) | — | |
Curian Guidance - Growth Fund | | 2,214 | | (2,214 | ) | — | |
Curian Guidance - Moderate Growth Fund | | 6,402 | | (6,402 | ) | — | |
Curian Guidance - Maximum Growth Fund | | 2,001 | | (2,001 | ) | — | |
Curian Guidance - Tactical Moderate Growth Fund | | 712 | | (712 | ) | — | |
Curian Guidance - Tactical Maximum Growth Fund | | 882 | | (882 | ) | — | |
Curian Guidance - Institutional Alt 65 Fund | | 1,214 | | (1,214 | ) | — | |
Curian Guidance - Alt 100 Conservative Fund | | 223 | | (223 | ) | — | |
Curian Guidance - Alt 100 Moderate Fund | | 2,082 | | (2,082 | ) | — | |
Curian Guidance - Alt 100 Growth Fund | | 567 | | (567 | ) | — | |
Curian Guidance - International Conservative Fund | | 4 | | (4 | ) | — | |
Curian Guidance - International Moderate Fund | | 42 | | (42 | ) | — | |
Curian Guidance - International Growth Fund | | 36 | | (36 | ) | — | |
Curian Guidance - Equity 100 Fund | | 1,677 | | (1,677 | ) | — | |
Curian Guidance - Fixed Income 100 Fund | | 77 | | (77 | ) | — | |
Curian Guidance - Real Assets Fund | | 25 | | (25 | ) | — | |
| | | | | | | | | | |
At December 31, 2014, the Funds had no net capital loss carryforwards available for U.S. federal income tax purposes to offset future net realized capital gains.
At December 31, 2014, the Funds did not elect to defer capital losses realized after October 31, 2014 (“Post-October losses”).
As of December 31, 2014, the cost of investments and the components of net unrealized appreciation/(depreciation) (in thousands) were as follows:
| | Tax Cost of
Investments | | Gross
Unrealized
Appreciation | | Gross
Unrealized
Depreciation | | Net Unrealized
Appreciation/
(Depreciation) | |
Curian Guidance - Interest Rate Opportunities Fund | | $ | 53,065 | | $ | 694 | | $ | (2,094 | ) | $ | (1,400 | ) |
Curian Guidance - Multi-Strategy Income Fund | | 40,595 | | 685 | | (1,547 | ) | (862 | ) |
Curian Guidance - Equity Income Fund | | 65,722 | | 4,883 | | (496 | ) | 4,387 | |
Curian Guidance - Conservative Fund | | 106,655 | | 2,213 | | (3,449 | ) | (1,236 | ) |
Curian Guidance - Moderate Fund | | 361,684 | | 9,316 | | (12,955 | ) | (3,639 | ) |
Curian Guidance - Growth Fund | | 169,981 | | 3,102 | | (6,793 | ) | (3,691 | ) |
Curian Guidance - Moderate Growth Fund | | 505,802 | | 16,393 | | (17,879 | ) | (1,486 | ) |
Curian Guidance - Maximum Growth Fund | | 120,627 | | 4,023 | | (4,905 | ) | (882 | ) |
Curian Guidance - Tactical Moderate Growth Fund | | 297,105 | | 10,801 | | (6,878 | ) | 3,923 | |
Curian Guidance - Tactical Maximum Growth Fund | | 97,504 | | 3,613 | | (2,480 | ) | 1,133 | |
Curian Guidance - Institutional Alt 65 Fund | | 131,461 | | 4,259 | | (5,465 | ) | (1,206 | ) |
Curian Guidance - Alt 100 Conservative Fund | | 36,929 | | 619 | | (1,107 | ) | (488 | ) |
Curian Guidance - Alt 100 Moderate Fund | | 354,394 | | 10,481 | | (15,208 | ) | (4,727 | ) |
Curian Guidance - Alt 100 Growth Fund | | 111,990 | | 2,335 | | (6,186 | ) | (3,851 | ) |
Curian Guidance - International Conservative Fund | | 5,176 | | 24 | | (278 | ) | (254 | ) |
Curian Guidance - International Moderate Fund | | 11,733 | | 55 | | (771 | ) | (716 | ) |
Curian Guidance - International Growth Fund | | 8,525 | | 67 | | (513 | ) | (446 | ) |
Curian Guidance - Equity 100 Fund | | 87,330 | | 451 | | (3,838 | ) | (3,387 | ) |
Curian Guidance - Fixed Income 100 Fund | | 50,066 | | 366 | | (2,119 | ) | (1,753 | ) |
Curian Guidance - Real Assets Fund | | 12,364 | | 154 | | (1,221 | ) | (1,067 | ) |
Curian/American Funds Global Growth Fund | | 34,178 | | 105 | | (1,274 | ) | (1,169 | ) |
Curian/American Funds Growth Fund | | 98,054 | | 8,160 | | (90 | ) | 8,070 | |
| | | | | | | | | | | | | |
Curian Variable Series Trust Master Feeder Funds and Fund of Funds
Notes to Financial Statements
December 31, 2014
As of December 31, 2014, the components of distributable taxable earnings for U.S. federal income tax purposes (in thousands) were as follows:
| | Undistributed
Net Ordinary
Income* | | Undistributed
Net Long-Term
Capital Gain | | Unrealized
Gains
(Losses)** | | Capital Loss
Carryforward | |
Curian Guidance - Interest Rate Opportunities Fund | | $ | 537 | | $ | 560 | | $ | (1,400 | ) | $ | — | |
Curian Guidance - Multi-Strategy Income Fund | | 635 | | 212 | | (862 | ) | — | |
Curian Guidance - Equity Income Fund | | 809 | | 1,212 | | 4,386 | | — | |
Curian Guidance - Conservative Fund | | 1,770 | | 1,135 | | (1,240 | ) | — | |
Curian Guidance - Moderate Fund | | 7,255 | | 8,427 | | (3,644 | ) | — | |
Curian Guidance - Growth Fund | | 4,327 | | 4,551 | | (3,693 | ) | — | |
Curian Guidance - Moderate Growth Fund | | 10,655 | | 13,739 | | (1,494 | ) | — | |
Curian Guidance - Maximum Growth Fund | | 4,514 | | 4,856 | | (884 | ) | — | |
Curian Guidance - Tactical Moderate Growth Fund | | 6,390 | | 5,974 | | 3,914 | | — | |
Curian Guidance - Tactical Maximum Growth Fund | | 2,659 | | 3,535 | | 1,131 | | — | |
Curian Guidance - Institutional Alt 65 Fund | | 2,511 | | 6,953 | | (1,208 | ) | — | |
Curian Guidance - Alt 100 Conservative Fund | | 478 | | 418 | | (488 | ) | — | |
Curian Guidance - Alt 100 Moderate Fund | | 5,630 | | 7,598 | | (4,737 | ) | — | |
Curian Guidance - Alt 100 Growth Fund | | 2,603 | | 1,424 | | (3,851 | ) | — | |
Curian Guidance - International Conservative Fund | | 41 | | 27 | | (255 | ) | — | |
Curian Guidance - International Moderate Fund | | 223 | | 86 | | (715 | ) | — | |
Curian Guidance - International Growth Fund | | 153 | | 106 | | (446 | ) | — | |
Curian Guidance - Equity 100 Fund | | 5,616 | | 4,185 | | (3,390 | ) | — | |
Curian Guidance - Fixed Income 100 Fund | | 844 | | 63 | | (1,754 | ) | — | |
Curian Guidance - Real Assets Fund | | 203 | | 153 | | (1,066 | ) | — | |
Curian/American Funds Global Growth Fund | | 297 | | 1,693 | | (1,167 | ) | — | |
Curian/American Funds Growth Fund | | 785 | | 4,046 | | 8,069 | | — | |
| | | | | | | | | | | | | |
* Undistributed net ordinary income consists of net taxable income derived from dividends, interest and net short-term capital gains, if any.
** Unrealized gains (losses) are adjusted for open wash sale loss deferrals.
The tax character of distributions paid (in thousands) during the Funds’ fiscal year ended December 31, 2014 was as follows:
| | Net Ordinary
Income* | | Long-term
Capital Gain** | |
Curian Guidance - Interest Rate Opportunities Fund | | $ | 753 | | $ | 46 | |
Curian Guidance - Multi-Strategy Income Fund | | 518 | | 46 | |
Curian Guidance - Equity Income Fund | | 2,366 | | 909 | |
Curian Guidance - Conservative Fund | | 762 | | 224 | |
Curian Guidance - Moderate Fund | | 7,503 | | 1,007 | |
Curian Guidance - Growth Fund | | 563 | | 351 | |
Curian Guidance - Moderate Growth Fund | | 8,806 | | 2,310 | |
Curian Guidance - Maximum Growth Fund | | 3,328 | | 794 | |
Curian Guidance - Tactical Moderate Growth Fund | | 12,471 | | 2,097 | |
Curian Guidance - Tactical Maximum Growth Fund | | 2,335 | | 1,567 | |
Curian Guidance - Institutional Alt 65 Fund | | 1,651 | | 1,121 | |
Curian Guidance - Alt 100 Conservative Fund | | 165 | | 2 | |
Curian Guidance - Alt 100 Moderate Fund | | 6,915 | | 851 | |
Curian Guidance - Alt 100 Growth Fund | | 655 | | 7 | |
Curian Guidance - International Conservative Fund | | 46 | | 4 | |
Curian Guidance - International Moderate Fund | | 100 | | 13 | |
Curian Guidance - International Growth Fund | | 54 | | 11 | |
Curian Guidance - Equity 100 Fund | | 2,936 | | 615 | |
Curian Guidance - Fixed Income 100 Fund | | 565 | | — | |
Curian Guidance - Real Assets Fund | | 111 | | 5 | |
Curian/American Funds Global Growth Fund | | 45 | | — | |
Curian/American Funds Growth Fund | | 220 | | 142 | |
| | | | | | | |
* Net ordinary income consists of net taxable income derived from dividends, interest and net short-term capital gains, if any.
** The Funds designated as a long-term capital gain dividend, pursuant to the Internal Revenue code section 852(b)(3), the amount necessary to reduce earnings and profits of the Funds related to net capital gains to zero for the year ended December 31, 2014.
The tax character of distributions paid (in thousands) during the Funds’ fiscal year ended December 31, 2013 was as follows:
| | Net Ordinary
Income* | | Long-term
Capital Gain | |
Curian Guidance - Equity Income Fund | | $ | 183 | | $ | 4 | |
Curian Guidance - Conservative Fund | | 353 | | 12 | |
Curian Guidance - Moderate Fund | | 535 | | 18 | |
Curian Guidance - Moderate Growth Fund | | 437 | | 159 | |
Curian Guidance - Maximum Growth Fund | | 94 | | 62 | |
Curian Guidance - Tactical Moderate Growth Fund | | 791 | | 437 | |
Curian Guidance - Tactical Maximum Growth Fund | | 14 | | 16 | |
Curian Guidance - Institutional Alt 65 Fund | | 253 | | 133 | |
| | | | | | | |
Curian Variable Series Trust Master Feeder Funds and Fund of Funds
Notes to Financial Statements
December 31, 2014
| | Net Ordinary
Income* | | Long-term
Capital Gain | |
Curian Guidance - Institutional Alt 100 Moderate Fund | | $ | 302 | | $ | 413 | |
Curian Guidance - Equity 100 Fund | | 29 | | 13 | |
Curian Guidance - Fixed Income 100 Fund | | 102 | | 5 | |
Curian/American Funds Growth Fund | | 49 | | — | |
| | | | | | | |
* Net ordinary income consists of net taxable income derived from dividends, interest and net short-term capital gains, if any.
FASB ASC Topic 740 “Income Taxes” provides guidance for how uncertain tax positions should be recognized, measured, presented and disclosed in the financial statements. FASB ASC Topic 740 requires the evaluation of tax positions taken or expected to be taken in the course of preparing each Fund’s tax return to determine whether the tax positions are “more-likely-than-not” of being sustained by the applicable tax authority. Tax positions not deemed to meet the “more-likely-than-not” threshold would result in the Funds recording a tax expense in the current year. FASB ASC Topic 740 requires that management evaluate the tax positions taken in the returns for 2012, 2013 and 2014, which remain subject to examination by the Internal Revenue Service and certain other jurisdictions. Management completed an evaluation of the Funds’ tax positions and based on that evaluation, determined that no provision for federal income tax was required in the Funds’ financial statements during the year ended December 31, 2014.
NOTE 7. SUBSEQUENT EVENTS
Management has evaluated subsequent events for the Funds through the date the financial statements are issued and the following events occurred:
At its meeting held January 8, 2015, the Board approved the following mergers effective after the close of business on April 24, 2015, subject to shareholder approval.
Acquired Fund | | Acquiring Fund |
Curian Guidance — Multi-Strategy Income Fund | | Curian Guidance Fixed Income 100 Fund |
Curian Guidance — Tactical Moderate Growth Fund | | Curian Guidance — Moderate Growth Fund |
Curian Guidance — Tactical Maximum Growth Fund | | Curian Guidance - Maximum Growth Fund |
Curian Guidance — Institutional Alt 65 Fund | | JNL Institutional Alt 65 Fund |
Curian Guidance — Alt 100 Conservative Fund | | Curian Guidance — Alt 100 Moderate Fund |
Curian Guidance — Alt 100 Growth Fund | | Curian Guidance — Alt 100 Moderate Fund |
Curian Guidance — International Conservative Fund | | Curian Guidance — Conservative Fund |
Curian Guidance — International Moderate Fund | | Curian Guidance — Moderate Fund |
Curian Guidance — International Growth Fund | | Curian Guidance — Growth Fund |
At its meeting held January 8, 2015, the Board also voted to approve the replacement of Curian with JNAM as the Funds’ investment adviser and administrator effective April 27, 2015, subject to shareholder approval. Subject to the approval of the change in investment adviser by the shareholders, the administration fee paid by the Curian Guidance Funds will be reduced to 0.05% of average daily net assets of each Fund effective April 27, 2015. Moreover, subject to shareholder approval of the change in investment adviser, the 12b-1 fees paid by Curian/American Funds Growth Fund and Curian/American Funds Global Growth Fund will be reduced to 0.20% of average daily net assets of each Fund effective April 27, 2015. Additionally, subject to shareholder approval of the change in investment adviser, the contractual agreement to waive advisory fees for Curian/American Funds Global Growth Fund will be terminated and a new contractual waiver agreement with JNAM will reflect a reduction in the amount previously waived by the Adviser to 0.60% of average daily net assets effective April 27, 2015. Finally, subject to shareholder approval of the change in investment adviser, the following Fund name changes will be effective April 27, 2015:
Existing Fund Name: | | Effective April 27, 2015 Fund Name: |
Curian Guidance - Interest Rate Opportunities Fund | | JNAM Guidance - Interest Rate Opportunities Fund |
Curian Guidance - Equity Income Fund | | JNAM Guidance - Equity Income Fund |
Curian Guidance - Conservative Fund | | JNAM Guidance - Conservative Fund |
Curian Guidance - Moderate Fund | | JNAM Guidance - Moderate Fund |
Curian Guidance - Growth Fund | | JNAM Guidance - Growth Fund |
Curian Guidance - Moderate Growth Fund | | JNAM Guidance - Moderate Growth Fund |
Curian Guidance - Maximum Growth Fund | | JNAM Guidance - Maximum Growth Fund |
Curian Guidance - Alt 100 Moderate Fund | | JNAM Guidance - Alt 100 Moderate Fund |
Curian Guidance - Equity 100 Fund | | JNAM Guidance - Equity 100 Fund |
Curian Guidance - Fixed Income 100 Fund | | JNAM Guidance - Fixed Income 100 Fund |
Curian Guidance - Real Assets Fund | | JNAM Guidance - Real Assets Fund |
Curian/American Funds Global Growth Fund | | JNL/American Funds Global Growth Fund |
Curian/American Funds Growth Fund | | JNL/American Funds Growth Fund |
No other events were noted that required adjustments to the financial statements or disclosure in the notes.
Report of Independent Registered Public Accounting Firm
To the Shareholders and Board of Trustees
Curian Variable Series Trust:
We have audited the accompanying statements of assets and liabilities, including the schedules of investments, of each series within Curian Variable Series Trust (the “Funds”) as listed in Note 1 of the financial statements of Curian Variable Series Trust Master Feeder Funds and Fund of Funds as of December 31, 2014, and the related statements of operations for the year or period then ended, the statements of changes in net assets for each of the years or periods in the two-year period then ended, and the financial highlights for each of the years or periods in the three-year period then ended. These financial statements and financial highlights are the responsibility of the Funds’ management. Our responsibility is to express an opinion on these financial statements and financial highlights based on our audits.
We conducted our audits in accordance with the standards of the Public Company Accounting Oversight Board (United States). Those standards require that we plan and perform the audit to obtain reasonable assurance about whether the financial statements and financial highlights are free of material misstatement. An audit includes examining, on a test basis, evidence supporting the amounts and disclosures in the financial statements. Our procedures included confirmation of securities owned as of December 31, 2014, by correspondence with the custodian, transfer agents and brokers or other appropriate auditing procedures. An audit also includes assessing the accounting principles used and significant estimates made by management, as well as evaluating the overall financial statement presentation. We believe that our audits provide a reasonable basis for our opinion.
In our opinion, the financial statements and financial highlights referred to above present fairly, in all material respects, the financial position of the Funds as of December 31, 2014, the results of their operations, changes in their net assets and the financial highlights for each of the years and periods indicated above, in conformity with U.S. generally accepted accounting principles.
/s/ KPMG LLP
Chicago, Illinois
February 26, 2015
Curian Variable Series Trust Master Feeder Funds and Fund of Funds
Additional Disclosures (Unaudited)
December 31, 2014
Disclosure of Fund Expenses. Shareholders incur ongoing costs, which include costs for portfolio management, administrative services, Rule 12b-1 fees of certain Funds and other operating expenses. Operating expenses such as these are deducted from each Fund’s gross income and directly reduce the final investment return. These expenses are expressed as a percentage of the Fund’s average net assets; this percentage is known as the Fund’s expense ratio. The examples below use the expense ratio and are intended to help the investor understand the ongoing costs (in dollars) of investing in a Fund and to compare these costs with the ongoing costs of investing in other mutual funds. The examples are based on an investment of $1,000 made at the beginning of the period shown and held for the entire period. The examples do not reflect the expenses of the variable insurance contracts or the separate account. Total expenses would be higher if these expenses were included.
Expenses Using Actual Fund Return. This section provides information about the actual account values and actual expenses incurred by the Fund. Use the information in this section, together with the amount invested, to estimate the expenses paid over the period. Simply divide the account value by $1,000 (for example, an $8,600 account value divided by $1,000 = 8.6), then multiply the result by the number in the first section under the heading entitled “Expenses Paid During Period” to estimate the expenses paid during this period.
Expenses Using Hypothetical 5% Return. This section provides information that can be used to compare each Fund’s costs with those of other mutual funds. It assumes that the Fund’s expense ratio for the period is unchanged and assumes an annual 5% return before expenses, which is not the Fund’s actual return. This example is useful in making comparisons because the SEC requires all mutual funds to make the 5% calculation.
| | Expenses Using Actual Fund Return | | Expenses Using Hypothetical 5% Return | |
| | Beginning
Account
Value
7/1/2014 | | Ending
Account
Value
12/31/2014 | | Annualized
Net Expense
Ratios | | Expenses
Paid
During Period | | Beginning
Account
Value
7/1/2014 | | Ending
Account
Value
12/31/2014 | | Annualized
Net Expense
Ratios | | Expenses
Paid
During Period | |
Curian Guidance - Interest Rate Opportunities Fund | | | | | | | | | | | | | | | | | |
| | $ | 1,000.00 | | $ | 972.00 | | 0.26 | % | $ | 1.29 | | $ | 1,000.00 | | $ | 1,023.88 | | 0.26 | % | $ | 1.33 | |
Curian Guidance - Multi-Strategy Income Fund | | | | | | | | | | | | | | | | | |
| | 1,000.00 | | 980.00 | | 0.26 | | 1.30 | | 1,000.00 | | 1,023.88 | | 0.26 | | 1.33 | |
Curian Guidance - Equity Income Fund | | | | | | | | | | | | | | | | | |
| | 1,000.00 | | 1,006.90 | | 0.26 | | 1.32 | | 1,000.00 | | 1,023.88 | | 0.26 | | 1.33 | |
Curian Guidance - Conservative Fund | | | | | | | | | | | | | | | | | |
| | 1,000.00 | | 989.70 | | 0.26 | | 1.30 | | 1,000.00 | | 1,023.88 | | 0.26 | | 1.33 | |
Curian Guidance - Moderate Fund | | | | | | | | | | | | | | | | | |
| | 1,000.00 | | 986.00 | | 0.26 | | 1.30 | | 1,000.00 | | 1,023.88 | | 0.26 | | 1.33 | |
Curian Guidance - Growth Fund | | | | | | | | | | | | | | | | | |
| | 1,000.00 | | 984.90 | | 0.26 | | 1.30 | | 1,000.00 | | 1,023.88 | | 0.26 | | 1.33 | |
Curian Guidance - Moderate Growth Fund | | | | | | | | | | | | | | | | | |
| | 1,000.00 | | 988.10 | | 0.26 | | 1.30 | | 1,000.00 | | 1,023.88 | | 0.26 | | 1.33 | |
Curian Guidance - Maximum Growth Fund | | | | | | | | | | | | | | | | | |
| | 1,000.00 | | 985.70 | | 0.26 | | 1.30 | | 1,000.00 | | 1,023.88 | | 0.26 | | 1.33 | |
Curian Guidance - Tactical Moderate Growth Fund | | | | | | | | | | | | | | | | | |
| | 1,000.00 | | 997.80 | | 0.26 | | 1.31 | | 1,000.00 | | 1,023.88 | | 0.26 | | 1.33 | |
Curian Guidance - Tactical Maximum Growth Fund | | | | | | | | | | | | | | | | | |
| | 1,000.00 | | 995.70 | | 0.26 | | 1.31 | | 1,000.00 | | 1,023.88 | | 0.26 | | 1.33 | |
Curian Guidance - Institutional Alt 65 Fund | | | | | | | | | | | | | | | | | |
| | 1,000.00 | | 976.70 | | 0.26 | | 1.30 | | 1,000.00 | | 1,023.88 | | 0.26 | | 1.33 | |
Curian Guidance - Alt 100 Conservative Fund | | | | | | | | | | | | | | | | | |
| | 1,000.00 | | 993.00 | | 0.26 | | 1.31 | | 1,000.00 | | 1,023.88 | | 0.26 | | 1.33 | |
Curian Guidance - Alt 100 Moderate Fund | | | | | | | | | | | | | | | | | |
| | 1,000.00 | | 967.90 | | 0.26 | | 1.29 | | 1,000.00 | | 1,023.88 | | 0.26 | | 1.33 | |
Curian Guidance - Alt 100 Growth Fund | | | | | | | | | | | | | | | | | |
| | 1,000.00 | | 954.50 | | 0.26 | | 1.28 | | 1,000.00 | | 1,023.88 | | 0.26 | | 1.33 | |
Curian Guidance - International Conservative Fund | | | | | | | | | | | | | | | | | |
| | 1,000.00 | | 928.60 | | 0.26 | | 1.26 | | 1,000.00 | | 1,023.88 | | 0.26 | | 1.33 | |
Curian Guidance - International Moderate Fund | | | | | | | | | | | | | | | | | |
| | 1,000.00 | | 920.20 | | 0.26 | | 1.26 | | 1,000.00 | | 1,023.88 | | 0.26 | | 1.33 | |
Curian Guidance - International Growth Fund | | | | | | | | | | | | | | | | | |
| | 1,000.00 | | 920.50 | | 0.26 | | 1.26 | | 1,000.00 | | 1,023.88 | | 0.26 | | 1.33 | |
Curian Guidance - Equity 100 Fund | | | | | | | | | | | | | | | | | |
| | 1,000.00 | | 998.10 | | 0.26 | | 1.31 | | 1,000.00 | | 1,023.88 | | 0.26 | | 1.33 | |
Curian Guidance - Fixed Income 100 Fund | | | | | | | | | | | | | | | | | |
| | 1,000.00 | | 982.30 | | 0.26 | | 1.30 | | 1,000.00 | | 1,023.88 | | 0.26 | | 1.33 | |
Curian Guidance - Real Assets Fund | | | | | | | | | | | | | | | | | |
| | 1,000.00 | | 885.10 | | 0.26 | | 1.24 | | 1,000.00 | | 1,023.88 | | 0.26 | | 1.33 | |
Curian/American Funds Global Growth Fund | | | | | | | | | | | | | | | | | |
| | 1,000.00 | | 996.10 | | 0.51 | | 2.57 | | 1,000.00 | | 1,022.62 | | 0.51 | | 2.60 | |
Curian/American Funds Growth Fund | | | | | | | | | | | | | | | | | |
| | 1,000.00 | | 1,025.60 | | 0.71 | | 3.63 | | 1,000.00 | | 1,021.61 | | 0.71 | | 3.62 | |
| | | | | | | | | | | | | | | | | | | | | | | |
Expenses paid during the period are equal to the annualized net expense ratio, multiplied by the average account value over the period, then multiplied by 184/365 (to reflect the most recent 6-month period).
Quarterly Portfolio Holdings. The Funds file a complete schedule of portfolio holdings with the SEC for the first and third quarters of each fiscal year on Form N-Q. The Funds’ Forms N-Q are available on the SEC’s website at www.sec.gov. The Forms N-Q may be reviewed and copied at the SEC’s Public Reference Room in Washington, DC, and information on the operation of the Public Reference Room may be obtained by calling 800-SEC-0330. It is also available upon request from the registrant by calling the Funds toll-free at 1-866-255-1935.
Proxy Voting Policies and Procedures and Proxy Voting Record. A description of the Policy of the Funds’ Adviser (and sub-advisers) used to vote proxies relating to the portfolio securities and information on how the Funds voted proxies relating to portfolio securities during the 12-month period ended June 30, 2014, are available (1) without charge, upon request by calling 1-800-873-5654 (Annuity Service Center), 1-800-599-5651 (NY Annuity Service Center) or 1-800-777-7779 (for contracts purchased through a bank or financial institution) or 1-888-464-7779 (for NY contracts purchased through a bank or financial institution), (2) by writing Curian Variable Series Trust, P.O. Box 30314, Lansing, Michigan 48909-7814, (3) on Jackson National Life Insurance Company’s or Jackson National Life Insurance Company of New York’s website at www.jackson.com, and (4) on the SEC’s website at www.sec.gov.

Curian Tactical Advantage Funds
Curian Capital, LLC
(Unaudited)
Market Summary: Most domestic market fundamentals improved throughout the year as the U.S. Federal Reserve ("Fed") brought the monetary easing process to an end in October. An improving job market, earnings growth and gross domestic product ("GDP") growth proved to be ample substitute for the declining stimulus. U.S. large cap stocks posted strong gains in 2014 causing most diversification decisions to detract from overall performance. Small cap equities generally produced less than half the return of large cap equities even with a very strong fourth quarter rally. While value equities and growth equities swapped the leadership position several times throughout the year, they ended the calendar year with similar returns.
U.S. government bonds and investment grade bonds regained the core leadership in the fixed income asset class. A steady interest rate decline in 2014 helped the Barclays U.S. Aggregate Bond Index deliver an attractive positive return for the year. The yield curve experienced a steady flattening as the 10-year U.S. Treasury yield dropped over 87 basis points ("bps") to end the year at 2.17%. The Fed remained inactive on the front of the curve leaving the Fed funds rate near zero. High yield spreads widened in the second half of the year as falling oil prices put pressure on many of the energy dependent issuers.
International investments lagged the U.S. in 2014 as weak currencies and economies hampered returns. A European recessionary environment and sporadic Japanese tax policy lead to lower nominal returns among the developed international domains. The weak Euro and Japanese Yen drove U.S. Dollar based returns into negative territory for both the MSCI All Country World ex USA Index and MSCI EAFE Index. Slowing growth in China and weak commodity performance translated into negative emerging market performance as well.
Portfolio Manager Commentary: Curian Tactical Advantage 35 Fund, Curian Tactical Advantage 60 Fund and Curian Tactical Advantage 75 Fund (collectively "Curian Tactical Advantage Funds") seek to achieve their investment objectives by investing in a diversified group of underlying exchange traded funds ("ETFs"). Each Curian Tactical Advantage Fund's asset allocation is determined by the Funds' Adviser through a proprietary asset allocation model. The Funds' Sub Adviser, Mellon Capital Management Corporation, executes transactions in the underlying ETFs to closely replicate the allocation determined by the Adviser.
The Curian Tactical Advantage Funds' performance was driven by both equities and fixed income for the year; however, fixed income was the primary detractor of relative performance. The Funds held various weightings to equities throughout the year, on average maintaining an overweight to equities within the asset allocation model. This overweight helped performance as equities ended the year as the better performing asset class. Within the equity portion of the Funds the strategies maintained on average an overweight to U.S. regions relative to international regions, a preference to large cap relative to small cap and neutral positioning between growth and value. This allocation helped performance within equities. The resulting average underweight to fixed income, also helped performance; however, the asset allocation within the fixed income portion of the Funds was the biggest detractor of relative performance. The Funds held a preference to credit over government debt and maintained a shorter than benchmark duration driving negative contribution to returns. The shorter duration position was the primary contributor to the lower performance as yields continued to move lower throughout the year. Additionally toward the end of the year the credit spreads began to widen hurting returns within the fixed income asset allocation for the year. This allocation within the fixed income asset class was the primary driver of underperformance relative to the primary benchmark.
Curian Tactical Advantage 35 Fund
Portfolio Composition†:
Domestic Fixed Income | | | 40.8 | % | |
Domestic Equity | | | 33.1 | | |
International Equity | | | 7.0 | | |
Emerging Markets Equity | | | 2.4 | | |
International Fixed Income | | | 2.1 | | |
Short Term Investments | | | 14.6 | | |
Total Investments | | | 100.0 | % | |
†Total Investments as of December 31, 2014.
For the year ended December 31, 2014, Curian Tactical Advantage 35 Fund underperformed its primary benchmark by posting a return of 4.03% compared to 4.78% for the Dow Jones Moderately Conservative Index. The Fund underperformed its blended benchmark return of 6.78% for the 25% S&P 500 Index, 10% MSCI EAFE Index, 65% Barclays U.S. Aggregate Bond Index. The Fund's investment objective is to seek long term growth of capital through investment in ETFs. Under normal market conditions, the Fund allocates approximately 20% to 50% (with a neutral target allocation of 35%) of its assets to underlying ETFs that invest primarily in equity securities and 50% to 80% (with a neutral target allocation of 65%) to underlying ETFs that invest primarily in fixed income securities and/or cash alternatives.
Curian Tactical Advantage 60 Fund
Portfolio Composition†:
Domestic Equity | | | 51.0 | % | |
Domestic Fixed Income | | | 21.0 | | |
International Equity | | | 10.8 | | |
Emerging Markets Equity | | | 3.7 | | |
International Fixed Income | | | 1.1 | | |
Short Term Investments | | | 12.4 | | |
Total Investments | | | 100.0 | % | |
†Total Investments as of December 31, 2014.
For the year ended December 31, 2014, Curian Tactical Advantage 60 Fund underperformed its primary benchmark by posting a return of 4.53% compared to 5.35% for the Dow Jones Moderate Index. The Fund underperformed its blended benchmark return of 6.77% for the 40% S&P 500 Index, 20% MSCI EAFE Index, 40% Barclays U.S. Aggregate Bond Index. The Fund's investment objective is to seek long term growth of capital through investment in ETFs. Under normal market conditions, the Fund allocates approximately 45% to 75% (with a neutral target allocation of 60%) of its assets to underlying ETFs that invest primarily in equity securities and 25% to 55% (with a neutral target allocation of 40%) to underlying ETFs that invest primarily in fixed income securities and/or cash alternatives.
Curian Tactical Advantage 75 Fund
Portfolio Composition†:
Domestic Equity | | | 64.8 | % | |
International Equity | | | 13.8 | | |
Emerging Markets Equity | | | 4.7 | | |
Domestic Fixed Income | | | 0.2 | | |
Short Term Investments | | | 16.5 | | |
Total Investments | | | 100.0 | % | |
†Total Investments as of December 31, 2014.
For the year ended December 31, 2014, Curian Tactical Advantage 75 Fund underperformed its primary benchmark by posting a return of 4.56% compared to 5.90% for the Dow Jones Moderately Aggressive Index. The Fund underperformed its blended benchmark return of 7.89% for the 55% S&P 500 Index, 20% MSCI EAFE Index, 25% Barclays U.S. Aggregate Bond Index. The Fund's investment objective is to seek long term growth of capital through investment in ETFs. Under normal market conditions, the Fund allocates approximately 50% to 100% (with a neutral target allocation of 75%) of its assets to underlying ETFs that invest primarily in equity securities and 0% to 50% (with a neutral target allocation of 25%) of its assets to underlying ETFs that invest primarily in fixed income securities and/or cash alternatives.

Curian Tactical Advantage Funds (continued)
Curian Capital, LLC
(Unaudited)
Curian Tactical Advantage 35 Fund
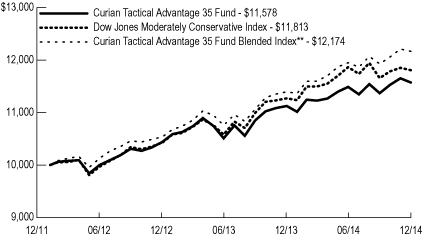
**25% S&P 500 Index, 10% MSCI EAFE Index, 65% Barclays Capital U.S. Aggregate Bond Index
Average Annual Total Returns* | |
| 1 Year | | | 4.03 | % | |
Since Inception | | | 5.18 | % | |
(Inception date February 6, 2012) | |
Curian Tactical Advantage 60 Fund

**40% S&P 500 Index, 20% MSCI EAFE Index, 40% Barclays Capital U.S. Aggregate Bond Index
Average Annual Total Returns* | |
| 1 Year | | | 4.53 | % | |
Since Inception | | | 8.05 | % | |
(Inception date February 6, 2012) | |
Past performance is not predictive of future performance. Investment return and principal value will fluctuate so that an investor's shares, when redeemed, may be worth more or less than their original cost. Performance numbers are net of all Fund operating expenses, but not do not reflect the deduction of insurance charges.
*The Fund's investment adviser waived certain expenses of the Fund. Performance results shown reflect the waiver, without which they would have been lower.

Curian Tactical Advantage Funds (continued)
Curian Capital, LLC
(Unaudited)
Curian Tactical Advantage 75 Fund
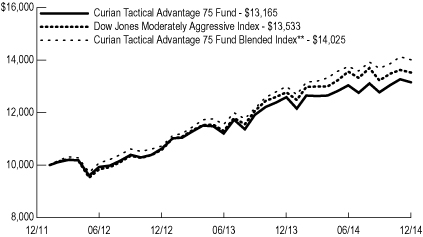
**55% S&P 500 Index, 20% MSCI EAFE Index, 25% Barclays Capital U.S. Aggregate Bond Index
Average Annual Total Returns* | |
| 1 Year | | | 4.56 | % | |
Since Inception | | | 9.94 | % | |
(Inception date February 6, 2012) | |
Past performance is not predictive of future performance. Investment return and principal value will fluctuate so that an investor's shares, when redeemed, may be worth more or less than their original cost. Performance numbers are net of all Fund operating expenses, but not do not reflect the deduction of insurance charges.
*The Fund's investment adviser waived certain expenses of the Fund. Performance results shown reflect the waiver, without which they would have been lower.

Curian Dynamic Risk Advantage Funds
Curian Capital, LLC
(Unaudited)
Market Summary: Most domestic market fundamentals improved throughout the year as the U.S. Federal Reserve ("Fed") brought the monetary easing process to an end in October. An improving job market, earnings growth and gross domestic product ("GDP") growth proved to be ample substitute for the declining stimulus. U.S. large cap stocks posted strong gains in 2014 causing most diversification decisions to detract from overall performance. Small cap equities generally produced less than half the return of large cap equities even with a very strong fourth quarter rally. While value equities and growth equities swapped the leadership position several times throughout the year, they ended the calendar year with similar returns.
U.S. government bonds and investment grade bonds regained the core leadership in the fixed income asset class. A steady interest rate decline in 2014 helped the Barclays U.S. Aggregate Bond Index deliver an attractive positive return for the year. The yield curve experienced a steady flattening as the 10-year U.S. Treasury yield dropped over 87 basis points ("bps") to end the year at 2.17%. The Fed remained inactive on the front of the curve leaving the Fed funds rate near zero. High yield spreads widened in the second half of the year as falling oil prices put pressure on many of the energy dependent issuers.
International investments lagged the U.S. in 2014 as weak currencies and economies hampered returns. A European recessionary environment and sporadic Japanese tax policy lead to lower nominal returns among the developed international domains. The weak Euro and Japanese Yen drove U.S. Dollar based returns into negative territory for both the MSCI All Country World ex USA Index and MSCI EAFE Index. Slowing growth in China and weak commodity performance translated into negative emerging market performance as well.
The HFRI Fund Weighted Composite Index returned 3.33% for the year as the top contributing categories within this index included Equity Hedge – Technology & Healthcare and Macro – Systematic Diversified. The largest detractors for the year included Equity Hedge – Energy & Basic Materials, Equity Hedge – Short Bias and Event Driven – Distressed & Restructuring. Global real estate investment trusts ("REIT") outperformed the S&P 500 Index during 2014 while broad based commodities suffered a second consecutive negative year, largely driven by weakness in energy markets.
Portfolio Manager Commentary: Curian Dynamic Risk Advantage – Diversified Fund, Curian Dynamic Risk Advantage – Growth Fund and Curian Dynamic Risk Advantage – Income Fund are collectively referred to as the Curian Dynamic Risk Advantage Funds. The Curian Dynamic Risk Advantage – Income Fund seeks to achieve its investment objective primarily through investing in underlying exchange traded Funds ("ETFs"). Curian Dynamic Risk Advantage – Diversified Fund and Curian Dynamic Risk Advantage – Growth Fund seek to achieve their investment objectives by investing in a range of securities and derivative contracts. Each Fund also seeks to control risk through diversification, and systematically increasing allocations to cash equivalents during periods of capital market declines. The Adviser has established a proprietary quantitative trading algorithm (the "Investment Model") for the funds and provides the Investment Model and parameters for implementing the Investment Model to Mellon Capital Management Corporation, the Funds' sub-adviser.
Curian Dynamic Risk Advantage – Diversified Fund
Portfolio Composition†:
Alternative | | | 2.6 | % | |
International Fixed Income | | | 2.5 | | |
Domestic Fixed Income | | | 1.9 | | |
Short Term Investments** | | | 93.0 | | |
Total Investments | | | 100.0 | % | |
†Total Investments as of December 31, 2014.
**In general, the Fund seeks to meet investment objectives by investing in a number of different types of derivative instruments. Please refer to the Schedule of Investments for the Fund's derivative investments.
For the year ended December 31, 2014, Curian Dynamic Risk Advantage – Diversified Fund outperformed its primary benchmark by posting a return of 5.17% compared to 4.78% for the Dow Jones Moderately Conservative Index. The Fund outperformed its blended benchmark return of 2.91% for the 40% BofA Merrill Lynch 1-3 Year Treasury Index, 10% Barclays U.S. Corporate High Yield Index, 10% Barclays U.S. Aggregate Bond Index, 10% JP Morgan EMBI Global Index, 10% MSCI U.S. REIT Index, 10% Bloomberg Commodity Index, 10% MSCI All Country World Index. The Fund's investment objective is to seek long term capital appreciation.
To achieve its investment objective, the Fund allocates between a market portfolio and lower risk, short term fixed income securities based on observable market prices. The allocation to the market portfolio includes exposure to broad asset classes, including, but not limited to, global equity, U.S. core fixed income, master limited partnerships ("MLPs"), high yield bonds, emerging market bonds, currency and U.S. REITs. The market portfolio is basically equally weighted between these
asset classes. The exposure to these asset classes is achieved primarily through swap arrangements on underlying exchange traded products or indexes or exchange traded products directly.
The bulk of exposure in the Fund is obtained through derivatives because of liquidity, cost, and regulatory reasons. However, ETFs and/or exchange traded notes ("ETN") are mostly used for daily cash flow investment needs. The Fund is managed such that investment and derivative fees are minimized whenever possible while still obtaining correct exposures. Derivative gains/losses are monitored daily, as are the premium/discount values for each ETF and/or ETN.
Performance for the year was driven largely by gains in U.S. Treasuries of long duration (20+ years), MLPs and REITs. These gains were somewhat offset by declines in emerging market equities, developed market equities and commodities. Exposure to these asset classes is obtained through derivatives, primarily total return swaps on underlying indexes. An overall decline in interest rates pushed U.S. Treasury prices higher, which offset much of the losses from the prior year. A dramatic drop in energy prices was a headwind for commodity futures, which posted a third straight yearly loss. Meanwhile, international equities continued to underperform U.S. stocks due in large part to a stronger U.S. Dollar. The Fund remained primarily invested in the market portfolio for much of the year, as market volatility was largely subdued.
During the year via derivative exposure, the biggest contributors to outperformance were derivative exposures to longer duration Treasuries, REITs and international bonds. These gains were somewhat offset by derivative exposure to commodities and developed market equities.
Curian Dynamic Risk Advantage – Growth Fund
Portfolio Composition†:
Alternative | | | 4.0 | % | |
Domestic Equity | | | 0.1 | | |
Emerging Markets Equity | | | 0.1 | | |
Short Term Investments** | | | 95.8 | | |
Total Investments | | | 100.0 | % | |
†Total Investments as of December 31, 2014.
**In general, the Fund seeks to meet investment objectives by investing in a number of different types of derivative instruments. Please refer to the Schedule of Investments for the Fund's derivative investments.
For the year ended December 31, 2014, Curian Dynamic Risk Advantage – Growth Fund underperformed its primary benchmark by posting a return of -4.22% compared to 5.35% for the Dow Jones Moderate Index. The Fund outperformed its blended benchmark return of -4.54% for the 40% BofA Merrill Lynch 1-3 Year Treasury Index, 24% MSCI All Country World Index, 24% S&P Dynamic VIX Futures Index, 12% Bloomberg Commodity Index. The Fund's investment objective is to seek long term capital appreciation.
To achieve its investment objective, the Fund allocates between a market portfolio and lower risk, short term fixed income securities based on observable market prices. The allocation to the market portfolio includes exposure to broad asset classes, including, but not limited to, global equity, currency and volatility related futures. The exposure is primarily through swap arrangements on underlying exchange traded products or indexes or exchange traded products directly. The Fund maintains a position in lower risk, short term fixed income securities and seeks to add excess return by dynamically allocating to the market portfolio,

Curian Dynamic Risk Advantage Funds (continued)
Curian Capital, LLC
(Unaudited)
ranging from 0% to 90%, depending on overall direction of the overall portfolio.
The bulk of exposure in the Fund is obtained through derivatives because of liquidity, cost, and regulatory reasons. However, ETFs and/or ETNs are mostly used for daily cash flow investment needs. The Fund is managed such that investment and derivative fees are minimized whenever possible while still obtaining correct exposures. Derivative gains/losses are monitored daily, as are the premium/discount values for each ETF and/or ETN.
The Fund finished the year lower due primarily to declines in international developed market equities, emerging market equities and Volatility Index ("VIX") futures. A strong U.S. Dollar was a headwind for international returns, and a drop in energy prices led commodities lower for the year. U.S. large and small cap equities helped offset some of these losses. Exposure to these asset classes is primarily through futures and total return swaps. The Fund was roughly half invested in the market portfolio and the low risk portfolio of short term fixed income securities for much of the year.
During the year via derivative exposure, underperformance was primarily attributable to exposure to commodities and VIX futures.
Curian Dynamic Risk Advantage – Income Fund
Portfolio Composition†:
Domestic Fixed Income | | | 37.2 | % | |
International Fixed Income | | | 17.1 | | |
Alternative | | | 13.3 | | |
Domestic Equity | | | 8.0 | | |
International Equity | | | 2.3 | | |
Short Term Investments | | | 22.1 | | |
Total Investments | | | 100.0 | % | |
†Total Investments as of December 31, 2014.
For the year ended December 31, 2014, Curian Dynamic Risk Advantage – Income Fund outperformed its primary benchmark by posting a return of 8.16% compared to 4.78% for the Dow Jones Moderately Conservative Index. The Fund outperformed its blended benchmark return of 5.92% for the 37% BofA Merrill Lynch 1-3 Year Treasury, 9% Barclays U.S. Corporate High Yield Index, 9% Dow Jones Global Select Real Estate Securities Index, 9% S&P U.S. Preferred Stock Index, 9% S&P High Yield Dividend Aristocrats Index, 9% S&P International Dividend Opportunities Index, 9% JP Morgan EMBI Global Index, 9% Barclays U.S. Credit Bond Index. The Fund's investment objective is to seek long term capital appreciation and current income.
To potentially achieve its investment objective, the Fund allocates between a market portfolio and lower risk, short term fixed income securities based on observable market prices. The allocation to the market portfolio includes exposure to broad asset classes, including, but not limited to, dividend paying stocks, U.S. investment grade bonds, preferred stocks, emerging market debt and high yield bonds. The exposure is through ETFs and the market portfolio maintains basically equally weighted holdings in these asset classes.
The lower risk exposure consists primarily of short term investment grade fixed income securities and cash equivalents. The Fund maintains a position in lower risk, short term fixed income securities and seeks to add excess return by dynamically allocating to the market portfolio ranging from roughly 0% to 90%, depending on the direction of the overall portfolio.
Performance for the year was driven largely by gains in U.S. Treasuries of long duration (20+ years), MLPs, preferred stocks and U.S. dividend
paying equities. These gains were somewhat offset by declines in international dividend paying stocks and high yield bonds. Exposure to these asset classes is obtained through ETFs. An overall decline in interest rates pushed U.S. Treasury prices higher, which offset much of the losses from the prior year. Meanwhile, credit spreads widened somewhat during the year, which was a headwind for high yield bonds. International equities continued to underperform U.S. stocks due in large part to a stronger U.S. Dollar. The Fund remained primarily invested in the market portfolio for much of the year, as market volatility was largely subdued.

Curian Dynamic Risk Advantage Funds (continued)
Curian Capital, LLC
(Unaudited)
Curian Dynamic Risk Advantage – Diversified Fund
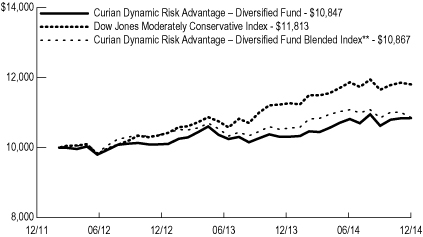
**40% BofA Merrill Lynch 1-3 Year Treasury Index, 10% Barclays Capital U.S. Corporate High Yield Index, 10% Barclays Capital U.S. Aggregate Bond Index, 10% JP Morgan EMBI Global Index, 10% MSCI U.S. REIT Index, 10% Dow Jones-UBS Commodity Index, 10% MSCI All Country World Index
Average Annual Total Returns* | |
| 1 Year | | | 5.17 | % | |
Since Inception | | | 2.84 | % | |
(Inception date February 6, 2012) | |

**40% BofA Merrill Lynch 1-3 Year U.S. Treasury Index, 24% MSCI All Country World Index, 24% S&P Dynamic VIX Futures Index, 12% Dow Jones-UBS Commodity Index
Curian Dynamic Risk Advantage – Growth Fund
Average Annual Total Returns* | |
| 1 Year | | | -4.22 | % | |
Since Inception | | | -2.47 | % | |
(Inception date February 6, 2012) | |
Past performance is not predictive of future performance. Investment return and principal value will fluctuate so that an investor's shares, when redeemed, may be worth more or less than their original cost. Performance numbers are net of all Fund operating expenses, but not do not reflect the deduction of insurance charges.
*The Fund's investment adviser waived certain expenses of the Fund. Performance results shown reflect the waiver, without which they would have been lower.

Curian Dynamic Risk Advantage Funds (continued)
Curian Capital, LLC
(Unaudited)
Curian Dynamic Risk Advantage – Income Fund

**37% BofA Merrill Lynch 1-3 Year U.S. Treasury Index, 9% Barclays Capital U.S. Corporate High Yield Index, 9% Dow Jones Global Select Real Estate Securities Index, 9% S&P U.S. Preferred Stock Index, 9% S&P High Yield Dividend Aristocrats Index, 9% S&P International Dividend Opportunities Index, 9% JP Morgan EMBI Global Index, 9% Barclays Capital U.S. Credit Index
Average Annual Total Returns* | |
| 1 Year | | | 8.16 | % | |
Since Inception | | | 4.55 | % | |
(Inception date February 6, 2012) | |
Past performance is not predictive of future performance. Investment return and principal value will fluctuate so that an investor's shares, when redeemed, may be worth more or less than their original cost. Performance numbers are net of all Fund operating expenses, but not do not reflect the deduction of insurance charges.
*The Fund's investment adviser waived certain expenses of the Fund. Performance results shown reflect the waiver, without which they would have been lower.

Curian/Aberdeen Latin America Fund
Aberdeen Asset Managers Ltd.
(Unaudited)
Market Summary: Latin American equities fell in 2014, underperforming the broader emerging markets asset class. At the beginning of the year, the U.S. Federal Reserve's announcement that it would start trimming its bond purchases triggered fears of increased outflows from the region. Subsequently, political developments drove a short lived rally, but gains were ultimately mitigated by concerns about Chinese growth, lower commodity prices and the possibility of a sooner than expected U.S. interest rate hike.
Mexico was among the better performing markets, thanks to relatively resilient gross domestic product ("GDP") growth and the signing of the energy reform into law. Conversely, Brazil underperformed. The stock market was steered by the bitterly contested presidential elections, which concluded with Dilma Rousseff edging out Aecio Neves to secure a second term. Subsequently, she confirmed that Joaquim Levy, currently head of Banco Bradesco's asset management arm, would replace Guido Mantega as finance minister. Levy, who pledged to restore the fiscal surplus, is seen as a credible choice, and his appointment may go some way towards reinstating investor confidence. In Chile, concerns about the new government's corporate tax hike and proposed labor reform, and their impact on investment, continued to weigh on sentiment.
Portfolio Composition†:
Financials | | | 32.3 | % | |
Consumer Staples | | | 25.6 | | |
Industrials | | | 12.2 | | |
Consumer Discretionary | | | 9.7 | | |
Materials | | | 8.3 | | |
Energy | | | 5.8 | | |
Health Care | | | 1.7 | | |
Information Technology | | | 1.6 | | |
Short Term Investments | | | 2.8 | | |
Total Investments | | | 100.0 | % | |
†Total Investments as of December 31, 2014.
Portfolio Manager Commentary: For the year ended December 31, 2014, Curian/Aberdeen Latin America Fund underperformed its benchmark by posting a return of -15.47% compared to -12.30% for the MSCI Emerging Markets Latin America 10/40 Index. The Fund's underperformance was largely due to negative stock selection.
In Brazil, miner Vale SA's share price fell, as fears of a slowdown in China's economy weighed
on iron ore prices. Retailer Cia Hering also underperformed as muted domestic demand hampered sales, amid continued restructuring. In Argentina, specialist pipe manufacturer Tenaris SA – ADR saw its shares fall sharply towards the end of the year in response to oil price weakness. Elsewhere, the Fund's lack of exposure to America Movil detracted from returns. The Mexican telecom operator rebounded after it announced plans to divest assets to avoid regulatory restrictions given its dominant market position.
Conversely, Mexican airport operator OMA Airports was a key contributor to relative performance. The company benefited from robust growth in traffic and commercial revenues. In Brazil, the Fund's smaller exposure to Petroleo Brasileiro SA ("Petrobras") relative to the benchmark also helped performance. The state-owned oil company's shares slumped on the back of a corruption scandal and a deteriorating balance sheet. Retailer Lojas Renner SA posted resilient results despite the challenging consumer environment, underpinned by
impressive sales growth and good cost control.
During the year, we sold Petrobras, on growing concerns about governance shortcomings, escalating leverage and the increasing politicization of the company. Against this, we introduced three stocks. These were Peru-based infrastructure company Grana y Montero SA – ADR, on the back of good growth prospects and an attractive valuation; Banco Santander Chile – ADR a well-run lender with an established domestic market position; and Iguatemi Empresa de Shopping Centers SA, a leading Brazilian mall owner and operator with a portfolio of well located malls.
At the end of the year, the Fund continued to be positioned towards companies in sectors that benefit from domestic demand and growth in Latin America. Consequently, the Fund has overweight positions in the consumer related and financial sectors. On the other hand, the Fund has less exposure to companies that are more reliant on exports and, therefore, the overall health of the global economy.
Curian/Aberdeen Latin America Fund
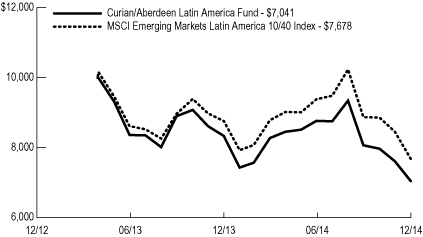
Average Annual Total Returns | |
| 1 Year | | | -15.47 | % | |
Since Inception | | | -18.90 | % | |
(Inception date April 29, 2013) | |
Past performance is not predictive of future performance. Investment return and principal value will fluctuate so that an investor's shares, when redeemed, may be worth more or less than their original cost. Performance numbers are net of all Fund operating expenses, but not do not reflect the deduction of insurance charges.

Curian/AQR Risk Parity Fund
AQR Capital Management, LLC
(Unaudited)
Market Summary: Developed equities were positive in 2014, driven primarily by the U.S. where economic data continued to improve throughout the year. International equity markets also finished the year modestly positive, but economic fundamentals diverged from the U.S. amid the threat of deflation and recession in Europe and recession in Japan. Emerging equities ended slightly positive for the year with mixed performance between countries. Commodity exporting countries like Brazil suffered losses, while China outperformed as the People's Bank of China took additional easing measures.
Developed bond markets saw strong positive returns over the year, registering gains in each quarter. Falling inflation, slowing global growth, geopolitical uncertainty in Russia and the Middle East and accommodative monetary policies were boons for bond performance. The U.S. Federal Reserve stayed the course on tapering and ended quantitative easing in October, while inflation came in below expectations. German bond yields fell as the European Central Bank increased efforts to help the struggling Eurozone. Japanese bond yields fell as the economy slipped into a recession prompting additional stimulus.
The story was similar for inflation linked bonds which provided solid returns over the year as slower economic activity and easing from G4 central banks persisted, resulting in lower real yields broadly. However, unlike nominal bonds, lower than expected realized inflation and declining inflation expectations limited gains.
Commodities were a significant drag on performance this year led by energy which suffered from both excess supply and weak demand. In the first half of the year bad weather and geopolitical risks had driven commodities higher, but record harvests and increased energy production in the U.S. sent prices lower in the second half of the year. As oil prices were falling, the Organization of the Petroleum Exporting Countries ("OPEC") announced that it would not be cutting production, triggering a large sell off in brent and crude oil. Metals were also hampered this year as demand remained soft in China and became softer in Europe.
Portfolio Composition†:
Government Securities | | | 36.9 | % | |
Short Term Investments†† | | | 63.1 | | |
Total Investments | | | 100.0 | % | |
†Total Investments as of December 31, 2014.
††In general, the Fund gains exposure to asset classes by investing in a number of different types of derivative instruments. Please refer to the Schedule of Investments for the Fund's derivative investments.
Portfolio Manager Commentary: For the year ended December 31, 2014, Curian/AQR Risk Parity Fund outperformed its primary benchmark by posting a return of 7.95% compared to 0.03% for the BofA Merrill Lynch U.S. 3-Month Treasury Bill Index. The Fund also outperformed its blended
benchmark return of 5.55% for the 60% MSCI All Country World Index and 40% Barclays Global Aggregate Hedged Index.
The Fund outperformed its blended benchmark as global nominal bond yields fell and global equities posted modest gains. The Fund is designed to take equal risk from three different asset classes: equity risk (global developed and emerging equities), fixed income risk (global developed nominal bonds), and inflation risk (commodities, inflation linked bonds and emerging currencies). The Fund utilized futures, forward foreign currency contracts and swaps to gain its long exposure to the various underlying assets. These derivative positions are responsible for most of the performance in the Fund.
The equity risk allocation contributed +3.2% to the Fund over the year as most developed and emerging markets posted positive returns. The nominal bond risk positions contributed +9.9% over the year as global bonds rallied strongly in 2014 after a disappointing 2013. The inflation risk positions detracted -5.1% from the Fund, with declines from commodities and gains from inflation linked bonds; emerging currencies were essentially flat. Commodities detracted -6.8% as commodity markets overall were down substantially during the year, driven by significant declines in energies on a glut of supply; inflation linked bonds contributed +1.7% during the year as real yields fell and despite global inflation remaining muted.
Curian/AQR Risk Parity Fund

**60% MSCI All Country World Index, 40% Barclays Global Aggregate Hedged Index
Average Annual Total Returns* | |
| 1 Year | | | 7.95 | % | |
Since Inception | | | 6.60 | % | |
(Inception date September 16, 2013) | |
Past performance is not predictive of future performance. Investment return and principal value will fluctuate so that an investor's shares, when redeemed, may be worth more or less than their original cost. Performance numbers are net of all Fund operating expenses, but not do not reflect the deduction of insurance charges.
*The Fund's investment adviser waived certain expenses of the Fund. Performance results shown reflect the waiver, without which they would have been lower.

Curian/Ashmore Emerging Market Small Cap Equity Fund
Ashmore Equities Investment Management (US) LLC.
(Unaudited)
Market Summary: Emerging markets ("EM") finished the year down -2.19% according the MSCI Emerging Markets Index. Markets were subject to swings in sentiment as investors responded to the prospect of war in Eastern Europe and the Middle East, speculation on China's growth and a changing political landscape. Several factors came into play late in 2014, notably a dramatic fall in oil prices alongside a significant slide on the Russian Ruble against the U.S. Dollar. As investors fretted over the energy price war between the Organization of the Petroleum Exporting Countries ("OPEC") and non OPEC member states, markets sold off heavily in EM, particularly for oil producing countries.
Small caps seemed to miss much of the speculative moves this year, finishing up 1.01% according to the MSCI Emerging Markets Small Cap Index. Volatility was also measurably lower, registering approximately 9.4% versus 13.9% for its large cap peers.
Russian small caps have been the worst performers, finishing down -63.16% as investors reacted to increased and sustained sanctions following incursions into Ukraine, a slowing economy, a weakening currency and the drop in oil prices, all pointing to recession and the prospect for further earnings downgrades. China small caps also disappointed on poor consumer spending, down -0.39% as the crackdown in corruption and slowing property prices dampened consumer sentiment.
Indian small caps had a spectacular run this year following Modi's convincing win in the general elections in May. The market has been the subject of a sustained rally as local investors returned in earnest, driving the market up strongly. Turkey has also benefitted from a turn in sentiment, mainly as a benefactor of lower oil prices and improving resultant current account deficit.
Philippines finished up 28.24%, while Malaysia dropped by over 10.43%, and Peru had resilient earnings and lower sensitivity to lower commodity prices, finishing up nearly 5.98%.
Portfolio Composition†:
Financials | | | 27.7 | % | |
Consumer Discretionary | | | 21.2 | | |
Industrials | | | 19.6 | | |
Information Technology | | | 15.9 | | |
Materials | | | 7.5 | | |
Health Care | | | 4.5 | | |
Consumer Staples | | | 2.4 | | |
Short Term Investments | | | 1.2 | | |
Total Investments | | | 100.0 | % | |
†Total Investments as of December 31, 2014.
Portfolio Manager Commentary: For the year ended December 31, 2014, Curian/Ashmore Emerging Market Small Cap Equity Fund underperformed its benchmark by posting a return of -9.54% compared to 1.01% for the MSCI Emerging Markets Small Cap Index.
We have long anticipated Chinese government stimulus efforts would eventually convince investors of China's underlying economic strengths and the precipitous run up in holdings
such as property developer Sunac China Holdings Ltd. and financial services firm Noah Holdings Ltd. – ADS which contributed positively to relative performance in the fourth quarter and the full year. China overall detracted from performance for the year, however, due largely to some consumer discretionary holdings as well as information technology stocks including online property listing service Soufun Holdings Ltd. – ADR and cloud computing service provider 21Vianet Group Inc. – ADR.
Russia and Brazil were key headwinds to the Fund's relative performance for the year. We owned regional airline Aeroflot – Russian Airlines OJSC ("Aeroflot") before Russia's annexation of Crimea. Aeroflot is trading at historically low valuations and our experience through similar crises over more than two decades tells us that the stock will rebound when the macro uncertainties subside. In Brazil, consumer spending has been weak, leading to declines in some of our key holdings in auto parts companies, such as Iochpe-Maxion SA and Tupy SA, though they derive a substantial portion
of their revenues outside Brazil. We are holding onto these stocks. Brazilian educational company Gaec Educacao SA was a positive contributor during the year as government support through the FIES student loan program supported growth in its business.
By the end of 2014, we had significantly increased our positioning in financials, including Indonesia's Bank Tabungan Negara Persero Tbk PT. Indonesia is a net oil importer that benefits from low oil prices. We also sold out of all companies in energy in the third quarter, just ahead of the further decline in oil prices.
We firmly believe there is more positive news to come as election uncertainties fade and China's stimulus efforts take hold. EM economies have the financial strength to promote growth and reformist governments have the mandates to improve business and operating conditions. Valuations are not stretched and the earnings outlook is set to improve.
Curian/Ashmore Emerging Market Small Cap Equity Fund
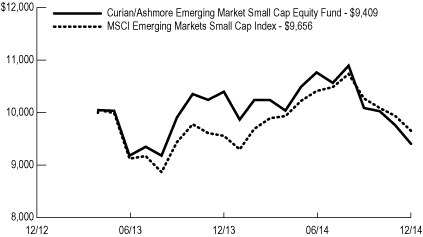
Average Annual Total Returns | |
| 1 Year | | | -9.54 | % | |
Since Inception | | | -3.57 | % | |
(Inception date April 29, 2013) | |
Past performance is not predictive of future performance. Investment return and principal value will fluctuate so that an investor's shares, when redeemed, may be worth more or less than their original cost. Performance numbers are net of all Fund operating expenses, but not do not reflect the deduction of insurance charges.

Curian/Baring International Fixed Income Fund
Baring International Investment Ltd.
(Unaudited)
Market Summary: Since peaking at the end of 2013, government bond yields have been trending lower. This theme has been most pronounced in Europe, specifically the Eurozone, but also applies to the U.S., UK and Japan. Central banks have remained accommodative amid a slower pace of global growth and a lack of inflationary pressures. Global economic divergence has however intensified in the latter part of the year. The U.S. and the UK have led global growth in 2014, while the Eurozone and Japan continued to lag behind. This has also led to divergent monetary policy expectations. The U.S. Federal Reserve ("Fed") is expected to raise interest rates in mid 2015, while in contrast, poor growth and disinflation pose big challenges for the Eurozone. Downside surprises to inflation in various euro area countries led to fresh lows in core and peripheral government bond yields. Spain's progress on economic reforms was acknowledged by Moody's who upgraded the country's sovereign rating from Baa3 to Baa2.
Elsewhere, the UK government bond market had a positive year, despite a marked improvement in the economy as investors reappraised the timing of the first interest rate hike. The Bank of England's ("BoE") message reinforced the growing market perception that interest rate rises are going to come "later" rather than "sooner". The BoE's most recent inflation forecasts are for a later realization of their +2% target which is now projected for the fourth quarter of 2017 rather than the third quarter.
The U.S. Dollar appreciated against most major currencies, both developed and emerging, over the course of the year. The weakest currencies were those which are highly correlated with the oil price (Norwegian Krone and the Mexican Peso). The falling oil price was a major driver of both bond and currency markets in the latter part of the year. The Organization of the Petroleum Exporting Countries' decision not to coordinate a cut in oil production in November exacerbated the already sharp fall in the oil price.
Portfolio Composition†:
Government Securities | | | 86.6 | % | |
Financials | | | 10.7 | | |
Utilities | | | 0.6 | | |
Telecommunication Services | | | 0.3 | | |
Short Term Investments | | | 1.8 | | |
Total Investments | | | 100.0 | % | |
†Total Investments as of December 31, 2014.
Portfolio Manager Commentary: For the year ended December 31, 2014, Curian/Baring International Fixed Income Fund outperformed its benchmark by posting a return of -2.59% compared to -2.68% for the Citigroup World Government Bond ex-U.S. Index.
Country allocation decisions was the main contributing factor to outperformance, specifically, the Fund's consistent underweight position in Japan. Even though yields fell in Japan, it was to a lesser extent than other major markets. We were also able to capture the strong performance in the
UK bond market, through our overweight allocation. Our strategic positioning in emerging markets was also beneficial. We bought South African government bonds on weakness and exited the market following a substantial rally, avoiding the ensuing market weakness. The South African bond market has recently been affected by falling commodity prices.
In currencies, the Fund's exposure in U.S. Dollars was a major contributor to positive performance. The prevailing environment was positive for the U.S. Dollar, and it appreciated against all major currencies over the year. The Fund's underweight Japanese Yen exposure also contributed positively. The Japanese Yen fell to a seven year low against the U.S. Dollar as the Bank of Japan announced an expansion of its quantitative easing program.
On the negative side, the Fund's exposure to commodity related currencies hurt relative performance due to their weakness in recent months. The Norwegian Krone has been particularly vulnerable
to the collapse in oil price. In an unexpected move, the Norges Bank cut its deposit rate by -0.25% to 1.25% in December. The statement acknowledged that "growth prospects for the Norwegian economy have weakened," with the "sharp fall in oil prices likely to amplify this tendency."
The Fund's defensive duration position detracted overall, as yields declined in most major markets. Negative returns came from the Fund's lack of duration in the UK and in Australia (we are allocated in the shorter part of the yield curve). Although this was partially offset by a positive contribution from an overweight level of duration in Japan (where we are positioned in longer maturities).
Foreign exchange forwards were important instruments in enabling the manager to activate and dynamically manage the Fund's currency positions both for relative overweighting and underweighting versus the benchmark and at times, independently of the underlying bond position.
Curian/Baring International Fixed Income Fund

Average Annual Total Returns | |
| 1 Year | | | -2.59 | % | |
Since Inception | | | -3.78 | % | |
(Inception date April 29, 2013) | |
Past performance is not predictive of future performance. Investment return and principal value will fluctuate so that an investor's shares, when redeemed, may be worth more or less than their original cost. Performance numbers are net of all Fund operating expenses, but not do not reflect the deduction of insurance charges.

Curian/BlackRock Global Long Short Credit Fund
BlackRock Financial Management, Inc.
BlackRock International Limited
(Unaudited)
Market Summary: Looking at 2014 as a whole, equities were one of the best performing asset classes. For fixed income, 2014 was a year for duration and rate sensitive assets. Going into the year, few investors expected interest rate sensitive fixed income to outperform; however the Barclays Aggregate Index was one of the best performing fixed income indices, benefiting from the 10-year U.S. Treasury yield falling 87 basis points ("bps") during the year.
It was a tale of two halves for credit markets, the first half of the year witnessing spread tightening and a favorable environment for credit despite some pockets of volatility. However, the second half of the year marked a broad based selloff in credit as a confluence of events drove credit spreads wider despite positive fundamentals. First, concerns over valuations appearing stretched were a negative factor, then came heavy new issue supply which was met by retail outflows and then came global growth woes and a breakdown in commodity prices. Credit spreads widened meaningfully the second half of the year – well over 100 bps in some cases.
Long Investments Portfolio Composition†:
Financials | | | 21.1 | % | |
Consumer Discretionary | | | 12.4 | | |
Non-U.S. Government Agency ABS | | | 11.9 | | |
Government Securities | | | 8.4 | | |
Telecommunication Services | | | 5.9 | | |
Industrials | | | 3.9 | | |
Health Care | | | 3.8 | | |
Information Technology | | | 3.7 | | |
Energy | | | 3.3 | | |
Materials | | | 2.7 | | |
Consumer Staples | | | 1.5 | | |
Utilities | | | 1.3 | | |
Short Term Investments | | | 20.1 | | |
Total Long Investments | | | 100.0 | % | |
Short Investments Portfolio Composition†:
Financials | | | 39.2 | % | |
Government Securities | | | 34.6 | | |
Telecommunication Services | | | 6.0 | | |
Consumer Staples | | | 5.3 | | |
Materials | | | 3.5 | | |
Information Technology | | | 3.0 | | |
Consumer Discretionary | | | 2.5 | | |
Health Care | | | 2.5 | | |
Energy | | | 2.2 | | |
Industrials | | | 1.2 | | |
Total Short Investments | | | 100.0 | % | |
†Total Long Investments represent 113.4% of net assets and Total Short Investments represent (15.8%) of net assets as of December 31, 2014.
Portfolio Manager Commentary: For the year ended December 31, 2014, Curian/BlackRock Global Long Short Credit Fund outperformed its benchmark by posting a return of 1.19% compared to 0.03% for the BofA Merrill Lynch U.S. 3-Month Treasury Bill Index.
For the first half of the year, the Fund was on pace for another strong year of total returns, navigating bouts of volatility early in the year quite well. Being a Fund whose returns are driven primarily by credit risk, the second half of the year was marked by participation (although limited) in the credit selloff.
In the Fund, European strategies outperformed U.S. strategies modestly. The largest overall contrib-
utor to returns was positioning in European bank debt up and down the capital structure. Early in the year, the Fund favored subordinated debt, where capital raising would provide a boost to the existing securities. Later in the year, exposure to covered bonds was a strong contributor as the European Central Bank ("ECB") embarked on a purchase program in the asset class. With 2014 being such a volatile year for credit, carry strategies were an important contributor to returns. Throughout the course of the year, the Fund was long bank loans (through leveraged loans and collateralized loan obligations ("CLOs") as well as enhanced equipment trust certificates ("EETCs"). These assets are fairly low volatility and held up well from a price perspective while providing income to the Fund. Additionally, despite the volatility in broad credit markets, long positions in select U.S. higher quality high yield issuers remained a positive contributor throughout the year, with security selection incredibly important. Rounding out the contributors were absolute return strategies, which included trading strategies in European convertible bonds, a strategy in Spanish covered bonds versus senior unsecured bank debt and long/short trading strategies in U.S. industrials. This included positioning around a merger in the telecommunications/cable sectors early in the year and identifying tactical crossover and capital structure trades in information technology the second half of the year.
Active detractors for the year included tactical long positioning within energy, which was reduced with the move in oil, as well as a broad European crossover high yield short expressed throughout the year. We continue to see value in that trade given the levels where European high yield is trading. Finally, broad market hedges through equity put options were an overall detractor given the rally in U.S. and European equities during the year.
Initially during the year we expected to see a decrease in beta and carry driven opportunities and an increase in absolute return opportunities, driven by a pick up in merger and acquisition activity. However, during the year these themes did not pan out as much as anticipated. In the U.S., we continued to express beta via broad exposures to high yield and investment grade cash bonds (primarily financial names); however, we actively
decreased risk in these positions over the summer as we began to see an increase in volatility. In high yield, we shifted exposure into credit default swaps, a more liquid expression of high yield risk, on fears that the bond market could experience a pull back. Given heightened volatility in markets, we continued to look for high carry, low volatility strategies in leveraged loans, CLOs and EETCs. Finally, in absolute return strategies we positioned tactically around opportunities in information technology. In Europe, we rotated the Fund's exposure in European bank debt following a variety of catalysts and positive performance. We also sought opportunities in high yield cash bonds while generally remaining short the crossover index, which has traded very tightly. In sovereigns we were tactical with respect to positioning and while our fundamental view is biased toward owning private sector credit, we lifted our short positions at several points during the year to take advantage of positive technical and macro catalysts. We also continued to exercise convertible bond trading strategies and looked to optimize our credit versus equity exposures.
From a fundamental perspective credit remains attractive and, given spread widening seen in the fourth quarter, the asset class has cheapened. However, as we enter 2015, evolving monetary policy regimes are diverging globally. Measures undertaken by the ECB have created a powerful technical backdrop to the European credit market with asset purchases and negative interest rates broadly increasing the demand for high quality spread products in Europe. As a result, we continue to believe there is an increased opportunity in Europe versus U.S. credit markets, though we are selectively finding pockets of value domestically. Looking ahead we believe ongoing global uncertainty and mispricing should create dislocation and therefore opportunities for the Fund, both idiosyncratic and event orientated.
As part of its investment strategy, the Fund uses derivatives to fully hedge against duration (sensitivity to interest rate movements) and currency risk. The Fund may also employ credit derivatives in order to express a positive or negative on a particular issuer or sector, or to hedge or manage overall credit risk.

Curian/BlackRock Global Long Short Credit Fund (continued)
BlackRock Financial Management, Inc.
BlackRock International Limited
(Unaudited)
Curian/BlackRock Global Long Short Credit Fund
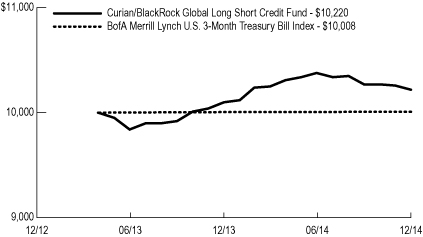
Average Annual Total Returns | |
| 1 Year | | | 1.19 | % | |
Since Inception | | | 1.31 | % | |
(Inception date April 29, 2013) | |
Past performance is not predictive of future performance. Investment return and principal value will fluctuate so that an investor's shares, when redeemed, may be worth more or less than their original cost. Performance numbers are net of all Fund operating expenses, but not do not reflect the deduction of insurance charges.

Curian/CenterSquare International Real Estate Securities Fund
(Formerly, Curian/Urdang International REIT Fund)
CenterSquare Investment Management, Inc.
(Unaudited)
Market Summary: During the year, though the broader equity markets performed well across almost all regions, concerns about the global economy and earnings growth coincided with weaker international markets in late 2014. The Euro Area Consumer Price Index entered negative territory in December at -0.2% with year over year inflation at 0.3%. International government stimulus has been implemented in such countries as Japan with Prime Minster Shinzo Abe announcing on December 27 an emergency stimulus package to help lift the recession-hit Japanese economy. In addition, the Singapore Purchasing Managers' Index ("PMI") saw a drop in output from factories in December due to slower export orders.
The global real estate markets outperformed the broader equity markets during the year. Australia, the UK and Hong Kong led the listed real estate markets (in U.S. Dollar terms). Australia outperformed on relatively strong economic data as investors continue to exhibit a large appetite for yield. Europe was strong in local currency terms, but the lackluster economic backdrop and the announcement by the European Central Bank of likely quantitative easing in 2015 led to currency declines. Japan significantly underperformed as the Japanese Yen weakened, and fiscal and monetary intervention has failed to kick start the economy so far.
Portfolio Composition†:
Financials | | | 99.9 | % | |
Short Term Investments | | | 0.1 | | |
Total Investments | | | 100.0 | % | |
†Total Investments as of December 31, 2014.
Portfolio Manager Commentary: For the year ended December 31, 2014, Curian/CenterSquare International Real Estate Securities Fund underperformed its benchmark by posting a return of 0.80% compared to 3.22% for the FTSE EPRA/NAREIT Developed ex. U.S. Index.
Sector selection generated positive alpha but stock selection and currency effect hurt the Fund, and the Fund's small cash position hurt performance in a rising market. Positive sector selection was driven by the Fund's allocation to Japan with additional positive performance generated from Canada, the UK and Europe. Allocations to Hong Kong, which saw a decline in retail sales in response to the 75-day Occupy Central movement, and Australia, detracted from performance.
Stock selection within Singapore, Japan, Australia and Canada all detracted from performance though this was significantly offset by our selection within Europe. In Europe, overweight positions to German residential company GAGFAH SA and Swedish names Kungsleden AB ("Kungsleden") and Wihlborgs Fastigheter AB outperformed. The Fund's underweight to Mitsubishi Estate Co. Ltd. also contributed strongly to performance though this was offset by negative performance of the overweight positions to Sumitomo Realty & Development Co. Ltd. and Mitsui Fudosan Co. Ltd.
During the year, significant changes in the Fund occurred in Hong Kong/China, which included increasing the Fund's exposure to the landlord and developer companies. This included purchasing more of developer names such as Sun Hung Kai Properties Ltd. and adding Kerry Properties Ltd. and Henderson Land Development Co. Ltd. to the Fund while selling some of Wharf Holdings Ltd. and Sino Land Company Limited. Within Hong Kong landlords, we added to Hong Kong Land
Holdings Ltd. while trimming our exposure to Link Real Estate Investment Trust. In Europe, we purchased Klepierre while reducing our exposure to Unibail-Rodamco SE. Throughout the year we also added Kungsleden, Corio NV, Deutsche Annington Immobilien SE and Citycon OYJ to the Fund while moving out of Mobimo Holdings AG and Eurocommercial Properties NV – CVA. In Japan, we added Orix JREIT Inc., Nippon Prologis REIT Inc. and Kenedix Residential Investment Corp. while selling out of Japan Real Estate Investment Corp. and GLP J-REIT.
We continue to focus on bottom-up stock picking, where there are still opportunities to buy quality stocks at reasonable valuations, and capitalize on regions and sectors where the conditions for real estate investment remain attractive in spite of economic weakness. At the end of the year we remain with a reduced overweight to the UK and have moved to an overweight to Hong Kong while we are underweight to Canada, Europe, Singapore, and Japan and are neutral to Australia.
Curian/CenterSquare International Real Estate Securities Fund

Average Annual Total Returns | |
| 1 Year | | | 0.80 | % | |
Since Inception | | | -3.56 | % | |
(Inception date April 29, 2013) | |
Past performance is not predictive of future performance. Investment return and principal value will fluctuate so that an investor's shares, when redeemed, may be worth more or less than their original cost. Performance numbers are net of all Fund operating expenses, but not do not reflect the deduction of insurance charges.

Curian/DFA U.S. Micro Cap Fund
Dimensional Fund Advisors LP
(Unaudited)
Market Summary: The U.S. market had positive performance for 2014, outperforming both non-U.S. developed and emerging markets. Using the Russell 3000 Index as a proxy, U.S. markets gained 12.56%, as compared to -4.45% for the MSCI World ex USA IMI Index and -1.79 % for the MSCI Emerging Markets IMI Index. Asset class returns ranged from 13.45% for large cap value stocks as measured by Russell 1000 Value Index to 3.15% for microcap value stocks as measured by Russell Micro Cap Value Index. The strongest performing sectors were real estate investment trusts ("REITs") and utilities, while energy was the only sector to post a negative return for the year.
Along the market capitalization dimension, small caps as measured by the Russell 2000 Index underperformed large caps as measured by the Russell 1000 Index by 8.35% for the year.
Value stocks generally outperformed growth stocks among large cap stocks, while underperforming among small and microcaps. Using the Russell Indexes as proxies, large cap value stocks as measured by the Russell 1000 Value Index outperformed growth stocks as measured by the Russell 1000 Growth Index by 0.40%, and the Russell Midcap Value Index outperformed the Russell Midcap Growth Index by 2.85%, while small value stocks as measured by the Russell 2000 Value Index underperformed small growth stocks as measured by the Russell 2000 Growth Index by 1.38%.
Along the profitability dimension, the top quartile of most profitable stocks in the Russell 1000 outperformed the bottom quartile of least profitable stocks among large caps (excluding REITs and utilities). Among small caps in the Russell 2000, excluding REITs and utilities, the most profitable quartile underperformed the least profitable quartile.
Portfolio Composition†:
Information Technology | | | 17.3 | % | |
Financials | | | 17.0 | | |
Industrials | | | 16.7 | | |
Consumer Discretionary | | | 14.3 | | |
Health Care | | | 9.4 | | |
Materials | | | 5.0 | | |
Consumer Staples | | | 3.1 | | |
Energy | | | 3.1 | | |
Utilities | | | 1.9 | | |
Telecommunication Services | | | 1.6 | | |
Short Term Investments | | | 10.6 | | |
Total Investments | | | 100.0 | % | |
†Total Investments as of December 31, 2014.
Portfolio Manager Commentary: For the year ended December 31, 2014, Curian/DFA U.S. Micro Cap Fund underperformed its primary
benchmark by posting a return of 2.05% compared to 3.66% for the Russell Micro Cap Index. The Fund also underperformed its other benchmark, the Russell 2000 Index, which returned 4.89%.
Underperformance was generally attributable to two distinguishing features of the Fund compared to the Russell 2000 Index: the general exclusion of REIT securities and the Fund's focus on the microcap asset category within small caps. The general exclusion of REITs, one of the best performing equity categories in 2014, detracted from performance versus the Russell 2000 Index.
Additionally, while the Russell 2000 Index includes some exposure to microcap stocks, the Fund targets these securities as a part of its fundamental strategy. Microcap securities represented approximately 94% of the Fund's holdings,
compared to approximately 57% of the Russell 2000 Index and their underperformance detracted from the Fund's performance relative to the Russell 2000 Index.
Both the Fund and the Russell Micro Cap Index target microcap companies and both held more than 94% of their weighting in this category during the year. Within microcap stocks, REITs outperformed most other asset types and their exclusion by the Fund detracted from relative performance. While more profitable microcap stocks generally underperformed during the year, detracting from the Fund's relative performance, the reverse was true within information technology. Consequently, the Fund benefited from a greater allocation to high profitability names in information technology.
Curian/DFA U.S. Micro Cap Fund

Average Annual Total Returns | |
| 1 Year | | | 2.05 | % | |
Since Inception | | | 18.59 | % | |
(Inception date September 10, 2012) | |
Past performance is not predictive of future performance. Investment return and principal value will fluctuate so that an investor's shares, when redeemed, may be worth more or less than their original cost. Performance numbers are net of all Fund operating expenses, but not do not reflect the deduction of insurance charges.

Curian/DoubleLine Total Return Fund
DoubleLine Capital LP
(Unaudited)
Market Summary: The U.S. Treasury yield curve flattened over the year in 2014 with longer term maturity Treasuries declining significantly. The 10-year U.S. Treasury yield declined by 87 basis points ("bps") year-over-year and ended the year at 2.17%. The Barclays U.S. Mortgage Backed Securities Index returned 6.08% for the year while the duration of the index declined by 1.28 years to 4.34 years. The meaningful decline in duration was caused by the low rate environment which in turn resulted in mildly faster prepayment speeds across all Agencies (Fannie Mae ("FNMA"), Freddie Mac ("FHLMC") and Ginnie Mae). Prepayment speeds experienced some variability during the year but ended the year close to where it began with FNMA and FHLMC prepayment speeds increasing by approximately 1 conditional prepayment rate despite a 70 bps drop in the 30 year mortgage rate. The minimal change in speeds is directly related to the concept of the "burnout effect" in which borrowers who can refinance have already done so in periods of sustained lower rates. This is further evidenced by the drop in the MBA Refinancing Index which has declined to its lowest levels over the year of 2014. Issuance for the year ended just shy of one trillion, which is about 60% of prior year's issuance numbers. This is consistent with prepayment activity being relatively stable for the most of the year as a lack of higher prepayment activity normally results in lower gross issuance.
Portfolio Composition†:
U.S. Government Agency MBS | | | 51.7 | % | |
Non-U.S. Government Agency ABS | | | 36.4 | | |
Government Securities | | | 4.9 | | |
Short Term Investments | | | 7.0 | | |
Total Investments | | | 100.0 | % | |
†Total Investments as of December 31, 2014.
Market Summary: For the year ended December 31, 2014, Curian/DoubleLine Total Return Fund outperformed its benchmark by posting a return of 6.49% compared to 5.97% for the Barclays U.S. Aggregate Bond Index. Due to the
decline in longer maturity U.S. interest rates, Agency residential mortgage backed securities led the outperformance of the Fund over the year benefiting from longer durations. On a total return basis, Agency inverse floating rate securities were the best performers due to its relatively longer duration, while inverse interest only bonds ended the year as a close second. Inverse interest only and inverse floaters have persistently contributed strong income as LIBOR remains low. Fixed rate Agency bonds additionally added moderate price appreciation over the year due to their relatively longer durations. Within the non-Agency portion
of the Fund, all sectors across the credit quality spectrum experienced positive returns, but Alt-A bonds gained the most. The sector remains favorable in terms of valuations as little new issuance in the space have helped buoy pricing. Commercial mortgage backed securities held in the Fund were positive adding high coupon returns and price increases over the year. Collateralized loan obligations had a historically high year of issuance and ended 2014 slightly wider than the beginning of the year due to a deluge of new issuance supply.
Curian/DoubleLine Total Return Fund

Average Annual Total Returns* | |
| 1 Year | | | 6.49 | % | |
Since Inception | | | 4.99 | % | |
(Inception date September 16, 2013) | |
Past performance is not predictive of future performance. Investment return and principal value will fluctuate so that an investor's shares, when redeemed, may be worth more or less than their original cost. Performance numbers are net of all Fund operating expenses, but not do not reflect the deduction of insurance charges.
*The Fund's investment adviser waived certain expenses of the Fund. Performance results shown reflect the waiver, without which they would have been lower.

Curian/Eaton Vance Global Macro Absolute Return Advantage Fund
Eaton Vance Management
(Unaudited)
Market Summary: For 2014, asset prices generally moved higher, with broad emerging markets ("EM") a notable exception, as actions by major central banks, diverging economic trends and the collapse of oil prices influenced investors.
In the U.S., economic data improved during the year and the dramatic decline of oil prices created an additional tailwind for the consumption-driven economy. As a result, the U.S. Federal Reserve ended its bond purchasing program in October, as expected, and continued to lead markets to expect policy rate increases in the middle of 2015. On the other hand, falling oil prices led markets to become increasingly concerned with disinflationary trends in both the Eurozone and Japan – fearing oil could potentially lead to a deflationary spiral. In Japan, the economy was also struggling with a slide into recession as the impact from a consumption tax increase in April was stronger than expected. In response, additional stimulus announcements from the European Central Bank and the Bank of Japan resulted in a generally positive environment for developed market risk assets.
While China's slowing economy was a primary consideration earlier in the year, emerging markets were particularly influenced by falling oil prices during the second half of the year, while numerous elections also impacted sentiment during the year. Countries that export oil broadly experienced sharp declines in asset prices, with Russia – in combination with Western sanctions in response to violence in eastern and southern Ukraine – being the most notable. Of note, both India and Indonesia elected new political leaders considered to be market friendly, while Brazil reelected President Rousseff, who is generally unpopular with investors.
Against this backdrop, the U.S. Treasury yield curve flattened and U.S. credit spreads generally narrowed while bond prices in both Europe and Japan broadly rallied and U.S. Dollar strengthened versus these, and other, developed market currencies. Overall, local interest rates were mixed while equities, credit spreads and currencies were generally weaker across EM. Commodity prices tumbled during the year, largely driven by collapse of oil prices.
Portfolio Composition†:
Government Securities | | | 60.0 | % | |
Purchased Options | | | 2.4 | | |
Financials | | | 1.5 | | |
U.S. Government Agency MBS | | | 1.0 | | |
Industrials | | | 1.0 | | |
Energy | | | 0.6 | | |
Investment Companies | | | 0.6 | | |
Telecommunication Services | | | 0.1 | | |
Short Term Investments** | | | 32.8 | | |
Net Long (Short) Investments | | | 100.0 | % | |
†Net Long (Short) Investments as of December 31, 2014.
**In general, the Fund gains exposure to asset classes by investing in a number of different types of derivative instruments. Please refer to the Schedule of Investments for the Fund's derivative investments.
Portfolio Manager Commentary: For the year ended December 31, 2014, Curian/Eaton Vance Global Macro Absolute Return Advantage Fund outperformed its primary benchmark by posting a return of 4.73% compared to 0.03% for the BofA Merrill Lynch U.S. 3-Month Treasury Bill Index. The Fund underperformed one of its other benchmarks the HFRI Macro Index, which returned 6.38% and outperformed its other bench-
mark, the Credit Suisse Global Macro Hedge Fund Index, which returned 3.11%.
In Asia, currency positions contributed the most to regional performance. Rates trades detracted from regional performance, driven by losses on short Japanese duration.
Credit investments led positive performance in Eastern Europe. Currency positions also contributed to regional gains led by a short Russian Ruble position and long Serbian Dinar versus the Euro trade. Equity investments also contributed to performance. The region suffered losses on its rates trades.
Two positions drove gains in the Dollar Bloc, namely short Australian dollar and long New Zealand rates.
Short currency positions in Western Europe led regional gains. Performance was muted by a short Spanish credit position and short UK rates.
The Fund's long credit positions in the Middle East and Africa mostly contributed to regional gains while a long Iraqi credit position detracted. The Fund's short South African Rand currency investment and long Lebanese Pound positions contributed positively. Short credit positions in the region detracted from performance.
Latin America detracted on the whole from
Fund performance. Long positions in the Mexican Peso and Chilean Peso detracted as did long credit positions in Ecuador and Venezuela. Gains in the region were predominantly driven by long credit positions in Jamaica, Paraguay and Barbados.
Regarding exposure, the Fund reduced its net short currency position as additional long U.S. Dollar positions were added during the year. The Fund's credit spread duration became less negative as attractive country by country credit opportunities presented themselves. The Fund's interest rate duration remained fairly close to zero with a bias to be short where there is very limited room for further compression, while long in countries with room to cut rates and where recent price movements in oil provide the disinflationary pressure to catalyze a loosening of monetary policy.
The Fund typically employs significant use of derivative instruments both to gain exposure as well as hedge. The decision to utilize cash instruments or derivatives is based on relative value and efficiency as deemed by the management team. The Fund primarily uses foreign exchange forward contracts and credit default swaps. It may also use interest rate swaps, interest rate futures, bond futures, equity index futures, and options, among others.
Curian/Eaton Vance Global Macro Absolute Return Advantage Fund
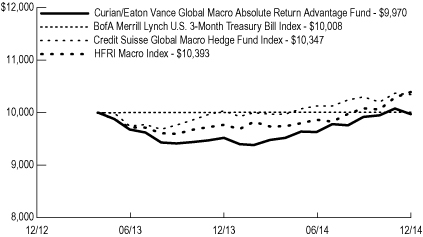
Average Annual Total Returns | |
| 1 Year | | | 4.73 | % | |
Since Inception | | | -0.18 | % | |
(Inception date April 29, 2013) | |
Past performance is not predictive of future performance. Investment return and principal value will fluctuate so that an investor's shares, when redeemed, may be worth more or less than their original cost. Performance numbers are net of all Fund operating expenses, but not do not reflect the deduction of insurance charges.

Curian/Epoch Global Shareholder Yield Fund
Epoch Investment Partners, Inc.
(Unaudited)
Market Summary: Global equity markets were mixed in 2014 amid an increase in volatility. In the U.S., large cap stocks hit new highs and achieved double digit returns for 2014. The U.S. Treasury yield curve flattened as the U.S. Federal Reserve set the stage for short term rates to rise while long term yields trended lower. Real gross domestic product was positive and November marked the tenth consecutive month of job gains over 200,000 and an all time record of 50 consecutive months of job gains. The unemployment rate declined to 5.6% at the end of December.
Disappointing economic data in the Eurozone, Japan and China was countered by moves toward more accommodative monetary policies in those regions. Sovereign bond yields fell from already low levels. European stocks were hindered by concerns that the Eurozone may have slipped into its third recession in six years. Japan's economy slid back into recession following its April consumption tax increase and emerging markets declined sharply in Europe and Latin America, especially in U.S. Dollar terms.
Portfolio Composition†:
Utilities | | | 17.1 | % | |
Telecommunication Services | | | 14.3 | | |
Consumer Staples | | | 13.4 | | |
Financials | | | 10.6 | | |
Energy | | | 8.1 | | |
Industrials | | | 7.3 | | |
Health Care | | | 6.3 | | |
Consumer Discretionary | | | 5.9 | | |
Materials | | | 5.5 | | |
Information Technology | | | 4.0 | | |
Short Term Investments | | | 7.5 | | |
Total Investments | | | 100.0 | % | |
†Total Investments as of December 31, 2014.
Portfolio Manager Commentary: For the year ended December 31, 2014, Curian/Epoch Global Shareholder Yield Fund outperformed its benchmark by posting a return of 6.05% compared to 4.94% for the MSCI World Index.
The Fund's returns are primarily the result of finding companies that can grow their free cash flow and are committed to returning a significant portion of that cash to shareholders. The vast majority of stocks in the Fund were able to achieve this and increase their dividends during the year. We believe understanding this steady approach is more helpful to understanding returns than parsing returns in terms of sector weights and relative returns within those sectors. That said, sector commentary may provide additional insight if it is viewed in the proper context for this strategy.
Relative performance was helped by the Fund's overweight position in utilities which outperformed the returns of the overall market during the year. Stock selection in energy, consumer staples and financials also provided a significant contribution. From a country perspective, security selection within the U.S. and the UK helped relative results, as did a lack of exposure to Japan. Among the stocks that provided the most significant
contribution were Health Care REIT Inc., Altria Group Inc. and Reynolds America Inc., while Mattel Inc., Electricite de France SA and Centrica Plc detracted from results.
Sector weights are generally a function of our bottom-up stock selection process. During the year, the Fund's largest reduction in exposure was in industrials, consumer discretionary and health care. Sector weightings within financials, consumer staples and utilities experienced the largest increase. At the end of the year, the Fund's largest overweight positions were in utilities and telecommunication services, while the largest underweight positions were in information technology and financials. The Fund continues to seek attractive returns through a diversified group of companies focused on generating significant free cash flow and returning it to shareholders through a combination of dividends, share repurchases and debt reduction.
Curian/Epoch Global Shareholder Yield Fund
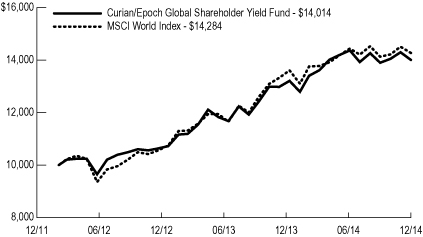
Average Annual Total Returns | |
| 1 Year | | | 6.05 | % | |
Since Inception | | | 12.34 | % | |
(Inception date February 6, 2012) | |
Past performance is not predictive of future performance. Investment return and principal value will fluctuate so that an investor's shares, when redeemed, may be worth more or less than their original cost. Performance numbers are net of all Fund operating expenses, but not do not reflect the deduction of insurance charges.

Curian/FAMCO Flex Core Covered Call Fund
Fiduciary Asset Management LLC
(Unaudited)
Market Summary: 2014 was another strong year for stocks as the S&P 500 Index produced a total return of 13.69%, the third straight annual return over 10% since the 1990s. Large capitalization, strong balance sheets and stable earnings were key factors for companies that outperformed the market during the year.
Stock market returns were nearly flat through mid October 2014 as many uncertainties weighed on the markets. The Ebola scare dominated headlines along with political uncertainty around the November elections. The stock market benefited from strong fundamentals during the second half of the year. 80% of S&P 500 Index companies reported earnings that exceeded analyst expectations, the second consecutive quarter with such positive earnings surprises. Compared to 2013, earnings grew 9.1% and sales grew 4.0%.
Looking into 2015, consensus forecasts anticipate gross domestic product ("GDP") growth near 3.0%, which would be the highest annual rate since 2005. Economists estimate that the drop in gasoline prices is the equivalent of a $150 billion tax cut, assuming prices remain below $2 per gallon during the year. The majority of U.S. Federal Reserve ("Fed") members expect to raise short term interest rates in 2015. If this is indeed the case, we expect stocks to produce acceptable returns. Over the past 25 years, the S&P 500 Index has provided positive returns in the six month period before and after Fed's initial rate hike.
Corporations have done an excellent job navigating the ups and downs of the current cycle. The large corporations we track have been continually cutting costs and improving efficiency throughout their organizations, resulting in record profit margins for companies in the S&P 500 Index. The strong corporate earnings resulted in a forward price/earnings multiple of 17.0 at year end, in line with multiples from past cycles. Balance sheets are healthy, dividends have been growing from record levels, and share buybacks have continued.
Portfolio Composition†:
Industrials | | | 22.4 | % | |
Consumer Staples | | | 16.8 | | |
Consumer Discretionary | | | 16.4 | | |
Information Technology | | | 14.6 | | |
Health Care | | | 9.5 | | |
Financials | | | 7.7 | | |
Telecommunication Services | | | 4.4 | | |
Energy | | | 3.6 | | |
Materials | | | 2.7 | | |
Short Term Investments | | | 1.9 | | |
Total Investments | | | 100.0 | % | |
†Total Investments as of December 31, 2014.
Portfolio Manager Commentary: For the year ended December 31, 2014, Curian/FAMCO Flex Core Covered Call Fund outperformed its benchmark by posting a return of 8.84% compared to 5.64% for the CBOE S&P 500 BuyWrite Index.
Superior stock selection and an actively managed call option strategy were the primary
drivers of excess performance during the year. The 320 basis points of outperformance were split nearly evenly between stock selection and call option alpha.
The Fund invests in a diversified portfolio of large capitalization domestic equity securities from high quality, industry leading companies. This Fund is combined with an active covered call writing strategy on each individual equity holding in order to generate call premium income. The income from the call options can help stabilize Fund returns by mitigating some of the losses during declining equity markets. Over a market cycle, the strategy seeks to produce equity like returns with lower volatility, resulting in an improved Sharpe ratio.
During 2014, stock selection was strong in the Fund's overweight sectors of industrials, consumer staples and consumer discretionary. Low interest rates and gasoline prices below $2 per gallon result in our continuing to overweight the consumer sectors. During the fourth quarter, we moved
toward companies that will benefit from lower energy prices. We continue to underweight energy, due to the potential for further price declines, and financials, due to lower quality earnings and weak bank lending. An underweight allocation detracted from performance in utilities, which was the top performing sector for the year.
The call options in the Fund outperformed the call options in the CBOE S&P 500 BuyWrite Index during 2014. At year end, the call options in the Fund averaged 2.8% out of the money with maturities averaging 5.0 months. While the call options added alpha during the first three quarters of 2014, the majority of the outperformance came during the fourth quarter. During the fourth quarter, the Fund tended to have more downside protection during the market declines and more upside participation during the market rallies, relative to the benchmark, a testament to the benefits of actively managing the call options.
Curian/FAMCO Flex Core Covered Call Fund
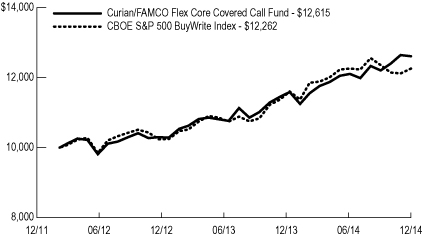
Average Annual Total Returns | |
| 1 Year | | | 8.84 | % | |
Since Inception | | | 8.34 | % | |
(Inception date February 6, 2012) | |
Past performance is not predictive of future performance. Investment return and principal value will fluctuate so that an investor's shares, when redeemed, may be worth more or less than their original cost. Performance numbers are net of all Fund operating expenses, but not do not reflect the deduction of insurance charges.

Curian Focused International Equity Fund
WCM Investment Management
(Unaudited)
Market Summary: Overall, 2014 was quite a contrast to 2013, with international markets down a few percent as opposed to 2013's positive 20% returns. In the first third of the year the patterns of 2013 persisted: small cap outperformed large cap, developed markets outperformed emerging markets and value outperformed growth; all headwinds for this Fund. By the middle third of the year conditions began to change and fundamentals mattered again. The Fund began to gain ground against the benchmark. In the final third of the year the impact of the dramatic oil price decline was quite noticeable and growth greatly outperformed value. Coupled with solid stock selection, the Fund outperformed for the full year, delivering what we think is a hallmark of the strategy: a positive result when the markets lose ground.
We expect the recent bouts of volatility to persist over the coming year, as the market digests the various global macro cross currents (prospect of U.S. Federal Reserve tightening, European Central Bank quantitative easing, oil price and currency volatility, etc.). We believe these are the periods in which stock selection matters most, and we can exploit this with our concentrated portfolio approach. Companies with growing moats are able to accelerate their competitive advantages during volatile macro periods, as they are able to fully capitalize on growth opportunities while peers are playing defense and/or dealing with internal issues. This was in evidence in 2014, particularly in the fourth quarter: most of our Funds' companies were able to widen their growth gap relative to gross domestic product and industry rates.
Portfolio Composition†:
Industrials | | | 20.3 | % | |
Information Technology | | | 19.3 | | |
Consumer Staples | | | 15.7 | | |
Health Care | | | 11.0 | | |
Materials | | | 10.1 | | |
Financials | | | 8.8 | | |
Consumer Discretionary | | | 6.8 | | |
Energy | | | 2.8 | | |
Rights | | | 0.2 | | |
Short Term Investments | | | 5.0 | | |
Total Investments | | | 100.0 | % | |
†Total Investments as of December 31, 2014.
Portfolio Manager Commentary: For the year ended December 31, 2014, Curian Focused International Equity Fund outperformed its benchmark by posting a return of -0.94% compared to -3.87% for the MSCI All Country World ex USA Index.
Stock selection overall was positive, adding about +170 basis points ("bps") to the outperformance. Stand outs were industrials and health care. Weak spots were consumer discretionary
and consumer staples. Allocation overall was also positive, adding about +270 bps. Overweights to information technology ("IT") and health care plus underweights to energy and materials were contributors. Underweights to financials, utilities and telecommunications services were modest detractors. Even though allocation dominated this year, we still expect our process to deliver outperformance primarily due to stock selection. Regionally, selection was positive and broad based, with strength in North America, the Far East and Western Europe.
At year end exposure to emerging markets ("EM") was about 16% compared to the benchmark at 20%. That's well below the Fund's long term average of around 25%. Since EM outperformed developed markets in 2014, this was a slight headwind for the Fund. Also at year end, the largest relative overweight sectors are IT (+14%) and industrials (+10%). The largest underweights are financials (-18%) and telecommunications services (-5%). Finally, at year end the Fund held 30 companies in the product, across 8 sectors, in 23 industries, from 17 countries, denominated in
11 different currencies.
Turnover for the year was 18%. New purchases include Denmark's Chr Hansen Holding A/S (January), the leading maker of enzymes and cultures for dairy (yogurt) products; Yandex NV (April), Russia's biggest Internet company and the leading search engine; UK based Reckitt Benckiser Group Plc (July), a maker of personal health and hygiene products; Swatch Group AG (September), Switzerland's largest watch maker; and Ireland's Experian plc (December), the world's largest supplier of credit data on consumers and businesses. Sales included Brasil Foods SA – ADR (February), MercadoLibre Inc. (May), Covidien Plc (July), and ASOS Plc ("ASOS") (September).
Top stock specific detractors were ASOS (-300 bps), Core Laboratories NV (-126 bps), and Svenska Cellulosa AB (-99 bps). Top stock specific contributors were Sysmex Corp. (+143 bps), Taiwan Semiconductor Manufacturing Co. Ltd. – ADR (+141 bps), and Canadian Pacific Railway Co. (+135 bps).
Curian Focused International Equity Fund

**Effective April 28, 2014, the Fund changed its primary benchmark from the MSCI EAFE Index to the MSCI All Country World ex USA Index because the MSCI All Country World ex USA Index better reflects the Fund's asset class exposure and risk profile.
Average Annual Total Returns* | |
| 1 Year | | | -0.94 | % | |
Since Inception | | | 3.25 | % | |
(Inception date September 16, 2013) | |
Past performance is not predictive of future performance. Investment return and principal value will fluctuate so that an investor's shares, when redeemed, may be worth more or less than their original cost. Performance numbers are net of all Fund operating expenses, but not do not reflect the deduction of insurance charges.
*The Fund's investment adviser waived certain expenses of the Fund. Performance results shown reflect the waiver, without which they would have been lower.

Curian Focused U.S. Equity Fund
The London Company of Virginia, LLC
(Unaudited)
Market Summary: The S&P 1500 Index was up 13.08% during 2014. For the year, large cap stocks significantly outperformed small cap stocks. Other factors that impacted performance for the year were growth outperforming value, low beta over high beta, and high quality over low quality. Size had the largest impact on absolute performance with the Russell 1000 Index outperforming the Russell 2000 Index by over 800 basis points ("bps").
In 2014, the S&P 1500 Index was led higher by utilities and health care while energy and telecommunication services lagged. The Fund underperformed the S&P 1500 Index for the year driven by both poor stock selection and sector allocation.
While we do not attempt to forecast the future, we remain fairly optimistic. Corporate America is in good shape with high operating margins and strong balance sheets. The economic recovery continues with improvement in employment, capital investment and a generally benign interest rate and inflation outlook. We expect the slow growth environment to continue and believe stocks could be more volatile in the future. Our approach is to own companies with strong returns on capital and flexibility to enhance shareholder value using the balance sheet.
Organic growth remains difficult to produce, so the market's separation between the haves and have nots could rise. Our goal is to structure the Fund to withstand almost all environments and perform well across the full market cycle. We wear our long viewed lenses when thinking about the value of the Fund and are not blinded by relatively short swings in the market's printed prices. Stock selection has driven historical alpha and we expect that to continue.
Portfolio Composition†:
Financials | | | 20.3 | % | |
Consumer Discretionary | | | 16.8 | | |
Industrials | | | 12.5 | | |
Materials | | | 12.1 | | |
Information Technology | | | 8.2 | | |
Energy | | | 6.4 | | |
Health Care | | | 5.7 | | |
Consumer Staples | | | 4.3 | | |
Short Term Investments | | | 13.7 | | |
Total Investments | | | 100.0 | % | |
†Total Investments as of December 31, 2014.
Portfolio Manager Commentary: For the year ended December 31, 2014, Curian Focused U.S. Equity Fund underperformed its benchmark by posting a return of 3.52% compared to 13.08% for the S&P 1500 Index.
The predominant driver of underperformance in the year was stock selection although sector allocation was a detractor as well. A major factor affecting the market during the year was the fall in oil prices, causing energy to decline -8.7% in the S&P 1500 Index. The more defensive utilities and health care sectors led the market for the year.
The best performing sectors for the S&P 1500 Index were utilities, health care and information technology ("IT"). The Fund had no exposure to
utilities and was underweight health care and IT. Conversely, the weakest sectors in the index were energy, telecommunication services and materials. The Fund was underweight energy and telecommunication services and overweight materials.
Poor sector allocation in health care, materials and IT was only partially offset by positive sector allocation in energy, telecommunication services and financials.
Stock selection in consumer discretionary, energy and IT hindered performance while stock selection in industrials, consumer staples and materials benefited performance.
In terms of overall effect, consumer discretionary, IT and health care were the top detractors and industrials, consumer staples and telecommunications services were the largest contributors to performance.
The best performing stocks relative to the benchmark were: Old Dominion Freight Line Inc. ("Old Dominion Freight"), General Dynamics Corp. ("General Dynamics"), Corning Inc. ("Corning"), Dollar Tree Inc. ("Dollar Tree") and Lorillard Inc. ("Lorillard"). Old Dominion Freight steadily increased all year as the company posted strong results driven by its best in class, service focused model. General Dynamics was strong all year due to its improving backlog and consistently solid results. Corning demonstrated some pricing improvement in its display business during the
year. Dollar Tree posted the majority of its gains late in the year reflecting strong same store sales growth and improving operating margins. Lorillard outperformed throughout the year as speculation about a potential acquisition drove the stock higher.
The weakest performing stocks were Sturm Ruger & Co. Inc. ("Sturm Ruger"), Atwood Oceanics Inc. ("Atwood Oceanics"), Smith & Wesson Holding Corp. ("Smith & Wesson"), Cabela's Inc. ("Cabela's") and Albemarle Corp. ("Albemarle"). Sturm Ruger was weak most of the year reflecting the slowdown in gun sales. Atwood Oceanics underperformed during the second half of the year due to weakness in offshore drilling rig day rates driven by the decline in oil prices. Smith & Wesson was weak as gun/ammo demand was down significantly this year following the elevated level of purchasing in recent years. Cabela's shares were weak most of the year as same store sales were weaker than expected. Albemarle traded lower following the announcement of its plans to acquire Rockwood Holdings Inc.
During the year, the Fund sold or trimmed positions in Hershey Co., Cintas Corp., Columbia Sportswear Co., Advent Software Inc., Corning and FedEx Corp. and established positions in Pulte Homes Inc., Tredegar Corp., USG Corp., Apache Corp, and Eli Lilly & Co.
Curian Focused U.S. Equity Fund

Average Annual Total Returns* | |
| 1 Year | | | 3.52 | % | |
Since Inception | | | 10.35 | % | |
(Inception date September 16, 2013) | |
Past performance is not predictive of future performance. Investment return and principal value will fluctuate so that an investor's shares, when redeemed, may be worth more or less than their original cost. Performance numbers are net of all Fund operating expenses, but not do not reflect the deduction of insurance charges.
*The Fund's investment adviser waived certain expenses of the Fund. Performance results shown reflect the waiver, without which they would have been lower.

Curian/Franklin Templeton Frontier Markets Fund
Templeton Asset Management Ltd.
(Unaudited)
Market Summary: Frontier market stocks performed well during the first three quarters of 2014 as they generally remained less sensitive to the uncertainties surrounding major central banks' monetary policies. Despite concerns about the U.S. Federal Reserve possibly raising interest rates sooner than expected, heightened geopolitical tensions in several regions and moderating global economic growth, frontier market stocks generally trended higher through September.
However, frontier market stocks pulled back in 2014's final quarter as events in crude oil markets pressured energy stocks. The Organization of the Petroleum Exporting Countries' decision to maintain production levels despite a global oversupply of oil led prices to fall more than 40% in 2014's fourth quarter. Stocks retreated in two major oil producing frontier market countries, Kuwait and Nigeria. Nigeria's market decline was more severe because, with the country's weaker financial position, the oil price shock immediately pressured its currency, resulting in devaluation, emergency tax hikes and interest rate increases. Other frontier markets with significant oil and gas interests also lost ground, including Saudi Arabia, Kazakhstan and Bahrain. Ukrainian stocks declined as a result of the country's ongoing crisis with Russia.
Despite this correction, frontier market stocks, as measured by the MSCI Frontier Markets Index, ended 2014 with a 6.84% total return. Top performers included South Asian markets Bangladesh and Sri Lanka, which benefited from political stability, economic restructuring, aid packages from China and Japan and increasing investor interest. Kenya advanced as constructive discussions with the International Monetary Fund ("IMF") on an economic program and standby aid facility provided a "safe-haven" appeal to investors. Pakistan benefited from a positive IMF report, a successful sukuk (Islamic bond) offering that reinforced its fiscal position, and, as a major oil importer, from lower oil prices. Argentina performed well in spite of downbeat economic reports and a technical debt default, as foreign exchange restrictions reduced alternative investment opportunities for domestic investors.
Portfolio Composition†:
Financials | | | 26.3 | % | |
Energy | | | 19.7 | | |
Telecommunication Services | | | 17.4 | | |
Consumer Staples | | | 10.0 | | |
Materials | | | 9.7 | | |
Consumer Discretionary | | | 5.0 | | |
Industrials | | | 3.7 | | |
Health Care | | | 3.6 | | |
Short Term Investments | | | 4.6 | | |
Total Investments | | | 100.0 | % | |
†Total Investments as of December 31, 2014.
Portfolio Manager Commentary: For the year ended December 31, 2014, Curian/Franklin Templeton Frontier Markets Fund underperformed its benchmark by posting a -14.98% compared to 6.84% for the MSCI Frontier Markets Index.
Geographically, a relatively low allocation to Kuwait, which underperformed the benchmark, was a leading contributor to relative performance. An allocation to Egypt and a lack of exposure to Bahrain also helped relative results. Kenya and Vietnam contributed as stock selection more than offset the negative allocation effects. In sector terms, stock selection in consumer staples and
health care, as well as our weighting in consumer discretionary, aided relative performance.
Notable individual contributors included our off benchmark investments in Egyptian International Pharmaceutical Industrial Co., a leading Egyptian pharmaceuticals company; Eastern Tobacco, a major Egyptian tobacco company; and Indus Motor Co. Ltd., Toyota's joint venture partner for manufacture and distribution of passenger cars and light commercial vehicles in Pakistan.
In contrast, key relative detractors included allocations to the United Arab Emirates ("UAE"), Qatar, Saudi Arabia and Colombia. Stock selection in the UAE, Qatar, Ukraine, Argentina, Kazakhstan and Nigeria also hindered relative results. In sector terms, major detractors included stock selection in financials, materials, telecommunication services and industrials, as well as our allocation and stock selection in energy.
Key individual detractors included the Fund's off benchmark investments in Ferrexpo Plc, one of the world's leading iron ore companies, with its main assets located in Ukraine; African Minerals Ltd., a UK listed minerals exploration and development company with significant interests in Sierra Leone; and Pacific Rubiales Energy Corp.,
Colombia's largest independent oil and gas exploration and production company.
During the year, the U.S. Dollar appreciated against most foreign currencies, which also hurt the Fund's performance because investments in securities with non U.S. currency exposure lost value as the U.S. Dollar rose.
Significant share redemptions during the year led us to conduct sales across most markets and sectors. We undertook some of the largest reductions in Qatar and Nigeria. Additionally, we made sales in other markets, including Kenya, the UAE, Vietnam and Panama. In sector terms, we reduced positions largely in financials, telecommunication services, materials and industrials.
Consistent with our bottom-up investment approach, our continued search for what we considered underappreciated stocks with attractive valuations led us to initiate exposures to Cambodia and Botswana. Furthermore, we increased our positions in other markets, including Kuwait and Sierra Leone.
At year end, the Fund's largest sector holdings were in financials, energy and telecommunication services. Geographically, the Fund's largest weightings were in Nigeria, Romania and Egypt.
Curian/Franklin Templeton Frontier Markets Fund

Average Annual Total Returns | |
| 1 Year | | | -14.98 | % | |
Since Inception | | | 2.18 | % | |
(Inception date September 10, 2012) | |
Past performance is not predictive of future performance. Investment return and principal value will fluctuate so that an investor's shares, when redeemed, may be worth more or less than their original cost. Performance numbers are net of all Fund operating expenses, but not do not reflect the deduction of insurance charges.

Curian/Franklin Templeton Natural Resources Fund
Franklin Advisers, Inc.
(Unaudited)
Market Summary: The global economy grew moderately during 2014. U.S. economic growth trends were generally encouraging as economic activity expanded. The U.S. Federal Reserve ended its asset purchase program in October while keeping interest rates low. The UK economy grew relatively well, but Eurozone economic growth remained subdued. The European Central Bank reduced its main interest rate and implemented an asset purchase program. Japan's economy entered a recession, and the Bank of Japan expanded its stimulus measures. Global developed market stocks advanced overall during the year amid a generally accommodative monetary policy environment and continued strength in corporate earnings. In several emerging markets ('EM"), economic growth generally moderated, with Brazil a notable exception. EM stocks overall fell for the year, amid headwinds such as soft domestic demand, weak exports, plummeting crude oil prices, regional geopolitical tensions and concerns about possible U.S. interest rate increases.
Global commodities overall experienced the largest annual decline since 2008's global financial crisis as a worldwide oil surplus spurred a rout in crude oil prices and a stronger U.S. Dollar reduced commodities' investment appeal. A generally moderating global economy and growing production led to excess supply in oil, coal, iron ore and other commodities. U.S. Dollar priced commodities became more expensive for non U.S. buyers as the U.S. Dollar appreciated against most foreign currencies, driven in part by the U.S. economy's fastest growth rate in more than a decade. Gold prices ended the year lower amid benign global inflation and a strong U.S. Dollar.
Portfolio Composition†:
Energy | | | 69.0 | % | |
Materials | | | 19.2 | | |
Short Term Investments | | | 11.8 | | |
Total Investments | | | 100.0 | % | |
†Total Investments as of December 31, 2014.
Portfolio Manager Commentary: For the year ended December 31, 2014, Curian/Franklin Templeton Natural Resources Fund underperformed its benchmark by posting a return of -20.60%, compared to -9.77% for the S&P North American Natural Resources Sector Index.
The Fund's focus on small and mid capitalization companies that in our view have higher long term growth potential differed from the natural resources index's heavy weighting in large capitalization, income oriented companies that in our view have more limited growth opportunities. In a weak commodity price and low interest rate environment when investors focused on short term safety and high dividend yield, this difference detracted from the Fund's relative performance. The Fund's larger weightings outside North America and energy compared to the benchmark also hurt results as North American energy
companies in certain industries had more stable performance in 2014.
Oil and gas exploration and production was a significant detractor from absolute and relative results as our holdings in small and mid cap companies underperformed their large cap counterparts in the benchmark. Natural gas focused companies performed well in the year's first half but suffered from mild summer weather and reduced natural gas demand. Key underperformers included Rex Energy Corp., which is not part of the benchmark, and Southwestern Energy Co.
Diversified metals and mining, which has a small index weighting, hampered relative results as fears of slowing economic growth in China weighed on commodity prices. Key detractors included BHP Billiton Plc – ADR (Australia), which is not part of the benchmark, and Teck Resources Ltd. (Canada).
A lack of ownership in midstream companies (oil and gas storage and transportation) also hurt relative results as investors favored such companies for their relatively high dividend yields.
The Fund had several contributors to relative performance, including an underweighting in oil and gas drilling, which was the worst performing industry, as well as positions in several gold
companies that performed well. The Fund's holdings in chemicals industries also helped relative results, driven by commodity chemicals company LyondellBasell Industries NV, fertilizers and agricultural chemicals producer Potash Corporation of Saskatchewan Inc., and specialty chemicals manufacturer Celanese Corp., which is not part of the benchmark.
In our view, much as in 2008 when commodities and commodity stocks fell in value, 2014 presented similar investment opportunities that the Fund's strategy is designed to benefit from. We actively added to positions whose price weakness, in our assessment, could lead to stronger performance in the longer term, as was the case following the 2008 global financial crisis. We favored companies that in our view could weather commodity weakness and thrive in a recovery scenario. Critical to this assessment was in depth, fundamental research to identify companies we view as having among the lowest production costs and greatest balance sheet flexibility. Many high quality companies that fit this description have become more attractively valued to us over the past several months and we are seeking to increase exposure at a pace commensurate with our views on near term downside risks.
Curian/Franklin Templeton Natural Resources Fund
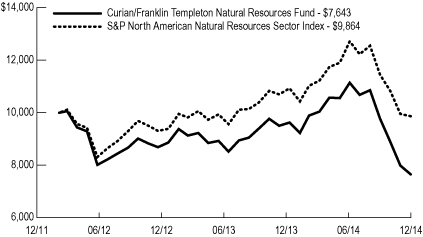
Average Annual Total Returns | |
| 1 Year | | | -20.60 | % | |
Since Inception | | | -8.85 | % | |
(Inception date February 6, 2012) | |
Past performance is not predictive of future performance. Investment return and principal value will fluctuate so that an investor's shares, when redeemed, may be worth more or less than their original cost. Performance numbers are net of all Fund operating expenses, but not do not reflect the deduction of insurance charges.

Curian/Lazard International Strategic Equity Fund
Lazard Asset Management LLC
(Unaudited)
Market Summary: International equity markets rose slightly in local currencies in 2014, but fell in U.S. Dollar terms as the U.S. currency saw strong inflows. This was driven by the mix of economic data for the year, with broadly encouraging macroeconomic signs from the U.S. prompting the end of quantitative easing ("QE") from the U.S. Federal Reserve, while in Europe, China and Japan the situation was reversed. Weak economic data all year eventually prompted QE speculation in the Eurozone, a cut in interest rates in China, and the delay of a rise in consumption tax in Japan.
Commodities fell broadly in 2014. For industrial commodities such as iron ore, this was driven by the structural slowing of Chinese demand, just as years of high mining capex were starting to produce a supply response. From September, we witnessed the collapse of the oil price, as softening demand met the surge in U.S. shale supply, and then an unexpected change in the Organization of the Petroleum Exporting Countries ("OPEC") policy. Previous expectations were for a cut in supply to support prices. Instead OPEC discussed the maintenance of market share. As a result, the oil price has now halved in a matter of months. For global consumers, and for major oil importing countries like India, this is an unambiguous positive. The losers are oil exporting countries such as Russia, and those areas reliant on oil industry spend. For the U.S., the boom in shale oil has been a key driver of economic recovery, but its consumers are significant beneficiaries of the falling price of gasoline. Deflationary forces remain strong. With growth disappointing in most geographies, and commodity prices falling, cyclical sectors generally performed poorly in 2014. Energy stocks fell sharply, while mining and many industrial companies also came under pressure. Banks continued to struggle in an environment of low growth and very low interest rates, exacerbated by relentless regulatory pressure. The stronger sectors were the more defensive and high yielding areas such as consumer staples, health care, and utilities.
Portfolio Composition†:
Financials | | | 22.8 | % | |
Consumer Discretionary | | | 19.8 | | |
Health Care | | | 15.9 | | |
Industrials | | | 8.6 | | |
Consumer Staples | | | 8.6 | | |
Materials | | | 7.7 | | |
Telecommunication Services | | | 6.1 | | |
Energy | | | 4.8 | | |
Short Term Investments | | | 5.7 | | |
Total Investments | | | 100.0 | % | |
†Total Investments as of December 31, 2014.
Portfolio Manager Commentary: For the year ended December 31, 2014, Curian/Lazard International Strategic Equity Fund outperformed its benchmark by posting a return of -1.42% compared to -4.90% for the MSCI EAFE Index.
In energy, the Fund benefited from its very low exposure to the companies hurt most by the falling oil price, while Australian fuel marketer Caltex Australia Ltd. was a beneficiary of its major restructuring initiatives, as well as the oil environment. In materials, Australian packaging company Amcor Ltd. and German flavor maker Symrise AG reported encouraging results, while the Fund had little exposure to falling commodity materials and mining companies. Stock selection in health care was strong, as Swiss pharmaceutical company Novartis AG reported very encouraging results from an acute heart failure drug, while private hospital operator Spire Healthcare Group Plc rose from an unduly depressed initial public offering valuation. Elsewhere during 2014, Associated British Foods Plc benefited from a material rerating of its discount apparel retailer Primark Stores Ltd. Stock selection in financials also helped performance.
Performance in consumer discretionary stocks was mixed. Strong profits and share price rises were seen at Japanese retailers Don Quijote Holdings Co. Ltd. and Ryohin Keikaku Co. Ltd., global sportswear brand Asics Corp., auto supplier Valeo SA, and U.S. jeweler Signet Jewelers Ltd. after its takeover of key rival Zales Corporation. In contrast, Sands China Ltd. suffered from continuing weak activity in Macau, Volkswagen AG struggled to feed its cost savings into profits and the Fund's media holdings, such as Informa Plc, generally suffered from the weak cyclical rebound in activity.
On the negative side, SoftBank Corp. suffered from lower profit guidance at its U.S. subsidiary Sprint Corporation, where the new management is rightly looking to build scale before rebuilding margins, while aerospace manufacturer Airbus Group NV gave a very disappointing profit outlook. Testing company Applus Services SA reported delays in its key pipeline inspection business, while the Fund also suffered from its low exposure to utility stocks.
Corporate profitability and balance sheets are still in extremely good shape. If this profitability can be sustained in an environment of gently improving, developed market growth, then equities may still offer attractive valuations compared to the low returns available in other asset markets. In many cases share prices today appear dependent on a continuation of these very low interest rates, which presents some dangers.
In the Eurozone, the structural reforms being implemented in Greece and Spain are encouraging and we are starting to see these economies stabilize and return to growth. In the U.S., a housing recovery allied to low cost gas and labor is
encouraging. In China, despite the latest stimulus, growth is likely to be structurally lower in the future as the economy is close to the limits of its historic model based on low cost labor and very high fixed asset investment. The aggressive Japanese monetary experiment has achieved its initial aim of lifting asset prices and depressing the Japanese Yen, but now needs to feed into wage growth if we are to see a sustainable end to deflation. Structural reforms are key to longer term prospects here. Following the withdrawal of QE, we have seen a sharp rise in the U.S. Dollar, and may potentially see rising U.S. yields, which will likely have a negative impact on a number of related debt and equity markets outside of the U.S.
The Fund's management team continues to focus on stock selection, seeking to find stocks with sustainably high or improving returns trading at attractive valuations and remain confident that the strong track record of the Fund will continue in a variety of market conditions.

Curian/Lazard International Strategic Equity
Fund (continued)
Lazard Asset Management LLC
(Unaudited)
Curian/Lazard International Strategic Equity Fund

Average Annual Total Returns | |
| 1 Year | | | -1.42 | % | |
Since Inception | | | 8.34 | % | |
(Inception date April 29, 2013) | |
Past performance is not predictive of future performance. Investment return and principal value will fluctuate so that an investor's shares, when redeemed, may be worth more or less than their original cost. Performance numbers are net of all Fund operating expenses, but not do not reflect the deduction of insurance charges.

Curian Long Short Credit Fund
PPM America, Inc.
(Unaudited)
Market Summary: U.S. fixed income performed resiliently during the year, and in stark contrast with 2013, higher quality credits generally outperformed lower quality segments. For instance, the Barclays U.S. Aggregate Bond Index advanced 5.97%, and the Barclays U.S. Corporate Investment Grade Index gained 7.46%, while the Bank of America ("BofA") Merrill Lynch U.S. High Yield Master II Index returned 2.51%, and the S&P/LSTA Leveraged Loan Index delivered 1.60%. For most of the year, interest rates drifted lower, aiding higher quality fixed income's performance. Compared to 2013 year end, five and 10-year U.S. Treasury yields ended 10 basis points ("bps") and 87 bps lower, respectively.
Slowing global growth, heightened geopolitical tensions, fears of deflation and plummeting oil prices were among the factors that contributed to investors' demand for the relative safety of U.S. Treasuries. These issues pressured Treasury yields downward despite the conclusion of quantitative easing, improving U.S. economic health and the anticipation of an increase in the federal funds rate in the coming year. However, in December third quarter gross domestic product was revised upward to 5%, the biggest quarterly gain since 2006, reinforcing previous indications of domestic economic improvement and encouraging short term rates upward.
Though low interest rates provided a favorable tailwind for U.S. fixed income assets, corporate bond yields failed to follow Treasury yields lower, resulting in wider credit spreads. Investment grade and high yield corporate credit spreads increased 14 bps and 104 bps, respectively, during the year as measured by Barclays U.S. Credit Index and BofA Merrill Lynch U.S. High Yield Master II Index. High yield spread widening was exacerbated by a structural reduction in market liquidity, which diminished broker dealers' ability to behave as market makers. While wider spreads reflected investors' more cautious sentiment toward risk, many credit supportive themes remained prevalent during the year. These included reasonable corporate credit metrics, low borrowing costs and the absence of a material increase in defaults.
In tandem with largely weak global growth, developed economies' government bond yields worldwide were generally pressured downward, aiding investment grade bonds' performance. In U.S. Dollar terms, the Barclays Global Aggregate Bond Index generated a total return of 0.59% during the year. Broad spread tightening also marginally contributed to index performance; spreads decreased 4 bps relative to 2013 year end.
In local currency terms and by geographical region, U.S. issues delivered +5.97% (USD), Asian Pacific issues generated 6.28% (Yen) and Pan European issues returned 12.44% (Euro). Strong performance results in the U.S. and Asian Pacific regions were primarily driven by declining interest rates, whereas Pan European returns were also positively influenced by tightening credit spreads. However, as the Barclays Global Aggregate Bond Index performance is commonly reported in U.S. Dollar terms, both Asian Pacific and Pan European components of the index detracted from aggregate returns due to U.S. Dollar appreciation throughout the year.
Portfolio Composition†:
Financials | | | 25.9 | % | |
Consumer Discretionary | | | 17.8 | | |
Energy | | | 15.1 | | |
Health Care | | | 6.9 | | |
Materials | | | 6.3 | | |
Industrials | | | 6.2 | | |
Telecommunication Services | | | 4.7 | | |
Utilities | | | 4.5 | | |
Consumer Staples | | | 3.9 | | |
Non-U.S. Government Agency ABS | | | 3.2 | | |
Information Technology | | | 2.4 | | |
Investment Companies | | | 0.2 | | |
Short Term Investments | | | 2.9 | | |
Total Investments | | | 100.0 | % | |
†Total Investments as of December 31, 2014.
Portfolio Manager Commentary: For the year ended December 31, 2014, Curian Long Short Credit Fund underperformed its benchmark by posting a return of -1.43% compared to 0.03% for the BofA Merrill Lynch U.S. 3-Month Treasury Bill Index.
In light of the market's relatively poor risk sentiment during the year, the Fund's investment results were negatively impacted by its exposure to corporate credit and short position in Treasuries. Within the Fund's exposure to corporate bonds, high yield bonds and energy securities drove underperformance. Energy holdings were hurt by the sharp decline in world oil prices. Furthermore, a long position in the high yield credit default swap index and exposure to floating rate bank loans, which suffered price declines due to poor technical conditions, negatively influenced performance. Since Treasury rates fell throughout the year, Treasury futures also detracted from performance, as we largely hedged out the Fund's interest rate risk. Exposure to preferred stock and structured products, commercial mortgage backed securities and asset backed securities positively influenced performance.
Though we are cognizant of ongoing global uncertainties, we expect the U.S. economy to grow moderately over the next 12-24 months, and that as a result, interest rates are likely to be biased
upward. Because the Fund is relatively flexible, we think it has the potential to outperform more traditional fixed income strategies during challenging market conditions. As interest rates may trend higher over the next 12-24 months, we will continue to hedge out interest rate risk in the Fund. The year 2014 has again illustrated the precariousness of forecasting interest rates, particularly given uncertain global growth and the pervasiveness of central banks' influence on the financial markets. Furthermore, we think that volatility is likely to persist; in the event that it does, we will take advantage of material dislocations and leverage our ability to uncover attractive long and short opportunities. Overall, the Fund anticipates remaining focused on corporate credit. Relative to the beginning of the year, the Fund selectively increased its exposure to corporate loans, as loan prices declined during the year amid resilient corporate fundamentals and traded at more attractive valuations.

Curian Long Short Credit Fund (continued)
PPM America, Inc.
(Unaudited)
Curian Long Short Credit Fund

Average Annual Total Returns | |
| 1 Year | | | -1.43 | % | |
Since Inception | | | 0.14 | % | |
(Inception date April 29, 2013) | |
Past performance is not predictive of future performance. Investment return and principal value will fluctuate so that an investor's shares, when redeemed, may be worth more or less than their original cost. Performance numbers are net of all Fund operating expenses, but not do not reflect the deduction of insurance charges.

Curian/Neuberger Berman Funds
Neuberger Berman Fixed Income LLC
(Unaudited)
Market Summary: Benign inflation, moderating growth overseas, geopolitical issues and overall strong demand triggered intermediate and longer term yields to decline in 2014. In addition, while the U.S. Federal Reserve ("Fed") concluded its third round of quantitative easing in October, it vowed to take a measured approach in terms of rates. At its meeting in December, the central bank said, "Based on its current assessment, the Committee judges that it can be patient in beginning to normalize the stance of monetary policy."
In a reversal from 2013, the yield curve flattened during the year. Most spread sectors outperformed equal duration Treasuries for the year. The best absolute performers were longer term government/credit and longer term corporate securities. In contrast, local emerging market debt and Treasury Inflation Protected Securities ("TIPS") were relative underperformers.
Following several years of subdued volatility, 2014 ended with a return to more normal levels of currency volatility. For the year, the U.S. Dollar, the New Zealand Dollar and the British Pound outperformed the other major currencies in 2014, while the Norwegian Krone, the Swedish Krona and the Japanese Yen were the worst performing currencies.
Commodities declined for the fourth consecutive year in 2014 as the asset class experienced broad based weakness across most sectors. Energy commodities were the hardest hit, with declines greater than 40% in several markets, while industrial metals, precious metals and agricultural commodities mostly retreated, albeit with a few exceptions such as nickel, zinc and soybean meal. Cattle prices and certain areas of the softs complex (cocoa and coffee) were the main areas of commodity price strength, as mostly idiosyncratic factors supported those markets. Otherwise, commodities were weakened by a combination of factors – the strength of the U.S. Dollar was chief among these, but low inflation, ample supplies in certain markets and other commodity specific factors have been at play as well.
Curian/Neuberger Berman Currency Fund
Portfolio Composition†:
Government Securities | | | 94.8 | % | |
Short Term Investments** | | | 5.2 | | |
Total Investments | | | 100.0 | % | |
†Total Investments as of December 31, 2014.
**The Fund gains exposure to currencies by investing in forward foreign currency contracts. Please refer to the Schedule of Investments for the Fund's investments in forward foreign currency contracts.
Portfolio Manager Commentary: For the year ended December 31, 2014, Curian/Neuberger Berman Currency Fund outperformed its benchmark by posting a return of 3.37% compared to 0.03% for the BofA Merrill Lynch U.S. 3-Month Treasury Bill Index.
The currency portion of the Fund, fully implemented through non deliverable foreign forward currency contracts, generated a positive
performance in 2014, with the best performing positions being the underweights in the Swiss Franc, the Australian Dollar and the Canadian Dollar. Conversely, the worst performing positions were the overweights in the Norwegian Krone and the Euro.
The fixed income portion of the Fund has been invested in U.S. government Treasuries and agencies. Given the low level of interest rates, duration has been managed conservatively.
At the end of 2014, the largest overweight exposures in the Fund were approximately 26% U.S. Dollar and 21% Norwegian Krone. Conversely, the largest underweight exposures were approximately 30% Swiss Franc and 22% Australian Dollar.
In terms of core positions, we continue to be constructive on the U.S. Dollar. Fundamentally, we believe there is little doubt that the U.S. is emerging as one of the stronger economies in the G10 space. However, we are cautious as to how the
Fed will interpret the most recent fall in energy prices and the U.S. Dollar strength. It is our belief, that renewed consumer consumption will support price developments but the extent is difficult to assess. As such, we believe that wage formation will be the key for the U.S. Dollar going forward. Additionally, the overweight in the U.S. Dollar is a consensus position by now and the risk of positioning reduction has increased. We have already noticed that the U.S. Dollar has sold off against many currencies in times of risk aversion, despite running against fundamentals. We also continue to hold a core underweight in the Swiss Franc. It has emerged that the Swiss National Bank intervened in December to keep the Euro to Swiss Franc floor intact at 1.20. However, we view the Swiss Franc as a proxy short in the Euro as the Swiss Franc is strongly correlated to the Euro but more overvalued from a long term perspective.
Curian/Neuberger Berman Currency Fund

Average Annual Total Returns | |
| 1 Year | | | 3.37 | % | |
Since Inception | | | 1.03 | % | |
(Inception date September 10, 2012) | |
Past performance is not predictive of future performance. Investment return and principal value will fluctuate so that an investor's shares, when redeemed, may be worth more or less than their original cost. Performance numbers are net of all Fund operating expenses, but not do not reflect the deduction of insurance charges.

Curian/Neuberger Berman Funds (continued)
Neuberger Berman Fixed Income LLC
(Unaudited)
Curian/Neuberger Berman Risk Balanced Commodity Strategy Fund
Portfolio Composition†:
Financials | | | 28.1 | % | |
Non-U.S. Government Agency ABS | | | 23.5 | | |
Government Securities | | | 10.3 | | |
Consumer Discretionary | | | 4.4 | | |
Information Technology | | | 4.3 | | |
Health Care | | | 3.2 | | |
Industrials | | | 3.0 | | |
Energy | | | 2.1 | | |
Utilities | | | 1.9 | | |
Consumer Staples | | | 1.6 | | |
Telecommunication Services | | | 0.7 | | |
Materials | | | 0.7 | | |
Short Term Investments | | | 16.2 | | |
Total Investments | | | 100.0 | % | |
†Total Investments as of December 31, 2014.
Portfolio Manager Commentary: For the period April 28, 2014 through December 31, 2014, Curian/Neuberger Berman Risk Balanced Commodity Strategy Fund outperformed its
benchmark by posting a return of -22.60% compare to -24.28% for the Bloomberg Commodity Index.
For the period, commodity prices have been under pressure, with the asset class finishing the year with its worst return since 2008. Nearly every commodity in the Fund was down for the period, with the exception of cattle and zinc prices. The broad based declines in commodity prices are largely attributable to the strength of the U.S. Dollar – given that most commodities are priced in U.S. Dollars, the appreciating U.S. currency not only put pressure on non U.S. consumers of commodities, for whom it is more expensive to purchase inputs, but also on the supply side as higher prices brought more supplies to market. Other factors contributing to the price weakness include benign inflationary trends, low interest rates, as well as commodity specific influences such as geopolitical and weather related factors.
The primary sector responsible for the negative performance over the period was energy. While the Fund was cutting exposure to energy in the latter part of the year, the significant price
declines in every constituent of this sector rendered this the worst performing area of the commodities complex. All other sectors except livestock contributed negatively to returns as well, but the contributions were much more muted than in energy. The Fund had slightly increased its exposure to industrial metals due to economic conditions generally being supportive of this sector, as well as lower energy input prices. Precious metals exposure also was slightly higher over the period, mostly due to technical factors, although this was a detractor from returns. Agriculture exposure declined by the end of the period. Livestock exposure was higher and contributed positively, while softs exposure was largely unchanged by year end. The Fund gains its exposure to commodities through the use of derivatives, specifically exchange traded commodity futures and forwards.
As of the end of the period, the Fund was positioned with somewhat bearish stances on natural gas, where ample supplies could have a negative impact on prices, and certain agricultural commodities, where the increase in prices may have been overdone.
Curian/Neuberger Berman Risk Balanced Commodity Strategy Fund

Total Return | |
Since Inception | | | -22.60 | % | |
(Inception date April 28, 2014) | |
Past performance is not predictive of future performance. Investment return and principal value will fluctuate so that an investor's shares, when redeemed, may be worth more or less than their original cost. Performance numbers are net of all Fund operating expenses, but not do not reflect the deduction of insurance charges.

Curian/Nicholas Convertible Arbitrage Fund
Nicholas Investment Partners, L.P.
(Unaudited)
Market Summary: As expected, U.S. economic data improved throughout the year in stark contrast to weaker global economic data and a dramatic downdraft in commodities, particularly oil, in the later part of the year. U.S. equity markets closed higher with large cap stocks the clear winner for the year. The S&P 500 Index gained 13.69% while mid cap stocks place second with the Russell Midcap Index up 13.22%. Small cap stocks lagged, with a gain of 4.89% for the year as measured by the Russell 2000 Index.
Credit markets were generally positive for the year amid a surprisingly low interest rate environment. The Barclays Corporate Investment Grade Index added 7.46% in 2014 compared to 2.45% for the Barclays U.S. Corporate High Yield Index. The U.S. 10-year Treasury Yield started the year at 3.04% and closed at 2.17%. Credit spreads for high grade and high yield widened.
Strong performance among U.S. equities and investment grade debt drove U.S. convertibles securities higher as the Merrill Lynch All Quality Convertibles Index gained 9.44% in 2014. Investment grade issues outperformed high yield issues, by nearly 2-to-1. Similarly, large cap issues significantly outperformed mid and small cap issues.
Volatility in the markets bounced around and ultimately closed higher in 2014. The Chicago Board Options Exchange Volatility Index ("VIX") began the year at 13.72, saw a low of 10.32 in early July and hit a high of 26.25 in mid October on concerns of decelerating oil prices. Oil prices plunged, particularly in the fourth quarter, falling to $53.27 per barrel at year end after starting the year at $98.42 per barrel. The VIX ultimately ended the year at 19.20.
Lastly, alternative assets were mixed and largely underperformed straight equity and fixed income assets. According to Credit Suisse Hedge Fund research, managed futures funds performed the best, with double digit returns. Most alternative strategies gained less than 6% for the year with negative results among equity market neutral, risk arbitrage, convertible arbitrage and short bias funds.
Long Investments Portfolio Composition†:
Information Technology | | | 38.1 | % | |
Health Care | | | 17.1 | | |
Consumer Discretionary | | | 12.9 | | |
Industrials | | | 10.4 | | |
Energy | | | 8.2 | | |
Financials | | | 5.3 | | |
Materials | | | 4.6 | | |
Consumer Staples | | | 1.3 | | |
Short Term Investments | | | 2.1 | | |
Total Long Investments | | | 100.0 | % | |
Short Investments Portfolio Composition†:
Information Technology | | | 40.9 | % | |
Health Care | | | 19.4 | | |
Consumer Discretionary | | | 12.6 | | |
Industrials | | | 11.4 | | |
Financials | | | 4.8 | | |
Materials | | | 4.3 | | |
Energy | | | 3.5 | | |
Consumer Staples | | | 2.0 | | |
Investment Companies | | | 1.1 | | |
Total Short Investments | | | 100.0 | % | |
†Total Long Investments represent 103.9% of net assets and Total Short Investments represent (48.4%) of net assets as of December 31, 2014.
Portfolio Manager Commentary: For the year ended December 31, 2014, Curian/Nicholas Convertible Arbitrage Fund underperformed its primary benchmark by posting a return of -1.07% compared to 0.03% for the BofA Merrill Lynch U.S. 3-Month Treasury Bill Index. The Fund outperformed its other benchmark which posted a return of -1.68% for the Credit Suisse Convertible Arbitrage Hedge Fund Index.
Over the year, the Fund's long position contributed nearly 6.1% to overall performance and the Fund's short positions subtracted roughly -4.9%. The Fund's net exposure ranged from about 51.7% – 58.0% through most of the year and a theoretical delta-adjusted net long position range that began the year at 11.8% was as low as 9.6% and closed the year with a theoretical delta adjusted net long of 13.9%.
Throughout the year, the Fund was well diversified across sectors and industries. Positive contribution to returns was broadly distributed across sectors, with the exception of the Fund's energy exposure, which declined during the fourth quarter as oil prices collapsed. On a net basis, exposures to information technology, health care and consumer discretionary were the most additive to performance for the year. At a security level, top contributing positions included DFC Global Corp.,
Horizon Pharma Inc. and Liberty Interactive LLC. The largest detractors from performance included Energy XXI Bermuda, Hornbeck Offshore Services Inc. and Cobalt International Energy Inc.
Near term, we believe sluggish growth in Europe, weakening data in China and other geopolitical events will continue to drive investor sentiment and likely increase volatility. We also recognize the potential risk the strong U.S. Dollar poses to U.S. exports and the downstream impact to U.S. growth. Falling oil prices, and eventual energy cost savings, may actually boost consumer spending.
Against this backdrop, the Fund remains fully invested, with a moderately conservative credit profile. The current yield is 1.83% with an effective duration of 2.78 years and an average credit quality of BB-. We continue to actively manage hedges of existing positions as stock prices move and as we discern changes in near term fundamentals.
With over three decades of convertibles investment experience, we understand the importance to adhere to our bottom-up investment philosophy and process in all market environments. We are confident that our convertible arbitrage strategy will achieve its objective of delivering positive absolute returns with lower volatility over a full market cycle.
Curian/Nicholas Convertible Arbitrage Fund
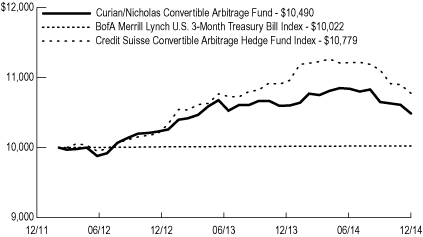
Average Annual Total Returns | |
| 1 Year | | | -1.07 | % | |
Since Inception | | | 1.66 | % | |
(Inception date February 6, 2012) | |
Past performance is not predictive of future performance. Investment return and principal value will fluctuate so that an investor's shares, when redeemed, may be worth more or less than their original cost. Performance numbers are net of all Fund operating expenses, but not do not reflect the deduction of insurance charges.

Curian/PIMCO Credit Income Fund
Pacific Investment Management Company LLC
(Unaudited)
Market Summary: Both uncertainty and volatility increased at the start of 2014 amid geopolitical tensions and weak economic data. An uncharacteristically cold winter took a toll on economic data in the U.S., resulting in a weak first quarter U.S. gross domestic product rate. On the global front, rising geopolitical tensions between Russia and Ukraine led to volatile swings in financial markets.
Despite the weak first quarter, the U.S. Federal Reserve ("Fed") continued tapering its asset purchases and remained on track to conclude their purchases by year end. The Fed also strengthened its forward guidance on the policy rate. In Fed Chairman Janet Yellen's first statement in March, the Fed placed greater emphasis on inflation and other "measures of labor market conditions" as more appropriate barometers for determining the timing of the first interest rate hike. In Europe, the European Central Bank announced new easing measures, including a historic negative rate on deposits, policy rate cut, and targeted long term refinancing operations.
Improving global economic data in the second quarter, supportive central banks and easing of global political risks led to sizable market gains overall with the S&P 500 Index hitting an all time high. Global fixed income markets also posted strong returns, benefitting from rate declines across most maturities and investors beginning to embrace the view that policy rates would remain lower than historical norms suggested.
The third quarter was marked by geopolitical tension and diverging markets. Most developed market government yields were led lower by easy central bank policies, while credit market yields backed up. Equity markets somersaulted their way to modest gains in the U.S., but were flat or slightly negative in many other regions. U.S. growth became more sure footed, but the Eurozone recovery sputtered and growth decelerated in parts of Asia.
Evidence of global growth divergence was further borne out in the final quarter of 2014, but the most defining event of the quarter was the sharp decline in oil prices and accompanying market volatility. Growth in the U.S. exceeded expectations and handily outpaced its peers in the developed world, especially Japan and Europe, which continued to struggle. The uneven growth and drop in oil led to bouts of market volatility that dissipated quickly but still managed to leave certain risk sectors bruised.
Portfolio Composition†:
Financials | | | 38.6 | % | |
Government Securities | | | 15.8 | | |
Energy | | | 8.4 | | |
Consumer Discretionary | | | 6.4 | | |
Telecommunication Services | | | 4.6 | | |
Non-U.S. Government Agency ABS | | | 3.9 | | |
Health Care | | | 3.1 | | |
Information Technology | | | 2.9 | | |
Industrials | | | 2.6 | | |
Utilities | | | 2.0 | | |
Materials | | | 1.2 | | |
U.S. Government Agency MBS | | | 1.0 | | |
Consumer Staples | | | 0.9 | | |
Purchased Options | | | 0.1 | | |
Short Term Investments | | | 8.5 | | |
Total Investments | | | 100.0 | % | |
†Total Investments as of December 31, 2014.
Portfolio Manager Commentary: For the year ended December 31, 2014, Curian/PIMCO Credit Income Fund outperformed its benchmark
by posting a return of 7.61% compared to 7.53% for the Barclays U.S. Credit Bond Index.
The investment concentration differences relative to the benchmark included an underweight to overall duration and an underweight to investment grade credit ("IGC"). The Fund also had out of index exposure to high yield and non-agency mortgage-backed securities ("MBS").
Drivers of performance relative to the benchmark resulted from the following strategies. The Fund's curve positioning, including a focus on intermediate maturities and an underweight to the long end of the curve, was negative for performance as the yield curve flattened. However, in emerging markets ("EM"), exposure to local rates in Brazil and Mexico added to returns as yields rallied over the year. An overall underweight to IGC and tactical exposure in high yield were positive for performance as IGC spreads widened and selection among financials led to favorable returns relative to the benchmark. An allocation to non-agency MBS, which were supported by limited
supply and an ongoing housing recovery, also contributed to performance. An overweight to external EM debt detracted from returns as spreads widened over the year. Lastly, defensive positioning against the Euro and Japanese Yen contributed to performance as these currencies depreciated versus the U.S. Dollar.
Derivatives were used in the Fund and were instrumental in attaining specific exposures targeted to gain from anticipated market developments. The Fund's exposure to U.S. interest rates, which was negative for returns, was partly facilitated through the use of interest rate swaps. The overweight to EM local debt, which was positive for relative performance, included exposure to local debt in Brazil that was implemented using zero coupon interest rate swaps. Additionally, exposure to the investment grade corporate sector and external EM debt that provided mixed returns over the year were implemented partially via the use of credit default swaps.
Curian/PIMCO Credit Income Fund
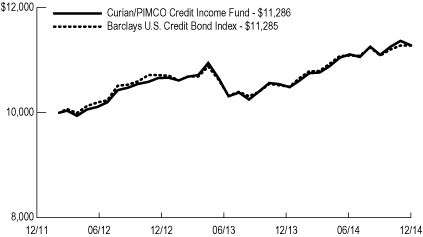
Average Annual Total Returns | |
| 1 Year | | | 7.61 | % | |
Since Inception | | | 4.26 | % | |
(Inception date February 6, 2012) | |
Past performance is not predictive of future performance. Investment return and principal value will fluctuate so that an investor's shares, when redeemed, may be worth more or less than their original cost. Performance numbers are net of all Fund operating expenses, but not do not reflect the deduction of insurance charges.

Curian/PineBridge Merger Arbitrage Fund
PineBridge Investments LLC
(Unaudited)
Market Summary: The U.S. equity markets finished 2014 with a return of 13.69% as measured by the S&P 500 Index. Still easy monetary policy, an improved pace of underlying economic activity, further multiple expansion and earnings growth drove gains. Broad macro fears including Russia policy and currency, slowing emerging market growth and oil drove a pickup in volatility during the second half of the year.
Overall deal activity measured on a transaction volume basis was up near 10% year over year. Dollar volume was up significantly, driven by a near doubling in transactions of $5 billion (or more) in total value when compared to the year prior. The top 5 transactions in terms of announced value in the post financial crisis era were launched during 2014. Low risk merger arbitrage strategy returns are driven by transaction volume, level of interest rates and deal specific risk. While transaction volumes gained, we still sit 10-15% below median levels. Low interest rates coupled with low deal volume during the first half of 2014 kept spreads tight. Encouragingly, in part due to more proper market pricing of deal risks, spreads ended the year at more attractive levels.
2014 was a challenging year for the low risk merger arbitrage market. A relatively tight spread environment was met with a challenging market with large headline deal breaks (that drove some broader spread widening during the second half of 2014). 2015, however, starts with an improved spread environment and universe of investible transactions. We're more optimistic on the environment, as the fundamentals of high cash levels on corporate balance sheets, reasonable leverage ratios and a still easy financing market are met with an improved growth picture and strong corporate confidence, as acquirers continue to be rewarded for accretive acquisitions.
Portfolio Composition†:
Health Care | | | 12.0 | % | |
Financials | | | 8.8 | | |
Information Technology | | | 8.7 | | |
Utilities | | | 6.9 | | |
Materials | | | 6.2 | | |
Energy | | | 3.8 | | |
Consumer Discretionary | | | 3.6 | | |
Short Term Investments | | | 50.0 | | |
Net Long (Short) Investments | | | 100.0 | % | |
†Net Long (Short) Investments as of December 31, 2014.
Portfolio Manager Commentary: For the year ended December 31, 2014, Curian/PineBridge Merger Arbitrage Fund underperformed its primary benchmark by posting a return of -0.60% compared to 0.23% for the BofA Merrill Lynch U.S. Dollar 3-Month Libor Constant Maturity Index. The Fund outperformed one of its other benchmarks which posted a return of -1.32% for the Credit Suisse Event Driven Risk Arbitrage Hedge Fund Index. The Fund underper-
formed its other benchmark which posted a return of 3.79% for the CISDM Merger Arbitrage Index.
The Fund executed on its disciplined investment process of seeking friendly transactions with a strong likelihood of closing, as over 90% of investments contributed to performance in 2014. The Fund's goal is to lock in spreads that exist between a deal announcement and its subsequent closure. Some of the biggest contributors to performance were the successful acquisitions of Bally Technologies Inc., UNS Energy Corp, Nordion Inc., RDA Microelectronics Inc. – ADR and Forest Laboratories Inc.
2014 presented several challenges for the Fund. With a considerable volume of deal closings met with limited investible new transactions during late 2013 and early in the first quarter of 2014, the Fund was less than optimally invested during much of the first quarter. Further, as realized gains from closed deals were put to work, the Fund faced a challenging spread environment with annualized spreads in the 1.5-2.5% range for most of the first half. We are happy to report that deal volume and
spread levels improved in the back half of the year. Importantly, the Fund avoided exposure to inversion transactions and the termination of the Shire Plc and AbbVie Inc. deal that pressured much of the peer group.
A significant component of performance is deal terminations, which will drive a stock to its predeal price. While we avoided the largest terminations of the year, the Fund unwound its position in Pinnacle Foods Inc. at a loss prior to the termination of its deal with Hillshire Brands ("Hillshire"). This transaction included stock and ultimately our short position in Hillshire at the time resulted in this transaction becoming our biggest detractor for the year, as the acquirer eventually became the target.
The Fund's low risk approach helped it navigate a challenging transaction and environment. Looking into 2015, it is our view that the underlying fundamentals of the merger and acquisition ("M&A") environment remain strong. As the spread environment and deal volumes continue to normalize, we remain optimistic with regard to the prospect for improving returns for a M&A strategy.
Curian/PineBridge Merger Arbitrage Fund

Average Annual Total Returns | |
| 1 Year | | | -0.60 | % | |
Since Inception | | | 0.14 | % | |
(Inception date February 6, 2012) | |
Past performance is not predictive of future performance. Investment return and principal value will fluctuate so that an investor's shares, when redeemed, may be worth more or less than their original cost. Performance numbers are net of all Fund operating expenses, but not do not reflect the deduction of insurance charges.

Curian/Schroder Emerging Europe Fund
Schroder Investment Management North America Inc.
(Unaudited)
Market Summary: Emerging European equities declined in 2014, precipitated by concerns over deterioration in the demand outlook from the Eurozone economy and elevated geo political risk around the situation in the Ukraine. Turkey registered strong, double digit gains and was the only country to deliver a positive return. In what was a volatile period for Turkish equities and the Turkish Lira, the market climbed higher after concerns over future U.S. Federal Reserve rate hikes dissipated somewhat and the oil price declined sharply, which is likely to support the central bank's effort to lower inflation. The Czech Republic outperformed as the local market held up relatively well, largely thanks to solid gains from utility company CEZ Group. Poland finished ahead of the benchmark despite recording a significant decline. A weaker demand outlook from the Eurozone and Russian food import bans, issued in response to Western sanctions, weighed on the local market. The same factors also negatively impacted the Hungarian market, which underperformed. Foreign exchange debt concerns also acted as a headwind throughout much of the year, although a resolution was announced in November. Greece experienced a highly volatile year with political uncertainty culminating in an early presidential election in December, and subsequently the prospect of parliamentary elections in January 2014. With anti bailout party Syriza leading in opinion polls, financial markets recorded heavy declines. Russia was the worst preforming index country. Geopolitical concerns were stoked by Russia's move to annex Crimea. Tensions were heightened after a commercial airliner was brought down, allegedly by Kremlin backed separatists on the border between the two countries. Meanwhile a deteriorating economy, falling oil prices and exacerbated corporate governance concerns have further weighed on the local market and contributed to a significant sell off in the Russian Ruble.
Portfolio Composition†:
Financials | | | 34.9 | % | |
Energy | | | 25.1 | | |
Telecommunication Services | | | 9.2 | | |
Materials | | | 6.0 | | |
Consumer Discretionary | | | 5.8 | | |
Industrials | | | 5.4 | | |
Consumer Staples | | | 4.8 | | |
Information Technology | | | 2.9 | | |
Utilities | | | 2.5 | | |
Health Care | | | 0.5 | | |
Short Term Investments | | | 2.9 | | |
Total Investments | | | 100.0 | % | |
†Total Investments as of December 31, 2014.
Portfolio Manager Commentary: For the year ended December 31, 2014, Curian/Schroder Emerging Europe Fund outperformed its benchmark by posting a return of -27.23% compared to -29.52% for the MSCI Emerging Markets Europe 10/40 Index.
Country allocation (+140 basis points) ("bps") and stock selection (+248 bps) were positive. The underweight to Russia (+79 bps) which
underperformed and the off benchmark position to United Arab Emirates ("UAE") (+84 bps) added value. This was somewhat offset by the underweights to Poland (-73 bps) and Czech Republic (-30 bps) which outperformed and therefore detracted value. Selection was positive in Russia (+201 bps), primarily due to an overweight to Luxoft Holding Inc. and Lukoil OAO – ADR and positive American depository receipts versus local line premium/discount timing effects. Greece (+44 bps) contributed due to an overweight in Hellenic Telecommunications Organization SA.
In terms of Fund positioning, main changes were as follows. In January 2014, the Fund invested in Qatar given strong bottom-up ideas and the increased attention the market was receiving ahead of its reclassification from the MSCI Frontier Markets Index to the MSCI Emerging Markets Index in May.
In the first quarter of 2014, Russia was taken from overweight to neutral given the deterioration in the situation in the Ukraine. In August, the Fund took Russia to an underweight position and the Fund continued to increase the size of the under-
weight position in September. In the second quarter of 2014, the overweight to Hungary was reduced to neutral due to a combination of the country's high level of external debt, as well as a deteriorating earnings outlook partly due to the situation in Ukraine. In the third quarter of 2014, the Fund gradually reduced the underweight in Turkey taking it to a small overweight position owing to attractive valuations and positive earnings revisions.
At December 31, 2014, the overweight countries were: Turkey (due to attractive valuations), Georgia, Romania and UAE, all due to strong stock opportunities. The Fund was neutrally positioned in Greece due to improving economic fundamentals, but there is still a high degree of uncertainty around the country's political environment. The underweight positions were Czech Republic, due to only reasonable valuations and a poor earnings outlook; Hungary, due to earnings uncertainty; Poland, due to poor earnings outlook; and Russia, due to deteriorating economic fundamentals, oil price and sanction risk and the ongoing regional crisis.
Curian/Schroder Emerging Europe Fund
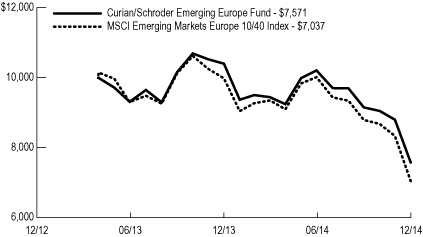
Average Annual Total Returns | |
| 1 Year | | | -27.23 | % | |
Since Inception | | | -15.32 | % | |
(Inception date April 29, 2013) | |
Past performance is not predictive of future performance. Investment return and principal value will fluctuate so that an investor's shares, when redeemed, may be worth more or less than their original cost. Performance numbers are net of all Fund operating expenses, but not do not reflect the deduction of insurance charges.

Curian/T. Rowe Price Capital Appreciation Fund
T. Rowe Price Associates, Inc.
(Unaudited)
Market Summary: U.S. equities rose in 2014 for the sixth consecutive year, as the economy recovered strongly from a first quarter weather related contraction. Falling long term interest rates since the end of 2013 – despite the U.S. Federal Reserve's ("Fed") reduction of asset purchases – solid employment growth, favorable corporate earnings and expanded stimulus measures by major non U.S. central banks were also supportive. Stagnant global growth, heightened geopolitical tensions due to U.S. and European Union sanctions against Russia for its actions in Ukraine and unrest in the Middle East periodically weighed on stock prices, as did concerns that the Fed would soon start raising short term interest rates. However, interest rate reductions in the Eurozone and expectations that the European Central Bank could start buying sovereign debt, as well as aggressive monetary easing in Japan, boosted investor sentiment. Oil prices plunged from early summer highs above $100 per barrel, which accelerated the Organization of the Petroleum Exporting Countries' decision at the end of November to maintain current production levels. As measured by various Russell indexes, value stocks outperformed growth among large and mid caps, while the opposite was true for small cap shares.
U.S. bond returns were mostly positive, as high quality issues appreciated but lower quality bonds declined. Long term Treasury bonds performed best, as long term interest rates and inflation expectations tumbled with oil prices and as U.S. government bond yields looked appealing versus yields of their Eurozone and Japanese counterparts. Investment grade corporate, mortgage backed and municipal securities also produced solid gains, but asset backed securities trailed. High yield bonds fell as credit spreads – the yield difference between high and low quality bonds with comparable maturities – widened, which indicated growing concerns about borrowers' ability to service their debt. High yield debt in energy, which is the largest segment in the high yield market, performed worst. Leveraged loans held up better than high yield bonds.
Portfolio Composition†:
Health Care | | | 17.3 | % | |
Financials | | | 12.3 | | |
Industrials | | | 11.1 | | |
Consumer Discretionary | | | 10.9 | | |
Information Technology | | | 8.3 | | |
Energy | | | 8.1 | | |
Telecommunication Services | | | 6.3 | | |
Consumer Staples | | | 3.8 | | |
Utilities | | | 3.1 | | |
Investment Companies | | | 0.9 | | |
Materials | | | 0.8 | | |
Non-U.S. Government Agency ABS | | | 0.1 | | |
Government Securities | | | 0.1 | | |
Short Term Investments | | | 16.9 | | |
Total Investments | | | 100.0 | % | |
†Total Investments as of December 31, 2014.
Portfolio Manager Commentary: For the year ended December 31, 2014, Curian/T. Rowe Price Capital Appreciation Fund underperformed its primary benchmark by posting a return of 11.63% compared to 13.69% for the S&P 500 Index. The Fund outperformed its blended benchmark return of 10.62% for the 60% S&P 500 Index and 40% Barclays U.S. Aggregate Bond Index.
The Fund lagged the all equity S&P 500 Index in 2014 due to its allocation to bonds in a rising equity environment. While the Fund's equity holdings outpaced the S&P 500 Index, its fixed income holdings, while positive for the year, lagged the Barclays U.S. Aggregate Index. The Fund's overweight to high yield bonds benefited in the first half of the year but detracted from returns more recently. Among equity sectors, health care drove relative performance due to both stock selection in Allergan Inc. ("Allergen"), Zoetis Inc. and UnitedHealth Group Inc. ("UnitedHealth") and an overweight position; while stock selection in con-
sumer discretionary companies AutoZone Inc. ("AutoZone"), O'Reilly Automotive Inc. and Lowe's Companies Inc. also contributed. On the downside, industrials and business services detracted from relative results due to both stock selection in United Technologies Corp. ("United Technologies") and an overweight position. Stock selection in energy companies Range Resources Corp. and Canadian Natural Resources Ltd. ("Canadian Natural Resources") also weighed on performance, although our underweight position helped to mitigate some of the detraction.
The five largest purchases during the year were: Danaher Corp., Thermo Fisher Scientific Inc., Marsh & McLennan Companies, Inc. and AutoZone, which were existing holdings; while Canadian Natural Resources was new to the Fund. The five largest sales during the year were: United Technologies, XCEL Energy Inc., Allergan and UnitedHealth, which are still held; while Perrigo Co. Plc was sold from the Fund.
As the equity market continued its overall upward trajectory, we opportunistically trimmed holdings within utilities and consumer staples on strength, decreasing the Fund's overall equity exposure from the prior year. Overall, we continue to believe that the attractiveness of the U.S. equity market has diminished given that equity valuations are relatively expensive compared to historical averages. However, we found select opportunities to continue building our overweight position in health care. Since the end of 2013, our overall weight within fixed income marginally decreased, as it remained challenging to find reasonable risk reward opportunities. The Fund eliminated holdings in 10-year U.S. Treasuries in the fourth quarter as long term interest rates continued to decline due to global economic weakness and geopolitical uncertainties. High yield bonds, which remain our
largest fixed income sector, benefited in the first half of the year from the yield advantage relative to investment grade bonds, low default rates and the financial strength of most high yield issuers. More recently however, credit spreads have widened as falling oil prices have weighed on energy sector bonds, the largest segment of the high yield market.
While the macroeconomic landscape has improved considerably in the U.S., industry fundamentals have continued to worsen in general and earnings expectations for many companies appear overly optimistic. Within the fixed income market, yield spreads are significantly compressed compared with historical levels aside from the high yield space. With the extended market advance, the Fund remains more conservatively positioned and we believe exposed to less cyclicality, bearing in mind our commitment to capital preservation. As always, we remain focused on finding the best risk adjusted opportunities across asset classes in an attempt to generate equity like returns over the long term with less overall risk than the all equity index.
As of December 31, 2014, the Fund held equity options which generated a net derivative exposure equivalent to approximately 4.43% of net assets, on a delta adjusted basis. Equity options were held throughout the year. In December, the Fund also held minimal positions in currency forwards, credit default swaps and index futures. The estimated return impact from employing currency forwards was negligible, -5 basis points ("bps") from futures and -25 bps from options for the year. During the year, the covered call strategy represented, on average, 4.47% of the overall Fund and generated a return of approximately 7.22%. The covered call strategy's estimated contribution to the Fund's total return was 0.28%.

Curian/T. Rowe Price Capital Appreciation
Fund (continued)
T. Rowe Price Associates, Inc.
(Unaudited)
Curian/T. Rowe Price Capital Appreciation Fund
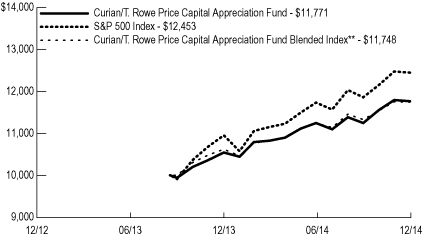
**60% S&P 500 Index, 40% Barclays U.S. Aggregate Bond Index
Average Annual Total Returns* | |
| 1 Year | | | 11.63 | % | |
Since Inception | | | 13.47 | % | |
(Inception date September 16, 2013) | |
Past performance is not predictive of future performance. Investment return and principal value will fluctuate so that an investor's shares, when redeemed, may be worth more or less than their original cost. Performance numbers are net of all Fund operating expenses, but not do not reflect the deduction of insurance charges.
*The Fund's investment adviser waived certain expenses of the Fund. Performance results shown reflect the waiver, without which they would have been lower.

Curian/The Boston Company Equity Income Fund
The Boston Company Asset Management LLC
(Unaudited)
Market Summary: Global equities produced mixed returns for 2014 as investors digested a medley of encouraging U.S. data, increasing volatility and rising geopolitical risk.
Positive economic data helped U.S. stocks rally during the first quarter despite an unseasonably harsh winter that threatened consumer sentiment. By the second quarter, U.S. investors largely shrugged off reports that the economy shrank during the first three months of the year, while the U.S. Federal Reserve ("Fed") underlined an improving economy by announcing it would wind down its monthly bond purchases. U.S. stocks logged third quarter gains as investors cheered better than expected growth indicators, which included improvements in consumer spending, tourism and manufacturing. In the final quarter of 2014, U.S. stocks tallied another solid quarterly gain amid better than expected growth indicators, with the Fed offering a mostly upbeat assessment of the country's economic prospects.
Outside the U.S., equities gained modestly in the first quarter as policymakers around the world acted to support a strengthening global economy. In the second quarter, low inflation and shrinking private sector lending persisted in the Eurozone, causing the European Central Bank ("ECB") to take the extraordinary step of setting a negative deposit rate. Global equity returns were mostly subdued through the later summer months as geopolitical risks rose and economic data disappointed. By the final quarter of 2014, dangerously low inflation continued to pose a headwind for ECB policymakers while the specter of instability reappeared in Greece. Emerging market stocks struggled during the fourth quarter as stocks in Russia declined further amid a tumbling ruble and weak oil prices.
Portfolio Composition†:
Financials | | | 27.4 | % | |
Health Care | | | 13.8 | | |
Information Technology | | | 12.6 | | |
Energy | | | 10.6 | | |
Consumer Discretionary | | | 8.4 | | |
Consumer Staples | | | 7.8 | | |
Industrials | | | 7.0 | | |
Materials | | | 4.0 | | |
Utilities | | | 1.2 | | |
Telecommunication Services | | | 1.2 | | |
Short Term Investments | | | 6.0 | | |
Total Investments | | | 100.0 | % | |
†Total Investments as of December 31, 2014.
Portfolio Manager Commentary: For the year ended December 31, 2014, Curian/The Boston Company Equity Income Fund underperformed its benchmark by posting a return of 11.07% compared to 12.36% for the S&P 500 Value Index.
In terms of relative performance, utilities and financials were the Fund's weakest sectors, while
information technology ("IT") and materials were the strongest.
In utilities, the Fund's underweight allocation and stock selection weighed on relative returns. Bond proxy names held up well amid depressed interest rate levels and ongoing expectations of lower rates for longer. Relative underperformance in financials was due to ill founded concerns about the strength of the U.S. economy early in the year and the downward move in interest rates, pressuring banks and other interest rate sensitive positions in the Fund.
Effective stock selection and an overweight allocation in cyclical IT drove broad based relative outperformance. Our relative outperformance in materials stemmed from deft stock selection, tilted in favor of U.S. exposed aggregate names and away from stocks that are sensitive to emerging market demand.
Our confidence in the prospects for a constructive U.S. economy remains largely unchanged, buttressed by improving employment and falling commodity prices. The U.S. is the biggest beneficiary of lower oil prices, which act as a considerable
stimulus, given that approximately 70% of U.S. gross domestic product is consumption based. As the recovery continues, the Fed will indeed raise rates, but unlike past rate cycles, the increase in short rates is unlikely to pave the way for long rates to rise to the point where they curtail the recovery.
Within the Fund, we continue to favor economically sensitive, attractively valued sectors over expensive, defensive ones like utilities and telecommunication services. In financials, our largest absolute weight, valuations remain attractive and we are encouraged by expectations for a more conducive interest rate environment, improving capital markets and strong loan growth. The Fund is also overweight health care, with exposure to pharmaceutical companies that offer underappreciated product pipelines, as well as various services and insurance names that should benefit from favorable business trends and company specific catalysts. We also favor IT, finding attractive opportunities in companies exposed to pent up enterprise capital spending and compelling product cycles.
Curian/The Boston Company Equity Income Fund

Average Annual Total Returns | |
| 1 Year | | | 11.07 | % | |
Since Inception | | | 18.81 | % | |
(Inception date February 6, 2012) | |
Past performance is not predictive of future performance. Investment return and principal value will fluctuate so that an investor's shares, when redeemed, may be worth more or less than their original cost. Performance numbers are net of all Fund operating expenses, but not do not reflect the deduction of insurance charges.

Curian/UBS Global Long Short Fixed Income Opportunities Fund
UBS Global Asset Management (Americas) Inc.
(Unaudited)
Market Summary: The theme of diverging global growth and monetary policy had a significant impact on fixed income markets during the year. Global interest rates drifted lower during the year as global growth concerns and accommodative monetary policy drove rates to all time lows in many markets. The substantial decline in oil prices during the second half of the year drove rates down further as did various geopolitical risks that emerged throughout the year.
Economic data in the U.S. steadily improved after weak weather influenced first quarter. In particular, employment data was increasingly strong during the year. The strong fundamental underpinnings of the U.S. economy largely played out, but technical factors and the demand for U.S. debt overwhelmed the macroeconomic backdrop. The U.S. Federal Reserve ended its quantitative easing program as planned in October and indicated that an initial rate hike was imminent in 2015 at its final meeting in December. Meanwhile, in other developed market economies such as Europe and Japan, the economic data was continually disappointing, evidenced by low growth data and inflation data trending downward to possible negative territory. Central banks as a result took unprecedented steps in implementing additional monetary policy support for sputtering economies.
The beginning of the year was marked by a reach for yield as strong fundamentals, declining rates and a low volatility market environment were supportive for credit performance. However, the majority of the down performance in credit occurred during the fourth quarter following sharp declines in oil and concern over the health of energy spilled into broader spread widening heading the into year end.
The effect of growth and monetary policy divergence was most apparent in currency markets as the U.S. Dollar experienced a prolonged bull run during the second half of the year. The U.S. Dollar appreciated against a basket of developed market currencies and specifically against the Japanese Yen and Euro. The U.S. Dollar Index reached an eight year high at the end of the year.
Portfolio Composition†:
Financials | | | 33.8 | % | |
Government Securities | | | 13.8 | | |
Non-U.S. Government Agency ABS | | | 13.8 | | |
Energy | | | 10.6 | | |
Materials | | | 7.9 | | |
Industrials | | | 4.7 | | |
Consumer Discretionary | | | 4.6 | | |
Purchased Options | | | 2.6 | | |
Telecommunication Services | | | 2.2 | | |
Utilities | | | 2.1 | | |
Consumer Staples | | | 1.5 | | |
Information Technology | | | 1.3 | | |
Health Care | | | 0.8 | | |
U.S. Government Agency MBS | | | 0.2 | | |
Short Term Investments | | | 0.1 | | |
Total Investments | | | 100.0 | % | |
†Total Investments as of December 31, 2014.
Portfolio Manager Commentary: For the year ended December 31, 2014, Curian/UBS Global Long Short Fixed Income Opportunities Fund underperformed its benchmark by posting a return of -4.42% compared to 0.03% for the BofA Merrill Lynch U.S. 3-Month Treasury Bill Index.
The Fund's credit exposure detracted from performance, specifically the allocation to corporate credit in both investment grade and high yield debt. While cash bonds contributed positively to performance, beta hedging more than offset the gains. Emerging market ("EM") debt also detracted from performance during the year. The Fund's net long exposure to securitized credit was a positive contributor as was the long exposure to collateralized loan obligations.
Developed market currency positions were a positive contributor to performance during the year. The Fund's long U.S. Dollar position relative to various currencies throughout the year such as the Japanese Yen, Euro, Australian Dollar, New Zealand Dollar, and British Pound all contributed to performance. Exposure to EM currencies, however, was a big detractor from performance.
The Fund's net short duration positioning was the biggest detractor from performance during the year. The Fund utilizes derivatives as a component of its overall construction to manage risk, hedge positioning and provide efficient exposure. The Fund utilizes a variety of instruments across global interest rate, credit and currency markets. Duration
hedging was a negative for performance, while currency hedging was additive to performance. Index hedging was a negative for performance in both investment grade and high yield corporate credit, but was a positive contributor in EM. Interest rate swaps and options were negatives for performance, but futures were a positive contributor during the year.
At the end of the year, the Fund maintained a net short duration position with short exposure to U.S. and Japanese interest rates, but long exposure to New Zealand rates. The Fund finished the year net short corporate credit due to its net short investment grade positioning, but has modest net long exposure in both high yield and EM debt. The Fund also finished the year with long exposure to securitized credit favoring commercial mortgage backed securities. The Fund also maintained long exposure to collateralized loan obligations. In active currency positions, the Fund finished the year long the U.S. Dollar relative to the Euro, Australian Dollar and Japanese Yen.
Curian/UBS Global Long Short Fixed Income Opportunities Fund

Average Annual Total Returns | |
| 1 Year | | | -4.42 | % | |
Since Inception | | | -2.90 | % | |
(Inception date April 29, 2013) | |
Past performance is not predictive of future performance. Investment return and principal value will fluctuate so that an investor's shares, when redeemed, may be worth more or less than their original cost. Performance numbers are net of all Fund operating expenses, but not do not reflect the deduction of insurance charges.

Curian/Van Eck International Gold Fund
Van Eck Associates Corporation
(Unaudited)
Market Summary: Early in the year, tensions in Thailand, Venezuela, Turkey and Ukraine threatened regional, and possibly global, financial stability, and were supportive of gold, driving it to its 2014 high of $1,383.05 per ounce on March 14. Gold later declined as tensions steadied in Ukraine and due in part to strong U.S. data reports. In June, growing Middle East tensions once again created demand for gold as a hedge against geopolitical risk. On August 15, the gold price closed at $1,304.83, a year to date gain of $99.18 or 8.24%. Those gains evaporated throughout the remainder of the year, primarily driven by U.S. Dollar strength. Gold, historically, has an inverse correlation with the U.S. Dollar. The U.S. Dollar Index rose 10.86% from August 15 to December 31, while gold dropped -9.19% during that period. The U.S. Dollar rally has been fueled by several factors, including the ongoing strength in the U.S. economy, contrasting with economic weakness in emerging markets; an unexpected rate cut announced by the European Central Bank ("ECB") in September; plans for quantitative easing from the ECB and the Bank of Japan; and the end of the U.S. Federal Reserve's quantitative easing program. On October 31, gold fell below the $1,180 technical support level, dropping to a low of $1,140.65 on November 5. Subsequently, improving physical demand from India and China were supportive of gold, and it had bounced back above $1,200. The year end brought on further selling pressure, and gold closed at $1,184.86 on December 31, down 1.72% for the year. Gold equities outperformed gold for most of the year, however, the late year selloff led to their underperformance for the full year. Notably, although flows out of gold bullion exchange traded products ("ETF") continued throughout the year, ETF holdings declined by 9.3% in 2014, compared to a drop of 33.0% during 2013.
Portfolio Composition†:
Materials | | | 77.6 | % | |
Short Term Investments | | | 22.4 | | |
Total Investments | | | 100.0 | % | |
†Total Investments as of December 31, 2014.
Portfolio Manager Commentary: For the year ended December 31, 2014, Curian/Van Eck International Gold Fund outperformed its benchmark by posting a return of -6.13% compared to -11.76% for the NYSE Arca Gold Miners Index.
The Fund maintained an emphasis on gold mining companies with strong balance sheets and favorable cost structures, as well as royalty and streaming companies, which have no operating costs. At the end of 2014, the Fund was almost fully invested in equities, prepared to benefit from what we expect will be an outperformance of gold stocks relative to the metal in a rising gold price environment.
While the performance of gold stocks during the year was disappointing, we are surprised at the magnitude of the loss given the steady improvements we have seen in company fundamentals. Companies generally appear to remain focused on increasing operating margins, maintaining healthy balance sheets, exercising capital discipline and meeting expectations. Reports from third and fourth quarter of 2014 seem to indicate they are being successful in improving the sector's profitability and returns to shareholders.
Share price performance was mixed across the stocks held in the Fund. A little less than half of the Fund's positions posted gains. Royal Gold Inc. outperformed significantly, up 37.8%. We believe that this was driven primarily by the company's attractive royalty business model, which keeps the company cash flow positive, even at low gold prices, and also by the company's excellent
track record of growth. Yamana Gold Inc. ("Yamana") underperformed, down 52.5%, likely due to a combination of factors including operating problems at its new mines, and the divestment of some non core assets. We believe the selloff of Yamana shares was overdone. In our opinion, the stock represents good value, and we view its acquisition of a stake in Osisko Mining Corp. as positive, as well as its efforts to streamline its operations by divesting some non core assets. Small cap gold mining stocks, as represented by the Market Vectors Global Junior Gold Miners Index, fell 20.86% during 2014, underperforming relative to both gold and the larger companies. However, 18 out of the 39 junior positions in the Fund posted gains, and 29 of the positions outperformed the Market Vectors Global Junior Gold Miners Index.
Curian/Van Eck International Gold Fund
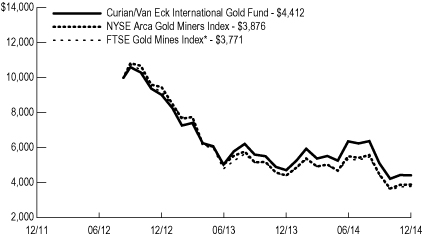
*Effective April 28, 2014, the Fund changed its primary benchmark from the FTSE Gold Mines Index to the NYSE Arca Gold Miners Index because the FTSE Gold Mines Index better reflects the Fund's asset class exposure and risk profile.
Average Annual Total Returns | |
| 1 Year | | | -6.13 | % | |
Since Inception | | | -29.86 | % | |
(Inception date September 10, 2012) | |
Past performance is not predictive of future performance. Investment return and principal value will fluctuate so that an investor's shares, when redeemed, may be worth more or less than their original cost. Performance numbers are net of all Fund operating expenses, but not do not reflect the deduction of insurance charges.
Curian Variable Series Trust Sub-Advised Funds
Schedules of Investments (in thousands)
December 31, 2014
Curian Tactical Advantage 35 Fund
| | Shares/Par † | | Value | |
INVESTMENT COMPANIES - 100.0% | | | | | |
iShares 7-10 Year Treasury Bond Fund (a) | | 26 | | $ | 2,800 | |
iShares Barclays Capital Intermediate Credit Bond ETF (a) | | 38 | | 4,175 | |
iShares Capital 3-7 Year Treasury Bond ETF (a) | | 15 | | 1,857 | |
iShares MBS ETF (a) | | 38 | | 4,131 | |
iShares MSCI EMU ETF | | 50 | | 1,833 | |
iShares MSCI Japan ETF | | 81 | | 911 | |
iShares MSCI Pacific ex-Japan ETF | | 13 | | 568 | |
iShares MSCI United Kingdom ETF (a) | | 50 | | 901 | |
iShares Russell 1000 Growth ETF (a) | | 91 | | 8,654 | |
iShares Russell 1000 Value ETF (a) | | 68 | | 7,123 | |
iShares Russell 2000 Growth ETF (a) | | 16 | | 2,248 | |
iShares Russell 2000 Value ETF | | 18 | | 1,827 | |
PIMCO 0-5 Year High Yield Corporate Bond Index ETF (a) | | 25 | | 2,525 | |
PowerShares Emerging Markets Sovereign Debt Portfolio (a) | | 45 | | 1,263 | |
Vanguard Index Funds MSCI Emerging Market | | 36 | | 1,445 | |
Vanguard Intermediate-Term Corporate Bond ETF (a) | | 54 | | 4,646 | |
Vanguard Short-Term Corporate Bond ETF | | 6 | | 463 | |
Vanguard Total Bond Market ETF | | 47 | | 3,871 | |
Total Investment Companies (cost $50,136) | | | | 51,241 | |
| | | | | |
SHORT TERM INVESTMENTS - 17.1% | | | | | |
| | | | | |
Investment Company - 1.2% | | | | | |
JNL Money Market Fund, 0.01% (b) (c) | | 624 | | 624 | |
| | | | | |
Securities Lending Collateral - 15.9% | | | | | |
BlackRock Liquidity Funds TempFund Portfolio, 0.07% (c) | | 500 | | 500 | |
Fidelity Institutional Money Market Portfolio, 0.09% (c) | | 1,000 | | 1,000 | |
Repurchase Agreement with BNP, 0.05% (Collateralized by $360 U.S. Treasury Note, 0.25%, due 02/29/16, value $359 and $4,747 U.S. Treasury Bond Strip, due 10/15/15, value $4,741) acquired on 12/31/14, due 01/02/15 at $5,000 | | $ | 5,000 | | 5,000 | |
Repurchase Agreement with MLP, 0.06% (Collateralized by $538 U.S. Treasury Bond, 6.25%, due 05/15/30, value $808 and $891 U.S. Treasury Note, 0.13%, due 07/15/24, value $855) acquired on 12/31/14, due 01/02/15 at $1,631 | | 1,631 | | 1,631 | |
| | | | 8,131 | |
Total Short Term Investments (cost $8,755) | | | | 8,755 | |
| | | | | |
Total Investments - 117.1% (cost $58,891) | | | | 59,996 | |
Other Assets and Liabilities, Net - (17.1%) | | | | (8,775 | ) |
Total Net Assets - 100.0% | | | | $ | 51,221 | |
| | | | | | | |
(a) | All or portion of the security was on loan. |
(b) | Investment in affiliate. |
(c) | Yield changes daily to reflect current market conditions. Rate was the quoted yield as of December 31, 2014. |
Curian Tactical Advantage 60 Fund
| | Shares/Par † | | Value | |
INVESTMENT COMPANIES - 100.0% | | | | | |
iShares 7-10 Year Treasury Bond Fund (a) | | 31 | | $ | 3,290 | |
iShares Barclays Capital Intermediate Credit Bond ETF (a) | | 45 | | 4,906 | |
iShares Capital 3-7 Year Treasury Bond ETF (a) | | 18 | | 2,178 | |
iShares MBS ETF (a) | | 44 | | 4,855 | |
iShares MSCI EMU ETF | | 178 | | 6,471 | |
iShares MSCI Japan ETF | | 287 | | 3,228 | |
iShares MSCI Pacific ex-Japan ETF (a) | | 45 | | 1,997 | |
iShares MSCI United Kingdom ETF | | 177 | | 3,198 | |
iShares Russell 1000 Growth ETF (a) | | 319 | | 30,534 | |
iShares Russell 1000 Value ETF | | 241 | | 25,130 | |
iShares Russell 2000 Growth ETF (a) | | 56 | | 7,938 | |
iShares Russell 2000 Value ETF (a) | | 63 | | 6,448 | |
PIMCO 0-5 Year High Yield Corporate Bond Index ETF (a) | | 30 | | 2,976 | |
PowerShares Emerging Markets Sovereign Debt Portfolio (a) | | 53 | | 1,485 | |
Vanguard Index Funds MSCI Emerging Market | | 127 | | 5,100 | |
Vanguard Intermediate-Term Corporate Bond ETF (a) | | 63 | | 5,467 | |
Vanguard Short-Term Corporate Bond ETF (a) | | 7 | | 543 | |
Vanguard Total Bond Market ETF | | 55 | | 4,549 | |
Total Investment Companies (cost $115,881) | | | | 120,293 | |
| | | | | |
SHORT TERM INVESTMENTS - 14.1% | | | | | |
Securities Lending Collateral - 14.1% | | | | | |
BlackRock Liquidity Funds TempFund Portfolio, 0.07% (b) | | 10,000 | | 10,000 | |
Fidelity Institutional Money Market Portfolio, 0.09% (b) | | 4,000 | | 4,000 | |
Repurchase Agreement with BNP, 0.05% (Collateralized by $144 U.S. Treasury Note, 0.25%, due 02/29/16, value $144 and $1,899 U.S. Treasury Bond Strip, due 10/15/15, value $1,896) acquired on 12/31/14, due 01/02/15 at $2,000 | | $ | 2,000 | | 2,000 | |
Repurchase Agreement with MLP, 0.06% (Collateralized by $318 U.S. Treasury Bond, 6.25%, due 05/15/30, value $477 and $526 U.S. Treasury Note, 0.13%, due 07/15/24, value $505) acquired on 12/31/14, due 01/02/15 at $963 | | 963 | | 963 | |
Total Short Term Investments (cost $16,963) | | | | 16,963 | |
| | | | | |
Total Investments - 114.1% (cost $132,844) | | | | 137,256 | |
Other Assets and Liabilities, Net - (14.1%) | | | | (16,975 | ) |
Total Net Assets - 100.0% | | | | $ | 120,281 | |
| | | | | | | |
(a) | All or portion of the security was on loan. |
(b) | Yield changes daily to reflect current market conditions. Rate was the quoted yield as of December 31, 2014. |
Curian Tactical Advantage 75 Fund
INVESTMENT COMPANIES - 100.1% | | | | | |
iShares 7-10 Year Treasury Bond Fund (a) | | — | | $ | 29 | |
iShares Barclays Capital Intermediate Credit Bond ETF | | — | | 43 | |
iShares Capital 3-7 Year Treasury Bond ETF (a) | | — | | 19 | |
iShares MBS ETF | | — | | 42 | |
iShares MSCI EMU ETF (a) | | 207 | | 7,535 | |
iShares MSCI Japan ETF | | 334 | | 3,750 | |
iShares MSCI Pacific ex-Japan ETF (a) | | 53 | | 2,329 | |
iShares MSCI United Kingdom ETF (a) | | 207 | | 3,726 | |
iShares Russell 1000 Growth ETF (a) | | 372 | | 35,569 | |
| | | | | | |
See accompanying Notes to Financial Statements.
| | Shares/Par † | | Value | |
iShares Russell 1000 Value ETF (a) | | 280 | | 29,276 | |
iShares Russell 2000 Growth ETF (a) | | 65 | | 9,241 | |
iShares Russell 2000 Value ETF (a) | | 74 | | 7,508 | |
PIMCO 0-5 Year High Yield Corporate Bond Index ETF (a) | | — | | 26 | |
PowerShares Emerging Markets Sovereign Debt Portfolio (a) | | — | | 13 | |
Vanguard Index Funds MSCI Emerging Market | | 148 | | 5,931 | |
Vanguard Intermediate-Term Corporate Bond ETF (a) | | 1 | | 47 | |
Vanguard Short-Term Corporate Bond ETF (a) | | — | | 5 | |
Vanguard Total Bond Market ETF | | — | | 39 | |
Total Investment Companies (cost $100,874) | | | | 105,128 | |
| | | | | |
SHORT TERM INVESTMENTS - 19.8% | | | | | |
| | | | | |
Investment Company - 0.3% | | | | | |
JNL Money Market Fund, 0.01% (b) (c) | | 300 | | 300 | |
| | | | | |
Securities Lending Collateral - 19.5% | | | | | |
BlackRock Liquidity Funds TempFund Portfolio, 0.07% (c) | | 10,104 | | 10,104 | |
Fidelity Institutional Money Market Portfolio, 0.09% (c) | | 4,000 | | 4,000 | |
Repurchase Agreement with BNP, 0.05% (Collateralized by $360 U.S. Treasury Note, 0.25%, due 02/29/16, value $359 and $4,747 U.S. Treasury Bond Strip, due 10/15/15, value $4,741) acquired on 12/31/14, due 01/02/15 at $5,000 | | $ | 5,000 | | 5,000 | |
Repurchase Agreement with MLP, 0.06% (Collateralized by $461 U.S. Treasury Bond, 6.25%, due 05/15/30, value $691 and $762 U.S. Treasury Note, 0.13%, due 07/15/24, value $732) acquired on 12/31/14, due 01/02/15 at $1,396 | | 1,396 | | 1,396 | |
| | | | 20,500 | |
Total Short Term Investments (cost $20,800) | | | | 20,800 | |
| | | | | |
Total Investments - 119.9% (cost $121,674) | | | | 125,928 | |
Other Assets and Liabilities, Net - (19.9%) | | | | (20,857 | ) |
Total Net Assets - 100.0% | | | | $ | 105,071 | |
| | | | | | | |
(a) | All or portion of the security was on loan. |
(b) | Investment in affiliate. |
(c) | Yield changes daily to reflect current market conditions. Rate was the quoted yield as of December 31, 2014. |
Curian Dynamic Risk Advantage - Diversified Fund
INVESTMENT COMPANIES - 7.0% | | | | | |
First Trust North American Energy Infrastructure Fund | | 101 | | $ | 2,839 | |
iShares Barclays Capital Intermediate Credit Bond ETF (a) | | 40 | | 4,414 | |
iShares JPMorgan USD Emerging Markets Bond ETF (a) | | 22 | | 2,374 | |
PIMCO 0-5 Year High Yield Corporate Bond Index ETF (a) | | 24 | | 2,454 | |
PowerShares DB Commodity Index Tracking Fund (a) (b) | | 93 | | 1,721 | |
Vanguard REIT ETF | | 58 | | 4,692 | |
Vanguard Total International Bond ETF (a) | | 118 | | 6,282 | |
Total Investment Companies (cost $25,251) | | | | 24,776 | |
| | | | | |
SHORT TERM INVESTMENTS - 93.8% | | | | | |
| | | | | |
Federal Home Loan Bank - 10.3% | | | | | |
Federal Home Loan Bank | | | | | |
0.03%, 01/12/15 (c) | | $ | 6,000 | | 6,000 | |
0.10%, 03/27/15 (c) | | 5,000 | | 5,000 | |
0.08%, 04/17/15 (c) | | 10,000 | | 9,999 | |
0.09%, 05/06/15 (c) | | 15,000 | | 14,996 | |
| | | | 35,995 | |
Federal Home Loan Mortgage Corp. - 11.7% | | | | | |
Federal Home Loan Mortgage Corp. | | | | | |
0.05%, 02/05/15 (c) | | 9,500 | | 9,500 | |
0.06%, 04/06/15 (c) | | 5,000 | | 4,999 | |
0.07%, 04/15/15 - 04/20/15 (c) | | 16,500 | | 16,498 | |
0.10%, 05/28/15 (c) | | 10,000 | | 9,997 | |
| | | | 40,994 | |
Federal National Mortgage Association - 11.7% | | | | | |
Federal National Mortgage Association | | | | | |
0.02%, 03/03/15 (c) | | 13,000 | | 13,000 | |
0.07%, 04/08/15 (c) | | 11,000 | | 10,999 | |
0.08%, 04/15/15 (c) | | 7,000 | | 6,999 | |
0.11%, 05/26/15 (c) | | 10,000 | | 9,997 | |
| | | | 40,995 | |
Investment Company - 10.1% | | | | | |
JNL Money Market Fund, 0.01% (d) (e) | | 35,292 | | 35,292 | |
| | | | | |
Securities Lending Collateral - 1.8% | | | | | |
Repurchase Agreement with BNP, 0.05% (Collateralized by $216 U.S. Treasury Note, 0.25%, due 02/29/16, value $216 and $2,848 U.S. Treasury Bond Strip, due 10/15/15, value $2,844) acquired on 12/31/14, due 01/02/15 at $3,000 | | $ | 3,000 | | 3,000 | |
Repurchase Agreement with MLP, 0.06% (Collateralized by $1,094 U.S. Treasury Bond, 6.25%, due 05/15/30, value $1,642 and $1,811 U.S. Treasury Note, 0.13%, due 07/15/24, value $1,739) acquired on 12/31/14, due 01/02/15 at $3,314 | | 3,314 | | 3,314 | |
| | | | 6,314 | |
Treasury Securities - 48.2% | | | | | |
U.S. Treasury Bill | | | | | |
0.02%, 01/08/15 | | 73,500 | | 73,499 | |
0.02%, 01/15/15 | | 69,375 | | 69,375 | |
0.04%, 04/02/15 | | 22,000 | | 21,998 | |
0.08%, 06/04/15 (f) | | 3,990 | | 3,989 | |
| | | | 168,861 | |
Total Short Term Investments (cost $328,440) | | | | 328,451 | |
| | | | | |
Total Investments - 100.8% (cost $353,691) | | | | 353,227 | |
Other Assets and Liabilities, Net - (0.8%) | | | | (2,881 | ) |
Total Net Assets - 100.0% | | | | $ | 350,346 | |
(a) | All or portion of the security was on loan. |
(b) | Non-income producing security. |
(c) | This security is a direct debt of the agency and not collateralized by mortgages. |
(d) | Investment in affiliate. |
(e) | Yield changes daily to reflect current market conditions. Rate was the quoted yield as of December 31, 2014. |
(f) | All or a portion of the security is pledged or segregated as collateral. See the Notes to Financial Statements. |
See accompanying Notes to Financial Statements.
Curian Variable Series Trust Sub-Advised Funds
Schedules of Investments (in thousands, except contracts)
December 31, 2014
Schedule of Open Futures Contracts
| | Expiration | | Contracts
Long | | Unrealized
Appreciation | |
Mini MSCI Emerging Markets Index Future | | March 2015 | | 142 | | $ | 265 | |
MSCI Mini EAFE Index Future | | March 2015 | | 99 | | 81 | |
Russell 2000 Mini Index Future | | March 2015 | | 189 | | 578 | |
S&P 500 E-Mini Index Future | | March 2015 | | 313 | | 385 | |
Ultra Long Term U.S. Treasury Bond Future | | March 2015 | | 238 | | 1,641 | |
| | | | | | $ | 2,950 | |
Schedule of Over the Counter Total Return Swap Agreements
Counterparty | | Receiving Return of Reference Entity | | Rate Paid by Fund | | Expiration
Date | | Notional
Amount (1) | | Unrealized
Appreciation /
(Depreciation) | |
BCL | | iShares Barclays Intermediate Credit Bond ETF | | 1-Month LIBOR +0.50% | | 12/15/2015 | | $ | 38,368 | | $ | 66 | |
BCL | | PIMCO 0-5 Year High Yield Corporate Bond Index ETF | | 1-Month LIBOR +0.50% | | 12/15/2015 | | 24,382 | | 319 | |
BCL | | Vanguard Total International Bond ETF | | 1-Month LIBOR +0.50% | | 12/15/2015 | | 44,282 | | 213 | |
BOA | | iShares JPMorgan USD Emerging Markets Bond ETF | | 1-Month LIBOR -1.25% | | 12/15/2015 | | 23,816 | | 814 | |
CGM | | First Trust North American Energy Infrastructure Fund | | 1-Month LIBOR +0.49% | | 12/15/2015 | | 21,562 | | 1,578 | |
CGM | | PowerShares DB Commodity Index Tracking Fund | | 1-Month LIBOR +0.40% | | 12/15/2015 | | 3,211 | | (94 | ) |
CGM | | Vanguard REIT ETF | | Federal Funds Effective Rate +0.30% | | 12/15/2015 | | 38,737 | | 1,119 | |
| | | | | | | | | | $ | 4,015 | |
| | | | | | | | | | | | | |
(1) Notional amount is stated in USD.
See accompanying Notes to Financial Statements.
Curian Variable Series Trust Sub-Advised Funds
Schedules of Investments (in thousands)
December 31, 2014
Curian Dynamic Risk Advantage - Growth Fund
| | Shares/Par † | | Value | |
INVESTMENT COMPANIES - 0.2% | | | | | |
iShares 1-3 Year Treasury Bond ETF (a) | | — | | $ | 13 | |
iShares MSCI EAFE ETF | | — | | 25 | |
iShares Russell 2000 ETF | | — | | 2 | |
SPDR S&P 500 ETF Trust - Series 1 | | — | | 37 | |
Vanguard Index Funds MSCI Emerging Market | | 1 | | 39 | |
Total Investment Companies (cost $101) | | | | 116 | |
| | | | | |
SENIOR DEBT NOTES - 4.1% | | | | | |
iPath S&P 500 Dynamic VIX ETN (a) (b) | | $ | 35 | | 986 | |
iPath S&P 500 VIX Mid-Term Futures ETN (a) (b) | | 46 | | 603 | |
VelocityShares Daily Inverse VIX Short-Term ETN (a) (b) | | 29 | | 888 | |
Total Senior Debt Notes (cost $2,620) | | | | 2,477 | |
| | | | | |
SHORT TERM INVESTMENTS - 98.1% | | | | | |
| | | | | |
Federal Home Loan Bank - 14.8% | | | | | |
Federal Home Loan Bank | | | | | |
0.08%, 04/17/15 (c) | | 5,000 | | 4,999 | |
0.11%, 05/27/15 (c) | | 4,000 | | 3,999 | |
| | | | 8,998 | |
Federal Home Loan Mortgage Corp. - 12.4% | | | | | |
Federal Home Loan Mortgage Corp. | | | | | |
0.05%, 02/05/15 (c) | | 1,500 | | 1,500 | |
0.06%, 04/06/15 (c) | | 5,000 | | 4,999 | |
0.10%, 05/28/15 (c) | | 1,000 | | 1,000 | |
| | | | 7,499 | |
Federal National Mortgage Association - 15.6% | | | | | |
Federal National Mortgage Association | | | | | |
0.02%, 03/03/15 (c) | | 4,500 | | 4,500 | |
0.06%, 04/01/15 (c) | | 2,000 | | 2,000 | |
0.08%, 04/15/15 (c) | | 2,000 | | 2,000 | |
0.11%, 05/26/15 (c) | | 1,000 | | 999 | |
| | | | 9,499 | |
Investment Company - 8.9% | | | | | |
JNL Money Market Fund, 0.01% (d) (e) | | 5,421 | | 5,421 | |
| | | | | |
Securities Lending Collateral - 2.6% | | | | | |
Fidelity Institutional Money Market Portfolio, 0.09% (e) | | 100 | | 100 | |
Repurchase Agreement with CSI, 0.07% (Collateralized by $1,015 U.S. Treasury Bond Strip, due 11/15/37-11/15/39, value $510) acquired on 12/31/14, due 01/02/15 at $500 | | $ | 500 | | 500 | |
Repurchase Agreement with MLP, 0.06% (Collateralized by $321 U.S. Treasury Bond, 6.25%, due 05/15/30, value $481 and $530 U.S. Treasury Note, 0.13%, due 07/15/24, value $509) acquired on 12/31/14, due 01/02/15 at $971 | | 971 | | 971 | |
| | | | 1,571 | |
Treasury Securities - 43.8% | | | | | |
U.S. Treasury Bill | | | | | |
0.02%, 01/08/15 | | 15,800 | | 15,800 | |
0.02%, 01/15/15 | | 7,000 | | 7,000 | |
0.04%, 03/05/15 | | 2,565 | | 2,565 | |
0.08%, 06/04/15 (f) | | 1,195 | | 1,194 | |
| | | | 26,559 | |
Total Short Term Investments (cost $59,546) | | | | 59,547 | |
| | | | | |
Total Investments - 102.4% (cost $62,267) | | | | 62,140 | |
Other Assets and Liabilities, Net - (2.4%) | | | | (1,481 | ) |
Total Net Assets - 100.0% | | | | $ | 60,659 | |
(a) | All or portion of the security was on loan. |
(b) | Non-income producing security. |
(c) | This security is a direct debt of the agency and not collateralized by mortgages. |
(d) | Investment in affiliate. |
(e) | Yield changes daily to reflect current market conditions. Rate was the quoted yield as of December 31, 2014. |
(f) | All or a portion of the security is pledged or segregated as collateral. See the Notes to Financial Statements. |
See accompanying Notes to Financial Statements.
Curian Variable Series Trust Sub-Advised Funds
Schedules of Investments (in thousands, except contracts)
December 31, 2014
Schedule of Open Futures Contracts
| | Expiration | | Contracts
Long | | Unrealized
Appreciation /
(Depreciation) | |
Mini MSCI Emerging Markets Index Future | | March 2015 | | 86 | | $ | 156 | |
MSCI Mini EAFE Index Future | | March 2015 | | 59 | | 43 | |
Russell 2000 Mini Index Future | | March 2015 | | 54 | | 162 | |
S&P 500 E-Mini Index Future | | March 2015 | | 66 | | 99 | |
U.S. Treasury Note Future, 2-Year | | March 2015 | | 128 | | (31 | ) |
| | | | | | $ | 429 | |
Schedule of Over the Counter Total Return Swap Agreements
Counterparty | | Receiving Return of Reference Entity | | Rate Paid by Fund | | Expiration
Date | | Notional
Amount (1) | | Unrealized
(Depreciation) | |
BOA | | iPath S&P 500 Dynamic VIX ETN | | Federal Funds Effective Rate +0.80% | | 12/15/2015 | | $ | 1,397 | | $ | (57 | ) |
CGM | | iPath S&P 500 VIX Mid-Term Futures ETN | | 1-Week LIBOR -0.20% | | 12/15/2015 | | 6,067 | | — | |
CGM | | VelocityShares Daily Inverse VIX Short-Term ETN | | 1-Week LIBOR | | 12/15/2015 | | 2,191 | | — | |
| | | | | | | | | | $ | (57 | ) |
| | | | | | | | | | | | | |
(1) Notional amount is stated in USD.
See accompanying Notes to Financial Statements.
Curian Variable Series Trust Sub-Advised Funds
Schedules of Investments (in thousands)
December 31, 2014
Curian Dynamic Risk Advantage - Income Fund
| | Shares/Par † | | Value | |
INVESTMENT COMPANIES - 99.0% | | | | | |
First Trust North American Energy Infrastructure Fund (a) | | 611 | | $ | 17,209 | |
iShares 20+ Year Treasury Bond ETF (a) | | 198 | | 24,898 | |
iShares Barclays Capital Intermediate Credit Bond ETF | | 202 | | 22,122 | |
iShares Barclays Short Treasury Bond ETF | | 1 | | 96 | |
iShares International Select Dividend ETF (a) | | 156 | | 5,259 | |
iShares JPMorgan USD Emerging Markets Bond ETF (a) | | 122 | | 13,437 | |
iShares US Preferred Stock ETF (a) | | 659 | | 25,978 | |
PIMCO Enhanced Short Maturity ETF (a) | | 33 | | 3,309 | |
Schwab US Dividend Equity ETF (a) | | 460 | | 18,345 | |
SPDR Barclays High Yield Bond ETF (a) | | 244 | | 9,406 | |
SPDR Dow Jones Global Real Estate ETF | | 283 | | 13,509 | |
Vanguard Total International Bond ETF (a) | | 491 | | 26,062 | |
Total Investment Companies (cost $177,221) | | | | 179,630 | |
| | | | | |
SHORT TERM INVESTMENTS - 28.2% | | | | | |
| | | | | |
Investment Company - 2.4% | | | | | |
JNL Money Market Fund, 0.01% (b) (c) | | 4,265 | | 4,265 | |
| | | | | |
Securities Lending Collateral - 25.8% | | | | | |
BlackRock Liquidity Funds TempFund Portfolio, 0.07% (c) | | 12,000 | | 12,000 | |
Fidelity Institutional Money Market Portfolio, 0.09% (c) | | 15,100 | | 15,100 | |
Repurchase Agreement with BNP, 0.05% (Collateralized by $719 U.S. Treasury Note, 0.25%, due 02/29/16, value $719 and $9,493 U.S. Treasury Bond Strip, due 10/15/15, value $9,481) acquired on 12/31/14, due 01/02/15 at $10,000 | | $ | 10,000 | | 10,000 | |
Repurchase Agreement with MLP, 0.06% (Collateralized by $3,225 U.S. Treasury Bond, 6.25%, due 05/15/30, value $4,838 and $5,335 U.S. Treasury Note, 0.13%, due 07/15/24, value $5,123) acquired on 12/31/14, due 01/02/15 at $9,765 | | 9,765 | | 9,765 | |
| | | | 46,865 | |
Total Short Term Investments (cost $51,130) | | | | 51,130 | |
| | | | | |
Total Investments - 127.2% (cost $228,351) | | | | 230,760 | |
Other Assets and Liabilities, Net - (27.2%) | | | | (49,285 | ) |
Total Net Assets - 100.0% | | | | $ | 181,475 | |
| | | | | | | |
(a) All or portion of the security was on loan.
(b) Investment in affiliate.
(c) Yield changes daily to reflect current market conditions. Rate was the quoted yield as of December 31, 2014.
Curian/Aberdeen Latin America Fund
COMMON STOCKS - 91.3% | | | | | |
| | | | | |
ARGENTINA - 2.5% | | | | | |
Tenaris SA - ADR | | 7 | | $ | 212 | |
| | | | | |
BRAZIL - 57.2% | | | | | |
AMBEV SA | | 52 | | 318 | |
Arezzo Industria e Comercio SA | | 22 | | 219 | |
Banco Bradesco SA | | 37 | | 475 | |
BM&F Bovespa SA | | 41 | | 154 | |
BRF SA | | 10 | | 248 | |
Cia Hering | | 14 | | 104 | |
Iguatemi Empresa de Shopping Centers SA | | 9 | | 86 | |
Itau Unibanco Holding SA | | 45 | | 544 | |
Localiza Rent a Car SA | | 10 | | 136 | |
Lojas Renner SA | | 12 | | 342 | |
Multiplan Empreendimentos Imobiliarios SA | | 19 | | 337 | |
Natura Cosmeticos SA | | 17 | | 205 | |
Odontoprev SA | | 39 | | 145 | |
Souza Cruz SA | | 21 | | 152 | |
Totvs SA | | 10 | | 136 | |
Ultrapar Participacoes SA | | 15 | | 283 | |
Vale SA | | 74 | | 610 | |
Valid Solucoes e Servicos de Seguranca em Meios de Pagamento e Identificacao SA | | 6 | | 96 | |
WEG SA | | 10 | | 112 | |
Wilson Sons Ltd. - BDR | | 12 | | 144 | |
| | | | 4,846 | |
CHILE - 6.1% | | | | | |
Banco Santander Chile - ADR | | 12 | | 227 | |
Parque Arauco SA | | 69 | | 132 | |
SACI Falabella | | 24 | | 162 | |
| | | | 521 | |
COLOMBIA - 3.4% | | | | | |
Almacenes Exito SA | | 11 | | 130 | |
Bancolombia SA | | 13 | | 156 | |
| | | | 286 | |
MEXICO - 20.4% | | | | | |
Arca Continental SAB de CV | | 3 | | 19 | |
Fomento Economico Mexicano SAB de CV - ADR (a) | | 4 | | 392 | |
Grupo Aeroportuario del Centro Norte Sab de CV - ADR | | 6 | | 200 | |
Grupo Aeroportuario del Sureste SA de CV - ADR - Class B | | 2 | | 198 | |
Grupo Financiero Banorte SAB de CV | | 62 | | 340 | |
Grupo Financiero Santander Mexico SAB de CV - Class B | | 41 | | 85 | |
Kimberly-Clark de Mexico SAB de CV - Class A | | 66 | | 143 | |
Organizacion Soriana SAB de CV | | 51 | | 138 | |
Wal-Mart de Mexico SAB de CV - Class V | | 98 | | 210 | |
| | | | 1,725 | |
PERU - 1.7% | | | | | |
Grana y Montero SA - ADR | | 12 | | 147 | |
Total Common Stocks (cost $10,150) | | | | 7,737 | |
| | | | | |
PREFERRED STOCKS - 6.1% | | | | | |
| | | | | |
BRAZIL - 3.5% | | | | | |
Banco Bradesco SA | | 16 | | 209 | |
Bradespar SA | | 17 | | 92 | |
| | | | 301 | |
CHILE - 2.6% | | | | | |
Embotelladora Andina SA, 2.59% | | 90 | | 218 | |
Total Preferred Stocks (cost $750) | | | | 519 | |
| | | | | | |
See accompanying Notes to Financial Statements.
| | Shares/Par † | | Value | |
SHORT TERM INVESTMENTS - 2.9% | | | | | |
| | | | | |
Investment Company - 2.9% | | | | | |
JNL Money Market Fund, 0.01% (b) (c) | | 241 | | 241 | |
Total Short Term Investments (cost $241) | | | | 241 | |
| | | | | |
Total Investments - 100.3% (cost $11,141) | | | | 8,497 | |
Other Assets and Liabilities, Net - (0.3%) | | | | (23 | ) |
Total Net Assets - 100.0% | | | | $ | 8,474 | |
| | | | | | |
(a) Non-income producing security.
(b) Investment in affiliate.
(c) Yield changes daily to reflect current market conditions. Rate was the quoted yield as of December 31, 2014.
Curian/AQR Risk Parity Fund (a)
GOVERNMENT AND AGENCY OBLIGATIONS - 36.8%
FRANCE - 5.6% | | | | | |
France Government Inflation Indexed Bond | | | | | |
0.25%, 07/25/18 - 07/25/24 (b), EUR | | 2,062 | | $ | 2,565 | |
1.30%, 07/25/19 (b), EUR | | 2,771 | | 3,613 | |
1.10%, 07/25/22 (b), EUR | | 1,954 | | 2,610 | |
2.10%, 07/25/23 (b), EUR | | 769 | | 1,124 | |
| | | | 9,912 | |
GERMANY - 5.8% | | | | | |
Bundesrepublik Deutschland Bundesobligation Inflation Indexed Bond, 0.75%, 04/15/18 (b), EUR | | 2,659 | | 3,305 | |
Deutsche Bundesrepublik Inflation Indexed Bond | | | | | |
1.75%, 04/15/20 (b), EUR | | 1,645 | | 2,219 | |
0.10%, 04/15/23 (b), EUR | | 3,627 | | 4,584 | |
| | | | 10,108 | |
UNITED KINGDOM - 5.7% | | | | | |
United Kingdom Inflation Indexed Treasury Bond | | | | | |
1.88%, 11/22/22 (b), GBP | | 4,010 | | 7,771 | |
0.13%, 03/22/24 (b), GBP | | 1,276 | | 2,186 | |
| | | | 9,957 | |
UNITED STATES OF AMERICA - 19.7% | | | | | |
U.S. Treasury Inflation Indexed Note | | | | | |
0.13%, 04/15/18 - 07/15/24 (b) | | $ | 25,588 | | 25,197 | |
2.13%, 01/15/19 (b) | | 1,769 | | 1,903 | |
0.38%, 07/15/23 (b) | | 4,897 | | 4,849 | |
0.63%, 01/15/24 (b) | | 2,544 | | 2,560 | |
| | | | 34,509 | |
Total Government and Agency Obligations (cost $66,917) | | | | 64,486 | |
| | | | | |
SHORT TERM INVESTMENTS - 62.7% | | | | | |
| | | | | |
Investment Companies - 40.2% | | | | | |
JNL Money Market Fund, 0.01% (c) (d) | | 16,500 | | 16,500 | |
JPMorgan U.S. Treasury Plus Money Market Fund, 0.00% (d) | | 54,106 | | 54,106 | |
| | | | 70,606 | |
Treasury Securities - 22.5% | | | | | |
U.S. Treasury Bill | | | | | |
0.02%, 01/29/15 | | $ | 33,453 | | 33,453 | |
0.03%, 04/09/15 | | 6,045 | | 6,044 | |
| | | | 39,497 | |
Total Short Term Investments (cost $110,102) | | | | 110,103 | |
| | | | | |
Total Investments - 99.5% (cost $177,019) | | | | 174,589 | |
Other Assets and Liabilities, Net - 0.5% | | | | 951 | |
Total Net Assets - 100.0% | | | | $ | 175,540 | |
(a) Consolidated Schedule of Investments.
(b) Treasury inflation indexed note, par amount is adjusted for inflation.
(c) Investment in affiliate.
(d) Yield changes daily to reflect current market conditions. Rate was the quoted yield as of December 31, 2014.
See accompanying Notes to Financial Statements.
Curian Variable Series Trust Sub-Advised Funds
Schedules of Investments (in thousands, except contracts)
December 31, 2014
Schedule of Open Futures Contracts
| | Expiration | | Contracts
Long | | Unrealized
Appreciation /
(Depreciation) | |
Amsterdam Exchanges Index Future | | January 2016 | | 3 | | $ | 19 | |
ASX SPI 200 Index Future | | March 2015 | | 13 | | 68 | |
Australia Commonwealth Treasury Bond Future, 10-Year | | March 2015 | | 48 | | 68 | |
Brent Crude Oil Future | | March 2015 | | 60 | | (750 | ) |
CAC40 10 Euro Future | | January 2015 | | 18 | | 62 | |
Canadian Government Bond Future, 10-Year | | March 2015 | | 64 | | 122 | |
CBT Wheat Future | | March 2015 | | 33 | | 84 | |
Cocoa Future | | March 2015 | | 7 | | — | |
Coffee ‘C’ Future | | March 2015 | | 10 | | (101 | ) |
Corn Future | | March 2015 | | 52 | | 77 | |
Cotton No.2 Future | | March 2015 | | 15 | | (10 | ) |
Euro STOXX 50 Future | | March 2015 | | 70 | | 110 | |
Euro-Bund Future | | March 2015 | | 241 | | 829 | |
Feeder Cattle Future | | March 2015 | | 2 | | 2 | |
FTSE 100 Index Future | | March 2015 | | 40 | | 218 | |
FTSE/JSE Top 40 Index Future | | March 2015 | | 41 | | 69 | |
FTSE/MIB Index Future | | March 2015 | | 2 | | 4 | |
German Stock Index Future | | March 2015 | | 3 | | 39 | |
Gold 100 Oz. Future | | February 2015 | | 17 | | (14 | ) |
Hang Seng China Enterprises Index Future | | January 2015 | | 4 | | 1 | |
IBEX 35 Index Future | | January 2015 | | 3 | | 16 | |
Japanese Government Bond Future, 10-Year | | March 2015 | | 14 | | 96 | |
KOSPI 200 Future | | March 2015 | | 24 | | (79 | ) |
Lean Hogs Future | | February 2015 | | 3 | | (7 | ) |
LME Aluminum Future | | June 2015 | | 41 | | (125 | ) |
LME Copper Future | | June 2015 | | 22 | | (63 | ) |
LME Lead Future | | June 2015 | | 7 | | (30 | ) |
LME Nickel Future | | June 2015 | | 7 | | (50 | ) |
LME Zinc Future | | June 2015 | | 11 | | (11 | ) |
Russell 2000 Mini Index Future | | March 2015 | | 22 | | 134 | |
S&P 400 E-Mini Index Future | | March 2015 | | 22 | | 127 | |
S&P 500 E-Mini Index Future | | March 2015 | | 291 | | 1,051 | |
S&P/Toronto Stock Exchange 60 Index Future | | March 2015 | | 14 | | 130 | |
SGX CNX Nifty Index Future | | January 2015 | | 71 | | 2 | |
Silver Future | | March 2015 | | 26 | | (91 | ) |
Soybean Future | | May 2015 | | 24 | | (29 | ) |
Soybean Meal Future | | March 2015 | | 18 | | (19 | ) |
Sugar #11 (World Markets) Future | | March 2015 | | 89 | | (217 | ) |
Tokyo Price Index Future | | March 2015 | | 35 | | (85 | ) |
U.K. Long Gilt Future | | March 2015 | | 54 | | 230 | |
U.S. Treasury Note Future, 10-Year | | March 2015 | | 24 | | 12 | |
| | | | | | $ | 1,889 | |
Schedule of Open Forward Foreign Currency Contracts
Purchased/
Sold | | Settlement
Date | | Counter-
Party | | Notional
Amount | | Value | | Unrealized
Gain/(Loss) | |
BRL/USD | | 03/18/2015 | | CSI | | BRL | | 9,800 | | $ | 3,615 | | $ | (77 | ) |
BRL/USD | | 03/18/2015 | | CSI | | BRL | | 100 | | 37 | | 1 | |
CHF/USD | | 03/18/2015 | | CSI | | CHF | | 30 | | 30 | | — | |
CNH/USD | | 03/18/2015 | | CSI | | CNH | | 8,706 | | 1,390 | | (8 | ) |
CNH/USD | | 03/18/2015 | | CSI | | CNH | | 12,694 | | 2,028 | | 2 | |
EUR/USD | | 03/18/2015 | | CSI | | EUR | | 961 | | 1,164 | | (33 | ) |
GBP/USD | | 03/18/2015 | | CSI | | GBP | | 45 | | 70 | | (1 | ) |
HKD/USD | | 03/18/2015 | | CSI | | HKD | | 925 | | 120 | | — | |
HKD/USD | | 03/18/2015 | | CSI | | HKD | | 3,173 | | 409 | | — | |
HUF/USD | | 03/18/2015 | | CSI | | HUF | | 504,900 | | 1,925 | | (106 | ) |
ILS/USD | | 03/18/2015 | | CSI | | ILS | | 9,600 | | 2,463 | | 42 | |
| | | | | | | | | | | | | | | |
See accompanying Notes to Financial Statements.
Curian Variable Series Trust Sub-Advised Funds
Schedules of Investments (in thousands)
December 31, 2014
Purchased/
Sold | | Settlement
Date | | Counter- Party | | Notional
Amount | | Value | | Unrealized
Gain/(Loss) | |
INR/USD | | 03/18/2015 | | CSI | | INR | | 100 | | $ | — | | $ | — | |
INR/USD | | 03/18/2015 | | CSI | | INR | | 1,100 | | 17 | | — | |
JPY/USD | | 03/18/2015 | | CSI | | JPY | | 23,813 | | 199 | | (2 | ) |
JPY/USD | | 03/18/2015 | | CSI | | JPY | | 11,047 | | 92 | | — | |
KRW/USD | | 03/18/2015 | | CSI | | KRW | | 5,745,700 | | 5,210 | | 20 | |
MXN/USD | | 03/18/2015 | | CSI | | MXN | | 72,200 | | 4,871 | | (229 | ) |
PLN/USD | | 03/18/2015 | | CSI | | PLN | | 10,300 | | 2,900 | | (150 | ) |
SGD/USD | | 03/18/2015 | | CSI | | SGD | | 5,200 | | 3,920 | | (36 | ) |
TRY/USD | | 03/18/2015 | | CSI | | TRY | | 11,599 | | 4,891 | | (185 | ) |
TRY/USD | | 03/18/2015 | | CSI | | TRY | | 200 | | 84 | | 2 | |
TWD/USD | | 03/18/2015 | | CSI | | TWD | | 76,700 | | 2,428 | | (43 | ) |
USD/CHF | | 03/18/2015 | | CSI | | CHF | | (36 | ) | (36 | ) | 1 | |
USD/EUR | | 03/18/2015 | | CSI | | EUR | | (31,460 | ) | (38,093 | ) | 710 | |
USD/GBP | | 03/18/2015 | | CSI | | GBP | | (6,310 | ) | (9,828 | ) | 27 | |
USD/HKD | | 03/18/2015 | | CSI | | HKD | | (3,160 | ) | (407 | ) | — | |
USD/ILS | | 03/18/2015 | | CSI | | ILS | | (1,200 | ) | (308 | ) | 3 | |
USD/ILS | | 03/18/2015 | | CSI | | ILS | | (5,200 | ) | (1,334 | ) | (15 | ) |
USD/JPY | | 03/18/2015 | | CSI | | JPY | | (41,000 | ) | (342 | ) | 1 | |
USD/KRW | | 03/18/2015 | | CSI | | KRW | | (156,500 | ) | (142 | ) | (2 | ) |
USD/KRW | | 03/18/2015 | | CSI | | KRW | | (235,100 | ) | (213 | ) | 2 | |
USD/MXN | | 03/18/2015 | | CSI | | MXN | | (100 | ) | (7 | ) | — | |
USD/SGD | | 03/18/2015 | | CSI | | SGD | | (1,400 | ) | (1,055 | ) | 9 | |
USD/TRY | | 03/18/2015 | | CSI | | TRY | | (200 | ) | (84 | ) | 4 | |
USD/TWD | | 03/18/2015 | | CSI | | TWD | | (50,900 | ) | (1,611 | ) | 28 | |
USD/ZAR | | 03/18/2015 | | CSI | | ZAR | | (200 | ) | (17 | ) | 1 | |
ZAR/USD | | 03/18/2015 | | CSI | | ZAR | | 29,200 | | 2,493 | | (60 | ) |
| | | | | | | | | | $ | (13,121 | ) | $ | (94 | ) |
Schedule of Over the Counter Total Return Swap Agreements
Counterparty | | Receiving Return of Reference Entity | | Expiration
Date | �� | Notional
Amount (1) | | Unrealized
Appreciation /
(Depreciation) | |
BCL | | Gold 100 Oz. Future | | 02/27/2015 | | $ | 1,913 | | $ | (19 | ) |
BCL | | ICE Gas Oil Future | | 03/31/2015 | | | 1,697 | | (121 | ) |
BCL | | Natural Gas Future | | 03/31/2015 | | | 1,237 | | (253 | ) |
BCL | | NY Harbor ULSD Future | | 03/30/2015 | | | 1,548 | | (174 | ) |
BCL | | RBOB Gasoline Future | | 03/30/2015 | | | 1,326 | | (188 | ) |
BCL | | WTI Crude Oil Future | | 03/31/2015 | | | 4,230 | | (685 | ) |
BOA | | Bovespa Index Future | | 02/19/2015 | | BRL | 4,349 | | 72 | |
BOA | | Euro-Bund Future | | 03/10/2015 | | EUR | 6,589 | | 138 | |
BOA | | Hang Seng China Enterprises Index Future | | 01/30/2015 | | HKD | 30,203 | | 48 | |
BOA | | Japanese Government Bond Future, 10-Year | | 03/20/2015 | | JPY | 1,175,593 | | 57 | |
BOA | | MSCI Taiwan Stock Index Future | | 01/29/2015 | | | 2,335 | | 33 | |
BOA | | SGX CNX Nifty Index Future | | 01/29/2015 | | | 183 | | 1 | |
BOA | | Swiss Market Index Future | | 03/20/2015 | | CHF | 1,747 | | 35 | |
BOA | | U.K. Long Gilt Future | | 03/31/2015 | | GBP | 1,164 | | 49 | |
BOA | | U.S. Treasury Note Future, 10-Year | | 03/31/2015 | | | 96,916 | | 716 | |
CGM | | CBT Wheat Future | | 03/17/2015 | | | 237 | | 28 | |
CGM | | Coffee ‘C’ Future | | 03/31/2015 | | | 366 | | (54 | ) |
CGM | | Corn Future | | 03/17/2015 | | | 941 | | 91 | |
CGM | | Cotton No.2 Future | | 03/23/2015 | | | 94 | | (4 | ) |
CGM | | LME Zinc Future | | 06/17/2015 | | | 277 | | (4 | ) |
CGM | | Soybean Future | | 05/18/2015 | | | 848 | | (24 | ) |
CGM | | Soybean Oil Future | | 03/24/2015 | | | 824 | | 5 | |
MLP | | Lean Hogs Future | | 02/18/2015 | | | 797 | | (82 | ) |
MLP | | Live Cattle Future | | 03/16/2015 | | | 2,442 | | (87 | ) |
| | | | | | | | | $ | (422 | ) |
(1) Notional amount is stated in USD unless otherwise noted.
See accompanying Notes to Financial Statements.
Curian/Ashmore Emerging Market Small Cap Equity Fund *
| | Shares/Par † | | Value | |
COMMON STOCKS - 98.1% | | | | | |
| | | | | |
BRAZIL - 5.1% | | | | | |
Iochpe-Maxion SA | | 121 | | $ | 556 | |
Tupy SA | | 85 | | 569 | |
Other Securities | | | | 825 | |
| | | | 1,950 | |
CHILE - 1.9% | | | | | |
Other Securities | | | | 747 | |
| | | | | |
CHINA - 17.0% | | | | | |
21Vianet Group Inc. - ADR (a) | | 29 | | 448 | |
Ctrip.com International Ltd. - ADR (a) | | 17 | | 780 | |
Hollysys Automation Technologies Ltd. (a) | | 20 | | 488 | |
iKang Healthcare Group Inc. - ADR (a) | | 25 | | 375 | |
Noah Holdings Ltd. - ADS (a) (b) | | 51 | | 1,068 | |
Phoenix New Media Ltd. - ADR (a) | | 61 | | 507 | |
SouFun Holdings Ltd. - ADR (b) | | 85 | | 628 | |
Sunac China Holdings Ltd. | | 1,737 | | 1,755 | |
Other Securities | | | | 491 | |
| | | | 6,540 | |
COLOMBIA - 0.2% | | | | | |
Other Securities | | | | 80 | |
| | | | | |
EGYPT - 0.9% | | | | | |
Other Securities | | | | 336 | |
| | | | | |
HONG KONG - 10.4% | | | | | |
China Machinery Engineering Corp. - Class H | | 592 | | 452 | |
China Merchants Land Ltd. | | 2,780 | | 407 | |
Chinasoft International Ltd. (a) | | 1,296 | | 362 | |
Ju Teng International Holdings Ltd. | | 1,138 | | 559 | |
Nord Anglia Education Inc. (a) | | 22 | | 427 | |
Pacific Basin Shipping Ltd. | | 1,009 | | 404 | |
Shenzhen Investment Ltd. | | 1,470 | | 422 | |
Singamas Container Holdings Ltd. | | 2,260 | | 375 | |
Other Securities | | | | 600 | |
| | | | 4,008 | |
INDIA - 8.0% | | | | | |
Balrampur Chini Mills Ltd. (a) | | 499 | | 471 | |
ING Vysya Bank Ltd. | | 41 | | 562 | |
PI Industries Ltd. | | 73 | | 599 | |
Shriram Transport Finance Co. Ltd. | | 28 | | 499 | |
Tata Chemicals Ltd. | | 71 | | 491 | |
Other Securities | | | | 445 | |
| | | | 3,067 | |
INDONESIA - 6.1% | | | | | |
Bank Tabungan Negara Persero Tbk PT | | 15,436 | | 1,495 | |
Ciputra Surya Tbk PT | | 1,962 | | 468 | |
Other Securities | | | | 373 | |
| | | | 2,336 | |
MEXICO - 5.1% | | | | | |
Cydsa SAB de CV - Class A | | 209 | | 423 | |
Grupo Industrial Saltillo SAB de CV - Class A | | 192 | | 428 | |
TF Administradora Industrial S de RL de CV | | 318 | | 665 | |
Other Securities | | | | 468 | |
| | | | 1,984 | |
PHILIPPINES - 0.8% | | | | | |
Other Securities | | | | 293 | |
| | | | | |
RUSSIAN FEDERATION - 1.2% | | | | | |
Other Securities | | | | 478 | |
| | | | | |
SOUTH AFRICA - 0.3% | | | | | |
Other Securities | | | | 120 | |
| | | | | |
SOUTH KOREA - 12.7% | | | | | |
i-SENS Inc. (a) | | 7 | | 379 | |
Interpark Corp. | | 50 | | 418 | |
Interpark INT Corp. (a) | | 15 | | 314 | |
Korean Reinsurance Co. | | 65 | | 638 | |
Medy-Tox Inc. | | 2 | | 533 | |
Modetour Network Inc. | | 39 | | 856 | |
Samchuly Bicycle Co. Ltd. | | 21 | | 368 | |
Soulbrain Co. Ltd. | | 19 | | 546 | |
Other Securities | | | | 851 | |
| | | | 4,903 | |
TAIWAN - 24.4% | | | | | |
Altek Corp. | | 694 | | 790 | |
Capital Securities Corp. | | 1,499 | | 494 | |
Casetek Holdings Ltd. | | 211 | | 1,188 | |
Chimei Innolux Corp. | | 2,253 | | 1,089 | |
China Airlines Ltd. (a) | | 1,110 | | 508 | |
Evergreen Marine Corp Taiwan Ltd. (a) | | 1,742 | | 1,228 | |
FLEXium Interconnect Inc. | | 338 | | 752 | |
Gloria Material Technology Corp. | | 808 | | 558 | |
MPI Corp. | | 170 | | 621 | |
Primax Electronics Ltd. | | 720 | | 873 | |
Tainan Spinning Co. Ltd. | | 648 | | 380 | |
Taiwan Paiho Ltd. | | 325 | | 438 | |
Other Securities | | | | 465 | |
| | | | 9,384 | |
THAILAND - 0.5% | | | | | |
Other Securities | | | | 200 | |
| | | | | |
TURKEY - 3.5% | | | | | |
Dogus Otomotiv Servis ve Ticaret A/S | | 138 | | 705 | |
Turkiye Sinai Kalkinma Bankasi A/S | | 730 | | 628 | |
| | | | 1,333 | |
Total Common Stocks (cost $40,061) | | | | 37,759 | |
| | | | | |
PARTICIPATORY NOTES - 1.3% | | | | | |
| | | | | |
SAUDI ARABIA - 1.3% | | | | | |
JPMorgan Structured Products BV Participatory Note (Al Khaleej Training and Education Co.) | | $ | 29 | | 495 | |
Total Participatory Notes (cost $489) | | | | 495 | |
| | | | | |
PREFERRED STOCKS - 0.5% | | | | | |
| | | | | |
BRAZIL - 0.5% | | | | | |
Other Securities | | | | 203 | |
Total Preferred Stocks (cost $225) | | | | 203 | |
| | | | | |
RIGHTS - 0.0% | | | | | |
| | | | | |
CHILE - 0.0% | | | | | |
Other Securities | | | | 9 | |
Total Rights (cost $0) | | | | 9 | |
| | | | | |
SHORT TERM INVESTMENTS - 1.2% | | | | | |
| | | | | |
Investment Company - 0.5% | | | | | |
JNL Money Market Fund, 0.01% (c) (d) | | 178 | | 178 | |
| | | | | |
Securities Lending Collateral - 0.7% | | | | | |
BlackRock Liquidity Funds TempFund Portfolio, 0.07% (d) | | 100 | | 100 | |
| | | | | | | |
See accompanying Notes to Financial Statements.
| | Shares/Par † | | Value | |
Fidelity Institutional Money Market Portfolio, 0.09% (d) | | 100 | | 100 | |
Repurchase Agreement with MLP, 0.06% (Collateralized by $23 U.S. Treasury Bond, 6.25%, due 05/15/30, value $34 and $38 U.S. Treasury Note, 0.13%, due 07/15/24, value $36) acquired on 12/31/14, due 01/02/15 at $69 | | $ | 69 | | 69 | |
| | | | 269 | |
Total Short Term Investments (cost $447) | | | | 447 | |
| | | | | |
Total Investments - 101.1% (cost $41,222) | | | | 38,913 | |
Other Assets and Liabilities, Net - (1.1%) | | | | (422 | ) |
Total Net Assets - 100.0% | | | | $ | 38,491 | |
| | | | | | | |
(a) Non-income producing security.
(b) All or portion of the security was on loan.
(c) Investment in affiliate.
(d) Yield changes daily to reflect current market conditions. Rate was the quoted yield as of December 31, 2014.
Curian/Baring International Fixed Income Fund
CORPORATE BONDS AND NOTES - 11.4% | | | | | |
| | | | | |
GERMANY - 4.8% | | | | | |
Deutsche Telekom International Finance BV, 4.25%, 07/13/22, EUR | | 50 | | $ | 75 | |
FMS Wertmanagement AoeR, 2.00%, 05/23/18, EUR | | 400 | | 514 | |
KFW, 5.55%, 06/07/21, GBP | | 300 | | 577 | |
| | | | 1,166 | |
LUXEMBOURG - 2.6% | | | | | |
European Investment Bank | | | | | |
3.00%, 12/07/15, GBP | | 350 | | 557 | |
5.00%, 04/15/39, GBP | | 40 | | 87 | |
| | | | 644 | |
NETHERLANDS - 2.4% | | | | | |
Cooperatieve Centrale Raiffeisen-Boerenleenbank BA | | | | | |
4.00%, 09/10/15, GBP | | 90 | | 143 | |
1.85%, 04/12/17, JPY | | 30,000 | | 260 | |
ING Bank NV, 5.38%, 04/15/21, GBP | | 100 | | 183 | |
| | | | 586 | |
SWEDEN - 0.5% | | | | | |
Skandinaviska Enskilda Banken AB, 2.50%, 09/01/15, EUR | | 100 | | 123 | |
| | | | | |
UNITED KINGDOM - 1.1% | | | | | |
Abbey National Treasury Services Plc, 4.13%, 09/14/17, GBP | | 80 | | 134 | |
SSE Plc, 8.38%, 11/20/28, GBP | | 60 | | 144 | |
| | | | 278 | |
Total Corporate Bonds and Notes (cost $2,947) | | | | 2,797 | |
| | | | | |
GOVERNMENT AND AGENCY OBLIGATIONS - 85.6% | | | | | |
| | | | | |
AUSTRALIA - 4.7% | | | | | |
Western Australian Treasury Corp. | | | | | |
8.00%, 07/15/17, AUD | | 530 | | 492 | |
7.00%, 10/15/19, AUD | | 680 | | 664 | |
| | | | 1,156 | |
AUSTRIA - 2.5% | | | | | |
Austria Government Bond | | | | | |
3.20%, 02/20/17, EUR | | 300 | | 388 | |
4.15%, 03/15/37, EUR | | 120 | | 223 | |
| | | | 611 | |
BELGIUM - 4.7% | | | | | |
Belgium Government Bond | | | | | |
4.25%, 09/28/21, EUR | | 350 | | 533 | |
2.25%, 06/22/23, EUR | | 450 | | 615 | |
| | | | 1,148 | |
CANADA - 3.9% | | | | | |
Canada Housing Trust No. 1, 1.85%, 12/15/16, CAD | | 450 | | 392 | |
Province of Alberta, Canada | | | | | |
1.85%, 09/01/16, CAD | | 500 | | 436 | |
1.75%, 06/15/17, CAD | | 150 | | 131 | |
| | | | 959 | |
FRANCE - 6.6% | | | | | |
Agence Francaise de Developpement, 1.80%, 06/19/15, JPY | | 10,000 | | 84 | |
Caisse Francaise de Financement Local, 1.80%, 05/09/17, JPY | | 40,000 | | 348 | |
France Government Bond | | | | | |
3.50%, 04/25/26, EUR | | 124 | | 190 | |
5.75%, 10/25/32, EUR | | 330 | | 665 | |
4.75%, 04/25/35, EUR | | 175 | | 326 | |
| | | | 1,613 | |
GERMANY - 1.8% | | | | | |
Federal Republic of Germany, 4.00%, 01/04/37, EUR | | 130 | | 240 | |
KFW, 2.05%, 02/16/26, JPY | | 21,000 | | 209 | |
| | | | 449 | |
IRELAND - 2.1% | | | | | |
Ireland Government Bond | | | | | |
4.60%, 04/18/16, EUR | | 300 | | 384 | |
4.50%, 10/18/18, EUR | | 100 | | 140 | |
| | | | 524 | |
ITALY - 13.4% | | | | | |
Italy Buoni Poliennali Del Tesoro | | | | | |
4.25%, 09/01/19, EUR | | 605 | | 843 | |
3.75%, 08/01/21, EUR | | 570 | | 793 | |
4.75%, 08/01/23, EUR | | 550 | | 827 | |
Republic of Italy, 5.25%, 11/01/29, EUR | | 510 | | 821 | |
| | | | 3,284 | |
JAPAN - 14.2% | | | | | |
Japan Government Bond | | | | | |
0.80%, 12/20/22, JPY | | 50,700 | | 444 | |
1.90%, 06/20/25, JPY | | 20,000 | | 193 | |
1.60%, 06/20/30, JPY | | 45,500 | | 429 | |
1.40%, 12/20/32, JPY | | 27,000 | | 243 | |
1.70%, 06/20/33, JPY | | 102,000 | | 958 | |
2.00%, 09/20/41, JPY | | 97,450 | | 957 | |
1.80%, 09/20/43, JPY | | 27,300 | | 258 | |
| | | | 3,482 | |
LUXEMBOURG - 2.0% | | | | | |
European Investment Bank | | | | | |
4.13%, 12/07/17, GBP | | 130 | | 220 | |
4.00%, 10/15/37, EUR | | 150 | | 271 | |
| | | | 491 | |
| | | | | | |
See accompanying Notes to Financial Statements.
| | Shares/Par † | | Value | |
MEXICO - 4.2% | | | | | |
Mexico Bonos | | | | | |
7.25%, 12/15/16, MXN | | 1,300 | | 94 | |
6.50%, 06/10/21, MXN | | 5,400 | | 384 | |
8.00%, 12/07/23, MXN | | 6,900 | | 538 | |
| | | | 1,016 | |
NETHERLANDS - 0.4% | | | | | |
Netherlands Government Bond, 1.25%, 01/15/19, EUR | | 70 | | 89 | |
| | | | | |
NORWAY - 0.4% | | | | | |
Norway Government Bond, 2.00%, 05/24/23, NOK | | 700 | | 98 | |
| | | | | |
PHILIPPINES - 2.5% | | | | | |
Asian Development Bank, 2.35%, 06/21/27, JPY | | 60,000 | | 612 | |
| | | | | |
POLAND - 2.6% | | | | | |
Poland Government Bond | | | | | |
3.75%, 04/25/18, PLN | | 1,000 | | 298 | |
3.25%, 07/25/25, PLN | | 1,100 | | 332 | |
| | | | 630 | |
SOUTH AFRICA - 0.6% | | | | | |
South Africa Government Bond, 7.00%, 02/28/31, ZAR | | 1,850 | | 140 | |
| | | | | |
SPAIN - 11.4% | | | | | |
Spain Government Bond | | | | | |
4.10%, 07/30/18, EUR | | 400 | | 542 | |
2.75%, 04/30/19, EUR | | 420 | | 551 | |
5.50%, 04/30/21, EUR | | 490 | | 753 | |
3.80%, 04/30/24, EUR | | 650 | | 941 | |
| | | | 2,787 | |
SWEDEN - 1.4% | | | | | |
Sweden Government Bond | | | | | |
3.00%, 07/12/16, SEK | | 1,400 | | 188 | |
3.50%, 06/01/22, SEK | | 430 | | 66 | |
2.50%, 05/12/25, SEK | | 580 | | 86 | |
| | | | 340 | |
UNITED KINGDOM - 4.7% | | | | | |
United Kingdom Treasury Bond | | | | | |
2.75%, 01/22/15, GBP | | 150 | | 234 | |
2.25%, 09/07/23, GBP | | 400 | | 653 | |
4.50%, 09/07/34, GBP | | 130 | | 272 | |
| | | | 1,159 | |
UNITED STATES OF AMERICA - 1.5% | | | | | |
International Bank for Reconstruction & Development, 5.40%, 06/07/21, GBP | | 190 | | 365 | |
| | | | | |
Total Government and Agency Obligations (cost $22,025) | | | | 20,953 | |
| | | | | |
SHORT TERM INVESTMENTS - 1.8% | | | | | |
Investment Company - 1.8% | | | | | |
JNL Money Market Fund, 0.01% (a) (b) | | 438 | | 438 | |
| | | | | |
Total Short Term Investments (cost $438) | | | | 438 | |
| | | | | |
Total Investments - 98.8% (cost $25,410) | | | | 24,188 | |
Other Assets and Liabilities, Net - 1.2% | | | | 300 | |
Total Net Assets - 100.0% | | | | $ | 24,488 | |
| | | | | | |
(a) Investment in affiliate.
(b) Yield changes daily to reflect current market conditions. Rate was the quoted yield as of December 31, 2014.
See accompanying Notes to Financial Statements.
Schedule of Open Forward Foreign Currency Contracts
Purchased/
Sold | | Settlement
Date | | Counter-
Party | | Notional
Amount | | Value | | Unrealized
Gain/(Loss) | |
EUR/USD | | 02/06/2015 | | CIB | | EUR | | 763 | | $ | 924 | | $ | (34 | ) |
EUR/USD | | 02/06/2015 | | GSC | | EUR | | 643 | | 779 | | (27 | ) |
JPY/USD | | 03/06/2015 | | NTS | | JPY | | 305,000 | | 2,548 | | 16 | |
NOK/USD | | 03/06/2015 | | HSB | | NOK | | 7,020 | | 940 | | (38 | ) |
PLN/USD | | 03/06/2015 | | SSB | | PLN | | 1,736 | | 489 | | (24 | ) |
SGD/USD | | 03/13/2015 | | IMP | | SGD | | 130 | | 98 | | (1 | ) |
USD/AUD | | 02/06/2015 | | CIT | | AUD | | (190 | ) | (155 | ) | 8 | |
USD/AUD | | 02/06/2015 | | HSB | | AUD | | (530 | ) | (431 | ) | 10 | |
USD/AUD | | 02/06/2015 | | BMO | | AUD | | (540 | ) | (440 | ) | 5 | |
USD/CAD | | 03/06/2015 | | HSB | | CAD | | (424 | ) | (365 | ) | 6 | |
USD/EUR | | 02/06/2015 | | HSB | | EUR | | (2,093 | ) | (2,534 | ) | 73 | |
USD/EUR | | 02/06/2015 | | NTS | | EUR | | (158 | ) | (191 | ) | 5 | |
USD/EUR | | 02/06/2015 | | SSB | | EUR | | (179 | ) | (146 | ) | 6 | |
USD/EUR | | 03/06/2015 | | CIT | | EUR | | (622 | ) | (753 | ) | 16 | |
USD/GBP | | 03/06/2015 | | GSC | | GBP | | (1,192 | ) | (1,857 | ) | 11 | |
USD/JPY | | 03/06/2015 | | NTS | | JPY | | (49,623 | ) | (415 | ) | 13 | |
USD/NOK | | 03/06/2015 | | CIB | | NOK | | (7,020 | ) | (940 | ) | (24 | ) |
USD/PLN | | 03/06/2015 | | CIT | | PLN | | (113 | ) | (32 | ) | 2 | |
USD/SEK | | 03/06/2015 | | GSC | | SEK | | (1,800 | ) | (231 | ) | 8 | |
| | | | | | | | | | $ | (2,712 | ) | $ | 31 | |
See accompanying Notes to Financial Statements.
Curian/BlackRock Global Long Short Credit Fund *
| | Shares/Par † | | Value | |
COMMON STOCKS - 1.2% | | | | | |
| | | | | |
GERMANY - 0.1% | | | | | |
Commerzbank AG (a) | | 19 | | $ | 247 | |
| | | | | |
IRELAND - 0.1% | | | | | |
Other Securities | | | | 206 | |
| | | | | |
NETHERLANDS - 0.1% | | | | | |
Other Securities | | | | 289 | |
| | | | | |
SPAIN - 0.0% | | | | | |
Criteria CaixaCorp SA | | 36 | | 186 | |
| | | | | |
UNITED KINGDOM - 0.2% | | | | | |
Barclays Plc | | 258 | | 969 | |
| | | | | |
UNITED STATES OF AMERICA - 0.7% | | | | | |
Other Securities | | | | 2,674 | |
Total Common Stocks (cost $4,322) | | | | 4,571 | |
| | | | | |
NON-U.S. GOVERNMENT AGENCY ASSET-BACKED SECURITIES - 13.5% | | | | | |
| | | | | |
AUSTRALIA - 0.7% | | | | | |
Virgin Australia Trust | | | | | |
8.50%, 10/23/16 (b) | | $ | 1,020 | | 1,040 | |
7.13%, 10/23/18 (b) | | 1,179 | | 1,216 | |
6.00%, 10/23/20 (b) | | 521 | | 532 | |
| | | | 2,788 | |
CANADA - 0.2% | | | | | |
Other Securities | | | | 760 | |
| | | | | |
CAYMAN ISLANDS - 0.1% | | | | | |
Other Securities | | | | 263 | |
| | | | | |
GERMANY - 0.4% | | | | | |
Other Securities | | | | 1,371 | |
| | | | | |
GUERNSEY - 0.3% | | | | | |
Other Securities | | | | 989 | |
| | | | | |
IRELAND - 2.2% | | | | | |
ALME Loan Funding | | | | | |
1.69%, 08/15/27 (c) (d), EUR | | 1,390 | | 1,674 | |
5.39%, 08/15/27 (c) (d), EUR | | 310 | | 342 | |
6.14%, 08/15/27 (c) (d), EUR | | 250 | | 263 | |
Arbour CLO Ltd. | | | | | |
1.81%, 06/16/27 (c) (d), EUR | | 1,728 | | 2,090 | |
5.36%, 06/16/27 (c) (d), EUR | | 338 | | 373 | |
6.11%, 06/16/27 (c) (d), EUR | | 336 | | 354 | |
Other Securities | | | | 3,429 | |
| | | | 8,525 | |
ITALY - 0.2% | | | | | |
Other Securities | | | | 850 | |
| | | | | |
NETHERLANDS - 1.7% | | | | | |
North Westerly CLO IV BV | | | | | |
1.76%, 01/15/26 (c) (d), EUR | | 2,200 | | 2,659 | |
2.99%, 01/15/26 (c) (d), EUR | | 528 | | 530 | |
Other Securities | | | | 3,473 | |
| | | | 6,662 | |
PORTUGAL - 0.5% | | | | | |
TAGUS-Sociedade de Titularizacao de Creditos SA, 2.98%, 02/16/18 (d), EUR | | 1,585 | | 1,928 | |
| | | | | |
UNITED KINGDOM - 0.3% | | | | | |
Other Securities | | | | 1,019 | |
| | | | | |
UNITED STATES OF AMERICA - 6.9% | | | | | |
American Airlines Pass-Through Trust | | | | | |
6.00%, 01/15/17 (b) | | 2,350 | | 2,388 | |
6.13%, 07/15/18 | | 1,750 | | 1,811 | |
6.98%, 05/23/21 | | 853 | | 891 | |
ING IM CLO Ltd., 4.98%, 10/15/22 (b) (c) | | 250 | | 248 | |
ING Investment Management Co., 2.93%, 01/18/26 (b) (c) | | 255 | | 242 | |
US Airways Pass-Through Trust | | | | | |
5.45%, 06/03/18 | | 2,700 | | 2,727 | |
8.00%, 10/01/19 | | 206 | | 232 | |
6.75%, 06/03/21 | | 627 | | 669 | |
5.38%, 11/15/21 (o) | | 1,602 | | 1,639 | |
Other Securities | | | | 15,327 | |
| | | | 26,174 | |
Total Non-U.S. Government Agency Asset-Backed Securities (cost $53,757) | | | | 51,329 | |
| | | | | |
CORPORATE BONDS AND NOTES - 63.7% | | | | | |
| | | | | |
BARBADOS - 0.1% | | | | | |
Other Securities | | | | 510 | |
| | | | | |
BRAZIL - 0.6% | | | | | |
Petrobras Global Finance BV | | | | | |
4.88%, 03/17/20 | | 550 | | 515 | |
5.38%, 10/01/29, GBP | | 145 | | 180 | |
6.63%, 01/16/34, GBP | | 420 | | 566 | |
7.25%, 03/17/44 | | 925 | | 913 | |
| | | | 2,174 | |
CANADA - 0.5% | | | | | |
Other Securities | | | | 1,969 | |
| | | | | |
CHILE - 0.1% | | | | | |
Other Securities | | | | 270 | |
| | | | | |
CZECH REPUBLIC - 0.2% | | | | | |
Other Securities | | | | 903 | |
| | | | | |
DENMARK - 0.3% | | | | | |
Other Securities | | | | 1,249 | |
| | | | | |
FRANCE - 3.3% | | | | | |
BNP Paribas Cardif SA, 4.03%, (callable at 100 beginning 11/25/25) (f), EUR | | 700 | | 851 | |
BNP Paribas SA, 2.62%, 10/14/27 (c) (d), EUR | | 1,050 | | 1,278 | |
Numericable Group SA | | | | | |
4.88%, 05/15/19 (b) | | 475 | | 471 | |
5.38%, 05/15/22 (d), EUR | | 745 | | 930 | |
5.63%, 05/15/24 (d), EUR | | 595 | | 745 | |
6.25%, 05/15/24 (b) | | 270 | | 272 | |
Numericable Group SA Term Loan, 4.50%, 04/23/20 (c), EUR | | 720 | | 866 | |
Other Securities | | | | 7,244 | |
| | | | 12,657 | |
GERMANY - 5.6% | | | | | |
Commerzbank AG, 7.75%, 03/16/21, EUR | | 1,500 | | 2,219 | |
HSH Nordbank AG | | | | | |
7.25% (callable at 100 beginning 12/30/14) (f) | | 1,400 | | 500 | |
0.88%, 02/14/17 (c), EUR | | 513 | | 511 | |
0.92%, 02/14/17 (c) (d), EUR | | 1,484 | | 1,477 | |
Volkswagen International Finance NV | | | | | |
5.50%, 11/09/15 (b) (h), EUR | | 400 | | 535 | |
5.50%, 11/09/15 (d) (h), EUR | | 4,700 | | 6,290 | |
| | | | | | | |
See accompanying Notes to Financial Statements.
| | Shares/Par † | | Value | |
Other Securities | | | | 9,861 | |
| | | | 21,393 | |
INDIA - 0.1% | | | | | |
Other Securities | | | | 539 | |
| | | | | |
IRELAND - 2.1% | | | | | |
Bank of Ireland | | | | | |
3.25%, 01/15/19 (d), EUR | | 1,160 | | 1,505 | |
4.25%, 06/11/24 (d), EUR | | 1,800 | | 2,151 | |
Other Securities | | | | 4,386 | |
| | | | 8,042 | |
ITALY - 7.5% | | | | | |
Arianna SPV Srl, 3.60%, 04/20/19 (d), EUR | | 1,619 | | 2,041 | |
Banca Monte dei Paschi di Siena SpA | | | | | |
2.88%, 04/16/21 (d), EUR | | 1,150 | | 1,514 | |
2.88%, 07/16/25 (d), EUR | | 770 | | 1,000 | |
Telecom Italia Finance SA | | | | | |
6.13%, 11/15/16 (d) (h), EUR | | 3,000 | | 4,254 | |
7.75%, 01/24/33, EUR | | 910 | | 1,460 | |
UniCredit SpA | | | | | |
6.75% (callable at 100 beginning 09/10/21) (d) (f), EUR | | 200 | | 234 | |
3.25%, 01/14/21 (d), EUR | | 1,580 | | 2,091 | |
6.95%, 10/31/22 (d), EUR | | 620 | | 882 | |
5.75%, 10/28/25 (d), EUR | | 1,970 | | 2,576 | |
Wind Acquisition Finance SA | | | | | |
4.00%, 07/15/20 (d), EUR | | 1,453 | | 1,725 | |
4.08%, 07/15/20 (c) (d), EUR | | 370 | | 427 | |
Other Securities | | | | 10,328 | |
| | | | 28,532 | |
JAMAICA - 0.1% | | | | | |
Other Securities | | | | 236 | |
| | | | | |
JERSEY - 0.4% | | | | | |
Other Securities | | | | 1,460 | |
| | | | | |
LUXEMBOURG - 2.1% | | | | | |
Other Securities | | | | 8,104 | |
| | | | | |
MEXICO - 0.3% | | | | | |
Other Securities | | | | 1,071 | |
| | | | | |
NETHERLANDS - 1.9% | | | | | |
Ziggo BV Term Loan B-1, 3.50%, 01/15/22 (c), EUR | | 483 | | 572 | |
Ziggo BV Term Loan B-2, 3.50%, 01/15/22 (c), EUR | | 311 | | 369 | |
Ziggo BV Term Loan B-3, 3.75%, 01/15/22 (c), EUR | | 875 | | 1,036 | |
Other Securities | | | | 5,454 | |
| | | | 7,431 | |
POLAND - 0.2% | | | | | |
Other Securities | | | | 611 | |
| | | | | |
PORTUGAL - 1.1% | | | | | |
Banco Espirito Santo SA | | | | | |
2.63%, 05/08/17 (d), EUR | | 400 | | 450 | |
4.75%, 01/15/18 (d), EUR | | 900 | | 1,067 | |
4.00%, 01/21/19 (d), EUR | | 900 | | 1,054 | |
Other Securities | | | | 1,841 | |
| | | | 4,412 | |
SPAIN - 4.5% | | | | | |
Bankia SA | | | | | |
3.50%, 01/17/19 (d), EUR | | 2,400 | | 3,134 | |
4.00%, 05/22/24 (d), EUR | | 2,900 | | 3,428 | |
CaixaBank SA | | | | | |
4.50%, 11/22/16 (d) (h), EUR | | 1,100 | | 1,200 | |
5.00%, 11/14/23 (d), EUR | | 900 | | 1,168 | |
Other Securities | | | | 8,202 | |
| | | | 17,132 | |
SWEDEN - 0.2% | | | | | |
Other Securities | | | | 727 | |
| | | | | |
SWITZERLAND - 0.8% | | | | | |
UBS AG | | | | | |
4.75%, 05/22/23 (d) | | 300 | | 303 | |
5.13%, 05/15/24 (d) | | 775 | | 778 | |
4.75%, 02/12/26 (d), EUR | | 665 | | 861 | |
Other Securities | | | | 1,321 | |
| | | | 3,263 | |
UNITED KINGDOM - 4.2% | | | | | |
Barclays Plc | | | | | |
8.00% (callable at 100 beginning 12/15/20) (f), EUR | | 675 | | 850 | |
8.25% (callable at 100 beginning 12/15/18) (f) | | 498 | | 510 | |
RAC Finance Holdings Ltd. Term Loan | | | | | |
0.00%,11/30/21 (j), GBP | | 980 | | 1,518 | |
0.00%,11/30/22 (j), GBP | | 490 | | 765 | |
Other Securities | | | | 12,236 | |
| | | | 15,879 | |
UNITED STATES OF AMERICA - 27.4% | | | | | |
Anadarko Petroleum Corp., 0.00%, 10/10/36 (k) | | 8,370 | | 3,175 | |
AT&T Inc., 0.00%, 11/27/22 (b) (k) | | 3,000 | | 2,339 | |
Bank of America Corp. | | | | | |
6.25% (callable at 100 beginning 09/05/24) (f) | | 1,725 | | 1,705 | |
6.50% (callable at 100 beginning 10/23/24) (f) | | 1,110 | | 1,130 | |
Caesars Entertainment Corp. Term Loan, 9.75%, 01/28/18 (c) | | 736 | | 635 | |
Caesars Entertainment Operating Co. 1st Lien Term Loan, 6.99%, 01/28/18 (c) | | 386 | | 337 | |
Caesars Entertainment Operating Co. Inc., 9.00%, 02/15/20 | | 346 | | 256 | |
Caesars Entertainment Resort Properties LLC Term Loan B, 7.00%, 09/17/20 (c) | | 975 | | 907 | |
Citigroup Inc. | | | | | |
5.90% (callable at 100 beginning 02/15/23) (f) | | 436 | | 425 | |
5.95% (callable at 100 beginning 01/30/23) (f) | | 554 | | 546 | |
Cox Communications Inc., 3.85%, 02/01/25 (b) | | 2,273 | | 2,294 | |
ING US Inc., 5.65%, 05/15/53 (c) | | 1,615 | | 1,599 | |
JPMorgan Chase & Co. | | | | | |
5.00% (callable at 100 beginning 07/01/19) (f) | | 600 | | 587 | |
6.10% (callable at 100 beginning 10/01/24) (f) | | 500 | | 499 | |
6.12% (callable at 100 beginning 04/30/24) (f) | | 360 | | 359 | |
6.75% (callable at 100 beginning 02/01/24) (f) | | 1,521 | | 1,607 | |
KLA-Tencor Corp., 4.65%, 11/01/24 | | 1,895 | | 1,962 | |
Meccanica Holdings USA Inc. | | | | | |
6.25%, 07/15/19 (b) | | 510 | | 556 | |
7.38%, 07/15/39 (b) | | 230 | | 237 | |
6.25%, 01/15/40 (b) | | 1,120 | | 1,064 | |
Mondelez International Inc. Term Loan B-1, 4.25%, 07/04/21 (c), EUR | | 1,730 | | 2,082 | |
See accompanying Notes to Financial Statements.
Curian Variable Series Trust Sub-Advised Funds
Schedules of Investments (in thousands, except contracts)
December 31, 2014
| | Shares/Par † | | Value | |
Morgan Stanley | | | | | |
5.45% (callable at 100 beginning 07/15/19) (f) | | 1,685 | | 1,688 | |
2.38%, 03/31/21, EUR | | 910 | | 1,183 | |
Verizon Communications Inc. | | | | | |
5.15%, 09/15/23 | | 2,260 | | 2,496 | |
3.50%, 11/01/24 | | 200 | | 196 | |
4.40%, 11/01/34 | | 675 | | 671 | |
Other Securities | | | | 73,845 | |
| | | | 104,380 | |
VENEZUELA - 0.1% | | | | | |
Other Securities | | | | 258 | |
Total Corporate Bonds and Notes (cost $251,592) | | | | 243,202 | |
| | | | | |
GOVERNMENT AND AGENCY OBLIGATIONS - 9.6% | | | | | |
| | | | | |
CROATIA - 0.1% | | | | | |
Other Securities | | | | 323 | |
| | | | | |
HUNGARY - 0.1% | | | | | |
Other Securities | | | | 346 | |
| | | | | |
INDONESIA - 0.2% | | | | | |
Other Securities | | | | 677 | |
| | | | | |
ITALY - 0.8% | | | | | |
Italy Buoni Poliennali Del Tesoro | | | | | |
5.50%, 11/01/22, EUR | | 800 | | 1,245 | |
2.50%, 12/01/24, EUR | | 1,510 | | 1,928 | |
| | | | 3,173 | |
PORTUGAL - 0.5% | | | | | |
Portugal Government International Bond | | | | | |
3.50%, 03/25/15 (d) | | 1,250 | | 1,259 | |
5.13%, 10/15/24 (d) | | 725 | | 762 | |
| | | | 2,021 | |
ROMANIA - 0.1% | | | | | |
Other Securities | | | | 318 | |
| | | | | |
RUSSIAN FEDERATION - 0.2% | | | | | |
Other Securities | | | | 679 | |
| | | | | |
SERBIA - 0.1% | | | | | |
Other Securities | | | | 334 | |
| | | | | |
SLOVENIA - 0.1% | | | | | |
Other Securities | | | | 353 | |
| | | | | |
UNITED STATES OF AMERICA - 7.4% | | | | | |
U.S. Treasury Bond | | | | | |
3.38%, 05/15/44 | | 2,010 | | 2,264 | |
3.13%, 08/15/44 | | 3,294 | | 3,546 | |
3.00%, 11/15/44 | | 15 | | 16 | |
U.S. Treasury Note | | | | | |
1.00%, 09/15/17 | | 470 | | 470 | |
1.00%, 12/15/17 | | 4,565 | | 4,555 | |
1.75%, 09/30/19 | | 8 | | 8 | |
1.50%, 11/30/19 (o) | | 9,978 | | 9,912 | |
1.88%, 11/30/21 | | 135 | | 134 | |
2.13%, 12/31/21 | | 430 | | 434 | |
2.25%, 11/15/24 | | 6,782 | | 6,828 | |
| | | | 28,167 | |
VENEZUELA - 0.0% | | | | | |
Other Securities | | | | 49 | |
Total Government and Agency Obligations (cost $36,451) | | | | 36,440 | |
| | Shares/Par/Contracts † | | | |
TRUST PREFERREDS - 0.1% | | | | | |
| | | | | |
UNITED STATES OF AMERICA - 0.1% | | | | | |
Other Securities | | | | 440 | |
Total Trust Preferreds (cost $401) | | | | 440 | |
| | | | | |
PREFERRED STOCKS - 2.6% | | | | | |
| | | | | |
GERMANY - 0.3% | | | | | |
Other Securities | | | | 1,280 | |
| | | | | |
UNITED KINGDOM - 0.1% | | | | | |
Other Securities | | | | 248 | |
| | | | | |
UNITED STATES OF AMERICA - 2.2% | | | | | |
Citigroup Inc., 6.88%, (callable at 25 beginning 11/15/23) (f) | | 124 | | 3,296 | |
Goldman Sachs Group Inc., 6.38%, (callable at 25 beginning 05/10/24) (f) | | 48 | | 1,244 | |
Goldman Sachs Group Inc., 5.50%, (callable at 25 beginning 05/10/23) (f) | | 53 | | 1,296 | |
Other Securities | | | | 2,732 | |
| | | | 8,568 | |
Total Preferred Stocks (cost $10,327) | | | | 10,096 | |
| | | | | |
PURCHASED OPTIONS - 0.0% | | | | | |
Other Securities | | | | 137 | |
Total Purchased Options (cost $225) | | | | 137 | |
| | | | | |
SHORT TERM INVESTMENTS - 22.7% | | | | | |
| | | | | |
Investment Company - 7.0% | | | | | |
JNL Money Market Fund, 0.01% (m) (n) | | 26,633 | | 26,633 | |
| | | | | |
Repurchase Agreements - 15.7% | | | | | |
| | | | | |
Australia - 0.2% | | | | | |
Repurchase Agreement with CGM, (0.10)% (Collateralized by $100 BHP Billiton Finance USA Ltd., 5.00%, due 09/30/43, value $114) acquired on 12/29/14, open maturity at $112 | | $ | 112 | | 112 | |
Repurchase Agreement with DUB, (0.10)% (Collateralized by $678 Westpac Banking Corp., 2.25%, due 07/30/18, value $689) acquired on 10/08/14, open maturity at $691 | | 691 | | 691 | |
| | | | 803 | |
Belgium - 0.4% | | | | | |
Repurchase Agreement with CGM, (0.10)% (Collateralized by $1,670 Anheuser-Busch InBev Finance Inc., 3.70%, due 02/01/24, value $1,741) acquired on 10/30/14, open maturity at $1,714 | | 1,714 | | 1,714 | |
| | | | | |
Canada - 0.4% | | | | | |
Repurchase Agreement with BCL, (0.15)% (Collateralized by $1,151 Potash Corp. of Saskatchewan Inc., 5.63%, due 12/01/40, value $1,432) acquired on 12/16/14, open maturity at $1,396 | | 1,396 | | 1,396 | |
| | | | | |
Germany - 0.4% | | | | | |
Repurchase Agreement with JPM, (0.18)% (Collateralized by EUR 323 Bundesrepublik Deutschland, 2.50%, due 01/04/21, value EUR 370) acquired on 12/16/14, open maturity at $458, EUR | | 379 | | 458 | |
| | | | | | |
See accompanying Notes to Financial Statements.
Curian Variable Series Trust Sub-Advised Funds
Schedules of Investments (in thousands)
December 31, 2014
| | Shares/Par † | | Value | |
Repurchase Agreement with JPM, (0.18)% (Collateralized by EUR 725 Bundesobligation, 0.75%, due 02/24/17, value EUR 737) acquired on 12/16/14, open maturity at $903, EUR | | 746 | | 903 | |
| | | | 1,361 | |
Italy - 0.0% | | | | | |
Repurchase Agreement with BBP, (0.08)% (Collateralized by EUR 44 Italy Buoni Poliennali Del Tesoro, 4.50%, due 05/01/23, value EUR 54) acquired on 12/17/14, open maturity at $66, EUR | | 54 | | 66 | |
| | | | | |
United Kingdom - 0.7% | | | | | |
Repurchase Agreement with BCL, (0.10)% (Collateralized by $350 Standard Chartered Plc, 5.70%, due 03/26/44, value $367) acquired on 10/02/14, open maturity at $379 | | 379 | | 379 | |
Repurchase Agreement with BCL, (0.10)% (Collateralized by $410 Standard Chartered Plc, 5.70%, due 03/26/44, value $430) acquired on 10/20/14, open maturity at $444 | | 444 | | 444 | |
Repurchase Agreement with CGM, (0.10)% (Collateralized by $213 BAE Systems Holdings Inc., 3.80%, due 10/07/24, value $219) acquired on 11/14/14, open maturity at $214 | | 214 | | 214 | |
Repurchase Agreement with CGM, (0.35)% (Collateralized by $500 Standard Chartered Plc, 5.20%, due 01/26/24, value $522) acquired on 11/21/14, open maturity at $531 | | 531 | | 531 | |
Repurchase Agreement with CGM, (1.25)% (Collateralized by $425 Standard Chartered Plc, 5.30%, due 01/09/43, value $428) acquired on 05/06/14, open maturity at $435 | | 435 | | 435 | |
Repurchase Agreement with DUB, (0.10)% (Collateralized by $340 Imperial Tobacco Finance Plc, 3.50%, due 02/11/23, value $335) acquired on 12/03/14, open maturity at $338 | | 338 | | 338 | |
Repurchase Agreement with MLP, (0.15)% (Collateralized by $350 Standard Chartered Plc, 5.70%, due 03/26/44, value $367) acquired on 10/08/14, open maturity at $389 | | 389 | | 389 | |
| | | | 2,730 | |
United States of America - 13.6% | | | | | |
Repurchase Agreement with BCL, (0.10)% (Collateralized by $1,110 International Business Machines Corp., 4.00%, due 06/20/42, value $1,115) acquired on 10/23/14, open maturity at $1,099 | | 1,099 | | 1,099 | |
Repurchase Agreement with BCL, (0.10)% (Collateralized by $1,130 Bank of America Corp., 3.30%, due 01/11/23, value $1,132) acquired on 12/19/14, open maturity at $1,140 | | 1,140 | | 1,140 | |
Repurchase Agreement with BCL, (0.10)% (Collateralized by $100 Apache Corp., 4.75%, due 04/15/43, value $95) acquired on 12/04/14, open maturity at $95 | | 95 | | 95 | |
Repurchase Agreement with BCL, (0.10)% (Collateralized by $350 Noble Energy Inc., 5.05%, due 11/15/44, value $349) acquired on 12/04/14, open maturity at $345 | | 345 | | 345 | |
Repurchase Agreement with BCL, (0.10)% (Collateralized by $400 Wells Fargo & Co., 5.90%, due , value $405) acquired on 10/14/14, open maturity at $424 | | 424 | | 424 | |
Repurchase Agreement with BCL, (0.10)% (Collateralized by $540 Microsoft Corp., 2.38%, due 05/01/23, value $532) acquired on 05/15/14, open maturity at $518 | | 518 | | 518 | |
Repurchase Agreement with BCL, (0.10)% (Collateralized by $560 Pfizer Inc., 3.40%, due 05/15/24, value $585) acquired on 10/16/14, open maturity at $584 | | 584 | | 584 | |
Repurchase Agreement with BCL, (0.10)% (Collateralized by $700 AT&T Inc., 4.35%, due 06/15/45, value $665) acquired on 11/24/14, open maturity at $667 | | 667 | | 667 | |
Repurchase Agreement with BCL, (0.25)% (Collateralized by $520 Molson Coors Brewing Co., 3.50%, due 05/01/22, value $527) acquired on 12/19/14, open maturity at $527 | | 527 | | 527 | |
Repurchase Agreement with CGM, (0.10)% (Collateralized by $1,380 Morgan Stanley, 2.38%, due 07/23/19, value $1,377) acquired on 10/01/14, open maturity at $1,366 | | 1,366 | | 1,366 | |
Repurchase Agreement with CGM, (0.10)% (Collateralized by $140 Pfizer Inc., 4.40%, due 05/15/44, value $154) acquired on 09/30/14, open maturity at $144 | | 144 | | 144 | |
Repurchase Agreement with CGM, (0.10)% (Collateralized by $150 Sunoco Logistics Partners Operations LP, 5.35%, due 05/15/45, value $153) acquired on 12/18/14, open maturity at $148 | | 148 | | 148 | |
Repurchase Agreement with CGM, (0.10)% (Collateralized by $2,770 Wells Fargo & Co., 2.13%, due 04/22/19, value $2,775) acquired on 10/01/14, open maturity at $2,773 | | 2,773 | | 2,773 | |
Repurchase Agreement with CGM, (0.10)% (Collateralized by $2,800 JPMorgan Chase & Co., 2.20%, due 10/22/19, value $2,782) acquired on 12/03/14, open maturity at $2,782 | | 2,782 | | 2,782 | |
Repurchase Agreement with CGM, (0.10)% (Collateralized by $290 Pfizer Inc., 3.40%, due 05/15/24, value $303) acquired on 10/02/14, open maturity at $302 | | 302 | | 302 | |
Repurchase Agreement with CGM, (0.10)% (Collateralized by $30 Iron Mountain Inc., 5.75%, due 08/15/24, value $31) acquired on 12/04/14, open maturity at $31 | | 31 | | 31 | |
Repurchase Agreement with CGM, (0.10)% (Collateralized by $350 Freeport-McMoRan Inc., 5.45%, due 03/15/43, value $333) acquired on 11/21/14, open maturity at $335 | | 335 | | 335 | |
Repurchase Agreement with CGM, (0.10)% (Collateralized by $450 Amazon.com Inc., 3.80%, due 12/05/24, value $463) acquired on 12/17/14, open maturity at $456 | | 456 | | 456 | |
Repurchase Agreement with CGM, (0.10)% (Collateralized by $450 Pfizer Inc., 3.40%, due 05/15/24, value $470) acquired on 10/14/14, open maturity at $473 | | 473 | | 473 | |
See accompanying Notes to Financial Statements.
| | Shares/Par † | | Value | |
Repurchase Agreement with CGM, (0.10)% (Collateralized by $540 International Business Machines Corp., 3.38%, due 08/01/23, value $554) acquired on 05/28/13, open maturity at $537 | | 537 | | 537 | |
Repurchase Agreement with CGM, (0.10)% (Collateralized by $600 Citigroup Inc., 4.50%, due 01/14/22, value $658) acquired on 11/21/14, open maturity at $653 | | 653 | | 653 | |
Repurchase Agreement with CGM, (0.10)% (Collateralized by $75 Eastman Chemical Co., 3.60%, due 08/15/22, value $76) acquired on 12/23/14, open maturity at $77 | | 77 | | 77 | |
Repurchase Agreement with CGM, (0.75)% (Collateralized by $200 AT&T Inc., 3.90%, due 03/11/24, value $206) acquired on 12/01/14, open maturity at $209 | | 209 | | 209 | |
Repurchase Agreement with CGM, (1.00)% (Collateralized by $140 Motorola Solutions Inc., 4.00%, due 09/01/24, value $141) acquired on 11/12/14, open maturity at $141 | | 141 | | 141 | |
Repurchase Agreement with CSI, (0.10)% (Collateralized by $1,390 Morgan Stanley, 2.38%, due 07/23/19, value $1,386) acquired on 10/08/14, open maturity at $1,390 | | 1,390 | | 1,390 | |
Repurchase Agreement with CSI, (0.15)% (Collateralized by $2,770 Bank of America Corp., 2.65%, due 04/01/19, value $2,796) acquired on 10/01/14, open maturity at $2,763 | | 2,763 | | 2,763 | |
Repurchase Agreement with CSI, (0.15)% (Collateralized by $550 Sysco Corp., 4.50%, due 10/02/44, value $602) acquired on 10/27/14, open maturity at $569 | | 569 | | 569 | |
Repurchase Agreement with CSI, (0.15)% (Collateralized by $560 Citigroup Inc., 5.50%, due 09/13/25, value $622) acquired on 10/27/14, open maturity at $626 | | 626 | | 626 | |
Repurchase Agreement with CSI, 0.06% (Collateralized by $12,347 U.S. Treasury Note, 2.38%, due 08/15/24, value $12,571) acquired on 11/19/14, open maturity at $12,455 | | 12,455 | | 12,455 | |
Repurchase Agreement with CSI, 0.15% (Collateralized by $1,090 U.S. Treasury Note, 1.50%, due 12/31/18, value $1,092) acquired on 12/18/14, open maturity at $1,100 | | 1,100 | | 1,100 | |
Repurchase Agreement with DUB, (0.10)% (Collateralized by $275 Energy Transfer Partners LP, 4.65%, due 06/01/21, value $288) acquired on 11/18/14, open maturity at $289 | | 289 | | 289 | |
Repurchase Agreement with DUB, (0.10)% (Collateralized by $275 Noble Energy Inc., 3.90%, due 11/15/24, value $273) acquired on 11/18/14, open maturity at $273 | | 273 | | 273 | |
Repurchase Agreement with DUB, (0.10)% (Collateralized by $750 Amazon.com Inc., 2.50%, due 11/29/22, value $713) acquired on 10/28/14, open maturity at $713 | | 713 | | 713 | |
Repurchase Agreement with DUB, (0.15)% (Collateralized by $3,030 Goldman Sachs Group Inc., 2.55%, due 10/23/19, value $3,022) acquired on 12/04/14, open maturity at $3,026 | | 3,026 | | 3,026 | |
Repurchase Agreement with DUB, (0.15)% (Collateralized by $873 Cox Communications Inc., 2.95%, due 06/30/23, value $840) acquired on 12/26/14, open maturity at $853 | | 853 | | 853 | |
Repurchase Agreement with JPM, (0.05)% (Collateralized by $765 Verizon Communications Inc., 6.40%, due 09/15/33, value $946) acquired on 11/24/14, open maturity at $937 | | 937 | | 937 | |
Repurchase Agreement with JPM, (0.10)% (Collateralized by $1,100 Bank of America Corp., 4.25%, due 10/22/26, value $1,101) acquired on 12/30/14, open maturity at $1,126 | | 1,126 | | 1,126 | |
Repurchase Agreement with JPM, (0.10)% (Collateralized by $2,770 Citigroup Inc., 2.50%, due 07/29/19, value $2,776) acquired on 12/18/14, open maturity at $2,794 | | 2,794 | | 2,794 | |
Repurchase Agreement with JPM, (0.10)% (Collateralized by $795 Verizon Communications Inc., 6.40%, due 09/15/33, value $982) acquired on 12/04/14, open maturity at $979 | | 979 | | 979 | |
Repurchase Agreement with MLP, (0.15)% (Collateralized by $325 Amazon.com Inc., 2.50%, due 11/29/22, value $308) acquired on 05/01/14, open maturity at $312 | | 312 | | 312 | |
Repurchase Agreement with MLP, (0.18)% (Collateralized by $125 International Paper Co., 3.65%, due 06/15/24, value $125) acquired on 11/24/14, open maturity at $126 | | 126 | | 126 | |
Repurchase Agreement with MLP, 0.13% (Collateralized by $4,275 U.S. Treasury Note, 2.13%, due 09/30/21, value $4,323) acquired on 12/09/14, open maturity at $4,344 | | 4,344 | | 4,344 | |
Repurchase Agreement with MLP, 0.17% (Collateralized by $1,304 U.S. Treasury Note, 2.00%, due 10/31/21, value $1,307) acquired on 12/02/14, open maturity at $1,307 | | 1,307 | | 1,307 | |
| | | | 51,808 | |
| | | | | |
Total Repurchase Agreements | | | | 59,878 | |
Total Short Term Investments (cost $86,559) | | | | 86,511 | |
Total Investments - 113.4% (cost $443,634) | | | | 432,726 | |
Total Securities Sold Short - (15.8%) (proceeds $59,845) | | | | (60,380 | ) |
Other Assets and Liabilities, Net - 2.4% | | | | 9,143 | |
Total Net Assets - 100.0% | | | | $ | 381,489 | |
| | | | | |
SECURITIES SOLD SHORT - 15.8% | | | | | |
| | | | | |
CORPORATE BONDS AND NOTES - 10.3% | | | | | |
| | | | | |
AUSTRALIA - 0.2% | | | | | |
BHP Billiton Finance USA Ltd., 5.00%, 09/30/43 | | $ | 100 | | $ | 114 | |
Westpac Banking Corp., 2.25%, 07/30/18 | | 678 | | 689 | |
| | | | 803 | |
| | | | | | | |
See accompanying Notes to Financial Statements.
| | Shares/Par † | | Value | |
BELGIUM - 0.4% | | | | | |
Anheuser-Busch InBev Finance Inc., 3.70%, 02/01/24 | | 1,670 | | 1,741 | |
| | | | | |
CANADA - 0.4% | | | | | |
Canadian Natural Resources Ltd., 3.90%, 02/01/25 | | 180 | | 178 | |
Potash Corp. of Saskatchewan Inc., 5.63%, 12/01/40 | | 1,151 | | 1,432 | |
| | | | 1,610 | |
UNITED KINGDOM - 0.7% | | | | | |
BAE Systems Holdings Inc., 3.80%, 10/07/24 (b) | | 213 | | 219 | |
Imperial Tobacco Finance Plc, 3.50%, 02/11/23 (b) | | 340 | | 335 | |
Standard Chartered Plc | | | | | |
5.20%, 01/26/24 (b) | | 500 | | 522 | |
5.30%, 01/09/43 (b) | | 425 | | 428 | |
5.70%, 03/26/44 (b) | | 1,110 | | 1,164 | |
| | | | 2,668 | |
UNITED STATES OF AMERICA - 8.6% | | | | | |
Amazon.com Inc. | | | | | |
2.50%, 11/29/22 | | 1,075 | | 1,021 | |
3.80%, 12/05/24 | | 450 | | 463 | |
Apache Corp, 4.75%, 04/15/43 | | 100 | | 95 | |
AT&T Inc. | | | | | |
3.90%, 03/11/24 | | 200 | | 206 | |
4.35%, 06/15/45 | | 700 | | 665 | |
Bank of America Corp. | | | | | |
2.65%, 04/01/19 | | 2,770 | | 2,796 | |
3.30%, 01/11/23 | | 1,130 | | 1,132 | |
4.25%, 10/22/26 | | 1,100 | | 1,101 | |
Citigroup Inc. | | | | | |
2.50%, 07/29/19 | | 2,770 | | 2,776 | |
4.50%, 01/14/22 | | 600 | | 658 | |
5.50%, 09/13/25 | | 560 | | 622 | |
Cox Communications Inc., 2.95%, 06/30/23 (b) | | 873 | | 840 | |
Eastman Chemical Co., 3.60%, 08/15/22 | | 75 | | 76 | |
Energy Transfer Partners LP, 4.65%, 06/01/21 | | 275 | | 288 | |
Freeport-McMoRan Inc., 5.45%, 03/15/43 | | 350 | | 333 | |
Goldman Sachs Group Inc., 2.55%, 10/23/19 | | 3,030 | | 3,022 | |
International Business Machines Corp. | | | | | |
3.38%, 08/01/23 | | 540 | | 554 | |
4.00%, 06/20/42 | | 1,110 | | 1,115 | |
International Paper Co., 3.65%, 06/15/24 | | 125 | | 125 | |
Iron Mountain Inc., 5.75%, 08/15/24 | | 30 | | 31 | |
JPMorgan Chase & Co., 2.20%, 10/22/19 | | 2,800 | | 2,782 | |
Microsoft Corp., 2.38%, 05/01/23 | | 540 | | 532 | |
Molson Coors Brewing Co., 3.50%, 05/01/22 | | 520 | | 527 | |
Morgan Stanley, 2.38%, 07/23/19 | | 2,770 | | 2,763 | |
Motorola Solutions Inc., 4.00%, 09/01/24 | | 140 | | 141 | |
Noble Energy Inc. | | | | | |
3.90%, 11/15/24 | | 275 | | 273 | |
5.05%, 11/15/44 | | 350 | | 349 | |
Pfizer Inc. | | | | | |
3.40%, 05/15/24 | | 1,300 | | 1,358 | |
4.40%, 05/15/44 | | 140 | | 154 | |
Sunoco Logistics Partners Operations LP, 5.35%, 05/15/45 | | 150 | | 153 | |
Sysco Corp., 4.50%, 10/02/44 | | 550 | | 602 | |
Verizon Communications Inc., 6.40%, 09/15/33 | | 1,560 | | 1,928 | |
Wells Fargo & Co. | | | | | |
5.90% (callable at 100 beginning 06/15/24) (f) | | 400 | | 405 | |
2.13%, 04/22/19 | | 2,770 | | 2,775 | |
| | | | 32,661 | |
| | | | | |
Total Corporate Bonds and Notes (proceeds $39,008) | | | | 39,483 | |
| | | | | |
GOVERNMENT AND AGENCY OBLIGATIONS - 5.5% | | | | | |
| | | | | |
GERMANY - 0.4% | | | | | |
Bundesobligation, 0.75%, 02/24/17, EUR | | 725 | | 892 | |
Bundesrepublik Deutschland, 2.50%, 01/04/21, EUR | | 323 | | 448 | |
| | | | 1,340 | |
ITALY - 0.0% | | | | | |
Italy Buoni Poliennali Del Tesoro, 4.50%, 05/01/23, EUR | | 44 | | 65 | |
| | | | | |
UNITED STATES OF AMERICA - 5.1% | | | | | |
U.S. Treasury Note | | | | | |
1.50%, 12/31/18 | | 1,090 | | 1,092 | |
1.63%, 12/31/19 | | 200 | | 199 | |
2.13%, 09/30/21 | | 4,275 | | 4,323 | |
2.00%, 10/31/21 | | 1,304 | | 1,307 | |
2.38%, 08/15/24 | | 12,347 | | 12,571 | |
| | | | 19,492 | |
Total Government and Agency Obligations (proceeds $20,837) | | | | 20,897 | |
| | | | | |
Total Securities Sold Short - 15.8% (proceeds $59,845) | | | | $ | 60,380 | |
| | | | | | |
(a) | Non-income producing security. |
(b) | The Sub-Adviser has deemed this security which is exempt from registration under the Securities Act of 1933 (“1933 Act”), as amended, to be liquid based on procedures approved by the Trust’s Board of Trustees. As of December 31, 2014, the aggregate value of these liquid securities was $54,763 for long term investments and ($3,508) for securities sold short which represented 14.4% and (0.9%) of net assets, respectively. |
(c) | Variable rate security. Rate stated was in effect as of December 31, 2014. |
(d) | Security is restricted to resale to institutional investors. See Restricted Securities in these Schedules of Investments. |
(e) | Security fair valued in good faith in accordance with the procedures approved by the Trust’s Board of Trustees. Good faith fair valued securities may be classified as Level 2 or Level 3 for Financial Accounting Standards Board (“FASB”) Accounting Standards Codification (“ASC”) Topic 820 “Fair Value Measurement” based on the applicable valuation inputs. See FASB ASC Topic 820 “Fair Value Measurement” in the Notes to Financial Statements. |
(f) | Perpetual security. |
(g) | Pay-in-kind security. The coupon interest earned by the security may be paid in cash or additional par. |
(h) | Convertible security. |
(i) | The Sub-Adviser has deemed this security to be illiquid based on procedures approved by the Trust’s Board of Trustees. |
(j) | This variable rate senior loan will settle after December 31, 2014, at which time the interest rate will be determined. |
(k) | Security issued with a zero coupon. Income is recognized through the accretion of discount. |
(l) | Security is a “step-up” bond where the coupon may increase or step up at a future date. Rate stated was the coupon as of December 31, 2014. |
(m) | Investment in affiliate. |
(n) | Yield changes daily to reflect current market conditions. Rate was the quoted yield as of December 31, 2014. |
(o) | All or a portion of the security is pledged or segregated as collateral. See the Notes to Financial Statements. |
See accompanying Notes to Financial Statements.
Restricted Securities - The Fund invests in securities that are restricted under the 1933 Act or which are subject to legal, contractual, or other agreed upon restrictions on resale. Restricted securities are often purchased in private placement transactions and cannot be sold without prior registration unless the sale is pursuant to an exemption under the 1933 Act, as amended. As of December 31, 2014, the Fund held investments in restricted securities, excluding certain securities exempt from registration under the 1933 Act which are deemed to be liquid, as follows:
| | Initial
Acquisition
Date | | Cost | | Ending
Value | | Percent of
Net Assets | |
AA Bond Co. Ltd., 9.50%, 07/31/19 | | 06/26/2013 | | $ | 602 | | $ | 668 | | 0.2 | % |
ALME Loan Funding, 1.69%, 08/15/27 | | 06/06/2014 | | 1,893 | | 1,674 | | 0.4 | |
ALME Loan Funding, 5.39%, 08/15/27 | | 06/06/2014 | | 409 | | 342 | | 0.1 | |
ALME Loan Funding, 6.14%, 08/15/27 | | 06/06/2014 | | 326 | | 263 | | 0.1 | |
APERAM, 0.63%, 07/08/21 | | 06/30/2014 | | 800 | | 795 | | 0.2 | |
AXA SA, 3.88%, callable at 100 beginning 10/08/25 | | 05/19/2014 | | 817 | | 730 | | 0.2 | |
Abengoa Finance SAU, 6.00%, 03/31/21 | | 11/25/2014 | | 227 | | 215 | | 0.1 | |
Achmea BV, 6.00%, 04/04/43 | | 07/09/2013 | | 272 | | 276 | | 0.1 | |
Achmea Hypotheekbank NV, 2.75%, 02/18/21 | | 02/12/2014 | | 681 | | 664 | | 0.2 | |
Aldesa Financial Services SA, 7.25%, 04/01/21 | | 03/28/2014 | | 268 | | 199 | | 0.1 | |
Allied Irish Banks Plc, 2.75%, 04/16/19 | | 04/10/2014 | | 1,796 | | 1,654 | | 0.4 | |
Altice SA, 7.25%, 05/15/22 | | 04/24/2014 | | 1,515 | | 1,366 | | 0.4 | |
Annington Finance No. 5 Plc, 13.00%, 01/15/23 | | 08/19/2014 | | 623 | | 580 | | 0.2 | |
Arbour CLO Ltd., 1.81%, 06/16/27 | | 05/19/2014 | | 2,367 | | 2,090 | | 0.5 | |
Arbour CLO Ltd., 5.36%, 06/16/27 | | 05/19/2014 | | 457 | | 373 | | 0.1 | |
Arbour CLO Ltd., 6.11%, 06/16/27 | | 05/19/2014 | | 454 | | 354 | | 0.1 | |
Ardagh Packaging Finance Plc, 4.25%, 01/15/22 | | 06/23/2014 | | 1,122 | | 1,035 | | 0.3 | |
Ares XXV CLO Ltd., 3.38%, 01/17/24 | | 10/04/2013 | | 249 | | 245 | | 0.1 | |
Arianna SPV Srl, 3.60%, 04/20/19 | | 02/24/2014 | | 2,276 | | 2,041 | | 0.5 | |
Astaldi SpA, 7.13%, 12/01/20 | | 11/29/2013 | | 842 | | 751 | | 0.2 | |
Atalaya Luxco, 11.50%, 05/30/20 | | 05/29/2014 | | 1,216 | | 1,118 | | 0.3 | |
Atrium European Real Estate Ltd., 4.00%, 04/20/20 | | 05/03/2013 | | 1,051 | | 1,030 | | 0.3 | |
Avoca CLO XI Ltd., 1.83%, 07/15/27 | | 05/12/2014 | | 1,513 | | 1,330 | | 0.3 | |
Avoca CLO XIII Ltd., 5.69%, 12/29/27 | | 12/22/2014 | | 291 | | 283 | | 0.1 | |
BNP Paribas SA, 2.62%, 10/14/27 | | 10/07/2014 | | 1,321 | | 1,278 | | 0.3 | |
BPE Financiaciones SA, 2.50%, 02/01/17 | | 01/31/2014 | | 949 | | 864 | | 0.2 | |
Banca Monte dei Paschi di Siena SpA, 2.88%, 04/16/21 | | 04/16/2014 | | 1,593 | | 1,514 | | 0.4 | |
Banca Monte dei Paschi di Siena SpA, 2.88%, 07/16/25 | | 07/09/2014 | | 1,044 | | 1,000 | | 0.3 | |
Banco Bilbao Vizcaya Argentaria SA, 7.00%, callable at 100 beginning 02/19/19 | | 02/12/2014 | | 822 | | 740 | | 0.2 | |
Banco Bilbao Vizcaya Argentaria SA, 9.00%, callable at 100 beginning 05/09/18 | | 12/02/2013 | | 626 | | 642 | | 0.2 | |
Banco Espirito Santo SA, 2.63%, 05/08/17 | | 07/14/2014 | | 512 | | 450 | | 0.1 | |
Banco Espirito Santo SA, 4.00%, 01/21/19 | | 07/24/2014 | | 1,130 | | 1,054 | | 0.3 | |
Banco Espirito Santo SA, 4.75%, 01/15/18 | | 07/11/2014 | | 1,163 | | 1,067 | | 0.3 | |
Banco Popolare SC, 3.50%, 03/14/19 | | 03/07/2014 | | 1,166 | | 1,072 | | 0.3 | |
Banco Popular Espanol SA, 11.50%, callable at 100 beginning 10/10/18 | | 10/04/2013 | | 959 | | 964 | | 0.3 | |
Banco Santander SA, 6.25%, callable at 100 beginning 03/12/19 | | 03/06/2014 | | 549 | | 472 | | 0.1 | |
Bank of Ireland, 3.25%, 01/15/19 | | 01/15/2014 | | 1,594 | | 1,505 | | 0.4 | |
Bank of Ireland, 4.25%, 06/11/24 | | 07/16/2014 | | 2,286 | | 2,151 | | 0.6 | |
Bankia SA, 3.50%, 01/17/19 | | 01/10/2014 | | 3,256 | | 3,134 | | 0.8 | |
Bankia SA, 4.00%, 05/22/24 | | 05/16/2014 | | 3,704 | | 3,428 | | 0.9 | |
Bayerische Landesbank, 0.89%, 02/07/19 | | 05/08/2013 | | 730 | | 680 | | 0.2 | |
Belden Inc., 5.50%, 04/15/23 | | 11/21/2014 | | 527 | | 510 | | 0.1 | |
Berica PMI, 2.48%, 05/31/57 | | 07/15/2014 | | 904 | | 850 | | 0.2 | |
Bilbao Luxembourg SA, 10.50%, 12/01/18 | | 10/18/2013 | | 442 | | 399 | | 0.1 | |
Blackstone CQP Holdco LP, 9.30%, 03/31/19 | | 03/18/2014 | | 645 | | 640 | | 0.2 | |
Boparan Finance Plc, 4.38%, 07/15/21 | | 11/19/2014 | | 116 | | 106 | | — | |
CE Energy A/S, 7.00%, 02/01/21 | | 02/03/2014 | | 452 | | 404 | | 0.1 | |
CNH Industrial Finance Europe SA, 2.75%, 03/18/19 | | 03/14/2014 | | 932 | | 828 | | 0.2 | |
CVC Cordatus Loan Fund III Ltd., 1.85%, 07/08/27 | | 03/28/2014 | | 1,754 | | 1,545 | | 0.4 | |
CaixaBank SA, 4.50%, 11/22/16 | | 11/13/2013 | | 1,478 | | 1,200 | | 0.3 | |
CaixaBank SA, 5.00%, 11/14/23 | | 10/14/2014 | | 1,227 | | 1,168 | | 0.3 | |
Cemex SAB de CV, 4.75%, 01/11/22 | | 09/05/2014 | | 758 | | 693 | | 0.2 | |
Cirsa Funding Luxembourg SA, 8.75%, 05/15/18 | | 02/11/2014 | | 263 | | 236 | | 0.1 | |
Coventry Building Society, 6.37%, callable at 100 beginning 11/01/19 | | 06/20/2014 | | 341 | | 298 | | 0.1 | |
Credit Suisse AG, 5.75%, 09/18/25 | | 11/01/2013 | | 391 | | 383 | | 0.1 | |
Croatia Government International Bond, 3.88%, 05/30/22 | | 09/04/2014 | | 342 | | 323 | | 0.1 | |
Debenhams Plc, 5.25%, 07/15/21 | | 07/02/2014 | | 508 | | 455 | | 0.1 | |
Deutsche Annington Finance BV, 4.00%, callable at 100 beginning 12/17/21 | | 12/11/2014 | | 747 | | 733 | | 0.2 | |
Deutsche Rastatten Grupp IV GmbH, 6.75%, 12/30/20 | | 08/07/2014 | | 141 | | 128 | | — | |
Electricite de France, 5.00%, callable at 100 beginning 01/22/26 | | 01/16/2014 | | 673 | | 671 | | 0.2 | |
Electricite de France SA, 4.25%, callable at 100 beginning 01/29/20 | | 11/07/2014 | | 671 | | 651 | | 0.2 | |
| | | | | | | | | | | |
See accompanying Notes to Financial Statements.
| | Initial
Acquisition
Date | | Cost | | Ending
Value | | Percent of
Net Assets | |
Enel SpA, 6.50%, 01/10/74 | | 11/10/2014 | | $ | 690 | | $ | 665 | | 0.2 | % |
Enterprise Funding Ltd., 3.50%, 09/10/20 | | 09/06/2013 | | 468 | | 430 | | 0.1 | |
FGA Capital Ireland Plc, 2.63%, 04/17/19 | | 04/10/2014 | | 586 | | 533 | | 0.1 | |
FTE Verwaltungs GmbH, 9.00%, 07/15/20 | | 11/11/2013 | | 606 | | 507 | | 0.1 | |
Fresenius Finance BV, 3.00%, 02/01/21 | | 01/10/2014 | | 1,507 | | 1,462 | | 0.4 | |
Galp Energia SGPS SA, 3.00%, 01/14/21 | | 07/08/2014 | | 942 | | 834 | | 0.2 | |
Gas Natural Fenosa Finance BV, 4.12%, callable at 100 beginning 11/18/22 | | 11/13/2014 | | 497 | | 497 | | 0.1 | |
Gates Global LLC, 5.75%, 07/15/22 | | 08/22/2014 | | 131 | | 112 | | — | |
German Residential Funding Plc, 4.23%, 08/27/18 | | 06/14/2013 | | 1,429 | | 1,371 | | 0.4 | |
Grand City Properties SA, 2.00%, 10/29/21 | | 10/27/2014 | | 485 | | 482 | | 0.1 | |
HSH Nordbank AG, 0.92%, 02/14/17 | | 05/03/2013 | | 1,515 | | 1,477 | | 0.4 | |
Hema Bondco I BV, 6.25%, 06/15/19 | | 08/07/2014 | | 133 | | 102 | | — | |
House of Fraser Funding Plc, 8.88%, 08/15/18 | | 05/03/2013 | | 581 | | 594 | | 0.2 | |
IVS F. SpA, 7.13%, 04/01/20 | | 05/03/2013 | | 160 | | 136 | | — | |
Indonesia Government International Bond, 2.88%, 07/08/21 | | 09/05/2014 | | 344 | | 318 | | 0.1 | |
Indonesia Government International Bond, 6.75%, 01/15/44 | | 09/04/2014 | | 356 | | 359 | | 0.1 | |
Intesa Sanpaolo SpA, 3.50%, 01/17/22 | | 02/12/2014 | | 858 | | 852 | | 0.2 | |
Intralot Finance Luxembourg SA, 9.75%, 08/15/18 | | 08/02/2013 | | 918 | | 867 | | 0.2 | |
Jubilee CDO BV, 1.48%, 04/15/27 | | 05/09/2014 | | 1,446 | | 1,271 | | 0.3 | |
Kerneos Tech Group SAS, 4.83%, 03/01/21 | | 02/28/2014 | | 178 | | 157 | | — | |
Kerneos Tech Group SAS, 5.75%, 03/01/21 | | 02/28/2014 | | 245 | | 221 | | 0.1 | |
Lion/Seneca France 2, 7.88%, 04/15/19 | | 04/21/2014 | | 746 | | 562 | | 0.1 | |
Lloyds Banking Group Plc, 6.37%, callable at 100 beginning 06/27/20 | | 04/03/2014 | | 1,334 | | 1,167 | | 0.3 | |
Mahle GmbH, 2.50%, 05/14/21 | | 05/12/2014 | | 515 | | 468 | | 0.1 | |
Marks & Spencer Plc, 4.75%, 06/12/25 | | 01/10/2014 | | 426 | | 446 | | 0.1 | |
Mediobanca SpA, 2.25%, 03/18/19 | | 03/12/2014 | | 1,281 | | 1,172 | | 0.3 | |
Merck KGaA, 2.62%, 12/12/74 | | 12/09/2014 | | 642 | | 642 | | 0.2 | |
North Westerly CLO IV BV, 1.76%, 01/15/26 | | 12/12/2013 | | 3,018 | | 2,659 | | 0.7 | |
North Westerly CLO IV BV, 2.99%, 01/15/26 | | 12/13/2013 | | 673 | | 530 | | 0.1 | |
Numericable Group SA, 5.38%, 05/15/22 | | 04/24/2014 | | 963 | | 930 | | 0.2 | |
Numericable Group SA, 5.63%, 05/15/24 | | 04/24/2014 | | 793 | | 745 | | 0.2 | |
Orange SA, 4.00%, callable at 100 beginning 10/01/21 | | 09/25/2014 | | 222 | | 220 | | 0.1 | |
Orange SA, 4.25%, callable at 100 beginning 02/07/20 | | 11/07/2014 | | 652 | | 638 | | 0.2 | |
Orange SA, 5.00%, callable at 100 beginning 10/01/26 | | 09/25/2014 | | 474 | | 481 | | 0.1 | |
Paragon Mortgages No. 13 Plc, 0.41%, 01/15/39 | | 08/22/2013 | | 551 | | 581 | | 0.2 | |
Pension Insurance Corp. Plc, 6.50%, 07/03/24 | | 06/27/2014 | | 296 | | 281 | | 0.1 | |
Petroleos de Venezuela SA, 5.25%, 04/12/17 | | 09/05/2014 | | 266 | | 148 | | — | |
Petroleos de Venezuela SA, 6.00%, 11/15/26 | | 10/24/2014 | | 139 | | 110 | | — | |
Pfleiderer GmbH, 7.88%, 08/01/19 | | 11/03/2014 | | 306 | | 289 | | 0.1 | |
Play Finance 1 SA, 6.50%, 08/01/19 | | 01/27/2014 | | 424 | | 398 | | 0.1 | |
Play Finance 2 SA, 5.25%, 02/01/19 | | 01/27/2014 | | 232 | | 213 | | 0.1 | |
PortAventura Entertainment Barcelona BV, 7.25%, 12/01/20 | | 08/28/2014 | | 554 | | 519 | | 0.1 | |
Portugal Government International Bond, 3.50%, 03/25/15 | | 06/04/2013 | | 1,251 | | 1,259 | | 0.3 | |
Portugal Government International Bond, 5.13%, 10/15/24 | | 07/03/2014 | | 719 | | 762 | | 0.2 | |
Punch Taverns Finance Plc, 0.56%, 07/15/21 | | 12/19/2014 | | 1,055 | | 988 | | 0.3 | |
Punch Taverns Finance Plc, 6.06%, 10/15/27 | | 10/09/2014 | | 863 | | 798 | | 0.2 | |
RPG Byty Sro, 6.75%, 05/01/20 | | 05/06/2013 | | 530 | | 499 | | 0.1 | |
Republic of Serbia, 5.88%, 12/03/18 | | 09/04/2014 | | 339 | | 334 | | 0.1 | |
Rhino Bondco SpA, 7.25%, 11/15/20 | | 12/10/2014 | | 1,265 | | 1,239 | | 0.3 | |
Romania Government International Bond, 3.63%, 04/24/24 | | 09/04/2014 | | 341 | | 318 | | 0.1 | |
Russia Government International Bond, 7.50%, 03/31/30 | | 10/22/2014 | | 735 | | 679 | | 0.2 | |
SGD Group SAS, 5.63%, 05/15/19 | | 04/16/2014 | | 553 | | 513 | | 0.1 | |
Samvardhana Motherson Automotive Systems Group BV, 4.13%, 07/15/21 | | 08/20/2014 | | 592 | | 539 | | 0.1 | |
Schaeffler Holding Finance BV, 5.75%, 11/15/21 | | 10/22/2014 | | 602 | | 619 | | 0.2 | |
Slovenia Government Bond, 4.63%, 09/09/24 | | 09/04/2014 | | 367 | | 353 | | 0.1 | |
Snai SpA, 7.63%, 06/15/18 | | 11/29/2013 | | 231 | | 207 | | 0.1 | |
Sorrento Park CLO Ltd., 6.46%, 11/16/27 | | 11/03/2014 | | 280 | | 271 | | 0.1 | |
St. Pauls CLO Ltd., 1.49%, 04/25/28 | | 03/27/2014 | | 2,064 | | 1,813 | | 0.5 | |
TAGUS-Sociedade de Titularizacao de Creditos SA, 2.98%, 02/16/18 | | 03/27/2014 | | 2,186 | | 1,928 | | 0.5 | |
THOM Europe SAS, 7.38%, 07/15/19 | | 10/20/2014 | | 536 | | 517 | | 0.1 | |
TMF Group Holding BV, 9.88%, 12/01/19 | | 06/26/2013 | | 423 | | 398 | | 0.1 | |
Telecom Italia Finance SA, 6.13%, 11/15/16 | | 11/11/2013 | | 4,008 | | 4,254 | | 1.1 | |
| | | | | | | | | | | |
See accompanying Notes to Financial Statements.
Curian Variable Series Trust Sub-Advised Funds
Schedules of Investments (in thousands, except contracts)
December 31, 2014
| | Initial
Acquisition
Date | | Cost | | Ending
Value | | Percent of
Net Assets | |
Telecom Italia SpA, 4.50%, 01/25/21 | | 01/17/2014 | | $ | 542 | | $ | 529 | | 0.1 | % |
Telefonica Europe BV, 4.20%, callable at 100 beginning 12/04/19 | | 11/28/2014 | | 1,001 | | 980 | | 0.3 | |
Telefonica Europe BV, 5.00%, callable at 100 beginning 03/31/20 | | 11/07/2014 | | 649 | | 631 | | 0.2 | |
Telefonica SA, 6.00%, 07/24/17 | | 08/04/2014 | | 1,353 | | 1,243 | | 0.3 | |
Telenet Finance V Luxembourg SCA, 6.25%, 08/15/22 | | 08/07/2014 | | 144 | | 132 | | — | |
Trionista Holdco GmbH, 5.00%, 04/30/20 | | 08/07/2014 | | 137 | | 125 | | — | |
UBS AG, 4.75%, 05/22/23 | | 05/16/2013 | | 300 | | 303 | | 0.1 | |
UBS AG, 4.75%, 02/12/26 | | 02/07/2014 | | 899 | | 861 | | 0.2 | |
UBS AG, 5.13%, 05/15/24 | | 05/09/2014 | | 774 | | 778 | | 0.2 | |
UniCredit SpA, 3.25%, 01/14/21 | | 01/08/2014 | | 2,142 | | 2,091 | | 0.5 | |
UniCredit SpA, 5.75%, 10/28/25 | | 10/22/2013 | | 2,681 | | 2,576 | | 0.7 | |
UniCredit SpA, 6.75%, callable at 100 beginning 09/10/21 | | 10/20/2014 | | 243 | | 234 | | 0.1 | |
UniCredit SpA, 6.95%, 10/31/22 | | 05/24/2013 | | 858 | | 882 | | 0.2 | |
Unione di Banche Italiane SCpA, 2.88%, 02/18/19 | | 02/11/2014 | | 1,227 | | 1,160 | | 0.3 | |
Unitymedia Hessen GmbH & Co. KG, 4.00%, 01/15/25 | | 12/04/2014 | | 1,279 | | 1,281 | | 0.3 | |
Unitymedia Hessen GmbH & Co. KG, 5.63%, 04/15/23 | | 08/07/2014 | | 143 | | 131 | | — | |
Unitymedia Hessen GmbH & Co. KG, 6.25%, 01/15/29 | | 08/07/2014 | | 429 | | 412 | | 0.1 | |
Venezuela Government International Bond, 11.75%, 10/21/26 | | 09/04/2014 | | 85 | | 49 | | — | |
Virgin Media Secured Finance Plc, 6.00%, 04/15/21 | | 08/07/2014 | | 181 | | 172 | | — | |
Volkswagen International Finance NV, 5.50%, 11/09/15 | | 01/03/2014 | | 7,050 | | 6,290 | | 1.7 | |
Volvo Treasury AB, 4.20%, 06/10/75 | | 12/04/2014 | | 737 | | 727 | | 0.2 | |
Vougeot Bidco Plc, 7.88%, 07/15/20 | | 07/17/2013 | | 578 | | 610 | | 0.2 | |
Voyage Care Bondco Plc, 11.00%, 02/01/19 | | 02/11/2014 | | 787 | | 750 | | 0.2 | |
Wind Acquisition Finance SA, 4.00%, 07/15/20 | | 06/25/2014 | | 1,911 | | 1,725 | | 0.5 | |
Wind Acquisition Finance SA, 4.08%, 07/15/20 | | 06/25/2014 | | 503 | | 427 | | 0.1 | |
Xefin Lux SCA, 3.83%, 06/01/19 | | 05/22/2014 | | 965 | | 853 | | 0.2 | |
| | | | $ | 133,903 | | $ | 124,998 | | 32.8 | % |
Schedule of Written Options
| | Expiration
Date | | Exercise
Price | | Contracts | | Value | |
Options on Securities | | | | | | | | | |
Citigroup Corp. Put Option | | 01/23/2015 | | 49.00 | | 100 | | $ | (1 | ) |
Micron Technology Inc. Put Option | | 01/23/2015 | | 29.50 | | 45 | | (1 | ) |
Micron Technology Inc. Put Option | | 01/30/2015 | | 30.00 | | 15 | | (1 | ) |
PowerShares QQQ Trust Put Option | | 02/20/2015 | | 94.00 | | 17 | | (1 | ) |
SPDR S&P Oil & Gas Exploration & Production ETF Trust Put Option | | 01/17/2015 | | 38.00 | | 100 | | (2 | ) |
SPDR S&P Oil & Gas Exploration & Production ETF Trust Put Option | | 01/30/2015 | | 37.00 | | 25 | | — | |
| | | | | | 302 | | $ | (6 | ) |
Summary of Written Options
| | Contracts/
Notional
Contracts | | Premiums | |
Options outstanding at December 31, 2013 | | 5,550,955 | | $ | 50 | |
Options written during the year | | 48,395,696 | | 411 | |
Options closed during the year | | (3,320 | ) | (257 | ) |
Options expired during the year | | (53,943,029 | ) | (185 | ) |
Options outstanding at December 31, 2014 | | 302 | | $ | 19 | |
Schedule of Exchange Traded Futures Options
| | Expiration
Date | | Exercise
Price | | Purchased Contracts | | Unrealized
(Depreciation) | |
Euro-Bund Put Option | | 02/20/2015 | | EUR | 153.00 | | 88 | | $ | (21 | ) |
Euro-Bund Put Option | | 02/20/2015 | | EUR | 153.50 | | 68 | | (20 | ) |
| | | | | | 156 | | $ | (41 | ) |
See accompanying Notes to Financial Statements.
Schedule of Open Futures Contracts
| | Expiration | | Contracts
(Short) | | Unrealized
Appreciation /
(Depreciation) | |
Euro STOXX 50 Future | | March 2015 | | (3 | ) | $ | (5 | ) |
Euro STOXX Banks Index Future | | March 2015 | | (198 | ) | (12 | ) |
Euro-Bobl Future | | March 2015 | | (191 | ) | (189 | ) |
Euro-Bund Future | | March 2015 | | (49 | ) | (156 | ) |
Euro-Schatz Future | | March 2015 | | (34 | ) | (7 | ) |
NASDAQ 100 E-Mini Future | | March 2015 | | (11 | ) | (1 | ) |
Russell 2000 Mini Index Future | | March 2015 | | (2 | ) | (10 | ) |
S&P 500 E-Mini Index Future | | March 2015 | | (12 | ) | 10 | |
U.K. Long Gilt Future | | March 2015 | | (4 | ) | (17 | ) |
U.S. Treasury Long Bond Future | | March 2015 | | (11 | ) | (43 | ) |
U.S. Treasury Note Future, 10-Year | | March 2015 | | (43 | ) | (14 | ) |
U.S. Treasury Note Future, 5-Year | | March 2015 | | (28 | ) | 3 | |
Ultra Long Term U.S. Treasury Bond Future | | March 2015 | | (26 | ) | (195 | ) |
| | | | | | $ | (636 | ) |
Schedule of Open Forward Foreign Currency Contracts
Purchased/
Sold | | Settlement
Date | | Counter-
Party | | Notional
Amount | | Value | | Unrealized
Gain/(Loss) | |
AUD/USD | | 01/21/2015 | | UBS | | AUD | 594 | | $ | 484 | | $ | (29 | ) |
CHF/USD | | 01/21/2015 | | BOA | | CHF | 3 | | 3 | | — | |
CHF/USD | | 01/21/2015 | | GSC | | CHF | 173 | | 175 | | (5 | ) |
EUR/USD | | 01/21/2015 | | MSC | | EUR | 550 | | 666 | | (39 | ) |
EUR/USD | | 01/21/2015 | | BOA | | EUR | 1,192 | | 1,443 | | (60 | ) |
EUR/USD | | 01/21/2015 | | GSC | | EUR | 4,200 | | 5,083 | | (216 | ) |
EUR/USD | | 01/21/2015 | | BNP | | EUR | 3,482 | | 4,214 | | (136 | ) |
EUR/USD | | 01/21/2015 | | JPM | | EUR | 200 | | 242 | | (8 | ) |
EUR/USD | | 01/21/2015 | | CIT | | EUR | 200 | | 242 | | (7 | ) |
EUR/USD | | 01/21/2015 | | CSI | | EUR | 900 | | 1,089 | | (16 | ) |
GBP/USD | | 01/21/2015 | | MSC | | GBP | 2,600 | | 4,052 | | (21 | ) |
USD/CHF | | 01/21/2015 | | JPM | | CHF | (176 | ) | (177 | ) | 9 | |
USD/EUR | | 01/07/2015 | | UBS | | EUR | (1,940 | ) | (2,348 | ) | 68 | |
USD/EUR | | 01/21/2015 | | JPM | | EUR | (9,002 | ) | (10,896 | ) | 569 | |
USD/EUR | | 01/21/2015 | | GSC | | EUR | (720 | ) | (871 | ) | 33 | |
USD/EUR | | 01/21/2015 | | BOA | | EUR | (2,602 | ) | (3,149 | ) | 113 | |
USD/EUR | | 01/21/2015 | | DUB | | EUR | (571 | ) | (691 | ) | 19 | |
USD/EUR | | 01/21/2015 | | UBS | | EUR | (251 | ) | (303 | ) | 9 | |
USD/EUR | | 01/21/2015 | | BNP | | EUR | (350 | ) | (424 | ) | 11 | |
USD/EUR | | 01/21/2015 | | CIT | | EUR | (2,233 | ) | (2,703 | ) | 79 | |
USD/EUR | | 03/06/2015 | | DUB | | EUR | (90,000 | ) | (108,965 | ) | 3,687 | |
USD/EUR | | 03/06/2015 | | CGM | | EUR | (8,000 | ) | (9,686 | ) | 328 | |
USD/GBP | | 01/21/2015 | | BCL | | GBP | (4,111 | ) | (6,407 | ) | 148 | |
USD/GBP | | 01/21/2015 | | UBS | | GBP | (591 | ) | (921 | ) | 7 | |
USD/GBP | | 01/21/2015 | | DUB | | GBP | (1,253 | ) | (1,953 | ) | 21 | |
USD/GBP | | 03/06/2015 | | CGM | | GBP | (5,000 | ) | (7,789 | ) | 99 | |
| | | | | | | | $ | (139,590 | ) | $ | 4,663 | |
Schedule of Interest Rate Swap Agreements
Counterparty | | Floating Rate Index | | Fund Receiving
Floating Rate | | Fixed Rate | | Expiration
Date | | Notional
Amount (1) | | Unrealized
Appreciation /
(Depreciation) | |
Centrally Cleared Interest Rate Swap Agreements | | | | | | | | | |
N/A | | 3-Month LIBOR | | Receiving | | 1.03 | % | 04/07/2017 | | 600 | | $ | (1 | ) |
N/A | | 3-Month LIBOR | | Receiving | | 1.01 | % | 04/28/2017 | | 600 | | — | |
N/A | | 3-Month LIBOR | | Receiving | | 0.92 | % | 05/16/2017 | | 290 | | 1 | |
| | | | | | | | | | | | | | |
See accompanying Notes to Financial Statements.
Curian Variable Series Trust Sub-Advised Funds
Schedules of Investments (in thousands)
December 31, 2014
Counterparty | | Floating Rate Index | | Fund Receiving
Floating Rate | | Fixed Rate | | Expiration
Date | | Notional
Amount (1) | | Unrealized
Appreciation /
(Depreciation) | |
Centrally Cleared Interest Rate Swap Agreements (continued) | | | | | | |
N/A | | 3-Month LIBOR | | Receiving | | 1.89 | % | 09/11/2019 | | 290 | | $ | (2 | ) |
N/A | | 3-Month LIBOR | | Receiving | | 1.78 | % | 12/23/2019 | | 340 | | — | |
N/A | | 3-Month LIBOR | | Receiving | | 2.69 | % | 06/20/2024 | | 1,700 | | (64 | ) |
N/A | | 3-Month LIBOR | | Receiving | | 3.37 | % | 06/20/2044 | | 580 | | (83 | ) |
N/A | | 6-Month Euribor | | Receiving | | 0.44 | % | 10/06/2019 | | EUR | 21,190 | | (127 | ) |
| | | | | | | | | | | | $ | (276 | ) |
| | | | | | | | | | | | | | | |
Schedule of Credit Default Swap Agreements
Counterparty | | Reference Obligation | | Implied
Credit
Spread (4) | | Fixed
Received /
Pay Rate (7) | | Expiration
Date | | Notional
Amount (1),(6) | | Value (5) | | Premiums
Paid /
(Received) | | Unrealized
Appreciation /
(Depreciation) | |
Over the Counter Credit Default Swap Agreements | | | | | | | | | | | |
Credit default swap agreements - purchase protection (2) | | | | | | | | | | | |
JPM | | Abbott Laboratories, 4.13%, 05/27/2020 | | N/A | | 1.00 | % | 12/20/2018 | | $ | 1,620 | | $ | (52 | ) | $ | (56 | ) | $ | 4 | |
CGM | | AK Steel Corp., 7.63%, 05/15/2020 | | N/A | | 5.00 | % | 12/20/2016 | | 200 | | (6 | ) | (4 | ) | (2 | ) |
CSI | | Ally Financial Inc., 7.50%, 09/15/2020 | | N/A | | 5.00 | % | 12/20/2019 | | 140 | | (22 | ) | (22 | ) | — | |
CIT | | Anadarko Petroleum Corp., 5.95%, 09/15/2016 | | N/A | | 1.00 | % | 12/20/2016 | | 2,930 | | (30 | ) | (38 | ) | 8 | |
BOA | | Anglo American Capital Plc, 5.88%, 04/17/2015 | | N/A | | 1.00 | % | 09/20/2019 | | 411 | | 8 | | 3 | | 5 | |
CIT | | Anglo American Capital Plc, 5.88%, 04/17/2015 | | N/A | | 1.00 | % | 09/20/2019 | | 272 | | 5 | | 1 | | 4 | |
BCL | | Arrow Electronics Inc., 6.88%, 06/01/2018 | | N/A | | 1.00 | % | 12/20/2019 | | 550 | | (9 | ) | 1 | | (10 | ) |
BOA | | Arrow Electronics Inc., 6.88%, 06/01/2018 | | N/A | | 1.00 | % | 12/20/2019 | | 400 | | (7 | ) | 3 | | (10 | ) |
JPM | | Arrow Electronics Inc., 6.88%, 06/01/2018 | | N/A | | 1.00 | % | 12/20/2019 | | 1,750 | | (30 | ) | (11 | ) | (19 | ) |
CSI | | Boston Scientific Corp., 6.40%, 06/15/2016 | | N/A | | 1.00 | % | 12/20/2018 | | 1,620 | | (36 | ) | (21 | ) | (15 | ) |
BBP | | Cardinal Health Inc., 1.90%, 06/15/2017 | | N/A | | 1.00 | % | 12/20/2018 | | 1,620 | | (52 | ) | (49 | ) | (3 | ) |
CIT | | Carlsberg Breweries A/S, 3.38%, 10/13/2017 | | N/A | | 1.00 | % | 09/20/2019 | | 145 | | — | | (2 | ) | 2 | |
GSI | | Carlsberg Breweries A/S, 3.38%, 10/13/2017 | | N/A | | 1.00 | % | 09/20/2019 | | 272 | | 2 | | (3 | ) | 5 | |
BOA | | Casino Guichard Peracho, 4.47%, 04/04/2016 | | N/A | | 1.00 | % | 03/20/2020 | | 97 | | — | | — | | — | |
CGM | | Casino Guichard Peracho, 4.47%, 04/04/2016 | | N/A | | 1.00 | % | 03/20/2020 | | 194 | | (1 | ) | — | | (1 | ) |
CSI | | Caterpillar Inc., 1.50%, 06/26/2017 | | N/A | | 1.00 | % | 12/20/2019 | | 275 | | (6 | ) | (7 | ) | 1 | |
CSI | | Caterpillar Inc., 1.50%, 06/26/2017 | | N/A | | 1.00 | % | 12/20/2019 | | 280 | | (7 | ) | (7 | ) | — | |
CSI | | Caterpillar Inc., 1.50%, 06/26/2017 | | N/A | | 1.00 | % | 12/20/2019 | | 400 | | (9 | ) | (10 | ) | 1 | |
GSC | | Caterpillar Inc., 1.50%, 06/26/2017 | | N/A | | 1.00 | % | 12/20/2019 | | 275 | | (7 | ) | (7 | ) | — | |
JPM | | Caterpillar Inc., 1.50%, 06/26/2017 | | N/A | | 1.00 | % | 12/20/2019 | | 425 | | (10 | ) | (12 | ) | 2 | |
JPM | | Caterpillar Inc., 1.50%, 06/26/2017 | | N/A | | 1.00 | % | 12/20/2019 | | 500 | | (11 | ) | (12 | ) | 1 | |
GSI | | Clorox Company, 3.55%, 11/01/2015 | | N/A | | 1.00 | % | 09/20/2019 | | 480 | | (10 | ) | (10 | ) | — | |
BOA | | Conoco Phillips, 5.90%, 10/15/2032 | | N/A | | 1.00 | % | 03/20/2020 | | 200 | | (5 | ) | (4 | ) | (1 | ) |
GSC | | Conoco Phillips, 5.90%, 10/15/2032 | | N/A | | 1.00 | % | 03/20/2020 | | 200 | | (5 | ) | (5 | ) | — | |
DUB | | Credit Agricole, 5.07%, 08/10/2022 | | N/A | | 1.00 | % | 09/20/2019 | | 315 | | (8 | ) | (8 | ) | — | |
GSC | | Dell Inc., 7.10%, 04/15/2028 | | N/A | | 1.00 | % | 12/20/2018 | | 250 | | 1 | | 5 | | (4 | ) |
GSC | | Dell Inc., 7.10%, 04/15/2028 | | N/A | | 1.00 | % | 12/20/2018 | | 100 | | — | | 2 | | (2 | ) |
JPM | | Dow Chemical Co., 7.38%, 11/01/2029 | | N/A | | 1.00 | % | 09/20/2018 | | 730 | | (13 | ) | (4 | ) | (9 | ) |
CIT | | Energias de Portugal SA, 6.00%, 12/07/2014 | | N/A | | 5.00 | % | 09/20/2017 | | 779 | | (89 | ) | (112 | ) | 23 | |
GSI | | Energias de Portugal SA, 6.00%, 12/07/2014 | | N/A | | 5.00 | % | 09/20/2017 | | 315 | | (37 | ) | (46 | ) | 9 | |
CIT | | Expedia Inc., 7.46%, 08/15/2018 | | N/A | | 1.00 | % | 09/20/2019 | | 275 | | (4 | ) | — | | (4 | ) |
GSI | | Expedia Inc., 7.46%, 08/15/2018 | | N/A | | 1.00 | % | 09/20/2019 | | 175 | | (2 | ) | — | | (2 | ) |
BOA | | Federative Republic of Brazil, 12.25%, 03/06/2030 | | N/A | | 1.00 | % | 06/20/2019 | | 925 | | 31 | | 39 | | (8 | ) |
BOA | | Federative Republic of Brazil, 12.25%, 03/06/2030 | | N/A | | 1.00 | % | 03/20/2020 | | 490 | | 24 | | 19 | | 5 | |
CIT | | Federative Republic of Brazil, 12.25%, 03/06/2030 | | N/A | | 1.00 | % | 06/20/2019 | | 895 | | 30 | | 44 | | (14 | ) |
CIT | | Finmeccanica Finance S.A., 5.75%, 12/12/2018 | | N/A | | 5.00 | % | 06/20/2018 | | 442 | | (60 | ) | (34 | ) | (26 | ) |
CIT | | Ford Motor Co., 6.50%, 08/01/2018 | | N/A | | 5.00 | % | 12/20/2019 | | 140 | | (27 | ) | (27 | ) | — | |
GSI | | Ford Motor Co., 6.50%, 08/01/2018 | | N/A | | 5.00 | % | 09/20/2019 | | 375 | | (69 | ) | (74 | ) | 5 | |
JPM | | Ford Motor Credit Co., 5.00%, 05/15/2018 | | N/A | | 5.00 | % | 09/20/2019 | | 190 | | (37 | ) | (40 | ) | 3 | |
JPM | | Ford Motor Credit Co., 5.00%, 05/15/2018 | | N/A | | 5.00 | % | 09/20/2019 | | 100 | | (19 | ) | (20 | ) | 1 | |
CSI | | Fortum Oyj, 4.50%, 06/20/2016 | | N/A | | 1.00 | % | 09/20/2019 | | 430 | | (11 | ) | (10 | ) | (1 | ) |
CSI | | Fortum Oyj, 4.50%, 06/20/2016 | | N/A | | 1.00 | % | 09/20/2019 | | 272 | | (7 | ) | (6 | ) | (1 | ) |
DUB | | Fortum Oyj, 4.50%, 06/20/2016 | | N/A | | 1.00 | % | 09/20/2019 | | 430 | | (11 | ) | (10 | ) | (1 | ) |
| | | | | | | | | | | | | | | | | | | | | |
See accompanying Notes to Financial Statements.
Counterparty | | Reference Obligation | | Implied
Credit
Spread (4) | | Fixed
Received /
Pay Rate (7) | | Expiration
Date | | Notional
Amount (1),(6) | | Value (5) | | Premiums
Paid /
(Received) | | Unrealized
Appreciation /
(Depreciation) | |
Over the Counter Credit Default Swap Agreements (continued) | | | | | | | | | | | |
Credit default swap agreements - purchase protection (2) (continued) | | | | | | | | | | | |
DUB | | Fortum Oyj, 4.50%, 06/20/2016 | | N/A | | 1.00 | % | 09/20/2019 | | $ | 272 | | $ | (7 | ) | $ | (7 | ) | $ | — | |
BCL | | Freescale Semiconductor, 8.05%, 02/01/2020 | | N/A | | 5.00 | % | 12/20/2019 | | 100 | | (11 | ) | (4 | ) | (7 | ) |
CGM | | Freescale Semiconductor, 8.05%, 02/01/2020 | | N/A | | 5.00 | % | 12/20/2019 | | 100 | | (11 | ) | (7 | ) | (4 | ) |
CSI | | Freescale Semiconductor, 8.05%, 02/01/2020 | | N/A | | 5.00 | % | 12/20/2019 | | 220 | | (24 | ) | (17 | ) | (7 | ) |
GSC | | Freescale Semiconductor, 8.05%, 02/01/2020 | | N/A | | 5.00 | % | 12/20/2019 | | 100 | | (11 | ) | (5 | ) | (6 | ) |
BOA | | GDF Suez SA, 5.13%, 02/19/2018 | | N/A | | 1.00 | % | 06/20/2019 | | 732 | | (22 | ) | (20 | ) | (2 | ) |
CIT | | GDF Suez SA, 5.13%, 02/19/2018 | | N/A | | 1.00 | % | 06/20/2019 | | 417 | | (12 | ) | (10 | ) | (2 | ) |
DUB | | GDF Suez SA, 5.13%, 02/19/2018 | | N/A | | 1.00 | % | 06/20/2019 | | 423 | | (12 | ) | (11 | ) | (1 | ) |
CSI | | General Mills Inc., 5.70%, 02/15/2017 | | N/A | | 1.00 | % | 09/20/2019 | | 430 | | (14 | ) | (14 | ) | — | |
CSI | | General Mills Inc., 5.70%, 02/15/2017 | | N/A | | 1.00 | % | 09/20/2019 | | 691 | | (23 | ) | (22 | ) | (1 | ) |
CSI | | General Mills Inc., 5.70%, 02/15/2017 | | N/A | | 1.00 | % | 09/20/2019 | | 500 | | (17 | ) | (16 | ) | (1 | ) |
JPM | | General Mills Inc., 5.70%, 02/15/2017 | | N/A | | 1.00 | % | 03/20/2020 | | 200 | | (7 | ) | (6 | ) | (1 | ) |
CGM | | Genworth Holdings Inc., 6.52%, 05/22/2018 | | N/A | | 1.00 | % | 06/20/2018 | | 520 | | 46 | | 32 | | 14 | |
CGM | | Genworth Holdings Inc., 6.52%, 05/22/2018 | | N/A | | 1.00 | % | 06/20/2020 | | 89 | | 15 | | 12 | | 3 | |
CSI | | Genworth Holdings Inc., 6.52%, 05/22/2018 | | N/A | | 1.00 | % | 06/20/2018 | | 85 | | 7 | | 6 | | 1 | |
CSI | | Genworth Holdings Inc., 6.52%, 05/22/2018 | | N/A | | 1.00 | % | 06/20/2018 | | 89 | | 7 | | 5 | | 2 | |
CSI | | Genworth Holdings Inc., 6.52%, 05/22/2018 | | N/A | | 1.00 | % | 06/20/2018 | | 88 | | 7 | | 5 | | 2 | |
GSC | | Genworth Holdings Inc., 6.52%, 05/22/2018 | | N/A | | 1.00 | % | 06/20/2020 | | 122 | | 19 | | 15 | | 4 | |
JPM | | Genworth Holdings Inc., 6.52%, 05/22/2018 | | N/A | | 1.00 | % | 06/20/2020 | | 77 | | 12 | | 10 | | 2 | |
BBP | | GKN Holdings Plc, 6.75%, 10/28/2019 | | N/A | | 1.00 | % | 06/20/2019 | | 97 | | (2 | ) | (1 | ) | (1 | ) |
BNP | | GKN Holdings Plc, 6.75%, 10/28/2019 | | N/A | | 1.00 | % | 06/20/2019 | | 133 | | (2 | ) | (1 | ) | (1 | ) |
BOA | | GKN Holdings Plc, 6.75%, 10/28/2019 | | N/A | | 1.00 | % | 06/20/2019 | | 79 | | (2 | ) | (1 | ) | (1 | ) |
CIT | | GKN Holdings Plc, 6.75%, 10/28/2019 | | N/A | | 1.00 | % | 06/20/2019 | | 127 | | (2 | ) | (1 | ) | (1 | ) |
CSI | | Hewlett-Packard Co., 5.40%, 03/01/2017 | | N/A | | 1.00 | % | 12/20/2019 | | 850 | | (14 | ) | (2 | ) | (12 | ) |
GSI | | International Business Machines Corp., 5.70%, 09/14/2017 | | N/A | | 1.00 | % | 12/20/2018 | | 1,620 | | (44 | ) | (49 | ) | 5 | |
BBP | | iTraxx Europe Senior Series 20 | | N/A | | 1.00 | % | 12/20/2018 | | 1,367 | | (27 | ) | (7 | ) | (20 | ) |
CIT | | iTraxx Europe Senior Series 20 | | N/A | | 1.00 | % | 12/20/2018 | | 2,916 | | (58 | ) | (15 | ) | (43 | ) |
CIT | | iTraxx Europe Senior Series 21 | | N/A | | 1.00 | % | 06/20/2019 | | 2,710 | | (51 | ) | (25 | ) | (26 | ) |
CIT | | iTraxx Europe Senior Series 21 | | N/A | | 1.00 | % | 06/20/2019 | | 2,571 | | (48 | ) | (25 | ) | (23 | ) |
CIT | | iTraxx Europe Senior Series 21 | | N/A | | 1.00 | % | 06/20/2019 | | 3,860 | | (73 | ) | (47 | ) | (26 | ) |
CIT | | iTraxx Europe Senior Series 21 | | N/A | | 1.00 | % | 06/20/2019 | | 2,710 | | (51 | ) | (25 | ) | (26 | ) |
DUB | | iTraxx Europe Senior Series 21 | | N/A | | 1.00 | % | 06/20/2019 | | 2,711 | | (51 | ) | (35 | ) | (16 | ) |
CIT | | iTraxx Europe Series 9 | | N/A | | 5.00 | % | 06/20/2018 | | 2,202 | | (217 | ) | 255 | | (472 | ) |
JPM | | Kohl’s Corporation, 6.25%, 12/15/2017 | | N/A | | 1.00 | % | 06/20/2019 | | 1,080 | | (7 | ) | 23 | | (30 | ) |
GSC | | Lennar Corp., 4.75%, 12/15/2017 | | N/A | | 5.00 | % | 12/20/2019 | | 200 | | (28 | ) | (27 | ) | (1 | ) |
BBP | | Marks & Spencer Plc, 6.13%, 12/02/2019 | | N/A | | 1.00 | % | 03/20/2019 | | 252 | | (2 | ) | 6 | | (8 | ) |
CSI | | Microsoft Corp., 4.50%, 10/01/2040 | | N/A | | 1.00 | % | 12/20/2018 | | 1,279 | | (42 | ) | (38 | ) | (4 | ) |
GSI | | Microsoft Corp., 4.50%, 10/01/2040 | | N/A | | 1.00 | % | 12/20/2018 | | 341 | | (11 | ) | (10 | ) | (1 | ) |
JPM | | Navient LLC, 6.25%, 01/25/2016 | | N/A | | 1.00 | % | 12/20/2019 | | 100 | | 7 | | 7 | | — | |
BNP | | Obrigacoes do Tesouro, 4.95%, 10/25/2023 | | N/A | | 1.00 | % | 09/20/2019 | | 725 | | 22 | | 22 | | — | |
BNP | | Peugeot SA, 8.38%, 07/15/2014 | | N/A | | 5.00 | % | 09/20/2018 | | 278 | | (34 | ) | 8 | | (42 | ) |
CIT | | Peugeot SA, 8.38%, 07/15/2014 | | N/A | | 5.00 | % | 06/20/2018 | | 1,936 | | (227 | ) | 126 | | (353 | ) |
JPM | | Radian Group Inc., 9.00%, 06/15/2017 | | N/A | | 5.00 | % | 06/20/2019 | | 400 | | (50 | ) | (45 | ) | (5 | ) |
JPM | | Radian Group Inc., 9.00%, 06/15/2017 | | N/A | | 5.00 | % | 06/20/2019 | | 500 | | (62 | ) | (55 | ) | (7 | ) |
BBP | | Republic of France, 4.25%, 04/25/2019 | | N/A | | 0.25 | % | 06/20/2018 | | 1,275 | | — | | 23 | | (23 | ) |
JPM | | Republic of France, 4.25%, 04/25/2019 | | N/A | | 0.25 | % | 06/20/2018 | | 865 | | 1 | | 14 | | (13 | ) |
JPM | | Republic of Portugal, 5.45%, 09/23/2013 | | N/A | | 1.00 | % | 06/20/2015 | | 1,250 | | (4 | ) | 27 | | (31 | ) |
BNP | | Rio Tinto Finance USA LTD., 6.50%, 07/15/2018 | | N/A | | 1.00 | % | 03/20/2020 | | 100 | | 1 | | 1 | | — | |
BNP | | Rio Tinto Finance USA LTD., 6.50%, 07/15/2018 | | N/A | | 1.00 | % | 03/20/2020 | | 100 | | — | | 1 | | (1 | ) |
BOA | | Rio Tinto Finance USA LTD., 6.50%, 07/15/2018 | | N/A | | 1.00 | % | 12/20/2019 | | 100 | | — | | — | | — | |
JPM | | Sony Corp., 1.57%, 06/19/2015 | | N/A | | 1.00 | % | 03/20/2019 | | 1,190 | | (11 | ) | 91 | | (102 | ) |
BNP | | Southwest Airlines Co., 5.13%, 03/01/2017 | | N/A | | 1.00 | % | 12/20/2019 | | 275 | | (6 | ) | (5 | ) | (1 | ) |
CSI | | Southwest Airlines Co., 5.13%, 03/01/2017 | | N/A | | 1.00 | % | 12/20/2019 | | 580 | | (14 | ) | (10 | ) | (4 | ) |
MSC | | Staples Inc., 2.75%, 01/12/2018 | | N/A | | 1.00 | % | 03/20/2020 | | 300 | | 9 | | 10 | | (1 | ) |
CSI | | The Western Union Co., 3.65%, 08/22/2018 | | N/A | | 1.00 | % | 12/20/2019 | | 1,400 | | 17 | | 48 | | (31 | ) |
| | | | | | | | | | | | | | | | | | | | | |
See accompanying Notes to Financial Statements.
Counterparty | | Reference Obligation | | Implied
Credit
Spread (4) | | Fixed
Received /
Pay Rate (7) | | Expiration
Date | | Notional
Amount (1),(6) | | Value (5) | | Premiums
Paid /
(Received) | | Unrealized
Appreciation /
(Depreciation) | |
Over the Counter Credit Default Swap Agreements (continued) | | | | | | | | | | | | | |
Credit default swap agreements - purchase protection (2) (continued) | | | | | | | | | | | | | |
JPM | | The Western Union Co., 3.65%, 08/22/2018 | | N/A | | 1.00 | % | 12/20/2019 | | $ | 425 | | $ | 5 | | $ | 15 | | $ | (10 | ) |
BBP | | Transocean Inc., 7.38%, 04/15/2018 | | N/A | | 1.00 | % | 12/20/2017 | | 725 | | 82 | | 12 | | 70 | |
BNP | | United Mexican States, 5.95%, 03/19/2019 | | N/A | | 1.00 | % | 03/20/2020 | | 1,200 | | 2 | | (3 | ) | 5 | |
GSC | | Valero Energy Corp., 8.75%, 06/15/2030 | | N/A | | 1.00 | % | 12/20/2019 | | 409 | | 6 | | (1 | ) | 7 | |
| | | | | | | | | | $ | 69,377 | | $ | (1,654 | ) | $ | (347 | ) | $ | (1,307 | ) |
| | | | | | | | | | | | | | | | | |
Credit default swap agreements - sell protection (3) | | | | | | | | | | | |
CGM | | Abengoa SA, 8.50%, 03/31/2016 | | 12.45 | % | 5.00 | % | 12/20/2019 | | $ | (3 | ) | $ | — | | $ | — | | $ | — | |
CSI | | Abengoa SA, 8.50%, 03/31/2016 | | 12.45 | % | 5.00 | % | 12/20/2019 | | (85 | ) | (19 | ) | (20 | ) | 1 | |
CSI | | Abengoa SA, 8.50%, 03/31/2016 | | 12.45 | % | 5.00 | % | 12/20/2019 | | (85 | ) | (20 | ) | (16 | ) | (4 | ) |
CSI | | Abengoa SA, 8.50%, 03/31/2016 | | 12.45 | % | 5.00 | % | 12/20/2019 | | (121 | ) | (28 | ) | (27 | ) | (1 | ) |
CGM | | AK Steel Corp., 7.63%, 05/15/2020 | | 7.21 | % | 5.00 | % | 12/20/2019 | | (200 | ) | (17 | ) | (20 | ) | 3 | |
CGM | | Altice Finco SA, 9.00%, 06/15/2023 | | 4.73 | % | 5.00 | % | 12/20/2019 | | (97 | ) | 1 | | 1 | | — | |
BCL | | Amkor Technology Inc., 7.38%, 05/01/2018 | | 3.16 | % | 5.00 | % | 12/20/2019 | | (175 | ) | 15 | | 12 | | 3 | |
CIT | | Amkor Technology Inc., 7.38%, 05/01/2018 | | 2.96 | % | 5.00 | % | 09/20/2019 | | (200 | ) | 18 | | 18 | | — | |
GSI | | Amkor Technology Inc., 7.38%, 05/01/2018 | | 3.16 | % | 5.00 | % | 12/20/2019 | | (80 | ) | 6 | | 6 | | — | |
GSI | | Amkor Technology Inc., 7.38%, 05/01/2018 | | 3.16 | % | 5.00 | % | 12/20/2019 | | (50 | ) | 4 | | 4 | | — | |
BCL | | Amkor Technology Inc., 7.38%, 05/01/2018 | | 3.16 | % | 5.00 | % | 12/20/2019 | | (110 | ) | 10 | | 9 | | 1 | |
BCL | | Amkor Technology Inc., 7.38%, 05/01/2018 | | 3.16 | % | 5.00 | % | 12/20/2019 | | (75 | ) | 6 | | 6 | | — | |
BNP | | Apache Corp., 7.00%, 02/01/2018 | | 2.15 | % | 1.00 | % | 03/20/2020 | | (100 | ) | (6 | ) | (5 | ) | (1 | ) |
BBP | | ArcelorMittal, 6.13%, 06/01/2018 | | 2.55 | % | 1.00 | % | 09/20/2019 | | (133 | ) | (9 | ) | (9 | ) | — | |
BCL | | ArcelorMittal, 6.13%, 06/01/2018 | | 2.55 | % | 1.00 | % | 09/20/2019 | | (136 | ) | (9 | ) | (10 | ) | 1 | |
CGM | | ArcelorMittal, 6.13%, 06/01/2018 | | 2.68 | % | 1.00 | % | 12/20/2019 | | (206 | ) | (16 | ) | (14 | ) | (2 | ) |
CIT | | ArcelorMittal, 6.13%, 06/01/2018 | | 2.55 | % | 1.00 | % | 09/20/2019 | | (272 | ) | (19 | ) | (20 | ) | 1 | |
CSI | | ArcelorMittal, 6.13%, 06/01/2018 | | 2.55 | % | 1.00 | % | 09/20/2019 | | (278 | ) | (19 | ) | (20 | ) | 1 | |
BBP | | Astaldi SpA, 7.13%, 12/01/2020 | | 5.66 | % | 5.00 | % | 06/20/2019 | | (44 | ) | (1 | ) | 1 | | (2 | ) |
CSI | | Astaldi SpA, 7.13%, 12/01/2020 | | 5.66 | % | 5.00 | % | 06/20/2019 | | (48 | ) | (1 | ) | 2 | | (3 | ) |
CSI | | Astaldi SpA, 7.13%, 12/01/2020 | | 5.66 | % | 5.00 | % | 06/20/2019 | | (65 | ) | (2 | ) | — | | (2 | ) |
DUB | | Astaldi SpA, 7.13%, 12/01/2020 | | 5.66 | % | 5.00 | % | 06/20/2019 | | (43 | ) | (1 | ) | 2 | | (3 | ) |
GSI | | Astaldi SpA, 7.13%, 12/01/2020 | | 5.66 | % | 5.00 | % | 06/20/2019 | | (66 | ) | (2 | ) | 2 | | (4 | ) |
JPM | | Barrick Gold Corp., 5.80%, 11/15/2034 | | 1.77 | % | 1.00 | % | 12/20/2019 | | (400 | ) | (14 | ) | (14 | ) | — | |
BBP | | Bayerische Landesbank, 4.38%, 01/22/2014 | | 0.58 | % | 1.00 | % | 12/20/2018 | | (859 | ) | 14 | | 2 | | 12 | |
CIT | | Best Buy Co. Inc., 5.50%, 03/15/2021 | | 2.08 | % | 5.00 | % | 06/20/2019 | | (300 | ) | 37 | | 22 | | 15 | |
CSI | | Best Buy Co. Inc., 5.50%, 03/15/2021 | | 2.08 | % | 5.00 | % | 06/20/2019 | | (300 | ) | 37 | | 23 | | 14 | |
DUB | | BHP Billiton Finance, 7.25%, 03/01/2016 | | 0.76 | % | 1.00 | % | 03/20/2020 | | (100 | ) | 1 | | 1 | | — | |
CIT | | Cable & Wireless International Finance BV, 8.63%, 03/25/2019 | | 2.09 | % | 5.00 | % | 09/20/2019 | | (60 | ) | 8 | | 8 | | — | |
CIT | | CNH Industrial Finance Europe SA, 6.25%, 03/09/2018 | | 1.57 | % | 5.00 | % | 03/20/2019 | | (218 | ) | 31 | | 39 | | (8 | ) |
CIT | | CNH Industrial Finance Europe SA, 6.25%, 03/09/2018 | | 1.57 | % | 5.00 | % | 03/20/2019 | | (218 | ) | 31 | | 38 | | (7 | ) |
BNP | | Devon Energy Corporation, 7.95%, 04/15/2032 | | 1.12 | % | 1.00 | % | 12/20/2019 | | (530 | ) | (3 | ) | — | | (3 | ) |
BNP | | Devon Energy Corporation, 7.95%, 04/15/2032 | | 1.12 | % | 1.00 | % | 12/20/2019 | | (580 | ) | (3 | ) | 1 | | (4 | ) |
CIT | | Eileme 2 AB, 11.75%, 01/31/2020 | | 1.04 | % | 5.00 | % | 09/20/2019 | | (101 | ) | 19 | | 18 | | 1 | |
BOA | | General Motors Co., 4.88%, 10/02/2023 | | 1.24 | % | 5.00 | % | 12/20/2018 | | (250 | ) | 36 | | 40 | | (4 | ) |
DUB | | General Motors Co., 6.25%, 10/02/2043 | | 1.38 | % | 5.00 | % | 06/20/2019 | | (750 | ) | 117 | | 123 | | (6 | ) |
DUB | | General Motors Co., 6.25%, 10/02/2043 | | 1.51 | % | 5.00 | % | 12/20/2019 | | (500 | ) | 82 | | 82 | | — | |
BNP | | Glencore Finance Europe, 6.50%, 02/27/2019 | | 1.83 | % | 1.00 | % | 06/20/2021 | | (153 | ) | (8 | ) | (17 | ) | 9 | |
CIT | | Glencore Finance Europe, 6.50%, 02/27/2019 | | 1.83 | % | 1.00 | % | 06/20/2021 | | (307 | ) | (15 | ) | (34 | ) | 19 | |
CIT | | Goodyear Tire & Rubber Co., 7.00%, 03/15/2028 | | 1.65 | % | 5.00 | % | 06/20/2019 | | (300 | ) | 43 | | 37 | | 6 | |
GSI | | Goodyear Tire & Rubber Co., 7.00%, 03/15/2028 | | 1.81 | % | 5.00 | % | 09/20/2019 | | (300 | ) | 43 | | 35 | | 8 | |
GSC | | HCA Inc., 8.00%, 10/01/2018 | | 2.05 | % | 5.00 | % | 12/20/2019 | | (150 | ) | 20 | | 17 | | 3 | |
CIT | | Hertz Corp., 7.50%, 10/15/2018 | | 3.41 | % | 5.00 | % | 09/20/2019 | | (100 | ) | 7 | | 11 | | (4 | ) |
GSC | | Hertz Corp., 7.50%, 10/15/2018 | | 3.62 | % | 5.00 | % | 12/20/2019 | | (100 | ) | 6 | | 7 | | (1 | ) |
GSI | | Hertz Corp., 7.50%, 10/15/2018 | | 3.41 | % | 5.00 | % | 09/20/2019 | | (130 | ) | 9 | | 16 | | (7 | ) |
MSC | | Italian Republic, 6.88%, 09/27/2023 | | 1.32 | % | 1.00 | % | 12/20/2019 | | (1,890 | ) | (28 | ) | (47 | ) | 19 | |
See accompanying Notes to Financial Statements.
Counterparty | | Reference Obligation | | Implied
Credit
Spread (4) | | Fixed
Received /
Pay Rate (7) | | Expiration
Date | | Notional
Amount (1),(6) | | Value (5) | | Premiums
Paid /
(Received) | | Unrealized
Appreciation /
(Depreciation) | |
Over the Counter Credit Default Swap Agreements (continued) | | | | | | | | | | |
Credit default swap agreements - sell protection (3) (continued) | | | | | | | | | | |
BBP | | iTraxx Europe Subordinated Series 20 | | N/A | | 5.00 | % | 12/20/2018 | | $ | (1,089 | ) | $ | 182 | | $ | 211 | | $ | (29 | ) |
CIT | | iTraxx Europe Subordinated Series 20 | | N/A | | 5.00 | % | 12/20/2018 | | (1,561 | ) | 260 | | 299 | | (39 | ) |
DUB | | iTraxx Europe Subordinated Series 20 | | N/A | | 5.00 | % | 12/20/2018 | | (774 | ) | 129 | | 149 | | (20 | ) |
CSI | | Norske Skogindustrier ASA, 7.00%, 06/26/2017 | | 25.46 | % | 5.00 | % | 12/20/2018 | | (145 | ) | (61 | ) | (65 | ) | 4 | |
CIT | | OTE Plc, 4.63%, 05/20/2016 | | 4.02 | % | 5.00 | % | 09/20/2019 | | (40 | ) | 2 | | 6 | | (4 | ) |
GSI | | OTE Plc, 4.63%, 05/20/2016 | | 4.02 | % | 5.00 | % | 09/20/2019 | | (61 | ) | 3 | | 8 | | (5 | ) |
DUB | | Pulte Group Inc., 7.88%, 06/15/2032 | | 1.38 | % | 5.00 | % | 09/20/2019 | | (130 | ) | 21 | | 19 | | 2 | |
BBP | | Republic of France, 4.25%, 04/25/2019 | | 0.67 | % | 0.25 | % | 06/20/2023 | | (780 | ) | (25 | ) | (61 | ) | 36 | |
CIT | | Republic of France, 4.25%, 04/25/2019 | | 0.67 | % | 0.25 | % | 06/20/2023 | | (530 | ) | (18 | ) | (44 | ) | 26 | |
CSI | | Rexel SA, 5.13%, 06/15/2020 | | 1.89 | % | 5.00 | % | 09/20/2019 | | (79 | ) | 11 | | 8 | | 3 | |
CSI | | Rexel SA, 5.13%, 06/15/2020 | | 1.89 | % | 5.00 | % | 09/20/2019 | | (163 | ) | 24 | | 18 | | 6 | |
DUB | | Rexel SA, 5.13%, 06/15/2020 | | 1.75 | % | 5.00 | % | 06/20/2019 | | (1 | ) | — | | — | | — | |
BBP | | Sabre Holdings Corp., 6.35%, 03/15/2016 | | 2.89 | % | 5.00 | % | 09/20/2019 | | (115 | ) | 11 | | 11 | | — | |
BCL | | Sabre Holdings Corp., 6.35%, 03/15/2016 | | 3.05 | % | 5.00 | % | 12/20/2019 | | (100 | ) | 9 | | 6 | | 3 | |
BCL | | Sabre Holdings Corp., 6.35%, 03/15/2016 | | 3.05 | % | 5.00 | % | 12/20/2019 | | (100 | ) | 9 | | 7 | | 2 | |
BCL | | Sabre Holdings Corp., 6.35%, 03/15/2016 | | 3.05 | % | 5.00 | % | 12/20/2019 | | (140 | ) | 13 | | 9 | | 4 | |
DUB | | Sabre Holdings Corp., 6.35%, 03/15/2016 | | 2.89 | % | 5.00 | % | 09/20/2019 | | (175 | ) | 17 | | 17 | | — | |
DUB | | Sabre Holdings Corp., 6.35%, 03/15/2016 | | 2.89 | % | 5.00 | % | 09/20/2019 | | (175 | ) | 16 | | 17 | | (1 | ) |
GSI | | Sabre Holdings Corp., 6.35%, 03/15/2016 | | 2.89 | % | 5.00 | % | 09/20/2019 | | (175 | ) | 16 | | 17 | | (1 | ) |
CGM | | Tenet Healthcare Corp., 6.88%, 11/15/2031 | | 3.30 | % | 5.00 | % | 03/20/2020 | | (100 | ) | 9 | | 9 | | — | |
GSC | | Tenet Healthcare Corp., 6.88%, 11/15/2031 | | 3.30 | % | 5.00 | % | 03/20/2020 | | (100 | ) | 8 | | 8 | | — | |
JPM | | Tenet Healthcare Corp., 6.88%, 11/15/2031 | | 3.30 | % | 5.00 | % | 03/20/2020 | | (100 | ) | 8 | | 9 | | (1 | ) |
BOA | | ThyssenKrupp AG, 4.38%, 03/18/2015 | | 1.16 | % | 1.00 | % | 09/20/2018 | | (44 | ) | — | | (4 | ) | 4 | |
BBP | | Transocean Inc., 7.38%, 04/15/2018 | | 6.47 | % | 1.00 | % | 12/20/2019 | | (520 | ) | (112 | ) | (48 | ) | (64 | ) |
CIT | | TVN Finance Corporation, 7.38%, 12/15/2020 | | 1.24 | % | 5.00 | % | 09/20/2019 | | (101 | ) | 18 | | 15 | | 3 | |
| | | | | | | | | | $ | (18,566 | ) | $ | 911 | | $ | 931 | | $ | (20 | ) |
Counterparty | | Reference Obligation | | Fixed
Received /
Pay Rate (7) | | Expiration
Date | | Notional
Amount (1),(6) | | Value (5) | | Unrealized
(Depreciation) | |
Centrally Cleared Credit Default Swap Agreements | | | | | | | | |
Credit default swap agreements - purchase protection (2) | | | | | | | | |
N/A | | CDX.NA.HY.23 | | 5.00 | % | 12/20/2019 | | $ | 4,230 | | $ | (262 | ) | $ | (16 | ) |
N/A | | CDX.NA.IG.23 | | 1.00 | % | 12/20/2019 | | 13,705 | | (219 | ) | (21 | ) |
N/A | | iTraxx Europe Crossover Series 21 | | 5.00 | % | 12/20/2019 | | 16,463 | | (1,102 | ) | (103 | ) |
N/A | | iTraxx Europe Senior Series 22 | | 1.00 | % | 12/20/2019 | | 5,445 | | (86 | ) | (27 | ) |
| | | | | | | | $ | 39,843 | | $ | (1,669 | ) | $ | (167 | ) |
| | | | | | | | | | | | | |
Credit default swap agreements - sell protection (3) | | | | | | | |
N/A | | iTraxx Europe Crossover Series 21 | | 5.00 | % | 06/20/2019 | | $ | (1,783 | ) | $ | 207 | | $ | (10 | ) |
N/A | | iTraxx Europe Series 21 | | 1.00 | % | 06/20/2019 | | (1,440 | ) | 29 | | — | |
| | | | | | | | $ | (3,223 | ) | $ | 236 | | $ | (10 | ) |
Schedule of Over the Counter Total Return Swap Agreements
Counterparty | | Paying Return of Reference Entity | | Rate Received by Fund | | Expiration
Date | | Notional
Amount (1) | | Unrealized
Appreciation /
(Depreciation) | |
BNP | | American Airlines Group Inc. | | 3-Month LIBOR -0.25% | | 10/28/2015 | | (41 | ) | $ | (16 | ) |
BNP | | Aperam SA | | 3-Month Euribor -0.25% | | 09/23/2015 | | EUR | (52 | ) | 6 | |
BNP | | SPDR S&P Oil & Gas Exploration & Production | | 3-Month LIBOR -1.00% | | 08/06/2015 | | | (183 | ) | 35 | |
BNP | | Telecom Italia SpA | | 3-Month Euribor -0.25% | | 06/16/2015 | | EUR | (98 | ) | 14 | |
BNP | | Telecom Italia SpA | | 3-Month Euribor -0.25% | | 06/17/2015 | | EUR | (262 | ) | 37 | |
| | | | | | | | | | | | | |
See accompanying Notes to Financial Statements.
Counterparty | | Paying Return of Reference Entity | | Rate Received by Fund | | Expiration
Date | | Notional
Amount (1) | | Unrealized
Appreciation /
(Depreciation) | |
BNP | | Telecom Italia SpA | | 3-Month Euribor -0.30% | | 07/22/2015 | | EUR | (766 | ) | $ | (5 | ) |
BNP | | Volkswagen AG | | 3-Month Euribor -0.25% | | 02/04/2015 | | EUR | (323 | ) | 10 | |
BNP | | Volkswagen AG | | 3-Month Euribor -0.25% | | 02/04/2015 | | EUR | (272 | ) | 12 | |
BNP | | Volkswagen AG | | 3-Month Euribor -0.25% | | 02/04/2015 | | EUR | (540 | ) | 19 | |
BOA | | Antero Resources Corp. | | 3-Month LIBOR -0.90% | | 12/10/2015 | | | (8 | ) | — | |
BOA | | Antero Resources Corp. | | 3-Month LIBOR -0.90% | | 12/13/2015 | | | (22 | ) | (1 | ) |
BOA | | Banco Santander SA | | 3-Month Euribor -0.30% | | 04/14/2015 | | EUR | (227 | ) | 6 | |
BOA | | California Resources Corp. | | 3-Month LIBOR -0.30% | | 12/04/2015 | | | (35 | ) | 8 | |
BOA | | Caterpillar Inc. | | 3-Month LIBOR -0.30% | | 07/25/2015 | | | (83 | ) | 6 | |
BOA | | Caterpillar Inc. | | 3-Month LIBOR -0.30% | | 10/08/2015 | | | (83 | ) | 5 | |
BOA | | Caterpillar Inc. | | 3-Month LIBOR -0.30% | | 12/04/2015 | | | (99 | ) | 12 | |
BOA | | Citigroup Inc. | | 3-Month LIBOR -0.30% | | 10/20/2015 | | | (54 | ) | (5 | ) |
BOA | | Concho Resources Inc. | | 3-Month LIBOR -0.30% | | 12/12/2015 | | | (41 | ) | (4 | ) |
BOA | | Financial Select Sector SPDR | | 1-Month LIBOR +0.30% | | 12/18/2015 | | | (120 | ) | (4 | ) |
BOA | | Genworth Financial Inc. | | 3-Month LIBOR -0.30% | | 11/12/2015 | | | (51 | ) | (4 | ) |
BOA | | Genworth Financial Inc. | | 3-Month LIBOR -0.30% | | 11/23/2015 | | | (26 | ) | 2 | |
BOA | | Genworth Financial Inc. | | 3-Month LIBOR -0.30% | | 11/30/2015 | | | (10 | ) | 1 | |
BOA | | Genworth Financial Inc. | | 3-Month LIBOR -0.30% | | 12/01/2015 | | | (16 | ) | 1 | |
BOA | | Genworth Financial Inc. | | 3-Month LIBOR -0.30% | | 12/23/2015 | | | (43 | ) | (4 | ) |
BOA | | Hewlett Packard Co. | | 3-Month LIBOR -0.30% | | 10/16/2015 | | | (74 | ) | (16 | ) |
BOA | | Hewlett Packard Co. | | 3-Month LIBOR -0.30% | | 11/04/2015 | | | (28 | ) | (4 | ) |
BOA | | iShares iBoxx High Yield Corporate Bond ETF | | 1-Month LIBOR -0.35% | | 11/10/2015 | | | (81 | ) | — | |
BOA | | iShares iBoxx High Yield Corporate Bond ETF | | 1-Month LIBOR -0.35% | | 11/20/2015 | | | (173 | ) | (2 | ) |
BOA | | iShares iBoxx High Yield Corporate Bond ETF | | 1-Month LIBOR -0.35% | | 11/21/2015 | | | (85 | ) | (3 | ) |
BOA | | iShares iBoxx High Yield Corporate Bond ETF | | 1-Month LIBOR -0.70% | | 12/04/2015 | | | (90 | ) | — | |
BOA | | iShares iBoxx High Yield Corporate Bond ETF | | 1-Month LIBOR -2.25% | | 10/18/2015 | | | (109 | ) | (4 | ) |
BOA | | iShares iBoxx High Yield Corporate Bond ETF | | 1-Month LIBOR -2.25% | | 10/18/2015 | | | (133 | ) | (4 | ) |
BOA | | iShares iBoxx High Yield Corporate Bond ETF | | 3-Month LIBOR -0.35% | | 12/02/2015 | | | (144 | ) | 2 | |
BOA | | iShares U.S. Preferred Stock ETF | | 3-Month LIBOR -1.50% | | 08/07/2015 | | | (74 | ) | — | |
BOA | | iShares U.S. Preferred Stock ETF | | 3-Month LIBOR -1.50% | | 12/09/2015 | | | (90 | ) | (1 | ) |
BOA | | iShares U.S. Preferred Stock ETF | | 3-Month LIBOR -2.75% | | 12/16/2015 | | | (200 | ) | (3 | ) |
BOA | | iShares U.S. Preferred Stock ETF | | 3-Month LIBOR -2.75% | | 12/18/2015 | | | (200 | ) | (3 | ) |
BOA | | iShares U.S. Preferred Stock ETF | | 3-Month LIBOR -2.75% | | 12/19/2015 | | | (176 | ) | (4 | ) |
BOA | | Market Vector Semiconductor ETF | | 3-Month LIBOR -0.30% | | 07/23/2015 | | | (123 | ) | (16 | ) |
BOA | | Powershares QQQ | | 3-Month LIBOR -0.10% | | 10/16/2015 | | | (153 | ) | (17 | ) |
BOA | | Powershares QQQ | | 3-Month LIBOR -0.15% | | 02/26/2015 | | | (413 | ) | 7 | |
BOA | | Powershares Senior Loan Portfolio ETF | | 3-Month LIBOR -0.05% | | 12/16/2015 | | | (251 | ) | (2 | ) |
BOA | | Powershares Senior Loan Portfolio ETF | | 3-Month LIBOR -0.05% | | 12/16/2015 | | | (119 | ) | (2 | ) |
BOA | | Powershares Senior Loan Portfolio ETF | | 3-Month LIBOR -0.05% | | 12/19/2015 | | | (164 | ) | (4 | ) |
BOA | | SPDR S&P Oil & Gas Exploration & Production | | 3-Month LIBOR -3.00% | | 12/04/2015 | | | (92 | ) | 10 | |
BOA | | UniCredit SpA | | 3-Month Euribor +0.10% | | 01/26/2015 | | EUR | (222 | ) | 28 | |
BOA | | United Technologies Corp. | | 3-Month LIBOR -0.30% | | 09/18/2015 | | | (207 | ) | (6 | ) |
BOA | | United Technologies Corp. | | 3-Month LIBOR -0.30% | | 09/28/2015 | | | (216 | ) | 4 | |
BOA | | Volkswagen AG | | 3-Month Euribor -0.20% | | 05/27/2015 | | EUR | (531 | ) | 20 | |
BOA | | Volkswagen AG | | 3-Month Euribor -0.40% | | 05/27/2015 | | EUR | (532 | ) | 21 | |
BOA | | WPX Energy Inc. | | 3-Month LIBOR -0.30% | | 12/16/2015 | | | (20 | ) | (2 | ) |
CIT | | Repsol SA | | 3-Month Euribor -0.50% | | 01/22/2015 | | EUR | (1 | ) | (23 | ) |
CIT | | Repsol SA | | 3-Month Euribor -0.50% | | 07/17/2015 | | EUR | (1 | ) | (23 | ) |
CIT | | Telecom Italia SpA | | 3-Month Euribor -0.40% | | 05/07/2015 | | EUR | (661 | ) | 48 | |
CIT | | Telecom Italia SpA | | 3-Month Euribor -0.40% | | 05/12/2015 | | EUR | (665 | ) | 49 | |
DUB | | iShares U.S. Preferred Stock ETF | | 3-Month LIBOR -1.50% | | 08/07/2015 | | | (88 | ) | — | |
DUB | | iShares U.S. Preferred Stock ETF | | 3-Month LIBOR -1.75% | | 09/17/2015 | | | (88 | ) | (1 | ) |
GSI | | Energy Select Sector SPDR | | 1-Month LIBOR +0.21% | | 12/14/2015 | | | (23 | ) | (1 | ) |
GSI | | Energy Select Sector SPDR | | 1-Month LIBOR +0.21% | | 12/18/2015 | | | (37 | ) | (3 | ) |
GSI | | Repsol SA | | 3-Month Euribor -0.20% | | 11/17/2015 | | EUR | (779 | ) | 75 | |
JPM | | Aperam SA | | 3-Month Euribor -0.30% | | 10/05/2015 | | EUR | (12 | ) | — | |
JPM | | Banco Popular Espanol SA | | 3-Month Euribor | | 09/23/2015 | | EUR | (195 | ) | 35 | |
JPM | | Bankia SA | | 3-Month Euribor -0.40% | | 11/17/2015 | | EUR | (14 | ) | 1 | |
| | | | | | | | | | | | | |
See accompanying Notes to Financial Statements.
Counterparty | | Paying Return of Reference Entity | | Rate Received by Fund | | Expiration
Date | | Notional
Amount (1) | | Unrealized
Appreciation /
(Depreciation) | |
JPM | | Bankia SA | | 3-Month Euribor -0.40% | | 11/17/2015 | | EUR | (57 | ) | $ | 8 | |
JPM | | Bankia SA | | 3-Month Euribor -0.40% | | 11/17/2015 | | EUR | (23 | ) | 3 | |
JPM | | Bankia SA | | 3-Month Euribor -0.40% | | 11/17/2015 | | EUR | (18 | ) | 2 | |
JPM | | Bankia SA | | 3-Month Euribor -0.40% | | 11/17/2015 | | EUR | (199 | ) | 21 | |
JPM | | Bankia SA | | 3-Month Euribor -0.40% | | 11/17/2015 | | EUR | (197 | ) | 2 | |
JPM | | Bankia SA | | 3-Month Euribor -0.40% | | 11/17/2015 | | EUR | (45 | ) | — | |
JPM | | Bankia SA | | 3-Month Euribor -0.40% | | 11/17/2015 | | EUR | (34 | ) | — | |
JPM | | Bankia SA | | 3-Month Euribor -0.50% | | 12/22/2015 | | EUR | (123 | ) | 1 | |
JPM | | Bankia SA | | 3-Month Euribor -0.50% | | 12/22/2015 | | EUR | (64 | ) | 2 | |
JPM | | Caterpillar Inc. | | 1-Month LIBOR -0.35% | | 09/23/2015 | | | (58 | ) | 7 | |
JPM | | Financial Select Sector SPDR | | 1-Month LIBOR +0.16% | | 10/28/2015 | | | (61 | ) | — | |
JPM | | Telecom Italia SpA | | 3-Month Euribor -0.20% | | 11/13/2015 | | EUR | (950 | ) | (36 | ) |
JPM | | Telecom Italia SpA | | 3-Month Euribor -0.30% | | 11/12/2015 | | EUR | (163 | ) | 6 | |
JPM | | Volkswagen AG | | 3-Month Euribor -0.10% | | 04/09/2015 | | EUR | (64 | ) | 6 | |
JPM | | Volkswagen AG | | 3-Month Euribor -0.10% | | 04/09/2015 | | EUR | (479 | ) | 22 | |
JPM | | Volkswagen AG | | 3-Month Euribor -0.10% | | 04/09/2015 | | EUR | (1,144 | ) | 47 | |
JPM | | Volkswagen AG | | 3-Month Euribor -0.10% | | 04/09/2015 | | EUR | (1,065 | ) | 45 | |
| | | | | | | | | | | $ | 423 | |
(1)Notional amount is stated in USD unless otherwise noted.
(2)If the Fund is a buyer of protection and a credit event occurs, as defined under the terms of that particular swap agreement, the Fund will either (i) receive from the seller of protection an amount equal to the notional amount of the referenced obligation agreement and deliver the referenced obligation, other deliverable obligations or underlying securities comprising the referenced index or (ii) receive a net settlement amount in the form of cash or securities equal to the notional amount of the swap agreement less the recovery value of the referenced obligation or underlying securities comprising the referenced index.
(3)If the Fund is a seller of protection and a credit event occurs, as defined under the terms of that particular swap agreement, the Fund will either (i) pay the buyer of protection an amount equal to the notional amount of the referenced obligation and take delivery of the referenced obligation, other deliverable obligations or underlying securities comprising the referenced index or (ii) pay a net settlement amount in the form of cash or securities equal to the notional amount of the swap agreement less the recovery value of the reference obligation or underlying securities comprising the referenced index.
(4)Implied credit spreads, represented in absolute terms, utilized in determining the value of credit default swap agreements on corporate issues and sovereign issues serve as an indicator of the current status of the payment/performance risk and represent the likelihood or risk of default for the credit derivative. The implied credit spread of a particular referenced entity reflects the cost of buying/selling protection and may include upfront payments required to be made to enter into the agreement. Wider credit spreads represent a deterioration of the referenced entity’s credit soundness and a greater likelihood or risk of default or other credit event occurring as defined under the terms of the applicable agreement.
(5)The prices and resulting values for credit default swap agreements on credit indices serve as an indicator of the current status of the payment/performance risk and represent the likelihood or risk of default for the credit derivative. Increasing market values, in absolute terms when compared to the notional amount of the swap, represent a deterioration of the referenced entity’s credit soundness and a greater likelihood or risk of default or other credit event occurring as defined under the terms of the agreement.
(6)The maximum potential amount the Fund could be required to pay as a seller of credit protection or receive as a buyer of credit protection if a credit event occurs is limited to the total notional amount which is defined under the terms of each swap agreement.
(7)If the Fund is a buyer of protection, the Fund pays the fixed rate. If the Fund is a seller of protection, the Fund receives the fixed rate.
See accompanying Notes to Financial Statements.
Curian/CenterSquare International Real Estate Securities Fund
| | Shares/Par † | | Value | |
COMMON STOCKS - 98.6% | | | | | |
| | | | | |
AUSTRALIA - 12.7% | | | | | |
Dexus Property Group | | 36 | | $ | 206 | |
Federation Centres Ltd. | | 168 | | 391 | |
Goodman Group | | 34 | | 159 | |
ING Office Fund | | 29 | | 87 | |
Mirvac Group | | 296 | | 429 | |
Scentre Group (a) | | 208 | | 589 | |
Stockland | | 70 | | 233 | |
Westfield Corp. | | 59 | | 429 | |
| | | | 2,523 | |
CANADA - 5.8% | | | | | |
Allied Properties REIT | | 6 | | 180 | |
Boardwalk REIT | | 2 | | 129 | |
Calloway REIT | | 8 | | 183 | |
Chartwell Retirement Residences | | 7 | | 70 | |
Dream Office REIT | | 18 | | 395 | |
RioCan REIT | | 9 | | 196 | |
| | | | 1,153 | |
FINLAND - 1.8% | | | | | |
Citycon Oyj | | 62 | | 191 | |
Sponda Oyj | | 39 | | 169 | |
| | | | 360 | |
FRANCE - 7.4% | | | | | |
ICADE | | 4 | | 286 | |
Klepierre | | 10 | | 426 | |
Mercialys SA | | 5 | | 111 | |
Unibail-Rodamco SE | | 3 | | 651 | |
| | | | 1,474 | |
GERMANY - 4.8% | | | | | |
Alstria Office REIT AG | | 18 | | 223 | |
Deutsche Annington Immobilien SE | | 7 | | 238 | |
Deutsche Wohnen AG | | 16 | | 386 | |
LEG Immobilien AG | | 2 | | 118 | |
| | | | 965 | |
HONG KONG - 15.9% | | | | | |
Fortune REIT | | 283 | | 286 | |
Henderson Land Development Co. Ltd. | | 15 | | 104 | |
Hongkong Land Holdings Ltd. | | 64 | | 431 | |
Kerry Properties Ltd. | | 57 | | 206 | |
Link Real Estate Investment Trust | | 47 | | 294 | |
New World Development Co. Ltd. | | 294 | | 338 | |
Sun Hung Kai Properties Ltd. | | 63 | | 954 | |
Wharf Holdings Ltd. | | 76 | | 546 | |
| | | | 3,159 | |
JAPAN - 24.4% | | | | | |
Advance Residence Investment Corp. | | — | | 83 | |
Industrial & Infrastructure Fund Investment Corp. | | — | | 37 | |
Japan Excellent Inc. | | — | | 215 | |
Japan Hotel REIT Investment Corp. | | — | | 167 | |
Japan Logistics Fund Inc. | | — | | 148 | |
Kenedix Realty Investment Corp. | | — | | 379 | |
Kenedix Residential Investment Corp. | | — | | 120 | |
Mitsubishi Estate Co. Ltd. | | 32 | | 674 | |
Mitsui Fudosan Co. Ltd. | | 44 | | 1,188 | |
Mori Hills REIT Investment Corp. | | — | | 42 | |
Nippon Building Fund Inc. | | — | | 472 | |
Nippon Prologis REIT Inc. | | — | | 189 | |
Nomura Real Estate Office Fund Inc. | | — | | 45 | |
Orix JREIT Inc. | | — | | 256 | |
Sumitomo Realty & Development Co. Ltd. | | 19 | | 647 | |
Tokyo Tatemono Co. Ltd. | | 26 | | 189 | |
Top REIT Inc. | | — | | 9 | |
| | | | 4,860 | |
LUXEMBOURG - 1.2% | | | | | |
GAGFAH SA (a) | | 11 | | 247 | |
| | | | | |
NETHERLANDS - 1.1% | | | | | |
Corio NV | | 4 | | 212 | |
| | | | | |
NORWAY - 0.3% | | | | | |
Norwegian Property ASA (a) | | 51 | | 69 | |
| | | | | |
SINGAPORE - 6.8% | | | | | |
Ascendas REIT | | 55 | | 99 | |
CapitaCommercial Trust | | 62 | | 82 | |
CapitaLand Ltd. | | 93 | | 231 | |
CDL Hospitality Trusts | | 64 | | 84 | |
Global Logistic Properties Ltd. | | 210 | | 391 | |
K-Reit Asia | | 180 | | 165 | |
Keppel DC REIT (a) | �� | 187 | | 138 | |
Keppel Land Ltd. | | 30 | | 77 | |
Mapletree Greater China Commercial Trust | | 107 | | 77 | |
| | | | 1,344 | |
SWEDEN - 2.9% | | | | | |
Hemfosa Fastigheter AB (a) | | 3 | | 67 | |
Kungsleden AB | | 26 | | 189 | |
Wihlborgs Fastigheter AB | | 18 | | 326 | |
| | | | 582 | |
UNITED KINGDOM - 13.5% | | | | | |
British Land Co. Plc | | 26 | | 320 | |
Capital & Counties Properties Plc | | 46 | | 257 | |
Great Portland Estates Plc | | 24 | | 272 | |
Hammerson Plc | | 23 | | 218 | |
Land Securities Group Plc | | 49 | | 874 | |
Londonmetric Property Plc | | 83 | | 197 | |
Safestore Holdings Plc | | 35 | | 128 | |
Tritax Big Box REIT Plc | | 72 | | 121 | |
Unite Group Plc | | 42 | | 303 | |
| | | | 2,690 | |
Total Common Stocks (cost $20,230) | | | | 19,638 | |
| | | | | |
WARRANTS - 0.0% | | | | | |
Sun Hung Kai Properties Ltd. (a) | | 3 | | 7 | |
Total Warrants (cost $0) | | | | 7 | |
| | | | | |
SHORT TERM INVESTMENTS - 0.1% | | | | | |
| | | | | |
Investment Company - 0.1% | | | | | |
JNL Money Market Fund, 0.01% (b) (c) | | 15 | | 15 | |
Total Short Term Investments (cost $15) | | | | 15 | |
| | | | | |
Total Investments - 98.7% (cost $20,245) | | | | 19,660 | |
Other Assets and Liabilities, Net - 1.3% | | | | 262 | |
Total Net Assets - 100.0% | | | | $ | 19,922 | |
(a) | Non-income producing security. |
(b) | Investment in affiliate. |
(c) | Yield changes daily to reflect current market conditions. Rate was the quoted yield as of December 31, 2014. |
See accompanying Notes to Financial Statements.
Curian/DFA U.S. Micro Cap Fund *
| | Shares/Par † | | Value | |
COMMON STOCKS - 100.1% | | | | | |
| | | | | |
CONSUMER DISCRETIONARY - 16.0% | | | | | |
Asbury Automotive Group Inc. (a) | | 3 | | $ | 216 | |
Brown Shoe Co. Inc. | | 11 | | 357 | |
Cato Corp. - Class A | | 5 | | 229 | |
Churchill Downs Inc. | | 3 | | 322 | |
Core-Mark Holding Co. Inc. | | 4 | | 253 | |
Krispy Kreme Doughnuts Inc. (a) | | 11 | | 218 | |
Matthews International Corp. - Class A | | 5 | | 262 | |
Popeyes Louisiana Kitchen Inc. (a) | | 4 | | 235 | |
Rent-A-Center Inc. | | 7 | | 269 | |
Sonic Corp. | | 8 | | 222 | |
Other Securities | | | | 12,328 | |
| | | | 14,911 | |
CONSUMER STAPLES - 3.5% | | | | | |
Cal-Maine Foods Inc. (b) | | 8 | | 301 | |
Pantry Inc. (a) | | 6 | | 220 | |
Other Securities | | | | 2,718 | |
| | | | 3,239 | |
| | | | | |
ENERGY - 3.5% | | | | | |
Other Securities | | | | 3,208 | |
| | | | | |
FINANCIALS - 19.0% | | | | | |
BancFirst Corp. | | 3 | | 221 | |
HFF Inc. - Class A | | 7 | | 256 | |
Park National Corp. (b) | | 3 | | 231 | |
Pinnacle Financial Partners Inc. | | 6 | | 233 | |
South State Corp. (b) | | 3 | | 216 | |
Other Securities | | | | 16,570 | |
| | | | 17,727 | |
| | | | | |
HEALTH CARE - 10.5% | | | | | |
Amedisys Inc. (a) | | 8 | | 238 | |
Auxilium Pharmaceuticals Inc. (a) (b) | | 12 | | 417 | |
Cantel Medical Corp. | | 7 | | 290 | |
Natus Medical Inc. (a) | | 6 | | 216 | |
Tornier BV (a) | | 11 | | 291 | |
Wright Medical Group Inc. (a) | | 12 | | 311 | |
Other Securities | | | | 8,048 | |
| | | | 9,811 | |
INDUSTRIALS - 18.7% | | | | | |
AAON Inc. | | 10 | | 233 | |
Korn/Ferry International (a) | | 8 | | 218 | |
Matson Inc. | | 8 | | 277 | |
Meritor Inc. (a) | | 14 | | 216 | |
Saia Inc. (a) | | 5 | | 275 | |
Tennant Co. | | 3 | | 224 | |
Other Securities | | | | 16,018 | |
| | | | 17,461 | |
INFORMATION TECHNOLOGY - 19.3% | | | | | |
Cirrus Logic Inc. (a) | | 9 | | 214 | |
comScore Inc. (a) | | 7 | | 337 | |
Constant Contact Inc. (a) | | 8 | | 282 | |
Cray Inc. (a) | | 11 | | 373 | |
Ellie Mae Inc. (a) (b) | | 6 | | 253 | |
Infinera Corp. (a) (b) | | 21 | | 303 | |
Methode Electronics Inc. | | 7 | | 238 | |
Monolithic Power Systems Inc. | | 9 | | 442 | |
NetScout Systems Inc. (a) | | 7 | | 253 | |
Omnivision Technologies Inc. (a) | | 11 | | 275 | |
Rambus Inc. (a) | | 24 | | 262 | |
Rogers Corp. (a) | | 3 | | 213 | |
Spansion Inc. - Class A (a) | | 9 | | 317 | |
Tessera Technologies Inc. | | 12 | | 428 | |
TriQuint Semiconductor Inc. (a) | | 39 | | 1,062 | |
Other Securities | | | | 12,746 | |
| | | | 17,998 | |
MATERIALS - 5.6% | | | | | |
A. Schulman Inc. | | 5 | | 217 | |
Century Aluminum Co. (a) | | 11 | | 262 | |
Other Securities | | | | 4,736 | |
| | | | 5,215 | |
TELECOMMUNICATION SERVICES - 1.8% | | | | | |
Consolidated Communications Holdings Inc. (b) | | 10 | | 276 | |
Other Securities | | | | 1,429 | |
| | | | 1,705 | |
UTILITIES - 2.2% | | | | | |
American States Water Co. | | 7 | | 249 | |
Northwest Natural Gas Co. (b) | | 5 | | 230 | |
Other Securities | | | | 1,547 | |
| | | | 2,026 | |
Total Common Stocks (cost $75,514) | | | | 93,301 | |
| | | | | |
RIGHTS - 0.0% | | | | | |
Other Securities | | | | — | |
Total Rights (cost $0) | | | | — | |
| | | | | |
WARRANTS - 0.0% | | | | | |
Other Securities | | | | — | |
Total Warrants (cost $0) | | | | — | |
| | | | | |
SHORT TERM INVESTMENTS - 11.8% | | | | | |
| | | | | |
Investment Company - 0.0% | | | | | |
JNL Money Market Fund, 0.01% (f) (g) | | 32 | | 32 | |
| | | | | |
Securities Lending Collateral - 11.8% | | | | | |
BlackRock Liquidity Funds TempFund Portfolio, 0.07% (g) | | 3,000 | | 3,000 | |
Fidelity Institutional Money Market Portfolio, 0.09% (g) | | 4,000 | | 4,000 | |
Repurchase Agreement with CSI, 0.07% (Collateralized by $4,059 U.S. Treasury Bond Strip, due 11/15/37-11/15/39, value $2,040) acquired on 12/31/14, due 01/02/15 at $2,000 | | $ | 2,000 | | 2,000 | |
Repurchase Agreement with MLP, 0.06% (Collateralized by $663 U.S. Treasury Bond, 6.25%, due 05/15/30, value $994 and $1,096 U.S. Treasury Note, 0.13%, due 07/15/24, value $1,052) acquired on 12/31/14, due 01/02/15 at $2,007 | | 2,007 | | 2,007 | |
| | | | 11,007 | |
Total Short Term Investments (cost $11,039) | | | | 11,039 | |
| | | | | |
Total Investments - 111.9% (cost $86,553) | | | | 104,340 | |
Other Assets and Liabilities, Net - (11.9%) | | | | (11,125 | ) |
Total Net Assets - 100.0% | | | | $ | 93,215 | |
| | | | | | | |
(a) | Non-income producing security. |
(b) | All or portion of the security was on loan. |
(c) | Security fair valued in good faith in accordance with the procedures approved by the Trust’s Board of Trustees. Good faith fair valued securities may be classified as Level 2 or Level 3 for FASB ASC Topic 820 “Fair Value Measurement” based on the applicable valuation inputs. See FASB ASC Topic 820 “Fair Value Measurement” in the Notes to Financial Statements. |
See accompanying Notes to Financial Statements.
(d) | Security is restricted to resale to institutional investors. See Restricted Securities in these Schedules of Investments. |
(e) | The Sub-Adviser has deemed this security to be illiquid based on procedures approved by the Trust’s Board of Trustees. |
(f) | Investment in affiliate. |
(g) | Yield changes daily to reflect current market conditions. Rate was the quoted yield as of December 31, 2014. |
Restricted Securities - The Fund invests in securities that are restricted under the 1933 Act or which are subject to legal, contractual, or other agreed upon restrictions on resale. Restricted securities are often purchased in private placement transactions and cannot be sold without prior registration unless the sale is pursuant to an exemption under the 1933 Act, as amended. As of December 31, 2014, the Fund held investments in restricted securities, excluding certain securities exempt from registration under the 1933 Act which are deemed to be liquid, as follows:
| | Initial
Acquisition
Date | | Cost | | Ending
Value | | Percent of
Net Assets | |
Magnum Hunter Resources Corp. | | 09/12/2012 | | $ | — | | $ | — | | — | % |
Transcept Pharmaceuticals, Inc. | | 10/24/2014 | | — | | — | | — | |
| | | | $ | — | | $ | — | | — | % |
See accompanying Notes to Financial Statements.
Curian/DoubleLine Total Return Fund
| | Shares/Par † | | Value | |
NON-U.S. GOVERNMENT AGENCY ASSET-BACKED SECURITIES - 37.4% | | | | | |
Anchorage Capital CLO 3 Ltd., 2.48%, 04/28/26 (a) (b) | | $ | 1,500 | | $ | 1,457 | |
Apidos CDO, 1.68%, 01/19/25 (a) (b) | | 845 | | 839 | |
ARES CLO Ltd., 2.23%, 04/17/26 (a) (b) | | 500 | | 484 | |
Ares IIIR/IVR CLO Ltd., 0.45%, 04/16/21 (a) (b) | | 794 | | 783 | |
Avery Point CLO Ltd. | | | | | |
3.68%, 07/17/25 (a) (b) | | 500 | | 468 | |
2.33%, 04/25/26 (a) (b) | | 500 | | 487 | |
3.33%, 04/25/26 (a) (b) | | 500 | | 488 | |
3.73%, 04/25/26 (a) (b) | | 500 | | 467 | |
Avery Point III CLO Ltd., 1.63%, 01/18/25 (a) (b) | | 500 | | 493 | |
Babson CLO Ltd. | | | | | |
1.33%, 04/20/25 (a) (b) | | 1,000 | | 980 | |
3.23%, 01/15/26 (a) (b) | | 1,000 | | 971 | |
Baker Street Funding CLO Ltd., 0.69%, 12/15/18 (a) (b) | | 500 | | 490 | |
Ballyrock CLO LLC | | | | | |
3.43%, 10/20/26 (a) (b) | | 500 | | 484 | |
3.98%, 10/20/26 (a) (b) | | 500 | | 472 | |
Banc of America Re-Remic Trust REMIC, 2.72%, 06/15/18 (a) (b) | | 2,000 | | 1,963 | |
Bear Stearns Asset Backed Securities I Trust REMIC, 6.00%, 03/25/36 | | 5,616 | | 5,000 | |
Bear Stearns Commercial Mortgage Securities Trust REMIC | | | | | |
5.90%, 09/11/17 (a) | | 4,400 | | 4,469 | |
5.61%, 08/11/16 (a) | | 2,000 | | 2,052 | |
Birchwood Park CLO Ltd. REMIC, 3.38%, 07/15/26 (a) (b) | | 250 | | 245 | |
Black Diamond CLO Delaware Corp., 0.52%, 06/20/17 (a) (b) | | 296 | | 295 | |
BlackRock Senior Income Series IV, 0.47%, 04/20/19 (a) (b) | | 448 | | 444 | |
Carlyle Global Market Strategies Ltd., 1.75%, 04/17/25 (a) (b) | | 1,000 | | 996 | |
Carlyle High Yield Partners VIII Ltd., 0.61%, 05/21/21 (a) (b) | | 500 | | 481 | |
Catamaran CLO Ltd. | | | | | |
2.03%, 04/20/26 (a) (b) | | 500 | | 478 | |
2.88%, 04/20/26 (a) (b) | | 500 | | 470 | |
Cent CLO 19 Ltd., 1.56%, 10/29/25 (a) (b) | | 500 | | 492 | |
Cent CLO 22 Ltd., 3.43%, 11/07/26 (a) (b) | | 1,000 | | 970 | |
Cent CLO LP, 3.23%, 01/25/26 (a) (b) | | 1,000 | | 961 | |
CGBAM Commercial Mortgage Trust REMIC, 2.16%, 02/15/19 (a) (b) | | 1,600 | | 1,593 | |
CHL Mortgage Pass-Through Trust REMIC | | | | | |
6.00%, 02/25/37 | | 8,035 | | 7,480 | |
5.44%, 01/25/38 | | 7,220 | | 6,309 | |
Citigroup Commercial Mortgage Trust REMIC, 3.64%, 09/10/24 | | 1,766 | | 1,837 | |
Citigroup Mortgage Loan Trust REMIC, 6.15%, 05/25/37 (a) (b) | | 8,089 | | 7,629 | |
Citigroup/Deutsche Bank Commercial Mortgage Trust REMIC, 5.37%, 12/11/49 (a) | | 3,400 | | 3,527 | |
CitiMortgage Alternative Loan Trust REMIC | | | | | |
6.00%, 09/25/36 | | 4,532 | | 3,974 | |
6.00%, 05/25/37 | | 4,024 | | 3,511 | |
COMM Mortgage Trust Interest Only REMIC, 1.21%, 05/10/47 (a) | | 38,751 | | 2,909 | |
Commercial Mortgage Pass-Through Certificates REMIC | | | | | |
4.72%, 08/10/24 (a) | | 1,500 | | 1,571 | |
4.41%, 07/13/16 (a) (b) | | 4,794 | | 4,770 | |
Commercial Mortgage Trust REMIC | | | | | |
3.82%, 05/10/24 | | 1,766 | | 1,872 | |
3.59%, 10/10/24 | | 1,766 | | 1,837 | |
5.82%, 07/10/16 (a) | | 2,000 | | 2,052 | |
Credit Suisse Commercial Mortgage Trust REMIC, 5.90%, 07/15/17 (a) | | 4,500 | | 4,870 | |
Credit Suisse First Boston Mortgage Securities Corp. REMIC | | | | | |
6.00%, 10/25/35 | | 8,845 | | 6,539 | |
6.00%, 12/25/35 | | 13,387 | | 11,598 | |
Credit Suisse Mortgage Capital Certificates REMIC, 6.00%, 03/25/36 | | 10,170 | | 9,154 | |
CSMC Trust REMIC, 2.64%, 11/27/37 (a) (b) | | 15,500 | | 14,244 | |
Dryden XI-Leveraged Loan CDO, 1.83%, 04/12/20 (a) (b) | | 1,000 | | 966 | |
Dryden XXIV Senior Loan Fund, 4.98%, 11/15/23 (a) (b) | | 250 | | 253 | |
Dryden XXV Senior Loan Fund, 4.23%, 01/15/25 (a) (b) | | 500 | | 485 | |
Eaton Vance CDO IX Ltd., 0.46%, 04/20/19 (a) (b) | | 51 | | 51 | |
Eaton Vance CDO VIII Ltd., 0.88%, 08/15/22 (a) (b) | | 250 | | 241 | |
First Horizon Alternative Mortgage Securities Trust REMIC, 6.00%, 05/25/36 | | 8,838 | | 7,629 | |
Franklin CLO V Ltd., 0.50%, 06/15/18 (a) (b) | | 725 | | 720 | |
Galaxy CLO Ltd., 0.64%, 06/13/18 (a) | | 915 | | 911 | |
GMACM Mortgage Loan Trust REMIC, 5.75%, 07/25/35 | | 5,103 | | 4,772 | |
Goldentree Loan Opportunities VI Ltd., 4.43%, 04/17/22 (a) (b) | | 250 | | 248 | |
Greenwich Capital Commercial Funding Corp. REMIC | | | | | |
6.05%, 09/10/17 (a) | | 4,000 | | 4,186 | |
5.48%, 02/10/17 | | 3,550 | | 3,721 | |
GS Mortgage Securities Trust REMIC | | | | | |
5.52%, 02/10/16 (a) | | 1,525 | | 1,567 | |
3.63%, 11/13/24 | | 1,500 | | 1,561 | |
Halcyon Loan Advisors Funding Ltd. | | | | | |
3.23%, 08/15/23 (a) (b) | | 500 | | 486 | |
3.10%, 12/20/24 (a) (b) | | 1,430 | | 1,362 | |
2.93%, 08/01/25 (a) (b) | | 250 | | 236 | |
4.03%, 08/01/25 (a) (b) | | 1,000 | | 951 | |
1.79%, 04/18/26 (a) (b) | | 1,000 | | 995 | |
IndyMac INDA Mortgage Loan Trust REMIC, 2.58%, 09/25/36 (a) | | 10,114 | | 8,614 | |
ING IM CLO Ltd. | | | | | |
5.23%, 04/15/24 (a) (b) | | 250 | | 224 | |
1.68%, 01/18/26 (a) (b) | | 1,000 | | 991 | |
ING Investment Management CLO II Ltd., 1.83%, 08/01/20 (a) | | 1,000 | | 945 | |
ING Investment Management Co. | | | | | |
2.09%, 03/14/22 (a) (b) | | 500 | | 498 | |
2.99%, 03/14/22 (a) (b) | | 500 | | 498 | |
Jamestown CLO Ltd., 1.73%, 07/15/26 (a) (b) | | 500 | | 496 | |
JPMBB Commercial Mortgage Securities Trust REMIC | | | | | |
4.66%, 07/15/24 (a) | | 2,000 | | 2,086 | |
3.49%, 12/15/24 | | 950 | | 974 | |
JPMorgan Chase Commercial Mortgage Securities Trust REMIC | | | | | |
5.37%, 05/15/47 | | 2,471 | | 2,563 | |
5.70%, 02/12/49 (a) | | 2,000 | | 2,112 | |
6.07%, 02/12/51 (a) | | 1,245 | | 1,311 | |
JPMorgan Mortgage Acquisition Trust REMIC, 0.28%, 05/25/37 (a) | | 4,859 | | 4,725 | |
| | | | | | | |
See accompanying Notes to Financial Statements.
| | Shares/Par † | | Value | |
JPMorgan Resecuritization Trust REMIC, 6.41%, 03/26/37 (a) (b) | | 6,112 | | 4,732 | |
KKR Financial CLO Corp., 0.58%, 05/15/21 (a) (b) | | 375 | | 372 | |
Landmark VI CDO Ltd., 4.98%, 01/14/18 (a) | | 500 | | 500 | |
Landmark VII CDO Ltd., 0.68%, 07/15/18 (a) (b) | | 500 | | 499 | |
Lavender Trust REMIC, 6.25%, 10/26/36 (b) | | 2,645 | | 2,811 | |
LB-UBS Commercial Mortgage Trust REMIC | | | | | |
5.48%, 02/15/40 | | 2,000 | | 2,080 | |
5.49%, 02/15/40 (a) | | 3,000 | | 3,163 | |
LCM LP | | | | | |
1.76%, 07/15/26 (a) (b) | | 1,000 | | 995 | |
3.86%, 07/15/26 (a) (b) | | 500 | | 471 | |
LCM VI Ltd., 1.04%, 05/28/19 (a) (b) | | 1,000 | | 971 | |
LCM X LP | | | | | |
2.13%, 04/15/22 (a) (b) | | 500 | | 498 | |
3.08%, 04/15/22 (a) (b) | | 500 | | 494 | |
LCM XI LP | | | | | |
2.38%, 04/19/22 (a) (b) | | 500 | | 491 | |
4.18%, 04/19/22 (a) (b) | | 250 | | 243 | |
LCM XII LP, 1.70%, 10/19/22 (a) (b) | | 1,000 | | 998 | |
LCM XIV LP, 3.73%, 07/15/25 (a) (b) | | 500 | | 470 | |
LCM XV LP, 3.33%, 08/25/24 (a) (b) | | 1,000 | | 979 | |
Lehman Mortgage Trust REMIC, 5.50%, 11/25/35 | | 3,060 | | 2,887 | |
Madison Park Funding IV Ltd., 1.68%, 03/22/21 (a) (b) | | 500 | | 476 | |
Madison Park Funding Ltd. | | | | | |
3.83%, 08/15/22 (a) | | 250 | | 253 | |
3.33%, 07/20/26 (a) (b) | | 500 | | 489 | |
Madison Park Funding XV Ltd., 3.94%, 01/27/26 (a) (b) | | 500 | | 479 | |
Morgan Stanley Bank of America Merrill Lynch Trust REMIC | | | | | |
4.83%, 02/15/24 (a) (b) | | 2,000 | | 1,926 | |
4.49%, 09/15/24 (a) | | 1,500 | | 1,506 | |
3.53%, 11/15/24 | | 2,000 | | 2,073 | |
4.00%, 12/15/24 (a) | | 2,000 | | 1,927 | |
Morgan Stanley Capital I Trust REMIC, 3.69%, 08/11/21 (a) (b) | | 2,000 | | 2,024 | |
Morgan Stanley Mortgage Loan Trust REMIC | | | | | |
5.75%, 04/25/37 (a) | | 2,073 | | 1,619 | |
6.00%, 08/25/37 | | 3,928 | | 3,730 | |
Nautique Funding Ltd., 1.93%, 04/15/20 (a) (b) | | 500 | | 480 | |
Nomura Asset Acceptance Corp. Alternative Loan Trust REMIC, 2.60%, 02/25/36 (a) | | 2,850 | | 2,452 | |
North End CLO Ltd. | | | | | |
2.98%, 07/17/25 (a) (b) | | 1,000 | | 948 | |
3.73%, 07/17/25 (a) (b) | | 500 | | 466 | |
NYLIM Flatiron CLO Ltd., 0.47%, 08/08/20 (a) (b) | | 260 | | 259 | |
Oaktree CLO, 3.98%, 02/13/25 (a) (b) | | 250 | | 236 | |
Octagon Investment Partners XX Ltd., 1.68%, 08/12/26 (b) | | 1,500 | | 1,485 | |
Octagon Investment Partners XXI Ltd. | | | | | |
3.43%, 11/14/26 (a) (b) | | 1,000 | | 981 | |
3.88%, 11/14/26 (a) (b) | | 1,000 | | 942 | |
Octagon Investment Partners XXII Ltd., 4.87%, 11/22/25 (a) (b) | | 1,000 | | 1,000 | |
OZLM Funding V Ltd., 1.73%, 01/17/26 (a) (b) | | 1,000 | | 991 | |
Pinnacle Park CLO Ltd., 3.33%, 04/15/26 (a) (b) | | 1,500 | | 1,469 | |
PR Mortgage Loan Trust REMIC, 5.93%, 09/25/47 (a) (b) | | 14,556 | | 14,842 | |
Race Point IV CLO Ltd. | | | | | |
0.98%, 08/01/21 (a) (b) | | 500 | | 486 | |
2.23%, 08/01/21 (a) (b) | | 500 | | 488 | |
RALI Trust REMIC | | | | | |
3.41%, 09/25/35 (a) | | 5,829 | | 4,710 | |
3.76%, 01/25/36 (a) | | 10,957 | | 8,760 | |
6.00%, 05/25/36 | | 8,698 | | 7,295 | |
RBSGC Mortgage Loan Trust REMIC | | | | | |
0.62%, 01/25/37 (a) | | 10,249 | | 7,106 | |
6.75%, 01/25/37 | | 14,694 | | 13,603 | |
Interest Only, 5.88%, 01/25/37 (a) | | 10,249 | | 2,057 | |
Regatta V Funding Ltd., 1.79%, 10/25/26 (a) (b) | | 1,000 | | 995 | |
Residential Accredit Loans Inc. Trust REMIC, 6.00%, 04/25/36 | | 6,862 | | 5,680 | |
Residential Asset Securitization Trust REMIC | | | | | |
6.00%, 07/25/36 | | 7,433 | | 6,565 | |
0.62%, 04/25/37 (a) | | 10,611 | | 5,958 | |
45.08%, 04/25/37 (a) | | 1,384 | | 3,012 | |
Residential Funding Mortgage Securities Inc. Trust REMIC | | | | | |
6.00%, 07/25/36 | | 1,324 | | 1,206 | |
6.00%, 11/25/36 | | 7,615 | | 6,930 | |
6.00%, 02/25/37 | | 2,853 | | 2,557 | |
6.00%, 04/25/37 | | 5,978 | | 5,273 | |
6.00%, 07/25/37 | | 5,639 | | 5,106 | |
RFMSI Trust REMIC, 5.50%, 05/25/35 | | 8,376 | | 8,576 | |
Slater Mill Loan Fund LP, 2.88%, 08/17/22 (a) (b) | | 500 | | 500 | |
Sound Harbor Loan Fund Ltd., 1.73%, 10/30/26 (a) (b) | | 1,000 | | 990 | |
Springleaf Mortgage Loan Trust REMIC | | | | | |
6.00%, 06/25/58 (a) (b) | | 10,000 | | 10,493 | |
6.00%, 12/25/65 (a) (b) | | 10,000 | | 10,214 | |
STARM Mortgage Loan Trust REMIC, 2.82%, 04/25/37 (a) | | 3,561 | | 2,760 | |
Steele Creek CLO Ltd., 1.83%, 08/21/26 (a) (b) | | 250 | | 249 | |
Structured Adjustable Rate Mortgage Loan Trust REMIC, 2.42%, 11/25/35 (a) | | 18,390 | | 16,475 | |
Thacher Park CLO, 3.76%, 10/20/26 (a) (b) | | 1,000 | | 937 | |
TimberStar Trust 1, 6.21%, 10/15/36 (b) | | 1,375 | | 1,429 | |
Venture CDO Ltd., 1.73%, 04/15/26 (a) (b) | | 500 | | 497 | |
Venture XIV CLO Ltd. | | | | | |
2.09%, 08/28/25 (a) (b) | | 500 | | 480 | |
3.99%, 08/28/25 (a) (b) | | 500 | | 474 | |
Venture XVII CLO Ltd. | | | | | |
1.71%, 07/15/26 (a) (b) | | 500 | | 496 | |
2.33%, 07/15/26 (a) (b) | | 500 | | 487 | |
Voya CLO Ltd., 1.73%, 10/14/26 (a) (b) | | 1,000 | | 995 | |
Wachovia Bank Commercial Mortgage Trust REMIC | | | | | |
5.94%, 02/15/51 (a) | | 5,000 | | 5,240 | |
5.38%, 12/15/43 | | 2,000 | | 2,122 | |
Washington Mill CLO Ltd. | | | | | |
2.28%, 04/20/26 (a) (b) | | 500 | | 479 | |
3.23%, 04/20/26 (a) (b) | | 500 | | 480 | |
Washington Mutual Mortgage Pass-Through Certificates WMALT Trust REMIC | | | | | |
6.00%, 07/25/36 (a) | | 7,123 | | 5,891 | |
6.00%, 07/25/36 | | 3,989 | | 3,299 | |
5.50%, 04/25/37 | | 6,003 | | 5,494 | |
Wells Fargo Alternative Loan Trust REMIC | | | | | |
6.00%, 07/25/37 | | 9,677 | | 9,076 | |
6.25%, 11/25/37 | | 3,135 | | 2,982 | |
Wells Fargo Mortgage Backed Securities REMIC | | | | | |
3.41%, 12/15/24 | | 1,138 | | 1,165 | |
3.96%, 12/15/24 | | 1,761 | | 1,805 | |
Wells Fargo Mortgage Backed Securities Trust REMIC | | | | | |
5.50%, 03/25/36 | | 5,786 | | 5,992 | |
6.00%, 04/25/37 | | 4,292 | | 4,258 | |
See accompanying Notes to Financial Statements.
| | Shares/Par † | | Value | |
6.00%, 06/25/37 | | 9,562 | | 9,677 | |
WF-RBS Commercial Mortgage Trust REMIC | | | | | |
Interest Only, 1.32%, 03/15/47 (a) | | 23,739 | | 1,848 | |
Interest Only, 0.96%, 11/15/47 (a) | | 29,475 | | 2,003 | |
WG Horizons CLO I, 1.94%, 05/24/19 (a) (b) | | 1,000 | | 964 | |
Total Non-U.S. Government Agency Asset-Backed Securities (cost $453,972) | | | | 456,654 | |
| | | | | |
GOVERNMENT AND AGENCY OBLIGATIONS - 56.4% | | | | | |
| | | | | |
GOVERNMENT SECURITIES - 4.9% | | | | | |
| | | | | |
U.S. Treasury Securities - 4.9% | | | | | |
U.S. Treasury Note, 0.38%, 08/31/15 | | 60,000 | | 60,075 | |
| | | | | |
U.S. GOVERNMENT AGENCY MORTGAGE-BACKED SECURITIES - 51.5% | | | | | |
| | | | | |
Federal Home Loan Mortgage Corp. - 27.4% | | | | | |
Federal Home Loan Mortgage Corp. | | | | | |
3.00%, 06/01/43 - 10/01/43 | | 114,165 | | 115,428 | |
4.00%, 09/01/43 - 02/01/44 | | 21,750 | | 23,373 | |
REMIC, 3.00%, 02/15/32 - 03/15/41 | | 167,947 | | 171,735 | |
REMIC, 3.50%, 09/15/33 | | 5,000 | | 5,222 | |
REMIC, 4.50%, 01/15/40 | | 1,413 | | 1,474 | |
REMIC, 6.79%, 06/15/42 (a) | | 2,202 | | 1,994 | |
REMIC, 5.21%, 01/15/43 (a) | | 5,045 | | 4,123 | |
REMIC, 4.00%, 11/15/44 | | 1,493 | | 1,531 | |
REMIC, Interest Only, 6.34%, 11/15/40 - 12/15/40 (a) | | 40,237 | | 7,226 | |
REMIC, Interest Only, 5.74%, 01/15/54 (a) | | 14,564 | | 2,388 | |
| | | | 334,494 | |
Federal National Mortgage Association - 22.8% | | | | | |
Federal National Mortgage Association | | | | | |
4.50%, 04/01/26 | | 10,317 | | 11,145 | |
3.00%, 09/01/33 - 10/01/33 | | 126,531 | | 130,614 | |
3.50%, 09/01/43 | | 35,739 | | 37,292 | |
3.50%, 01/01/45, TBA (c) | | 15,000 | | 15,401 | |
REMIC, 1.50%, 03/25/28 | | 12,642 | | 12,305 | |
REMIC, 3.00%, 06/25/33 - 12/25/44 | | 52,281 | | 51,332 | |
REMIC, 4.00%, 10/25/40 | | 5,242 | | 5,500 | |
REMIC, 2.00%, 09/25/41 | | 9,828 | | 9,633 | |
REMIC, Interest Only, 6.51%, 12/25/25 (a) | | 5,401 | | 855 | |
REMIC, Interest Only, 6.43%, 02/25/35 (a) | | 15,057 | | 2,847 | |
REMIC, Interest Only, 6.33%, 09/25/41 (a) | | 4,575 | | 937 | |
| | | | 277,861 | |
Government National Mortgage Association - 1.3% | | | | | |
Government National Mortgage Association REMIC | | | | | |
9.37%, 12/20/40 (a) | | 6,000 | | 6,751 | |
Interest Only, 5.93%, 03/20/40 (a) | | 25,282 | | 3,245 | |
Principal Only, 0.00%, 03/16/33 (d) | | 6,023 | | 5,954 | |
| | | | 15,950 | |
Total Government and Agency Obligations
(cost $665,980) | | | | 688,380 | |
| | | | | |
SHORT TERM INVESTMENTS - 7.1% | | | | | |
| | | | | |
Investment Company - 7.1% | | | | | |
JNL Money Market Fund, 0.01% (e) (f) | | 86,863 | | 86,863 | |
Total Short Term Investments (cost $86,863) | | | | 86,863 | |
| | | | | |
Total Investments - 100.9% (cost $1,206,815) | | | | 1,231,897 | |
Other Assets and Liabilities, Net - (0.9%) | | | | (11,579 | ) |
Total Net Assets - 100.0% | | | | $ | 1,220,318 | |
| | | | | | |
(a) | Variable rate security. Rate stated was in effect as of December 31, 2014. |
(b) | The Sub-Adviser has deemed this security which is exempt from registration under the 1933 Act to be liquid based on procedures approved by the Trust’s Board of Trustees. As of December 31, 2014, the aggregate value of these liquid securities was $131,749 which represented 10.8% of net assets. |
(c) | All or a portion of the investment was purchased on a delayed delivery basis. As of December 31, 2014, the total cost of investments purchased on a delayed delivery basis was $15,438. |
(d) | Security issued with a zero coupon. Income is recognized through the accretion of discount. |
(e) | Investment in affiliate. |
(f) | Yield changes daily to reflect current market conditions. Rate was the quoted yield as of December 31, 2014. |
Curian/Eaton Vance Global Macro Absolute Return Advantage Fund
COMMON STOCKS - 1.9% | | | | | |
| | | | | |
GERMANY - 0.4% | | | | | |
Deutsche Wohnen AG | | 70 | | $ | 1,659 | |
| | | | | |
LUXEMBOURG - 0.4% | | | | | |
GAGFAH SA (a) | | 75 | | 1,668 | |
| | | | | |
SINGAPORE - 0.6% | | | | | |
Yoma Strategic Holdings Ltd. (a) | | 4,848 | | 2,407 | |
| | | | | |
SRI LANKA - 0.4% | | | | | |
Commercial Bank of Ceylon Plc | | 161 | | 210 | |
Dialog Axiata Plc | | 2,178 | | 221 | |
Hatton National Bank Plc | | 140 | | 207 | |
John Keells Holdings Plc | | 531 | | 1,012 | |
| | | | 1,650 | |
UNITED KINGDOM - 0.1% | | | | | |
Genel Energy Plc (a) | | 59 | | 641 | |
Total Common Stocks (cost $7,658) | | | | 8,025 | |
| | | | | |
CORPORATE BONDS AND NOTES - 1.2% | | | | | |
| | | | | |
ETHIOPIA - 0.1% | | | | | |
Ethiopian Railways Corp. Term Loan, 4.07%, 08/01/21 (b) (c) (d) (e) | | $ | 572 | | 572 | |
| | | | | |
GEORGIA - 0.6% | | | | | |
Bank of Georgia JSC, 7.75%, 07/05/17 | | 2,312 | | 2,370 | |
| | | | | |
RUSSIAN FEDERATION - 0.5% | | | | | |
Gazprom OAO Via Gaz Capital SA, 4.30%, 11/12/15 (f) | | 2,095 | | 2,042 | |
Total Corporate Bonds and Notes (cost $5,114) | | | | 4,984 | |
| | | | | |
GOVERNMENT AND AGENCY OBLIGATIONS - 61.9% | | | | | |
| | | | | |
ALBANIA - 0.2% | | | | | |
Albania Government International Bond, 7.50%, 11/04/15, EUR | | 622 | | 779 | |
| | | | | |
ARGENTINA - 3.8% | | | | | |
Argentina Boden Bond, 7.00%, 10/03/15 | | 8,228 | | 7,974 | |
Argentina Bonar Bond, 8.75%, 05/07/24 | | 4,155 | | 3,994 | |
Argentina Republic Government International Bond, 8.28%, 12/31/33 (g) | | 4,419 | | 3,944 | |
| | | | 15,912 | |
BARBADOS - 0.8% | | | | | |
Barbados Government International Bond 6.63%, 12/05/35 (f) | | 723 | | 611 | |
| | | | | | | |
See accompanying Notes to Financial Statements.
| | Shares/Par † | | Value | |
6.63%, 12/05/35 | | 3,505 | | 2,962 | |
| | | | 3,573 | |
BELARUS - 0.9% | | | | | |
Republic of Belarus | | | | | |
8.75%, 08/03/15 | | 2,959 | | 2,786 | |
8.95%, 01/26/18 | | 883 | | 810 | |
| | | | 3,596 | |
BERMUDA - 0.6% | | | | | |
Bermuda Government International Bond, 4.85%, 02/06/24 (f) | | 2,524 | | 2,625 | |
| | | | | |
CROATIA - 0.5% | | | | | |
Croatia Government International Bond, 6.25%, 04/27/17 | | 2,002 | | 2,123 | |
| | | | | |
CYPRUS - 1.6% | | | | | |
Cyprus Government International Bond, 3.75%, 11/01/15 (f), EUR | | 5,719 | | 6,865 | |
| | | | | |
DOMINICAN REPUBLIC - 1.7% | | | | | |
Dominican Republic Central Bank Note, 12.00%, 04/05/19 (f), DOP | | 27,490 | | 635 | |
Dominican Republic International Bond | | | | | |
14.00%, 04/30/21 (f), DOP | | 15,500 | | 383 | |
15.95%, 06/04/21 (f), DOP | | 30,000 | | 824 | |
14.50%, 02/10/23 (f), DOP | | 4,200 | | 104 | |
14.50%, 02/10/23, DOP | | 48,400 | | 1,196 | |
11.50%, 05/10/24 (f), DOP | | 49,000 | | 1,102 | |
18.50%, 02/04/28, DOP | | 96,500 | | 2,807 | |
18.50%, 02/04/28 (f), DOP | | 1,900 | | 55 | |
| | | | 7,106 | |
ECUADOR - 3.4% | | | | | |
Ecuador Government International Bond | | | | | |
9.38%, 12/15/15 | | 2,611 | | 2,546 | |
7.95%, 06/20/24 (f) | | 6,282 | | 5,371 | |
7.95%, 06/20/24 | | 7,243 | | 6,193 | |
| | | | 14,110 | |
IRAQ - 1.9% | | | | | |
Republic of Iraq, 5.80%, 01/15/28 | | 9,554 | | 7,978 | |
| | | | | |
JORDAN - 0.4% | | | | | |
Jordan Government International Bond, 3.88%, 11/12/15 | | 1,679 | | 1,683 | |
| | | | | |
LEBANON - 7.0% | | | | | |
Lebanon Government International Bond | | | | | |
4.10%, 06/12/15 | | 1,720 | | 1,707 | |
8.50%, 08/06/15 - 01/19/16 | | 7,055 | | 7,366 | |
Lebanon Treasury Note | | | | | |
7.54%, 01/15/15, LBP | | 4,101,650 | | 2,717 | |
5.94%, 02/05/15, LBP | | 2,967,560 | | 1,967 | |
6.50%, 04/02/15 - 09/03/15, LBP | | 23,742,300 | | 15,817 | |
| | | | 29,574 | |
MACEDONIA - 2.8% | | | | | |
Former Yugoslav Republic of Macedonia, 3.98%, 07/24/21 (f), EUR | | 9,900 | | 11,858 | |
| | | | | |
MOZAMBIQUE - 0.4% | | | | | |
Republic of Mozambique, 6.31%, 09/11/20 | | 1,619 | | 1,579 | |
| | | | | |
NEW ZEALAND - 2.8% | | | | | |
New Zealand Government Bond, 5.50%, 04/15/23, NZD | | 3,604 | | 3,176 | |
New Zealand Government Inflation Indexed Bond | | | | | |
2.06%, 09/20/25 (h), NZD | | 3,487 | | 2,796 | |
3.06%, 09/20/30 (h), NZD | | 6,743 | | 5,925 | |
| | | | 11,897 | |
PAKISTAN - 1.6% | | | | | |
Pakistan Government International Bond | | | | | |
7.13%, 03/31/16 | | 979 | | 993 | |
6.88%, 06/01/17 | | 1,016 | | 1,029 | |
7.25%, 04/15/19 (f) | | 2,546 | | 2,583 | |
8.25%, 04/15/24 (f) | | 1,954 | | 2,008 | |
| | | | 6,613 | |
PHILIPPINES - 0.9% | | | | | |
Philippine Government International Bond | | | | | |
4.95%, 01/15/21, PHP | | 124,000 | | 2,876 | |
6.25%, 01/14/36, PHP | | 44,000 | | 1,106 | |
| | | | 3,982 | |
RWANDA - 0.7% | | | | | |
Rwanda International Government Bond, 6.63%, 05/02/23 (l) | | 2,876 | | 2,899 | |
| | | | | |
SERBIA - 7.5% | | | | | |
Republic of Serbia, 5.25%, 11/21/17 | | 1,814 | | 1,863 | |
Serbia Treasury Bond | | | | | |
10.00%, 05/16/15 - 06/05/21, RSD | | 2,437,220 | | 24,201 | |
11.50%, 10/26/15, RSD | | 379,400 | | 3,874 | |
4.00%, 11/08/16, EUR | | 1,216 | | 1,468 | |
| | | | 31,406 | |
SLOVENIA - 7.2% | | | | | |
Slovenia Government Bond | | | | | |
4.38%, 01/18/21, EUR | | 2,582 | | 3,599 | |
4.63%, 09/09/24, EUR | | 1,915 | | 2,818 | |
5.13%, 03/30/26, EUR | | 5,689 | | 8,727 | |
Slovenia Government International Bond | | | | | |
4.13%, 02/18/19 | | 4,296 | | 4,500 | |
5.50%, 10/26/22 | | 2,695 | | 2,988 | |
5.85%, 05/10/23 | | 1,325 | | 1,498 | |
5.85%, 05/10/23 (f) | | 5,263 | | 5,951 | |
| | | | 30,081 | |
| | | | | |
SRI LANKA - 3.6% | | | | | |
Sri Lanka Government Bond | | | | | |
6.50%, 07/15/15, LKR | | 200,000 | | 1,526 | |
8.00%, 09/01/16, LKR | | 945,870 | | 7,360 | |
Sri Lanka Government International Bond | | | | | |
6.25%, 10/04/20 - 07/27/21 | | 1,600 | | 1,671 | |
5.88%, 07/25/22 | | 4,702 | | 4,778 | |
| | | | 15,335 | |
TANZANIA - 1.7% | | | | | |
Tanzania Government International Bond, 6.33%, 03/08/20 (d) | | 6,828 | | 7,135 | |
| | | | | |
TURKEY - 3.6% | | | | | |
Turkey Government Inflation Indexed Bond | | | | | |
4.00%, 04/01/20 (i), TRY | | 340 | | 163 | |
3.00%, 01/06/21 - 07/21/21 (i), TRY | | 32,393 | | 14,968 | |
2.00%, 10/26/22 (i), TRY | | 458 | | 200 | |
| | | | 15,331 | |
UGANDA - 0.8% | | | | | |
Republic of Uganda Government Bond | | | | | |
14.12%, 12/01/16, UGX | | 4,932,000 | | 1,763 | |
14.62%, 11/01/18, UGX | | 4,322,500 | | 1,549 | |
| | | | 3,312 | |
UNITED STATES OF AMERICA - 1.0% | | | | | |
Federal Home Loan Mortgage Corp. Interest Only REMIC, 5.94%, 06/15/32 (d) | | 4,836 | | 801 | |
Federal National Mortgage Association REMIC | | | | | |
Interest Only, 6.03%, 03/25/33 (d) | | 1,707 | | 337 | |
Interest Only, 5.88%, 11/25/38 (d) | | 4,748 | | 557 | |
Interest Only, 6.08%, 07/25/42 - 04/25/43 (d) | | 8,731 | | 1,553 | |
See accompanying Notes to Financial Statements.
Curian Variable Series Trust Sub-Advised Funds
Schedules of Investments (in thousands, except contracts)
December 31, 2014
| | Shares/Par/Contracts † | | Value | |
Interest Only, 5.98%, 01/25/43 (d) | | 4,348 | | 834 | |
| | | | 4,082 | |
VENEZUELA - 2.9% | | | | | |
Venezuela Government International Bond | | | | | |
7.00%, 03/16/15, EUR | | 299 | | 310 | |
5.75%, 02/26/16 | | 19,012 | | 11,863 | |
| | | | 12,173 | |
ZAMBIA - 1.6% | | | | | |
Zambia Government International Bond, 8.50%, 04/14/24 (f) | | 6,124 | | 6,707 | |
Total Government and Agency Obligations (cost $276,435) | | | | 260,314 | |
| | | | | |
INVESTMENT COMPANIES - 0.6% | | | | | |
Fondul Proprietatea SA | | 10,011 | | 2,413 | |
Total Investment Companies (cost $2,514) | | | | 2,413 | |
| | | | | |
PURCHASED OPTIONS - 2.3% | | | | | |
Australian Dollar versus USD Call Option, Strike Price 0.85, Expiration 04/29/15, CIT, JPM | | 14,829,555 | | 753 | |
Chinese Offshore Yuan versus USD Call Option, Strike Price CNH 6.20, Expiration 03/05/15, DUB, SCB | | 21,723,226 | | 243 | |
Chinese Offshore Yuan versus USD Call Option, Strike Price CNH 6.20, Expiration 03/06/15, SCB | | 7,076,774 | | 80 | |
Euro versus USD Call Option, Strike Price 1.21, Expiration 07/30/15, CIT | | 16,348,000 | | 426 | |
Euro versus USD Call Option, Strike Price 1.28, Expiration 11/01/16, DUB | | 12,510,000 | | 812 | |
Euro versus USD Call Option, Strike Price 1.30, Expiration 07/30/15, CIT | | 11,877,000 | | 829 | |
Euro versus USD Call Option, Strike Price 1.38, Expiration 04/29/15, CIT | | 7,422,643 | | 918 | |
Euro versus USD Call Option, Strike Price 1.38, Expiration 10/29/19, GSI | | 12,510,000 | | 1,208 | |
Euro versus USD Put Option, Strike Price 1.35, Expiration 7/30/15, CIT | | 11,877,000 | | 1,202 | |
Japanese Yen versus USD Call Option, Strike Price JPY 105, Expiration 06/22/15, CIT, DUB, GSI | | 23,881,000 | | 2,971 | |
Nikkei 225 Index Call Option, Strike Price JPY 16,000, Expiration 05/13/16, GSI | | 15 | | 322 | |
Total Purchased Options (cost $3,690) | | | | 9,764 | |
| | | | | |
SHORT TERM INVESTMENTS - 32.2% | | | | | |
| | | | | |
Investment Company - 12.3% | | | | | |
JNL Money Market Fund, 0.01% (j) (k) | | 51,674 | | 51,674 | |
| | | | | |
Repurchase Agreements - 2.3% | | | | | |
| | | | | |
Spain - 2.3% | | | | | |
Repurchase Agreement with NSI, (0.15)% (Collateralized by EUR 5,943 Spain Government Bond, 5.40%, due 01/31/23, value EUR 7,784) acquired on 11/28/14, due 01/09/15 at $9,618 (e), EUR | | 7,949 | | 9,618 | |
| | | | | |
Treasury Securities - 17.6% | | | | | |
Lebanon Treasury Bill | | | | | |
0.00%, 01/22/15, LBP | | 1,987,530 | | 1,311 | |
0.00%, 02/05/15, LBP | | 4,885,530 | | 3,220 | |
0.00%, 02/19/15, LBP | | 4,955,010 | | 3,260 | |
Mexico Cetes, 0.20%, 05/28/15, MXN | | 15,070 | | 10,089 | |
Philippine Treasury Bill, 0.02%, 02/04/15, PHP | | 16,870 | | 376 | |
Republic of Croatia Ministry of Finance, 0.00%, 02/12/15, EUR | | 8,738 | | 10,561 | |
| | | | | |
| | Shares/Par † | | | |
Republic of Uganda Treasury Bill | | | | | |
0.00%, 01/22/15, UGX | | 534,000 | | 192 | |
0.00%, 05/14/15, UGX | | 949,200 | | 328 | |
0.00%, 05/28/15, UGX | | 1,224,100 | | 420 | |
0.00%, 06/11/15, UGX | | 1,992,900 | | 681 | |
0.00%, 06/24/15, UGX | | 557,000 | | 189 | |
0.00%, 09/03/15, UGX | | 595,000 | | 197 | |
Serbia Treasury Bill | | | | | |
0.08%, 01/29/15, RSD | | 235,690 | | 2,337 | |
0.00%,,11/26/15, EUR | | 3,817 | | 4,501 | |
Sri Lanka Treasury Bill | | | | | |
0.05%, 02/06/15, LKR | | 1,486,630 | | 11,269 | |
0.05%, 09/11/15, LKR | | 355,380 | | 2,601 | |
U.S. Treasury Bill | | | | | |
0.02%, 01/15/15 | | $ | 10,000 | | 10,000 | |
0.04%, 04/02/15 (l) | | 10,000 | | 9,999 | |
Uruguay Treasury Bill | | | | | |
0.54%, 01/16/15, UYU | | 14,340 | | 587 | |
0.55%, 02/20/15, UYU | | 5,660 | | 229 | |
0.49%, 08/20/15, UYU | | 13,080 | | 494 | |
0.50%, 10/08/15, UYU | | 20,240 | | 752 | |
0.49%, 01/14/16, UYU | | 2,000 | | 72 | |
0.47%, 07/28/16, UYU | | 5,615 | | 188 | |
| | | | 73,853 | |
Total Short Term Investments (cost $138,529) | | | | 135,145 | |
| | | | | |
Total Investments - 100.1% (cost $433,940) | | | | 420,645 | |
Total Securities Sold Short - (2.2%) (proceeds $8,072) | | | | (9,419 | ) |
Other Assets and Liabilities, Net - 2.1% | | | | 8,944 | |
Total Net Assets - 100.0% | | | | $ | 420,170 | |
| | | | | |
SECURITIES SOLD SHORT - 2.2% | | | | | |
| | | | | |
GOVERNMENT AND AGENCY OBLIGATIONS - 2.2% | | | | | |
| | | | | |
SPAIN - 2.2% | | | | | |
Spain Government Bond, 5.40%, 01/31/23 (f), EUR | | 5,943 | | $ | 9,419 | |
Total Securities Sold Short - 2.2% (proceeds $8,072) | | | | $ | 9,419 | |
| | | | | | | |
(a) | Non-income producing security. |
(b) | A portion of this security was unfunded at December 31, 2014. See Unfunded Loan Commitments in the Notes to Financial Statements. |
(c) | Security fair valued in good faith in accordance with the procedures approved by the Trust’s Board of Trustees. Good faith fair valued securities may be classified as Level 2 or Level 3 for FASB ASC Topic 820 “Fair Value Measurement” based on the applicable valuation inputs. See FASB ASC Topic 820 “Fair Value Measurement” in the Notes to Financial Statements. |
(d) | Variable rate security. Rate stated was in effect as of December 31, 2014. |
(e) | The Sub-Adviser has deemed this security to be illiquid based on procedures approved by the Trust’s Board of Trustees. |
(f) | The Sub-Adviser has deemed this security which is exempt from registration under the 1933 Act to be liquid based on procedures approved by the Trust’s Board of Trustees. As of December 31, 2014, the aggregate value of these liquid securities was $49,723 for long term investments and ($9,419) for securities sold short which represented 11.8% and (2.2%) of net assets, respectively. |
(g) | Security is in default relating to principal, dividends and/or interest. |
(h) | Treasury inflation indexed note, par amount is not adjusted for inflation. |
(i) | Treasury inflation indexed note, par amount is adjusted for inflation. |
(j) | Investment in affiliate. |
(k) | Yield changes daily to reflect current market conditions. Rate was the quoted yield as of December 31, 2014. |
(l) | All or a portion of the security is pledged or segregated as collateral. See the Notes to Financial Statements. |
See accompanying Notes to Financial Statements.
Schedule of Written Options
| | Expiration
Date | | Exercise
Price | | Notional
Contracts | | Value | |
Foreign Currency Options | | | | | | | | | |
Chinese Offshore Yuan versus USD Call Option, DUB | | 03/05/2015 | | CNH | 6.20 | | 10,927,903 | | $ | (122 | ) |
Chinese Offshore Yuan versus USD Call Option, GSI | | 03/05/2015 | | CNH | 6.20 | | 10,795,323 | | (121 | ) |
Chinese Offshore Yuan versus USD Call Option, GSI | | 03/06/2015 | | CNH | 6.20 | | 7,076,774 | | (80 | ) |
Euro versus USD Call Option, CIT | | 04/29/2015 | | | 1.38 | | 7,422,642 | | (918 | ) |
Euro versus USD Call Option, CIT | | 07/30/2015 | | | 1.30 | | 11,877,000 | | (829 | ) |
Euro versus USD Put Option, CIT | | 07/30/2015 | | | 1.35 | | 11,877,000 | | (1,202 | ) |
Japanese Yen versus USD Call Option, DUB | | 06/22/2015 | | JPY | 105.00 | | 11,996,000 | | (1,492 | ) |
Japanese Yen versus USD Put Option, GSI | | 06/22/2015 | | JPY | 105.00 | | 11,885,000 | | (1,479 | ) |
| | | | | | | 83,857,642 | | $ | (6,243 | ) |
Summary of Written Options
| | Contracts/
Notional
Contracts | | Premiums | |
Options outstanding at December 31, 2013 | | 33,162,559 | | $ | 598 | |
Options written during the year | | 95,765,248 | | 2,982 | |
Options closed during the year | | (47 | ) | (122 | ) |
Options expired during the year | | (45,070,118 | ) | (640 | ) |
Options outstanding at December 31, 2014 | | 83,857,642 | | $ | 2,818 | |
Schedule of Open Futures Contracts
| | Expiration | | Contracts
Long /
(Short) | | Unrealized
Appreciation /
(Depreciation) | |
10-Year USD Deliverable Interest Rate Swap Future | | March 2015 | | (562) | | $ | (176 | ) |
10-Year USD Deliverable Interest Rate Swap Future | | March 2015 | | 22 | | (8 | ) |
2-Year USD Deliverable Interest Rate Swap Future | | March 2015 | | (162) | | (16 | ) |
5-Year USD Deliverable Interest Rate Swap Future | | March 2015 | | (182) | | (74 | ) |
90-Day Eurodollar Future | | March 2016 | | (334) | | (130 | ) |
Euro-Bobl Future | | March 2015 | | (267) | | (247 | ) |
Euro-Bund Future | | March 2015 | | (87) | | (145 | ) |
Set 50 Index Future | | March 2015 | | (676) | | 87 | |
SGX CNX Nifty Index Future | | January 2015 | | 618 | | 52 | |
Tokyo Price Index Future | | March 2015 | | 39 | | (141 | ) |
U.S. Treasury Note Future, 10-Year | | March 2015 | | (24) | | (19 | ) |
U.S. Treasury Note Future, 5-Year | | March 2015 | | (16) | | (2 | ) |
| | | | | | $ | (819 | ) |
Schedule of Open Forward Foreign Currency Contracts
Purchased/
Sold | | Settlement
Date | | Counter-
Party | | Notional
Amount | | Value | | Unrealized
Gain/(Loss) | |
ARS/USD | | 02/20/2015 | | CGM | | ARS | 6,000 | | $ | 671 | | $ | 154 | |
ARS/USD | | 02/20/2015 | | BOA | | ARS | 3,000 | | 335 | | 77 | |
ARS/USD | | 02/23/2015 | | CGM | | ARS | 9,000 | | 1,004 | | 228 | |
ARS/USD | | 02/24/2015 | | CGM | | ARS | 7,000 | | 780 | | 176 | |
ARS/USD | | 02/25/2015 | | CGM | | ARS | 19,000 | | 2,115 | | 470 | |
ARS/USD | | 02/25/2015 | | BOA | | ARS | 2,653 | | 295 | | 66 | |
CAD/USD | | 01/23/2015 | | GSC | | CAD | 9,709 | | 8,354 | | (222 | ) |
CAD/USD | | 01/23/2015 | | SCB | | CAD | 8,267 | | 7,113 | | (152 | ) |
CLP/USD | | 02/20/2015 | | BNP | | CLP | 2,864,830 | | 4,698 | | (77 | ) |
CLP/USD | | 03/19/2015 | | BNP | | CLP | 1,947,721 | | 3,187 | | 68 | |
EGP/USD | | 01/14/2015 | | CGM | | EGP | 4,818 | | 669 | | 9 | |
EGP/USD | | 01/20/2015 | | CGM | | EGP | 11,654 | | 1,611 | | 19 | |
EGP/USD | | 01/22/2015 | | CGM | | EGP | 11,655 | | 1,608 | | 17 | |
| | | | | | | | | | | | | | |
See accompanying Notes to Financial Statements.
Curian Variable Series Trust Sub-Advised Funds
Schedules of Investments (in thousands)
December 31, 2014
Purchased/
Sold | | Settlement
Date | | Counter-
Party | | Notional
Amount | | Value | | Unrealized
Gain/(Loss) | |
EUR/CHF | | 03/23/2015 | | CGM | | CHF | (7,683 | ) | $ | (7,739 | ) | $ | (8 | ) |
EUR/CHF | | 03/30/2015 | | JPM | | CHF | (8,040 | ) | (8,100 | ) | 1 | |
EUR/GBP | | 01/15/2015 | | SCB | | GBP | (2,550 | ) | (3,975 | ) | (31 | ) |
EUR/GBP | | 01/15/2015 | | BNP | | GBP | (5,134 | ) | (8,002 | ) | (127 | ) |
EUR/HUF | | 03/12/2015 | | BNP | | HUF | (1,624,482 | ) | (6,199 | ) | 191 | |
EUR/HUF | | 03/12/2015 | | JPM | | HUF | (187,930 | ) | (717 | ) | 18 | |
EUR/HUF | | 03/17/2015 | | BOA | | HUF | (382,631 | ) | (1,460 | ) | 42 | |
EUR/HUF | | 03/17/2015 | | BNP | | HUF | (381,395 | ) | (1,455 | ) | 15 | |
EUR/RON | | 03/23/2015 | | JPM | | RON | (8,336 | ) | (2,246 | ) | 6 | |
EUR/RON | | 03/23/2015 | | SCB | | RON | (6,846 | ) | (1,844 | ) | 4 | |
EUR/RON | | 03/23/2015 | | BOA | | RON | (16,281 | ) | (4,387 | ) | 5 | |
EUR/RON | | 03/23/2015 | | BNP | | RON | (14,234 | ) | (3,835 | ) | 9 | |
EUR/RON | | 03/31/2015 | | CGM | | RON | (21,516 | ) | (5,795 | ) | (16 | ) |
EUR/RON | | 03/31/2015 | | DUB | | RON | (6,526 | ) | (1,758 | ) | (4 | ) |
EUR/USD | | 01/02/2015 | | GSC | | EUR | 111 | | 134 | | (5 | ) |
GBP/EUR | | 01/15/2015 | | BNP | | EUR | (4,206 | ) | (5,090 | ) | 92 | |
GBP/EUR | | 01/15/2015 | | MSC | | EUR | (2,319 | ) | (2,806 | ) | 51 | |
GBP/EUR | | 01/15/2015 | | CGM | | EUR | (1,513 | ) | (1,831 | ) | 59 | |
GBP/EUR | | 01/15/2015 | | SCB | | EUR | (1,728 | ) | (2,091 | ) | 68 | |
IDR/USD | | 01/16/2015 | | GSC | | IDR | 39,325,750 | | 3,169 | | 3 | |
IDR/USD | | 01/16/2015 | | GSC | | IDR | 14,869,400 | | 1,198 | | (18 | ) |
IDR/USD | | 01/22/2015 | | DUB | | IDR | 16,100,550 | | 1,296 | | 35 | |
IDR/USD | | 01/23/2015 | | GSC | | IDR | 14,253,340 | | 1,147 | | (25 | ) |
IDR/USD | | 01/30/2015 | | GSC | | IDR | 8,640,200 | | 694 | | (4 | ) |
IDR/USD | | 01/30/2015 | | BNP | | IDR | 17,371,190 | | 1,396 | | (9 | ) |
IDR/USD | | 01/30/2015 | | CGM | | IDR | 17,288,710 | | 1,390 | | (10 | ) |
IDR/USD | | 01/30/2015 | | DUB | | IDR | 25,939,938 | | 2,085 | | (26 | ) |
IDR/USD | | 02/13/2015 | | JPM | | IDR | 40,877,438 | | 3,277 | | (24 | ) |
IDR/USD | | 02/20/2015 | | SCB | | IDR | 8,992,052 | | 720 | | (10 | ) |
IDR/USD | | 02/23/2015 | | SCB | | IDR | 26,035,676 | | 2,084 | | (38 | ) |
IDR/USD | | 02/23/2015 | | GSC | | IDR | 23,081,040 | | 1,847 | | (34 | ) |
INR/USD | | 01/20/2015 | | GSC | | INR | 127,780 | | 2,018 | | (46 | ) |
INR/USD | | 01/20/2015 | | BNP | | INR | 120,610 | | 1,904 | | (44 | ) |
INR/USD | | 02/09/2015 | | SCB | | INR | 165,375 | | 2,600 | | (55 | ) |
INR/USD | | 02/09/2015 | | GSC | | INR | 177,506 | | 2,791 | | (59 | ) |
INR/USD | | 02/09/2015 | | CGM | | INR | 54,558 | | 858 | | 8 | |
INR/USD | | 02/18/2015 | | SCB | | INR | 71,053 | | 1,115 | | (24 | ) |
INR/USD | | 02/18/2015 | | CGM | | INR | 243,377 | | 3,820 | | (83 | ) |
INR/USD | | 02/18/2015 | | DUB | | INR | 94,259 | | 1,480 | | (32 | ) |
INR/USD | | 02/18/2015 | | GSC | | INR | 14,766 | | 232 | | (5 | ) |
INR/USD | | 02/23/2015 | | GSC | | INR | 195,439 | | 3,065 | | 12 | |
INR/USD | | 02/23/2015 | | CGM | | INR | 353,722 | | 5,547 | | 22 | |
KZT/USD | | 02/05/2015 | | DUB | | KZT | 227,059 | | 1,140 | | (228 | ) |
MXN/USD | | 01/28/2015 | | SCB | | MXN | 60,876 | | 4,120 | | (353 | ) |
MXN/USD | | 02/12/2015 | | SCB | | MXN | 125,014 | | 8,453 | | (692 | ) |
MXN/USD | | 02/19/2015 | | SCB | | MXN | 197,363 | | 13,340 | | (255 | ) |
NOK/EUR | | 03/11/2015 | | BNP | | EUR | (6,561 | ) | (7,943 | ) | 112 | |
NOK/EUR | | 03/18/2015 | | SCB | | EUR | (1,243 | ) | (1,505 | ) | 53 | |
NOK/EUR | | 03/18/2015 | | GSC | | EUR | (1,878 | ) | (2,275 | ) | 167 | |
NOK/EUR | | 03/18/2015 | | BNP | | EUR | (3,421 | ) | (4,142 | ) | 73 | |
NOK/EUR | | 03/30/2015 | | CIT | | EUR | (3,487 | ) | (4,222 | ) | 21 | |
PHP/USD | | 01/07/2015 | | CGM | | PHP | 9,950 | | 222 | | — | |
PHP/USD | | 01/07/2015 | | BNP | | PHP | 10,880 | | 243 | | — | |
PHP/USD | | 01/07/2015 | | DUB | | PHP | 7,390 | | 165 | | — | |
PHP/USD | | 02/12/2015 | | BOA | | PHP | 523,847 | | 11,688 | | (13 | ) |
PLN/EUR | | 01/16/2015 | | BOA | | EUR | (4,099 | ) | (4,960 | ) | (79 | ) |
PLN/EUR | | 01/16/2015 | | BNP | | EUR | (3,866 | ) | (4,679 | ) | (75 | ) |
PLN/EUR | | 01/20/2015 | | BNP | | EUR | (4,177 | ) | (5,055 | ) | (47 | ) |
PLN/USD | | 01/20/2015 | | GSC | | PLN | 1,291 | | 364 | | (23 | ) |
| | | | | | | | | | | | | | |
See accompanying Notes to Financial Statements.
Purchased/
Sold | | Settlement
Date | | Counter-
Party | | Notional
Amount | | Value | | Unrealized
Gain/(Loss) | |
RON/EUR | | 03/23/2015 | | SCB | | EUR | (2,079 | ) | $ | (2,518 | ) | $ | 58 | |
RON/EUR | | 03/23/2015 | | JPM | | EUR | (1,410 | ) | (1,708 | ) | 38 | |
RON/EUR | | 03/23/2015 | | BOA | | EUR | (2,237 | ) | (2,709 | ) | 56 | |
RON/EUR | | 03/23/2015 | | CGM | | EUR | (4,055 | ) | (4,912 | ) | 98 | |
RON/EUR | | 03/31/2015 | | CGM | | EUR | (3,047 | ) | (3,690 | ) | 68 | |
RON/EUR | | 03/31/2015 | | BOA | | EUR | (3,253 | ) | (3,940 | ) | 71 | |
RSD/EUR | | 03/13/2015 | | DUB | | EUR | (4,124 | ) | (4,993 | ) | (43 | ) |
RUB/USD | | 01/29/2015 | | BOA | | RUB | 138,785 | | 2,251 | | (235 | ) |
RUB/USD | | 01/29/2015 | | BNP | | RUB | 8,577 | | 139 | | (14 | ) |
RUB/USD | | 02/05/2015 | | BNP | | RUB | 74,389 | | 1,201 | | (118 | ) |
RUB/USD | | 02/05/2015 | | DUB | | RUB | 106,791 | | 1,725 | | 234 | |
RUB/USD | | 04/29/2015 | | JPM | | RUB | 172,440 | | 2,665 | | 113 | |
RUB/USD | | 04/29/2015 | | DUB | | RUB | 42,590 | | 658 | | 32 | |
TRY/USD | | 02/18/2015 | | SCB | | TRY | 1,924 | | 816 | | 12 | |
TRY/USD | | 02/18/2015 | | JPM | | TRY | 3,848 | | 1,631 | | (2 | ) |
TRY/USD | | 05/21/2015 | | DUB | | TRY | 1,288 | | 535 | | (19 | ) |
TRY/USD | | 05/21/2015 | | BOA | | TRY | 9,818 | | 4,081 | | (193 | ) |
TRY/USD | | 05/21/2015 | | MSC | | TRY | 6,459 | | 2,685 | | (129 | ) |
TRY/USD | | 05/21/2015 | | SCB | | TRY | 4,398 | | 1,828 | | 13 | |
UGX/USD | | 01/12/2015 | | CGM | | UGX | 1,566,230 | | 564 | | (9 | ) |
UGX/USD | | 01/12/2015 | | SCB | | UGX | 736,943 | | 265 | | (5 | ) |
UGX/USD | | 01/23/2015 | | CGM | | UGX | 2,196,000 | | 789 | | (24 | ) |
USD/ARS | | 02/20/2015 | | CGM | | ARS | (6,000 | ) | (671 | ) | (91 | ) |
USD/ARS | | 02/20/2015 | | BOA | | ARS | (3,000 | ) | (335 | ) | (48 | ) |
USD/ARS | | 02/23/2015 | | CGM | | ARS | (9,000 | ) | (1,003 | ) | (136 | ) |
USD/ARS | | 02/24/2015 | | CGM | | ARS | (7,000 | ) | (780 | ) | (110 | ) |
USD/ARS | | 02/25/2015 | | BOA | | ARS | (2,653 | ) | (295 | ) | (42 | ) |
USD/ARS | | 02/25/2015 | | CGM | | ARS | (19,000 | ) | (2,115 | ) | (291 | ) |
USD/AUD | | 01/12/2015 | | MSC | | AUD | (15,518 | ) | (12,662 | ) | 878 | |
USD/AUD | | 01/30/2015 | | GSC | | AUD | (7,308 | ) | (5,955 | ) | 447 | |
USD/AUD | | 01/30/2015 | | JPM | | AUD | (2,289 | ) | (1,865 | ) | 74 | |
USD/CAD | | 01/23/2015 | | DUB | | CAD | (16,035 | ) | (13,796 | ) | 451 | |
USD/CAD | | 01/23/2015 | | GSC | | CAD | (1,942 | ) | (1,671 | ) | 38 | |
USD/EUR | | 01/02/2015 | | GSC | | EUR | (1,224 | ) | (1,481 | ) | 54 | |
USD/EUR | | 01/16/2015 | | DUB | | EUR | (5,381 | ) | (6,512 | ) | 223 | |
USD/EUR | | 01/16/2015 | | SCB | | EUR | (7,237 | ) | (8,758 | ) | 161 | |
USD/EUR | | 01/21/2015 | | JPM | | EUR | (8,213 | ) | (9,940 | ) | 448 | |
USD/EUR | | 01/28/2015 | | JPM | | EUR | (656 | ) | (794 | ) | 43 | |
USD/EUR | | 02/04/2015 | | GSC | | EUR | (9,738 | ) | (11,788 | ) | 572 | |
USD/EUR | | 02/09/2015 | | BNP | | EUR | (904 | ) | (1,094 | ) | 37 | |
USD/EUR | | 02/09/2015 | | GSC | | EUR | (96 | ) | (116 | ) | 3 | |
USD/EUR | | 02/11/2015 | | SCB | | EUR | (27,588 | ) | (33,395 | ) | 864 | |
USD/EUR | | 02/25/2015 | | GSC | | EUR | (2,707 | ) | (3,277 | ) | 106 | |
USD/EUR | | 03/04/2015 | | JPM | | EUR | (5,865 | ) | (7,101 | ) | 95 | |
USD/EUR | | 03/16/2015 | | GSC | | EUR | (302 | ) | (365 | ) | 10 | |
USD/EUR | | 03/25/2015 | | GSC | | EUR | (4,831 | ) | (5,850 | ) | 169 | |
USD/EUR | | 03/25/2015 | | DUB | | EUR | (5,104 | ) | (6,181 | ) | 183 | |
USD/EUR | | 03/25/2015 | | CGM | | EUR | (3,825 | ) | (4,632 | ) | 132 | |
USD/EUR | | 04/01/2015 | | DUB | | EUR | (12,531 | ) | (15,175 | ) | 167 | |
USD/EUR | | 04/08/2015 | | GSC | | EUR | (1,113 | ) | (1,348 | ) | 10 | |
USD/EUR | | 11/27/2015 | | SCB | | EUR | (3,931 | ) | (4,779 | ) | 168 | |
USD/GBP | | 02/18/2015 | | SCB | | GBP | (410 | ) | (638 | ) | 3 | |
USD/JPY | | 01/16/2015 | | GSC | | JPY | (643,768 | ) | (5,375 | ) | 516 | |
USD/JPY | | 02/18/2015 | | GSC | | JPY | (1,920,114 | ) | (16,036 | ) | 455 | |
USD/JPY | | 03/12/2015 | | SCB | | JPY | (514,172 | ) | (4,295 | ) | 31 | |
USD/JPY | | 03/12/2015 | | GSC | | JPY | (511,890 | ) | (4,276 | ) | 49 | |
USD/JPY | | 04/06/2015 | | SCB | | JPY | (232,971 | ) | (1,947 | ) | 11 | |
USD/KZT | | 02/05/2015 | | DUB | | KZT | (227,059 | ) | (1,140 | ) | 72 | |
USD/NZD | | 01/21/2015 | | BNP | | NZD | (15,644 | ) | (12,182 | ) | 122 | |
| | | | | | | | | | | | | | |
See accompanying Notes to Financial Statements.
Purchased/
Sold | | Settlement
Date | | Counter-
Party | | Notional
Amount | | Value | | Unrealized
Gain/(Loss) | |
USD/NZD | | 01/21/2015 | | DUB | | NZD | (5,168 | ) | $ | (4,024 | ) | $ | 54 | |
USD/NZD | | 01/21/2015 | | SCB | | NZD | (7,368 | ) | (5,737 | ) | 20 | |
USD/NZD | | 01/30/2015 | | JPM | | NZD | (15,714 | ) | (12,223 | ) | 167 | |
USD/NZD | | 02/04/2015 | | MSC | | NZD | (3,232 | ) | (2,513 | ) | 5 | |
USD/NZD | | 02/04/2015 | | JPM | | NZD | (2,360 | ) | (1,835 | ) | 4 | |
USD/NZD | | 02/04/2015 | | BNP | | NZD | (5,007 | ) | (3,893 | ) | (37 | ) |
USD/NZD | | 02/04/2015 | | CGM | | NZD | (1,990 | ) | (1,547 | ) | (8 | ) |
USD/NZD | | 02/04/2015 | | SCB | | NZD | (3,506 | ) | (2,726 | ) | (22 | ) |
USD/NZD | | 03/16/2015 | | BNP | | NZD | (5,260 | ) | (4,075 | ) | 9 | |
USD/RON | | 02/23/2015 | | BNP | | RON | (9,451 | ) | (2,549 | ) | 110 | |
USD/RUB | | 01/29/2015 | | BNP | | RUB | (147,362 | ) | (2,390 | ) | 987 | |
USD/RUB | | 02/05/2015 | | JPM | | RUB | (89,682 | ) | (1,448 | ) | 617 | |
USD/RUB | | 02/05/2015 | | BNP | | RUB | (91,498 | ) | (1,477 | ) | 628 | |
USD/RUB | | 04/29/2015 | | JPM | | RUB | (215,030 | ) | (3,322 | ) | 1,504 | |
USD/SGD | | 01/02/2015 | | SCB | | SGD | (3,169 | ) | (2,392 | ) | 96 | |
USD/SGD | | 03/02/2015 | | DUB | | SGD | (3,169 | ) | (2,390 | ) | (2 | ) |
USD/TRY | | 05/21/2015 | | BNP | | TRY | (26,343 | ) | (10,952 | ) | 208 | |
USD/TRY | | 05/21/2015 | | SCB | | TRY | (7,448 | ) | (3,096 | ) | 54 | |
USD/TRY | | 05/21/2015 | | SCB | | TRY | (2,640 | ) | (1,097 | ) | (8 | ) |
USD/TWD | | 02/12/2015 | | GSC | | TWD | (183,230 | ) | (5,799 | ) | 193 | |
USD/TWD | | 02/12/2015 | | BOA | | TWD | (199,970 | ) | (6,329 | ) | 213 | |
USD/TWD | | 02/26/2015 | | DUB | | TWD | (174,112 | ) | (5,511 | ) | 136 | |
USD/TWD | | 02/26/2015 | | GSC | | TWD | (90,745 | ) | (2,872 | ) | 70 | |
USD/TWD | | 03/04/2015 | | JPM | | TWD | (170,323 | ) | (5,391 | ) | 106 | |
USD/TWD | | 03/04/2015 | | BNP | | TWD | (98,310 | ) | (3,112 | ) | 59 | |
USD/TWD | | 03/04/2015 | | DUB | | TWD | (15,040 | ) | (476 | ) | (2 | ) |
USD/ZAR | | 01/08/2015 | | CGM | | ZAR | (47,711 | ) | (4,122 | ) | 40 | |
USD/ZAR | | 01/08/2015 | | JPM | | ZAR | (47,323 | ) | (4,089 | ) | 39 | |
USD/ZAR | | 03/09/2015 | | DUB | | ZAR | (41,284 | ) | (3,533 | ) | 111 | |
UYU/USD | | 01/16/2015 | | CGM | | UYU | 69,221 | | 2,843 | | (52 | ) |
UYU/USD | | 01/23/2015 | | CGM | | UYU | 69,366 | | 2,846 | | (49 | ) |
UYU/USD | | 01/23/2015 | | CIT | | UYU | 17,205 | | 706 | | 3 | |
UYU/USD | | 02/06/2015 | | CGM | | UYU | 16,000 | | 655 | | 10 | |
UYU/USD | | 02/13/2015 | | CGM | | UYU | 16,000 | | 654 | | 10 | |
UYU/USD | | 02/27/2015 | | CGM | | UYU | 20,790 | | 847 | | (22 | ) |
UYU/USD | | 02/27/2015 | | CGM | | UYU | 14,000 | | 570 | | 5 | |
UYU/USD | | 03/31/2015 | | CGM | | UYU | 17,670 | | 714 | | (16 | ) |
UYU/USD | | 03/31/2015 | | CGM | | UYU | 13,000 | | 525 | | 4 | |
UYU/USD | | 04/30/2015 | | CGM | | UYU | 33,000 | | 1,322 | | 19 | |
| | | | | | | | | $ | (297,567 | ) | $ | 10,537 | |
Schedule of Interest Rate Swap Agreements
Counterparty | | Floating Rate Index | | Fund Paying /
Receiving
Floating Rate | | Fixed Rate | | Expiration
Date | | Notional
Amount (1) | | Premiums
Paid /
(Received) | | Unrealized
Appreciation /
(Depreciation) | |
Over the Counter Interest Rate Swap Agreements | | | | | | | | | | | | | | |
CIT | | 3-Month Kuala Lumpur Interbank Offered Rate | | Paying | | 3.90 | % | 11/27/2019 | | MYR | 26,740 | | $ | — | | $ | (42 | ) |
DUB | | 3-Month Kuala Lumpur Interbank Offered Rate | | Paying | | 3.89 | % | 11/28/2019 | | MYR | 11,717 | | — | | (21 | ) |
GSI | | 3-Month Kuala Lumpur Interbank Offered Rate | | Paying | | 3.92 | % | 11/24/2019 | | MYR | 3,250 | | — | | (4 | ) |
JPM | | 3-Month Kuala Lumpur Interbank Offered Rate | | Paying | | 3.90 | % | 11/27/2019 | | MYR | 10,730 | | — | | (17 | ) |
SCB | | 3-Month Kuala Lumpur Interbank Offered Rate | | Paying | | 3.93 | % | 11/25/2019 | | MYR | 10,503 | | — | | (13 | ) |
JPM | | 3-Month New Zealand Bank Bill Forward Rate Agreement | | Paying | | 4.06 | % | 06/04/2023 | | NZD | 1,890 | | — | | (1 | ) |
BOA | | 3-Month Poland Warsaw Interbank Rate | | Paying | | 2.73 | % | 05/27/2018 | | PLN | 72,500 | | — | | 882 | |
BOA | | Brazil Interbank Deposit Rate | | Paying | | 12.93 | % | 01/04/2016 | | BRL | 156,660 | | — | | 24 | |
BOA | | Brazil Interbank Deposit Rate | | Paying | | 12.90 | % | 01/04/2016 | | BRL | 17,535 | | — | | 1 | |
DUB | | Brazil Interbank Deposit Rate | | Paying | | 11.81 | % | 01/02/2017 | | BRL | 96,599 | | — | | (499 | ) |
DUB | | Brazil Interbank Deposit Rate | | Paying | | 12.19 | % | 01/02/2017 | | BRL | 27,826 | | — | | (77 | ) |
| | | | | | | | | | | | | | | | | | |
See accompanying Notes to Financial Statements.
Counterparty | | Floating Rate Index | | Fund Paying /
Receiving
Floating Rate | | Fixed Rate | | Expiration
Date | | Notional
Amount (1) | | Premiums
Paid /
(Received) | | Unrealized
Appreciation /
(Depreciation) | |
Over the Counter Interest Rate Swap Agreements (continued) | | | | | | | | | | | |
DUB | | Brazil Interbank Deposit Rate | | Paying | | 12.20 | % | 01/02/2017 | | BRL | 68,694 | | $ | — | | $ | (189 | ) |
DUB | | Brazil Interbank Deposit Rate | | Paying | | 12.03 | % | 01/02/2017 | | BRL | 5,687 | | — | | (22 | ) |
DUB | | Brazil Interbank Deposit Rate | | Paying | | 12.31 | % | 01/02/2017 | | BRL | 58,823 | | — | | (144 | ) |
GSI | | Brazil Interbank Deposit Rate | | Paying | | 13.35 | % | 01/04/2016 | | BRL | 69,237 | | — | | 102 | |
GSI | | Brazil Interbank Deposit Rate | | Paying | | 12.87 | % | 01/04/2016 | | BRL | 91,519 | | — | | (4 | ) |
GSI | | Brazil Interbank Deposit Rate | | Paying | | 12.87 | % | 01/04/2016 | | BRL | 177,671 | | — | | (9 | ) |
GSI | | Brazil Interbank Deposit Rate | | Paying | | 12.14 | % | 01/02/2017 | | BRL | 57,124 | | — | | (178 | ) |
GSI | | Brazil Interbank Deposit Rate | | Paying | | 12.08 | % | 01/02/2017 | | BRL | 67,484 | | — | | (248 | ) |
GSI | | Brazil Interbank Deposit Rate | | Paying | | 12.02 | % | 01/02/2017 | | BRL | 58,386 | | — | | (236 | ) |
GSI | | Brazil Interbank Deposit Rate | | Paying | | 12.33 | % | 01/02/2017 | | BRL | 29,412 | | — | | (69 | ) |
GSI | | Brazil Interbank Deposit Rate | | Paying | | 12.33 | % | 01/02/2017 | | BRL | 66,356 | | — | | (155 | ) |
GSI | | Brazil Interbank Deposit Rate | | Receiving | | 11.51 | % | 01/02/2023 | | BRL | 30,230 | | — | | 167 | |
GSI | | Brazil Interbank Deposit Rate | | Receiving | | 11.64 | % | 01/02/2023 | | BRL | 26,372 | | — | | 102 | |
BOA | | Chilean Interbank Rate | | Receiving | | 3.70 | % | 12/04/2019 | | CLP | 1,976,612 | | — | | (8 | ) |
BOA | | Chilean Interbank Rate | | Receiving | | 3.75 | % | 12/09/2019 | | CLP | 1,271,963 | | — | | (9 | ) |
BOA | | Chilean Interbank Rate | | Receiving | | 3.73 | % | 12/09/2019 | | CLP | 637,106 | | — | | (4 | ) |
DUB | | Chilean Interbank Rate | | Receiving | | 3.70 | % | 08/07/2018 | | CLP | 3,319,072 | | — | | (60 | ) |
DUB | | Chilean Interbank Rate | | Receiving | | 3.60 | % | 08/08/2018 | | CLP | 3,387,520 | | — | | (40 | ) |
DUB | | Chilean Interbank Rate | | Receiving | | 3.98 | % | 10/30/2019 | | CLP | 413,550 | | — | | (11 | ) |
GSI | | Chilean Interbank Rate | | Receiving | | 3.90 | % | 10/20/2019 | | CLP | 853,357 | | — | | (18 | ) |
GSI | | Chilean Interbank Rate | | Receiving | | 3.97 | % | 10/29/2019 | | CLP | 1,312,858 | | — | | (35 | ) |
GSI | | Chilean Interbank Rate | | Receiving | | 3.97 | % | 11/05/2019 | | CLP | 413,550 | | — | | (11 | ) |
GSI | | Chilean Interbank Rate | | Receiving | | 3.97 | % | 11/06/2019 | | CLP | 1,247,215 | | — | | (33 | ) |
GSI | | Chilean Interbank Rate | | Receiving | | 3.97 | % | 11/07/2019 | | CLP | 827,100 | | — | | (22 | ) |
GSI | | Chilean Interbank Rate | | Receiving | | 3.98 | % | 11/07/2019 | | CLP | 1,654,201 | | — | | (45 | ) |
GSI | | Chilean Interbank Rate | | Receiving | | 4.02 | % | 11/13/2019 | | CLP | 827,100 | | — | | (25 | ) |
GSI | | Chilean Interbank Rate | | Receiving | | 4.05 | % | 11/17/2019 | | CLP | 1,280,036 | | — | | (41 | ) |
GSI | | Chilean Interbank Rate | | Receiving | | 3.93 | % | 11/20/2019 | | CLP | 433,243 | | — | | (10 | ) |
GSI | | Chilean Interbank Rate | | Receiving | | 3.87 | % | 11/21/2019 | | CLP | 866,486 | | — | | (15 | ) |
GSI | | Chilean Interbank Rate | | Receiving | | 3.79 | % | 11/25/2019 | | CLP | 1,312,858 | | — | | (15 | ) |
GSI | | Chilean Interbank Rate | | Receiving | | 3.77 | % | 11/26/2019 | | CLP | 853,357 | | — | | (8 | ) |
GSI | | Chilean Interbank Rate | | Receiving | | 3.69 | % | 12/03/2019 | | CLP | 1,772,358 | | — | | (6 | ) |
GSI | | Chilean Interbank Rate | | Receiving | | 3.76 | % | 12/09/2019 | | CLP | 2,287,277 | | — | | (17 | ) |
GSI | | Chilean Interbank Rate | | Receiving | | 3.70 | % | 12/15/2019 | | CLP | 892,790 | | — | | (3 | ) |
BOA | | Colombian Interbank Rate | | Paying | | 4.48 | % | 11/10/2016 | | COP | 11,675,598 | | — | | (15 | ) |
BOA | | Colombian Interbank Rate | | Paying | | 4.41 | % | 11/14/2016 | | COP | 5,693,849 | | — | | (10 | ) |
BOA | | Colombian Interbank Rate | | Paying | | 4.45 | % | 11/15/2016 | | COP | 5,693,849 | | — | | (8 | ) |
BOA | | Colombian Interbank Rate | | Paying | | 4.37 | % | 11/21/2016 | | COP | 16,418,279 | | — | | (35 | ) |
BOA | | Colombian Interbank Rate | | Paying | | 4.37 | % | 11/24/2016 | | COP | 13,134,620 | | — | | (28 | ) |
CIT | | Colombian Interbank Rate | | Paying | | 4.28 | % | 11/28/2016 | | COP | 9,009,720 | | — | | (25 | ) |
CIT | | Colombian Interbank Rate | | Paying | | 4.29 | % | 12/01/2016 | | COP | 9,009,720 | | — | | (25 | ) |
MSC | | Colombian Interbank Rate | | Paying | | 4.49 | % | 11/10/2016 | | COP | 7,799,577 | | — | | (10 | ) |
MSC | | Colombian Interbank Rate | | Paying | | 4.46 | % | 11/15/2016 | | COP | 7,832,884 | | — | | (11 | ) |
DUB | | India NSE Interbank Offered Rate | | Paying | | 7.15 | % | 12/19/2019 | | INR | 129,046 | | — | | 5 | |
DUB | | India NSE Interbank Offered Rate | | Paying | | 7.19 | % | 12/22/2019 | | INR | 124,884 | | — | | 8 | |
GSI | | India NSE Interbank Offered Rate | | Paying | | 7.25 | % | 12/18/2019 | | INR | 249,767 | | — | | 26 | |
GSI | | India NSE Interbank Offered Rate | | Paying | | 7.15 | % | 12/19/2019 | | INR | 249,767 | | — | | 10 | |
GSI | | India NSE Interbank Offered Rate | | Paying | | 7.18 | % | 12/22/2019 | | INR | 124,884 | | — | | 8 | |
| | | | | | | | | | | | $ | — | | $ | (1,196 | ) |
Counterparty | | Floating Rate Index | | Fund Paying /
Receiving
Floating Rate | | Fixed Rate | | Expiration
Date | | Notional
Amount (1) | | Unrealized
Appreciation /
(Depreciation) | |
Centrally Cleared Interest Rate Swap Agreements | | | | | | | | | |
N/A | | 3-Month New Zealand Bank Bill Forward Rate Agreement | | Paying | | 4.03 | % | 11/26/2017 | | NZD 27,253 | | $ | 92 | |
N/A | | 3-Month New Zealand Bank Bill Forward Rate Agreement | | Paying | | 4.02 | % | 11/27/2017 | | NZD 10,220 | | 32 | |
N/A | | 3-Month New Zealand Bank Bill Forward Rate Agreement | | Paying | | 3.96 | % | 11/28/2017 | | NZD 19,097 | | 37 | |
| | | | | | | | | | | | | | |
See accompanying Notes to Financial Statements.
Counterparty | | Floating Rate Index | | Fund Paying /
Receiving
Floating Rate | | Fixed Rate | | Expiration
Date | | Notional
Amount (1) | | Unrealized
Appreciation /
(Depreciation) | |
Centrally Cleared Interest Rate Swap Agreements (continued) | | | | | | | | | |
N/A | | 3-Month New Zealand Bank Bill Forward Rate Agreement | | Paying | | 4.96 | % | 04/29/2024 | | NZD | 6,530 | | $ | 357 | |
N/A | | 3-Month Norway Interbank Offered Rate | | Receiving | | 1.72 | % | 09/21/2016 | | NOK | 478,908 | | (132 | ) |
N/A | | 3-Month Norway Interbank Offered Rate | | Receiving | | 1.82 | % | 09/21/2016 | | NOK | 676,021 | | (214 | ) |
N/A | | 3-Month Norway Interbank Offered Rate | | Receiving | | 1.88 | % | 09/21/2016 | | NOK | 338,010 | | (116 | ) |
N/A | | 3-Month Norway Interbank Offered Rate | | Receiving | | 1.84 | % | 09/21/2016 | | NOK | 338,010 | | (109 | ) |
N/A | | 3-Month Norway Interbank Offered Rate | | Receiving | | 1.81 | % | 09/21/2016 | | NOK | 338,011 | | (106 | ) |
N/A | | 3-Month Norway Interbank Offered Rate | | Receiving | | 1.82 | % | 09/21/2016 | | NOK | 676,021 | | (215 | ) |
N/A | | 3-Month Norway Interbank Offered Rate | | Receiving | | 1.84 | % | 09/21/2016 | | NOK | 338,010 | | (110 | ) |
N/A | | 3-Month Norway Interbank Offered Rate | | Receiving | | 1.78 | % | 09/21/2016 | | NOK | 540,817 | | (162 | ) |
N/A | | 3-Month Norway Interbank Offered Rate | | Receiving | | 1.71 | % | 09/21/2016 | | NOK | 386,371 | | (105 | ) |
N/A | | 6-Month Budapest Interbank Offered Rate | | Receiving | | 4.57 | % | 11/14/2018 | | HUF | 569,000 | | (209 | ) |
N/A | | 6-Month Budapest Interbank Offered Rate | | Receiving | | 4.43 | % | 11/15/2018 | | HUF | 730,000 | | (251 | ) |
N/A | | 6-Month Budapest Interbank Offered Rate | | Receiving | | 3.69 | % | 05/15/2019 | | HUF | 1,086,557 | | (250 | ) |
N/A | | 6-Month Poland Warsaw Interbank Offered Rate | | Paying | | 1.95 | % | 10/27/2019 | | PLN | 68,947 | | 11 | |
N/A | | British Bankers’ Association Yen LIBOR | | Receiving | | 0.75 | % | 06/12/2024 | | JPY | 751,525 | | (175 | ) |
N/A | | British Bankers’ Association Yen LIBOR | | Receiving | | 0.52 | % | 12/24/2024 | | JPY | 3,939,100 | | (7 | ) |
N/A | | Mexican Interbank Rate | | Paying | | 6.29 | % | 12/03/2024 | | MXN | 284,316 | | 312 | |
N/A | | Mexican Interbank Rate | | Paying | | 6.36 | % | 12/04/2024 | | MXN | 64,114 | | 94 | |
N/A | | Stockholm Interbank Offered Rate | | Paying | | 0.89 | % | 09/21/2016 | | SEK | 730,501 | | 158 | |
N/A | | Stockholm Interbank Offered Rate | | Paying | | 0.89 | % | 09/21/2016 | | SEK | 365,251 | | 79 | |
N/A | | Stockholm Interbank Offered Rate | | Paying | | 0.81 | % | 09/21/2016 | | SEK | 365,251 | | 70 | |
N/A | | Stockholm Interbank Offered Rate | | Paying | | 0.76 | % | 09/21/2016 | | SEK | 365,251 | | 62 | |
N/A | | Stockholm Interbank Offered Rate | | Paying | | 0.76 | % | 09/21/2016 | | SEK | 730,501 | | 123 | |
N/A | | Stockholm Interbank Offered Rate | | Paying | | 0.77 | % | 09/21/2016 | | SEK | 365,251 | | 62 | |
N/A | | Stockholm Interbank Offered Rate | | Paying | | 0.77 | % | 09/21/2016 | | SEK | 328,896 | | 57 | |
N/A | | Stockholm Interbank Offered Rate | | Paying | | 0.76 | % | 09/21/2016 | | SEK | 513,940 | | 87 | |
N/A | | Stockholm Interbank Offered Rate | | Paying | | 0.70 | % | 09/21/2016 | | SEK | 584,394 | | 85 | |
| | | | | | | | | | | | $ | (443 | ) |
Schedule of Over the Counter Cross Currency Swap Agreements
Counterparty | | Receive Rate (7) | | Pay Rate (7) | | Expiration
Date | | Notional Amount
Received (1) | | Notional Amount
Delivered (1) | | Unrealized
Appreciation /
(Depreciation) | |
BOA | | Fixed rate of 1.10% | | Sinacofi Chile Interbank Rate | | 12/04/2019 | | CLF | 80 | | CLP | (1,976,616 | ) | $ | (14 | ) |
BOA | | Fixed rate of 1.15% | | Sinacofi Chile Interbank Rate | | 12/09/2019 | | CLF | 52 | | CLP | (1,271,965 | ) | (7 | ) |
BOA | | Fixed rate of 1.23% | | Sinacofi Chile Interbank Rate | | 12/09/2019 | | CLF | 26 | | CLP | (637,103 | ) | 1 | |
DUB | | Fixed rate of 0.95% | | Sinacofi Chile Interbank Rate | | 08/08/2018 | | CLF | 136 | | CLP | (3,261,544 | ) | 38 | |
DUB | | Fixed rate of 1.00% | | Sinacofi Chile Interbank Rate | | 08/07/2018 | | CLF | 130 | | CLP | (3,131,015 | ) | 47 | |
GSI | | Fixed rate of 1.21% | | Sinacofi Chile Interbank Rate | | 10/30/2019 | | CLF | 17 | | CLP | (408,174 | ) | 7 | |
GSI | | Fixed rate of 1.01% | | Sinacofi Chile Interbank Rate | | 11/26/2019 | | CLF | 35 | | CLP | (857,357 | ) | (5 | ) |
GSI | | Fixed rate of 1.03% | | Sinacofi Chile Interbank Rate | | 11/25/2019 | | CLF | 52 | | CLP | (1,268,475 | ) | (10 | ) |
GSI | | Fixed rate of 1.09% | | Sinacofi Chile Interbank Rate | | 11/03/2019 | | CLF | 70 | | CLP | (1,718,700 | ) | (13 | ) |
GSI | | Fixed rate of 1.11% | | Sinacofi Chile Interbank Rate | | 11/21/2019 | | CLF | 35 | | CLP | (855,937 | ) | — | |
GSI | | Fixed rate of 1.17% | | Sinacofi Chile Interbank Rate | | 10/20/2019 | | CLF | 35 | | CLP | (848,165 | ) | 15 | |
GSI | | Fixed rate of 1.17% | | Sinacofi Chile Interbank Rate | | 11/20/2019 | | CLF | 17 | | CLP | (427,826 | ) | 2 | |
GSI | | Fixed rate of 1.17% | | Sinacofi Chile Interbank Rate | | 12/09/2019 | | CLF | 96 | | CLP | (2,356,296 | ) | (1 | ) |
GSI | | Fixed rate of 1.21% | | Sinacofi Chile Interbank Rate | | 10/29/2019 | | CLF | 51 | | CLP | (1,223,422 | ) | 52 | |
GSI | | Fixed rate of 1.21% | | Sinacofi Chile Interbank Rate | | 11/05/2019 | | CLF | 17 | | CLP | (408,804 | ) | 7 | |
GSI | | Fixed rate of 1.21% | | Sinacofi Chile Interbank Rate | | 11/06/2019 | | CLF | 50 | | CLP | (1,226,702 | ) | 19 | |
GSI | | Fixed rate of 1.21% | | Sinacofi Chile Interbank Rate | | 11/07/2019 | | CLF | 34 | | CLP | (818,028 | ) | 12 | |
GSI | | Fixed rate of 1.23% | | Sinacofi Chile Interbank Rate | | 11/07/2019 | | CLF | 67 | | CLP | (1,636,032 | ) | 27 | |
GSI | | Fixed rate of 1.26% | | Sinacofi Chile Interbank Rate | | 11/13/2019 | | CLF | 34 | | CLP | (819,535 | ) | 14 | |
GSI | | Fixed rate of 1.29% | | Sinacofi Chile Interbank Rate | | 11/17/2019 | | CLF | 52 | | CLP | (1,265,114 | ) | 22 | |
GSI | | Fixed rate of 1.29% | | Sinacofi Chile Interbank Rate | | 12/15/2019 | | CLF | 33 | | CLP | (816,265 | ) | 5 | |
JPM | | 3-Month LIBOR | | Fixed rate of 5.85% | | 01/06/2021 | | 9,387 | | TRY | (17,366 | ) | 2,467 | |
JPM | | 3-Month LIBOR | | Fixed rate of 7.86% | | 07/21/2021 | | 7,142 | | TRY | (13,678 | ) | 1,292 | |
| | | | | | | | | | | | | | | | |
See accompanying Notes to Financial Statements.
Counterparty | | Receive Rate (7) | | Pay Rate (7) | | Expiration
Date | | Notional Amount
Received (1) | | Notional Amount
Delivered (1) | | Unrealized
Appreciation /
(Depreciation) | |
JPM | | Fixed rate of 10.76% | | 3-Month LIBOR | | 04/08/2016 | | TRY | 7,891 | | | (3,705 | ) | $ | 72 | |
| | | | | | | | | | | | | | $ | 4,049 | |
Schedule of Credit Default Swap Agreements
Counterparty | | Reference Obligation | | Implied
Credit
Spread (4) | | Fixed
Received /
Pay Rate (6) | | Expiration
Date | | Notional
Amount (1),(5) | | Value | | Premiums
Paid /
(Received) | | Unrealized
Appreciation /
(Depreciation) | |
Over the Counter Credit Default Swap Agreements | | | | | | | | | | | | | |
Credit default swap agreements - purchase protection(2) | | | | | | | | | | | | | |
GSI | | Central Bank of Tunisia, 8.25%, 09/19/2027 | | N/A | | 1.00 | % | 06/20/2018 | | $ | 3,200 | | $ | 144 | | $ | 424 | | $ | (280 | ) |
DUB | | Kingdom of Thailand, 7.07%, 09/30/2013 | | N/A | | 1.00 | % | 06/20/2018 | | 4,900 | | (63 | ) | (36 | ) | (27 | ) |
JPM | | Kingdom of Thailand, 7.07%, 09/30/2013 | | N/A | | 1.00 | % | 06/20/2018 | | 4,250 | | (55 | ) | (15 | ) | (40 | ) |
GSI | | Lebanese Republic, 11.63%, 05/11/2016 | | N/A | | 1.00 | % | 06/20/2018 | | 17,491 | | 1,290 | | 2,422 | | (1,132 | ) |
GSI | | Lebanese Republic, 11.63%, 05/11/2016 | | N/A | | 5.00 | % | 12/20/2018 | | 228 | | (13 | ) | (12 | ) | (1 | ) |
GSI | | Lebanese Republic, 11.63%, 05/11/2016 | | N/A | | 5.00 | % | 12/20/2018 | | 245 | | (14 | ) | (13 | ) | (1 | ) |
JPM | | People’s Republic of China, 4.25%, 10/28/2014 | | N/A | | 1.00 | % | 06/20/2018 | | 11,250 | | (184 | ) | (143 | ) | (41 | ) |
DUB | | Republic of Colombia, 10.38%, 01/28/2033 | | N/A | | 1.00 | % | 06/20/2023 | | 5,291 | | 322 | | 175 | | 147 | |
BNP | | Republic of Croatia, 5.00%, 04/15/2014 | | N/A | | 1.00 | % | 06/20/2018 | | 2,000 | | 78 | | 170 | | (92 | ) |
BNP | | Republic of Croatia, 5.00%, 04/15/2014 | | N/A | | 1.00 | % | 06/20/2018 | | 700 | | 28 | | 57 | | (29 | ) |
BNP | | Republic of Croatia, 5.00%, 04/15/2014 | | N/A | | 1.00 | % | 06/20/2018 | | 7,900 | | 311 | | 715 | | (404 | ) |
CIT | | Republic of Croatia, 5.00%, 04/15/2014 | | N/A | | 1.00 | % | 06/20/2018 | | 690 | | 27 | | 57 | | (30 | ) |
GSI | | Republic of South Africa, 5.50%, 03/09/2020 | | N/A | | 1.00 | % | 12/20/2023 | | 13,500 | | 1,396 | | 1,769 | | (373 | ) |
JPM | | Republic of South Africa, 5.50%, 03/09/2020 | | N/A | | 1.00 | % | 06/20/2023 | | 20,000 | | 1,922 | | 1,838 | | 84 | |
BNP | | Russian Federation, 7.50%, 03/31/2030 | | N/A | | 1.00 | % | 06/20/2023 | | 1,500 | | 337 | | 117 | | 220 | |
BNP | | Russian Federation, 7.50%, 03/31/2030 | | N/A | | 1.00 | % | 06/20/2023 | | 6,500 | | 1,459 | | 489 | | 970 | |
DUB | | Russian Federation, 7.50%, 03/31/2030 | | N/A | | 1.00 | % | 06/20/2018 | | 9,906 | | 1,178 | | 183 | | 995 | |
BNP | | State of Qatar, 9.75%, 06/15/2030 | | N/A | | 1.00 | % | 06/20/2019 | | 1,019 | | (13 | ) | (19 | ) | 6 | |
BOA | | State of Qatar, 9.75%, 06/15/2030 | | N/A | | 1.00 | % | 06/20/2019 | | 1,020 | | (13 | ) | (26 | ) | 13 | |
BOA | | State of Qatar, 9.75%, 06/15/2030 | | N/A | | 1.00 | % | 06/20/2019 | | 1,020 | | (12 | ) | (24 | ) | 12 | |
CIT | | State of Qatar, 9.75%, 06/15/2030 | | N/A | | 1.00 | % | 06/20/2019 | | 3,830 | | (47 | ) | (89 | ) | 42 | |
DUB | | State of Qatar, 9.75%, 06/15/2030 | | N/A | | 1.00 | % | 06/20/2019 | | 1,019 | | (13 | ) | (18 | ) | 5 | |
GSI | | State of Qatar, 9.75%, 06/15/2030 | | N/A | | 1.00 | % | 12/20/2023 | | 2,506 | | 35 | | 4 | | 31 | |
GSI | | State of Qatar, 9.75%, 06/15/2030 | | N/A | | 1.00 | % | 12/20/2023 | | 700 | | 10 | | 2 | | 8 | |
JPM | | State of Qatar, 9.75%, 06/15/2030 | | N/A | | 1.00 | % | 03/20/2019 | | 900 | | (12 | ) | (15 | ) | 3 | |
JPM | | State of Qatar, 9.75%, 06/15/2030 | | N/A | | 1.00 | % | 06/20/2019 | | 1,953 | | (24 | ) | (38 | ) | 14 | |
JPM | | State of Qatar, 9.75%, 06/15/2030 | | N/A | | 1.00 | % | 06/20/2019 | | 970 | | (12 | ) | (25 | ) | 13 | |
BNP | | United Mexican States, 5.95%, 03/19/2019 | | N/A | | 1.00 | % | 06/20/2023 | | 5,080 | | 167 | | 146 | | 21 | |
BNP | | United Mexican States, 5.95%, 03/19/2019 | | N/A | | 1.00 | % | 06/20/2023 | | 1,211 | | 40 | | 28 | | 12 | |
| | | | | | | | | | $ | 130,779 | | $ | 8,269 | | $ | 8,123 | | $ | 146 | |
Credit default swap agreements - sell protection(3) | | | | | | | | | | | | | |
GSI | | Republic of South Africa, 5.50%, 03/09/2020 | | 1.53 | % | 1.00 | % | 12/20/2018 | | $ | (10,000 | ) | $ | (199 | ) | $ | (502 | ) | $ | 303 | |
JPM | | Republic of South Africa, 5.50%, 03/09/2020 | | 1.39 | % | 1.00 | % | 06/20/2018 | | (20,000 | ) | (260 | ) | (516 | ) | 256 | |
BNP | | Republic of Turkey, 11.88%, 01/15/2030 | | 2.23 | % | 1.00 | % | 06/20/2023 | | (2,000 | ) | (177 | ) | (120 | ) | (57 | ) |
BNP | | Republic of Turkey, 11.88%, 01/15/2030 | | 2.23 | % | 1.00 | % | 06/20/2023 | | (2,236 | ) | (198 | ) | (128 | ) | (70 | ) |
GSI | | Republic of Turkey, 11.88%, 01/15/2030 | | 1.43 | % | 1.00 | % | 09/20/2018 | | (5,450 | ) | (83 | ) | (115 | ) | 32 | |
GSI | | Republic of Turkey, 11.88%, 01/15/2030 | | 1.43 | % | 1.00 | % | 09/20/2018 | | (3,300 | ) | (50 | ) | (65 | ) | 15 | |
MSC | | Republic of Turkey, 11.88%, 01/15/2030 | | 1.43 | % | 1.00 | % | 09/20/2018 | | (2,570 | ) | (39 | ) | (52 | ) | 13 | |
MSC | | Republic of Turkey, 11.88%, 01/15/2030 | | 1.43 | % | 1.00 | % | 09/20/2018 | | (7,980 | ) | (121 | ) | (162 | ) | 41 | |
MSC | | Republic of Turkey, 11.88%, 01/15/2030 | | 1.43 | % | 1.00 | % | 09/20/2018 | | (5,450 | ) | (83 | ) | (116 | ) | 33 | |
MSC | | Republic of Turkey, 11.88%, 01/15/2030 | | 1.43 | % | 1.00 | % | 09/20/2018 | | (1,090 | ) | (17 | ) | (23 | ) | 6 | |
MSC | | Republic of Turkey, 11.88%, 01/15/2030 | | 1.43 | % | 1.00 | % | 09/20/2018 | | (3,300 | ) | (50 | ) | (67 | ) | 17 | |
MSC | | Republic of Turkey, 11.88%, 01/15/2030 | | 1.43 | % | 1.00 | % | 09/20/2018 | | (1,100 | ) | (16 | ) | (21 | ) | 5 | |
MSC | | Republic of Turkey, 11.88%, 01/15/2030 | | 1.43 | % | 1.00 | % | 09/20/2018 | | (1,600 | ) | (25 | ) | (34 | ) | 9 | |
BNP | | Russian Federation, 7.50%, 03/31/2030 | | 4.83 | % | 1.00 | % | 03/20/2019 | | (1,150 | ) | (160 | ) | (68 | ) | (92 | ) |
DUB | | Russian Federation, 7.50%, 03/31/2030 | | 4.83 | % | 1.00 | % | 03/20/2019 | | (1,700 | ) | (236 | ) | (101 | ) | (135 | ) |
See accompanying Notes to Financial Statements.
Counterparty | | Reference Obligation | | Implied
Credit
Spread (4) | | Fixed
Received /
Pay Rate (6) | | Expiration
Date | | Notional
Amount (1),(5) | | Value | | Premiums
Paid /
(Received) | | Unrealized
Appreciation /
(Depreciation) | |
Over the Counter Credit Default Swap Agreements (continued) | | | | | | | | | | | | | |
Credit default swap agreements - sell protection(3) (continued) | | | | | | | | | | | | | |
GSI | | Russian Federation, 7.50%, 03/31/2030 | | 4.83 | % | 1.00 | % | 03/20/2019 | | $ | (960 | ) | $ | (134 | ) | $ | (57 | ) | $ | (77 | ) |
| | | | | | | | | | $ | (69,886 | ) | $ | (1,848 | ) | $ | (2,147 | ) | $ | 299 | |
Schedule of Over the Counter Total Return Swap Agreements
Counterparty | | Receiving Return of Reference Entity | | Rate Paid by Fund | | Expiration
Date | | Notional
Amount (1) | | Unrealized
Appreciation | |
CIT | | Sri Lanka Government Bond, 6.20%, 6/15/2015 | | 3-Month LIBOR +1.00% | | 06/15/2015 | | LKR | 138,850 | | $ | 30 | |
| | | | | | | | | | $ | 30 | |
| | | | | | | | | | | | | |
Counterparty | | Paying Return of Reference Entity | | Rate Paid by Fund | | Expiration
Date | | Notional
Amount (1) | | Unrealized
(Depreciation) | |
JPM | | WIG20 Index Future | | N/A | | 03/20/2015 | | PLN | (12,063 | ) | $ | (29 | ) |
| | | | | | | | | | $ | (29 | ) |
| | | | | | | | | | | | | |
Schedule of Over the Counter Non-Deliverable Bond Forward Contracts
Counterparty | | Receiving Return of Reference Obligation | | Expiration Date | | Notional
Amount(1) | | Unrealized
Appreciation/
(Depreciation) | |
DUB | | Republic of Colombia Treasury Bond, 7.25%, 06/15/2016 | | 01/15/2015 | | COP | 31,840,000 | | $ | (40 | ) |
BOA | | Republic of Colombia Treasury Bond, 7.25%, 06/15/2016 | | 01/21/2015 | | COP | 48,000,000 | | (37 | ) |
BOA | | Republic of Colombia Treasury Bond, 7.25%, 06/15/2016 | | 01/19/2015 | | COP | 50,000,000 | | 5 | |
DUB | | Republic of Colombia Treasury Bond, 7.25%, 06/15/2016 | | 01/22/2015 | | COP | 3,430,000 | | 2 | |
DUB | | Republic of Colombia Treasury Bond, 10.00%, 07/24/2024 | | 01/22/2015 | | COP | 4,144,000 | | (13 | ) |
DUB | | Republic of Colombia Treasury Bond, 10.00%, 07/24/2024 | | 01/27/2015 | | COP | 276,000 | | — | |
| | | | | | | | $ | (83 | ) |
(1)Notional amount is stated in USD unless otherwise noted.
(2)If the Fund is a buyer of protection and a credit event occurs, as defined under the terms of that particular swap agreement, the Fund will either (i) receive from the seller of protection an amount equal to the notional amount of the referenced obligation agreement and deliver the referenced obligation, other deliverable obligations or underlying securities comprising the referenced index or (ii) receive a net settlement amount in the form of cash or securities equal to the notional amount of the swap agreement less the recovery value of the referenced obligation or underlying securities comprising the referenced index.
(3)If the Fund is a seller of protection and a credit event occurs, as defined under the terms of that particular swap agreement, the Fund will either (i) pay the buyer of protection an amount equal to the notional amount of the referenced obligation and take delivery of the referenced obligation, other deliverable obligations or underlying securities comprising the referenced index or (ii) pay a net settlement amount in the form of cash or securities equal to the notional amount of the swap agreement less the recovery value of the reference obligation or underlying securities comprising the referenced index.
(4)Implied credit spreads, represented in absolute terms, utilized in determining the value of credit default swap agreements on corporate issues and sovereign issues serve as an indicator of the current status of the payment/performance risk and represent the likelihood or risk of default for the credit derivative. The implied credit spread of a particular referenced entity reflects the cost of buying/selling protection and may include upfront payments required to be made to enter into the agreement. Wider credit spreads represent a deterioration of the referenced entity’s credit soundness and a greater likelihood or risk of default or other credit event occurring as defined under the terms of the applicable agreement.
(5)The maximum potential amount the Fund could be required to pay as a seller of credit protection or receive as a buyer of credit protection if a credit event occurs is limited to the total notional amount which is defined under the terms of each swap agreement.
(6)If the Fund is a buyer of protection, the Fund pays the fixed rate. If the Fund is a seller of protection, the Fund receives the fixed rate.
(7)Payments delivered or received are based on the notional amount.
See accompanying Notes to Financial Statements.
Curian/Epoch Global Shareholder Yield Fund *
| | Shares/Par † | | Value | |
COMMON STOCKS - 96.4% | | | | | |
| | | | | |
CONSUMER DISCRETIONARY - 6.2% | | | | | |
Daimler AG | | 9 | | $ | 706 | |
Shaw Communications Inc. - Class B (a) | | 19 | | 526 | |
Other Securities | | | | 2,322 | |
| | | | 3,554 | |
CONSUMER STAPLES - 14.0% | | | | | |
Altria Group Inc. | | 24 | | 1,186 | |
British American Tobacco Plc | | 12 | | 641 | |
Imperial Tobacco Group Plc | | 25 | | 1,098 | |
Kimberly-Clark Corp. | | 5 | | 543 | |
Lorillard Inc. | | 17 | | 1,056 | |
Philip Morris International Inc. | | 7 | | 538 | |
Reynolds American Inc. | | 15 | | 978 | |
Other Securities | | | | 1,996 | |
| | | | 8,036 | |
ENERGY - 8.4% | | | | | |
ConocoPhillips | | 7 | | 486 | |
Kinder Morgan Inc. | | 23 | | 972 | |
Royal Dutch Shell Plc - ADR - Class A | | 11 | | 752 | |
Total SA | | 16 | | 800 | |
Other Securities | | | | 1,805 | |
| | | | 4,815 | |
FINANCIALS - 11.1% | | | | | |
CME Group Inc. | | 10 | | 898 | |
Health Care REIT Inc. | | 14 | | 1,046 | |
Muenchener Rueckversicherungs AG | | 4 | | 858 | |
SCOR SE | | 19 | | 568 | |
Unibail-Rodamco SE | | 2 | | 543 | |
Wells Fargo & Co. | | 9 | | 486 | |
Other Securities | | | | 1,940 | |
| | | | 6,339 | |
HEALTH CARE - 6.5% | | | | | |
AbbVie Inc. | | 8 | | 510 | |
GlaxoSmithKline Plc | | 38 | | 825 | |
Novartis AG | | 6 | | 583 | |
Other Securities | | | | 1,829 | |
| | | | 3,747 | |
INDUSTRIALS - 7.6% | | | | | |
BAE Systems Plc | | 114 | | 837 | |
Corrections Corp. of America | | 20 | | 724 | |
Lockheed Martin Corp. (a) | | 3 | | 619 | |
Vinci SA | | 14 | | 789 | |
Other Securities | | | | 1,415 | |
| | | | 4,384 | |
INFORMATION TECHNOLOGY - 4.1% | | | | | |
Other Securities | | | | 2,369 | |
| | | | | |
MATERIALS - 5.7% | | | | | |
BASF SE | | 7 | | 582 | |
Dow Chemical Co. | | 11 | | 481 | |
Potash Corp. of Saskatchewan Inc. | | 21 | | 739 | |
Yara International ASA | | 11 | | 509 | |
Other Securities | | | | 971 | |
| | | | 3,282 | |
TELECOMMUNICATION SERVICES - 14.9% | | | | | |
AT&T Inc. | | 27 | | 910 | |
BCE Inc. | | 24 | | 1,090 | |
CenturyTel Inc. | | 21 | | 845 | |
Deutsche Telekom AG | | 55 | | 885 | |
Swisscom AG | | 2 | | 894 | |
Telstra Corp. Ltd. | | 170 | | 824 | |
Verizon Communications Inc. | | 20 | | 913 | |
Vivendi SA | | 21 | | 521 | |
Vodafone Group Plc | | 293 | | 1,005 | |
Other Securities | | | | 646 | |
| | | | 8,533 | |
UTILITIES - 17.9% | | | | | |
Ameren Corp. | | 21 | | 976 | |
Centrica Plc | | 145 | | 629 | |
Duke Energy Corp. | | 12 | | 997 | |
Electricite de France SA | | 27 | | 732 | |
National Grid Plc | | 71 | | 1,006 | |
PPL Corp. | | 25 | | 913 | |
SSE Plc | | 40 | | 1,012 | |
TECO Energy Inc. | | 36 | | 740 | |
Terna Rete Elettrica Nazionale SpA (a) | | 173 | | 786 | |
United Utilities Group Plc | | 62 | | 878 | |
Other Securities | | | | 1,573 | |
| | | | 10,242 | |
Total Common Stocks (cost $52,797) | | | | 55,301 | |
| | | | | |
SHORT TERM INVESTMENTS - 7.9% | | | | | |
| | | | | |
Investment Company - 2.7% | | | | | |
JNL Money Market Fund, 0.01% (b) (c) | | 1,522 | | 1,522 | |
| | | | | |
Securities Lending Collateral - 5.2% | | | | | |
Repurchase Agreement with CSI, 0.07% (Collateralized by $2,030 U.S. Treasury Bond Strip, due 11/15/37-11/15/39, value $1,020) acquired on 12/31/14, due 01/02/15 at $1,000 | | $ | 1,000 | | 1,000 | |
Repurchase Agreement with MLP, 0.06% (Collateralized by $660 U.S. Treasury Bond, 6.25%, due 05/15/30, value $991 and $1,092 U.S. Treasury Note, 0.13%, due 07/15/24, value $1,049) acquired on 12/31/14, due 01/02/15 at $2,000 | | 2,000 | | 2,000 | |
| | | | 3,000 | |
Total Short Term Investments (cost $4,522) | | | | 4,522 | |
| | | | | |
Total Investments - 104.3% (cost $57,319) | | | | 59,823 | |
Other Assets and Liabilities, Net - (4.3%) | | | | (2,461 | ) |
Total Net Assets - 100.0% | | | | $ | 57,362 | |
| | | | | | | |
(a) | All or portion of the security was on loan. |
(b) | Investment in affiliate. |
(c) | Yield changes daily to reflect current market conditions. Rate was the quoted yield as of December 31, 2014. |
See accompanying Notes to Financial Statements.
Investments by Country‡ | | Percentage of Total
Long-Term
Investments | |
Australia | | 3.4 | % |
Canada | | 4.9 | |
France | | 7.8 | |
Germany | | 6.0 | |
Ireland | | 0.8 | |
Italy | | 1.4 | |
Netherlands | | 2.0 | |
Norway | | 2.2 | |
Philippines | | 0.6 | |
Sweden | | 0.7 | |
Switzerland | | 3.9 | |
United Kingdom | | 19.7 | |
United States | | 46.6 | |
Total Long-Term Investments | | 100.0 | % |
‡ | The country table is presented for this Fund because its strategy includes investment in non-U.S. securities as deemed significant by the Fund’s Adviser. |
Curian/FAMCO Flex Core Covered Call Fund
| | Shares/Par † | | Value | |
COMMON STOCKS - 101.7% | | | | | |
| | | | | |
CONSUMER DISCRETIONARY - 16.9% | | | | | |
Ford Motor Co. | | 483 | | $ | 7,485 | |
Home Depot Inc. | | 109 | | 11,389 | |
Ross Stores Inc. | | 40 | | 3,770 | |
Time Warner Inc. | | 101 | | 8,636 | |
Whirlpool Corp. | | 56 | | 10,753 | |
| | | | 42,033 | |
CONSUMER STAPLES - 17.4% | | | | | |
CVS Health Corp. | | 110 | | 10,585 | |
General Mills Inc. | | 100 | | 5,322 | |
Kimberly-Clark Corp. | | 50 | | 5,812 | |
PepsiCo Inc. | | 97 | | 9,210 | |
Procter & Gamble Co. | | 54 | | 4,955 | |
Wal-Mart Stores Inc. | | 83 | | 7,145 | |
| | | | 43,029 | |
ENERGY - 3.8% | | | | | |
Chevron Corp. | | 43 | | 4,824 | |
ConocoPhillips | | 65 | | 4,496 | |
| | | | 9,320 | |
FINANCIALS - 8.0% | | | | | |
American Express Co. | | 48 | | 4,429 | |
BlackRock Inc. | | 25 | | 8,760 | |
JPMorgan Chase & Co. | | 106 | | 6,602 | |
| | | | 19,791 | |
HEALTH CARE - 9.9% | | | | | |
Baxter International Inc. | | 114 | | 8,384 | |
Johnson & Johnson | | 78 | | 8,157 | |
Pfizer Inc. | | 255 | | 7,934 | |
| | | | 24,475 | |
INDUSTRIALS - 23.2% | | | | | |
Delta Air Lines Inc. | | 99 | | 4,855 | |
General Electric Co. | | 278 | | 7,020 | |
Honeywell International Inc. | | 72 | | 7,214 | |
Lockheed Martin Corp. | | 36 | | 6,990 | |
Raytheon Co. | | 65 | | 6,977 | |
Union Pacific Corp. | | 139 | | 16,595 | |
United Technologies Corp. | | 70 | | 8,004 | |
| | | | 57,655 | |
INFORMATION TECHNOLOGY - 15.2% | | | | | |
Apple Inc. | | 97 | | 10,740 | |
Cisco Systems Inc. | | 302 | | 8,389 | |
EMC Corp. | | 238 | | 7,075 | |
International Business Machines Corp. | | 25 | | 3,963 | |
QUALCOMM Inc. | | 100 | | 7,418 | |
| | | | 37,585 | |
MATERIALS - 2.8% | | | | | |
Dow Chemical Co. | | 153 | | 6,974 | |
| | | | | |
TELECOMMUNICATION SERVICES - 4.5% | | | | | |
AT&T Inc. | | 181 | | 6,070 | |
Verizon Communications Inc. | | 111 | | 5,211 | |
| | | | 11,281 | |
Total Common Stocks (cost $217,494) | | | | 252,143 | |
| | | | | |
SHORT TERM INVESTMENTS - 2.0% | | | | | |
| | | | | |
Investment Company - 2.0% | | | | | |
JNL Money Market Fund, 0.01% (a) (b) | | 4,882 | | 4,882 | |
Total Short Term Investments (cost $4,882) | | | | 4,882 | |
| | | | | |
Total Investments - 103.7% (cost $222,376) | | | | 257,025 | |
Other Assets and Liabilities, Net - (3.7%) | | | | (9,101 | ) |
Total Net Assets - 100.0% | | | | $ | 247,924 | |
(a) | Investment in affiliate. |
(b) | Yield changes daily to reflect current market conditions. Rate was the quoted yield as of December 31, 2014. |
See accompanying Notes to Financial Statements.
Curian Variable Series Trust Sub-Advised Funds
Schedules of Investments (in thousands, except contracts)
December 31, 2014
Schedule of Written Call Options
| | Expiration
Date | | Exercise
Price | | Contracts | | Value | |
Options on Securities | | | | | | | | | |
American Express Co. | | 01/17/2015 | | 95.00 | | 476 | | $ | (32 | ) |
Apple Inc. | | 01/17/2015 | | 120.00 | | 511 | | (9 | ) |
Apple Inc. | | 02/20/2015 | | 125.00 | | 462 | | (41 | ) |
AT&T Inc. | | 02/20/2015 | | 35.00 | | 86 | | (2 | ) |
AT&T Inc. | | 02/20/2015 | | 36.00 | | 1,721 | | (17 | ) |
Baxter International Inc. | | 01/17/2015 | | 75.00 | | 1,144 | | (34 | ) |
BlackRock Inc. | | 01/15/2016 | | 350.00 | | 233 | | (757 | ) |
BlackRock Inc. | | 01/15/2016 | | 360.00 | | 12 | | (33 | ) |
Chevron Corp. | | 02/20/2015 | | 110.00 | | 410 | | (215 | ) |
Chevron Corp. | | 02/20/2015 | | 115.00 | | 20 | | (5 | ) |
Cisco Systems Inc. | | 02/20/2015 | | 27.00 | | 1,070 | | (148 | ) |
Cisco Systems Inc. | | 02/20/2015 | | 29.00 | | 1,946 | | (82 | ) |
ConocoPhillips | | 01/17/2015 | | 67.50 | | 651 | | (181 | ) |
CVS Caremark Corp. | | 05/15/2015 | | 95.00 | | 557 | | (297 | ) |
CVS Caremark Corp. | | 01/15/2016 | | 97.50 | | 542 | | (369 | ) |
Delta Airlines Inc. | | 01/17/2015 | | 45.00 | | 987 | | (450 | ) |
Dow Chemical Co. | | 03/20/2015 | | 48.00 | | 363 | | (49 | ) |
Dow Chemical Co. | | 01/15/2016 | | 55.00 | | 300 | | (45 | ) |
Dow Chemical Co. | | 01/15/2016 | | 57.50 | | 866 | | (92 | ) |
EMC Corp. | | 01/17/2015 | | 31.00 | | 113 | | (2 | ) |
EMC Corp. | | 01/17/2015 | | 32.00 | | 928 | | (5 | ) |
EMC Corp. | | 01/15/2016 | | 35.00 | | 1,338 | | (150 | ) |
Ford Motor Co. | | 01/17/2015 | | 16.00 | | 1,390 | | (19 | ) |
Ford Motor Co. | | 02/20/2015 | | 16.00 | | 979 | | (34 | ) |
Ford Motor Co. | | 06/19/2015 | | 16.00 | | 2,460 | | (182 | ) |
General Electric Co. | | 01/17/2015 | | 26.00 | | 132 | | (1 | ) |
General Electric Co. | | 01/17/2015 | | 27.00 | | 2,646 | | (5 | ) |
General Mills Inc. | | 01/17/2015 | | 52.50 | | 447 | | (67 | ) |
General Mills Inc. | | 01/17/2015 | | 55.00 | | 191 | | (2 | ) |
General Mills Inc. | | 01/15/2016 | | 57.50 | | 360 | | (60 | ) |
Home Depot Inc. | | 02/20/2015 | | 100.00 | | 1,085 | | (718 | ) |
Honeywell International Inc. | | 03/20/2015 | | 105.00 | | 722 | | (84 | ) |
International Business Machines Corp. | | 01/15/2016 | | 160.00 | | 85 | | (111 | ) |
International Business Machines Corp. | | 01/15/2016 | | 165.00 | | 162 | | (167 | ) |
Johnson & Johnson | | 01/17/2015 | | 110.00 | | 780 | | (9 | ) |
JPMorgan Chase & Co. | | 01/15/2016 | | 67.50 | | 1,055 | | (281 | ) |
Kimberly-Clark Corp. | | 01/17/2015 | | 115.00 | | 503 | | (91 | ) |
Lockheed Martin Corp. | | 03/20/2015 | | 190.00 | | 173 | | (151 | ) |
Lockheed Martin Corp. | | 01/15/2016 | | 200.00 | | 190 | | (219 | ) |
PepsiCo Inc. | | 01/15/2016 | | 97.50 | | 628 | | (245 | ) |
PepsiCo Inc., MSC | | 01/15/2016 | | 100.00 | | 346 | | (106 | ) |
Pfizer Inc. | | 01/17/2015 | | 33.00 | | 1,602 | | (8 | ) |
Pfizer Inc. | | 02/20/2015 | | 31.00 | | 945 | | (88 | ) |
Procter & Gamble Co. | | 02/20/2015 | | 92.50 | | 544 | | (67 | ) |
QUALCOMM Inc. | | 01/17/2015 | | 72.50 | | 451 | | (112 | ) |
QUALCOMM Inc. | | 02/20/2015 | | 75.00 | | 547 | | (133 | ) |
Raytheon Co. | | 02/20/2015 | | 110.00 | | 120 | | (27 | ) |
Raytheon Co. | | 01/15/2016 | | 115.00 | | 525 | | (295 | ) |
Ross Stores Inc. | | 01/17/2015 | | 90.00 | | 234 | | (110 | ) |
Ross Stores Inc. | | 01/17/2015 | | 87.50 | | 166 | | (113 | ) |
Time Warner Inc. | | 04/17/2015 | | 87.50 | | 1,011 | | (308 | ) |
Union Pacific Corp. | | 01/15/2016 | | 125.00 | | 1,393 | | (1,114 | ) |
United Technologies Corp. | | 01/17/2015 | | 115.00 | | 663 | | (118 | ) |
United Technologies Corp. | | 02/20/2015 | | 120.00 | | 33 | | (4 | ) |
Verizon Communications Inc. | | 01/17/2015 | | 52.50 | | 450 | | — | |
Verizon Communications Inc. | | 04/17/2015 | | 50.00 | | 53 | | (2 | ) |
Verizon Communications Inc. | | 04/17/2015 | | 52.50 | | 611 | | (7 | ) |
Wal-Mart Stores Inc. | | 01/17/2015 | | 87.50 | | 832 | | (39 | ) |
Whirlpool Corp. | | 01/17/2015 | | 190.00 | | 26 | | (19 | ) |
| | | | | | | | | | |
See accompanying Notes to Financial Statements.
| | Expiration
Date | | Exercise
Price | | Contracts | | Value | |
Whirlpool Corp. | | 01/15/2016 | | 175.00 | | 529 | | $ | (1,531 | ) |
| | | | | | 39,805 | | $ | (9,662 | ) |
Summary of Written Call Options
| | Contracts | | Premiums | |
Options outstanding at December 31, 2013 | | 11,763 | | $ | 1,572 | |
Options written during the year | | 231,740 | | 29,944 | |
Options closed during the year | | (176,637 | ) | (21,120 | ) |
Options exercised during the year | | (676 | ) | (119 | ) |
Options expired during the year | | (26,385 | ) | (2,884 | ) |
Options outstanding at December 31, 2014 | | 39,805 | | $ | 7,393 | |
See accompanying Notes to Financial Statements.
Curian Variable Series Trust Sub-Advised Funds
Schedules of Investments (in thousands)
December 31, 2014
Curian Focused International Equity Fund
| | Shares/Par † | | Value | |
COMMON STOCKS - 95.8% | | | | | |
| | | | | |
CANADA - 9.0% | | | | | |
Canadian National Railway Co. | | 132 | | $ | 9,086 | |
Canadian Pacific Railway Co. | | 55 | | 10,553 | |
Constellation Software Inc. | | 5 | | 1,410 | |
| | | | 21,049 | |
CHINA - 1.3% | | | | | |
Sun Art Retail Group Ltd. (a) | | 3,129 | | 3,111 | |
| | | | | |
DENMARK - 11.4% | | | | | |
Chr Hansen Holding A/S | | 242 | | 10,721 | |
Novo-Nordisk A/S - ADR | | 202 | | 8,554 | |
Novozymes A/S - Class B | | 174 | | 7,327 | |
| | | | 26,602 | |
FRANCE - 1.8% | | | | | |
LVMH Moet Hennessy Louis Vuitton SA | | 26 | | 4,196 | |
| | | | | |
HONG KONG - 3.6% | | | | | |
Tencent Holdings Ltd. | | 587 | | 8,490 | |
| | | | | |
IRELAND - 2.1% | | | | | |
Experian Plc | | 290 | | 4,896 | |
| | | | | |
JAPAN - 6.0% | | | | | |
Fanuc Ltd. | | 40 | | 6,513 | |
Sysmex Corp. | | 171 | | 7,576 | |
| | | | 14,089 | |
MEXICO - 1.7% | | | | | |
Wal-Mart de Mexico SAB de CV - Class V | | 1,910 | | 4,107 | |
| | | | | |
NETHERLANDS - 11.4% | | | | | |
ASML Holding NV - ADR | | 100 | | 10,759 | |
Core Laboratories NV (a) | | 55 | | 6,608 | |
Sensata Technologies Holding NV (b) | | 178 | | 9,326 | |
| | | | 26,693 | |
RUSSIAN FEDERATION - 1.5% | | | | | |
Yandex NV - Class A (b) | | 195 | | 3,509 | |
| | | | | |
SOUTH AFRICA - 1.8% | | | | | |
Shoprite Holdings Ltd. | | 285 | | 4,132 | |
| | | | | |
SPAIN - 3.3% | | | | | |
Inditex SA | | 269 | | 7,678 | |
| | | | | |
SWEDEN - 2.5% | | | | | |
Svenska Cellulosa AB - Class B | | 270 | | 5,813 | |
| | | | | |
SWITZERLAND - 13.3% | | | | | |
ACE Ltd. | | 95 | | 10,930 | |
Nestle SA | | 115 | | 8,413 | |
SGS SA | | 4 | | 7,535 | |
Swatch Group AG | | 10 | | 4,247 | |
| | | | 31,125 | |
TAIWAN - 5.8% | | | | | |
Taiwan Semiconductor Manufacturing Co. Ltd. - ADR | | 602 | | 13,470 | |
| | | | | |
UNITED KINGDOM - 7.4% | | | | | |
ARM Holdings Plc - ADR | | 174 | | 8,056 | |
Indivior Plc (b) | | 112 | | 262 | |
Reckitt Benckiser Group Plc | | 112 | | 9,101 | |
| | | | 17,419 | |
UNITED STATES OF AMERICA - 11.9% | | | | | |
Coca-Cola Enterprises Inc. | | 189 | | 8,355 | |
Lazard Ltd. - Class A | | 197 | | 9,879 | |
Perrigo Co. Plc (a) | | 57 | | 9,578 | |
| | | | 27,812 | |
Total Common Stocks (cost $226,881) | | | | 224,191 | |
| | | | | |
RIGHTS - 0.2% | | | | | |
LVMH Moet Hennessy (b) (c) | | 26 | | 451 | |
Total Rights (cost $437) | | | | 451 | |
| | | | | |
SHORT TERM INVESTMENTS - 5.1% | | | | | |
| | | | | |
Investment Company - 4.2% | | | | | |
JNL Money Market Fund, 0.01% (d) (e) | | 9,724 | | 9,724 | |
| | | | | |
Securities Lending Collateral - 0.9% | | | | | |
Repurchase Agreement with MLP, 0.06% (Collateralized by $736 U.S. Treasury Bond, 6.25%, due 05/15/30, value $1,105 and $1,218 U.S. Treasury Note, 0.13%, due 07/15/24, value $1,170) acquired on 12/31/14, due 01/02/15 at $2,230 | | $ | 2,230 | | 2,230 | |
Total Short Term Investments (cost $11,954) | | | | 11,954 | |
| | | | | |
Total Investments - 101.1% (cost $239,272) | | | | 236,596 | |
Other Assets and Liabilities, Net - (1.1%) | | | | (2,668 | ) |
Total Net Assets - 100.0% | | | | $ | 233,928 | |
| | | | | | | |
(a) | All or portion of the security was on loan. |
(b) | Non-income producing security. |
(c) | Security fair valued in good faith in accordance with the procedures approved by the Trust’s Board of Trustees. Good faith fair valued securities may be classified as Level 2 or Level 3 for FASB ASC Topic 820 “Fair Value Measurement” based on the applicable valuation inputs. See FASB ASC Topic 820 “Fair Value Measurement” in the Notes to Financial Statements. |
(d) | Investment in affiliate. |
(e) | Yield changes daily to reflect current market conditions. Rate was the quoted yield as of December 31, 2014. |
Curian Focused U.S. Equity Fund
| | Shares/Par † | | Value | |
COMMON STOCKS - 96.2% | | | | | |
| | | | | |
CONSUMER DISCRETIONARY - 18.7% | | | | | |
Cabela’s Inc. - Class A (a) (b) | | 55 | | $ | 2,903 | |
Carnival Plc | | 57 | | 2,562 | |
Dollar Tree Inc. (a) | | 53 | | 3,715 | |
Pulte Homes Inc. | | 129 | | 2,763 | |
Smith & Wesson Holding Corp. (a) (b) | | 234 | | 2,212 | |
Sturm Ruger & Co. Inc. | | 38 | | 1,325 | |
| | | | 15,480 | |
CONSUMER STAPLES - 4.8% | | | | | |
Lorillard Inc. | | 63 | | 3,978 | |
| | | | | |
ENERGY - 7.2% | | | | | |
Apache Corp. | | 38 | | 2,388 | |
Atwood Oceanics Inc. | | 51 | | 1,453 | |
ConocoPhillips | | 30 | | 2,095 | |
| | | | 5,936 | |
FINANCIALS - 22.7% | | | | | |
Berkshire Hathaway Inc. - Class B (a) | | 35 | | 5,297 | |
BlackRock Inc. | | 11 | | 3,976 | |
Cincinnati Financial Corp. | | 44 | | 2,292 | |
MBIA Inc. (a) | | 185 | | 1,760 | |
Wells Fargo & Co. | | 100 | | 5,468 | |
| | | | 18,793 | |
| | | | | | |
See accompanying Notes to Financial Statements.
| | Shares/Par † | | Value | |
HEALTH CARE - 6.3% | | | | | |
Eli Lilly & Co. | | 43 | | 2,945 | |
Pfizer Inc. | | 73 | | 2,286 | |
| | | | 5,231 | |
INDUSTRIALS - 13.9% | | | | | |
Alliant Techsystems Inc. | | 21 | | 2,397 | |
General Dynamics Corp. | | 24 | | 3,296 | |
Old Dominion Freight Line Inc. (a) | | 46 | | 3,534 | |
USG Corp. (a) (b) | | 83 | | 2,310 | |
| | | | 11,537 | |
INFORMATION TECHNOLOGY - 9.1% | | | | | |
Corning Inc. | | 148 | | 3,392 | |
EMC Corp. | | 80 | | 2,378 | |
International Business Machines Corp. | | 11 | | 1,777 | |
| | | | 7,547 | |
MATERIALS - 13.5% | | | | | |
Albemarle Corp. (b) | | 68 | | 4,071 | |
NewMarket Corp. | | 11 | | 4,342 | |
Tredegar Corp. | | 123 | | 2,757 | |
| | | | 11,170 | |
Total Common Stocks (cost $78,761) | | | | 79,672 | |
| | | | | |
SHORT TERM INVESTMENTS - 15.3% | | | | | |
| | | | | |
Investment Company - 3.8% | | | | | |
JNL Money Market Fund, 0.01% (c) (d) | | 3,116 | | 3,116 | |
| | | | | |
Securities Lending Collateral - 11.5% | | | | | |
BlackRock Liquidity Funds TempFund Portfolio, 0.07% (d) | | 3,000 | | 3,000 | |
Fidelity Institutional Money Market Portfolio, 0.09% (d) | | 2,000 | | 2,000 | |
Repurchase Agreement with MLP, 0.06% (Collateralized by $1,490 U.S. Treasury Bond, 6.25%, due 05/15/30, value $2,235 and $2,465 U.S. Treasury Note, 0.13%, due 07/15/24, value $2,367) acquired on 12/31/14, due 01/02/15 at $4,511 | | $ | 4,511 | | 4,511 | |
| | | | 9,511 | |
Total Short Term Investments (cost $12,627) | | | | 12,627 | |
| | | | | |
Total Investments - 111.5% (cost $91,388) | | | | 92,299 | |
Other Assets and Liabilities, Net - (11.5%) | | | | (9,495 | ) |
Total Net Assets - 100.0% | | | | $ | 82,804 | |
| | | | | | | |
(a) | Non-income producing security. |
(b) | All or portion of the security was on loan. |
(c) | Investment in affiliate. |
(d) | Yield changes daily to reflect current market conditions. Rate was the quoted yield as of December 31, 2014. |
Curian/Franklin Templeton Frontier Markets Fund
| | Shares/Par † | | Value | |
COMMON STOCKS - 89.0% | | | | | |
| | | | | |
ARGENTINA - 2.1% | | | | | |
Adecoagro SA (a) | | 87 | | $ | 696 | |
Tenaris SA - ADR | | 13 | | 402 | |
Ternium SA - ADR | | 23 | | 404 | |
| | | | 1,502 | |
BOTSWANA - 2.1% | | | | | |
Letshego Holdings Ltd. | | 5,433 | | 1,519 | |
| | | | | |
CANADA - 1.8% | | | | | |
First Quantum Minerals Ltd. | | 50 | | 702 | |
Gran Tierra Energy Inc. (a) | | 154 | | 591 | |
| | | | 1,293 | |
EGYPT - 8.1% | | | | | |
Alexandria Mineral Oils Co. | | 117 | | 995 | |
Eastern Tobacco | | 43 | | 1,325 | |
Egyptian International Pharmaceutical Industrial Co. | | 142 | | 1,563 | |
Global Telecom Holding - GDR (a) (b) | | 313 | | 892 | |
Telecom Egypt Co. | | 625 | | 1,032 | |
| | | | 5,807 | |
GEORGIA - 1.6% | | | | | |
Bank of Georgia Holdings Plc | | 35 | | 1,142 | |
| | | | | |
HONG KONG - 1.9% | | | | | |
NagaCorp Ltd. | | 1,642 | | 1,338 | |
| | | | | |
JORDAN - 0.8% | | | | | |
Arab Potash Co. | | 9 | | 257 | |
Jordan Phosphate Mines (a) | | 36 | | 328 | |
| | | | 585 | |
KAZAKHSTAN - 3.4% | | | | | |
KazMunaiGas Exploration Production JSC - GDR (b) | | 135 | | 1,957 | |
KCell JSC - GDR (c) | | 50 | | 499 | |
| | | | 2,456 | |
KENYA - 2.8% | | | | | |
East African Breweries Ltd. | | 346 | | 1,176 | |
Equity Bank Ltd. | | 1,468 | | 811 | |
| | | | 1,987 | |
KUWAIT - 6.7% | | | | | |
Kuwait Foods Americana | | 39 | | 372 | |
Mobile Telecommunications Co. KSC | | 1,070 | | 1,920 | |
National Bank of Kuwait SAK | | 818 | | 2,530 | |
| | | | 4,822 | |
LEBANON - 0.8% | | | | | |
BLOM Bank SAL - GDR (b) | | 58 | | 596 | |
| | | | | |
MAURITIUS - 2.2% | | | | | |
MCB Group Ltd. | | 189 | | 1,180 | |
New Mauritius Hotels Ltd. | | 159 | | 388 | |
| | | | 1,568 | |
NETHERLANDS - 1.0% | | | | | |
Nostrum Oil & Gas Plc (a) | | 108 | | 708 | |
| | | | | |
NIGERIA - 8.9% | | | | | |
FBN Holdings Plc | | 35,334 | | 1,678 | |
Guinness Nigeria Plc | | 527 | | 480 | |
Nigerian Breweries Plc | | 740 | | 660 | |
SEPLAT Petroleum Development Co. Plc | | 350 | | 787 | |
UAC of Nigeria Plc | | 3,660 | | 680 | |
Zenith Bank Plc | | 20,857 | | 2,074 | |
| | | | 6,359 | |
OMAN - 2.3% | | | | | |
BankMuscat SAOG | | 1,111 | | 1,661 | |
| | | | | |
PAKISTAN - 2.4% | | | | | |
Fauji Fertilizer Co. Ltd. | | 991 | | 1,155 | |
Indus Motor Co. Ltd. | | 64 | | 563 | |
| | | | 1,718 | |
| | | | | | |
| | Shares/Par † | | Value | |
PANAMA - 1.9% | | | | | |
Cable & Wireless Communications Plc | | 676 | | 520 | |
Copa Holdings SA - Class A (d) | | 8 | | 860 | |
| | | | 1,380 | |
PERU - 2.6% | | | | | |
Cia de Minas Buenaventura SA - ADR | | 80 | | 769 | |
Intercorp Financial Services Inc. (b) | | 37 | | 1,115 | |
| | | | 1,884 | |
QATAR - 4.4% | | | | | |
Ooredoo QSC | | 93 | | 3,125 | |
| | | | | |
ROMANIA - 8.8% | | | | | |
Banca Transilvania (a) | | 1,459 | | 751 | |
OMV Petrom SA | | 45,723 | | 5,036 | |
Societatea Nationala de Gaze Naturale ROMGAZ SA | | 56 | | 533 | |
| | | | 6,320 | |
SENEGAL - 1.9% | | | | | |
Sonatel | | 32 | | 1,346 | |
| | | | | |
SOUTH AFRICA - 3.0% | | | | | |
MTN Group Ltd. | | 112 | | 2,134 | |
| | | | | |
SOUTH KOREA - 1.2% | | | | | |
Youngone Corp. | | 18 | | 849 | |
| | | | | |
UKRAINE - 2.8% | | | | | |
Ferrexpo Plc | | 826 | | 685 | |
MHP SA - GDR (b) | | 141 | | 1,301 | |
| | | | 1,986 | |
UNITED ARAB EMIRATES - 4.6% | | | | | |
Aramex PJSC | | 1,252 | | 1,050 | |
Dragon Oil Plc | | 270 | | 2,264 | |
| | | | 3,314 | |
UNITED KINGDOM - 0.0% | | | | | |
African Minerals Ltd. (a) (b) (e) (f) | | 359 | | — | |
| | | | | |
VIETNAM - 5.8% | | | | | |
DHG Pharmaceutical JSC | | 145 | | 649 | |
Hoa Phat Group JSC | | 402 | | 995 | |
Imexpharm Pharmaceutical JSC | | 175 | | 341 | |
PetroVietnam Drilling and Well Services JSC | | 264 | | 796 | |
PetroVietnam Fertilizer & Chemicals JSC | | 387 | | 558 | |
PetroVietnam Technical Service JSC | | 642 | | 808 | |
| | | | 4,147 | |
ZIMBABWE - 3.1% | | | | | |
Delta Corp. Ltd. | | 1,405 | | 1,433 | |
Econet Wireless Zimbabwe Ltd. | | 1,254 | | 753 | |
| | | | 2,186 | |
Total Common Stocks (cost $69,059) | | | | 63,732 | |
| | | | | |
PARTICIPATORY NOTES - 4.8% | | | | | |
| | | | | |
SAUDI ARABIA - 4.8% | | | | | |
Deutsche Bank AG Participatory Note (Samba Financial Group) (c) | | $ | 100 | | 1,024 | |
HSBC Bank Plc Participatory Note (Etihad Etisalat Co.) (c) | | 92 | | 1,058 | |
HSBC Bank Plc Participatory Note (Samba Financial Group) (c) | | 52 | | 533 | |
HSBC Bank Plc Participatory Note (Saudi Basic Industries Corp.) (c) | | 37 | | 807 | |
Total Participatory Notes (cost $4,321) | | | | 3,422 | |
| | | | | |
SHORT TERM INVESTMENTS - 4.6% | | | | | |
| | | | | |
Investment Company - 3.5% | | | | | |
JNL Money Market Fund, 0.01% (g) (h) | | 2,470 | | 2,470 | |
| | | | | |
Securities Lending Collateral - 1.1% | | | | | |
BlackRock Liquidity Funds TempFund Portfolio, 0.07% (h) | | 30 | | 30 | |
Fidelity Institutional Money Market Portfolio, 0.09% (h) | | 30 | | 30 | |
Repurchase Agreement with CSI, 0.07% (Collateralized by $406 U.S. Treasury Bond Strip, due 11/15/37-11/15/39, value $204) acquired on 12/31/14, due 01/02/15 at $200 | | $ | 200 | | 200 | |
Repurchase Agreement with MLP, 0.06% (Collateralized by $173 U.S. Treasury Bond, 6.25%, due 05/15/30, value $260 and $286 U.S. Treasury Note, 0.13%, due 07/15/24, value $275) acquired on 12/31/14, due 01/02/15 at $524 | | 524 | | 524 | |
| | | | 784 | |
Total Short Term Investments (cost $3,254) | | | | 3,254 | |
| | | | | |
Total Investments - 98.4% (cost $76,634) | | | | 70,408 | |
Other Assets and Liabilities, Net - 1.6% | | | | 1,163 | |
Total Net Assets - 100.0% | | | | $ | 71,571 | |
| | | | | | | |
(a) | Non-income producing security. |
(b) | Security is restricted to resale to institutional investors. See Restricted Securities in these Schedules of Investments. |
(c) | The Sub-Adviser has deemed this security which is exempt from registration under the 1933 Act to be liquid based on procedures approved by the Trust’s Board of Trustees. As of December 31, 2014, the aggregate value of these liquid securities was $3,921 which represented 5.4% of net assets. |
(d) | All or portion of the security was on loan. |
(e) | Security fair valued in good faith in accordance with the procedures approved by the Trust’s Board of Trustees. Good faith fair valued securities may be classified as Level 2 or Level 3 for FASB ASC Topic 820 “Fair Value Measurement” based on the applicable valuation inputs. See FASB ASC Topic 820 “Fair Value Measurement” in the Notes to Financial Statements. |
(f) | The Sub-Adviser has deemed this security to be illiquid based on procedures approved by the Trust’s Board of Trustees. |
(g) | Investment in affiliate. |
(h) | Yield changes daily to reflect current market conditions. Rate was the quoted yield as of December 31, 2014. |
See accompanying Notes to Financial Statements.
Restricted Securities - The Fund invests in securities that are restricted under the 1933 Act or which are subject to legal, contractual, or other agreed upon restrictions on resale. Restricted securities are often purchased in private placement transactions and cannot be sold without prior registration unless the sale is pursuant to an exemption under the 1933 Act, as amended. As of December 31, 2014, the Fund held investments in restricted securities, excluding certain securities exempt from registration under the 1933 Act which are deemed to be liquid, as follows:
| | Initial
Acquisition
Date | | Cost | | Ending
Value | | Percent of
Net Assets | |
African Minerals Ltd. | | 11/07/2013 | | $ | 1,031 | | $ | — | | — | % |
BLOM Bank SAL - GDR | | 04/30/2013 | | 494 | | 596 | | 0.8 | |
Global Telecom Holding - GDR | | 09/14/2012 | | 939 | | 892 | | 1.3 | |
Intercorp Financial Services Inc. | | 09/08/2014 | | 1,127 | | 1,115 | | 1.6 | |
KazMunaiGas Exploration Production JSC - GDR | | 09/19/2012 | | 2,367 | | 1,957 | | 2.7 | |
MHP SA — GDR | | 09/13/2012 | | 2,276 | | 1,301 | | 1.8 | |
| | | | $ | 8,234 | | $ | 5,861 | | 8.2 | % |
See accompanying Notes to Financial Statements.
Curian/Franklin Templeton Natural Resources Fund
| | Shares/Par † | | Value | |
COMMON STOCKS - 94.6% | | | | | |
| | | | | |
ENERGY - 74.0% | | | | | |
Anadarko Petroleum Corp. | | 27 | | $ | 2,211 | |
Baker Hughes Inc. | | 16 | | 886 | |
BP Plc - ADR (a) | | 14 | | 530 | |
C&J Energy Services Inc. (b) | | 30 | | 401 | |
Cabot Oil & Gas Corp. - Class A | | 49 | | 1,448 | |
California Resources Corp. (b) | | 12 | | 68 | |
Callon Petroleum Co. (b) | | 56 | | 307 | |
Cameron International Corp. (b) | | 17 | | 839 | |
Canadian Natural Resources Ltd. | | 26 | | 799 | |
Chevron Corp. | | 18 | | 1,997 | |
Cimarex Energy Co. | | 7 | | 774 | |
Cobalt International Energy Inc. (b) | | 39 | | 343 | |
Concho Resources Inc. (b) | | 12 | | 1,232 | |
Devon Energy Corp. | | 10 | | 609 | |
Diamondback Energy Inc. (b) | | 15 | | 903 | |
Dril-Quip Inc. (b) | | 7 | | 533 | |
Eclipse Resources Corp. (b) | | 30 | | 208 | |
EnCana Corp. | | 44 | | 605 | |
Ensco Plc - Class A (a) | | 9 | | 269 | |
EOG Resources Inc. | | 5 | | 502 | |
EQT Corp. | | 12 | | 893 | |
Exxon Mobil Corp. | | 14 | | 1,267 | |
FMC Technologies Inc. (b) | | 14 | | 667 | |
Forum Energy Technologies Inc. (b) | | 10 | | 215 | |
Gran Tierra Energy Inc. (b) | | 123 | | 473 | |
Halliburton Co. | | 32 | | 1,246 | |
Hess Corp. | | 15 | | 1,104 | |
HollyFrontier Corp. | | 17 | | 648 | |
Hornbeck Offshore Services Inc. (b) | | 17 | | 433 | |
Key Energy Services Inc. (b) | | 104 | | 174 | |
Marathon Oil Corp. | | 41 | | 1,168 | |
Marathon Petroleum Corp. | | 3 | | 298 | |
Matador Resources Co. (b) | | 29 | | 577 | |
MEG Energy Corp. (a) (b) | | 12 | | 207 | |
National Oilwell Varco Inc. | | 4 | | 282 | |
Noble Corp. plc (a) | | 15 | | 244 | |
Noble Energy Inc. | | 17 | | 818 | |
Oasis Petroleum Inc. (b) | | 29 | | 477 | |
Occidental Petroleum Corp. | | 27 | | 2,160 | |
Oceaneering International Inc. | | 17 | | 988 | |
Oil States International Inc. (b) | | 4 | | 210 | |
Ophir Energy Plc (b) | | 116 | | 254 | |
Peabody Energy Corp. (a) | | 61 | | 475 | |
Petroleo Brasileiro SA - Petrobras - ADR (a) | | 33 | | 243 | |
PHI Inc. (b) | | 7 | | 267 | |
Phillips 66 | | 13 | | 900 | |
Pioneer Energy Services Corp. (b) | | 84 | | 464 | |
Pioneer Natural Resources Co. | | 6 | | 901 | |
Rex Energy Corp. (a) (b) | | 82 | | 416 | |
RigNet Inc. (b) | | 12 | | 484 | |
Rowan Cos. Plc - Class A | | 20 | | 458 | |
Royal Dutch Shell Plc - ADR - Class A | | 7 | | 499 | |
RPC Inc. | | 10 | | 133 | |
Schlumberger Ltd. | | 24 | | 2,075 | |
SM Energy Co. (a) | | 17 | | 656 | |
Southwestern Energy Co. (b) | | 38 | | 1,032 | |
Superior Energy Services Inc. | | 38 | | 767 | |
Total SA - ADR | | 17 | | 868 | |
Tullow Oil Plc | | 47 | | 305 | |
Valero Energy Corp. | | 9 | | 423 | |
Weatherford International Plc (b) | | 32 | | 363 | |
| | | | 41,996 | |
MATERIALS - 20.6% | | | | | |
Agnico-Eagle Mines Ltd. | | 12 | | 300 | |
AngloGold Ashanti Ltd. - ADR (a) (b) | | 26 | | 229 | |
Axiall Corp. | | 10 | | 442 | |
B2Gold Corp. (a) (b) | | 208 | | 340 | |
Barrick Gold Corp. | | 32 | | 341 | |
BHP Billiton Plc - ADR | | 36 | | 1,561 | |
Celanese Corp. - Class A | | 6 | | 351 | |
First Quantum Minerals Ltd. | | 26 | | 369 | |
Freeport-McMoRan Inc. - Class B | | 44 | | 1,018 | |
G-Resources Group Ltd. (b) | | 8,322 | | 197 | |
Glencore Plc | | 223 | | 1,030 | |
Goldcorp Inc. | | 36 | | 668 | |
Imperial Metals Corp. (a) (b) | | 32 | | 277 | |
LyondellBasell Industries NV - Class A | | 4 | | 353 | |
Martin Marietta Materials Inc. | | 3 | | 331 | |
MMG Ltd. | | 508 | | 157 | |
Mosaic Co. | | 7 | | 338 | |
Nautilus Minerals Inc. (b) | | 53 | | 17 | |
Newcrest Mining Ltd. (b) | | 28 | | 250 | |
PanAust Ltd. | | 268 | | 305 | |
Randgold Resources Ltd. - ADR (a) | | 8 | | 516 | |
Rio Tinto Plc - ADR (a) | | 21 | | 976 | |
Romarco Minerals Inc. (a) (b) | | 404 | | 171 | |
Sandfire Resources NL | | 104 | | 382 | |
Tahoe Resources Inc. | | 9 | | 129 | |
Teck Resources Ltd. - Class B | | 48 | | 657 | |
| | | | 11,705 | |
Total Common Stocks (cost $69,077) | | | | 53,701 | |
| | | | | |
PREFERRED STOCKS - 0.9% | | | | | |
| | | | | |
ENERGY - 0.9% | | | | | |
Sanchez Energy Corp., 4.88% (c) (f) | | 10 | | 293 | |
Sanchez Energy Corp., 6.50% (c) (f) | | 6 | | 205 | |
Total Preferred Stocks (cost $1,013) | | | | 498 | |
| | | | | |
CORPORATE BONDS AND NOTES - 0.9% | | | | | |
| | | | | |
ENERGY - 0.5% | | | | | |
Cobalt International Energy Inc., 3.13%, 05/15/24 (c) | | $ | 372 | | 250 | |
| | | | | |
MATERIALS - 0.4% | | | | | |
Molycorp Inc., 6.00%, 09/01/17 (a) (c) | | 758 | | 227 | |
Total Corporate Bonds and Notes (cost $962) | | | | 477 | |
| | | | | |
SHORT TERM INVESTMENTS - 12.8% | | | | | |
| | | | | |
Investment Company - 3.6% | | | | | |
JNL Money Market Fund, 0.01% (d) (e) | | 2,057 | | 2,057 | |
| | | | | |
Securities Lending Collateral - 9.2% | | | | | |
Repurchase Agreement with CSI, 0.07% (Collateralized by $4,059 U.S. Treasury Bond Strip, due 11/15/37-11/15/39, value $2,040) acquired on 12/31/14, due 01/02/15 at $2,000 | | $ | 2,000 | | 2,000 | |
| | | | | | | |
See accompanying Notes to Financial Statements.
| | Shares/Par † | | Value | |
Repurchase Agreement with MLP, 0.06% (Collateralized by $1,072 U.S. Treasury Bond, 6.25%, due 05/15/30, value $1,609 and $1,774 U.S. Treasury Note, 0.13%, due 07/15/24, value $1,703) acquired on 12/31/14, due 01/02/15 at $3,247 | | 3,247 | | 3,247 | |
| | | | 5,247 | |
Total Short Term Investments (cost $7,304) | | | | 7,304 | |
Total Investments - 109.2% (cost $78,356) | | | | 61,980 | |
Other Assets and Liabilities, Net - (9.2%) | | | | (5,201 | ) |
Total Net Assets - 100.0% | | | | $ | 56,779 | |
| | | | | | |
(a) | All or portion of the security was on loan. |
(b) | Non-income producing security. |
(c) | Convertible security. |
(d) | Investment in affiliate. |
(e) | Yield changes daily to reflect current market conditions. Rate was the quoted yield as of December 31, 2014. |
(f) | Perpetual security. |
Investments by Country‡ | | Percentage of Total
Long-Term
Investments | |
Australia | | 1.7 | % |
Brazil | | 0.4 | |
Canada | | 9.8 | |
France | | 1.6 | |
Hong Kong | | 0.6 | |
Netherlands | | 1.6 | |
South Africa | | 0.4 | |
Switzerland | | 1.9 | |
United Kingdom | | 5.3 | |
United States | | 76.7 | |
Total Long-Term Investments | | 100.0 | % |
‡ | The country table is presented for this Fund because its strategy includes investment in non-U.S. securities as deemed significant by the Fund’s Adviser. |
Curian/Lazard International Strategic Equity Fund
| | Shares/Par † | | Value | |
COMMON STOCKS - 96.1% | | | | | |
| | | | | |
AUSTRALIA - 7.8% | | | | | |
Amcor Ltd. | | 321 | | $ | 3,537 | |
Ansell Ltd. | | 125 | | 2,294 | |
Caltex Australia Ltd. | | 98 | | 2,711 | |
Insurance Australia Group Ltd. | | 213 | | 1,080 | |
| | | | 9,622 | |
BELGIUM - 2.3% | | | | | |
Anheuser-Busch InBev NV | | 25 | | 2,815 | |
| | | | | |
BERMUDA - 1.1% | | | | | |
Signet Jewelers Ltd. | | 11 | | 1,397 | |
| | | | | |
CANADA - 2.3% | | | | | |
Home Capital Group Inc. | | 28 | | 1,157 | |
MacDonald Dettwiler & Associates Ltd. | | 21 | | 1,746 | |
| | | | 2,903 | |
FINLAND - 4.0% | | | | | |
Sampo Oyj | | 107 | | 5,015 | |
| | | | | |
FRANCE - 2.0% | | | | | |
Valeo SA | | 20 | | 2,468 | |
| | | | | |
GERMANY - 6.1% | | | | | |
Bayer AG | | 27 | | 3,733 | |
Fresenius SE & Co. KGaA | | 31 | | 1,637 | |
Symrise AG | | 36 | | 2,199 | |
| | | | 7,569 | |
HONG KONG - 1.8% | | | | | |
AIA Group Ltd. | | 407 | | 2,243 | |
| | | | | |
IRELAND - 2.7% | | | | | |
James Hardie Industries SE - CDI | | 125 | | 1,337 | |
Kerry Group Plc | | 30 | | 2,037 | |
| | | | 3,374 | |
ISRAEL - 3.2% | | | | | |
Israel Discount Bank Ltd. - Class A (a) | | 365 | | 582 | |
Teva Pharmaceutical Industries Ltd. - ADR (b) | | 59 | | 3,376 | |
| | | | 3,958 | |
ITALY - 1.5% | | | | | |
Mediolanum SpA | | 287 | | 1,829 | |
| | | | | |
JAPAN - 19.2% | | | | | |
AEON Financial Service Co. Ltd. (b) | | 86 | | 1,698 | |
Asics Corp. | | 125 | | 3,002 | |
Daiwa House Industry Co. Ltd. | | 149 | | 2,813 | |
Don Quijote Holdings Co. Ltd. | | 66 | | 4,510 | |
Japan Tobacco Inc. | | 43 | | 1,170 | |
KDDI Corp. | | 28 | | 1,740 | |
Makita Corp. | | 51 | | 2,285 | |
Ryohin Keikaku Co. Ltd. | | 14 | | 1,738 | |
SoftBank Corp. | | 67 | | 4,012 | |
United Arrows Ltd. | | 28 | | 793 | |
| | | | 23,761 | |
MACAU - 1.0% | | | | | |
Sands China Ltd. | | 244 | | 1,190 | |
| | | | | |
NETHERLANDS - 1.5% | | | | | |
Koninklijke KPN NV | | 599 | | 1,891 | |
| | | | | |
NEW ZEALAND - 1.6% | | | | | |
Z Energy Ltd. | | 551 | | 1,985 | |
| | | | | |
NORWAY - 0.4% | | | | | |
XXL ASA (a) | | 51 | | 504 | |
| | | | | |
SPAIN - 1.5% | | | | | |
Mediaset Espana Comunicacion SA (a) | | 144 | | 1,805 | |
| | | | | |
SWEDEN - 6.2% | | | | | |
Assa Abloy AB | | 71 | | 3,765 | |
Swedbank AB - Class A | | 159 | | 3,953 | |
| | | | 7,718 | |
SWITZERLAND - 7.8% | | | | | |
Cie Financiere Richemont SA | | 20 | | 1,813 | |
GAM Holding Ltd. | | 88 | | 1,590 | |
Novartis AG | | 53 | | 4,953 | |
Swatch Group AG | | 3 | | 1,243 | |
| | | | 9,599 | |
UNITED KINGDOM - 22.1% | | | | | |
Amec Foster Wheeler Plc | | 100 | | 1,323 | |
Associated British Foods Plc | | 26 | | 1,289 | |
British American Tobacco Plc | | 65 | | 3,538 | |
Close Brothers Group Plc | | 43 | | 995 | |
Informa Plc | | 404 | | 2,951 | |
International Consolidated Airlines Group SA (a) | | 271 | | 2,041 | |
Lloyds Banking Group Plc (a) | | 3,347 | | 3,937 | |
London Stock Exchange Group Plc | | 55 | | 1,908 | |
| | | | | | |
See accompanying Notes to Financial Statements.
| | Shares/Par † | | Value | |
Rexam Plc | | 371 | | 2,615 | |
Shire Plc | | 31 | | 2,170 | |
Spire Healthcare Group PLC (a) | | 320 | | 1,893 | |
Stagecoach Group Plc | | 184 | | 1,053 | |
William Hill Plc | | 291 | | 1,633 | |
| | | | 27,346 | |
Total Common Stocks (cost $117,065) | | | | 118,992 | |
| | | | | |
SHORT TERM INVESTMENTS - 5.8% | | | | | |
| | | | | |
Investment Company - 4.8% | | | | | |
JNL Money Market Fund, 0.01% (c) (d) | | 5,994 | | 5,994 | |
| | | | | |
Securities Lending Collateral - 1.0% | | | | | |
Repurchase Agreement with MLP, 0.06% (Collateralized by $423 U.S. Treasury Bond, 6.25%, due 05/15/30, value $635 and $701 U.S. Treasury Note, 0.13%, due 07/15/24, value $673) acquired on 12/31/14, due 01/02/15 at $1,283 | | $ | 1,283 | | 1,283 | |
Total Short Term Investments (cost $7,277) | | | | 7,277 | |
Total Investments - 101.9% (cost $124,342) | | | | 126,269 | |
Other Assets and Liabilities, Net - (1.9%) | | | | (2,408 | ) |
Total Net Assets - 100.0% | | | | $ | 123,861 | |
| | | | | | | |
(a) | Non-income producing security. |
(b) | All or portion of the security was on loan. |
(c) | Investment in affiliate. |
(d) | Yield changes daily to reflect current market conditions. Rate was the quoted yield as of December 31, 2014. |
Curian Long Short Credit Fund *
| | Shares/Par † | | Value | |
NON-U.S. GOVERNMENT AGENCY ASSET-BACKED SECURITIES - 3.1% | | | | | |
Citigroup Commercial Mortgage Trust REMIC, 0.91%, 06/15/21 (a) (b) (d) | | $ | 4,000 | | $ | 4,004 | |
Citigroup/Deutsche Bank Commercial Mortgage Trust REMIC, 5.23%, 10/15/15 (d) | | 1,887 | | 1,936 | |
Morgan Stanley Capital I Trust REMIC, 4.98%, 06/12/47 (d) | | 475 | | 482 | |
Other Securities | | | | 4,733 | |
Total Non-U.S. Government Agency Asset-Backed Securities
(cost $11,154) | | | | 11,155 | |
| | | | | |
CORPORATE BONDS AND NOTES - 90.6% | | | | | |
| | | | | |
CONSUMER DISCRETIONARY - 17.6% | | | | | |
General Motors Co. | | | | | |
3.50%, 10/02/18 | | 1,500 | | 1,530 | |
5.00%, 04/01/35 | | 1,000 | | 1,042 | |
6.25%, 10/02/43 | | 664 | | 793 | |
Hilton Worldwide Finance LLC, 5.63%, 10/15/21 | | 585 | | 611 | |
Hilton Worldwide Inc. Term Loan B, 3.50%, 09/23/20 (d) | | 1,382 | | 1,364 | |
Numericable Group SA | | | | | |
4.88%, 05/15/19 (c) | | 916 | | 908 | |
5.38%, 05/15/22 (c), EUR | | 1,000 | | 1,249 | |
Schaeffler Finance BV | | | | | |
3.25%, 05/15/19 (c), EUR | | 556 | | 680 | |
3.50%, 05/15/22 (c), EUR | | 358 | | 441 | |
Schaeffler Holding Finance BV, 5.75%, 11/15/21 (c), EUR | | 469 | | 604 | |
Scientific Games International Inc., 7.00%, 01/01/22 (a) (b) | | 699 | | 708 | |
Scientific Games International Inc. Term Loan, 6.00%, 09/17/21 (d) | | 1,500 | | 1,476 | |
Sirius XM Radio Inc., 6.00%, 07/15/24 (c) | | 1,967 | | 2,016 | |
Tenneco Inc. | | | | | |
6.88%, 12/15/20 | | 1,750 | | 1,851 | |
5.38%, 12/15/24 | | 355 | | 364 | |
Univision Communications Inc. Term Loan, 4.00%, 03/01/20 (d) | | 2,119 | | 2,068 | |
Wynn Las Vegas LLC, 7.75%, 08/15/20 | | 2,425 | | 2,583 | |
Other Securities | | | | 42,328 | |
| | | | 62,616 | |
CONSUMER STAPLES - 3.8% | | | | | |
Other Securities | | | | 13,553 | |
| | | | | |
ENERGY - 14.8% | | | | | |
Access Midstream Partners LP | | | | | |
5.88%, 04/15/21 | | 371 | | 387 | |
4.88%, 05/15/23 | | 1,519 | | 1,542 | |
4.88%, 03/15/24 | | 440 | | 447 | |
Chesapeake Energy Corp., 3.48%, 04/15/19 (d) | | 2,467 | | 2,418 | |
DCP Midstream LLC, 5.85%, 05/21/43 (c) (d) | | 2,326 | | 2,256 | |
Fieldwood Energy LLC 1st Lien Term Loan, 3.88%, 09/28/18 (d) | | 1,886 | | 1,783 | |
Fieldwood Energy LLC 2nd Lien Term Loan, 8.38%, 09/24/20 (d) | | 200 | | 145 | |
Kinder Morgan Inc. | | | | | |
3.05%, 12/01/19 | | 1,250 | | 1,240 | |
5.30%, 12/01/34 | | 800 | | 812 | |
Petrobras Global Finance BV | | | | | |
1.85%, 05/20/16 (d) | | 1,150 | | 1,099 | |
2.37%, 01/15/19 (d) | | 1,000 | | 887 | |
4.38%, 05/20/23 | | 841 | | 723 | |
Regency Energy Partners LP | | | | | |
5.88%, 03/01/22 | | 1,729 | | 1,725 | |
5.00%, 10/01/22 | | 567 | | 536 | |
Seadrill Ltd., 6.13%, 09/15/17 (c) (h) | | 2,150 | | 1,903 | |
Seadrill Ltd. Term Loan B, 4.00%, 02/12/21 (d) | | 1,089 | | 842 | |
Other Securities | | | | 33,821 | |
| | | | 52,566 | |
FINANCIALS - 23.7% | | | | | |
Bank of America Corp. | | | | | |
6.25% (callable at 100 beginning 09/05/24) (j) | | 1,373 | | 1,357 | |
6.50% (callable at 100 beginning 10/23/24) (j) | | 785 | | 799 | |
3.30%, 01/11/23 | | 917 | | 917 | |
4.20%, 08/26/24 | | 1,250 | | 1,273 | |
4.25%, 10/22/26 | | 739 | | 737 | |
Barclays Bank Plc | | | | | |
7.75%, 04/10/23 (d) | | 1,000 | | 1,090 | |
3.75%, 05/15/24 | | 2,000 | | 2,061 | |
Barclays Plc | | | | | |
8.00% (callable at 100 beginning 12/15/20) (j), EUR | | 1,100 | | 1,385 | |
8.25% (callable at 100 beginning 12/15/18) (j) | | 1,100 | | 1,127 | |
Citigroup Inc., 5.90%, (callable at 100 beginning 02/15/23) (j) | | 1,100 | | 1,072 | |
Credit Suisse | | | | | |
3.00%, 10/29/21 | | 797 | | 793 | |
3.63%, 09/09/24 | | 1,891 | | 1,924 | |
Credit Suisse AG, 6.50%, 08/08/23 (c) | | 2,481 | | 2,723 | |
Credit Suisse Group AG, 7.50%, (callable at 100 beginning 12/11/23) (c) (j) | | 1,759 | | 1,829 | |
Five Corners Funding Trust, 4.42%, 11/15/23 (c) | | 2,221 | | 2,349 | |
| | | | | | | |
See accompanying Notes to Financial Statements.
| | Shares/Par † | | Value | |
General Electric Capital Corp. | | | | | |
6.25% (callable at 100 beginning 12/15/22) (j) | | 825 | | 898 | |
7.13% (callable at 100 beginning 06/15/22) (j) | | 3,400 | | 3,957 | |
Goldman Sachs Group Inc. | | | | | |
5.70% (callable at 100 beginning 05/10/19) (j) | | 2,552 | | 2,581 | |
2.55%, 10/23/19 | | 1,250 | | 1,244 | |
5.38%, 03/15/20 | | 1,350 | | 1,513 | |
4.00%, 03/03/24 | | 1,461 | | 1,517 | |
HSBC Holdings Plc | | | | | |
5.63% (callable at 100 beginning 01/17/20) (j) | | 949 | | 952 | |
6.37% (callable at 100 beginning 09/17/24) (j) | | 1,348 | | 1,361 | |
4.25%, 03/14/24 | | 1,300 | | 1,353 | |
5.25%, 03/14/44 | | 350 | | 392 | |
International Lease Finance Corp., 6.25%, 05/15/19 | | 1,800 | | 1,966 | |
Intesa Sanpaolo SpA, 5.02%, 06/26/24 (c) | | 2,475 | | 2,402 | |
JPMorgan Chase & Co. | | | | | |
5.00% (callable at 100 beginning 07/01/19) (j) | | 500 | | 489 | |
7.90% (callable at 100 beginning 04/30/18) (j) | | 966 | | 1,040 | |
3.63%, 05/13/24 | | 600 | | 614 | |
4.13%, 12/15/26 | | 1,250 | | 1,247 | |
Morgan Stanley | | | | | |
0.97%, 07/23/19 (d) | | 1,950 | | 1,942 | |
5.63%, 09/23/19 | | 900 | | 1,016 | |
4.10%, 05/22/23 | | 1,237 | | 1,252 | |
3.70%, 10/23/24 | | 625 | | 634 | |
4.35%, 09/08/26 | | 1,222 | | 1,229 | |
National Rural Utilities Cooperative Finance Corp., 4.75%, 04/30/43 (d) | | 2,000 | | 1,982 | |
Royal Bank of Scotland Group Plc | | | | | |
6.10%, 06/10/23 | | 1,472 | | 1,597 | |
6.00%, 12/19/23 | | 359 | | 389 | |
5.13%, 05/28/24 | | 1,534 | | 1,560 | |
Wells Fargo & Co. | | | | | |
4.48%, 01/16/24 | | 461 | | 492 | |
4.10%, 06/03/26 | | 1,934 | | 1,977 | |
Other Securities | | | | 25,323 | |
| | | | 84,355 | |
HEALTH CARE - 6.8% | | | | | |
DaVita HealthCare Partners Inc. Term Loan B, 3.50%, 06/20/21 (d) | | 2,259 | | 2,231 | |
Gilead Sciences Inc. | | | | | |
3.50%, 02/01/25 | | 561 | | 576 | |
4.80%, 04/01/44 | | 814 | | 903 | |
4.50%, 02/01/45 | | 492 | | 526 | |
HCA Inc. | | | | | |
3.75%, 03/15/19 | | 918 | | 919 | |
4.25%, 10/15/19 | | 2,053 | | 2,084 | |
Medtronic Inc. | | | | | |
3.50%, 03/15/25 (c) | | 1,626 | | 1,663 | |
4.38%, 03/15/35 (c) | | 1,005 | | 1,066 | |
4.63%, 03/15/45 (c) | | 1,354 | | 1,468 | |
Other Securities | | | | 12,900 | |
| | | | 24,336 | |
INDUSTRIALS - 6.2% | | | | | |
Bombardier Inc. | | | | | |
4.75%, 04/15/19 (c) | | 1,571 | | 1,577 | |
6.00%, 10/15/22 (c) | | 835 | | 843 | |
6.13%, 01/15/23 (c) | | 1,727 | | 1,762 | |
International Lease Finance Corp., 2.19%, 06/15/16 (d) | | 1,350 | | 1,348 | |
Schaeffler AG Term Loan, 4.25%, 05/15/20 (d) | | 550 | | 549 | |
Other Securities | | | | 15,810 | |
| | | | 21,889 | |
INFORMATION TECHNOLOGY - 2.4% | | | | | |
Oracle Corp., 4.30%, 07/08/34 | | 1,750 | | 1,874 | |
ViaSat Inc., 6.88%, 06/15/20 | | 1,932 | | 2,009 | |
Other Securities | | | | 4,620 | |
| | | | 8,503 | |
MATERIALS - 6.2% | | | | | |
Ardagh Packaging Finance Plc, 3.24%, 12/15/19 (c) (d) | | 3,000 | | 2,895 | |
Cemex Finance LLC | | | | | |
9.38%, 10/12/22 (c) | | 1,050 | | 1,171 | |
6.00%, 04/01/24 (c) | | 447 | | 436 | |
Cemex SAB de CV | | | | | |
6.50%, 12/10/19 (c) | | 774 | | 793 | |
7.25%, 01/15/21 (c) | | 794 | | 832 | |
FMG Resources August 2006 Pty Ltd., 6.00%, 04/01/17 (c) | | 750 | | 717 | |
FMG Resources Pty Ltd., 6.88%, 04/01/22 (c) | | 1,200 | | 999 | |
FMG Resources Pty Ltd. New Term Loan B, 3.75%, 06/30/19 (d) | | 1,478 | | 1,339 | |
Freeport-McMoRan Inc., 5.40%, 11/14/34 | | 2,351 | | 2,292 | |
Other Securities | | | | 10,534 | |
| | | | 22,008 | |
TELECOMMUNICATION SERVICES - 4.6% | | | | | |
Verizon Communications Inc. | | | | | |
5.15%, 09/15/23 | | 1,800 | | 1,988 | |
6.40%, 09/15/33 | | 1,053 | | 1,297 | |
4.40%, 11/01/34 | | 750 | | 745 | |
6.55%, 09/15/43 | | 817 | | 1,047 | |
5.01%, 08/21/54 (a) (b) | | 818 | | 846 | |
Other Securities | | | | 10,590 | |
| | | | 16,513 | |
UTILITIES - 4.5% | | | | | |
AES Corp. | | | | | |
3.23%, 06/01/19 (d) | | 1,049 | | 1,023 | |
4.88%, 05/15/23 | | 850 | | 844 | |
Electricite de France SA, 5.25%, (callable at 100 beginning 01/29/23) (c) (j) | | 2,700 | | 2,767 | |
Puget Energy Inc., 6.00%, 09/01/21 | | 1,800 | | 2,106 | |
Other Securities | | | | 9,196 | |
| | | | 15,936 | |
Total Corporate Bonds and Notes (cost $329,524) | | | | 322,275 | |
| | | | | |
TRUST PREFERREDS - 0.5% | | | | | |
| | | | | |
FINANCIALS - 0.5% | | | | | |
Citigroup Capital XIII, 7.88%, (callable at 25 beginning 10/30/15) | | 64 | | 1,701 | |
Total Trust Preferreds (cost $1,757) | | | | 1,701 | |
| | | | | |
PREFERRED STOCKS - 1.5% | | | | | |
| | | | | |
ENERGY - 0.1% | | | | | |
Other Securities | | | | 490 | |
| | | | | |
FINANCIALS - 1.4% | | | | | |
Goldman Sachs Group Inc., 5.50%, (callable at 25 beginning 05/10/23) (j) | | 45 | | 1,098 | |
US Bancorp, 6.00%, (callable at 25 beginning 04/15/17) (j) | | 88 | | 2,387 | |
See accompanying Notes to Financial Statements.
| | Shares/Par † | | Value | |
Other Securities | | | | 1,279 | |
| | | | 4,764 | |
Total Preferred Stocks (cost $5,441) | | | | 5,254 | |
| | | | | |
INVESTMENT COMPANIES - 0.1% | | | | | |
Other Securities | | | | 522 | |
Total Investment Companies (cost $505) | | | | 522 | |
| | | | | |
SHORT TERM INVESTMENTS - 2.9% | | | | | |
| | | | | |
Investment Company - 2.9% | | | | | |
JNL Money Market Fund, 0.01% (k) (l) | | 10,256 | | 10,256 | |
Total Short Term Investments (cost $10,256) | | | | 10,256 | |
Total Investments - 98.7% (cost $358,637) | | | | 351,163 | |
Other Assets and Liabilities, Net - 1.3% | | | | 4,466 | |
Total Net Assets - 100.0% | | | | $ | 355,629 | |
| | | | | | |
(a) | Security is restricted to resale to institutional investors. See Restricted Securities in these Schedules of Investments. |
(b) | The Sub-Adviser has deemed this security to be illiquid based on procedures approved by the Trust’s Board of Trustees. |
(c) | The Sub-Adviser has deemed this security which is exempt from registration under the 1933 Act to be liquid based on procedures approved by the Trust’s Board of Trustees. As of December 31, 2014, the aggregate value of these liquid securities was $91,243 which represented 25.7% of net assets. |
(d) | Variable rate security. Rate stated was in effect as of December 31, 2014. |
(e) | Pay-in-kind security. The coupon interest earned by the security may be paid in cash or additional par. |
(f) | This variable rate senior loan will settle after December 31, 2014, at which time the interest rate will be determined. |
(g) | Security fair valued in good faith in accordance with the procedures approved by the Trust’s Board of Trustees. Good faith fair valued securities may be classified as Level 2 or Level 3 for FASB ASC Topic 820 “Fair Value Measurement” based on the applicable valuation inputs. See FASB ASC Topic 820 “Fair Value Measurement” in the Notes to Financial Statements. |
(h) | Security is a “step-up” bond where the coupon may increase or step up at a future date. Rate stated was the coupon as of December 31, 2014. |
(i) | The interest rate for this security is inversely affected by upgrades or downgrades to the credit rating of the issuer. |
(j) | Perpetual security. |
(k) | Investment in affiliate. |
(l) | Yield changes daily to reflect current market conditions. Rate was the quoted yield as of December 31, 2014. |
Investments by Country‡ | | Percentage of Total
Long-Term
Investments | |
Australia | | 0.6 | % |
Brazil | | 1.7 | |
Canada | | 1.8 | |
Chile | | 0.3 | |
France | | 1.9 | |
Germany | | 0.5 | |
Ireland | | 1.1 | |
Italy | | 1.2 | |
Japan | | 0.5 | |
Luxembourg | | 1.2 | |
Mexico | | 0.7 | |
Norway | | 0.8 | |
Puerto Rico | | 0.2 | |
Spain | | 0.3 | |
Sweden | | 0.4 | |
Switzerland | | 1.6 | |
United Kingdom | | 6.0 | |
United States | | 79.2 | |
Total Long-Term Investments | | 100.0 | % |
‡ | The country table is presented for this Fund because its strategy includes investment in non-U.S. securities as deemed significant by the Fund’s Adviser. |
See accompanying Notes to Financial Statements.
Restricted Securities - The Fund invests in securities that are restricted under the 1933 Act or which are subject to legal, contractual, or other agreed upon restrictions on resale. Restricted securities are often purchased in private placement transactions and cannot be sold without prior registration unless the sale is pursuant to an exemption under the 1933 Act, as amended. As of December 31, 2014, the Fund held investments in restricted securities, excluding certain securities exempt from registration under the 1933 Act which are deemed to be liquid, as follows:
| | Initial
Acquisition
Date | | Cost | | Ending
Value | | Percent of
Net Assets | |
American Airlines Pass-Through Trust, 5.60%, 07/15/20 | | 07/30/2014 | | $ | 1,782 | | $ | 1,820 | | 0.5 | % |
Citigroup Commercial Mortgage Trust REMIC, 0.91%, 06/15/21 | | 06/05/2014 | | 4,000 | | 4,004 | | 1.1 | |
Scientific Games International Inc., 7.00%, 01/01/22 | | 12/02/2014 | | 699 | | 708 | | 0.2 | |
Verizon Communications Inc., 5.01%, 08/21/54 | | 08/25/2014 | | 644 | | 846 | | 0.3 | |
| | | | $ | 7,125 | | $ | 7,378 | | 2.1 | % |
Schedule of Open Futures Contracts
| | Expiration | | Contracts
(Short) | | Unrealized
Appreciation /
(Depreciation) | |
Euro FX Currency Future | | March 2015 | | (43 | ) | $ | 184 | |
U.S. Treasury Long Bond Future | | March 2015 | | (219 | ) | (837 | ) |
U.S. Treasury Note Future, 10-Year | | March 2015 | | (774 | ) | (523 | ) |
U.S. Treasury Note Future, 2-Year | | March 2015 | | (19 | ) | 6 | |
U.S. Treasury Note Future, 5-Year | | March 2015 | | (392 | ) | 16 | |
Ultra Long Term U.S. Treasury Bond Future | | March 2015 | | (146 | ) | (1,063 | ) |
| | | | | | $ | (2,217 | ) |
Schedule of Credit Default Swap Agreements
Counterparty | | Reference Obligation | | Implied
Credit
Spread (4) | | Fixed
Received /
Pay Rate (6) | | Expiration
Date | | Notional
Amount (1),(5) | | Value | | Premiums
Paid /
(Received) | | Unrealized
Appreciation /
(Depreciation) | |
Over the Counter Credit Default Swap Agreements | | | | | | | | | |
Credit default swap agreements - purchase protection (2) | | | | | | | | | |
JPM | | Capital One Bank, 2.25%, 02/13/2019 | | N/A | | 1.00 | % | 03/20/2020 | | $ | 3,500 | | $ | (126 | ) | $ | (115 | ) | $ | (11 | ) |
CGM | | Carnival Corp., 6.65%, 01/15/2028 | | N/A | | 1.00 | % | 03/20/2020 | | 4,000 | | (87 | ) | (66 | ) | (21 | ) |
JPM | | Cooper Tire & Rubber Corp., 7.63%, 03/15/2027 | | N/A | | 5.00 | % | 03/20/2020 | | 4,000 | | (495 | ) | (432 | ) | (63 | ) |
JPM | | Dominion Resources Inc., 6.40%, 06/15/2018 | | N/A | | 1.00 | % | 03/20/2020 | | 4,000 | | (125 | ) | (115 | ) | (10 | ) |
CGM | | Kellogg Co., 4.00%, 12/15/2020 | | N/A | | 1.00 | % | 03/20/2020 | | 4,000 | | (80 | ) | (64 | ) | (16 | ) |
CGM | | Marriott International, 3.00%, 03/01/2019 | | N/A | | 1.00 | % | 03/20/2020 | | 4,000 | | (119 | ) | (110 | ) | (9 | ) |
CGM | | Nucor Corp., 5.75%, 12/01/2017 | | N/A | | 1.00 | % | 03/20/2020 | | 4,000 | | (73 | ) | (57 | ) | (16 | ) |
CGM | | Staples Inc., 2.75%, 01/12/2018 | | N/A | | 1.00 | % | 03/20/2020 | | 2,000 | | 63 | | 99 | | (36 | ) |
CGM | | Viacom Inc., 6.88%, 04/30/2036 | | N/A | | 1.00 | % | 03/20/2020 | | 2,000 | | (45 | ) | (33 | ) | (12 | ) |
JPM | | Viacom Inc., 6.88%, 04/30/2036 | | N/A | | 1.00 | % | 03/20/2020 | | 2,000 | | (45 | ) | (42 | ) | (3 | ) |
CGM | | Xerox Corp., 6.35%, 05/15/2018 | | N/A | | 1.00 | % | 03/20/2020 | | 4,000 | | (63 | ) | (32 | ) | (31 | ) |
| | | | | | | | | | $ | 37,500 | | $ | (1,195 | ) | $ | (967 | ) | $ | (228 | ) |
Credit default swap agreements - sell protection (3) | | | | | | | | | |
GSC | | CitiGroup Inc., 6.13%, 05/15/2018 | | 0.75 | % | 1.00 | % | 03/20/2020 | | $ | (3,500 | ) | $ | 44 | | $ | 40 | | $ | 4 | |
JPM | | Goodyear Tire & Rubber Co., 7.00%, 03/15/2028 | | 2.07 | % | 5.00 | % | 03/20/2020 | | (4,000 | ) | 573 | | 514 | | 59 | |
CGM | | Host Hotels & Resorts LP, 4.75%, 03/01/2023 | | 0.83 | % | 1.00 | % | 03/20/2020 | | (4,000 | ) | 35 | | 25 | | 10 | |
CGM | | Royal Caribbean Cruises, 5.25%, 11/15/2022 | | 1.57 | % | 5.00 | % | 03/20/2020 | | (4,000 | ) | 677 | | 643 | | 34 | |
| | | | | | | | | | $ | (15,500 | ) | $ | 1,329 | | $ | 1,222 | | $ | 107 | |
(1)Notional amount is stated in USD.
(2)If the Fund is a buyer of protection and a credit event occurs, as defined under the terms of that particular swap agreement, the Fund will either (i) receive from the seller of protection an amount equal to the notional amount of the referenced obligation agreement and deliver the referenced obligation, other deliverable obligations or underlying securities comprising the referenced index or (ii) receive a net settlement amount in the form of cash or securities equal to the notional amount of the swap agreement less the recovery value of the referenced obligation or underlying securities comprising the referenced index.
See accompanying Notes to Financial Statements.
(3)If the Fund is a seller of protection and a credit event occurs, as defined under the terms of that particular swap agreement, the Fund will either (i) pay the buyer of protection an amount equal to the notional amount of the referenced obligation and take delivery of the referenced obligation, other deliverable obligations or underlying securities comprising the referenced index or (ii) pay a net settlement amount in the form of cash or securities equal to the notional amount of the swap agreement less the recovery value of the reference obligation or underlying securities comprising the referenced index.
(4)Implied credit spreads, represented in absolute terms, utilized in determining the value of credit default swap agreements on corporate issues serve as an indicator of the current status of the payment/performance risk and represent the likelihood or risk of default for the credit derivative. The implied credit spread of a particular referenced entity reflects the cost of buying/selling protection and may include upfront payments required to be made to enter into the agreement. Wider credit spreads represent a deterioration of the referenced entity’s credit soundness and a greater likelihood or risk of default or other credit event occurring as defined under the terms of the applicable agreement.
(5)The maximum potential amount the Fund could be required to pay as a seller of credit protection or receive as a buyer of credit protection if a credit event occurs is limited to the total notional amount which is defined under the terms of each swap agreement.
(6)If the Fund is a buyer of protection, the Fund pays the fixed rate. If the Fund is a seller of protection, the Fund receives the fixed rate.
See accompanying Notes to Financial Statements.
Curian/Neuberger Berman Currency Fund
| | Shares/Par † | | Value | |
GOVERNMENT AND AGENCY OBLIGATIONS - 94.7% | | | | | |
| | | | | |
GOVERNMENT SECURITIES - 94.7% | | | | | |
| | | | | |
Federal Farm Credit Bank - 11.0% | | | | | |
Federal Farm Credit Bank | | | | | |
0.19%, 03/20/15 (a) (b) | | $ | 2,000 | | $ | 2,001 | |
0.18%, 04/23/15 (a) (b) | | 7,000 | | 7,002 | |
0.50%, 05/01/15 (b) | | 2,000 | | 2,002 | |
0.25%, 05/28/15 (b) | | 4,000 | | 4,001 | |
0.15%, 07/09/15 (b) | | 4,250 | | 4,248 | |
0.28%, 08/25/15 (b) | | 2,000 | | 2,000 | |
| | | | 21,254 | |
Federal Home Loan Bank - 10.9% | | | | | |
Federal Home Loan Bank | | | | | |
0.10%, 02/11/15 (a) (b) | | 5,000 | | 5,000 | |
0.14%, 03/02/15 (b) | | 5,000 | | 5,000 | |
0.07%, 04/22/15 (b) | | 4,000 | | 3,999 | |
0.13%, 06/02/15 - 06/03/15 (b) | | 5,000 | | 4,999 | |
1.63%, 08/20/15 (b) | | 2,000 | | 2,017 | |
| | | | 21,015 | |
Federal Home Loan Mortgage Corp. - 11.0% | | | | | |
Federal Home Loan Mortgage Corp. | | | | | |
0.35%, 03/18/15 (b) | | 4,000 | | 4,001 | |
4.38%, 07/17/15 (b) | | 2,000 | | 2,045 | |
0.45%, 09/04/15 (b) | | 2,000 | | 2,002 | |
1.75%, 09/10/15 (b) | | 5,000 | | 5,051 | |
0.42%, 09/18/15 (b) | | 3,525 | | 3,528 | |
0.50%, 09/25/15 (b) | | 4,500 | | 4,509 | |
| | | | 21,136 | |
Federal National Mortgage Association - 10.9% | | | | | |
Federal National Mortgage Association | | | | | |
0.38%, 03/16/15 (b) | | 2,000 | | 2,001 | |
5.00%, 04/15/15 (b) | | 3,000 | | 3,041 | |
0.50%, 05/27/15 (b) | | 14,000 | | 14,016 | |
0.35%, 08/28/15 (b) | | 2,000 | | 2,002 | |
| | | | 21,060 | |
U.S. Treasury Securities - 50.9% | | | | | |
U.S. Treasury Note | | | | | |
0.25%, 01/15/15 - 05/15/15 | | 42,500 | | 42,512 | |
4.00%, 02/15/15 | | 5,500 | | 5,526 | |
0.38%, 03/15/15 - 04/15/15 | | 50,000 | | 50,034 | |
| | | | 98,072 | |
Total Government and Agency Obligations (cost $182,557) | | | | 182,537 | |
| | | | | |
SHORT TERM INVESTMENTS - 5.2% | | | | | |
| | | | | |
Investment Company - 5.2% | | | | | |
JNL Money Market Fund, 0.01% (c) (d) | | 9,965 | | 9,965 | |
Total Short Term Investments (cost $9,965) | | | | 9,965 | |
Total Investments - 99.9% (cost $192,522) | | | | 192,502 | |
Other Assets and Liabilities, Net - 0.1% | | | | 124 | |
Total Net Assets - 100.0% | | | | $ | 192,626 | |
| | | | | | | |
(a) | Variable rate security. Rate stated was in effect as of December 31, 2014. |
(b) | This security is a direct debt of the agency and not collateralized by mortgages. |
(c) | Investment in affiliate. |
(d) | Yield changes daily to reflect current market conditions. Rate was the quoted yield as of December 31, 2014. |
See accompanying Notes to Financial Statements.
Schedule of Open Forward Foreign Currency Contracts
Purchased/
Sold | | Settlement
Date | | Counter-
Party | | Notional
Amount | | Value | | Unrealized
Gain/(Loss) | |
AUD/USD | | 01/15/2015 | | SSB | | AUD | 40,606 | | $ | 33,124 | | $ | (1,816 | ) |
AUD/USD | | 01/15/2015 | | SGB | | AUD | 34,577 | | 28,208 | | (1,014 | ) |
AUD/USD | | 01/15/2015 | | RBC | | AUD | 10,127 | | 8,261 | | (193 | ) |
CAD/USD | | 01/15/2015 | | SGB | | CAD | 32,282 | | 27,781 | | (700 | ) |
CAD/USD | | 01/15/2015 | | SSB | | CAD | 39,076 | | 33,625 | | (815 | ) |
CAD/USD | | 01/15/2015 | | RBC | | CAD | 20,065 | | 17,267 | | (253 | ) |
CAD/USD | | 01/15/2015 | | SSB | | CAD | 2,193 | | 1,887 | | 3 | |
CAD/USD | | 01/15/2015 | | SGB | | CAD | 17,149 | | 14,758 | | 34 | |
CHF/USD | | 01/15/2015 | | SSB | | CHF | 27,906 | | 28,073 | | (1,087 | ) |
CHF/USD | | 01/15/2015 | | SGB | | CHF | 45,387 | | 45,661 | | (1,938 | ) |
CHF/USD | | 01/15/2015 | | RBC | | CHF | 13,218 | | 13,298 | | (406 | ) |
EUR/USD | | 01/15/2015 | | SSB | | EUR | 39,442 | | 47,732 | | (1,911 | ) |
EUR/USD | | 01/15/2015 | | SGB | | EUR | 33,778 | | 40,879 | | (1,723 | ) |
EUR/USD | | 01/15/2015 | | RBC | | EUR | 19,132 | | 23,152 | | (773 | ) |
GBP/USD | | 01/15/2015 | | SSB | | GBP | 19,085 | | 29,744 | | (549 | ) |
GBP/USD | | 01/15/2015 | | SGB | | GBP | 13,677 | | 21,316 | | (475 | ) |
GBP/USD | | 01/15/2015 | | RBC | | GBP | 9,704 | | 15,123 | | (327 | ) |
GBP/USD | | 01/15/2015 | | SSB | | GBP | 1,345 | | 2,097 | | 2 | |
GBP/USD | | 01/15/2015 | | SGB | | GBP | 3,052 | | 4,756 | | 19 | |
JPY/USD | | 01/15/2015 | | SSB | | JPY | 3,065,413 | | 25,595 | | (2,077 | ) |
JPY/USD | | 01/15/2015 | | RBC | | JPY | 1,471,622 | | 12,287 | | (609 | ) |
JPY/USD | | 01/15/2015 | | SGB | | JPY | 1,063,544 | | 8,880 | | (620 | ) |
JPY/USD | | 01/15/2015 | | RBC | | JPY | 562,729 | | 4,698 | | 2 | |
JPY/USD | | 01/15/2015 | | SSB | | JPY | 832,918 | | 6,954 | | 35 | |
NOK/USD | | 01/15/2015 | | SSB | | NOK | 402,606 | | 54,002 | | (5,159 | ) |
NOK/USD | | 01/15/2015 | | SGB | | NOK | 298,937 | | 40,099 | | (3,580 | ) |
NOK/USD | | 01/15/2015 | | RBC | | NOK | 75,608 | | 10,142 | | (916 | ) |
NOK/USD | | 01/15/2015 | | SSB | | NOK | 41,237 | | 5,531 | | 21 | |
NZD/USD | | 01/15/2015 | | SGB | | NZD | 31,422 | | 24,482 | | 158 | |
NZD/USD | | 01/15/2015 | | SSB | | NZD | 26,528 | | 20,670 | | 148 | |
NZD/USD | | 01/15/2015 | | RBC | | NZD | 22,144 | | 17,254 | | 139 | |
NZD/USD | | 01/15/2015 | | SGB | | NZD | 6,202 | | 4,832 | | (32 | ) |
NZD/USD | | 01/15/2015 | | SSB | | NZD | 33,393 | | 26,020 | | (159 | ) |
NZD/USD | | 01/15/2015 | | RBC | | NZD | 2,861 | | 2,229 | | (6 | ) |
SEK/USD | | 01/15/2015 | | SGB | | SEK | 176,184 | | 22,601 | | (1,348 | ) |
SEK/USD | | 01/15/2015 | | SSB | | SEK | 312,963 | | 40,147 | | (1,798 | ) |
SEK/USD | | 01/15/2015 | | RBC | | SEK | 45,645 | | 5,856 | | (274 | ) |
SEK/USD | | 01/15/2015 | | SSB | | SEK | 61,909 | | 7,942 | | 66 | |
SEK/USD | | 01/15/2015 | | SGB | | SEK | 66,612 | | 8,545 | | 19 | |
USD/AUD | | 01/15/2015 | | SGB | | AUD | (12,794 | ) | (10,437 | ) | (8 | ) |
USD/AUD | | 01/15/2015 | | SSB | | AUD | (9,968 | ) | (8,132 | ) | (14 | ) |
USD/AUD | | 01/15/2015 | | SSB | | AUD | (64,779 | ) | (52,845 | ) | 3,311 | |
USD/AUD | | 01/15/2015 | | RBC | | AUD | (21,807 | ) | (17,790 | ) | 1,172 | |
USD/AUD | | 01/15/2015 | | SGB | | AUD | (16,775 | ) | (13,684 | ) | 872 | |
USD/CAD | | 01/15/2015 | | RBC | | CAD | (1,458 | ) | (1,255 | ) | (2 | ) |
USD/CAD | | 01/15/2015 | | SSB | | CAD | (3,953 | ) | (3,402 | ) | (1 | ) |
USD/CAD | | 01/15/2015 | | SGB | | CAD | (5,695 | ) | (4,901 | ) | (3 | ) |
USD/CAD | | 01/15/2015 | | SSB | | CAD | (51,361 | ) | (44,198 | ) | 1,338 | |
USD/CAD | | 01/15/2015 | | RBC | | CAD | (25,939 | ) | (22,322 | ) | 628 | |
USD/CAD | | 01/15/2015 | | SGB | | CAD | (41,947 | ) | (36,097 | ) | 1,078 | |
USD/CHF | | 01/15/2015 | | SGB | | CHF | (40,969 | ) | (41,215 | ) | 1,154 | |
USD/CHF | | 01/15/2015 | | SSB | | CHF | (83,787 | ) | (84,291 | ) | 2,481 | |
USD/CHF | | 01/15/2015 | | RBC | | CHF | (17,717 | ) | (17,823 | ) | 713 | |
USD/EUR | | 01/15/2015 | | SSB | | EUR | (45,392 | ) | (50,734 | ) | 1,398 | |
USD/EUR | | 01/15/2015 | | SGB | | EUR | (56,425 | ) | (68,283 | ) | 2,987 | |
USD/EUR | | 01/15/2015 | | RBC | | EUR | (6,357 | ) | (7,692 | ) | 198 | |
USD/GBP | | 01/15/2015 | | SSB | | GBP | (15,233 | ) | (23,740 | ) | 449 | |
USD/GBP | | 01/15/2015 | | SGB | | GBP | (15,266 | ) | (23,789 | ) | 418 | |
| | | | | | | | | | | | | | |
See accompanying Notes to Financial Statements.
Purchased/
Sold | | Settlement
Date | | Counter-
Party | | Notional
Amount | | Value | | Unrealized
Gain/(Loss) | |
USD/GBP | | 01/15/2015 | | RBC | | GBP | (8,315 | ) | $ | (12,957 | ) | $ | 132 | |
USD/JPY | | 01/15/2015 | | SGB | | JPY | (1,685,912 | ) | (14,076 | ) | 969 | |
USD/JPY | | 01/15/2015 | | SSB | | JPY | (3,628,631 | ) | (30,298 | ) | 1,637 | |
USD/JPY | | 01/15/2015 | | RBC | | JPY | (825,428 | ) | (6,892 | ) | 273 | |
USD/NOK | | 01/15/2015 | | SSB | | NOK | (183,539 | ) | (24,618 | ) | 2,181 | |
USD/NOK | | 01/15/2015 | | SGB | | NOK | (174,182 | ) | (23,363 | ) | 2,121 | |
USD/NOK | | 01/15/2015 | | RBC | | NOK | (96,868 | ) | (12,993 | ) | 1,056 | |
USD/NOK | | 01/15/2015 | | SGB | | NOK | (73,097 | ) | (9,805 | ) | (69 | ) |
USD/NZD | | 01/15/2015 | | SSB | | NZD | (41,833 | ) | (32,596 | ) | (200 | ) |
USD/NZD | | 01/15/2015 | | SGB | | NZD | (5,789 | ) | (4,510 | ) | (28 | ) |
USD/NZD | | 01/15/2015 | | RBC | | NZD | (10,434 | ) | (8,130 | ) | (52 | ) |
USD/NZD | | 01/15/2015 | | SSB | | NZD | (40,329 | ) | (31,425 | ) | 303 | |
USD/NZD | | 01/15/2015 | | SGB | | NZD | (34,798 | ) | (27,114 | ) | 104 | |
USD/NZD | | 01/15/2015 | | RBC | | NZD | (14,320 | ) | (11,158 | ) | 65 | |
USD/SEK | | 01/15/2015 | | SGB | | SEK | (192,556 | ) | (24,703 | ) | 1,635 | |
USD/SEK | | 01/15/2015 | | SSB | | SEK | (141,573 | ) | (18,161 | ) | 1,173 | |
USD/SEK | | 01/15/2015 | | RBC | | SEK | (86,532 | ) | (11,101 | ) | 487 | |
| | | | | | | | | $ | (51,022 | ) | $ | 44 | |
See accompanying Notes to Financial Statements.
Curian/Neuberger Berman Risk Balanced Commodity Strategy Fund (a)
| | Shares/Par † | | Value | |
NON-U.S. GOVERNMENT AGENCY ASSET-BACKED SECURITIES - 22.6% | | | | | |
Ally Auto Receivables Trust | | | | | |
0.48%, 02/15/16 | | $ | 1,175 | | $ | 1,174 | |
0.63%, 05/15/17 | | 2,188 | | 2,188 | |
BA Credit Card Trust, 0.43%, 04/17/17 (b) | | 5,100 | | 5,091 | |
Capital One Multi-Asset Execution Trust, 0.24%, 02/15/17 (b) | | 3,000 | | 2,983 | |
CarMax Auto Owner Trust | | | | | |
0.47%, 02/15/17 | | 868 | | 868 | |
0.46%, 04/17/17 | | 3,664 | | 3,661 | |
Chase Issuance Trust, 0.43%, 05/15/17 (b) | | 3,000 | | 3,002 | |
Citibank Credit Card Issuance Trust, 0.30%, 12/15/16 (b) | | 3,000 | | 2,990 | |
Ford Credit Auto Owner Trust, 0.57%, 06/15/16 | | 2,727 | | 2,727 | |
Honda Auto Receivables Owner Trust, 0.58%, 03/15/16 | | 1,035 | | 1,034 | |
Hyundai Auto Receivables Trust | | | | | |
0.46%, 01/16/17 | | 1,814 | | 1,813 | |
0.44%, 02/15/17 | | 3,755 | | 3,752 | |
Navient Student Loan Trust | | | | | |
0.42%, 12/25/16 (b) | | 1,205 | | 1,202 | |
0.43%, 12/26/16 (b) | | 3,360 | | 3,360 | |
Nelnet Student Loan Trust REMIC, 0.31%, 10/26/26 (b) | | 1,450 | | 1,448 | |
Nissan Auto Receivables Owner Trust, 0.50%, 01/15/16 | | 593 | | 593 | |
SLM Student Loan Trust, 0.32%, 04/27/20 (b) | | 1,769 | | 1,762 | |
Toyota Auto Receivables Owner Trust, 0.40%, 12/15/15 | | 1,085 | | 1,084 | |
Total Non-U.S. Government Agency Asset-Backed Securities (cost $40,776) | | | | 40,732 | |
| | | | | |
CORPORATE BONDS AND NOTES - 48.0% | | | | | |
| | | | | |
CONSUMER DISCRETIONARY - 4.2% | | | | | |
Daimler Finance North America LLC, 0.91%, 08/01/16 (b) (c) | | 1,280 | | 1,287 | |
NBCUniversal Enterprise Inc., 0.77%, 04/15/16 (b) (c) | | 1,500 | | 1,503 | |
Toyota Motor Credit Corp. | | | | | |
0.52%, 05/17/16 (b) | | 1,500 | | 1,503 | |
0.35%, 09/23/16 (b) | | 1,750 | | 1,748 | |
Volkswagen Group of America Finance LLC | | | | | |
0.60%, 05/23/17 (b) | | 1,085 | | 1,082 | |
0.67%, 11/20/17 (b) (c) | | 415 | | 414 | |
| | | | 7,537 | |
CONSUMER STAPLES - 1.5% | | | | | |
Anheuser-Busch InBev Worldwide Inc., 4.13%, 01/15/15 (d) | | 1,200 | | 1,202 | |
Coca-Cola Co., 0.33%, 11/01/16 (b) | | 1,500 | | 1,500 | |
| | | | 2,702 | |
ENERGY - 2.0% | | | | | |
BP Capital Markets Plc, 0.56%, 11/06/15 (b) | | 1,780 | | 1,782 | |
Devon Energy Corp., 0.69%, 12/15/15 (b) | | 560 | | 560 | |
TransCanada PipeLines Ltd., 0.94%, 06/30/16 (b) | | 1,365 | | 1,371 | |
| | | | 3,713 | |
FINANCIALS - 27.0% | | | | | |
American Express Credit Corp., 1.34%, 06/12/15 (b) | | 1,500 | | 1,506 | |
American Honda Finance Corp., 0.61%, 05/26/16 (b) (c) | | 2,000 | | 2,004 | |
Bank of America NA, 0.70%, 11/14/16 (b) | | 1,500 | | 1,499 | |
Bank of Montreal, 0.75%, 07/15/16 (b) | | 1,500 | | 1,507 | |
Bank of New York Mellon Corp., 0.46%, 03/04/16 (b) | | 2,500 | | 2,500 | |
Berkshire Hathaway Finance Corp., 0.38%, 01/10/17 (b) | | 1,500 | | 1,499 | |
Caterpillar Financial Services Corp., 0.47%, 02/26/16 (b) | | 1,600 | | 1,602 | |
Citigroup Inc., 6.01%, 01/15/15 | | 1,000 | | 1,002 | |
General Electric Capital Corp., 0.88%, 07/12/16 (b) | | 3,500 | | 3,524 | |
Goldman Sachs Group Inc., 0.63%, 07/22/15 (b) | | 1,200 | | 1,200 | |
HSBC USA Inc., 0.55%, 06/23/17 (b) | | 2,220 | | 2,215 | |
John Deere Capital Corp., 0.33%, 02/25/16 (b) | | 750 | | 750 | |
JPMorgan Chase & Co., 0.75%, 02/15/17 (b) | | 4,080 | | 4,070 | |
Metropolitan Life Global Funding I, 0.76%, 07/15/16 (b) (c) | | 2,000 | | 2,008 | |
Mizuho Bank Ltd., 0.70%, 09/25/17 (b) (c) | | 675 | | 675 | |
National Australia Bank Ltd., 0.78%, 07/25/16 (b) | | 1,400 | | 1,406 | |
PNC Funding Corp., 3.63%, 02/08/15 | | 1,000 | | 1,003 | |
Pricoa Global Funding I, 0.50%, 08/19/15 (b) (c) | | 2,500 | | 2,502 | |
Principal Life Global Funding II, 0.61%, 05/27/16 (b) (c) | | 1,000 | | 1,003 | |
Royal Bank of Canada, 0.46%, 12/16/15 (b) | | 1,750 | | 1,753 | |
Simon Property Group LP, 5.10%, 06/15/15 | | 2,350 | | 2,396 | |
Svenska Handelsbanken AB, 0.70%, 03/21/16 (b) | | 2,120 | | 2,127 | |
U.S. Bancorp, 3.15%, 03/04/15 | | 1,440 | | 1,447 | |
U.S. Bank NA, 0.46%, 01/30/17 (b) | | 1,500 | | 1,500 | |
Wells Fargo & Co., 0.50%, 09/08/17 (b) | | 3,340 | | 3,331 | |
Westpac Banking Corp., 1.01%, 09/25/15 (b) | | 2,540 | | 2,553 | |
| | | | 48,582 | |
HEALTH CARE - 3.1% | | | | | |
Bayer US Finance LLC, 0.48%, 10/07/16 (b) (c) | | 740 | | 740 | |
Medtronic Inc., 0.33%, 02/27/17 (b) | | 2,750 | | 2,741 | |
Merck & Co. Inc., 0.42%, 05/18/16 (b) | | 400 | | 401 | |
Pfizer Inc., 0.38%, 05/15/17 (b) | | 850 | | 849 | |
Walgreens Boots Alliance Inc., 0.68%, 05/18/16 (b) | | 820 | | 820 | |
| | | | 5,551 | |
INDUSTRIALS - 2.9% | | | | | |
Canadian National Railway Co., 0.43%, 11/06/15 (b) | | 1,330 | | 1,330 | |
Rockwell Collins Inc., 0.59%, 12/15/16 (b) | | 1,720 | | 1,720 | |
United Technologies Corp., 0.73%, 06/01/15 (b) | | 2,150 | | 2,154 | |
| | | | 5,204 | |
INFORMATION TECHNOLOGY - 4.1% | | | | | |
Apple Inc., 0.30%, 05/05/17 (b) | | 2,100 | | 2,093 | |
Cisco Systems Inc., 0.51%, 03/03/17 (b) | | 2,000 | | 2,000 | |
International Business Machines Corp., 0.30%, 02/05/16 (b) | | 1,800 | | 1,800 | |
Oracle Corp., 0.43%, 07/07/17 (b) | | 1,510 | | 1,508 | |
| | | | 7,401 | |
MATERIALS - 0.6% | | | | | |
BHP Billiton Finance USA Ltd., 0.51%, 09/30/16 (b) | | 1,155 | | 1,155 | |
| | | | | | | |
See accompanying Notes to Financial Statements.
| | Shares/Par † | | Value | |
TELECOMMUNICATION SERVICES - 0.7% | | | | | |
Verizon Communications Inc., 0.70%, 11/02/15 (c) | | 1,200 | | 1,200 | |
| | | | | |
UTILITIES - 1.9% | | | | | |
Duke Energy Ohio Inc., 0.38%, 03/06/15 (b) | | 1,850 | | 1,850 | |
Electricite de France SA, 0.69%, 01/20/17 (b) (c) | | 1,500 | | 1,504 | |
| | | | 3,354 | |
Total Corporate Bonds and Notes (cost $86,502) | | | | 86,399 | |
| | | | | |
GOVERNMENT AND AGENCY OBLIGATIONS - 9.9% | | | | | |
| | | | | |
GOVERNMENT SECURITIES - 9.9% | | | | | |
U.S. Treasury Securities - 9.9% | | | | | |
U.S. Treasury Note | | | | | |
4.00%, 02/15/15 | | 2,250 | | 2,261 | |
0.38%, 03/15/15 - 04/15/15 | | 11,000 | | 11,007 | |
0.25%, 07/15/15 | | 4,500 | | 4,503 | |
Total Government and Agency Obligations
(cost $17,772) | | | | 17,771 | |
| | | | | |
SHORT TERM INVESTMENTS - 15.6% | | | | | |
| | | | | |
Certificates of Deposit - 3.1% | | | | | |
Credit Suisse, 0.65%, 12/07/15 (b) | | 1,500 | | 1,501 | |
Nordea Bank Finland Plc, 0.42%, 06/13/16 (b) | | 2,540 | | 2,541 | |
Sumitomo Mitsui Banking Corp., 0.64%, 03/13/15 (b) | | 1,500 | | 1,501 | |
| | | | 5,543 | |
Investment Companies - 9.9% | | | | | |
JNL Money Market Fund, 0.01% (e) (f) | | 628 | | 628 | |
JPMorgan U.S. Treasury Plus Money Market Fund, 0.00% (f) | | 17,195 | | 17,195 | |
| | | | 17,823 | |
Treasury Securities - 2.6% | | | | | |
U.S. Treasury Bill, 0.12%, 06/25/15 | | $ | 4,750 | | 4,748 | |
Total Short Term Investments (cost $28,114) | | | | 28,114 | |
| | | | | |
Total Investments - 96.1% (cost $173,164) | | | | 173,016 | |
Other Assets and Liabilities, Net - 3.9% | | | | 6,934 | |
Total Net Assets - 100.0% | | | | $ | 179,950 | |
| | | | | | | |
(a) | Consolidated Schedule of Investments. |
(b) | Variable rate security. Rate stated was in effect as of December 31, 2014. |
(c) | The Sub-Adviser has deemed this security which is exempt from registration under the 1933 Act to be liquid based on procedures approved by the Trust’s Board of Trustees. As of December 31, 2014, the aggregate value of these liquid securities was $14,840 which represented 8.2% of net assets. |
(d) | The interest rate for this security is inversely affected by upgrades or downgrades to the credit rating of the issuer. |
(e) | Investment in affiliate. |
(f) | Yield changes daily to reflect current market conditions. Rate was the quoted yield as of December 31, 2014. |
See accompanying Notes to Financial Statements.
Curian Variable Series Trust Sub-Advised Funds
Schedules of Investments (in thousands, except contracts)
December 31, 2014
Schedule of Open Futures Contracts
| | Expiration | | Contracts
Long | | Unrealized
Appreciation /
(Depreciation) | |
Brent Crude Oil Future | | May 2015 | | 141 | | $ | 35 | |
CBT Wheat Future | | July 2015 | | 122 | | (143 | ) |
Cocoa Future | | May 2015 | | 175 | | (97 | ) |
Coffee ‘C’ Future | | May 2015 | | 32 | | 8 | |
Copper Future | | May 2015 | | 128 | | 15 | |
Corn Future | | July 2015 | | 438 | | (335 | ) |
Cotton No.2 Future | | May 2015 | | 126 | | (89 | ) |
Feeder Cattle Future | | March 2015 | | 57 | | (384 | ) |
Gold 100 Oz. Future | | April 2015 | | 126 | | (178 | ) |
ICE Gas Oil Future | | April 2015 | | 211 | | (261 | ) |
KCBT Wheat Future | | July 2015 | | 121 | | (125 | ) |
Lean Hogs Future | | April 2015 | | 230 | | (769 | ) |
Live Cattle Future | | May 2015 | | 122 | | (332 | ) |
LME Aluminum Future | | April 2015 | | 110 | | (45 | ) |
LME Lead Future | | April 2015 | | 206 | | 61 | |
LME Nickel Future | | April 2015 | | 96 | | 82 | |
LME Zinc Future | | April 2015 | | 153 | | 18 | |
Natural Gas Future | | April 2015 | | 124 | | (309 | ) |
NY Harbor ULSD Future | | April 2015 | | 105 | | 50 | |
Platinum Future | | April 2015 | | 158 | | (128 | ) |
RBOB Gasoline Future | | April 2015 | | 98 | | 19 | |
Silver Future | | May 2015 | | 78 | | (70 | ) |
Soybean Future | | July 2015 | | 101 | | (127 | ) |
Soybean Meal Future | | July 2015 | | 57 | | (57 | ) |
Soybean Oil Future | | July 2015 | | 159 | | (75 | ) |
Sugar #11 (World Markets) Future | | May 2015 | | 153 | | (23 | ) |
WTI Crude Oil Future | | April 2015 | | 137 | | (39 | ) |
| | | | | | $ | (3,298 | ) |
See accompanying Notes to Financial Statements.
Curian Variable Series Trust Sub-Advised Funds
Schedules of Investments (in thousands)
December 31, 2014
Curian/Nicholas Convertible Arbitrage Fund
| | Shares/Par † | | Value | |
COMMON STOCKS - 0.7% | | | | | |
| | | | | |
HEALTH CARE - 0.7% | | | | | |
Horizon Pharma Plc (a) | | 227 | | $ | 2,927 | |
Total Common Stocks (cost $2,929) | | | | 2,927 | |
| | | | | |
PREFERRED STOCKS - 6.5% | | | | | |
| | | | | |
CONSUMER DISCRETIONARY - 0.8% | | | | | |
Fiat Chrysler Automobiles NV (b) | | 31 | | 3,382 | |
| | | | | |
CONSUMER STAPLES - 1.3% | | | | | |
Tyson Foods Inc., 4.75%, 07/15/17 (b) | | 116 | | 5,844 | |
| | | | | |
ENERGY - 0.1% | | | | | |
Chesapeake Energy Corp., 5.75% (b) (i) | | 1 | | 604 | |
| | | | | |
FINANCIALS - 2.0% | | | | | |
Crown Castle International Corp., 4.50%, 11/01/16 (b) (c) | | 85 | | 8,800 | |
| | | | | |
INDUSTRIALS - 1.3% | | | | | |
Genesee & Wyoming Inc., 5.00%, 10/01/15 (b) | | 49 | | 5,640 | |
| | | | | |
MATERIALS - 1.0% | | | | | |
Alcoa Inc., 5.38%, 10/01/17 (b) | | 86 | | 4,323 | |
Total Preferred Stocks (cost $28,588) | | | | 28,593 | |
| | | | | |
CORPORATE BONDS AND NOTES - 94.4% | | | | | |
| | | | | |
CONSUMER DISCRETIONARY - 12.6% | | | | | |
Jarden Corp., 1.88%, 09/15/18 (b) (c) | | $ | 2,765 | | 4,336 | |
Lennar Corp., 2.75%, 12/15/20 (b) (d) | | 3,370 | | 6,807 | |
Liberty Interactive LLC, 0.75%, 03/30/43 (b) (c) | | 6,800 | | 9,664 | |
Live Nation Entertainment Inc., 2.50%, 05/15/19 (b) (d) | | 7,730 | | 8,165 | |
MGM Resorts International, 4.25%, 04/15/15 (b) | | 8,170 | | 9,641 | |
priceline.com Inc., 1.00%, 03/15/18 (b) | | 5,150 | | 6,843 | |
Restoration Hardware Holdings Inc., 0.00%, 06/15/19 (b) (d) (e) | | 1,800 | | 1,860 | |
Tesla Motors Inc., 1.25%, 03/01/21 (b) | | 8,545 | | 7,706 | |
| | | | 55,022 | |
ENERGY - 8.4% | | | | | |
Bristow Group Inc., 3.00%, 06/15/38 (b) (c) | | 5,887 | | 6,123 | |
Chesapeake Energy Corp., 2.50%, 05/15/37 (b) (c) | | 8,930 | | 8,673 | |
Cobalt International Energy Inc., 2.63%, 12/01/19 (b) (c) | | 4,460 | | 2,693 | |
Hornbeck Offshore Services Inc., 1.50%, 09/01/19 (b) | | 11,570 | | 9,618 | |
PDC Energy Inc., 3.25%, 05/15/16 (b) (d) | | 5,010 | | 5,777 | |
Scorpio Tankers Inc., 2.38%, 07/01/19 (b) (d) | | 3,940 | | 3,755 | |
| | | | 36,639 | |
FINANCIALS - 3.4% | | | | | |
Cowen Group Inc., 3.00%, 03/15/19 (b) (c) (d) | | 3,830 | | 4,120 | |
iStar Financial Inc. | | | | | |
1.50%, 11/15/16 (b) (d) | | 1,775 | | 1,800 | |
3.00%, 11/15/16 (b) | | 3,295 | | 4,166 | |
Portfolio Recovery Associates Inc., 3.00%, 08/01/20 (b) | | 4,460 | | 4,998 | |
| | | | 15,084 | |
HEALTH CARE - 17.2% | | | | | |
Brookdale Senior Living Inc., 2.75%, 06/15/18 (b) | | 4,065 | | 5,536 | |
Clovis Oncology Inc., 2.50%, 09/15/21 (b) (d) | | 4,660 | | 5,333 | |
Depomed Inc., 2.50%, 09/01/21 (b) | | 3,160 | | 3,411 | |
Illumina Inc., 0.00%, 06/15/19 (b) (d) (e) | | 10,075 | | 11,082 | |
Incyte Corp., 1.25%, 11/15/20 (b) (c) | | 5,725 | | 8,820 | |
Insulet Corp., 2.00%, 06/15/19 (b) | | 3,885 | | 4,570 | |
Isis Pharmaceuticals Inc., 1.00%, 11/15/21 (b) (d) | | 2,715 | | 3,046 | |
Jazz Investments I Ltd., 1.88%, 08/15/21 (b) (d) | | 5,715 | | 6,465 | |
Medivation Inc., 2.63%, 04/01/17 (b) (c) | | 4,945 | | 9,590 | |
Orexigen Therapeutics Inc., 2.75%, 12/01/20 (b) | | 4,005 | | 3,980 | |
Pacira Pharmaceuticals Inc., 3.25%, 02/01/19 (b) | | 1,020 | | 3,646 | |
Salix Pharmaceuticals Ltd., 1.50%, 03/15/19 (b) | | 4,720 | | 8,605 | |
Spectranetics Corp., 2.63%, 06/01/34 (b) | | 685 | | 879 | |
| | | | 74,963 | |
INDUSTRIALS - 9.4% | | | | | |
Air Lease Corp., 3.88%, 12/01/18 (b) (f) | | 5,850 | | 7,993 | |
Greenbrier Cos. Inc., 3.50%, 04/01/18 (b) (c) | | 3,385 | | 5,090 | |
Meritor Inc., 7.88%, 03/01/26 (b) | | 2,765 | | 4,554 | |
Navistar International Corp., 4.75%, 04/15/19 (b) (d) | | 9,500 | | 9,084 | |
SolarCity Corp., 2.75%, 11/01/18 (b) | | 3,005 | | 3,240 | |
UTi Worldwide Inc., 4.50%, 03/01/19 (b) (d) | | 10,150 | | 11,209 | |
| | | | 41,170 | |
INFORMATION TECHNOLOGY - 39.6% | | | | | |
Akamai Technologies Inc., 0.00%, 02/15/19 (b) (c) (d) (e) | | 3,985 | | 4,147 | |
Ciena Corp., 4.00%, 12/15/20 (b) (c) | | 7,875 | | 9,760 | |
Electronic Arts Inc., 0.75%, 07/15/16 (b) (c) | | 8,750 | | 13,180 | |
Electronics For Imaging Inc., 0.75%, 09/01/19 (b) (c) (d) | | 5,645 | | 5,726 | |
EnerNOC Inc., 2.25%, 08/15/19 (b) (d) | | 1,505 | | 1,264 | |
Intel Corp., 3.25%, 08/01/39 (b) (c) | | 6,275 | | 10,911 | |
LinkedIn Corp., 0.50%, 11/01/19 (b) (d) | | 3,565 | | 3,761 | |
Micron Technology Inc., 3.00%, 11/15/43 (b) | | 3,400 | | 4,473 | |
Nvidia Corp., 1.00%, 12/01/18 (b) | | 7,880 | | 9,057 | |
NXP Semiconductor NV, 1.00%, 12/01/19 (b) (d) | | 4,295 | | 4,400 | |
Palo Alto Networks Inc., 0.00%, 07/01/19 (b) (d) (e) | | 6,085 | | 7,686 | |
Proofpoint Inc., 1.25%, 12/15/18 (b) | | 7,365 | | 10,058 | |
Qihoo 360 Technology Co. Ltd., 2.50%, 09/15/18 (b) (d) | | 5,655 | | 5,450 | |
salesforce.com inc., 0.25%, 04/01/18 (b) | | 6,125 | | 6,979 | |
SanDisk Corp., 0.50%, 10/15/20 (b) | | 9,610 | | 11,544 | |
ServiceNow Inc., 0.00%, 11/01/18 (b) (e) | | 6,980 | | 7,940 | |
Sina Corp., 1.00%, 12/01/18 (b) | | 9,715 | | 8,956 | |
SunEdison Inc., 2.00%, 10/01/18 (b) (d) | | 3,835 | | 5,628 | |
SunPower Corp., 0.75%, 06/01/18 (b) | | 5,775 | | 7,049 | |
Synchronoss Technologies Inc., 0.75%, 08/15/19 (b) | | 4,190 | | 4,412 | |
Take-Two Interactive Software Inc., 1.00%, 07/01/18 (b) | | 4,145 | | 5,785 | |
Trulia Inc., 2.75%, 12/15/20 (b) | | 3,120 | | 4,504 | |
Twitter Inc., 1.00%, 09/15/21 (b) (d) | | 7,305 | | 6,364 | |
WebMD Health Corp., 1.50%, 12/01/20 (b) | | 4,710 | | 4,701 | |
Workday Inc., 0.75%, 07/15/18 (b) | | 7,885 | | 9,349 | |
| | | | 173,084 | |
MATERIALS - 3.8% | | | | | |
Kaiser Aluminum Corp., 4.50%, 04/01/15 (b) (c) | | 4,110 | | 6,116 | |
| | | | | | | |
See accompanying Notes to Financial Statements.
| | Shares/Par † | | Value | |
RTI International Metals Inc., 1.63%, 10/15/19 (b) | | 10,730 | | 10,428 | |
| | | | 16,544 | |
Total Corporate Bonds and Notes (cost $395,602) | | | | 412,506 | |
SHORT TERM INVESTMENTS - 2.3% | | | | | |
| | | | | |
Investment Company - 1.5% | | | | | |
JNL Money Market Fund, 0.01% (g) (h) | | 6,545 | | 6,545 | |
| | | | | |
Securities Lending Collateral - 0.8% | | | | | |
Repurchase Agreement with CSI, 0.07% (Collateralized by $3,044 U.S. Treasury Bond Strip, due 11/15/37-11/15/39, value $1,530) acquired on 12/31/14, due 01/02/15 at $1,500 | | $ | 1,500 | | 1,500 | |
Repurchase Agreement with MLP, 0.06% (Collateralized by $609 U.S. Treasury Bond, 6.25%, due 05/15/30, value $914 and $1,008 U.S. Treasury Note, 0.13%, due 07/15/24, value $968) acquired on 12/31/14, due 01/02/15 at $1,845 | | 1,845 | | 1,845 | |
| | | | 3,345 | |
Total Short Term Investments (cost $9,890) | | | | 9,890 | |
| | | | | |
Total Investments - 103.9% (cost $437,009) | | | | 453,916 | |
Total Securities Sold Short - (48.4%) (proceeds $198,561) | | | | (211,262 | ) |
Other Assets and Liabilities, Net - 44.5% | | | | 194,097 | |
Total Net Assets - 100.0% | | | | $ | 436,751 | |
| | | | | |
SECURITIES SOLD SHORT - 48.4% | | | | | |
| | | | | |
COMMON STOCKS - 47.9% | | | | | |
| | | | | |
CONSUMER DISCRETIONARY - 6.1% | | | | | |
Comcast Corp. - Class A | | 43 | | $ | 2,494 | |
Fiat Chrysler Automobiles NV | | 144 | | 1,663 | |
Jarden Corp. | | 74 | | 3,541 | |
Lennar Corp. - Class A | | 137 | | 6,150 | |
Live Nation Inc. | | 96 | | 2,497 | |
MGM Resorts International | | 132 | | 2,821 | |
Priceline Group Inc. | | 4 | | 4,321 | |
Restoration Hardware Holdings Inc. | | 9 | | 819 | |
Tesla Motors Inc. | | 11 | | 2,375 | |
| | | | 26,681 | |
CONSUMER STAPLES - 1.0% | | | | | |
Tyson Foods Inc. - Class A | | 104 | | 4,170 | |
| | | | | |
ENERGY - 1.7% | | | | | |
Bristow Group Inc. | | 24 | | 1,590 | |
Chesapeake Energy Corp. | | 19 | | 366 | |
Cobalt International Energy Inc. | | 49 | | 439 | |
Hornbeck Offshore Services Inc. | | 86 | | 2,145 | |
PDC Energy Inc. | | 35 | | 1,461 | |
Scorpio Tankers Inc. | | 162 | | 1,404 | |
| | | | 7,405 | |
FINANCIALS - 2.3% | | | | | |
Cowen Group Inc. - Class A | | 323 | | 1,551 | |
Crown Castle International Corp. | | 47 | | 3,686 | |
iStar Financial Inc. | | 245 | | 3,347 | |
PRA Group Inc. | | 27 | | 1,572 | |
| | | | 10,156 | |
HEALTH CARE - 9.4% | | | | | |
Brookdale Senior Living Inc. | | 83 | | 3,050 | |
Clovis Oncology Inc. | | 44 | | 2,451 | |
DepoMed Inc. | | 38 | | 611 | |
Illumina Inc. | | 17 | | 3,098 | |
Incyte Corp. | | 74 | | 5,418 | |
Insulet Corp. | | 34 | | 1,558 | |
Isis Pharmaceuticals Inc. | | 19 | | 1,179 | |
Jazz Pharmaceuticals Plc | | 20 | | 3,278 | |
Medivation Inc. | | 90 | | 9,003 | |
Orexigen Therapeutics Inc. | | 293 | | 1,778 | |
Pacira Pharmaceuticals Inc. | | 35 | | 3,091 | |
Salix Pharmaceuticals Ltd. | | 54 | | 6,183 | |
Spectranetics Corp. | | 12 | | 414 | |
| | | | 41,112 | |
INDUSTRIALS - 5.5% | | | | | |
Air Lease Corp. - Class A | | 146 | | 5,003 | |
Genesee & Wyoming Inc. - Class A | | 39 | | 3,540 | |
Greenbrier Cos. Inc. | | 72 | | 3,859 | |
Meritor Inc. | | 127 | | 1,920 | |
Navistar International Corp. | | 88 | | 2,941 | |
SolarCity Corp. | | 34 | | 1,822 | |
UTi Worldwide Inc. | | 404 | | 4,875 | |
| | | | 23,960 | |
INFORMATION TECHNOLOGY - 19.8% | | | | | |
Akamai Technologies Inc. | | 16 | | 980 | |
Ciena Corp. | | 240 | | 4,649 | |
Electronic Arts Inc. | | 198 | | 9,329 | |
Electronics for Imaging Inc. | | 60 | | 2,565 | |
EnerNOC Inc. | | 33 | | 503 | |
Intel Corp. | | 243 | | 8,829 | |
Linkedin Corp. - Class A | | 6 | | 1,390 | |
Micron Technology Inc. | | 64 | | 2,225 | |
Nvidia Corp. | | 215 | | 4,313 | |
NXP Semiconductors NV | | 22 | | 1,716 | |
Palo Alto Networks Inc. | | 39 | | 4,734 | |
Proofpoint Inc. | | 123 | | 5,917 | |
Qihoo 360 Technology Co. Ltd. - ADR | | 10 | | 584 | |
Salesforce.com Inc. | | 47 | | 2,784 | |
SanDisk Corp. | | 68 | | 6,649 | |
ServiceNow Inc. | | 55 | | 3,716 | |
Sina Corp. | | 4 | | 147 | |
SunEdison Inc. | | 197 | | 3,837 | |
SunPower Corp. | | 139 | | 3,588 | |
Synchronoss Technologies Inc. | | 39 | | 1,649 | |
Take-Two Interactive Software Inc. | | 145 | | 4,050 | |
Trulia Inc. | | 69 | | 3,198 | |
Twitter Inc. | | 49 | | 1,757 | |
WebMD Health Corp. | | 59 | | 2,352 | |
Workday Inc. - Class A | | 62 | | 5,022 | |
| | | | 86,483 | |
MATERIALS - 2.1% | | | | | |
Alcoa Inc. | | 169 | | 2,673 | |
Kaiser Aluminum Corp. | | 54 | | 3,854 | |
RTI International Metals Inc. | | 99 | | 2,511 | |
| | | | 9,038 | |
Total Common Stocks (proceeds $196,553) | | | | 209,005 | |
| | | | | |
INVESTMENT COMPANIES - 0.5% | | | | | |
iShares 20+ Year Treasury Bond ETF | | 18 | | 2,257 | |
| | | | | |
Total Investment Companies (proceeds $2,008) | | | | 2,257 | |
| | | | | |
Total Securities Sold Short - 48.4%
(proceeds $198,561) | | | | $ | 211,262 | |
| | | | | | | |
(a) | Non-income producing security. |
(b) | Convertible security. |
(c) | All or a portion of the security is pledged or segregated as collateral. See the Notes to Financial Statements. |
(d) | The Sub-Adviser has deemed this security which is exempt from registration under the 1933 Act to be liquid based on procedures approved by the Trust’s Board of Trustees. As of December 31, 2014, the aggregate value of these liquid securities was $122,931 which represented 28.1% of net assets. |
(e) | Security issued with a zero coupon. Income is recognized through the accretion of discount. |
(f) | All or portion of the security was on loan. |
(g) | Investment in affiliate. |
(h) | Yield changes daily to reflect current market conditions. Rate was the quoted yield as of December 31, 2014. |
(i) | Perpetual security. |
See accompanying Notes to Financial Statements.
Curian/PIMCO Credit Income Fund *
| | Shares/Par † | | Value | |
NON-U.S. GOVERNMENT AGENCY ASSET-BACKED SECURITIES - 4.0% | | | | | |
JPMorgan Mortgage Acquisition Trust REMIC, 0.44%, 07/25/36 (b) | | $ | 300 | | $ | 216 | |
Other Securities | | | | 3,327 | |
Total Non-U.S. Government Agency Asset-Backed Securities (cost $3,455) | | | | 3,543 | |
| | | | | |
CORPORATE BONDS AND NOTES - 71.7% | | | | | |
| | | | | |
CONSUMER DISCRETIONARY - 5.9% | | | | | |
Cablevision Systems Corp. Term Loan B, 2.67%, 04/15/20 (b) | | 457 | | 447 | |
QVC Inc., 4.45%, 02/15/25 | | 500 | | 489 | |
Other Securities | | | | 4,288 | |
| | | | 5,224 | |
CONSUMER STAPLES - 1.0% | | | | | |
Other Securities | | | | 838 | |
| | | | | |
ENERGY - 8.7% | | | | | |
AK Transneft OJSC Via TransCapitalInvest Ltd., 8.70%, 08/07/18 (a) | | 400 | | 412 | |
Energy Future Intermediate Holding Co. LLC Term Loan, 4.25%, 04/28/16 (b) | | 732 | | 731 | |
Petrobras Global Finance BV, 6.25%, 03/17/24 | | 100 | | 95 | |
Petrobras International Finance Co., 7.88%, 03/15/19 | | 400 | | 421 | |
Other Securities | | | | 6,080 | |
| | | | 7,739 | |
FINANCIALS - 39.1% | | | | | |
ABN AMRO Bank NV, 6.25%, 09/13/22 | | 400 | | 433 | |
Banco Popolare, 2.38%, 01/22/18, EUR | | 400 | | 488 | |
Banco Santander Brasil SA | | | | | |
4.50%, 04/06/15 (a) | | 100 | | 101 | |
4.63%, 02/13/17 (a) | | 300 | | 311 | |
Bank of America Corp. | | | | | |
6.50%, 08/01/16 | | 350 | | 377 | |
0.00%, 01/04/17 (f) | | 500 | | 488 | |
2.65%, 04/01/19 | | 100 | | 101 | |
4.00%, 04/01/24 | | 600 | | 625 | |
Bank of America NA | | | | | |
1.25%, 02/14/17 | | 250 | | 249 | |
0.65%, 05/08/17 (b) | | 250 | | 250 | |
Bank of New York Mellon Corp., 2.30%, 09/11/19 | | 400 | | 402 | |
Barclays Bank Plc | | | | | |
14.00% (callable at 100 beginning 12/15/19) (g), GBP | | 200 | | 409 | |
7.63%, 11/21/22 | | 600 | | 656 | |
Cantor Fitzgerald LP, 7.88%, 10/15/19 (a) | | 500 | | 546 | |
Citigroup Inc. | | | | | |
4.88%, 05/07/15 | | 500 | | 507 | |
1.03%, 04/01/16 (b) | | 500 | | 502 | |
8.13%, 07/15/39 | | 100 | | 153 | |
Credit Agricole SA | | | | | |
6.63% (callable at 100 beginning 09/23/19) (c) (d) (g) | | 300 | | 291 | |
0.78%, 06/12/17 (a) (b) | | 250 | | 250 | |
Credit Suisse | | | | | |
3.00%, 10/29/21 | | 300 | | 299 | |
3.63%, 09/09/24 | | 250 | | 254 | |
Credit Suisse AG, 6.50%, 08/08/23 (a) | | 200 | | 220 | |
Credit Suisse Group AG, 7.50%, (callable at 100 beginning 12/11/23) (a) (g) | | 200 | | 208 | |
Credit Suisse Group Guernsey I Ltd., 7.88%, 02/24/41 (h) | | 400 | | 424 | |
Crown Castle International Corp., 4.88%, 04/15/22 | | 100 | | 101 | |
DBS Bank Ltd. | | | | | |
0.84%, 07/15/21 (a) (b) | | 100 | | 99 | |
3.62%, 09/21/22 | | 200 | | 206 | |
DBS Group Holdings Ltd., 2.25%, 07/16/19 (a) | | 200 | | 200 | |
Ford Motor Credit Co. LLC | | | | | |
7.00%, 04/15/15 | | 100 | | 102 | |
12.00%, 05/15/15 | | 100 | | 104 | |
2.38%, 01/16/18 | | 400 | | 402 | |
8.13%, 01/15/20 | | 150 | | 186 | |
5.88%, 08/02/21 | | 200 | | 232 | |
Goldman Sachs Group Inc. | | | | | |
5.95%, 01/18/18 | | 700 | | 778 | |
6.15%, 04/01/18 | | 200 | | 224 | |
7.50%, 02/15/19 | | 380 | | 452 | |
6.00%, 06/15/20 | | 200 | | 231 | |
4.80%, 07/08/44 | | 250 | | 268 | |
HBOS Plc, 6.75%, 05/21/18 (a) | | 400 | | 446 | |
HSBC Bank USA NA, 4.88%, 08/24/20 | | 110 | | 121 | |
HSBC Capital Funding LP, 10.18%, (callable at 100 beginning 06/30/30) (a) (g) | | 100 | | 150 | |
HSBC Finance Corp., 6.68%, 01/15/21 | | 350 | | 415 | |
HSBC Holdings Plc, 6.80%, 06/01/38 | | 300 | | 398 | |
Industrial & Commercial Bank of China Ltd., 2.35%, 11/13/17 | | 400 | | 399 | |
Intesa Sanpaolo SpA | | | | | |
3.13%, 01/15/16 | | 200 | | 203 | |
6.50%, 02/24/21 (a) | | 250 | | 289 | |
5.02%, 06/26/24 (c) (d) | | 400 | | 388 | |
JPMorgan Chase & Co. | | | | | |
5.00% (callable at 100 beginning 07/01/19) (g) | | 150 | | 147 | |
6.10% (callable at 100 beginning 10/01/24) (g) | | 500 | | 499 | |
1.06%, 05/30/17 (b), GBP | | 50 | | 77 | |
6.30%, 04/23/19 | | 300 | | 348 | |
3.63%, 05/13/24 | | 150 | | 154 | |
JPMorgan Chase Bank NA | | | | | |
0.57%, 06/13/16 (b) | | 250 | | 249 | |
5.38%, 09/28/16, GBP | | 100 | | 166 | |
0.78%, 05/31/17 (b), EUR | | 550 | | 664 | |
0.65%, 06/02/17 (b) | | 250 | | 249 | |
6.00%, 10/01/17 | | 250 | | 277 | |
LeasePlan Corp., 3.00%, 10/23/17 (c) (d) | | 200 | | 205 | |
LeasePlan Corp. NV, 2.50%, 05/16/18 (a) | | 200 | | 200 | |
Merrill Lynch & Co. Inc., 6.88%, 04/25/18 | | 1,010 | | 1,160 | |
Moody’s Corp. | | | | | |
4.50%, 09/01/22 | | 200 | | 214 | |
4.88%, 02/15/24 | | 290 | | 319 | |
Morgan Stanley | | | | | |
6.25%, 08/28/17 | | 100 | | 111 | |
| | | | | | | |
See accompanying Notes to Financial Statements.
| | Shares/Par † | | Value | |
7.30%, 05/13/19 | | 290 | | 344 | |
5.75%, 01/25/21 | | 100 | | 115 | |
Rio Oil Finance Trust | | | | | |
6.25%, 07/06/24 (a) | | 250 | | 239 | |
6.75%, 01/06/27 (a) | | 250 | | 239 | |
Royal Bank of Scotland Group Plc, 6.99%, (callable at 100 beginning 10/05/17) (a) (g) | | 400 | | 450 | |
Royal Bank of Scotland NV, 4.65%, 06/04/18 | | 500 | | 519 | |
Royal Bank of Scotland Plc, 9.50%, 03/16/22 | | 100 | | 114 | |
Sberbank of Russia Via SB Capital SA | | | | | |
5.40%, 03/24/17 | | 200 | | 187 | |
3.35%, 11/15/19, EUR | | 100 | | 100 | |
5.72%, 06/16/21 | | 200 | | 173 | |
UBS AG | | | | | |
2.38%, 08/14/19 | | 300 | | 300 | |
7.63%, 08/17/22 | | 750 | | 883 | |
Wells Fargo & Co. | | | | | |
5.90% (callable at 100 beginning 06/15/24) (g) | | 100 | | 101 | |
3.00%, 01/22/21 | | 300 | | 306 | |
4.48%, 01/16/24 | | 100 | | 107 | |
4.65%, 11/04/44 | | 100 | | 103 | |
Wells Fargo Bank NA, 5.95%, 08/26/36 | | 100 | | 126 | |
Other Securities | | | | 10,265 | |
| | | | 34,648 | |
HEALTH CARE - 3.3% | | | | | |
Amgen Inc. | | | | | |
2.30%, 06/15/16 | | 150 | | 152 | |
4.10%, 06/15/21 | | 355 | | 381 | |
3.63%, 05/22/24 | | 300 | | 305 | |
Medtronic Inc. | | | | | |
1.04%, 03/15/20 (a) (b) | | 150 | | 150 | |
3.50%, 03/15/25 (a) | | 250 | | 256 | |
WellPoint Inc., 1.25%, 09/10/15 | | 500 | | 502 | |
Other Securities | | | | 1,137 | |
| | | | 2,883 | |
INDUSTRIALS - 2.7% | | | | | |
International Lease Finance Corp. | | | | | |
6.75%, 09/01/16 (a) | | 200 | | 213 | |
7.13%, 09/01/18 (a) | | 190 | | 213 | |
Masco Corp. | | | | | |
6.13%, 10/03/16 | | 150 | | 159 | |
5.85%, 03/15/17 | | 50 | | 54 | |
5.95%, 03/15/22 | | 150 | | 166 | |
6.50%, 08/15/32 | | 100 | | 102 | |
Other Securities | | | | 1,478 | |
| | | | 2,385 | |
INFORMATION TECHNOLOGY - 2.8% | | | | | |
Alibaba Group Holding Ltd. | | | | | |
3.13%, 11/28/21 (a) | | 300 | | 296 | |
3.60%, 11/28/24 (a) | | 300 | | 298 | |
Avago Technologies Term Loan, 3.75%, 04/01/21 (b) | | 599 | | 596 | |
Other Securities | | | | 1,312 | |
| | | | 2,502 | |
MATERIALS - 1.3% | | | | | |
Other Securities | | | | 1,111 | |
| | | | | |
TELECOMMUNICATION SERVICES - 4.8% | | | | | |
Crown Castle International Corp., 5.25%, 01/15/23 | | 100 | | 102 | |
Crown Castle International Corp. New Term Loan B, 3.00%, 01/31/21 (b) | | 398 | | 391 | |
Telefonica Emisiones SAU | | | | | |
3.99%, 02/16/16 | | 300 | | 309 | |
6.42%, 06/20/16 | | 100 | | 107 | |
Verizon Communications Inc. | | | | | |
1.01%, 06/17/19 (b) | | 100 | | 101 | |
2.63%, 02/21/20 (a) | | 500 | | 494 | |
4.50%, 09/15/20 | | 200 | | 217 | |
5.15%, 09/15/23 | | 400 | | 442 | |
6.55%, 09/15/43 | | 280 | | 359 | |
5.01%, 08/21/54 (a) | | 279 | | 289 | |
Other Securities | | | | 1,421 | |
| | | | 4,232 | |
UTILITIES - 2.1% | | | | | |
Israel Electric Corp. Ltd. | | | | | |
5.63%, 06/21/18 | | 200 | | 211 | |
7.25%, 01/15/19 (a) | | 200 | | 223 | |
Other Securities | | | | 1,434 | |
| | | | 1,868 | |
Total Corporate Bonds and Notes (cost $63,466) | | | | 63,430 | |
| | | | | |
GOVERNMENT AND AGENCY OBLIGATIONS - 17.4% | | | | | |
| | | | | |
GOVERNMENT SECURITIES - 16.4% | | | | | |
Municipals - 0.2% | | | | | |
Other Securities | | | | 199 | |
| | | | | |
Sovereign - 1.5% | | | | | |
Italy Buoni Poliennali Del Tesoro, 5.50%, 11/01/22, EUR | | 500 | | 778 | |
Other Securities | | | | 522 | |
| | | | 1,300 | |
Treasury Inflation Index Securities - 1.3% | | | | | |
U.S. Treasury Inflation Indexed Note, 2.38%, 01/15/25 (k) | | 1,008 | | 1,185 | |
| | | | | |
U.S. Treasury Securities - 13.4% | | | | | |
U.S. Treasury Bond | | | | | |
3.13%, 11/15/41 | | 260 | | 281 | |
3.13%, 02/15/42 | | 100 | | 108 | |
3.00%, 05/15/42 (l) | | 800 | | 841 | |
3.63%, 08/15/43 | | 300 | | 353 | |
0.00%,11/15/43 (f) | | 2,500 | | 1,099 | |
3.75%, 11/15/43 | | 3,700 | | 4,450 | |
3.63%, 02/15/44 | | 750 | | 883 | |
3.38%, 05/15/44 | | 25 | | 28 | |
3.13%, 08/15/44 (m) | | 2,050 | | 2,207 | |
Principal Only, 0.00%, 08/15/43 (f) | | 1,300 | | 576 | |
Principal Only, 0.00%, 02/15/44 (f) | | 1,300 | | 567 | |
U.S. Treasury Note | | | | | |
0.25%, 02/28/15 (l) | | 64 | | 64 | |
0.25%, 05/15/15 | | 100 | | 100 | |
2.25%, 11/15/24 | | 250 | | 252 | |
| | | | 11,809 | |
U.S. GOVERNMENT AGENCY MORTGAGE-BACKED SECURITIES - 1.0% | | | | | |
Federal National Mortgage Association - 1.0% | | | | | |
Federal National Mortgage Association, 3.00%, 01/15/45, TBA (m) | | 900 | | 910 | |
Total Government and Agency Obligations
(cost $14,304) | | | | 15,403 | |
| | | | | |
COMMON STOCKS - 0.9% | | | | | |
| | | | | |
CONSUMER DISCRETIONARY - 0.7% | | | | | |
Other Securities | | | | 661 | |
| | | | | |
FINANCIALS - 0.0% | | | | | |
Citigroup Inc. | | 1 | | 42 | |
| | | | | |
INFORMATION TECHNOLOGY - 0.2% | | | | | |
Other Securities | | | | 132 | |
Total Common Stocks (cost $903) | | | | 835 | |
See accompanying Notes to Financial Statements.
Curian Variable Series Trust Sub-Advised Funds
Schedules of Investments (in thousands, except contracts)
December 31, 2014
| | Shares/Par/Contracts † | | Value | |
PREFERRED STOCKS - 0.4% | | | | | |
| | | | | |
FINANCIALS - 0.4% | | | | | |
Other Securities | | | | 339 | |
Total Preferred Stocks (cost $337) | | | | 339 | |
| | | | | |
PURCHASED OPTIONS - 0.1% | | | | | |
Other Securities | | | | 49 | |
Total Purchased Options (cost $163) | | | | 49 | |
| | | | | |
TRUST PREFERREDS - 0.5% | | | | | |
| | | | | |
FINANCIALS - 0.5% | | | | | |
Citigroup Capital XIII, 7.88%, (callable at 25 beginning 10/30/15) | | 17 | | 438 | |
| | | | | |
UTILITIES - 0.0% | | | | | |
Other Securities | | | | 11 | |
Total Trust Preferreds (cost $463) | | | | 449 | |
| | | | | |
SHORT TERM INVESTMENTS - 8.7% | | | | | |
Certificates of Deposit - 0.8% | | | | | |
Banco Bilbao Vizcaya Argentaria | | | | | |
0.98%, 10/23/15 (b) | | $ | 250 | | 250 | |
1.08%, 05/16/16 (b) | | 250 | | 250 | |
Credit Suisse, 0.61%, 01/28/16 (b) | | 200 | | 200 | |
| | | | 700 | |
Federal Home Loan Bank - 1.2% | | | | | |
Federal Home Loan Bank | | | | | |
0.08%, 04/17/15 (o) | | 300 | | 300 | |
0.09%, 04/29/15 (o) | | 500 | | 500 | |
0.11%, 05/20/15 (o) | | 300 | | 300 | |
| | | | 1,100 | |
Federal Home Loan Mortgage Corp. - 1.5% | | | | | |
Federal Home Loan Mortgage Corp. | | | | | |
0.06%, 02/09/15 (o) | | 100 | | 100 | |
0.09%, 02/13/15 (o) | | 300 | | 300 | |
0.05%, 03/11/15 (o) | | 600 | | 600 | |
0.07%, 04/09/15 (o) | | 300 | | 300 | |
| | | | 1,300 | |
Federal National Mortgage Association - 1.3% | | | | | |
Federal National Mortgage Association | | | | | |
0.05%, 03/16/15 (o) | | 100 | | 100 | |
0.07%, 04/08/15 (o) | | 200 | | 200 | |
0.09%, 04/27/15 (o) | | 300 | | 300 | |
0.09%, 05/01/15 (o) | | 600 | | 600 | |
| | | | 1,200 | |
Investment Company - 0.9% | | | | | |
JNL Money Market Fund, 0.01% (p) (q) | | 817 | | 817 | |
| | | | | |
Treasury Securities - 3.0% | | | | | |
Mexico Cetes, 0.20%, 04/30/15, MXN | | 2,867 | | 1,924 | |
U.S. Treasury Bill, 0.02%, 01/29/15 | | $ | 600 | | 600 | |
Other Securities | | | | 121 | |
| | | | 2,645 | |
Total Short Term Investments (cost $7,796) | | | | 7,762 | |
| | | | | |
Total Investments - 103.7% (cost $90,887) | | | | 91,810 | |
Other Assets and Liabilities, Net - (3.7%) | | | | (3,299 | ) |
Total Net Assets - 100.0% | | | | $ | 88,511 | |
| | | | | | | |
(a) | The Sub-Adviser has deemed this security which is exempt from registration under the 1933 Act to be liquid based on procedures approved by the Trust’s Board of Trustees. As of December 31, 2014, the aggregate value of these liquid securities was $16,034 which represented 18.1% of net assets. |
(b) | Variable rate security. Rate stated was in effect as of December 31, 2014. |
(c) | Security is restricted to resale to institutional investors. See Restricted Securities in these Schedules of Investments. |
(d) | The Sub-Adviser has deemed this security to be illiquid based on procedures approved by the Trust’s Board of Trustees. |
(e) | The interest rate for this security is inversely affected by upgrades or downgrades to the credit rating of the issuer. |
(f) | Security issued with a zero coupon. Income is recognized through the accretion of discount. |
(g) | Perpetual security. |
(h) | Convertible security. |
(i) | Security is a “step-up” bond where the coupon may increase or step up at a future date. Rate stated was the coupon as of December 31, 2014. |
(j) | This variable rate senior loan will settle after December 31, 2014, at which time the interest rate will be determined. |
(k) | Treasury inflation indexed note, par amount is adjusted for inflation. |
(l) | All or a portion of the security is pledged or segregated as collateral. See the Notes to Financial Statements. |
(m) | All or a portion of the investment was purchased on a delayed delivery basis. As of December 31, 2014, the total cost of investments purchased on a delayed delivery basis was $3,086. |
(n) | Non-income producing security. |
(o) | This security is a direct debt of the agency and not collateralized by mortgages. |
(p) | Investment in affiliate. |
(q) | Yield changes daily to reflect current market conditions. Rate was the quoted yield as of December 31, 2014. |
Investments by Country‡ | | Percentage of Total
Long-Term
Investments | |
Australia | | 0.4 | % |
Brazil | | 1.6 | |
Canada | | 0.5 | |
Cayman Islands | | 0.3 | |
Chile | | 0.6 | |
China | | 2.7 | |
Colombia | | 0.1 | |
Ecuador | | 0.1 | |
France | | 1.5 | |
Germany | | 0.1 | |
Greece | | 0.2 | |
Hong Kong | | 0.2 | |
India | | 0.9 | |
Indonesia | | 0.1 | |
Israel | | 0.5 | |
Italy | | 3.2 | |
Japan | | 1.0 | |
Luxembourg | | 0.9 | |
Macau | | 0.2 | |
Mexico | | 0.2 | |
Netherlands | | 1.9 | |
Peru | | 0.5 | |
Portugal | | 0.3 | |
Russian Federation | | 1.9 | |
Singapore | | 0.6 | |
Slovenia | | 0.4 | |
South Africa | | 0.2 | |
South Korea | | 0.5 | |
Spain | | 0.7 | |
Switzerland | | 2.4 | |
United Kingdom | | 5.0 | |
United States | | 70.3 | |
Total Long-Term Investments | | 100.0 | % |
‡ The country table is presented for this Fund because its strategy includes investment in non-U.S. securities as deemed significant by the Fund’s Adviser.
See accompanying Notes to Financial Statements.
Restricted Securities - The Fund invests in securities that are restricted under the 1933 Act or which are subject to legal, contractual, or other agreed upon restrictions on resale. Restricted securities are often purchased in private placement transactions and cannot be sold without prior registration unless the sale is pursuant to an exemption under the 1933 Act, as amended. As of December 31, 2014, the Fund held investments in restricted securities, excluding certain securities exempt from registration under the 1933 Act which are deemed to be liquid, as follows:
| | Initial
Acquisition
Date | | Cost | | Ending
Value | | Percent of
Net Assets | |
Anglo American Capital Plc, 4.13%, 04/15/21 | | 04/08/2014 | | $ | 199 | | $ | 201 | | 0.2 | % |
BGC Partners Inc., 5.38%, 12/09/19 | | 12/05/2014 | | 223 | | 221 | | 0.3 | |
BP AMI Leasing Inc., 5.52%, 05/08/19 | | 09/25/2014 | | 141 | | 140 | | 0.2 | |
Bank of Tokyo-Mitsubishi UFJ Ltd., 2.35%, 09/08/19 | | 09/03/2014 | | 400 | | 397 | | 0.5 | |
Canadian Oil Sands Ltd., 7.75%, 05/15/19 | | 04/13/2012 | | 58 | | 54 | | 0.1 | |
Corp. Nacional del Cobre de Chile, 2.25%, 07/09/24 | | 07/03/2014 | | 135 | | 125 | | 0.1 | |
Cox Communications Inc., 3.85%, 02/01/25 | | 12/02/2014 | | 200 | | 202 | | 0.2 | |
Credit Agricole SA, 6.63%, callable at 100 beginning 09/23/19 | | 09/12/2014 | | 300 | | 291 | | 0.3 | |
Enable Midstream Partners LP, 2.40%, 05/15/19 | | 05/20/2014 | | 200 | | 195 | | 0.2 | |
Glencore Funding LLC, 1.70%, 05/27/16 | | 01/17/2014 | | 150 | | 150 | | 0.2 | |
Intesa Sanpaolo SpA, 5.02%, 06/26/24 | | 06/20/2014 | | 400 | | 388 | | 0.4 | |
LeasePlan Corp., 3.00%, 10/23/17 | | 03/24/2014 | | 204 | | 205 | | 0.2 | |
MTN Mauritius Investments Ltd., 4.76%, 11/11/24 | | 11/04/2014 | | 200 | | 196 | | 0.2 | |
OMX Timber Finance Investments I LLC, 5.42%, 01/29/20 | | 09/15/2014 | | 333 | | 332 | | 0.4 | |
Petrofac Ltd., 3.40%, 10/10/18 | | 10/04/2013 | | 100 | | 99 | | 0.1 | |
Piper Jaffray Cos., 3.26%, 05/31/17 | | 06/03/2014 | | 100 | | 100 | | 0.1 | |
TIAA Asset Management Finance Co. LLC, 2.95%, 11/01/19 | | 10/28/2014 | | 100 | | 100 | | 0.1 | |
| | | | $ | 3,443 | | $ | 3,396 | | 3.8 | % |
Schedule of Written Options
| | Expiration
Date | | Exercise
Price | | Contracts/
Notional Contracts | | Value | |
Index Options | | | | | | | | | |
CDX.NA.IG.23 Put Option, CSI | | 02/18/2015 | | 0.85 | | 17 | | $ | (1 | ) |
CDX.NA.IG.23 Put Option, CSI | | 01/21/2015 | | 0.85 | | 17 | | — | |
CDX.NA.IG.23 Put Option, JPM | | 03/18/2015 | | 1.00 | | 17 | | (1 | ) |
CDX.NA.IG.23 Put Option, JPM | | 03/18/2015 | | 0.95 | | 26 | | (2 | ) |
Euro Stoxx 50 Index Put Option, CSI | | 12/20/2019 | | 300.00 | | 17 | | (57 | ) |
iTraxx Europe Main Series 22 Call Option, BNP | | 01/21/2015 | | 0.60 | | 2 | | — | |
iTraxx Europe Main Series 22 Call Option, BOA | | 02/18/2015 | | 0.55 | | 2 | | — | |
iTraxx Europe Main Series 22 Call Option, CIT | | 01/21/2015 | | 0.60 | | 3 | | (1 | ) |
iTraxx Europe Main Series 22 Call Option, GSC | | 01/21/2015 | | 0.60 | | 1 | | — | |
iTraxx Europe Main Series 22 Call Option, GSC | | 03/18/2015 | | 0.50 | | 4 | | (1 | ) |
iTraxx Europe Main Series 22 Call Option, JPM | | 03/18/2015 | | 0.50 | | 4 | | (1 | ) |
iTraxx Europe Main Series 22 Call Option, JPM | | 01/21/2015 | | 0.60 | | 1 | | — | |
iTraxx Europe Main Series 22 Put Option, BNP | | 01/21/2015 | | 0.90 | | 2 | | — | |
iTraxx Europe Main Series 22 Put Option, BOA | | 02/18/2015 | | 0.85 | | 2 | | — | |
iTraxx Europe Main Series 22 Put Option, CIT | | 01/21/2015 | | 0.90 | | 2 | | — | |
iTraxx Europe Main Series 22 Put Option, CIT | | 01/21/2015 | | 1.00 | | 1 | | — | |
iTraxx Europe Main Series 22 Put Option, CSI | | 01/21/2015 | | 0.90 | | 13 | | — | |
iTraxx Europe Main Series 22 Put Option, CSI | | 01/21/2015 | | 0.85 | | 7 | | — | |
iTraxx Europe Main Series 22 Put Option, GSC | | 01/21/2015 | | 1.20 | | 3 | | — | |
iTraxx Europe Main Series 22 Put Option, GSC | | 01/21/2015 | | 1.00 | | 1 | | — | |
iTraxx Europe Main Series 22 Put Option, GSC | | 03/18/2015 | | 0.85 | | 4 | | (1 | ) |
iTraxx Europe Main Series 22 Put Option, JPM | | 01/21/2015 | | 1.00 | | 1 | | — | |
iTraxx Europe Main Series 22 Put Option, JPM | | 03/18/2015 | | 0.85 | | 4 | | (1 | ) |
| | | | | | 151 | | $ | (66 | ) |
| | | | | | | | | |
Foreign Currency Options | | | | | | | | | |
Brazilian Real versus USD Call Option, BOA | | 05/27/2015 | | BRL | 2.65 | | 400,000 | | $ | (23 | ) |
Brazilian Real versus USD Call Option, GSB | | 06/02/2015 | | BRL | 2.70 | | 200,000 | | (10 | ) |
Indian Rupee versus USD Call Option, BOA | | 02/27/2015 | | INR | 65.20 | | 200,000 | | (1 | ) |
Indian Rupee versus USD Call Option, GSB | | 06/02/2015 | | INR | 67.00 | | 100,000 | | (1 | ) |
See accompanying Notes to Financial Statements.
| | Expiration
Date | | Exercise
Price | | Contracts/
Notional Contracts | | Value | |
Foreign Currency Options (continued) | | | | | | | | | |
Indian Rupee versus USD Call Option, MSB | | 06/03/2015 | | INR | 65.90 | | 300,000 | | $ | (5 | ) |
| | | | | | 1,200,000 | | $ | (40 | ) |
| | | | | | | | | |
Interest Rate Swaptions | | | | | | | | | |
Call Swaption, 3-Month LIBOR versus 2.30% fixed, GSC | | 02/13/2015 | | N/A | | 15 | | $ | (12 | ) |
Call Swaption, 3-Month LIBOR versus 2.91% fixed, MSS | | 08/17/2015 | | N/A | | 49 | | (26 | ) |
Call Swaption, 6-Month Euribor versus 0.35% fixed, GSB | | 09/08/2015 | | N/A | | 16 | | (6 | ) |
Call Swaption, 6-Month Euribor versus 0.95% fixed, DUB | | 03/23/2015 | | N/A | | 1 | | (2 | ) |
Call Swaption, 6-Month Euribor versus 0.95% fixed, GSB | | 03/23/2015 | | N/A | | 1 | | (2 | ) |
Put Swaption, 3-Month LIBOR versus 2.50% fixed, DUB | | 09/21/2015 | | N/A | | 2 | | (2 | ) |
Put Swaption, 3-Month LIBOR versus 2.80% fixed, GSC | | 02/13/2015 | | N/A | | 15 | | — | |
Put Swaption, 3-Month LIBOR versus 2.91% fixed, MSS | | 08/17/2015 | | N/A | | 49 | | (8 | ) |
Put Swaption, 3-Month LIBOR versus 3.38% fixed, MSS | | 03/04/2015 | | N/A | | 23 | | — | |
Put Swaption, 3-Month LIBOR versus 3.40% fixed, JPM | | 03/04/2015 | | N/A | | 23 | | — | |
Put Swaption, 6-Month Euribor versus 0.35% fixed, GSB | | 09/08/2015 | | N/A | | 16 | | (2 | ) |
Put Swaption, 6-Month Euribor versus 1.55% fixed, DUB | | 03/23/2015 | | N/A | | 1 | | — | |
Put Swaption, 6-Month Euribor versus 1.55% fixed, GSB | | 03/23/2015 | | N/A | | 1 | | — | |
| | | | | | 212 | | $ | (60 | ) |
| | | | | | | | | | | |
Summary of Written Options
| | Contracts/
Notional
Contracts | | Premiums | |
Options outstanding at December 31, 2013 | | 300 | | $ | 59 | |
Options written during the year | | 2,550,694 | | 399 | |
Options closed during the year | | (167 | ) | (21 | ) |
Options expired during the year | | (1,350,464 | ) | (155 | ) |
Options outstanding at December 31, 2014 | | 1,200,363 | | $ | 282 | |
Schedule of Open Futures Contracts
| | Expiration | | Contracts
Long /
(Short) | | Unrealized
Appreciation /
(Depreciation) | |
5-Year USD Deliverable Interest Rate Swap Future | | March 2015 | | 12 | | $ | 5 | |
Euro-Bund Future | | March 2015 | | (2 | ) | (5 | ) |
JPX-Nikkei Index 400 Future | | March 2015 | | 8 | | — | |
U.S. Treasury Note Future, 10-Year | | March 2015 | | 27 | | 22 | |
| | | | | | $ | 22 | |
Schedule of Open Forward Foreign Currency Contracts
Purchased/
Sold | | Settlement
Date | | Counter-
Party | | Notional
Amount | | Value | | Unrealized
Gain/(Loss) | |
BRL/USD | | 01/05/2015 | | BNP | | BRL | 224 | | $ | 84 | | $ | (2 | ) |
BRL/USD | | 01/05/2015 | | CSI | | BRL | 227 | | 85 | | — | |
BRL/USD | | 01/05/2015 | | MSC | | BRL | 192 | | 72 | | — | |
BRL/USD | | 07/02/2015 | | DUB | | BRL | 224 | | 80 | | (2 | ) |
EUR/USD | | 01/05/2015 | | BNP | | EUR | 1,810 | | 2,190 | | (67 | ) |
EUR/USD | | 01/05/2015 | | CIT | | EUR | 4,000 | | 4,840 | | (62 | ) |
GBP/USD | | 02/03/2015 | | UBS | | GBP | 56 | | 87 | | — | |
INR/USD | | 01/20/2015 | | CIT | | INR | 16,124 | | 255 | | (4 | ) |
JPY/USD | | 01/05/2015 | | MSC | | JPY | 212,700 | | 1,776 | | (53 | ) |
JPY/USD | | 01/05/2015 | | BOA | | JPY | 104,461 | | 872 | | 1 | |
MXN/USD | | 02/05/2015 | | BCL | | MXN | 2,384 | | 161 | | (15 | ) |
| | | | | | | | | | | | | | |
See accompanying Notes to Financial Statements.
Curian Variable Series Trust Sub-Advised Funds
Schedules of Investments (in thousands)
December 31, 2014
Purchased/
Sold | | Settlement
Date | | Counter-
Party | | Notional
Amount | | Value | | Unrealized
Gain/(Loss) | |
MXN/USD | | 02/05/2015 | | MSC | | MXN | 4,803 | | $ | 325 | | $ | (15 | ) |
USD/AUD | | 01/05/2015 | | JPM | | AUD | (290 | ) | (237 | ) | 9 | |
USD/BRL | | 01/05/2015 | | DUB | | BRL | (224 | ) | (84 | ) | 3 | |
USD/BRL | | 01/05/2015 | | CSI | | BRL | (227 | ) | (86 | ) | 1 | |
USD/BRL | | 01/05/2015 | | BNP | | BRL | (192 | ) | (72 | ) | (2 | ) |
USD/BRL | | 02/03/2015 | | MSC | | BRL | (192 | ) | (72 | ) | — | |
USD/BRL | | 07/02/2015 | | CSI | | BRL | (227 | ) | (81 | ) | — | |
USD/EUR | | 01/05/2015 | | JPM | | EUR | (5,810 | ) | (7,030 | ) | 168 | |
USD/EUR | | 02/03/2015 | | CIT | | EUR | (4,000 | ) | (4,842 | ) | 62 | |
USD/GBP | | 02/03/2015 | | MSC | | GBP | (783 | ) | (1,220 | ) | 3 | |
USD/JPY | | 01/05/2015 | | CSI | | JPY | (160,261 | ) | (1,338 | ) | 16 | |
USD/JPY | | 01/05/2015 | | BOA | | JPY | (156,900 | ) | (1,310 | ) | 2 | |
USD/JPY | | 02/03/2015 | | BOA | | JPY | (104,461 | ) | (872 | ) | (1 | ) |
USD/MXN | | 02/05/2015 | | BNP | | MXN | (4,024 | ) | (272 | ) | 14 | |
USD/MXN | | 02/05/2015 | | BNP | | MXN | (296 | ) | (20 | ) | — | |
USD/MXN | | 02/05/2015 | | DUB | | MXN | (405 | ) | (27 | ) | — | |
USD/MXN | | 04/30/2015 | | CIT | | MXN | (28,376 | ) | (1,909 | ) | 16 | |
| | | | | | | | | $ | (8,645 | ) | $ | 72 | |
Schedule of Interest Rate Swap Agreements
Counterparty | | Floating Rate Index | | Fund Paying /
Receiving
Floating Rate | | Fixed Rate | | Expiration
Date | | Notional
Amount (1) | | Premiums
Paid /
(Received) | | Unrealized
Appreciation /
(Depreciation) | |
Over the Counter Interest Rate Swap Agreements | |
BNP | | Brazil Interbank Deposit Rate | | Paying | | 11.68 | % | 01/04/2021 | | BRL | 1,600 | | $ | (2 | ) | $ | (2 | ) |
BOA | | Brazil Interbank Deposit Rate | | Paying | | 8.91 | % | 01/02/2017 | | BRL | 2,000 | | 2 | | (54 | ) |
BOA | | Brazil Interbank Deposit Rate | | Paying | | 8.91 | % | 01/02/2017 | | BRL | 1,600 | | 2 | | (44 | ) |
DUB | | Brazil Interbank Deposit Rate | | Paying | | 11.68 | % | 01/04/2021 | | BRL | 900 | | (1 | ) | (2 | ) |
DUB | | Brazil Interbank Deposit Rate | | Paying | | 12.00 | % | 01/04/2021 | | BRL | 900 | | — | | — | |
GSB | | Brazil Interbank Deposit Rate | | Paying | | 12.06 | % | 01/04/2021 | | BRL | 800 | | 3 | | (1 | ) |
UBS | | Brazil Interbank Deposit Rate | | Paying | | 11.47 | % | 01/02/2017 | | BRL | 3,700 | | 7 | | (18 | ) |
UBS | | Brazil Interbank Deposit Rate | | Paying | | 11.68 | % | 01/04/2021 | | BRL | 100 | | — | | — | |
UBS | | Brazil Interbank Deposit Rate | | Paying | | 11.00 | % | 01/04/2021 | | BRL | 100 | | — | | (1 | ) |
UBS | | Brazil Interbank Deposit Rate | | Paying | | 11.00 | % | 01/04/2021 | �� | BRL | 1,300 | | (5 | ) | (10 | ) |
BNP | | Eurozone HICP | | Receiving | | 1.05 | % | 09/15/2019 | | EUR | 100 | | — | | (3 | ) |
BNP | | Eurozone HICP | | Receiving | | 1.00 | % | 10/15/2019 | | EUR | 100 | | — | | (2 | ) |
BNP | | Eurozone HICP | | Receiving | | 1.00 | % | 10/15/2019 | | EUR | 100 | | — | | (2 | ) |
BNP | | Eurozone HICP | | Receiving | | 0.85 | % | 12/15/2019 | | EUR | 50 | | — | | (1 | ) |
BOA | | Eurozone HICP | | Receiving | | 0.70 | % | 12/15/2018 | | EUR | 100 | | — | | (1 | ) |
BOA | | Eurozone HICP | | Receiving | | 1.05 | % | 09/15/2019 | | EUR | 100 | | — | | (3 | ) |
BOA | | Eurozone HICP | | Receiving | | 0.75 | % | 12/10/2019 | | EUR | 50 | | — | | (1 | ) |
BOA | | Eurozone HICP | | Receiving | | 0.75 | % | 12/10/2019 | | EUR | 50 | | — | | (1 | ) |
CIT | | Eurozone HICP | | Receiving | | 0.75 | % | 12/15/2019 | | EUR | 100 | | — | | (2 | ) |
DUB | | Eurozone HICP | | Receiving | | 0.60 | % | 12/15/2018 | | EUR | 50 | | — | | — | |
DUB | | Eurozone HICP | | Receiving | | 0.75 | % | 12/15/2019 | | EUR | 100 | | — | | (1 | ) |
GSB | | Eurozone HICP | | Receiving | | 0.90 | % | 10/15/2019 | | EUR | 100 | | — | | (2 | ) |
GSB | | Eurozone HICP | | Receiving | | 0.90 | % | 10/15/2019 | | EUR | 100 | | — | | (2 | ) |
GSB | | Eurozone HICP | | Receiving | | 1.00 | % | 10/15/2019 | | EUR | 100 | | — | | (3 | ) |
GSB | | Eurozone HICP | | Receiving | | 0.90 | % | 11/15/2019 | | EUR | 100 | | — | | (2 | ) |
GSB | | Eurozone HICP | | Receiving | | 0.90 | % | 11/15/2019 | | EUR | 200 | | — | | (4 | ) |
GSB | | Eurozone HICP | | Receiving | | 0.90 | % | 11/15/2019 | | EUR | 50 | | — | | (1 | ) |
GSB | | Eurozone HICP | | Receiving | | 0.90 | % | 11/15/2019 | | EUR | 100 | | — | | (2 | ) |
GSB | | Eurozone HICP | | Receiving | | 0.90 | % | 11/15/2019 | | EUR | 200 | | — | | (3 | ) |
MSC | | Eurozone HICP | | Receiving | | 0.35 | % | 12/15/2017 | | EUR | 50 | | — | | — | |
MSC | | Eurozone HICP | | Receiving | | 0.91 | % | 11/26/2019 | | EUR | 50 | | — | | (1 | ) |
MSC | | Eurozone HICP | | Receiving | | 0.80 | % | 12/10/2019 | | EUR | 50 | | — | | (1 | ) |
UBS | | Eurozone HICP | | Receiving | | 0.70 | % | 12/15/2018 | | EUR | 50 | | — | | (1 | ) |
UBS | | Eurozone HICP | | Receiving | | 0.91 | % | 11/26/2019 | | EUR | 50 | | — | | (1 | ) |
| | | | | | | | | | | | | | | | | | |
See accompanying Notes to Financial Statements.
Counterparty | | Floating Rate Index | | Fund Paying /
Receiving
Floating Rate | | Fixed Rate | | Expiration
Date | | Notional
Amount (1) | | Premiums
Paid /
(Received) | | Unrealized
Appreciation /
(Depreciation) | |
Over the Counter Interest Rate Swap Agreements (continued) | | | | |
UBS | | Eurozone HICP | | Receiving | | 0.91 | % | 11/26/2019 | | EUR | 50 | | $ | — | | $ | (1 | ) |
UBS | | Eurozone HICP | | Receiving | | 0.80 | % | 12/10/2019 | | EUR | 100 | | — | | (1 | ) |
CSI | | Eurozone HICP ex. Tobacco | | Receiving | | 1.05 | % | 09/15/2019 | | EUR | 100 | | — | | (3 | ) |
DUB | | Eurozone HICP ex. Tobacco | | Receiving | | 1.05 | % | 09/15/2019 | | EUR | 100 | | — | | (3 | ) |
GSB | | Eurozone HICP ex. Tobacco | | Receiving | | 1.05 | % | 09/15/2019 | | EUR | 100 | | — | | (4 | ) |
DUB | | Mexican Interbank Rate | | Paying | | 5.61 | % | 07/07/2021 | | MXN | 7,650 | | 1 | | (4 | ) |
MSC | | US CPURNSA | | Receiving | | 1.53 | % | 11/07/2016 | | | 100 | | — | | (2 | ) |
MSC | | US CPURNSA | | Receiving | | 1.53 | % | 11/07/2016 | | | 100 | | — | | (2 | ) |
| | | | | | | | | | | | $ | 7 | | $ | (192 | ) |
Counterparty | | Floating Rate Index | | Fund Paying /
Receiving
Floating Rate | | Fixed Rate | | Expiration
Date | | Notional
Amount (1) | | Unrealized
Appreciation /
(Depreciation) | |
Centrally Cleared Interest Rate Swap Agreements | | | |
N/A | | 3-Month Euribor | | Receiving | | 0.40 | % | 03/16/2015 | | EUR | 800 | | $ | (1 | ) |
N/A | | 3-Month LIBOR | | Receiving | | 2.70 | % | 05/21/2024 | | | 1,100 | | (43 | ) |
N/A | | 3-Month LIBOR | | Paying | | 2.46 | % | 11/15/2024 | | | 300 | | (5 | ) |
N/A | | 3-Month LIBOR | | Paying | | 3.00 | % | 12/17/2024 | | | 950 | | (14 | ) |
N/A | | 6-Month Australian Bank Bill Short Term Rate | | Paying | | 3.25 | % | 09/21/2017 | | AUD | 11,100 | | 96 | |
N/A | | 6-Month Euribor | | Receiving | | 1.25 | % | 03/18/2025 | | EUR | 1,300 | | (75 | ) |
N/A | | British Bankers’ Association Yen LIBOR | | Paying | | 1.00 | % | 09/18/2023 | | JPY | 66,700 | | (33 | ) |
N/A | | British Bankers’ Association Yen LIBOR | | Receiving | | 1.00 | % | 09/20/2024 | | JPY | 140,000 | | (15 | ) |
N/A | | London-Interbank Offered Rate | | Receiving | | 3.00 | % | 09/11/2024 | | GBP | 100 | | (6 | ) |
N/A | | London-Interbank Offered Rate | | Receiving | | 2.75 | % | 03/18/2025 | | GBP | 700 | | (74 | ) |
N/A | | Mexican Interbank Rate | | Paying | | 5.61 | % | 07/07/2021 | | MXN | 17,950 | | (4 | ) |
N/A | | Mexican Interbank Rate | | Paying | | 5.84 | % | 09/14/2021 | | MXN | 1,600 | | 1 | |
N/A | | Mexican Interbank Rate | | Paying | | 5.81 | % | 09/29/2021 | | MXN | 1,300 | | 1 | |
N/A | | Mexican Interbank Rate | | Paying | | 5.75 | % | 09/30/2021 | | MXN | 1,600 | | — | |
N/A | | Mexican Interbank Rate | | Paying | | 5.63 | % | 10/11/2021 | | MXN | 13,100 | | (5 | ) |
| | | | | | | | | | | | | $ | (177 | ) |
Schedule of Credit Default Swap Agreements
Counterparty | | Reference Obligation | | Implied
Credit
Spread (3) | | Fixed
Received /
Pay Rate (6) | | Expiration
Date | | Notional
Amount (1),(5) | | Value (4) | | Premiums
Paid /
(Received) | | Unrealized
Appreciation /
(Depreciation) | |
Over the Counter Credit Default Swap Agreements | | | | | | | | | |
Credit default swap agreements - sell protection (2) | | | | | | | | | |
CIT | | AT&T Inc., 1.60%, 02/15/2017 | | 0.35 | % | 1.00 | % | 12/20/2017 | | $ | (150 | ) | $ | 3 | | $ | 2 | | $ | 1 | |
BOA | | Barrick Gold Corp., 5.80%, 11/15/2034 | | 1.03 | % | 1.00 | % | 06/20/2018 | | (100 | ) | — | | (4 | ) | 4 | |
CIT | | Barrick Gold Corp., 5.80%, 11/15/2034 | | 1.26 | % | 1.00 | % | 12/20/2018 | | (100 | ) | (1 | ) | (4 | ) | 3 | |
MSS | | Barrick Gold Corp., 5.80%, 11/15/2034 | | 1.26 | % | 1.00 | % | 12/20/2018 | | (100 | ) | (1 | ) | (4 | ) | 3 | |
BBP | | Berkshire Hathaway Inc., 2.45%, 12/15/2015 | | 0.30 | % | 1.00 | % | 12/20/2017 | | (200 | ) | 4 | | (2 | ) | 6 | |
DUB | | BNP Paribas, 2.88%, 09/26/2023 | | 0.53 | % | 1.00 | % | 03/20/2019 | | (182 | ) | 4 | | 2 | | 2 | |
CGM | | CDX.NA.23 | | N/A | | 1.00 | % | 12/20/2024 | | (150 | ) | (4 | ) | (3 | ) | (1 | ) |
GSI | | Community Health Systems Inc., 8.00%, 11/15/2019 | | 3.45 | % | 5.00 | % | 03/20/2021 | | (100 | ) | 8 | | 7 | | 1 | |
GSI | | Credit Agricole, 5.07%, 08/10/2022 | | 0.60 | % | 1.00 | % | 09/20/2019 | | (250 | ) | 5 | | 3 | | 2 | |
CIT | | D.R. Horton Inc., 3.63%, 02/15/2018 | | 2.05 | % | 1.00 | % | 03/20/2021 | | (100 | ) | (6 | ) | (7 | ) | 1 | |
JPM | | Enbridge Inc. 4.90%,03/01/2015 | | 2.22 | % | 1.00 | % | 12/20/2019 | | (50 | ) | (3 | ) | — | | (3 | ) |
CSI | | Encana Corp., 4.75%, 10/15/2013 | | 1.55 | % | 1.00 | % | 03/20/2018 | | (100 | ) | (1 | ) | (1 | ) | — | |
CIT | | Exelon Generation Co. LLC, 6.20%, 10/01/2017 | | 0.88 | % | 1.00 | % | 03/20/2019 | | (100 | ) | 1 | | (2 | ) | 3 | |
CSI | | Federative Republic of Brazil, 12.25%, 03/06/2030 | | 1.37 | % | 1.00 | % | 09/20/2017 | | (100 | ) | (1 | ) | (3 | ) | 2 | |
CSI | | Federative Republic of Brazil, 12.25%, 03/06/2030 | | 1.64 | % | 1.00 | % | 12/20/2018 | | (100 | ) | (3 | ) | (5 | ) | 2 | |
JPM | | Federative Republic of Brazil, 12.25%, 03/06/2030 | | 1.64 | % | 1.00 | % | 12/20/2018 | | (100 | ) | (2 | ) | (5 | ) | 3 | |
MSC | | Federative Republic of Brazil, 12.25%, 03/06/2030 | | 1.31 | % | 1.00 | % | 06/20/2017 | | (100 | ) | (1 | ) | (3 | ) | 2 | |
MSS | | Federative Republic of Brazil, 12.25%, 03/06/2030 | | 1.64 | % | 1.00 | % | 12/20/2018 | | (100 | ) | (2 | ) | (4 | ) | 2 | |
| | | | | | | | | | | | | | | | | | | | | |
See accompanying Notes to Financial Statements.
Counterparty | | Reference Obligation | | Implied
Credit
Spread (3) | | Fixed
Received /
Pay Rate (6) | | Expiration
Date | | Notional
Amount (1),(5) | | Value (4) | | Premiums
Paid /
(Received) | | Unrealized
Appreciation /
(Depreciation) | |
Over the Counter Credit Default Swap Agreements - sell protection (2) (continued) | | | | | | |
BBP | | Ford Motor Co., 6.50%, 08/01/2018 | | 0.19 | % | 5.00 | % | 12/20/2015 | | $ | (50 | ) | $ | 3 | | $ | 5 | | $ | (2 | ) |
JPM | | Freeport-McMoRan Copper & Gold, 3.55%, 03/01/2022 | | 1.94 | % | 1.00 | % | 06/20/2019 | | (100 | ) | (4 | ) | (3 | ) | (1 | ) |
MSC | | Freeport-McMoRan Copper & Gold, 3.55%, 03/01/2022 | | 1.94 | % | 1.00 | % | 06/20/2019 | | (100 | ) | (4 | ) | (2 | ) | (2 | ) |
BBP | | General Electric Capital Corp., 5.63%, 09/15/2017 | | 0.51 | % | 1.00 | % | 03/20/2019 | | (200 | ) | 4 | | 2 | | 2 | |
DUB | | General Motors Co., 4.88%, 10/02/2023 | | 1.30 | % | 5.00 | % | 03/20/2019 | | (100 | ) | 16 | | 18 | | (2 | ) |
JPM | | HSBC Bank Plc, 6.00%, 12/14/2029 | | 1.87 | % | 1.00 | % | 12/20/2019 | | (242 | ) | (10 | ) | (4 | ) | (6 | ) |
BNP | | Italian Republic, 6.88%, 09/27/2023 | | 1.11 | % | 1.00 | % | 06/20/2019 | | (500 | ) | (2 | ) | 4 | | (6 | ) |
BOA | | Italian Republic, 6.88%, 09/27/2023 | | 1.07 | % | 1.00 | % | 03/20/2019 | | (400 | ) | (1 | ) | (7 | ) | 6 | |
DUB | | Italian Republic, 6.88%, 09/27/2023 | | 1.11 | % | 1.00 | % | 06/20/2019 | | (300 | ) | (2 | ) | (2 | ) | — | |
DUB | | Italian Republic, 6.88%, 09/27/2023 | | 1.11 | % | 1.00 | % | 06/20/2019 | | (400 | ) | (2 | ) | 3 | | (5 | ) |
MSC | | Italian Republic, 6.88%, 09/27/2023 | | 1.11 | % | 1.00 | % | 06/20/2019 | | (200 | ) | (1 | ) | 1 | | (2 | ) |
GSI | | KB Home, 9.10%, 09/15/2017 | | 2.15 | % | 5.00 | % | 09/20/2018 | | (100 | ) | 10 | | 5 | | 5 | |
BBP | | Kingdom of Spain, 5.50%, 07/30/2017 | | 0.75 | % | 1.00 | % | 06/20/2019 | | (400 | ) | 5 | | 3 | | 2 | |
BNP | | Kingdom of Spain, 5.50%, 07/30/2017 | | 0.68 | % | 1.00 | % | 12/20/2018 | | (100 | ) | 1 | | (4 | ) | 5 | |
BOA | | Kingdom of Spain, 5.50%, 07/30/2017 | | 0.71 | % | 1.00 | % | 03/20/2019 | | (400 | ) | 4 | | (3 | ) | 7 | |
CIT | | Kingdom of Spain, 5.50%, 07/30/2017 | | 0.75 | % | 1.00 | % | 06/20/2019 | | (150 | ) | 2 | | 1 | | 1 | |
DUB | | Kingdom of Spain, 5.50%, 07/30/2017 | | 0.68 | % | 1.00 | % | 12/20/2018 | | (200 | ) | 3 | | (7 | ) | 10 | |
GSI | | Kingdom of Spain, 5.50%, 07/30/2017 | | 0.71 | % | 1.00 | % | 03/20/2019 | | (800 | ) | 10 | | (7 | ) | 17 | |
JPM | | Kingdom of Spain, 5.50%, 07/30/2017 | | 0.75 | % | 1.00 | % | 06/20/2019 | | (150 | ) | 2 | | 1 | | 1 | |
BNP | | Lafarge SA, 5.38%, 11/29/2018 | | 0.86 | % | 1.00 | % | 03/20/2021 | | (121 | ) | — | | (14 | ) | 14 | |
CSI | | Lafarge SA, 5.38%, 11/29/2018 | | 0.86 | % | 1.00 | % | 03/20/2021 | | (121 | ) | 1 | | (13 | ) | 14 | |
BBP | | Metlife Inc., 4.75%, 02/08/2021 | | 0.50 | % | 1.00 | % | 12/20/2018 | | (600 | ) | 12 | | — | | 12 | |
BNP | | Petrobras International Finance Co., 8.38%, 12/10/2018 | | 5.66 | % | 1.00 | % | 06/20/2015 | | (100 | ) | (2 | ) | (1 | ) | (1 | ) |
BNP | | Petrobras International Finance Co., 6.25%, 01/25/2016 | | 4.43 | % | 1.00 | % | 06/20/2019 | | (100 | ) | (14 | ) | (8 | ) | (6 | ) |
BNP | | Petrobras International Finance Co., 8.38%, 12/10/2018 | | 4.42 | % | 1.00 | % | 09/20/2019 | | (400 | ) | (55 | ) | (21 | ) | (34 | ) |
BNP | | Petrobras International Finance Co., 8.38%, 12/10/2018 | | 4.41 | % | 1.00 | % | 12/20/2019 | | (400 | ) | (58 | ) | (45 | ) | (13 | ) |
DUB | | Petrobras International Finance Co., 8.38%, 12/10/2018 | | 5.66 | % | 1.00 | % | 03/20/2015 | | (100 | ) | (1 | ) | (1 | ) | — | |
GSI | | Republic of Colombia, 10.38%, 01/28/2033 | | 0.61 | % | 1.00 | % | 03/20/2016 | | (100 | ) | 1 | | 1 | | — | |
JPM | | Russian Federation, 7.50%, 03/31/2030 | | 4.78 | % | 1.00 | % | 12/20/2019 | | (800 | ) | (125 | ) | (87 | ) | (38 | ) |
CIT | | Teck Resources Ltd., 3.15%, 01/15/2017 | | 1.71 | % | 1.00 | % | 06/20/2018 | | (100 | ) | (3 | ) | (5 | ) | 2 | |
CSI | | Telecom Italia SpA, 5.38%, 01/29/2019 | | 1.40 | % | 1.00 | % | 06/20/2019 | | (60 | ) | (1 | ) | (4 | ) | 3 | |
CSI | | Telefonica Emisiones SAU, 4.38%, 02/02/2016 | | 0.96 | % | 1.00 | % | 06/20/2021 | | (121 | ) | — | | (6 | ) | 6 | |
DUB | | Tenet Healthcare Corp., 6.88%, 11/15/2031 | | 2.54 | % | 5.00 | % | 03/20/2019 | | (100 | ) | 10 | | 8 | | 2 | |
MSC | | Transocean Inc., 7.38%, 04/15/2018 | | 6.47 | % | 1.00 | % | 12/20/2019 | | (200 | ) | (43 | ) | (27 | ) | (16 | ) |
BBP | | United Mexican States, 5.95%, 03/19/2019 | | 0.82 | % | 1.00 | % | 12/20/2018 | | (250 | ) | 2 | | — | | 2 | |
BOA | | United Mexican States, 5.95%, 03/19/2019 | | 0.82 | % | 1.00 | % | 12/20/2018 | | (200 | ) | 1 | | — | | 1 | |
BOA | | United Mexican States, 5.95%, 03/19/2019 | | 0.85 | % | 1.00 | % | 03/20/2019 | | (100 | ) | 1 | | 1 | | — | |
CSI | | United Mexican States, 5.95%, 03/19/2019 | | 0.65 | % | 1.00 | % | 09/20/2017 | | (100 | ) | 1 | | (1 | ) | 2 | |
CSI | | United Mexican States, 5.95%, 03/19/2019 | | 0.82 | % | 1.00 | % | 12/20/2018 | | (50 | ) | — | | — | | — | |
GSI | | United Mexican States, 5.95%, 03/19/2019 | | 0.61 | % | 1.00 | % | 06/20/2017 | | (100 | ) | 1 | | (3 | ) | 4 | |
GSI | | United Mexican States, 5.95%, 03/19/2019 | | 0.82 | % | 1.00 | % | 12/20/2018 | | (150 | ) | 1 | | — | | 1 | |
GSI | | United Mexican States, 5.95%, 03/19/2019 | | 0.85 | % | 1.00 | % | 03/20/2019 | | (100 | ) | 1 | | 1 | | — | |
MSS | | United Mexican States, 5.95%, 03/19/2019 | | 0.85 | % | 1.00 | % | 03/20/2019 | | (400 | ) | 3 | | 3 | | — | |
BNP | | Unitymedia KabelBW, 9.63%, 12/01/2019 | | 1.21 | % | 5.00 | % | 03/20/2019 | | (121 | ) | 18 | | 13 | | 5 | |
BBP | | UPC Holding BV, 8.38%, 08/15/2020 | | 2.84 | % | 5.00 | % | 03/20/2021 | | (121 | ) | 15 | | 13 | | 2 | |
DUB | | Whirlpool Corp., 7.75%, 07/15/2016 | | 0.28 | % | 1.00 | % | 03/20/2018 | | (100 | ) | 3 | | (1 | ) | 4 | |
| | | | | | | | | | $ | (12,289 | ) | $ | (197 | ) | $ | (226 | ) | $ | 29 | |
See accompanying Notes to Financial Statements.
Counterparty | | Reference Obligation | | Fixed
Received /
Pay Rate (6) | | Expiration
Date | | Notional
Amount (1),(5) | | Value (4) | | Unrealized
Appreciation /
(Depreciation) | |
Centrally Cleared Credit Default Swap Agreements | |
Credit default swap agreements - sell protection (2) | |
N/A | | CDX.NA.HY.23 | | 5.00 | % | 12/20/2019 | | $ | (1,700 | ) | $ | 105 | | $ | 7 | |
N/A | | CDX.NA.IG.18 | | 1.00 | % | 06/20/2017 | | (275 | ) | 5 | | 1 | |
N/A | | CDX.NA.IG.18 | | 1.00 | % | 06/20/2022 | | (3,450 | ) | 28 | | 90 | |
N/A | | CDX.NA.IG.19 | | 1.00 | % | 12/20/2017 | | (500 | ) | 9 | | 4 | |
N/A | | CDX.NA.IG.19 | | 1.00 | % | 12/20/2022 | | (2,350 | ) | 12 | | 84 | |
N/A | | CDX.NA.IG.23 | | 1.00 | % | 12/20/2019 | | (5,300 | ) | 85 | | 11 | |
N/A | | iTraxx Europe Series 22 | | 1.00 | % | 12/20/2019 | | (2,057 | ) | 37 | | 2 | |
N/A | | iTraxx Europe Series 22 | | 1.00 | % | 12/20/2024 | | (363 | ) | — | | — | |
| | | | | | | | $ | (15,995 | ) | $ | 281 | | $ | 199 | |
(1)Notional amount is stated in USD unless otherwise noted.
(2)If the Fund is a seller of protection and a credit event occurs, as defined under the terms of that particular swap agreement, the Fund will either (i) pay the buyer of protection an amount equal to the notional amount of the referenced obligation and take delivery of the referenced obligation, other deliverable obligations or underlying securities comprising the referenced index or (ii) pay a net settlement amount in the form of cash or securities equal to the notional amount of the swap agreement less the recovery value of the reference obligation or underlying securities comprising the referenced index.
(3)Implied credit spreads, represented in absolute terms, utilized in determining the value of credit default swap agreements on corporate issues and sovereign issues serve as an indicator of the current status of the payment/performance risk and represent the likelihood or risk of default for the credit derivative. The implied credit spread of a particular referenced entity reflects the cost of buying/selling protection and may include upfront payments required to be made to enter into the agreement. Wider credit spreads represent a deterioration of the referenced entity’s credit soundness and a greater likelihood or risk of default or other credit event occurring as defined under the terms of the applicable agreement.
(4)The prices and resulting values for credit default swap agreements on credit indices serve as an indicator of the current status of the payment/performance risk and represent the likelihood or risk of default for the credit derivative. Increasing market values, in absolute terms when compared to the notional amount of the swap, represent a deterioration of the referenced entity’s credit soundness and a greater likelihood or risk of default or other credit event occurring as defined under the terms of the agreement.
(5)The maximum potential amount the Fund could be required to pay as a seller of credit protection if a credit event occurs is limited to the total notional amount which is defined under the terms of each swap agreement.
(6)If the Fund is a seller of protection, the Fund receives the fixed rate.
See accompanying Notes to Financial Statements.
Curian/PineBridge Merger Arbitrage Fund
| | Shares/Par † | | Value | |
COMMON STOCKS - 62.5% | | | | | |
| | | | | |
CONSUMER DISCRETIONARY - 8.0% | | | | | |
Brookfield Residential Properties Inc. (a) | | 16 | | $ | 389 | |
Time Warner Cable Inc. | | 30 | | 4,577 | |
TRW Automotive Holdings Corp. (a) | | 24 | | 2,437 | |
| | | | 7,403 | |
ENERGY - 3.3% | | | | | |
Baker Hughes Inc. | | 10 | | 549 | |
Dresser-Rand Group Inc. (a) | | 30 | | 2,438 | |
| | | | 2,987 | |
FINANCIALS - 18.2% | | | | | |
American Realty Capital Healthcare Trust Inc. | | 205 | | 2,440 | |
Hudson City Bancorp Inc. | | 719 | | 7,276 | |
Platinum Underwriters Holdings Ltd. | | 8 | | 609 | |
Protective Life Corp. | | 75 | | 5,199 | |
Susquehanna Bancshares Inc. | | 94 | | 1,268 | |
| | | | 16,792 | |
HEALTH CARE - 12.6% | | | | | |
CareFusion Corp. (a) | | 56 | | 3,323 | |
Covance Inc. (a) | | 25 | | 2,638 | |
Covidien Plc | | 33 | | 3,375 | |
Cubist Pharmaceuticals Inc. (a) | | 18 | | 1,842 | |
Volcano Corp. (a) | | 26 | | 463 | |
| | | | 11,641 | |
INFORMATION TECHNOLOGY - 6.3% | | | | | |
International Rectifier Corp. (a) | | 38 | | 1,512 | |
Riverbed Technology Inc. (a) | | 34 | | 700 | |
Sapient Corp. (a) | | 84 | | 2,083 | |
Trulia Inc. (a) | | 32 | | 1,473 | |
| | | | 5,768 | |
MATERIALS - 6.1% | | | | | |
Rockwood Holdings Inc. | | 53 | | 4,137 | |
Sigma-Aldrich Corp. | | 11 | | 1,494 | |
| | | | 5,631 | |
UTILITIES - 8.0% | | | | | |
Integrys Energy Group Inc. | | 46 | | 3,612 | |
Pepco Holdings Inc. | | 138 | | 3,720 | |
| | | | 7,332 | |
Total Common Stocks (cost $56,389) | | | | 57,554 | |
| | | | | |
SHORT TERM INVESTMENTS - 36.1% | | | | | |
| | | | | |
Investment Company - 17.7% | | | | | |
JNL Money Market Fund, 0.01% (b) (c) | | 16,289 | | 16,289 | |
| | | | | |
Treasury Securities - 18.4% | | | | | |
U.S. Treasury Bill | | | | | |
0.02%, 01/29/15 (d) | | $ | 5,000 | | 5,000 | |
0.04%, 03/05/15 (d) | | 9,000 | | 9,000 | |
0.04%, 04/16/15 | | 3,000 | | 3,000 | |
| | | | 17,000 | |
Total Short Term Investments (cost $33,288) | | | | 33,289 | |
Total Investments - 98.6% (cost $89,677) | | | | 90,843 | |
Total Securities Sold Short - (26.3%) (proceeds $23,398) | | | | (24,259 | ) |
Other Assets and Liabilities, Net - 27.7% | | | | 25,536 | |
Total Net Assets - 100.0% | | | | $ | 92,120 | |
| | | | | |
SECURITIES SOLD SHORT - 26.3% | | | | | |
| | | | | |
COMMON STOCKS - 26.3% | | | | | |
| | | | | |
CONSUMER DISCRETIONARY - 5.5% | | | | | |
Comcast Corp. - Class A | | 87 | | $ | 5,020 | |
| | | | | |
ENERGY - 0.5% | | | | | |
Halliburton Co. | | 11 | | 432 | |
| | | | | |
FINANCIALS - 11.8% | | | | | |
BB&T Corp. | | 24 | | 929 | |
M&T Bank Corp. | | 48 | | 5,995 | |
RenaissanceRe Holdings Ltd. | | 2 | | 239 | |
Ventas Inc. | | 31 | | 2,233 | |
Zillow Inc. - Class A | | 14 | | 1,504 | |
| | | | 10,900 | |
HEALTH CARE - 3.9% | | | | | |
Becton Dickinson & Co. | | 4 | | 605 | |
Laboratory Corp. of America Holdings | | 7 | | 736 | |
Medtronic Inc. | | 32 | | 2,278 | |
| | | | 3,619 | |
MATERIALS - 1.6% | | | | | |
Albemarle Corp. | | 25 | | 1,516 | |
| | | | | |
UTILITIES - 3.0% | | | | | |
Wisconsin Energy Corp. | | 53 | | 2,772 | |
Total Securities Sold Short - 26.3%
(proceeds $23,398) | | | | $ | 24,259 | |
| | | | | | | |
(a) | Non-income producing security. |
(b) | Investment in affiliate. |
(c) | Yield changes daily to reflect current market conditions. Rate was the quoted yield as of December 31, 2014. |
(d) | All or a portion of the security is pledged or segregated as collateral. See the Notes to Financial Statements. |
Curian/Schroder Emerging Europe Fund
| | Shares/Par † | | Value | |
COMMON STOCKS - 94.0% | | | | | |
| | | | | |
CZECH REPUBLIC - 2.2% | | | | | |
CEZ A/S | | 7 | | $ | 182 | |
Komercni Banka A/S | | 1 | | 112 | |
| | | | 294 | |
GEORGIA - 1.0% | | | | | |
Bank of Georgia Holdings Plc | | 2 | | 70 | |
TBC Bank JSC - GDR (a) | | 6 | | 68 | |
| | | | 138 | |
GREECE - 6.7% | | | | | |
Alpha Bank AE (a) | | 216 | | 121 | |
Hellenic Telecommunications Organization SA (a) | | 33 | | 364 | |
JUMBO SA | | 18 | | 186 | |
National Bank of Greece SA (a) | | 122 | | 214 | |
| | | | 885 | |
HUNGARY - 1.9% | | | | | |
OTP Bank Plc | | 13 | | 186 | |
Richter Gedeon Nyrt | | 5 | | 72 | |
| | | | 258 | |
POLAND - 16.8% | | | | | |
Bank Pekao SA | | 4 | | 210 | |
Bank Zachodni WBK SA | | 3 | | 315 | |
CCC SA | | 3 | | 123 | |
| | | | | | |
See accompanying Notes to Financial Statements.
| | Shares/Par † | | Value | |
Cyfrowy Polsat SA | | 21 | | 135 | |
Energa SA | | 23 | | 151 | |
KRUK SA (a) | | 3 | | 95 | |
Polskie Gornictwo Naftowe i Gazownictwo SA | | 29 | | 37 | |
Powszechna Kasa Oszczednosci Bank Polski SA | | 50 | | 507 | |
Powszechny Zaklad Ubezpieczen SA | | 4 | | 529 | |
Telekomunikacja Polska SA | | 25 | | 58 | |
Work Service SA (a) | | 15 | | 78 | |
| | | | 2,238 | |
ROMANIA - 0.6% | | | | | |
Societatea Nationala de Gaze Naturale ROMGAZ SA | | 8 | | 75 | |
| | | | | |
RUSSIAN FEDERATION - 36.8% | | | | | |
Gazprom Neft OAO - ADR | | 4 | | 49 | |
Gazprom OAO - ADR | | 106 | | 490 | |
Lukoil OAO - ADR | | 31 | | 1,229 | |
Luxoft Holding Inc. - Class A (a) | | 8 | | 322 | |
Magnit PJSC | | 1 | | 212 | |
Magnit PJSC - GDR | | 6 | | 271 | |
Mail.ru Group Ltd. - GDR (a) | | 4 | | 60 | |
MMC Norilsk Nickel OJSC - ADR | | 49 | | 703 | |
Mobile Telesystems OJSC - ADR | | 28 | | 201 | |
Moscow Exchange MICEX-RTS OAO | | 113 | | 109 | |
Sberbank of Russia (a) | | 27 | | 24 | |
Sberbank of Russia - ADR | | 45 | | 183 | |
Severstal OAO - GDR | | 9 | | 83 | |
Surgutneftegas OAO - ADR | | 84 | | 433 | |
Tatneft OAO - GDR | | 19 | | 466 | |
X5 Retail Group NV - GDR (a) | | 4 | | 52 | |
| | | | 4,887 | |
TURKEY - 26.6% | | | | | |
Akbank TAS | | 142 | | 526 | |
Aselsan Elektronik Sanayi Ve Ticaret A/S | | 34 | | 173 | |
AvivaSA Emeklilik ve Hayat A/S (a) | | 3 | | 56 | |
Coca-Cola Icecek A/S | | 5 | | 100 | |
Ford Otomotiv Sanayi A/S | | 12 | | 167 | |
Haci Omer Sabanci Holding A/S | | 131 | | 569 | |
KOC Holding A/S | | 46 | | 245 | |
Pegasus Hava Tasimaciligi A/S (a) | | 8 | | 114 | |
Tofas Turk Otomobil Fabrikasi A/S | | 23 | | 153 | |
Tupras Turkiye Petrol Rafinerileri A/S | | 12 | | 282 | |
Turkcell Iletisim Hizmetleri A/S (a) | | 95 | | 582 | |
Turkiye Is Bankasi - Class C | | 116 | | 334 | |
Turkiye Vakiflar Bankasi Tao | | 112 | | 233 | |
| | | | 3,534 | |
UNITED ARAB EMIRATES - 1.4% | | | | | |
Emaar Properties PJSC | | 95 | | 183 | |
Total Common Stocks (cost $15,425) | | | | 12,492 | |
| | | | | |
PREFERRED STOCKS - 1.9% | | | | | |
| | | | | |
RUSSIAN FEDERATION - 1.9% | | | | | |
Sberbank of Russia | | 44 | | 27 | |
Surgutneftegas OAO | | 487 | | 232 | |
Total Preferred Stocks (cost $455) | | | | 259 | |
| | | | | |
SHORT TERM INVESTMENTS - 2.8% | | | | | |
| | | | | |
Investment Company - 2.8% | | | | | |
JNL Money Market Fund, 0.01% (b) (c) | | 374 | | 374 | |
Total Short Term Investments (cost $374) | | | | 374 | |
Total Investments - 98.7% (cost $16,254) | | | | 13,125 | |
Other Assets and Liabilities, Net - 1.3% | | | | 170 | |
Total Net Assets - 100.0% | | | | $ | 13,295 | |
| | | | | | |
(a) | Non-income producing security. |
(b) | Investment in affiliate. |
(c) | Yield changes daily to reflect current market conditions. Rate was the quoted yield as of December 31, 2014. |
Curian/T. Rowe Price Capital Appreciation Fund *
| | Shares/Par † | | Value | |
COMMON STOCKS - 60.3% | | | | | |
| | | | | |
CONSUMER DISCRETIONARY - 7.1% | | | | | |
AutoZone Inc. (a) | | 5 | | $ | 2,848 | |
Delphi Automotive Plc | | 15 | | 1,113 | |
Johnson Controls Inc. | | 24 | | 1,141 | |
Liberty Global Plc - Class A (a) | | 5 | | 231 | |
Liberty Global Plc - Class��C (a) | | 21 | | 1,005 | |
Lowe’s Cos. Inc. | | 14 | | 943 | |
Other Securities | | | | 772 | |
| | | | 8,053 | |
CONSUMER STAPLES - 2.9% | | | | | |
PepsiCo Inc. | | 9 | | 823 | |
Philip Morris International Inc. | | 10 | | 823 | |
Other Securities | | | | 1,672 | |
| | | | 3,318 | |
ENERGY - 2.7% | | | | | |
Canadian Natural Resources Ltd. | | 57 | | 1,760 | |
Range Resources Corp. | | 6 | | 308 | |
Other Securities | | | | 932 | |
| | | | 3,000 | |
FINANCIALS - 10.3% | | | | | |
Bank of New York Mellon Corp. | | 21 | | 840 | |
Crown Castle International Corp. | | 12 | | 960 | |
JPMorgan Chase & Co. | | 16 | | 983 | |
Marsh & McLennan Cos. Inc. | | 54 | | 3,102 | |
State Street Corp. | | 28 | | 2,198 | |
TD Ameritrade Holding Corp. | | 30 | | 1,059 | |
UBS Group AG | | 81 | | 1,385 | |
Other Securities | | | | 1,138 | |
| | | | 11,665 | |
HEALTH CARE - 15.0% | | | | | |
Abbott Laboratories | | 26 | | 1,157 | |
Actavis plc (a) | | 7 | | 1,725 | |
Allergan Inc. | | 9 | | 1,828 | |
Becton Dickinson & Co. | | 11 | | 1,489 | |
CareFusion Corp. (a) | | 14 | | 819 | |
CIGNA Corp. | | 10 | | 988 | |
DaVita HealthCare Partners Inc. (a) | | 5 | | 348 | |
Eli Lilly & Co. | | 29 | | 1,994 | |
Pfizer Inc. | | 33 | | 1,015 | |
Thermo Fisher Scientific Inc. | | 24 | | 3,032 | |
UnitedHealth Group Inc. | | 9 | | 950 | |
Zoetis Inc. - Class A | | 26 | | 1,102 | |
Other Securities | | | | 492 | |
| | | | 16,939 | |
| | | | | | |
See accompanying Notes to Financial Statements.
| | Shares/Par † | | Value | |
INDUSTRIALS - 11.2% | | | | | |
AMETEK Inc. | | 23 | | 1,189 | |
Boeing Co. | | 6 | | 832 | |
Danaher Corp. | | 59 | | 5,074 | |
Pentair Plc (b) | | 27 | | 1,820 | |
Roper Industries Inc. | | 6 | | 1,001 | |
Tyco International Plc | | 28 | | 1,215 | |
Other Securities | | | | 1,471 | |
| | | | 12,602 | |
INFORMATION TECHNOLOGY - 7.7% | | | | | |
Fidelity National Information Services Inc. | | 21 | | 1,275 | |
Fiserv Inc. (a) (b) | | 39 | | 2,789 | |
Google Inc. - Class A (a) | | 1 | | 371 | |
Google Inc. - Class C (a) | | 1 | | 684 | |
Texas Instruments Inc. | | 15 | | 802 | |
Visa Inc. - Class A | | 6 | | 1,678 | |
Other Securities | | | | 1,156 | |
| | | | 8,755 | |
MATERIALS - 0.6% | | | | | |
Cytec Industries Inc. | | 15 | | 697 | |
| | | | | |
TELECOMMUNICATION SERVICES - 0.3% | | | | | |
Other Securities | | | | 299 | |
| | | | | |
UTILITIES - 2.5% | | | | | |
PG&E Corp. | | 39 | | 2,050 | |
Other Securities | | | | 757 | |
| | | | 2,807 | |
Total Common Stocks (cost $62,736) | | | | 68,135 | |
| | | | | |
PREFERRED STOCKS - 0.3% | | | | | |
| | | | | |
ENERGY - 0.0% | | | | | |
Other Securities | | | | 2 | |
| | | | | |
FINANCIALS - 0.1% | | | | | |
State Street Corp., 6.00%, (callable at 25 beginning 12/15/19) (d) | | 3 | | 76 | |
| | | | | |
TELECOMMUNICATION SERVICES - 0.2% | | | | | |
Other Securities | | | | 290 | |
Total Preferred Stocks (cost $351) | | | | 368 | |
| | | | | |
TRUST PREFERREDS - 0.1% | | | | | |
| | | | | |
UTILITIES - 0.1% | | | | | |
Other Securities | | | | 131 | |
Total Trust Preferreds (cost $123) | | | | 131 | |
| | | | | |
INVESTMENT COMPANIES - 0.9% | | | | | |
T. Rowe Price Institutional Floating Rate Fund (e) | | 101 | | 1,017 | |
Total Investment Companies (cost $1,041) | | | | 1,017 | |
| | | | | |
NON-U.S. GOVERNMENT AGENCY ASSET-BACKED SECURITIES - 0.1% | | | | | |
Other Securities | | | | 119 | |
Total Non-U.S. Government Agency Asset-Backed Securities (cost $119) | | | | 119 | |
| | | | | |
CORPORATE BONDS AND NOTES - 23.6% | | | | | |
| | | | | |
CONSUMER DISCRETIONARY - 4.0% | | | | | |
Univision Communications Inc. | | | | | |
6.88%, 05/15/19 (g) | | 625 | | 651 | |
7.88%, 11/01/20 (g) | | 425 | | 453 | |
6.75%, 09/15/22 (g) | | 263 | | 281 | |
5.13%, 05/15/23 (g) | | 50 | | 50 | |
UPC Financing Partnership Term Loan AH, 3.25%, 06/30/21 (f) | | 1,000 | | 974 | |
Other Securities | | | | 2,157 | |
| | | | 4,566 | |
CONSUMER STAPLES - 1.0% | | | | | |
Other Securities | | | | 1,099 | |
| | | | | |
ENERGY - 5.6% | | | | | |
Canadian Natural Resources Ltd. | | | | | |
1.75%, 01/15/18 | | 50 | | 50 | |
3.90%, 02/01/25 | | 105 | | 103 | |
Concho Resources Inc. | | | | | |
7.00%, 01/15/21 | | 375 | | 393 | |
6.50%, 01/15/22 | | 100 | | 104 | |
5.50%, 10/01/22 | | 25 | | 25 | |
5.50%, 04/01/23 | | 400 | | 402 | |
MarkWest Energy Partners LP | | | | | |
6.75%, 11/01/20 | | 250 | | 260 | |
6.50%, 08/15/21 | | 175 | | 180 | |
6.25%, 06/15/22 | | 225 | | 233 | |
5.50%, 02/15/23 | | 300 | | 304 | |
4.50%, 07/15/23 | | 400 | | 385 | |
4.88%, 12/01/24 | | 150 | | 147 | |
Range Resources Corp. | | | | | |
6.75%, 08/01/20 | | 300 | | 312 | |
5.75%, 06/01/21 | | 675 | | 697 | |
5.00%, 08/15/22 | | 600 | | 600 | |
5.00%, 03/15/23 | | 675 | | 675 | |
Other Securities | | | | 1,520 | |
| | | | 6,390 | |
FINANCIALS - 2.3% | | | | | |
Crown Castle International Corp., 4.88%, 04/15/22 | | 100 | | 101 | |
Ford Motor Credit Co. LLC | | | | | |
6.63%, 08/15/17 | | 200 | | 223 | |
0.81%, 12/06/17 (f) | | 200 | | 199 | |
5.00%, 05/15/18 | | 200 | | 217 | |
2.38%, 03/12/19 | | 200 | | 199 | |
2.60%, 11/04/19 | | 400 | | 398 | |
KFW, 2.50%, 11/20/24 | | 652 | | 661 | |
Other Securities | | | | 565 | |
| | | | 2,563 | |
HEALTH CARE - 2.8% | | | | | |
Becton Dickinson and Co. | | | | | |
1.80%, 12/15/17 | | 90 | | 90 | |
2.68%, 12/15/19 | | 80 | | 81 | |
3.73%, 12/15/24 | | 90 | | 93 | |
4.69%, 12/15/44 | | 20 | | 22 | |
DaVita HealthCare Partners Inc. | | | | | |
5.75%, 08/15/22 | | 325 | | 344 | |
5.13%, 07/15/24 | | 700 | | 714 | |
DaVita HealthCare Partners Inc. Term Loan B, 3.50%, 06/20/21 (f) | | 274 | | 271 | |
DaVita Inc., 6.63%, 11/01/20 | | 125 | | 131 | |
UnitedHealth Group Inc., 1.40%, 12/15/17 | | 65 | | 65 | |
Other Securities | | | | 1,346 | |
| | | | 3,157 | |
INDUSTRIALS - 0.3% | | | | | |
Other Securities | | | | 304 | |
| | | | | |
INFORMATION TECHNOLOGY - 0.8% | | | | | |
Other Securities | | | | 912 | |
See accompanying Notes to Financial Statements.
| | Shares/Par † | | Value | |
MATERIALS - 0.2% | | | | | |
Cytec Industries Inc., 3.95%, 05/01/25 | | 155 | | 157 | |
Other Securities | | | | 60 | |
| | | | 217 | |
TELECOMMUNICATION SERVICES - 6.0% | | | | | |
Crown Castle International Corp., 5.25%, 01/15/23 | | 100 | | 102 | |
Crown Castle International Corp. New Term Loan B, 3.00%, 01/31/21 (f) | | 370 | | 363 | |
Intelsat Jackson Holdings SA | | | | | |
7.25%, 04/01/19 | | 275 | | 287 | |
7.25%, 10/15/20 | | 760 | | 803 | |
7.50%, 04/01/21 | | 325 | | 348 | |
5.50%, 08/01/23 | | 120 | | 119 | |
Intelsat Jackson Holdings SA Term Loan B-2, 3.75%, 06/30/19 (f) | | 2,075 | | 2,041 | |
UPCB Finance III Ltd., 6.63%, 07/01/20 (g) | | 900 | | 945 | |
UPCB Finance V Ltd., 7.25%, 11/15/21 (g) | | 450 | | 492 | |
UPCB Finance VI Ltd., 6.88%, 01/15/22 (g) | | 600 | | 653 | |
Other Securities | | | | 619 | |
| | | | 6,772 | |
UTILITIES - 0.6% | | | | | |
Other Securities | | | | 693 | |
Total Corporate Bonds and Notes (cost $26,731) | | | | 26,673 | |
| | | | | |
GOVERNMENT AND AGENCY OBLIGATIONS - 0.1% | | | | | |
| | | | | |
GOVERNMENT SECURITIES - 0.1% | | | | | |
Sovereign - 0.1% | | | | | |
Kreditanstalt fuer Wiederaufbau, 0.50%, 04/19/16 | | 90 | | 90 | |
Total Government and Agency Obligations (cost $90) | | | | 90 | |
| | | | | |
SHORT TERM INVESTMENTS - 17.4% | | | | | |
| | | | | |
Investment Companies - 16.5% | | | | | |
JNL Money Market Fund, 0.01% (e) (h) | | 2,056 | | 2,056 | |
T. Rowe Price Reserves Investment Fund, 0.07% (e) (h) | | 16,536 | | 16,536 | |
| | | | 18,592 | |
Securities Lending Collateral - 0.9% | | | | | |
Repurchase Agreement with MLP, 0.06% (Collateralized by $333 U.S. Treasury Bond, 6.25%, due 05/15/30, value $499 and $550 U.S. Treasury Note, 0.13%, due 07/15/24, value $528) acquired on 12/31/14, due 01/02/15 at $1,007 | | $ | 1,007 | | 1,007 | |
Total Short Term Investments (cost $19,599) | | | | 19,599 | |
| | | | | |
Total Investments - 102.8% (cost $110,790) | | | | 116,132 | |
Other Assets and Liabilities, Net - (2.8%) | | | | (3,202 | ) |
Total Net Assets - 100.0% | | | | $ | 112,930 | |
| | | | | | | |
(a) | Non-income producing security. |
(b) | All or portion of the security was on loan. |
(c) | Convertible security. |
(d) | Perpetual security. |
(e) | Investment in affiliate. |
(f) | Variable rate security. Rate stated was in effect as of December 31, 2014. |
(g) | The Sub-Adviser has deemed this security which is exempt from registration under the 1933 Act to be liquid based on procedures approved by the Trust’s Board of Trustees. As of December 31, 2014, the aggregate value of these liquid securities was $6,308 which represented 5.6% of net assets. |
(h) | Yield changes daily to reflect current market conditions. Rate was the quoted yield as of December 31, 2014. |
See accompanying Notes to Financial Statements.
Curian Variable Series Trust Sub-Advised Funds
Schedules of Investments (in thousands, except contracts)
December 31, 2014
Schedule of Written Call Options
| | Expiration
Date | | Exercise
Price | | Contracts | | Value | |
Options on Securities | | | | | | | | | |
Allergan, Inc. , CGM | | 01/17/2015 | | 170.00 | | 10 | | $ | (42 | ) |
American Tower Corp., CGM | | 01/15/2016 | | 115.00 | | 10 | | (2 | ) |
American Tower Corp., CGM | | 01/15/2016 | | 110.00 | | 4 | | (1 | ) |
American Tower Corp., CGM | | 01/15/2016 | | 105.00 | | 5 | | (3 | ) |
Apache Corp. | | 01/17/2015 | | 95.00 | | 7 | | — | |
Apache Corp., MSC | | 01/17/2015 | | 100.00 | | 3 | | — | |
Apache Corp., MSC | | 01/17/2015 | | 105.00 | | 2 | | — | |
Apache Corp., MSC | | 01/17/2015 | | 97.50 | | 2 | | — | |
Apache Corp., MSC | | 01/17/2015 | | 90.00 | | 4 | | — | |
Apache Corp., MSC | | 01/17/2015 | | 92.50 | | 6 | | — | |
Boeing Co. | | 01/17/2015 | | 135.00 | | 2 | | — | |
Boeing Co. | | 01/17/2015 | | 140.00 | | 2 | | — | |
Boeing Co., CGM | | 01/17/2015 | | 145.00 | | 4 | | — | |
Boeing Co., CGM | | 01/17/2015 | | 150.00 | | 3 | | — | |
Boeing Co., CGM | | 01/17/2015 | | 155.00 | | 4 | | — | |
Boeing Co., CGM | | 01/15/2016 | | 140.00 | | 8 | | (5 | ) |
Cisco Systems Inc., CGM | | 01/15/2016 | | 25.00 | | 66 | | (24 | ) |
CVS Caremark Corp., MSC | | 01/17/2015 | | 77.50 | | 2 | | (4 | ) |
CVS Caremark Corp., MSC | | 01/17/2015 | | 80.00 | | 2 | | (3 | ) |
CVS Caremark Corp., MSC | | 01/15/2016 | | 90.00 | | 14 | | (15 | ) |
CVS Caremark Corp., MSC | | 01/15/2016 | | 95.00 | | 14 | | (11 | ) |
Danaher Corp., JPM | | 01/17/2015 | | 80.00 | | 2 | | (1 | ) |
Danaher Corp., JPM | | 01/17/2015 | | 85.00 | | 2 | | (1 | ) |
Danaher Corp., JPM | | 01/17/2015 | | 90.00 | | 5 | | — | |
Google Inc. | | 01/17/2015 | | 280.00 | | 1 | | — | |
JPMorgan Chase & Co. | | 01/17/2015 | | 60.00 | | 2 | | (1 | ) |
JPMorgan Chase & Co. | | 01/17/2015 | | 65.00 | | 2 | | — | |
JPMorgan Chase & Co. | | 01/15/2016 | | 70.00 | | 54 | | (10 | ) |
Lowe’s Companies Inc., JPM | | 01/17/2015 | | 55.00 | | 10 | | (14 | ) |
Lowe’s Companies Inc., JPM | | 01/17/2015 | | 52.50 | | 1 | | (2 | ) |
Lowe’s Companies Inc., MSC | | 01/15/2016 | | 60.00 | | 35 | | (41 | ) |
Lowe’s Companies Inc., MSC | | 01/15/2016 | | 75.00 | | 16 | | (5 | ) |
Mondelez International Inc., CGM | | 01/15/2016 | | 45.00 | | 26 | | (1 | ) |
Occidental Petroleum Corp., CGM | | 01/15/2016 | | 97.50 | | 31 | | (3 | ) |
Occidental Petroleum Corp., CGM | | 01/15/2016 | | 95.00 | | 31 | | (8 | ) |
PepsiCo Inc., MSC | | 01/15/2016 | | 100.00 | | 18 | | (6 | ) |
PepsiCo Inc., MSC | | 01/15/2016 | | 105.00 | | 12 | | (2 | ) |
PepsiCo Inc., MSC | | 01/15/2016 | | 110.00 | | 22 | | (2 | ) |
Pfizer Inc., CGM | | 01/17/2015 | | 32.00 | | 10 | | — | |
Pfizer Inc., CGM | | 01/17/2015 | | 35.00 | | 9 | | — | |
Pfizer Inc., CGM | | 01/15/2016 | | 30.00 | | 93 | | (24 | ) |
Philip Morris International Inc. | | 01/17/2015 | | 95.00 | | 2 | | — | |
State Street Corp., MSC | | 01/15/2016 | | 85.00 | | 13 | | (5 | ) |
TD Ameritrade Holding Corporation, CGM | | 01/17/2015 | | 29.50 | | 146 | | (92 | ) |
TD Ameritrade Holding Corporation, CGM | | 01/17/2015 | | 33.00 | | 64 | | (18 | ) |
TD Ameritrade Holding Corporation, CGM | | 02/20/2015 | | 30.00 | | 86 | | (48 | ) |
Texas Instruments Inc. | | 01/17/2015 | | 50.00 | | 6 | | (2 | ) |
Texas Instruments Inc., CGM | | 01/17/2015 | | 45.00 | | 44 | | (37 | ) |
Texas Instruments Inc., CGM | | 01/17/2015 | | 50.00 | | 21 | | (9 | ) |
Thermo Fisher Scientific Inc., CGM | | 01/15/2016 | | 150.00 | | 4 | | (2 | ) |
United Technologies Corp., CGM | | 01/17/2015 | | 120.00 | | 10 | | — | |
United Technologies Corp., CGM | | 01/15/2016 | | 120.00 | | 18 | | (11 | ) |
UnitedHealth Group Inc., CGM | | 01/15/2016 | | 105.00 | | 13 | | (10 | ) |
UnitedHealth Group Inc., CGM | | 01/15/2016 | | 100.00 | | 13 | | (12 | ) |
Visa Inc. | | 01/15/2016 | | 280.00 | | 6 | | (9 | ) |
Visa Inc. | | 01/15/2016 | | 300.00 | | 6 | | (5 | ) |
Wal-Mart Stores Inc., CGM | | 01/15/2016 | | 82.50 | | 16 | | (12 | ) |
Wal-Mart Stores Inc., CGM | | 01/15/2016 | | 80.00 | | 14 | | (13 | ) |
| | | | | | 1,038 | | $ | (516 | ) |
See accompanying Notes to Financial Statements.
Schedule of Written Call Options
| | Contracts | | Premiums | |
Options outstanding at December 31, 2013 | | 148 | | $ | 51 | |
Options written during the year | | 1,457 | | 319 | |
Options closed during the year | | (453 | ) | (92 | ) |
Options exercised during the year | | (55 | ) | (19 | ) |
Options expired during the year | | (59 | ) | (9 | ) |
Options outstanding at December 31, 2014 | | 1,038 | | $ | 250 | |
Schedule of Open Futures Contracts
| | Expiration | | Contracts
Long | | Unrealized
Appreciation | |
Euro STOXX 50 Future | | March 2015 | | 29 | | $ | 37 | |
STOXX Europe 600 Index Future | | March 2015 | | 26 | | 12 | |
| | | | | | $ | 49 | |
Schedule of Open Forward Foreign Currency Contracts
Purchased/
Sold | | Settlement
Date | | Counter-
Party | | Notional
Amount | | Value | | Unrealized
Gain | |
USD/EUR | | 03/25/2015 | | BOA | | EUR | (163 | ) | $ | (197 | ) | $ | 1 | |
| | | | | | | | $ | (197 | ) | $ | 1 | |
| | | | | | | | | | | | | | |
See accompanying Notes to Financial Statements.
Curian Variable Series Trust Sub-Advised Funds
Schedules of Investments (in thousands)
December 31, 2014
Curian/The Boston Company Equity Income Fund
| | Shares/Par † | | Value | |
COMMON STOCKS - 98.7% | | | | | |
| | | | | |
CONSUMER DISCRETIONARY - 8.8% | | | | | |
Carnival Plc | | 21 | | $ | 970 | |
General Motors Co. | | 10 | | 347 | |
Kohl’s Corp. | | 7 | | 416 | |
Macy’s Inc. | | 4 | | 250 | |
Omnicom Group Inc. | | 12 | | 944 | |
Regal Entertainment Group - Class A (a) | | 14 | | 307 | |
Time Warner Inc. (a) | | 7 | | 573 | |
Twenty-First Century Fox Inc. - Class A | | 21 | | 793 | |
Viacom Inc. - Class B | | 5 | | 339 | |
Walt Disney Co. | | 5 | | 462 | |
| | | | 5,401 | |
CONSUMER STAPLES - 8.1% | | | | | |
Archer-Daniels-Midland Co. | | 10 | | 542 | |
Coca-Cola Enterprises Inc. | | 18 | | 802 | |
ConAgra Foods Inc. | | 10 | | 365 | |
CVS Health Corp. | | 12 | | 1,202 | |
Molson Coors Brewing Co. - Class B | | 8 | | 631 | |
PepsiCo Inc. | | 11 | | 1,058 | |
Philip Morris International Inc. | | 5 | | 404 | |
| | | | 5,004 | |
ENERGY - 11.2% | | | | | |
Anadarko Petroleum Corp. | | 10 | | 852 | |
Marathon Oil Corp. | | 19 | | 533 | |
Occidental Petroleum Corp. | | 38 | | 3,044 | |
Phillips 66 | | 16 | | 1,143 | |
Schlumberger Ltd. | | 15 | | 1,291 | |
| | | | 6,863 | |
FINANCIALS - 28.8% | | | | | |
Allstate Corp. | | 10 | | 736 | |
American International Group Inc. | | 10 | | 543 | |
Ameriprise Financial Inc. | | 5 | | 641 | |
Bank of America Corp. | | 88 | | 1,576 | |
Berkshire Hathaway Inc. - Class B (b) | | 13 | | 1,883 | |
Citigroup Inc. | | 28 | | 1,525 | |
Goldman Sachs Group Inc. | | 6 | | 1,225 | |
Hartford Financial Services Group Inc. | | 13 | | 535 | |
Invesco Ltd. | | 14 | | 555 | |
JPMorgan Chase & Co. | | 38 | | 2,404 | |
MetLife Inc. | | 16 | | 864 | |
Morgan Stanley | | 25 | | 970 | |
PNC Financial Services Group Inc. | | 8 | | 735 | |
Regions Financial Corp. | | 50 | | 523 | |
TD Ameritrade Holding Corp. | | 14 | | 494 | |
U.S. Bancorp | | 7 | | 293 | |
Voya Financial Inc. | | 20 | | 847 | |
Wells Fargo & Co. | | 25 | | 1,363 | |
| | | | 17,712 | |
HEALTH CARE - 14.5% | | | | | |
AbbVie Inc. | | 12 | | 791 | |
Amgen Inc. | | 4 | | 611 | |
Cardinal Health Inc. | | 17 | | 1,402 | |
Eli Lilly & Co. | | 5 | | 378 | |
McKesson Corp. | | 3 | | 526 | |
Medtronic Inc. | | 8 | | 559 | |
Merck & Co. Inc. | | 11 | | 615 | |
Omnicare Inc. | | 13 | | 915 | |
Pfizer Inc. | | 44 | | 1,374 | |
UnitedHealth Group Inc. | | 17 | | 1,764 | |
| | | | 8,935 | |
INDUSTRIALS - 7.4% | | | | | |
Cummins Inc. | | 3 | | 449 | |
Delta Air Lines Inc. | | 3 | | 172 | |
Honeywell International Inc. | | 13 | | 1,304 | |
Northrop Grumman Systems Corp. | | 2 | | 301 | |
Owens Corning Inc. (a) | | 15 | | 531 | |
PACCAR Inc. | | 4 | | 301 | |
Raytheon Co. | | 5 | | 576 | |
United Technologies Corp. | | 8 | | 900 | |
| | | | 4,534 | |
INFORMATION TECHNOLOGY - 13.2% | | | | | |
Accenture Plc - Class A | | 7 | | 669 | |
Apple Inc. | | 10 | | 1,158 | |
Applied Materials Inc. | | 47 | | 1,182 | |
Cisco Systems Inc. | | 76 | | 2,100 | |
EMC Corp. | | 34 | | 997 | |
Hewlett-Packard Co. | | 9 | | 378 | |
Microchip Technology Inc. (a) | | 16 | | 704 | |
Texas Instruments Inc. | | 17 | | 929 | |
| | | | 8,117 | |
MATERIALS - 4.2% | | | | | |
Dow Chemical Co. | | 8 | | 343 | |
International Paper Co. | | 7 | | 370 | |
Martin Marietta Materials Inc. (a) | | 11 | | 1,236 | |
Vulcan Materials Co. | | 9 | | 620 | |
| | | | 2,569 | |
TELECOMMUNICATION SERVICES - 1.2% | | | | | |
Windstream Holdings Inc. (a) | | 91 | | 749 | |
| | | | | |
UTILITIES - 1.3% | | | | | |
Exelon Corp. | | 8 | | 309 | |
NRG Yield Inc. - Class A | | 10 | | 488 | |
| | | | 797 | |
Total Common Stocks (cost $54,899) | | | | 60,681 | |
| | | | | |
SHORT TERM INVESTMENTS - 6.3% | | | | | |
| | | | | |
Investment Company - 0.9% | | | | | |
JNL Money Market Fund, 0.01% (c) (d) | | 569 | | 569 | |
| | | | | |
Securities Lending Collateral - 5.4% | | | | | |
Fidelity Institutional Money Market Portfolio, 0.09% (d) | | 100 | | 100 | |
Repurchase Agreement with CSI, 0.07% (Collateralized by $2,030 U.S. Treasury Bond Strip, due 11/15/37-11/15/39, value $1,020) acquired on 12/31/14, due 01/02/15 at $1,000 | | $ | 1,000 | | 1,000 | |
Repurchase Agreement with MLP, 0.06% (Collateralized by $721 U.S. Treasury Bond, 6.25%, due 05/15/30, value $1,081 and $1,192 U.S. Treasury Note, 0.13%, due 07/15/24, value $1,145) acquired on 12/31/14, due 01/02/15 at $2,182 | | 2,182 | | 2,182 | |
| | | | 3,282 | |
Total Short Term Investments (cost $3,851) | | | | 3,851 | |
| | | | | |
Total Investments - 105.0% (cost $58,750) | | | | 64,532 | |
Other Assets and Liabilities, Net - (5.0%) | | | | (3,069 | ) |
Total Net Assets - 100.0% | | | | $ | 61,463 | |
| | | | | | | |
(a) | All or portion of the security was on loan. |
(b) | Non-income producing security. |
(c) | Investment in affiliate. |
(d) | Yield changes daily to reflect current market conditions. Rate was the quoted yield as of December 31, 2014. |
See accompanying Notes to Financial Statements.
Curian/UBS Global Long Short Fixed Income Opportunities Fund *
| | Shares/Par † | | Value | |
NON-U.S. GOVERNMENT AGENCY ASSET-BACKED SECURITIES - 13.4% | | | | | |
| | | | | |
UNITED STATES OF AMERICA - 13.4% | | | | | |
Galaxy CLO Ltd. | | | | | |
2.83%, 11/16/25 (a) (b) | | $ | 500 | | $ | 475 | |
3.23%, 10/15/26 (a) (b) | | 850 | | 825 | |
JPMorgan Chase Commercial Mortgage Securities Trust REMIC | | | | | |
2.66%, 10/15/19 (a) (b) | | 725 | | 725 | |
4.52%, 07/05/22 (a) (b) | | 500 | | 517 | |
Morgan Stanley Bank of America Merrill Lynch Trust REMIC | | | | | |
4.08%, 06/15/23 (b) | | 500 | | 507 | |
4.83%, 01/15/24 (b) | | 1,000 | | 1,075 | |
Northwoods Capital Corp., 3.39%, 09/15/25 (a) (b) | | 1,000 | | 965 | |
Northwoods Capital XIV Ltd., 3.58%, 11/12/25 (a) (b) | | 500 | | 488 | |
Octagon Investment Partners XIX Ltd., 3.08%, 04/15/26 (a) (b) | | 725 | | 696 | |
Octagon Investment Partners XVII Ltd., 3.03%, 10/25/25 (a) (b) | | 250 | | 241 | |
Octagon Investment Partners XVIII Ltd., 2.98%, 12/16/24 (a) (b) | | 750 | | 717 | |
Other Securities | | | | 15,913 | |
Total Non-U.S. Government Agency Asset-Backed Securities (cost $23,427) | | | | 23,144 | |
| | | | | |
CORPORATE BONDS AND NOTES - 67.3% | | | | | |
| | | | | |
AUSTRALIA - 1.8% | | | | | |
Crown Group Finance Ltd., 5.75%, 07/18/17, AUD | | 1,450 | | 1,242 | |
Other Securities | | | | 1,903 | |
| | | | 3,145 | |
BRAZIL - 4.2% | | | | | |
Caixa Economica Federal, 2.38%, 11/06/17 (a) | | 2,250 | | 2,124 | |
Petrobras Global Finance BV, 4.38%, 05/20/23 | | 200 | | 172 | |
Petrobras International Finance Co. | | | | | |
5.38%, 01/27/21 | | 1,550 | | 1,436 | |
6.75%, 01/27/41 | | 700 | | 637 | |
Other Securities | | | | 2,934 | |
| | | | 7,303 | |
CANADA - 2.7% | | | | | |
Barrick Gold Corp., 3.85%, 04/01/22 | | 1,600 | | 1,540 | |
NOVA Chemicals Corp., 5.25%, 08/01/23 (a) | | 1,830 | | 1,848 | |
Yamana Gold Inc., 4.95%, 07/15/24 | | 1,270 | | 1,240 | |
| | | | 4,628 | |
COLOMBIA - 0.5% | | | | | |
Other Securities | | | | 909 | |
| | | | | |
COSTA RICA - 0.7% | | | | | |
Banco Nacional de Costa Rica, 4.88%, 11/01/18 (a) | | 1,250 | | 1,237 | |
| | | | | |
CROATIA - 0.9% | | | | | |
Agrokor dd, 8.88%, 02/01/20 (a) | | 1,370 | | 1,478 | |
| | | | | |
FRANCE - 0.4% | | | | | |
Other Securities | | | | 763 | |
| | | | | |
GEORGIA - 0.2% | | | | | |
Other Securities | | | | 313 | |
| | | | | |
GERMANY - 2.8% | | | | | |
HeidelbergCement Finance Luxembourg SA, 8.50%, 10/31/19, EUR | | 1,250 | | 1,995 | |
Trionista HoldCo GmbH, 5.00%, 04/30/20 (a), EUR | | 1,015 | | 1,271 | |
Unitymedia KabelBW GmbH, 6.13%, 01/15/25 (a) | | 1,470 | | 1,518 | |
| | | | 4,784 | |
HONG KONG - 0.6% | | | | | |
Other Securities | | | | 976 | |
| | | | | |
HUNGARY - 0.6% | | | | | |
Other Securities | | | | 1,008 | |
| | | | | |
INDONESIA - 1.0% | | | | | |
Pertamina Persero PT | | | | | |
6.00%, 05/03/42 | | 950 | | 927 | |
6.45%, 05/30/44 (a) | | 700 | | 731 | |
| | | | 1,658 | |
IRELAND - 1.1% | | | | | |
XL Group Plc, 6.50%, (callable at 100 beginning 04/15/17) (c) | | 1,255 | | 1,199 | |
Other Securities | | | | 709 | |
| | | | 1,908 | |
ITALY - 0.1% | | | | | |
Other Securities | | | | 238 | |
| | | | | |
KAZAKHSTAN - 0.8% | | | | | |
Other Securities | | | | 1,374 | |
| | | | | |
MALAYSIA - 0.4% | | | | | |
Other Securities | | | | 659 | |
| | | | | |
MEXICO - 1.7% | | | | | |
Cemex SAB de CV | | | | | |
5.88%, 03/25/19 (a) | | 500 | | 508 | |
7.25%, 01/15/21 (a) | | 1,100 | | 1,152 | |
5.70%, 01/11/25 (a) | | 550 | | 534 | |
Other Securities | | | | 661 | |
| | | | 2,855 | |
MOROCCO - 0.2% | | | | | |
Other Securities | | | | 368 | |
| | | | | |
NIGERIA - 0.5% | | | | | |
Other Securities | | | | 845 | |
| | | | | |
NORWAY - 2.3% | | | | | |
Eksportfinans ASA | | | | | |
5.50%, 05/25/16 | | 2,700 | | 2,821 | |
5.50%, 06/26/17 | | 1,000 | | 1,066 | |
| | | | 3,887 | |
PORTUGAL - 1.6% | | | | | |
EDP Finance BV | | | | | |
4.75%, 09/26/16, EUR | | 1,200 | | 1,539 | |
4.90%, 10/01/19 (a) | | 1,200 | | 1,249 | |
| | | | 2,788 | |
RUSSIAN FEDERATION - 1.1% | | | | | |
Other Securities | | | | 1,893 | |
| | | | | |
SINGAPORE - 1.1% | | | | | |
Other Securities | | | | 1,912 | |
| | | | | |
SOUTH AFRICA - 0.2% | | | | | |
Other Securities | | | | 415 | |
| | | | | |
SPAIN - 1.4% | | | | | |
Santander US Debt SAU, 3.72%, 01/20/15 (a) | | 2,100 | | 2,103 | |
| | | | | | | |
See accompanying Notes to Financial Statements.
Curian Variable Series Trust Sub-Advised Funds
Schedules of Investments (in thousands, except contracts)
December 31, 2014
| | Shares/Par † | | Value | |
Other Securities | | | | 373 | |
| | | | 2,476 | |
SRI LANKA - 0.6% | | | | | |
Other Securities | | | | 1,057 | |
| | | | | |
SWITZERLAND - 0.3% | | | | | |
Other Securities | | | | 471 | |
| | | | | |
TURKEY - 1.0% | | | | | |
Other Securities | | | | 1,676 | |
| | | | | |
UNITED KINGDOM - 6.3% | | | | | |
HBOS Plc | | | | | |
4.88%, 03/20/15, EUR | | 200 | | 244 | |
6.75%, 05/21/18 (a) | | 1,700 | | 1,894 | |
Lloyds Bank Plc, 6.50%, 03/24/20, EUR | | 2,050 | | 3,056 | |
Royal Bank of Scotland Group Plc | | | | | |
6.10%, 06/10/23 | | 2,660 | | 2,885 | |
5.13%, 05/28/24 | | 700 | | 712 | |
Other Securities | | | | 2,168 | |
| | | | 10,959 | |
UNITED STATES OF AMERICA - 29.7% | | | | | |
ADT Corp., 3.50%, 07/15/22 | | 1,700 | | 1,449 | |
Allstate Corp., 5.75%, 08/15/53 (b) | | 1,170 | | 1,233 | |
Ally Financial Inc. | | | | | |
8.30%, 02/12/15 | | 100 | | 101 | |
4.63%, 06/26/15 | | 800 | | 806 | |
3.50%, 01/27/19 | | 1,150 | | 1,136 | |
ArcelorMittal, 6.00%, 03/01/21 (e) | | 2,100 | | 2,184 | |
Case New Holland Inc., 7.88%, 12/01/17 | | 2,300 | | 2,530 | |
Cemex Finance LLC, 6.00%, 04/01/24 (a) | | 750 | | 731 | |
CIT Group Inc., 5.00%, 08/15/22 | | 2,325 | | 2,389 | |
Citigroup Inc. | | | | | |
6.30% (callable at 100 beginning 05/15/24) (c) | | 1,400 | | 1,379 | |
0.76%, 05/31/17 (b), EUR | | 2,700 | | 3,234 | |
5.50%, 09/13/25 | | 400 | | 443 | |
DISH DBS Corp., 7.88%, 09/01/19 | | 2,230 | | 2,531 | |
El Paso LLC, 7.25%, 06/01/18 | | 1,500 | | 1,700 | |
Energy Transfer Partners LP | | | | | |
9.00%, 04/15/19 | | 461 | | 566 | |
6.05%, 06/01/41 | | 100 | | 109 | |
6.50%, 02/01/42 | | 500 | | 575 | |
General Motors Financial Co. Inc. | | | | | |
4.75%, 08/15/17 | | 2,000 | | 2,109 | |
3.00%, 09/25/17 | | 420 | | 425 | |
Intelsat Jackson Holdings SA, 7.50%, 04/01/21 | | 2,400 | | 2,568 | |
International Lease Finance Corp., 8.63%, 09/15/15 (f) | | 2,250 | | 2,346 | |
Kinder Morgan Inc. | | | | | |
5.63%, 11/15/23 (a) | | 800 | | 856 | |
5.30%, 12/01/34 | | 800 | | 812 | |
MetLife Inc., 6.40%, 12/15/36 (b) | | 2,035 | | 2,269 | |
Midstates Petroleum Co. Inc., 10.75%, 10/01/20 | | 2,300 | | 1,219 | |
Pacific Drilling SA, 5.38%, 06/01/20 (a) | | 2,300 | | 1,874 | |
PNC Preferred Funding Trust, 1.89%, (callable at 100 beginning 03/15/17) (a) (c) | | 1,800 | | 1,692 | |
Prudential Financial Inc. | | | | | |
5.87%, 09/15/42 (b) | | 420 | | 443 | |
5.20%, 03/15/44 (b) | | 1,670 | | 1,653 | |
Other Securities | | | | 10,105 | |
| | | | 51,467 | |
VENEZUELA - 0.5% | | | | | |
Other Securities | | | | 937 | |
Total Corporate Bonds and Notes (cost $120,358) | | | | 116,387 | |
| | | | | |
GOVERNMENT AND AGENCY OBLIGATIONS - 13.6% | | | | | |
| | | | | |
ARGENTINA - 0.5% | | | | | |
Other Securities | | | | 891 | |
| | | | | |
BELARUS - 1.0% | | | | | |
Republic of Belarus, 8.75%, 08/03/15 | | 1,950 | | 1,836 | |
| | | | | |
BRAZIL - 0.6% | | | | | |
Other Securities | | | | 986 | |
| | | | | |
CROATIA - 1.0% | | | | | |
Croatia Government International Bond, 6.25%, 04/27/17 | | 1,650 | | 1,750 | |
| | | | | |
ECUADOR - 0.2% | | | | | |
Other Securities | | | | 307 | |
| | | | | |
GABON - 0.3% | | | | | |
Other Securities | | | | 570 | |
| | | | | |
GHANA - 0.6% | | | | | |
Other Securities | | | | 1,019 | |
| | | | | |
GREECE - 0.9% | | | | | |
Hellenic Republic Government Bond, 2.00%, 02/24/31 (f), EUR | | 2,420 | | 1,523 | |
| | | | | |
KENYA - 0.3% | | | | | |
Other Securities | | | | 512 | |
| | | | | |
MEXICO - 0.3% | | | | | |
Other Securities | | | | 506 | |
| | | | | |
NIGERIA - 0.5% | | | | | |
Other Securities | | | | 841 | |
| | | | | |
PAKISTAN - 0.1% | | | | | |
Other Securities | | | | 101 | |
| | | | | |
RUSSIAN FEDERATION - 0.1% | | | | | |
Other Securities | | | | 249 | |
| | | | | |
UNITED STATES OF AMERICA - 6.4% | | | | | |
State of California | | | | | |
7.55%, 04/01/39 | | 200 | | 309 | |
7.30%, 10/01/39 | | 850 | | 1,252 | |
State of Illinois | | | | | |
5.67%, 03/01/18 | | 555 | | 608 | |
5.88%, 03/01/19 | | 780 | | 861 | |
4.95%, 06/01/23 | | 410 | | 429 | |
U.S. Treasury Bond | | | | | |
3.75%, 11/15/43 (i) | | 2,500 | | 3,007 | |
Principal Only, 0.00%, 02/15/43 (i) (j) | | 5,000 | | 2,242 | |
U.S. Treasury Inflation Indexed Note, 0.13%, 07/15/24 (h) (i) | | 2,000 | | 1,929 | |
Other Securities | | | | 385 | |
| | | | 11,022 | |
VENEZUELA - 0.5% | | | | | |
Other Securities | | | | 881 | |
| | | | | |
ZAMBIA - 0.3% | | | | | |
Other Securities | | | | 548 | |
Total Government and Agency Obligations (cost $25,329) | | | | 23,542 | |
| | | | | |
PURCHASED OPTIONS - 2.5% | | | | | |
Other Securities | | | | 4,339 | |
Total Purchased Options (cost $7,878) | | | | 4,339 | |
See accompanying Notes to Financial Statements.
Curian Variable Series Trust Sub-Advised Funds
Schedules of Investments (in thousands)
December 31, 2014
| | Shares/Par † | | Value | |
SHORT TERM INVESTMENTS - 0.1% | | | | | |
| | | | | |
Investment Company - 0.1% | | | | | |
JNL Money Market Fund, 0.01% (k) (l) | | 227 | | 227 | |
Total Short Term Investments (cost $227) | | | | 227 | |
| | | | | |
Total Investments - 96.9% (cost $177,219) | | | | 167,639 | |
Other Assets and Liabilities, Net - 3.1% | | | | 5,381 | |
Total Net Assets - 100.0% | | | | $ | 173,020 | |
| | | | | | |
(a) | The Sub-Adviser has deemed this security which is exempt from registration under the 1933 Act to be liquid based on procedures approved by the Trust’s Board of Trustees. As of December 31, 2014, the aggregate value of these liquid securities was $52,549 which represented 30.4% of net assets. |
(b) | Variable rate security. Rate stated was in effect as of December 31, 2014. |
(c) | Perpetual security. |
(d) | Convertible security. |
(e) | The interest rate for this security is inversely affected by upgrades or downgrades to the credit rating of the issuer. |
(f) | Security is a “step-up” bond where the coupon may increase or step up at a future date. Rate stated was the coupon as of December 31, 2014. |
(g) | Treasury inflation indexed note, par amount is not adjusted for inflation. |
(h) | Treasury inflation indexed note, par amount is adjusted for inflation. |
(i) | All or a portion of the security is pledged or segregated as collateral. See the Notes to Financial Statements. |
(j) | Security issued with a zero coupon. Income is recognized through the accretion of discount. |
(k) | Investment in affiliate. |
(l) | Yield changes daily to reflect current market conditions. Rate was the quoted yield as of December 31, 2014. |
See accompanying Notes to Financial Statements.
Curian Variable Series Trust Sub-Advised Funds
Schedules of Investments (in thousands, except contracts)
December 31, 2014
Schedule of Written Options
| | Expiration
Date | | Exercise
Price | | Contracts | | Value | |
Exchange-Traded Futures Options | | | | | | | | | |
90-Day Eurodollar Future Call Option | | 06/13/2016 | | 98.75 | | 392 | | $ | (267 | ) |
| | | | | | 392 | | $ | (267 | ) |
Interest Rate Swaptions | | | | | | | | | |
Call Swaption, 3-Month LIBOR versus 4.32% fixed, JPM | | 01/17/2018 | | N/A | | 985 | | $ | (385 | ) |
Call Swaption, 3-Month LIBOR versus 5.00% fixed, JPM | | 12/19/2017 | | N/A | | 480 | | (242 | ) |
Call Swaption, 6-Month GBP LIBOR versus 3.15% fixed, BOA | | 06/17/2015 | | N/A | | 66 | | (1,142 | ) |
Call Swaption, 6-Month Japanese Yen LIBOR versus 1.75% fixed, BBP | | 05/22/2015 | | N/A | | 900 | | (84 | ) |
Call Swaption, 6-Month Japanese Yen LIBOR versus 1.75% fixed, BBP | | 05/22/2015 | | N/A | | 10,390 | | (968 | ) |
Put Swaption, 3-Month LIBOR versus 5.00% fixed, BBP | | 12/07/2017 | | N/A | | 37 | | (18 | ) |
Put Swaption, 3-Month LIBOR versus 5.00% fixed, BBP | | 12/19/2017 | | N/A | | 775 | | (390 | ) |
Put Swaption, 6-Month GBP LIBOR versus 3.15% fixed, BOA | | 06/17/2015 | | N/A | | 66 | | (8 | ) |
Put Swaption, 6-Month Japanese Yen LIBOR versus 1.75% fixed, JPM | | 05/22/2015 | | N/A | | 1,650 | | (154 | ) |
| | | | | | 15,349 | | $ | (3,391 | ) |
Index Options | | | | | | | | | |
CDX.NA.HY.23 Call Option, CIT | | 03/18/2015 | | 107.50 | | 174 | | $ | (67 | ) |
CDX.NA.HY.23 Call Option, CIT | | 03/18/2015 | | 107.00 | | 45 | | (28 | ) |
CDX.NA.HY.23 Call Option, BOA | | 03/18/2015 | | 108.00 | | 59 | | (15 | ) |
CDX.NA.HY.23 Call Option, JPM | | 01/21/2015 | | 108.00 | | 40 | | (1 | ) |
CDX.NA.HY.23 Put Option, BOA | | 01/21/2015 | | 105.00 | | 197 | | (87 | ) |
CDX.NA.HY.23 Put Option, BOA | | 03/18/2015 | | 102.00 | | 59 | | (44 | ) |
CDX.NA.HY.23 Put Option, CIT | | 03/18/2015 | | 101.00 | | 45 | | (27 | ) |
| | | | | | 618 | | $ | (269 | ) |
Summary of Written Options
| | Contracts | | Premiums | |
Options outstanding at December 31, 2013 | | 13,005 | | $ | 2,488 | |
Options written during the year | | 19,842 | | 8,394 | |
Options closed during the year | | (11,503 | ) | (3,992 | ) |
Options expired during the year | | (4,985 | ) | (1,603 | ) |
Options outstanding at December 31, 2014 | | 16,359 | | $ | 5,287 | |
Schedule of Open Futures Contracts
| | Expiration | | Contracts
Long /
(Short) | | Unrealized
Appreciation /
(Depreciation) | |
Euro-Bobl Future | | March 2015 | | (14 | ) | $ | (15 | ) |
U.S. Treasury Long Bond Future | | March 2015 | | 5 | | 2 | |
U.S. Treasury Note Future, 10-Year | | March 2015 | | 43 | | 25 | |
U.S. Treasury Note Future, 5-Year | | March 2015 | | 153 | | 56 | |
Ultra Long Term U.S. Treasury Bond Future | | March 2015 | | 112 | | 281 | |
| | | | | | $ | 349 | |
Schedule of Open Forward Foreign Currency Contracts
Purchased/
Sold | | Settlement
Date | | Counter-
Party | | Notional
Amount | | Value | | Unrealized
Gain/(Loss) | |
CLP/USD | | 03/16/2015 | | BCL | | CLP | 345,000 | | $ | 565 | | $ | 2 | |
CNY/USD | | 03/16/2015 | | BCL | | CNY | 1,650 | | 264 | | (3 | ) |
EUR/USD | | 03/04/2015 | | JPM | | EUR | 3,430 | | 4,152 | | (104 | ) |
GBP/USD | | 03/04/2015 | | JPM | | GBP | 1,990 | | 3,100 | | (34 | ) |
INR/USD | | 03/16/2015 | | DUB | | INR | 42,200 | | 659 | | (1 | ) |
| | | | | | | | | | | | | | |
See accompanying Notes to Financial Statements.
Curian Variable Series Trust Sub-Advised Funds
Schedules of Investments (in thousands)
December 31, 2014
Purchased/
Sold | | Settlement
Date | | Counter-
Party | | Notional
Amount | | Value | | Unrealized
Gain/(Loss) | |
JPY/USD | | 03/04/2015 | | BCL | | JPY | 401,046 | | $ | 3,350 | | $ | (35 | ) |
USD/AUD | | 03/04/2015 | | MSC | | AUD | (12,670 | ) | (10,301 | ) | 470 | |
USD/BRL | | 03/16/2015 | | BCL | | BRL | (2,450 | ) | (904 | ) | (3 | ) |
USD/CLP | | 03/16/2015 | | DUB | | CLP | (345,000 | ) | (565 | ) | (8 | ) |
USD/EUR | | 03/04/2015 | | DUB | | EUR | (13,830 | ) | (16,744 | ) | 549 | |
USD/GBP | | 03/04/2015 | | JPM | | GBP | (2,605 | ) | (4,058 | ) | 42 | |
USD/JPY | | 03/04/2015 | | JPM | | JPY | (289,000 | ) | (2,414 | ) | 47 | |
USD/MXN | | 03/18/2015 | | BCL | | MXN | (7,360 | ) | (496 | ) | (2 | ) |
USD/NZD | | 03/04/2015 | | JPM | | NZD | (755 | ) | (586 | ) | 4 | |
USD/NZD | | 03/04/2015 | | JPM | | NZD | (450 | ) | (349 | ) | (4 | ) |
USD/THB | | 03/16/2015 | | DUB | | THB | (13,300 | ) | (403 | ) | (3 | ) |
| | | | | | | | | $ | (24,730 | ) | $ | 917 | |
Schedule of Interest Rate Swap Agreements
Counterparty | | Floating Rate Index | | Fund Paying /
Receiving
Floating Rate | | Fixed Rate | | Expiration
Date | | Notional
Amount (1) | | Premiums
Paid /
(Received) | | Unrealized
Appreciation /
(Depreciation) | |
Over the Counter Interest Rate Swap Agreements | | | | | | | |
BBP | | 3-Month LIBOR | | Receiving | | 0.43 | % | 01/17/2015 | | 8,500 | | $ | — | | $ | (13 | ) |
BBP | | 3-Month LIBOR | | Receiving | | 3.40 | % | 08/15/2039 | | 400 | | — | | (60 | ) |
BOA | | 3-Month LIBOR | | Receiving | | 3.83 | % | 08/15/2039 | | 2,140 | | — | | (495 | ) |
BOA | | 3-Month LIBOR | | Receiving | | 2.99 | % | 02/15/2043 | | 5,000 | | — | | (251 | ) |
CIT | | 3-Month LIBOR | | Receiving | | 3.18 | % | 08/15/2039 | | 450 | | — | | (48 | ) |
BOA | | 3-Month South African Johannesburg Interbank Rate | | Paying | | 6.40 | % | 06/04/2018 | | ZAR | 3,000 | | — | | (6 | ) |
DUB | | 3-Month South African Johannesburg Interbank Rate | | Paying | | 7.48 | % | 05/31/2023 | | ZAR | 1,800 | | — | | (3 | ) |
BOA | | 6-Month Euribor | | Receiving | | 0.98 | % | 06/07/2018 | | EUR | 2,430 | | — | | (89 | ) |
BOA | | Korean Won 3-Month Certificate of Deposit | | Receiving | | 3.38 | % | 01/20/2019 | | KRW | 3,200,000 | | — | | (98 | ) |
BBP | | London-Interbank Offered Rate | | Receiving | | 1.98 | % | 05/13/2023 | | GBP | 1,000 | | — | | (32 | ) |
| | | | | | | | | | | | | $ | — | | $ | (1,095 | ) |
Counterparty | | Payments made by the Fund(8) | | Payments received by the Fund(8) | | Expiration
Date | | Notional
Amount(1) | | Premiums
Paid/
(Received) | | Unrealized
Appreciation | |
Over the Counter Interest Rate Swap Agreements | | | | | | | |
BOA | | 1-Month LIBOR | | 3-Month LIBOR | | 06/06/2043 | | 5,000 | | $ | — | | $ | 39 | |
JPM | | 1-Month LIBOR | | 3-Month LIBOR | | 05/16/2043 | | 35,000 | | — | | 283 | |
JPM | | 1-Month LIBOR | | 3-Month LIBOR | | 06/06/2043 | | 10,000 | | — | | 79 | |
| | | | | | | | | | $ | — | | $ | 401 | |
Counterparty | | Floating Rate Index | | Fund Paying /
Receiving
Floating Rate | | Fixed Rate | | Expiration
Date | | Notional
Amount (1) | | Unrealized
Appreciation /
(Depreciation) | |
Centrally Cleared Interest Rate Swap Agreements | | | | | | | | | |
N/A | | 3-Month LIBOR | | Receiving | | 0.48 | % | 09/27/2015 | | 13,500 | | $ | (14 | ) |
N/A | | 3-Month LIBOR | | Receiving | | 0.70 | % | 03/31/2016 | | 15,000 | | (14 | ) |
N/A | | 3-Month LIBOR | | Receiving | | 1.22 | % | 02/28/2017 | | 4,125 | | (17 | ) |
N/A | | 3-Month LIBOR | | Receiving | | 1.41 | % | 03/26/2018 | | 8,300 | | (11 | ) |
N/A | | 3-Month LIBOR | | Receiving | | 2.81 | % | 01/17/2021 | | 6,000 | | (296 | ) |
N/A | | 3-Month LIBOR | | Receiving | | 2.70 | % | 04/11/2021 | | 7,500 | | (282 | ) |
N/A | | 3-Month LIBOR | | Receiving | | 2.59 | % | 04/17/2021 | | 3,450 | | (106 | ) |
N/A | | 3-Month LIBOR | | Receiving | | 2.62 | % | 05/30/2023 | | 9,000 | | (227 | ) |
N/A | | 3-Month LIBOR | | Receiving | | 2.66 | % | 10/29/2023 | | 1,500 | | (55 | ) |
N/A | | 3-Month LIBOR | | Receiving | | 2.66 | % | 10/30/2023 | | 2,000 | | (74 | ) |
N/A | | 3-Month LIBOR | | Receiving | | 2.75 | % | 11/12/2023 | | 2,625 | | (115 | ) |
| | | | | | | | | | | | | | |
See accompanying Notes to Financial Statements.
Counterparty | | Floating Rate Index | | Fund Paying /
Receiving
Floating Rate | | Fixed Rate | | Expiration
Date | | Notional
Amount (1) | | Unrealized
Appreciation /
(Depreciation) | |
Centrally Cleared Interest Rate Swap Agreements (continued) | | | | | | | | | |
N/A | | 3-Month LIBOR | | Receiving | | 3.35 | % | 01/17/2024 | | 5,750 | | $ | (532 | ) |
N/A | | 3-Month LIBOR | | Receiving | | 2.90 | % | 05/22/2024 | | 2,600 | | (120 | ) |
N/A | | 3-Month LIBOR | | Receiving | | 2.49 | % | 07/20/2024 | | 3,190 | | (144 | ) |
N/A | | 3-Month LIBOR | | Receiving | | 3.57 | % | 01/17/2026 | | 5,000 | | (601 | ) |
N/A | | 3-Month LIBOR | | Receiving | | 3.27 | % | 05/22/2029 | | 1,600 | | (136 | ) |
N/A | | 3-Month LIBOR | | Receiving | | 3.24 | % | 08/04/2030 | | 3,800 | | (334 | ) |
N/A | | 3-Month LIBOR | | Receiving | | 3.79 | % | 08/15/2039 | | 11,500 | | (2,423 | ) |
N/A | | 3-Month LIBOR | | Receiving | | 3.84 | % | 08/15/2039 | | 1,700 | | (373 | ) |
N/A | | 3-Month LIBOR | | Receiving | | 3.22 | % | 05/15/2043 | | 900 | | (89 | ) |
N/A | | 3-Month LIBOR | | Receiving | | 4.02 | % | 11/15/2043 | | 4,250 | | (1,183 | ) |
N/A | | 3-Month New Zealand Bank Bill Forward Rate Agreement | | Paying | | 4.78 | % | 07/24/2024 | | NZD | 10,000 | | 426 | |
N/A | | 3-Month New Zealand Bank Bill Forward Rate Agreement | | Paying | | 4.71 | % | 07/24/2024 | | NZD | 9,800 | | 376 | |
N/A | | 3-Month New Zealand Bank Bill Forward Rate Agreement | | Paying | | 4.71 | % | 07/24/2024 | | NZD | 6,900 | | 261 | |
N/A | | London-Interbank Offered Rate | | Paying | | 2.48 | % | 04/16/2020 | | GBP | 9,486 | | 696 | |
N/A | | London-Interbank Offered Rate | | Receiving | | 3.05 | % | 04/16/2025 | | GBP | 10,550 | | (1,817 | ) |
N/A | | London-Interbank Offered Rate | | Paying | | 3.38 | % | 04/16/2045 | | GBP | 2,451 | | 1,019 | |
| | | | | | | | | | | | $ | (6,185 | ) |
Counterparty | | Payments made by the Fund(8) | | Payments received by the Fund(8) | | Expiration
Date | | Notional
Amount(1) | | Unrealized
Appreciation | |
Centrally Cleared Interest Rate Swap Agreements | | | | | | | | |
N/A | | 1-Month LIBOR | | 3-Month LIBOR | | 09/13/2042 | | 10,000 | | $ | 64 | |
N/A | | 1-Month LIBOR | | 3-Month LIBOR | | 06/06/2043 | | 65,000 | | 354 | |
N/A | | 1-Month LIBOR | | 3-Month LIBOR | | 06/06/2043 | | 50,000 | | 305 | |
| | | | | | | | | | $ | 723 | |
Schedule of Over the Counter Cross Currency Swap Agreements
Counter-
party | | Receive Rate (8) | | Pay Rate (8) | | Expiration
Date | | Notional
Amount
Received (1) | | Notional
Amount
Delivered (1) | | Unrealized
Appreciation /
(Depreciation) | |
BBP | | 3-Month Australian Bank Bill Short Term Rate + 0.36% | | 3-Month USD LIBOR | | 12/24/2022 | | AUD | 3,500 | | (2,848 | ) | $ | 24 | |
BOA | | 3-Month Australian Bank Bill Short Term Rate + 0.31% | | 3-Month USD LIBOR | | 05/21/2023 | | AUD | 11,700 | | (10,198 | ) | (619 | ) |
BOA | | 3-Month USD LIBOR | | 3-Month Australian Bank Bill Short Term Rate + 0.14% | | 05/21/2015 | | | 15,427 | | AUD | (17,700 | ) | 938 | |
BOA | | 3-Month USD LIBOR | | 3-Month Australian Bank Bill Short Term Rate + 0.19% | | 12/24/2015 | | | 2,848 | | AUD | (3,500 | ) | (11 | ) |
CIT | | 3-Month JPY LIBOR - 0.14% | | 3-Month USD LIBOR | | 03/20/2015 | | JPY | 1,975,000 | | | (16,650 | ) | (161 | ) |
CIT | | 3-Month USD LIBOR | | 3-Month Australian Bank Bill Short Term Rate + 0.12% | | 06/06/2015 | | | 252 | | AUD | (300 | ) | 6 | |
CIT | | 3-Month USD LIBOR | | 3-Month Australian Bank Bill Short Term Rate + 0.19% | | 09/05/2015 | | | 1,170 | | AUD | (1,386 | ) | 37 | |
CIT | | 3-Month USD LIBOR | | 3-Month JPY LIBOR - 0.44% | | 03/20/2019 | | | 16,650 | | JPY | (1,975,000 | ) | 82 | |
JPM | | 3-Month Australian Bank Bill Short Term Rate + 0.35% | | 3-Month USD LIBOR | | 09/05/2023 | | AUD | 1,386 | | | (1,170 | ) | (33 | ) |
JPM | | 3-Month Australian Bank Bill Short Term Rate + 0.36% | | 3-Month USD LIBOR | | 05/21/2023 | | AUD | 6,000 | | | (5,230 | ) | (299 | ) |
JPM | | 3-Month Australian Bank Bill Short Term Rate + 0.36% | | 3-Month USD LIBOR | | 06/06/2023 | | AUD | 300 | | | (252 | ) | (5 | ) |
| | | | | | | | | | | | | | $ | (41 | ) |
Schedule of Credit Default Swap Agreements
Counterparty | | Reference Obligation | | Implied
Credit
Spread (4) | | Fixed
Received /
Pay Rate (7) | | Expiration
Date | | Notional
Amount (1),(6) | | Value (5) | | Premiums
Paid /
(Received) | | Unrealized
Appreciation /
(Depreciation) | |
Over the Counter Credit Default Swap Agreements | | | | | | | | | | | |
Credit default swap agreements - purchase protection (2) | | | | | | | | | |
BOA | | American International Group Inc., 6.25%, 05/01/2036 | | N/A | | 1.00 | % | 06/20/2019 | | $ | 3,350 | | $ | (85 | ) | $ | (72 | ) | $ | (13 | ) |
JPM | | Boston Scientific Corp., 2.65%, 10/01/2018 | | N/A | | 1.00 | % | 12/20/2019 | | 3,600 | | (65 | ) | (47 | ) | (18 | ) |
MSC | | Canadian Natural l Resources, 6.25%, 03/15/2038 | | N/A | | 1.00 | % | 12/20/2019 | | 3,920 | | 182 | | (15 | ) | 197 | |
BOA | | CDX.EM.21 | | N/A | | 5.00 | % | 06/20/2019 | | 12,000 | | (617 | ) | (1,178 | ) | 561 | |
| | | | | | | | | | | | | | | | | | | | | |
See accompanying Notes to Financial Statements.
Counterparty | | Reference Obligation | | Implied
Credit
Spread (4) | | Fixed
Received /
Pay Rate (7) | | Expiration
Date | | Notional
Amount (1),(6) | | Value (5) | | Premiums
Paid /
(Received) | | Unrealized
Appreciation /
(Depreciation) | |
Over the Counter Credit Default Swap Agreements (continued) | | | | | | | | | |
Credit default swap agreements - purchase protection (2) (continued) | | | | | | | |
CIT | | CDX.EM.21 | | N/A | | 5.00 | % | 06/20/2019 | | $ | 2,400 | | $ | (123 | ) | $ | (236 | ) | $ | 113 | |
MSC | | CDX.EM.21 | | N/A | | 5.00 | % | 06/20/2019 | | 10,867 | | (559 | ) | (1,097 | ) | 538 | |
MSC | | CDX.EM.21 | | N/A | | 5.00 | % | 06/20/2019 | | 7,680 | | (396 | ) | (200 | ) | (196 | ) |
BOA | | CNA Financial Corp., 5.85%, 12/15/2014 | | N/A | | 1.00 | % | 09/20/2019 | | 3,500 | | (76 | ) | (80 | ) | 4 | |
CIT | | iTraxx Europe Subordinated Series 21 | | N/A | | 1.00 | % | 06/20/2019 | | 12,101 | | (74 | ) | 179 | | (253 | ) |
DUB | | Republic of Colombia, 10.38%, 01/28/2033 | | N/A | | 1.00 | % | 12/20/2019 | | 3,910 | | 65 | | 17 | | 48 | |
| | | | | | | | | | $ | 63,328 | | $ | (1,748 | ) | $ | (2,729 | ) | $ | 981 | |
Credit default swap agreements - sell protection (3) | | | | | | | | | | |
BOA | | CMBX.NA.BB.6 | | N/A | | 5.00 | % | 05/11/2063 | | $ | (2,180 | ) | $ | 9 | | $ | 68 | | $ | (59 | ) |
BOA | | CMBX.NA.BB.6 | | N/A | | 5.00 | % | 05/11/2063 | | (1,125 | ) | 5 | | — | | 5 | |
CIT | | CMBX.NA.BB.6 | | N/A | | 5.00 | % | 05/11/2063 | | (2,000 | ) | 8 | | (9 | ) | 17 | |
MSC | | CMBX.NA.BB.6 | | N/A | | 5.00 | % | 05/11/2063 | | (2,500 | ) | 10 | | 75 | | (65 | ) |
MSC | | CMBX.NA.BBB.6 | | N/A | | 3.00 | % | 05/11/2063 | | (5,100 | ) | 15 | | (149 | ) | 164 | |
BOA | | General Electric Capital Corp., 5.63%, 09/15/2017 | | 0.55 | % | 1.00 | % | 06/20/2019 | | (3,350 | ) | 66 | | 81 | | (15 | ) |
BOA | | Hartford Financial Services Group, 6.00%, 01/15/2019 | | 0.57 | % | 1.00 | % | 09/20/2019 | | (3,500 | ) | 69 | | 55 | | 14 | |
CIT | | State of Illinois, 5.00%, 06/01/2029 | | 2.10 | % | 1.00 | % | 12/20/2023 | | (1,900 | ) | (144 | ) | (135 | ) | (9 | ) |
| | | | | | | | | | $ | (21,655 | ) | $ | 38 | | $ | (14 | ) | $ | 52 | |
Counterparty | | Reference Obligation | | Fixed
Received /
Pay Rate (7) | | Expiration
Date | | Notional
Amount (1),(6) | | Value (5) | | Unrealized
Appreciation /
(Depreciation) | |
Centrally Cleared Credit Default Swap Agreements | | | | | |
Credit default swap agreements - purchase protection (2) | | | | | |
N/A | | CDX.NA.HY.21 | | 5.00 | % | 12/20/2018 | | $ | 6,930 | | $ | (495 | ) | $ | (4 | ) |
N/A | | CDX.NA.HY.22 | | 5.00 | % | 06/20/2019 | | 16,503 | | (1,124 | ) | (134 | ) |
N/A | | CDX.NA.IG.23 | | 1.00 | % | 12/20/2019 | | 62,000 | | (991 | ) | 1 | |
N/A | | iTraxx Europe Crossover Series 20 | | 5.00 | % | 12/20/2018 | | 6,413 | | (786 | ) | (280 | ) |
N/A | | iTraxx Europe Series 22 | | 1.00 | % | 12/20/2019 | | 36,967 | | (668 | ) | (138 | ) |
| | | | | | | | $ | 128,813 | | $ | (4,064 | ) | $ | (555 | ) |
Schedule of Over the Counter Total Return Swap Agreements
Counterparty | | Receiving Return of Reference Entity | | Rate Paid by Fund | | Expiration
Date | | Notional
Amount (1) | | Unrealized
Appreciation | |
BOA | | iBoxx Liquid High Yield Index | | 3-Month LIBOR | | 03/25/2015 | | $ | 8,250 | | $ | 97 | |
JPM | | iBoxx Liquid High Yield Index | | 3-Month LIBOR | | 03/25/2015 | | 11,000 | | 117 | |
| | | | | | | | | | $ | 214 | |
| | | | | | | | | | | | | |
(1)Notional amount is stated in USD unless otherwise noted.
(2)If the Fund is a buyer of protection and a credit event occurs, as defined under the terms of that particular swap agreement, the Fund will either (i) receive from the seller of protection an amount equal to the notional amount of the referenced obligation agreement and deliver the referenced obligation, other deliverable obligations or underlying securities comprising the referenced index or (ii) receive a net settlement amount in the form of cash or securities equal to the notional amount of the swap agreement less the recovery value of the referenced obligation or underlying securities comprising the referenced index.
(3)If the Fund is a seller of protection and a credit event occurs, as defined under the terms of that particular swap agreement, the Fund will either (i) pay the buyer of protection an amount equal to the notional amount of the referenced obligation and take delivery of the referenced obligation, other deliverable obligations or underlying securities comprising the referenced index or (ii) pay a net settlement amount in the form of cash or securities equal to the notional amount of the swap agreement less the recovery value of the reference obligation or underlying securities comprising the referenced index.
(4)Implied credit spreads, represented in absolute terms, utilized in determining the value of credit default swap agreements on corporate issues and sovereign issues serve as an indicator of the current status of the payment/performance risk and represent the likelihood or risk of default for the credit derivative. The implied credit spread of a particular referenced entity reflects the cost of buying/selling protection and may include upfront payments required to be made to enter into the agreement. Wider credit spreads represent a deterioration of the referenced entity’s credit soundness and a greater likelihood or risk of default or other credit event occurring as defined under the terms of the applicable agreement.
(5)The prices and resulting values for credit default swap agreements on credit indices serve as an indicator of the current status of the payment/performance risk and represent the likelihood or risk of default for the credit derivative. Increasing market values, in absolute terms when compared to the notional amount of the swap, represent a deterioration of the referenced entity’s credit soundness and a greater likelihood or risk of default or other credit event occurring as defined under the terms of the agreement.
(6)The maximum potential amount the Fund could be required to pay as a seller of credit protection or receive as a buyer of credit protection if a credit event occurs is limited to the total notional amount which is defined under the terms of each swap agreement.
(7)If the Fund is a buyer of protection, the Fund pays the fixed rate. If the Fund is a seller of protection, the Fund receives the fixed rate.
(8)Payments delivered or received are based on the notional amount.
See accompanying Notes to Financial Statements.
Curian/Van Eck International Gold Fund (a)
| | Shares/Par † | | Value | |
COMMON STOCKS - 96.4% | | | | | |
| | | | | |
MATERIALS - 96.4% | | | | | |
Agnico-Eagle Mines Ltd. | | 109 | | $ | 2,722 | |
Agnico-Eagle Mines Ltd. | | 55 | | 1,369 | |
Alamos Gold Inc. | | 65 | | 463 | |
Alamos Gold Inc. (b) | | 118 | | 840 | |
Amara Mining Plc (c) | | 1,029 | | 232 | |
Argonaut Gold Inc. (b) (c) | | 629 | | 991 | |
Asanko Gold Inc. (b) (c) | | 100 | | 155 | |
Asanko Gold Inc. (b) (c) | | 379 | | 587 | |
AuRico Gold Inc. | | 832 | | 2,727 | |
B2Gold Corp. (b) (c) | | 218 | | 357 | |
B2Gold Corp. (b) (c) | | 3,055 | | 4,948 | |
Bear Creek Mining Corp. (b) (c) | | 310 | | 379 | |
Belo Sun Mining Corp. (b) (c) | | 465 | | 82 | |
Castle Mountain Mining Co. Ltd. (c) | | 306 | | 87 | |
Continental Gold Ltd. (b) (c) | | 463 | | 737 | |
Corvus Gold Inc. (c) | | 235 | | 194 | |
Corvus Gold Inc. (c) | | 13 | | 11 | |
Eastmain Resources Inc. (c) | | 285 | | 56 | |
Eldorado Gold Corp. | | 938 | | 5,703 | |
Evolution Mining Ltd. (b) | | 1,205 | | 625 | |
Fortuna Silver Mines Inc. (b) (c) | | 110 | | 501 | |
Franco-Nevada Corp. | | 84 | | 4,117 | |
Fresnillo Plc (b) | | 146 | | 1,738 | |
Gold Canyon Resources Inc. (c) | | 278 | | 28 | |
Gold Road Resources Ltd. (c) | | 3,987 | | 798 | |
Goldcorp Inc. | | 194 | | 3,600 | |
Gryphon Minerals Ltd. (b) (c) | | 1,309 | | 68 | |
Guyana Goldfields Inc. (b) (c) | | 488 | | 1,185 | |
Klondex Mines Ltd. (b) (c) | | 565 | | 948 | |
Lundin Gold Inc. (c) | | 94 | | 337 | |
Lydian International Ltd. (c) | | 547 | | 221 | |
MAG Silver Corp. (b) (c) | | 49 | | 399 | |
Midway Gold Corp. (b) (c) | | 317 | | 235 | |
New Gold Inc. (c) | | 902 | | 3,877 | |
New Gold Inc. (b) (c) | | 93 | | 399 | |
Newcrest Mining Ltd. (c) | | 272 | | 2,392 | |
Novagold Resources Inc. (b) (c) | | 176 | | 519 | |
OceanaGold Corp. (c) | | 180 | | 313 | |
Orezone Gold Corp. (c) | | 1,282 | | 552 | |
Osisko Gold Royalties Ltd. (b) | | 126 | | 1,770 | |
Premier Gold Mines Ltd. (b) (c) | | 264 | | 430 | |
Pretium Resources Inc. (b) (c) | | 121 | | 701 | |
Pretium Resources Inc. (b) (c) | | 56 | | 323 | |
Primero Mining Corp. (b) (c) | | 253 | | 972 | |
Probe Mines Ltd. (b) (c) | | 89 | | 229 | |
Randgold Resources Ltd. - ADR (b) | | 96 | | 6,438 | |
Rio Alto Mining Ltd. (b) (c) | | 1,009 | | 2,450 | |
Romarco Minerals Inc. (b) (c) | | 1,119 | | 472 | |
Roxgold Inc. (b) (c) (d) | | 1,018 | | 482 | |
Royal Gold Inc. | | 66 | | 4,151 | |
Rubicon Minerals Corp. (b) (c) | | 144 | | 139 | |
Rubicon Minerals Corp. (b) (c) | | 371 | | 360 | |
Sabina Gold & Silver Corp. (c) | | 548 | | 167 | |
SEMAFO Inc. (c) | | 659 | | 1,690 | |
Silver Wheaton Corp. (b) | | 207 | | 4,206 | |
Sulliden Mining Capital Inc. (c) | | 54 | | 20 | |
Tahoe Resources Inc. (b) | | 203 | | 2,826 | |
Timmins Gold Corp. (b) (c) | | 621 | | 609 | |
Torex Gold Resources Inc. (b) (c) | | 1,537 | | 1,627 | |
Yamana Gold Inc. (b) | | 398 | | 1,608 | |
Yamana Gold Inc. (b) | | 338 | | 1,360 | |
| | | | | |
Total Common Stocks (cost $97,307) | | | | 78,522 | |
| | | | | |
SHORT TERM INVESTMENTS - 27.9% | | | | | |
| | | | | |
Investment Companies - 3.6% | | | | | |
JNL Money Market Fund, 0.01% (e) (f) | | 2,862 | | 2,862 | |
JPMorgan U.S. Treasury Plus Money Market Fund, 0.00% (f) | | 83 | | 83 | |
| | | | 2,945 | |
Securities Lending Collateral - 24.3% | | | | | |
BlackRock Liquidity Funds TempFund Portfolio, 0.07% (f) | | 9,000 | | 9,000 | |
Fidelity Institutional Money Market Portfolio, 0.09% (f) | | 1,000 | | 1,000 | |
Repurchase Agreement with BNP, 0.05% (Collateralized by $360 U.S. Treasury Note, 0.25%, due 02/29/16, value $359 and $4,747 U.S. Treasury Bond Strip, due 10/15/15, value $4,741) acquired on 12/31/14, due 01/02/15 at $5,000 | | $ | 5,000 | | 5,000 | |
Repurchase Agreement with MLP, 0.06% (Collateralized by $1,572 U.S. Treasury Bond, 6.25%, due 05/15/30, value $2,359 and $2,601 U.S. Treasury Note, 0.13%, due 07/15/24, value $2,497) acquired on 12/31/14, due 01/02/15 at $4,761 | | 4,761 | | 4,761 | |
| | | | 19,761 | |
Total Short Term Investments (cost $22,706) | | | | 22,706 | |
| | | | | |
Total Investments - 124.3% (cost $120,013) | | | | 101,228 | |
Other Assets and Liabilities, Net - (24.3%) | | | | (19,781 | ) |
Total Net Assets - 100.0% | | | | $ | 81,447 | |
| | | | | | | |
(a) | Consolidated Schedule of Investments. |
(b) | All or portion of the security was on loan. |
(c) | Non-income producing security. |
(d) | The Sub-Adviser has deemed this security which is exempt from registration under the 1933 Act to be liquid based on procedures approved by the Trust’s Board of Trustees. As of December 31, 2014, the aggregate value of these liquid securities was $482 which represented 0.6% of net assets. |
(e) | Investment in affiliate. |
(f) | Yield changes daily to reflect current market conditions. Rate was the quoted yield as of December 31, 2014. |
Investments by Country‡ | | Percentage of Total
Long-Term
Investments | |
Australia | | 5.3 | % |
Canada | | 71.6 | |
Jersey | | 0.3 | |
United Kingdom | | 2.5 | |
United States | | 20.3 | |
Total Long-Term Investments | | 100.0 | % |
‡ The country table is presented for this Fund because its strategy includes investment in non-U.S. securities as deemed significant by the Fund’s Adviser.
See accompanying Notes to Financial Statements.
Currency Abbreviations:
ARS - Argentine Peso | IDR - Indonesian Rupiah | PLN - Polish Zloty |
AUD - Australian Dollar | ILS - Israeli New Sheqel | RON - Romanian New Leu |
BRL - Brazilian Real | INR - Indian Rupee | RSD - Serbian Dinar |
CAD - Canadian Dollar | JPY - Japanese Yen | RUB - Russian Ruble |
CHF - Swiss Franc | KRW - Korean Won | SEK - Swedish Krona |
CLF - Chilean Unidad de Fomento | KZT - Kazakhstani Tenge | SGD - Singapore Dollar |
CLP - Chilean Peso | LBP - Lebanese Pound | THB - Thai Baht |
CNH - Chinese Offshore Yuan | LKR - Sri Lankan Rupee | TRY - New Turkish Lira |
CNY - Chinese Yuan | MXN - Mexican Peso | TWD - Taiwan Dollar |
DOP - Dominican Peso | MYR - Malaysian Ringgit | UGX - Ugandan Shilling |
EGP — Egyptian Pound | NGN - Nigerian Naira | USD - United States Dollar |
EUR - European Currency Unit (Euro) | NOK - Norwegian Krone | UYU - Uruguayan Peso |
GBP - British Pound | NZD - New Zealand Dollar | ZAR - South African Rand |
HKD - Hong Kong Dollar | PEN - Peruvian Nuevo Sol | ZMW - Zambian Kwacha |
HUF - Hungarian Forint | PHP - Philippine Peso | |
Abbreviations:
ABS - Asset-Backed Security ADR - American Depositary Receipt ADS - American Depository Shares ASX - Australian Stock Exchange BDR - Brazilian Depositary Receipt CAC - Cotation Assistee en Continu CDI - Chess Depository Interest CDX.EM - Credit Default Swap Index - Emerging Markets CDX.NA.HY - Credit Default Swap Index - North American - High Yield CDX.NA.IG - Credit Default Swap Index - North American - Investment Grade CLO - Collateralized Loan Obligation CNX - CRISIL NSE Index CPURNSA - CPI Consumers Index Non-Seasonally Adjusted CVA - Commanditaire Vennootschap op Aandelen EAFE - Europe, Australia and Far East EMU - Economic and Monetary Union (Europe) ETF - Exchange Traded Fund ETN - Exchange Traded Note Euribor - Europe Interbank Offered Rate Euro-Bobl - debt instrument issued by the Federal Republic of Germany with a term of 4.5 to 5.5 years Euro-Bund - debt instrument issued by the Federal Republic of Germany with a term of 8.5 to 10.5 years Euro-Schatz - debt instrument issued by the Federal Republic of Germany with a term of 1.75 to 2.25 years FTSE - Financial Times and the London Stock Exchange GDR - Global Depositary Receipt HICP - Harmonized Index of Consumer Prices | | IBEX - Iberia Index ICE - IntercontinentalExchange iTraxx - Group of international credit derivative indexes monitored by the International Index Company JSE - Johannesburg Stock Exchange KOSPI - Korea Composite Stock Price Index LIBOR - London Interbank Offer Rate LME - London Metal Exchange MBS - Mortgage Backed Security MIB - Milano Italia Borsa MLP - Master Limited Partnership MSCI - Morgan Stanley Capital International NASDAQ - National Association of Securities Dealers Automated Quotations NSE - National Stock Exchange NYSE - New York Stock Exchange OJSC - Open Joint-Stock Company OTC - Over the Counter PCL - Public Company Limited RBOB - Reformulated Gasoline Blendstock for Oxygen Blending REIT - Real Estate Investment Trust REMIC - Real Estate Mortgage Investment Conduit SGX - Singapore Exchange SPDR - Standard & Poor’s Depositary Receipt SPI - Schedule Performance Index ULSD - Ultra Low Sulfur Diesel VIX - Volatility Index WIG - Warszawski Indeks Giedowy WTI - West Texas Intermediate |
Counterparty Abbreviations:
BBP - Barclays Bank Plc | IMP - Imperial Capital Inc. |
BCL - Barclays Capital Inc. | JPM - JPMorgan Chase Bank N.A. |
BMO - BMO Capital Markets Corp. | MLP - Merrill Lynch, Pierce, Fenner, & Smith |
BNP - BNP Paribas Securities | MSC - Morgan Stanley & Co., Incorporated |
BOA - Banc of America Securities LLC/Bank of America NA | MSS - Morgan Stanley Capital Services Inc. |
CGM - Citigroup Global Markets | NSI - Nomura Securities International |
CIB - CIBC World Markets Corp. | NTS - Northern Trust Securities |
CIT - Citibank, Inc. | RBC - Royal Bank of Canada |
CSI - Credit Suisse Securities, LLC | RBS - Royal Bank of Scotland |
DUB - Deutsche Bank Alex Brown Inc. | SCB - Standard Chartered Bank |
GSB - Goldman Sachs Bank | SGB - Societe Generale Bannon LLC |
GSC - Goldman Sachs & Co. | SSB - State Street Brokerage Services, Inc. |
GSI - Goldman Sachs International | UBS - UBS Securities LLC |
HSB - HSBC Securities, Inc. | |
† For funds with fixed income securities, par amounts are listed in United States Dollars unless otherwise noted. Options are quoted in unrounded number of contracts.
“-” Amount rounds to less than one thousand
* A Summary Schedule of Investments is presented for this portfolio. A complete Schedule of Investments is available without charge, upon request, by calling the Annuity Service Center at 1-800-873-5654 or by visiting the Commission’s website, www.sec.gov.
See accompanying Notes to Financial Statements.
Curian Variable Series Trust Sub-Advised Funds
Statements of Assets and Liabilities (in thousands, except net asset value per share)
December 31, 2014
| | Curian
Tactical
Advantage 35
Fund | | Curian
Tactical
Advantage 60
Fund | | Curian
Tactical
Advantage 75
Fund | | Curian
Dynamic Risk
Advantage -
Diversified
Fund | | Curian
Dynamic Risk
Advantage -
Growth Fund | | Curian
Dynamic Risk
Advantage -
Income Fund | |
Assets | | | | | | | | | | | | | |
Investments - unaffiliated, at value (a)(d) | | $ | 52,741 | | $ | 134,293 | | $ | 119,232 | | $ | 311,621 | | $ | 55,248 | | $ | 206,730 | |
Investments - affiliated, at value (b) | | 624 | | — | | 300 | | 35,292 | | 5,421 | | 4,265 | |
Repurchase Agreements (a) | | 6,631 | | 2,963 | | 6,396 | | 6,314 | | 1,471 | | 19,765 | |
Total investments, at value (c) | | 59,996 | | 137,256 | | 125,928 | | 353,227 | | 62,140 | | 230,760 | |
Cash | | — | | — | | — | | 4,087 | | — | | 92 | |
Foreign currency (e) | | — | | — | | — | | — | | — | | — | |
Receivable for investments sold | | — | | 130 | | — | | — | | 287 | | — | |
Receivable for treasury roll transactions | | — | | — | | — | | — | | — | | — | |
Receivable for fund shares sold | | 8 | | 44 | | 19 | | 205 | | 89 | | 125 | |
Receivable from adviser | | 13 | | 30 | | 27 | | 21 | | 4 | | 53 | |
Receivable for dividends and interest | | 12 | | 14 | | — | | 11 | | — | | 163 | |
Receivable for variation margin on financial derivative instruments | | — | | — | | — | | 90 | | 11 | | — | |
Receivable for deposits with brokers and counterparties | | — | | — | | — | | — | | 300 | | — | |
Unrealized appreciation on forward foreign currency contracts | | — | | — | | — | | — | | — | | — | |
Unrealized appreciation on OTC swap agreements | | — | | — | | — | | 4,109 | | — | | — | |
OTC swap premiums paid | | — | | — | | — | | — | | — | | — | |
Other assets | | — | | 1 | | 1 | | 2 | | — | | 1 | |
Total assets | | 60,029 | | 137,475 | | 125,975 | | 361,752 | | 62,831 | | 231,194 | |
Liabilities | | | | | | | | | | | | | |
Cash overdraft | | — | | 100 | | — | | — | | — | | — | |
Payable for reverse repurchase agreements | | — | | — | | — | | — | | — | | — | |
Payable for advisory fees | | 32 | | 76 | | 67 | | 251 | | 43 | | 129 | |
Payable for administrative fees | | 8 | | 21 | | 17 | | 60 | | 10 | | 30 | |
Payable for 12b-1 fee | | 4 | | 9 | | 8 | | 26 | | 5 | | 14 | |
Payable for investment securities purchased | | 618 | | — | | 292 | | — | | 279 | | 2,494 | |
Payable for treasury roll transactions | | — | | — | | — | | — | | — | | — | |
Payable for fund shares redeemed | | 12 | | 19 | | 14 | | 131 | | 37 | | 176 | |
Payable for dividends or interest on securities sold short | | — | | — | | — | | — | | — | | — | |
Payable for interest expense and brokerage charges | | — | | — | | — | | — | | — | | — | |
Payable for trustee fees | | 2 | | 4 | | 4 | | 16 | | 4 | | 8 | |
Payable for chief compliance officer fees | | — | | — | | — | | 1 | | — | | — | |
Payable for other expenses | | 1 | | 2 | | 2 | | 6 | | 2 | | 3 | |
Payable for variation margin on financial derivative instruments | | — | | — | | — | | 617 | | 164 | | — | |
Due to brokers and counterparties for deposits | | — | | — | | — | | 3,890 | | — | | — | |
Investment in securities sold short, at value (f) | | — | | — | | — | | — | | — | | — | |
Options written, at value (g) | | — | | — | | — | | — | | — | | — | |
Unrealized depreciation on forward foreign currency contracts | | — | | — | | — | | — | | — | | — | |
Unrealized depreciation on OTC swap agreements | | — | | — | | — | | 94 | | 57 | | — | |
OTC swap premiums received | | — | | — | | — | | — | | — | | — | |
Payable upon return of securities loaned | | 8,131 | | 16,963 | | 20,500 | | 6,314 | | 1,571 | | 46,865 | |
Total liabilities | | 8,808 | | 17,194 | | 20,904 | | 11,406 | | 2,172 | | 49,719 | |
Net assets | | $ | 51,221 | | $ | 120,281 | | $ | 105,071 | | $ | 350,346 | | $ | 60,659 | | $ | 181,475 | |
Net assets consist of: | | | | | | | | | | | | | |
Paid-in capital | | $ | 49,018 | | $ | 112,135 | | $ | 97,051 | | $ | 332,850 | | $ | 63,557 | | $ | 172,953 | |
Undistributed (excess of distributions over) net investment income (loss) | | 762 | | 1,669 | | 1,428 | | 171 | | (5 | ) | 4,681 | |
Accumulated net realized gain (loss) | | 336 | | 2,065 | | 2,338 | | 10,824 | | (3,138 | ) | 1,432 | |
Net unrealized appreciation (depreciation) on investments and foreign currency | | 1,105 | | 4,412 | | 4,254 | | 6,501 | | 245 | | 2,409 | |
| | $ | 51,221 | | $ | 120,281 | | $ | 105,071 | | $ | 350,346 | | $ | 60,659 | | $ | 181,475 | |
Shares outstanding (no par value), unlimited shares authorized | | 4,618 | | 10,099 | | 8,467 | | 32,696 | | 6,782 | | 16,648 | |
Net asset value per share | | $ | 11.09 | | $ | 11.91 | | $ | 12.41 | | $ | 10.72 | | $ | 8.94 | | $ | 10.90 | |
(a) Investments - unaffiliated, at cost | | $ | 58,267 | | $ | 132,844 | | $ | 121,374 | | $ | 318,399 | | $ | 56,846 | | $ | 224,086 | |
(b) Investments - affiliated, at cost | | 624 | | — | | 300 | | 35,292 | | 5,421 | | 4,265 | |
(c) Total investments, at cost | | $ | 58,891 | | $ | 132,844 | | $ | 121,674 | | $ | 353,691 | | $ | 62,267 | | $ | 228,351 | |
(d) Including value of securities on loan | | $ | 7,940 | | $ | 16,552 | | $ | 19,933 | | $ | 6,146 | | $ | 1,494 | | $ | 45,533 | |
(e) Foreign currency, at cost | | — | | — | | — | | — | | — | | — | |
(f) Proceeds from securities sold short | | — | | — | | — | | — | | — | | — | |
(g) Premiums from options written | | — | | — | | — | | — | | — | | — | |
See accompanying Notes to Financial Statements.
| | Curian/
Aberdeen
Latin America
Fund | | Curian/AQR
Risk Parity
Fund (h) | | Curian/
Ashmore
Emerging
Market Small
Cap Equity
Fund | | Curian/Baring
International
Fixed Income
Fund | | Curian/
BlackRock
Global Long
Short Credit
Fund | | Curian/
CenterSquare
International
Real Estate
Securities
Fund | |
Assets | | | | | | | | | | | | | |
Investments - unaffiliated, at value (a)(d) | | $ | 8,256 | | $ | 158,089 | | $ | 38,666 | | $ | 23,750 | | $ | 346,215 | | $ | 19,645 | |
Investments - affiliated, at value (b) | | 241 | | 16,500 | | 178 | | 438 | | 26,633 | | 15 | |
Repurchase Agreements (a) | | — | | — | | 69 | | — | | 59,878 | | — | |
Total investments, at value (c) | | 8,497 | | 174,589 | | 38,913 | | 24,188 | | 432,726 | | 19,660 | |
Cash | | — | | — | | 4 | | — | | 949 | | — | |
Foreign currency (e) | | 1 | | 85 | | 2 | | 3 | | 2,735 | | 219 | |
Receivable for investments sold | | — | | — | | 88 | | — | | 750 | | 237 | |
Receivable for treasury roll transactions | | — | | — | | — | | — | | — | | — | |
Receivable for fund shares sold | | — | | 166 | | 28 | | — | | 169 | | 33 | |
Receivable from adviser | | — | | 30 | | — | | — | | — | | — | |
Receivable for dividends and interest | | 19 | | 143 | | 40 | | 286 | | 4,203 | | 85 | |
Receivable for variation margin on financial derivative instruments | | — | | 535 | | — | | — | | 58 | | — | |
Receivable for deposits with brokers and counterparties | | — | | 13,294 | | — | | — | | 3,131 | | — | |
Unrealized appreciation on forward foreign currency contracts | | — | | 853 | | — | | 179 | | 5,200 | | — | |
Unrealized appreciation on OTC swap agreements | | — | | 1,273 | | — | | — | | 1,050 | | — | |
OTC swap premiums paid | | — | | — | | — | | — | | 2,317 | | — | |
Other assets | | — | | 1 | | — | | — | | 2 | | — | |
Total assets | | 8,517 | | 190,969 | | 39,075 | | 24,656 | | 453,290 | | 20,234 | |
Liabilities | | | | | | | | | | | | | |
Cash overdraft | | — | | 6,987 | | — | | — | | — | | — | |
Payable for reverse repurchase agreements | | — | | — | | — | | — | | — | | — | |
Payable for advisory fees | | 10 | | 128 | | 38 | | 12 | | 307 | | 13 | |
Payable for administrative fees | | 1 | | 30 | | 7 | | 4 | | 64 | | 3 | |
Payable for 12b-1 fee | | 1 | | 13 | | 3 | | 2 | | 29 | | 2 | |
Payable for investment securities purchased | | 26 | | — | | 153 | | — | | 6,226 | | 292 | |
Payable for treasury roll transactions | | — | | — | | — | | — | | — | | — | |
Payable for fund shares redeemed | | 5 | | 327 | | 31 | | 1 | | 9 | | 1 | |
Payable for dividends or interest on securities sold short | | — | | — | | — | | — | | 483 | | — | |
Payable for interest expense and brokerage charges | | — | | — | | — | | — | | 11 | | — | |
Payable for trustee fees | | — | | 6 | | 1 | | 1 | | 13 | | 1 | |
Payable for chief compliance officer fees | | — | | 1 | | — | | — | | 1 | | — | |
Payable for other expenses | | — | | 5 | | 1 | | — | | 10 | | — | |
Payable for variation margin on financial derivative instruments | | — | | 4,620 | | — | | — | | 38 | | — | |
Due to brokers and counterparties for deposits | | — | | 670 | | — | | — | | — | | — | |
Deferred foreign capital gains tax liability | | — | | — | | 81 | | — | | — | | — | |
Investment in securities sold short, at value (f) | | — | | — | | — | | — | | 60,380 | | — | |
Options written, at value (g) | | — | | — | | — | | — | | 6 | | — | |
Unrealized depreciation on forward foreign currency contracts | | — | | 947 | | — | | 148 | | 537 | | — | |
Unrealized depreciation on OTC swap agreements | | — | | 1,695 | | — | | — | | 1,954 | | — | |
OTC swap premiums received | | — | | — | | — | | — | | 1,733 | | — | |
Payable upon return of securities loaned | | — | | — | | 269 | | — | | — | | — | |
Total liabilities | | 43 | | 15,429 | | 584 | | 168 | | 71,801 | | 312 | |
Net assets | | $ | 8,474 | | $ | 175,540 | | $ | 38,491 | | $ | 24,488 | | $ | 381,489 | | $ | 19,922 | |
Net assets consist of: | | | | | | | | | | | | | |
Paid-in capital | | $ | 12,071 | | $ | 155,219 | | $ | 42,435 | | $ | 26,054 | | $ | 369,588 | | $ | 21,353 | |
Undistributed (excess of distributions over) net investment income (loss) | | 1 | | 14,522 | | (82 | ) | (328 | ) | 17,559 | | (276 | ) |
Accumulated net realized gain (loss) | | (954 | ) | 6,863 | | (1,473 | ) | (32 | ) | 3,117 | | (568 | ) |
Net unrealized appreciation (depreciation) on investments and foreign currency | | (2,644 | ) | (1,064 | ) | (2,389 | ) | (1,206 | ) | (8,775 | ) | (587 | ) |
| | $ | 8,474 | | $ | 175,540 | | $ | 38,491 | | $ | 24,488 | | $ | 381,489 | | $ | 19,922 | |
Shares outstanding (no par value), unlimited shares authorized | | 1,228 | | 16,743 | | 4,154 | | 2,631 | | 37,335 | | 2,221 | |
Net asset value per share | | $ | 6.90 | | $ | 10.48 | | $ | 9.27 | | $ | 9.31 | | $ | 10.22 | | $ | 8.97 | |
(a) Investments - unaffiliated, at cost | | $ | 10,900 | | $ | 160,519 | | $ | 41,044 | | $ | 24,972 | | $ | 417,001 | | $ | 20,230 | |
(b) Investments - affiliated, at cost | | 241 | | 16,500 | | 178 | | 438 | | 26,633 | | 15 | |
(c) Total investments, at cost | | $ | 11,141 | | $ | 177,019 | | $ | 41,222 | | $ | 25,410 | | $ | 443,634 | | $ | 20,245 | |
(d) Including value of securities on loan | | $ | — | | $ | — | | $ | 259 | | $ | — | | $ | — | | $ | — | |
(e) Foreign currency, at cost | | 1 | | 85 | | 2 | | 3 | | 2,732 | | 218 | |
(f) Proceeds from securities sold short | | — | | — | | — | | — | | 59,845 | | — | |
(g) Premiums from options written | | — | | — | | — | | — | | 19 | | — | |
(h) Consolidated Statement of Assets and Liabilities. | | | | | | | | | | | | | |
See accompanying Notes to Financial Statements.
| | Curian/DFA
U.S. Micro
Cap Fund | | Curian/
DoubleLine
Total Return
Fund | | Curian/Eaton
Vance Global
Macro
Absolute
Return
Advantage
Fund | | Curian/Epoch
Global
Shareholder
Yield Fund | | Curian/
FAMCO Flex
Core Covered
Call Fund | | Curian
Focused
International
Equity Fund | |
Assets | | | | | | | | | | | | | |
Investments - unaffiliated, at value (a)(d) | | $ | 104,308 | | $ | 1,145,034 | | $ | 368,971 | | $ | 58,301 | | $ | 252,143 | | $ | 226,872 | |
Investments - affiliated, at value (b) | | 32 | | 86,863 | | 51,674 | | 1,522 | | 4,882 | | 9,724 | |
Total investments, at value (c) | | 104,340 | | 1,231,897 | | 420,645 | | 59,823 | | 257,025 | | 236,596 | |
Cash | | 2 | | 14 | | 1,133 | | 1 | | 50 | | 168 | |
Foreign currency (e) | | — | | — | | 1,419 | | 54 | | — | | 89 | |
Receivable for investments sold | | 33 | | — | | — | | 37 | | 2 | | 196 | |
Receivable for treasury roll transactions | | — | | — | | — | | — | | — | | — | |
Receivable for fund shares sold | | 126 | | 803 | | 30 | | 351 | | 357 | | 24 | |
Receivable from adviser | | — | | 121 | | — | | — | | — | | 4 | |
Receivable for dividends and interest | | 64 | | 3,900 | | 5,748 | | 189 | | 449 | | 113 | |
Receivable for variation margin on financial derivative instruments | | — | | — | | 224 | | — | | — | | — | |
Receivable for deposits with brokers and counterparties | | — | | — | | 13,617 | | — | | — | | — | |
Unrealized appreciation on forward foreign currency contracts | | — | | — | | 22,150 | | — | | — | | — | |
Unrealized appreciation on OTC swap agreements | | — | | — | | 8,797 | | — | | — | | — | |
OTC swap premiums paid | | — | | — | | 8,596 | | — | | — | | — | |
Other assets | | 1 | | 6 | | 3 | | — | | 1 | | 1 | |
Total assets | | 104,566 | | 1,236,741 | | 482,362 | | 60,455 | | 257,884 | | 237,191 | |
Liabilities | | | | | | | | | | | | | |
Cash overdraft | | — | | — | | — | | — | | — | | — | |
Payable for reverse repurchase agreements | | — | | — | | 1,354 | | — | | — | | — | |
Payable for advisory fees | | 62 | | 496 | | 337 | | 34 | | 124 | | 158 | |
Payable for administrative fees | | 16 | | 201 | | 71 | | 9 | | 41 | | 39 | |
Payable for 12b-1 fee | | 7 | | 92 | | 31 | | 4 | | 19 | | 18 | |
Payable for investment securities purchased | | — | | 15,457 | | 20 | | 39 | | — | | 788 | |
Payable for treasury roll transactions | | — | | — | | — | | — | | — | | — | |
Payable for fund shares redeemed | | 245 | | 116 | | 24 | | 4 | | 100 | | 15 | |
Payable for dividends or interest on securities sold short | | — | | — | | 357 | | — | | — | | — | |
Payable for interest expense and brokerage charges | | — | | — | | 1 | | — | | — | | — | |
Payable for trustee fees | | 12 | | 26 | | 17 | | 2 | | 7 | | 5 | |
Payable for chief compliance officer fees | | — | | 3 | | 1 | | — | | 1 | | 1 | |
Payable for other expenses | | 2 | | 32 | | 18 | | 1 | | 6 | | 9 | |
Payable for variation margin on financial derivative instruments | | — | | — | | 111 | | — | | — | | — | |
Due to brokers and counterparties for deposits | | — | | — | | 24,374 | | — | | — | | — | |
Investment in securities sold short, at value (f) | | — | | — | | 9,419 | | — | | — | | — | |
Options written, at value (g) | | — | | — | | 6,243 | | — | | 9,662 | | — | |
Unrealized depreciation on forward foreign currency contracts | | — | | — | | 11,613 | | — | | — | | — | |
Unrealized depreciation on OTC swap agreements | | — | | — | | 5,581 | | — | | — | | — | |
OTC swap premiums received | | — | | — | | 2,620 | | — | | — | | — | |
Payable upon return of securities loaned | | 11,007 | | — | | — | | 3,000 | | — | | 2,230 | |
Total liabilities | | 11,351 | | 16,423 | | 62,192 | | 3,093 | | 9,960 | | 3,263 | |
Net assets | | $ | 93,215 | | $ | 1,220,318 | | $ | 420,170 | | $ | 57,362 | | $ | 247,924 | | $ | 233,928 | |
Net assets consist of: | | | | | | | | | | | | | |
Paid-in capital | | $ | 45,168 | | $ | 1,173,365 | | $ | 406,668 | | $ | 52,447 | | $ | 224,742 | | $ | 237,624 | |
Undistributed (excess of distributions over) net investment income (loss) | | (37 | ) | 23,907 | | 19,670 | | 1,810 | | 2,912 | | 188 | |
Accumulated net realized gain (loss) | | 30,297 | | (2,036 | ) | (327 | ) | 605 | | (12,110 | ) | (1,205 | ) |
Net unrealized appreciation (depreciation) on investments and foreign currency | | 17,787 | | 25,082 | | (5,841 | ) | 2,500 | | 32,380 | | (2,679 | ) |
| | $ | 93,215 | | $ | 1,220,318 | | $ | 420,170 | | $ | 57,362 | | $ | 247,924 | | $ | 233,928 | |
Shares outstanding (no par value), unlimited shares authorized | | 6,916 | | 114,951 | | 42,153 | | 4,847 | | 20,068 | | 22,439 | |
Net asset value per share | | $ | 13.48 | | $ | 10.62 | | $ | 9.97 | | $ | 11.83 | | $ | 12.35 | | $ | 10.42 | |
(a) Investments - unaffiliated, at cost | | $ | 86,521 | | $ | 1,119,952 | | $ | 382,266 | | $ | 55,797 | | $ | 217,494 | | $ | 229,548 | |
(b) Investments - affiliated, at cost | | 32 | | 86,863 | | 51,674 | | 1,522 | | 4,882 | | 9,724 | |
(c) Total investments, at cost | | $ | 86,553 | | $ | 1,206,815 | | $ | 433,940 | | $ | 57,319 | | $ | 222,376 | | $ | 239,272 | |
(d) Including value of securities on loan | | $ | 10,620 | | $ | — | | $ | — | | $ | 2,882 | | $ | — | | $ | 2,176 | |
(e) Foreign currency, at cost | | — | | — | | 1,470 | | 55 | | — | | 90 | |
(f) Proceeds from securities sold short | | — | | — | | 8,072 | | — | | — | | — | |
(g) Premiums from options written | | — | | — | | 2,818 | | — | | 7,393 | | — | |
See accompanying Notes to Financial Statements.
| | Curian
Focused U.S.
Equity Fund | | Curian/
Franklin
Templeton
Frontier
Markets Fund | | Curian/
Franklin
Templeton
Natural
Resources
Fund | | Curian/Lazard
International
Strategic
Equity Fund | | Curian Long
Short Credit
Fund | | Curian/
Neuberger
Berman
Currency
Fund | |
Assets | | | | | | | | | | | | | |
Investments - unaffiliated, at value (a)(d) | | $ | 89,183 | | $ | 67,938 | | $ | 59,923 | | $ | 120,275 | | $ | 340,907 | | $ | 182,537 | |
Investments - affiliated, at value (b) | | 3,116 | | 2,470 | | 2,057 | | 5,994 | | 10,256 | | 9,965 | |
Total investments, at value (c) | | 92,299 | | 70,408 | | 61,980 | | 126,269 | | 351,163 | | 192,502 | |
Cash | | — | | 401 | | 3 | | — | | 1,278 | | — | |
Foreign currency (e) | | — | | 1,430 | | 106 | | 29 | | 54 | | — | |
Receivable for investments sold | | — | | 94 | | — | | 198 | | — | | — | |
Receivable for treasury roll transactions | | — | | — | | — | | — | | — | | — | |
Receivable for fund shares sold | | — | | 112 | | 138 | | 422 | | 21 | | 2 | |
Receivable from adviser | | 7 | | — | | — | | — | | — | | — | |
Receivable for dividends and interest | | 79 | | 231 | | 100 | | 136 | | 3,577 | | 322 | |
Receivable for variation margin on financial derivative instruments | | — | | — | | — | | — | | 30 | | — | |
Receivable for deposits with brokers and counterparties | | — | | — | | — | | — | | 2,472 | | — | |
Unrealized appreciation on forward foreign currency contracts | | — | | — | | — | | — | | — | | 30,979 | |
Unrealized appreciation on OTC swap agreements | | — | | — | | — | | — | | 107 | | — | |
OTC swap premiums paid | | — | | — | | — | | — | | 1,321 | | — | |
Other assets | | 1 | | 1 | | 1 | | 1 | | 3 | | 1 | |
Total assets | | 92,386 | | 72,677 | | 62,328 | | 127,055 | | 360,026 | | 223,806 | |
Liabilities | | | | | | | | | | | | | |
Cash overdraft | | — | | — | | — | | — | | — | | — | |
Payable for reverse repurchase agreements | | — | | — | | — | | — | | — | | — | |
Payable for advisory fees | | 47 | | 92 | | 41 | | 83 | | 285 | | 108 | |
Payable for administrative fees | | 13 | | 13 | | 11 | | 21 | | 60 | | 31 | |
Payable for 12b-1 fee | | 6 | | 5 | | 4 | | 9 | | 27 | | 14 | |
Payable for investment securities purchased | | — | | — | | — | | 1,711 | | 2,350 | | — | |
Payable for treasury roll transactions | | — | | — | | — | | — | | — | | — | |
Payable for fund shares redeemed | | — | | 197 | | 231 | | 83 | | 17 | | 70 | |
Payable for dividends or interest on securities sold short | | — | | — | | — | | — | | — | | — | |
Payable for interest expense and brokerage charges | | — | | — | | — | | — | | — | | — | |
Payable for trustee fees | | 2 | | 12 | | 12 | | 3 | | 12 | | 19 | |
Payable for chief compliance officer fees | | — | | — | | — | | — | | 1 | | — | |
Payable for other expenses | | 3 | | 3 | | 3 | | 1 | | 8 | | 3 | |
Payable for variation margin on financial derivative instruments | | — | | — | | — | | — | | 343 | | — | |
Due to brokers and counterparties for deposits | | — | | — | | — | | — | | — | | — | |
Investment in securities sold short, at value (f) | | — | | — | | — | | — | | — | | — | |
Options written, at value (g) | | — | | — | | — | | — | | — | | — | |
Unrealized depreciation on forward foreign currency contracts | | — | | — | | — | | — | | — | | 30,935 | |
Unrealized depreciation on OTC swap agreements | | — | | — | | — | | — | | 228 | | — | |
OTC swap premiums received | | — | | — | | — | | — | | 1,066 | | — | |
Payable upon return of securities loaned | | 9,511 | | 784 | | 5,247 | | 1,283 | | — | | — | |
Total liabilities | | 9,582 | | 1,106 | | 5,549 | | 3,194 | | 4,397 | | 31,180 | |
Net assets | | $ | 82,804 | | $ | 71,571 | | $ | 56,779 | | $ | 123,861 | | $ | 355,629 | | $ | 192,626 | |
Net assets consist of: | | | | | | | | | | | | | |
Paid-in capital | | $ | 81,092 | | $ | 63,168 | | $ | 61,944 | | $ | 121,854 | | $ | 362,931 | | $ | 188,588 | |
Undistributed (excess of distributions over) net investment income (loss) | | 279 | | 3,102 | | 992 | | 862 | | 11,470 | | 4,011 | |
Accumulated net realized gain (loss) | | 522 | | 11,527 | | 10,219 | | (777 | ) | (8,956 | ) | 3 | |
Net unrealized appreciation (depreciation) on investments and foreign currency | | 911 | | (6,226 | ) | (16,376 | ) | 1,922 | | (9,816 | ) | 24 | |
| | $ | 82,804 | | $ | 71,571 | | $ | 56,779 | | $ | 123,861 | | $ | 355,629 | | $ | 192,626 | |
Shares outstanding (no par value), unlimited shares authorized | | 7,294 | | 7,611 | | 9,486 | | 10,835 | | 36,658 | | 19,013 | |
Net asset value per share | | $ | 11.35 | | $ | 9.40 | | $ | 5.99 | | $ | 11.43 | | $ | 9.70 | | $ | 10.13 | |
(a) Investments - unaffiliated, at cost | | $ | 88,272 | | $ | 74,164 | | $ | 76,299 | | $ | 118,348 | | $ | 348,381 | | $ | 182,557 | |
(b) Investments - affiliated, at cost | | 3,116 | | 2,470 | | 2,057 | | 5,994 | | 10,256 | | 9,965 | |
(c) Total investments, at cost | | $ | 91,388 | | $ | 76,634 | | $ | 78,356 | | $ | 124,342 | | $ | 358,637 | | $ | 192,522 | |
(d) Including value of securities on loan | | $ | 9,253 | | $ | 774 | | $ | 5,068 | | $ | 1,222 | | $ | — | | $ | — | |
(e) Foreign currency, at cost | | — | | 1,427 | | 106 | | 29 | | 56 | | — | |
(f) Proceeds from securities sold short | | — | | — | | — | | — | | — | | — | |
(g) Premiums from options written | | — | | — | | — | | — | | — | | — | |
See accompanying Notes to Financial Statements.
| | Curian/
Neuberger
Berman Risk
Balanced
Commodity
Strategy (h)
Fund (h) | | Curian/
Nicholas
Convertible
Arbitrage
Fund | | Curian/
PIMCO Credit
Income Fund | | Curian/
PineBridge
Merger
Arbitrage
Fund | | Curian/
Schroder
Emerging
Europe Fund | | Curian/
T. Rowe Price
Capital
Appreciation
Fund | |
Assets | | | | | | | | | | | | | |
Investments - unaffiliated, at value (a)(d) | | $ | 172,388 | | $ | 447,371 | | $ | 90,993 | | $ | 74,554 | | $ | 12,751 | | $ | 96,523 | |
Investments - affiliated, at value (b) | | 628 | | 6,545 | | 817 | | 16,289 | | 374 | | 19,609 | |
Total investments, at value (c) | | 173,016 | | 453,916 | | 91,810 | | 90,843 | | 13,125 | | 116,132 | |
Cash | | — | | 196,563 | | — | | 26,250 | | — | | 223 | |
Foreign currency (e) | | — | | — | | 137 | | 358 | | 1 | | 197 | |
Receivable for investments sold | | — | | — | | 78 | | — | | — | | 231 | |
Receivable for treasury roll transactions | | — | | — | | 1,279 | | — | | — | | — | |
Receivable for fund shares sold | | 217 | | 25 | | 72 | | 49 | | 51 | | 737 | |
Receivable from adviser | | — | | — | | — | | — | | — | | 12 | |
Receivable for dividends and interest | | 178 | | 1,530 | | 818 | | 12 | | 138 | | 406 | |
Receivable for variation margin on financial derivative instruments | | 318 | | — | | 20 | | — | | — | | — | |
Receivable for deposits with brokers and counterparties | | 12,260 | | — | | 387 | | — | | — | | 166 | |
Unrealized appreciation on forward foreign currency contracts | | — | | — | | 295 | | — | | — | | 1 | |
Unrealized appreciation on OTC swap agreements | | — | | — | | 167 | | — | | — | | — | |
OTC swap premiums paid | | — | | — | | 112 | | — | | — | | — | |
Other assets | | 1 | | 3 | | 1 | | 1 | | — | | 1 | |
Total assets | | 185,990 | | 652,037 | | 95,176 | | 117,513 | | 13,315 | | 118,106 | |
Liabilities | | | | | | | | | | | | | |
Cash overdraft | | 1,154 | | — | | 448 | | — | | — | | — | |
Payable for reverse repurchase agreements | | — | | — | | — | | — | | — | | — | |
Payable for advisory fees | | 95 | | 315 | | 29 | | 79 | | 13 | | 64 | |
Payable for administrative fees | | 32 | | 73 | | 14 | | 18 | | 3 | | 19 | |
Payable for 12b-1 fee | | 14 | | 33 | | 7 | | 7 | | 1 | | 8 | |
Payable for investment securities purchased | | — | | — | | 1,634 | | 722 | | — | | 3,408 | |
Payable for treasury roll transactions | | — | | — | | 3,443 | | — | | — | | — | |
Payable for fund shares redeemed | | 34 | | 106 | | 21 | | 210 | | 2 | | 150 | |
Payable for dividends or interest on securities sold short | | — | | 6 | | — | | 17 | | — | | — | |
Payable for interest expense and brokerage charges | | — | | 97 | | — | | 61 | | — | | — | |
Payable for trustee fees | | 4 | | 39 | | 4 | | 15 | | 1 | | 2 | |
Payable for chief compliance officer fees | | — | | 1 | | — | | — | | — | | — | |
Payable for other expenses | | 9 | | 9 | | 1 | | 5 | | — | | 2 | |
Payable for variation margin on financial derivative instruments | | 4,698 | | — | | 7 | | — | | — | | — | |
Due to brokers and counterparties for deposits | | — | | — | | 7 | | — | | — | | | |
Investment in securities sold short, at value (f) | | — | | 211,262 | | — | | 24,259 | | — | | — | |
Options written, at value (g) | | — | | — | | 166 | | — | | — | | 516 | |
Unrealized depreciation on forward foreign currency contracts | | — | | — | | 223 | | — | | — | | — | |
Unrealized depreciation on OTC swap agreements | | — | | — | | 330 | | — | | — | | — | |
OTC swap premiums received | | — | | — | | 331 | | — | | — | | — | |
Payable upon return of securities loaned | | — | | 3,345 | | — | | — | | — | | 1,007 | |
Total liabilities | | 6,040 | | 215,286 | | 6,665 | | 25,393 | | 20 | | 5,176 | |
Net assets | | $ | 179,950 | | $ | 436,751 | | $ | 88,511 | | $ | 92,120 | | $ | 13,295 | | $ | 112,930 | |
Net assets consist of: | | | | | | | | | | | | | |
Paid-in capital | | $ | 226,555 | | $ | 447,910 | | $ | 85,684 | | $ | 90,945 | | $ | 18,351 | | $ | 106,932 | |
Undistributed (excess of distributions over) net investment income (loss) | | (131 | ) | (6,108 | ) | 2,214 | | (17 | ) | (13 | ) | (80 | ) |
Accumulated net realized gain (loss) | | (43,028 | ) | (9,256 | ) | (374 | ) | 907 | | (1,912 | ) | 955 | |
Net unrealized appreciation (depreciation) on investments and foreign currency | | (3,446 | ) | 4,205 | | 987 | | 285 | | (3,131 | ) | 5,123 | |
| | $ | 179,950 | | $ | 436,751 | | $ | 88,511 | | $ | 92,120 | | $ | 13,295 | | $ | 112,930 | |
Shares outstanding (no par value), unlimited shares authorized | | 23,242 | | 42,932 | | 8,090 | | 9,200 | | 1,834 | | 9,919 | |
Net asset value per share | | $ | 7.74 | | $ | 10.17 | | $ | 10.94 | | $ | 10.01 | | $ | 7.25 | | $ | 11.38 | |
(a) Investments - unaffiliated, at cost | | $ | 172,536 | | $ | 430,464 | | $ | 90,070 | | $ | 73,388 | | $ | 15,880 | | $ | 91,158 | |
(b) Investments - affiliated, at cost | | 628 | | 6,545 | | 817 | | 16,289 | | 374 | | 19,632 | |
(c) Total investments, at cost | | $ | 173,164 | | $ | 437,009 | | $ | 90,887 | | $ | 89,677 | | $ | 16,254 | | $ | 110,790 | |
(d) Including value of securities on loan | | $ | — | | $ | 3,272 | | $ | — | | $ | — | | $ | — | | $ | 977 | |
(e) Foreign currency, at cost | | — | | — | | 139 | | 377 | | 1 | | 199 | |
(f) Proceeds from securities sold short | | — | | 198,561 | | — | | 23,398 | | — | | — | |
(g) Premiums from options written | | — | | — | | 282 | | — | | — | | 250 | |
(h) Consolidated Statement of Assets and Liabilities. | | | | | |
See accompanying Notes to Financial Statements.
| | Curian/The
Boston
Company
Equity Income
Fund | | Curian/UBS
Global Long
Short Fixed
Income
Opportunities
Fund | | Curian/
Van Eck
International
Gold Fund (h) | |
Assets | | | | | | | |
Investments - unaffiliated, at value (a)(d) | | $ | 60,781 | | $ | 167,412 | | $ | 88,605 | |
Investments - affiliated, at value (b) | | 569 | | 227 | | 2,862 | |
Repurchase Agreements (a) | | 3,182 | | — | | 9,761 | |
Total investments, at value (c) | | 64,532 | | 167,639 | | 101,228 | |
Cash | | — | | 1,869 | | — | |
Foreign currency (e) | | — | | 1,439 | | 32 | |
Receivable for investments sold | | — | | — | | — | |
Receivable for treasury roll transactions | | — | | — | | — | |
Receivable for fund shares sold | | 146 | | 47 | | 105 | |
Receivable from adviser | | — | | — | | — | |
Receivable for dividends and interest | | 117 | | 2,201 | | 26 | |
Receivable for variation margin on financial derivative instruments | | — | | 252 | | — | |
Receivable for deposits with brokers and counterparties | | — | | 6,159 | | — | |
Unrealized appreciation on forward foreign currency contracts | | — | | 1,114 | | — | |
Unrealized appreciation on OTC swap agreements | | — | | 3,363 | | — | |
OTC swap premiums paid | | — | | 475 | | — | |
Other assets | | — | | 1 | | 1 | |
Total assets | | 64,795 | | 184,559 | | 101,392 | |
Liabilities | | | | | | | |
Cash overdraft | | — | | — | | — | |
Payable for reverse repurchase agreements | | — | | — | | — | |
Payable for advisory fees | | 28 | | 150 | | 54 | |
Payable for administrative fees | | 10 | | 32 | | 14 | |
Payable for 12b-1 fee | | 5 | | 13 | | 6 | |
Payable for investment securities purchased | | — | | — | | — | |
Payable for treasury roll transactions | | — | | — | | — | |
Payable for fund shares redeemed | | 4 | | 97 | | 98 | |
Payable for dividends or interest on securities sold short | | — | | — | | — | |
Payable for interest expense and brokerage charges | | — | | — | | — | |
Payable for trustee fees | | 2 | | 6 | | 9 | |
Payable for chief compliance officer fees | | — | | — | | — | |
Payable for other expenses | | 1 | | 15 | | 3 | |
Payable for variation margin on financial derivative instruments | | — | | 162 | | — | |
Due to brokers and counterparties for deposits | | — | | 871 | | — | |
Investment in securities sold short, at value (f) | | — | | — | | — | |
Options written, at value (g) | | — | | 3,927 | | — | |
Unrealized depreciation on forward foreign currency contracts | | — | | 197 | | — | |
Unrealized depreciation on OTC swap agreements | | — | | 2,851 | | — | |
OTC swap premiums received | | — | | 3,218 | | — | |
Payable upon return of securities loaned | | 3,282 | | — | | 19,761 | |
Total liabilities | | 3,332 | | 11,539 | | 19,945 | |
Net assets | | $ | 61,463 | | $ | 173,020 | | $ | 81,447 | |
Net assets consist of: | | | | | | | |
Paid-in capital | | $ | 52,013 | | $ | 181,987 | | $ | 156,702 | |
Undistributed (excess of distributions over) net investment income (loss) | | 586 | | 2,323 | | 461 | |
Accumulated net realized gain (loss) | | 3,082 | | 1,162 | | (56,930 | ) |
Net unrealized appreciation (depreciation) on investments and foreign currency | | 5,782 | | (12,452 | ) | (18,786 | ) |
| | $ | 61,463 | | $ | 173,020 | | $ | 81,447 | |
Shares outstanding (no par value), unlimited shares authorized | | 4,279 | | 18,183 | | 18,561 | |
Net asset value per share | | $ | 14.36 | | $ | 9.52 | | $ | 4.39 | |
(a) Investments - unaffiliated, at cost | | $ | 58,181 | | $ | 176,992 | | $ | 117,151 | |
(b) Investments - affiliated, at cost | | 569 | | 227 | | 2,862 | |
(c) Total investments, at cost | | $ | 58,750 | | $ | 177,219 | | $ | 120,013 | |
(d) Including value of securities on loan | | $ | 3,194 | | $ | — | | $ | 18,774 | |
(e) Foreign currency, at cost | | — | | 1,417 | | 33 | |
(f) Proceeds from securities sold short | | — | | — | | — | |
(g) Premiums from options written | | — | | 5,287 | | — | |
(h) Consolidated Statement of Assets and Liabilities. | | | | | | | |
See accompanying Notes to Financial Statements.
Curian Variable Series Trust Sub-Advised Funds
Statements of Operations (in thousands)
For the Year Ended December 31, 2014
| | Curian Tactical
Advantage 35
Fund | | Curian Tactical
Advantage 60
Fund | | Curian Tactical
Advantage 75
Fund | | Curian
Dynamic Risk
Advantage -
Diversified
Fund | | Curian
Dynamic Risk
Advantage -
Growth Fund | | Curian
Dynamic Risk
Advantage -
Income Fund | |
Investment income | | | | | | | | | | | | | |
Dividends (a) | | $ | 1,046 | | $ | 2,391 | | $ | 2,103 | | $ | 864 | | $ | 3 | | $ | 5,493 | |
Foreign taxes withheld | | — | | — | | — | | — | | — | | — | |
Interest | | — | | — | | — | | 117 | | 25 | | — | |
Securities lending | | 110 | | 230 | | 180 | | 158 | | 25 | | 754 | |
Total investment income | | 1,156 | | 2,621 | | 2,283 | | 1,139 | | 53 | | 6,247 | |
| | | | | | | | | | | | | |
Expenses | | | | | | | | | | | | | |
Advisory fees | | 338 | | 798 | | 698 | | 2,923 | | 506 | | 1,373 | |
Administrative fees | | 90 | | 213 | | 186 | | 687 | | 119 | | 323 | |
12b-1 fees | | 113 | | 266 | | 233 | | 859 | | 149 | | 404 | |
Legal fees | | 2 | | 4 | | 3 | | 14 | | 2 | | 6 | |
Trustee fees | | 4 | | 10 | | 9 | | 34 | | 6 | | 16 | |
Dividends or interest on securities sold short | | — | | — | | — | | — | | — | | — | |
Short holdings borrowing fees | | — | | — | | — | | — | | — | | — | |
Chief compliance officer fees | | — | | — | | — | | — | | — | | — | |
Other expenses | | 1 | | 2 | | 3 | | 10 | | 2 | | 4 | |
Total expenses | | 548 | | 1,293 | | 1,132 | | 4,527 | | 784 | | 2,126 | |
Expense waived by Adviser | | (135 | ) | (319 | ) | (279 | ) | (241 | ) | (42 | ) | (565 | ) |
Net expenses | | 413 | | 974 | | 853 | | 4,286 | | 742 | | 1,561 | |
Net investment income (loss) | | 743 | | 1,647 | | 1,430 | | (3,147 | ) | (689 | ) | 4,686 | |
| | | | | | | | | | | | | |
Realized and unrealized gain (loss) | | | | | | | | | | | | | |
Net realized gain (loss) on: | | | | | | | | | | | | | |
Unaffiliated investments | | 570 | | 2,477 | | 2,553 | | 1,101 | | (702 | ) | 5,343 | |
Affiliated investments | | — | | — | | — | | — | | — | | — | |
Swap agreements | | — | | — | | — | | 13,755 | | (972 | ) | — | |
Foreign currency related items | | — | | — | | — | | (1,331 | ) | — | | — | |
Futures contracts | | — | | — | | — | | 2,924 | | 118 | | — | |
Written option contracts | | — | | — | | — | | — | | — | | — | |
Investment securities sold short | | — | | — | | — | | — | | — | | — | |
Brokerage commissions recaptured | | — | | — | | — | | — | | — | | — | |
Net change in unrealized appreciation (depreciation) on: | | | | | | | | | | | | | |
Investments | | 462 | | 783 | | 257 | | (633 | ) | (41 | ) | 2,584 | |
OTC swap agreements | | — | | — | | — | | 1,712 | | 161 | | — | |
Foreign currency related items | | — | | — | | — | | (48 | ) | — | | — | |
Futures contracts and centrally cleared swap agreements | | — | | — | | — | | 2,001 | | (447 | ) | — | |
Written option contracts | | — | | — | | — | | — | | — | | — | |
Investment securities sold short | | — | | — | | — | | — | | — | | — | |
Net realized and unrealized gain (loss) | | 1,032 | | 3,260 | | 2,810 | | 19,481 | | (1,883 | ) | 7,927 | |
Net increase (decrease) in net assets from operations | | $ | 1,775 | | $ | 4,907 | | $ | 4,240 | | $ | 16,334 | | $ | (2,572 | ) | $ | 12,613 | |
(a) Income from affiliated investments | | $ | — | | $ | — | | $ | — | | $ | 3 | | $ | 1 | | $ | — | |
See accompanying Notes to Financial Statements.
| | Curian/
Aberdeen Latin
America Fund | | Curian/AQR
Risk Parity
Fund (b) | | Curian/
Ashmore
Emerging
Market Small
Cap Equity
Fund | | Curian/Baring
International
Fixed Income
Fund | | Curian/
BlackRock
Global Long
Short Credit
Fund | | Curian/
CenterSquare
International
Real Estate
Securities Fund | |
Investment income | | | | | | | | | | | | | |
Dividends (a) | | $ | 314 | | $ | 3 | | $ | 599 | | $ | — | | $ | 703 | | $ | 622 | |
Foreign taxes withheld | | (27 | ) | — | | (75 | ) | — | | (12 | ) | (54 | ) |
Interest | | — | | 1,808 | | — | | 489 | | 14,757 | | — | |
Securities lending | | — | | — | | 3 | | — | | — | | — | |
Total investment income | | 287 | | 1,811 | | 527 | | 489 | | 15,448 | | 568 | |
| | | | | | | | | | | | | |
Expenses | | | | | | | | | | | | | |
Advisory fees | | 136 | | 2,326 | | 345 | | 136 | | 3,541 | | 138 | |
Administrative fees | | 20 | | 547 | | 63 | | 45 | | 746 | | 34 | |
12b-1 fees | | 25 | | 684 | | 78 | | 57 | | 932 | | 43 | |
Legal fees | | — | | 12 | | 1 | | 1 | | 15 | | 1 | |
Trustee fees | | 1 | | 27 | | 3 | | 2 | | 37 | | 2 | |
Dividends or interest on securities sold short | | — | | — | | — | | — | | 2,819 | | — | |
Short holdings borrowing fees | | — | | — | | — | | — | | 44 | | — | |
Chief compliance officer fees | | — | | — | | — | | — | | — | | — | |
Other expenses | | 2 | | 40 | | 4 | | 2 | | 46 | | 2 | |
Total expenses | | 184 | | 3,636 | | 494 | | 243 | | 8,180 | | 220 | |
Expense waived by Adviser | | — | | (547 | ) | — | | — | | — | | — | |
Net expenses | | 184 | | 3,089 | | 494 | | 243 | | 8,180 | | 220 | |
Net investment income (loss) | | 103 | | (1,278 | ) | 33 | | 246 | | 7,268 | | 348 | |
| | | | | | | | | | | | | |
Realized and unrealized gain (loss) | | | | | | | | | | | | | |
Net realized gain (loss) on: | | | | | | | | | | | | | |
Unaffiliated investments | | (867 | ) | 692 | | (690 | ) (c) | (29 | ) | 13,389 | | (97 | ) |
Affiliated investments | | — | | — | | — | | — | | 10 | | — | |
Swap agreements | | — | | 684 | | — | | — | | (1,449 | ) | — | |
Foreign currency related items | | 20 | | 4,571 | | (4 | ) | (256 | ) | 11,465 | | (17 | ) |
Futures contracts | | — | | 18,780 | | — | | — | | (6,980 | ) | — | |
Written option contracts | | — | | — | | — | | — | | (61 | ) | — | |
Investment securities sold short | | — | | — | | — | | — | | (4,304 | ) | — | |
Brokerage commissions recaptured | | — | | — | | — | | — | | — | | — | |
Net change in unrealized appreciation (depreciation) on: | | | | | | | | | | | | | |
Investments | | (871 | ) | (1,069 | ) | (3,504 | ) (d) | (996 | ) | (19,888 | ) | (191 | ) |
OTC swap agreements | | — | | 1,722 | | — | | — | | (269 | ) | — | |
Foreign currency related items | | — | | 687 | | 1 | | 169 | | 7,443 | | (2 | ) |
Futures contracts and centrally cleared swap agreements | | — | | 1,081 | | — | | — | | (1,759 | ) | — | |
Written option contracts | | — | | — | | — | | — | | (27 | ) | — | |
Investment securities sold short | | — | | — | | — | | — | | (738 | ) | — | |
Net realized and unrealized gain (loss) | | (1,718 | ) | 27,148 | | (4,197 | ) | (1,112 | ) | (3,168 | ) | (307 | ) |
Net increase (decrease) in net assets from operations | | $ | (1,615 | ) | $ | 25,870 | | $ | (4,164 | ) | $ | (866 | ) | $ | 4,100 | | $ | 41 | |
(a) Income from affiliated investments | | $ | — | | $ | 3 | | $ | — | | $ | — | | $ | 2 | | $ | — | |
(b) Consolidated Statement of Operations.
(c) Net of foreign capital gains taxes.
(d) Net of deferred foreign capital gains taxes.
See accompanying Notes to Financial Statements.
| | Curian/DFA
U.S. Micro Cap
Fund | | Curian/
DoubleLine
Total Return
Fund | | Curian/Eaton
Vance Global
Macro Absolute
Return
Advantage
Fund | | Curian/Epoch
Global
Shareholder
Yield Fund | | Curian/FAMCO
Flex Core
Covered Call
Fund | | Curian
Focused
International
Equity Fund | |
Investment income | | | | | | | | | | | | | |
Dividends (a) | | $ | 1,511 | | $ | 11 | | $ | 65 | | $ | 2,350 | | $ | 4,962 | | $ | 1,900 | |
Foreign taxes withheld | | — | | — | | (292 | ) | (74 | ) | — | | (249 | ) |
Interest | | — | | 35,535 | | 19,545 | | — | | — | | — | |
Securities lending | | 167 | | — | | — | | 34 | | — | | — | |
Total investment income | | 1,678 | | 35,546 | | 19,318 | | 2,310 | | 4,962 | | 1,651 | |
| | | | | | | | | | | | | |
Expenses | | | | | | | | | | | | | |
Advisory fees | | 1,112 | | 4,387 | | 3,784 | | 324 | | 1,152 | | 917 | |
Administrative fees | | 278 | | 1,764 | | 796 | | 92 | | 384 | | 230 | |
12b-1 fees | | 347 | | 2,204 | | 996 | | 116 | | 480 | | 287 | |
Legal fees | | 7 | | 30 | | 16 | | 2 | | 7 | | 3 | |
Trustee fees | | 14 | | 82 | | 39 | | 4 | | 17 | | 10 | |
Dividends or interest on securities sold short | | — | | — | | 609 | | — | | — | | — | |
Short holdings borrowing fees | | — | | — | | 45 | | — | | — | | — | |
Chief compliance officer fees | | — | | — | | — | | — | | — | | — | |
Other expenses | | 7 | | 79 | | 50 | | 1 | | 9 | | 12 | |
Total expenses | | 1,765 | | 8,546 | | 6,335 | | 539 | | 2,049 | | 1,459 | |
Expense waived by Adviser | | — | | (1,058 | ) | — | | — | | — | | (23 | ) |
Net expenses | | 1,765 | | 7,488 | | 6,335 | | 539 | | 2,049 | | 1,436 | |
Net investment income (loss) | | (87 | ) | 28,058 | | 12,983 | | 1,771 | | 2,913 | | 215 | |
| | | | | | | | | | | | | |
Realized and unrealized gain (loss) | | | | | | | | | | | | | |
Net realized gain (loss) on: | | | | | | | | | | | | | |
Unaffiliated investments | | 31,335 | | (6,128 | ) | 2,994 | | 763 | | (239 | ) | (1,205 | ) |
Affiliated investments | | — | | — | | — | | — | | — | | — | |
Swap agreements | | — | | — | | (1,271 | ) | — | | — | | — | |
Foreign currency related items | | — | | — | | 11,443 | | (17 | ) | — | | (26 | ) |
Futures contracts | | (970 | ) | — | | (5,466 | ) | — | | — | | — | |
Written option contracts | | — | | — | | 617 | | — | | (8,635 | ) | — | |
Investment securities sold short | | — | | — | | (395 | ) | — | | — | | — | |
Brokerage commissions recaptured | | — | | — | | — | | 2 | | — | | — | |
Net change in unrealized appreciation (depreciation) on: | | | | | | | | | | | | | |
Investments | | (31,302 | ) | 28,521 | | (9,048 | ) | (258 | ) | 26,356 | | (3,003 | ) |
OTC swap agreements | | — | | — | | 986 | | — | | — | | — | |
Foreign currency related items | | — | | — | | 12,755 | | (5 | ) | — | | (3 | ) |
Futures contracts and centrally cleared swap agreements | | — | | — | | (2,569 | ) | — | | — | | — | |
Written option contracts | | — | | — | | (3,356 | ) | — | | (2,525 | ) | — | |
Investment securities sold short | | — | | — | | (435 | ) | — | | — | | — | |
Net realized and unrealized gain (loss) | | (937 | ) | 22,393 | | 6,255 | | 485 | | 14,957 | | (4,237 | ) |
Net increase (decrease) in net assets from operations | | $ | (1,024 | ) | $ | 50,451 | | $ | 19,238 | | $ | 2,256 | | $ | 17,870 | | $ | (4,022 | ) |
(a) Income from affiliated investments | | $ | — | | $ | 11 | | $ | 5 | | $ | — | | $ | 1 | | $ | 1 | |
See accompanying Notes to Financial Statements.
| | Curian
Focused U.S.
Equity Fund | | Curian/Franklin
Templeton
Frontier
Markets Fund | | Curian/Franklin
Templeton
Natural
Resources
Fund | | Curian/Lazard
International
Strategic Equity
Fund | | Curian Long
Short Credit
Fund | | Curian/
Neuberger
Berman
Currency Fund | |
Investment income | | | | | | | | | | | | | |
Dividends (a) | | $ | 681 | | $ | 6,256 | | $ | 2,292 | | $ | 2,150 | | $ | 616 | | $ | 1 | |
Foreign taxes withheld | | — | | (472 | ) | (20 | ) | (194 | ) | (6 | ) | — | |
Interest | | — | | — | | 71 | | — | | 16,428 | | 105 | |
Securities lending | | 45 | | 8 | | 101 | | — | | — | | — | |
Total investment income | | 726 | | 5,792 | | 2,444 | | 1,956 | | 17,038 | | 106 | |
| | | | | | | | | | | | | |
Expenses | | | | | | | | | | | | | |
Advisory fees | | 296 | | 1,868 | | 1,145 | | 683 | | 3,580 | | 902 | |
Administrative fees | | 84 | | 266 | | 286 | | 170 | | 754 | | 258 | |
12b-1 fees | | 106 | | 334 | | 358 | | 213 | | 942 | | 322 | |
Legal fees | | 1 | | 6 | | 7 | | 3 | | 16 | | 5 | |
Trustee fees | | 4 | | 14 | | 14 | | 8 | | 37 | | 13 | |
Dividends or interest on securities sold short | | — | | — | | — | | — | | — | | — | |
Short holdings borrowing fees | | — | | — | | — | | — | | — | | — | |
Chief compliance officer fees | | — | | — | | — | | — | | — | | — | |
Other expenses | | 2 | | 12 | | — | | 5 | | 41 | | 6 | |
Total expenses | | 493 | | 2,500 | | 1,810 | | 1,082 | | 5,370 | | 1,506 | |
Expense waived by Adviser | | (46 | ) | — | | — | | — | | — | | — | |
Net expenses | | 447 | | 2,500 | | 1,810 | | 1,082 | | 5,370 | | 1,506 | |
Net investment income (loss) | | 279 | | 3,292 | | 634 | | 874 | | 11,668 | | (1,400 | ) |
| | | | | | | | | | | | | |
Realized and unrealized gain (loss) | | | | | | | | | | | | | |
Net realized gain (loss) on: | | | | | | | | | | | | | |
Unaffiliated investments | | 519 | | 11,523 | | 13,297 | | (739 | ) | 3,971 | | 3 | |
Affiliated investments | | — | | — | | — | | — | | — | | — | |
Swap agreements | | — | | — | | — | | — | | (1,195 | ) | — | |
Foreign currency related items | | — | | (145 | ) | (8 | ) | (42 | ) | (14 | ) | 4,972 | |
Futures contracts | | — | | — | | — | | — | | (8,482 | ) | — | |
Written option contracts | | — | | — | | — | | — | | — | | — | |
Investment securities sold short | | — | | — | | — | | — | | — | | — | |
Brokerage commissions recaptured | | 3 | | 4 | | 4 | | — | | — | | — | |
Net change in unrealized appreciation (depreciation) on: | | | | | | | | | | | | | |
Investments | | 399 | | (28,554 | ) | (26,950 | ) | (1,997 | ) | (4,520 | ) | (22 | ) |
OTC swap agreements | | — | | — | | — | | — | | (42 | ) | — | |
Foreign currency related items | | — | | (3 | ) | 3 | | (5 | ) | (4 | ) | 509 | |
Futures contracts and centrally cleared swap agreements | | — | | — | | — | | — | | (6,160 | ) | — | |
Written option contracts | | — | | — | | — | | — | | — | | — | |
Investment securities sold short | | — | | — | | — | | — | | — | | — | |
Net realized and unrealized gain (loss) | | 921 | | (17,175 | ) | (13,654 | ) | (2,783 | ) | (16,446 | ) | 5,462 | |
Net increase (decrease) in net assets from operations | | $ | 1,200 | | $ | (13,883 | ) | $ | (13,020 | ) | $ | (1,909 | ) | $ | (4,778 | ) | $ | 4,062 | |
(a) Income from affiliated investments | | $ | 1 | | $ | — | | $ | — | | $ | 1 | | $ | 2 | | $ | 1 | |
See accompanying Notes to Financial Statements.
| | Curian/
Neuberger
Berman Risk
Balanced
Commodity
Strategy
Fund (b) (c) | | Curian/
Nicholas
Convertible
Arbitrage Fund | | Curian/PIMCO
Credit Income
Fund | | Curian/
PineBridge
Merger
Arbitrage Fund | | Curian/
Schroder
Emerging
Europe Fund | | Curian/T. Rowe
Price Capital
Appreciation
Fund | |
Investment income | | | | | | | | | | | | | |
Dividends (a) | | $ | 1 | | $ | 531 | | $ | 33 | | $ | 1,398 | | $ | 786 | | $ | 700 | |
Foreign taxes withheld | | — | | — | | (3 | ) | (42 | ) | (102 | ) | (4 | ) |
Net interest (amortization) | | 336 | | (8,445 | ) | 2,072 | | 57 | | — | | 532 | |
Securities lending | | — | | 13 | | — | | — | | — | | — | |
Total investment income | | 337 | | (7,901 | ) | 2,102 | | 1,413 | | 684 | | 1,228 | |
| | | | | | | | | | | | | |
Expenses | | | | | | | | | | | | | |
Advisory fees | | 740 | | 3,130 | | 278 | | 1,848 | | 197 | | 471 | |
Administrative fees | | 247 | | 736 | | 139 | | 435 | | 35 | | 134 | |
12b-1 fees | | 308 | | 920 | | 174 | | 544 | | 45 | | 168 | |
Legal fees | | 4 | | 13 | | 2 | | 10 | | 1 | | 2 | |
Trustee fees | | 13 | | 34 | | 6 | | 22 | | 2 | | 6 | |
Dividends or interest on securities sold short | | — | | 701 | | — | | 856 | | — | | — | |
Short holdings borrowing fees and interest expense | | — | | 1,222 | | 2 | | 494 | | — | | — | |
Chief compliance officer fees | | — | | — | | — | | — | | — | | — | |
Other expenses | | 10 | | — | | 2 | | 4 | | 9 | | 5 | |
Total expenses | | 1,322 | | 6,756 | | 603 | | 4,213 | | 289 | | 786 | |
Expense waived by Adviser | | — | | — | | — | | — | | — | | (91 | ) |
Net expenses | | 1,322 | | 6,756 | | 603 | | 4,213 | | 289 | | 695 | |
Net investment income (loss) | | (985 | ) | (14,657 | ) | 1,499 | | (2,800 | ) | 395 | | 533 | |
| | | | | | | | | | | | | |
Realized and unrealized gain (loss) | | | | | | | | | | | | | |
Net realized gain (loss) on: | | | | | | | | | | | | | |
Unaffiliated investments | | 1 | | 25,654 | | 636 | | 6,524 | | (1,507 | ) | 3,768 | |
Affiliated investments | | — | | — | | — | | — | | — | | — | |
Swap agreements | | — | | — | | 220 | | — | | — | | — | |
Foreign currency related items | | — | | (2 | ) | 704 | | (59 | ) | (4 | ) | (2 | ) |
Futures contracts | | (43,029 | ) | — | | 9 | | — | | — | | (90 | ) |
Written option contracts | | — | | — | | 171 | | — | | — | | 28 | |
Investment securities sold short and forward sales commitments | | — | | (22,229 | ) | 6 | | (3,912 | ) | — | | — | |
Brokerage commissions recaptured | | — | | 1 | | — | | — | | — | | — | |
Net change in unrealized appreciation (depreciation) on: | | | | | | | | | | | | | |
Investments | | (148 | ) | 1,232 | | 1,182 | | (1,252 | ) | (3,997 | ) | 3,818 | |
OTC swap agreements | | — | | — | | (45 | ) | — | | — | | — | |
Foreign currency related items | | — | | (1 | ) | 92 | | (11 | ) | (2 | ) | (1 | ) |
Futures contracts and centrally cleared swap agreements | | (3,298 | ) | — | | (24 | ) | — | | — | | 49 | |
Written option contracts | | — | | — | | 134 | | — | | — | | (253 | ) |
Investment securities sold short | | — | | 1,436 | | — | | (231 | ) | — | | — | |
Net realized and unrealized gain (loss) | | (46,474 | ) | 6,091 | | 3,085 | | 1,059 | | (5,510 | ) | 7,317 | |
Net increase (decrease) in net assets from operations | | $ | (47,459 | ) | $ | (8,566 | ) | $ | 4,584 | | $ | (1,741 | ) | $ | (5,115 | ) | $ | 7,850 | |
(a) Income from affiliated investments | | $ | 1 | | $ | 3 | | $ | — | | $ | 2 | | $ | — | | $ | 47 | |
(b) Period from April 28, 2014 (commencement of operations).
(c) Consolidated Statement of Operations.
See accompanying Notes to Financial Statements.
| | Curian/The
Boston
Company
Equity Income
Fund | | Curian/UBS
Global Long
Short Fixed
Income
Opportunities
Fund | | Curian/Van Eck
International
Gold Fund (b) | |
Investment income | | | | | | | |
Dividends (a) | | $ | 1,086 | | $ | 1 | | $ | 747 | |
Foreign taxes withheld | | — | | — | | (27 | ) |
Interest | | — | | 8,053 | | — | |
Securities lending | | 9 | | — | | 92 | |
Total investment income | | 1,095 | | 8,054 | | 812 | |
| | | | | | | |
Expenses | | | | | | | |
Advisory fees | | 271 | | 1,928 | | 993 | |
Administrative fees | | 98 | | 406 | | 249 | |
12b-1 fees | | 123 | | 507 | | 310 | |
Legal fees | | 2 | | 8 | | 5 | |
Trustee fees | | 5 | | 19 | | 12 | |
Dividends or interest on securities sold short | | — | | — | | — | |
Short holdings borrowing fees | | — | | — | | — | |
Chief compliance officer fees | | — | | — | | — | |
Other expenses | | — | | 37 | | 8 | |
Total expenses | | 499 | | 2,905 | | 1,577 | |
Expense waived by Adviser | | — | | — | | — | |
Net expenses | | 499 | | 2,905 | | 1,577 | |
Net investment income (loss) | | 596 | | 5,149 | | (765 | ) |
| | | | | | | |
Realized and unrealized gain (loss) | | | | | | | |
Net realized gain (loss) on: | | | | | | | |
Unaffiliated investments | | 3,116 | | (8,995 | ) | (33,974 | ) |
Affiliated investments | | — | | — | | — | |
Swap agreements | | — | | (3,378 | ) | — | |
Foreign currency related items | | — | | 3,694 | | 40 | |
Futures contracts | | — | | 5,021 | | — | |
Written option contracts | | — | | 2,344 | | — | |
Investment securities sold short | | — | | — | | — | |
Brokerage commissions recaptured | | 4 | | — | | 7 | |
Net change in unrealized appreciation (depreciation) on: | | | | | | | |
Investments | | 1,662 | | (8,623 | ) | 37,919 | |
OTC swap agreements | | — | | (2,038 | ) | — | |
Foreign currency related items | | — | | 804 | | (1 | ) |
Futures contracts and centrally cleared swap agreements | | — | | (4,735 | ) | — | |
Written option contracts | | — | | 1,685 | | — | |
Investment securities sold short | | — | | — | | — | |
Net realized and unrealized gain (loss) | | 4,782 | | (14,221 | ) | 3,991 | |
Net increase (decrease) in net assets from operations | | $ | 5,378 | | $ | (9,072 | ) | $ | 3,226 | |
(a) Income from affiliated investments | | $ | — | | $ | 1 | | $ | — | |
(b) Consolidated Statement of Operations.
See accompanying Notes to Financial Statements.
Curian Variable Series Trust Sub-Advised Funds
Statements of Changes in Net Assets (in thousands)
For the Year Ended December 31, 2014
| | Curian
Tactical
Advantage 35
Fund | | Curian
Tactical
Advantage 60
Fund | | Curian
Tactical
Advantage 75
Fund | | Curian
Dynamic Risk
Advantage -
Diversified
Fund | | Curian
Dynamic Risk
Advantage -
Growth Fund | | Curian
Dynamic Risk
Advantage -
Income Fund | |
Operations | | | | | | | | | | | | | |
Net investment income (loss) | | $ | 743 | | $ | 1,647 | | $ | 1,430 | | $ | (3,147 | ) | $ | (689 | ) | $ | 4,686 | |
Net realized gain (loss) | | 570 | | 2,477 | | 2,553 | | 16,449 | | (1,556 | ) | 5,343 | |
Net change in unrealized appreciation (depreciation) | | 462 | | 783 | | 257 | | 3,032 | | (327 | ) | 2,584 | |
Net increase (decrease) in net assets from operations | | 1,775 | | 4,907 | | 4,240 | | 16,334 | | (2,572 | ) | 12,613 | |
Distributions to shareholders | | | | | | | | | | | | | |
From net investment income | | (387 | ) | (769 | ) | (632 | ) | — | | — | | (3,257 | ) |
From net realized gain | | (1,231 | ) | (3,780 | ) | (3,984 | ) | (230 | ) | (297 | ) | (1,731 | ) |
Total distributions to shareholders | | (1,618 | ) | (4,549 | ) | (4,616 | ) | (230 | ) | (297 | ) | (4,988 | ) |
Share transactions(1) | | | | | | | | | | | | | |
Proceeds from sale of shares | | 22,413 | | 44,644 | | 48,424 | | 137,773 | | 28,404 | | 55,540 | |
Proceeds in connection with acquisition | | — | | — | | — | | — | | — | | — | |
Reinvestment of distributions | | 1,618 | | 4,549 | | 4,616 | | 230 | | 297 | | 4,988 | |
Cost of shares redeemed | | (10,476 | ) | (17,362 | ) | (22,590 | ) | (159,311 | ) | (22,673 | ) | (43,643 | ) |
Change in net assets from share transactions | | 13,555 | | 31,831 | | 30,450 | | (21,308 | ) | 6,028 | | 16,885 | |
Change in net assets | | 13,712 | | 32,189 | | 30,074 | | (5,204 | ) | 3,159 | | 24,510 | |
Net assets beginning of year | | 37,509 | | 88,092 | | 74,997 | | 355,550 | | 57,500 | | 156,965 | |
Net assets end of year | | $ | 51,221 | | $ | 120,281 | | $ | 105,071 | | $ | 350,346 | | $ | 60,659 | | $ | 181,475 | |
Undistributed (excess of distributions over) net investment income (loss) | | $ | 762 | | $ | 1,669 | | $ | 1,428 | | $ | 171 | | $ | (5 | ) | $ | 4,681 | |
(1) Share transactions | | | | | | | | | | | | | |
Shares sold | | 2,003 | | 3,728 | | 3,862 | | 13,100 | | 3,086 | | 5,115 | |
Shares issued in connection with acquisition | | — | | — | | — | | — | | — | | — | |
Reinvestment of distributions | | 145 | | 379 | | 368 | | 22 | | 33 | | 460 | |
Shares redeemed | | (935 | ) | (1,445 | ) | (1,806 | ) | (15,269 | ) | (2,470 | ) | (4,069 | ) |
Change in shares | | 1,213 | | 2,662 | | 2,424 | | (2,147 | ) | 649 | | 1,506 | |
Purchase and sales of investment securities (excluding short-term securities): | | | | | | | | | | | | | |
Purchase of securities | | $ | 51,049 | | $ | 122,649 | | $ | 125,229 | | $ | 94,607 | | $ | 11,648 | | $ | 276,814 | |
Proceeds from sales of securities | | 38,256 | | 93,490 | | 97,907 | | 89,821 | | 11,668 | | 260,900 | |
| | | | | | | | | | | | | | | | | | | |
See accompanying Notes to Financial Statements.
| | Curian/
Aberdeen
Latin America
Fund | | Curian/AQR
Risk Parity
Fund (a) | | Curian/
Ashmore
Emerging
Market Small
Cap Equity
Fund | | Curian/Baring
International
Fixed Income
Fund | | Curian/
BlackRock
Global Long
Short Credit
Fund | | Curian/
CenterSquare
International
Real Estate
Securities
Fund | |
Operations | | | | | | | | | | | | | |
Net investment income (loss) | | $ | 103 | | $ | (1,278 | ) | $ | 33 | | $ | 246 | | $ | 7,268 | | $ | 348 | |
Net realized gain (loss) | | (847 | ) | 24,727 | | (694 | ) | (285 | ) | 12,070 | | (114 | ) |
Net change in unrealized appreciation (depreciation) | | (871 | ) | 2,421 | | (3,503 | ) | (827 | ) | (15,238 | ) | (193 | ) |
Net increase (decrease) in net assets from operations | | (1,615 | ) | 25,870 | | (4,164 | ) | (866 | ) | 4,100 | | 41 | |
Distributions to shareholders | | | | | | | | | | | | | |
From net investment income | | (119 | ) | — | | (7 | ) | (3 | ) | — | | (614 | ) |
From net realized gain | | — | | (6,293 | ) | (553 | ) | (28 | ) | — | | — | |
Total distributions to shareholders | | (119 | ) | (6,293 | ) | (560 | ) | (31 | ) | — | | (614 | ) |
Share transactions(1) | | | | | | | | | | | | | |
Proceeds from sale of shares | | 5,244 | | 109,513 | | 53,285 | | 11,041 | | 96,825 | | 9,525 | |
Proceeds in connection with acquisition | | — | | — | | — | | — | | — | | — | |
Reinvestment of distributions | | 119 | | 6,293 | | 560 | | 31 | | — | | 614 | |
Cost of shares redeemed | | (4,830 | ) | (271,559 | ) | (28,434 | ) | (4,309 | ) | (132,637 | ) | (3,254 | ) |
Change in net assets from share transactions | | 533 | | (155,753 | ) | 25,411 | | 6,763 | | (35,812 | ) | 6,885 | |
Change in net assets | | (1,201 | ) | (136,176 | ) | 20,687 | | 5,866 | | (31,712 | ) | 6,312 | |
Net assets beginning of year | | 9,675 | | 311,716 | | 17,804 | | 18,622 | | 413,201 | | 13,610 | |
Net assets end of year | | $ | 8,474 | | $ | 175,540 | | $ | 38,491 | | $ | 24,488 | | $ | 381,489 | | $ | 19,922 | |
Undistributed (excess of distributions over) net investment income (loss) | | $ | 1 | | $ | 14,522 | | $ | (82 | ) | $ | (328 | ) | $ | 17,559 | | $ | (276 | ) |
(1) Share transactions | | | | | | | | | | | | | |
Shares sold | | 624 | | 10,182 | | 5,225 | | 1,120 | | 9,421 | | 1,019 | |
Shares issued in connection with acquisition | | — | | — | | — | | — | | — | | — | |
Reinvestment of distributions | | 17 | | 592 | | 61 | | 3 | | — | | 68 | |
Shares redeemed | | (581 | ) | (25,008 | ) | (2,843 | ) | (439 | ) | (12,999 | ) | (349 | ) |
Change in shares | | 60 | | (14,234 | ) | 2,443 | | 684 | | (3,578 | ) | 738 | |
Purchase and sales of investment securities (excluding short-term securities): | | | | | | | | | | | | | |
Purchase of securities | | $ | 3,323 | | $ | 20,918 | (b) | $ | 63,393 | | $ | 22,631 | | $ | 776,683 | (c) | $ | 13,913 | |
Proceeds from sales of securities | | 2,712 | | 113,266 | (b) | 38,519 | | 15,913 | | 735,339 | (c) | 7,382 | |
Securities sold short covers | | — | | — | | — | | — | | 294,860 | (c) | — | |
Securities sold short proceeds | | — | | — | | — | | — | | 269,496 | (c) | — | |
| | | | | | | | | | | | | | | | | | | |
(a) | Consolidated Statement of Changes in Net Assets. |
(b) | Amounts include $18,610 and $73,743 of purchases and sales, respectively, of U.S. Government Securities. |
(c) | Amounts include U.S. Government Securities purchases of $275,691, sales of $251,507, covers of securities sold short of $214,966 and proceeds from securities sold short of $180,837. |
See accompanying Notes to Financial Statements.
| | Curian/DFA
U.S. Micro
Cap Fund | | Curian/
DoubleLine
Total Return
Fund | | Curian/Eaton
Vance Global
Macro
Absolute
Return
Advantage
Fund | | Curian/Epoch
Global
Shareholder
Yield Fund | | Curian/
FAMCO Flex
Core Covered
Call Fund | | Curian
Focused
International
Equity Fund | |
Operations | | | | | | | | | | | | | |
Net investment income (loss) | | $ | (87 | ) | $ | 28,058 | | $ | 12,983 | | $ | 1,771 | | $ | 2,913 | | $ | 215 | |
Net realized gain (loss) | | 30,365 | | (6,128 | ) | 7,922 | | 748 | | (8,874 | ) | (1,231 | ) |
Net change in unrealized appreciation (depreciation) | | (31,302 | ) | 28,521 | | (1,667 | ) | (263 | ) | 23,831 | | (3,006 | ) |
Net increase (decrease) in net assets from operations | | (1,024 | ) | 50,451 | | 19,238 | | 2,256 | | 17,870 | | (4,022 | ) |
Distributions to shareholders | | | | | | | | | | | | | |
From net investment income | | — | | (3,136 | ) | — | | — | | (60 | ) | — | |
From net realized gain | | (7,673 | ) | — | | — | | (1,026 | ) | — | | (35 | ) |
Total distributions to shareholders | | (7,673 | ) | (3,136 | ) | — | | (1,026 | ) | (60 | ) | (35 | ) |
Share transactions(1) | | | | | | | | | | | | | |
Proceeds from sale of shares | | 53,944 | | 863,778 | | 89,128 | | 30,977 | | 187,242 | | 263,547 | |
Proceeds in connection with acquisition | | — | | — | | — | | — | | — | | — | |
Reinvestment of distributions | | 7,673 | | 3,136 | | — | | 1,026 | | 60 | | 35 | |
Cost of shares redeemed | | (138,035 | ) | (243,232 | ) | (87,727 | ) | (9,787 | ) | (34,851 | ) | (34,108 | ) |
Change in net assets from share transactions | | (76,418 | ) | 623,682 | | 1,401 | | 22,216 | | 152,451 | | 229,474 | |
Change in net assets | | (85,115 | ) | 670,997 | | 20,639 | | 23,446 | | 170,261 | | 225,417 | |
Net assets beginning of year | | 178,330 | | 549,321 | | 399,531 | | 33,916 | | 77,663 | | 8,511 | |
Net assets end of year | | $ | 93,215 | | $ | 1,220,318 | | $ | 420,170 | | $ | 57,362 | | $ | 247,924 | | $ | 233,928 | |
Undistributed (excess of distributions over) net investment income (loss) | | $ | (37 | ) | $ | 23,907 | | $ | 19,670 | | $ | 1,810 | | $ | 2,912 | | $ | 188 | |
(1) Share transactions | | | | | | | | | | | | | |
Shares sold | | 3,857 | | 83,215 | | 9,304 | | 2,602 | | 16,179 | | 24,818 | |
Shares issued in connection with acquisition | | — | | — | | — | | — | | — | | — | |
Reinvestment of distributions | | 583 | | 297 | | — | | 85 | | 5 | | 3 | |
Shares redeemed | | (9,918 | ) | (23,502 | ) | (9,124 | ) | (826 | ) | (2,959 | ) | (3,191 | ) |
Change in shares | | (5,478 | ) | 60,010 | | 180 | | 1,861 | | 13,225 | | 21,630 | |
Purchase and sales of investment securities (excluding short-term securities): | | | | | | | | | | | | | |
Purchase of securities | | $ | 25,881 | | $ | 702,909 | (a) | $ | 353,565 | | $ | 27,328 | | $ | 276,695 | | $ | 240,676 | |
Proceeds from sales of securities | | 110,119 | | 115,246 | (a) | 225,179 | (b) | 5,511 | | 124,536 | | 20,403 | |
| | | | | | | | | | | | | | | | | | | |
(a) | Amounts include $344,576 and $72,175 of purchases and sales, respectively, of U.S. Government Securities. |
(b) | Amount includes $50,000 of sales of U.S. Government Securities. |
See accompanying Notes to Financial Statements.
| | Curian
Focused U.S.
Equity Fund | | Curian/
Franklin
Templeton
Frontier
Markets Fund | | Curian/
Franklin
Templeton
Natural
Resources
Fund | | Curian/Lazard
International
Strategic
Equity Fund | | Curian Long
Short Credit
Fund | | Curian/
Neuberger
Berman
Currency
Fund | |
Operations | | | | | | | | | | | | | |
Net investment income (loss) | | $ | 279 | | $ | 3,292 | | $ | 634 | | $ | 874 | | $ | 11,668 | | $ | (1,400 | ) |
Net realized gain (loss) | | 522 | | 11,382 | | 13,293 | | (781 | ) | (5,720 | ) | 4,975 | |
Net change in unrealized appreciation (depreciation) | | 399 | | (28,557 | ) | (26,947 | ) | (2,002 | ) | (10,726 | ) | 487 | |
Net increase (decrease) in net assets from operations | | 1,200 | | (13,883 | ) | (13,020 | ) | (1,909 | ) | (4,778 | ) | 4,062 | |
Distributions to shareholders | | | | | | | | | | | | | |
From net investment income | | (13 | ) | (3,168 | ) | — | | — | | (6,099 | ) | — | |
From net realized gain | | (25 | ) | (5,895 | ) | (14,115 | ) | (53 | ) | (5,403 | ) | — | |
Total distributions to shareholders | | (38 | ) | (9,063 | ) | (14,115 | ) | (53 | ) | (11,502 | ) | — | |
Share transactions(1) | | | | | | | | | | | | | |
Proceeds from sale of shares | | 94,843 | | 67,323 | | 91,654 | | 103,786 | | 65,680 | | 95,401 | |
Proceeds in connection with acquisition | | — | | — | �� | — | | — | | — | | — | |
Reinvestment of distributions | | 38 | | 9,063 | | 14,115 | | 53 | | 11,502 | | — | |
Cost of shares redeemed | | (20,478 | ) | (148,457 | ) | (160,676 | ) | (17,071 | ) | (99,625 | ) | (71,728 | ) |
Change in net assets from share transactions | | 74,403 | | (72,071 | ) | (54,907 | ) | 86,768 | | (22,443 | ) | 23,673 | |
Change in net assets | | 75,565 | | (95,017 | ) | (82,042 | ) | 84,806 | | (38,723 | ) | 27,735 | |
Net assets beginning of year | | 7,239 | | 166,588 | | 138,821 | | 39,055 | | 394,352 | | 164,891 | |
Net assets end of year | | $ | 82,804 | | $ | 71,571 | | $ | 56,779 | | $ | 123,861 | | $ | 355,629 | | $ | 192,626 | |
Undistributed (excess of distributions over) net investment income (loss) | | $ | 279 | | $ | 3,102 | | $ | 992 | | $ | 862 | | $ | 11,470 | | $ | 4,011 | |
(1) Share transactions | | | | | | | | | | | | | |
Shares sold | | 8,452 | | 5,511 | | 9,847 | | 8,933 | | 6,393 | | 9,456 | |
Shares issued in connection with acquisition | | — | | — | | — | | — | | — | | — | |
Reinvestment of distributions | | 3 | | 926 | | 2,306 | | 5 | | 1,174 | | — | |
Shares redeemed | | (1,821 | ) | (12,301 | ) | (17,230 | ) | (1,471 | ) | (9,688 | ) | (7,269 | ) |
Change in shares | | 6,634 | | (5,864 | ) | (5,077 | ) | 7,467 | | (2,121 | ) | 2,187 | |
Purchase and sales of investment securities (excluding short-term securities): | | | | | | | | | | | | | |
Purchase of securities | | $ | 77,557 | | $ | 25,670 | | $ | 86,286 | | $ | 116,210 | | $ | 334,156 | | $ | 262,668 | (a) |
Proceeds from sales of securities | | 5,761 | | 105,495 | | 150,985 | | 31,464 | | 340,898 | | 164,405 | (a) |
| | | | | | | | | | | | | | | | | | | |
(a) | Amounts include $250,411 and $157,403 of purchases and sales, respectively, of U.S. Government Securities. |
See accompanying Notes to Financial Statements.
| | Curian/
Neuberger
Berman Risk
Balanced
Commodity
Strategy
Fund (a) (b) | | Curian/
Nicholas
Convertible
Arbitrage
Fund | | Curian/PIMCO
Credit Income
Fund | | Curian/
PineBridge
Merger
Arbitrage
Fund | | Curian/
Schroder
Emerging
Europe Fund | | Curian/
T. Rowe Price
Capital
Appreciation
Fund | |
Operations | | | | | | | | | | | | | |
Net investment income (loss) | | $ | (985 | ) | $ | (14,657 | ) | $ | 1,499 | | $ | (2,800 | ) | $ | 395 | | $ | 533 | |
Net realized gain (loss) | | (43,028 | ) | 3,424 | | 1,746 | | 2,553 | | (1,511 | ) | 3,704 | |
Net change in unrealized appreciation (depreciation) | | (3,446 | ) | 2,667 | | 1,339 | | (1,494 | ) | (3,999 | ) | 3,613 | |
Net increase (decrease) in net assets from operations | | (47,459 | ) | (8,566 | ) | 4,584 | | (1,741 | ) | (5,115 | ) | 7,850 | |
Distributions to shareholders | | | | | | | | | | | | | |
From net investment income | | — | | (3,519 | ) | (34 | ) | — | | (434 | ) | (620 | ) |
From net realized gain | | — | | (7,704 | ) | — | | — | | — | | (2,776 | ) |
From return of capital | | — | | — | | — | | — | | (6 | ) | — | |
Total distributions to shareholders | | — | | (11,223 | ) | (34 | ) | — | | (440 | ) | (3,396 | ) |
Share transactions(1) | | | | | | | | | | | | | |
Proceeds from sale of shares | | 248,573 | | 143,767 | | 63,547 | | 53,857 | | 4,908 | | 89,098 | |
Proceeds in connection with acquisition | | — | | 115,414 | | — | | — | | — | | — | |
Reinvestment of distributions | | — | | 11,223 | | 34 | | — | | 440 | | 3,396 | |
Cost of shares redeemed | | (21,164 | ) | (52,320 | ) | (32,093 | ) | (220,395 | ) | (8,178 | ) | (23,103 | ) |
Change in net assets from share transactions | | 227,409 | | 218,084 | | 31,488 | | (166,538 | ) | (2,830 | ) | 69,391 | |
Change in net assets | | 179,950 | | 198,295 | | 36,038 | | (168,279 | ) | (8,385 | ) | 73,845 | |
Net assets beginning of year | | — | | 238,456 | | 52,473 | | 260,399 | | 21,680 | | 39,085 | |
Net assets end of year | | $ | 179,950 | | $ | 436,751 | | $ | 88,511 | | $ | 92,120 | | $ | 13,295 | | $ | 112,930 | |
Undistributed (excess of distributions over) net investment income (loss) | | $ | (131 | ) | $ | (6,108 | ) | $ | 2,214 | | $ | (17 | ) | $ | (13 | ) | $ | (80 | ) |
(1) Share transactions | | | | | | | | | | | | | |
Shares sold | | 25,492 | | 13,431 | | 5,941 | | 5,370 | | 522 | | 7,984 | |
Shares issued in connection with acquisition | | — | | 10,710 | | — | | — | | — | | — | |
Reinvestment of distributions | | — | | 1,098 | | 3 | | — | | 60 | | 296 | |
Shares redeemed | | (2,250 | ) | (4,906 | ) | (3,012 | ) | (22,039 | ) | (853 | ) | (2,079 | ) |
Change in shares | | 23,242 | | 20,333 | | 2,932 | | (16,669 | ) | (271 | ) | 6,201 | |
Purchase and sales of investment securities (excluding short-term securities): | | | | | | | | | | | | | |
Purchase of securities | | $ | 220,807 | (c) | $ | 520,143 | | $ | 107,155 | (d) | $ | 348,649 | | $ | 16,717 | | $ | 101,499 | (e) |
Proceeds from sales of securities | | 75,285 | (c) | 336,679 | | 76,832 | (d) | 456,740 | | 19,582 | | 48,364 | (e) |
Securities sold short covers | | — | | 223,850 | | — | | — | | — | | — | |
Securities sold short proceeds | | — | | 297,217 | | — | | — | | — | | — | |
| | | | | | | | | | | | | | | | | | | |
(a) | Period from April 28, 2014 (commencement of operations). |
(b) | Consolidated Statement of Changes in Net Assets. |
(c) | Amounts include $56,828 and $38,825 of purchases and sales, respectively, of U.S. Government Securities. |
(d) | Amounts include $48,245 and $53,489 of purchases and sales, respectively, of U.S. Government Securities. |
(e) | Amounts include $2,373 and $5,472 of purchases and sales, respectively, of U.S. Government Securities. |
See accompanying Notes to Financial Statements.
| | Curian/The
Boston
Company
Equity Income
Fund | | Curian/UBS
Global Long
Short Fixed
Income
Opportunities
Fund | | Curian/
Van Eck
International
Gold
Fund (a) | |
Operations | | | | | | | |
Net investment income (loss) | | $ | 596 | | $ | 5,149 | | $ | (765 | ) |
Net realized gain (loss) | | 3,120 | | (1,314 | ) | (33,927 | ) |
Net change in unrealized appreciation (depreciation) | | 1,662 | | (12,907 | ) | 37,918 | |
Net increase (decrease) in net assets from operations | | 5,378 | | (9,072 | ) | 3,226 | |
Distributions to shareholders | | | | | | | |
From net investment income | | (41 | ) | — | | (230 | ) |
From net realized gain | | (2,013 | ) | — | | — | |
Total distributions to shareholders | | (2,054 | ) | — | | (230 | ) |
Share transactions(1) | | | | | | | |
Proceeds from sale of shares | | 29,217 | | 148,194 | | 122,300 | |
Proceeds in connection with acquisition | | — | | — | | — | |
Reinvestment of distributions | | 2,054 | | — | | 230 | |
Cost of shares redeemed | | (10,984 | ) | (96,792 | ) | (160,836 | ) |
Change in net assets from share transactions | | 20,287 | | 51,402 | | (38,306 | ) |
Change in net assets | | 23,611 | | 42,330 | | (35,310 | ) |
Net assets beginning of year | | 37,852 | | 130,690 | | 116,757 | |
Net assets end of year | | $ | 61,463 | | $ | 173,020 | | $ | 81,447 | |
Undistributed (excess of distributions over) net investment income (loss) | | $ | 586 | | $ | 2,323 | | $ | 461 | |
(1) Share transactions | | | | | | | |
Shares sold | | 2,103 | | 14,934 | | 23,281 | |
Shares issued in connection with acquisition | | — | | — | | — | |
Reinvestment of distributions | | 142 | | — | | 52 | |
Shares redeemed | | (795 | ) | (9,872 | ) | (29,667 | ) |
Change in shares | | 1,450 | | 5,062 | | (6,334 | ) |
Purchase and sales of investment securities (excluding short-term securities): | | | | | | | |
Purchase of securities | | $ | 41,463 | | $ | 165,128 | (b) | $ | 63,785 | |
Proceeds from sales of securities | | 22,971 | | 105,838 | (b) | 98,881 | |
| | | | | | | | | | |
(a) Consolidated Statement of Changes in Net Assets.
(b) Amounts include $11,146 and $17,967 of purchases and sales, respectively, of U.S. Government Securities.
See accompanying Notes to Financial Statements.
Curian Variable Series Trust Sub-Advised Funds
Statements of Changes in Net Assets (in thousands)
For the Year Ended December 31, 2013
| | Curian Tactical
Advantage 35
Fund | | Curian Tactical
Advantage 60
Fund | | Curian Tactical
Advantage 75
Fund | | Curian
Dynamic Risk
Advantage -
Diversified
Fund | | Curian
Dynamic Risk
Advantage -
Growth Fund | | Curian
Dynamic Risk
Advantage -
Income Fund | |
Operations | | | | | | | | | | | | | |
Net investment income (loss) | | $ | 378 | | $ | 758 | | $ | 627 | | $ | (2,838 | ) | $ | (861 | ) | $ | 2,978 | |
Net realized gain (loss) | | 1,034 | | 3,427 | | 3,804 | | 1,578 | | 1,649 | | (1,834 | ) |
Net change in unrealized appreciation (depreciation) | | 386 | | 3,048 | | 3,418 | | 3,178 | | 578 | | (890 | ) |
Net increase (decrease) in net assets from operations | | 1,798 | | 7,233 | | 7,849 | | 1,918 | | 1,366 | | 254 | |
Distributions to shareholders | | | | | | | | | | | | | |
From net investment income | | — | | — | | — | | — | | — | | — | |
From net realized gain | | (41 | ) | (56 | ) | (99 | ) | (341 | ) | (1,949 | ) | (93 | ) |
Total distributions to shareholders | | (41 | ) | (56 | ) | (99 | ) | (341 | ) | (1,949 | ) | (93 | ) |
Share transactions(1) | | | | | | | | | | | | | |
Proceeds from sale of shares | | 27,908 | | 66,467 | | 54,741 | | 341,671 | | 68,662 | | 124,926 | |
Reinvestment of distributions | | 41 | | 56 | | 99 | | 341 | | 1,949 | | 93 | |
Cost of shares redeemed | | (10,064 | ) | (10,291 | ) | (9,914 | ) | (131,218 | ) | (70,638 | ) | (43,268 | ) |
Change in net assets from share transactions | | 17,885 | | 56,232 | | 44,926 | | 210,794 | | (27 | ) | 81,751 | |
Change in net assets | | 19,642 | | 63,409 | | 52,676 | | 212,371 | | (610 | ) | 81,912 | |
Net assets beginning of year | | 17,867 | | 24,683 | | 22,321 | | 143,179 | | 58,110 | | 75,053 | |
Net assets end of year | | $ | 37,509 | | $ | 88,092 | | $ | 74,997 | | $ | 355,550 | | $ | 57,500 | | $ | 156,965 | |
Undistributed (excess of distributions over) net investment income (loss) | | $ | 385 | | $ | 766 | | $ | 630 | | $ | (807 | ) | $ | (5 | ) | $ | 3,250 | |
(1) Share transactions | | | | | | | | | | | | | |
Shares sold | | 2,617 | | 5,980 | | 4,763 | | 33,279 | | 7,205 | | 11,977 | |
Reinvestment of distributions | | 4 | | 5 | | 8 | | 34 | | 208 | | 9 | |
Shares redeemed | | (944 | ) | (918 | ) | (856 | ) | (12,781 | ) | (7,371 | ) | (4,184 | ) |
Change in shares | | 1,677 | | 5,067 | | 3,915 | | 20,532 | | 42 | | 7,802 | |
Purchase and sales of investment securities (excluding short-term securities): | | | | | | | | | | | | | |
Purchase of securities | | $ | 54,591 | | $ | 139,249 | | $ | 125,652 | | $ | 167,668 | | $ | 19,701 | | $ | 330,028 | |
Proceeds from sales of securities | | 36,351 | | 82,338 | | 79,309 | | 156,354 | | 18,265 | | 244,722 | |
| | | | | | | | | | | | | | | | | | | |
See accompanying Notes to Financial Statements.
| | Curian/
Aberdeen Latin
America
Fund (a) | | Curian/AQR
Risk Parity
Fund (b)(e) | | Curian/
Ashmore
Emerging
Market Small
Cap Equity
Fund (a) | | Curian/Baring
International
Fixed Income
Fund (a) | | Curian/
BlackRock
Global Long
Short Credit
Fund (a) | | Curian/DFA
U.S. Micro
Cap Fund | |
Operations | | | | | | | | | | | | | |
Net investment income (loss) | | $ | 36 | | $ | (876 | ) | $ | 13 | | $ | 111 | | $ | 1,696 | | $ | (152 | ) |
Net realized gain (loss) | | (75 | ) | 4,920 | | (351 | ) | (320 | ) | (3,115 | ) | 7,847 | |
Net change in unrealized appreciation (depreciation) | | (1,773 | ) | (3,485 | ) | 1,114 | | (379 | ) | 6,463 | | 48,874 | |
Net increase (decrease) in net assets from operations | | (1,812 | ) | 559 | | 776 | | (588 | ) | 5,044 | | 56,569 | |
Distributions to shareholders | | | | | | | | | | | | | |
From net investment income | | (57 | ) | — | | (3 | ) | (105 | ) | — | | (805 | ) |
From net realized gain | | — | | — | | — | | — | | — | | (747 | ) |
Total distributions to shareholders | | (57 | ) | — | | (3 | ) | (105 | ) | — | | (1,552 | ) |
Share transactions(1) | | | | | | | | | | | | | |
Proceeds from sale of shares | | 12,448 | | 325,995 | | 17,821 | | 20,375 | | 467,322 | | 40,356 | |
Reinvestment of distributions | | 57 | | — | | 3 | | 105 | | — | | 1,552 | |
Cost of shares redeemed | | (961 | ) | (14,842 | ) | (793 | ) | (1,165 | ) | (59,165 | ) | (54,306 | ) |
Change in net assets from share transactions | | 11,544 | | 311,153 | | 17,031 | | 19,315 | | 408,157 | | (12,398 | ) |
Change in net assets | | 9,675 | | 311,712 | | 17,804 | | 18,622 | | 413,201 | | 42,619 | |
Net assets beginning of year | | — | | 4 | | — | | — | | — | | 135,711 | |
Net assets end of year | | $ | 9,675 | | $ | 311,716 | | $ | 17,804 | | $ | 18,622 | | $ | 413,201 | | $ | 178,330 | |
Undistributed (excess of distributions over) net investment income (loss) | | $ | (3 | ) | $ | 131 | | $ | (5 | ) | $ | (163 | ) | $ | 2,211 | | $ | (103 | ) |
(1) Share transactions | | | | | | | | | | | | | |
Shares sold | | 1,275 | | 32,442 | | 1,791 | | 2,055 | | 46,856 | | 3,239 | |
Reinvestment of distributions | | 7 | | — | | — | | 11 | | — | | 112 | |
Shares redeemed | | (114 | ) | (1,465 | ) | (80 | ) | (119 | ) | (5,943 | ) | (4,382 | ) |
Change in shares | | 1,168 | | 30,977 | | 1,711 | | 1,947 | | 40,913 | | (1,031 | ) |
Purchase and sales of investment securities (excluding short-term securities): | | | | | | | | | | | | | |
Purchase of securities | | $ | 11,934 | | $ | 244,999 | (c) | $ | 23,358 | | $ | 24,762 | | $ | 613,695 | (d) | $ | 23,334 | |
Proceeds from sales of securities | | 697 | | 88,339 | (c) | 6,590 | | 5,852 | | 400,740 | (d) | 37,840 | |
| | | | | | | | | | | | | | | | | | | |
(a) | Period from April 29, 2013 (commencement of operations). |
(b) | Period from September 16, 2013 (commencement of operations). |
(c) | Amounts include $138,084 and $48,798 of purchases and sales, respectively, of U.S. Government Securities. |
(d) | Amounts include $11,844 and $9,018 of purchases and sales, respectively, of U.S. Government Securities. |
(e) | Consolidated Statement of Changes in Net Assets. |
See accompanying Notes to Financial Statements.
| | Curian/
DoubleLine
Total Return
Fund (b) | | Curian/Eaton
Vance Global
Macro Absolute
Return
Advantage
Fund (a) | | Curian/Epoch
Global
Shareholder
Yield Fund | | Curian/FAMCO
Flex Core
Covered Call
Fund | | Curian
Focused
International
Equity Fund (b) | | Curian
Focused U.S.
Equity Fund (b) | |
Operations | | | | | | | | | | | | | |
Net investment income (loss) | | $ | 3,341 | | $ | 2,992 | | $ | 1,033 | | $ | 986 | | $ | (11 | ) | $ | 9 | |
Net realized gain (loss) | | (575 | ) | (29,043 | ) | 4,193 | | (3,144 | ) | 41 | | 25 | |
Net change in unrealized appreciation (depreciation) | | (3,439 | ) | (4,174 | ) | 2,152 | | 8,487 | | 327 | | 512 | |
Net increase (decrease) in net assets from operations | | (673 | ) | (30,225 | ) | 7,378 | | 6,329 | | 357 | | 546 | |
Distributions to shareholders | | | | | | | | | | | | | |
From net investment income | | — | | — | | (961 | ) | (932 | ) | — | | — | |
From net realized gain | | — | | — | | (3,353 | ) | (39 | ) | — | | — | |
Total distributions to shareholders | | — | | — | | (4,314 | ) | (971 | ) | — | | — | |
Share transactions(1) | | | | | | | | | | | | | |
Proceeds from sale of shares | | 642,001 | | 672,671 | | 34,822 | | 69,900 | | 8,766 | | 7,057 | |
Reinvestment of distributions | | — | | — | | 4,314 | | 971 | | — | | — | |
Cost of shares redeemed | | (92,007 | ) | (242,915 | ) | (34,275 | ) | (27,257 | ) | (612 | ) | (364 | ) |
Change in net assets from share transactions | | 549,994 | | 429,756 | | 4,861 | | 43,614 | | 8,154 | | 6,693 | |
Change in net assets | | 549,321 | | 399,531 | | 7,925 | | 48,972 | | 8,511 | | 7,239 | |
Net assets beginning of year | | — | | — | | 25,991 | | 28,691 | | — | | — | |
Net assets end of year | | $ | 549,321 | | $ | 399,531 | | $ | 33,916 | | $ | 77,663 | | $ | 8,511 | | $ | 7,239 | |
Undistributed (excess of distributions over) net investment income (loss) | | $ | 3,134 | | $ | 135 | | $ | 47 | | $ | 59 | | $ | (1 | ) | $ | 13 | |
(1) Share transactions | | | | | | | | | | | | | |
Shares sold | | 64,089 | | 67,568 | | 2,976 | | 6,417 | | 868 | | 695 | |
Reinvestment of distributions | | — | | — | | 383 | | 86 | | — | | — | |
Shares redeemed | | (9,148 | ) | (25,595 | ) | (2,830 | ) | (2,472 | ) | (59 | ) | (35 | ) |
Change in shares | | 54,941 | | 41,973 | | 529 | | 4,031 | | 809 | | 660 | |
Purchase and sales of investment securities (excluding short-term securities): | | | | | | | | | | | | | |
Purchase of securities | | $ | 604,956 | (c) | $ | 379,701 | (d) | $ | 34,992 | | $ | 99,472 | | $ | 8,041 | | $ | 6,553 | |
Proceeds from sales of securities | | 72,314 | (c) | 222,402 | (d) | 33,464 | | 56,752 | | 598 | | 132 | |
| | | | | | | | | | | | | | | | | | | |
(a) | Period from April 29, 2013 (commencement of operations). |
(b) | Period from September 16, 2013 (commencement of operations). |
(c) | Amounts include $437,609 and $68,802 of purchases and sales, respectively, of U.S. Government Securities. |
(d) | Amounts include $75,116 and $25,000 of purchases and sales, respectively, of U.S. Government Securities. |
See accompanying Notes to Financial Statements.
| | Curian/Franklin
Templeton
Frontier
Markets Fund | | Curian/Franklin
Templeton
Natural
Resources
Fund | | Curian/Lazard
International
Strategic Equity
Fund (a) | | Curian Long
Short Credit
Fund (a) | | Curian/
Neuberger
Berman
Currency Fund | | Curian/
Nicholas
Convertible
Arbitrage
Fund | |
Operations | | | | | | | | | | | | | |
Net investment income (loss) | | $ | 3,154 | | $ | 378 | | $ | 3 | | $ | 5,662 | | $ | (2,289 | ) | $ | (5,310 | ) |
Net realized gain (loss) | | 5,864 | | 13,175 | | 33 | | 2,270 | | (1,411 | ) | 19,053 | |
Net change in unrealized appreciation (depreciation) | | 16,220 | | (1,479 | ) | 3,924 | | 910 | | 4 | | (6,241 | ) |
Net increase (decrease) in net assets from operations | | 25,238 | | 12,074 | | 3,960 | | 8,842 | | (3,696 | ) | 7,502 | |
Distributions to shareholders | | | | | | | | | | | | | |
From net investment income | | — | | — | | — | | — | | (1,759 | ) | (14 | ) |
From net realized gain | | — | | (430 | ) | — | | — | | — | | (1,163 | ) |
Total distributions to shareholders | | — | | (430 | ) | — | | — | | (1,759 | ) | (1,177 | ) |
Share transactions(1) | | | | | | | | | | | | | |
Proceeds from sale of shares | | 40,779 | | 64,352 | | 38,000 | | 426,163 | | 83,060 | | 96,784 | |
Reinvestment of distributions | | — | | 430 | | — | | — | | 1,759 | | 1,177 | |
Cost of shares redeemed | | (29,672 | ) | (103,972 | ) | (2,905 | ) | (40,653 | ) | (140,459 | ) | (70,358 | ) |
Change in net assets from share transactions | | 11,107 | | (39,190 | ) | 35,095 | | 385,510 | | (55,640 | ) | 27,603 | |
Change in net assets | | 36,345 | | (27,546 | ) | 39,055 | | 394,352 | | (61,095 | ) | 33,928 | |
Net assets beginning of year | | 130,243 | | 166,367 | | — | | — | | 225,986 | | 204,528 | |
Net assets end of year | | $ | 166,588 | | $ | 138,821 | | $ | 39,055 | | $ | 394,352 | | $ | 164,891 | | $ | 238,456 | |
Undistributed (excess of distributions over) net investment income (loss) | | $ | 3,123 | | $ | (85 | ) | $ | 30 | | $ | 6,138 | | $ | 439 | | $ | 2,119 | |
(1) Share transactions | | | | | | | | | | | | | |
Shares sold | | 3,597 | | 7,178 | | 3,637 | | 42,882 | | 8,344 | | 9,179 | |
Reinvestment of distributions | | — | | 46 | | — | | — | | 179 | | 112 | |
Shares redeemed | | (2,603 | ) | (11,575 | ) | (269 | ) | (4,103 | ) | (14,064 | ) | (6,634 | ) |
Change in shares | | 994 | | (4,351 | ) | 3,368 | | 38,779 | | (5,541 | ) | 2,657 | |
Purchase and sales of investment securities (excluding short-term securities): | | | | | | | | | | | | | |
Purchase of securities | | $ | 35,254 | | $ | 64,093 | | $ | 40,798 | | $ | 579,466 | | $ | 187,643 | (b) | $ | 332,997 | |
Proceeds from sales of securities | | 21,026 | | 102,201 | | 7,967 | | 235,056 | | 155,644 | (b) | 334,929 | |
Securities sold short covers | | — | | — | | — | | — | | — | | 176,133 | |
Securities sold short proceeds | | — | | — | | — | | — | | — | | 171,592 | |
| | | | | | | | | | | | | | | | | | | |
(a) Period from April 29, 2013 (commencement of operations).
(b) Amounts include $187,643 and $155,644 of purchases and sales, respectively, of U.S. Government Securities.
See accompanying Notes to Financial Statements.
| | Curian/
PIMCO
Credit
Income Fund | | Curian/
PineBridge
Merger
Arbitrage Fund | | Curian/
Schroder
Emerging
Europe
Fund (a) | | Curian/T. Rowe
Price Capital
Appreciation
Fund (b) | | Curian/The
Boston
Company
Equity Income
Fund | | Curian/UBS
Global Long
Short Fixed
Income
Opportunities
Fund (a) | |
Operations | | | | | | | | | | | | | |
Net investment income (loss) | | $ | 880 | | $ | (1,464 | ) | $ | 204 | | $ | 69 | | $ | 389 | | $ | 1,037 | |
Net realized gain (loss) | | (1,285 | ) | 530 | | (374 | ) | 69 | | 4,723 | | (1,931 | ) |
Net change in unrealized appreciation (depreciation) | | (881 | ) | 1,302 | | 868 | | 1,510 | | 3,399 | | 455 | |
Net increase (decrease) in net assets from operations | | (1,286 | ) | 368 | | 698 | | 1,648 | | 8,511 | | (439 | ) |
Distributions to shareholders | | | | | | | | | | | | | |
From net investment income | | (936 | ) | — | | (217 | ) | (105 | ) | (350 | ) | — | |
From net realized gain | | (16 | ) | (804 | ) | — | | (15 | ) | (2,851 | ) | — | |
Total distributions to shareholders | | (952 | ) | (804 | ) | (217 | ) | (120 | ) | (3,201 | ) | — | |
Share transactions(1) | | | | | | | | | | | | | |
Proceeds from sale of shares | | 71,129 | | 124,901 | | 23,120 | | 38,726 | | 33,967 | | 147,598 | |
Reinvestment of distributions | | 952 | | 804 | | 217 | | 120 | | 3,201 | | — | |
Cost of shares redeemed | | (50,889 | ) | (85,787 | ) | (2,138 | ) | (1,289 | ) | (21,296 | ) | (16,469 | ) |
Change in net assets from share transactions | | 21,192 | | 39,918 | | 21,199 | | 37,557 | | 15,872 | | 131,129 | |
Change in net assets | | 18,954 | | 39,482 | | 21,680 | | 39,085 | | 21,182 | | 130,690 | |
Net assets beginning of year | | 33,519 | | 220,917 | | — | | — | | 16,670 | | — | |
Net assets end of year | | $ | 52,473 | | $ | 260,399 | | $ | 21,680 | | $ | 39,085 | | $ | 37,852 | | $ | 130,690 | |
Undistributed (excess of distributions over) net investment income (loss) | | $ | (44 | ) | $ | (9 | ) | $ | 3 | | $ | (20 | ) | $ | 40 | | $ | (36 | ) |
(1) Share transactions | | | | | | | | | | | | | |
Shares sold | | 6,793 | | 12,356 | | 2,303 | | 3,832 | | 2,656 | | 14,776 | |
Reinvestment of distributions | | 94 | | 80 | | 21 | | 11 | | 241 | | — | |
Shares redeemed | | (4,909 | ) | (8,481 | ) | (219 | ) | (125 | ) | (1,626 | ) | (1,655 | ) |
Change in shares | | 1,978 | | 3,955 | | 2,105 | | 3,718 | | 1,271 | | 13,121 | |
Purchase and sales of investment securities (excluding short-term securities): | | | | | | | | | | | | | |
Purchase of securities | | $ | 94,249 | (c) | $ | 642,697 | | $ | 31,025 | | $ | 36,585 | (d) | $ | 39,957 | | $ | 138,265 | (e) |
Proceeds from sales of securities | | 66,497 | (c) | 512,795 | | 10,394 | | 2,834 | | 27,174 | | 16,363 | (e) |
| | | | | | | | | | | | | | | | | | | |
(a) Period from April 29, 2013 (commencement of operations).
(b) Period from September 16, 2013 (commencement of operations).
(c) Amounts include $54,271 and $47,423 of purchases and sales, respectively, of U.S. Government Securities.
(d) Amount includes $2,905 of purchases of U.S. Government Securities.
(e) Amounts include $15,444 and $4,822 of purchases and sales, respectively, of U.S. Government Securities.
See accompanying Notes to Financial Statements.
| | Curian/Urdang
International
REIT Fund (a) | | Curian/Van
Eck
International
Gold Fund (b) | |
Operations | | | | | |
Net investment income (loss) | | $ | 124 | | $ | (352 | ) |
Net realized gain (loss) | | (310 | ) | (20,748 | ) |
Net change in unrealized appreciation (depreciation) | | (394 | ) | (45,168 | ) |
Net increase (decrease) in net assets from operations | | (580 | ) | (66,268 | ) |
Distributions to shareholders | | | | | |
From net investment income | | (224 | ) | (223 | ) |
From net realized gain | | — | | — | |
Total distributions to shareholders | | (224 | ) | (223 | ) |
Share transactions(1) | | | | | |
Proceeds from sale of shares | | 14,825 | | 170,664 | |
Reinvestment of distributions | | 224 | | 223 | |
Cost of shares redeemed | | (635 | ) | (86,246 | ) |
Change in net assets from share transactions | | 14,414 | | 84,641 | |
Change in net assets | | 13,610 | | 18,150 | |
Net assets beginning of year | | — | | 98,607 | |
Net assets end of year | | $ | 13,610 | | $ | 116,757 | |
Undistributed (excess of distributions over) net investment income (loss) | | $ | (80 | ) | $ | (88 | ) |
(1) Share transactions | | | | | |
Shares sold | | 1,527 | | 28,657 | |
Reinvestment of distributions | | 25 | | 49 | |
Shares redeemed | | (69 | ) | (14,742 | ) |
Change in shares | | 1,483 | | 13,964 | |
Purchase and sales of investment securities (excluding short-term securities): | | | | | |
Purchase of securities | | $ | 16,977 | | $ | 117,100 | |
Proceeds from sales of securities | | 3,051 | | 34,715 | |
| | | | | | | |
(a) Period from April 29, 2013 (commencement of operations).
(b) Consolidated Statement of Changes in Net Assets.
See accompanying Notes to Financial Statements.
Curian Variable Series Trust Sub-Advised Funds
Financial Highlights
For a Share Outstanding
| | | | Increase (Decrease) from
Investment Operations | | Distributions from | | | | | | Supplemental Data | | Ratios(a) | |
Period
Ended | | Net Asset
Value,
Beginning
of Period | | Net
Investment
Income
(Loss)(b) | | Net Realized
& Unrealized
Gain (Loss) | | Total from
Investment
Operations | | Net
Investment
Income | | Net Realized
Gain on
Investment
Transactions | | Net Asset
Value,
End
of Period | | Total
Return(c) | | Net Assets,
End of
Period (in
thousands) | | Portfolio
Turnover(d) | | Net
Expenses to
Average Net
Assets | | Total
Expenses to
Average Net
Assets | | Net
Investment
Income
(Loss) to
Average Net
Assets | |
Curian Tactical Advantage 35 Fund(e) | | | | | | | | | | | | | | | | | | | | | | | |
| | | | | | | | | | | | | | | | | | | | | | | |
12/31/2014 | | $ | 11.01 | | $ | 0.18 | | $ | 0.27 | | $ | 0.45 | | $ | (0.09 | ) | $ | (0.28 | ) | $ | 11.09 | | 4.03 | % | $ | 51,221 | | 85 | % | 0.92 | % | 1.22 | % | 1.65 | % |
12/31/2013 | | 10.34 | | 0.14 | | 0.54 | | 0.68 | | — | | (0.01 | ) | 11.01 | | 6.60 | | 37,509 | | 124 | | 0.92 | | 1.22 | | 1.27 | |
12/31/2012* | | 10.00 | | 0.17 | | 0.27 | | 0.44 | | (0.08 | ) | (0.02 | ) | 10.34 | | 4.40 | | 17,867 | | 59 | | 0.96 | | 1.26 | | 1.87 | |
| | | | | | | | | | | | | | | | | | | | | | | | | | | |
Curian Tactical Advantage 60 Fund(e) | | | | | | | | | | | | | | | | | | | | | | | |
| | | | | | | | | | | | | | | | | | | | | | | | | | | |
12/31/2014 | | 11.84 | | 0.19 | | 0.35 | | 0.54 | | (0.08 | ) | (0.39 | ) | 11.91 | | 4.53 | | 120,281 | | 88 | | 0.92 | | 1.22 | | 1.55 | |
12/31/2013 | | 10.42 | | 0.15 | | 1.28 | | 1.43 | | — | | (0.01 | ) | 11.84 | | 13.71 | | 88,092 | | 149 | | 0.92 | | 1.22 | | 1.36 | |
12/31/2012* | | 10.00 | | 0.20 | | 0.33 | | 0.53 | | (0.09 | ) | (0.02 | ) | 10.42 | | 5.32 | | 24,683 | | 54 | | 0.96 | | 1.26 | | 2.22 | |
| | | | | | | | | | | | | | | | | | | | | | | | | | | |
Curian Tactical Advantage 75 Fund(e) | | | | | | | | | | | | | | | | | | | | | | | |
| | | | | | | | | | | | | | | | | | | | | | | | | | | |
12/31/2014 | | 12.41 | | 0.19 | | 0.38 | | 0.57 | | (0.08 | ) | (0.49 | ) | 12.41 | | 4.56 | | 105,071 | | 105 | | 0.92 | | 1.22 | | 1.54 | |
12/31/2013 | | 10.49 | | 0.16 | | 1.78 | | 1.94 | | — | | (0.02 | ) | 12.41 | | 18.48 | | 74,997 | | 172 | | 0.92 | | 1.22 | | 1.35 | |
12/31/2012* | | 10.00 | | 0.22 | | 0.41 | | 0.63 | | (0.10 | ) | (0.04 | ) | 10.49 | | 6.28 | | 22,321 | | 99 | | 0.96 | | 1.26 | | 2.39 | |
| | | | | | | | | | | | | | | | | | | | | | | | | | | |
Curian Dynamic Risk Advantage - Diversified Fund(e) | | | | | | | | | | | | | | | | | | | | | |
| | | | | | | | | | | | | | | | | | | | | | | | | | | |
12/31/2014 | | 10.20 | | (0.10 | ) | 0.63 | | 0.53 | | — | | (0.01 | ) | 10.72 | | 5.17 | | 350,346 | | 345 | | 1.25 | | 1.32 | | (0.92 | ) |
12/31/2013 | | 10.00 | | (0.10 | ) | 0.31 | | 0.21 | | — | | (0.01 | ) | 10.20 | | 2.10 | | 355,550 | | 1,000 | | 1.37 | | 1.42 | | (1.02 | ) |
12/31/2012* | | 10.00 | | (0.09 | ) | 0.19 | | 0.10 | | — | | (0.10 | ) | 10.00 | | 1.02 | | 143,179 | | 1,487 | | 1.46 | | 1.46 | | (1.00 | ) |
| | | | | | | | | | | | | | | | | | | | | | | | | | | |
Curian Dynamic Risk Advantage - Growth Fund(e) | | | | | | | | | | | | | | | | | | | | | |
| | | | | | | | | | | | | | | | | | | | | | | | | | | |
12/31/2014 | | 9.38 | | (0.11 | ) | (0.28 | ) | (0.39 | ) | — | | (0.05 | ) | 8.94 | | (4.22 | ) | 60,659 | | 430 | | 1.25 | | 1.32 | | (1.16 | ) |
12/31/2013 | | 9.54 | | (0.13 | ) | 0.30 | | 0.17 | | — | | (0.33 | ) | 9.38 | | 1.77 | | 57,500 | | 634 | | 1.37 | | 1.42 | | (1.31 | ) |
12/31/2012* | | 10.00 | | (0.12 | ) | (0.34 | ) | (0.46 | ) | — | | — | | 9.54 | | (4.60 | ) | 58,110 | | 1,005 | | 1.46 | | 1.46 | | (1.33 | ) |
| | | | | | | | | | | | | | | | | | | | | | | | | | | |
Curian Dynamic Risk Advantage - Income Fund(e) | | | | | | | | | | | | | | | | | | | | | |
| | | | | | | | | | | | | | | | | | | | | | | | | | | |
12/31/2014 | | 10.37 | | 0.31 | | 0.54 | | 0.85 | | (0.21 | ) | (0.11 | ) | 10.90 | | 8.16 | | 181,475 | | 163 | | 0.97 | | 1.32 | | 2.90 | |
12/31/2013 | | 10.23 | | 0.23 | | (0.08 | ) | 0.15 | | — | | (0.01 | ) | 10.37 | | 1.43 | | 156,965 | | 186 | | 1.07 | | 1.42 | | 2.21 | |
12/31/2012* | | 10.00 | | 0.30 | | 0.07 | | 0.37 | | (0.11 | ) | (0.03 | ) | 10.23 | | 3.70 | | 75,053 | | 153 | | 1.11 | | 1.46 | | 3.32 | |
| | | | | | | | | | | | | | | | | | | | | | | | | | | |
Curian/Aberdeen Latin America Fund | | | | | | | | | | | | | | | | | | | | | | | |
| | | | | | | | | | | | | | | | | | | | | | | | | | | |
12/31/2014 | | 8.28 | | 0.08 | | (1.36 | ) | (1.28 | ) | (0.10 | ) | — | | 6.90 | | (15.47 | ) | 8,474 | | 28 | | 1.83 | | 1.83 | | 1.03 | |
12/31/2013‡ | | 10.00 | | 0.03 | | (1.70 | ) | (1.67 | ) | (0.05 | ) | (0.00 | )(g) | 8.28 | | (16.70 | ) | 9,675 | | 7 | | 1.83 | | 1.83 | | 0.56 | |
| | | | | | | | | | | | | | | | | | | | | | | | | | | |
Curian/AQR Risk Parity Fund(i) | | | | | | | | | | | | | | | | | | | | | | | | |
| | | | | | | | | | | | | | | | | | | | | | | | | | | |
12/31/2014 | | 10.06 | | (0.05 | ) | 0.86 | | 0.81 | | — | | (0.39 | ) | 10.48 | | 7.95 | | 175,540 | | 17 | | 1.13 | | 1.33 | | (0.47 | ) |
12/31/2013^ | | 10.00 | | (0.03 | ) | 0.09 | | 0.06 | | — | | — | | 10.06 | | 0.60 | | 311,716 | | 69 | | 1.14 | | 1.34 | | (1.00 | ) |
| | | | | | | | | | | | | | | | | | | | | | | | | | | |
Curian/Ashmore Emerging Market Small Cap Equity Fund | | | | | | | | | | | | | | | | | | | |
| | | | | | | | | | | | | | | | | | | | | | | | | | | |
12/31/2014 | | 10.40 | | 0.01 | | (1.00 | ) | (0.99 | ) | (0.00 | )(g) | (0.14 | ) | 9.27 | | (9.54 | ) | 38,491 | | 124 | | 1.58 | | 1.58 | | 0.10 | |
12/31/2013‡ | | 10.00 | | 0.01 | | 0.39 | | 0.40 | | (0.00 | )(g) | — | | 10.40 | | 4.02 | | 17,804 | | 49 | | 1.59 | | 1.59 | | 0.14 | |
| | | | | | | | | | | | | | | | | | | | | | | | | | | |
Curian/Baring International Fixed Income Fund | | | | | | | | | | | | | | | | | | | | | |
| | | | | | | | | | | | | | | | | | | | | | | | | | | |
12/31/2014 | | 9.57 | | 0.11 | | (0.36 | ) | (0.25 | ) | (0.00 | )(g) | (0.01 | ) | 9.31 | | (2.59 | ) | 24,488 | | 71 | | 1.07 | | 1.07 | | 1.09 | |
12/31/2013‡ | | 10.00 | | 0.06 | | (0.44 | ) | (0.38 | ) | (0.05 | ) | — | | 9.57 | | (3.76 | ) | 18,622 | | 36 | | 1.09 | | 1.09 | | 0.99 | |
| | | | | | | | | | | | | | | | | | | | | | | | | | | |
Curian/BlackRock Global Long Short Credit Fund | | | | | | | | | | | | | | | | | | | | | |
| | | | | | | | | | | | | | | | | | | | | | | | | | | |
12/31/2014 | | 10.10 | | 0.20 | | (0.08 | ) | 0.12 | | — | | — | | 10.22 | | 1.19 | | 381,489 | | 223 | | 2.19 | (f) | 2.19 | (f) | 1.95 | |
12/31/2013‡ | | 10.00 | | 0.05 | | 0.05 | | 0.10 | | — | | — | | 10.10 | | 1.00 | | 413,201 | | 164 | | 1.84 | (f) | 1.84 | (f) | 0.78 | |
| | | | | | | | | | | | | | | | | | | | | | | | | | | | | | | | | | | |
See accompanying Notes to Financial Statements.
| | | | Increase (Decrease) from
Investment Operations | | Distributions from | | | | | | Supplemental Data | | Ratios(a) | |
Period
Ended | | Net Asset
Value,
Beginning
of Period | | Net
Investment
Income
(Loss)(b) | | Net Realized
& Unrealized
Gain (Loss) | | Total from
Investment
Operations | | Net
Investment
Income | | Net Realized
Gain on
Investment
Transactions | | Net Asset
Value,
End
of Period | | Total
Return(c) | | Net Assets,
End of
Period (in
thousands) | | Portfolio
Turnover(d) | | Net
Expenses to
Average Net
Assets | | Total
Expenses to
Average Net
Assets | | Net
Investment
Income
(Loss) to
Average Net
Assets | |
Curian/CenterSquare International Real Estate Securities Fund | | | | | | | | | | | | | | | | | | | |
| | | | | | | | | | | | | | | | | | | | | | | | | | | |
12/31/2014 | | $ | 9.18 | | $ | 0.19 | | $ | (0.11 | ) | $ | 0.08 | | $ | (0.29 | ) | $ | — | | $ | 8.97 | | 0.80 | % | $ | 19,922 | | 43 | % | 1.27 | % | 1.27 | % | 2.02 | % |
12/31/2013‡ | | 10.00 | | 0.10 | | (0.77 | ) | (0.67 | ) | (0.15 | )(k) | — | | 9.18 | | (6.63 | ) | 13,610 | | 28 | | 1.27 | | 1.27 | | 1.60 | |
| | | | | | | | | | | | | | | | | | | | | | | | | | | |
Curian/DFA U.S. Micro Cap Fund | | | | | | | | | | | | | | | | | | | | | | | |
| | | | | | | | | | | | | | | | | | | | | | | | | | | |
12/31/2014 | | 14.39 | | (0.01 | ) | 0.28 | | 0.27 | | — | | (1.18 | ) | 13.48 | | 2.05 | | 93,215 | | 19 | | 1.27 | | 1.27 | | (0.06 | ) |
12/31/2013 | | 10.11 | | (0.01 | ) | 4.42 | | 4.41 | | (0.07 | ) | (0.06 | ) | 14.39 | | 43.64 | | 178,330 | | 15 | | 1.27 | | 1.27 | | (0.10 | ) |
12/31/2012† | | 10.00 | | 0.06 | | 0.05 | | 0.11 | | — | | — | | 10.11 | | 1.10 | | 135,711 | | 3 | | 1.31 | | 1.31 | | 2.12 | |
| | | | | | | | | | | | | | | | | | | | | | | | | | | |
Curian/DoubleLine Total Return Fund | | | | | | | | | | | | | | | | | | | | | | | |
| | | | | | | | | | | | | | | | | | | | | | | | | | | |
12/31/2014 | | 10.00 | | 0.33 | | 0.32 | | 0.65 | | (0.03 | ) | — | | 10.62 | | 6.49 | | 1,220,318 | | 14 | | 0.85 | | 0.97 | | 3.18 | |
12/31/2013^ | | 10.00 | | 0.07 | | (0.07 | ) | 0.00 | | — | | — | | 10.00 | | 0.00 | | 549,321 | | 17 | | 0.85 | | 0.97 | | 2.27 | |
| | | | | | | | | | | | | | | | | | | | | | | | | | | |
Curian/Eaton Vance Global Macro Absolute Return Advantage Fund | | | | | | | | | | | | | | | | | |
| | | | | | | | | | | | | | | | | | | | | | | | | | | |
12/31/2014 | | 9.52 | | 0.32 | | 0.13 | | 0.45 | | — | | — | | 9.97 | | 4.73 | | 420,170 | | 91 | | 1.59 | (f) | 1.59 | (f) | 3.26 | |
12/31/2013‡ | | 10.00 | | 0.06 | | (0.54 | ) | (0.48 | ) | — | | — | | 9.52 | | (4.80 | ) | 399,531 | | 106 | | 1.62 | (f) | 1.62 | (f) | 0.96 | |
| | | | | | | | | | | | | | | | | | | | | | | | | | | |
Curian/Epoch Global Shareholder Yield Fund | | | | | | | | | | | | | | | | | | | | | |
| | | | | | | | | | | | | | | | | | | | | | | | | | | |
12/31/2014 | | 11.36 | | 0.46 | | 0.23 | | 0.69 | | (0.00 | )(g) | (0.22 | ) | 11.83 | | 6.05 | | 57,362 | | 12 | | 1.17 | | 1.17 | | 3.83 | |
12/31/2013 | | 10.58 | | 0.39 | | 2.06 | | 2.45 | | (0.37 | ) | (1.30 | ) | 11.36 | | 23.33 | | 33,916 | | 110 | | 1.17 | | 1.17 | | 3.26 | |
12/31/2012* | | 10.00 | | 0.27 | | 0.45 | | 0.72 | | (0.14 | ) | — | | 10.58 | | 7.15 | | 25,991 | | 15 | | 1.21 | | 1.21 | | 2.90 | |
| | | | | | | | | | | | | | | | | | | | | | | | | | | |
Curian/FAMCO Flex Core Covered Call Fund | | | | | | | | | | | | | | | | | | | | | |
| | | | | | | | | | | | | | | | | | | | | | | | | | | |
12/31/2014 | | 11.35 | | 0.18 | | 0.82 | | 1.00 | | (0.00 | )(g) | — | | 12.35 | | 8.84 | | 247,924 | | 53 | | 1.07 | | 1.07 | | 1.52 | |
12/31/2013 | | 10.20 | | 0.20 | | 1.10 | | 1.30 | | (0.14 | ) | (0.01 | ) | 11.35 | | 12.71 | | 77,663 | | 106 | | 1.07 | | 1.07 | | 1.83 | |
12/31/2012* | | 10.00 | | 0.20 | | 0.08 | | 0.28 | | (0.08 | ) | — | | 10.20 | | 2.84 | | 28,691 | | 162 | | 1.11 | | 1.11 | | 2.13 | |
| | | | | | | | | | | | | | | | | | | | | | | | | | | |
Curian Focused International Equity Fund | | | | | | | | | | | | | | | | | | | | | | | |
| | | | | | | | | | | | | | | | | | | | | | | | | | | |
12/31/2014 | | 10.52 | | 0.02 | | (0.12 | ) | (0.10 | ) | — | | (0.00 | )(g) | 10.42 | | (0.94 | ) | 233,928 | | 18 | | 1.25 | | 1.27 | | 0.19 | |
12/31/2013^ | | 10.00 | | (0.01 | ) | 0.53 | | 0.52 | | — | | — | | 10.52 | | 5.20 | | 8,511 | | 10 | | 1.25 | | 1.27 | | (0.49 | ) |
| | | | | | | | | | | | | | | | | | | | | | | | | | | |
Curian Focused U.S. Equity Fund | | | | | | | | | | | | | | | | | | | | | | | |
| | | | | | | | | | | | | | | | | | | | | | | | | | | |
12/31/2014 | | 10.97 | | 0.07 | | 0.31 | | 0.38 | | (0.00 | )(g) | (0.00 | )(g) | 11.35 | | 3.52 | | 82,804 | | 14 | | 1.06 | | 1.17 | | 0.66 | |
12/31/2013^ | | 10.00 | | 0.02 | | 0.95 | | 0.97 | | — | | — | | 10.97 | | 9.70 | | 7,239 | | 3 | | 1.06 | | 1.17 | | 0.52 | |
| | | | | | | | | | | | | | | | | | | | | | | | | | | |
Curian/Franklin Templeton Frontier Markets Fund | | | | | | | | | | | | | | | | | | | | | |
| | | | | | | | | | | | | | | | | | | | | | | | | | | |
12/31/2014 | | 12.36 | | 0.30 | | (2.11 | ) | (1.81 | ) | (0.40 | ) | (0.75 | ) | 9.40 | | (14.98 | ) | 71,571 | | 20 | | 1.87 | | 1.87 | | 2.47 | |
12/31/2013 | | 10.44 | | 0.24 | | 1.68 | | 1.92 | | — | | — | | 12.36 | | 18.39 | (h) | 166,588 | | 15 | | 1.87 | | 1.87 | | 2.15 | |
12/31/2012† | | 10.00 | | (0.02 | ) | 0.46 | | 0.44 | | — | | — | | 10.44 | | 4.40 | | 130,243 | | 0 | | 1.91 | | 1.91 | | (0.57 | ) |
| | | | | | | | | | | | | | | | | | | | | | | | | | | |
Curian/Franklin Templeton Natural Resources Fund | | | | | | | | | | | | | | | | | | | | | |
| | | | | | | | | | | | | | | | | | | | | | | | | | | |
12/31/2014 | | 9.53 | | 0.04 | | (1.97 | ) | (1.93 | ) | — | | (1.61 | ) | 5.99 | | (20.60 | ) | 56,779 | | 66 | | 1.26 | | 1.26 | | 0.44 | |
12/31/2013 | | 8.80 | | 0.02 | | 0.74 | | 0.76 | | — | | (0.03 | ) | 9.53 | | 8.65 | | 138,821 | | 46 | | 1.27 | | 1.27 | | 0.26 | |
12/31/2012* | | 10.00 | | 0.00 | | (1.14 | ) | (1.14 | ) | (0.04 | ) | (0.02 | ) | 8.80 | | (11.41 | ) | 166,367 | | 52 | | 1.31 | | 1.31 | | 0.00 | |
| | | | | | | | | | | | | | | | | | | | | | | | | | | |
Curian/Lazard International Strategic Equity Fund | | | | | | | | | | | | | | | | | | | | | |
| | | | | | | | | | | | | | | | | | | | | | | | | | | |
12/31/2014 | | 11.60 | | 0.12 | | (0.28 | ) | (0.16 | ) | — | | (0.01 | ) | 11.43 | | (1.42 | ) | 123,861 | | 40 | | 1.27 | | 1.27 | | 1.02 | |
12/31/2013‡ | | 10.00 | | 0.00 | | 1.60 | | 1.60 | | — | | — | | 11.60 | | 16.00 | | 39,055 | | 39 | | 1.27 | | 1.27 | | 0.02 | |
| | | | | | | | | | | | | | | | | | | | | | | | | | | |
Curian Long Short Credit Fund | | | | | | | | | | | | | | | | | | | | | | | | |
| | | | | | | | | | | | | | | | | | | | | | | | | | | |
12/31/2014 | | 10.17 | | 0.32 | | (0.47 | ) | (0.15 | ) | (0.17 | ) | (0.15 | ) | 9.70 | | (1.43 | ) | 355,629 | | 94 | | 1.42 | | 1.42 | | 3.10 | |
12/31/2013‡ | | 10.00 | | 0.19 | | (0.02 | ) | 0.17 | | — | | — | | 10.17 | | 1.70 | | 394,352 | | 92 | | 1.42 | | 1.42 | | 2.83 | |
| | | | | | | | | | | | | | | | | | | | | | | | | | | | | | | | | | | |
See accompanying Notes to Financial Statements.
| | | | Increase (Decrease) from
Investment Operations | | Distributions from | | | | | | Supplemental Data | | Ratios(a) | |
Period
Ended | | Net Asset
Value,
Beginning
of Period | | Net
Investment
Income
(Loss)(b) | | Net Realized
& Unrealized
Gain (Loss) | | Total from
Investment
Operations | | Net
Investment
Income | | Net Realized
Gain on
Investment
Transactions | | Net Asset
Value,
End
of Period | | Total
Return(c) | | Net Assets,
End of
Period (in
thousands) | | Portfolio
Turnover(d) | | Net Expenses
to Average
Net Assets | | Total
Expenses
to Average
Net Assets | | Net
Investment
Income
(Loss) to
Average Net
Assets | |
Curian/Neuberger Berman Currency Fund | | | | | | | | | | | | | | | | | | | | | | | |
| | | | | | | | | | | | | | | | | | | | | | | | | | | |
12/31/2014 | | $ | 9.80 | | $ | (0.11 | ) | $ | 0.44 | | $ | 0.33 | | $ | — | | $ | — | | $ | 10.13 | | 3.37 | % | $ | 192,626 | | 0 | % | 1.17 | % | 1.17 | % | (1.09 | )% |
12/31/2013 | | 10.10 | | (0.11 | ) | (0.08 | ) | (0.19 | ) | (0.11 | ) | (0.00 | )(g) | 9.80 | | (1.91 | ) | 164,891 | | 69 | | 1.17 | | 1.17 | | (1.07 | ) |
12/31/2012† | | 10.00 | | (0.03 | ) | 0.13 | | 0.10 | | — | | — | | 10.10 | | 1.00 | | 225,986 | | 25 | | 1.21 | | 1.21 | | (1.09 | ) |
| | | | | | | | | | | | | | | | | | | | | | | | | | | |
Curian/Neuberger Berman Risk Balanced Commodity Strategy Fund(i) | | | | | | | | | | | | | | | | | |
12/31/2014¥ | | 10.00 | | (0.05 | ) | (2.21 | ) | (2.26 | ) | — | | — | | 7.74 | | (22.60 | ) | 179,950 | | 49 | | 1.07 | | 1.07 | | (0.80 | ) |
| | | | | | | | | | | | | | | | | | | | | | | | | | | |
Curian/Nicholas Convertible Arbitrage Fund | | | | | | | | | | | | | | | | | | | | | | |
| | | | | | | | | | | | | | | | | | | | | | | | | | | |
12/31/2014 | | 10.55 | | (0.42 | ) | 0.30 | | (0.12 | ) | (0.08 | ) | (0.18 | ) | 10.17 | | (1.07 | ) | 436,751 | | 116 | | 1.84 | (f) | 1.84 | (f) | (3.98 | ) |
12/31/2013 | | 10.26 | | (0.25 | ) | 0.59 | | 0.34 | | (0.00 | )(g) | (0.05 | ) | 10.55 | | 3.35 | | 238,456 | | 150 | | 1.88 | (f) | 1.88 | (f) | (2.39 | ) |
12/31/2012* | | 10.00 | | (0.36 | ) | 0.62 | | 0.26 | | — | | — | | 10.26 | | 2.60 | | 204,528 | | 139 | | 2.50 | (f) | 2.50 | (f) | (3.99 | ) |
| | | | | | | | | | | | | | | | | | | | | | | | | | | |
Curian/PIMCO Credit Income Fund | | | | | | | | | | | | | | | | | | | | | | | |
| | | | | | | | | | | | | | | | | | | | | | | | | | | |
12/31/2014 | | 10.17 | | 0.23 | | 0.54 | | 0.77 | | (0.00 | )(g) | — | | 10.94 | | 7.61 | | 88,511 | | 100 | | 0.87 | | 0.87 | | 2.16 | |
12/31/2013 | | 10.54 | | 0.17 | | (0.35 | ) | (0.18 | ) | (0.19 | ) | (0.00 | )(g) | 10.17 | | (1.70 | ) | 52,473 | | 103 | | 0.97 | | 0.97 | | 1.67 | |
12/31/2012* | | 10.00 | | 0.16 | | 0.51 | | 0.67 | | (0.11 | ) | (0.02 | ) | 10.54 | | 6.68 | | 33,519 | | 79 | | 1.01 | | 1.01 | | 1.71 | |
| | | | | | | | | | | | | | | | | | | | | | | | | | | |
Curian/PineBridge Merger Arbitrage Fund | | | | | | | | | | | | | | | | | | | | | | |
| | | | | | | | | | | | | | | | | | | | | | | | | | | |
12/31/2014 | | 10.07 | | (0.13 | ) | 0.07 | | (0.06 | ) | — | | — | | 10.01 | | (0.60 | ) | 92,120 | | 229 | | 1.94 | (f) | 1.94 | (f) | (1.29 | ) |
12/31/2013 | | 10.08 | | (0.06 | ) | 0.08 | | 0.02 | | — | | (0.03 | ) | 10.07 | | 0.21 | | 260,399 | | 283 | | 1.53 | (f) | 1.53 | (f) | (0.59 | ) |
12/31/2012* | | 10.00 | | (0.10 | ) | 0.18 | | 0.08 | | — | | — | | 10.08 | | 0.80 | | 220,917 | | 341 | | 1.51 | (f) | 1.51 | (f) | (1.12 | ) |
| | | | | | | | | | | | | | | | | | | | | | | | | | | |
Curian/Schroder Emerging Europe Fund | | | | | | | | | | | | | | | | | | | | | | | |
| | | | | | | | | | | | | | | | | | | | | | | | | | | |
12/31/2014 | | 10.30 | | 0.21 | | (3.01 | ) | (2.80 | ) | (0.25 | ) | — | | 7.25 | | (27.23 | ) | 13,295 | | 96 | | 1.61 | | 1.61 | | 2.20 | |
12/31/2013‡ | | 10.00 | | 0.10 | | 0.30 | | 0.40 | | (0.10 | ) | — | | 10.30 | | 4.04 | | 21,680 | | 53 | | 1.58 | | 1.58 | | 1.47 | |
| | | | | | | | | | | | | | | | | | | | | | | | | | | |
Curian/T. Rowe Price Capital Appreciation Fund | | | | | | | | | | | | | | | | | | | | | |
| | | | | | | | | | | | | | | | | | | | | | | | | | | |
12/31/2014 | | 10.51 | | 0.09 | | 1.13 | | 1.22 | | (0.06 | ) | (0.29 | ) | 11.38 | | 11.63 | | 112,930 | | 82 | | 1.03 | (l) | 1.17 | | 0.79 | |
12/31/2013^ | | 10.00 | | 0.02 | | 0.52 | | 0.54 | | (0.03 | ) | (0.00 | )(g) | 10.51 | | 5.45 | | 39,085 | | 11 | | 1.03 | | 1.16 | | 0.79 | |
| | | | | | | | | | | | | | | | | | | | | | | | | | | |
Curian/The Boston Company Equity Income Fund | | | | | | | | | | | | | | | | | | | | | |
12/31/2014 | | 13.38 | | 0.17 | | 1.32 | | 1.49 | | (0.01 | ) | (0.50 | ) | 14.36 | | 11.07 | | 61,463 | | 47 | | 1.02 | | 1.02 | | 1.21 | |
12/31/2013 | | 10.70 | | 0.18 | | 3.76 | | 3.94 | | (0.14 | ) | (1.12 | ) | 13.38 | | 36.82 | | 37,852 | | 102 | | 1.02 | | 1.02 | | 1.43 | |
12/31/2012* | | 10.00 | | 0.21 | | 0.64 | | 0.85 | | (0.12 | ) | (0.03 | ) | 10.70 | | 8.49 | | 16,670 | | 45 | | 1.06 | | 1.06 | | 2.28 | |
| | | | | | | | | | | | | | | | | | | | | | | | | | | |
Curian/UBS Global Long Short Fixed Income Opportunities Fund | | | | | | | | | | | | | | | | | | | |
| | | | | | | | | | | | | | | | | | | | | | | | | | | |
12/31/2014 | | 9.96 | | 0.25 | | (0.69 | ) | (0.44 | ) | — | | — | | 9.52 | | (4.42 | ) | 173,020 | | 45 | | 1.43 | (f) | 1.43 | (f) | 2.54 | |
12/31/2013‡ | | 10.00 | | 0.12 | | (0.16 | ) | (0.04 | ) | — | | — | | 9.96 | | (0.40 | ) | 130,690 | | 15 | | 1.45 | | 1.45 | | 1.71 | |
| | | | | | | | | | | | | | | | | | | | | | | | | | | |
Curian/Van Eck International Gold Fund(j) | | | | | | | | | | | | | | | | | | | | | | |
| | | | | | | | | | | | | | | | | | | | | | | | | | | |
12/31/2014 | | 4.69 | | (0.03 | ) | (0.26 | ) | (0.29 | ) | (0.01 | ) | — | | 4.39 | | (6.13 | ) | 81,447 | | 55 | | 1.27 | | 1.27 | | (0.62 | ) |
12/31/2013 | | 9.02 | | (0.02 | ) | (4.30 | ) | (4.32 | ) | (0.01 | ) | — | | 4.69 | | (47.90 | ) | 116,757 | | 33 | | 1.29 | | 1.29 | | (0.31 | ) |
12/31/2012† | | 10.00 | | (0.02 | ) | (0.96 | ) | (0.98 | ) | — | | — | | 9.02 | | (9.80 | ) | 98,607 | | 1 | | 1.31 | | 1.31 | | (0.72 | ) |
| | | | | | | | | | | | | | | | | | | | | | | | | | | | | | | | | | | |
* Commenced operations on February 6, 2012.
† Commenced operations on September 10, 2012.
‡ Commenced operations on April 29, 2013.
^ Commenced operations on September 16, 2013.
¥ Commenced operations on April 28, 2014.
(a) Annualized for periods less than one year.
(b) Per share data calculated using average shares method.
(c) Total return assumes reinvestment of all distributions for the period. Total return is not annualized for periods less than one year and does not reflect payment of the expenses that apply to the variable accounts or any annuity charges.
(d) Portfolio turnover is not annualized for periods of less than one year. Fixed income securities with maturities greater than one year that are purchased for short term investment are excluded from the portfolio turnover calculation.
(e) Ratios of net investment income and expenses to average net assets do not include the impact of the underlying funds’ expenses.
See accompanying Notes to Financial Statements.
(f) The ratio of net expenses and total expenses to average net assets without dividend on securities sold short, short holdings borrowing fees and interest expense was as follows for the period indicated:
| | December 31, 2014 | | December 31, 2013 | | December 31, 2012 | |
Curian/BlackRock Global Long Short Credit Fund | | 1.43 | % | 1.42 | % | N/A | |
Curian/Eaton Vance Global Macro Absolute Return Advantage Fund | | 1.43 | | 1.43 | | N/A | |
Curian/Nicholas Convertible Arbitrage Fund | | 1.31 | | 1.32 | | 1.36 | % |
Curian/PineBridge Merger Arbitrage Fund | | 1.32 | | 1.32 | | 1.36 | |
(g) Amount represents less than $0.005.
(h) Total return for the Curian/Franklin Templeton Frontier Markets Fund includes a reimbursement from the sub-adviser due to certain investment losses. The return without the reimbursement was 18.30%.
(i) Consolidated Financial Statements since commencement of operations.
(j) Consolidated Financial Statements starting year ended December 31, 2013.
(k) Distribution amount for Curian/CenterSquare International Real Estate Securities Fund includes a return of capital distribution which was $0.02 per share.
(l) The ratio of net expenses to average net assets for Curian/T. Rowe Price Capital Appreciation Fund includes a reimbursement of 0.01% for advisory fees waived by the sub-adviser related to advisory fees earned on an affiliated investment held by the Fund.
See accompanying Notes to Financial Statements.
Curian Variable Series Trust Sub-Advised Funds
Notes to Financial Statements
December 31, 2014
NOTE 1. ORGANIZATION
The Curian Variable Series Trust (the “Trust”) is an open-end investment management company organized under the laws of the Commonwealth of Massachusetts, by a Declaration of Trust, dated September 7, 2011. The Trust is registered with the U.S. Securities and Exchange Commission (“SEC”) under the Investment Company Act of 1940, as amended (“1940 Act”), and its shares are registered under the Securities Act of 1933, as amended (“1933 Act”). The Trust operates as a series company, and at December 31, 2014 consisted of 55 separate funds. The information presented in these financial statements pertains to the 33 separate funds (each a “Fund,” and collectively, “Funds”) listed in the table below. Each Fund represents shares of beneficial interest in a separate portfolio of securities and other assets, each with its own investment objective.
Curian Capital, LLC (“Curian,” the “Adviser” or “Administrator”), a wholly-owned subsidiary of Jackson National Life Insurance Company® (“Jackson”), serves as investment adviser and administrator to the Funds. Jackson is an indirect wholly owned subsidiary of Prudential plc, a publicly traded company incorporated in the United Kingdom. Prudential plc is not affiliated in any manner with Prudential Financial Inc., a company whose principal place of business is the United States of America. The Funds offer only one class of shares. Shares of each Fund are sold to life insurance company separate accounts and other affiliated registered investment companies to fund the benefits of variable annuity contracts. Shares may also be sold directly to qualified and non-qualified retirement plans. The Funds and each Fund’s Adviser/Sub-Adviser are:
Fund: | | Adviser: | | Sub-Adviser: |
Curian Tactical Advantage 35 Fund Curian Tactical Advantage 60 Fund Curian Tactical Advantage 75 Fund The Funds are collectively known as “Curian Tactical Advantage Funds.” | | Curian Capital, LLC | | Mellon Capital Management Corporation |
Curian Dynamic Risk Advantage - Diversified Fund Curian Dynamic Risk Advantage - Growth Fund Curian Dynamic Risk Advantage - Income Fund The Funds are collectively known as “Curian Dynamic Risk Advantage Funds.” | | Curian Capital, LLC | | Mellon Capital Management Corporation |
Curian/Aberdeen Latin America Fund | | Curian Capital, LLC | | Aberdeen Asset Managers Limited |
Curian/AQR Risk Parity Fund | | Curian Capital, LLC | | AQR Capital Management, LLC |
Curian/Ashmore Emerging Market Small Cap Equity Fund | | Curian Capital, LLC | | Ashmore Equities Investment Management (US) LLC |
Curian/Baring International Fixed Income Fund | | Curian Capital, LLC | | Baring International Investment Limited |
Curian/BlackRock Global Long Short Credit Fund | | Curian Capital, LLC | | BlackRock Financial Management, Inc. BlackRock International Limited |
Curian/CenterSquare International Real Estate Securities Fund | | Curian Capital, LLC | | CenterSquare Investment Management, Inc. |
Curian/DFA U.S. Micro Cap Fund | | Curian Capital, LLC | | Dimensional Fund Advisors LP |
Curian/DoubleLine Total Return Fund | | Curian Capital, LLC | | DoubleLine Capital LP |
Curian/Eaton Vance Global Macro Absolute Return Advantage Fund | | Curian Capital, LLC | | Eaton Vance Management |
Curian/Epoch Global Shareholder Yield Fund | | Curian Capital, LLC | | Epoch Investment Partners, Inc. |
Curian/FAMCO Flex Core Covered Call Fund | | Curian Capital, LLC | | Fiduciary Asset Management LLC |
Curian Focused International Equity Fund | | Curian Capital, LLC | | WCM Investment Management |
Curian Focused U.S. Equity Fund | | Curian Capital, LLC | | The London Company of Virginia, LLC |
Curian/Franklin Templeton Frontier Markets Fund | | Curian Capital, LLC | | Templeton Asset Management Ltd. |
Curian/Franklin Templeton Natural Resources Fund | | Curian Capital, LLC | | Franklin Advisers, Inc. |
Curian/Lazard International Strategic Equity Fund | | Curian Capital, LLC | | Lazard Asset Management LLC |
Curian Long Short Credit Fund | | Curian Capital, LLC | | PPM America, Inc.* |
Curian/Neuberger Berman Currency Fund Curian/Neuberger Berman Risk Balanced Commodity Strategy Fund | | Curian Capital, LLC | | Neuberger Berman Fixed Income LLC |
Curian/Nicholas Convertible Arbitrage Fund | | Curian Capital, LLC | | Nicholas Investment Partners, L.P. |
Curian/PIMCO Credit Income Fund | | Curian Capital, LLC | | Pacific Investment Management Company LLC |
Curian/PineBridge Merger Arbitrage Fund | | Curian Capital, LLC | | PineBridge Investments LLC |
Curian/Schroder Emerging Europe Fund | | Curian Capital, LLC | | Schroder Investment Management North America Inc. Schroder Investment Management North America Limited (Sub-Sub-Adviser) |
Curian/T. Rowe Price Capital Appreciation Fund | | Curian Capital, LLC | | T. Rowe Price Associates, Inc. |
Curian/The Boston Company Equity Income Fund | | Curian Capital, LLC | | The Boston Company Asset Management LLC |
Curian/UBS Global Long Short Fixed Income Opportunities Fund | | Curian Capital, LLC | | UBS Global Asset Management (Americas) Inc. |
Curian/Van Eck International Gold Fund | | Curian Capital, LLC | | Van Eck Associates Corporation |
* PPM America, Inc. is an affiliate of Curian.
Curian Variable Series Trust Sub-Advised Funds
Notes to Financial Statements
December 31, 2014
The Funds are diversified Funds for purposes of the 1940 Act, with the exception of the following non-diversified Funds: Curian Tactical Advantage Funds, Curian Dynamic Risk Advantage - Income Fund, Curian/Aberdeen Latin America Fund, Curian/AQR Risk Parity Fund, Curian/Baring International Fixed Income Fund, Curian/Eaton Vance Global Macro Absolute Return Advantage Fund, Curian Focused International Equity Fund, Curian Focused U.S. Equity Fund, Curian/Franklin Templeton Frontier Markets Fund, Curian/Neuberger Berman Currency Fund, Curian/Neuberger Berman Risk Balanced Commodity Strategy Fund, Curian/PineBridge Merger Arbitrage Fund and Curian/Van Eck International Gold Fund.
Curian/Neuberger Berman Risk Balanced Commodity Strategy Fund commenced operations on April 28, 2014.
Effective April 28, 2014, the name of Curian/Urdang International REIT Fund was changed to Curian/CenterSquare International REIT Fund. Effective September 15, 2014, the name of Curian/CenterSquare International REIT Fund was changed to Curian/CenterSquare International Real Estate Securities Fund.
NOTE 2. SIGNIFICANT ACCOUNTING POLICIES
The Funds are investment companies and follow accounting and reporting guidance under Financial Accounting Standards Board (“FASB”) Accounting Standards Codification (“ASC”) Topic 946, “Financial Services-Investment Companies”. The following is a summary of significant accounting policies consistently followed by the Funds in the preparation of their financial statements in conformity with U.S. generally accepted accounting principles (“GAAP”).
Security Valuation - Curian has entered into a sub-administration and fund accounting services agreement on behalf of the Funds with Jackson Fund Services (“JFS” or “Sub-Administrator”), a division of Jackson National Asset Management, LLC (“JNAM”). Curian and JNAM are subsidiaries of Jackson and affiliates. Under the Trust’s valuation policy and procedures, the Trust’s Board of Trustees (“Board”) has delegated the daily operational oversight of the securities valuation function to the Pricing Committee of JFS (“Pricing Committee”), which consists of certain officers of the Trust, and Curian and JNAM management. The Pricing Committee is responsible for determining fair valuations for any security for which market quotations are not readily available. For those securities fair valued under procedures adopted by the Board, the Pricing Committee reviews and affirms the reasonableness of the fair valuation determinations after considering all relevant information that is reasonably available. The Pricing Committee’s fair valuation determinations are subject to review, at the latest, by the Board at its next regularly scheduled meeting covering the calendar quarter in which the fair valuation was determined. For fair valuation determinations that are deemed significant, the Board is promptly notified, in detail, of the fair valuation.
The net asset value (“NAV”) of each Fund shall be determined as of the close of trading (generally, 4:00 PM Eastern Time) on each day the New York Stock Exchange (“NYSE”) is open for trading. Stocks traded on an exchange are generally valued at the official closing price of the exchange where the security is principally traded. If there is no official closing price for the security, the security may be valued at the last quoted sale price on the exchange where the security is principally traded or final bid price in the absence of a sale. Stocks not listed on a national or foreign stock exchange may be valued at the closing bid price on the over the counter (“OTC”) market. The Sub-Administrator has retained an independent statistical fair value pricing service to assist in the fair valuation process for securities traded in foreign markets in order to adjust for possible changes in value that may occur between the close of the foreign exchange and the time at which the NAVs are determined. Investments in mutual funds are valued at the NAV per share determined as of the close of the NYSE on each valuation date. Short-term securities maturing within sixty (60) days are valued at amortized cost, unless it is determined that such practice does not approximate market value. Debt securities are generally valued by independent pricing services approved by the Board. If pricing services are unable to provide valuations, debt securities are valued at the most recent bid quotation for a long position and ask quotation for a short position or an evaluated price, as applicable, obtained from each Fund’s Sub-Adviser, a broker/dealer or a widely used quotation system. Futures contracts traded on an exchange are generally valued at the exchange’s settlement price. If the settlement price is not available, exchange traded futures are valued at the last sales price as of the close of business on the local exchange. Options traded on an exchange are generally valued at the last traded price as of the close of business on the local exchange. If the last trade is determined to not be representative of fair value, exchange traded options are valued at the last bid. Forward foreign currency contracts are generally valued at the foreign currency exchange rate as of the close of the NYSE. Centrally cleared swap agreements, listed on a multilateral or trade facility platform, such as a registered exchange, are valued by the respective exchange. The exchange determines a daily settlement price via pricing models which use, as appropriate, its members’ actionable levels across complete term structures along with information obtained from external third party price providers. OTC derivatives, including options and swap agreements, are generally valued by approved pricing services. If the pricing services are unable to provide valuations, OTC derivatives are valued at the most recent bid quotation or evaluated price, as applicable, obtained from a broker/dealer or by pricing models using observable inputs. Pricing services utilized to value debt and derivative instruments may use various pricing techniques which take into account appropriate factors such as: yield; credit quality; coupon rate; maturity; type of issue; trading characteristics; call features; credit ratings; broker quotes; and other relevant data.
Market quotations may not be readily available for certain investments or it may be determined that a quotation of an investment does not represent market value. In such instances, the investment is valued as determined in good faith using procedures approved by the Board. Situations that may require an investment to be fair valued may include instances where a security is thinly traded, halted or restricted as to resale. In addition, investments may be fair valued based on the occurrence of a significant event. Significant events may be specific to a particular issuer, such as mergers, restructurings or defaults. Alternatively, significant events may affect an entire market, such as natural disasters, government actions, and significant changes in the value of U.S. securities markets. Securities are fair valued based on observable and unobservable inputs, including the Sub-Administrator’s or Pricing Committee’s own assumptions in determining the fair value of an investment. Under the procedures approved by the Board, the Sub-Administrator may utilize pricing services or other sources, including the Funds’ Adviser and Sub-Advisers, to assist in determining the fair value of an investment. Factors considered to determine fair value may include the correlation with price movement of similar securities in the same or other markets; the type, cost and investment characteristics of the security; the business and financial condition of the issuer; and trading or other market data.
Curian Variable Series Trust Sub-Advised Funds
Notes to Financial Statements
December 31, 2014
If an investment is valued at a fair value for purposes of calculating a Fund’s NAV, the value may be different from the last quoted price for the investment depending on the source and method used to determine the value. Although there can be no assurance, in general, the fair value of the investment is the amount the owner of such investment might reasonably expect to receive in an orderly transaction between market participants upon its current sale.
Distributions to Shareholders - The amount and timing of distributions are determined in accordance with federal income tax regulations, which may differ from GAAP. Dividends from net investment income are generally declared and paid annually, but may be paid more frequently to avoid excise tax. Distributions of net realized capital gains, if any, will be distributed at least annually, to the extent they exceed available capital loss carry forwards.
Security Transactions and Investment Income - Security transactions are recorded on the trade date for financial reporting purposes. Dividend income, net of applicable withholding taxes, is recorded on the ex-dividend date. Corporate actions involving foreign securities, including dividends, are recorded when the information becomes available. Income received in lieu of dividends for securities loaned is included in dividends in the Statements of Operations. Interest income, including level-yield amortization of discounts and premiums on debt securities and convertible bonds, is accrued daily. A Fund may place a debt obligation on non-accrual status and reduce related interest income by ceasing current accruals and writing off interest receivables when the collection of all or a portion of interest has become doubtful. A debt obligation is removed from non-accrual status when the issuer resumes interest payments or when collectability of interest is reasonably assured. Realized gains and losses are determined on the specific identification basis.
Expenses - Expenses are recorded on an accrual basis. Expenses of the Trust that are directly attributable to a specific Fund are charged to that Fund. Other Trust level expenses are allocated to the Funds based on the average daily net assets of each Fund.
Foreign Taxes - The Funds may be subject to foreign taxes on income, gains on investments or foreign currency purchases and repatriation, a portion of which may be recoverable. The Funds will accrue such taxes and recoveries as applicable, based upon the current interpretations of tax rules and regulations that exist in the markets in which the Funds invest. When a capital gains tax is determined to apply, a Fund will record an estimated deferred tax liability in an amount that may be payable if the securities were disposed of on the valuation date.
Foreign Currency Translations - The accounting records of each Fund are maintained in U.S. dollars. Each business day, the market values of foreign securities, currency holdings and other assets and liabilities denominated in a foreign currency are translated into U.S. dollars based on current exchange rates. Purchases and sales of investment securities, income receipts and expense payments are translated into U.S. dollars based on the respective exchange rates prevailing on the dates of such transactions. The Funds do not isolate that portion of the results of operations resulting from changes in foreign exchange rates on investments from the fluctuations arising from changes in market prices of foreign securities. Such fluctuations are included in net realized and unrealized gain or loss on investments.
Net realized gains and losses on foreign currency related items are considered ordinary income for tax purposes and arise from sales of foreign currencies; currency gains or losses realized between the trade and settlement dates on securities transactions; the difference between the amounts of dividends, interest and foreign withholding taxes recorded and the U.S. dollar amounts actually received or paid; and the realized gains or losses resulting from portfolio and transaction hedges. Net unrealized gain or loss on foreign currency related items include gains and losses from changes in the value of assets and liabilities, other than investments in securities, resulting from changes in currency exchange rates.
Guarantees and Indemnifications - In the normal course of business, the Trust may enter into contracts that contain a variety of representations which provide general indemnifications for certain liabilities. Under the Trust’s organizational documents, its officers and Trustees are indemnified against certain liabilities arising out of the performance of their duties to the Funds. However, since their commencement of operations, the Funds have not had claims or losses pursuant to their contracts and expect the risk of loss to be remote. The Funds’ maximum exposure under these arrangements is unknown since the amount of any future claims that may be made against the Funds cannot be determined and the Funds have no historical basis for predicting the likelihood of any such claims.
Use of Estimates - The preparation of financial statements in conformity with GAAP requires management to make estimates and assumptions that affect the reported amounts of assets and liabilities and disclosure of contingent assets and liabilities at the date of the financial statements and the reported amounts of increases and decreases in net assets from operations during the reporting period. Actual results could differ from those estimates.
Curian Variable Series Trust Sub-Advised Funds
Notes to Financial Statements
December 31, 2014
Basis of Consolidation - The accompanying financial statements and Schedules of Investments for Curian/AQR Risk Parity Fund, Curian/Neuberger Berman Risk Balanced Commodity Strategy Fund and Curian/Van Eck International Gold Fund have each been consolidated to include the respective account of Curian/AQR Risk Parity Fund Ltd., Curian/Neuberger Berman Risk Balanced Commodity Strategy Fund Ltd. and Curian/Van Eck International Gold Fund Ltd. (each a “Subsidiary”). Each Subsidiary is a wholly owned Cayman Islands domiciled subsidiary of the respective Fund, which primarily invests in commodity-related instruments and collateral. The Subsidiary allows each Fund to hold commodity-related instruments and meet regulated investment company (“RIC”) tax requirements in pursuit of its investment objectives as outlined in each Fund’s prospectus and statement of additional information. Each Fund is the sole shareholder of the Subsidiary with the intent that it will retain all rights to the Subsidiary. Each Fund may invest up to 25% of its total assets in the Subsidiary, which may invest without limitation in commodity-related instruments and collateral. Intercompany accounts and transactions have been eliminated. Each Subsidiary has the same Sub-Adviser as the Fund and is subject to the same investment policies and restrictions as the Fund. The summary below provides additional information (in thousands, where applicable) for each Subsidiary.
| | Curian/AQR Risk
Parity Fund Ltd. | | Curian/Neuberger
Berman Risk
Balanced
Commodity
Strategy Fund Ltd. | | Curian/Van Eck
International Gold
Fund Ltd. | |
Date established | | April 23, 2013 | | March 7, 2014 | | April 23, 2013 | |
At December 31, 2014 | | | | | | | |
Subsidiary net assets | | $ | 25,198 | | $ | 23,921 | | $ | 83 | |
Subsidiary percentage of Fund net assets | | 14.35 | % | 13.29 | % | 0.10 | % |
Net unrealized appreciation (depreciation) | | $ | (2,923 | ) | $ | (3,298 | ) | $ | — | |
For the year ended December 31, 2014 | | | | | | | |
Net investment loss | | $ | (356 | ) | $ | (130 | ) | $ | (1 | ) |
Net realized loss | | (9,467 | ) | (43,029 | ) | — | |
Net change in unrealized appreciation (depreciation) | | (1,749 | ) | (3,298 | ) | — | |
Net decrease in net assets from operations | | $ | (11,572 | ) | $ | (46,457 | ) | $ | (1 | ) |
Recent Accounting Pronouncements - In June 2014, FASB released Accounting Standards Update (“ASU”) 2014-11 “Repurchase-to-Maturity Transactions, Repurchase Financings and Disclosures”. The amendments in this ASU change the accounting for repurchase-to-maturity transactions and linked repurchase financings to secured borrowing accounting, which is consistent with the accounting for other repurchase agreements. The amendments also require two new disclosures. The first disclosure requires an entity to disclose information on transfers accounted for as sales in transactions that are economically similar to repurchase agreements. The second disclosure provides increased transparency about the types of collateral pledged in repurchase agreements and similar transactions accounted for as secured borrowings. ASU 2014-11 is effective for the first interim and annual period beginning on or after December 15, 2014. Management is currently evaluating the impact the ASU may have on the Funds’ financial statements.
NOTE 3. FASB ASC TOPIC 820, “FAIR VALUE MEASUREMENT”
This standard establishes a single authoritative definition of fair value, sets out a framework for measuring fair value and requires additional disclosures about fair value measurements. Various inputs are used in determining the value of a Fund’s investments under FASB ASC Topic 820 guidance. The inputs are summarized into three broad categories.
Level 1 includes valuations based on quoted prices of identical securities in active markets, including valuations for securities listed on a national or foreign stock exchange or investments in mutual funds, which are valued at their daily reported NAV.
Level 2 includes valuations determined from significant direct or indirect observable inputs. Direct observable inputs include broker quotes, third party prices, closing prices of similar securities in active markets, closing prices for identical or similar securities in non-active markets or corporate action or reorganization entitlement values. Indirect significant observable inputs include factors such as interest rates, yield curves, prepayment speeds or credit ratings. Level 2 includes valuations for fixed income securities, including certain term loans, OTC derivatives, centrally cleared swap agreements, broker quotes in active markets, securities subject to corporate actions, securities valued at amortized cost, international equity securities priced by an independent statistical fair value pricing service, swap agreements valued by pricing services, or ADRs and GDRs for which quoted prices in active markets are not available.
Level 3 includes valuations determined from significant unobservable inputs, including management’s own assumptions in determining the fair value of the investment. Inputs used to determine the fair value of Level 3 securities include security specific inputs such as: credit quality, credit rating spreads, issuer news, trading characteristics, call features, maturity or anticipated cash flows; or industry specific inputs such as: trading activity of similar markets or securities, changes in the security’s underlying index or changes in comparable securities’ models. Level 3 valuations include securities that are priced based on single source broker quotes, term loans that do not meet certain liquidity thresholds, where prices may be unavailable due to halted trading, restricted to resale due to market events, newly issued or investments for which reliable quotes are otherwise not available.
To assess the continuing appropriateness of security valuation, the Sub-Administrator regularly compares prior day prices with current day prices, transaction prices and alternative vendor prices. When the comparison results exceed pre-defined thresholds, the Sub-Administrator challenges the prices exceeding tolerance levels with the pricing service or broker. To verify Level 3 unobservable inputs, the Sub-Administrator uses a variety of
Curian Variable Series Trust Sub-Advised Funds
Notes to Financial Statements
December 31, 2014
techniques as appropriate to substantiate these valuation approaches, including a regular review of key inputs and assumptions, transaction back-testing or disposition analysis and review of related market activity.
The inputs or methodology used for valuing securities are not necessarily an indication of the risk associated with investing in those securities.
The following table summarizes each Fund’s investments in securities and other financial instruments (in thousands) as of December 31, 2014 by valuation level. For Funds with significant Level 1 and Level 2 investments in common stock, additional detail regarding the sector or country, as applicable, is disclosed.
| | Assets - Securities | |
| | Level 1 | | Level 2 | | Level 3 | | Total | |
Curian Tactical Advantage 35 Fund | | | | | | | | | |
Investment Companies | | $ | 51,241 | | $ | — | | $ | — | | $ | 51,241 | |
Short Term Investments | | 2,124 | | 6,631 | | — | | 8,755 | |
Fund Total | | $ | 53,365 | | $ | 6,631 | | $ | — | | $ | 59,996 | |
Curian Tactical Advantage 60 Fund | | | | | | | | | |
Investment Companies | | $ | 120,293 | | $ | — | | $ | — | | $ | 120,293 | |
Short Term Investments | | 14,000 | | 2,963 | | — | | 16,963 | |
Fund Total | | $ | 134,293 | | $ | 2,963 | | $ | — | | $ | 137,256 | |
Curian Tactical Advantage 75 Fund | | | | | | | | | |
Investment Companies | | $ | 105,128 | | $ | — | | $ | — | | $ | 105,128 | |
Short Term Investments | | 14,404 | | 6,396 | | — | | 20,800 | |
Fund Total | | $ | 119,532 | | $ | 6,396 | | $ | — | | $ | 125,928 | |
Curian Dynamic Risk Advantage - Diversified Fund | | | | | | | | | |
Investment Companies | | $ | 24,776 | | $ | — | | $ | — | | $ | 24,776 | |
Short Term Investments | | 35,292 | | 293,159 | | — | | 328,451 | |
Fund Total | | $ | 60,068 | | $ | 293,159 | | $ | — | | $ | 353,227 | |
Curian Dynamic Risk Advantage - Growth Fund | | | | | | | | | |
Investment Companies | | $ | 116 | | $ | — | | $ | — | | $ | 116 | |
Senior Debt Notes | | 2,477 | | — | | — | | 2,477 | |
Short Term Investments | | 5,521 | | 54,026 | | — | | 59,547 | |
Fund Total | | $ | 8,114 | | $ | 54,026 | | $ | — | | $ | 62,140 | |
Curian Dynamic Risk Advantage - Income Fund | | | | | | | | | |
Investment Companies | | $ | 179,630 | | $ | — | | $ | — | | $ | 179,630 | |
Short Term Investments | | 31,365 | | 19,765 | | — | | 51,130 | |
Fund Total | | $ | 210,995 | | $ | 19,765 | | $ | — | | $ | 230,760 | |
Curian/Aberdeen Latin America Fund | | | | | | | | | |
Common Stocks | | $ | 7,737 | | $ | — | | $ | — | | $ | 7,737 | |
Preferred Stocks | | 519 | | — | | — | | 519 | |
Short Term Investments | | 241 | | — | | — | | 241 | |
Fund Total | | $ | 8,497 | | $ | — | | $ | — | | $ | 8,497 | |
Curian/AQR Risk Parity Fund | | | | | | | | | |
Government and Agency Obligations | | $ | — | | $ | 64,486 | | $ | — | | $ | 64,486 | |
Short Term Investments | | 70,606 | | 39,497 | | — | | 110,103 | |
Fund Total | | $ | 70,606 | | $ | 103,983 | | $ | — | | $ | 174,589 | |
Curian/Ashmore Emerging Market Small Cap Equity Fund | | | | | | | | | |
Common Stocks | | | | | | | | | |
Brazil | | $ | 1,950 | | $ | — | | $ | — | | $ | 1,950 | |
Chile | | 747 | | — | | — | | 747 | |
China | | 4,785 | | 1,755 | | — | | 6,540 | |
Colombia | | 80 | | — | | — | | 80 | |
Egypt | | — | | 336 | | — | | 336 | |
Hong Kong | | 680 | | 3,328 | | — | | 4,008 | |
India | | 1,371 | | 1,696 | | — | | 3,067 | |
Indonesia | | 16 | | 2,320 | | — | | 2,336 | |
Mexico | | 1,984 | | — | | — | | 1,984 | |
Philippines | | 182 | | 111 | | — | | 293 | |
Russian Federation | | 295 | | 183 | | — | | 478 | |
South Africa | | 120 | | — | | — | | 120 | |
South Korea | | 112 | | 4,791 | | — | | 4,903 | |
Taiwan | | 790 | | 8,594 | | — | | 9,384 | |
Thailand | | — | | 200 | | — | | 200 | |
Turkey | | — | | 1,333 | | — | | 1,333 | |
Participatory Notes | | — | | 495 | | — | | 495 | |
Preferred Stocks | | 203 | | — | | — | | 203 | |
Rights | | 9 | | — | | — | | 9 | |
Short Term Investments | | 378 | | 69 | | — | | 447 | |
Fund Total | | $ | 13,702 | | $ | 25,211 | | $ | — | | $ | 38,913 | |
Curian Variable Series Trust Sub-Advised Funds
Notes to Financial Statements
December 31, 2014
| | Assets - Securities | |
| | Level 1 | | Level 2 | | Level 3 | | Total | |
Curian/Baring International Fixed Income Fund | | | | | | | | | |
Corporate Bonds and Notes | | $ | — | | $ | 2,797 | | $ | — | | $ | 2,797 | |
Government and Agency Obligations | | — | | 20,953 | | — | | 20,953 | |
Short Term Investments | | 438 | | — | | — | | 438 | |
Fund Total | | $ | 438 | | $ | 23,750 | | $ | — | | $ | 24,188 | |
Curian/BlackRock Global Long Short Credit Fund | | | | | | | | | |
Common Stocks | | | | | | | | | |
Germany | | $ | — | | $ | 247 | | $ | — | | $ | 247 | |
Ireland | | — | | 206 | | — | | 206 | |
Netherlands | | 289 | | — | | — | | 289 | |
Spain | | — | | 186 | | — | | 186 | |
United Kingdom | | — | | 969 | | — | | 969 | |
United States of America | | 2,674 | | — | | — | | 2,674 | |
Non-U.S. Government Agency ABS | | — | | 49,928 | | 1,401 | | 51,329 | |
Corporate Bonds and Notes | | — | | 241,395 | | 1,807 | | 243,202 | |
Government and Agency Obligations | | — | | 36,440 | | — | | 36,440 | |
Trust Preferreds | | 440 | | — | | — | | 440 | |
Preferred Stocks | | 8,816 | | 1,280 | | — | | 10,096 | |
Purchased Options | | 112 | | 25 | | — | | 137 | |
Short Term Investments | | 26,633 | | 59,878 | | — | | 86,511 | |
Fund Total | | $ | 38,964 | | $ | 390,554 | | $ | 3,208 | | $ | 432,726 | |
Curian/CenterSquare International Real Estate Securities Fund | | | | | | | | | |
Common Stocks | | $ | 2,598 | | $ | 17,040 | | $ | — | | $ | 19,638 | |
Warrants | | 7 | | — | | — | | 7 | |
Short Term Investments | | 15 | | — | | — | | 15 | |
Fund Total | | $ | 2,620 | | $ | 17,040 | | $ | — | | $ | 19,660 | |
Curian/DFA U.S. Micro Cap Fund | | | | | | | | | |
Common Stocks | | $ | 93,301 | | $ | — | | $ | — | | $ | 93,301 | |
Rights | | — | | — | | — | | — | |
Warrants | | — | | — | | — | | — | |
Short Term Investments | | 7,032 | | 4,007 | | — | | 11,039 | |
Fund Total | | $ | 100,333 | | $ | 4,007 | | $ | — | | $ | 104,340 | |
Curian/DoubleLine Total Return Fund | | | | | | | | | |
Non-U.S. Government Agency ABS | | $ | — | | $ | 456,654 | | $ | — | | $ | 456,654 | |
Government and Agency Obligations | | — | | 688,380 | | — | | 688,380 | |
Short Term Investments | | 86,863 | | — | | — | | 86,863 | |
Fund Total | | $ | 86,863 | | $ | 1,145,034 | | $ | — | | $ | 1,231,897 | |
Curian/Eaton Vance Global Macro Absolute Return Advantage Fund | | | | | | | | | |
Common Stocks | | $ | 1,650 | | $ | 6,375 | | $ | — | | $ | 8,025 | |
Corporate Bonds and Notes | | — | | 4,412 | | 572 | | 4,984 | |
Government and Agency Obligations | | — | | 260,314 | | — | | 260,314 | |
Investment Companies | | — | | 2,413 | | — | | 2,413 | |
Purchased Options | | — | | 9,764 | | — | | 9,764 | |
Short Term Investments | | 51,674 | | 83,471 | | — | | 135,145 | |
Fund Total | | $ | 53,324 | | $ | 366,749 | | $ | 572 | | $ | 420,645 | |
Curian/Epoch Global Shareholder Yield Fund | | | | | | | | | |
Common Stocks | | | | | | | | | |
Consumer Discretionary | | $ | 1,669 | | $ | 1,885 | | $ | — | | $ | 3,554 | |
Consumer Staples | | 5,227 | | 2,809 | | — | | 8,036 | |
Energy | | 3,716 | | 1,099 | | — | | 4,815 | |
Financials | | 3,119 | | 3,220 | | — | | 6,339 | |
Health Care | | 1,595 | | 2,152 | | — | | 3,747 | |
Industrials | | 2,091 | | 2,293 | | — | | 4,384 | |
Information Technology | | 2,369 | | — | | — | | 2,369 | |
Materials | | 1,581 | | 1,701 | | — | | 3,282 | |
Telecommunication Services | | 4,404 | | 4,129 | | — | | 8,533 | |
Utilities | | 4,808 | | 5,434 | | — | | 10,242 | |
Short Term Investments | | 1,522 | | 3,000 | | — | | 4,522 | |
Fund Total | | $ | 32,101 | | $ | 27,722 | | $ | — | | $ | 59,823 | |
Curian/FAMCO Flex Core Covered Call Fund | | | | | | | | | |
Common Stocks | | $ | 252,143 | | $ | — | | $ | — | | $ | 252,143 | |
Short Term Investments | | 4,882 | | — | | — | | 4,882 | |
Fund Total | | $ | 257,025 | | $ | — | | $ | — | | $ | 257,025 | |
Curian Focused International Equity Fund | | | | | | | | | |
Common Stocks | | | | | | | | | |
Canada | | $ | 21,049 | | $ | — | | $ | — | | $ | 21,049 | |
China | | 3,111 | | — | | — | | 3,111 | |
Denmark | | 8,554 | | 18,048 | | — | | 26,602 | |
France | | — | | 4,196 | | — | | 4,196 | |
Hong Kong | | — | | 8,490 | | — | | 8,490 | |
Ireland | | — | | 4,896 | | — | | 4,896 | |
Curian Variable Series Trust Sub-Advised Funds
Notes to Financial Statements
December 31, 2014
| | Assets - Securities | |
| | Level 1 | | Level 2 | | Level 3 | | Total | |
Curian Focused International Equity Fund (continued) | | | | | | | | | |
Japan | | $ | — | | $ | 14,089 | | $ | — | | $ | 14,089 | |
Mexico | | 4,107 | | — | | — | | 4,107 | |
Netherlands | | 26,693 | | — | | — | | 26,693 | |
Russian Federation | | 3,509 | | — | | — | | 3,509 | |
South Africa | | — | | 4,132 | | — | | 4,132 | |
Spain | | — | | 7,678 | | — | | 7,678 | |
Sweden | | — | | 5,813 | | — | | 5,813 | |
Switzerland | | 10,930 | | 20,195 | | — | | 31,125 | |
Taiwan | | 13,470 | | — | | — | | 13,470 | |
United Kingdom | | 8,318 | | 9,101 | | — | | 17,419 | |
United States of America | | 27,812 | | — | | — | | 27,812 | |
Rights | | — | | 451 | | — | | 451 | |
Short Term Investments | | 9,724 | | 2,230 | | — | | 11,954 | |
Fund Total | | $ | 137,277 | | $ | 99,319 | | $ | — | | $ | 236,596 | |
Curian Focused U.S. Equity Fund | | | | | | | | | |
Common Stocks | | $ | 79,672 | | $ | — | | $ | — | | $ | 79,672 | |
Short Term Investments | | 8,116 | | 4,511 | | — | | 12,627 | |
Fund Total | | $ | 87,788 | | $ | 4,511 | | $ | — | | $ | 92,299 | |
Curian/Franklin Templeton Frontier Markets Fund | | | | | | | | | |
Common Stocks | | | | | | | | | |
Argentina | | $ | 1,502 | | $ | — | | $ | — | | $ | 1,502 | |
Botswana | | 1,519 | | — | | — | | 1,519 | |
Canada | | 591 | | 702 | | — | | 1,293 | |
Egypt | | 3,780 | | 2,027 | | — | | 5,807 | |
Georgia | | — | | 1,142 | | — | | 1,142 | |
Hong Kong | | — | | 1,338 | | — | | 1,338 | |
Jordan | | 585 | | — | | — | | 585 | |
Kazakhstan | | 1,957 | | 499 | | — | | 2,456 | |
Kenya | | 1,176 | | 811 | | — | | 1,987 | |
Kuwait | | — | | 4,822 | | — | | 4,822 | |
Lebanon | | 596 | | — | | — | | 596 | |
Mauritius | | 1,568 | | — | | — | | 1,568 | |
Netherlands | | 708 | | — | | — | | 708 | |
Nigeria | | 1,467 | | 4,892 | | — | | 6,359 | |
Oman | | — | | 1,661 | | — | | 1,661 | |
Pakistan | | 1,718 | | — | | — | | 1,718 | |
Panama | | 860 | | 520 | | — | | 1,380 | |
Peru | | 1,884 | | — | | — | | 1,884 | |
Qatar | | — | | 3,125 | | — | | 3,125 | |
Romania | | 6,320 | | — | | — | | 6,320 | |
Senegal | | 1,346 | | — | | — | | 1,346 | |
South Africa | | — | | 2,134 | | — | | 2,134 | |
South Korea | | — | | 849 | | — | | 849 | |
Ukraine | | 1,301 | | 685 | | — | | 1,986 | |
United Arab Emirates | | 2,264 | | 1,050 | | — | | 3,314 | |
United Kingdom | | — | | — | | — | | — | |
Vietnam | | 3,351 | | 796 | | — | | 4,147 | |
Zimbabwe | | 2,186 | | — | | — | | 2,186 | |
Participatory Notes | | — | | 3,422 | | — | | 3,422 | |
Short Term Investments | | 2,530 | | 724 | | — | | 3,254 | |
Fund Total | | $ | 39,209 | | $ | 31,199 | | $ | — | | $ | 70,408 | |
Curian/Franklin Templeton Natural Resources Fund | | | | | | | | | |
Common Stocks | | $ | 50,821 | | $ | 2,880 | | $ | — | | $ | 53,701 | |
Preferred Stocks | | — | | 498 | | — | | 498 | |
Corporate Bonds and Notes | | — | | 477 | | — | | 477 | |
Short Term Investments | | 2,057 | | 5,247 | | — | | 7,304 | |
Fund Total | | $ | 52,878 | | $ | 9,102 | | $ | — | | $ | 61,980 | |
Curian/Lazard International Strategic Equity Fund | | | | | | | | | |
Common Stocks | | $ | 10,713 | | $ | 108,279 | | $ | — | | $ | 118,992 | |
Short Term Investments | | 5,994 | | 1,283 | | — | | 7,277 | |
Fund Total | | $ | 16,707 | | $ | 109,562 | | $ | — | | $ | 126,269 | |
Curian Long Short Credit Fund | | | | | | | | | |
Non-U.S. Government Agency ABS | | $ | — | | $ | 11,155 | | $ | — | | $ | 11,155 | |
Corporate Bonds and Notes | | — | | 320,316 | | 1,959 | | 322,275 | |
Trust Preferreds | | 1,701 | | — | | — | | 1,701 | |
Preferred Stocks | | 5,254 | | — | | — | | 5,254 | |
Investment Companies | | 522 | | — | | — | | 522 | |
Short Term Investments | | 10,256 | | — | | — | | 10,256 | |
Fund Total | | $ | 17,733 | | $ | 331,471 | | $ | 1,959 | | $ | 351,163 | |
Curian Variable Series Trust Sub-Advised Funds
Notes to Financial Statements
December 31, 2014
| | Assets - Securities | |
| | Level 1 | | Level 2 | | Level 3 | | Total | |
Curian/Neuberger Berman Currency Fund | | | | | | | | | |
Government and Agency Obligations | | $ | — | | $ | 182,537 | | $ | — | | $ | 182,537 | |
Short Term Investments | | 9,965 | | — | | — | | 9,965 | |
Fund Total | | $ | 9,965 | | $ | 182,537 | | $ | — | | $ | 192,502 | |
Curian/Neuberger Berman Risk Balanced Commodity Strategy Fund | | | | | | | | | |
Non-U.S. Government Agency ABS | | $ | — | | $ | 40,732 | | $ | — | | $ | 40,732 | |
Corporate Bonds and Notes | | — | | 86,399 | | — | | 86,399 | |
Government and Agency Obligations | | — | | 17,771 | | — | | 17,771 | |
Short Term Investments | | 17,823 | | 10,291 | | — | | 28,114 | |
Fund Total | | $ | 17,823 | | $ | 155,193 | | $ | — | | $ | 173,016 | |
Curian/Nicholas Convertible Arbitrage Fund | | | | | | | | | |
Common Stocks | | $ | 2,927 | | $ | — | | $ | — | | $ | 2,927 | |
Preferred Stocks | | 27,989 | | 604 | | — | | 28,593 | |
Corporate Bonds and Notes | | — | | 412,506 | | — | | 412,506 | |
Short Term Investments | | 6,545 | | 3,345 | | — | | 9,890 | |
Fund Total | | $ | 37,461 | | $ | 416,455 | | $ | — | | $ | 453,916 | |
Curian/PIMCO Credit Income Fund | | | | | | | | | |
Non-U.S. Government Agency ABS | | $ | — | | $ | 3,543 | | $ | — | | $ | 3,543 | |
Corporate Bonds and Notes | | — | | 63,430 | | — | | 63,430 | |
Government and Agency Obligations | | — | | 15,403 | | — | | 15,403 | |
Common Stocks | | 835 | | — | | — | | 835 | |
Preferred Stocks | | 339 | | — | | — | | 339 | |
Purchased Options | | — | | 49 | | — | | 49 | |
Trust Preferreds | | 449 | | — | | — | | 449 | |
Short Term Investments | | 817 | | 6,945 | | — | | 7,762 | |
Fund Total | | $ | 2,440 | | $ | 89,370 | | $ | — | | $ | 91,810 | |
Curian/PineBridge Merger Arbitrage Fund | | | | | | | | | |
Common Stocks | | $ | 57,554 | | $ | — | | $ | — | | $ | 57,554 | |
Short Term Investments | | 16,289 | | 17,000 | | — | | 33,289 | |
Fund Total | | $ | 73,843 | | $ | 17,000 | | $ | — | | $ | 90,843 | |
Curian/Schroder Emerging Europe Fund | | | | | | | | | |
Common Stocks | | $ | 1,480 | | $ | 11,012 | | $ | — | | $ | 12,492 | |
Preferred Stocks | | — | | 259 | | — | | 259 | |
Short Term Investments | | 374 | | — | | — | | 374 | |
Fund Total | | $ | 1,854 | | $ | 11,271 | | $ | — | | $ | 13,125 | |
Curian/T. Rowe Price Capital Appreciation Fund | | | | | | | | | |
Common Stocks | | $ | 67,936 | | $ | 199 | | $ | — | | $ | 68,135 | |
Preferred Stocks | | 368 | | — | | — | | 368 | |
Trust Preferreds | | 131 | | — | | — | | 131 | |
Investment Companies | | 1,017 | | — | | — | | 1,017 | |
Non-U.S. Government Agency ABS | | — | | 119 | | — | | 119 | |
Corporate Bonds and Notes | | — | | 26,673 | | — | | 26,673 | |
Government and Agency Obligations | | — | | 90 | | — | | 90 | |
Short Term Investments | | 18,592 | | 1,007 | | — | | 19,599 | |
Fund Total | | $ | 88,044 | | $ | 28,088 | | $ | — | | $ | 116,132 | |
Curian/The Boston Company Equity Income Fund | | | | | | | | | |
Common Stocks | | $ | 60,681 | | $ | — | | $ | — | | $ | 60,681 | |
Short Term Investments | | 669 | | 3,182 | | — | | 3,851 | |
Fund Total | | $ | 61,350 | | $ | 3,182 | | $ | — | | $ | 64,532 | |
Curian/UBS Global Long Short Fixed Income Opportunities Fund | | | | | | | | | |
Non-U.S. Government Agency ABS | | $ | — | | $ | 23,144 | | $ | — | | $ | 23,144 | |
Corporate Bonds and Notes | | — | | 116,387 | | — | | 116,387 | |
Government and Agency Obligations | | — | | 23,542 | | — | | 23,542 | |
Purchased Options | | 1,038 | | 3,301 | | — | | 4,339 | |
Short Term Investments | | 227 | | — | | — | | 227 | |
Fund Total | | $ | 1,265 | | $ | 166,374 | | $ | — | | $ | 167,639 | |
Curian/Van Eck International Gold Fund | | | | | | | | | |
Common Stocks | | $ | 72,669 | | $ | 5,853 | | $ | — | | $ | 78,522 | |
Short Term Investments | | 12,945 | | 9,761 | | — | | 22,706 | |
Fund Total | | $ | 85,614 | | $ | 15,614 | | $ | — | | $ | 101,228 | |
| | | |
| | Liabilities - Securities | |
| | Level 1 | | Level 2 | | Level 3 | | Total | |
Curian/BlackRock Global Long Short Credit Fund | | | | | | | | | |
Corporate Bonds and Notes | | $ | — | | $ | (39,483 | ) | $ | — | | $ | (39,483 | ) |
Government and Agency Obligations | | — | | (20,897 | ) | — | | (20,897 | ) |
Fund Total | | $ | — | | $ | (60,380 | ) | $ | — | | $ | (60,380 | ) |
Curian/Eaton Vance Global Macro Absolute Return Advantage Fund | | | | | | | | | |
Government and Agency Obligations | | $ | — | | $ | (9,419 | ) | $ | — | | $ | (9,419 | ) |
Fund Total | | $ | — | | $ | (9,419 | ) | $ | — | | $ | (9,419 | ) |
Curian Variable Series Trust Sub-Advised Funds
Notes to Financial Statements
December 31, 2014
| | Liabilities - Securities | |
| | Level 1 | | Level 2 | | Level 3 | | Total | |
Curian/Nicholas Convertible Arbitrage Fund | | | | | | | | | |
Common Stocks | | $ | (209,005 | ) | $ | — | | $ | — | | $ | (209,005 | ) |
Investment Companies | | (2,257 | ) | — | | — | | (2,257 | ) |
Fund Total | | $ | (211,262 | ) | $ | — | | $ | — | | $ | (211,262 | ) |
Curian/PineBridge Merger Arbitrage Fund | | | | | | | | | |
Common Stocks | | $ | (24,259 | ) | $ | — | | $ | — | | $ | (24,259 | ) |
Fund Total | | $ | (24,259 | ) | $ | — | | $ | — | | $ | (24,259 | ) |
| | | | | | | | | |
| | Assets - Investments in Other Financial Instruments(1) | |
| | Level 1 | | Level 2 | | Level 3 | | Total | |
Curian Dynamic Risk Advantage - Diversified Fund | | | | | | | | | |
Open Futures Contracts | | $ | 2,950 | | $ | — | | $ | — | | $ | 2,950 | |
OTC Total Return Swap Agreements | | — | | 4,109 | | — | | 4,109 | |
Fund Total | | $ | 2,950 | | $ | 4,109 | | $ | — | | $ | 7,059 | |
Curian Dynamic Risk Advantage - Growth Fund | | | | | | | | | |
Open Futures Contracts | | $ | 460 | | $ | — | | $ | — | | $ | 460 | |
Fund Total | | $ | 460 | | $ | — | | $ | — | | $ | 460 | |
Curian/AQR Risk Parity Fund | | | | | | | | | |
Open Futures Contracts | | $ | 3,570 | | $ | — | | $ | — | | $ | 3,570 | |
Open Forward Foreign Currency Contracts | | — | | 853 | | — | | 853 | |
OTC Total Return Swap Agreements | | — | | 1,273 | | — | | 1,273 | |
Fund Total | | $ | 3,570 | | $ | 2,126 | | $ | — | | $ | 5,696 | |
Curian/Baring International Fixed Income Fund | | | | | | | | | |
Open Forward Foreign Currency Contracts | | $ | — | | $ | 179 | | $ | — | | $ | 179 | |
Fund Total | | $ | — | | $ | 179 | | $ | — | | $ | 179 | |
Curian/BlackRock Global Long Short Credit Fund | | | | | | | | | |
Open Futures Contracts | | $ | 13 | | $ | — | | $ | — | | $ | 13 | |
Open Forward Foreign Currency Contracts | | — | | 5,200 | | — | | 5,200 | |
Centrally Cleared Interest Rate Swap Agreements | | — | | 1 | | — | | 1 | |
OTC Credit Default Swap Agreements | | — | | 404 | | — | | 404 | |
OTC Total Return Swap Agreements | | — | | 646 | | — | | 646 | |
Fund Total | | $ | 13 | | $ | 6,251 | | $ | — | | $ | 6,264 | |
Curian/Eaton Vance Global Macro Absolute Return Advantage Fund | | | | | | | | | |
Open Futures Contracts | | $ | 139 | | $ | — | | $ | — | | $ | 139 | |
Open Forward Foreign Currency Contracts | | — | | 15,217 | | — | | 15,217 | |
OTC Interest Rate Swap Agreements | | — | | 1,335 | | — | | 1,335 | |
Centrally Cleared Interest Rate Swap Agreements | | — | | 1,718 | | — | | 1,718 | |
OTC Cross Currency Swap Agreements | | — | | 4,099 | | — | | 4,099 | |
OTC Credit Default Swap Agreements | | — | | 3,326 | | — | | 3,326 | |
OTC Total Return Swap Agreements | | — | | 30 | | — | | 30 | |
Non-Deliverable Bond Forward Contracts | | — | | 7 | | — | | 7 | |
Fund Total | | $ | 139 | | $ | 25,732 | | $ | — | | $ | 25,871 | |
Curian Long Short Credit Fund | | | | | | | | | |
Open Futures Contracts | | $ | 206 | | $ | — | | $ | — | | $ | 206 | |
OTC Credit Default Swap Agreements | | — | | 107 | | — | | 107 | |
Fund Total | | $ | 206 | | $ | 107 | | $ | — | | $ | 313 | |
Curian/Neuberger Berman Currency Fund | | | | | | | | | |
Open Forward Foreign Currency Contracts | | $ | — | | $ | 30,979 | | $ | — | | $ | 30,979 | |
Fund Total | | $ | — | | $ | 30,979 | | $ | — | | $ | 30,979 | |
Curian/Neuberger Berman Risk Balanced Commodity Strategy Fund | | | | | | | | | |
Open Futures Contracts | | $ | 288 | | $ | — | | $ | — | | $ | 288 | |
Fund Total | | $ | 288 | | $ | — | | $ | — | | $ | 288 | |
Curian/PIMCO Credit Income Fund | | | | | | | | | |
Open Futures Contracts | | $ | 27 | | $ | — | | $ | — | | $ | 27 | |
Open Forward Foreign Currency Contracts | | — | | 295 | | — | | 295 | |
Centrally Cleared Interest Rate Swap Agreements | | — | | 98 | | — | | 98 | |
OTC Credit Default Swap Agreements | | — | | 167 | | — | | 167 | |
Centrally Cleared Credit Default Swap Agreements | | — | | 199 | | — | | 199 | |
Fund Total | | $ | 27 | | $ | 759 | | $ | — | | $ | 786 | |
Curian/T. Rowe Price Capital Appreciation Fund | | | | | | | | | |
Open Futures Contracts | | $ | 49 | | $ | — | | $ | — | | $ | 49 | |
Open Forward Foreign Currency Contracts | | — | | 1 | | — | | 1 | |
Fund Total | | $ | 49 | | $ | 1 | | $ | — | | $ | 50 | |
Curian/UBS Global Long Short Fixed Income Opportunities Fund | | | | | | | | | |
Open Futures Contracts | | $ | 364 | | $ | — | | $ | — | | $ | 364 | |
Open Forward Foreign Currency Contracts | | — | | 1,114 | | — | | 1,114 | |
OTC Interest Rate Swap Agreements | | — | | 401 | | — | | 401 | |
Centrally Cleared Interest Rate Swap Agreements | | — | | 3,501 | | — | | 3,501 | |
OTC Cross Currency Swap Agreements | | — | | 1,087 | | — | | 1,087 | |
OTC Credit Default Swap Agreements | | — | | 1,661 | | — | | 1,661 | |
Curian Variable Series Trust Sub-Advised Funds
Notes to Financial Statements
December 31, 2014
| | Assets - Investments in Other Financial Instruments(1) | |
| | Level 1 | | Level 2 | | Level 3 | | Total | |
Curian/UBS Global Long Short Fixed Income Opportunities Fund (continued) | | | | | | | | | |
Centrally Cleared Credit Default Swap Agreements | | $ | — | | $ | 1 | | $ | — | | $ | 1 | |
OTC Total Return Swap Agreements | | — | | 214 | | — | | 214 | |
Fund Total | | $ | 364 | | $ | 7,979 | | $ | — | | $ | 8,343 | |
| | | | | | | | | |
| | Liabilities - Investments in Other Financial Instruments(1) | |
| | Level 1 | | Level 2 | | Level 3 | | Total | |
Curian Dynamic Risk Advantage - Diversified Fund | | | | | | | | | |
OTC Total Return Swap Agreements | | $ | — | | $ | (94 | ) | $ | — | | $ | (94 | ) |
Fund Total | | $ | — | | $ | (94 | ) | $ | — | | $ | (94 | ) |
Curian Dynamic Risk Advantage - Growth Fund | | | | | | | | | |
Open Futures Contracts | | $ | (31 | ) | $ | — | | $ | — | | $ | (31 | ) |
OTC Total Return Swap Agreements | | — | | (57 | ) | — | | (57 | ) |
Fund Total | | $ | (31 | ) | $ | (57 | ) | $ | — | | $ | (88 | ) |
Curian/AQR Risk Parity Fund | | | | | | | | | |
Open Futures Contracts | | $ | (1,681 | ) | $ | — | | $ | — | | $ | (1,681 | ) |
Open Forward Foreign Currency Contracts | | — | | (947 | ) | — | | (947 | ) |
OTC Total Return Swap Agreements | | — | | (1,695 | ) | — | | (1,695 | ) |
Fund Total | | $ | (1,681 | ) | $ | (2,642 | ) | $ | — | | $ | (4,323 | ) |
Curian/Baring International Fixed Income Fund | | | | | | | | | |
Open Forward Foreign Currency Contracts | | $ | — | | $ | (148 | ) | $ | — | | $ | (148 | ) |
Fund Total | | $ | — | | $ | (148 | ) | $ | — | | $ | (148 | ) |
Curian/BlackRock Global Long Short Credit Fund | | | | | | | | | |
Written Options | | $ | (6 | ) | $ | — | | $ | — | | $ | (6 | ) |
Exchange Traded Futures Options on Futures | | (41 | ) | — | | — | | (41 | ) |
Open Futures Contracts | | (649 | ) | — | | — | | (649 | ) |
Open Forward Foreign Currency Contracts | | — | | (537 | ) | — | | (537 | ) |
Centrally Cleared Interest Rate Swap Agreements | | — | | (277 | ) | — | | (277 | ) |
OTC Credit Default Swap Agreements | | — | | (1,731 | ) | — | | (1,731 | ) |
Centrally Cleared Credit Default Swap Agreements | | — | | (177 | ) | — | | (177 | ) |
OTC Total Return Swap Agreements | | — | | (223 | ) | — | | (223 | ) |
Fund Total | | $ | (696 | ) | $ | (2,945 | ) | $ | — | | $ | (3,641 | ) |
Curian/Eaton Vance Global Macro Absolute Return Advantage Fund | | | | | | | | | |
Written Options | | $ | — | | $ | (6,243 | ) | $ | — | | $ | (6,243 | ) |
Open Futures Contracts | | (958 | ) | — | | — | | (958 | ) |
Open Forward Foreign Currency Contracts | | — | | (4,680 | ) | — | | (4,680 | ) |
OTC Interest Rate Swap Agreements | | — | | (2,531 | ) | — | | (2,531 | ) |
Centrally Cleared Interest Rate Swap Agreements | | — | | (2,161 | ) | — | | (2,161 | ) |
OTC Cross Currency Swap Agreements | | — | | (50 | ) | — | | (50 | ) |
OTC Credit Default Swap Agreements | | — | | (2,881 | ) | — | | (2,881 | ) |
OTC Total Return Swap Agreements | | — | | (29 | ) | — | | (29 | ) |
Non-Deliverable Bond Forward Contracts | | — | | (90 | ) | — | | (90 | ) |
Fund Total | | $ | (958 | ) | $ | (18,665 | ) | $ | — | | $ | (19,623 | ) |
Curian/FAMCO Flex Core Covered Call Fund | | | | | | | | | |
Written Options | | $ | (9,556 | ) | $ | (106 | ) | $ | — | | $ | (9,662 | ) |
Fund Total | | $ | (9,556 | ) | $ | (106 | ) | $ | — | | $ | (9,662 | ) |
Curian Long Short Credit Fund | | | | | | | | | |
Open Futures Contracts | | $ | (2,423 | ) | $ | — | | $ | — | | $ | (2,423 | ) |
OTC Credit Default Swap Agreements | | — | | (228 | ) | — | | (228 | ) |
Fund Total | | $ | (2,423 | ) | $ | (228 | ) | $ | — | | $ | (2,651 | ) |
Curian/Neuberger Berman Currency Fund | | | | | | | | | |
Open Forward Foreign Currency Contracts | | $ | — | | $ | (30,935 | ) | $ | — | | $ | (30,935 | ) |
Fund Total | | $ | — | | $ | (30,935 | ) | $ | — | | $ | (30,935 | ) |
Curian/Neuberger Berman Risk Balanced Commodity Strategy Fund | | | | | | | | | |
Open Futures Contracts | | $ | (3,586 | ) | $ | — | | $ | — | | $ | (3,586 | ) |
Fund Total | | $ | (3,586 | ) | $ | — | | $ | — | | $ | (3,586 | ) |
Curian/PIMCO Credit Income Fund | | | | | | | | | |
Written Options | | $ | — | | $ | (166 | ) | $ | — | | $ | (166 | ) |
Open Futures Contracts | | (5 | ) | — | | — | | (5 | ) |
Open Forward Foreign Currency Contracts | | — | | (223 | ) | — | | (223 | ) |
OTC Interest Rate Swap Agreements | | — | | (192 | ) | — | | (192 | ) |
Centrally Cleared Interest Rate Swap Agreements | | — | | (275 | ) | — | | (275 | ) |
OTC Credit Default Swap Agreements | | — | | (138 | ) | — | | (138 | ) |
Fund Total | | $ | (5 | ) | $ | (994 | ) | $ | — | | $ | (999 | ) |
Curian/T. Rowe Price Capital Appreciation Fund | | | | | | | | | |
Written Options | | $ | (27 | ) | $ | (489 | ) | $ | — | | $ | (516 | ) |
Fund Total | | $ | (27 | ) | $ | (489 | ) | $ | — | | $ | (516 | ) |
Curian Variable Series Trust Sub-Advised Funds
Notes to Financial Statements
December 31, 2014
| | | | | | | | | | | | | |
| | Liabilities - Investments in Other Financial Instruments(1) | |
| | Level 1 | | Level 2 | | Level 3 | | Total | |
Curian/UBS Global Long Short Fixed Income Opportunities Fund | | | | | | | | | |
Written Options | | $ | (267 | ) | $ | (3,660 | ) | $ | — | | $ | (3,927 | ) |
Open Futures Contracts | | (15 | ) | — | | — | | (15 | ) |
Open Forward Foreign Currency Contracts | | — | | (197 | ) | — | | (197 | ) |
OTC Interest Rate Swap Agreements | | — | | (1,095 | ) | — | | (1,095 | ) |
Centrally Cleared Interest Rate Swap Agreements | | — | | (8,963 | ) | — | | (8,963 | ) |
OTC Cross Currency Swap Agreements | | — | | (1,128 | ) | — | | (1,128 | ) |
OTC Credit Default Swap Agreements | | — | | (628 | ) | — | | (628 | ) |
Centrally Cleared Credit Default Swap Agreements | | — | | (556 | ) | — | | (556 | ) |
Fund Total | | $ | (282 | ) | $ | (16,227 | ) | $ | — | | $ | (16,509 | ) |
| | | | | | | | | | | | | |
| | | | | | | | | | | | | | |
(1)All derivatives, except for written options, are reflected at the unrealized appreciation/(depreciation) on the instrument. Written options are reflected at value.
The Funds recognize transfers between levels as of the beginning of the period for financial reporting purposes. The following table summarizes significant transfers (in thousands) between Level 1 and Level 2 valuations for the year ended December 31, 2014.
| | Transfers out of
Level 2 into
Level 1 during
the Period | | Transfers out of
Level 1 into
Level 2 during
the Period | |
Transfers related to the application of statistical fair value pricing including changes between closing and evaluated pricing | | | | | |
Curian/CenterSquare International Real Estate Securities Fund | | | | | |
Common Stocks | | $ | 647 | | $ | 297 | |
Curian/Franklin Templeton Frontier Markets Fund | | | | | |
Common Stocks | | 8,190 | | 18,832 | |
Curian/Schroder Emerging Europe Fund | | | | | |
Common Stocks | | 2,174 | | 2,318 | |
Preferred Stocks | | — | | 301 | |
| | | | | | | |
The following table is a rollforward of Level 3 investments (in thousands) by category for which significant unobservable inputs were used to determine fair value during the year ended December 31, 2014:
| | Balance at
Beginning
of Period | | Transfers
into Level 3
During the
Period(2) | | Transfers out of
Level 3 During
the Period(2) | | Total Realized
and Change in
Unrealized
Gain/(Loss) | | Purchases | | (Sales) | | Balance at
End of
Period | | Net Change in
Unrealized
Appreciation/
(Depreciation) on
Investments Held at
End of Period(1) | |
Curian/Ashmore Emerging Market Small Cap Equity Fund | | | | | | | | | | | | | | | | | |
Common Stocks | | $ | — | | $ | 504 | (3) | $ | (504 | )(3) | $ | — | | $ | — | | $ | — | | $ | — | | $ | — | |
Curian/DoubleLine Total Return Fund | | | | | | | | | | | | | | | | | |
U.S. Government ABS | | $ | — | | $ | — | | $ | (20,275 | )(4) | $ | — | | $ | 20,275 | (4) | $ | — | | $ | — | | $ | — | |
U.S. Government ABS | | — | | — | | (28,291 | )(4) | — | | 28,291 | (4) | — | | — | | — | |
U.S. Government ABS | | — | | — | | (20,438 | )(5) | — | | 20,438 | (5) | — | | — | | — | |
U.S. Government ABS | | — | | — | | (20,606 | )(4) | — | | 20,606 | (4) | — | | — | | — | |
Non-U.S. Government Agency ABS | | — | | — | | (15,075 | )(6) | — | | 15,075 | (6) | — | | — | | — | |
Fund Total | | $ | — | | $ | — | | $ | (104,685 | ) | $ | — | | $ | 104,685 | | $ | — | | $ | — | | $ | — | |
Curian/Franklin Templeton Frontier Markets Fund | | | | | | | | | | | | | | | | | |
Common Stocks | | $ | — | | $ | 2,522 | (7) | $ | (2,522 | )(7) | $ | — | | $ | — | | $ | — | | $ | — | | $ | — | |
Curian Long Short Credit Fund | | | | | | | | | | | | | | | | | |
Non-U.S. Government Agency ABS | | $ | — | | $ | — | | $ | (4,000 | )(8) | $ | — | | $ | 4,000 | (8) | $ | — | | $ | — | | $ | — | |
(1) | Reflects the change in unrealized appreciation/(depreciation) for Level 3 investments held at December 31, 2014. |
(2) | There were no significant transfers between Level 3 and Level 2 valuations during the year ended December 31, 2014 other than those noted. |
(3) | During the year, trading was halted for the common stock held in Curian/Ashmore Emerging Market Small Cap Equity Fund and the common stock was valued at the last trade price and was considered a Level 3 valuation. The common stock resumed trading during the year and is considered a Level 2 valuation based on the application of a statistical fair value price. |
(4) | During the year, the valuation of the U.S. Government ABS held in Curian/DoubleLine Total Return Fund was transferred from a Level 3 valuation to a Level 2 valuation. The security is currently valued by an approved independent pricing service and considered a Level 2 valuation. Previously, it was valued based on the transaction purchase price and considered a Level 3 valuation. |
(5) | During the year, the valuation of the U.S. Government ABS held in Curian/DoubleLine Total Return Fund was transferred from a Level 3 valuation to a Level 2 valuation. The security is currently valued by an approved independent pricing service and considered a Level 2 valuation. Previously, it was valued using a single source broker quote and considered a Level 3 valuation. |
(6) | During the year, the valuation of the Non-U.S. Government Agency ABS held in Curian/DoubleLine Total Return Fund was transferred from a Level 3 valuation to a Level 2 valuation. The security is currently valued by an approved independent pricing service and considered a Level 2 valuation. Previously, it was valued based on the transaction purchase price and considered a Level 3 valuation. |
Curian Variable Series Trust Sub-Advised Funds
Notes to Financial Statements
December 31, 2014
(7) | At the beginning of the year and at the end of the year, the valuation of the common stock held in Curian/Franklin Templeton Frontier Markets Fund was determined using the official closing price on the exchange where the common stock was principally traded and considered a Level 1 valuation. During the year, shares of the common stock halted trading in advance of a planned reorganization and the fair value measurement was determined using a recent transaction price and considered a Level 3 valuation. The common stock resumed trading during the year and the valuation was determined using the official closing price. |
(8) | During the year, the valuation of the Non-U.S. Government Agency ABS held in Curian Long Short Credit Fund was transferred from a Level 3 valuation to a Level 2 valuation. The security is currently valued by an approved independent pricing service and considered a Level 2 valuation. Previously, it was valued based on the transaction purchase price and considered a Level 3 valuation. |
Significant changes in unobservable valuation inputs to a different amount might result in a significantly higher or lower fair value measurement than the one used in a security’s valuation.
NOTE 4. SECURITIES AND OTHER INVESTMENTS
Securities Lending and Securities Lending Collateral - The Funds participate in an agency based securities lending program. Per the securities lending agreement, the securities lending agent is authorized to loan securities on behalf of the Funds to approved borrowers and is required to maintain collateral. Each Fund receives cash collateral against the loaned securities in an amount equal to at least 100% of the market value of the loaned securities. Collateral is maintained over the life of the loan in an amount not less than 100% of the market value of loaned securities, as determined at the close of fund business each day; any additional collateral required due to changes in security values is delivered to the Fund on the next business day. The Fund receives income from the investment of cash collateral, in addition to lending fees and rebates paid by the borrower. The Fund bears the market risk with respect to the collateral investment and securities loaned. The Fund also bears the risk that the agent may default on its obligations to the Fund. The securities lending agent has agreed to indemnify the Fund in the event of default by a third party borrower.
JPMorgan Chase Bank, N.A. (“JPM Chase” or “Custodian”) serves as securities lending agent to the Trust. The Funds invest cash collateral in money market funds and overnight repurchase agreements which are collateralized fully by U.S. government and agency securities. Each Fund also bears the risk of any deficiency in the amount of collateral available for return to a borrower due to a decline in value of an approved investment.
Cash collateral received from the borrower is recorded in the Statements of Assets and Liabilities as payable upon return of securities loaned. Investments acquired with such cash collateral are reported in a manner consistent with other portfolio investments held by each Fund as investment - at value on the Statements of Assets and Liabilities. The value of securities on loan is disclosed under footnote (d) on the Statements of Assets and Liabilities. Each Fund’s net exposure to a borrower is determined by the amount of any excess or shortfall in cash collateral received compared to the value of securities on loan.
U.S. Government Agencies or Government Sponsored Enterprises - Certain Funds may invest in U.S. government agencies or government sponsored enterprises. U.S. Government securities are obligations of, and in certain cases, guaranteed by, the U.S. government, its agencies or instrumentalities. Some U.S. Government securities, such as Treasury bills, notes and bonds, and securities guaranteed by the Government National Mortgage Association, are supported by the full faith and credit of the U.S. government; others, such as those of the Federal Home Loan Bank, are supported by the right of the issuer to borrow from the U.S. Department of the Treasury (“U.S. Treasury”); others, such as those of the Federal National Mortgage Association (“FNMA” or “Fannie Mae”), are supported by the discretionary authority of the U.S. government to purchase the agency’s obligations; and still others, such as those of the Student Loan Marketing Association, are supported only by the credit of the instrumentality. U.S. Government securities may include zero coupon securities, which do not distribute interest on a current basis and tend to be subject to greater risk than interest paying securities of similar maturities.
Government-related guarantors (i.e., guarantors that are not backed by the full faith and credit of the U.S. government) include FNMA and the Federal Home Loan Mortgage Corporation (“FHLMC” or “Freddie Mac”). FNMA purchases conventional (i.e., not insured or guaranteed by any government agency) residential mortgages from a list of approved seller/servicers, which include state and federally chartered savings and loan associations, mutual savings banks, commercial banks and credit unions and mortgage bankers. Pass-through securities issued by FNMA are guaranteed as to timely payment of principal and interest by FNMA, but are not backed by the full faith and credit of the U.S. government. FHLMC issues Participation Certificates (“PCs”), which are pass-through securities, each representing an undivided interest in a pool of residential mortgages. FHLMC guarantees the timely payment of interest and ultimate collection of principal, but PCs are not backed by the full faith and credit of the U.S. government.
FNMA and FHMLC were placed into conservatorship by the Federal Housing Finance Agency (“FHFA”). As the conservator, FHFA succeeded to all rights, titles, powers and privileges of FNMA and FHLMC and of any stockholder, officer or director of FNMA and FHLMC with respect to FNMA and FHLMC and each enterprise’s assets. In connection with the conservatorship, the U.S. Treasury entered into a Senior Preferred Stock Purchase Agreement with FNMA and FHLMC. This agreement contains various covenants that severely limit each enterprise’s operations. In exchange for entering into these agreements, the U.S. Treasury received senior preferred stock in each enterprise and warrants to purchase each enterprise’s common stock. The U.S. Treasury created a new secured lending facility, which is available to FNMA and FHLMC as a liquidity backstop and created a temporary program to purchase mortgage-backed securities issued by FNMA and FHLMC. FNMA and FHLMC are continuing to operate as going concerns while in conservatorship and each remains liable for all of its obligations, including its guaranty obligations, associated with its mortgage-backed securities.
Unregistered Securities - A Fund may own certain investment securities, which are unregistered and thus restricted to resale. These securities may also be referred to as “private placements.” Unregistered securities may be “illiquid” because there is no readily available market for sale of the securities. Where future dispositions of the securities require registration under the 1933 Act, the Funds have the right to include those securities in such registration generally without cost to the Funds. The Funds have no right to require registration of unregistered securities.
Curian Variable Series Trust Sub-Advised Funds
Notes to Financial Statements
December 31, 2014
Repurchase Agreements - Certain Funds may invest in repurchase agreements. In a repurchase agreement, a Fund receives debt or equity securities (collateral) subject to an obligation of the seller to repurchase, and the Fund to resell, the securities at an agreed upon price and date. Certain repurchase agreements used to settle short sale transactions have no stated maturity and can be terminated by either party at any time. The underlying securities used as collateral for repurchase agreements may be held in safekeeping by the Fund’s Custodian or designated sub-custodians under triparty repurchase agreements or delivered to the counterparty. In certain repurchase agreements, the Fund takes possession of the underlying debt obligation. Earnings on collateral and compensation to the seller are based on agreed upon rates between the seller and the Fund. Net interest earned on repurchase agreements is recorded as interest income and net fees paid to the seller are recorded as short holdings borrowing fees. In periods of increased demand for collateral, the Fund may pay a fee for receipt of the collateral, which may result in interest expense to the Fund. When a repurchase agreement is entered into, a Fund typically receives securities with a value that approximates or exceeds the repurchase price, including any accrued interest earned on the repurchase agreement. The value of such securities will be marked to market daily, and cash or additional securities will be exchanged between the parties with a frequency and in amounts prescribed in the repurchase agreement. In the event of a default by the counterparty, realization of the collateral proceeds could be delayed, during which time the value of such collateral may decline.
Reverse Repurchase Agreements - Certain Funds may enter into reverse repurchase agreements. In a reverse repurchase agreement, a Fund delivers to a counterparty a security in exchange for cash with a simultaneous agreement to repurchase the same or substantially the same security at an agreed upon price and date. Cash received in exchange for securities delivered plus accrued interest to be paid by the Fund are reflected as liabilities on the Statements of Assets and Liabilities. Interest paid is recorded as interest expense to the Fund. The Fund receives principal and interest payments, if any, made on the security delivered to the counterparty during the term of the agreement. In periods of increased demand of the security, the Fund may receive a fee for use of the security by the counterparty, which may result in interest income to the Fund. A reverse repurchase agreement involves the risk that the value of the security delivered by the Fund may decline below the repurchase price of the security. A Fund will segregate assets determined to be liquid at the Custodian or otherwise cover its obligations under reverse repurchase agreements.
The average daily balance (in thousands) and the weighted average interest rate for reverse repurchase agreements, for the year ended December 31, 2014, were as follows: Curian/BlackRock Global Long Short Credit Fund, $7,889 and 0.10%, respectively, for 229 days outstanding; and Curian/Eaton Vance Global Macro Absolute Return Advantage Fund, $1,160 and 0.00%, respectively, for 65 days outstanding. The value of reverse repurchase agreements and collateral pledged or received at December 31, 2014 was as follows:
| | Counter-
party | | Payable for Reverse
Repurchase Agreement
Including Interest Payable | | Collateral Amount | | Interest Rate
(Income) / Expense | | Date of
Agreement | | Maturity Date | |
Curian/Eaton Vance Global Macro Absolute Return Advantage Fund | | CIT | | $ | 1,074 | | $ | 1,098 | | (1.00 | )% | 10/27/14 | | rolling maturity | |
| | CIT | | 280 | | 294 | | (1.00 | ) | 12/11/14 | | rolling maturity | |
| | | | | | | | | | | | | | | |
Mortgage-Backed Dollar and Treasury Roll Transactions - Certain Funds may sell mortgage-backed or treasury securities and simultaneously contract to repurchase securities at a future date at an agreed upon price. A Fund may only enter into covered rolls. A “covered roll” is a type of dollar roll for which a Fund maintains offsetting positions in cash, U.S. Government securities, or other liquid assets which mature on or before the forward repurchase settlement date of the dollar roll transaction. During the period between the sale and repurchase, a Fund forgoes interest and principal paid on the mortgage-backed securities. A Fund is compensated by the interest earned on the cash proceeds of the initial sale and from negotiated fees paid by brokers offered as an inducement to the Fund to “roll over” its purchase commitments. A Fund may dispose of “covered roll” securities after they are entered into and close these positions before their maturity, which may result in a realized gain or loss.
In a mortgage-backed or treasury securities roll transaction, if the repurchased security is determined to be similar, but not substantially the same, the transaction is accounted for as a purchase and sale. Any gains, losses and any income or fees earned are recorded to realized gain or loss. If the repurchased security is determined to be substantially the same, the transaction is accounted for as a secured borrowing, rather than as a purchase and sales transaction. Any income or fees earned are recorded to investment income and financing costs associated with the transaction are recorded to interest expense.
Dollar roll transactions involve the risk that the market value of the securities sold by a Fund may decline below the repurchase price of those securities which the Fund is obligated to purchase or that the return earned by the Fund with the proceeds of a dollar roll may not exceed transaction costs.
The Curian/PIMCO Credit Income Fund had treasury roll transactions during the year. The average daily balance (in thousands) and weighted average interest rate for treasury rolls, for the year ended December 31, 2014, were $2,391 and 0.04%, respectively, for 176 days outstanding. At December 31, 2014, Curian/PIMCO Credit Income Fund had $2 of deferred income (in thousands) included in payable for treasury roll transactions on the Statements of Assets and Liabilities.
Inflation-Indexed Bonds - Certain Funds may invest in inflation-indexed bonds which are fixed income securities whose principal value is periodically adjusted to the rate of inflation. The interest rate on these bonds is generally fixed at issuance at a rate lower than typical bonds. Over the life of an inflation-indexed bond, however, interest will be paid based on a principal value which is adjusted for inflation. Any increase in the principal amount of an inflation-indexed bond will be considered interest income, even though investors do not receive principal payments until maturity.
Curian Variable Series Trust Sub-Advised Funds
Notes to Financial Statements
December 31, 2014
Senior and Junior Loans - Certain Funds may invest in Senior loans or secured and unsecured subordinated loans, second lien loans and subordinated bridge loans (“Junior loans”) which are purchased or sold on a when-issued or delayed-delivery basis and may be settled a month or more after the trade date. Interest income on these loans is accrued based on the terms of the securities. Senior and Junior loans can be acquired through an agent, by assignment from another holder of the loan, or as a participation interest in another holder’s portion of the loan.
Securities Sold Short - Certain Funds may enter into short sales transactions whereby the Fund sells a security it does not own in anticipation of a decline in the market price of the security or to engage in arbitrage transactions. When a Fund engages in a short sale, the Fund borrows the security sold short to make delivery to the buyer. The Fund may have to pay a fee to borrow securities and is often obligated to repay the lender of the securities for any interest or dividends that accrues on the borrowed securities during the period of the loan. Until the Fund closes its short position, the lending broker requires assets to be segregated as collateral, which is marked-to-market daily, to the extent necessary to meet margin requirements or cover the short sale obligation. A Fund is obligated to deliver securities at the market price at the time the short position is closed. If the price of the security sold short increases between the time of the short sale and the time that the Fund replaces the borrowed security, the Fund will incur a capital loss; conversely, if the price declines, the Fund will realize a capital gain. A Fund’s loss on a short sale could theoretically be unlimited in cases where the Fund is unable, for whatever reason, to close out its short position.
Convertible Securities - Certain Funds may invest in fixed-income securities which are convertible into common stock. Convertible securities may be converted either at a stated price or rate within a specified period of time into a specified number of shares of common stock. Traditionally, convertible securities have paid dividends or interest greater than on the related common stocks, but less than fixed income non-convertible securities. By investing in a convertible security, a Fund may participate in any capital appreciation or depreciation of a company’s stock, but to a lesser degree than if it had invested in that company’s common stock. Convertible securities rank senior to common stock in a corporation’s capital structure and, therefore, entail less risk than the corporation’s common stock. A Fund may attempt to hedge certain of their investments in convertible debt securities by selling short the issuer’s common stock.
Participatory Note Securities - Certain Funds may invest in Participatory Notes (“P-Notes”). P-Notes are promissory notes that are designed to offer a return linked to the performance of a particular underlying equity security or market. P-Notes are issued by banks or broker-dealers and allow a Fund to gain exposure to common stocks in markets where direct investment by the Fund may not be allowed or efficient. A Fund may tender a P-Note for cash payment in an amount that reflects the current market value of the underlying equity investments or market, reduced by program fees.
Real Estate Investment Trusts - Certain Funds may invest in Real Estate Investment Trusts (“REITs”). REITs are traded as a stock on major stock exchanges and invest in real estate directly, either through properties or mortgages. REITs typically concentrate on a specific geographic region or property type, receive special tax considerations and are a liquid method of investing in real estate.
Master Limited Partnerships - Certain Funds may invest in Master Limited Partnerships (“MLPs”). An MLP is a publicly traded company organized as a limited partnership or limited liability company and treated as a partnership for Federal income tax purposes. The benefit derived from the Fund’s investment in MLPs is largely dependent on the MLPs being treated as partnerships for federal income tax purposes. MLPs may derive income and gains from the exploration, development, mining or production, processing, refining, transportation (including pipelines transporting gas, oil, or products thereof), or the marketing of any mineral or natural resources.
Unfunded Commitments - Certain Funds may enter into certain credit agreements, all or a portion of which may be unfunded. The Fund is obligated to fund these loan commitments at the borrowers’ discretion. Unfunded loan commitments and funded portions of credit agreements are marked-to-market daily. Funded portions of credit agreements are presented in the Schedules of Investments. The following table details unfunded loan commitments (in thousands) at December 31, 2014:
| | Unfunded
Commitment | | Appreciation | |
Curian/Eaton Vance Global Macro Absolute Return Advantage Fund | | | | | |
Ethiopian Railways Corp. Term Loan, 4.07%, 08/01/21 | | $ | 228 | | $ | — | |
| | | | | | | |
Unrealized appreciation on unfunded commitments is reflected in other assets and payable for investment securities purchased in the Statements of Assets and Liabilities and unrealized appreciation on investments in the Statements of Operations.
NOTE 5. INVESTMENT TRANSACTION AGREEMENTS AND COLLATERAL
Under various agreements, certain investment transactions require collateral to be pledged to/from a Fund and a counterparty or segregated at the custodian. U.S. Treasury Bills and U.S. dollars are generally the preferred forms of collateral, although other forms of high quality or sovereign securities may be used. Securities held by a Fund that are used as collateral are identified as such within the Schedules of Investments. Collateral for OTC financial derivative transactions paid to or received from brokers and counterparties is included in receivable for deposits with brokers and counterparties and due to brokers and counterparties for deposits in the Statements of Assets and Liabilities.
Master Netting Agreements (“Master Agreements”) - Certain Funds are subject to various Master Agreements, which govern the terms of certain transactions and mitigate the counterparty risk associated with relevant transactions by specifying credit protection mechanisms and providing standardization that improves legal certainty. Since different types of financial transactions have different mechanics and are sometimes traded out of different legal entities of a particular counterparty organization, each type of transaction may be covered by a different Master Agreement, potentially
Curian Variable Series Trust Sub-Advised Funds
Notes to Financial Statements
December 31, 2014
resulting in the need for multiple agreements with a single counterparty. A Fund may net exposure and collateralize multiple transaction types governed by the same Master Agreement with the same counterparty and may close out and net its total exposure to a counterparty in the event of a default and/or termination event with respect to all the transactions governed under a single agreement with a counterparty. Each Master Agreement defines whether the Fund is contractually able to net settle daily payments. Additionally, certain circumstances, such as laws of a particular jurisdiction or settlement of amounts due in different currencies, may prohibit or restrict the right of offset as defined in the Master Agreements.
Master Agreements also help limit credit and counterparty risk by specifying collateral posting arrangements at pre-arranged exposure levels. Under the Master Agreements, collateral is routinely transferred if the total net exposure to certain transactions (net of existing collateral) governed under the relevant master agreement with a counterparty in a given account exceeds a specified threshold depending on the counterparty and the type of Master Agreement. A Fund’s overall exposure to counterparty risk can change substantially within a short period, as it is affected by each transaction subject to the relevant Master Agreement. To the extent amounts due to a Fund from its counterparties are not fully collateralized, contractually or otherwise, the Fund bears the risk of loss from counterparty non-performance. The Funds’ Sub-Advisers attempt to limit counterparty risk by only entering into Master Agreements with counterparties which the Sub-Adviser believes have the financial resources to honor their obligations and by monitoring the financial stability of those counterparties. For swap agreements executed with a Derivatives Clearing Organization (“DCO”) in a multilateral or other trade facility platform (“centrally cleared swaps”), counterparty risk is reduced by shifting exposure from the counterparty to the DCO. Additionally, the DCO has broad powers to provide an orderly liquidation in the event of a default.
Master Repurchase Agreements and Global Master Repurchase Agreements (individually and collectively “Master Repo Agreements”) - Master Repo Agreements govern repurchase, reverse repurchase and treasury roll transactions between a Fund and select counterparties. The Master Repo Agreements maintain provisions for, among other things, initiation and confirmation, income payments and transfer, events of default, termination, and maintenance of collateral. In the event of default, the total value exposure will be offset against collateral exchanged to date, which would result in a net receivable/(payable) that would be due from/to the counterparty. Securities purchased under repurchase agreements are reflected as an asset on a Fund’s Statement of Assets and Liabilities. The value of repurchase agreements and collateral pledged or received by a counterparty are disclosed in the Schedules of Investments. A Fund’s net exposure to the counterparty is determined by the amount of any excess or shortfall in collateral compared to the value of the repurchase or reverse repurchase agreement.
Master Securities Forward Transaction Agreements (“Master Forward Agreements”) - Master Forward Agreements govern the considerations and factors surrounding the settlement of certain forward-settling transactions, such as delayed-delivery transactions, “To Be Announced” (“TBA”) securities and treasury roll transactions between a Fund and select counterparties. The Master Forward Agreements maintain provisions for, among other things, initiation and confirmation, payment and transfer, events of default, termination, and maintenance of collateral. Losses may arise due to changes in the value of the underlying securities prior to settlement date, if the counterparty does not perform under the contract’s terms, or if the issuer does not issue the securities due to political, economic or other factors. In the event of default, the unrealized gain or loss will be offset against collateral exchanged to date, which would result in a net receivable/(payable) that would be due from/to the counterparty. In the ordinary course of business, settlements of transactions are not typically subject to net settlement, except for TBA pools.
International Swaps and Derivatives Association Inc. Master Agreements and Credit Support Annexes (“ISDA Master Agreements”) - ISDA Master Agreements govern OTC financial derivative transactions entered into by a Fund’s Sub-Adviser and select counterparties. The ISDA Master Agreements maintain provisions for general obligations, representations, agreements, events of default, termination and maintenance of collateral. Termination includes conditions that may entitle counterparties to elect to terminate early and cause settlement of all outstanding transactions under the applicable ISDA Master Agreement. Any election to early termination could be material to the financial statements. In the event of default, the total financial derivative value exposure will be offset against collateral exchanged to date, which would result in a net receivable/(payable) that would be due from/to the counterparty. The amount of collateral exchanged is based on provisions within the ISDA Master Agreements and is determined by the net exposure with the counterparty and is not identified for a specific OTC derivative instrument.
Customer Account Agreements - Customer Account Agreements and related addendums govern cleared derivative transactions such as futures, options on futures and centrally cleared derivatives. If a Fund transacts in centrally cleared derivatives, the Sub-Adviser is a party to agreements with (1) a Futures Commissions Merchant (“FCM”) in which the FCM facilitates the execution of the centrally cleared derivative with the DCO and (2) with an executing broker/swap dealer to agree to the terms of the swap and resolution process in the event the centrally cleared swap is not accepted for clearing by the designated DCO. Cleared derivatives transactions require posting an amount of cash or cash equivalents equal to a certain percentage of the contract amount known as the “initial margin” as determined by each relevant clearing agency and is segregated at an FCM which is registered with the Commodity Futures Trading Commission (“CFTC”) or the applicable regulator. The Fund receives from, or pays to, the counterparty an amount of cash equal to the daily fluctuation in the value of the contracts. Such receipts or payments are known as the “variation margin”. Variation margin received may not be netted between futures and centrally cleared derivatives. In the event of default, counterparty risk is significantly reduced as creditors to the FCM do not have claim to the Fund’s assets in the segregated account. Additionally, portability of exposure in the event of default further reduces risk.
Prime Brokerage Arrangements - Certain Funds may enter into Prime Brokerage Arrangements to facilitate execution and/or clearing of listed equity option transactions or short sales of securities between the Fund and select counterparties. The arrangements provide general guidelines surrounding the rights, obligations and other events, including but not limited to, margin, execution and settlement. These arrangements maintain provisions for, among other things, payments, maintenance of collateral, events of default and termination. Margin and securities delivered as collateral are typically in the possession of the prime broker and offset any obligations due to the prime broker. In the event of default, the value of securities sold short will be offset against collateral exchanged to date, which would result in a net receivable/(payable) that would be due from/to the counterparty.
Curian Variable Series Trust Sub-Advised Funds
Notes to Financial Statements
December 31, 2014
NOTE 6. FINANCIAL DERIVATIVE INSTRUMENTS
Options Transactions - A Fund may buy and sell (“write”) call and put options on securities, futures, indices, currencies and swap agreements (“swaptions”). An option is a contract that gives the purchaser of the option, in return for a premium paid, the right to buy a specified underlying instrument from the writer of the option (in the case of a call option), or to sell a specified underlying instrument to the writer of the option (in the case of a put option) at a designated price. The right to exercise is dependent upon the contract terms and can be during the term or at expiration of the option. When a Fund purchases an option, the premium paid by the Fund is recorded as an asset and is subsequently marked-to-market to reflect the current value of the option. Premiums paid for purchasing options which expire are treated as realized losses. Premiums paid for purchasing options which are exercised or closed are added to the cost basis of the underlying investment or offset against the proceeds of the underlying investment transaction to determine realized gain or loss. Purchasing call options tends to increase a Fund’s exposure to the underlying instrument. Purchasing put options tends to decrease a Fund’s exposure to the underlying instrument. The risks associated with purchasing options are limited to premiums paid and the failure of the counterparty to honor its obligation under the contract. When a Fund writes a call or put option, the premium received by the Fund is recorded as a liability and is subsequently marked-to-market to reflect the current value of the option. Premiums received from writing options which expire are treated as realized gains. Premiums received from writing options which are exercised or closed are added to the proceeds of the underlying investment transaction or reduce the cost basis of the underlying investment to determine the realized gain or loss. Writing call options tends to decrease a Fund’s exposure to the underlying instrument. Writing put options tends to increase a Fund’s exposure to the underlying instrument. The risk associated with writing an option that is exercised is that an unfavorable change in the price of the security underlying the option could result in a Fund buying the underlying security at a price higher than the current value or selling the underlying security at a price lower than the current market value. There is also the risk a Fund may not be able to enter into a closing transaction if the market is illiquid. Options written by a Fund do not give rise to counterparty credit risk, as they obligate the Fund, not the counterparty, to perform.
Depending on the exchange on which an exchange traded futures option is traded, premium may be paid/received when purchasing/writing the option or there may be no premium paid/received when purchasing/writing the option. Exchange traded futures options are marked-to-market daily and the change in value is recorded by the Fund as an unrealized gain or loss. Variation margin on these options is recorded by the Fund until the contracts are terminated at which time realized gains and losses are recognized. Exchange traded futures options involve to varying degrees, risk of loss in excess of the variation margin recorded by the Fund.
Swaptions are similar to options on securities except that instead of purchasing the right to buy or sell a security, the writer or purchaser of the swaption is granting or buying the right to enter into a previously agreed upon interest rate or credit default swap agreement. The right to exercise is dependent upon the contract terms and can be during the term or at expiration of the option. Swaptions are illiquid investments.
Futures Contracts - A Fund may buy and sell futures on equities, indices, interest rates, commodities, currencies and swaps. A futures contract is a standardized contract obligating two parties to exchange a specified asset at an agreed upon price and date. Variation margin is recorded by the Fund until the contracts are terminated at which time realized gains and losses are recognized. Futures contracts involve to varying degrees, risk of loss in excess of the variation margin recorded by the Fund. The primary risks associated with the use of futures contracts are the imperfect correlation between the change in value of the securities held by a Fund or the change in the value of an underlying entity and the prices of the futures contracts and the possibility a Fund may not be able to enter into a closing transaction because of an illiquid market. With futures, counterparty risk to a Fund is reduced since futures contracts are exchange traded and the exchange’s clearinghouse, acting as counterparty to all exchange traded futures, guarantees the futures contracts against default.
Forward Foreign Currency Contracts - A forward foreign currency contract is an agreement between two parties to buy and sell a currency at a set price on a future date. The use of forward foreign currency contracts does not eliminate fluctuations in the underlying prices of a Fund’s investment securities, but it does establish a fixed rate of currency exchange that can be achieved in the future. The value of a forward foreign currency contract fluctuates with changes in foreign currency exchange rates. Forward foreign currency contracts are marked-to-market daily and the change in value is recorded by a Fund as an unrealized gain or loss and as a receivable or payable from forward foreign currency contracts. Upon settlement, or delivery or receipt of the currency, a realized gain or loss is recorded which is equal to the difference between the value of the contract at the time it was opened and the value at the time it was closed. Forward foreign currency contracts involve market risk in excess of the receivable or payable related to forward foreign currency contracts recorded by the Funds. Although contracts limit the risk of loss due to a decline in the value of the hedged currency, they also limit any potential gain that might result should the value of the currency increase. Additionally, a Fund could be exposed to the risk of a previously hedged position becoming unhedged if the counterparty to a contract is unable to meet the terms of the contract or if the currency changes unfavorably to the value of the offsetting currency.
Swap Agreements - Swap agreements are bilaterally negotiated agreements between a Fund and a counterparty to exchange or swap investment cash flows, assets, foreign currencies or market-linked returns at specified, future intervals. Swap agreements may be privately negotiated in the OTC market or executed and centrally cleared with a DCO. OTC swaps are typically illiquid investments.
Swap agreements are marked-to-market daily and the change in value is recorded by a Fund as an unrealized gain or loss. For OTC swaps, premiums paid or received at the beginning of the measurement period are recorded as an asset or liability by the Fund and represent payments made or received upon entering into the OTC swap to compensate for differences between the stated terms of the OTC swap and prevailing market conditions relating to credit spreads, interest rates, currency exchange rates and other relevant factors as appropriate. These upfront payments are recorded as a realized gain or loss upon termination or maturity of the OTC swap. For centrally cleared swaps, daily changes in valuation are recorded as a receivable or payable, as appropriate, and received from or paid to the DCO on a daily basis until the contracts are terminated at which time a realized gain or loss is recorded. The
Curian Variable Series Trust Sub-Advised Funds
Notes to Financial Statements
December 31, 2014
use of centrally cleared swaps may require a Fund to commit initial and variation margin that may otherwise not be required under an OTC swap. A liquidation payment received or made at the termination of the swap agreement is recorded as a realized gain or loss. Net periodic payments received or paid by a Fund are included as part of realized gain or loss.
Entering into swap agreements involves, to varying degrees, elements of interest, credit, market and documentation risk in excess of the unrealized gain or loss recorded by a Fund. Such risks include that there is no liquid market for OTC swaps, that the counterparty to the agreements may default on its obligation to perform or disagree as to the meaning of contractual terms in the agreement and that there may be unfavorable changes in interest rates or value of underlying securities. Centrally cleared swaps involve to varying degrees, risk of loss in excess of the variation margin recorded by the Fund.
Interest Rate Swap Agreements - Interest rate swap agreements involve the exchange by a Fund with another party of their respective commitments to pay or receive interest with respect to the notional amount of principal. Forms of interest rate swap agreements that the Funds have entered into include: fixed-for-floating rate swaps, under which a party agrees to pay a fixed rate in exchange for receiving a floating rate tied to a benchmark, floating-for-fixed rate swaps, under which a party agrees to pay a floating rate in exchange for receiving a fixed rate and floating-for-floating rate swaps, under which a party agrees to pay a floating rate in exchange for another floating rate.
A Fund’s maximum risk of loss from counterparty credit risk for an interest rate swap agreement is the discounted net value of the cash flows to be received from the counterparty over the contract’s remaining life, to the extent this amount is positive.
Cross-Currency Swap Agreements - Cross-currency swaps are interest rate swaps in which one party pays a stream of interest payments, either fixed or floating, in exchange for another party’s stream of interest payments, either fixed or floating, based on the notional amounts of two different currencies. The notional amounts are typically determined based on the spot exchange rates at the inception of the trade. Cross-currency swaps may also involve an exchange of notional amounts at the start, during or at expiration of the contract, either at the current spot or another specified rate. A Fund’s maximum risk of loss from counterparty credit risk is generally the aggregate unrealized gain netted against any collateral pledged by the counterparty.
Credit Default Swap Agreements - Credit default swap agreements involve one party making a stream of payments (referred to as the buyer of protection) to another party (the seller of protection) in exchange for the right to receive a specified return if a credit event occurs for the referenced entity, obligation or index. As a seller of protection, a Fund will generally receive from the buyer of protection a premium in return for such protection and/or a fixed rate of income throughout the term of the swap if there is no credit event. A credit event is defined under the terms of each swap agreement and may include, but is not limited to, underlying entity default, bankruptcy, restructuring, write-down, principal shortfall or interest shortfall. As a seller, a Fund adds leverage to its portfolio because, in addition to its total net assets, the Fund is subject to investment exposure on the notional amount of the credit default swap. If a Fund is a seller or buyer of protection and a credit event occurs, as defined under the terms of that particular credit default swap agreement, the Fund will either pay to or receive from the buyer or seller of protection an amount prescribed in that particular swap agreement. Until a credit event occurs, recovery values are determined by market makers considering either industry standard recovery rates or entity specific factors and considerations. When a credit event occurs, the recovery value is determined by a facilitated auction, administered by ISDA, whereby a minimum number of allowable broker bids, together with a specified valuation method, are used to calculate the settlement value.
A Fund may use credit default swap agreements on corporate or sovereign issues to provide a measure of protection against defaults of an issuer (i.e., to reduce risk where a Fund owns or has exposure to the referenced obligation) or to take an active long or short position with respect to the likelihood of a particular issuer’s default. If a credit event occurs and cash settlement is not elected, a variety of other deliverable obligations may be delivered in lieu of the specific referenced obligation. The ability to deliver other obligations may result in a cheapest-to-deliver option (the buyer of protection’s right to choose the deliverable obligation with the lowest value following a credit event.)
A Fund may use credit default swap agreements on credit indices to hedge a portfolio of credit default swap agreements or bonds, to protect investors owning bonds against default and to speculate on changes in credit quality. A credit index is a basket of credit instruments or exposures designed to represent a portion of the credit market. These indices consist of reference credits that are considered to be the liquid entities in the credit default swap market based on the index sector. Components of the indices may include, but are not limited to, investment grade securities, high yield securities, asset-backed securities and emerging market securities. These components can be determined based upon various credit ratings within each sector. Credit indices are traded using credit default swaps with standardized terms including a fixed spread and standard maturity dates. An index credit default swap references all the issuers in the index, and if there is a credit event, the credit event is settled based on that issuer’s weight in the index. The composition of the indices changes periodically, usually every six months, and for most indices, each issuer has an equal weight in the index.
Either as a seller of protection or a buyer of protection of a credit default swap agreement, a Fund’s maximum risk of loss from counterparty risk is the fair value of the agreement. The maximum potential amount of future payments (undiscounted) that a Fund as a seller of protection could be required to make under a credit default swap agreement would be an amount equal to the notional amount of the agreement. Notional amounts of all credit default swap agreements outstanding as of December 31, 2014, for which a Fund is the seller of protection, are disclosed in the Schedules of Investments. These potential amounts would be partially offset by any recovery values of the respective referenced obligations, upfront payments received upon entering into the agreement or net amounts received from the settlement of buy protection credit default swap agreements entered into by the Fund for the same referenced entity or entities.
Total Return Swap Agreements - Some total return swap agreements involve a commitment to pay periodic interest payments in exchange for a market linked return based on a security or a basket of securities. To the extent the total return of the security, index or other financial measure underlying the
Curian Variable Series Trust Sub-Advised Funds
Notes to Financial Statements
December 31, 2014
transaction exceeds or falls short of the offsetting interest rate obligation, a Fund will receive a payment from or make a payment to the counterparty. A Fund’s maximum risk of loss from counterparty credit risk for this type of total return swap agreement is the discounted net value of the cash flows to be received from or paid to the counterparty over the contract’s remaining life, to the extent this amount is positive. Other total return swap agreements involve a right to receive the appreciation in value of a specified security, index or other instrument in return for a fee paid to the counterparty, which will typically be an agreed upon rate. To the extent the underlying asset declines in value over the term of the swap, a Fund may also be required to pay the value of that decline to the counterparty. A Fund’s maximum risk of loss from counterparty credit risk for this type of total return swap agreement is the value of the underlying security, index or other financial instrument.
Non-Deliverable Bond Forward Contracts - A non-deliverable bond forward contract is a short-term forward agreement between two parties to buy or sell a bond denominated in a non-deliverable foreign currency at a specified price and date. Non-deliverable bond forward contracts are marked-to-market daily and change in value is recorded by a Fund as an unrealized gain or loss. A realized gain or loss is recorded upon termination of the contract. The use of these instruments involves the risk that the counterparty to the agreements may default on its obligation to perform. These contracts may be illiquid, and changes in their values may not directly correlate with changes in the value of the underlying security. The maximum amount of potential loss for a non-deliverable bond forward contract is the value of the contract.
FASB ASC Topic 815, “Derivatives and Hedging” and Financial Instruments Eligible for Offset - FASB ASC Topic 815 includes the requirement for enhanced qualitative disclosures about objectives and strategies for using derivative instruments and disclosures regarding credit related contingent features in derivative instruments; as well as quantitative disclosures in the semi-annual and annual financial statements about fair value, gains and losses, and volume of activity for derivative instruments. Information about these instruments is disclosed in the context of each instrument’s primary underlying risk exposure which is categorized as credit, commodity, equity price, interest rate and foreign currency exchange rate risk. The following disclosures include: (1) Objectives and strategies for each Fund’s derivative investments during the year. (2) A summary table (in thousands) of the fair valuations of each Fund’s derivative instruments categorized by risk exposure, which references the location on the Statements of Assets and Liabilities and the realized and unrealized gain or loss on the Statements of Operations for each derivative instrument as of December 31, 2014. Funds which held only one type of derivative during the year are not included in the tables as the location on the Statements of Assets and Liabilities and the realized and unrealized gain loss on the Statements of Operations can be referenced directly on each Fund’s respective statements. (3) A summary table (in thousands) of derivative instruments and certain investments of each Fund, which are subject to master netting agreements or a similar agreement and are eligible for offset in the Statements of Assets and Liabilities as of December 31, 2014. For Funds which held only one type of derivative during the year, amounts eligible for offset are presented gross in the Statements of Assets and Liabilities. Net exposure can be referenced in the assets and liabilities on the Statements of Assets and Liabilities and, if collateral exists, the net exposure is offset by collateral identified in the segregated or pledged collateral table. (4) A table reflecting each Fund’s average monthly derivative volume (in thousands) for the year ended December 31, 2014.
Curian Dynamic Risk Advantage — Diversified Fund Derivative Strategies - The Fund entered into futures contracts and total return swap agreements as an efficient means of adjusting overall exposure to certain markets as part of its investment strategy. The Fund entered into forward foreign currency contracts to gain directional exposure to currencies as part of its overall investment strategy.
Curian Dynamic Risk Advantage — Diversified Fund - Derivative Instruments Categorized by Risk Exposure
| | Commodity | | Credit | | Equity | | Foreign
Exchange | | Interest Rate | | Total | |
Fair values of derivative instruments on the Statement of Assets and Liabilities as of December 31, 2014: | | | | | | | | | | | | | |
Assets: | | | | | | | | | | | | | |
Variation margin on financial derivative instruments | | $ | — | | $ | — | | $ | 8 | | $ | — | | $ | 82 | | $ | 90 | |
Unrealized appreciation on OTC swap agreements | | — | | 385 | | 2,697 | | — | | 1,027 | | 4,109 | |
| | $ | — | | $ | 385 | | $ | 2,705 | | $ | — | | $ | 1,109 | | $ | 4,199 | |
Liabilities: | | | | | | | | | | | | | |
Variation margin on financial derivative instruments | | $ | — | | $ | — | | $ | 617 | | $ | — | | $ | — | | $ | 617 | |
Unrealized depreciation on OTC swap agreements | | 94 | | — | | — | | — | | — | | 94 | |
| | $ | 94 | | $ | — | | $ | 617 | | $ | — | | $ | — | | $ | 711 | |
The effect of derivative instruments on the Statement of Operations for the period ended December 31, 2014: | | | | | | | | | | | | | |
Net realized gain (loss) on: | | | | | | | | | | | | | |
Swap agreements | | $ | 1,929 | | $ | (615 | ) | $ | 7,932 | | $ | — | | $ | 4,509 | | $ | 13,755 | |
Foreign currency related items | | — | | — | | — | | (1,659 | ) | — | | (1,659 | ) |
Futures contracts | | — | | — | | 1,187 | | — | | 1,737 | | 2,924 | |
| | $ | 1,929 | | $ | (615 | ) | $ | 9,119 | | $ | (1,659 | ) | $ | 6,246 | | $ | 15,020 | |
Net change in unrealized appreciation (depreciation) on: | | | | | | | | | | | | | |
OTC swap agreements | | $ | (1,616 | ) | $ | 204 | | $ | 2,203 | | $ | — | | $ | 921 | | $ | 1,712 | |
Foreign currency related items | | — | | — | | — | | (48 | ) | — | | (48 | ) |
Futures contracts and centrally cleared swap agreements | | — | | — | | 152 | | — | | 1,849 | | 2,001 | |
| | $ | (1,616 | ) | $ | 204 | | $ | 2,355 | | $ | (48 | ) | $ | 2,770 | | $ | 3,665 | |
Curian Variable Series Trust Sub-Advised Funds
Notes to Financial Statements
December 31, 2014
Curian Dynamic Risk Advantage — Diversified Fund - Derivative and Financial Instruments Eligible for Offset
| | Gross Amount
Presented in the
Statements of
Assets and | | Financial | | | | | | Total Collateral (7) | |
| | Liabilities (3) | | Instruments (4) | | Collateral (5) | | Net Amount (6) | | Cash | | Security | |
Derivative Assets by Counterparty* | | | | | | | | | | | | | |
BCL | | $ | 598 | | $ | — | | $ | — | | $ | 598 | | $ | — | | $ | — | |
BOA | | 814 | | — | | — | | 814 | | — | | — | |
CGM | | 2,697 | | (94 | ) | (2,603 | ) | — | | 3,890 | | — | |
Derivatives eligible for offset | | $ | 4,109 | | $ | (94 | ) | $ | (2,603 | ) | $ | 1,412 | | | | | |
Derivatives not eligible for offset | | 90 | | | | | | | | $ | — | | $ | — | |
| | $ | 4,199 | | | | | | | | | | | |
| | | | | | | | | | | | | |
Derivative Liabilities by Counterparty* | | | | | | | | | | | | | |
CGM | | $ | 94 | | $ | (94 | ) | $ | — | | $ | — | | $ | — | | $ | — | |
Derivatives eligible for offset | | $ | 94 | | $ | (94 | ) | $ | — | | $ | — | | | | | |
Derivatives not eligible for offset | | 617 | | | | | | | | $ | — | | $ | 3,989 | |
| | $ | 711 | | | | | | | | | | | |
Curian Dynamic Risk Advantage — Diversified Fund - Average Derivative Volume(1)
| | Cost of Options
Purchased and
Written | | Notional Value
at Purchase of
Futures
Contracts | | Cost of Forward
Foreign
Currency
Contracts | | Notional
Amount of
Interest Rate
Swap
Agreements | | Notional
Amount of
Credit Default
Swap
Agreements | | Notional
Amount of
Total Return
Swap
Agreements | |
Average monthly volume | | $ | — | | $ | 115,113 | | $ | 299,816 | | $ | — | | $ | — | | $ | 176,457 | |
| | | | | | | | | | | | | | | | | | | |
Curian Variable Series Trust Sub-Advised Funds
Notes to Financial Statements
December 31, 2014
Curian Dynamic Risk Advantage — Growth Fund Derivative Strategies - The Fund entered into futures contracts and total return swap agreements as an efficient means of adjusting overall exposure to certain markets as part of its investment strategy.
Curian Dynamic Risk Advantage — Growth Fund - Derivative Instruments Categorized by Risk Exposure
| | Credit | | Equity | | Foreign
Exchange | | Interest Rate | | Total | |
Fair values of derivative instruments on the Statement of Assets and Liabilities as of December 31, 2014: | | | | | | | | | | | |
Assets: | | | | | | | | | | | |
Variation margin on financial derivative instruments | | $ | — | | $ | 5 | | $ | — | | $ | 6 | | $ | 11 | |
| | $ | — | | $ | 5 | | $ | — | | $ | 6 | | $ | 11 | |
Liabilities: | | | | | | | | | | | |
Variation margin on financial derivative instruments | | $ | — | | $ | 164 | | $ | — | | $ | — | | $ | 164 | |
Unrealized depreciation on OTC swap agreements | | — | | 57 | | — | | — | | 57 | |
| | $ | — | | $ | 221 | | $ | — | | $ | — | | $ | 221 | |
The effect of derivative instruments on the Statement of Operations for the year ended December 31, 2014: | | | | | | | | | | | |
Net realized gain (loss) on: | | | | | | | | | | | |
Swap agreements | | $ | — | | $ | (972 | ) | $ | — | | $ | — | | $ | (972 | ) |
Futures contracts | | — | | 7 | | — | | 111 | | 118 | |
| | $ | — | | $ | (965 | ) | $ | — | | $ | 111 | | $ | (854 | ) |
Net change in unrealized appreciation (depreciation) on: | | | | | | | | | | | |
OTC swap agreements | | $ | — | | $ | 161 | | $ | — | | $ | — | | $ | 161 | |
Futures contracts and centrally cleared swap agreements | | — | | (450 | ) | — | | 3 | | (447 | ) |
| | $ | — | | $ | (289 | ) | $ | — | | $ | 3 | | $ | (286 | ) |
Curian Dynamic Risk Advantage — Growth Fund - Derivative and Financial Instruments Eligible for Offset
| | Gross Amount
Presented in the
Statements of
Assets and | | Financial | | | | | | Total Collateral (7) | |
| | Liabilities (3) | | Instruments (4) | | Collateral (5) | | Net Amount (6) | | Cash | | Security | |
Derivative Assets by Counterparty* | | | | | | | | | | | | | |
Derivatives eligible for offset | | $ | — | | $ | — | | $ | — | | $ | — | | $ | — | | $ | — | |
Derivatives not eligible for offset | | | 11 | | | | | | | | | | | |
| | $ | 11 | | | | | | | | | | | |
Derivative Liabilities by Counterparty* | | | | | | | | | | | | | |
BOA | | $ | 57 | | $ | — | | $ | — | | $ | 57 | | $ | — | | $ | — | |
CGM | | — | | — | | — | | — | | 300 | | — | |
Derivatives eligible for offset | | $ | 57 | | $ | — | | $ | — | | $ | 57 | | | | | |
Derivatives not eligible for offset | | 164 | | | | | | | | $ | — | | $ | 1,194 | |
| | $ | 221 | | | | | | | | | | | |
Curian Dynamic Risk Advantage — Growth Fund - Average Derivative Volume(1)
| | Cost of Options
Purchased and
Written | | Notional Value
at Purchase of
Futures
Contracts | | Cost of Forward
Foreign
Currency
Contracts | | Notional
Amount of
Interest Rate
Swap
Agreements | | Notional
Amount of
Credit Default
Swap
Agreements | | Notional
Amount of
Total Return
Swap
Agreements | |
Average monthly volume | | $ | — | | $ | 48,283 | | $ | — | | $ | — | | $ | — | | $ | 10,641 | |
| | | | | | | | | | | | | | | | | | | |
Curian Variable Series Trust Sub-Advised Funds
Notes to Financial Statements
December 31, 2014
Curian/AQR Risk Parity Fund Derivative Strategies - The Fund entered into futures contracts to obtain exposure to or hedge changes in securities prices and interest rates, to gain exposure to certain markets, to manage cash flows, to replicate treasury bond positions, as an efficient means of adjusting overall exposure to certain markets as part of its investment strategy and as a substitute for investment in physical securities and commodities. The Fund entered into forward foreign currency contracts to gain directional exposure to currencies as part of its overall investment strategy, to create foreign currency exposure in U.S. dollar cash balances, to minimize foreign currency exposure on investment securities denominated in foreign currencies and as a means of risk management. The Fund entered into total return swap agreements to obtain exposure to or hedge changes in securities prices and interest rates, as a substitute for investment in physical securities and as an efficient means of adjusting overall exposure to certain markets as part of its investment strategy.
Curian/AQR Risk Parity Fund - Derivative Instruments Categorized by Risk Exposure
| | Commodity | | Equity | | Foreign
Exchange | | Interest Rate | | Total | |
Fair values of derivative instruments on the Statement of Assets and Liabilities as of December 31, 2014: | | | | | | | | | | | |
Assets: | | | | | | | | | | | |
Variation margin on financial derivative instruments | | $ | 90 | | $ | 379 | | $ | — | | $ | 66 | | $ | 535 | |
Forward foreign currency contracts | | — | | — | | 853 | | — | | 853 | |
Unrealized appreciation on OTC swap agreements | | 124 | | 189 | | — | | 960 | | 1,273 | |
| | $ | 214 | | $ | 568 | | $ | 853 | | $ | 1,026 | | $ | 2,661 | |
Liabilities: | | | | | | | | | | | |
Variation margin on financial derivative instruments | | $ | 4,198 | | $ | 422 | | $ | — | | $ | — | | $ | 4,620 | |
Forward foreign currency contracts | | — | | — | | 947 | | — | | 947 | |
Unrealized depreciation on OTC swap agreements | | 1,695 | | — | | — | | — | | 1,695 | |
| | $ | 5,893 | | $ | 422 | | $ | 947 | | $ | — | | $ | 7,262 | |
The effect of derivative instruments on the Statement of Operations for the year ended December 31, 2014: | | | | | | | | | | | |
Net realized gain (loss) on: | | | | | | | | | | | |
Swap agreements | | $ | (5,498 | ) | $ | 1,428 | | $ | — | | $ | 4,754 | | $ | 684 | |
Foreign currency related items | | — | | — | | 4,383 | | — | | 4,383 | |
Futures contracts | | (3,969 | ) | 8,809 | | — | | 13,940 | | 18,780 | |
| | $ | (9,467 | ) | $ | 10,237 | | $ | 4,383 | | $ | 18,694 | | $ | 23,847 | |
Net change in unrealized appreciation (depreciation) on: | | | | | | | | | | | |
OTC swap agreements | | $ | (1,124 | ) | $ | 168 | | $ | — | | $ | 2,678 | | $ | 1,722 | |
Foreign currency related items | | — | | — | | 697 | | — | | 697 | |
Futures contracts and centrally cleared swap agreements | | (624 | ) | (2,327 | ) | — | | 4,032 | | 1,081 | |
| | $ | (1,748 | ) | $ | (2,159 | ) | $ | 697 | | $ | 6,710 | | $ | 3,500 | |
Curian/AQR Risk Parity Fund - Derivative and Financial Instruments Eligible for Offset
| | Gross Amount
Presented in the
Statements of
Assets and | | Financial | | | | | | Total Collateral (7) | |
| | Liabilities (3) | | Instruments (4) | | Collateral (5) | | Net Amount (6) | | Cash | | Security | |
Derivative Assets by Counterparty* | | | | | | | | | | | | | |
BOA | | $ | 1,149 | | $ | — | | $ | (670 | ) | $ | 479 | | $ | 670 | | $ | — | |
CGM | | 124 | | (86 | ) | — | | 38 | | — | | — | |
CSI | | 853 | | (853 | ) | — | | — | | — | | — | |
Derivatives eligible for offset | | $ | 2,126 | | $ | (939 | ) | $ | (670 | ) | $ | 517 | | | | | |
Derivatives not eligible for offset | | 535 | | | | | | | | $ | — | | $ | — | |
| | $ | 2.661 | | | | | | | | | | | |
| | | | | | | | | | | | | |
Derivative Liabilities by Counterparty* | | | | | | | | | | | | | |
BCL | | $ | 1,440 | | $ | — | | $ | (1,440 | ) | $ | — | | $ | 4,680 | | $ | — | |
CGM | | 86 | | (86 | ) | — | | — | | 1,030 | | — | |
CSI | | 947 | | (853 | ) | (94 | ) | — | | 180 | | — | |
MLP | | 169 | | — | | (169 | ) | — | | 730 | | — | |
Derivatives eligible for offset | | $ | 2,642 | | $ | (939 | ) | $ | (1,703 | ) | $ | — | | | | | |
Derivatives not eligible for offset | | 4,620 | | | | | | | | $ | 6,674 | | $ | — | |
| | $ | 7,262 | | | | | | | | | | | |
Curian/AQR Risk Parity Fund - Average Derivative Volume(1)
| | Cost of Options
Purchased and
Written | | Notional Value
at Purchase of
Futures
Contracts | | Cost of Forward
Foreign
Currency
Contracts | | Notional
Amount of
Interest Rate
Swap
Agreements | | Notional
Amount of
Credit Default Swap
Agreements | | Notional
Amount of
Total Return
Swap
Agreements | |
Average monthly volume | | $ | — | | $ | 322,224 | | $ | 162,686 | | $ | — | | $ | — | | $ | 175,273 | |
| | | | | | | | | | | | | | | | | | | |
Curian Variable Series Trust Sub-Advised Funds
Notes to Financial Statements
December 31, 2014
Curian/BlackRock Global Long Short Credit Fund Derivative Strategies - The Fund entered into options contracts as a means of risk management and as an efficient means of adjusting overall exposure to certain markets as part of its investment strategy. The Fund entered into futures contracts to obtain exposure to or hedge changes in security prices and interest rates and as a means of risk management. The Fund entered into forward foreign currency contracts to minimize foreign currency exposure on investment securities denominated in foreign currencies and as a means of risk management. The Fund entered into interest rate swap agreements to manage duration. The Fund entered into credit default swap agreements to provide a measure of protection against defaults of issuers, to obtain credit exposure, as a substitute for investment in physical securities, to speculate on changes in credit quality, to hedge a portfolio of credit default swap agreements or bonds and used in combination with cash bonds exposure (1) to take advantage of spread variances between cash bonds and the credit default swap agreement or (2) to hedge the underlying exposure to the cash bonds. The Fund entered into total return swap agreements to obtain exposure to or hedge changes in securities prices and as a substitute for investment in physical securities.
Curian/BlackRock Global Long Short Credit Fund - Derivative Instruments Categorized by Risk Exposure
| | Credit | | Equity | | Foreign
Exchange | | Interest Rate | | Total | |
Fair values of derivative instruments on the Statement of Assets and Liabilities as of December 31, 2014: | | | | | | | | | | | |
Assets: | | | | | | | | | | | |
Investments — unaffiliated, at value(2) | | $ | — | | $ | 112 | | $ | — | | $ | 25 | | $ | 137 | |
Variation margin on financial derivative instruments | | 30 | | 28 | | — | | — | | 58 | |
Forward foreign currency contracts | | — | | — | | 5,200 | | — | | 5,200 | |
Unrealized appreciation on OTC swap agreements | | 406 | | 644 | | — | | — | | 1,050 | |
OTC swap premiums paid | | 2,317 | | — | | — | | — | | 2,317 | |
| | $ | 2,753 | | $ | 784 | | $ | 5,200 | | $ | 25 | | $ | 8,762 | |
Liabilities: | | | | | | | | | | | |
Variation margin on financial derivative instruments | | $ | 5 | | $ | — | | $ | — | | $ | 33 | | $ | 38 | |
Options written, at value | | — | | 6 | | — | | — | | 6 | |
Forward foreign currency contracts | | — | | — | | 537 | | — | | 537 | |
Unrealized depreciation on OTC swap agreements | | 1,744 | | 202 | | — | | 8 | | 1,954 | |
OTC swap premiums received | | 1,733 | | — | | — | | — | | 1,733 | |
| | $ | 3,482 | | $ | 208 | | $ | 537 | | $ | 41 | | $ | 4,268 | |
The effect of derivative instruments on the Statement of Operations for the year ended December 31, 2014: | | | | | | | | | | | |
Net realized gain (loss) on: | | | | | | | | | | | |
Unaffiliated investments(2) | | $ | (184 | ) | $ | (112 | ) | $ | (48 | ) | $ | (77 | ) | $ | (421 | ) |
Swap agreements | | (1,648 | ) | 729 | | — | | (530 | ) | (1,449 | ) |
Foreign currency related items | | — | | — | | 13,570 | | — | | 13,570 | |
Futures contracts | | — | | (354 | ) | — | | (6,626 | ) | (6,980 | ) |
Written option contracts | | 47 | | (108 | ) | — | | — | | (61 | ) |
| | $ | (1,785 | ) | $ | 155 | | $ | 13,522 | | $ | (7,233 | ) | $ | 4,659 | |
Net change in unrealized appreciation (depreciation) on: | | | | | | | | | | | |
Investments(2) | | $ | 62 | | $ | (28 | ) | $ | — | | $ | (16 | ) | $ | 18 | |
OTC swap agreements | | (806 | ) | 545 | | — | | (8 | ) | (269 | ) |
Foreign currency related items | | — | | — | | 7,499 | | — | | 7,499 | |
Futures contracts and centrally cleared swap agreements | | 173 | | (15 | ) | — | | (1,917 | ) | (1,759 | ) |
Written option contracts | | (7 | ) | (20 | ) | — | | — | | (27 | ) |
| | $ | (578 | ) | $ | 482 | | $ | 7,499 | | $ | (1,941 | ) | $ | 5,462 | |
Curian Variable Series Trust Sub-Advised Funds
Notes to Financial Statements
December 31, 2014
Curian/BlackRock Global Long Short Credit Fund - Derivative and Financial Instruments Eligible for Offset
| | Gross Amount
Presented in the
Statements of
Assets and | | Financial | | | | | | Total Collateral (7) | |
| | Liabilities (3) | | Instruments (4) | | Collateral (5) | | Net Amount (6) | | Cash | | Security | |
Derivative Assets by Counterparty* | | | | | | | | | | | | | |
BBP† | | $ | 118 | | $ | (118 | ) | $ | — | | $ | — | | $ | — | | $ | — | |
BCL | | 162 | | (17 | ) | — | | 145 | | — | | — | |
BNP | | 158 | | (158 | ) | — | | — | | — | | — | |
BOA | | 260 | | (201 | ) | — | | 59 | | — | | — | |
CGM | | 447 | | (9 | ) | — | | 438 | | — | | — | |
CIT | | 302 | | (302 | ) | — | | — | | — | | — | |
CSI | | 36 | | (36 | ) | — | | — | | — | | — | |
DUB | | 3,729 | | (49 | ) | — | | 3,680 | | — | | — | |
GSC | | 47 | | (47 | ) | — | | — | | — | | — | |
GSI | | 107 | | (24 | ) | — | | 83 | | — | | — | |
JPM | | 806 | | (272 | ) | — | | 534 | | — | | — | |
MSC | | 19 | | (19 | ) | — | | — | | — | | — | |
UBS | | 84 | | (29 | ) | — | | 55 | | — | | — | |
Derivatives eligible for offset | | $ | 6,275 | | $ | (1,281 | ) | $ | — | | $ | 4,994 | | | | | |
Derivatives not eligible for offset | | 2,487 | | $ | — | | $ | — | | | | | | | |
| | $ | 8,762 | | | | | | | | | | | |
| | | | | | | | | | | | | |
Derivative Liabilities by Counterparty* | | | | | | | | | | | | | |
BBP† | | $ | 150 | | $ | (118 | ) | $ | — | | $ | 32 | | $ | — | | $ | — | |
BCL | | 17 | | (17 | ) | — | | — | | — | | — | |
BNP | | 210 | | (158 | ) | — | | 52 | | — | | — | |
BOA | | 201 | | (201 | ) | — | | — | | — | | — | |
CGM | | 9 | | (9 | ) | — | | — | | — | | — | |
CIT | | 1,131 | | (302 | ) | (600 | ) | 229 | | 600 | | — | |
CSI | | 103 | | (36 | ) | — | | 67 | | — | | — | |
DUB | | 49 | | (49 | ) | — | | — | | — | | — | |
GSC | | 235 | | (47 | ) | — | | 188 | | — | | — | |
GSI | | 24 | | (24 | ) | — | | — | | — | | — | |
JPM | | 272 | | (272 | ) | — | | — | | — | | — | |
MSC | | 61 | | (19 | ) | — | | 42 | | — | | — | |
UBS | | 29 | | (29 | ) | — | | — | | 168 | | — | |
Derivatives eligible for offset | | $ | 2,491 | | $ | (1,281 | ) | $ | (600 | ) | $ | 610 | | | | | |
Derivatives not eligible for offset | | 1,777 | | | | | | | | $ | 2,363 | | $ | — | |
| | $ | 4,268 | | | | | | | | | | | |
Curian/BlackRock Global Long Short Credit Fund - Average Derivative Volume(1)
| | Cost of Options
Purchased and
Written | | Notional Value
at Purchase of
Futures
Contracts | | Cost of Forward
Foreign
Currency
Contracts | | Notional
Amount of
Interest Rate
Swap
Agreements | | Notional
Amount of
Credit Default
Swap
Agreements | | Notional
Amount of
Total Return
Swap
Agreements | |
Average monthly volume | | $ | 250 | | $ | 95,239 | | $ | 181,257 | | $ | 17,076 | | $ | 157,219 | | $ | 26,229 | |
| | | | | | | | | | | | | | | | | | | |
† Some ISDA Master Agreements may contain a set-off provision allowing the Fund to offset a net amount payable by the Fund upon a default of its counterparty with amounts due to the Fund under another contract with the same counterparty. Bankruptcy or insolvency laws of a particular jurisdiction may impose restrictions on or prohibitions against the right of offset in bankruptcy, insolvency or other events. For example, notwithstanding what contractual rights may be included in an ISDA Master Agreement, such laws may prohibit the Fund from setting off amounts owed to a defaulting counterparty under an ISDA Master Agreement against amounts owed to the Fund by affiliates of the defaulting counterparty. The insolvency regimes of many jurisdictions do, however, generally permit set off of simultaneous payables and receivables under certain types of financial contracts between the same legal entities upon a default of one of the entities, regardless of the existence of a contractual set off right in those contracts.
Curian Variable Series Trust Sub-Advised Funds
Notes to Financial Statements
December 31, 2014
Curian/Eaton Vance Global Macro Absolute Return Advantage Fund Derivative Strategies - The Fund entered into options contracts to obtain exposure to or hedge changes in foreign currencies, as a directional investment, as a substitute for investment in physical securities, as an efficient means of adjusting overall exposure to certain markets and as part of its overall investment strategy. The Fund entered into futures contracts to manage exposure to or hedge changes in security prices, interest rates and foreign currency rates, to gain exposure to certain markets, to replicate treasury bond positions, as an efficient means of adjusting overall exposure to certain markets as part of its investment strategy, as a substitute for investment in physical securities and as a means of risk management. The Fund entered into forward foreign currency contracts to gain directional exposure to currencies as part of its overall investment strategy, to minimize foreign currency exposure on investment securities denominated in foreign currencies and as a means of risk management. The Fund entered into interest rate swap agreements to manage duration, to execute yield curve, swap spread and sovereign relative value trades, to express views on a country’s interest rates, to obtain interest rate and yield curve exposure and as a substitute for investment in physical securities. The Fund entered into cross-currency swap agreements to gain directional exposure to currencies, as a means of risk management and as part of its overall investment strategy. The Fund entered into credit default swap agreements to provide a measure of protection against defaults of issuers, to obtain credit exposure, as a substitute for investment in physical securities and to speculate on changes in credit quality. The Fund entered into total return swap agreements as a substitute for investment in physical securities and as an efficient means of adjusting overall exposure to certain markets as part of its investment strategy. The Fund entered into non-deliverable bond forward contracts to obtain exposure to or hedge changes in interest rates and as a part of its overall investment strategy.
Curian/Eaton Vance Global Macro Absolute Return Advantage Fund - Derivative Instruments Categorized by Risk Exposure
| | Credit | | Equity | | Foreign
Exchange | | Interest Rate | | Total | |
Fair values of derivative instruments on the Statement of Assets and Liabilities as of December 31, 2014: | | | | | | | | | | | |
Assets: | | | | | | | | | | | |
Investments — unaffiliated, at value(2) | | $ | — | | $ | 322 | | $ | 9,442 | | $ | — | | $ | 9,764 | |
Variation margin on financial derivative instruments | | — | | 46 | | — | | 178 | | 224 | |
Forward foreign currency contracts | | — | | — | | 22,150 | | — | | 22,150 | |
Unrealized appreciation on OTC swap agreements | | 3,326 | | — | | 4,099 | | 1,372 | | 8,797 | |
OTC swap premiums paid | | 8,596 | | — | | — | | — | | 8,596 | |
| | $ | 11,922 | | $ | 368 | | $ | 35,691 | | $ | 1,550 | | $ | 49,531 | |
Liabilities: | | | | | | | | | | | |
Variation margin on financial derivative instruments | | $ | — | | $ | — | | $ | — | | $ | 111 | | $ | 111 | |
Options written, at value | | — | | — | | 6,243 | | — | | 6,243 | |
Forward foreign currency contracts | | — | | — | | 11,613 | | — | | 11,613 | |
Unrealized depreciation on OTC swap agreements | | 2,881 | | 29 | | 50 | | 2,621 | | 5,581 | |
OTC swap premiums received | | 2,620 | | — | | — | | — | | 2,620 | |
| | $ | 5,501 | | $ | 29 | | $ | 17,906 | | $ | 2,732 | | $ | 26,168 | |
The effect of derivative instruments on the Statement of Operations for the year ended December 31, 2014: | | | | | | | | | | | |
Net realized gain (loss) on: | | | | | | | | | | | |
Unaffiliated investments(2) | | $ | — | | $ | 653 | | $ | (277 | ) | $ | — | | $ | 376 | |
Swap agreements | | (2,088 | ) | 117 | | 1,324 | | (624 | ) | (1,271 | ) |
Foreign currency related items | | — | | — | | 12,664 | | — | | 12,664 | |
Futures contracts | | — | | 2,183 | | — | | (7,649 | ) | (5,466 | ) |
Written option contracts | | — | | (22 | ) | 639 | | — | | 617 | |
| | $ | (2,088 | ) | $ | 2,931 | | $ | 14,350 | | $ | (8,273 | ) | $ | 6,920 | |
Net change in unrealized appreciation (depreciation) on: | | | | | | | | | | | |
Investments(2) | | $ | — | | $ | 192 | | $ | 6,459 | | $ | — | | $ | 6,651 | |
OTC swap agreements | | 1,626 | | (279 | ) | (77 | ) | (284 | ) | 986 | |
Foreign currency related items | | — | | — | | 12,955 | | — | | 12,955 | |
Futures contracts and centrally cleared swap agreements | | — | | (298 | ) | — | | (2,271 | ) | (2,569 | ) |
Written option contracts | | — | | — | | (3,356 | ) | — | | (3,356 | ) |
| | $ | 1,626 | | $ | (385 | ) | $ | 15,981 | | $ | (2,555 | ) | $ | 14,667 | |
Curian Variable Series Trust Sub-Advised Funds
Notes to Financial Statements
December 31, 2014
Curian/Eaton Vance Global Macro Absolute Return Advantage Fund - Derivative and Financial Instruments Eligible for Offset
| | Gross Amount
Presented in the
Statements of | | | | | | | | | | | |
| | Assets and | | Financial | | | | | | Total Collateral (7) | |
| | Liabilities (3) | | Instruments (4) | | Collateral (5) | | Net Amount (6) | | Cash | | Security | |
Derivative Assets by Counterparty* | | | | | | | | | | | | | |
BNP | | $ | 5,461 | | $ | (2,804 | ) | $ | (2,657 | ) | $ | — | | $ | — | | $ | 3,413 | |
BOA | | 2,998 | | (2,315 | ) | (683 | ) | — | | — | | 3,391 | |
CGM | | 3,343 | | (2,721 | ) | — | | 622 | | — | | — | |
CIT | | 4,660 | | (3,088 | ) | (1,572 | ) | — | | 1,968 | | — | |
DUB | | 6,187 | | (4,064 | ) | (2,123 | ) | — | | 2,150 | | — | |
GSC | | 2,878 | | (443 | ) | — | | 2,435 | | — | | — | |
GSI | | 3,249 | | (3,249 | ) | — | | — | | — | | 4,330 | |
JPM | | 8,318 | | (673 | ) | (7,645 | ) | — | | 8,280 | | — | |
MSC | | 1,144 | | (237 | ) | (412 | ) | 495 | | — | | 412 | |
SCB | | 2,473 | | (2,312 | ) | (161 | ) | — | | 430 | | — | |
Derivatives eligible for offset | | $ | 40,711 | | $ | (21,906 | ) | $ | (15,253 | ) | $ | 3,552 | | | | | |
Derivatives not eligible for offset | | 8,820 | | $ | — | | $ | — | | | | | | | |
| | $ | 49,531 | | | | | | | | | | | |
| | | | | | | | | | | | | |
Derivative Liabilities by Counterparty* | | | | | | | | | | | | | |
BNP | | $ | 2,804 | | $ | (2,804 | ) | $ | — | | $ | — | | $ | — | | $ | — | |
BOA | | 2,315 | | (2,315 | ) | — | | — | | — | | — | |
CGM | | 2,721 | | (2,721 | ) | — | | — | | — | | — | |
CIT | | 3,088 | | (3,088 | ) | — | | — | | — | | — | |
DUB | | 4,064 | | (4,064 | ) | — | | — | | — | | — | |
GSC | | 443 | | (443 | ) | — | | — | | — | | — | |
GSI | | 4,780 | | (3,249 | ) | — | | 1,531 | | — | | — | |
JPM | | 673 | | (673 | ) | — | | — | | — | | — | |
MSC | | 237 | | (237 | ) | — | | — | | — | | — | |
SCB | | 2,312 | | (2,312 | ) | — | | — | | — | | — | |
Derivatives eligible for offset | | $ | 23,437 | | $ | (21,906 | ) | $ | — | | $ | 1,.531 | | | | | |
Derivatives not eligible for offset | | 2,731 | | | | | | | | $ | 2,071 | | $ | 2,825 | |
| | $ | 26,168 | | | | | | | | | | | |
Curian/Eaton Vance Global Macro Absolute Return Advantage Fund - Average Derivative Volume(1)
| | Cost of
Options
Purchased
and Written | | Notional Value
at Purchase of
Futures
Contracts | | Cost of
Forward
Foreign
Currency
Contracts | | Notional
Amount of
Interest Rate
Swap
Agreements | | Notional
Amount of
Cross Currency
Swap
Agreements | | Notional
Amount of
Credit Default
Swap
Agreements | | Notional
Amount of
Total Return
Swap
Agreements | | Notional
Amount of Non-
Deliverable
Bond Forwards | |
Average monthly volume | | $ | 3,539 | | $ | 244,197 | | $ | 711,307 | | $ | 614,777 | | $ | 68,808 | | $ | 191,371 | | $ | 9,386 | | $ | 57,938 | |
| | | | | | | | | | | | | | | | | | | | | | | | | |
Curian Variable Series Trust Sub-Advised Funds
Notes to Financial Statements
December 31, 2014
Curian Long Short Credit Fund Derivative Strategies - The Fund entered into futures contracts to obtain exposure to or hedge changes in interest and foreign currency rates. The Fund entered into credit default swap agreements to provide a measure of protection against defaults of issuers, to obtain credit exposure and as a substitute for investment in physical securities.
Curian Long Short Credit Fund - Derivative Instruments Categorized by Risk Exposure
| | Credit | | Equity | | Foreign
Exchange | | Interest Rate | | Total | |
Fair values of derivative instruments on the Statement of Assets and Liabilities as of December 31, 2014: | | | | | | | | | | | |
Assets: | | | | | | | | | | | |
Variation margin on financial derivative instruments | | $ | — | | $ | — | | $ | 30 | | $ | — | | $ | 30 | |
Unrealized appreciation on OTC swap agreements | | 107 | | — | | — | | — | | 107 | |
OTC swap premiums paid | | 1,321 | | — | | — | | — | | 1,321 | |
| | $ | 1,428 | | $ | — | | $ | 30 | | $ | — | | $ | 1,458 | |
Liabilities: | | | | | | | | | | | |
Variation margin on financial derivative instruments | | $ | — | | $ | — | | $ | — | | $ | 343 | | $ | 343 | |
Unrealized depreciation on OTC swap agreements | | 228 | | — | | — | | — | | 228 | |
OTC swap premiums received | | 1,066 | | — | | — | | — | | 1,066 | |
| | $ | 1,294 | | $ | — | | $ | — | | $ | 343 | | $ | 1,637 | |
The effect of derivative instruments on the Statement of Operations for the year ended December 31, 2014: | | | | | | | | | | | |
Net realized gain (loss) on: | | | | | | | | | | | |
Swap agreements | | $ | (1,195 | ) | $ | — | | $ | — | | $ | — | | $ | (1,195 | ) |
Futures contracts | | — | | — | | 791 | | (9,273 | ) | (8,482 | ) |
| | $ | (1,195 | ) | $ | — | | $ | 791 | | $ | (9,273 | ) | $ | (9,677 | ) |
Net change in unrealized appreciation (depreciation) on: | | | | | | | | | | | |
OTC swap agreements | | $ | (42 | ) | $ | — | | $ | — | | $ | — | | $ | (42 | ) |
Futures contracts and centrally cleared swap agreements | | (534 | ) | — | | 188 | | (5,814 | ) | (6,160 | ) |
| | $ | (576 | ) | $ | — | | $ | 188 | | $ | (5,814 | ) | $ | (6,202 | ) |
Curian Long Short Credit Fund - Derivative and Financial Instruments Eligible for Offset
| | Gross Amount
Presented in the
Statements of
Assets and | | Financial | | | | | | Total Collateral (7) | |
| | Liabilities (3) | | Instruments (4) | | Collateral (5) | | Net Amount (6) | | Cash | | Security | |
Derivative Assets by Counterparty* | | | | | | | | | | | | | |
CGM | | $ | 44 | | $ | (44 | ) | $ | — | | $ | — | | $ | — | | $ | — | |
GSC | | 4 | | — | | — | | 4 | | — | | — | |
JPM | | 59 | | (59 | ) | — | | — | | — | | — | |
Derivatives eligible for offset | | $ | 107 | | $ | (103 | ) | $ | — | | $ | 4 | | | | | |
Derivatives not eligible for offset | | 1,351 | | $ | — | | $ | — | | | | | | | |
| | $ | 1,458 | | | | | | | | | | | |
| | | | | | | | | | | | | |
Derivative Liabilities by Counterparty* | | | | | | | | | | | | | |
CGM | | $ | 141 | | $ | (44 | ) | $ | — | | $ | 97 | | $ | — | | $ | — | |
JPM | | 87 | | (59 | ) | — | | 28 | | — | | — | |
Derivatives eligible for offset | | $ | 228 | | $ | (103 | ) | $ | — | | $ | 125 | | | | | |
Derivatives not eligible for offset | | 1,409 | | | | | | | | $ | 2,472 | | $ | — | |
| | $ | 1,637 | | | | | | | | | | | |
Curian Long Short Credit Fund - Average Derivative Volume(1)
| | Cost of Options
Purchased and
Written | | Notional Value
at Purchase of
Futures
Contracts | | Cost of Forward
Foreign
Currency
Contracts | | Notional
Amount of
Interest Rate
Swap
Agreements | | Notional
Amount of
Credit Default Swap
Agreements | | Notional
Amount of
Total Return
Swap
Agreements | |
Average monthly volume | | $ | — | | $ | 220,550 | | $ | — | | $ | — | | $ | 59,520 | | $ | — | |
| | | | | | | | | | | | | | | | | | | |
Curian Variable Series Trust Sub-Advised Funds
Notes to Financial Statements
December 31, 2014
Curian/PIMCO Credit Income Fund Derivative Strategies - The Fund entered into options contracts to obtain exposure to or hedge changes in interest rates, inflation and foreign currencies and as a substitute for investment in physical securities. The Fund entered into futures contracts to obtain exposure to or hedge changes in interest rates. The Fund entered into forward foreign currency contracts to minimize foreign currency exposure on investment securities denominated in foreign currencies. The Fund entered into interest rate swap agreements to manage duration, to obtain interest rate and yield curve exposure and as a substitute for investment in physical securities. The Fund entered into credit default swap agreements to obtain credit exposure.
Curian/PIMCO Credit Income Fund - Derivative Instruments Categorized by Risk Exposure
| | Credit | | Equity | | Foreign
Exchange | | Interest Rate | | Total | |
Fair values of derivative instruments on the Statement of Assets and Liabilities as of December 31, 2014: | | | | | | | | | | | |
Assets: | | | | | | | | | | | |
Investments — unaffiliated, at value(2) | | $ | — | | $ | 48 | | $ | — | | $ | 1 | | $ | 49 | |
Variation margin on financial derivative instruments | | 1 | | — | | — | | 19 | | 20 | |
Forward foreign currency contracts | | — | | — | | 295 | | — | | 295 | |
Unrealized appreciation on OTC swap agreements | | 167 | | — | | — | | — | | 167 | |
OTC swap premiums paid | | 97 | | — | | — | | 15 | | 112 | |
| | $ | 265 | | $ | 48 | | $ | 295 | | $ | 35 | | $ | 643 | |
Liabilities: | | | | | | | | | | | |
Variation margin on financial derivative instruments | | $ | 1 | | $ | — | | $ | — | | $ | 6 | | $ | 7 | |
Options written, at value | | 9 | | 57 | | 40 | | 60 | | 166 | |
Forward foreign currency contracts | | — | | — | | 223 | | — | | 223 | |
Unrealized depreciation on OTC swap agreements | | 138 | | — | | — | | 192 | | 330 | |
OTC swap premiums received | | 323 | | — | | — | | 8 | | 331 | |
| | $ | 471 | | $ | 57 | | $ | 263 | | $ | 266 | | $ | 1,057 | |
The effect of derivative instruments on the Statement of Operations for the year ended December 31, 2014: | | | | | | | | | | | |
Net realized gain (loss) on: | | | | | | | | | | | |
Swap agreements | | $ | 420 | | $ | — | | $ | — | | $ | (200 | ) | $ | 220 | |
Foreign currency related items | | — | | — | | 927 | | — | | 927 | |
Futures contracts | | — | | — | | — | | 9 | | 9 | |
Written option contracts | | 29 | | 16 | | 10 | | 116 | | 171 | |
| | $ | 449 | | $ | 16 | | $ | 937 | | $ | (75 | ) | $ | 1,327 | |
Net change in unrealized appreciation (depreciation) on: | | | | | | | | | | | |
Investments(2) | | $ | — | | $ | (2 | ) | $ | — | | $ | (120 | ) | $ | (122 | ) |
OTC swap agreements | | (107 | ) | — | | — | | 62 | | (45 | ) |
Foreign currency related items | | — | | — | | 98 | | — | | 98 | |
Futures contracts and centrally cleared swap agreements | | 47 | | — | | — | | (71 | ) | (24 | ) |
Written option contracts | | 10 | | 7 | | (9 | ) | 126 | | 134 | |
| | $ | (50 | ) | $ | 5 | | $ | 89 | | $ | (3 | ) | $ | 41 | |
Curian/PIMCO Credit Income Fund - Derivative and Financial Instruments Eligible for Offset
| | Gross Amount
Presented in the
Statements of
Assets and | | Financial | | | | | | Total Collateral (7) | |
| | Liabilities (3) | | Instruments (4) | | Collateral (5) | | Net Amount (6) | | Cash | | Security | |
Derivative Assets by Counterparty* | | | | | | | | | | | | | |
BBP | | $ | 26 | | $ | (2 | ) | $ | — | | $ | 24 | | $ | — | | $ | — | |
BNP | | 38 | | (38 | ) | — | | — | | — | | — | |
BOA | | 21 | | (21 | ) | — | | — | | — | | — | |
CIT | | 89 | | (69 | ) | — | | 20 | | — | | — | |
CSI | | 94 | | (61 | ) | — | | 33 | | — | | — | |
DUB | | 22 | | (22 | ) | — | | — | | — | | — | |
GSI | | 30 | | — | | — | | 30 | | — | | — | |
JPM | | 181 | | (53 | ) | — | | 128 | | — | | — | |
MSC | | 5 | | (5 | ) | — | | — | | 7 | | — | |
MSS | | 5 | | (5 | ) | — | | — | | — | | — | |
Derivatives eligible for offset | | $ | 511 | | $ | (276 | ) | $ | — | | $ | 235 | | | | | |
Derivatives not eligible for offset | | 132 | | | | | | | | $ | — | | $ | — | |
| | $ | 643 | | | | | | | | | | | |
Curian Variable Series Trust Sub-Advised Funds
Notes to Financial Statements
December 31, 2014
Curian/PIMCO Credit Income Fund - Derivative and Financial Instruments Eligible for Offset (continued)
| | Gross Amount
Presented in the
Statements of
Assets and | | Financial | | | | | | Total Collateral (7) | |
| | Liabilities (3) | | Instruments (4) | | Collateral (5) | | Net Amount (6) | | Cash | | Security | |
Derivative Liabilities by Counterparty* | | | | | | | | | | | | | |
BBP | | $ | 2 | | $ | (2 | ) | $ | — | | $ | — | | $ | — | | $ | — | |
BCL | | 15 | | — | | — | | 15 | | — | | — | |
BNP | | 141 | | (38 | ) | — | | 103 | | — | | — | |
BOA | | 129 | | (21 | ) | — | | 108 | | — | | — | |
CGM | | 1 | | — | | — | | 1 | | — | | — | |
CIT | | 69 | | (69 | ) | — | | — | | — | | — | |
CSI | | 61 | | (61 | ) | — | | — | | — | | — | |
DUB | | 23 | | (22 | ) | — | | 1 | | — | | — | |
GSB | | 45 | | — | | — | | 45 | | — | | — | |
GSC | | 14 | | — | | — | | 14 | | — | | — | |
JPM | | 53 | | (53 | ) | — | | — | | — | | — | |
MSB | | 5 | | — | | — | | 5 | | — | | — | |
MSC | | 94 | | (5 | ) | — | | 89 | | — | | — | |
MSS | | 34 | | (5 | ) | — | | 29 | | — | | — | |
UBS | | 33 | | — | | — | | 33 | | — | | — | |
Derivatives eligible for offset | | $ | 719 | | $ | (276 | ) | $ | — | | $ | 443 | | | | | |
Derivatives not eligible for offset | | 338 | | | | | | | | $ | 387 | | $ | 411 | |
| | $ | 1,057 | | | | | | | | | | | |
| | Gross Amount
Presented in the
Statement of
Assets and | | Financial | | | | | | Total Collateral (7) | |
| | Liabilities (8) | | Instruments (4) | | Collateral (5) | | Net Amount (8) | | Cash | | Security | |
Master Forward Agreement Transaction Assets by Counterparty* | | | | | | | | | | | | | |
BNP | | $ | 3,464 | | $ | (3,443 | ) | $ | — | | $ | 21 | | $ | — | | $ | — | |
JPM | | 910 | | (901 | ) | — | | 9 | | — | | — | |
| | $ | 4,374 | | $ | (4,344 | ) | $ | — | | $ | 30 | | | | | |
| | | | | | | | | | | | | |
Master Forward Agreement Transaction Liabilities by Counterparty* | | | | | | | | | | | | | |
BNP | | $ | 3,443 | | $ | (3,443 | ) | $ | — | | $ | — | | $ | — | | $ | — | |
JPM | | 901 | | (901 | ) | — | | — | | — | | — | |
| | $ | 4,344 | | $ | (4,344 | ) | $ | — | | $ | — | | | | | |
Curian/PIMCO Credit Income Fund - Average Derivative Volume(1)
| | Cost of Options
Purchased and
Written | | Notional Value
at Purchase of
Futures
Contracts | | Cost of Forward
Foreign
Currency
Contracts | | Notional
Amount of
Interest Rate
Swap
Agreements | | Notional
Amount of
Credit Default
Swap
Agreements | | Notional
Amount of
Total Return
Swap
Agreements | |
Average monthly volume | | $ | 277 | | $ | 10,800 | | $ | 14,275 | | $ | 15,426 | | $ | 23,503 | | $ | — | |
| | | | | | | | | | | | | | | | | | | |
Curian Variable Series Trust Sub-Advised Funds
Notes to Financial Statements
December 31, 2014
Curian/T. Rowe Price Capital Appreciation Fund Derivative Strategies - The Fund entered into options contracts to obtain exposure to or hedge changes in securities prices, to generate income and as a part of its overall investment strategy. The Fund entered into futures contracts to gain exposure to certain markets and as an efficient means of adjusting overall exposure to certain markets as part of its investment strategy. The Fund entered into forward foreign currency contracts to minimize foreign currency exposure on investment securities denominated in foreign currencies.
Curian/T. Rowe Price Capital Appreciation Fund - Derivative Instruments Categorized by Risk Exposure
| | Credit | | Equity | | Foreign
Exchange | | Interest Rate | | Total | |
Fair values of derivative instruments on the Statement of Assets and Liabilities as of December 31, 2014: | | | | | | | | | | | |
Assets: | | | | | | | | | | | |
Forward foreign currency contracts | | $ | — | | $ | — | | $ | 1 | | $ | — | | $ | 1 | |
| | $ | — | | $ | — | | $ | 1 | | $ | — | | $ | 1 | |
Liabilities: | | | | | | | | | | | |
Options written, at value | | $ | — | | $ | 516 | | $ | — | | $ | — | | $ | 516 | |
| | $ | — | | $ | 516 | | $ | — | | $ | — | | $ | 516 | |
The effect of derivative instruments on the Statement of Operations for the year ended December 31, 2014: | | | | | | | | | | | |
Net realized gain (loss) on: | | | | | | | | | | | |
Futures contracts | | $ | — | | $ | (90 | ) | $ | — | | $ | — | | $ | (90 | ) |
Written option contracts | | — | | 28 | | — | | — | | 28 | |
| | $ | — | | $ | (62 | ) | $ | — | | $ | — | | $ | (62 | ) |
Net change in unrealized appreciation (depreciation) on: | | | | | | | | | | | |
Foreign currency related items | | $ | — | | $ | — | | $ | 1 | | $ | — | | $ | 1 | |
Futures contracts and centrally cleared swap agreements | | — | | 49 | | — | | — | | 49 | |
Written option contracts | | — | | (253 | ) | — | | — | | (253 | ) |
| | $ | — | | $ | (204 | ) | $ | 1 | | $ | — | | $ | (203 | ) |
Curian/T. Rowe Price Capital Appreciation Fund - Derivative and Financial Instruments Eligible for Offset
| | Gross Amount
Presented in the
Statements of
Assets and | | Financial | | | | | | Total Collateral (7) | |
| | Liabilities (3) | | Instruments (4) | | Collateral (5) | | Net Amount (6) | | Cash | | Security | |
Derivative Assets by Counterparty* | | | | | | | | | | | | | |
BOA | | $ | 1 | | $ | — | | $ | — | | $ | 1 | | $ | — | | $ | — | |
Derivatives eligible for offset | | $ | 1 | | $ | — | | $ | — | | $ | 1 | | | | | |
Derivatives not eligible for offset | | — | | $ | — | | $ | — | | | | | | | |
| | $ | 1 | | | | | | | | | | | |
| | | | | | | | | | | | | |
Derivative Liabilities by Counterparty* | | | | | | | | | | | | | |
CGM | | $ | 377 | | $ | — | | $ | — | | $ | 377 | | $ | — | | $ | — | |
JPM | | 29 | | — | | — | | 29 | | — | | — | |
MSC | | 94 | | — | | — | | 94 | | — | | — | |
Derivatives eligible for offset | | $ | 500 | | $ | — | | $ | — | | $ | 500 | | | | | |
Derivatives not eligible for offset | | 16 | | | | | | | | $ | 166 | | $ | — | |
| | $ | 516 | | | | | | | | | | | |
Curian/T. Rowe Price Capital Appreciation Fund - Average Derivative Volume(1)
| | Cost of Options
Purchased and
Written | | Notional Value at
Purchase of
Futures
Contracts | | Cost of Forward
Foreign
Currency
Contracts | | Notional Amount
of Interest Rate
Swap
Agreements | | Notional Amount
of Credit Default
Swap
Agreements | | Notional Amount
of Cross
Currency Swap
Agreements | | Notional Amount
of Total Return
Swap
Agreements | |
Average monthly volume | | $ | 116 | | $ | 1,586 | | $ | 199 | | $ | — | | $ | — | | $ | — | | $ | — | |
| | | | | | | | | | | | | | | | | | | | | | |
Curian Variable Series Trust Sub-Advised Funds
Notes to Financial Statements
December 31, 2014
Curian/UBS Global Long Short Fixed Income Opportunities Fund Derivative Strategies - The Fund entered into options contracts to obtain exposure to or hedge changes in securities prices, interest rates, foreign currencies, credit default swap indices and interest rate swap valuations, to generate income, as a directional investment, as a substitute for investment in physical securities, as a means of risk management, as an efficient means of adjusting overall exposure to certain markets as part of its investment strategy and as a part of its overall investment strategy. The Fund entered into futures contracts to obtain exposure to or hedge changes in securities prices and interest rates, to gain exposure to certain markets, to replicate treasury bond positions, as an efficient means of adjusting overall exposure to certain markets as part of its investment strategy, as a substitute for investment in physical securities and as a means of risk management. The Fund entered into forward foreign currency contracts to hedge foreign currency exposure between trade date and settlement date on investment security purchases and sales, to gain directional exposure to currencies as part of its overall investment strategy, to create foreign currency exposure in U.S. dollar cash balances, to minimize foreign currency exposure on investment securities denominated in foreign currencies, to reduce currency deviations from its benchmark and as a means of risk management. The Fund entered into interest rate swap agreements to manage duration, to execute yield curve, swap spread and sovereign relative value trades, to express views on a country’s interest rates, to hedge against the risk that the value of fixed rate bond investments will decrease/increase as interest rates rise/fall, to obtain interest rate and yield curve exposure and as a substitute for investment in physical securities. The Fund entered into cross-currency swap agreements as part of its overall investment strategy. The Fund entered into credit default swap agreements to provide a measure of protection against defaults of issuers, to manage duration at the cross sector level, to obtain credit exposure, as a substitute for investment in physical securities, to speculate on changes in credit quality, to hedge a portfolio of credit default swap agreements or bonds, to take an active long or short position with respect to the likelihood of a particular referenced obligation’s default and used in combination with cash bonds exposure (1) to take advantage of spread variances between cash bonds and the credit default swap agreement or (2) to hedge the underlying exposure to the cash bonds. The Fund entered into total return swap agreements to obtain exposure to or hedge changes in securities prices and interest rates, as a substitute for investment in physical securities and as an efficient means of adjusting overall exposure to certain markets as part of its overall investment strategy.
Curian/UBS Global Long Short Fixed Income Opportunities Fund - Derivative Instruments Categorized by Risk Exposure
| | Credit | | Equity | | Foreign
Exchange | | Interest Rate | | Total | |
Fair values of derivative instruments on the Statement of Assets and Liabilities as of December 31, 2014: | | | | | | | | | | | |
Assets: | | | | | | | | | | | |
Investments — unaffiliated, at value(2) | | $ | — | | $ | — | | $ | 698 | | $ | 3,641 | | $ | 4,339 | |
Variation margin on financial derivative instruments | | 13 | | — | | — | | 239 | | 252 | |
Forward foreign currency contracts | | — | | — | | 1,114 | | — | | 1,114 | |
Unrealized appreciation on OTC swap agreements | | 1,875 | | — | | 1,087 | | 401 | | 3,363 | |
OTC swap premiums paid | | 475 | | — | | — | | — | | 475 | |
| | $ | 2,363 | | $ | — | | $ | 2,899 | | $ | 4,281 | | $ | 9,543 | |
Liabilities: | | | | | | | | | | | |
Variation margin on financial derivative instruments | | $ | 15 | | $ | — | | $ | — | | $ | 147 | | $ | 162 | |
Options written, at value | | 269 | | — | | — | | 3,658 | | 3,927 | |
Forward foreign currency contracts | | — | | — | | 197 | | — | | 197 | |
Unrealized depreciation on OTC swap agreements | | 628 | | — | | 1,128 | | 1,095 | | 2,851 | |
OTC swap premiums received | | 3,218 | | — | | — | | — | | 3,218 | |
| | $ | 4,130 | | $ | — | | $ | 1,325 | | $ | 4,900 | | $ | 10,355 | |
The effect of derivative instruments on the Statement of Operations for the year ended December 31, 2014: | | | | | | | | | | | |
Net realized gain (loss) on: | | | | | | | | | | | |
Unaffiliated investments(2) | | $ | (413 | ) | $ | — | | $ | 511 | | $ | (9,051 | ) | $ | (8,953 | ) |
Swap agreements | | (4,173 | ) | — | | 81 | | 714 | | (3,378 | ) |
Foreign currency related items | | — | | — | | 5,453 | | — | | 5,453 | |
Futures contracts | | — | | — | | — | | 5,021 | | 5,021 | |
Written option contracts | | 456 | | — | | — | | 1,888 | | 2,344 | |
| | $ | (4,130 | ) | $ | — | | $ | 6,045 | | $ | (1,428 | ) | $ | 487 | |
Net change in unrealized appreciation (depreciation) on: | | | | | | | | | | | |
Investments(2) | | $ | — | | $ | — | | $ | 396 | | $ | (4,005 | ) | $ | (3,609 | ) |
OTC swap agreements | | 2,253 | | — | | (61 | ) | (4,230 | ) | (2,038 | ) |
Foreign currency related items | | — | | — | | 3,751 | | — | | 3,751 | |
Futures contracts and centrally cleared swap agreements | | 759 | | — | | — | | (5,494 | ) | (4,735 | ) |
Written option contracts | | 249 | | — | | — | | 1,436 | | 1,685 | |
| | $ | 3,261 | | $ | — | | $ | 4,086 | | $ | (12,293 | ) | $ | (4,946 | ) |
Curian Variable Series Trust Sub-Advised Funds
Notes to Financial Statements
December 31, 2014
Curian/UBS Global Long Short Fixed Income Opportunities Fund - Derivative and Financial Instruments Eligible for Offset
| | Gross Amount
Presented in the
Statements of
Assets and | | Financial | | | | | | Total Collateral (7) | |
| | Liabilities (3) | | Instruments (4) | | Collateral (5) | | Net Amount (6) | | Cash | | Security | |
Derivative Assets by Counterparty* | | | | | | | | | | | | | |
BBP | | $ | 968 | | $ | (968 | ) | $ | — | | $ | — | | $ | — | | $ | — | |
BCL | | 2 | | (2 | ) | — | | — | | — | | — | |
BOA | | 1,895 | | (1,895 | ) | — | | — | | — | | — | |
CIT | | 255 | | (255 | ) | — | | — | | — | | — | |
DUB | | 597 | | (15 | ) | — | | 582 | | — | | — | |
JPM | | 2,231 | | (1,279 | ) | (871 | ) | 81 | | 871 | | — | |
MSC | | 1,369 | | (261 | ) | — | | 1,108 | | — | | — | |
MSS | | 461 | | — | | — | | 461 | | — | | — | |
Derivatives eligible for offset | | $ | 7,778 | | $ | (4,675 | ) | $ | (871 | ) | $ | 2,232 | | | | | |
Derivatives not eligible for offset | | 1,765 | | | | | | | | $ | — | | $ | — | |
| | $ | 9,543 | | | | | | | | | | | |
| | | | | | | | | | | | | |
Derivative Liabilities by Counterparty* | | | | | | | | | | | | | |
BBP | | $ | 1,565 | | $ | (968 | ) | $ | — | | $ | 597 | | $ | — | | $ | — | |
BCL | | 43 | | (2 | ) | (41 | ) | — | | — | | 589 | |
BOA | | 2,952 | | (1,895 | ) | (1,057 | ) | — | | — | | 2,400 | |
CIT | | 593 | | (255 | ) | (338 | ) | — | | — | | 625 | |
DUB | | 15 | | (15 | ) | — | | — | | — | | — | |
JPM | | 1,279 | | (1,279 | ) | — | | — | | — | | — | |
MSC | | 261 | | (261 | ) | — | | — | | — | | 664 | |
Derivatives eligible for offset | | $ | 6,708 | | $ | (4,675 | ) | $ | (1,436 | ) | $ | 597 | | | | | |
Derivatives not eligible for offset | | 3,647 | | | | | | | | $ | 6,159 | | $ | — | |
| | $ | 10,355 | | | | | | | | | | | |
Curian/UBS Global Long Short Fixed Income Opportunities Fund - Average Derivative Volume(1)
| | Cost of Options
Purchased and
Written | | Notional Value
at Purchase of
Futures
Contracts | | Cost of
Forward
Foreign
Currency
Contracts | | Notional
Amount of
Interest Rate
Swap
Agreements | | Notional
Amount of
Credit Default
Swap
Agreements | | Notional
Amount of
Cross Currency
Swap
Agreements | | Notional
Amount
of Total Return
Swap
Agreements | |
Average monthly volume | | $ | 15,682 | | $ | 133,228 | | $ | 105,952 | | $ | 519,756 | | $ | 195,940 | | $ | 155,018 | | $ | 19 | |
| | | | | | | | | | | | | | | | | | | | | | |
The financial instruments eligible for offset table is presented for the following Fund, which held forward foreign currency contracts with significant exposure to several counterparties which were eligible for offset with each counterparty.
Curian/Neuberger Berman Currency Fund - Derivative and Financial Instruments Eligible for Offset
| | Gross Amount
Presented in the
Statements of
Assets and | | Financial | | | | | | Total Collateral (7) | |
| | Liabilities (3) | | Instruments (4) | | Collateral (5) | | Net Amount (6) | | Cash | | Security | |
Derivative Assets by Counterparty* | | | | | | | | | | | | | |
RBC | | $ | 4,865 | | $ | (3,811 | ) | $ | — | | $ | 1,054 | | $ | — | | $ | — | |
SGB | | 11,568 | | (11,538 | ) | — | | 30 | | — | | — | |
SSB | | 14,546 | | (14,546 | ) | — | | — | | — | | — | |
Derivatives eligible for offset | | $ | 30,979 | | $ | (29,895 | ) | $ | — | | $ | 1,084 | | | | | |
| | | | | | | | | | | | | |
Derivative Liabilities by Counterparty* | | | | | | | | | | | | | |
RBC | | $ | 3,811 | | $ | (3,811 | ) | $ | — | | $ | — | | $ | — | | $ | — | |
SGB | | 11,538 | | (11,538 | ) | — | | — | | — | | — | |
SSB | | 15,586 | | (14,546 | ) | — | | 1,040 | | — | | — | |
Derivatives eligible for offset | | $ | 30,935 | | $ | (29,895 | ) | $ | — | | $ | 1,040 | | | | | |
(1) The derivative instruments outstanding as of December 31, 2014, as disclosed in the Schedules of Investments and the amounts of realized and changes in unrealized gains and losses on derivative instruments during the year ended December 31, 2014, as disclosed in the Statements of Operations, also serve as indicators of the derivative volume for the Funds.
(2) Purchased options market value is reflected in Investments - unaffiliated, at value. Realized gain (loss) and change in unrealized appreciation (depreciation) on purchased options are reflected in realized gain (loss) on unaffiliated investments and change in unrealized appreciation (depreciation) on investments, respectively, in the Statements of Operations.
(3) Amounts eligible for offset are presented gross in the Statements of Assets and Liabilities.
(4) Financial instruments eligible for offset but not offset in the Statements of Assets and Liabilities.
(5) Cash and security collateral not offset in the Statements of Assets and Liabilities. For derivative assets and liabilities, amounts do not reflect over-collateralization.
(6) For assets, net amount represents the amount payable by the counterparty to the Fund in the event of default. For liabilities, net amount represents the amount payable by the Fund to the counterparty in the event of default.
(7) Cash and security collateral pledged or segregated for derivative investments. For assets, amount reflects collateral received from or segregated by the counterparty. For liabilities, amount reflects collateral pledged or segregated by the Fund. Collateral for derivatives not eligible for offset includes amounts pledged for margin purposes.
Curian Variable Series Trust Sub-Advised Funds
Notes to Financial Statements
December 31, 2014
(8) Investment liabilities and assets include delayed delivery securities and secured borrowings. Liabilities reflect amounts payable to the counterparty for the cost of the investment, assets reflect the market value of the investment and the net amount reflects net unrealized gain or loss. The net unrealized gain or loss constitutes the amount which is subject to margin or collateral requirements as required under the Master Forward Agreement.
* Counterparties are defined on page 196 in the Schedules of Investments.
The derivative strategy for Funds which held only one type of derivative instrument during the year is as follows: Curian/Baring International Fixed Income Fund entered into forward foreign currency contracts to gain directional exposure to currencies as part of its overall investment strategy, to minimize foreign currency exposure on investment securities denominated in foreign currencies, to reduce currency deviations from its benchmark and as a means of risk management. Curian/DFA U.S. Micro Cap Fund entered into futures contracts to manage cash flows. Curian/FAMCO Flex Core Covered Call Fund entered into options contracts to obtain exposure to or hedge changes in securities prices, to generate income and as a part of its overall investment strategy. Curian/Neuberger Berman Currency Fund entered into forward foreign currency contracts to gain directional exposure to currencies as part of its overall investment strategy. Curian/Neuberger Berman Risk Balanced Commodity Strategy Fund entered into futures contracts to gain exposure to certain markets and as a substitute for investment in physical securities.
The derivative instruments outstanding as of December 31, 2014, as disclosed in the Schedules of Investments and the amounts of realized and changes in unrealized gains and losses on derivative instruments during the year ended December 31, 2014, as disclosed in the Statements of Operations, also serve as indicators of the derivative volume for the Funds. For Funds which held only one type of derivative during the year, the average monthly derivative volume (in thousands) is as follows:
| | Notional Value at
Purchase of
Futures Contracts | | Cost of Options
Purchased and
Written | | Cost of Forward
Foreign Currency
Contracts | |
Curian/Baring International Fixed Income Fund | | $ | — | | $ | — | | $ | 11,743 | |
Curian/FAMCO Covered Call Fund | | — | | 3,806 | | — | |
Curian/Neuberger Berman Currency Fund | | — | | — | | 930,806 | |
Curian/Neuberger Risk Balanced Commodity Strategy Fund | | 185,999 | | — | | — | |
| | | | | | | | | | |
Pledged or Segregated Collateral - The following table summarizes cash and securities collateral (in thousands) for Funds for which collateral exists but was not presented in a Derivative and Financial Instruments Eligible for Offset table:
| | Prime Broker | | Counterparties | | Futures Contracts
Pledged or
Segregated Cash | | Securities Sold
Short Securities
Collateral Pledged | | Repurchase
Agreement Securities
Collateral Pledged | |
Curian/BlackRock Global Long Short Credit Fund | | N/A | | BBP, MSC | | $ | — | | $ | — | | $ | 286 | |
Curian/Neuberger Berman Risk Balanced Commodity Strategy Fund | | N/A | | GSC | | 12,260 | | — | | — | |
Curian/Nicholas Convertible Arbitrage Fund | | UBS | | N/A | | — | | 88,296 | | — | |
Curian/PineBridge Merger Arbitrage Fund | | CSI | | N/A | | — | | 13,000 | | — | |
| | | | | | | | | | | | | | |
NOTE 7. INVESTMENT RISKS AND REGULATORY MATTERS
Foreign Securities Risk - Investing in securities of foreign companies and foreign governments generally involves special risks and considerations not typically associated with investing in U.S. companies and the U.S. government. These risks include the potential for revaluation of currencies, different accounting policies and future adverse political and economic developments. Moreover, securities of many foreign companies and foreign governments and their markets may be less liquid and their prices may be more volatile than those of securities of comparable U.S. companies and the U.S. government.
Sanctioned Securities Risk - Certain Funds may invest in securities issued by companies located in Russia. The U.S. Government and other governments have placed sanctions on Russia. When sanctions are placed on a country, the Fund may experience limitations on its investments, including the inability to dispose of securities in that country, the inability to settle securities transactions in that country and the inability to repatriate currency from that country. Investments in sanctioned countries may be volatile, and the Fund and its pricing agent may have difficulty valuing such sanctioned country securities. Investments in sanctioned countries are subject to a number of risks, including, but not limited to, liquidity risk, foreign securities risk and currency risk.
Convertible Securities Risk - A convertible security tends to perform more like a stock when the underlying stock price is high and more like a debt security when the underlying stock price is low. A convertible security is not as sensitive to interest rate changes as a similar non-convertible debt security, and generally has less potential for gain or loss than the underlying stock.
Currency Risk - Investing directly in foreign currencies or in securities that trade in, and receive revenues in, foreign currencies, or in financial derivatives that provide exposure to foreign currencies, involves the risk that those currencies will decline in value relative to the base currency of a Fund, or, in the case of hedging positions, that a Fund’s base currency will decline in value relative to the currency being hedged. Currency rates in foreign countries may fluctuate significantly over short periods of time for a number of reasons, including changes in interest rates, general economics of a country, actions (or inaction) of U.S. governments or banks, foreign governments, central banks or supranational entities such as the International Monetary Fund, the imposition of currency controls or other political developments in the U.S. or abroad.
Curian Variable Series Trust Sub-Advised Funds
Notes to Financial Statements
December 31, 2014
Market, Credit and Counterparty Risk - In the normal course of business, the Funds trade financial instruments and enter into financial transactions where the risk of potential loss exists due to changes in the market (“market risk”) or failure of the other party to a transaction to perform (“credit risk”). Bonds and other debt securities are subject to credit risk, which is the possibility that the credit strength of an issuer will weaken and/or an issuer of a debt security will fail to make timely payments of principal or interest and the security will go into default. Certain Funds invest in exchange trade notes which are unsecured debt securities. Similar to other debt securities, they are backed by the credit of the issuer, and there is credit risk associated with these investments. Similar to credit risk, the Funds may be exposed to counterparty risk, or the risk that an institution or other entity with which the Funds have unsettled or open transactions will default. Financial assets, which potentially expose the Funds to credit risk, consist principally of investments and cash due from counterparties (“counterparty risk”). The extent of the Funds’ exposure to credit and counterparty risks in respect to these financial assets is incorporated within their carrying value as recorded in the Funds’ Statements of Assets and Liabilities. For certain derivative contracts, the potential loss could exceed the value of the financial assets recorded in the financial statements.
Emerging Market Securities Risk - Investing in securities of emerging market countries generally involves greater risk than investing in foreign securities in developed markets. Emerging market countries typically have economic and political systems that are less fully developed and are likely to be less stable than those in more advanced countries. These risks include the potential for government intervention, adverse changes in earnings and business prospects, liquidity, credit and currency risks, and price volatility.
Participatory Note Risk - The Curian/Ashmore Emerging Market Small Cap Equity Fund and Curian/Franklin Templeton Frontier Markets Fund invest in P-Notes. P-Notes may contain various risks including the potential inability of the counterparty to fulfill its obligations under the terms of the contract. An issuer of P-Notes may fail to make interest payments and repay principal when due, in whole or in part. Changes in an issuer’s financial strength or credit rating may affect a security’s value. These securities may be more volatile and less liquid than other investments held by a Fund.
Real Estate Investment Risk - The Curian/CenterSquare International Real Estate Securities Fund concentrates its assets in the real estate industry and an investment in the Fund will be closely linked to the performance of the real estate markets. Property values may fall due to increasing vacancies or declining rents resulting from economic, legal, cultural or technological developments. Many real estate companies, including REITs, utilize leverage (and some may be highly leveraged), which increases investment risk and could adversely affect a real estate company’s operations and market value in periods of rising interest rates. The value of a Fund’s investment in REITs may be affected by the management skill of the persons managing the REIT. Because REITs have expenses of their own, the Fund will bear a proportional share of those expenses. Due to the fact that the Fund focuses its investments in REITs and other companies related to the real estate industry, the value of shares may rise and fall more than the value of shares of a Fund that invests in a broader range of companies.
Master Limited Partnership Risk - Investment in MLPs involves some risks that differ from an investment in the common stock of a corporation. Holders of MLPs have limited control on matters affecting the partnership. Investing in MLPs involves certain risks related to investing in the underlying assets of the MLPs and risks associated with pooled investment vehicles. MLPs holding credit-related investments are subject to interest rate risk and the risk of default on payment obligations by debt issuers. MLPs that concentrate in a particular industry or a particular geographic region are subject to risks associated with such industry or region.
Senior and Junior Loan Risk - When a Fund invests in a loan or participation, the Fund is subject to the risk that an intermediate participant between the Fund and the borrower will fail to meet its obligations to the Fund, in addition to the risk that the borrower under the loan may default on its obligations. Senior and Junior loans typically are of below investment grade quality and have below investment grade credit ratings, which ratings are associated with securities having high risk and speculative characteristics. The Fund is also subject to the risk that the agent bank administering the loan may fail to meet its obligations.
NOTE 8. INVESTMENT ADVISORY FEES AND TRANSACTIONS WITH AFFILIATES
Advisory and Administration Fee - The Trust has an investment advisory and management agreement and administration agreement with Curian. Pursuant to the advisory agreement, each Fund pays Curian an annual fee, accrued daily and paid monthly, based on a specified percentage of the average daily net assets of each Fund. A portion of this fee is paid by Curian to the Sub-Advisers as compensation for their services. The following is a schedule of the fees each Fund is currently obligated to pay Curian:
| | Assets | | Advisory Fee | |
Curian Tactical Advantage Funds | | $0 to $1 billion Over $1 billion | | 0.75 0.70 | % |
Curian Dynamic Risk Advantage Funds | | $0 to $1 billion Over $1 billion | | 0.85 0.80 | |
Curian/Aberdeen Latin America Fund | | $0 to $1 billion Over $1 billion | | 1.35 1.30 | |
Curian/AQR Risk Parity Fund | | $0 to $1 billion Over $1 billion | | 0.85 0.80 | |
Curian/Ashmore Emerging Market Small Cap Equity Fund | | $0 to $1 billion Over $1 billion | | 1.10 1.05 | |
Curian/Baring International Fixed Income Fund | | $0 to $1 billion Over $1 billion | | 0.60 0.55 | |
Curian Variable Series Trust Sub-Advised Funds
Notes to Financial Statements
December 31, 2014
| | Assets | | Advisory Fee | |
Curian/BlackRock Global Long Short Credit Fund | | $0 to $1 billion Over $1 billion | | 0.95 0.90 | % |
Curian/CenterSquare International Real Estate Securities Fund | | $0 to $1 billion Over $1 billion | | 0.80 0.75 | |
Curian/DFA U.S. Micro Cap Fund | | $0 to $1 billion Over $1 billion | | 0.80 0.75 | |
Curian/DoubleLine Total Return Fund | | $0 to $1 billion Over $1 billion | | 0.50 0.45 | |
Curian/Eaton Vance Global Macro Absolute Return Advantage Fund | | $0 to $1 billion Over $1 billion | | 0.95 0.90 | |
Curian/Epoch Global Shareholder Yield Fund | | $0 to $1 billion Over $1 billion | | 0.70 0.65 | |
Curian/FAMCO Flex Core Covered Call Fund | | $0 to $1 billion Over $1 billion | | 0.60 0.55 | |
Curian Focused International Equity Fund | | $0 to $1 billion Over $1 billion | | 0.80 0.75 | |
Curian Focused U.S. Equity Fund | | $0 to $1 billion Over $1 billion | | 0.70 0.65 | |
Curian/Franklin Templeton Frontier Markets Fund | | $0 to $1 billion Over $1 billion | | 1.40 1.35 | |
Curian/Franklin Templeton Natural Resources Fund | | $0 to $1 billion Over $1 billion | | 0.80 0.75 | |
Curian/Lazard International Strategic Equity Fund | | $0 to $1 billion Over $1 billion | | 0.80 0.75 | |
Curian Long Short Credit Fund | | $0 to $1 billion Over $1 billion | | 0.95 0.90 | |
Curian/Neuberger Berman Currency Fund | | $0 to $1 billion Over $1 billion | | 0.70 0.65 | |
Curian/Neuberger Berman Risk Balanced Commodity Strategy Fund | | $0 to $1 billion Over $1 billion | | 0.60 0.55 | |
Curian/Nicholas Convertible Arbitrage Fund | | $0 to $1 billion Over $1 billion | | 0.85 0.80 | |
Curian/PIMCO Credit Income Fund | | $0 to $1 billion Over $1 billion | | 0.40 0.35 | |
Curian/PineBridge Merger Arbitrage Fund | | $0 to $1 billion Over $1 billion | | 0.85 0.80 | |
Curian/Schroder Emerging Europe Fund | | $0 to $1 billion Over $1 billion | | 1.10 1.05 | |
Curian/T. Rowe Price Capital Appreciation Fund | | $0 to $1 billion Over $1 billion | | 0.70 0.65 | |
Curian/The Boston Company Equity Income Fund | | $0 to $1 billion Over $1 billion | | 0.55 0.50 | |
Curian/UBS Global Long Short Fixed Income Opportunities Fund | | $0 to $1 billion Over $1 billion | | 0.95 0.90 | |
Curian/Van Eck International Gold Fund | | $0 to $1 billion Over $1 billion | | 0.80 0.75 | |
Pursuant to the administration agreement, Curian receives an annual fee, accrued daily and paid monthly, at an annual rate of 0.20% of the average daily net assets of each Fund. In return for the fees paid under the administration agreement, Curian provides or procures all necessary administrative functions and services for the operation of the Funds. Subject to the oversight of the Board, Curian is responsible for managing the Funds’ business affairs and providing day-to-day administrative services to the Funds either directly or through others selected by it for the Funds. In addition, Curian, at its own expense, arranges for legal, audit, fund accounting, transfer agency, custody (except overdraft and interest expense), printing and mailing, errors and omissions insurance and all other services necessary for the operation of each Fund. Each Fund is responsible for registration fees, trading expenses, including brokerage commissions, interest and taxes, other non-operating expenses, independent trustee liability insurance, the fees and expenses of the independent Trustees and independent legal counsel to the independent Trustees, the costs associated with the Chief Compliance Officer, and certain nonrecurring or extraordinary expenses.
Fee Waivers - Pursuant to contractual fee waiver agreements, Curian agreed to waive a portion of its advisory fees for each of the following Funds:
Fund | | Advisory Fee Waiver as a
Percentage of Average
Daily Net Assets | |
Curian Tactical Advantage Funds | | 0.30 | % |
Curian Dynamic Risk Advantage — Diversified Fund | | 0.07 | |
Curian Variable Series Trust Sub-Advised Funds
Notes to Financial Statements
December 31, 2014
Fund | | Advisory Fee Waiver as a
Percentage of Average
Daily Net Assets | |
Curian Dynamic Risk Advantage — Growth Fund | | 0.07 | % |
Curian Dynamic Risk Advantage — Income Fund | | 0.35 | |
Curian/AQR Risk Parity Fund | | 0.20 | |
Curian/DoubleLine Total Return Fund | | 0.12 | |
Curian Focused International Equity Fund | | 0.02 | |
Curian Focused U.S. Equity Fund | | 0.11 | |
Curian/T. Rowe Price Capital Appreciation Fund | | 0.13 | |
None of the waived fees can be recaptured by Curian. The amount of waived expenses for each Fund is recorded as an expense waiver in each Fund’s Statement of Operations.
Other Service Providers - Curian has entered into a sub-administration and fund accounting services agreement with JFS, and is responsible for the compensation of JFS for services provided pursuant to such agreement. Curian pays JFS for such services through the fees earned pursuant to the administration agreement. The Trust has entered into a fund compliance services agreement with JFS. Pursuant to the fund compliance services agreement, JFS provides compliance oversight services to the Trust. JPM Chase acts as custodian for the Funds.
Distribution Agreement - The Trust has a Distribution Agreement, under the provisions of Rule 12b-1 under the 1940 Act, with Jackson National Life Distributors LLC (the “Distributor” or “JNLD”), an affiliate of the Adviser, for the purpose of reimbursement of certain distribution and related service expenses from the sale and distribution of each Fund’s shares. Under the Rule 12b-1 fee plan, each Fund accrues the Rule 12b-1 fee daily, at the maximum annual rate of 0.25% of the average daily net assets of the Fund, and pays the fee monthly to JNLD. Amounts charged pursuant to the Distribution Plan are reflected as 12b-1 fees in the Statements of Operations.
Directed Brokerage Commissions - A Sub-Adviser may allocate a portion of a Fund’s equity security transactions (subject to obtaining best execution of each transaction) through certain designated broker/dealers which will rebate a portion of the brokerage commissions to that Fund. Any amount credited to the Fund is reflected as brokerage commissions recaptured in the Statements of Operations.
Deferred Compensation Plan - The Funds adopted a Deferred Compensation Plan whereby a disinterested Trustee may defer the receipt of all or a portion of their compensation. These deferred amounts, which remain as liabilities of the Funds, are treated as if invested and reinvested in shares of one or more affiliated funds at the discretion of the applicable Trustee. These amounts represent general, unsecured liabilities of the Funds and vary according to the total returns of the selected Funds. Liabilities related to deferred balances are included in payable for trustee fees in the Statements of Assets and Liabilities. Increases or decreases related to the changes in value of deferred balances are included in trustee fees set forth in the Statements of Operations.
Investments in Affiliates - During the year ended December 31, 2014, certain Funds invested in the JNL Money Market Fund, which is managed by JNAM. The JNL Money Market Fund is offered as a cash management tool to the Funds and their affiliates and is not available for direct purchase by members of the public. JNAM serves as the Adviser and Administrator for JNL Money Market Fund. Curian/BlackRock Global Long Short Credit Fund invested in the iShares Transportation Average ETF, which is an affiliate of the Fund’s Sub-Adviser. Curian/T. Rowe Price Capital Appreciation Fund invested in T. Rowe Price Reserves Investment Fund as a cash management tool and T. Rowe Price Institutional Floating Rate Fund, which are affiliates of the Fund’s Sub-Adviser. The total value and cost of such affiliated investments is disclosed separately in the Statements of Assets and Liabilities, and the associated income and realized gain (loss) are disclosed separately in the Statements of Operations.
The following table details cash management investments in affiliates held at December 31, 2014. There was no realized gain or loss relating to transactions in these investments during the year ended December 31, 2014.
| | JNL Money Market Fund | |
| | Beginning
Amortized Cost | | Ending
Amortized Cost | | Dividend
Income | |
Curian Tactical Advantage 35 Fund | | $ | 374 | | $ | 624 | | $ | — | |
Curian Tactical Advantage 60 Fund | | 537 | | — | | — | |
Curian Tactical Advantage 75 Fund | | 714 | | 300 | | — | |
Curian Dynamic Risk Advantage - Diversified Fund | | 38,251 | | 35,292 | | 3 | |
Curian Dynamic Risk Advantage - Growth Fund | | 5,902 | | 5,421 | | 1 | |
Curian Dynamic Risk Advantage - Income Fund | | 2,311 | | 4,265 | | — | |
Curian/Aberdeen Latin America Fund | | 290 | | 241 | | — | |
Curian/AQR Risk Parity Fund | | 56,500 | | 16,500 | | 3 | |
Curian/Ashmore Emerging Market Small Cap Equity Fund | | 299 | | 178 | | — | |
Curian/Baring International Fixed Income Fund | | 248 | | 438 | | — | |
Curian/BlackRock Global Long Short Credit Fund | | 81,199 | | 26,633 | | 2 | |
Curian/CenterSquare International Real Estate Securities Fund | | 335 | | 15 | | — | |
Curian/DFA U.S. Micro Cap Fund | | 732 | | 32 | | — | |
Curian/DoubleLine Total Return Fund | | 19,365 | | 86,863 | | 11 | |
Curian/Eaton Vance Global Macro Absolute Return Advantage Fund | | 40,478 | | 51,674 | | 5 | |
Curian/Epoch Global Shareholder Yield Fund | | 1,067 | | 1,522 | | — | |
| | | | | | | | | | |
Curian Variable Series Trust Sub-Advised Funds
Notes to Financial Statements
December 31, 2014
| | JNL Money Market Fund | |
| | Beginning
Amortized Cost | | Ending
Amortized Cost | | Dividend
Income | |
Curian/FAMCO Flex Core Covered Call Fund | | $ | 3,016 | | $ | 4,882 | | $ | 1 | |
Curian Focused International Equity Fund | | 367 | | 9,724 | | 1 | |
Curian Focused U.S. Equity Fund | | 273 | | 3,116 | | 1 | |
Curian/Franklin Templeton Frontier Markets Fund | | 2,357 | | 2,470 | | — | |
Curian/Franklin Templeton Natural Resources Fund | | 6,804 | | 2,057 | | — | |
Curian/Lazard International Strategic Equity Fund | | 2,492 | | 5,994 | | 1 | |
Curian Long Short Credit Fund | | 20,333 | | 10,256 | | 2 | |
Curian/Neuberger Berman Currency Fund | | 10,223 | | 9,965 | | 1 | |
Curian/Neuberger Berman Risk Balanced Commodity Strategy Fund | | — | | 628 | | 1 | |
Curian/Nicholas Convertible Arbitrage Fund | | 41,670 | | 6,545 | | 3 | |
Curian/PIMCO Credit Income Fund | | 616 | | 817 | | — | |
Curian/PineBridge Merger Arbitrage Fund | | 44,368 | | 16,289 | | 2 | |
Curian/Schroder Emerging Europe Fund | | 367 | | 374 | | — | |
Curian/T. Rowe Price Capital Appreciation Fund | | — | | 2,056 | | — | |
Curian/The Boston Company Equity Income Fund | | 536 | | 569 | | — | |
Curian/UBS Global Long Short Fixed Income Opportunities Fund | | 4,000 | | 227 | | 1 | |
Curian/Van Eck International Gold Fund | | 5,330 | | 2,862 | | — | |
| | | | | | | |
| | T. Rowe Price Reserves Investment Fund | |
Fund | | Beginning
Amortized Cost | | Ending
Amortized Cost | | Dividend
Income | |
Curian/T. Rowe Price Capital Appreciation Fund | | $ | 3,903 | | $ | 16,536 | | $ | 5 | |
The following table details each Fund’s long term investments in affiliates held during the year ended December 31, 2014.
Fund | | Affiliate | | Value
Beginning
of Period | | Purchases | | Sales
Proceeds | | Dividend
Income | | Realized
Gain (Loss) | | Value End
of Period | |
Curian/BlackRock Global Long Short Credit Fund | | iShares Transportation Average ETF | | $ | 236 | | $ | — | | $ | 231 | | $ | — | | $ | 10 | | $ | — | |
Curian/T. Rowe Price Capital Appreciation Fund | | T. Rowe Price Institutional Floating Rate Fund | | 759 | | 540 | | 256 | | 42 | | — | | 1,017 | |
| | | | | | | | | | | | | | | | | | | | | |
NOTE 9. BORROWING ARRANGEMENTS
The Trust entered into a Syndicated Credit Agreement (“SCA”) with a group of lenders. The Funds participate in the SCA with other funds managed by JNAM and Curian in a credit facility which is available solely to finance shareholder redemptions or for other temporary or emergency purposes. Effective June 6, 2014, the Funds may borrow up to the lesser of $450,000,000, the amount available under the facility; the limits set for borrowing by the Funds’ prospectuses and the 1940 Act; or an amount prescribed within the SCA. Prior to June 6, 2014, the amount available under the facility was $300,000,000. Also effective June 6, 2014, Curian/AQR Risk Parity Fund, Curian/DoubleLine Total Return Fund, Curian Focused International Equity Fund, Curian Focused U.S. Equity Fund and Curian/T. Rowe Price Capital Appreciation Fund were added to the SCA. Prior to this date these Funds did not participate in the SCA. Interest on borrowings is payable at the Federal Funds Rate plus the amount by which the one month London Interbank Offer Rate (“LIBOR”) exceeds the Federal Funds rate plus 1.00% on an annualized basis. The Funds pay an annual fee of 0.075% of the available commitments and an annual administration fee to JPM Chase. These expenses are allocated to the participating Funds based on each Fund’s net assets as a percentage of the participating Funds’ total net assets and are included in other expenses in each Fund’s Statement of Operations. No amounts were borrowed under the facility during the year.
NOTE 10. FUND ACQUISITIONS
The following tables include information (in thousands) relating to an acquisition that was completed on April 28, 2014 by a taxable exchange of shares of Curian/The Boston Company Multi-Alpha Market Neutral Equity Fund for shares of Curian/Nicholas Convertible Arbitrage Fund pursuant to a plan of reorganization approved by the Board at a meeting held on December 16 and 17, 2013. The purpose of the acquisition was to combine Funds managed by the Adviser with comparable investment objectives and strategies. For financial reporting purposes, shares were issued at NAV based on the fair value of the assets received by the acquiring Fund.
| | | | Acquired Fund | | Acquiring Fund | | | |
Acquired Fund | | Acquiring Fund | | Net Assets on
Acquisition
Date | | Shares
Outstanding
on Acquisition
Date | | Net Assets on
Acquisition
Date | | Shares
Outstanding
on Acquisition
Date | | Shares of
Acquiring
Fund Issued
in Exchange | |
Curian/The Boston Company Multi-Alpha Market Neutral Equity Fund | | Curian/Nicholas Convertible Arbitrage Fund | | $ | 115,414 | | 11,710 | | $ | 260,145 | | 24,123 | | 10,710 | |
| | | | | | | | | | | | | | | |
Assuming the April 28, 2014 acquisition had been completed on January 1, 2014, the acquiring Fund’s pro forma results of operations (in thousands) for the year ended December 31, 2014, would have been:
Acquiring Fund | | Net Investment
Loss | | Net Realized Gain | | Net Change in Unrealized
Appreciation/ (Depreciation) | | Net Decrease in Net
Assets from Operations | |
Curian/Nicholas Convertible Arbitrage Fund | | $ | (15,430 | ) | $ | 8,668 | | $ | (4,515 | ) | $ | (11,277 | ) |
| | | | | | | | | | | | | |
Curian Variable Series Trust Sub-Advised Funds
Notes to Financial Statements
December 31, 2014
Because the combined investment portfolios have been managed as a single integrated portfolio since the acquisition was completed, it is not practicable to separate the amounts of net investment loss and net realized and unrealized gain (loss) of the acquired Fund that has been included in the respective acquiring Fund’s Statements of Operations since April 28, 2014 for the acquisition.
NOTE 11. INCOME TAX MATTERS
Each Fund is a separate taxpayer for federal income tax purposes. Each Fund intends to qualify as a regulated investment company (“RIC”) and to distribute substantially all net investment income and net capital gains, if any, to its shareholders and otherwise comply with Subchapter M of the Internal Revenue Code of 1986, as amended, applicable to regulated investment companies. Therefore, no federal income tax provision is required. Under current tax law, interest, dividends and capital gains paid by the Funds are not currently taxable to shareholders when left to accumulate within a variable annuity contract or variable life insurance policies.
The following information is presented on an income tax basis (in thousands). Differences between amounts for financial statements and federal income tax purposes are primarily due to timing and character differences in recognizing certain gains and losses on investment transactions. Permanent differences between financial statement and federal income tax reporting are reclassified within the capital accounts based on their federal income tax treatment. Temporary differences do not require reclassification. Permanent differences may include but are not limited to the following: foreign currency reclassifications, premium amortization or paydown reclassifications, reclassifications on the sale of passive foreign investment company (“PFIC”) or REIT securities, net operating losses, accounting treatment of notional principal contracts and distribution adjustments. These reclassifications have no impact on net assets.
| | Net Increase (Decrease) | |
| | Undistributed
Net Investment
Income | | Accumulated
Net Realized
Gain (Loss) | | Paid-in Capital | |
Curian Tactical Advantage 35 Fund | | $ | 21 | | $ | (21 | ) | $ | — | |
Curian Tactical Advantage 60 Fund | | 25 | | (25 | ) | — | |
Curian Tactical Advantage 75 Fund | | — | | — | | — | |
Curian Dynamic Risk Advantage - Diversified Fund | | 4,125 | | (4,125 | ) | — | |
Curian Dynamic Risk Advantage - Growth Fund | | 689 | | (16 | ) | (673 | ) |
Curian Dynamic Risk Advantage - Income Fund | | 2 | | (2 | ) | — | |
Curian/Aberdeen Latin America Fund | | 20 | | (20 | ) | — | |
Curian/AQR Risk Parity Fund | | 15,669 | | (15,669 | ) | — | |
Curian/Ashmore Emerging Market Small Cap Equity Fund | | (103 | ) | 103 | | — | |
Curian/Baring International Fixed Income Fund | | (408 | ) | 423 | | (15 | ) |
Curian/BlackRock Global Long Short Credit Fund | | 8,080 | | (8,080 | ) | — | |
Curian/CenterSquare International Real Estate Securities Fund | | 70 | | (152 | ) | 82 | |
Curian/DFA U.S. Micro Cap Fund | | 153 | | (153 | ) | — | |
Curian/DoubleLine Total Return Fund | | (4,149 | ) | 4,149 | | — | |
Curian/Eaton Vance Global Macro Absolute Return Advantage Fund | | 6,552 | | (6,552 | ) | — | |
Curian/Epoch Global Shareholder Yield Fund | | (8 | ) | 8 | | — | |
Curian/FAMCO Flex Core Covered Call Fund | | — | | — | | — | |
Curian Focused International Equity Fund | | (26 | ) | 26 | | — | |
Curian Focused U.S. Equity Fund | | — | | — | | — | |
Curian/Franklin Templeton Frontier Markets Fund | | (145 | ) | 145 | | — | |
Curian/Franklin Templeton Natural Resources Fund | | 443 | | (443 | ) | — | |
Curian/Lazard International Strategic Equity Fund | | (42 | ) | 42 | | — | |
Curian Long Short Credit Fund | | (237 | ) | 237 | | — | |
Curian/Neuberger Berman Currency Fund | | 4,972 | | (4,972 | ) | — | |
Curian/Neuberger Berman Risk Balanced Commodity Strategy Fund | | 854 | | — | | (854 | ) |
Curian/Nicholas Convertible Arbitrage Fund | | 11,780 | | (11,811 | ) | 31 | |
Curian/PIMCO Credit Income Fund | | 793 | | (793 | ) | — | |
Curian/PineBridge Merger Arbitrage Fund | | 2,792 | | (1,646 | ) | (1,146 | ) |
Curian/Schroder Emerging Europe Fund | | 29 | | (23 | ) | (6 | ) |
Curian/T. Rowe Price Capital Appreciation Fund | | 27 | | (27 | ) | — | |
Curian/The Boston Company Equity Income Fund | | (9 | ) | 9 | | — | |
Curian/UBS Global Long Short Fixed Income Opportunities Fund | | (2,790 | ) | 2,790 | | — | |
Curian/Van Eck International Gold Fund | | 1,544 | | (1,543 | ) | (1 | ) |
| | | | | | | | | | |
At December 31, 2014, the following Funds elected to defer capital, currency and/or PFIC mark-to-market losses (in thousands) realized after October 31, 2014 (“Post-October losses”), which were deferred for tax purposes to the first day of the following fiscal year, January 1, 2015:
| | Amount | |
Curian/Aberdeen Latin America Fund | | $ | 428 | |
Curian/Ashmore Emerging Market Small Cap Equity Fund | | 1,284 | |
Curian/Baring International Fixed Income Fund | | 231 | |
Curian/CenterSquare International Real Estate Securities Fund | | 26 | |
Curian/Schroder Emerging Europe Fund | | 774 | |
| | | | |
Curian Variable Series Trust Sub-Advised Funds
Notes to Financial Statements
December 31, 2014
At December 31, 2014, the following Funds had net capital loss carryforwards (in thousands) available for U.S. federal income tax purposes to offset future net realized capital gains. Details of the capital loss carryforwards are listed in the table below.
| | No Expiration | | | |
| | Short Term | | Long Term | | Total | |
Curian Dynamic Risk Advantage - Growth Fund | | $ | 1,234 | | $ | 905 | | $ | 2,139 | |
Curian/Aberdeen Latin America Fund | | 104 | | 197 | | 301 | |
Curian/CenterSquare International Real Estate Securities Fund | | 253 | | — | | 253 | |
Curian/DoubleLine Total Return Fund | | 2,036 | | — | | 2,036 | |
Curian/Eaton Vance Global Macro Absolute Return Advantage Fund | | — | | 716 | | 716 | |
Curian Focused International Equity Fund | | 1,198 | | — | | 1,198 | |
Curian/Lazard International Strategic Equity Fund | | 675 | | — | | 675 | |
Curian Long Short Credit Fund | | 2,716 | | 8,403 | | 11,119 | |
Curian/Nicholas Convertible Arbitrage Fund | | 7,609 | | — | | 7,609 | |
Curian/PIMCO Credit Income Fund | | 11 | | 296 | | 307 | |
Curian/Schroder Emerging Europe Fund | | 434 | | 496 | | 930 | |
Curian/Van Eck International Gold Fund | | 12,294 | | 30,226 | | 42,520 | |
| | | | | | | | | | |
As of December 31, 2014, the cost of investments and the components of net unrealized appreciation/(depreciation) (in thousands) were as follows:
| | Tax Cost of
Investments | | Gross
Unrealized
Appreciation | | Gross
Unrealized
Depreciation | | Net Unrealized
Appreciation/
(Depreciation) | |
Curian Tactical Advantage 35 Fund | | $ | 59,098 | | $ | 1,455 | | $ | (557 | ) | $ | 898 | |
Curian Tactical Advantage 60 Fund | | 133,204 | | 5,650 | | (1,598 | ) | 4,052 | |
Curian Tactical Advantage 75 Fund | | 121,949 | | 5,723 | | (1,744 | ) | 3,979 | |
Curian Dynamic Risk Advantage - Diversified Fund | | 353,891 | | 375 | | (1,039 | ) | (664 | ) |
Curian Dynamic Risk Advantage - Growth Fund | | 62,837 | | 38 | | (735 | ) | (697 | ) |
Curian Dynamic Risk Advantage - Income Fund | | 229,414 | | 3,368 | | (2,022 | ) | 1,346 | |
Curian/Aberdeen Latin America Fund | | 11,368 | | 104 | | (2,975 | ) | (2,871 | ) |
Curian/AQR Risk Parity Fund | | 177,024 | | 169 | | (2,604 | ) | (2,435 | ) |
Curian/Ashmore Emerging Market Small Cap Equity Fund | | 41,639 | | 2,862 | | (5,588 | ) | (2,726 | ) |
Curian/Baring International Fixed Income Fund | | 25,425 | | 167 | | (1,404 | ) | (1,237 | ) |
Curian/BlackRock Global Long Short Credit Fund | | | | | | | | | |
Long Investments | | 444,733 | | 3,292 | | (15,299 | ) | (12,007 | ) |
Short Investments | | 60,192 | | 2,945 | | (2,757 | ) | 188 | |
Curian/CenterSquare International Real Estate Securities Fund | | 20,974 | | 658 | | (1,972 | ) | (1,314 | ) |
Curian/DFA U.S. Micro Cap Fund | | 86,653 | | 24,259 | | (6,572 | ) | 17,687 | |
Curian/DoubleLine Total Return Fund | | 1,206,814 | | 28,479 | | (3,396 | ) | 25,083 | |
Curian/Eaton Vance Global Macro Absolute Return Advantage Fund | | 433,943 | | 11,323 | | (24,621 | ) | (13,298 | ) |
Curian/Epoch Global Shareholder Yield Fund | | 57,413 | | 4,872 | | (2,462 | ) | 2,410 | |
Curian/FAMCO Flex Core Covered Call Fund | | 222,376 | | 36,817 | | (2,168 | ) | 34,649 | |
Curian Focused International Equity Fund | | 239,279 | | 11,546 | | (14,229 | ) | (2,683 | ) |
Curian Focused U.S. Equity Fund | | 91,388 | | 6,236 | | (5,325 | ) | 911 | |
Curian/Franklin Templeton Frontier Markets Fund | | 76,668 | | 7,477 | | (13,737 | ) | (6,260 | ) |
Curian/Franklin Templeton Natural Resources Fund | | 80,144 | | 652 | | (18,816 | ) | (18,164 | ) |
Curian/Lazard International Strategic Equity Fund | | 124,444 | | 8,009 | | (6,184 | ) | 1,825 | |
Curian Long Short Credit Fund | | 358,686 | | 6,586 | | (14,109 | ) | (7,523 | ) |
Curian/Neuberger Berman Currency Fund | | 192,521 | | 5 | | (24 | ) | (19 | ) |
Curian/Neuberger Berman Risk Balanced Commodity Strategy Fund | | 173,164 | | 7 | | (155 | ) | (148 | ) |
Curian/Nicholas Convertible Arbitrage Fund | | | | | | | | | |
Long Investments | | 448,676 | | 19,242 | | (14,002 | ) | 5,240 | |
Short Investments | | 199,721 | | 29,749 | | (18,208 | ) | 11,541 | |
Curian/PIMCO Credit Income Fund | | 90,912 | | 2,272 | | (1,374 | ) | 898 | |
Curian/PineBridge Merger Arbitrage Fund | | 89,783 | | 1,727 | | (667 | ) | 1,060 | |
Curian/Schroder Emerging Europe Fund | | 16,474 | | 318 | | (3,667 | ) | (3,349 | ) |
Curian/T. Rowe Price Capital Appreciation Fund | | 111,022 | | 6,229 | | (1,119 | ) | 5,110 | |
Curian/The Boston Company Equity Income Fund | | 58,805 | | 7,070 | | (1,343 | ) | 5,727 | |
Curian/UBS Global Long Short Fixed Income Opportunities Fund | | 177,235 | | 3,731 | | (13,327 | ) | (9,596 | ) |
Curian/Van Eck International Gold Fund | | 134,947 | | 2,579 | | (36,298 | ) | (33,719 | ) |
| | | | | | | | | | | | | |
As of December 31, 2014, the components of distributable taxable earnings for U.S. federal income tax purposes (in thousands) were as follows:
| | Undistributed
Net Ordinary
Income* | | Undistributed
Net Long-Term
Capital Gain | | Unrealized
Gains
(Losses)** | | Capital Loss
Carryforward | |
Curian Tactical Advantage 35 Fund | | $ | 1,101 | | $ | 206 | | $ | 896 | | $ | — | |
Curian Tactical Advantage 60 Fund | | 3,216 | | 880 | | 4,050 | | — | |
Curian Tactical Advantage 75 Fund | | 3,189 | | 856 | | 3,975 | | — | |
Curian Dynamic Risk Advantage - Diversified Fund | | 12,246 | | 3,008 | | 2,242 | | — | |
Curian Dynamic Risk Advantage - Growth Fund | | — | | — | | (759 | ) | (2,139 | ) |
Curian Dynamic Risk Advantage - Income Fund | | 7,182 | | — | | 1,340 | | — | |
| | | | | | | | | | | | | |
Curian Variable Series Trust Sub-Advised Funds
Notes to Financial Statements
December 31, 2014
| | Undistributed
Net Ordinary
Income* | | Undistributed
Net Long-Term
Capital Gain | | Unrealized
Gains
(Losses)** | | Capital Loss
Carryforward | |
Curian/Aberdeen Latin America Fund | | $ | 1 | | $ | — | | $ | (3,297 | ) | $ | (301 | ) |
Curian/AQR Risk Parity Fund | | 27,829 | | 5,720 | | (13,228 | ) | — | |
Curian/Ashmore Emerging Market Small Cap Equity Fund | | 117 | | 29 | | (4,090 | ) | — | |
Curian/Baring International Fixed Income Fund | | — | | 11 | | (1,577 | ) | — | |
Curian/BlackRock Global Long Short Credit Fund | | 26,231 | | 257 | | (14,587 | ) | — | |
Curian/CenterSquare International Real Estate Securities Fund | | 165 | | — | | (1,343 | ) | (253 | ) |
Curian/DFA U.S. Micro Cap Fund | | 609 | | 29,701 | | 17,737 | | — | |
Curian/DoubleLine Total Return Fund | | 23,912 | | — | | 25,077 | | (2,036 | ) |
Curian/Eaton Vance Global Macro Absolute Return Advantage Fund | | 28,903 | | — | | (14,685 | ) | (716 | ) |
Curian/Epoch Global Shareholder Yield Fund | | 2,063 | | 446 | | 2,406 | | — | |
Curian/FAMCO Flex Core Covered Call Fund | | 4,813 | | 57 | | 18,312 | | — | |
Curian Focused International Equity Fund | | 190 | | — | | (2,688 | ) | (1,198 | ) |
Curian Focused U.S. Equity Fund | | 740 | | 61 | | 911 | | — | |
Curian/Franklin Templeton Frontier Markets Fund | | 3,119 | | 11,561 | | (6,277 | ) | — | |
Curian/Franklin Templeton Natural Resources Fund | | 2,235 | | 10,780 | | (18,180 | ) | — | |
Curian/Lazard International Strategic Equity Fund | | 862 | | — | | 1,820 | | (675 | ) |
Curian Long Short Credit Fund | | 11,466 | | — | | (7,649 | ) | (11,119 | ) |
Curian/Neuberger Berman Currency Fund | | 4,086 | | — | | (48 | ) | — | |
Curian/Neuberger Berman Risk Balanced Commodity Strategy Fund | | — | | — | | (46,605 | ) | — | |
Curian/Nicholas Convertible Arbitrage Fund | | 5,231 | | — | | (8,781 | ) | (7,609 | ) |
Curian/PIMCO Credit Income Fund | | 2,324 | | — | | 810 | | (307 | ) |
Curian/PineBridge Merger Arbitrage Fund | | — | | 1,012 | | 161 | | — | |
Curian/Schroder Emerging Europe Fund | | — | | — | | (4,126 | ) | (930 | ) |
Curian/T. Rowe Price Capital Appreciation Fund | | 1,090 | | 98 | | 4,810 | | — | |
Curian/The Boston Company Equity Income Fund | | 1,616 | | 2,109 | | 5,725 | | — | |
Curian/UBS Global Long Short Fixed Income Opportunities Fund | | 4,470 | | — | | (13,437 | ) | — | |
Curian/Van Eck International Gold Fund | | 997 | | — | | (33,732 | ) | (42,520 | ) |
| | | | | | | | | | | | | |
* Undistributed net ordinary income consists of net taxable income derived from dividends, interest and net short-term capital gains, if any.
** Unrealized gains (losses) are adjusted for open wash sale loss deferrals; accelerated recognition of unrealized gain/loss on futures, options, and forward contracts; and accelerated recognition of unrealized gain on PFICs. Also adjusted for differences between book and tax realized and unrealized gain/loss on swap contracts.
The tax character of distributions paid (in thousands) during the Funds’ fiscal year ended December 31, 2014 was as follows:
| | Net Ordinary
Income* | | Long-term
Capital Gain** | | Return of Capital | |
Curian Tactical Advantage 35 Fund | | $ | 1,539 | | $ | 79 | | $ | — | |
Curian Tactical Advantage 60 Fund | | 4,256 | | 293 | | — | |
Curian Tactical Advantage 75 Fund | | 4,360 | | 256 | | — | |
Curian Dynamic Risk Advantage - Diversified Fund | | — | | 230 | | — | |
Curian Dynamic Risk Advantage - Growth Fund | | — | | 297 | | — | |
Curian Dynamic Risk Advantage - Income Fund | | 4,958 | | 30 | | — | |
Curian/Aberdeen Latin America Fund | | 119 | | — | | — | |
Curian/AQR Risk Parity Fund | | 3,241 | | 3,052 | | — | |
Curian/Ashmore Emerging Market Small Cap Equity Fund | | 560 | | — | | — | |
Curian/Baring International Fixed Income Fund | | 3 | | 28 | | — | |
Curian/CenterSquare International Real Estate Securities Fund | | 614 | | — | | — | |
Curian/DFA U.S. Micro Cap Fund | | 4,811 | | 2,862 | | — | |
Curian/DoubleLine Total Return Fund | | 3,136 | | — | | — | |
Curian/Epoch Global Shareholder Yield Fund | | 924 | | 102 | | — | |
Curian/FAMCO Flex Core Covered Call Fund | | 60 | | — | | — | |
Curian Focused International Equity Fund | | 35 | | — | | — | |
Curian Focused U.S. Equity Fund | | 38 | | — | | — | |
Curian/Franklin Templeton Frontier Markets Fund | | 6,616 | | 2,447 | | — | |
Curian/Franklin Templeton Natural Resources Fund | | 8,963 | | 5,152 | | — | |
Curian/Lazard International Strategic Equity Fund | | 53 | | — | | — | |
Curian Long Short Credit Fund | | 8,311 | | 3,191 | | — | |
Curian/Nicholas Convertible Arbitrage Fund | | 3,519 | | 7,704 | | — | |
Curian/PIMCO Credit Income Fund | | 34 | | — | | — | |
Curian/Schroder Emerging Europe Fund | | 434 | | — | | 6 | |
Curian/T. Rowe Price Capital Appreciation Fund | | 3,294 | | 102 | | — | |
Curian/The Boston Company Equity Income Fund | | 1,049 | | 1,005 | | — | |
Curian/Van Eck International Gold Fund | | 230 | | — | | — | |
| | | | | | | | | | |
* Net ordinary income consists of net taxable income derived from dividends, interest and net short-term capital gains, if any.
** The Funds designated as a long-term capital gain dividend, pursuant to the Internal Revenue code section 852(b)(3), the amount necessary to reduce earnings and profits of the Funds related to net capital gains to zero for the year ended December 31, 2014.
Curian Variable Series Trust Sub-Advised Funds
Notes to Financial Statements
December 31, 2014
The tax character of distributions paid (in thousands) during the Funds’ fiscal year ended December 31, 2013 was as follows:
| | Net Ordinary
Income* | | Long-term
Capital Gain | | Return of
Capital | |
Curian Tactical Advantage 35 Fund | | $ | 31 | | $ | 10 | | $ | — | |
Curian Tactical Advantage 60 Fund | | 48 | | 8 | | — | |
Curian Tactical Advantage 75 Fund | | 97 | | 2 | | — | |
Curian Dynamic Risk Advantage - Diversified Fund | | 28 | | 313 | | — | |
Curian Dynamic Risk Advantage - Growth Fund | | — | | 1,949 | | — | |
Curian Dynamic Risk Advantage - Income Fund | | 93 | | — | | — | |
Curian/Aberdeen Latin America Fund | | 57 | | — | | — | |
Curian/Ashmore Emerging Market Small Cap Equity Fund | �� | 3 | | — | | — | |
Curian/Baring International Fixed Income Fund | | 105 | | — | | — | |
Curian/DFA U.S. Micro Cap Fund | | 1,273 | | 279 | | — | |
Curian/Epoch Global Shareholder Yield Fund | | 3,487 | | 827 | | — | |
Curian/FAMCO Flex Core Covered Call Fund | | 971 | | — | | — | |
Curian/Franklin Templeton Natural Resources Fund | | 430 | | — | | — | |
Curian/Neuberger Berman Currency Fund | | 1,759 | | — | | — | |
Curian/Nicholas Convertible Arbitrage Fund | | 1,177 | | — | | — | |
Curian/PIMCO Credit Income Fund | | 952 | | — | | — | |
Curian/PineBridge Merger Arbitrage Fund | | 804 | | — | | — | |
Curian/Schroder Emerging Europe Fund | | 217 | | — | | — | |
Curian/T. Rowe Price Capital Appreciation Fund | | 122 | | — | | — | |
Curian/The Boston Company Equity Income Fund | | 2,505 | | 696 | | — | |
Curian/Urdang International REIT Fund | | 202 | | — | | 22 | |
Curian/Van Eck International Gold Fund | | 223 | | — | | — | |
| | | | | | | | | | |
* Net ordinary income consists of net taxable income derived from dividends, interest and net short-term capital gains, if any.
FASB ASC Topic 740 “Income Taxes” provides guidance for how uncertain tax positions should be recognized, measured, presented and disclosed in the financial statements. FASB ASC Topic 740 requires the evaluation of tax positions taken or expected to be taken in the course of preparing each Fund’s tax return to determine whether the tax positions are “more-likely-than-not” of being sustained by the applicable tax authority. Tax positions not deemed to meet the “more-likely-than-not” threshold would result in the Funds recording a tax expense in the current period. FASB ASC Topic 740 requires that management evaluate the tax positions taken in the 2012, 2013 and 2014 returns which remain subject to examination by the Internal Revenue Service and certain other jurisdictions. Management completed an evaluation of the Funds’ tax positions and based on that evaluation, determined that no provision for federal income tax was required in the Funds’ financial statements during the year ended December 31, 2014.
NOTE 12. SUBSEQUENT EVENTS
Management has evaluated subsequent events for the Funds through the date the financial statements are issued and the following events occurred:
Effective January 1, 2015, the Adviser agreed to contractually waive annual advisory fees of 0.25% of average daily net assets for the Curian Long Short Credit Fund. In addition, effective on the same day, the Adviser agreed to voluntarily waive annual advisory fees of 0.15% of average daily net assets for the Curian/Aberdeen Latin American Fund and 0.10% of average daily net assets for the Curian/UBS Global Long Short Fixed Income Opportunities Fund.
At meetings held on January 8, 2015 and January 12, 2015, the Board approved the followings mergers effective after the close of business on April 24, 2015, subject to shareholder approval.
Acquired Fund | | Acquiring Fund |
Curian Dynamic Risk Advantage — Diversified Fund | | JNL/MMRS Conservative |
Curian Dynamic Risk Advantage — Growth Fund | | JNL/MMRS Moderate |
Curian Dynamic Risk Advantage — Income Fund | | JNL/MMRS Conservative |
Curian/Aberdeen Latin America Fund | | JNL/Lazard Emerging Markets Fund |
Curian/Ashmore Emerging Market Small Cap Equity Fund | | JNL/Lazard Emerging Markets Fund |
Curian/Baring International Fixed Income Fund | | JNL/Franklin Templeton Global Multisector Bond Fund |
Curian/CenterSquare International Real Estate Securities Fund | | JNL/Invesco Global Real Estate Fund |
Curian/PineBridge Merger Arbitrage Fund | | Curian/Nicholas Convertible Arbitrage Fund |
Curian/Schroder Emerging Europe Fund | | JNL/Lazard Emerging Markets Fund |
Curian/UBS Global Long Short Fixed Income Opportunities Fund | | Curian/BlackRock Global Long Short Credit Fund |
Curian Variable Series Trust Sub-Advised Funds
Notes to Financial Statements
December 31, 2014
At its meeting held January 8, 2015, the Board also voted to approve the replacement of Curian with JNAM as the Funds’ investment adviser and administrator effective April 27, 2015, subject to shareholder approval. Subject to shareholder approval of the change in investment adviser, the administration fee paid by the Funds will be reduced to 0.15% of average daily net assets of each Fund effective April 27, 2015. Additionally, subject to shareholder approval of the change in investment adviser, the 12b-1 fees paid by the Funds will be reduced to 0.20% of average daily net assets of each Fund effective April 27, 2015. Moreover, subject to shareholder approval of the change in investment adviser, the contractual agreement to waive advisory fees for Curian/AQR Risk Parity Fund, Curian/DoubleLine Total Return Fund, Curian Focused International Equity Fund, Curian Focused U.S. Equity Fund and Curian/T. Rowe Price Capital Appreciation Fund will be terminated and a new contractual waiver agreement with JNAM will reflect a reduction in the amounts previously waived by the Adviser to 0.10%, 0.02%, 0.00%, 0.01% and 0.03%, respectively, of average daily net assets effective April 27, 2015. Finally, subject to shareholder approval of the change in investment adviser, the following Fund name changes will be effective April 27, 2015:
Existing Fund Name | | Effective April 27, 2015 Fund Name: |
Curian Tactical Advantage 35 Fund | | JNL Tactical Advantage 35 Fund |
Curian Tactical Advantage 60 Fund | | JNL Tactical Advantage 60 Fund |
Curian Tactical Advantage 75 Fund | | JNL Tactical Advantage 75 Fund |
Curian/AQR Risk Parity Fund | | JNL/AQR Risk Parity Fund |
Curian/BlackRock Global Long Short Credit Fund | | JNL/BlackRock Global Long Short Credit Fund |
Curian/DFA U.S. Micro Cap Fund | | JNL/DFA U.S. Micro Cap Fund |
Curian/DoubleLine Total Return Fund | | JNL/DoubleLine Total Return Fund |
Curian/Eaton Vance Global Macro Absolute Return Advantage Fund | | JNL/Eaton Vance Global Macro Absolute Return Advantage Fund |
Curian/Epoch Global Shareholder Yield Fund | | JNL/Epoch Global Shareholder Yield Fund |
Curian/FAMCO Flex Core Covered Call Fund | | JNL/FAMCO Flex Core Covered Call Fund |
Curian Focused International Equity Fund | | JNL/Focused International Equity Fund |
Curian Focused U.S. Equity Fund | | JNL/Focused U.S. Equity Fund |
Curian/Franklin Templeton Frontier Markets Fund | | JNL/Franklin Templeton Frontier Markets Fund |
Curian/Franklin Templeton Natural Resources Fund | | JNL/Franklin Templeton Natural Resources Fund |
Curian/Lazard International Strategic Equity Fund | | JNL/Lazard International Strategic Equity Fund |
Curian Long Short Credit Fund | | JNL/Long Short Credit Fund |
Curian/Neuberger Berman Currency Fund | | JNL/Neuberger Berman Currency Fund |
Curian/Neuberger Berman Risk Balanced Commodity Strategy Fund | | JNL/Neuberger Berman Risk Balanced Commodity Strategy Fund |
Curian/Nicholas Convertible Arbitrage Fund | | JNL/Nicholas Convertible Arbitrage Fund |
Curian/PIMCO Credit Income Fund | | JNL/PIMCO Credit Income Fund |
Curian/T. Rowe Price Capital Appreciation Fund | | JNL/T. Rowe Price Capital Appreciation Fund |
Curian/The Boston Company Equity Income Fund | | JNL/The Boston Company Equity Income Fund |
Curian/Van Eck International Gold Fund | | JNL/Van Eck International Gold Fund |
No other events were noted that required adjustments to the financial statements or disclosure in the notes.
Report of Independent Registered Public Accounting Firm
To the Shareholders and Board of Trustees
Curian Variable Series Trust:
We have audited the accompanying (consolidated, where applicable) statements of assets and liabilities of each series within Curian Variable Series Trust (the “Funds”) as listed in Note 1 of the financial statements of Curian Variable Series Trust Sub-Advised Funds, including the schedules of investments or summary schedules of investments, where applicable, as of December 31, 2014, and the related statements of operations for the year or periods then ended, the statements of changes in net assets for each of the years or periods in the two-year period then ended, and the financial highlights for each of the years or periods in the three-year period then ended. These financial statements and financial highlights are the responsibility of the Funds’ management. Our responsibility is to express an opinion on these financial statements and financial highlights based on our audits.
We conducted our audits in accordance with the standards of the Public Company Accounting Oversight Board (United States). Those standards require that we plan and perform the audit to obtain reasonable assurance about whether the financial statements and financial highlights are free of material misstatement. An audit includes examining, on a test basis, evidence supporting the amounts and disclosures in the financial statements. Our procedures included confirmation of securities owned as of December 31, 2014, by correspondence with the custodian, transfer agents and brokers or other appropriate auditing procedures. An audit also includes assessing the accounting principles used and significant estimates made by management, as well as evaluating the overall financial statement presentation. We believe that our audits provide a reasonable basis for our opinion.
In our opinion, the financial statements (consolidated, where applicable) and financial highlights referred to above present fairly, in all material respects, the financial position of the Funds as of December 31, 2014, the results of their operations, changes in their net assets and the financial highlights for each of the years and periods indicated above, in conformity with U.S. generally accepted accounting principles.
/s/ KPMG LLP
Chicago, Illinois
February 26, 2015
Curian Variable Series Trust Sub-Advised Funds
Additional Disclosures (Unaudited)
December 31, 2014
Disclosure of Fund Expenses. Shareholders incur ongoing costs, which include costs for portfolio management, administrative services, Rule 12b-1 fees of certain Funds and other operating expenses. Operating expenses such as these are deducted from each Fund’s gross income and directly reduce the final investment return. These expenses are expressed as a percentage of the Fund’s average net assets; this percentage is known as the Fund’s expense ratio. The examples below use the expense ratio and are intended to help the investor understand the ongoing costs (in dollars) of investing in a Fund and to compare these costs with the ongoing costs of investing in other mutual funds. The examples are based on an investment of $1,000 made at the beginning of the period shown and held for the entire period. The examples do not reflect the expenses of the variable insurance contracts or the separate account. Total expenses would be higher if these expenses were included.
Expenses Using Actual Fund Return. This section provides information about the actual account values and actual expenses incurred by the Fund. Use the information in this section, together with the amount invested, to estimate the expenses paid over the period. Simply divide the account value by $1,000 (for example, an $8,600 account value divided by $1,000 = 8.6), then multiply the result by the number in the first section under the heading entitled “Expenses Paid During Period” to estimate the expenses paid during this period.
Expenses Using Hypothetical 5% Return. This section provides information that can be used to compare each Fund’s costs with those of other mutual funds. It assumes that the Fund’s expense ratio for the period is unchanged and assumes an annual 5% return before expenses, which is not the Fund’s actual return. This example is useful in making comparisons because the SEC requires all mutual funds to make the 5% calculation.
| | Expenses Using Actual Fund Return | | Expenses Using Hypothetical 5% Return | |
| | Beginning
Account
Value
7/1/2014 | | Ending
Account
Value
12/31/2014 | | Annualized
Net Expense
Ratios | | Expenses
Paid
During Period | | Beginning
Account
Value
7/1/2014 | | Ending
Account
Value
12/31/2014 | | Annualized
Net Expense
Ratios | | Expenses
Paid
During Period | |
Curian Tactical Advantage 35 Fund | | | | | | | | | | | | | | | | | |
| | $ | 1,000.00 | | $ | 1,007.30 | | 0.91 | % | $ | 4.60 | | $ | 1,000.00 | | $ | 1,020.60 | | 0.91 | % | $ | 4.63 | |
Curian Tactical Advantage 60 Fund | | | | | | | | | | | | | | | | | |
| | 1,000.00 | | 1,009.50 | | 0.91 | | 4.61 | | 1,000.00 | | 1,020.60 | | 0.91 | | 4.63 | |
Curian Tactical Advantage 75 Fund | | | | | | | | | | | | | | | | | |
| | 1,000.00 | | 1,009.00 | | 0.91 | | 4.61 | | 1,000.00 | | 1,020.60 | | 0.91 | | 4.63 | |
Curian Dynamic Risk Advantage - Diversified Fund | | | | | | | | | | | | | | | | | |
| | 1,000.00 | | 1,002.50 | | 1.24 | | 6.26 | | 1,000.00 | | 1,018.94 | | 1.24 | | 6.31 | |
Curian Dynamic Risk Advantage - Growth Fund | | | | | | | | | | | | | | | | | |
| | 1,000.00 | | 950.80 | | 1.24 | | 6.10 | | 1,000.00 | | 1,018.94 | | 1.24 | | 6.31 | |
Curian Dynamic Risk Advantage - Income Fund | | | | | | | | | | | | | | | | | |
| | 1,000.00 | | 1,017.80 | | 0.96 | | 4.88 | | 1,000.00 | | 1,020.35 | | 0.96 | | 4.89 | |
Curian/Aberdeen Latin America Fund | | | | | | | | | | | | | | | | | |
| | 1,000.00 | | 803.60 | | 1.82 | | 8.27 | | 1,000.00 | | 1,016.04 | | 1.82 | | 9.25 | |
Curian/AQR Risk Parity Fund | | | | | | | | | | | | | | | | | |
| | 1,000.00 | | 964.50 | | 1.12 | | 5.55 | | 1,000.00 | | 1,019.57 | | 1.12 | | 5.70 | |
Curian/Ashmore Emerging Market Small Cap Equity Fund | | | | | | | | | | | | | | | | | |
| | 1,000.00 | | 873.50 | | 1.58 | | 7.46 | | 1,000.00 | | 1,017.27 | | 1.58 | | 8.03 | |
Curian/Baring International Fixed Income Fund | | | | | | | | | | | | | | | | | |
| | 1,000.00 | | 919.30 | | 1.06 | | 5.13 | | 1,000.00 | | 1,019.84 | | 1.06 | | 5.40 | |
Curian/BlackRock Global Long Short Credit Fund | | | | | | | | | | | | | | | | | |
| | 1,000.00 | | 984.60 | | 2.27 | | 11.36 | | 1,000.00 | | 1,013.75 | | 2.27 | | 11.52 | |
Curian/CenterSquare International Real Estate Securities Fund | | | | | | | | | | | | | | | | | |
| | 1,000.00 | | 954.90 | | 1.26 | | 6.21 | | 1,000.00 | | 1,018.83 | | 1.26 | | 6.41 | |
Curian/DFA U.S. Micro Cap Fund | | | | | | | | | | | | | | | | | |
| | 1,000.00 | | 1,006.50 | | 1.26 | | 6.37 | | 1,000.00 | | 1,018.83 | | 1.26 | | 6.41 | |
Curian/DoubleLine Total Return Fund | | | | | | | | | | | | | | | | | |
| | 1,000.00 | | 1,022.00 | | 0.84 | | 4.28 | | 1,000.00 | | 1,020.96 | | 0.84 | | 4.28 | |
Curian/Eaton Vance Global Macro Absolute Return Advantage Fund | | | | | | | | | | | | | | | | | |
| | 1,000.00 | | 1,035.30 | | 1.51 | | 7.75 | | 1,000.00 | | 1,017.61 | | 1.51 | | 7.68 | |
Curian/Epoch Global Shareholder Yield Fund | | | | | | | | | | | | | | | | | |
| | 1,000.00 | | 974.70 | | 1.16 | | 5.77 | | 1,000.00 | | 1,019.35 | | 1.16 | | 5.90 | |
Curian/FAMCO Flex Core Covered Call Fund | | | | | | | | | | | | | | | | | |
| | 1,000.00 | | 1,041.60 | | 1.07 | | 5.51 | | 1,000.00 | | 1,019.83 | | 1.07 | | 5.45 | |
Curian Focused International Equity Fund | | | | | | | | | | | | | | | | | |
| | 1,000.00 | | 953.50 | | 1.25 | | 6.15 | | 1,000.00 | | 1,018.89 | | 1.25 | | 6.36 | |
Curian Focused U.S. Equity Fund | | | | | | | | | | | | | | | | | |
| | 1,000.00 | | 984.90 | | 1.06 | | 5.30 | | 1,000.00 | | 1,019.84 | | 1.06 | | 5.40 | |
Curian/Franklin Templeton Frontier Markets Fund | | | | | | | | | | | | | | | | | |
| | 1,000.00 | | 815.90 | | 1.87 | | 8.56 | | 1,000.00 | | 1,015.80 | | 1.87 | | 9.50 | |
Curian/Franklin Templeton Natural Resources Fund | | | | | | | | | | | | | | | | | |
| | 1,000.00 | | 686.00 | | 1.26 | | 5.35 | | 1,000.00 | | 1,018.83 | | 1.26 | | 6.41 | |
Curian/Lazard International Strategic Equity Fund | | | | | | | | | | | | | | | | | |
| | 1,000.00 | | 942.70 | | 1.27 | | 6.22 | | 1,000.00 | | 1,018.82 | | 1.27 | | 6.46 | |
Curian Long Short Credit Fund | | | | | | | | | | | | | | | | | |
| | 1,000.00 | | 960.20 | | 1.41 | | 6.97 | | 1,000.00 | | 1,018.08 | | 1.41 | | 7.17 | |
Curian/Neuberger Berman Currency Fund | | | | | | | | | | | | | | | | | |
| | 1,000.00 | | 1,022.20 | | 1.16 | | 5.91 | | 1,000.00 | | 1,019.34 | | 1.16 | | 5.90 | |
| | | | | | | | | | | | | | | | | | | | | | | |
| | Expenses Using Actual Fund Return | | Expenses Using Hypothetical 5% Return | |
| | Beginning
Account
Value
7/1/2014 | | Ending
Account
Value
12/31/2014 | | Annualized
Net Expense
Ratios | | Expenses
Paid
During Period | | Beginning
Account
Value
7/1/2014 | | Ending
Account
Value
12/31/2014 | | Annualized
Net Expense
Ratios | | Expenses
Paid
During Period | |
Curian/Neuberger Berman Risk Balanced Commodity Strategy Fund | | | | | | | | | | | | | | | | | |
| | $ | 1,000.00 | | $ | 765.60 | | 1.07 | % | $ | 4.76 | | $ | 1,000.00 | | $ | 1,019.81 | | 1.07 | % | $ | 5.45 | |
Curian/Nicholas Convertible Arbitrage Fund | | | | | | | | | | | | | | | | | |
| | 1,000.00 | | 967.30 | | 1.81 | | 8.98 | | 1,000.00 | | 1,016.09 | | 1.81 | | 9.20 | |
Curian/PIMCO Credit Income Fund | | | | | | | | | | | | | | | | | |
| | 1,000.00 | | 1,015.20 | | 0.86 | | 4.37 | | 1,000.00 | | 1,020.86 | | 0.86 | | 4.38 | |
Curian/PineBridge Merger Arbitrage Fund | | | | | | | | | | | | | | | | | |
| | 1,000.00 | | 1,002.00 | | 2.33 | | 11.76 | | 1,000.00 | | 1,013.44 | | 2.33 | | 11.82 | |
Curian/Schroder Emerging Europe Fund | | | | | | | | | | | | | | | | | |
| | 1,000.00 | | 741.40 | | 1.58 | | 6.94 | | 1,000.00 | | 1,017.24 | | 1.58 | | 8.03 | |
Curian/T. Rowe Price Capital Appreciation Fund | | | | | | | | | | | | | | | | | |
| | 1,000.00 | | 1,046.60 | | 1.03 | | 5.31 | | 1,000.00 | | 1,020.02 | | 1.03 | | 5.24 | |
Curian/The Boston Company Equity Income Fund | | | | | | | | | | | | | | | | | |
| | 1,000.00 | | 1,050.30 | | 1.01 | | 5.22 | | 1,000.00 | | 1,020.10 | | 1.01 | | 5.14 | |
Curian/UBS Global Long Short Fixed Income Opportunities Fund | | | | | | | | | | | | | | | | | |
| | 1,000.00 | | 967.50 | | 1.43 | | 7.09 | | 1,000.00 | | 1,017.97 | | 1.43 | | 7.27 | |
Curian/Van Eck International Gold Fund | | | | | | | | | | | | | | | | | |
| | 1,000.00 | | 693.30 | | 1.27 | | 5.42 | | 1,000.00 | | 1,018.82 | | 1.27 | | 6.46 | |
| | | | | | | | | | | | | | | | | | | | | | | |
Expenses paid during the period are equal to the annualized net expense ratio, multiplied by the average account value over the period, then multiplied by 184/365 (to reflect the most recent 6-month period).
Quarterly Portfolio Holdings. The Funds file a complete schedule of portfolio holdings with the SEC for the first and third quarters of each fiscal year on Form N-Q. The Funds’ Forms N-Q are available on the SEC’s website at www.sec.gov. The Forms N-Q may be reviewed and copied at the SEC’s Public Reference Room in Washington, DC, and information on the operation of the Public Reference Room may be obtained by calling 800-SEC-0330. It is also available upon request from the registrant by calling the Funds toll-free at 1-866-255-1935.
Proxy Voting Policies and Procedures and Proxy Voting Record. A description of the Policy of the Funds’ Adviser (and sub-advisers) used to vote proxies relating to the portfolio securities and information on how the Funds voted proxies relating to portfolio securities during the 12-month period ended June 30, 2014, are available (1) without charge, upon request by calling 1-800-873-5654 (Annuity Service Center), 1-800-599-5651 (NY Annuity Service Center) or 1-800-777-7779 (for contracts purchased through a bank or financial institution) or 1-888-464-7779 (for NY contracts purchased through a bank or financial institution), (2) by writing Curian Variable Series Trust, P.O. Box 30314, Lansing, Michigan 48909-7814 (3) on Jackson National Life Insurance Company’s or Jackson National Life Insurance Company of New York’s website at www.jackson.com, and (4) on the SEC’s website at www.sec.gov.
TRUSTEES AND OFFICERS OF CURIAN VARIABLE SERIES TRUST (“TRUST”)
NAME, ADDRESS AND (AGE) | | POSITION(S) HELD
WITH TRUST
(LENGTH OF TIME SERVED) | | NUMBER OF PORTFOLIOS IN FUND COMPLEX TO
BE OVERSEEN BY TRUSTEE |
| | | | |
Independent Trustees | | | | |
| | | | |
David W. Agostine (53) 7601 Technology Way Denver, CO 80237 | | Chairman of the Board and Trustee(1) (10/2011 to present) | | 58 |
| | | | |
PRINCIPAL OCCUPATION(S) DURING PAST 5 YEARS: President, Cachematrix Holdings, LLC (software company) (12/2013 to present); Principal, Market Metrics, LLC (market research firm) (1/2011 to 12/2013); Principal Executive Officer, Dividend Capital Group, LLC (investment manager) (1/2008 to 12/2010) |
| | | | |
OTHER DIRECTORSHIPS HELD BY TRUSTEE DURING PAST 5 YEARS: Trustee, Curian Series Trust (11/2010 to present); Trustee, Dividend Capital Investments, Inc. (9/2007 to 12/2011) |
| | | | |
Gregory P. Contillo (59) 7601 Technology Way Denver, CO 80237 | | Trustee(1) (10/2011 to present) | | 58 |
| | | | |
PRINCIPAL OCCUPATION(S) DURING PAST 5 YEARS: President, Crystal River Partners, LLC (financial services company) (2005 to present) |
|
OTHER DIRECTORSHIPS HELD BY TRUSTEE DURING PAST 5 YEARS: Trustee, Curian Series Trust (9/2011 to present) |
| | | | |
Dylan E. Taylor (44) 7601 Technology Way Denver, CO 80237 | | Trustee(1) (10/2011 to present) | | 58 |
| | | | |
PRINCIPAL OCCUPATION(S) DURING PAST 5 YEARS: Global Chief Operating Officer, Colliers International (commercial real estate advisory firm) (7/2014 to present); Chief Executive Officer, Americas, Colliers International (6/2009 to present) |
|
OTHER DIRECTORSHIPS HELD BY TRUSTEE DURING PAST 5 YEARS: Trustee, Curian Series Trust (11/2010 to present) |
| | | | |
Mark S. Wehrle (57) 7601 Technology Way Denver, CO 80237 | | Trustee(1) (7/2013 to present) | | 58 |
| | | | |
PRINCIPAL OCCUPATION(S) DURING PAST 5 YEARS: Broker, RE/MAX Professionals (4/2011 to present); Adjunct Professor of Accounting, University of Denver School of Accountancy (1/2011 to 6/2014); Partner, Deloitte & Touche LLP (9/1987 to 1/2011) |
|
OTHER DIRECTORSHIPS HELD BY TRUSTEE DURING PAST 5 YEARS: Trustee, Curian Series Trust (7/2013 to present) |
| | | | |
Scot T. Wetzel (46) 7601 Technology Way Denver, CO 80237 | | Trustee(1) (10/2011 to present) | | 58 |
| | | | |
PRINCIPAL OCCUPATION(S) DURING PAST 5 YEARS: Founder, Managing Director & Chief Executive Officer, Crestmoor Advisors, LLC (advisor in the financial services industry) (2010 to present); Chief Executive Officer, United Western Bancorp, Inc. (financial services company) (2005 to 2010) |
|
OTHER DIRECTORSHIPS HELD BY TRUSTEE DURING PAST 5 YEARS: Trustee, Curian Series Trust (11/2010 to present); Inside Director of United Western Bancorp, Inc. (12/2005 to 4/2010) |
(1) The Chairman of the Board, interested and independent Trustees are elected to serve for an indefinite term.
NAME, ADDRESS AND (AGE) | | POSITION(S) HELD
WITH TRUST
(LENGTH OF TIME SERVED) |
| | |
Officers | | |
| | |
Emily Bennett (31) 1 Corporate Way Lansing, MI 48951 | | Assistant Secretary (5/2012 to present) |
| | |
PRINCIPAL OCCUPATION(S) DURING PAST 5 YEARS: Senior Attorney of Jackson National Asset Management, LLC (“JNAM”) (10/2013 to present); Assistant Secretary of funds sponsored by Curian Capital, LLC that are in the same group of other investment companies advised by JNAM (5/2012 to present); Attorney of JNAM (11/2011 to 10/2013); Departmental Specialist, Michigan Public Health Institute (7/2010 to 11/2011); Legal Assistant, Guyselman & Ehnis-Clark (4/2009 to 7/2010) |
| | |
Danielle A. Bergandine (34) 1 Corporate Way Lansing, MI 48951 | | Anti-Money Laundering Officer (10/2011 to present) |
| | |
PRINCIPAL OCCUPATION(S) DURING PAST 5 YEARS: Senior Compliance Analyst of JNAM (7/2009 to present); Compliance Analyst of JNAM (8/2006 to 6/2009) |
| | |
Karen J. Buiter (49) 1 Corporate Way Lansing, MI 48951 | | Assistant Treasurer (10/2011 to present) |
| | |
PRINCIPAL OCCUPATION(S) DURING PAST 5 YEARS: Vice President – Financial Reporting of JNAM (7/2011 to present); Assistant Vice President – Financial Reporting of JNAM (4/2008 to 7/2011); Assistant Treasurer of other investment companies advised by JNAM (12/2008 to present); Assistant Treasurer of funds sponsored by Curian Capital, LLC that are in the same group of other investment companies advised by JNAM (11/2010 to present) |
| | |
Angela Burke (32) 1 Corporate Way Lansing, MI 48951 | | Assistant Secretary (6/2013 to present) |
| | |
PRINCIPAL OCCUPATION(S) DURING PAST 5 YEARS: Attorney of JNAM (4/2013 to present); Assistant Secretary of funds sponsored by Curian Capital, LLC that are in the same group of other investment companies advised by JNAM (6/2013 to present); Senior Analyst - Tax of JNAM (1/2011 to 4/2013); Senior Consultant of Deloitte Tax LLP (1/2008 to 1/2011) |
| | |
Kelly L. Crosser (42) 1 Corporate Way Lansing, MI 48951 | | Assistant Secretary (10/2011 to present) |
| | |
PRINCIPAL OCCUPATION(S) DURING PAST 5 YEARS: Manager of Legal Regulatory Filings and Print of Jackson National Life Insurance Company (“Jackson”) (12/2013 to present); Senior Compliance Analyst of Jackson National Life Insurance Company (4/2007 to 12/2013); Assistant Secretary of other Investment Companies advised by JNAM (9/2007 to present); Assistant Secretary of funds sponsored by Curian Capital, LLC that are in the same group of other investment companies advised by JNAM (11/2010 to present) |
| | |
Diana R. Gonzalez (36) 1 Corporate Way Lansing, MI 48951 | | Assistant Vice President (9/2012 to present) |
| | |
PRINCIPAL OCCUPATION(S) DURING PAST 5 YEARS: Associate General Counsel of JNAM (10/2013 to present); Senior Attorney of JNAM (5/2012 to 10/2013); Assistant Vice President of funds sponsored by Curian Capital, LLC that are in the same group of other investment companies advised by JNAM (9/2012 to present); Counsel of Sun Life Financial, Inc. (4/2008 to 5/2012) |
NAME, ADDRESS AND (AGE) | | POSITION(S) HELD
WITH TRUST
(LENGTH OF TIME SERVED) |
| | |
Officers | | |
| | |
William P. Harding (40) 1 Corporate Way Lansing, MI 48951 | | Vice President (5/2014 to present) |
| | |
PRINCIPAL OCCUPATION(S) DURING PAST 5 YEARS: Senior Vice President and Chief Investment Officer of JNAM (7/2014 to present); Vice President of Curian Capital, LLC (2/2013 to present);Vice President of JNAM (10/2012 to 6/2014); Vice President of funds sponsored by Curian Capital, LLC that are in the same group of other investment companies advised by JNAM (5/2014 to present); Vice President of other Investment Companies advised by JNAM (11/2012 to present); Head of Manager Research, Morningstar Associates (8/2011 to 10/2012); Director of Research, Morningstar Investment Services (1/2007 to 8/2011) |
| | |
Daniel W. Koors (44) 1 Corporate Way Lansing, MI 48951 | | Treasurer and Chief Financial Officer (10/2011 to present) |
| | |
PRINCIPAL OCCUPATION(S) DURING PAST 5 YEARS: Senior Vice President of JNAM (1/2009 to present) and Chief Operating Officer of JNAM (4/2011 to present); Chief Financial Officer of JNAM (1/2007 to 4/2011); Vice President of other investment companies advised by JNAM (12/2006 to present), Treasurer and Chief Financial Officer of other investment companies advised by JNAM (12/2006 to 11/2011); Treasurer and Chief Financial Officer (Principal Financial Officer) of funds sponsored by Curian Capital, LLC that are in the same group of other investment companies advised by JNAM (11/2010 to present); Assistant Vice President – Fund Administration of Jackson National Life Insurance Company (8/2006 to 1/2009) |
| | |
Mark D. Nerud (48) 1 Corporate Way Lansing, MI 48951 | | President and Chief Executive Officer (8/2014 to present) |
| | |
PRINCIPAL OCCUPATION(S) DURING PAST 5 YEARS: Chief Executive Officer of JNAM (1/2010 to present); President of JNAM (1/2007 to present); President and Chief Executive Officer of other funds sponsored by Curian Capital, LLC that are in the same group of other investment companies advised by JNAM (8/2014 to present); Managing Board Member of Curian Capital, LLC (1/2011 to present) and Curian Clearing LLC (1/2011 to present); Managing Board Member of JNAM (1/2007 to 12/2010); President and Chief Executive Officer of other Investment Companies advised by JNAM (12/2006 to present); Vice President – Fund Accounting & Administration of Jackson National Life Insurance Company (1/2000 to 12/2009) |
| | |
Joseph O’Boyle (52) 1 Corporate Way Lansing, MI 48951 | | Chief Compliance Officer (5/2012 to present) |
| | |
PRINCIPAL OCCUPATION(S) DURING PAST 5 YEARS: Chief Compliance Officer – Curian Funds (5/2012 to present); Chief Compliance Officer, Guggenheim Funds (2011 – 2012); Chief Compliance Officer, Calamos Investments (2008 – 2011) |
| | |
Gerard A. M. Oprins (55) 1 Corporate Way Lansing, MI 48951 | | Vice President (3/2012 to present) |
| | |
PRINCIPAL OCCUPATION(S) DURING PAST 5 YEARS: Senior Vice President and Chief Financial Officer of JNAM (4/2011 to present); Vice President, Treasurer and Chief Financial Officer of other investment companies advised by JNAM (11/2011 to present); Vice President of funds sponsored by Curian Capital, LLC that are in the same group of other investment companies advised by JNAM (3/2012 to present); Business Consultant (5/2009 to 3/2011) |
NAME, ADDRESS AND (AGE) | | POSITION(S) HELD
WITH TRUST
(LENGTH OF TIME SERVED) |
| | |
Officers | | |
| | |
Michael Piszczek (57) 1 Corporate Way Lansing, MI 48951 | | Vice President (10/2011 to present) |
| | |
PRINCIPAL OCCUPATION(S) DURING PAST 5 YEARS: Vice President – Tax of JNAM (7/2011 to present); Assistant Vice President – Tax of JNAM (11/2007 to 6/2011); Vice President of other investment companies advised by JNAM (11/2007 to present); Vice President of funds sponsored by Curian Capital, LLC that are in the same group of other investment companies advised by JNAM (11/2010 to present) |
| | |
Susan S. Rhee (43) 1 Corporate Way Lansing, MI 48951 | | Vice President, Chief Legal Officer & Secretary (10/2011 to present) |
| | |
PRINCIPAL OCCUPATION(S) DURING PAST 5 YEARS: Senior Vice President and General Counsel of JNAM (1/2010 to present); Chief Legal Officer of JNAM (7/2004 to present) and Secretary of JNAM (11/2000 to present); Vice President, Counsel, and Secretary of other investment companies advised by JNAM (2/2004 to present); Vice President, Chief Legal Officer & Secretary of other funds sponsored by Curian Capital, LLC that are in the same group of other investment companies advised by JNAM (11/2010 to present); Assistant Vice President of Jackson National Life Insurance Company (8/2003 to 12/2009) |
The Statement of Additional Information includes additional information about Fund Trustees and may be obtained at no charge by calling 1-800-873-5654 (Annuity and Life Service Center), 1-800-599-5651 (NY Annuity and Life Service Center), 1-800-777-7779 (for contracts purchased through a bank or financial institution) or 1-888-464-7779 (for NY contracts purchased through a bank or financial institution), by writing Curian Variable Series Trust, P.O. Box 30314, Lansing, Michigan 48909-7814 or by visiting www.jackson.com.
The Independent Trustees received the following compensation for their services during the fiscal year ended December 31, 2014:
TRUSTEE | | AGGREGATE COMPENSATION
FROM THE TRUST(1) | | PENSION OR RETIREMENT
BENEFITS ACCRUED AS PART OF
TRUST EXPENSES | | ESTIMATED ANNUAL BENEFITS
UPON RETIREMENT | | TOTAL COMPENSATION FROM THE
TRUST AND FUND COMPLEX(1) | |
David W. Agostine | | $ | 160,735 | | $ | 0 | | $ | 0 | | $ | 202,000 | |
Gregory P. Contillo | | $ | 144,835 | | $ | 0 | | $ | 0 | | $ | 182,000 | |
Dylan E. Taylor | | $ | 131,873 | | $ | 0 | | $ | 0 | | $ | 165,750 | |
Mark S. Wehrle | | $ | 147,220 | | $ | 0 | | $ | 0 | | $ | 185,000 | (2) |
Scot T. Wetzel | | $ | 136,885 | | $ | 0 | | $ | 0 | | $ | 172,000 | (3) |
(1) The fees paid to the Independent Trustees are paid for combined service on the Boards of the Trust and Curian Series Trust (the “Fund Complex”). The fees are allocated to the Funds and affiliated investment companies on a pro-rata basis based on net assets. The total fees paid to all the Independent Trustees from the Trust and Fund Complex are $906,750.
(2) Amount includes $37,000 deferred by Mr. Wehrle.
(3) Amount includes $2,000 deferred by Mr. Wetzel.
Neither the Trust nor any of the other investment company in the Fund Complex has adopted any plan providing pension or retirement benefits for Trustees.
CURIAN VARIABLE SERIES TRUST (“TRUST”)
APPROVAL OF INVESTMENT ADVISORY AND SUB-ADVISORY AGREEMENTS
DECEMBER 2014
The Board of Trustees of the Trust (“Board”) oversees the management of each series of the Trust (each, a “Fund” and collectively, the “Funds”) and, as required by law, determines whether to approve and, after the initial term, continue the Funds’ advisory agreement (“Advisory Agreement”) with Curian Capital, LLC (“Curian” or “Adviser”) and sub-advisory agreements (“Sub-Advisory Agreements” and, together with the Advisory Agreement, the “Continuing Agreements”) with the Funds’ respective investment sub-advisers (the “Sub-Advisers”).
At a telephonic meeting held on December 1, 2014 and an in-person meeting held on December 10, 2014, the Board, which was comprised solely of trustees who are not considered interested persons of the Funds (as defined in the Investment Company Act of 1940, as amended) (the “Independent Trustees”), considered information relating to the Continuing Agreements. The Board also considered information relating to BlackRock (Singapore) Limited, a proposed new Co-Sub-Adviser for the Curian/BlackRock Global Long Short Credit Fund (“BlackRock Singapore”), in connection with a new sub-advisory agreement for that Fund (the “New Sub-Advisory Agreement” and, together with the Continuing Agreements, the “Agreements”).
In advance of the meeting, independent legal counsel for the Independent Trustees requested that certain information be provided to the Board relating to the Agreements. The Board received, and had the opportunity to review, this and other materials, ask questions and request further information in connection with its consideration. At the conclusion of the Board’s discussions, the Board approved the Agreements.
In reviewing the Agreements and considering the information, the Board was advised by outside independent legal counsel. The Board considered the factors it deemed relevant, including: (1) the nature, quality and extent of the services provided and to be provided, (2) the investment performance of each Fund, (3) cost of services for each Fund, (4) profitability data, (5) whether economies of scale may be realized and shared, in some measure, with investors as each Fund grows, and (6) other benefits that may accrue to the Adviser or each Sub-Adviser through its relationship with the Trust. In approving the New Sub-Advisory Agreement, the Board did not consider the profits of BlackRock Singapore as it had not yet begun servicing the Curian/BlackRock Global Long Short Credit Fund. In its deliberations, the Board, in exercising its business judgment, did not identify any single factor that alone was responsible for its decision to approve the Agreements.
Before approving the Agreements, the Independent Trustees met in executive session with their independent legal counsel to consider the materials provided by Curian and the Sub-Advisers and the terms of the Agreements. Based on its evaluation of those materials and the information the Board received throughout the year at its regular meetings, the Board concluded that the Agreements are in the best interests of the shareholders of each applicable Fund. In reaching its conclusions, the Board considered numerous factors, including the following:
Nature, Quality and Extent of Services
The Board examined the nature, quality and extent of the services provided by Curian and the Sub-Advisers. The Board also examined the nature, quality and extent of the services proposed to be provided by BlackRock Singapore under the New Sub-Advisory Agreement.
For each Fund, the Board considered the services provided by Curian, including but not limited to, its oversight of the Sub-Advisers pursuant to the Advisory Agreement, its recommendations on an ongoing basis as to the hiring or removal of Sub-Advisers pursuant to the Trust’s “Manager of Managers” exemptive order, as well as its provision of recordkeeping and compliance services to the Funds. The Board also took into account that Curian monitors the performance of the various organizations that provide services to the Funds, including the Funds’ distributor, transfer agent and custodian. With respect to Curian’s oversight of the Sub-Advisers, the Board noted that Curian is responsible for screening and recommending new sub-advisers when appropriate, as well as monitoring and reporting to the Board on a regular basis as to the performance and operations of the existing Sub-Advisers. The Board also considered the investment sub-advisory services provided by each Sub-Adviser. The Board noted Curian’s evaluation of the Sub-Advisers, as well as Curian’s recommendations based on its review of the Sub-Advisers, to approve the Sub-Advisory Agreements.
The Board reviewed the qualifications, backgrounds and responsibilities of Curian’s senior management that are responsible for oversight of the Funds and each Sub-Adviser, and also reviewed the qualifications and backgrounds of Curian’s and the Sub-Advisers’ portfolio managers who are responsible for the day-to-day management of each Fund. The Board reviewed information pertaining to Curian’s and each Sub-Adviser’s organizational structure, senior management, financial condition, investment operations and other relevant information. The Board considered compliance reports about Curian and each Sub-Adviser from the Trust’s Chief Compliance Officer.
Based on the foregoing, the Board concluded that (i) each Fund is likely to continue to benefit from the nature, extent and quality of the services to be provided by Curian under the Advisory Agreement, and where applicable, that (ii) each Fund is likely to continue to benefit from the nature, extent and quality of the services to be provided by its Sub-Adviser under the respective Sub-Advisory Agreement. With regard to the New Sub-Advisory Agreement, the Board made these same conclusions regarding the nature, extent and quality of the services proposed to be provided by BlackRock Singapore under the New Sub-Advisory Agreement.
Investment Performance of the Funds
The Board considered the investment performance of each Fund. The Board noted that Curian reviews with the Board on a quarterly basis detailed information about each Fund’s performance results and investment strategies. The Board also considered the performance of each Fund, including how the Fund performed versus the average performance of a group of comparable funds (“peer group”) and how the Fund performed versus its primary
benchmark (“benchmark”) index. For certain Funds, the Board also considered the Funds’ average performance returns to other funds in a custom peer group (“custom peer group”), the constituents of which were selected by the Adviser. This consideration was based on the Adviser’s view that the custom peer group is, in some circumstances, a more meaningful source of comparative information than a broad-based benchmark or peer group for Funds that use a limited or unique investment focus or where the peer group may not be a good source of comparative information. The performance data was provided by an independent data service. The performance reviewed by the Board was for the periods ended June 30, 2014, unless otherwise noted. In considering the Funds’ performance, the Board noted that the Funds had been operating for a relatively short period of time. The Board also noted that none of the Funds has a three-year track record, which the Adviser represented is more indicative of an investment cycle than a shorter since-inception period or a one-year period.
Curian Guidance - Interest Rate Opportunities Fund. The Board considered that the Fund outperformed its benchmark for the one-year and since-inception periods, though it underperformed its peer group average during these periods. The Board also considered that the Fund commenced its operations in April 2013.
Curian Guidance - Multi-Strategy Income Fund. The Board considered that the Fund outperformed its benchmark for the one-year and since-inception periods, though it underperformed its peer group average during these periods. The Board also considered that the Adviser is considering strategic alternatives for the Fund. The Board considered that the Fund commenced its operations in April 2013.
Curian Guidance - Equity Income Fund. The Board considered that the Fund outperformed its benchmark and peer group average for the year-to-date period, though it underperformed its benchmark and peer group average for the one-year and since-inception periods. The Board considered that the Fund does not yet have a three-year track record.
Curian Guidance - Conservative Fund. The Board considered that the Fund outperformed its benchmark for the one-year and since-inception periods, though it underperformed its peer group average for these time periods. The Board also considered that the Fund does not yet have a three-year track record.
Curian Guidance - Moderate Fund. The Board considered that the Fund outperformed its peer group average for the since-inception period, though it underperformed its peer group average for the one-year period and its benchmark for both the one-year and since-inception periods. The Board considered that the Fund does not yet have a three-year track record.
Curian Guidance - Growth Fund. The Board considered that the Fund outperformed its peer group average for the one-year and since-inception periods, though the Fund underperformed its benchmark for the one-year and since-inception periods. The Board noted that the Fund commenced its operations in April 2013.
Curian Guidance - Moderate Growth Fund. The Board considered that the Fund outperformed its peer group average for the one-year and since-inception periods, though it underperformed its benchmark during the same time periods. The Board also considered that the Fund does not yet have a three-year track record.
Curian Guidance - Maximum Growth Fund. The Board noted that the Fund outperformed its benchmark and peer group average for the one-year period, though the Fund underperformed its benchmark and peer group average for the since-inception period. The Board also considered that the Fund does not yet have a three-year track record.
Curian Guidance - Tactical Moderate Growth Fund. The Board considered that the Fund outperformed its peer group average during the one-year and since-inception periods, though the Fund underperformed its benchmark for the one-year and since-inception periods. The Board also considered that the Adviser is considering strategic alternatives for the Fund.
Curian Guidance Tactical Maximum Growth Fund. The Board considered that the Fund outperformed its peer group average for the one-year and since-inception periods, though the Fund underperformed its benchmark for the one-year and since-inception periods. The Board also noted that the Adviser is considering strategic alternatives for the Fund.
Curian Guidance - Institutional Alt 65 Fund. The Board considered that the Fund outperformed its benchmark and its peer group average for the one-year and since-inception periods. The Board also considered that the Adviser is considering strategic alternatives for the Fund.
Curian Guidance - Alt 100 Conservative Fund. The Board considered that the Fund outperformed its peer group average for the year-to-date period, though it underperformed its benchmark and peer group average for the one-year and since-inception periods. The Board also considered that the Fund commenced its operations in April 2013. It also noted that the Adviser is considering strategic alternatives for the Fund.
Curian Guidance - Alt 100 Moderate Fund. The Board considered that the Fund outperformed its peer group average for the one-year and since-inception periods and its benchmark for the one-year period, though it underperformed the benchmark for the since-inception period.
Curian Guidance - Alt 100 Growth Fund. The Board considered that the Fund outperformed its benchmark and peer group average for the one-year and since-inception periods. The Board also considered that the Adviser is considering strategic alternatives for the Fund.
Curian Guidance - International Conservative Fund. The Board considered that the Fund outperformed its benchmark and peer group average for the year-to-date period, though it underperformed its benchmark and peer group average for the one-year and since-inception periods. The Board also considered that the Fund commenced its operations in April 2013. It also noted that the Adviser is considering strategic alternatives for the Fund.
Curian Guidance - International Moderate Fund. The Board considered that the Fund underperformed its benchmark and peer group average for the one-year and since-inception periods. The Board also considered that the Fund commenced its operations in April 2013. It also noted that the Adviser is considering strategic alternatives for the Fund.
Curian Guidance - International Growth Fund. The Board considered that the Fund outperformed its peer group average for the one-year period, though it underperformed its benchmark for that same period. The Board considered that the Fund underperformed its benchmark and peer group average for the since-inception period. The Board also considered that the Fund commenced its operations in April 2013. It also noted that the Adviser is considering strategic alternatives for the Fund.
Curian Guidance - Equity 100 Fund. The Board considered that the Fund outperformed its benchmark and peer group average for the since-inception period. The Board also considered that the Fund slightly underperformed its benchmark and peer group average for the one-year period. The Board noted that the Fund does not yet have a three-year track record.
Curian Guidance - Fixed Income 100 Fund. The Board considered that the Fund outperformed its benchmark for the one-year period, though it underperformed the benchmark since inception. The Board also noted that the Fund underperformed its peer group average for the one-year and since-inception periods. The Board considered that the Fund does not yet have a three-year track record.
Curian Guidance - Real Assets Fund. The Board considered that the Fund outperformed its benchmark and its peer group average for the one-year and since-inception periods.
Curian Tactical Advantage 35 Fund. The Board considered that the Fund underperformed its benchmark and peer group average for the one-year and since-inception periods. The Board considered that the Fund does not yet have a three-year track record.
Curian Tactical Advantage 60 Fund. The Board considered that the Fund underperformed its benchmark and peer group average for the one-year and since-inception periods. The Board considered that the Fund does not yet have a three-year track record.
Curian Tactical Advantage 75 Fund. The Board considered that the Fund underperformed its benchmark and peer group average for the one-year and since-inception periods. The Board considered that the Fund does not yet have a three-year track record.
Curian Dynamic Risk Advantage - Diversified Fund. The Board considered that the Fund underperformed its benchmark and peer group average for the one-year and since-inception periods. The Board considered that the Fund had outperformed its peer group average for the year-to-date period following an investment strategy change effective April 28, 2014. The Board noted that the Fund does not yet have a three-year track record. It also noted that the Adviser is considering strategic alternatives for the Fund.
Curian Dynamic Risk Advantage - Growth Fund. The Board considered that the Fund underperformed its benchmark and peer group average for the one-year and since-inception periods. The Board also considered that the Fund does not yet have a three-year track record. It also noted that the Adviser is considering strategic alternatives for the Fund.
Curian Dynamic Risk Advantage - Income Fund. The Board noted that the Fund outperformed its benchmark and peer group average for the year-to-date period, though it underperformed its benchmark and peer group average for the one-year and since-inception periods. The Board considered that the Fund’s investment strategy had changed effective April 28, 2014 and that the Fund does not yet have a three-year track record. It also noted that the Adviser is considering strategic alternatives for the Fund.
Curian/Aberdeen Latin America Fund. The Board noted that the Fund underperformed its benchmark and peer group average for the one-year and since-inception periods. The Board also considered that the Fund commenced its operations in April 2013. It also considered that the Adviser is considering strategic alternatives for the Fund.
Curian/American Funds® Global Growth Fund. The Board considered that the Fund underperformed its benchmark and peer group average for the since-inception period. The Board also considered that the Fund, which was launched in September 2013, does not yet have a three-year track record.
Curian/American Funds® Growth Fund. The Board considered that the Fund outperformed its peer group average for the year-to-date period, though it underperformed its benchmark and peer group average for the one-year and since-inception periods. The Board also considered that the Fund does not yet have a three-year track record.
Curian/AQR Risk Parity Fund. The Board considered that the Fund outperformed its benchmark and peer group average for the since-inception period. The Board also noted that the Fund outperformed its benchmark and peer group average for the one-year period ended September 30, 2014.
Curian/Ashmore Emerging Market Small Cap Equity Fund. The Board noted the Adviser’s view that the custom peer group provided a more meaningful comparison of the Fund’s performance. It considered that the Fund outperformed its custom peer group average for the one-year period, though it underperformed its custom peer group average for the since-inception period. The Board also considered that the Fund outperformed its benchmark and peer group average for the one-year and since-inception periods. The Board also considered that the Adviser is considering strategic alternatives for the Fund.
Curian/Baring International Fixed Income Fund. The Board considered that the Fund outperformed its peer group average for the one-year and since-inception periods, though it underperformed its benchmark for these same periods. The Board also considered that the Fund outperformed its benchmark and peer group average for the year-to-date period. It also noted that the Adviser is considering strategic alternatives for the Fund.
Curian/BlackRock Global Long Short Credit Fund. The Board noted the Adviser’s view that the custom peer group provided a more meaningful comparison of the Fund’s performance. The Board considered that the Fund outperformed its custom peer group average for the one-year period and performed in line with its custom peer group for the since-inception period. The Board also considered that the Fund outperformed its benchmark and peer group average for the one-year and since-inception periods. The Board also took into account the addition of BlackRock Singapore as a co-sub-adviser for the Fund and the Adviser’s view that this addition would contribute to effective management of the Fund.
Curian/CenterSquare International Real Estate Securities Fund. The Board noted that the Fund underperformed its benchmark, peer group average and custom peer group average for the one-year and since-inception periods. The Board also considered that the Fund commenced its operations in April 2013. It also noted that the Adviser is considering strategic alternatives for the Fund.
Curian/DFA U.S. Micro Cap Fund. The Board noted the Adviser’s view that the custom peer group provided a more meaningful comparison of the Fund’s performance. The Board considered that the Fund outperformed its peer group average and custom peer group average for the one-year and since-inception periods, though it underperformed its benchmark for these periods. The Board also considered that the Fund does not yet have a three-year track record.
Curian/DoubleLine Total Return Fund. The Board considered that the Fund outperformed its benchmark and peer group average for the year-to-date period, though it underperformed its benchmark and peer group average for the since-inception period. The Board also considered that the Fund outperformed its benchmark for the one-year period ended September 30, 2014. The Board noted that the Fund commenced its operations in September 2013.
Curian/Eaton Vance Global Macro Absolute Return Advantage Fund. The Board considered that the Fund outperformed its benchmark for the year-to-date period, though it underperformed its benchmark, peer group average and custom peer group average for the one-year and since-inception periods. The Board also considered that the Fund commenced its operations in April 2013.
Curian/Epoch Global Shareholder Yield Fund. The Board considered that the Fund outperformed its peer group average for the one-year and since-inception periods, though it underperformed its benchmark for these time periods. The Board also considered that the Fund outperformed its benchmark and peer group average for the year-to-date period.
Curian/FAMCO Flex Core Covered Call Fund. The Board noted the Adviser’s view that the custom peer group provided a more meaningful comparison of the Fund’s performance. The Board considered that the Fund outperformed its custom peer group average for the one-year and since-inception periods, though it underperformed its benchmark and peer group average during these periods. The Board also considered that the Fund does not yet have a three-year track record.
Curian Focused International Equity Fund. The Board noted that the Fund outperformed its peer group average for the year-to-date period, though it underperformed its benchmark and peer group average for the since-inception period. The Board also considered that the Fund commenced its operations in September 2013.
Curian Focused U.S. Equity Fund. The Board noted that the Fund underperformed its benchmark and peer group average for the since-inception period. The Board also considered that the Fund commenced its operations in September 2013.
Curian/Franklin Templeton Frontier Markets Fund. The Board considered that the Fund outperformed its peer group average for the one-year and since-inception periods, though it underperformed its benchmark for those periods. The Board also considered that the Fund does not yet have a three-year track record.
Curian/Franklin Templeton Natural Resources Fund. The Board noted that the Fund outperformed its peer group average for the one-year period, though it underperformed its peer group average for the since-inception period. The Board noted that the Fund underperformed its benchmark for the one-year and since-inception periods. The Board further considered that the Fund outperformed its peer group for the year-to-date period. The Board considered that the Fund does not yet have a three-year track record.
Curian/Lazard International Strategic Equity Fund. The Board considered that the Fund outperformed its benchmark and peer group average for the one-year and since-inception periods.
Curian Long Short Credit Fund. The Board noted the Adviser’s view that the custom peer group provided a more meaningful comparison of the Fund’s performance. The Board considered that the Fund outperformed its benchmark, peer group average and custom peer group average for the one-year and since-inception periods.
Curian/Neuberger Berman Currency Fund. The Board noted that the Fund outperformed its benchmark and peer group average for the one-year and since-inception periods.
Curian/Neuberger Berman Risk Balanced Commodity Strategy Fund. The Board noted that the Fund outperformed its benchmark and peer group average for the since-inception period.
Curian/Nicholas Convertible Arbitrage Fund. The Board considered that the Fund outperformed its benchmark and peer group average for the one-year and since-inception periods.
Curian/PIMCO Credit Income Fund. The Board considered that the Fund outperformed its benchmark and peer group average for the one-year period and since-inception periods.
Curian/PineBridge Merger Arbitrage Fund. The Board considered that the Fund underperformed its benchmark, peer group average and custom peer group average for the one-year and since-inception periods. The Board noted that the Fund does not yet have a three-year track record. It also noted that the Adviser is considering strategic alternatives for the Fund.
Curian/Schroder Emerging Europe Fund. The Board noted the Adviser’s view that the custom peer group provided a more meaningful comparison of the Fund’s performance. The Board considered that the Fund outperformed the custom peer group average for the one-year period, though it underperformed the custom peer group average for the since-inception period. The Board also considered that the Fund outperformed its benchmark for the one-year and since-inception periods, though it underperformed the peer group average during those periods. The Board also considered that the Adviser is considering strategic alternatives for the Fund.
Curian/T. Rowe Price Capital Appreciation Fund. The Board considered that the Fund outperformed its peer group average for the since-inception period, though it underperformed its benchmark for that period. The Board noted that the Fund outperformed its peer group average for the year-to-date period, though it underperformed its benchmark for that period. The Board also considered that the Fund commenced its operations in September 2013.
Curian/The Boston Company Equity Income Fund. The Board noted that the Fund outperformed its benchmark and peer group average for the one-year and since-inception periods.
Curian/UBS Global Long Short Fixed Income Opportunities Fund. The Board considered that the Fund underperformed its benchmark, peer group average and custom peer group average for the one-year and since-inception periods. The Board also considered that the Fund commenced its operations in September 2013. It noted that the Adviser is considering strategic alternatives for the Fund.
Curian/Van Eck International Gold Fund. The Board noted that the Fund outperformed its benchmark and peer group average for the one-year and since-inception periods.
Costs of Services
The Board reviewed the fees paid to Curian and each Fund’s Sub-Adviser(s). For each Fund, the Board reviewed fee and expense information as compared to that of comparable funds managed by other advisers, as well as fees charged by each Sub-Adviser to similar clients, if any. The Board also noted that Curian does not manage any institutional accounts with which Funds’ fees could be compared. Using information provided by an independent data service, the Board evaluated each Fund’s advisory fees compared to the average advisory fees for other funds similar in size, character and investment strategy (the “peer group”). While the Board also considered each Fund’s sub-advisory fee and compared that to the average sub-advisory fee of the peer group, the Board noted that each Fund’s sub-advisory fee would be paid by Curian (not the Fund) and, therefore, would be neither a direct shareholder expense nor a direct influence on a Fund’s total expense ratio. For certain Funds, the Board also considered a supplemental peer group provided by an independent data service (the “supplemental peer group”), as indicated below. This consideration was based on Curian’s view and information provided to the Board suggesting that the supplemental peer group, where presented, provides a more meaningful source of comparative information than the primary peer group.
Further detail considered by the Board regarding the advisory and sub-advisory fees of each Fund is set forth below:
Curian Guidance - Interest Rate Opportunities Fund and Curian Guidance - Tactical Moderate Growth Fund. The Board noted Curian’s view that a supplemental peer group also provided a meaningful comparison of Fund expenses. The Board considered that each Fund’s advisory fee and total expense ratio (excluding underlying fund expenses) are lower than the respective supplemental peer group averages, though each Fund’s advisory fee and total expense ratio (excluding underlying fund expenses) are higher than the respective peer group averages. The Board considered the reduction in the Funds’ advisory and administrative fees effective January 1, 2014, which reduced each Fund’s total expense structure by fifteen basis points. In light of all the information provided, the Board concluded that the fees are appropriate in light of the services provided.
Curian Guidance - Multi-Strategy Income Fund, Curian Guidance - Moderate Fund and Curian Guidance - Fixed Income 100 Fund. The Board noted Curian’s view that a supplemental peer group also provided a meaningful comparison of Fund expenses. The Board noted that each Fund’s advisory fee and total expense ratio (excluding underlying fund expenses) are higher than the respective peer group averages and that each Fund’s advisory fee and total expense ratio (excluding underlying fund expenses) are also higher than its respective supplemental peer group average. The Board considered the reduction in the Fund’s advisory and administrative fees effective January 1, 2014, which reduced each Fund’s total expense structure by fifteen basis points. The Board concluded that the fees are appropriate in light of the services provided.
Curian Guidance - Equity Income Fund and Curian Guidance - Moderate Growth Fund. The Board noted Curian’s view that a supplemental peer group also provided a meaningful comparison of Fund expenses. The Board noted that each Fund’s advisory fee and total expense ratio (excluding underlying fund expenses) are lower than its respective supplemental peer group averages. The Board also noted that each Fund’s advisory fee and total expense ratio (excluding underlying fund expenses) are higher than its respective peer group averages. The Board considered the reduction in the Fund’s advisory and administrative fees effective January 1, 2014, which reduced each Fund’s total expense structure by fifteen basis points. The Board concluded that the fees are appropriate in light of the services provided.
Curian Guidance - Conservative Fund. The Board noted Curian’s view that a supplemental peer group also provided a meaningful comparison of Fund expenses. The Board noted that the Fund’s total expense ratio (excluding underlying fund expenses) is lower than its supplemental peer group average, and the Fund’s advisory fee matches that of its supplemental peer group average. The Board also noted that the Fund’s advisory fee and total expense ratio (excluding underlying fund expenses) are higher than the Fund’s peer group averages. The Board considered the reduction in the Fund’s advisory and administrative fees effective January 1, 2014, which reduced the Fund’s total expense structure by fifteen basis points. The Board concluded that the fees are appropriate in light of the services provided.
Curian Guidance - Growth Fund. The Board noted Curian’s view that a supplemental peer group also provided a meaningful comparison of Fund expenses. The Board noted that the Fund’s advisory fee and total expense ratio (excluding underlying fund expenses) are lower than the supplemental peer group averages, though the Fund’s advisory fee is equal to its peer group average and its total expense ratio (excluding underlying fund expenses) is higher than its peer group average. The Board considered the reduction in the Funds’ advisory and administrative fees effective January 1, 2014, which reduced the Fund’s total expense structure by fifteen basis points. The Board concluded that the fees are appropriate in light of the services provided.
Curian Guidance - Maximum Growth Fund. The Board noted Curian’s view that a supplemental peer group also provided a meaningful comparison of Fund expenses. The Board noted that the Fund’s total expense ratio (excluding underlying fund expenses) is lower than its supplemental peer group average, though the Fund’s advisory fee is higher than the Fund’s supplemental peer group average. The Board also noted that the Fund’s advisory fee and total expense ratio (excluding underlying fund expenses) are higher than the Fund’s peer group averages. The Board considered the reduction in the Fund’s advisory and administrative fees effective January 1, 2014, which reduced the Fund’s total expense structure by fifteen basis points. The Board concluded that the fees are appropriate in light of the services provided.
Curian Guidance - Tactical Maximum Growth Fund. The Board noted Curian’s view that a supplemental peer group also provided a meaningful comparison of Fund expenses. The Board noted that the Fund’s advisory fee and total expense ratio (excluding underlying fund expenses) are lower than its supplemental peer group averages. The Board also noted that the Fund’s advisory fee and total expense ratio (excluding underlying fund expenses) are higher than its peer group averages. The Board considered the reduction in the Fund’s advisory and administrative fees effective January 1, 2014, which reduced the Fund’s total expense structure by fifteen basis points. The Board concluded that the fees are appropriate in light of the services provided.
Curian Guidance - Institutional Alt 65 Fund, Curian Guidance - Alt 100 Conservative Fund, Curian Guidance - Alt 100 Moderate Fund and Curian Guidance - Alt 100 Growth Fund. The Board noted that each Fund’s total expense ratio (excluding underlying fund expenses) is lower than its respective peer group average, though its advisory fee is higher than its respective peer group average. The Board considered the reduction in the Fund’s advisory and administrative fees effective January 1, 2014, which reduced each Fund’s total expense structure by fifteen basis points. The Board concluded that the fees are appropriate in light of the services provided.
Curian Guidance - International Conservative Fund. The Board noted that the Fund’s advisory fee and total expense ratio (excluding underlying fund expenses) are lower than the Fund’s peer group averages. The Board considered the reduction in the Fund’s advisory and administrative fees effective January 1, 2014, which reduced the Fund’s total expense structure by fifteen basis points. The Board concluded that the fees are appropriate in light of the services provided.
Curian Guidance - International Moderate Fund and Curian Guidance - Real Assets Fund. The Board noted that each Fund’s total expense ratio (excluding underlying fund expenses) is lower than its respective peer group average, though each Fund’s advisory fee is higher than its respective peer group average. The Board considered the reduction in each Fund’s advisory and administrative fees effective January 1, 2014, which reduced each Fund’s total expense structure by fifteen basis points. The Board concluded that the fees are appropriate in light of the services provided.
Curian Guidance - International Growth Fund and Curian Guidance - Equity 100 Fund. The Board noted that each Fund’s advisory fee and total expense ratio (excluding underlying fund expenses) are higher than its respective peer group averages. The Board considered the reduction in the Funds’ advisory and administrative fees effective January 1, 2014, which reduced each Fund’s total expense structure by fifteen basis points. The Board concluded that the fees are appropriate in light of the services provided.
Curian Tactical Advantage 35 Fund. The Board noted that the Fund’s advisory fee, sub-advisory fee and total expense ratio (excluding underlying fund expenses) are each lower than its peer group averages. The Board concluded that the fees are appropriate in light of the services provided.
Curian Tactical Advantage 60 Fund. The Board noted that the Fund’s sub-advisory fee is lower than its peer group average, though its advisory fee and total expense ratio (excluding underlying fund expenses) are higher than its peer group averages. The Board also considered that the Fund’s total expense ratio was only one basis point higher than its peer group average. The Board concluded that the fees are appropriate in light of the services provided.
Curian Tactical Advantage 75 Fund. The Board noted that the Fund’s advisory fee, sub-advisory fee and total expense ratio (excluding underlying fund expenses) are lower than the peer group averages. The Board concluded that the fees are appropriate in light of the services provided.
Curian Dynamic Risk Advantage - Diversified Fund. The Board noted Curian’s view that a supplemental peer group also provided a meaningful comparison of Fund expenses. The Board considered that the Fund’s advisory and sub-advisory fees are each in line with the supplemental peer group averages and that the Fund’s total expense ratio is lower than the supplemental peer group average. The Board noted that the Fund’s sub-advisory fee is lower than its peer group average, though its advisory fee and total expense ratio are higher than the Fund’s peer group averages. The Board concluded that the fees are appropriate in light of the services provided.
Curian Dynamic Risk Advantage - Growth Fund. The Board noted Curian’s view that a supplemental peer group also provided a meaningful comparison of Fund expenses. The Board noted that the Fund’s sub-advisory fee is equal to its supplemental peer group average and that its total expense ratio is lower than the supplemental peer group average, though the Fund’s advisory fee is higher than the Fund’s supplemental peer group average. The Board considered that the Fund’s advisory fee, sub-advisory fee and total expense ratio are higher than its peer group averages. The Board concluded that the fees are appropriate in light of the services provided.
Curian Dynamic Risk Advantage - Income Fund. The Board noted that the Fund’s advisory fee, sub-advisory fee, and total expense ratio (excluding underlying fund expenses) are lower than its peer group averages. The Board concluded that the fees are appropriate in light of the services provided.
Curian/Aberdeen Latin America Fund. The Board considered that the Fund’s advisory fee, sub-advisory fee and total expense ratio are higher than the respective peer group averages. The Board took into account the voluntary waiver to be implemented by the Adviser, which will serve to reduce the advisory fee rate. The Board concluded that the fees are appropriate in light of the services provided.
Curian/American Funds® Global Growth Fund. The Board noted Curian’s view that a supplemental peer group also provided a meaningful comparison of Fund expenses. The Board noted that the Fund’s total expense ratio (including underlying fund expenses) is lower than the Fund’s peer group average and supplemental peer group average, though the Fund’s advisory fee is higher than its peer group average and supplemental peer group average. The Board also noted that Curian had reduced the Fund’s administrative fee in 2014. The Board concluded that the fees are appropriate in light of the services provided.
Curian/American Funds® Growth Fund. The Board noted Curian’s view that a supplemental peer group also provided a meaningful comparison of Fund expenses. The Board considered that the Fund’s total expense ratio (including underlying fund expenses) is lower than its supplemental peer group average, though its advisory fee is higher than its supplemental peer group average. The Board also noted that the Fund’s advisory fee and total expense ratio (including underlying fund expenses) are higher than its peer group averages. The Board also considered that Curian had reduced the Fund’s administrative fee in 2014. The Board concluded that the fees are appropriate in light of the services provided.
Curian/AQR Risk Parity Fund. The Board noted that the Fund’s advisory fee, sub-advisory fee and total expense ratio are lower than the Fund’s peer group averages. The Board concluded that the fees are appropriate in light of the services provided.
Curian/Ashmore Emerging Market Small Cap Equity Fund. The Board noted that the Fund’s sub-advisory fee is lower than its peer group average, though its advisory fee and total expense ratio are higher than the peer group averages. Regarding the total expense ratio, the Board considered the Adviser’s assertion that many of the funds in the Fund’s peer group do not pay Rule 12b-1 fees and may have material transfer agent fees and that the Fund’s total expense ratio is more in line with the peer group when the impact of Rule 12b-1 fees and transfer agent fees is removed. The Board concluded that the fees are appropriate in light of the services provided.
Curian/Baring International Fixed Income Fund. The Board noted that the Fund’s advisory and sub-advisory fees are lower than the Fund’s peer group averages, though its total expense ratio is higher than the peer group average. The Board concluded that the fees are appropriate in light of the services provided.
Curian/BlackRock Global Long Short Credit Fund. The Board noted that the Fund’s advisory fee, sub-advisory fee and total expense ratio are lower than the Fund’s peer group averages. The Board concluded that the fees are appropriate in light of the services provided. The Board also considered that the sub-advisory fee to be paid under the New Sub-Advisory Agreement would not result in an increase in the Fund’s overall sub-advisory fee. The Board concluded that the proposed fee under the New Sub-Advisory Agreement is appropriate in light of the services to be provided.
Curian/CenterSquare International Real Estate Securities Fund. The Board noted that the Fund’s advisory fee is only two basis points higher than its peer group average and its total expense ratio is five basis points higher than its peer group average. The Board also considered that the Fund’s sub-advisory fee is higher than its peer group average. The Board concluded that the fees are appropriate in light of the services provided.
Curian/DFA U.S. Micro Cap Fund. The Board noted that the Fund’s advisory fee, sub-advisory fee and total expense ratio are lower than their respective peer group averages. The Board concluded that the fees are appropriate in light of the services provided.
Curian/DoubleLine Total Return Fund. The Board noted that the Fund’s advisory fee is lower than the peer group average, though its sub-advisory fee and total expense ratio are higher than the peer group average. The Board concluded that the fees are appropriate in light of the services provided.
Curian/Eaton Vance Global Macro Absolute Return Advantage Fund, Curian/Franklin Templeton Frontier Markets Fund and Curian/Van Eck International Gold Fund. The Board noted that each Fund’s advisory fee, sub-advisory fee and total expense ratio are higher than their respective peer group averages. Regarding the total expense ratios, the Board considered the Adviser’s assertion that many of the funds in the Funds’ peer groups do not pay Rule 12b-1 fees and may have material transfer agent fees and that the Funds’ total expense ratios are more in line with their peer groups when the impact of Rule 12b-1 fees and transfer agent fees is removed. The Board concluded that the fees are appropriate in light of the services provided.
Curian/Epoch Global Shareholder Yield Fund. The Board noted Curian’s view that a supplemental peer group also provided a meaningful comparison of Fund expenses. The Board noted that the Fund’s total expense ratio is lower than the supplemental peer group average and that the sub-advisory fee is equal to the supplemental peer group average, though the advisory fee is higher than the supplemental peer group average. The Board further noted that the Fund’s advisory fee, sub-advisory fee, and total expense ratio are higher than their respective peer group averages. The Board concluded that the fees are appropriate in light of the services provided.
Curian/FAMCO Flex Core Covered Call Fund. The Board considered that the Fund’s advisory fee and sub-advisory fee are lower than the Fund’s peer group averages. The Board also noted that the Fund’s total expense ratio is only four basis points higher than its peer group average. The Board concluded that the fees are appropriate in light of the services provided.
Curian Focused International Equity Fund. The Board noted that the Fund’s advisory fee and total expense ratio are lower than their respective peer group averages, while the Fund’s sub-advisory fee is equal to its peer group average. The Board concluded that the fees are appropriate in light of the services provided.
Curian Focused U.S. Equity Fund. The Board noted that the Fund’s advisory fee is lower than its peer group average, though its total expense ratio is four basis points higher than its peer group average. The Board also considered that the Fund’s sub-advisory fee is higher than its peer group average. The Board concluded that the fees are appropriate in light of the services provided.
Curian/Franklin Templeton Natural Resources Fund. The Board noted that the Fund’s advisory fee and total expense ratio are lower than their respective peer group averages, though the sub-advisory fee is equal to its peer group average. The Board concluded that the fees are appropriate in light of the services provided.
Curian/Lazard International Strategic Equity Fund. The Board noted that the Fund’s total expense ratio is lower than the Fund’s peer group average, though the Fund’s advisory fee and sub-advisory fee are higher than the peer group averages. The Board concluded that the fees are appropriate in light of the services provided.
Curian Long Short Credit Fund. The Board noted that the Fund’s advisory fee, sub-advisory fee and total expense ratio are all lower than their respective peer group averages. The Board also considered that the Adviser proposed a contractual advisory fee waiver to be effective January 1, 2015. The Board concluded that the fees are appropriate in light of the services provided.
Curian/Neuberger Berman Currency Fund. The Board noted that the Fund’s sub-advisory fee is equal to its peer group average, though the Fund’s advisory fee is higher than its peer group average and its total expense ratio is one basis point higher than its peer group average. Regarding the total expense ratio, the Board considered the Adviser’s assertion that many of the funds in the Fund’s peer group do not pay a Rule 12b-1 fees and may have material transfer agent fees, and that when the impact of the Rule 12b-1 fees and transfer agent fees is removed, the Fund’s total expense ratio is below the peer group average. The Board concluded that the fees are appropriate in light of the services provided.
Curian/Neuberger Berman Risk Balanced Commodities Strategy Fund. The Board considered that the Fund’s sub-advisory fee and total expense ratio are lower than their respective peer group averages, though the Fund’s advisory fee is higher than its peer group average. The Board concluded that the fees are appropriate in light of the services provided.
Curian/Nicholas Convertible Arbitrage Fund and Curian/PineBridge Merger Arbitrage Fund. The Board noted that each Fund’s sub-advisory fee is lower than its peer group average, though the advisory fee and total expense ratio are higher than their respective peer group averages. Regarding the total expense ratio, the Board considered the Adviser’s assertion that many of the funds in the Funds’ peer groups do not pay Rule 12b-1 fees and may have material transfer agent fees and that the Funds’ total expense ratios are equal to their peer group averages when the impact of Rule 12b-1 fees and transfer agent fees is removed. The Board concluded that the fees are appropriate in light of the services provided.
Curian/PIMCO Credit Income Fund. The Board noted that the Fund’s advisory fee and total expense ratio are lower than the respective peer group averages, though its sub-advisory fee is higher than the peer group average. The Board concluded that the fees are appropriate in light of the services provided.
Curian/Schroder Emerging Europe Fund. The Board noted Curian’s view that a supplemental peer group also provided a meaningful comparison of Fund expenses. The Board noted that the Fund’s total expense ratio is equal to its supplemental peer group average, though its advisory fee and sub-advisory fee are higher than their respective supplemental peer group averages. The Board also noted that the Fund’s advisory fee, sub-advisory fee and total expense ratio are higher than their respective peer group averages. The Board concluded that the fees are appropriate in light of the services provided.
Curian/T. Rowe Price Capital Appreciation Fund. The Board noted that the Fund’s advisory fee and sub-advisory fee are higher than their respective peer group averages and its total expense ratio is two basis points higher than its peer group average. The Board concluded that the fees are appropriate in light of the services provided.
Curian/The Boston Company Equity Income Fund and Curian/UBS Global Long Short Fixed Income Opportunities Fund. The Board noted that each Fund’s advisory fee, sub-advisory fee and total expense ratio are lower than their respective peer group averages. The Board concluded that the fees are appropriate in light of the services provided.
Economies of Scale
The Board considered whether each Fund’s advisory fee reflects economies of scale for the benefit of the Funds’ shareholders. Based on information provided by Curian, the Board noted that the fee arrangement for each Fund contains breakpoints that decrease the advisory fee rate as assets increase. Additionally, the Board considered Curian’s assertion that Curian continually evaluates the advisory fee and breakpoint schedules for the Funds, and it considered the extent to which economies of scale are reflected for the benefit of shareholders. The Board concluded that the advisory fee structure, in some measure, allows for adequate participation by shareholders in economies of scale across the Fund complex.
The Board also considered that the sub-advisory fee rates have been separately negotiated between Curian and each Sub-Adviser at arm’s length. These sub-advisory fees are paid by Curian to each Sub-Adviser. For this reason, Curian, rather than shareholders, directly benefits from these breakpoints. Additionally, to the extent that Curian is waiving its advisory fee with respect to a certain Fund, it may also be benefitting from the breakpoints in sub-advisory fees. The Board concluded that the sub-advisory fee schedules, where applicable, in some measure allow for adequate participation by shareholders in economies of scale.
Profitability
The Board considered information concerning the costs incurred and profits realized by Curian and each Sub-Adviser. The Board also considered the Adviser’s fee waivers for certain funds, pursuant to which it has reduced its fees and reimburses other expenses of the Funds, as applicable, to reduce the total annual operating expenses of the Funds. The Board determined that profits realized by Curian and each Sub-Adviser were not unreasonable. The Board did not consider the profits to be realized by BlackRock Singapore, as it had not yet begun serving as co-sub-adviser to the Curian/BlackRock Global Long Short Credit Fund.
Other Benefits to Curian and the Sub-Advisers
In evaluating the benefits that may accrue to Curian through its relationship with the Funds, the Board noted that Curian and certain of its affiliates serve the Funds in various capacities, including as adviser, administrator, sub-administrator, transfer agent and distributor, and receive compensation from the Funds in connection with providing certain services to the Funds. The Board noted that each service provided to the Funds by Curian or one of its affiliates is pursuant to a written agreement, which the Board evaluates periodically as required by law. The Board also noted that certain Sub-Advisers pay for portions of meetings organized by the Funds’ distributor to educate wholesalers about the Fund(s) that each of those Sub-Advisers manages. In addition, certain affiliates of the Sub-Advisers participate in the sale of funds or insurance contracts and are compensated by the Funds’ distributor for these activities, in addition to payments for marketing and conferences. An affiliate of Curian and its subsidiaries participate in the sales of shares of retail mutual funds advised by certain Sub-Advisers and other unaffiliated entities, and receive selling and other compensation from them in connection with those activities. The Board reviewed the monetary values of these transactions. Lastly, the Board considered that certain affiliates of Curian may receive benefits under the federal income tax laws with respect to tax deductions and credits.
In evaluating the benefits that may accrue to the Sub-Advisers through their relationship with the Fund(s), the Board noted that each Sub-Adviser may receive indirect benefits in the form of soft dollar arrangements for portfolio securities trades placed with the Funds’ assets and may also develop additional investment advisory business with Curian, the Funds or other clients of the Sub-adviser as a result of its relationship with the Fund(s).
CURIAN VARIABLE SERIES TRUST (“TRUST”)
APPROVAL OF INVESTMENT ADVISORY AND SUB-ADVISORY AGREEMENTS
JANUARY 2015
The Board of Trustees of the Trust (“Board”) oversees the management of each series of the Trust (each, a “Fund” and collectively, the “Funds”) and, as required by law, determines whether to approve and, after the initial term, continue the Trust’s advisory and sub-advisory agreements.
At an in-person meeting held on January 8, 2015, the Board, which was comprised solely of trustees who are not considered interested persons of the Funds (as defined in the Investment Company Act of 1940, as amended) (the “Independent Trustees”), considered information relating to the proposed investment advisory and management agreement (the “Advisory Agreement”) with Jackson National Asset Management, LLC (“JNAM”). At a telephonic meeting held on December 1, 2014 and in-person meetings held on December 10, 2014 and January 8, 2015, the Board considered management’s proposals to transfer the Trust’s investment advisory function to JNAM, as well as information related to the Trust’s Sub-Advisers and proposed new sub-advisory agreements between JNAM and each Sub-Adviser (the “Sub-Advisory Agreements,” and together with the Advisory Agreement, the “Agreements”). The Board noted that the Sub-Advisers for the Trust would not change, and that the Sub-Advisory Agreements would be essentially the same as the existing agreements, except that JNAM would be the contracting investment adviser.
In advance of the meeting, independent legal counsel for the Independent Trustees requested that certain information be provided to the Board relating to the Agreements. The Board received, and had the opportunity to review, this and other materials, ask questions and request further information in connection with its consideration. At the conclusion of the Board’s discussions, the Board approved the Agreements.
In reviewing the Agreements and considering the information, the Board was advised by outside independent legal counsel. The Board considered the factors it deemed relevant, including: (1) the nature, quality and extent of the services provided and proposed to be provided, (2) the investment performance of each Fund, (3) cost of services for each Fund, (4) profitability data, (5) whether economies of scale may be realized and shared, in some measure, with investors as each Fund grows, and (6) other benefits that may accrue to JNAM or each Sub-Adviser through its relationship with the Trust. In approving the New Advisory Agreement, the Board did not consider the profits of JNAM as it had not yet begun acting as investment adviser to the Funds. With regard to the profitability of the Sub-Advisers, the Board noted that it recently had considered their profitability as part of the Board’s annual consideration of the Sub-Advisory Agreements and that there were no changes in the terms of the Sub-Advisory Agreements, except that JNAM would become the contracting party. In its deliberations, the Board, in exercising its business judgment, did not identify any single factor that alone was responsible for its decision to approve the Agreements.
Before approving the Agreements, the Independent Trustees met in executive session with their independent legal counsel to consider the materials provided by JNAM and the Sub-Advisers and the terms of the Agreements. Based on its evaluation of those materials, the Board concluded that the Agreements are in the best interests of the shareholders of the Trust and each applicable Fund. In reaching its conclusions, the Board considered numerous factors, including the following:
Nature, Quality and Extent of Services
The Board examined the nature, quality and extent of the services provided by the Sub-Advisers and proposed to be provided by JNAM.
For each Fund, the Board considered the services proposed to be provided by JNAM, including but not limited to, its oversight of the Sub-Advisers pursuant to the Advisory Agreement, recommending the hiring or removal of Sub-Advisers pursuant to the Trust’s “Manager of Managers” exemptive order, as well as the provision of recordkeeping and compliance services to the Funds. The Board noted that the proposed services and the amounts the Funds would pay would be substantially the same as under the existing contract with the Funds’ current investment adviser, Curian Capital LLC (“Curian”). The Board also took into account that JNAM would monitor the performance of the various organizations that provide services to the Funds, including the Funds’ distributor, transfer agent and custodian. With respect to JNAM’s oversight of the Sub-Advisers, the Board noted that JNAM would be responsible for screening and recommending new sub-advisers when appropriate, as well as monitoring and reporting to the Board on the performance and operations of the existing Sub-Advisers. The Board noted that JNAM is an affiliate of Curian. The Board also noted that it was very familiar with JNAM and the quality of its services, since it had served as sub-administrator to the Trust since its inception and because certain employees of JNAM serve as officers of the Trust. The Board also considered that certain employees of Curian are dual employees of JNAM. The Board also discussed with representatives of JNAM its resources, existing fund offerings and experience in managing similar funds.
The Board also considered the investment sub-advisory services to be provided by each Sub-Adviser under the new Sub-Advisory Agreements. The Board noted that the terms of each Sub-Advisory Agreement are materially similar to the respective Sub-Adviser’s current sub-advisory agreement with Curian, and that the Sub-Advisers would continue performing the same services to the Funds under the new Sub-Advisory Agreements as they do under the existing agreement.
The Board reviewed the qualifications, backgrounds and responsibilities of JNAM’s senior management who would be responsible for oversight of the Funds and each Sub-Adviser, and also reviewed the qualifications and backgrounds of JNAM’s and the Sub-Advisers’ portfolio managers who would be responsible for the day-to-day management of each Fund. The Board reviewed information pertaining to JNAM’s and each Sub-Adviser’s organizational structure, senior management, financial condition, investment operations and other relevant information. The Board also considered compliance reports about JNAM and each Sub-Adviser from the Trust’s Chief Compliance Officer, and met in executive session with the Chief Compliance Officer to discuss these matters.
Based on the foregoing, the Board concluded that (i) each Fund is likely to benefit from the nature, extent and quality of the services proposed to be provided by JNAM under the Advisory Agreement, particularly because the scope of services and the amounts to be paid for those services will be substantially the same as the existing arrangements, and where applicable, that (ii) each Fund is likely to continue to benefit from the nature, extent and quality of the services to be provided by its Sub-Adviser under the respective Sub-Advisory Agreement.
Investment Performance of the Funds
The Board noted that it recently had examined the performance of each Fund as part of its annual consideration of the advisory contract with Curian and the existing Sub-Advisers. Because JNAM was not responsible for that performance, the Board did not give the Funds’ performance primary consideration in their review of JNAM, but noted that it would review with JNAM on a quarterly basis detailed information about each Fund’s performance results and investment strategies. The Board also noted that it would consider the performance of each Fund, including how the Fund performs versus the average performance of a group of comparable funds (“peer group”) selected by an independent data service and how the Fund performed versus its primary benchmark (“benchmark”) index. The Board likewise did not give primary consideration to the performance of the Sub-Advisers because of its recent review and the fact that the Sub-Advisory Agreements would not substantially change, other than the fact that JNAM would become the contracting party, not Curian. Nevertheless, the Board had available to it performance information for each Fund for periods ended October 31, 2014.
Costs of Services
The Board reviewed the fees to be paid to JNAM and each Fund’s Sub-Adviser(s). The Board noted that the proposed contractual advisory and sub-advisory fees under the new Agreements would remain the same as they are under the existing advisory and sub-advisory agreements and that the fee and expense information it considered at its December 2014 meetings regarding the existing agreements remained applicable. For each Fund, the Board had available to it fee and expense information as compared to that of comparable funds managed by other advisers, as well as fees charged by each Sub-Adviser to similar clients, if any.
In addition, the Board considered that JNAM’s fees as the proposed administrator to the Funds would be lower for most of the Funds than the existing administrative fee and that the respective Funds’ total expenses would decrease as a result.
Economies of Scale
The Board considered whether each Fund’s proposed advisory fee would reflect economies of scale for the benefit of the Funds’ shareholders. Based on information provided by JNAM, the Board noted that the fee arrangement for each contains breakpoints that would decrease the advisory fee rate as assets increase. Additionally, the Board considered the extent to which the breakpoints would reflect economies of scale for the benefit of shareholders. The Board concluded that the proposed advisory fee structure, in some measure, allows for adequate participation by shareholders in economies of scale across the Fund complex.
The Board also considered that the proposed sub-advisory fee rates would be paid by JNAM to each Sub-Adviser. For this reason, JNAM, rather than shareholders, would directly benefit from these breakpoints. Additionally, to the extent that JNAM would waive its advisory fee with respect to a certain Fund, the Fund would also potentially benefit from the breakpoints in sub-advisory fees. The Board concluded that the sub-advisory fee schedules, where applicable, in some measure allow for adequate participation by shareholders in economies of scale.
Profitability
The Board noted that it recently had extensively considered information concerning the costs incurred and profits realized by each Sub-Adviser as part of its annual 15(c) review in December 2014. The Board did not consider the profits to be realized by JNAM, since it had not yet begun serving as investment adviser to the Funds. The Board determined that profits that have been realized by each Sub-Adviser were not unreasonable.
Other Benefits to JNAM and the Sub-Advisers
In evaluating the benefits that may accrue to JNAM through its relationship with the Funds, the Board noted that JNAM and certain of its affiliates serve the Funds in various capacities, including as adviser, administrator, transfer agent and distributor, and receive compensation from the Funds in connection with providing certain services to the Funds. The Board noted that each service to be provided to the Funds by JNAM or one of its affiliates would be pursuant to a written agreement, which the Board would evaluate periodically as required by law. The Board also noted that certain Sub-Advisers pay for portions of meetings organized by the Funds’ distributor to educate wholesalers about the Fund(s) that each of those Sub-Advisers manages. In addition, certain affiliates of the Sub-Advisers participate in the sale of funds or insurance contracts and are compensated by the Funds’ distributor for these activities, in addition to payments for marketing and conferences. An affiliate of JNAM and its subsidiaries participate in the sales of shares of retail mutual funds advised by certain Sub-Advisers and other unaffiliated entities, and receive selling and other compensation from them in connection with those activities. The Board reviewed the monetary values of these transactions. Lastly, the Board considered that certain affiliates of JNAM may receive benefits under the federal income tax laws with respect to tax deductions and credits.
In evaluating the benefits that may accrue to the Sub-Advisers through their relationship with the Fund(s), the Board noted that each Sub-Adviser may receive indirect benefits in the form of soft dollar arrangements for portfolio securities trades placed with the Funds’ assets and may also develop additional investment advisory business with JNAM, the Funds or other clients of the Sub-adviser as a result of its relationship with the Fund(s).
SUPPLEMENT DATED AUGUST 22, 2014
TO THE PROSPECTUS DATED APRIL 28, 2014
CURIAN VARIABLE SERIES TRUST
Please note that the changes apply to your variable annuity product(s).
Please note that all changes are effective immediately.
For the Curian/PineBridge Merger Arbitrage Fund, please remove all references to Meg Sullivan.
This supplement is dated August 22, 2014.
(To be used with JMV8037 04/14, JMV8037BE 04/14, JMV8037NY 04/14 and JMV8037BENY 04/14)
CMV13564 08/14
SUPPLEMENT DATED SEPTEMBER 15, 2014
TO THE PROSPECTUS DATED APRIL 28, 2014
CURIAN VARIABLE SERIES TRUST
Please note that the changes apply to your variable annuity product(s).
Please note that all changes are effective immediately.
Please delete all references to the Curian Guidance — Institutional Alt 100 Conservative Fund and replace them with Curian Guidance — Alt 100 Conservative Fund.
Please delete all references to the Curian Guidance — Institutional Alt 100 Moderate Fund and replace them with Curian Guidance — Alt 100 Moderate Fund.
Please delete all references to the Curian Guidance — Institutional Alt 100 Growth Fund and replace them with Curian Guidance — Alt 100 Growth Fund.
Please delete all references to the Curian Guidance — International Opportunities Conservative Fund and replace them with Curian Guidance — International Conservative Fund.
Please delete all references to the Curian Guidance — International Opportunities Moderate Fund and replace them with Curian Guidance — International Moderate Fund.
Please delete all references to the Curian Guidance — International Opportunities Growth Fund and replace them with Curian Guidance — International Growth Fund.
Please delete all references to the Curian/CenterSquare International REIT Fund and replace them with Curian/CenterSquare International Real Estate Securities Fund.
In the section entitled “Summary Overview of Each Fund” for the Curian Guidance — Equity 100 Fund, please delete the subsection entitled “Principal Investment Strategies,” in its entirety and replace it with the following:
The Fund seeks to achieve its objective by investing in shares of Underlying Funds representing various asset classes and strategies. The Fund will invest in Underlying Funds such that 80% of its assets (net assets plus the amount of any borrowings for investment purposes) are invested in equities (which may include derivatives exposure to equity securities) of issuers in the U.S. and foreign countries, including emerging markets. The Fund allocates its assets to Underlying Funds that invest amongst various equity classes, as well as non-traditional investments. Derivative instrument holdings within the Underlying Funds will be counted toward the 80% policy discussed above to the extent they have economic characteristics similar to equity securities.
The Underlying Funds in which the Fund may invest each are a separate series of the Curian Variable Series Trust, JNL Series Trust, JNL Variable Fund LLC, or JNL Investors Series Trust. Not all Funds of the Curian Variable Series Trust, JNL Series Trust, JNL Variable Fund LLC, or JNL Investors Series Trust are available as Underlying Funds. Please refer to the “Additional Information About Each Fund” section of the Prospectus for a list of available Underlying Funds.
The Fund may allocate its assets among Underlying Funds categorized by the Adviser as follows:
Investment Categories
Alternative Assets
Alternative Strategies
Domestic/Global Equity
Domestic/Global Fixed Income
International
International Fixed Income
Risk Management
Sector
Specialty
Tactical Management
Although the Fund may invest in any of the Investment Categories listed in the table above, the Adviser intends only to invest in Underlying Funds categorized as Alternative Assets, Alternative Strategies, Domestic/Global Equity, International, Sector and Specialty. The Fund considers the Underlying Funds in the Domestic/Global Equity and International investment categories to be funds that invest primarily in equity securities. To the extent the Fund invests in Underlying Funds in the Sector and Specialty investment categories, it intends to invest in those that invest primarily in equity securities. The Fund considers the Underlying Funds in the Alternative Assets and Alternative Strategies investment categories to be funds that invest primarily in alternative assets and employ alternative strategies.
In determining allocations to any particular Underlying Fund, the Adviser considers, among other things, both long- and short-term market and economic conditions, historical performance of each Underlying Fund, and expected long-term performance of each Underlying Fund, as well as diversification to control overall portfolio risk exposure.
The Underlying Funds in which the Fund may invest may be changed from time to time at the discretion of the Adviser without notice or shareholder approval. Therefore, the Fund may invest in Underlying Funds that are not listed in the statutory prospectus.
The Fund is “non-diversified” under the Investment Company Act of 1940, as amended (the “1940 Act”), and may invest more of its assets in fewer issuers than “diversified” mutual funds.
In the section entitled “Summary Overview of Each Fund” for the Curian Guidance — Fixed Income 100 Fund, please delete the subsection entitled “Principal Investment Strategies,” in its entirety and replace it with the following:
The Fund seeks to achieve its objective by investing in shares of Underlying Funds representing various asset classes and strategies. The Fund will invest in Underlying Funds such that 80% of its assets (net assets plus the amount of any borrowings for investment purposes) are invested in fixed income securities (which may include derivatives exposure to fixed income securities) of issuers in the U.S. and foreign countries, including emerging markets. The Fund allocates its assets to Underlying Funds that invest amongst various fixed income classes, as well as non-traditional investments. Derivative instrument holdings within the Underlying Funds will be counted toward the 80% policy discussed above to the extent they have economic characteristics similar to fixed income securities.
The Underlying Funds in which the Fund may invest each are a separate series of the Curian Variable Series Trust, JNL Series Trust, JNL Variable Fund LLC, or JNL Investors Series Trust. Not all Funds of the Curian Variable Series Trust, JNL Series Trust, JNL Variable Fund LLC, or JNL Investors Series Trust are available as Underlying Funds. Please refer to the “Additional Information About Each Fund” section of the Prospectus for a list of available Underlying Funds.
The Fund may allocate its assets among Underlying Funds categorized by the Adviser as follows:
Investment Categories
Alternative Assets
Alternative Strategies
Domestic/Global Equity
Domestic/Global Fixed Income
International
International Fixed Income
Risk Management
Sector
Specialty
Tactical Management
Although the Fund may invest in any of the Investment Categories listed in the table above, the Adviser intends only to invest in Underlying Funds categorized as Alternative Assets, Alternative Strategies, Domestic/Global Fixed Income, International Fixed Income, Sector and Specialty. The Fund considers the Underlying Funds in the Domestic/Global Fixed Income and International Fixed Income investment categories to be funds that invest primarily in fixed income securities. To the extent the Fund invests in Underlying Funds in the Sector and Specialty investment categories, it intends to invest in those that invest primarily in fixed income securities. The Fund considers the Underlying Funds in the Alternative Assets and Alternative Strategies investment categories to be funds that invest primarily in alternative assets and employ alternative strategies.
In determining allocations to any particular Underlying Fund, the Adviser considers, among other things, both long- and short-term market and economic conditions, historical performance of each Underlying Fund, and expected long-term performance of each Underlying Fund, as well as diversification to control overall portfolio risk exposure.
The Underlying Funds in which the Fund may invest may be changed from time to time at the discretion of the Adviser without notice or shareholder approval. Therefore, the Fund may invest in Underlying Funds that are not listed in the statutory prospectus.
The Fund is “non-diversified” under the Investment Company Act of 1940, as amended (the “1940 Act”), and may invest more of its assets in fewer issuers than “diversified” mutual funds.
In the section entitled “Summary Overview of Each Fund” for the Curian Guidance — Fixed Income 100 Fund, under “Principal Risks of Investing in the Fund,” please delete “Equity securities risk” in its entirety.
This Supplement is dated September 15, 2014.
(To be used with JMV8037 04/14, JMV8037BE 04/14, JMV8037NY 04/14 and JMV8037BENY 04/14)
CMV13628 09/14
SUPPLEMENT DATED OCTOBER 31, 2014
TO THE PROSPECTUS DATED APRIL 28, 2014
CURIAN VARIABLE SERIES TRUST
Please note that the changes apply to your variable annuity product(s).
Please note that all changes are effective November 1, 2014.
In the summary prospectus section entitled “Summary Overview of Each Fund,” subsection “Portfolio Management” for the Curian/Schroder Emerging Europe Fund, please remove the line item relating to Tom Wilson and add the following:
Name: | | Joined
Fund Management
Team In: | | Title: |
Mohsin Memon | | November 2014 | | EMEA (Europe, Middle East, and Africa) Equity Fund Manager/Analyst |
Rollo Roscow | | November 2014 | | Head of EMEA |
This supplement is dated October 31, 2014.
(To be used with JMV8037 04/14, JMV8037BE 04/14, JMV8037NY 04/14 and JMV8037BENY 04/14)
CMV14055 10/14
SUPPLEMENT DATED JANUARY 16, 2015
TO THE PROSPECTUS DATED APRIL 28, 2014
CURIAN VARIABLE SERIES TRUST
Please note that the changes apply to your variable annuity product(s).
Please note that all changes are effective January 1, 2015, unless otherwise noted below.
In the summary section for the Curian Long Short Credit Fund, in the sub-section entitled “Expenses,” please delete the table entitled “Annual Fund Operating Expenses” in its entirety and replace it with the following:
Annual Fund Operating Expenses
(Expenses that you pay each year as a percentage of the value of your investment)
Management Fees | | 0.95 | % |
Distribution and/or Service (12b-1) Fees | | 0.25 | % |
Other Expenses(1) | | 0.22 | % |
Acquired Fund Fees and Expenses(2) | | 0.01 | % |
Total Annual Fund Operating Expenses | | 1.43 | % |
Less Waiver/Reimbursement(3) | | (0.25 | )% |
Total Net Annual Fund Operating Expenses After Waiver/Reimbursement | | 1.18 | % |
(1) “Other Expenses” include an Administrative Fee of 0.20% which is payable to Curian Capital, LLC (“Curian Capital” or the “Adviser”).
(2) Acquired Fund Fees and Expenses are the indirect expenses of investing in other investment companies. The Total Annual Fund Operating Expenses disclosed above do not correlate to the Ratio of Total Expenses to Average Net Assets of the Fund stated in the Financial Highlights because the Ratio of Total Expenses to Average Net Assets does not include the Acquired Fund Fees and Expenses.
(3) Curian Capital has entered into a contractual agreement with the Fund under which it will waive 0.25% of its Management Fees. This fee waiver will have an initial term expiring on December 31, 2015, unless the Board of Trustees approves a change in or elimination of the waiver.
In the summary section for the Curian Long Short Credit Fund, in the sub-section entitled “Expense Example,” please delete the expense example table in its entirety and replace it with the following:
1 year | | 3 years | | 5 years | | 10 years | |
$ | 120 | | $ | 428 | | $ | 758 | | $ | 1,692 | |
| | | | | | | | | | | |
This supplement is dated January 16, 2015
(To be used with JMV8037 04/14, JMV8037BE 04/14, JMV8037NY 04/14 and JMV8037BENY 04/14)
CMV14601 1/15
Curian Variable Series Trust 7601 Technology Way Denver, CO 80237 | PRSRT STD U.S. POSTAGE PAID JACKSON NATIONAL ASSET MANAGEMENT L.L.C. |
CMV13476 01/15
Item 2. Code of Ethics.
As of the end of the period covered by this report, the registrant had adopted a code of ethics, as defined in Item 2 of Form N-CSR, applicable to its principal executive officer, principal financial officer, principal accounting officer or controller, or persons performing similar functions. There were no substantive amendments or any waivers to this code of ethics during the period covered by this report. A copy of this code of ethics is filed as exhibit 12(a)(1) to this Form N-CSR.
Item 3. Audit Committee Financial Expert.
The registrant has named David W. Agostine, Gregory P. Contillo, Dylan E. Taylor, Scot T. Wetzel, and Mark S. Wehrle as audit committee financial experts serving on its Audit Committee. Each of these individuals is “independent,” meaning that he is not an “interested person” of the registrant, as that term is defined in Section 2(a)(19) of the Investment Company Act of 1940, as amended, and is considered “independent” for purposes of this Item.
An “audit committee financial expert” is not an “expert” for any purpose, including for purposes of Section 11 of the Securities Act of 1933, as amended, as a result of being designated as an “audit committee financial expert.” Further, the designation of a person as an “audit committee financial expert” does not mean that the person has any greater duties, obligations, or liability than those imposed on the person without the “audit committee financial expert” designation. Similarly, the designation of a person as an “audit committee financial expert” does not affect the duties, obligations, or liability of any other member of the Audit Committee or Board of Trustees.
Item 4. Principal Accountant Fees and Services.
The administrator of the registrant is responsible for payment of all expenses associated with the annual audit and other required services of the independent registered accounting firm, and all expenses associated with the preparation and filing of the tax returns.
KPMG LLP (“KPMG”) was appointed by the Board of Trustees as the independent registered public accounting firm of the registrant for the fiscal years ended December 31, 2013 and December 31, 2014. The following table sets forth aggregate fees billed by KPMG for the respective period for professional services rendered to the registrant.
Fees for Services Rendered to the Registrant by the Principal Accountant
Fiscal Year | | Audit Fees | | Audit-Related Fees | | Tax Fees | | All Other Fees | |
2013 | | $ | 586,190 | | $ | 0 | | $ | 141,875 | | $ | 0 | |
2014 | | $ | 623,536 | | $ | 0 | | $ | 208,540 | | $ | 0 | |
Fees for Services Rendered to the Adviser Entities by the Principal Accountant
The following table sets forth the amount of fees that were billed by KPMG for the respective period to any entity controlling, controlled by, or under common control with the investment adviser that provided ongoing services to the registrant (“Adviser Entities”) that were directly related to the registrant’s operations and financial reporting.
Fiscal Year | | Audit-Related Fees | | Tax Fees | | All Other Fees | |
2013 | | $ | 113,804 | | $ | 0 | | $ | 0 | |
2014 | | $ | 118,417 | | $ | 0 | | $ | 0 | |
The above Audit-Related Fees are the aggregate fees billed to Adviser Entities for the performance of an attestation on the suitability of design and operating effectiveness of control pursuant to Statement on Standards for Attestation Engagements No. 16.
(e)(1) The Audit Committee is authorized to pre-approve non-audit services provided by the registrant’s auditors, if they find it appropriate in light of their fiduciary duties and in the exercise of their good faith business judgment and compatible with the auditors’ independence. The Chairman of the Audit Committee is authorized to approve audit and non-audit services for newly established Funds of the registrant on the same terms as the full Audit Committee previously had approved for the then existing Funds.
(e)(2) 0%
(f) Not applicable.
(g) The aggregate fees billed for all non-audit fees to the registrant and Adviser Entities for the year ended December 31, 2013 was $352,679. The aggregate fees billed for all non-audit fees to the registrant and Adviser Entities for the year ended December 31, 2014 was $424,197.
(h) For the fiscal years ended December 31, 2013 and December 31, 2014, the Audit Committee of the registrant’s Board of Trustees considered the provision of non-audit services that were rendered to the Adviser Entities that were not pre-approved pursuant to paragraph (c)(7)(ii) of Rule 2-01 of Regulation S-X, and concluded that such services were compatible with maintaining KPMG’s independence.
Item 5. Audit Committee of Listed Registrants.
Not applicable.
Item 6. Investments.
(a) Below is a Schedule I — Investments in securities of unaffiliated issuers for the Curian Long Short Credit Fund, Curian/Ashmore Emerging Market Small Cap Equity Fund, Curian/BlackRock Global Long Short Credit Fund, Curian/DFA U.S. Micro Cap Fund, Curian/Epoch Global Shareholder Yield Fund, Curian/PIMCO Credit Income Fund, Curian/T. Rowe Price Capital Appreciation Fund, and the Curian/UBS Global Long Short Fixed Income Opportunities Fund for which a summary schedule of investments was provided in the Annual Report dated December 31, 2014, pursuant to §210.1212 of Regulation S-X.
Curian Variable Series Trust Sub-Advised Funds
Schedules of Investments (in thousands)
December 31, 2014
Curian/Ashmore Emerging Market Small Cap Equity Fund
| | Shares/Par † | | Value | |
COMMON STOCKS - 98.1% | | | | | |
| | | | | |
BRAZIL - 5.1% | | | | | |
All America Latina Logistica SA | | 61 | | $ | 115 | |
GAEC Educacao SA | | 18 | | 235 | |
Iochpe-Maxion SA | | 121 | | 556 | |
Tereos Internacional SA | | 411 | | 218 | |
Tupy SA | | 85 | | 569 | |
Wilson Sons Ltd. - BDR | | 21 | | 257 | |
| | | | 1,950 | |
CHILE - 1.9% | | | | | |
Cia Sud Americana de Vapores SA (a) | | 4,373 | | 165 | |
Empresas La Polar SA (a) | | 2,128 | | 99 | |
Forus SA | | 54 | | 220 | |
Vina Concha y Toro SA | | 134 | | 263 | |
| | | | 747 | |
CHINA - 17.0 % | | | | | |
21Vianet Group Inc. - ADR (a) | | 29 | | 448 | |
500.com Ltd. - ADR - Class A (a) | | 13 | | 231 | |
Ctrip.com International Ltd. - ADR (a) | | 17 | | 780 | |
Hollysys Automation Technologies Ltd. (a) | | 20 | | 488 | |
iKang Healthcare Group Inc. - ADR (a) | | 25 | | 375 | |
Noah Holdings Ltd. - ADS (a) (b) | | 51 | | 1,068 | |
Phoenix New Media Ltd. - ADR (a) | | 61 | | 507 | |
Sinovac Biotech Ltd. (a) | | — | | — | |
SouFun Holdings Ltd. - ADR (b) | | 85 | | 628 | |
Sunac China Holdings Ltd. | | 1,737 | | 1,755 | |
Tarena International Inc. - ADR (a) | | 23 | | 260 | |
| | | | 6,540 | |
COLOMBIA - 0.2% | | | | | |
Avianca Holdings SA - ADR | | 7 | | 80 | |
| | | | | |
EGYPT - 0.9% | | | | | |
Egyptian Financial Group-Hermes Holding - GDR (a) | | 85 | | 336 | |
| | | | | |
HONG KONG - 10.4% | | | | | |
China Machinery Engineering Corp. - Class H | | 592 | | 452 | |
China Merchants Land Ltd. | | 2,780 | | 407 | |
Chinasoft International Ltd. (a) | | 1,296 | | 362 | |
Ju Teng International Holdings Ltd. | | 1,138 | | 559 | |
Kingsoft Corp. Ltd. | | 41 | | 81 | |
Nord Anglia Education Inc. (a) | | 22 | | 427 | |
Pacific Basin Shipping Ltd. | | 1,009 | | 404 | |
Shanghai Fudan-Zhangjiang Bio-Pharmaceutical Co. Ltd. - Class H (a) | | 318 | | 266 | |
Shenzhen Investment Ltd. | | 1,470 | | 422 | |
Singamas Container Holdings Ltd. | | 2,260 | | 375 | |
Xinchen China Power Holdings Ltd. (a) | | 804 | | 253 | |
| | | | 4.008 | |
INDIA - 8.0% | | | | | |
Balrampur Chini Mills Ltd. (a) | | 499 | | 471 | |
ING Vysya Bank Ltd. | | 41 | | 562 | |
MT Educare Ltd. | | 74 | | 144 | |
Persistent Systems Ltd. | | 11 | | 301 | |
PI Industries Ltd. | | 73 | | 599 | |
Shriram Transport Finance Co. Ltd. | | 28 | | 499 | |
Tata Chemicals Ltd. | | 71 | | 491 | |
| | | | 3,067 | |
INDONESIA - 6.1% | | | | | |
Adi Sarana Armada Tbk PT | | 1,224 | | 16 | |
Bank Tabungan Negara Persero Tbk PT | | 15,436 | | 1,495 | |
Ciputra Surya Tbk PT | | 1,962 | | 468 | |
Lippo Karawaci Tbk PT | | 4,350 | | 357 | |
| | | | 2,336 | |
MEXICO - 5.1% | | | | | |
Cydsa SAB de CV - Class A | | 209 | | 423 | |
Grupo Famsa SAB de CV - Class A (a) | | 271 | | 224 | |
Grupo Industrial Saltillo SAB de CV - Class A | | 192 | | 428 | |
Grupo Lamosa SAB de CV | | 130 | | 244 | |
TF Administradora Industrial S de RL de CV | | 318 | | 665 | |
| | | | 1,984 | |
PHILIPPINES - 0.8% | | | | | |
Century Properties Group Inc. | | 8,591 | | 182 | |
Filinvest Land Inc. | | 3,252 | | 111 | |
| | | | 293 | |
RUSSIAN FEDERATION - 1.2% | | | | | |
Aeroflot - Russian Airlines OJSC | | 358 | | 183 | |
LSR Group - GDR | | 189 | | 295 | |
| | | | 478 | |
SOUTH AFRICA - 0.3% | | | | | |
Murray & Roberts Holdings Ltd. | | 65 | | 120 | |
| | | | | |
SOUTH KOREA - 12.7% | | | | | |
Basic House Co. Ltd. | | 8 | | 112 | |
Dongsung Finetec Co. Ltd. | | 43 | | 304 | |
i-SENS Inc. (a) | | 7 | | 379 | |
Interpark Corp. | | 50 | | 418 | |
Interpark INT Corp. (a) | | 15 | | 314 | |
Korean Reinsurance Co. | | 65 | | 638 | |
Medy-Tox Inc. | | 2 | | 533 | |
Modetour Network Inc. | | 39 | | 856 | |
Nexen Tire Corp. | | 21 | | 244 | |
Samchuly Bicycle Co. Ltd. | | 21 | | 368 | |
Soulbrain Co. Ltd. | | 19 | | 546 | |
Vieworks Co. Ltd. | | 6 | | 191 | |
| | | | 4,903 | |
TAIWAN - 24.4% | | | | | |
Altek Corp. | | 694 | | 790 | |
Capital Securities Corp. | | 1,499 | | 494 | |
Casetek Holdings Ltd. | | 211 | | 1,188 | |
Chimei Innolux Corp. | | 2,253 | | 1,089 | |
China Airlines Ltd. (a) | | 1,110 | | 508 | |
Evergreen Marine Corp Taiwan Ltd. (a) | | 1,742 | | 1,228 | |
FLEXium Interconnect Inc. | | 338 | | 752 | |
Globe Union Industrial Corp. | | 1 | | — | |
Gloria Material Technology Corp. | | 808 | | 558 | |
Johnson Health Tech Co. Ltd. | | 99 | | 222 | |
MPI Corp. | | 170 | | 621 | |
Primax Electronics Ltd. | | 720 | | 873 | |
Tainan Spinning Co. Ltd. | | 648 | | 380 | |
Taiwan Paiho Ltd. | | 325 | | 438 | |
Taiwan Sanyo Electric Co. Ltd. | | 95 | | 92 | |
Toung Loong Textile Manufacturing | | 60 | | 151 | |
| | | | 9,384 | |
THAILAND - 0.5% | | | | | |
Amata Corp PCL | | 423 | | 200 | |
| | | | | |
TURKEY - 3.5% | | | | | |
Dogus Otomotiv Servis ve Ticaret A/S | | 138 | | 705 | |
Turkiye Sinai Kalkinma Bankasi A/S | | 730 | | 628 | |
| | | | 1,333 | |
Total Common Stocks (cost $40,061) | | | | 37,759 | |
| | | | | | |
See accompanying Notes to Financial Statements.
| | Shares/Par † | | Value | |
PARTICIPATORY NOTES - 1.3% | | | | | |
| | | | | |
SAUDI ARABIA - 1.3% | | | | | |
JPMorgan Structured Products BV Participatory Note (Al Khaleej Training and Education Co.) | | $ | 29 | | 495 | |
Total Participatory Notes (cost $489) | | | | 495 | |
| | | | | |
PREFERRED STOCKS - 0.5% | | | | | |
| | | | | |
BRAZIL - 0.5% | | | | | |
Banco ABC Brasil SA | | 40 | | 203 | |
Total Preferred Stocks (cost $225) | | | | 203 | |
| | | | | |
RIGHTS - 0.0% | | | | | |
| | | | | |
CHILE - 0.0% | | | | | |
Cia Sud Americana de Vapores SA (a) | | 2,623 | | 9 | |
Total Rights (cost $0) | | | | 9 | |
| | | | | |
SHORT TERM INVESTMENTS - 1.2% | | | | | |
| | | | | |
Investment Company - 0.5% | | | | | |
JNL Money Market Fund, 0.01% (c) (d) | | 178 | | 178 | |
| | | | | |
Securities Lending Collateral - 0.7% | | | | | |
BlackRock Liquidity Funds TempFund Portfolio, 0.07% (d) | | 100 | | 100 | |
Fidelity Institutional Money Market Portfolio, 0.09% (d) | | 100 | | 100 | |
Repurchase Agreement with MLP, 0.06% (Collateralized by $23 U.S. Treasury Bond, 6.25%, due 05/15/30, value $34 and $38 U.S. Treasury Note, 0.13%, due 07/15/24, value $36) acquired on 12/31/14, due 01/02/15 at $69 | | $ | 69 | | 69 | |
| | | | 269 | |
Total Short Term Investments (cost $447) | | | | 447 | |
| | | | | |
Total Investments - 101.1% (cost $41,222) | | | | 38,913 | |
Other Assets and Liabilities, Net - (1.1%) | | | | (422 | ) |
Total Net Assets - 100.0% | | | | $ | 38,491 | |
| | | | | | | |
(a) | Non-income producing security. |
(b) | All or portion of the security was on loan. |
(c) | Investment in affiliate. |
(d) | Yield changes daily to reflect current market conditions. Rate was the quoted yield as of December 31, 2014. |
Curian/BlackRock Global Long Short Credit Fund
| | Shares/Par † | | Value | |
COMMON STOCKS - 1.2% | | | | | |
| | | | | |
GERMANY - 0.1% | | | | | |
Commerzbank AG (a) | | 19 | | $ | 247 | |
| | | | | |
IRELAND - 0.1% | | | | | |
Smurfit Kappa Group Plc | | 9 | | 206 | |
| | | | | |
NETHERLANDS - 0.1% | | | | | |
NXP Semiconductors NV (a) | | 4 | | 289 | |
| | | | | |
SPAIN - 0.0% | | | | | |
Criteria CaixaCorp SA | | 36 | | 186 | |
| | | | | |
UNITED KINGDOM - 0.2% | | | | | |
Barclays Plc | | 258 | | 969 | |
| | | | | |
UNITED STATES OF AMERICA - 0.7% | | | | | |
ADT Corp. | | 4 | | 153 | |
Apple Inc. | | 6 | | 628 | |
Beazer Homes USA Inc. (a) | | 1 | | 15 | |
eBay Inc. (a) | | 14 | | 770 | |
EMC Corp. | | 13 | | 393 | |
Freescale Semiconductor Ltd. (a) | | 6 | | 147 | |
KB Home | | 2 | | 33 | |
Oracle Corp. | | 4 | | 176 | |
Outfront Media Inc. | | 1 | | 37 | |
Vantage Drilling Co. (a) | | 38 | | 18 | |
Western Union Co. | | 17 | | 304 | |
| | | | 2,674 | |
Total Common Stocks (cost $4,322) | | | | 4,571 | |
| | | | | |
NON-U.S. GOVERNMENT AGENCY ASSET-BACKED SECURITIES - 13.5% | | | | | |
| | | | | |
AUSTRALIA - 0.7% | | | | | |
Virgin Australia Trust | | | | | |
8.50%, 10/23/16 (b) | | $ | 1,020 | | 1,040 | |
7.13%, 10/23/18 (b) | | 1,179 | | 1,216 | |
6.00%, 10/23/20 (b) | | 521 | | 532 | |
| | | | 2,788 | |
CANADA - 0.2% | | | | | |
Air Canada Pass-Through Trust | | | | | |
6.63%, 05/15/18 (b) | | 350 | | 357 | |
5.38%, 05/15/21 (b) | | 397 | | 403 | |
| | | | 760 | |
CAYMAN ISLANDS - 0.1% | | | | | |
Carlyle Global Market Strategies, 6.33%, 07/20/23 (b) (c) | | 265 | | 263 | |
| | | | | |
GERMANY - 0.4% | | | | | |
German Residential Funding Plc, 4.23%, 08/27/18 (d), EUR | | 1,070 | | 1,371 | |
| | | | | |
GUERNSEY - 0.3% | | | | | |
Doric Nimrod Air Alpha Pass-Through Trust, 5.25%, 05/30/23 (b) | | 950 | | 989 | |
| | | | | |
IRELAND - 2.2% | | | | | |
ALME Loan Funding | | | | | |
1.69%, 08/15/27 (c) (d), EUR | | 1,390 | | 1,674 | |
5.39%, 08/15/27 (c) (d), EUR | | 310 | | 342 | |
6.14%, 08/15/27 (c) (d), EUR | | 250 | | 263 | |
Arbour CLO Ltd. | | | | | |
1.81%, 06/16/27 (c) (d), EUR | | 1,728 | | 2,090 | |
5.36%, 06/16/27 (c) (d), EUR | | 338 | | 373 | |
6.11%, 06/16/27 (c) (d), EUR | | 336 | | 354 | |
Avoca CLO XI Ltd., 1.83%, 07/15/27 (c) (d), EUR | | 1,100 | | 1,330 | |
Avoca CLO XIII Ltd., 5.69%, 12/29/27 (c) (d) (e), EUR | | 250 | | 283 | |
CVC Cordatus Loan Fund III Ltd., 1.85%, 07/08/27 (c) (d), EUR | | 1,280 | | 1,545 | |
Sorrento Park CLO Ltd., 6.46%, 11/16/27 (c) (d), EUR | | 250 | | 271 | |
| | | | 8,525 | |
ITALY - 0.2% | | | | | |
Berica PMI, 2.48%, 05/31/57 (c) (d), EUR | | 692 | | 850 | |
| | | | | |
NETHERLANDS - 1.7% | | | | | |
Jubilee CDO BV | | | | | |
5.30%, 01/15/24 (c), EUR | | 690 | | 389 | |
1.48%, 04/15/27 (c) (d), EUR | | 1,050 | | 1,271 | |
| | | | | | | |
See accompanying Notes to Financial Statements.
| | Shares/Par † | | Value | |
North Westerly CLO IV BV | | | | | |
1.76%, 01/15/26 (c) (d), EUR | | 2,200 | | 2,659 | |
2.99%, 01/15/26 (c) (d), EUR | | 528 | | 530 | |
St. Pauls CLO Ltd., 1.49%, 04/25/28 (c) (d), EUR | | 1,500 | | 1,813 | |
| | | | 6,662 | |
PORTUGAL - 0.5% | | | | | |
TAGUS-Sociedade de Titularizacao de Creditos SA, 2.98%, 02/16/18 (d), EUR | | 1,585 | | 1,928 | |
| | | | | |
UNITED KINGDOM - 0.3% | | | | | |
Ludgate Funding Plc, 0.70%, 01/01/61 (c) (e), GBP | | 7,770 | | 438 | |
Paragon Mortgages No. 13 Plc, 0.41%, 01/15/39 (c) (d) | | 624 | | 581 | |
| | | | 1,019 | |
UNITED STATES OF AMERICA - 6.9% | | | | | |
ALM Loan Funding | | | | | |
3.68%, 04/24/24 (b) (c) | | 480 | | 455 | |
2.98%, 01/20/26 (b) (c) | | 250 | | 239 | |
4.73%, 01/20/26 (b) (c) | | 345 | | 296 | |
ALM VI Ltd., 4.99%, 06/14/23 (b) (c) | | 250 | | 250 | |
ALM VII Ltd., 4.73%, 10/19/24 (b) (c) | | 325 | | 325 | |
American Airlines Pass-Through Trust | | | | | |
6.00%, 01/15/17 (b) | | 2,350 | | 2,388 | |
6.13%, 07/15/18 | | 1,750 | | 1,811 | |
6.98%, 05/23/21 | | 853 | | 891 | |
Ares XXV CLO Ltd., 3.38%, 01/17/24 (c) (d) | | 250 | | 245 | |
Atlas Senior Loan Fund Ltd., 2.93%, 02/17/26 (b) (c) | | 350 | | 330 | |
Babson CLO Ltd., 4.48%, 05/15/23 (b) (c) | | 500 | | 497 | |
Carlyle Global Market Strategies CLO Ltd., 5.68%, 08/10/21 (b) (c) | | 400 | | 399 | |
CDGJ Commercial Mortgage Trust REMIC, 4.41%, 11/15/16 (b) (c) | | 300 | | 300 | |
Commercial Mortgage Pass-Through Certificates REMIC, 3.66%, 06/11/19 (b) (c) | | 1,295 | | 1,290 | |
Continental Airlines Pass-Through Certificates, 6.13%, 04/29/18 | | 397 | | 412 | |
Countrywide Asset-Backed Certificates REMIC, 0.34%, 03/25/37 (c) | | 642 | | 600 | |
Credit Suisse Commercial Mortgage Trust REMIC, 5.90%, 07/15/17 (c) | | 200 | | 209 | |
DCP Rights LLC, 5.46%, 10/25/21 (b) (e) | | 270 | | 270 | |
Flatiron CLO Ltd. | | | | | |
4.73%, 10/25/24 (b) (c) | | 250 | | 249 | |
1.63%, 01/17/26 (b) (c) | | 345 | | 341 | |
Galaxy XII CLO Ltd., 2.83%, 05/19/23 (b) (c) | | 250 | | 251 | |
Hilton USA Trust REMIC, 5.22%, 11/05/18 (b) (c) | | 374 | | 383 | |
ING IM CLO Ltd., 4.98%, 10/15/22 (b) (c) | | 250 | | 248 | |
ING Investment Management Co., 2.93%, 01/18/26 (b) (c) | | 255 | | 242 | |
KKR CLO Trust, 1.38%, 07/15/25 (b) (c) | | 500 | | 488 | |
LB-UBS Commercial Mortgage Trust REMIC | | | | | |
5.85%, 06/15/38 (c) | | 290 | | 300 | |
5.48%, 02/15/40 | | 730 | | 759 | |
Madison Park Funding I Ltd., 2.98%, 10/23/25 (b) (c) | | 320 | | 307 | |
Mountain Hawk CLO Ltd., 1.39%, 07/22/24 (b) (c) | | 460 | | 450 | |
North End CLO Ltd., 3.73%, 07/17/25 (b) (c) | | 250 | | 233 | |
Octagon Investment Partners XVIII Ltd., 3.93%, 12/16/24 (b) (c) | | 250 | | 237 | |
OHA Credit Partners VI Ltd., 4.73%, 05/15/23 (b) (c) | | 350 | | 351 | |
OHA Credit Partners VII Ltd., 1.65%, 11/20/23 (b) (c) | | 315 | | 314 | |
OneMain Financial Issuance Trust, 2.43%, 08/18/17 (b) (e) | | 410 | | 410 | |
OZLM Funding Ltd., 3.43%, 07/22/25 (b) (c) | | 750 | | 687 | |
RAIT Preferred Funding II Ltd. REMIC, 0.46%, 06/25/45 (b) (c) | | 208 | | 194 | |
SLM Private Education Loan Trust | | | | | |
2.41%, 05/15/19 (b) (c) | | 630 | | 668 | |
3.00%, 12/15/19 (b) | | 360 | | 350 | |
Tyron Park CLO Ltd., 3.73%, 07/15/25 (b) (c) | | 500 | | 471 | |
United Air Lines Inc. Pass-Through Trust, 4.30%, 08/15/25 | | 860 | | 889 | |
United Airlines Pass-Through Trust, 4.63%, 09/03/22 | | 520 | | 511 | |
US Airways Pass-Through Trust | | | | | |
5.45%, 06/03/18 | | 2,700 | | 2,727 | |
8.00%, 10/01/19 | | 206 | | 232 | |
6.75%, 06/03/21 | | 627 | | 669 | |
5.38%, 11/15/21 (o) | | 1,602 | | 1,639 | |
Wachovia Bank Commercial Mortgage Trust REMIC, 5.94%, 02/15/51 (c) | | 350 | | 367 | |
| | | | 26,174 | |
Total Non-U.S. Government Agency Asset-Backed Securities (cost $53,757) | | | | 51,329 | |
| | | | | |
CORPORATE BONDS AND NOTES - 63.7% | | | | | |
| | | | | |
BARBADOS - 0.1% | | | | | |
Columbus International Inc., 7.38%, 03/30/21 (b) | | 490 | | 510 | |
| | | | | |
BRAZIL - 0.6% | | | | | |
Petrobras Global Finance BV | | | | | |
4.88%, 03/17/20 | | 550 | | 515 | |
5.38%, 10/01/29, GBP | | 145 | | 180 | |
6.63%, 01/16/34, GBP | | 420 | | 566 | |
7.25%, 03/17/44 | | 925 | | 913 | |
| | | | 2,174 | |
CANADA - 0.5% | | | | | |
1011778 BC Unltd. Liability Corp., 6.00%, 04/01/22 (b) | | 465 | | 477 | |
Air Canada, 6.75%, 10/01/19 (b) | | 875 | | 910 | |
CEVA Logisitics Term Loan, 6.50%, 03/18/21 (c) | | 9 | | 8 | |
Hudson’s Bay Co. Initial Term Loan, 4.75%, 10/07/20 (c) | | 37 | | 37 | |
NOVA Chemicals Corp., 5.00%, 05/01/25 (b) | | 120 | | 119 | |
Valeant Pharmaceuticals International, 6.75%, 08/15/18 (b) | | 393 | | 418 | |
| | | | 1,969 | |
CHILE - 0.1% | | | | | |
VTR Finance BV, 6.88%, 01/15/24 (b) | | 265 | | 270 | |
| | | | | |
CZECH REPUBLIC - 0.2% | | | | | |
CE Energy A/S, 7.00%, 02/01/21 (d), EUR | | 335 | | 404 | |
RPG Byty Sro, 6.75%, 05/01/20 (d), EUR | | 400 | | 499 | |
| | | | 903 | |
DENMARK - 0.3% | | | | | |
Nets Holdings A/S Term Loan, 4.25%, 05/14/21 (c), EUR | | 1,050 | | 1,249 | |
| | | | | |
FRANCE - 3.3% | | | | | |
AXA SA, 3.88%, (callable at 100 beginning 10/08/25) (d) (f), EUR | | 600 | | 730 | |
See accompanying Notes to Financial Statements.
| | Shares/Par † | | Value | |
BNP Paribas Cardif SA, 4.03%, (callable at 100 beginning 11/25/25) (f), EUR | | 700 | | 851 | |
BNP Paribas SA, 2.62%, 10/14/27 (c) (d), EUR | | 1,050 | | 1,278 | |
Credit Agricole SA, 3.88%, 04/15/24 (b) | | 1,075 | | 1,111 | |
Electricite de France, 5.00%, (callable at 100 beginning 01/22/26) (d) (f), EUR | | 500 | | 671 | |
Electricite de France SA, 4.25%, (callable at 100 beginning 01/29/20) (d) (f), EUR | | 500 | | 651 | |
Kerneos Tech Group SAS | | | | | |
4.83%, 03/01/21 (c) (d), EUR | | 130 | | 157 | |
5.75%, 03/01/21 (d), EUR | | 179 | | 221 | |
Lion/Seneca France 2, 7.88%, 04/15/19 (d), EUR | | 540 | | 562 | |
Numericable Group SA | | | | | |
4.88%, 05/15/19 (b) | | 475 | | 471 | |
5.38%, 05/15/22 (d), EUR | | 745 | | 930 | |
5.63%, 05/15/24 (d), EUR | | 595 | | 745 | |
6.25%, 05/15/24 (b) | | 270 | | 272 | |
Numericable Group SA Term Loan, 4.50%, 04/23/20 (c), EUR | | 720 | | 866 | |
Orange SA | | | | | |
4.00% (callable at 100 beginning 10/01/21) (d) (f), EUR | | 175 | | 220 | |
4.25% (callable at 100 beginning 02/07/20) (d) (f), EUR | | 500 | | 638 | |
5.00% (callable at 100 beginning 10/01/26) (d) (f), EUR | | 375 | | 481 | |
Plastic Omnium SA, 2.88%, 05/29/20, EUR | | 600 | | 772 | |
SGD Group SAS, 5.63%, 05/15/19 (d), EUR | | 435 | | 513 | |
THOM Europe SAS, 7.38%, 07/15/19 (d), EUR | | 450 | | 517 | |
| | | | 12,657 | |
GERMANY - 5.6% | | | | | |
Bayerische Landesbank, 0.89%, 02/07/19 (c) (d), EUR | | 600 | | 680 | |
Commerzbank AG, 7.75%, 03/16/21, EUR | | 1,500 | | 2,219 | |
Deutsche Annington Finance BV, 4.00%, (callable at 100 beginning 12/17/21) (d) (f), EUR | | 600 | | 733 | |
Deutsche Bank AG, 7.50%, (callable at 100 beginning 04/30/25) (f) | | 800 | | 768 | |
Deutsche Rastatten Grupp IV GmbH, 6.75%, 12/30/20 (d), EUR | | 100 | | 128 | |
Fresenius Finance BV, 3.00%, 02/01/21 (d), EUR | | 1,120 | | 1,462 | |
FTE Verwaltungs GmbH, 9.00%, 07/15/20 (d), EUR | | 430 | | 507 | |
Grand City Properties SA, 2.00%, 10/29/21 (d), EUR | | 400 | | 482 | |
HSH Nordbank AG | | | | | |
7.25% (callable at 100 beginning 12/30/14) (f) | | 1,400 | | 500 | |
0.88%, 02/14/17 (c), EUR | | 513 | | 511 | |
0.92%, 02/14/17 (c) (d), EUR | | 1,484 | | 1,477 | |
Mahle GmbH, 2.50%, 05/14/21 (d), EUR | | 375 | | 468 | |
Merck KGaA, 2.62%, 12/12/74 (d), EUR | | 525 | | 642 | |
Pfleiderer GmbH, 7.88%, 08/01/19 (d), EUR | | 251 | | 289 | |
Schaeffler (INA Beteiligung GmbH) Term Loan B, 4.25%, 05/15/20 (c), EUR | | 570 | | 690 | |
Schaeffler Holding Finance BV | | | | | |
6.25%, 11/15/19 (b) (g) | | 200 | | 206 | |
5.75%, 11/15/21 (d) (g), EUR | | 480 | | 619 | |
6.75%, 11/15/22 (b) (g) | | 228 | | 238 | |
Trionista Holdco GmbH, 5.00%, 04/30/20 (d), EUR | | 100 | | 125 | |
Unitymedia Hessen GmbH & Co. KG | | | | | |
5.63%, 04/15/23 (d), EUR | | 100 | | 131 | |
4.00%, 01/15/25 (d), EUR | | 1,039 | | 1,281 | |
6.25%, 01/15/29 (d), EUR | | 300 | | 412 | |
Volkswagen International Finance NV | | | | | |
5.50%, 11/09/15 (b) (h), EUR | | 400 | | 535 | |
5.50%, 11/09/15 (d) (h), EUR | | 4,700 | | 6,290 | |
| | | | 21,393 | |
INDIA - 0.1% | | | | | |
Samvardhana Motherson Automotive Systems Group BV, 4.13%, 07/15/21 (d), EUR | | 455 | | 539 | |
| | | | | |
IRELAND - 2.1% | | | | | |
Allied Irish Banks Plc, 2.75%, 04/16/19 (d), EUR | | 1,300 | | 1,654 | |
Ardagh Packaging Finance Plc, 4.25%, 01/15/22 (d), EUR | | 868 | | 1,035 | |
Bank of Ireland | | | | | |
3.25%, 01/15/19 (d), EUR | | 1,160 | | 1,505 | |
4.25%, 06/11/24 (d), EUR | | 1,800 | | 2,151 | |
DEPFA Bank Plc, 0.78%, 12/15/15 (c), EUR | | 1,472 | | 1,697 | |
| | | | 8,042 | |
ITALY - 7.5% | | | | | |
Arianna SPV Srl, 3.60%, 04/20/19 (d), EUR | | 1,619 | | 2,041 | |
Astaldi SpA, 7.13%, 12/01/20 (d), EUR | | 608 | | 751 | |
Banca Monte dei Paschi di Siena SpA | | | | | |
2.88%, 04/16/21 (d), EUR | | 1,150 | | 1,514 | |
2.88%, 07/16/25 (d), EUR | | 770 | | 1,000 | |
Banco Popolare SC, 3.50%, 03/14/19 (d), EUR | | 850 | | 1,072 | |
CNH Industrial Finance Europe SA, 2.75%, 03/18/19 (d), EUR | | 675 | | 828 | |
Enel SpA, 6.50%, 01/10/74 (d), EUR | | 500 | | 665 | |
FGA Capital Ireland Plc, 2.63%, 04/17/19 (d), EUR | | 425 | | 533 | |
Intesa Sanpaolo SpA, 3.50%, 01/17/22 (d), EUR | | 620 | | 852 | |
Mediobanca SpA, 2.25%, 03/18/19 (d), EUR | | 925 | | 1,172 | |
Rhino Bondco SpA, 7.25%, 11/15/20 (d), EUR | | 1,000 | | 1,239 | |
Snai SpA, 7.63%, 06/15/18 (d), EUR | | 170 | | 207 | |
Telecom Italia Capital SA, 7.72%, 06/04/38 | | 350 | | 390 | |
Telecom Italia Finance SA | | | | | |
6.13%, 11/15/16 (d) (h), EUR | | 3,000 | | 4,254 | |
7.75%, 01/24/33, EUR | | 910 | | 1,460 | |
Telecom Italia SpA | | | | | |
4.50%, 01/25/21 (d), EUR | | 400 | | 529 | |
5.88%, 05/19/23, GBP | | 550 | | 930 | |
UniCredit SpA | | | | | |
6.75% (callable at 100 beginning 09/10/21) (d) (f), EUR | | 200 | | 234 | |
3.25%, 01/14/21 (d), EUR | | 1,580 | | 2,091 | |
6.95%, 10/31/22 (d), EUR | | 620 | | 882 | |
5.75%, 10/28/25 (d), EUR | | 1,970 | | 2,576 | |
Unione di Banche Italiane SCpA, 2.88%, 02/18/19 (d), EUR | | 900 | | 1,160 | |
Wind Acquisition Finance SA | | | | | |
4.00%, 07/15/20 (d), EUR | | 1,453 | | 1,725 | |
4.08%, 07/15/20 (c) (d), EUR | | 370 | | 427 | |
| | | | 28,532 | |
JAMAICA - 0.1% | | | | | |
Digicel Ltd., 6.00%, 04/15/21 (b) | | 252 | | 236 | |
| | | | | |
JERSEY - 0.4% | | | | | |
Atrium European Real Estate Ltd., 4.00%, 04/20/20 (d), EUR | | 800 | | 1,030 | |
Enterprise Funding Ltd., 3.50%, 09/10/20 (d) (h), GBP | | 300 | | 430 | |
| | | | 1,460 | |
See accompanying Notes to Financial Statements.
| | Shares/Par † | | Value | |
LUXEMBOURG - 2.1% | | | | | |
Aguila 3 SA, 7.88%, 01/31/18 (b) | | 440 | | 426 | |
Altice Financing SA, 6.50%, 01/15/22 (b) | | 350 | | 342 | |
Altice SA | | | | | |
7.25%, 05/15/22 (d), EUR | | 1,115 | | 1,366 | |
7.75%, 05/15/22 (b) | | 280 | | 280 | |
APERAM, 0.63%, 07/08/21 (d) (h) | | 800 | | 795 | |
Atalaya Luxco, 11.50%, 05/30/20 (d) (e) (g) (i), EUR | | 897 | | 1,118 | |
Avago Technologies Term Loan, 3.75%, 04/01/21 (c) | | 672 | | 669 | |
Bilbao Luxembourg SA, 10.50%, 12/01/18 (d) (g), EUR | | 317 | | 399 | |
Intralot Finance Luxembourg SA, 9.75%, 08/15/18 (d), EUR | | 700 | | 867 | |
IVS F. SpA, 7.13%, 04/01/20 (d), EUR | | 110 | | 136 | |
Mallinckrodt International Finance SA Term Loan B, 3.25%, 02/24/21 (c) | | 203 | | 199 | |
Siemens Audiology Solutions Term Loan B, 0.00%, 12/31/21 (j), EUR | | 430 | | 522 | |
Telenet Finance V Luxembourg SCA, 6.25%, 08/15/22 (d), EUR | | 100 | | 132 | |
Xefin Lux SCA, 3.83%, 06/01/19 (c) (d), EUR | | 705 | | 853 | |
| | | | 8,104 | |
MEXICO - 0.3% | | | | | |
Cemex SAB de CV | | | | | |
4.75%, 01/11/22 (d), EUR | | 585 | | 693 | |
5.70%, 01/11/25 (b) | | 390 | | 378 | |
| | | | 1,071 | |
NETHERLANDS - 1.9% | | | | | |
Achmea BV, 6.00%, 04/04/43 (c) (d), EUR | | 200 | | 276 | |
Achmea Hypotheekbank NV, 2.75%, 02/18/21 (d), EUR | | 500 | | 664 | |
Action Holding BV Term Loan B, 0.00%, 01/31/21 (j), EUR | | 680 | | 823 | |
Bureau Van Dijk Term Loan B | | | | | |
4.19%, 09/15/21 (c), EUR | | 465 | | 562 | |
5.22%, 09/15/21 (c), GBP | | 270 | | 419 | |
CEVA Logisitics Term Loan, 6.50%, 03/18/21 (c) | | 51 | | 48 | |
Constellium NV, 8.00%, 01/15/23 (b) | | 250 | | 249 | |
Hema Bondco I BV, 6.25%, 06/15/19 (d), EUR | | 100 | | 102 | |
NXP BV | | | | | |
3.75%, 06/01/18 (b) | | 1,140 | | 1,140 | |
5.75%, 02/15/21 (b) | | 200 | | 210 | |
NXP Semiconductor NV, 1.00%, 12/01/19 (b) (h) | | 550 | | 563 | |
TMF Group Holding BV, 9.88%, 12/01/19 (d), EUR | | 320 | | 398 | |
Ziggo BV Term Loan B-1, 3.50%, 01/15/22 (c), EUR | | 483 | | 572 | |
Ziggo BV Term Loan B-2, 3.50%, 01/15/22 (c), EUR | | 311 | | 369 | |
Ziggo BV Term Loan B-3, 3.75%, 01/15/22 (c), EUR | | 875 | | 1,036 | |
| | | | 7,431 | |
POLAND - 0.2% | | | | | |
Play Finance 1 SA, 6.50%, 08/01/19 (d), EUR | | 310 | | 398 | |
Play Finance 2 SA, 5.25%, 02/01/19 (d), EUR | | 170 | | 213 | |
| | | | 611 | |
PORTUGAL - 1.1% | | | | | |
Banco Espirito Santo SA | | | | | |
2.63%, 05/08/17 (d), EUR | | 400 | | 450 | |
4.75%, 01/15/18 (d), EUR | | 900 | | 1,067 | |
4.00%, 01/21/19 (d), EUR | | 900 | | 1,054 | |
Galp Energia SGPS SA | | | | | |
4.13%, 01/25/19, EUR | | 800 | | 1,007 | |
3.00%, 01/14/21 (d), EUR | | 700 | | 834 | |
| | | | 4,412 | |
SPAIN - 4.5% | | | | | |
Abengoa Finance SAU, 6.00%, 03/31/21 (d), EUR | | 209 | | 215 | |
Aldesa Financial Services SA, 7.25%, 04/01/21 (d), EUR | | 195 | | 199 | |
Banco Bilbao Vizcaya Argentaria SA | | | | | |
7.00% (callable at 100 beginning 02/19/19) (d) (f), EUR | | 600 | | 740 | |
9.00% (callable at 100 beginning 05/09/18) (d) (f) | | 600 | | 642 | |
Banco Popular Espanol SA, 11.50%, (callable at 100 beginning 10/10/18) (d) (f), EUR | | 700 | | 964 | |
Banco Santander SA, 6.25%, (callable at 100 beginning 03/12/19) (d) (f), EUR | | 400 | | 472 | |
Bankia SA | | | | | |
3.50%, 01/17/19 (d), EUR | | 2,400 | | 3,134 | |
4.00%, 05/22/24 (d), EUR | | 2,900 | | 3,428 | |
BPE Financiaciones SA, 2.50%, 02/01/17 (d), EUR | | 700 | | 864 | |
CaixaBank SA | | | | | |
4.50%, 11/22/16 (d) (h), EUR | | 1,100 | | 1,200 | |
5.00%, 11/14/23 (d), EUR | | 900 | | 1,168 | |
Cirsa Funding Luxembourg SA, 8.75%, 05/15/18 (d), EUR | | 190 | | 236 | |
Gas Natural Fenosa Finance BV, 4.12%, (callable at 100 beginning 11/18/22) (d) (f), EUR | | 400 | | 497 | |
PortAventura Entertainment Barcelona BV, 7.25%, 12/01/20 (d), EUR | | 416 | | 519 | |
Telefonica Europe BV | | | | | |
4.20% (callable at 100 beginning 12/04/19) (d) (f), EUR | | 800 | | 980 | |
5.00% (callable at 100 beginning 03/31/20) (d) (f), EUR | | 500 | | 631 | |
Telefonica SA, 6.00%, 07/24/17 (d) (h), EUR | | 1,000 | | 1,243 | |
| | | | 17,132 | |
SWEDEN - 0.2% | | | | | |
Volvo Treasury AB, 4.20%, 06/10/75 (d), EUR | | 600 | | 727 | |
| | | | | |
SWITZERLAND - 0.8% | | | | | |
Credit Suisse AG, 5.75%, 09/18/25 (d), EUR | | 280 | | 383 | |
Credit Suisse Group AG, 6.25%, (callable at 100 beginning 12/18/24) (b) (f) | | 975 | | 938 | |
UBS AG | | | | | |
4.75%, 05/22/23 (d) | | 300 | | 303 | |
5.13%, 05/15/24 (d) | | 775 | | 778 | |
4.75%, 02/12/26 (d), EUR | | 665 | | 861 | |
| | | | 3,263 | |
UNITED KINGDOM - 4.2% | | | | | |
AA Bond Co. Ltd., 9.50%, 07/31/19 (d), GBP | | 390 | | 668 | |
Annington Finance No. 5 Plc, 13.00%, 01/15/23 (d) (g), GBP | | 300 | | 580 | |
Barclays Plc | | | | | |
8.00% (callable at 100 beginning 12/15/20) (f), EUR | | 675 | | 850 | |
8.25% (callable at 100 beginning 12/15/18) (f) | | 498 | | 510 | |
Bestway UK Holdco Ltd. Term Loan B, 5.39%, 09/25/21 (c), GBP | | 560 | | 872 | |
See accompanying Notes to Financial Statements.
| | Shares/Par † | | Value | |
Boparan Finance Plc, 4.38%, 07/15/21 (d), EUR | | 105 | | 106 | |
CEVA Group Plc Term Loan | | | | | |
6.50%, 03/12/21 (c) | | 71 | | 66 | |
6.50%, 03/12/21 (c) | | 49 | | 46 | |
Coventry Building Society, 6.37%, (callable at 100 beginning 11/01/19) (d) (f), GBP | | 200 | | 298 | |
Debenhams Plc, 5.25%, 07/15/21 (d), GBP | | 300 | | 455 | |
HBOS Capital Funding LP, 6.85%, (callable at 100 beginning 12/23/14) (f) | | 130 | | 131 | |
House of Fraser Funding Plc, 8.88%, 08/15/18 (d), GBP | | 363 | | 594 | |
Iglo Foods Midco Ltd. Term Loan, 5.25%, 06/30/20 (c), GBP | | 518 | | 776 | |
Lloyds Banking Group Plc, 6.37%, (callable at 100 beginning 06/27/20) (d) (f), EUR | | 949 | | 1,167 | |
Marks & Spencer Plc, 4.75%, 06/12/25 (d), GBP | | 260 | | 446 | |
Pension Insurance Corp. Plc, 6.50%, 07/03/24 (d), GBP | | 175 | | 281 | |
Punch Taverns Finance B Ltd., 5.94%, 09/30/22, GBP | | 280 | | 432 | |
Punch Taverns Finance Plc | | | | | |
0.56%, 07/15/21 (c) (d), GBP | | 720 | | 988 | |
6.06%, 10/15/27 (c) (d) (i), GBP | | 528 | | 798 | |
RAC Finance Holdings Ltd. Term Loan | | | | | |
0.00%,11/30/21 (j), GBP | | 980 | | 1,518 | |
0.00%,11/30/22 (j), GBP | | 490 | | 765 | |
Saga Mid Co. Ltd. Term Loan, 0.00%, 04/25/19 (j), GBP | | 673 | | 986 | |
Virgin Media Investment Holdings Ltd. Term Loan, 4.25%, 06/30/23 (c), GBP | | 660 | | 1,014 | |
Virgin Media Secured Finance Plc, 6.00%, 04/15/21 (d), GBP | | 105 | | 172 | |
Vougeot Bidco Plc, 7.88%, 07/15/20 (d), GBP | | 378 | | 610 | |
Voyage Care Bondco Plc, 11.00%, 02/01/19 (d), GBP | | 450 | | 750 | |
| | | | 15,879 | |
UNITED STATES OF AMERICA - 27.4% | | | | | |
Actavis Funding SCS | | | | | |
3.85%, 06/15/24 | | 870 | | 874 | |
4.85%, 06/15/44 | | 92 | | 93 | |
Activision Blizzard Inc. Term Loan B, 3.25%, 09/15/20 (c) | | 275 | | 275 | |
ADT Corp. | | | | | |
2.25%, 07/15/17 | | 75 | | 73 | |
4.13%, 04/15/19 | | 87 | | 86 | |
5.25%, 03/15/20 | | 273 | | 276 | |
Advanced Micro Devices Inc., 6.75%, 03/01/19 | | 95 | | 89 | |
Advantage Sales and Marketing Inc. Term Loan | | | | | |
4.25%, 07/07/20 (c) | | 9 | | 9 | |
4.25%, 07/07/20 (c) | | 270 | | 267 | |
AECOM Technology Corp. | | | | | |
5.75%, 10/15/22 (b) | | 207 | | 212 | |
5.88%, 10/15/24 (b) | | 140 | | 143 | |
Alcatel-Lucent USA Inc, 6.75%, 11/15/20 (b) | | 365 | | 385 | |
Alliance Laundry Systems Term Loan B, 4.25%, 04/20/20 (c) | | 217 | | 214 | |
Ally Financial Inc, 5.13%, 09/30/24 | | 325 | | 330 | |
Ally Financial Inc. | | | | | |
3.75%, 11/18/19 | | 275 | | 271 | |
8.00%, 11/01/31 | | 188 | | 240 | |
AMAYA Holdings BV Term Loan | | | | | |
5.00%, 07/29/21 (c) | | 274 | | 271 | |
8.00%, 07/28/22 (c) | | 385 | | 379 | |
American Builders & Contractors Supply Co. Inc. Term Loan, 3.50%, 04/16/20 (c) | | 97 | | 94 | |
American Capital Ltd., 6.50%, 09/15/18 (b) | | 567 | | 593 | |
American Energy Marcellus Term Loan, 8.50%, 07/07/21 (c) (e) | | 757 | | 689 | |
Amsurg Corp., 5.63%, 07/15/22 (b) | | 478 | | 490 | |
Anadarko Petroleum Corp., 0.00%, 10/10/36 (k) | | 8,370 | | 3,175 | |
Anixter Inc., 5.13%, 10/01/21 | | 575 | | 575 | |
Antero Resources Corp., 5.13%, 12/01/22 (b) | | 200 | | 189 | |
ARC Properties Operating Partnership LP, 2.00%, 02/06/17 | | 100 | | 95 | |
Arysta Lifescience Corp. Term Loan B, 4.50%, 05/20/20 (c) | | 182 | | 181 | |
AT&T Inc., 0.00%, 11/27/22 (b) (k) | | 3,000 | | 2,339 | |
B/E Aerospace Inc. Term Loan, 4.00%, 11/12/21 (c) | | 115 | | 114 | |
Bank of America Corp. | | | | | |
6.25% (callable at 100 beginning 09/05/24) (f) | | 1,725 | | 1,705 | |
6.50% (callable at 100 beginning 10/23/24) (f) | | 1,110 | | 1,130 | |
Barrick Gold Corp., 4.10%, 05/01/23 | | 1,470 | | 1,431 | |
Becton Dickinson and Co., 2.68%, 12/15/19 | | 380 | | 385 | |
Belden Inc., 5.50%, 04/15/23 (d), EUR | | 406 | | 510 | |
Berkshire Hathaway Energy Co. | | | | | |
2.40%, 02/01/20 (b) | | 500 | | 498 | |
3.50%, 02/01/25 (b) | | 485 | | 488 | |
Beverage Packaging Holdings Luxembourg II SA, 6.00%, 06/15/17 (b) | | 227 | | 221 | |
Biomet Inc. Incremental Term Loan, 3.66%, 07/25/17 (c) | | 181 | | 180 | |
BJ’s Wholesale Club Term Loan, 4.50%, 09/26/19 (c) | | 288 | | 282 | |
Blackstone CQP Holdco LP, 9.30% , 03/31/19 (d) (i) | | 642 | | 640 | |
BMC Software Finance Inc., 8.13%, 07/15/21 (b) | | 60 | | 56 | |
BMC Software Finance Inc. Term Loan, 5.00%, 08/09/20 (c) | | 296 | | 287 | |
Bright Horizons Family Solutions LLC Term Loan B, 3.75%, 01/30/20 (c) | | 246 | | 242 | |
Brocade Communications Systems Inc., 4.63%, 01/15/23 | | 125 | | 120 | |
Building Materials Corp. of America, 5.38%, 11/15/24 (b) | | 430 | | 429 | |
Burger King NewCo Term Loan B, 4.50%, 09/23/21 (c) | | 395 | | 393 | |
Caesars Entertainment Corp. Term Loan, 9.75%, 01/28/18 (c) | | 736 | | 635 | |
Caesars Entertainment Operating Co. 1st Lien Term Loan, 6.99%, 01/28/18 (c) | | 386 | | 337 | |
Caesars Entertainment Operating Co. Inc., 9.00%, 02/15/20 | | 346 | | 256 | |
Caesars Entertainment Resort Properties LLC Term Loan B, 7.00%, 09/17/20 (c) | | 975 | | 907 | |
California Resources Corp. | | | | | |
5.50%, 09/15/21 (b) | | 385 | | 329 | |
6.00%, 11/15/24 (b) | | 613 | | 518 | |
Calpine Corp. | | | | | |
5.38%, 01/15/23 | | 516 | | 521 | |
5.75%, 01/15/25 | | 546 | | 553 | |
Catalent Pharma Solutions Inc. Term Loan, 4.25%, 04/30/21 (c) | | 224 | | 222 | |
CCOH Safari LLC | | | | | |
5.50%, 12/01/22 | | 326 | | 331 | |
5.75%, 12/01/24 | | 453 | | 458 | |
See accompanying Notes to Financial Statements.
| | Shares/Par † | | Value | |
CDK Global Inc., 4.50%, 10/15/24 (b) | | 500 | | 507 | |
CDW LLC, 5.50%, 12/01/24 | | 336 | | 336 | |
Cengage Learning Acquisitions Inc. Term Loan, 7.00%, 02/20/20 (c) | | 760 | | 752 | |
Charter Communications Term Loan, 4.25%, 08/12/21 (c) | | 830 | | 835 | |
Citigroup Inc. | | | | | |
5.90% (callable at 100 beginning 02/15/23) (f) | | 436 | | 425 | |
5.95% (callable at 100 beginning 01/30/23) (f) | | 554 | | 546 | |
Coinmach Corp. Term Loan, 4.25%, 11/14/19 (c) | | 370 | | 364 | |
Community Health Systems Inc. Term Loan D, 4.25%, 01/15/21 (c) | | 525 | | 523 | |
Concho Resources Inc., 5.50%, 04/01/23 | | 190 | | 191 | |
CONSOL Energy Inc., 5.88%, 04/15/22 (b) | | 215 | | 200 | |
Constellation Brands Inc., 3.88%, 11/15/19 | | 158 | | 159 | |
Continental Building Products LLC Term Loan B, 4.00%, 08/14/20 (c) | | 233 | | 229 | |
Continental Resources Inc., 4.90%, 06/01/44 | | 50 | | 42 | |
Cox Communications Inc., 3.85%, 02/01/25 (b) | | 2,273 | | 2,294 | |
CPG International Inc. Term Loan, 4.75%, 09/13/20 (c) | | 370 | | 364 | |
D.R. Horton Inc., 3.75%, 03/01/19 | | 325 | | 322 | |
Dell Inc. Term Loan B, 3.75%, 09/24/18 (c) | | 793 | | 789 | |
DIRECTV Holdings LLC, 3.95%, 01/15/25 | | 1,495 | | 1,507 | |
DISH DBS Corp., 5.88%, 11/15/24 (b) | | 276 | | 277 | |
Dynegy Finance I Inc. | | | | | |
6.75%, 11/01/19 (b) | | 500 | | 509 | |
7.38%, 11/01/22 (b) | | 495 | | 504 | |
Eastman Chemical Co., 4.65%, 10/15/44 | | 1,150 | | 1,177 | |
Energy Future Intermediate Holding Co. LLC Term Loan, 4.25%, 04/28/16 (c) | | 230 | | 230 | |
Equinix Inc. | | | | | |
5.38%, 01/01/22 | | 361 | | 364 | |
5.75%, 01/01/25 | | 250 | | 252 | |
Fifth Third Bancorp, 5.10%, (callable at 100 beginning 06/30/23) (f) | | 1,100 | | 1,019 | |
First Data Corp. New Term Loan, 3.66%, 03/24/17 (c) | | 110 | | 108 | |
First Data Corp. Replacement Term Loan, 3.67%, 03/23/18 (c) | | 1,030 | | 1,009 | |
First Data Corp. Term Loan B, 3.67%, 09/24/18 (c) | | 25 | | 24 | |
Florida East Coast Holdings Corp., 6.75%, 05/01/19 (b) | | 500 | | 495 | |
Forest Laboratories Inc., 5.00%, 12/15/21 (b) | | 1,320 | | 1,429 | |
Freeport-McMoRan Inc. | | | | | |
4.00%, 11/14/21 | | 284 | | 281 | |
4.55%, 11/14/24 | | 1,074 | | 1,043 | |
Freescale Semiconductor Inc., 5.00%, 05/15/21 (b) | | 250 | | 250 | |
Freescale Semiconductor Inc. Term Loan B-5, 5.00%, 01/15/21 (c) | | 202 | | 202 | |
Frontier Communications Corp., 6.25%, 09/15/21 | | 145 | | 146 | |
Gannett Co. Inc. | | | | | |
4.88%, 09/15/21 (b) | | 250 | | 248 | |
5.50%, 09/15/24 (b) | | 110 | | 110 | |
Gas Natural Fenosa Term Loan, 5.02%, 07/31/21 (c), EUR | | 1,000 | | 1,204 | |
Gates Global LLC, 5.75%, 07/15/22 (d), EUR | | 100 | | 112 | |
Gates Global LLC US Term Loan B, 4.25%, 07/03/21 (c) | | 554 | | 538 | |
General Motors Co., 5.20%, 04/01/45 | | 355 | | 375 | |
Genworth Financial Inc. | | | | | |
6.52%, 05/22/18 | | 780 | | 795 | |
7.70%, 06/15/20 | | 290 | | 289 | |
Genworth Holdings Inc. | | | | | |
7.20%, 02/15/21 | | 1,108 | | 1,079 | |
4.90%, 08/15/23 | | 150 | | 121 | |
Greektown Holdings LLC, 8.88%, 03/15/19 (b) | | 190 | | 190 | |
Grifols Worldwide Operations USA Inc. Term Loan, 3.17%, 03/03/21 (c) | | 496 | | 488 | |
HCA Inc. | | | | | |
4.25%, 10/15/19 | | 565 | | 573 | |
5.25%, 04/15/25 | | 665 | | 695 | |
HD Supply Inc. | | | | | |
7.50%, 07/15/20 | | 212 | | 222 | |
5.25%, 12/15/21 (b) | | 580 | | 590 | |
Hilton Worldwide Inc. Term Loan B, 3.50%, 09/23/20 (c) | | 660 | | 651 | |
Hospira Inc., 5.20%, 08/12/20 | | 830 | | 890 | |
Huntington Ingalls Industries Inc., 5.00%, 12/15/21 (b) | | 281 | | 286 | |
Huntsman International LLC, 5.13%, 11/15/22 (b) | | 75 | | 74 | |
Icahn Enterprises LP, 5.88%, 02/01/22 | | 280 | | 281 | |
IMS Health Inc. Term Loan B, 3.50%, 03/05/21 (c) | | 337 | | 329 | |
ING US Inc., 5.65%, 05/15/53 (c) | | 1,615 | | 1,599 | |
Ingersoll-Rand Luxembourg Finance SA, 3.55%, 11/01/24 | | 475 | | 472 | |
Interactive Data Corp. Term Loan, 4.75%, 04/30/21 (c) | | 299 | | 296 | |
J. Crew Group Inc. New Term Loan B, 4.00%, 02/26/21 (c) | | 169 | | 159 | |
Jefferies Group LLC, 6.50%, 01/20/43 | | 537 | | 548 | |
JPMorgan Chase & Co. | | | | | |
5.00% (callable at 100 beginning 07/01/19) (f) | | 600 | | 587 | |
6.10% (callable at 100 beginning 10/01/24) (f) | | 500 | | 499 | |
6.12% (callable at 100 beginning 04/30/24) (f) | | 360 | | 359 | |
6.75% (callable at 100 beginning 02/01/24) (f) | | 1,521 | | 1,607 | |
KLA-Tencor Corp., 4.65%, 11/01/24 | | 1,895 | | 1,962 | |
La Quinta Intermediate Holdings LLC Term Loan B, 4.00%, 02/18/21 (c) | | 543 | | 535 | |
Lennar Corp., 4.50%, 11/15/19 | | 373 | | 370 | |
Level 3 Financing Inc., 6.13%, 01/15/21 | | 549 | | 568 | |
Level 3 Financing Inc. Term Loan B-5, 4.50%, 01/31/22 (c) | | 250 | | 250 | |
MacDermid Inc. Term Loan, 4.00%, 06/15/20 (c) | | 493 | | 482 | |
Mallinckrodt International Finance SA, 5.75%, 08/01/22 (b) | | 300 | | 308 | |
Meccanica Holdings USA Inc. | | | | | |
6.25%, 07/15/19 (b) | | 510 | | 556 | |
7.38%, 07/15/39 (b) | | 230 | | 237 | |
6.25%, 01/15/40 (b) | | 1,120 | | 1,064 | |
Medtronic Inc. | | | | | |
2.50%, 03/15/20 (b) | | 1,225 | | 1,228 | |
3.15%, 03/15/22 (b) | | 605 | | 615 | |
Micron Technology Inc., 5.50%, 02/01/25 (b) | | 1,015 | | 1,025 | |
Mitchell International Inc. Term Loan B, 4.50%, 09/27/20 (c) | | 184 | | 181 | |
Mondelez International Inc. Term Loan B-1, 4.25%, 07/04/21 (c), EUR | | 1,730 | | 2,082 | |
See accompanying Notes to Financial Statements.
| | Shares/Par † | | Value | |
Morgan Stanley | | | | | |
5.45% (callable at 100 beginning 07/15/19) (f) | | 1,685 | | 1,688 | |
2.38%, 03/31/21, EUR | | 910 | | 1,183 | |
MSCI Inc., 5.25%, 11/15/24 (b) | | 238 | | 246 | |
Neiman Marcus Group Inc. Term Loan, 4.25%, 10/25/20 (c) | | 366 | | 358 | |
Northwest Florida Timber Finance LLC, 4.75%, 03/04/29 (b) | | 605 | | 612 | |
Nuance Communications Inc., 5.38%, 08/15/20 (b) | | 85 | | 85 | |
Och-Ziff Finance Co. LLC, 4.50%, 11/20/19 (b) | | 365 | | 360 | |
Offshore Group Investment Ltd. Term Loan, 5.75%, 03/28/19 (c) | | 103 | | 77 | |
Omnicare Inc. | | | | | |
4.75%, 12/01/22 | | 38 | | 38 | |
5.00%, 12/01/24 | | 24 | | 25 | |
Ortho-Clinical Diagnostics Inc. 1st Lien Term Loan, 4.75%, 04/29/21 (c) | | 224 | | 220 | |
Owens-Brockway Glass Container Inc., 5.00%, 01/15/22 (b) | | 250 | | 255 | |
Oxea Finance & Cy SCA Term Loan, 8.25%, 07/15/20 (c) | | 90 | | 85 | |
Oxea Finance & Cy SCA Term Loan B-2, 4.25%, 11/30/19 (c) | | 505 | | 482 | |
Par Pharmaceutical Companies Inc. Term Loan, 4.00%, 09/28/19 (c) | | 247 | | 240 | |
Party City Holdings Inc. Term Loan, 4.00%, 07/27/19 (c) | | 639 | | 624 | |
Pinnacle Foods Finance LLC Term Loan G, 3.50%, 04/15/20 (c) | | 432 | | 419 | |
QVC Inc. | | | | | |
3.13%, 04/01/19 | | 230 | | 230 | |
4.85%, 04/01/24 | | 1,025 | | 1,044 | |
Radian Group Inc., 5.50%, 06/01/19 | | 930 | | 953 | |
RBS Global Inc. and Rexnord Corp. Term Loan B, 4.00%, 08/15/20 (c) | | 227 | | 222 | |
Realogy Group LLC, 7.63%, 01/15/20 (b) | | 186 | | 199 | |
Regency Energy Partners LP, 5.00%, 10/01/22 | | 340 | | 321 | |
Reynolds American Inc., 4.75%, 11/01/42 | | 1,690 | | 1,640 | |
Reynolds Group Holdings Inc. New Dollar Term Loan, 4.00%, 11/26/18 (c) | | 99 | | 97 | |
RSP Permian Inc., 6.63%, 10/01/22 (b) | | 174 | | 162 | |
Sabine Pass Liquefaction LLC | | | | | |
5.63%, 02/01/21 (l) | | 174 | | 171 | |
6.25%, 03/15/22 | | 276 | | 280 | |
5.75%, 05/15/24 | | 100 | | 98 | |
Sabine Pass LNG LP, 7.50%, 11/30/16 | | 118 | | 123 | |
Sabre Inc. Term Loan B, 4.00%, 02/19/19 (c) | | 275 | | 269 | |
Salix Pharmaceuticals Ltd., 6.00%, 01/15/21 (b) | | 475 | | 484 | |
Salix Pharmaceuticals Ltd. Term Loan, 4.25%, 01/02/20 (c) | | 434 | | 428 | |
Sanchez Energy Corp., 6.13%, 01/15/23 (b) | | 247 | | 207 | |
SBA Communications Corp., 4.88%, 07/15/22 (b) | | 275 | | 265 | |
Seagate HDD Cayman, 4.75%, 01/01/25 (b) | | 520 | | 537 | |
Sealed Air Corp., 5.13%, 12/01/24 (b) | | 252 | | 255 | |
Sequa Corp. Term Loan, 5.25%, 05/15/17 (c) | | 563 | | 546 | |
ServiceMaster Co LLC Term Loan, 4.25%, 06/24/21 (c) | | 529 | | 518 | |
Sprint Communications Inc., 9.00%, 11/15/18 (b) | | 189 | | 215 | |
Sprint Corp. | | | | | |
7.88%, 09/15/23 | | 500 | | 494 | |
7.13%, 06/15/24 | | 207 | | 193 | |
State Street Capital Trust IV, 1.24%, 06/15/37 (c) | | 1,810 | | 1,502 | |
Steel Dynamics Inc., 5.13%, 10/01/21 (b) | | 275 | | 280 | |
Surgery Center Holding Corp. Term Loan, 5.25%, 07/16/20 (c) | | 85 | | 83 | |
T-Mobile USA Inc. | | | | | |
6.63%, 04/28/21 | | 172 | | 177 | |
6.73%, 04/28/22 | | 79 | | 81 | |
6.00%, 03/01/23 | | 81 | | 81 | |
6.50%, 01/15/24 | | 240 | | 246 | |
6.38%, 03/01/25 | | 340 | | 345 | |
Tenet Healthcare Corp. | | | | | |
5.00%, 03/01/19 (b) | | 375 | | 375 | |
6.00%, 10/01/20 | | 247 | | 265 | |
8.13%, 04/01/22 | | 324 | | 362 | |
Tesoro Logistics LP, 6.25%, 10/15/22 (b) | | 112 | | 112 | |
TIBCO Software Inc. Term Loan, 6.50%, 11/24/20 (c) | | 315 | | 305 | |
TransDigm Inc. | | | | | |
6.00%, 07/15/22 | | 230 | | 229 | |
6.50%, 07/15/24 | | 300 | | 301 | |
Travelport Finance SARL Term Loan B, 6.00%, 08/11/21 (c) | | 645 | | 643 | |
Twitter Inc., 1.00%, 09/15/21 (b) (h) | | 140 | | 122 | |
Ultra Petroleum Corp., 5.75%, 12/15/18 (b) | | 184 | | 170 | |
Union Pacific Railroad Co. Pass-Through Trust, 3.23%, 05/14/26 | | 500 | | 502 | |
Univision Communications Inc. Replacement 1st Lien Term Loan, 4.00%, 03/01/20 (c) | | 297 | | 290 | |
Valeant Pharmaceuticals International Inc. Term Loan, 3.50%, 12/11/19 (c) | | 172 | | 171 | |
Verizon Communications Inc. | | | | | |
5.15%, 09/15/23 | | 2,260 | | 2,496 | |
3.50%, 11/01/24 | | 200 | | 196 | |
4.40%, 11/01/34 | | 675 | | 671 | |
Weyerhaeuser Real Estate Co. | | | | | |
4.38%, 06/15/19 (b) | | 200 | | 197 | |
5.88%, 06/15/24 (b) | | 135 | | 135 | |
Williams Cos. Inc., 4.55%, 06/24/24 | | 1,725 | | 1,604 | |
Wilsonart LLC Initial Term Loan, 4.00%, 11/01/19 (c) | | 295 | | 286 | |
Wise Metals Group LLC, 8.75%, 12/15/18 (b) | | 455 | | 478 | |
WPX Energy Inc., 6.00%, 01/15/22 | | 100 | | 96 | |
WR Grace & Co-Conn, 5.13%, 10/01/21 (b) | | 110 | | 113 | |
| | | | 104,380 | |
VENEZUELA - 0.1% | | | | | |
Petroleos de Venezuela SA | | | | | |
5.25%, 04/12/17 (d) | | 330 | | 148 | |
6.00%, 11/15/26 (d) | | 300 | | 110 | |
| | | | 258 | |
Total Corporate Bonds and Notes (cost $251,592) | | | | 243,202 | |
| | | | | |
GOVERNMENT AND AGENCY OBLIGATIONS - 9.6% | | | | | |
| | | | | |
CROATIA - 0.1% | | | | | |
Croatia Government International Bond, 3.88%, 05/30/22 (d), EUR | | 260 | | 323 | |
| | | | | |
HUNGARY - 0.1% | | | | | |
Hungary Government International Bond, 5.38%, 03/25/24 | | 320 | | 346 | |
| | | | | |
INDONESIA - 0.2% | | | | | |
Indonesia Government International Bond | | | | | |
2.88%, 07/08/21 (d), EUR | | 260 | | 318 | |
6.75%, 01/15/44 (d) | | 290 | | 359 | |
| | | | 677 | |
See accompanying Notes to Financial Statements.
| | Shares/Par † | | Value | |
ITALY - 0.8% | | | | | |
Italy Buoni Poliennali Del Tesoro | | | | | |
5.50%, 11/01/22, EUR | | 800 | | 1,245 | |
2.50%, 12/01/24, EUR | | 1,510 | | 1,928 | |
| | | | 3,173 | |
PORTUGAL - 0.5% | | | | | |
Portugal Government International Bond | | | | | |
3.50%, 03/25/15 (d) | | 1,250 | | 1,259 | |
5.13%, 10/15/24 (d) | | 725 | | 762 | |
| | | | 2,021 | |
ROMANIA - 0.1% | | | | | |
Romania Government International Bond, 3.63%, 04/24/24 (d), EUR | | 240 | | 318 | |
| | | | | |
RUSSIAN FEDERATION - 0.2% | | | | | |
Russia Government International Bond, 7.50%, 03/31/30 (d) | | 655 | | 679 | |
| | | | | |
SERBIA - 0.1% | | | | | |
Republic of Serbia, 5.88%, 12/03/18 (d) | | 320 | | 334 | |
| | | | | |
SLOVENIA - 0.1% | | | | | |
Slovenia Government Bond, 4.63%, 09/09/24 (d), EUR | | 240 | | 353 | |
| | | | | |
UNITED STATES OF AMERICA - 7.4% | | | | | |
U.S. Treasury Bond | | | | | |
3.38%, 05/15/44 | | 2,010 | | 2,264 | |
3.13%, 08/15/44 | | 3,294 | | 3,546 | |
3.00%, 11/15/44 | | 15 | | 16 | |
U.S. Treasury Note | | | | | |
1.00%, 09/15/17 - 12/15/17 | | 5,035 | | 5,025 | |
1.75%, 09/30/19 | | 8 | | 8 | |
1.50%, 11/30/19 (o) | | 9,978 | | 9,912 | |
1.88%, 11/30/21 | | 135 | | 134 | |
2.13%, 12/31/21 | | 430 | | 434 | |
2.25%, 11/15/24 | | 6,782 | | 6,828 | |
| | | | 28,167 | |
VENEZUELA - 0.0% | | | | | |
Venezuela Government International Bond, 11.75%, 10/21/26 (d) | | 100 | | 49 | |
Total Government and Agency Obligations
(cost $36,451) | | | | 36,440 | |
| | | | | |
TRUST PREFERREDS - 0.1% | | | | | |
| | | | | |
UNITED STATES OF AMERICA - 0.1% | | | | | |
RBS Capital Funding Trust V, 5.90%, (callable at 25 beginning 02/13/15) (f) | | 6 | | 154 | |
RBS Capital Funding Trust VII, 6.08%, (callable at 25 beginning 02/13/15) (f) | | 6 | | 154 | |
SCE Trust III, 5.75%, (callable at 25 beginning 03/15/24) (f) | | 5 | | 132 | |
Total Trust Preferreds (cost $401) | | | | 440 | |
| | | | | |
PREFERRED STOCKS - 2.6% | | | | | |
| | | | | |
GERMANY - 0.3% | | | | | |
Volkswagen AG | | 6 | | 1,280 | |
| | | | | |
UNITED KINGDOM - 0.1% | | | | | |
Royal Bank of Scotland Group Plc - ADR, 6.60%, (callable at 25 beginning 02/13/15) (f) | | 8 | | 208 | |
Royal Bank of Scotland Group Plc - ADR, 6.13%, (callable at 25 beginning 02/13/15) (f) | | 2 | | 40 | |
| | | | 248 | |
UNITED STATES OF AMERICA - 2.2% | | | | | |
Citigroup Inc., 6.88%, (callable at 25 beginning 11/15/23) (f) | | 124 | | 3,296 | |
Goldman Sachs Group Inc., 6.38%, (callable at 25 beginning 05/10/24) (f) | | 48 | | 1,244 | |
Goldman Sachs Group Inc., 5.50%, (callable at 25 beginning 05/10/23) (f) | | 53 | | 1,296 | |
United Technologies Corp., 7.50%, 08/01/15 | | 19 | | 1,149 | |
Wells Fargo & Co., 5.85%, (callable at 25 beginning 09/15/23) (f) | | 62 | | 1,583 | |
| | | | 8,568 | |
Total Preferred Stocks (cost $10,327) | | | | 10,096 | |
| | | | | |
PURCHASED OPTIONS - 0.0% | | | | | |
Bank of America Corp. Put Option, Strike Price 16.5, Expiration 01/23/15 | | 140 | | 1 | |
Barrick Gold Corp. Put Option, Strike Price 20, Expiration 01/15/16 | | 154 | | 4 | |
Caterpillar Inc. Put Option, Strike Price 92.5, Expiration 02/20/15 | | 15 | | 6 | |
Citigroup Inc. Put Option, Strike Price 53, Expiration 01/23/15 | | 100 | | 8 | |
Ebay Inc. Call Option, Strike Price 60, Expiration 02/20/15 | | 25 | | 2 | |
Euro Stoxx 50 Index Put Option, Strike Price EUR 3,150, Expiration 01/16/15 | | 55 | | 42 | |
iShares Russell 2000 ETF Put Option, Strike Price 115.5, Expiration 01/30/15 | | 30 | | 4 | |
iShares U.S. Preferred Stock ETF Put Option, Strike Price 39, Expiration 01/17/15 | | 115 | | 1 | |
JPMorgan Chase & Co. Put Option, Strike Price 59.5, Expiration 01/30/15 | | 60 | | 4 | |
Kinder Morgan Inc. Put Option, Strike Price 40, Expiration 01/17/15 | | 40 | | 1 | |
Market Vectors Semiconductor ETF Put Option, Strike Price 100, Expiration 01/17/15 | | 70 | | 1 | |
Micron Tehcnology Inc. Put Option, Strike Price 33.50, Expiration 01/23/15 | | 45 | | 4 | |
Micron Tehcnology Inc. Put Option, Strike Price 34, Expiration 01/30/15 | | 15 | | 2 | |
PowerShares QQQ Trust Call Option, Strike Price 108, Expiration 02/20/15 | | 17 | | 1 | |
PowerShares QQQ Trust Put Option, Strike Price 101, Expiration 01/23/15 | | 55 | | 6 | |
PowerShares QQQ Trust Put Option, Strike Price 88, Expiration 02/20/15 | | 17 | | — | |
Put Swaption, 3-Month LIBOR versus 2.10% fixed, Expiration 03/04/15, CIT | | 2,400,000 | | 5 | |
Put Swaption, 3-Month LIBOR versus 2.10% fixed, Expiration 03/04/15, CIT | | 4,700,000 | | 10 | |
Put Swaption, 3-Month LIBOR versus 2.10% fixed, Expiration 03/04/15, JPM | | 2,280,000 | | 5 | |
Put Swaption, 3-Month LIBOR versus 2.85% fixed, Expiration 03/04/15, CIT | | 5,300,000 | | 3 | |
Put Swaption, 3-Month LIBOR versus 2.85% fixed, Expiration 03/04/15, JPM | | 4,000,000 | | 2 | |
S&P 500 Index Put Option, Strike Price 2,000, Expiration 01/17/15 | | 10 | | 12 | |
SPDR S&P Oil & Gas Exploration & Production ETF Put Option, Strike Price 41, Expiration 01/30/15 | | 25 | | 1 | |
SPDR S&P Oil & Gas Exploration & Production ETF Put Option, Strike Price 42, Expiration 01/17/15 | | 100 | | 4 | |
See accompanying Notes to Financial Statements.
| | Shares/Par † | | Value | |
Union Pacific Corp. Put Option, Strike Price 118, Expiration 01/30/15 | | 30 | | 8 | |
Total Purchased Options (cost $225) | | | | 137 | |
| | | | | |
SHORT TERM INVESTMENTS - 22.7% | | | | | |
| | | | | |
Investment Company - 7.0% | | | | | |
JNL Money Market Fund, 0.01% (m) (n) | | 26,633 | | 26,633 | |
| | | | | |
Repurchase Agreements - 15.7% | | | | | |
| | | | | |
Australia - 0.2% | | | | | |
Repurchase Agreement with CGM, (0.10)% (Collateralized by $100 BHP Billiton Finance USA Ltd., 5.00%, due 09/30/43, value $114) acquired on 12/29/14, open maturity at $112 | | $ | 112 | | 112 | |
Repurchase Agreement with DUB, (0.10)% (Collateralized by $678 Westpac Banking Corp., 2.25%, due 07/30/18, value $689) acquired on 10/08/14, open maturity at $691 | | 691 | | 691 | |
| | | | 803 | |
Belgium - 0.4% | | | | | |
Repurchase Agreement with CGM, (0.10)% (Collateralized by $1,670 Anheuser-Busch InBev Finance Inc., 3.70%, due 02/01/24, value $1,741) acquired on 10/30/14, open maturity at $1,714 | | 1,714 | | 1,714 | |
| | | | | |
Canada - 0.4% | | | | | |
Repurchase Agreement with BCL, (0.15)% (Collateralized by $1,151 Potash Corp. of Saskatchewan Inc., 5.63%, due 12/01/40, value $1,432) acquired on 12/16/14, open maturity at $1,396 | | 1,396 | | 1,396 | |
| | | | | |
Germany - 0.4% | | | | | |
Repurchase Agreement with JPM, (0.18)% (Collateralized by EUR 323 Bundesrepublik Deutschland, 2.50%, due 01/04/21, value EUR 370) acquired on 12/16/14, open maturity at $458, EUR | | 379 | | 458 | |
Repurchase Agreement with JPM, (0.18)% (Collateralized by EUR 725 Bundesobligation, 0.75%, due 02/24/17, value EUR 737) acquired on 12/16/14, open maturity at $903, EUR | | 746 | | 903 | |
| | | | 1,361 | |
Italy - 0.0% | | | | | |
Repurchase Agreement with BBP, (0.08)% (Collateralized by EUR 44 Italy Buoni Poliennali Del Tesoro, 4.50%, due 05/01/23, value EUR 54) acquired on 12/17/14, open maturity at $66, EUR | | 54 | | 66 | |
| | | | | |
United Kingdom - 0.7% | | | | | |
Repurchase Agreement with BCL, (0.10)% (Collateralized by $350 Standard Chartered Plc, 5.70%, due 03/26/44, value $367) acquired on 10/02/14, open maturity at $379 | | 379 | | 379 | |
Repurchase Agreement with BCL, (0.10)% (Collateralized by $410 Standard Chartered Plc, 5.70%, due 03/26/44, value $430) acquired on 10/20/14, open maturity at $444 | | 444 | | 444 | |
Repurchase Agreement with CGM, (0.10)% (Collateralized by $213 BAE Systems Holdings Inc., 3.80%, due 10/07/24, value $219) acquired on 11/14/14, open maturity at $214 | | 214 | | 214 | |
Repurchase Agreement with CGM, (0.35)% (Collateralized by $500 Standard Chartered Plc, 5.20%, due 01/26/24, value $522) acquired on 11/21/14, open maturity at $531 | | 531 | | 531 | |
Repurchase Agreement with CGM, (1.25)% (Collateralized by $425 Standard Chartered Plc, 5.30%, due 01/09/43, value $428) acquired on 05/06/14, open maturity at $435 | | 435 | | 435 | |
Repurchase Agreement with DUB, (0.10)% (Collateralized by $340 Imperial Tobacco Finance Plc, 3.50%, due 02/11/23, value $335) acquired on 12/03/14, open maturity at $338 | | 338 | | 338 | |
Repurchase Agreement with MLP, (0.15)% (Collateralized by $350 Standard Chartered Plc, 5.70%, due 03/26/44, value $367) acquired on 10/08/14, open maturity at $389 | | 389 | | 389 | |
| | | | 2,730 | |
United States of America - 13.6% | | | | | |
Repurchase Agreement with BCL, (0.10)% (Collateralized by $1,110 International Business Machines Corp., 4.00%, due 06/20/42, value $1,115) acquired on 10/23/14, open maturity at $1,099 | | 1,099 | | 1,099 | |
Repurchase Agreement with BCL, (0.10)% (Collateralized by $1,130 Bank of America Corp., 3.30%, due 01/11/23, value $1,132) acquired on 12/19/14, open maturity at $1,140 | | 1,140 | | 1,140 | |
Repurchase Agreement with BCL, (0.10)% (Collateralized by $100 Apache Corp., 4.75%, due 04/15/43, value $95) acquired on 12/04/14, open maturity at $95 | | 95 | | 95 | |
Repurchase Agreement with BCL, (0.10)% (Collateralized by $350 Noble Energy Inc., 5.05%, due 11/15/44, value $349) acquired on 12/04/14, open maturity at $345 | | 345 | | 345 | |
Repurchase Agreement with BCL, (0.10)% (Collateralized by $400 Wells Fargo & Co., 5.90%, perpetual, value $405) acquired on 10/14/14, open maturity at $424 | | 424 | | 424 | |
Repurchase Agreement with BCL, (0.10)% (Collateralized by $540 Microsoft Corp., 2.38%, due 05/01/23, value $532) acquired on 05/15/14, open maturity at $518 | | 518 | | 518 | |
Repurchase Agreement with BCL, (0.10)% (Collateralized by $560 Pfizer Inc., 3.40%, due 05/15/24, value $585) acquired on 10/16/14, open maturity at $584 | | 584 | | 584 | |
Repurchase Agreement with BCL, (0.10)% (Collateralized by $700 AT&T Inc., 4.35%, due 06/15/45, value $665) acquired on 11/24/14, open maturity at $667 | | 667 | | 667 | |
Repurchase Agreement with BCL, (0.25)% (Collateralized by $520 Molson Coors Brewing Co., 3.50%, due 05/01/22, value $527) acquired on 12/19/14, open maturity at $527 | | 527 | | 527 | |
Repurchase Agreement with CGM, (0.10)% (Collateralized by $1,380 Morgan Stanley, 2.38%, due 07/23/19, value $1,377) acquired on 10/01/14, open maturity at $1,366 | | 1,366 | | 1,366 | |
| | | | | | |
See accompanying Notes to Financial Statements.
| | Shares/Par † | | Value | |
Repurchase Agreement with CGM, (0.10)% (Collateralized by $140 Pfizer Inc., 4.40%, due 05/15/44, value $154) acquired on 09/30/14, open maturity at $144 | | 144 | | 144 | |
Repurchase Agreement with CGM, (0.10)% (Collateralized by $150 Sunoco Logistics Partners Operations LP, 5.35%, due 05/15/45, value $153) acquired on 12/18/14, open maturity at $148 | | 148 | | 148 | |
Repurchase Agreement with CGM, (0.10)% (Collateralized by $2,770 Wells Fargo & Co., 2.13%, due 04/22/19, value $2,775) acquired on 10/01/14, open maturity at $2,773 | | 2,773 | | 2,773 | |
Repurchase Agreement with CGM, (0.10)% (Collateralized by $2,800 JPMorgan Chase & Co., 2.20%, due 10/22/19, value $2,782) acquired on 12/03/14, open maturity at $2,782 | | 2,782 | | 2,782 | |
Repurchase Agreement with CGM, (0.10)% (Collateralized by $290 Pfizer Inc., 3.40%, due 05/15/24, value $303) acquired on 10/02/14, open maturity at $302 | | 302 | | 302 | |
Repurchase Agreement with CGM, (0.10)% (Collateralized by $30 Iron Mountain Inc., 5.75%, due 08/15/24, value $31) acquired on 12/04/14, open maturity at $31 | | 31 | | 31 | |
Repurchase Agreement with CGM, (0.10)% (Collateralized by $350 Freeport-McMoRan Inc., 5.45%, due 03/15/43, value $333) acquired on 11/21/14, open maturity at $335 | | 335 | | 335 | |
Repurchase Agreement with CGM, (0.10)% (Collateralized by $450 Amazon.com Inc., 3.80%, due 12/05/24, value $463) acquired on 12/17/14, open maturity at $456 | | 456 | | 456 | |
Repurchase Agreement with CGM, (0.10)% (Collateralized by $450 Pfizer Inc., 3.40%, due 05/15/24, value $470) acquired on 10/14/14, open maturity at $473 | | 473 | | 473 | |
Repurchase Agreement with CGM, (0.10)% (Collateralized by $540 International Business Machines Corp., 3.38%, due 08/01/23, value $554) acquired on 05/28/13, open maturity at $537 | | 537 | | 537 | |
Repurchase Agreement with CGM, (0.10)% (Collateralized by $600 Citigroup Inc., 4.50%, due 01/14/22, value $658) acquired on 11/21/14, open maturity at $653 | | 653 | | 653 | |
Repurchase Agreement with CGM, (0.10)% (Collateralized by $75 Eastman Chemical Co., 3.60%, due 08/15/22, value $76) acquired on 12/23/14, open maturity at $77 | | 77 | | 77 | |
Repurchase Agreement with CGM, (0.75)% (Collateralized by $200 AT&T Inc., 3.90%, due 03/11/24, value $206) acquired on 12/01/14, open maturity at $209 | | 209 | | 209 | |
Repurchase Agreement with CGM, (1.00)% (Collateralized by $140 Motorola Solutions Inc., 4.00%, due 09/01/24, value $141) acquired on 11/12/14, open maturity at $141 | | 141 | | 141 | |
Repurchase Agreement with CSI, (0.10)% (Collateralized by $1,390 Morgan Stanley, 2.38%, due 07/23/19, value $1,386) acquired on 10/08/14, open maturity at $1,390 | | 1,390 | | 1,390 | |
Repurchase Agreement with CSI, (0.15)% (Collateralized by $2,770 Bank of America Corp., 2.65%, due 04/01/19, value $2,796) acquired on 10/01/14, open maturity at $2,763 | | 2,763 | | 2,763 | |
Repurchase Agreement with CSI, (0.15)% (Collateralized by $550 Sysco Corp., 4.50%, due 10/02/44, value $602) acquired on 10/27/14, open maturity at $569 | | 569 | | 569 | |
Repurchase Agreement with CSI, (0.15)% (Collateralized by $560 Citigroup Inc., 5.50%, due 09/13/25, value $622) acquired on 10/27/14, open maturity at $626 | | 626 | | 626 | |
Repurchase Agreement with CSI, 0.06% (Collateralized by $12,347 U.S. Treasury Note, 2.38%, due 08/15/24, value $12,571) acquired on 11/19/14, open maturity at $12,455 | | 12,455 | | 12,455 | |
Repurchase Agreement with CSI, 0.15% (Collateralized by $1,090 U.S. Treasury Note, 1.50%, due 12/31/18, value $1,092) acquired on 12/18/14, open maturity at $1,100 | | 1,100 | | 1,100 | |
Repurchase Agreement with DUB, (0.10)% (Collateralized by $275 Energy Transfer Partners LP, 4.65%, due 06/01/21, value $288) acquired on 11/18/14, open maturity at $289 | | 289 | | 289 | |
Repurchase Agreement with DUB, (0.10)% (Collateralized by $275 Noble Energy Inc., 3.90%, due 11/15/24, value $273) acquired on 11/18/14, open maturity at $273 | | 273 | | 273 | |
Repurchase Agreement with DUB, (0.10)% (Collateralized by $750 Amazon.com Inc., 2.50%, due 11/29/22, value $713) acquired on 10/28/14, open maturity at $713 | | 713 | | 713 | |
Repurchase Agreement with DUB, (0.15)% (Collateralized by $3,030 Goldman Sachs Group Inc., 2.55%, due 10/23/19, value $3,022) acquired on 12/04/14, open maturity at $3,026 | | 3,026 | | 3,026 | |
Repurchase Agreement with DUB, (0.15)% (Collateralized by $873 Cox Communications Inc., 2.95%, due 06/30/23, value $840) acquired on 12/26/14, open maturity at $853 | | 853 | | 853 | |
Repurchase Agreement with JPM, (0.05)% (Collateralized by $765 Verizon Communications Inc., 6.40%, due 09/15/33, value $946) acquired on 11/24/14, open maturity at $937 | | 937 | | 937 | |
Repurchase Agreement with JPM, (0.10)% (Collateralized by $1,100 Bank of America Corp., 4.25%, due 10/22/26, value $1,101) acquired on 12/30/14, open maturity at $1,126 | | 1,126 | | 1,126 | |
Repurchase Agreement with JPM, (0.10)% (Collateralized by $2,770 Citigroup Inc., 2.50%, due 07/29/19, value $2,776) acquired on 12/18/14, open maturity at $2,794 | | 2,794 | | 2,794 | |
Repurchase Agreement with JPM, (0.10)% (Collateralized by $795 Verizon Communications Inc., 6.40%, due 09/15/33, value $982) acquired on 12/04/14, open maturity at $979 | | 979 | | 979 | |
See accompanying Notes to Financial Statements.
| | Shares/Par † | | Value | |
Repurchase Agreement with MLP, (0.15)% (Collateralized by $325 Amazon.com Inc., 2.50%, due 11/29/22, value $308) acquired on 05/01/14, open maturity at $312 | | 312 | | 312 | |
Repurchase Agreement with MLP, (0.18)% (Collateralized by $125 International Paper Co., 3.65%, due 06/15/24, value $125) acquired on 11/24/14, open maturity at $126 | | 126 | | 126 | |
Repurchase Agreement with MLP, 0.13% (Collateralized by $4,275 U.S. Treasury Note, 2.13%, due 09/30/21, value $4,323) acquired on 12/09/14, open maturity at $4,344 | | 4,344 | | 4,344 | |
Repurchase Agreement with MLP, 0.17% (Collateralized by $1,304 U.S. Treasury Note, 2.00%, due 10/31/21, value $1,307) acquired on 12/02/14, open maturity at $1,307 | | 1,307 | | 1,307 | |
| | | | 51,808 | |
Total Repurchase Agreements | | | | 59,878 | |
| | | | | |
Total Short Term Investments (cost $86,559) | | | | 86,511 | |
| | | | | |
Total Investments - 113.4% (cost $443,634) | | | | 432,726 | |
Total Securities Sold Short - (15.8%) (proceeds $59,845) | | | | (60,380 | ) |
Other Assets and Liabilities, Net - 2.4% | | | | 9,143 | |
Total Net Assets - 100.0% | | | | $ | 381,489 | |
| | | | | |
SECURITIES SOLD SHORT - 15.8% | | | | | |
| | | | | |
CORPORATE BONDS AND NOTES - 10.3% | | | | | |
| | | | | |
AUSTRALIA - 0.2% | | | | | |
BHP Billiton Finance USA Ltd., 5.00%, 09/30/43 | | $ | 100 | | $ | 114 | |
Westpac Banking Corp., 2.25%, 07/30/18 | | 678 | | 689 | |
| | | | 803 | |
BELGIUM - 0.4% | | | | | |
Anheuser-Busch InBev Finance Inc., 3.70%, 02/01/24 | | 1,670 | | 1,741 | |
| | | | | |
CANADA - 0.4% | | | | | |
Canadian Natural Resources Ltd., 3.90%, 02/01/25 | | 180 | | 178 | |
Potash Corp. of Saskatchewan Inc., 5.63%, 12/01/40 | | 1,151 | | 1,432 | |
| | | | 1,610 | |
UNITED KINGDOM - 0.7% | | | | | |
BAE Systems Holdings Inc., 3.80%, 10/07/24 (b) | | 213 | | 219 | |
Imperial Tobacco Finance Plc, 3.50%, 02/11/23 (b) | | 340 | | 335 | |
Standard Chartered Plc | | | | | |
5.20%, 01/26/24 (b) | | 500 | | 522 | |
5.30%, 01/09/43 (b) | | 425 | | 428 | |
5.70%, 03/26/44 (b) | | 1,110 | | 1,164 | |
| | | | 2,668 | |
UNITED STATES OF AMERICA - 8.6% | | | | | |
Amazon.com Inc. | | | | | |
2.50%, 11/29/22 | | 1,075 | | 1,021 | |
3.80%, 12/05/24 | | 450 | | 463 | |
Apache Corp, 4.75%, 04/15/43 | | 100 | | 95 | |
AT&T Inc. | | | | | |
3.90%, 03/11/24 | | 200 | | 206 | |
4.35%, 06/15/45 | | 700 | | 665 | |
Bank of America Corp. | | | | | |
2.65%, 04/01/19 | | 2,770 | | 2,796 | |
3.30%, 01/11/23 | | 1,130 | | 1,132 | |
4.25%, 10/22/26 | | 1,100 | | 1,101 | |
Citigroup Inc. | | | | | |
2.50%, 07/29/19 | | 2,770 | | 2,776 | |
4.50%, 01/14/22 | | 600 | | 658 | |
5.50%, 09/13/25 | | 560 | | 622 | |
Cox Communications Inc., 2.95%, 06/30/23 (b) | | 873 | | 840 | |
Eastman Chemical Co., 3.60%, 08/15/22 | | 75 | | 76 | |
Energy Transfer Partners LP, 4.65%, 06/01/21 | | 275 | | 288 | |
Freeport-McMoRan Inc., 5.45%, 03/15/43 | | 350 | | 333 | |
Goldman Sachs Group Inc., 2.55%, 10/23/19 | | 3,030 | | 3,022 | |
International Business Machines Corp. | | | | | |
3.38%, 08/01/23 | | 540 | | 554 | |
4.00%, 06/20/42 | | 1,110 | | 1,115 | |
International Paper Co., 3.65%, 06/15/24 | | 125 | | 125 | |
Iron Mountain Inc., 5.75%, 08/15/24 | | 30 | | 31 | |
JPMorgan Chase & Co., 2.20%, 10/22/19 | | 2,800 | | 2,782 | |
Microsoft Corp., 2.38%, 05/01/23 | | 540 | | 532 | |
Molson Coors Brewing Co., 3.50%, 05/01/22 | | 520 | | 527 | |
Morgan Stanley, 2.38%, 07/23/19 | | 2,770 | | 2,763 | |
Motorola Solutions Inc., 4.00%, 09/01/24 | | 140 | | 141 | |
Noble Energy Inc. | | | | | |
3.90%, 11/15/24 | | 275 | | 273 | |
5.05%, 11/15/44 | | 350 | | 349 | |
Pfizer Inc. | | | | | |
3.40%, 05/15/24 | | 1,300 | | 1,358 | |
4.40%, 05/15/44 | | 140 | | 154 | |
Sunoco Logistics Partners Operations LP, 5.35%, 05/15/45 | | 150 | | 153 | |
Sysco Corp., 4.50%, 10/02/44 | | 550 | | 602 | |
Verizon Communications Inc., 6.40%, 09/15/33 | | 1,560 | | 1,928 | |
Wells Fargo & Co. | | | | | |
5.90% (callable at 100 beginning 06/15/24) (f) | | 400 | | 405 | |
2.13%, 04/22/19 | | 2,770 | | 2,775 | |
| | | | 32,661 | |
Total Corporate Bonds and Notes (proceeds $39,008) | | | | 39,483 | |
| | | | | |
GOVERNMENT AND AGENCY OBLIGATIONS - 5.5% | | | | | |
| | | | | |
GERMANY - 0.4% | | | | | |
Bundesobligation, 0.75%, 02/24/17, EUR | | 725 | | 892 | |
Bundesrepublik Deutschland, 2.50%, 01/04/21, EUR | | 323 | | 448 | |
| | | | 1,340 | |
ITALY - 0.0% | | | | | |
Italy Buoni Poliennali Del Tesoro, 4.50%, 05/01/23, EUR | | 44 | | 65 | |
| | | | | |
UNITED STATES OF AMERICA - 5.1% | | | | | |
U.S. Treasury Note | | | | | |
1.50%, 12/31/18 | | 1,090 | | 1,092 | |
1.63%, 12/31/19 | | 200 | | 199 | |
2.13%, 09/30/21 | | 4,275 | | 4,323 | |
2.00%, 10/31/21 | | 1,304 | | 1,307 | |
| | | | | | | |
See accompanying Notes to Financial Statements.
| | Shares/Par † | | Value | |
2.38%, 08/15/24 | | 12,347 | | 12,571 | |
| | | | 19,492 | |
Total Government and Agency Obligations (proceeds $20,837) | | | | 20,897 | |
| | | | | |
Total Securities Sold Short - 15.8%
(proceeds $59,845) | | | | $ | 60,380 | |
| | | | | | |
(a) | Non-income producing security. |
(b) | The Sub-Adviser has deemed this security which is exempt from registration under the Securities Act of 1933 (‘1933 Act’), as amended, to be liquid based on procedures approved by the Trust’s Board of Trustees. As of December 31, 2014, the aggregate value of these liquid securities was $54,763 for long term investments and ($3,508) for securities sold short which represented 14.4% and (0.9%) of net assets, respectively. |
(c) | Variable rate security. Rate stated was in effect as of December 31, 2014. |
(d) | Security is restricted to resale to institutional investors. See the Restricted Securities tables accompanying the Summary Schedules of Investments presented in the Trust’s annual report. |
(e) | Security fair valued in good faith in accordance with the procedures approved by the Trust’s Board of Trustees. Good faith fair valued securities may be classified as Level 2 or Level 3 for Financial Accounting Standards Board (“FASB”) Accounting Standards Codification (“ASC”) Topic 820 “Fair Value Measurement” based on the applicable valuation inputs. See FASB ASC Topic 820 “Fair Value Measurement” in the Notes to Financial Statements. |
(f) | Perpetual security. |
(g) | Pay-in-kind security. The coupon interest earned by the security may be paid in cash or additional par. |
(h) | Convertible security. |
(i) | The Sub-Adviser has deemed this security to be illiquid based on procedures approved by the Trust’s Board of Trustees. |
(j) | This variable rate senior loan will settle after December 31, 2014, at which time the interest rate will be determined. |
(k) | Security issued with a zero coupon. Income is recognized through the accretion of discount. |
(l) | Security is a “step-up” bond where the coupon may increase or step up at a future date. Rate stated was the coupon as of December 31, 2014. |
(m) | Investment in affiliate. |
(n) | Yield changes daily to reflect current market conditions. Rate was the quoted yield as of December 31, 2014. |
(o) | All or a portion of the security is pledged or segregated as collateral. See the Notes to Financial Statements. |
Curian/DFA U.S. Micro Cap Fund
| | Shares/Par † | | Value | |
COMMON STOCKS - 100.1% | | | | | |
CONSUMER DISCRETIONARY - 16.0% | | | | | |
1-800-Flowers.com Inc. - Class A (a) (b) | | 8 | | $ | 62 | |
Aeropostale Inc. (a) (b) | | 10 | | 22 | |
AH Belo Corp. - Class A | | 4 | | 45 | |
Ambassadors Group Inc. (a) | | 1 | | 1 | |
America’s Car-Mart Inc. (a) (b) | | 2 | | 118 | |
American Axle & Manufacturing Holdings Inc. (a) | | 3 | | 66 | |
American Public Education Inc. (a) | | 2 | | 65 | |
Arctic Cat Inc. | | 2 | | 69 | |
Ark Restaurants Corp. | | 1 | | 13 | |
Asbury Automotive Group Inc. (a) | | 3 | | 216 | |
Ascent Capital Group Inc. - Class A (a) | | 2 | | 110 | |
Ballantyne Strong Inc. (a) | | 2 | | 8 | |
Barnes & Noble Inc. (a) | | 9 | | 205 | |
Bassett Furniture Industries Inc. | | 1 | | 15 | |
Bebe Stores Inc. (b) | | 9 | | 20 | |
Belmond Ltd. - Class A (a) | | 3 | | 33 | |
Big 5 Sporting Goods Corp. | | 3 | | 40 | |
Biglari Holdings Inc. (a) | | — | | 112 | |
BJ’s Restaurants Inc. (a) | | 4 | | 202 | |
Blue Nile Inc. (a) | | 1 | | 48 | |
Blyth Inc. | | 6 | | 52 | |
Bob Evans Farms Inc. (b) | | 3 | | 170 | |
Bon-Ton Stores Inc. (b) | | 2 | | 16 | |
Books-A-Million Inc. (a) | | 1 | | 1 | |
Bravo Brio Restaurant Group Inc. (a) | | 3 | | 48 | |
Bridgepoint Education Inc. (a) | | 7 | | 84 | |
Brown Shoe Co. Inc. | | 11 | | 357 | |
Build-A-Bear Workshop Inc. (a) | | 4 | | 71 | |
Callaway Golf Co. | | 9 | | 70 | |
Capella Education Co. | | 3 | | 203 | |
Career Education Corp. (a) (b) | | 10 | | 70 | |
Carmike Cinemas Inc. (a) | | 4 | | 106 | |
Carriage Services Inc. | | 2 | | 49 | |
Carrol’s Restaurant Group Inc. (a) | | 4 | | 28 | |
Cato Corp. - Class A | | 5 | | 229 | |
Cavco Industries Inc. (a) | | 1 | | 99 | |
Central European Media Entertainment Ltd. - Class A (a) (b) | | 10 | | 31 | |
Cherokee Inc. | | 1 | | 28 | |
Childrens Place Retail Stores Inc. | | 3 | | 157 | |
Christopher & Banks Corp. (a) | | 5 | | 30 | |
Churchill Downs Inc. | | 3 | | 322 | |
Chuy’s Holdings Inc. (a) (b) | | 2 | | 33 | |
Citi Trends Inc. (a) | | 3 | | 80 | |
ClubCorp Holdings Inc. | | 2 | | 31 | |
Collectors Universe Inc. | | 2 | | 38 | |
Cooper-Standard Holding Inc. (a) | | 1 | | 33 | |
Core-Mark Holding Co. Inc. | | 4 | | 253 | |
Crocs Inc. (a) | | 13 | | 157 | |
Culp Inc. (b) | | 2 | | 37 | |
Cumulus Media Inc. - Class A (a) | | 12 | | 50 | |
Del Frisco’s Restaurant Group Inc. (a) | | 3 | | 79 | |
Delta Apparel Inc. (a) (b) | | 1 | | 15 | |
Denny’s Corp. (a) | | 5 | | 53 | |
Destination Maternity Corp. | | 1 | | 20 | |
Destination XL Group Inc. (a) (b) | | 13 | | 69 | |
DineEquity Inc. | | — | | 10 | |
Dixie Group Inc. - Class A (a) | | 1 | | 7 | |
Drew Industries Inc. | | 3 | | 138 | |
Entercom Communications Corp. - Class A (a) | | 3 | | 41 | |
Entravision Communications Corp. - Class A | | 6 | | 41 | |
Escalade Inc. (b) | | 2 | | 33 | |
Ethan Allen Interiors Inc. | | 3 | | 108 | |
EVINE Live Inc. - Class A (a) (b) | | 9 | | 62 | |
EW Scripps Co. - Class A (a) | | 7 | | 151 | |
Famous Dave’s Of America Inc. (a) (b) | | 1 | | 19 | |
Fiesta Restaurant Group Inc. (a) | | 3 | | 186 | |
Finish Line Inc. - Class A | | 7 | | 159 | |
Flexsteel Industries Inc. | | 1 | | 24 | |
Fred’s Inc. - Class A | | 4 | | 66 | |
Frisch’s Restaurants Inc. (b) | | 1 | | 13 | |
FTD Cos. Inc. (a) | | 2 | | 68 | |
Fuel Systems Solutions Inc. (a) (b) | | 3 | | 32 | |
G-III Apparel Group Ltd. (a) (b) | | — | | 14 | |
Geeknet Inc. (a) | | — | | 4 | |
Gentherm Inc. (a) | | 5 | | 183 | |
Gordman’s Stores Inc. (a) (b) | | 3 | | 8 | |
Gray Television Inc. (a) | | 5 | | 61 | |
Harte-Hanks Inc. | | 11 | | 83 | |
Haverty Furniture Cos. Inc. | | 3 | | 62 | |
Helen of Troy Ltd. (a) | | 1 | | 67 | |
| | | | | | |
See accompanying Notes to Financial Statements.
| | Shares/Par † | | Value | |
hhgregg Inc. (a) (b) | | 4 | | 33 | |
Hibbett Sports Inc. (a) | | 3 | | 128 | |
Hooker Furniture Corp. | | 2 | | 40 | |
Hovnanian Enterprises Inc. - Class A (a) (b) | | 13 | | 56 | |
International Speedway Corp. - Class A | | 2 | | 64 | |
Interval Leisure Group Inc. (b) | | 6 | | 115 | |
iRobot Corp. (a) (b) | | 3 | | 106 | |
Isle of Capri Casinos Inc. (a) | | 3 | | 23 | |
Jamba Inc. (a) | | 2 | | 26 | |
Johnson Outdoors Inc. - Class A (b) | | 1 | | 24 | |
Journal Communications Inc. - Class A (a) | | 14 | | 157 | |
K12 Inc. (a) | | 4 | | 47 | |
KB Home (b) | | 7 | | 114 | |
Kirkland’s Inc. (a) | | 4 | | 83 | |
Kona Grill Inc. (a) | | 1 | | 34 | |
Krispy Kreme Doughnuts Inc. (a) | | 11 | | 218 | |
La-Z-Boy Inc. | | 6 | | 157 | |
Leapfrog Enterprises Inc. - Class A (a) | | 8 | | 39 | |
Libbey Inc. (a) | | 4 | | 118 | |
Lifetime Brands Inc. (b) | | 2 | | 35 | |
Lincoln Educational Services Corp. | | 5 | | 15 | |
Lithia Motors Inc. - Class A | | 1 | | 64 | |
Luby’s Inc. (a) (b) | | 3 | | 13 | |
M/I Homes Inc. (a) (b) | | 3 | | 58 | |
Marine Products Corp. | | 3 | | 26 | |
MarineMax Inc. (a) | | 6 | | 115 | |
Martha Stewart Living Omnimedia Inc. - Class A (a) | | 6 | | 26 | |
Matthews International Corp. - Class A | | 5 | | 262 | |
McClatchy Co. - Class A (a) | | 8 | | 28 | |
MDC Holdings Inc. | | 5 | | 133 | |
Media General Inc. (a) | | 1 | | 18 | |
Meritage Homes Corp. (a) | | 5 | | 181 | |
Modine Manufacturing Co. (a) | | 7 | | 99 | |
Monarch Casino & Resort Inc. (a) | | 2 | | 31 | |
Motorcar Parts of America Inc. (a) | | 2 | | 74 | |
Movado Group Inc. | | 4 | | 102 | |
Nathan’s Famous Inc. (a) (b) | | 1 | | 91 | |
National American University Holdings Inc. | | 2 | | 4 | |
National CineMedia Inc. | | 9 | | 133 | |
Nautilus Inc. (a) | | 5 | | 76 | |
New York & Co. Inc. (a) (b) | | 10 | | 27 | |
Nexstar Broadcasting Group Inc. - Class A (b) | | 3 | | 169 | |
NutriSystem Inc. | | 5 | | 98 | |
Orbitz Worldwide Inc. (a) | | 16 | | 129 | |
Overstock.com Inc. (a) | | 2 | | 60 | |
Oxford Industries Inc. | | 2 | | 137 | |
Pacific Sunwear of California Inc. (a) | | 3 | | 7 | |
Penn National Gaming Inc. (a) | | 5 | | 66 | |
Pep Boys-Manny Moe & Jack (a) | | 8 | | 79 | |
Perry Ellis International Inc. (a) | | 2 | | 61 | |
PetMed Express Inc. (b) | | 2 | | 36 | |
Popeyes Louisiana Kitchen Inc. (a) | | 4 | | 235 | |
Quicksilver Inc. (a) (b) | | 18 | | 40 | |
RCI Hospitality Holdings Inc. (a) | | 1 | | 10 | |
Red Lion Hotels Corp. (a) | | 4 | | 28 | |
Red Robin Gourmet Burgers Inc. (a) | | 1 | | 114 | |
Regis Corp. (a) | | 10 | | 166 | |
Rent-A-Center Inc. | | 7 | | 269 | |
Rocky Brands Inc. | | 1 | | 13 | |
Ruby Tuesday Inc. (a) | | 6 | | 44 | |
Ruth’s Hospitality Group Inc. | | 5 | | 69 | |
Salem Communications Corp. - Class A (b) | | 2 | | 13 | |
Scholastic Corp. (b) | | 2 | | 61 | |
Scientific Games Corp. - Class A (a) (b) | | 9 | | 111 | |
Select Comfort Corp. (a) | | 8 | | 212 | |
Shiloh Industries Inc. (a) (b) | | 2 | | 38 | |
Shoe Carnival Inc. | | 3 | | 77 | |
Shutterfly Inc. (a) | | 1 | | 28 | |
Sizmek Inc. (a) (b) | | 4 | | 23 | |
Skullcandy Inc. (a) | | 3 | | 29 | |
Skyline Corp. (a) (b) | | 3 | | 13 | |
Smith & Wesson Holding Corp. (a) (b) | | 1 | | 11 | |
Sonic Automotive Inc. - Class A | | 7 | | 192 | |
Sonic Corp. | | 8 | | 222 | |
Spartan Motors Inc. | | 5 | | 27 | |
Speedway Motorsports Inc. | | 6 | | 127 | |
Stage Stores Inc. | | 3 | | 68 | |
Standard Motor Products Inc. | | 5 | | 180 | |
Stanley Furniture Co. Inc. (a) | | 1 | | 1 | |
Stein Mart Inc. | | 9 | | 128 | |
Steiner Leisure Ltd. (a) | | 2 | | 87 | |
Stoneridge Inc. (a) (b) | | 4 | | 48 | |
Strattec Security Corp. | | 1 | | 45 | |
Strayer Education Inc. (a) | | 2 | | 124 | |
Sturm Ruger & Co. Inc. (b) | | 2 | | 69 | |
Superior Industries International Inc. (b) | | 4 | | 76 | |
Systemax Inc. (a) | | 1 | | 11 | |
Tandy Leather Factory Inc. (b) | | 1 | | 11 | |
Tile Shop Holdings Inc. (a) (b) | | 4 | | 35 | |
Tower International Inc. (a) | | 3 | | 77 | |
Town Sports International Holdings Inc. | | 4 | | 24 | |
Tuesday Morning Corp. (a) (b) | | 5 | | 101 | |
Tumi Holdings Inc. (a) | | 9 | | 203 | |
U.S. Auto Parts Network Inc. (a) | | 3 | | 6 | |
Unifi Inc. (a) | | 3 | | 102 | |
Universal Electronics Inc. (a) | | 3 | | 205 | |
Universal Technical Institute Inc. | | 4 | | 39 | |
Vera Bradley Inc. (a) | | 5 | | 102 | |
Vitamin Shoppe Inc. (a) | | 4 | | 174 | |
VOXX International Corp. - Class A (a) | | 2 | | 20 | |
West Marine Inc. (a) | | 3 | | 34 | |
Weyco Group Inc. (b) | | 1 | | 43 | |
William Lyon Homes - Class A (a) | | 3 | | 57 | |
Winmark Corp. (b) | | 1 | | 79 | |
Winnebago Industries Inc. | | 4 | | 84 | |
Zagg Inc. (a) | | 3 | | 18 | |
Zumiez Inc. (a) | | 5 | | 174 | |
| | | | 14,911 | |
CONSUMER STAPLES - 3.5% | | | | | |
Alico Inc. (b) | | 1 | | 56 | |
Alliance One International Inc. (a) | | 9 | | 15 | |
Andersons Inc. | | 1 | | 52 | |
B&G Foods Inc. | | 1 | | 17 | |
Boulder Brands Inc. (a) (b) | | 6 | | 69 | |
Cal-Maine Foods Inc. (b) | | 8 | | 301 | |
Calavo Growers Inc. | | 3 | | 131 | |
Central Garden & Pet Co. - Class A (a) | | 9 | | 87 | |
Chefs’ Warehouse Inc. (a) | | 3 | | 73 | |
Chiquita Brands International Inc. (a) | | 10 | | 146 | |
Coca-Cola Bottling Co. | | 1 | | 115 | |
Craft Brewers Alliance Inc. (a) (b) | | 2 | | 29 | |
Dean Foods Co. (b) | | 4 | | 74 | |
Diamond Foods Inc. (a) | | 1 | | 23 | |
Farmer Bros. Co. (a) | | 3 | | 90 | |
Griffin Land & Nurseries Inc. - Class A (b) | | 1 | | 26 | |
Ingles Markets Inc. - Class A | | 2 | | 76 | |
Inter Parfums Inc. | | 4 | | 118 | |
Inventure Foods Inc. (a) | | 3 | | 37 | |
John B. Sanfilippo & Son Inc. | | 1 | | 55 | |
Liberator Medical Holdings Inc. (b) | | 7 | | 21 | |
Lifeway Foods Inc. (a) | | — | | 8 | |
Limoneira Co. | | — | | 4 | |
Medifast Inc. (a) | | 3 | | 90 | |
See accompanying Notes to Financial Statements.
| | Shares/Par † | | Value | |
MGP Ingredients Inc. | | — | | 3 | |
National Beverage Corp. (a) | | 5 | | 120 | |
Natural Grocers by Vitamin Cottage Inc. (a) | | 2 | | 65 | |
Nutraceutical International Corp. (a) | | 1 | | 15 | |
Oil-Dri Corp. of America | | 1 | | 21 | |
Omega Protein Corp. (a) | | 4 | | 37 | |
Orchids Paper Products Co. | | 1 | | 26 | |
Pantry Inc. (a) | | 6 | | 220 | |
Prestige Brands Holdings Inc. (a) | | 4 | | 151 | |
Revlon Inc. - Class A (a) (b) | | 5 | | 155 | |
Rocky Mountain Chocolate Factory Inc. | | 2 | | 20 | |
Roundy’s Inc. (a) | | 7 | | 34 | |
Seneca Foods Corp. - Class A (a) | | 1 | | 29 | |
SpartanNash Co. | | 4 | | 108 | |
United-Guardian Inc. | | — | | 3 | |
Universal Corp. (b) | | 2 | | 105 | |
USANA Health Sciences Inc. (a) | | 1 | | 137 | |
Village Super Market Inc. - Class A (b) | | 2 | | 51 | |
WD-40 Co. | | 2 | | 205 | |
Weis Markets Inc. | | — | | 21 | |
| | | | 3,239 | |
ENERGY - 3.5% | | | | | |
Adams Resources & Energy Inc. | | 1 | | 40 | |
Alon USA Energy Inc. | | 10 | | 126 | |
Alpha Natural Resources Inc. (a) (b) | | 10 | | 17 | |
Approach Resources Inc. (a) (b) | | 4 | | 26 | |
Basic Energy Services Inc. (a) | | 6 | | 44 | |
Bill Barrett Corp. (a) | | 5 | | 58 | |
C&J Energy Services Inc. (a) | | 3 | | 39 | |
Callon Petroleum Co. (a) | | 9 | | 49 | |
Clayton Williams Energy Inc. (a) | | 2 | | 127 | |
Cloud Peak Energy Inc. (a) | | 7 | | 60 | |
Comstock Resources Inc. (b) | | 7 | | 44 | |
Contango Oil & Gas Co. (a) | | 2 | | 61 | |
Dawson Geophysical Co. | | 1 | | 10 | |
DHT Holdings Inc. | | 4 | | 29 | |
Emerald Oil Inc. (a) (b) | | 9 | | 11 | |
EnLink Midstream LLC | | 3 | | 106 | |
Era Group Inc. (a) | | 2 | | 44 | |
Evolution Petroleum Corp. | | 3 | | 22 | |
FieldPoint Petroleum Corp. (a) | | 1 | | 1 | |
Forbes Energy Services Ltd. (a) | | 1 | | 2 | |
Gastar Exploration Inc. (a) | | 11 | | 26 | |
Geospace Technologies Corp. (a) | | 1 | | 36 | |
Goodrich Petroleum Corp. (a) (b) | | 6 | | 28 | |
Green Plains Renewable Energy Inc. | | 5 | | 132 | |
Gulf Island Fabrication Inc. | | 2 | | 38 | |
Gulfmark Offshore Inc. - Class A (b) | | 3 | | 68 | |
Harvest Natural Resources Inc. (a) (b) | | 8 | | 15 | |
Hornbeck Offshore Services Inc. (a) | | 5 | | 131 | |
ION Geophysical Corp. (a) | | 17 | | 46 | |
Key Energy Services Inc. (a) | | 16 | | 26 | |
Matrix Service Co. (a) | | 3 | | 61 | |
Midstates Petroleum Co. Inc. (a) (b) | | 5 | | 7 | |
Miller Energy Resources Inc. (a) (b) | | 8 | | 10 | |
Mitcham Industries Inc. (a) | | 2 | | 10 | |
Natural Gas Services Group Inc. (a) (b) | | 1 | | 30 | |
Newpark Resources Inc. (a) | | 15 | | 139 | |
Nordic American Tankers Ltd. (b) | | 9 | | 92 | |
Northern Oil and Gas Inc. (a) (b) | | 9 | | 49 | |
Nuverra Environmental Solutions Inc. (a) | | 3 | | 16 | |
Panhandle Oil and Gas Inc. - Class A | | 2 | | 52 | |
Parker Drilling Co. (a) | | 13 | | 39 | |
Penn Virginia Corp. (a) (b) | | 7 | | 49 | |
PetroQuest Energy Inc. (a) | | 10 | | 36 | |
PHI Inc. (a) | | 1 | | 54 | |
Pioneer Energy Services Corp. (a) | | 10 | | 56 | |
Renewable Energy Group Inc. (a) | | 6 | | 57 | |
Rex Energy Corp. (a) (b) | | 6 | | 28 | |
RigNet Inc. (a) | | 3 | | 122 | |
Scorpio Tankers Inc. | | 15 | | 134 | |
SEACOR Holdings Inc. (a) | | 1 | | 78 | |
Seventy Seven Energy Inc. (a) | | 4 | | 20 | |
Swift Energy Co. (a) (b) | | 6 | | 24 | |
Synergy Resources Corp. (a) (b) | | 12 | | 146 | |
Tesco Corp. | | 6 | | 76 | |
Tetra Technologies Inc. (a) | | 11 | | 71 | |
TGC Industries Inc. (a) | | 4 | | 10 | |
Triangle Petroleum Corp. (a) (b) | | 13 | | 60 | |
VAALCO Energy Inc. (a) | | 9 | | 40 | |
W&T Offshore Inc. (b) | | 9 | | 70 | |
Westmoreland Coal Co. (a) | | 1 | | 42 | |
Willbros Group Inc. (a) | | 11 | | 67 | |
Yuma Energy Inc. (a) | | 1 | | 1 | |
| | | | 3,208 | |
FINANCIALS - 19.0% | | | | | |
1st Source Corp. | | 4 | | 140 | |
Access National Corp. (b) | | 3 | | 43 | |
Ambac Financial Group Inc. (a) | | 5 | | 114 | |
American National Bankshares Inc. (b) | | 1 | | 31 | |
American River Bankshares (a) | | 1 | | 10 | |
Ameris Bancorp | | 3 | | 82 | |
Amerisafe Inc. | | 3 | | 132 | |
Arrow Financial Corp. | | 2 | | 51 | |
Asta Funding Inc. (a) | | 2 | | 14 | |
Astoria Financial Corp. | | 13 | | 174 | |
AV Homes Inc. (a) | | 2 | | 33 | |
Baldwin & Lyons Inc. - Class B | | 2 | | 50 | |
Banc of California Inc. | | 4 | | 43 | |
BancFirst Corp. | | 3 | | 221 | |
Bancorp Inc. (a) | | 4 | | 42 | |
Bank Mutual Corp. | | 5 | | 33 | |
Bank of Commerce Holdings | | 1 | | 7 | |
Bank of Kentucky Financial Corp. | | 1 | | 57 | |
BankFinancial Corp. | | 3 | | 39 | |
Banner Corp. | | 3 | | 115 | |
Bar Harbor Bankshares | | 1 | | 40 | |
BBCN Bancorp Inc. | | 9 | | 136 | |
BCB Bancorp Inc. | | 2 | | 21 | |
Beneficial Mutual Bancorp Inc. (a) | | 7 | | 85 | |
Berkshire Hills Bancorp Inc. | | 3 | | 69 | |
BGC Partners Inc. - Class A | | 17 | | 159 | |
BofI Holding Inc. (a) | | 2 | | 143 | |
Boston Private Financial Holdings Inc. | | 11 | | 152 | |
Bridge Bancorp Inc. | | 1 | | 32 | |
Bridge Capital Holdings (a) | | 2 | | 40 | |
Brookline Bancorp Inc. | | 10 | | 101 | |
Bryn Mawr Bank Corp. | | 1 | | 44 | |
C&F Financial Corp. | | 1 | | 37 | |
Calamos Asset Management Inc. - Class A | | 2 | | 32 | |
Camden National Corp. (b) | | 2 | | 71 | |
Capital Bank Financial Corp. - Class A (a) | | 2 | | 65 | |
Capital City Bank Group Inc. (b) | | 2 | | 31 | |
Cardinal Financial Corp. | | 5 | | 99 | |
CareTrust REIT Inc. | | 2 | | 30 | |
Cascade Bancorp (a) | | 4 | | 21 | |
Cash America International Inc. | | 4 | | 88 | |
Centerstate Banks Inc. | | 5 | | 58 | |
Central Pacific Financial Corp. | | 4 | | 95 | |
Century Bancorp Inc. - Class A | | 1 | | 28 | |
Chemical Financial Corp. | | 5 | | 160 | |
Citizens Inc. - Class A (a) (b) | | 11 | | 84 | |
City Holdings Co. | | 2 | | 112 | |
Clifton Bancorp Inc. | | 4 | | 48 | |
See accompanying Notes to Financial Statements.
| | Shares/Par † | | Value | |
CNB Financial Corp. | | 1 | | 27 | |
CoBiz Financial Inc. | | 7 | | 86 | |
Codorus Valley Bancorp Inc. | | 1 | | 12 | |
Columbia Banking System Inc. | | 8 | | 211 | |
Community Bank System Inc. (b) | | 5 | | 181 | |
Community Bankers Trust Corp. (a) | | 1 | | 6 | |
Community Trust Bancorp Inc. (b) | | 3 | | 103 | |
ConnectOne Bancorp Inc. (b) | | 3 | | 58 | |
Consolidated-Tomoka Land Co. | | 1 | | 49 | |
Consumer Portfolio Services Inc. (a) (b) | | 4 | | 29 | |
Cowen Group Inc. - Class A (a) | | 13 | | 61 | |
Crawford & Co. - Class A (b) | | 1 | | 11 | |
Crawford & Co. - Class B | | 4 | | 39 | |
Customers Bancorp Inc. (a) | | 4 | | 72 | |
CVB Financial Corp. (b) | | 1 | | 20 | |
Diamond Hill Investment Group Inc. | | 1 | | 84 | |
Dime Community Bancshares Inc. | | 7 | | 113 | |
Donegal Group Inc. - Class A | | 2 | | 37 | |
Eagle Bancorp Inc. (a) | | 2 | | 54 | |
eHealth Inc. (a) | | 3 | | 81 | |
EMC Insurance Group Inc. | | 2 | | 57 | |
Employer Holdings Inc. | | 4 | | 101 | |
Encore Capital Group Inc. (a) (b) | | 3 | | 126 | |
Enova International Inc. (a) | | 4 | | 79 | |
Enterprise Bancorp Inc. (b) | | 1 | | 36 | |
Enterprise Financial Services Corp. | | 2 | | 45 | |
ESB Financial Corp. (b) | | 3 | | 65 | |
ESSA Bancorp Inc. | | 1 | | 14 | |
Ezcorp Inc. - Class A (a) | | 5 | | 54 | |
Farmers Capital Bank Corp. (a) | | 1 | | 17 | |
Federal Agricultural Mortgage Corp. - Class C | | 1 | | 29 | |
Federated National Holding Co. | | 2 | | 50 | |
Fidelity Southern Corp. | | 3 | | 43 | |
Financial Institutions Inc. | | 2 | | 57 | |
First Bancorp Inc. (b) | | 2 | | 37 | |
First Bancorp Inc. (a) | | 23 | | 137 | |
First Bancorp Inc. (b) | | 1 | | 27 | |
First Busey Corp. (b) | | 14 | | 92 | |
First Business Financial Services Inc. (b) | | 1 | | 28 | |
First Cash Financial Services Inc. (a) | | 1 | | 41 | |
First Commonwealth Financial Corp. | | 11 | | 102 | |
First Community Bancshares Inc. | | 3 | | 49 | |
First Connecticut Bancorp Inc. (b) | | 3 | | 49 | |
First Defiance Financial Corp. | | 1 | | 33 | |
First Financial Bancorp | | 8 | | 153 | |
First Financial Corp. | | 2 | | 62 | |
First Financial Northwest Inc. | | 3 | | 37 | |
First Interstate BancSystem Inc. - Class A (b) | | 2 | | 61 | |
First Merchants Corp. | | 5 | | 124 | |
First Midwest Bancorp Inc. | | 8 | | 143 | |
First NBC Bank Holding Co. (a) | | 1 | | 45 | |
First South Bancorp Inc. | | — | | 3 | |
Flagstar Bancorp Inc. (a) | | 7 | | 112 | |
Flushing Financial Corp. | | 6 | | 113 | |
Forestar Group Inc. (a) | | 6 | | 85 | |
Fox Chase Bancorp Inc. | | 1 | | 24 | |
Franklin Financial Corp. (a) (b) | | 1 | | 25 | |
FRP Holdings Inc. (a) (b) | | 1 | | 36 | |
FXCM Inc. - Class A | | 5 | | 78 | |
Gain Capital Holdings Inc. | | 5 | | 46 | |
German American Bancorp Inc. | | 2 | | 49 | |
GFI Group Inc. | | 18 | | 96 | |
Global Indemnity Plc (a) | | 1 | | 40 | |
Great Southern Bancorp Inc. (b) | | 2 | | 70 | |
Green Dot Corp. - Class A (a) | | 5 | | 105 | |
Greenhill & Co. Inc. (b) | | 4 | | 179 | |
Greenlight Capital Re Ltd. - Class A (a) | | 5 | | 160 | |
Hallmark Financial Services Inc. (a) (b) | | 2 | | 24 | |
Hanmi Financial Corp. | | 4 | | 98 | |
HCI Group Inc. | | 2 | | 69 | |
Heartland Financial USA Inc. | | 2 | | 52 | |
Heritage Commerce Corp. | | 4 | | 36 | |
Heritage Financial Corp. | | 3 | | 56 | |
HF Financial Corp. (b) | | 1 | | 14 | |
HFF Inc. - Class A | | 7 | | 256 | |
Hingham Institution for Savings | | — | | 29 | |
Home Bancorp Inc. | | — | | 8 | |
Horace Mann Educators Corp. | | 6 | | 198 | |
Horizon Bancorp (b) | | 1 | | 25 | |
Hudson Valley Holding Corp. | | 2 | | 62 | |
Imperial Holdings Inc. (a) | | 1 | | 5 | |
Independence Holding Co. (b) | | 1 | | 20 | |
Independent Bank Corp. | | 3 | | 128 | |
Independent Bank Group Inc. (b) | | 1 | | 37 | |
Interactive Brokers Group Inc. | | 6 | | 186 | |
Intervest Bancshares Corp. | | 2 | | 17 | |
INTL FCStone Inc. (a) | | 3 | | 69 | |
Investment Technology Group Inc. (a) | | 1 | | 24 | |
Investors Title Co. (b) | | — | | 28 | |
KCG Holdings Inc. - Class A (a) | | 8 | | 98 | |
Kearny Financial Corp. (a) (b) | | 4 | | 48 | |
Ladenburg Thalmann Financial Services Inc. (a) | | 24 | | 95 | |
Lakeland Bancorp Inc. | | 3 | | 36 | |
Lakeland Financial Corp. | | 3 | | 109 | |
LNB Bancorp Inc. | | 1 | | 20 | |
Macatawa Bank Corp. | | 1 | | 7 | |
Maiden Holdings Ltd. | | 8 | | 104 | |
MainSource Financial Group Inc. (b) | | 3 | | 61 | |
Malvern Bancorp Inc. (a) (b) | | 1 | | 8 | |
Manning & Napier Inc. - Class A | | 3 | | 35 | |
Marlin Business Services Inc. | | 1 | | 30 | |
MB Financial Inc. | | 1 | | 43 | |
MBT Financial Corp. (a) | | 3 | | 15 | |
Mercantile Bank Corp. | | 2 | | 48 | |
Merchants Bancshares Inc. | | 2 | | 49 | |
Meridian Bancorp Inc. (a) | | 4 | | 45 | |
Meta Financial Group Inc. (b) | | 1 | | 26 | |
Metro Bancorp Inc. (a) | | 2 | | 64 | |
MicroFinancial Inc. | | 2 | | 22 | |
Midsouth Bancorp Inc. | | 2 | | 41 | |
MidWestOne Financial Group Inc. | | 1 | | 17 | |
National Bank Holdings Corp. - Class A | | 3 | | 65 | |
National Interstate Corp. (b) | | 2 | | 55 | |
National Penn Bancshares Inc. | | 6 | | 65 | |
National Western Life Insurance Co. - Class A | | — | | 122 | |
Navigators Group Inc. (a) | | 3 | | 206 | |
NBT Bancorp Inc. | | 7 | | 181 | |
NewBridge Bancorp (a) | | 1 | | 11 | |
NewStar Financial Inc. (a) (b) | | 6 | | 77 | |
Nicholas Financial Inc. (a) | | 2 | | 28 | |
Northeast Bancorp | | — | | 2 | |
Northfield Bancorp Inc. | | 6 | | 90 | |
Northrim BanCorp Inc. | | 1 | | 29 | |
Northwest Bancshares Inc. | | 13 | | 161 | |
OceanFirst Financial Corp. | | 2 | | 41 | |
OFG Bancorp (b) | | 5 | | 77 | |
Old National Bancorp | | 5 | | 68 | |
OneBeacon Insurance Group Ltd. - Class A | | 1 | | 15 | |
Oppenheimer Holdings Inc. - Class A | | 2 | | 42 | |
Oritani Financial Corp. | | 7 | | 114 | |
Pacific Continental Corp. | | 3 | | 37 | |
Pacific Mercantile Bancorp (a) | | 1 | | 8 | |
Pacific Premier Bancorp Inc. (a) | | 2 | | 30 | |
See accompanying Notes to Financial Statements.
| | Shares/Par † | | Value | |
Park National Corp. (b) | | 3 | | 231 | |
Park Sterling Corp. | | 6 | | 41 | |
Peapack Gladstone Financial Corp. | | 2 | | 34 | |
Penns Woods Bancorp Inc. (b) | | 1 | | 29 | |
Peoples Bancorp Inc. | | 1 | | 37 | |
PHH Corp. (a) (b) | | 6 | | 142 | |
Phoenix Cos. Inc. (a) | | 1 | | 76 | |
Pico Holdings Inc. (a) | | 3 | | 50 | |
Pinnacle Financial Partners Inc. | | 6 | | 233 | |
Preferred Bank | | 2 | | 55 | |
Premier Financial Bancorp Inc. | | — | | 8 | |
Provident Financial Holdings Inc. | | 2 | | 32 | |
Provident Financial Services Inc. | | 8 | | 144 | |
Prudential Bancorp Inc. | | 1 | | 9 | |
Pulaski Financial Corp. | | 1 | | 14 | |
RCS Capital Corp. - Class A (b) | | 4 | | 49 | |
Regional Management Corp. (a) | | 2 | | 27 | |
Renasant Corp. | | 5 | | 156 | |
Republic Bancorp Inc. - Class A | | 3 | | 82 | |
Resource America Inc. - Class A (b) | | 1 | | 11 | |
S&T Bancorp Inc. | | 4 | | 123 | |
Safeguard Scientifics Inc. (a) | | 3 | | 57 | |
Safety Insurance Group Inc. | | 2 | | 135 | |
Sandy Spring Bancorp Inc. | | 4 | | 98 | |
Seacoast Banking Corp. of Florida (a) | | — | | 4 | |
Security National Financial Corp. - Class A (a) | | 1 | | 6 | |
Selective Insurance Group | | 6 | | 176 | |
Shore Bancshares Inc. (a) | | 1 | | 10 | |
Sierra Bancorp (b) | | 2 | | 37 | |
Simmons First National Corp. - Class A | | 3 | | 125 | |
Simplicity Bancorp Inc. | | 1 | | 20 | |
South State Corp. (b) | | 3 | | 216 | |
Southside Bancshares Inc. | | 3 | | 85 | |
Southwest Bancorp Inc. | | 3 | | 59 | |
State Auto Financial Corp. | | 7 | | 152 | |
Sterling Bancorp | | 12 | | 169 | |
Stewart Information Services Corp. | | 2 | | 92 | |
Stock Yards Bancorp Inc. | | 3 | | 87 | |
Suffolk Bancorp | | 2 | | 48 | |
Sun Bancorp Inc. (a) (b) | | 3 | | 49 | |
Tejon Ranch Co. (a) (b) | | 4 | | 126 | |
Territorial Bancorp Inc. (b) | | 1 | | 28 | |
Tompkins Financial Corp. | | 3 | | 154 | |
TowneBank | | 3 | | 52 | |
Tree.com Inc. (a) (b) | | 1 | | 48 | |
Trico Bancshares | | 2 | | 47 | |
TrustCo Bank Corp. (b) | | 14 | | 99 | |
Union Bankshares Corp. (b) | | 7 | | 168 | |
United Community Banks Inc. | | 6 | | 107 | |
United Community Financial Corp. (b) | | 3 | | 17 | |
United Financial Bancorp Inc. | | 8 | | 116 | |
United Fire Group Inc. | | 3 | | 102 | |
Universal Insurance Holdings Inc. | | 5 | | 96 | |
Univest Corp. of Pennsylvania (b) | | 2 | | 41 | |
ViewPoint Financial Group | | 5 | | 131 | |
Virtus Investment Partners Inc. | | — | | 17 | |
Walker & Dunlop Inc. (a) | | 3 | | 59 | |
Washington Trust Bancorp Inc. | | 2 | | 95 | |
Waterstone Financial Inc. (b) | | 8 | | 110 | |
WesBanco Inc. | | 4 | | 138 | |
West Bancorp Inc. (b) | | 2 | | 29 | |
Westamerica Bancorporation (b) | | 4 | | 175 | |
Western Alliance Bancorp (a) | | 2 | | 50 | |
Westfield Financial Inc. | | 6 | | 43 | |
Westwood Holdings Group Inc. | | 1 | | 53 | |
Wilshire Bancorp Inc. | | 10 | | 102 | |
WisdomTree Investments Inc. | | 4 | | 59 | |
World Acceptance Corp. (a) (b) | | 1 | | 78 | |
WSFS Financial Corp. | | 1 | | 99 | |
Yadkin Financial Corp. (a) | | 2 | | 34 | |
| | | | 17,727 | |
HEALTH CARE - 10.5% | | | | | |
Achillion Pharmaceuticals Inc. (a) (b) | | 11 | | 129 | |
Acorda Therapeutics Inc. (a) | | 4 | | 156 | |
Addus HomeCare Corp. (a) | | 2 | | 50 | |
Affymetrix Inc. (a) | | 14 | | 135 | |
Albany Molecular Research Inc. (a) (b) | | 6 | | 101 | |
Alliance HealthCare Services Inc. (a) | | — | | 8 | |
Almost Family Inc. (a) | | 1 | | 34 | |
AMAG Pharmaceuticals Inc. (a) | | 2 | | 65 | |
Amedisys Inc. (a) | | 8 | | 238 | |
Amicus Therapeutics Inc. (a) | | 1 | | 7 | |
AMN Healthcare Services Inc. (a) | | 5 | | 94 | |
Amsurg Corp. (a) | | 2 | | 86 | |
Anacor Pharmaceuticals Inc. (a) | | — | | 14 | |
Analogic Corp. | | 2 | | 130 | |
AngioDynamics Inc. (a) | | 5 | | 94 | |
Anika Therapeutics Inc. (a) | | 1 | | 61 | |
Atrion Corp. (b) | | — | | 153 | |
Auxilium Pharmaceuticals Inc. (a) (b) | | 12 | | 417 | |
Bio-Reference Labs Inc. (a) (b) | | 4 | | 123 | |
BioDelivery Sciences International Inc. (a) (b) | | 1 | | 12 | |
BioScrip Inc. (a) | | 13 | | 89 | |
BioTelemetry Inc. (a) | | 3 | | 27 | |
Bovie Medical Corp. (a) | | 1 | | 2 | |
Cambrex Corp. (a) | | 4 | | 96 | |
Cantel Medical Corp. | | 7 | | 290 | |
Capital Senior Living Corp. (a) | | 4 | | 105 | |
Codexis Inc. (a) (b) | | 7 | | 17 | |
Computer Programs & Systems Inc. (b) | | 2 | | 130 | |
Conmed Corp. | | 3 | | 127 | |
Corvel Corp. (a) | | 4 | | 137 | |
Cross Country Healthcare Inc. (a) | | 4 | | 47 | |
CryoLife Inc. | | 9 | | 98 | |
Cumberland Pharmaceuticals Inc. (a) (b) | | 3 | | 17 | |
Cutera Inc. (a) | | 3 | | 28 | |
Cyberonics Inc. (a) | | 1 | | 49 | |
Cynosure Inc. - Class A (a) | | 3 | | 72 | |
DepoMed Inc. (a) | | 6 | | 97 | |
Emergent BioSolutions Inc. (a) | | 4 | | 105 | |
Ensign Group Inc. | | 4 | | 171 | |
Enzo Biochem Inc. (a) | | 6 | | 27 | |
Exactech Inc. (a) | | 2 | | 39 | |
ExamWorks Group Inc. (a) | | 2 | | 72 | |
Five Star Quality Care Inc. (a) | | 9 | | 38 | |
Gentiva Health Services Inc. (a) | | 6 | | 118 | |
Greatbatch Inc. (a) | | 3 | | 166 | |
Hanger Orthopedic Group Inc. (a) (b) | | 4 | | 80 | |
Harvard Apparatus Regenerative Technology Inc. (a) | | 1 | | 5 | |
Harvard Bioscience Inc. (a) | | 6 | | 32 | |
Healthways Inc. (a) | | 6 | | 112 | |
ICU Medical Inc. (a) | | 2 | | 165 | |
Insys Therapeutics Inc. (a) (b) | | 4 | | 150 | |
Invacare Corp. (b) | | 4 | | 65 | |
IPC The Hospitalist Co. Inc. (a) | | 3 | | 143 | |
Iridex Corp. (a) (b) | | 2 | | 14 | |
Kindred Healthcare Inc. | | 7 | | 125 | |
Landauer Inc. | | 1 | | 34 | |
Lannett Co. Inc. (a) | | 1 | | 45 | |
LeMaitre Vascular Inc. | | 3 | | 20 | |
LHC Group Inc. (a) | | 4 | | 126 | |
Ligand Pharmaceuticals Inc. (a) (b) | | 2 | | 114 | |
Luminex Corp. (a) | | 4 | | 83 | |
See accompanying Notes to Financial Statements.
| | Shares/Par † | | Value | |
Masimo Corp. (a) | | 5 | | 128 | |
MedAssets Inc. (a) | | 6 | | 122 | |
Merge Healthcare Inc. (a) | | 6 | | 22 | |
Meridian Bioscience Inc. | | 6 | | 99 | |
Merit Medical Systems Inc. (a) | | 7 | | 113 | |
MiMedx Group Inc. (a) (b) | | 1 | | 12 | |
Misonix Inc. (a) (b) | | 1 | | 11 | |
Momenta Pharmaceuticals Inc. (a) | | 10 | | 119 | |
National Healthcare Corp. | | 1 | | 92 | |
National Research Corp. - Class A (b) | | 5 | | 68 | |
National Research Corp. - Class B (b) | | 1 | | 29 | |
Natus Medical Inc. (a) | | 6 | | 216 | |
Omnicell Inc. (a) | | 5 | | 152 | |
Oncothyreon Inc. (a) | | 2 | | 3 | |
OraSure Technologies Inc. (a) | | 11 | | 112 | |
Orthofix International NV (a) | | 3 | | 79 | |
Pain Therapeutics Inc. (a) | | 5 | | 11 | |
Paratek Pharmaceuticals Inc. | | 1 | | 20 | |
PDI Inc. (a) (b) | | 2 | | 4 | |
PDL BioPharma Inc. (b) | | 21 | | 163 | |
Pernix Therapeutics Holdings (a) | | 4 | | 37 | |
PharMerica Corp. (a) | | 6 | | 117 | |
PhotoMedex Inc. (a) (b) | | 2 | | 3 | |
Pozen Inc. (a) | | 4 | | 31 | |
Progenics Pharmaceuticals Inc. (a) (b) | | 9 | | 71 | |
Providence Services Corp. (a) | | 2 | | 77 | |
Quality Systems Inc. | | 9 | | 138 | |
Quidel Corp. (a) | | 3 | | 88 | |
RadNet Inc. (a) | | 4 | | 37 | |
Receptos Inc. (a) | | — | | 54 | |
Repligen Corp. (a) | | 6 | | 116 | |
Rigel Pharmaceuticals Inc. (a) (b) | | 11 | | 25 | |
RTI Surgical Inc. (a) | | 13 | | 65 | |
Sagent Pharmaceuticals Inc. (a) | | 5 | | 128 | |
Sciclone Pharmaceuticals Inc. (a) | | 11 | | 97 | |
Select Medical Holdings Corp. | | 1 | | 14 | |
Skilled Healthcare Group Inc. - Class A (a) | | 5 | | 39 | |
Span-America Medical Systems Inc. | | — | | 4 | |
Spectrum Pharmaceuticals Inc. (a) (b) | | 7 | | 47 | |
Sucampo Pharmaceuticals Inc. - Class A (a) | | 9 | | 132 | |
SurModics Inc. (a) | | 4 | | 78 | |
Symmetry Surgical Inc. (a) | | 1 | | 7 | |
Targacept Inc. (a) (b) | | 6 | | 17 | |
Tornier BV (a) | | 11 | | 291 | |
Transcept Pharmaceuticals, Inc. (a) (c) (d) (e) | | 6 | | — | |
Triple-S Management Corp. - Class B (a) | | 5 | | 117 | |
Universal American Corp. (a) | | 19 | | 181 | |
US Physical Therapy Inc. | | 3 | | 138 | |
Utah Medical Products Inc. | | 1 | | 50 | |
Vascular Solutions Inc. (a) | | 2 | | 67 | |
Volcano Corp. (a) | | 4 | | 75 | |
Wright Medical Group Inc. (a) | | 12 | | 311 | |
| | | | 9,811 | |
INDUSTRIALS - 18.7% | | | | | |
AAON Inc. | | 10 | | 233 | |
AAR Corp. | | 5 | | 138 | |
ABM Industries Inc. | | 5 | | 155 | |
Acacia Research Corp. (b) | | 7 | | 122 | |
ACCO Brands Corp. (a) | | 17 | | 151 | |
Accuride Corp. (a) | | 6 | | 28 | |
Aceto Corp. | | 6 | | 121 | |
Aegion Corp. (a) | | 4 | | 72 | |
Aerovironment Inc. (a) (b) | | 2 | | 66 | |
Air Transport Services Group Inc. (a) | | 12 | | 99 | |
Alamo Group Inc. | | 2 | | 94 | |
Albany International Corp. - Class A | | 5 | | 195 | |
Allied Motion Technologies Inc. (b) | | 1 | | 14 | |
Altra Holdings Inc. | | 4 | | 112 | |
Ameresco Inc. - Class A (a) (b) | | 4 | | 29 | |
American Railcar Industries Inc. (b) | | 3 | | 159 | |
American Science & Engineering Inc. | | 1 | | 63 | |
American Woodmark Corp. (a) | | 3 | | 138 | |
Ampco-Pittsburgh Corp. | | 3 | | 59 | |
Apogee Enterprises Inc. | | 4 | | 178 | |
ARC Document Solutions Inc. (a) | | 6 | | 61 | |
ArcBest Corp. | | 3 | | 124 | |
Argan Inc. | | 3 | | 85 | |
Astec Industries Inc. | | 4 | | 145 | |
Astronics Corp. (a) | | 1 | | 80 | |
Astronics Corp. - Class B (a) | | 2 | | 86 | |
Atlas Air Worldwide Holdings Inc. (a) | | 3 | | 128 | |
AZZ Inc. | | 4 | | 185 | |
Baltic Trading Ltd. | | 5 | | 13 | |
Barrett Business Services Inc. (b) | | 1 | | 29 | |
Blount International Inc. (a) | | 10 | | 171 | |
Brady Corp. - Class A | | 3 | | 68 | |
Briggs & Stratton Corp. (b) | | 6 | | 120 | |
Brink’s Co. | | 6 | | 153 | |
CAI International Inc. (a) (b) | | 3 | | 60 | |
CBIZ Inc. (a) | | 7 | | 57 | |
CDI Corp. | | 3 | | 55 | |
Ceco Environmental Corp. (b) | | 4 | | 60 | |
Celadon Group Inc. | | 3 | | 74 | |
Cenveo Corp. (a) | | 4 | | 9 | |
CIRCOR International Inc. | | 2 | | 110 | |
Columbus Mckinnon Corp. | | 3 | | 74 | |
Comfort Systems USA Inc. | | 4 | | 67 | |
Commercial Vehicle Group Inc. (a) | | 6 | | 38 | |
Courier Corp. | | 2 | | 30 | |
Covenant Transportation Group Inc. - Class A (a) | | 2 | | 47 | |
CPI Aerostructures Inc. (a) | | 3 | | 35 | |
CTPartners Executive Search Inc. (a) | | 1 | | 9 | |
Cubic Corp. | | 3 | | 165 | |
Douglas Dynamics Inc. | | 4 | | 88 | |
Ducommun Inc. (a) | | 3 | | 83 | |
DXP Enterprises Inc. (a) | | 1 | | 74 | |
Dycom Industries Inc. (a) | | 3 | | 123 | |
Dynamic Materials Corp. | | 2 | | 31 | |
Eastern Co. | | 1 | | 10 | |
Echo Global Logistics Inc. (a) | | 5 | | 160 | |
Encore Wire Corp. | | 3 | | 103 | |
Energy Recovery Inc. (a) (b) | | 10 | | 54 | |
EnerNOC Inc. (a) (b) | | 5 | | 82 | |
Engility Holdings Inc. (a) | | 2 | | 78 | |
Ennis Inc. | | 4 | | 57 | |
ESCO Technologies Inc. | | 4 | | 137 | |
Espey Manufacturing & Electronics Corp. | | 1 | | 15 | |
Exponent Inc. | | 2 | | 174 | |
Federal Signal Corp. | | 8 | | 117 | |
Forward Air Corp. | | 4 | | 211 | |
Franklin Covey Co. (a) | | 2 | | 48 | |
FreightCar America Inc. | | 2 | | 65 | |
FTI Consulting Inc. (a) | | 1 | | 52 | |
Fuel Tech Inc. (a) | | 4 | | 14 | |
Furmanite Corp. (a) | | 7 | | 55 | |
G&K Services Inc. - Class A | | 3 | | 185 | |
GenCorp Inc. (a) (b) | | 9 | | 161 | |
Gibraltar Industries Inc. (a) | | 4 | | 69 | |
Global Brass & Copper Holdings Inc. | | 1 | | 8 | |
Global Power Equipment Group Inc. | | 3 | | 41 | |
Goldfield Corp. (a) | | 3 | | 8 | |
Gorman-Rupp Co. | | 5 | | 153 | |
GP Strategies Corp. (a) | | 3 | | 95 | |
See accompanying Notes to Financial Statements.
| | Shares/Par † | | Value | |
GrafTech International Ltd. (a) | | 14 | | 71 | |
Graham Corp. | | 1 | | 36 | |
Granite Construction Inc. | | 4 | | 164 | |
Great Lakes Dredge & Dock Corp. (a) | | 7 | | 57 | |
Greenbrier Cos. Inc. (b) | | 1 | | 69 | |
Griffon Corp. (b) | | 12 | | 157 | |
H&E Equipment Services Inc. | | 5 | | 137 | |
Hardinge Inc. | | 2 | | 25 | |
Hawaiian Holdings Inc. (a) (b) | | 8 | | 198 | |
Heidrick & Struggles International Inc. | | 3 | | 65 | |
Heritage-Crystal Clean Inc. (a) | | — | | 3 | |
Hill International Inc. (a) (b) | | 4 | | 15 | |
Houston Wire & Cable Co. | | 3 | | 31 | |
HUB Group Inc. - Class A (a) | | 3 | | 126 | |
Hudson Global Inc. (a) | | 2 | | 5 | |
Hurco Cos. Inc. | | 1 | | 31 | |
Huron Consulting Group Inc. (a) | | 1 | | 38 | |
Hyster-Yale Materials Handling Inc. - Class A | | 1 | | 72 | |
ICF International Inc. (a) | | 2 | | 91 | |
II-VI Inc. (a) (b) | | 6 | | 86 | |
InnerWorkings Inc. (a) | | 2 | | 14 | |
Innovative Solutions & Support Inc. (a) | | — | | 1 | |
Insperity Inc. | | 3 | | 117 | |
Insteel Industries Inc. | | 4 | | 83 | |
Interface Inc. | | 10 | | 171 | |
International Shipholding Corp. (b) | | — | | 6 | |
Intersections Inc. (b) | | 3 | | 10 | |
John Bean Technologies Corp. | | 4 | | 128 | |
Kaman Corp. - Class A | | 4 | | 169 | |
Kelly Services Inc. - Class A (b) | | 4 | | 60 | |
Keyw Holding Corp. (a) (b) | | 4 | | 40 | |
Kforce Inc. | | 4 | | 98 | |
Kimball International Inc. - Class B | | 3 | | 31 | |
Knoll Inc. | | 8 | | 161 | |
Korn/Ferry International (a) | | 8 | | 218 | |
Kratos Defense & Security Solutions Inc. (a) | | 6 | | 30 | |
Layne Christensen Co. (a) (b) | | 4 | | 36 | |
LB Foster Co. | | 2 | | 80 | |
Lindsay Corp. (b) | | 1 | | 112 | |
LMI Aerospace Inc. (a) | | 2 | | 34 | |
LS Starrett Co. - Class A | | — | | 10 | |
LSI Industries Inc. | | 2 | | 15 | |
Lydall Inc. (a) | | 2 | | 66 | |
Magnetek Inc. (a) | | — | | 12 | |
Marten Transport Ltd. | | 6 | | 130 | |
Matson Inc. | | 8 | | 277 | |
McGrath RentCorp | | 5 | | 191 | |
Meritor Inc. (a) | | 14 | | 216 | |
Miller Industries Inc. (b) | | 2 | | 40 | |
Mistras Group Inc. (a) | | 5 | | 83 | |
Mueller Water Products Inc. - Class A | | 11 | | 116 | |
Multi-Color Corp. (b) | | 3 | | 169 | |
MYR Group Inc. (a) | | 3 | | 74 | |
NACCO Industries Inc. - Class A | | 1 | | 59 | |
National Presto Industries Inc. (b) | | 1 | | 57 | |
Navigant Consulting Inc. (a) | | 7 | | 102 | |
NCI Building Systems Inc. (a) | | 1 | | 27 | |
NL Industries Inc. | | 2 | | 17 | |
NN Inc. | | 4 | | 82 | |
Nordic American Offshore Ltd. (b) | | — | | 1 | |
Nortek Inc. (a) | | 3 | | 205 | |
Northwest Pipe Co. (a) | | 1 | | 36 | |
Omega Flex Inc. | | 1 | | 39 | |
Orbital Sciences Corp. (a) | | 1 | | 19 | |
Orion Energy Systems Inc. (a) | | 2 | | 13 | |
Orion Marine Group Inc. (a) | | 4 | | 48 | |
Overseas Shipholding Group Inc. - Class B (a) (b) | | 12 | | 68 | |
PAM Transportation Services Inc. (a) | | 1 | | 57 | |
Park-Ohio Holdings Corp. | | 3 | | 174 | |
Patrick Industries Inc. (a) | | 2 | | 94 | |
Pendrell Corp. (a) | | 8 | | 11 | |
Performant Financial Corp. (a) | | 3 | | 20 | |
PGT Inc. (a) | | 6 | | 63 | |
PMFG Inc. (a) | | 5 | | 25 | |
Powell Industries Inc. | | 1 | | 61 | |
PowerSecure International Inc. (a) | | 3 | | 32 | |
Preformed Line Products Co. (b) | | — | | 5 | |
Primoris Services Corp. | | 7 | | 167 | |
Providence and Worcester Railroad Co. | | — | | 5 | |
Quad/Graphics Inc. - Class A | | 4 | | 82 | |
Quality Distribution Inc. (a) | | 5 | | 49 | |
Quanex Building Products Corp. | | 7 | | 126 | |
Raven Industries Inc. (b) | | 5 | | 131 | |
RBC Bearings Inc. | | 3 | | 210 | |
Republic Airways Holdings Inc. (a) | | 5 | | 75 | |
Resources Connection Inc. | | 10 | | 168 | |
Roadrunner Transportation Systems Inc. (a) | | 5 | | 109 | |
RPX Corp. (a) | | 6 | | 76 | |
Rush Enterprises Inc. - Class A (a) | | 4 | | 141 | |
Saia Inc. (a) | | 5 | | 275 | |
SIFCO Industries Inc. | | 1 | | 35 | |
SkyWest Inc. | | 5 | | 70 | |
SL Industries Inc. (a) | | 1 | | 19 | |
SP Plus Corp. (a) | | 5 | | 118 | |
Sparton Corp. (a) | | 2 | | 51 | |
Standex International Corp. | | 3 | | 212 | |
Sterling Construction Co. Inc. (a) | | 2 | | 14 | |
Sun Hydraulics Corp. | | 4 | | 157 | |
Supreme Industries Inc. - Class A | | 3 | | 18 | |
Sypris Solutions Inc. | | 5 | | 12 | |
TAL International Group Inc. (b) | | 3 | | 123 | |
Taser International Inc. (a) (b) | | 7 | | 178 | |
Team Inc. (a) | | 3 | | 104 | |
Tecumseh Products Co. (a) | | 2 | | 7 | |
Tennant Co. | | 3 | | 224 | |
Thermon Group Holdings Inc. (a) | | 5 | | 129 | |
Titan International Inc. (b) | | 6 | | 59 | |
Titan Machinery Inc. (a) (b) | | 3 | | 44 | |
TRC Cos. Inc. (a) | | 1 | | 6 | |
Trex Co. Inc. (a) | | 4 | | 164 | |
TriMas Corp. (a) | | 3 | | 103 | |
TrueBlue Inc. (a) | | 5 | | 121 | |
Tutor Perini Corp. (a) | | 5 | | 120 | |
Twin Disc Inc. | | 2 | | 43 | |
Ultralife Corp. (a) | | — | | — | |
Ultrapetrol Bahamas Ltd. (a) | | 1 | | 3 | |
Universal Forest Products Inc. | | 3 | | 152 | |
Universal Truckload Services Inc. | | 3 | | 89 | |
US Ecology Inc. | | 4 | | 148 | |
USA Truck Inc. (a) | | — | | 13 | |
UTi Worldwide Inc. (a) | | 12 | | 140 | |
Versar Inc. (a) | | 2 | | 7 | |
Viad Corp. | | 3 | | 73 | |
Vicor Corp. (a) | | 2 | | 20 | |
VSE Corp. (b) | | 1 | | 59 | |
Wabash National Corp. (a) (b) | | 7 | | 88 | |
YRC Worldwide Inc. (a) | | 1 | | 19 | |
| | | | 17,461 | |
INFORMATION TECHNOLOGY - 19.3% | | | | | |
Actua Corp. (a) | | 5 | | 88 | |
Actuate Corp. (a) | | 7 | | 43 | |
ADTRAN Inc. | | 6 | | 123 | |
See accompanying Notes to Financial Statements.
| | Shares/Par † | | Value | |
Advanced Energy Industries Inc. (a) | | 5 | | 114 | |
Advent Software Inc. | | 1 | | 25 | |
Agilysys Inc. (a) | | 3 | | 40 | |
Alliance Fiber Optic Products Inc. | | 1 | | 8 | |
Alpha & Omega Semiconductor Ltd. (a) (b) | | 4 | | 36 | |
American Software Inc. - Class A | | 5 | | 48 | |
Amtech Systems Inc. (a) | | 2 | | 16 | |
Anadigics Inc. (a) (b) | | 10 | | 8 | |
Audience Inc. (a) | | 2 | | 10 | |
AVG Technologies NV (a) | | 6 | | 125 | |
Avid Technology Inc. (a) | | 2 | | 32 | |
Aware Inc. (b) | | 5 | | 22 | |
Axcelis Technologies Inc. (a) | | 2 | | 5 | |
AXT Inc. (a) (b) | | 12 | | 32 | |
Badger Meter Inc. | | 3 | | 175 | |
Bazaarvoice Inc. (a) (b) | | 2 | | 19 | |
Bel Fuse Inc. - Class B | | 3 | | 70 | |
Blackbaud Inc. | | — | | 8 | |
Blackhawk Network Holdings Inc. - Class B (a) | | 2 | | 66 | |
Blucora Inc. (a) | | 4 | | 59 | |
Bottomline Technologies Inc. (a) | | 6 | | 154 | |
BroadVision Inc. (a) (b) | | 2 | | 11 | |
Brooks Automation Inc. | | 7 | | 88 | |
Cabot Microelectronics Corp. (a) | | 3 | | 139 | |
CalAmp Corp. (a) (b) | | 4 | | 70 | |
Calix Inc. (a) | | 8 | | 77 | |
Cascade Microtech Inc. (a) | | 2 | | 34 | |
Cass Information Systems Inc. | | 2 | | 118 | |
Ceva Inc. (a) | | 2 | | 42 | |
Checkpoint Systems Inc. (a) | | 7 | | 91 | |
Ciber Inc. (a) | | 17 | | 61 | |
Cinedigm Corp. (a) | | 2 | | 3 | |
Cirrus Logic Inc. (a) | | 9 | | 214 | |
Clearfield Inc. (a) (b) | | 2 | | 28 | |
Coherent Inc. (a) | | 2 | | 96 | |
Cohu Inc. | | 4 | | 49 | |
Communications Systems Inc. | | 1 | | 13 | |
Computer Task Group Inc. | | 4 | | 38 | |
comScore Inc. (a) | | 7 | | 337 | |
Comtech Telecommunications Corp. | | 2 | | 63 | |
Comverse Inc. (a) | | 4 | | 68 | |
Concurrent Computer Corp. | | 1 | | 10 | |
Constant Contact Inc. (a) | | 8 | | 282 | |
Cray Inc. (a) | | 11 | | 373 | |
CSG Systems International Inc. | | 6 | | 139 | |
Daktronics Inc. | | 4 | | 56 | |
Datalink Corp. (a) | | 4 | | 50 | |
Demand Media Inc. (a) | | 4 | | 25 | |
Dice Holdings Inc. (a) | | 9 | | 91 | |
Digi International Inc. (a) | | 4 | | 41 | |
Digimarc Corp. (b) | | — | | 8 | |
Digital River Inc. (a) | | 5 | | 124 | |
Diodes Inc. (a) | | 5 | | 135 | |
DSP Group Inc. (a) | | 4 | | 40 | |
DTS Inc. (a) | | 3 | | 89 | |
EarthLink Holdings Corp. | | 23 | | 99 | |
Eastman Kodak Co. (a) | | 1 | | 17 | |
Ebix Inc. (b) | | 4 | | 67 | |
Electro Rent Corp. | | 4 | | 56 | |
Electro Scientific Industries Inc. | | 3 | | 24 | |
Ellie Mae Inc. (a) (b) | | 6 | | 253 | |
eMagin Corp. (a) (b) | | 2 | | 6 | |
Emcore Corp. (a) | | 5 | | 26 | |
Emulex Corp. (a) (b) | | 7 | | 41 | |
Entropic Communications Inc. (a) | | 9 | | 23 | |
Envestnet Inc. (a) | | 1 | | 67 | |
EPIQ Systems Inc. | | 4 | | 63 | |
ePlus Inc. (a) | | 1 | | 109 | |
Exar Corp. (a) (b) | | 5 | | 55 | |
ExlService Holdings Inc. (a) | | 4 | | 114 | |
Extreme Networks (a) | | 14 | | 49 | |
Fabrinet (a) | | 4 | | 64 | |
FARO Technologies Inc. (a) | | 2 | | 139 | |
FormFactor Inc. (a) | | 10 | | 87 | |
Forrester Research Inc. | | 5 | | 190 | |
Global Cash Access Holdings Inc. (a) | | 7 | | 49 | |
Globalscape Inc. | | 4 | | 9 | |
GSI Group Inc. (a) | | 6 | | 87 | |
GSI Technology Inc. (a) (b) | | 2 | | 9 | |
Hackett Group Inc. | | 6 | | 54 | |
Harmonic Inc. (a) | | 9 | | 66 | |
Heartland Payment Systems Inc. (b) | | 4 | | 211 | |
Higher One Holdings Inc. (a) | | 6 | | 24 | |
Hutchinson Technology Inc. (a) (b) | | 4 | | 15 | |
ID Systems Inc. (a) (b) | | 2 | | 11 | |
IEC Electronics Corp. (a) | | 2 | | 7 | |
Imation Corp. (a) | | 7 | | 26 | |
Immersion Corp. (a) | | 2 | | 23 | |
Infinera Corp. (a) (b) | | 21 | | 303 | |
Innodata Inc. (a) | | 6 | | 17 | |
Inphi Corp. (a) | | 5 | | 98 | |
Insight Enterprises Inc. (a) | | 7 | | 181 | |
Integrated Device Technology Inc. (a) | | 3 | | 59 | |
Integrated Silicon Solutions Inc. (b) | | 5 | | 80 | |
InterDigital Inc. | | 1 | | 74 | |
Internap Corp. (a) | | 12 | | 92 | |
Intevac Inc. (a) | | 1 | | 9 | |
IntraLinks Holdings Inc. (a) | | 6 | | 69 | |
Itron Inc. (a) | | 1 | | 53 | |
Ixia (a) (b) | | 9 | | 106 | |
IXYS Corp. | | 4 | | 51 | |
Kemet Corp. (a) | | 8 | | 35 | |
Key Tronic Corp. (a) (b) | | 4 | | 32 | |
Kimball Electronics Inc. (a) | | 3 | | 30 | |
Kofax Ltd. (a) | | 10 | | 73 | |
Kopin Corp. (a) | | 9 | | 33 | |
Kulicke & Soffa Industries Inc. (a) | | 15 | | 210 | |
KVH Industries Inc. (a) (b) | | 3 | | 34 | |
Lattice Semiconductor Corp. (a) | | 12 | | 84 | |
Limelight Networks Inc. (a) | | 14 | | 40 | |
Lionbridge Technologies Inc. (a) | | 9 | | 53 | |
LoJack Corp. (a) (b) | | 1 | | 3 | |
Magnachip Semiconductor Corp. (a) | | 4 | | 47 | |
Mantech International Corp. - Class A | | 4 | | 132 | |
Marchex Inc. - Class B | | 4 | | 17 | |
MaxLinear Inc. - Class A (a) | | 1 | | 10 | |
Maxwell Technologies Inc. (a) (b) | | 3 | | 28 | |
MeetMe Inc. (a) (b) | | 7 | | 10 | |
Mercury Systems Inc. (a) | | 6 | | 83 | |
Mesa Laboratories Inc. (b) | | — | | 37 | |
Methode Electronics Inc. | | 7 | | 238 | |
Micrel Inc. | | 11 | | 153 | |
MOCON Inc. | | 1 | | 12 | |
MoneyGram International Inc. (a) | | 4 | | 34 | |
Monolithic Power Systems Inc. | | 9 | | 442 | |
Monotype Imaging Holdings Inc. | | 7 | | 197 | |
Monster Worldwide Inc. (a) | | 10 | | 48 | |
MoSys Inc. (a) (b) | | 5 | | 9 | |
MTS Systems Corp. | | 2 | | 145 | |
Multi-Fineline Electronix Inc. (a) | | 2 | | 25 | |
Nanometrics Inc. (a) | | 4 | | 71 | |
NAPCO Security Technologies Inc. (a) | | 1 | | 6 | |
NCI Inc. - Class A (a) | | 2 | | 20 | |
NeoPhotonics Corp. (a) | | 3 | | 11 | |
See accompanying Notes to Financial Statements.
| | Shares/Par † | | Value | |
NetGear Inc. (a) | | 5 | | 195 | |
NetScout Systems Inc. (a) | | 7 | | 253 | |
Newport Corp. (a) | | 6 | | 110 | |
NIC Inc. | | 7 | | 119 | |
Novatel Wireless Inc. (a) | | 6 | | 19 | |
Oclaro Inc. (a) | | 6 | | 12 | |
Omnivision Technologies Inc. (a) | | 11 | | 275 | |
Optical Cable Corp. | | 1 | | 3 | |
OSI Systems Inc. (a) | | 3 | | 191 | |
PAR Technology Corp. (a) | | — | | 3 | |
Park Electrochemical Corp. (b) | | 4 | | 92 | |
PC Connection Inc. | | 3 | | 74 | |
PCM Inc. (a) | | 1 | | 10 | |
PDF Solutions Inc. (a) | | 4 | | 66 | |
Pegasystems Inc. | | 1 | | 27 | |
Perceptron Inc. | | 2 | | 22 | |
Perficient Inc. (a) | | 4 | | 66 | |
Pericom Semiconductor Corp. (a) | | 4 | | 51 | |
Photronics Inc. (a) | | 9 | | 74 | |
Planar Systems Inc. (a) | | 3 | | 21 | |
Plexus Corp. (a) | | 4 | | 154 | |
PMC - Sierra Inc. (a) | | 19 | | 171 | |
Power Integrations Inc. | | 2 | | 118 | |
PRGX Global Inc. (a) (b) | | 5 | | 29 | |
Procera Networks Inc. (a) (b) | | 2 | | 17 | |
Progress Software Corp. (a) | | 7 | | 185 | |
QAD Inc. - Class A | | 2 | | 35 | |
QLogic Corp. (a) | | 10 | | 129 | |
QuinStreet Inc. (a) | | 7 | | 45 | |
Qumu Corp. (a) | | 3 | | 40 | |
Radisys Corp. (a) | | 4 | | 10 | |
Rambus Inc. (a) | | 24 | | 262 | |
RealD Inc. (a) (b) | | 7 | | 85 | |
RealNetworks Inc. (a) | | 2 | | 13 | |
Reis Inc. | | 2 | | 47 | |
RF Industries Ltd. | | 2 | | 8 | |
Rightside Group Ltd. (a) | | 2 | | 12 | |
Rofin-Sinar Technologies Inc. (a) | | 3 | | 83 | |
Rogers Corp. (a) | | 3 | | 213 | |
Rosetta Stone Inc. (a) | | 3 | | 34 | |
Rubicon Technology Inc. (a) (b) | | 3 | | 12 | |
Rudolph Technologies Inc. (a) | | 3 | | 35 | |
ScanSource Inc. (a) | | 4 | | 141 | |
SeaChange International Inc. (a) | | 7 | | 43 | |
ServiceSource International Inc. (a) (b) | | 5 | | 23 | |
ShoreTel Inc. (a) | | 11 | | 83 | |
Sigma Designs Inc. (a) | | 7 | | 51 | |
Silicon Graphics International Corp. (a) | | 1 | | 7 | |
Silicon Image Inc. (a) | | 8 | | 44 | |
SMTC Corp. (a) | | 1 | | 3 | |
Sonus Networks Inc. (a) | | 32 | | 128 | |
Spansion Inc. - Class A (a) | | 9 | | 317 | |
Stamps.com Inc. (a) | | 2 | | 107 | |
StarTek Inc. (a) | | — | | 4 | |
Super Micro Computer Inc. (a) | | 6 | | 209 | |
support.com Inc. (a) | | 9 | | 18 | |
Sykes Enterprises Inc. (a) | | 5 | | 123 | |
Synchronoss Technologies Inc. (a) | | 1 | | 62 | |
Tangoe Inc. (a) | | — | | 4 | |
TeleCommunication Systems Inc. - Class A (a) | | 5 | | 15 | |
TeleNav Inc. (a) | | 7 | | 44 | |
TeleTech Holdings Inc. (a) | | 9 | | 205 | |
Tessco Technologies Inc. | | 2 | | 51 | |
Tessera Technologies Inc. | | 12 | | 428 | |
TiVo Inc. (a) | | 12 | | 140 | |
Transact Technologies Inc. | | — | | 1 | |
Travelzoo Inc. (a) | | 2 | | 27 | |
TriQuint Semiconductor Inc. (a) | | 39 | | 1,062 | |
TTM Technologies Inc. (a) | | 10 | | 74 | |
Ultra Clean Holdings Inc. (a) | | 3 | | 28 | |
Ultratech Inc. (a) | | 3 | | 54 | |
Unisys Corp. (a) (b) | | 5 | | 160 | |
United Online Inc. (a) | | 3 | | 45 | |
Universal Display Corp. (a) (b) | | 1 | | 19 | |
VASCO Data Security International Inc. (a) | | 3 | | 71 | |
Veeco Instruments Inc. (a) | | 5 | | 190 | |
Viasystems Group Inc. (a) | | — | | 7 | |
Virtusa Corp. (a) | | 4 | | 167 | |
Vishay Precision Group Inc. (a) | | 2 | | 37 | |
Wayside Technology Group Inc. | | — | | 6 | |
Xcerra Corp. (a) | | 14 | | 132 | |
XO Group Inc. (a) | | 3 | | 63 | |
Zix Corp. (a) | | 6 | | 22 | |
| | | | 17,998 | |
MATERIALS - 5.6% | | | | | |
A. Schulman Inc. | | 5 | | 217 | |
AEP Industries Inc. (a) | | 1 | | 68 | |
AK Steel Holding Corp. (a) (b) | | 9 | | 54 | |
AM Castle & Co. (a) (b) | | 2 | | 19 | |
American Vanguard Corp. (b) | | 3 | | 40 | |
Boise Cascade Co. (a) | | 4 | | 151 | |
Calgon Carbon Corp. (a) | | 8 | | 162 | |
Century Aluminum Co. (a) | | 11 | | 262 | |
Chase Corp. | | 2 | | 90 | |
Clearwater Paper Corp. (a) | | 2 | | 153 | |
Core Molding Technologies Inc. (a) | | — | | 3 | |
Deltic Timber Corp. | | 1 | | 89 | |
Ferro Corp. (a) | | 11 | | 145 | |
Flotek Industries Inc. (a) | | 8 | | 145 | |
Friedman Industries Inc. | | 1 | | 4 | |
FutureFuel Corp. | | 7 | | 86 | |
Globe Specialty Metals Inc. | | 11 | | 184 | |
Gold Resource Corp. | | 6 | | 19 | |
Hawkins Inc. | | 2 | | 101 | |
Haynes International Inc. | | 2 | | 106 | |
Headwaters Inc. (a) | | 8 | | 114 | |
Horsehead Holding Corp. (a) (b) | | 7 | | 108 | |
Innophos Holdings Inc. | | 3 | | 170 | |
Innospec Inc. | | 4 | | 172 | |
Kaiser Aluminum Corp. | | 3 | | 182 | |
KMG Chemicals Inc. | | 3 | | 54 | |
Koppers Holdings Inc. | | 2 | | 57 | |
Kraton Performance Polymers Inc. (a) | | 3 | | 70 | |
Landec Corp. (a) | | 6 | | 86 | |
LSB Industries Inc. (a) | | 4 | | 112 | |
Materion Corp. | | 2 | | 75 | |
McEwen Mining Inc. (a) (b) | | 4 | | 4 | |
Mercer International Inc. (a) | | 9 | | 116 | |
Myers Industries Inc. | | 6 | | 100 | |
Neenah Paper Inc. | | 2 | | 132 | |
Noranda Aluminium Holding Corp. | | 8 | | 27 | |
Northern Technologies International Corp. (a) (b) | | 1 | | 17 | |
Olympic Steel Inc. | | 1 | | 26 | |
OM Group Inc. | | 3 | | 98 | |
Omnova Solutions Inc. (a) | | 12 | | 95 | |
P.H. Glatfelter Co. | | 7 | | 169 | |
Quaker Chemical Corp. | | 2 | | 153 | |
RTI International Metals Inc. (a) | | 6 | | 142 | |
Schnitzer Steel Industries Inc. - Class A | | 3 | | 61 | |
Schweitzer-Mauduit International Inc. | | 4 | | 158 | |
Stepan Co. | | 3 | | 134 | |
SunCoke Energy Inc. | | 8 | | 147 | |
Synalloy Corp. | | 2 | | 29 | |
See accompanying Notes to Financial Statements.
| | Shares/Par † | | Value | |
Trecora Resources (a) (b) | | 3 | | 49 | |
Tredegar Corp. | | 3 | | 64 | |
United States Lime & Minerals Inc. | | 1 | | 42 | |
Universal Stainless & Alloy Products Inc. (a) | | 1 | | 36 | |
Wausau Paper Corp. (b) | | 6 | | 67 | |
Zep Inc. | | 3 | | 51 | |
| | | | 5,215 | |
TELECOMMUNICATION SERVICES - 1.8% | | | | | |
8x8 Inc. (a) | | 2 | | 17 | |
Alaska Communications Systems Group Inc. (a) | | 2 | | 4 | |
Atlantic Tele-Network Inc. | | 3 | | 189 | |
Boingo Wireless Inc. (a) | | 8 | | 63 | |
Cincinnati Bell Inc. (a) | | 28 | | 90 | |
Cogent Communications Group Inc. | | 1 | | 26 | |
Consolidated Communications Holdings Inc. (b) | | 10 | | 276 | |
General Communication Inc. - Class A (a) | | 6 | | 88 | |
Hawaiian Telcom Holdco Inc. (a) | | 1 | | 29 | |
HC2 Holdings Inc. (a) | | 2 | | 20 | |
IDT Corp. - Class B | | 4 | | 91 | |
Inteliquent Inc. | | 5 | | 89 | |
Iridium Communications Inc. (a) (b) | | 15 | | 149 | |
Lumos Networks Corp. | | 3 | | 59 | |
NTELOS Holdings Corp. (b) | | 2 | | 9 | |
ORBCOMM Inc. (a) | | 6 | | 40 | |
Premiere Global Services Inc. (a) | | 11 | | 119 | |
Shenandoah Telecommunications Co. | | 4 | | 118 | |
Spok Holdings Inc. | | 3 | | 56 | |
Straight Path Communications Inc. - Class B (a) (b) | | 3 | | 54 | |
Vonage Holdings Corp. (a) | | 31 | | 119 | �� |
| | | | 1,705 | |
UTILITIES - 2.2% | | | | | |
American States Water Co. | | 7 | | 249 | |
Artesian Resources Corp. - Class A (b) | | 2 | | 35 | |
California Water Service Group (b) | | 8 | | 188 | |
Chesapeake Utilities Corp. | | 2 | | 123 | |
Connecticut Water Services Inc. (b) | | 2 | | 55 | |
Consolidated Water Co. Ltd. (b) | | 2 | | 21 | |
Delta Natural Gas Co. Inc. | | 2 | | 33 | |
El Paso Electric Co. | | 1 | | 42 | |
Empire District Electric Co. | | 7 | | 208 | |
Gas Natural Inc. | | 2 | | 19 | |
Genie Energy Ltd. - Class B | | 4 | | 24 | |
MGE Energy Inc. | | 4 | | 191 | |
Middlesex Water Co. (b) | | 2 | | 56 | |
Northwest Natural Gas Co. (b) | | 5 | | 230 | |
Ormat Technologies Inc. (b) | | 5 | | 136 | |
Otter Tail Corp. | | 5 | | 151 | |
RGC Resources Inc. (b) | | — | | 7 | |
SJW Corp. | | 4 | | 126 | |
Unitil Corp. | | 2 | | 85 | |
York Water Co. (b) | | 2 | | 47 | |
| | | | 2,026 | |
| | | | | |
Total Common Stocks (cost $75,514) | | | | 93,301 | |
| | | | | |
RIGHTS - 0.0% | | | | | |
Providence Services Corp. (a) (c) | | 2 | | — | |
Total Rights (cost $0) | | | | — | |
| | | | | |
WARRANTS - 0.0% | | | | | |
Magnum Hunter Resources Corp. (a) (b) (c) (d) (e) | | 6 | | — | |
Total Warrants (cost $0) | | | | — | |
| | | | | |
SHORT TERM INVESTMENTS - 11.8% | | | | | |
| | | | | |
Investment Company - 0.0% | | | | | |
JNL Money Market Fund, 0.01% (f) (g) | | 32 | | 32 | |
Securities Lending Collateral - 11.8% | | | | | |
BlackRock Liquidity Funds TempFund Portfolio, 0.07% (g) | | 3,000 | | 3,000 | |
Fidelity Institutional Money Market Portfolio, 0.09% (g) | | 4,000 | | 4,000 | |
Repurchase Agreement with CSI, 0.07% (Collateralized by $4,059 U.S. Treasury Bond Strip, due 11/15/37-11/15/39, value $2,040) acquired on 12/31/14, due 01/02/15 at $2,000 | | $ | 2,000 | | 2,000 | |
Repurchase Agreement with MLP, 0.06% (Collateralized by $663 U.S. Treasury Bond, 6.25%, due 05/15/30, value $994 and $1,096 U.S. Treasury Note, 0.13%, due 07/15/24, value $1,052) acquired on 12/31/14, due 01/02/15 at $2,007 | | 2,007 | | 2,007 | |
| | | | 11,007 | |
| | | | | |
Total Short Term Investments (cost $11,039) | | | | 11,039 | |
| | | | | |
Total Investments - 111.9% (cost $86,553) | | | | 104,340 | |
Other Assets and Liabilities, Net - (11.9%) | | | | (11,125 | ) |
Total Net Assets - 100.0% | | | | $ | 93,215 | |
| | | | | | | |
(a) | Non-income producing security. |
(b) | All or portion of the security was on loan. |
(c) | Security fair valued in good faith in accordance with the procedures approved by the Trust’s Board of Trustees. Good faith fair valued securities may be classified as Level 2 or Level 3 for FASB ASC Topic 820 “Fair Value Measurement” based on the applicable valuation inputs. See FASB ASC Topic 820 “Fair Value Measurement” in the Notes to Financial Statements. |
(d) | Security is restricted to resale to institutional investors. See the Restricted Securities tables accompanying the Summary Schedules of Investments presented in the Trust’s annual report. |
(e) | The Sub-Adviser has deemed this security to be illiquid based on procedures approved by the Trust’s Board of Trustees. |
(f) | Investment in affiliate. |
(g) | Yield changes daily to reflect current market conditions. Rate was the quoted yield as of December 31, 2014. |
Curian/Epoch Global Shareholder Yield Fund
| | Shares/Par † | | Value | |
COMMON STOCKS - 96.4% | | | | | |
| | | | | |
CONSUMER DISCRETIONARY - 6.2% | | | | | |
Compass Group Plc | | 21 | | $ | 367 | |
Daimler AG | | 9 | | 706 | |
Mattel Inc. | | 12 | | 387 | |
McDonald’s Corp. | | 3 | | 324 | |
Pearson Plc | | 25 | | 457 | |
Regal Entertainment Group - Class A (a) | | 20 | | 432 | |
Shaw Communications Inc. - Class B (a) | | 19 | | 526 | |
Wolters Kluwer NV | | 12 | | 355 | |
| | | | 3,554 | |
| | | | | | |
See accompanying Notes to Financial Statements.
| | Shares/Par † | | Value | |
CONSUMER STAPLES - 14.0% | | | | | |
Altria Group Inc. | | 24 | | 1,186 | |
British American Tobacco Plc | | 12 | | 641 | |
Coca-Cola Co. | | 8 | | 320 | |
Diageo Plc - ADR | | 2 | | 270 | |
Imperial Tobacco Group Plc | | 25 | | 1,098 | |
Kimberly-Clark Corp. | | 5 | | 543 | |
Lorillard Inc. | | 17 | | 1,056 | |
Nestle SA | | 4 | | 312 | |
PepsiCo Inc. | | 4 | | 336 | |
Philip Morris International Inc. | | 7 | | 538 | |
Reynolds American Inc. | | 15 | | 978 | |
Unilever Plc | | 9 | | 386 | |
WM Morrison Supermarkets Plc (a) | | 130 | | 372 | |
| | | | 8,036 | |
ENERGY - 8.4% | | | | | |
ConocoPhillips | | 7 | | 486 | |
Enterprise Products Partners LP | | 12 | | 447 | |
Kinder Morgan Inc. | | 23 | | 972 | |
MarkWest Energy Partners LP | | 5 | | 347 | |
Occidental Petroleum Corp. | | 5 | | 423 | |
Royal Dutch Shell Plc - ADR - Class A | | 11 | | 752 | |
Statoil ASA (a) | | 17 | | 299 | |
Targa Resources Partners LP | | 6 | | 289 | |
Total SA | | 16 | | 800 | |
| | | | 4,815 | |
FINANCIALS - 11.1% | | | | | |
Aberdeen Asset Management Plc | | 7 | | 49 | |
Arthur J. Gallagher & Co. | | 7 | | 310 | |
CME Group Inc. | | 10 | | 898 | |
Commonwealth Bank of Australia | | 6 | | 387 | |
Health Care REIT Inc. | | 14 | | 1,046 | |
Muenchener Rueckversicherungs AG | | 4 | | 858 | |
People’s United Financial Inc. (a) | | 25 | | 379 | |
SCOR SE | | 19 | | 568 | |
Svenska Handelsbanken AB - Class A | | 9 | | 414 | |
Unibail-Rodamco SE | | 2 | | 543 | |
Wells Fargo & Co. | | 9 | | 486 | |
Westpac Banking Corp. | | 15 | | 401 | |
| | | | 6,339 | |
HEALTH CARE - 6.5% | | | | | |
AbbVie Inc. | | 8 | | 510 | |
AstraZeneca Plc - ADR | | 5 | | 322 | |
GlaxoSmithKline Plc | | 38 | | 825 | |
Johnson & Johnson | | 3 | | 347 | |
Merck & Co. Inc. | | 7 | | 416 | |
Novartis AG | | 6 | | 583 | |
Roche Holding AG | | 1 | | 382 | |
Sanofi | | 4 | | 362 | |
| | | | 3,747 | |
INDUSTRIALS - 7.6% | | | | | |
BAE Systems Plc | | 114 | | 837 | |
Corrections Corp. of America | | 20 | | 724 | |
Deutsche Post AG | | 9 | | 286 | |
Lockheed Martin Corp. (a) | | 3 | | 619 | |
Orkla ASA | | 56 | | 381 | |
RR Donnelley & Sons Co. | | 24 | | 396 | |
Vinci SA | | 14 | | 789 | |
Waste Management Inc. | | 7 | | 352 | |
| | | | 4,384 | |
INFORMATION TECHNOLOGY - 4.1% | | | | | |
Apple Inc. | | 4 | | 433 | |
Automatic Data Processing Inc. | | 4 | | 345 | |
KLA-Tencor Corp. | | 5 | | 341 | |
Microchip Technology Inc. (a) | | 9 | | 391 | |
Microsoft Corp. | | 8 | | 394 | |
Seagate Technology Plc | | 7 | | 465 | |
| | | | 2,369 | |
MATERIALS - 5.7% | | | | | |
BASF SE | | 7 | | 582 | |
BHP Billiton Ltd. | | 11 | | 267 | |
Dow Chemical Co. | | 11 | | 481 | |
EI Du Pont de Nemours & Co. | | 5 | | 361 | |
Potash Corp. of Saskatchewan Inc. | | 21 | | 739 | |
Rio Tinto Plc | | 7 | | 343 | |
Yara International ASA | | 11 | | 509 | |
| | | | 3,282 | |
TELECOMMUNICATION SERVICES - 14.9% | | | | | |
AT&T Inc. | | 27 | | 910 | |
BCE Inc. | | 24 | | 1,090 | |
CenturyTel Inc. | | 21 | | 845 | |
Deutsche Telekom AG | | 55 | | 885 | |
Philippine Long Distance Telephone Co. - ADR | | 5 | | 311 | |
Rogers Communications Inc. - Class B | | 9 | | 335 | |
Swisscom AG | | 2 | | 894 | |
Telstra Corp. Ltd. | | 170 | | 824 | |
Verizon Communications Inc. | | 20 | | 913 | |
Vivendi SA | | 21 | | 521 | |
Vodafone Group Plc | | 293 | | 1,005 | |
| | | | 8,533 | |
UTILITIES - 17.9% | | | | | |
Ameren Corp. | | 21 | | 976 | |
Centrica Plc | | 145 | | 629 | |
Dominion Resources Inc. | | 4 | | 332 | |
Duke Energy Corp. | | 12 | | 997 | |
Electricite de France SA | | 27 | | 732 | |
National Grid Plc | | 71 | | 1,006 | |
PPL Corp. | | 25 | | 913 | |
Severn Trent Plc | | 13 | | 391 | |
Southern Co. | | 9 | | 451 | |
SSE Plc | | 40 | | 1,012 | |
TECO Energy Inc. | | 36 | | 740 | |
Terna Rete Elettrica Nazionale SpA (a) | | 173 | | 786 | |
United Utilities Group Plc | | 62 | | 878 | |
Wisconsin Energy Corp. | | 8 | | 399 | |
| | | | 10,242 | |
| | | | | |
Total Common Stocks (cost $52,797) | | | | 55,301 | |
| | | | | |
SHORT TERM INVESTMENTS - 7.9% | | | | | |
| | | | | |
Investment Company - 2.7% | | | | | |
JNL Money Market Fund, 0.01% (b) (c) | | 1,522 | | 1,522 | |
Securities Lending Collateral - 5.2% | | | | | |
Repurchase Agreement with CSI, 0.07% (Collateralized by $2,030 U.S. Treasury Bond Strip, due 11/15/37-11/15/39, value $1,020) acquired on 12/31/14, due 01/02/15 at $1,000 | | $ | 1,000 | | 1,000 | |
| | | | | | |
See accompanying Notes to Financial Statements.
| | Shares/Par † | | Value | |
Repurchase Agreement with MLP, 0.06% (Collateralized by $660 U.S. Treasury Bond, 6.25%, due 05/15/30, value $991 and $1,092 U.S. Treasury Note, 0.13%, due 07/15/24, value $1,049) acquired on 12/31/14, due 01/02/15 at $2,000 | | 2,000 | | 2,000 | |
| | | | 3,000 | |
| | | | | |
Total Short Term Investments (cost $4,522) | | | | 4,522 | |
| | | | | |
Total Investments - 104.3% (cost $57,319) | | | | 59,823 | |
Other Assets and Liabilities, Net - (4.3%) | | | | (2,461 | ) |
Total Net Assets - 100.0% | | | | $ | 57,362 | |
| | | | | | |
(a) | All or portion of the security was on loan. |
(b) | Investment in affiliate. |
(c) | Yield changes daily to reflect current market conditions. Rate was the quoted yield as of December 31, 2014. |
Investments by Country* | | Percentage of Total
Long-Term
Investments | |
Australia | | 3.4 | % |
Canada | | 4.9 | |
France | | 7.8 | |
Germany | | 6.0 | |
Ireland | | 0.8 | |
Italy | | 1.4 | |
Netherlands | | 2.0 | |
Norway | | 2.2 | |
Philippines | | 0.6 | |
Sweden | | 0.7 | |
Switzerland | | 3.9 | |
United Kingdom | | 19.7 | |
United States | | 46.6 | |
Total Long-Term Investments | | 100.0 | % |
* | The country table is presented for this Fund because its strategy includes investment in non-U.S. securities as deemed significant by the Fund’s Adviser. |
Curian Long Short Credit Fund
| | Shares/Par † | | Value | |
NON-U.S. GOVERNMENT AGENCY ASSET-BACKED SECURITIES - 3.1% | | | | | |
American Airlines Pass-Through Trust, 5.60%, 07/15/20 (a) (b) | | $ | 1,782 | | $ | 1,820 | |
American Tower Trust I, 3.07%, 03/15/23 (c) | | 1,170 | | 1,163 | |
Citigroup Commercial Mortgage Trust REMIC, 0.91%, 06/15/21 (a) (b) (d) | | 4,000 | | 4,004 | |
Citigroup/Deutsche Bank Commercial Mortgage Trust REMIC, 5.23%, 10/15/15 (d) | | 1,887 | | 1,936 | |
Credit Suisse First Boston Mortgage Securities Corp. REMIC, 5.57%, 05/15/36 (d) | | 247 | | 249 | |
Dell Equipment Finance Trust | | | | | |
0.94%, 06/22/20 (c) | | 255 | | 255 | |
1.36%, 06/22/20 (c) | | 100 | | 100 | |
Morgan Stanley Capital I Trust REMIC, 4.98%, 06/12/47 (d) | | 475 | | 482 | |
MVW Owner Trust, 2.15%, 04/22/30 (c) | | 862 | | 863 | |
Wachovia Bank Commercial Mortgage Trust REMIC, 5.46%, 02/15/16 (d) | | 274 | | 283 | |
Total Non-U.S. Government Agency Asset-Backed Securities (cost $11,154) | | | | 11,155 | |
| | | | | |
CORPORATE BONDS AND NOTES - 90.6% | | | | | |
| | | | | |
CONSUMER DISCRETIONARY - 17.6% | | | | | |
Altice SA, 7.75%, 05/15/22 (c) | | 540 | | 541 | |
AMAYA Holdings BV Term Loan | | | | | |
5.00%, 07/29/21 (d) | | 1,077 | | 1,066 | |
8.00%, 07/28/22 (d) | | 270 | | 266 | |
Aramark Corp. Term Loan, 3.25%, 09/21/19 (d) | | 804 | | 790 | |
Beazer Homes USA Inc., 7.50%, 09/15/21 | | 1,856 | | 1,865 | |
Borgata Term Loan B, 6.75%, 08/15/18 (d) | | 1,144 | | 1,133 | |
Boyd Gaming Corp., 9.13%, 12/01/18 | | 1,075 | | 1,102 | |
British Sky Broadcasting Group Plc, 3.75%, 09/16/24 (c) | | 788 | | 793 | |
Burger King NewCo Term Loan B, 4.50%, 09/23/21 (d) | | 1,500 | | 1,494 | |
Caesars Growth Properties Holdings LLC 1st Lien Term Loan, 6.25%, 04/10/21 (d) | | 955 | | 870 | |
CBS Outdoor Americas Capital Term Loan, 3.00%, 01/16/21 (d) | | 600 | | 585 | |
Charter Communications Term Loan, 4.25%, 08/12/21 (d) | | 550 | | 553 | |
Chinos Intermediate Holdings A Inc., 7.75%, 05/01/19 (c) (e) | | 440 | | 389 | |
Citycenter Holdings LLC Term Loan B, 4.25%, 10/09/20 (d) | | 1,790 | | 1,771 | |
Delphi Corp., 5.00%, 02/15/23 | | 1,650 | | 1,761 | |
DreamWorks Animation SKG Inc., 6.88%, 08/15/20 (c) | | 800 | | 820 | |
Four Seasons Hotels Ltd. New Term Loan, 3.50%, 06/27/20 (d) | | 1,071 | | 1,047 | |
Garda World Security Corp. Delayed Draw Term Loan, 4.00%, 11/05/20 (d) | | 101 | | 98 | |
Garda World Security Corp. Term Loan B, 4.00%, 11/05/20 (d) | | 394 | | 384 | |
General Motors Co. | | | | | |
3.50%, 10/02/18 | | 1,500 | | 1,530 | |
5.00%, 04/01/35 | | 1,000 | | 1,042 | |
6.25%, 10/02/43 | | 664 | | 793 | |
Gibson Brands Inc., 8.88%, 08/01/18 (c) | | 369 | | 354 | |
GLP Capital LP | | | | | |
4.38%, 11/01/18 | | 207 | | 212 | |
4.88%, 11/01/20 | | 233 | | 236 | |
5.38%, 11/01/23 | | 182 | | 188 | |
Grupo Televisa SAB, 5.00%, 05/13/45 | | 933 | | 942 | |
Hilton Worldwide Finance LLC, 5.63%, 10/15/21 | | 585 | | 611 | |
Hilton Worldwide Inc. Term Loan B, 3.50%, 09/23/20 (d) | | 1,382 | | 1,364 | |
Hudson’s Bay Co. Initial Term Loan, 4.75%, 10/07/20 (d) | | 195 | | 195 | |
J.C. Penney Co. Inc. Term Loan, 6.00%, 05/22/18 (d) | | 670 | | 656 | |
Jarden Corp. Term Loan B-1, 2.91%, 09/30/20 (d) | | 1,321 | | 1,318 | |
Landry’s Holdings II Inc., 10.25%, 01/01/18 (c) | | 540 | | 556 | |
Liberty Global Term Loan, 4.50%, 12/24/21 (d) | | 900 | | 875 | |
Media General Financing Sub Inc., 5.88%, 11/15/22 (c) | | 394 | | 390 | |
Media General Inc. Term Loan, 0.00%, 07/31/20 (f) | | 1,330 | | 1,314 | |
MGM Resorts International, 6.75%, 10/01/20 | | 575 | | 604 | |
Michaels Stores Inc., 5.88%, 12/15/20 (c) | | 591 | | 597 | |
Mohegan Tribal Gaming Authority Term Loan B, 5.50%, 11/05/19 (d) | | 1,218 | | 1,168 | |
Neiman Marcus Group Ltd. Inc., 8.75%, 10/15/21 (c) (e) | | 1,044 | | 1,107 | |
Netflix Inc., 5.75%, 03/01/24 (c) | | 713 | | 742 | |
| | | | | | | |
See accompanying Notes to Financial Statements.
| | Shares/Par † | | Value | |
Numericable Group SA | | | | | |
4.88%, 05/15/19 (c) | | 916 | | 908 | |
5.38%, 05/15/22 (c), EUR | | 1,000 | | 1,249 | |
PC Nextco Holdings LLC, 8.75%, 08/15/19 (e) | | 592 | | 595 | |
PVH Corp., 4.50%, 12/15/22 | | 925 | | 913 | |
RSI Home Products Inc., 6.88%, 03/01/18 (c) | | 500 | | 522 | |
Schaeffler Finance BV | | | | | |
3.25%, 05/15/19 (c), EUR | | 556 | | 680 | |
3.50%, 05/15/22 (c), EUR | | 358 | | 441 | |
Schaeffler Holding Finance BV, 5.75%, 11/15/21 (c), EUR | | 469 | | 604 | |
Scientific Games International Inc., 7.00%, 01/01/22 (a) (b) | | 699 | | 708 | |
Scientific Games International Inc. Term Loan, 6.00%, 09/17/21 (d) | | 1,500 | | 1,476 | |
Seaworld Parks & Entertainment Inc. Term Loan B-2, 3.00%, 05/13/20 (d) | | 1,282 | | 1,211 | |
Seminole Hard Rock Entertainment Inc. Term Loan, 3.50%, 05/15/20 (d) | | 1,402 | | 1,349 | |
SES SA, 5.30%, 04/04/43 (c) | | 615 | | 683 | |
Shingle Springs Tribal Gaming Authority Term Loan, 6.25%, 08/15/19 (d) (l) | | 776 | | 776 | |
Sirius XM Radio Inc., 6.00%, 07/15/24 (c) | | 1,967 | | 2,016 | |
Sugarhouse HSP Gaming Prop Mezz LP, 6.38%, 06/01/21 (c) | | 316 | | 288 | |
Taylor Morrison Communities Inc., 7.75%, 04/15/20 (c) | | 1,075 | | 1,139 | |
Tenneco Inc. | | | | | |
6.88%, 12/15/20 | | 1,750 | | 1,851 | |
5.38%, 12/15/24 | | 355 | | 364 | |
Time Warner Cable Inc. | | | | | |
6.75%, 06/15/39 | | 247 | | 323 | |
5.88%, 11/15/40 | | 168 | | 200 | |
5.50%, 09/01/41 | | 460 | | 534 | |
Toll Brothers Finance Corp., 4.00%, 12/31/18 | | 513 | | 514 | |
TRW Automotive Inc., 4.45%, 12/01/23 (c) | | 550 | | 553 | |
Univision Communications Inc. Term Loan, 4.00%, 03/01/20 (d) | | 2,119 | | 2,068 | |
Visant Holding Corp. Term Loan, 7.00%, 08/15/21 (d) | | 1,377 | | 1,335 | |
Wave Holdco LLC, 8.25%, 07/15/19 (c) (e) | | 519 | | 522 | |
WideOpenWest Finance LLC, 10.25%, 07/15/19 | | 1,625 | | 1,692 | |
Wynn Las Vegas LLC, 7.75%, 08/15/20 | | 2,425 | | 2,583 | |
Yonkers Racing Corp. Term Loan, 4.25%, 08/19/19 (d) | | 444 | | 397 | |
| | | | 62,616 | |
CONSUMER STAPLES - 3.8% | | | | | |
Albertson’s LLC Term Loan B3, 4.00%, 08/11/19 (d) | | 1,300 | | 1,291 | |
Algeco Scotsman Global Finance Plc, 10.75%, 10/15/19 (c) | | 550 | | 473 | |
Century Intermediate Holding Co. 2, 9.75%, 02/15/19 (c) (e) | | 1,142 | | 1,199 | |
Constellation Brands Inc., 4.25%, 05/01/23 | | 1,400 | | 1,389 | |
Diamond Foods Inc., 7.00%, 03/15/19 (c) | | 138 | | 141 | |
Dole Food Co. Inc. New Term Loan B, 4.50%, 10/25/18 (d) | | 1,214 | | 1,197 | |
Hearthside Group Holdings LLC, 6.50%, 05/01/22 (c) | | 263 | | 256 | |
JBS Investments GmbH, 7.25%, 04/03/24 (c) | | 1,045 | | 1,027 | |
Pinnacle Foods Finance LLC Term Loan H, 3.00%, 04/29/20 (d) | | 1,089 | | 1,054 | |
Reynolds American Inc., 3.25%, 11/01/22 | | 900 | | 877 | |
Reynolds Group Issuer Inc., 5.75%, 10/15/20 | | 750 | | 769 | |
Sysco Corp., 4.35%, 10/02/34 | | 1,582 | | 1,703 | |
Tyson Foods Inc. | | | | | |
3.95%, 08/15/24 | | 434 | | 449 | |
4.88%, 08/15/34 | | 355 | | 389 | |
5.15%, 08/15/44 | | 256 | | 288 | |
Wal-Mart Stores Inc., 4.30%, 04/22/44 | | 963 | | 1,051 | |
| | | | 13,553 | |
ENERGY - 14.8% | | | | | |
Access Midstream Partners LP | | | | | |
5.88%, 04/15/21 | | 371 | | 387 | |
4.88%, 05/15/23 | | 1,519 | | 1,542 | |
4.88%, 03/15/24 | | 440 | | 447 | |
Alpha Natural Resources Inc. | | | | | |
9.75%, 04/15/18 | | 700 | | 315 | |
6.25%, 06/01/21 | | 1,300 | | 364 | |
Arch Coal Inc. | | | | | |
8.00%, 01/15/19 (c) | | 591 | | 328 | |
7.25%, 06/15/21 | | 1,300 | | 379 | |
Arch Western Finance LLC Term Loan, 6.25%, 05/14/18 (d) | | 987 | | 815 | |
BP Capital Markets Plc | | | | | |
2.50%, 11/06/22 | | 650 | | 606 | |
2.75%, 05/10/23 | | 1,027 | | 960 | |
BreitBurn Energy Partners LP, 7.88%, 04/15/22 | | 821 | | 634 | |
California Resources Corp. | | | | | |
5.50%, 09/15/21 (c) | | 773 | | 661 | |
6.00%, 11/15/24 (c) | | 779 | | 658 | |
Calumet Specialty Products Partners LP, 6.50%, 04/15/21 (c) | | 1,128 | | 1,004 | |
Chaparral Energy Inc., 8.25%, 09/01/21 | | 1,250 | | 850 | |
Chesapeake Energy Corp., 3.48%, 04/15/19 (d) | | 2,467 | | 2,418 | |
Citgo Petroleum Corp. Term Loan, 4.50%, 07/23/21 (d) | | 1,476 | | 1,464 | |
Concho Resources Inc., 5.50%, 04/01/23 | | 827 | | 831 | |
DCP Midstream LLC, 5.85%, 05/21/43 (c) (d) | | 2,326 | | 2,256 | |
Diamond Offshore Drilling Inc., 4.88%, 11/01/43 | | 1,355 | | 1,154 | |
Energy Future Intermediate Holding Co. LLC Term Loan, 4.25%, 04/28/16 (d) | | 1,658 | | 1,657 | |
Energy XXI Gulf Coast Inc., 6.88%, 03/15/24 (c) | | 433 | | 234 | |
EnQuest Plc, 7.00%, 04/15/22 (c) | | 834 | | 517 | |
Enterprise Products Operating LLC | | | | | |
3.75%, 02/15/25 | | 626 | | 628 | |
4.95%, 10/15/54 | | 472 | | 483 | |
Fieldwood Energy LLC 1st Lien Term Loan, 3.88%, 09/28/18 (d) | | 1,886 | | 1,783 | |
Fieldwood Energy LLC 2nd Lien Term Loan, 8.38%, 09/24/20 (d) | | 200 | | 145 | |
Halcon Resources Corp., 9.75%, 07/15/20 | | 1,144 | | 858 | |
Ithaca Energy Inc., 8.13%, 07/01/19 (c) | | 579 | | 437 | |
Jonah Energy LLC 2nd Lien Term Loan, 7.50%, 05/07/21 (d) (l) | | 900 | | 765 | |
Jupiter Resources Inc., 8.50%, 10/01/22 (c) | | 1,750 | | 1,317 | |
Kinder Morgan Inc. | | | | | |
3.05%, 12/01/19 | | 1,250 | | 1,240 | |
5.30%, 12/01/34 | | 800 | | 812 | |
Legacy Reserves LP, 6.63%, 12/01/21 (c) | | 701 | | 571 | |
Linden Term Loan B, 3.75%, 12/01/20 (d) | | 337 | | 332 | |
Linn Energy LLC, 8.63%, 04/15/20 | | 1,200 | | 1,044 | |
Memorial Production Partners LP, 6.88%, 08/01/22 (c) | | 965 | | 733 | |
Midstates Petroleum Co. Inc., 9.25%, 06/01/21 | | 1,176 | | 588 | |
Newfield Exploration Co., 6.88%, 02/01/20 | | 1,400 | | 1,421 | |
Penn Virginia Corp., 8.50%, 05/01/20 | | 1,175 | | 940 | |
Petrobras Global Finance BV 1.85%, 05/20/16 (d) | | 1,150 | | 1,099 | |
See accompanying Notes to Financial Statements.
| | Shares/Par † | | Value | |
2.37%, 01/15/19 (d) | | 1,000 | | 887 | |
4.38%, 05/20/23 | | 841 | | 723 | |
Petroleum Geo-Services ASA, 7.38%, 12/15/18 (c) | | 892 | | 745 | |
Phillips 66 | | | | | |
4.65%, 11/15/34 | | 650 | | 666 | |
4.88%, 11/15/44 | | 650 | | 665 | |
Plains Exploration & Production Co., 6.75%, 02/01/22 | | 468 | | 515 | |
Regency Energy Partners LP | | | | | |
5.88%, 03/01/22 | | 1,729 | | 1,725 | |
5.00%, 10/01/22 | | 567 | | 536 | |
Samson Investment Co. Term Loan 1, 5.00%, 09/25/18 (d) | | 1,550 | | 1,216 | |
Seadrill Ltd., 6.13%, 09/15/17 (c) (g) | | 2,150 | | 1,903 | |
Seadrill Ltd. Term Loan B, 4.00%, 02/12/21 (d) | | 1,089 | | 842 | |
SESI LLC, 7.13%, 12/15/21 | | 1,470 | | 1,411 | |
Seventy Seven Operating LLC Term Loan, 3.75%, 06/18/21 (d) (l) | | 498 | | 418 | |
SM Energy Co., 6.13%, 11/15/22 (c) | | 976 | | 918 | |
Targa Resources Partners LP, 4.13%, 11/15/19 (c) | | 1,928 | | 1,856 | |
Tesoro Logistics LP | | | | | |
5.50%, 10/15/19 (c) | | 154 | | 153 | |
6.25%, 10/15/22 (c) | | 225 | | 224 | |
Transocean Inc. | | | | | |
6.38%, 12/15/21 (h) | | 1,250 | | 1,153 | |
3.80%, 10/15/22 (h) | | 411 | | 333 | |
| | | | 52,566 | |
FINANCIALS - 23.7% | | | | | |
Abbey National Treasury Services Plc, 4.00%, 03/13/24 | | 1,049 | | 1,092 | |
AerCap Ireland Capital Ltd., 4.50%, 05/15/21 (c) | | 180 | | 182 | |
Banco Santander Chile, 2.11%, 06/07/18 (c) (d) | | 1,000 | | 1,012 | |
Bank of America Corp. | | | | | |
6.25% (callable at 100 beginning 09/05/24) (i) | | 1,373 | | 1,357 | |
6.50% (callable at 100 beginning 10/23/24) (i) | | 785 | | 799 | |
3.30%, 01/11/23 | | 917 | | 917 | |
4.20%, 08/26/24 | | 1,250 | | 1,273 | |
4.25%, 10/22/26 | | 739 | | 737 | |
Barclays Bank Plc | | | | | |
7.75%, 04/10/23 (d) | | 1,000 | | 1,090 | |
3.75%, 05/15/24 | | 2,000 | | 2,061 | |
Barclays Plc | | | | | |
8.00% (callable at 100 beginning 12/15/20) (i), EUR | | 1,100 | | 1,385 | |
8.25% (callable at 100 beginning 12/15/18) (i) | | 1,100 | | 1,127 | |
Capital One NA, 2.95%, 07/23/21 (b) | | 918 | | 912 | |
Citigroup Inc., 5.90%, (callable at 100 beginning 02/15/23) (i) | | 1,100 | | 1,072 | |
CME Group Inc., 5.30%, 09/15/43 | | 1,250 | | 1,515 | |
Credit Suisse | | | | | |
3.00%, 10/29/21 | | 797 | | 793 | |
3.63%, 09/09/24 | | 1,891 | | 1,924 | |
Credit Suisse AG, 6.50%, 08/08/23 (c) | | 2,481 | | 2,723 | |
Credit Suisse Group AG, 7.50%, (callable at 100 beginning 12/11/23) (c) (i) | | 1,759 | | 1,829 | |
Discover Financial Services, 3.95%, 11/06/24 | | 1,250 | | 1,257 | |
Financiere Gaillon 8 SAS, 7.00%, 09/30/19 (c), EUR | | 983 | | 1,154 | |
Five Corners Funding Trust, 4.42%, 11/15/23 (c) | | 2,221 | | 2,349 | |
Ford Motor Credit Co. LLC, 4.25%, 09/20/22 | | 875 | | 928 | |
General Electric Capital Corp. | | | | | |
6.25% (callable at 100 beginning 12/15/22) (i) | | 825 | | 898 | |
7.13% (callable at 100 beginning 06/15/22) (i) | | 3,400 | | 3,957 | |
General Motors Financial Co. Inc. | | | | | |
4.38%, 09/25/21 | | 470 | | 491 | |
4.25%, 05/15/23 | | 774 | | 789 | |
GFI Group Inc., 10.38%, 07/19/18 (h) | | 1,000 | | 1,155 | |
Goldman Sachs Group Inc. | | | | | |
5.70% (callable at 100 beginning 05/10/19) (i) | | 2,552 | | 2,581 | |
2.55%, 10/23/19 | | 1,250 | | 1,244 | |
5.38%, 03/15/20 | | 1,350 | | 1,513 | |
4.00%, 03/03/24 | | 1,461 | | 1,517 | |
Guggenheim Partners Investment Management Holdings LLC Initial Term Loan, 4.25%, 07/17/20 (d) | | 1,284 | | 1,270 | |
Hospitality Properties Trust, 4.50%, 03/15/25 | | 1,001 | | 1,008 | |
HSBC Holdings Plc | | | | | |
5.63% (callable at 100 beginning 01/17/20) (i) | | 949 | | 952 | |
6.37% (callable at 100 beginning 09/17/24) (i) | | 1,348 | | 1,361 | |
4.25%, 03/14/24 | | 1,300 | | 1,353 | |
5.25%, 03/14/44 | | 350 | | 392 | |
Icahn Enterprises LP | | | | | |
6.00%, 08/01/20 | | 920 | | 948 | |
5.88%, 02/01/22 | | 704 | | 707 | |
International Lease Finance Corp., 6.25%, 05/15/19 | | 1,800 | | 1,966 | |
Intesa Sanpaolo SpA, 5.02%, 06/26/24 (c) | | 2,475 | | 2,402 | |
JPMorgan Chase & Co. | | | | | |
5.00% (callable at 100 beginning 07/01/19) (i) | | 500 | | 489 | |
7.90% (callable at 100 beginning 04/30/18) (i) | | 966 | | 1,040 | |
3.63%, 05/13/24 | | 600 | | 614 | |
4.13%, 12/15/26 | | 1,250 | | 1,247 | |
Liberty Mutual Group Inc., 4.85%, 08/01/44 (c) | | 700 | | 712 | |
Mizuho Financial Group Cayman 3 Ltd., 4.60%, 03/27/24 (c) | | 1,600 | | 1,658 | |
Morgan Stanley | | | | | |
0.97%, 07/23/19 (d) | | 1,950 | | 1,942 | |
5.63%, 09/23/19 | | 900 | | 1,016 | |
4.10%, 05/22/23 | | 1,237 | | 1,252 | |
3.70%, 10/23/24 | | 625 | | 634 | |
4.35%, 09/08/26 | | 1,222 | | 1,229 | |
National Rural Utilities Cooperative Finance Corp., 4.75%, 04/30/43 (d) | | 2,000 | | 1,982 | |
PNC Financial Services Group Inc., 4.85%, (callable at 100 beginning 06/01/23) (i) | | 1,900 | | 1,793 | |
Prudential Financial Inc., 5.87%, 09/15/42 (d) | | 1,196 | | 1,262 | |
Royal Bank of Scotland Group Plc | | | | | |
6.10%, 06/10/23 | | 1,472 | | 1,597 | |
6.00%, 12/19/23 | | 359 | | 389 | |
5.13%, 05/28/24 | | 1,534 | | 1,560 | |
Santander UK Plc, 5.00%, 11/07/23 (c) | | 864 | | 913 | |
Societe Generale SA, 6.00%, (callable at 100 beginning 01/27/20) (c) (i) | | 499 | | 454 | |
State Street Corp., 3.10%, 05/15/23 | | 1,029 | | 1,015 | |
Stena AB, 7.00%, 02/01/24 (c) | | 1,332 | | 1,219 | |
Tanger Properties LP, 3.75%, 12/01/24 | | 1,250 | | 1,260 | |
Toys R Us Property Co. I LLC Term Loan, 6.00%, 08/21/19 (d) | | 647 | | 617 | |
Wells Fargo & Co. | | | | | |
4.48%, 01/16/24 | | 461 | | 492 | |
See accompanying Notes to Financial Statements.
| | Shares/Par † | | Value | |
4.10%, 06/03/26 | | 1,934 | | 1,977 | |
| | | | 84,355 | |
HEALTH CARE - 6.8% | | | | | |
Actavis Funding SCS, 4.85%, 06/15/44 | | 578 | | 587 | |
Amsurg Corp. Term Loan, 3.75%, 07/08/21 (d) | | 1,005 | | 995 | |
Becton Dickinson and Co. | | | | | |
2.68%, 12/15/19 | | 751 | | 761 | |
3.73%, 12/15/24 | | 294 | | 303 | |
4.69%, 12/15/44 | | 370 | | 398 | |
Capsugel SA, 7.00%, 05/15/19 (c) (e) | | 1,493 | | 1,508 | |
DaVita HealthCare Partners Inc. Term Loan B, 3.50%, 06/20/21 (d) | | 2,259 | | 2,231 | |
Endo Pharmaceuticals Holdings Inc. Term Loan B, 3.25%, 12/11/20 (d) | | 605 | | 589 | |
Envision Acquisition Co. 2nd Lien Term Loan, 9.75%, 09/23/21 (d) | | 414 | | 410 | |
Gilead Sciences Inc. | | | | | |
3.50%, 02/01/25 | | 561 | | 576 | |
4.80%, 04/01/44 | | 814 | | 903 | |
4.50%, 02/01/45 | | 492 | | 526 | |
HCA Inc. | | | | | |
3.75%, 03/15/19 | | 918 | | 919 | |
4.25%, 10/15/19 | | 2,053 | | 2,084 | |
Howard Hughes Medical Institute, 3.50%, 09/01/23 | | 1,227 | | 1,283 | |
Medtronic Inc. | | | | | |
3.50%, 03/15/25 (c) | | 1,626 | | 1,663 | |
4.38%, 03/15/35 (c) | | 1,005 | | 1,066 | |
4.63%, 03/15/45 (c) | | 1,354 | | 1,468 | |
Merck & Co. Inc., 4.15%, 05/18/43 | | 827 | | 880 | |
Omnicare Inc. | | | | | |
4.75%, 12/01/22 | | 100 | | 101 | |
5.00%, 12/01/24 | | 100 | | 102 | |
Par Pharmaceutical Companies Inc. Term Loan, 4.00%, 09/28/19 (d) | | 979 | | 950 | |
Perrigo Finance Plc | | | | | |
3.50%, 12/15/21 | | 850 | | 860 | |
4.90%, 12/15/44 | | 264 | | 280 | |
Pfizer Inc., 3.00%, 06/15/23 | | 1,250 | | 1,264 | |
Tenet Healthcare Corp. | | | | | |
5.00%, 03/01/19 (c) | | 750 | | 751 | |
8.13%, 04/01/22 | | 786 | | 878 | |
| | | | 24,336 | |
INDUSTRIALS - 6.2% | | | | | |
AECOM Technology Corp., 5.88%, 10/15/24 (c) | | 430 | | 440 | |
Aircastle Ltd., 4.63%, 12/15/18 | | 539 | | 542 | |
Berry Plastics Corp. Incremental Term Loan D, 3.50%, 01/29/20 (d) | | 1,480 | | 1,429 | |
Berry Plastics Term Loan E, 3.75%, 01/06/21 (d) | | 454 | | 441 | |
Bombardier Inc. | | | | | |
4.75%, 04/15/19 (c) | | 1,571 | | 1,577 | |
6.00%, 10/15/22 (c) | | 835 | | 843 | |
6.13%, 01/15/23 (c) | | 1,727 | | 1,762 | |
Delta Airlines Inc. Term Loan B-1, 3.25%, 10/18/18 (d) | | 1,870 | | 1,829 | |
Florida East Coast Holdings Corp., 6.75%, 05/01/19 (c) | | 1,187 | | 1,175 | |
Huntington Ingalls Industries Inc., 5.00%, 12/15/21 (c) | | 291 | | 296 | |
IHS Inc., 5.00%, 11/01/22 (c) | | 365 | | 361 | |
Interactive Data Corp. Term Loan, 4.75%, 04/30/21 (d) | | 1,493 | | 1,480 | |
International Lease Finance Corp., 2.19%, 06/15/16 (d) | | 1,350 | | 1,348 | |
Meritor Inc. | | | | | |
6.75%, 06/15/21 | | 1,276 | | 1,334 | |
6.25%, 02/15/24 | | 381 | | 387 | |
Schaeffler AG Term Loan, 4.25%, 05/15/20 (d) | | 550 | | 549 | |
Southwire LLC Term Loan, 3.25%, 02/11/21 (d) | | 1,035 | | 994 | |
TransDigm Inc. Term Loan D, 3.75%, 05/22/21 (d) | | 896 | | 878 | |
TransUnion Holding Co. Inc., 9.63%, 06/15/18 (e) | | 1,400 | | 1,432 | |
United Continental Holdings Inc., 6.00%, 07/15/28 | | 500 | | 476 | |
United Rentals North America Inc., 8.38%, 09/15/20 | | 1,600 | | 1,716 | |
US Airways Group Inc., 6.13%, 06/01/18 | | 575 | | 600 | |
| | | | 21,889 | |
INFORMATION TECHNOLOGY - 2.4% | | | | | |
Ancestry.com Inc., 9.63%, 10/15/18 (c) (e) | | 886 | | 868 | |
BMC Software Finance Inc. Term Loan, 5.00%, 08/09/20 (d) | | 669 | | 649 | |
Boxer Parent Co. Inc., 9.00%, 10/15/19 (c) (e) | | 829 | | 705 | |
CDK Global Inc., 3.30%, 10/15/19 (c) | | 503 | | 501 | |
First Data Corp. New Term Loan, 3.66%, 03/24/17 (d) | | 1,300 | | 1,279 | |
Oracle Corp., 4.30%, 07/08/34 | | 1,750 | | 1,874 | |
SunGard Availability Services Capital Inc., 8.75%, 04/01/22 (c) | | 1,048 | | 618 | |
ViaSat Inc., 6.88%, 06/15/20 | | 1,932 | | 2,009 | |
| | | | 8,503 | |
MATERIALS - 6.2% | | | | | |
Alcoa Inc., 5.13%, 10/01/24 | | 674 | | 714 | |
Ardagh Packaging Finance Plc, 3.24%, 12/15/19 (c) (d) | | 3,000 | | 2,895 | |
Barrick Gold Corp., 4.10%, 05/01/23 | | 600 | | 584 | |
Boart Longyear Management Pty Ltd., 10.00%, 10/01/18 (c) | | 432 | | 449 | |
Cemex Finance LLC | | | | | |
9.38%, 10/12/22 (c) | | 1,050 | | 1,171 | |
6.00%, 04/01/24 (c) | | 447 | | 436 | |
Cemex SAB de CV | | | | | |
6.50%, 12/10/19 (c) | | 774 | | 793 | |
7.25%, 01/15/21 (c) | | 794 | | 832 | |
FMG Resources August 2006 Pty Ltd., 6.00%, 04/01/17 (c) | | 750 | | 717 | |
FMG Resources Pty Ltd., 6.88%, 04/01/22 (c) | | 1,200 | | 999 | |
FMG Resources Pty Ltd. New Term Loan B, 3.75%, 06/30/19 (d) | | 1,478 | | 1,339 | |
Freeport-McMoRan Inc., 5.40%, 11/14/34 | | 2,351 | | 2,292 | |
Hexion US Finance Corp., 6.63%, 04/15/20 | | 500 | | 490 | |
INEOS Group Holdings SA, 6.50%, 08/15/18 (c), EUR | | 333 | | 396 | |
LyondellBasell Industries NV, 6.00%, 11/15/21 | | 1,250 | | 1,439 | |
Methanex Corp., 5.65%, 12/01/44 | | 496 | | 507 | |
Monsanto Co. | | | | | |
3.38%, 07/15/24 | | 262 | | 266 | |
4.70%, 07/15/64 | | 980 | | 1,028 | |
Samarco Mineracao SA | | | | | |
4.13%, 11/01/22 (c) | | 240 | | 211 | |
5.38%, 09/26/24 (c) | | 1,587 | | 1,471 | |
Sealed Air Corp., 4.88%, 12/01/22 (c) | | 337 | | 334 | |
Signode Industrial Group Lux SA, 6.38%, 05/01/22 (c) | | 340 | | 331 | |
Smurfit Kappa Acquisitions, 4.88%, 09/15/18 (c) | | 1,000 | | 1,035 | |
Solenis International LP 1st Lien Term Loan, 4.25%, 07/02/21 (d) | | 998 | | 970 | |
See accompanying Notes to Financial Statements.
| | Shares/Par † | | Value | |
Votorantim Cimentos SA, 7.25%, 04/05/41 (c) | | 300 | | 309 | |
| | | | 22,008 | |
TELECOMMUNICATION SERVICES - 4.6% | | | | | |
Altice Financing SA, 7.88%, 12/15/19 (c) | | 200 | | 205 | |
Crown Castle International Corp. New Term Loan B, 3.00%, 01/31/21 (d) | | 1,388 | | 1,364 | |
Frontier Communications Corp. | | | | | |
6.25%, 09/15/21 | | 200 | | 201 | |
6.88%, 01/15/25 | | 255 | | 255 | |
Hughes Satellite Systems Corp., 6.50%, 06/15/19 | | 550 | | 590 | |
Inmarsat Finance Plc, 4.88%, 05/15/22 (c) | | 1,519 | | 1,504 | |
Intelsat Jackson Holdings SA, 6.63%, 12/15/22 | | 1,500 | | 1,541 | |
PAETEC Holding Corp., 9.88%, 12/01/18 | | 1,342 | | 1,409 | |
SES Global Americas Holdings GP, 5.30%, 03/25/44 (c) | | 953 | | 1,067 | |
Sprint Corp., 7.13%, 06/15/24 | | 975 | | 907 | |
Verizon Communications Inc. | | | | | |
5.15%, 09/15/23 | | 1,800 | | 1,988 | |
6.40%, 09/15/33 | | 1,053 | | 1,297 | |
4.40%, 11/01/34 | | 750 | | 745 | |
6.55%, 09/15/43 | | 817 | | 1,047 | |
5.01%, 08/21/54 (a) (b) | | 818 | | 846 | |
Wind Acquisition Finance SA, 4.08%, 07/15/20 (c) (d), EUR | | 500 | | 578 | |
Windstream Corp. Term Loan B-4, 3.50%, 01/15/20 (d) | | 982 | | 969 | |
| | | | 16,513 | |
UTILITIES - 4.5% | | | | | |
Abengoa Yield Plc, 7.00%, 11/15/19 (c) | | 926 | | 912 | |
AES Corp. | | | | | |
3.23%, 06/01/19 (d) | | 1,049 | | 1,023 | |
4.88%, 05/15/23 | | 850 | | 844 | |
Electricite de France SA, 5.25%, (callable at 100 beginning 01/29/23) (c) (i) | | 2,700 | | 2,767 | |
Enel SpA, 8.75%, 09/24/73 (c) (d) | | 1,376 | | 1,598 | |
FirstEnergy Corp. | | | | | |
4.25%, 03/15/23 (h) | | 616 | | 636 | |
7.38%, 11/15/31 | | 525 | | 635 | |
FirstEnergy Transmission LLC, 5.45%, 07/15/44 (c) | | 747 | | 805 | |
GenOn Energy Inc., 9.50%, 10/15/18 | | 1,025 | | 1,020 | |
Oglethorpe Power Corp., 4.55%, 06/01/44 | | 1,042 | | 1,098 | |
Pacific Gas & Electric Co., 4.30%, 03/15/45 | | 578 | | 593 | |
Puget Energy Inc., 6.00%, 09/01/21 | | 1,800 | | 2,106 | |
RJS Power Holdings LLC, 5.13%, 07/15/19 (c) | | 1,350 | | 1,333 | |
Texas Competitive Electric Holdings Co. LLC Term Loan, 3.75%, 05/05/16 (d) | | 564 | | 566 | |
| | | | 15,936 | |
Total Corporate Bonds and Notes (cost $329,524) | | | | 322,275 | |
| | | | | |
TRUST PREFERREDS - 0.5% | | | | | |
| | | | | |
FINANCIALS - 0.5% | | | | | |
Citigroup Capital XIII, 7.88%, (callable at 25 beginning 10/30/15) | | 64 | | 1,701 | |
| | | | | |
Total Trust Preferreds (cost $1,757) | | | | 1,701 | |
| | | | | |
PREFERRED STOCKS - 1.5% | | | | | |
| | | | | |
ENERGY - 0.1% | | | | | |
NuStar Logistics LP, 7.63%, 01/15/43 | | 19 | | 490 | |
| | | | | |
FINANCIALS - 1.4% | | | | | |
Allstate Corp., 5.10%, 01/15/53 | | 51 | | 1,279 | |
Goldman Sachs Group Inc., (callable at 25 beginning 05/10/23) (i) | | 45 | | 1,098 | |
US Bancorp, 6.00%, (callable at 25 beginning 04/15/17) (i) | | 88 | | 2,387 | |
| | | | 4,764 | |
Total Preferred Stocks (cost $5,441) | | | | 5,254 | |
| | | | | |
INVESTMENT COMPANIES - 0.1% | | | | | |
| | | | | |
Kayne Anderson MLP Investment Co. | | 8 | | 297 | |
PIMCO Dynamic Credit Income Fund | | 11 | | 225 | |
| | | | | |
Total Investment Companies (cost $505) | | | | 522 | |
| | | | | |
SHORT TERM INVESTMENTS - 2.9% | | | | | |
| | | | | |
Investment Company - 2.9% | | | | | |
JNL Money Market Fund, 0.01% (j) (k) | | 10,256 | | 10,256 | |
| | | | | |
Total Short Term Investments (cost $10,256) | | | | 10,256 | |
| | | | | |
Total Investments - 98.7% (cost $358,637) | | | | 351,163 | |
Other Assets and Liabilities, Net - 1.3% | | | | 4,466 | |
Total Net Assets - 100.0% | | | | $ | 355,629 | |
| | | | | | |
(a) | Security is restricted to resale to institutional investors. See the Restricted Securities tables accompanying the Summary Schedules of Investments presented in the Trust’s annual report. |
(b) | The Sub-Adviser has deemed this security to be illiquid based on procedures approved by the Trust’s Board of Trustees. |
(c) | The Sub-Adviser has deemed this security which is exempt from registration under the 1933 Act to be liquid based on procedures approved by the Trust’s Board of Trustees. As of December 31, 2014, the aggregate value of these liquid securities was $91,243 which represented 25.7% of net assets. |
(d) | Variable rate security. Rate stated was in effect as of December 31, 2014. |
(e) | Pay-in-kind security. The coupon interest earned by the security may be paid in cash or additional par. |
(f) | This variable rate senior loan will settle after December 31, 2014, at which time the interest rate will be determined. |
(g) | Security is a “step-up” bond where the coupon may increase or step up at a future date. Rate stated was the coupon as of December 31, 2014. |
(h) | The interest rate for this security is inversely affected by upgrades or downgrades to the credit rating of the issuer. |
(i) | Perpetual security. |
(j) | Investment in affiliate. |
(k) | Yield changes daily to reflect current market conditions. Rate was the quoted yield as of December 31, 2014. |
(l) | Security fair valued in good faith in accordance with the procedures approved by the Trust’s Board of Trustees. Good faith fair valued securities may be classified as Level 2 or Level 3 for FASB ASC Topic 820 “Fair Value Measurement” based on the applicable valuation inputs. See FASB ASC Topic 820 “Fair Value Measurement” in the Notes to Financial Statements. |
See accompanying Notes to Financial Statements.
Investments by Country* | | Percentage of Total
Long-Term
Investments | |
Australia | | 0.6 | % |
Brazil | | 1.7 | |
Canada | | 1.8 | |
Chile | | 0.3 | |
France | | 1.9 | |
Germany | | 0.5 | |
Ireland | | 1.1 | |
Italy | | 1.2 | |
Japan | | 0.5 | |
Luxembourg | | 1.2 | |
Mexico | | 0.7 | |
Norway | | 0.8 | |
Puerto Rico | | 0.2 | |
Spain | | 0.3 | |
Sweden | | 0.4 | |
Switzerland | | 1.6 | |
United Kingdom | | 6.0 | |
United States | | 79.2 | |
Total Long-Term Investments | | 100.0 | % |
* The country table is presented for this Fund because its strategy includes investment in non-U.S. securities as deemed significant by the Fund’s Adviser.
Curian/PIMCO Credit Income Fund
| | Shares/Par † | | Value | |
NON-U.S. GOVERNMENT AGENCY ASSET-BACKED SECURITIES - 4.0% | | | | | |
Air Canada Pass-Through Trust, 4.13%, 05/15/25 (a) | | $ | 95 | | $ | 97 | |
American Airlines Pass-Through Trust, 5.25%, 01/31/21 | | 46 | | 49 | |
Asset Backed Securities Corp. Home Equity Loan Trust REMIC, 1.11%, 09/25/34 (b) | | 56 | | 51 | |
Asset-Backed Pass-Through Certificates REMIC, 0.62%, 04/25/35 (b) | | 21 | | 21 | |
Banc of America Alternative Loan Trust REMIC, 5.75%, 11/25/35 | | 106 | | 99 | |
Centex Home Equity Loan Trust REMIC, 0.79%, 09/25/34 (b) | | 64 | | 57 | |
Citigroup Mortgage Loan Trust Inc. REMIC, 5.39%, 09/25/37 (b) | | 85 | | 75 | |
Continental Airlines Inc. Pass-Through Trust | | | | | |
7.25%, 11/10/19 | | 54 | | 62 | |
5.50%, 10/29/20 | | 181 | | 189 | |
Countrywide Asset-Backed Certificates REMIC | | | | | |
0.89%, 07/25/34 (b) | | 130 | | 122 | |
1.02%, 08/25/34 (b) | | 96 | | 90 | |
CVS Pass-Through Trust, 7.51%, 01/10/32 (a) | | 63 | | 80 | |
First Franklin Mortgage Loan Trust REMIC, 1.59%, 10/25/34 (b) | | 50 | | 41 | |
HomeBanc Mortgage Trust REMIC, 0.44%, 10/25/35 (b) | | 37 | | 33 | |
HSI Asset Securitization Corp. Trust REMIC, 0.53%, 12/25/35 (b) | | 100 | | 81 | |
JPMorgan Mortgage Acquisition Trust REMIC, 0.44%, 07/25/36 (b) | | 300 | | 216 | |
Lehman XS Trust REMIC, 5.17%, 08/25/35 (b) | | 82 | | 82 | |
New Century Home Equity Loan Trust REMIC, 0.45%, 10/25/35 (b) | | 89 | | 88 | |
OMX Timber Finance Investments I LLC, 5.42%, 01/29/20 (c) (d) | | 300 | | 332 | |
Park Place Securities Inc. Asset-Backed Pass-Through Certificates REMIC, 1.16%, 09/25/34 (b) | | 98 | | 93 | |
Race Point CLO Ltd., 1.54%, 12/15/22 (a) (b) | | 250 | | 250 | |
RALI Trust REMIC | | | | | |
6.00%, 12/25/35 | | 134 | | 119 | |
6.00%, 02/25/37 | | 139 | | 111 | |
RASC Trust REMIC, 0.33%, 09/25/36 (b) | | 369 | | 310 | |
SBA Tower Trust REMIC, 3.60%, 04/16/18 (a) | | 100 | | 100 | |
SLM Private Credit Student Loan Trust REMIC, 0.42%, 09/15/17 (b) | | 151 | | 150 | |
STARM Mortgage Loan Trust REMIC, 6.02%, 02/25/37 (b) | | 42 | | 41 | |
United Air Lines Pass-Through Trust, 9.75%, 01/15/17 | | 54 | | 59 | |
United Airlines Pass-Through Trust, 3.75%, 09/03/26 | | 100 | | 101 | |
US Airways Pass-Through Trust | | | | | |
5.38%, 11/15/21 | | 148 | | 152 | |
3.95%, 11/15/25 | | 97 | | 100 | |
Virgin Australia Trust, 5.00%, 10/23/23 (a) | | 90 | | 92 | |
| | | | | |
Total Non-U.S. Government Agency Asset-Backed Securities (cost $3,455) | | | | 3,543 | |
| | | | | |
CORPORATE BONDS AND NOTES - 71.7% | | | | | |
| | | | | |
CONSUMER DISCRETIONARY - 5.9% | | | | | |
AMAYA Holdings BV Term Loan, 5.00%, 07/29/21 (b) | | 100 | | 99 | |
Amazon.com Inc. | | | | | |
2.60%, 12/05/19 | | 100 | | 101 | |
3.30%, 12/05/21 | | 100 | | 101 | |
3.80%, 12/05/24 | | 100 | | 103 | |
Cablevision Systems Corp. Term Loan B, 2.67%, 04/15/20 (b) | | 457 | | 447 | |
Charter Communications Operating LLC Term Loan E, 3.00%, 07/01/20 (b) | | 300 | | 294 | |
Charter Communications Operating LLC Term Loan F, 3.00%, 01/31/21 (b) | | 100 | | 98 | |
Comcast Corp., 6.50%, 01/15/17 | | 50 | | 55 | |
Cox Communications Inc., 3.85%, 02/01/25 (c) (d) | | 200 | | 202 | |
D.R. Horton Inc. | | | | | |
3.63%, 02/15/18 | | 100 | | 101 | |
3.75%, 03/01/19 | | 100 | | 99 | |
DIRECTV Holdings LLC, 3.95%, 01/15/25 | | 100 | | 101 | |
Glencore Funding LLC, 1.70%, 05/27/16 (c) (d) | | 150 | | 150 | |
GLP Capital LP, 4.38%, 11/01/18 | | 100 | | 102 | |
Massachusetts Institute of Technology, 4.68%, 07/01/14 | | 200 | | 231 | |
MCE Finance Ltd., 5.00%, 02/15/21 (a) | | 200 | | 187 | |
Nissan Motor Acceptance Corp., 2.65%, 09/26/18 (a) | | 100 | | 102 | |
Numericable Group SA, 6.00%, 05/15/22 (a) | | 200 | | 201 | |
Numericable U.S. LLC Term Loan B-1, 4.50%, 04/23/20 (b) | | 64 | | 64 | |
Numericable U.S. LLC Term Loan B-2, 4.50%, 04/23/20 (b) | | 55 | | 55 | |
Pearson Funding Five Plc, 3.25%, 05/08/23 (a) | | 200 | | 192 | |
QVC Inc., 4.45%, 02/15/25 | | 500 | | 489 | |
Time Warner Cable Inc. | | | | | |
5.85%, 05/01/17 | | 100 | | 109 | |
6.75%, 07/01/18 | | 100 | | 115 | |
Time Warner Entertainment Co. LP, 8.38%, 07/15/33 | | 100 | | 150 | |
Toll Brothers Finance Corp. | | | | | |
4.00%, 12/31/18 | | 150 | | 150 | |
| | | | | | | |
See accompanying Notes to Financial Statements.
| | Shares/Par † | | Value | |
6.75%, 11/01/19 | | 100 | | 112 | |
Venetian Casino Resort LLC Term Loan, 3.25%, 12/16/20 (b) | | 358 | | 355 | |
Viacom Inc., 4.25%, 09/01/23 | | 300 | | 309 | |
Wynn Las Vegas LLC, 5.38%, 03/15/22 | | 160 | | 162 | |
Wynn Macau Ltd, 5.25%, 10/15/21 (a) | | 200 | | 188 | |
| | | | 5,224 | |
CONSUMER STAPLES - 1.0% | | | | | |
Altria Group Inc., 9.25%, 08/06/19 (e) | | 12 | | 15 | |
BAT International Finance Plc, 9.50%, 11/15/18 | | 100 | | 126 | |
BRF SA, 4.75%, 05/22/24 (a) | | 200 | | 194 | |
HJ Heinz Co., 4.25%, 10/15/20 | | 100 | | 101 | |
PepsiCo Inc., 0.43%, 07/30/15 (b) | | 100 | | 100 | |
Reynolds American Inc., 3.25%, 11/01/22 | | 200 | | 195 | |
Reynolds Group Issuer Inc., 7.88%, 08/15/19 | | 50 | | 53 | |
Tyson Foods Inc., 4.50%, 06/15/22 | | 50 | | 54 | |
| | | | 838 | |
ENERGY - 8.7% | | | | | |
AK Transneft OJSC Via TransCapitalInvest Ltd., 8.70%, 08/07/18 (a) | | 400 | | 412 | |
BG Energy Capital Plc, 4.00%, 10/15/21 (a) | | 125 | | 129 | |
BP AMI Leasing Inc., 5.52%, 05/08/19 (c) (d) | | 125 | | 140 | |
California Resources Corp. | | | | | |
5.50%, 09/15/21 (a) | | 100 | | 85 | |
6.00%, 11/15/24 (a) | | 100 | | 85 | |
Canadian Oil Sands Ltd., 7.75%, 05/15/19 (c) (d) | | 50 | | 54 | |
Chesapeake Energy Corp., 3.48%, 04/15/19 (b) | | 100 | | 98 | |
CNOOC Finance 2013 Ltd., 3.00%, 05/09/23 | | 300 | | 284 | |
Continental Resources Inc., 3.80%, 06/01/24 | | 100 | | 88 | |
Enable Midstream Partners LP, 2.40%, 05/15/19 (c) (d) | | 200 | | 195 | |
Encana Corp., 6.50%, 02/01/38 | | 50 | | 53 | |
Energy Future Intermediate Holding Co. LLC Term Loan, 4.25%, 04/28/16 (b) | | 732 | | 731 | |
Energy Transfer Partners LP, 6.50%, 02/01/42 | | 100 | | 115 | |
Ensco Plc, 4.50%, 10/01/24 | | 200 | | 193 | |
Enterprise Products Operating LLC | | | | | |
3.20%, 02/01/16 | | 150 | | 154 | |
3.90%, 02/15/24 | | 100 | | 102 | |
3.75%, 02/15/25 | | 100 | | 100 | |
EQT Midstream Partners LP, 4.00%, 08/01/24 | | 100 | | 99 | |
Gazprom OAO Via Gaz Capital SA | | | | | |
8.15%, 04/11/18 (a) | | 100 | | 99 | |
6.00%, 01/23/21 (a) | | 200 | | 175 | |
Harvest Operations Corp., 6.88%, 10/01/17 | | 150 | | 145 | |
Kinder Morgan Energy Partners LP, 3.50%, 03/01/21 | | 150 | | 148 | |
Kinder Morgan Inc., 4.30%, 06/01/25 | | 150 | | 151 | |
MarkWest Energy Partners LP, 4.88%, 12/01/24 | | 400 | | 391 | |
Midstates Petroleum Co. Inc., 10.75%, 10/01/20 | | 100 | | 53 | |
NGPL PipeCo LLC, 7.12%, 12/15/17 (a) | | 100 | | 98 | |
ONEOK Partners LP | | | | | |
3.38%, 10/01/22 | | 25 | | 23 | |
5.00%, 09/15/23 | | 100 | | 104 | |
Pacific Rubiales Energy Corp., 5.13%, 03/28/23 (a) | | 100 | | 79 | |
Petrobras Global Finance BV, 6.25%, 03/17/24 | | 100 | | 95 | |
Petrobras International Finance Co., 7.88%, 03/15/19 | | 400 | | 421 | |
Petrofac Ltd., 3.40%, 10/10/18 (c) (d) | | 100 | | 99 | |
Pioneer Natural Resources Co. | | | | | |
5.88%, 07/15/16 | | 100 | | 106 | |
6.88%, 05/01/18 | | 50 | | 56 | |
Plains All American Pipeline LP | | | | | |
8.75%, 05/01/19 | | 150 | | 187 | |
2.60%, 12/15/19 | | 200 | | 199 | |
Rosneft Finance SA | | | | | |
7.50%, 07/18/16 (a) | | 100 | | 96 | |
7.88%, 03/13/18 | | 200 | | 184 | |
Sabine Pass Liquefaction LLC, 5.75%, 05/15/24 | | 300 | | 294 | |
Sibur Securities Ltd., 3.91%, 01/31/18 (a) | | 200 | | 162 | |
Sinopec Group Overseas Development Ltd., 1.15%, 04/10/19 (a) (b) | | 300 | | 300 | |
Southwestern Energy Co. | | | | | |
7.50%, 02/01/18 | | 100 | | 113 | |
4.10%, 03/15/22 | | 100 | | 98 | |
Targa Resources Partners LP | | | | | |
6.88%, 02/01/21 | | 62 | | 63 | |
6.38%, 08/01/22 | | 75 | | 76 | |
5.25%, 05/01/23 | | 100 | | 96 | |
Western Gas Partners LP | | | | | |
2.60%, 08/15/18 | | 100 | | 100 | |
4.00%, 07/01/22 | | 100 | | 101 | |
Williams Partners LP | | | | | |
5.25%, 03/15/20 | | 100 | | 109 | |
4.50%, 11/15/23 | | 100 | | 101 | |
4.30%, 03/04/24 | | 100 | | 100 | |
| | | | 7,739 | |
FINANCIALS - 39.1% | | | | | |
ABN AMRO Bank NV, 6.25%, 09/13/22 | | 400 | | 433 | |
AerCap Ireland Capital Ltd., 3.75%, 05/15/19 (a) | | 150 | | 148 | |
Alexandria Real Estate Equities Inc., 2.75%, 01/15/20 | | 100 | | 99 | |
American Campus Communities Operating Partnership LP, 3.75%, 04/15/23 | | 50 | | 50 | |
American Express Credit Corp., 0.74%, 07/29/16 (b) | | 300 | | 301 | |
American Tower Corp., 3.50%, 01/31/23 | | 300 | | 290 | |
ARC Properties Operating Partnership LP, 3.00%, 02/06/19 | | 200 | | 185 | |
Banco Continental SA via Continental Senior Trustees II Cayman Ltd., 5.75%, 01/18/17 (a) | | 300 | | 316 | |
Banco de Credito del Peru, 4.25%, 04/01/23 (a) | | 100 | | 99 | |
Banco de Credito e Inversiones, 3.00%, 09/13/17 (a) | | 200 | | 204 | |
Banco del Estado de Chile, 2.00%, 11/09/17 (a) | | 150 | | 150 | |
Banco Espirito Santo SA | | | | | |
5.88%, 11/09/15, EUR | | 100 | | 122 | |
5.00%, 05/23/19, EUR | | 100 | | 118 | |
Banco Popolare, 2.38%, 01/22/18, EUR | | 400 | | 488 | |
Banco Santander Brasil SA | | | | | |
4.50%, 04/06/15 (a) | | 100 | | 101 | |
4.63%, 02/13/17 (a) | | 300 | | 311 | |
Bank of America Corp. | | | | | |
6.50%, 08/01/16 | | 350 | | 377 | |
0.00%, 01/04/17 (f) | | 500 | | 488 | |
2.65%, 04/01/19 | | 100 | | 101 | |
4.00%, 04/01/24 | | 600 | | 625 | |
Bank of America NA | | | | | |
1.25%, 02/14/17 | | 250 | | 249 | |
0.65%, 05/08/17 (b) | | 250 | | 250 | |
Bank of New York Mellon Corp., 2.30%, 09/11/19 | | 400 | | 402 | |
See accompanying Notes to Financial Statements.
| | Shares/Par † | | Value | |
Bank of Tokyo-Mitsubishi UFJ Ltd., 2.35%, 09/08/19 (c) (d) | | 400 | | 397 | |
Barclays Bank Plc | | | | | |
14.00% (callable at 100 beginning 12/15/19) (g), GBP | | 200 | | 409 | |
7.63%, 11/21/22 | | 600 | | 656 | |
BBVA US Senior SAU, 4.66%, 10/09/15 | | 200 | | 205 | |
BGC Partners Inc., 5.38%, 12/09/19 (c) (d) | | 225 | | 221 | |
BPCE SA, 4.63%, 07/11/24 (a) | | 400 | | 388 | |
Cantor Fitzgerald LP, 7.88%, 10/15/19 (a) | | 500 | | 546 | |
CIT Group Inc. | | | | | |
4.25%, 08/15/17 | | 200 | | 204 | |
5.50%, 02/15/19 (a) | | 100 | | 105 | |
Citigroup Inc. | | | | | |
4.88%, 05/07/15 | | 500 | | 507 | |
1.03%, 04/01/16 (b) | | 500 | | 502 | |
8.13%, 07/15/39 | | 100 | | 153 | |
Commonwealth Bank of Australia, 2.30%, 09/06/19 | | 250 | | 250 | |
Compass Bank, 2.75%, 09/29/19 | | 250 | | 250 | |
Credit Agricole SA | | | | | |
6.63% (callable at 100 beginning 09/23/19) (c) (d) (g) | | 300 | | 291 | |
0.78%, 06/12/17 (a) (b) | | 250 | | 250 | |
Credit Suisse | | | | | |
3.00%, 10/29/21 | | 300 | | 299 | |
3.63%, 09/09/24 | | 250 | | 254 | |
Credit Suisse AG, 6.50%, 08/08/23 (a) | | 200 | | 220 | |
Credit Suisse Group AG, 7.50%, (callable at 100 beginning 12/11/23) (a) (g) | | 200 | | 208 | |
Credit Suisse Group Guernsey I Ltd., 7.88%, 02/24/41 (h) | | 400 | | 424 | |
Crown Castle International Corp., 4.88%, 04/15/22 | | 100 | | 101 | |
DBS Bank Ltd. | | | | | |
0.84%, 07/15/21 (a) (b) | | 100 | | 99 | |
3.62%, 09/21/22 | | 200 | | 206 | |
DBS Group Holdings Ltd., 2.25%, 07/16/19 (a) | | 200 | | 200 | |
Delos Finance SARL Term Loan, 3.50%, 02/27/21 (b) | | 300 | | 297 | |
Deutsche Annington Finance BV, 3.20%, 10/02/17 (d) | | 100 | | 102 | |
Education Realty Operating Partnership LP, 4.60%, 12/01/24 | | 100 | | 102 | |
Fidelity National Financial Inc., 5.50%, 09/01/22 | | 100 | | 109 | |
First American Financial Corp. | | | | | |
4.30%, 02/01/23 | | 100 | | 100 | |
4.60%, 11/15/24 | | 200 | | 203 | |
Ford Motor Credit Co. LLC | | | | | |
7.00%, 04/15/15 | | 100 | | 102 | |
12.00%, 05/15/15 | | 100 | | 104 | |
2.38%, 01/16/18 | | 400 | | 402 | |
8.13%, 01/15/20 | | 150 | | 186 | |
5.88%, 08/02/21 | | 200 | | 232 | |
General Electric Capital Corp. | | | | | |
5.50%, 09/15/67 (b), EUR | | 50 | | 65 | |
6.37%, 11/15/67 (b) | | 200 | | 214 | |
General Motors Financial Co. Inc., 3.50%, 07/10/19 | | 100 | | 102 | |
Goldman Sachs Group Inc. | | | | | |
5.95%, 01/18/18 | | 700 | | 778 | |
6.15%, 04/01/18 | | 200 | | 224 | |
7.50%, 02/15/19 | | 380 | | 452 | |
6.00%, 06/15/20 | | 200 | | 231 | |
4.80%, 07/08/44 | | 250 | | 268 | |
Hana Bank, 4.38%, 09/30/24 (a) | | 200 | | 208 | |
HBOS Plc, 6.75%, 05/21/18 (a) | | 400 | | 446 | |
HDFC Bank Ltd., 3.00%, 11/30/16 | | 200 | | 203 | |
Healthcare Trust of America Holdings LP, 3.38%, 07/15/21 | | 200 | | 200 | |
Host Hotels & Resorts LP, 6.00%, 10/01/21 | | 50 | | 57 | |
HSBC Bank USA NA, 4.88%, 08/24/20 | | 110 | | 121 | |
HSBC Capital Funding LP, 10.18%, (callable at 100 beginning 06/30/30) (a) (g) | | 100 | | 150 | |
HSBC Finance Corp., 6.68%, 01/15/21 | | 350 | | 415 | |
HSBC Holdings Plc, 6.80%, 06/01/38 | | 300 | | 398 | |
Hyundai Capital America, 1.88%, 08/09/16 (a) | | 100 | | 101 | |
ICICI Bank Ltd. | | | | | |
5.00%, 01/15/16 | | 100 | | 103 | |
4.75%, 11/25/16 (a) | | 200 | | 209 | |
Industrial & Commercial Bank of China Ltd., 2.35%, 11/13/17 | | 400 | | 399 | |
ING Bank NV, 5.80%, 09/25/23 (a) | | 200 | | 222 | |
Intesa Sanpaolo SpA | | | | | |
3.13%, 01/15/16 | | 200 | | 203 | |
6.50%, 02/24/21 (a) | | 250 | | 289 | |
5.02%, 06/26/24 (c) (d) | | 400 | | 388 | |
JPMorgan Chase & Co. | | | | | |
5.00% (callable at 100 beginning 07/01/19) (g) | | 150 | | 147 | |
6.10% (callable at 100 beginning 10/01/24) (g) | | 500 | | 499 | |
1.06%, 05/30/17 (b), GBP | | 50 | | 77 | |
6.30%, 04/23/19 | | 300 | | 348 | |
3.63%, 05/13/24 | | 150 | | 154 | |
JPMorgan Chase Bank NA | | | | | |
0.57%, 06/13/16 (b) | | 250 | | 249 | |
5.38%, 09/28/16, GBP | | 100 | | 166 | |
0.78%, 05/31/17 (b), EUR | | 550 | | 664 | |
0.65%, 06/02/17 (b) | | 250 | | 249 | |
6.00%, 10/01/17 | | 250 | | 277 | |
LBG Capital No.2 Plc, 15.00%, 12/21/19 (h), GBP | | 100 | | 214 | |
LeasePlan Corp., 3.00%, 10/23/17 (c) (d) | | 200 | | 205 | |
LeasePlan Corp. NV, 2.50%, 05/16/18 (a) | | 200 | | 200 | |
Legg Mason Inc., 3.95%, 07/15/24 | | 100 | | 102 | |
Lloyds Bank Plc, 12.00%, (callable at 100 beginning 12/16/24) (a) (g) | | 100 | | 142 | |
Merrill Lynch & Co. Inc., 6.88%, 04/25/18 | | 1,010 | | 1,160 | |
Metropolitan Life Global Funding I, 2.30%, 04/10/19 (a) | | 150 | | 151 | |
Mid-America Apartments LP, 3.75%, 06/15/24 | | 100 | | 100 | |
Mizuho Bank Ltd., 2.45%, 04/16/19 (a) | | 200 | | 199 | |
Moody’s Corp. | | | | | |
4.50%, 09/01/22 | | 200 | | 214 | |
4.88%, 02/15/24 | | 290 | | 319 | |
Morgan Stanley | | | | | |
6.25%, 08/28/17 | | 100 | | 111 | |
7.30%, 05/13/19 | | 290 | | 344 | |
5.75%, 01/25/21 | | 100 | | 115 | |
Nationwide Building Society, 6.25%, 02/25/20 (a) | | 250 | | 293 | |
New York Life Global Funding, 1.13%, 03/01/17 (a) | | 100 | | 100 | |
Omega Healthcare Investors Inc., 4.95%, 04/01/24 | | 50 | | 52 | |
OneMain Financial Holdings Inc., 6.75%, 12/15/19 (a) | | 100 | | 102 | |
Piper Jaffray Cos., 3.26%, 05/31/17 (b) (c) (d) | | 100 | | 100 | |
QBE Insurance Group Ltd., 2.40%, 05/01/18 (a) | | 200 | | 200 | |
RCI Banque SA, 3.50%, 04/03/18 (a) | | 100 | | 104 | |
See accompanying Notes to Financial Statements.
| | Shares/Par † | | Value | |
Rio Oil Finance Trust | | | | | |
6.25%, 07/06/24 (a) | | 250 | | 239 | |
6.75%, 01/06/27 (a) | | 250 | | 239 | |
Royal Bank of Scotland Group Plc, 6.99%, (callable at 100 beginning 10/05/17) (a) (g) | | 400 | | 450 | |
Royal Bank of Scotland NV, 4.65%, 06/04/18 | | 500 | | 519 | |
Royal Bank of Scotland Plc, 9.50%, 03/16/22 | | 100 | | 114 | |
Sberbank of Russia Via SB Capital SA | | | | | |
5.40%, 03/24/17 | | 200 | | 187 | |
3.35%, 11/15/19, EUR | | 100 | | 100 | |
5.72%, 06/16/21 | | 200 | | 173 | |
SL Green Realty Corp., 4.50%, 12/01/22 | | 100 | | 102 | |
SLM Corp., 8.45%, 06/15/18 | | 200 | | 223 | |
Springleaf Finance Corp., 6.90%, 12/15/17 | | 100 | | 106 | |
State Bank of India, 4.13%, 08/01/17 | | 200 | | 208 | |
State Street Corp., 3.30%, 12/16/24 | | 250 | | 254 | |
Sumitomo Mitsui Financial Group Inc., 4.44%, 04/02/24 (a) | | 200 | | 207 | |
TIAA Asset Management Finance Co. LLC, 2.95%, 11/01/19 (c) (d) | | 100 | | 100 | |
UBS AG | | | | | |
2.38%, 08/14/19 | | 300 | | 300 | |
7.63%, 08/17/22 | | 750 | | 883 | |
Vornado Realty LP, 2.50%, 06/30/19 | | 150 | | 149 | |
Wells Fargo & Co. | | | | | |
5.90% (callable at 100 beginning 06/15/24) (g) | | 100 | | 101 | |
3.00%, 01/22/21 | | 300 | | 306 | |
4.48%, 01/16/24 | | 100 | | 107 | |
4.65%, 11/04/44 | | 100 | | 103 | |
Wells Fargo Bank NA, 5.95%, 08/26/36 | | 100 | | 126 | |
Weyerhaeuser Co., 7.38%, 10/01/19 | | 300 | | 358 | |
| | | | 34,648 | |
HEALTH CARE - 3.3% | | | | | |
AbbVie Inc. | | | | | |
1.20%, 11/06/15 | | 100 | | 100 | |
2.90%, 11/06/22 | | 100 | | 99 | |
Amgen Inc. | | | | | |
2.30%, 06/15/16 | | 150 | | 152 | |
4.10%, 06/15/21 | | 355 | | 381 | |
3.63%, 05/22/24 | | 300 | | 305 | |
Biomet Inc. Incremental Term Loan, 3.66%, 07/25/17 (b) | | 138 | | 138 | |
Boston Scientific Corp., 2.65%, 10/01/18 | | 100 | | 100 | |
Endo Finance LLC & Endo Finco Inc., 5.38%, 01/15/23 (a) | | 200 | | 196 | |
HCA Inc., 3.75%, 03/15/19 | | 100 | | 100 | |
Hospira Inc., 5.20%, 08/12/20 | | 100 | | 107 | |
Medtronic Inc. | | | | | |
1.04%, 03/15/20 (a) (b) | | 150 | | 150 | |
3.50%, 03/15/25 (a) | | 250 | | 256 | |
RPI Finance Trust Term Loan, 3.25%, 06/30/20 (b) | | 298 | | 297 | |
WellPoint Inc., 1.25%, 09/10/15 | | 500 | | 502 | |
| | | | 2,883 | |
INDUSTRIALS - 2.7% | | | | | |
ADT Corp., 3.50%, 07/15/22 | | 100 | | 85 | |
Aviation Capital Group Corp. | | | | | |
4.63%, 01/31/18 (a) | | 100 | | 104 | |
7.13%, 10/15/20 (a) | | 50 | | 58 | |
AWAS Aviation Capital Ltd., 7.00%, 10/17/16 (a) (i) | | 31 | | 31 | |
Burlington Northern Santa Fe LLC, 3.45%, 09/15/21 | | 125 | | 130 | |
General Electric Co., 5.25%, 12/06/17 | | 130 | | 144 | |
Hellenic Railways Organization SA, 4.03%, 03/17/17, EUR | | 100 | | 98 | |
International Lease Finance Corp. | | | | | |
6.75%, 09/01/16 (a) | | 200 | | 213 | |
7.13%, 09/01/18 (a) | | 190 | | 213 | |
Lender Processing Services, 5.75%, 04/15/23 | | 50 | | 53 | |
Masco Corp. | | | | | |
6.13%, 10/03/16 | | 150 | | 159 | |
5.85%, 03/15/17 | | 50 | | 54 | |
5.95%, 03/15/22 | | 150 | | 166 | |
6.50%, 08/15/32 | | 100 | | 102 | |
Owens Corning | | | | | |
4.20%, 12/15/22 | | 150 | | 152 | |
4.20%, 12/01/24 | | 200 | | 198 | |
Penske Truck Leasing Co. LP, 3.38%, 03/15/18 (a) | | 100 | | 103 | |
USG Corp. | | | | | |
9.75%, 01/15/18 (e) | | 100 | | 114 | |
8.38%, 10/15/18 (a) | | 100 | | 105 | |
Verisk Analytics Inc., 4.13%, 09/12/22 | | 100 | | 103 | |
| | | | 2,385 | |
INFORMATION TECHNOLOGY - 2.8% | | | | | |
Alibaba Group Holding Ltd. | | | | | |
3.13%, 11/28/21 (a) | | 300 | | 296 | |
3.60%, 11/28/24 (a) | | 300 | | 298 | |
Autodesk Inc., 1.95%, 12/15/17 | | 100 | | 100 | |
Avago Technologies Term Loan, 3.75%, 04/01/21 (b) | | 599 | | 596 | |
Baidu Inc., 3.25%, 08/06/18 | | 300 | | 307 | |
Dell Inc. Term Loan B | | | | | |
3.75%, 09/24/18 (b) | | 200 | | 199 | |
4.50%, 03/24/20 (b) | | 198 | | 197 | |
Fidelity National Information Services Inc., 3.88%, 06/05/24 | | 100 | | 101 | |
KLA-Tencor Corp., 4.65%, 11/01/24 | | 100 | | 104 | |
Motorola Solutions Inc., 4.00%, 09/01/24 | | 100 | | 101 | |
Tencent Holdings Ltd., 3.38%, 05/02/19 (a) | | 200 | | 203 | |
| | | | 2,502 | |
MATERIALS - 1.3% | | | | | |
Anglo American Capital Plc, 4.13%, 04/15/21 (c) (d) | | 200 | | 201 | |
Cemex SAB de CV, 5.88%, 03/25/19 (a) | | 200 | | 203 | |
Corp. Nacional del Cobre de Chile, 2.25%, 07/09/24 (c) (d), EUR | | 100 | | 125 | |
EuroChem Mineral & Chemical Co. OJSC via EuroChem GI Ltd., 5.13%, 12/12/17 (a) | | 200 | | 172 | |
Goldcorp Inc., 3.63%, 06/09/21 | | 100 | | 100 | |
Graphic Packaging International Inc., 4.75%, 04/15/21 | �� | 50 | | 50 | |
Huntsman International LLC, 4.88%, 11/15/20 | | 100 | | 99 | |
Rock-Tenn Co., 4.90%, 03/01/22 | | 30 | | 32 | |
Westlake Chemical Corp., 3.60%, 07/15/22 | | 30 | | 30 | |
WR Grace and Co. Term Loan | | | | | |
0.00%,02/03/21 (j) | | 74 | | 73 | |
0.00%,02/03/21 (j) | | 26 | | 26 | |
| | | | 1,111 | |
TELECOMMUNICATION SERVICES - 4.8% | | | | | |
AT&T Inc., 4.80%, 06/15/44 | | 100 | | 102 | |
CC Holdings GS V LLC, 3.85%, 04/15/23 | | 200 | | 199 | |
Crown Castle International Corp., 5.25%, 01/15/23 | | 100 | | 102 | |
Crown Castle International Corp. New Term Loan B, 3.00%, 01/31/21 (b) | | 398 | | 391 | |
Lynx I Corp., 5.38%, 04/15/21 (a) | | 200 | | 206 | |
See accompanying Notes to Financial Statements.
| | Shares/Par † | | Value | |
MTN Mauritius Investments Ltd., 4.76%, 11/11/24 (c) (d) | | 200 | | 196 | |
Sprint Communications Inc., 8.38%, 08/15/17 | | 200 | | 216 | |
Telecom Italia Capital SA, 7.00%, 06/04/18 | | 150 | | 166 | |
Telecom Italia SpA | | | | | |
4.50%, 09/20/17, EUR | | 125 | | 162 | |
7.38%, 12/15/17, GBP | | 100 | | 174 | |
Telefonica Emisiones SAU | | | | | |
3.99%, 02/16/16 | | 300 | | 309 | |
6.42%, 06/20/16 | | 100 | | 107 | |
Verizon Communications Inc. | | | | | |
1.01%, 06/17/19 (b) | | 100 | | 101 | |
2.63%, 02/21/20 (a) | | 500 | | 494 | |
4.50%, 09/15/20 | | 200 | | 217 | |
5.15%, 09/15/23 | | 400 | | 442 | |
6.55%, 09/15/43 | | 280 | | 359 | |
5.01%, 08/21/54 (a) | | 279 | | 289 | |
| | | | 4,232 | |
UTILITIES - 2.1% | | | | | |
AES Corp., 3.23%, 06/01/19 (b) | | 150 | | 146 | |
Delmarva Power & Light Co., 3.50%, 11/15/23 | | 250 | | 260 | |
Duquesne Light Holdings Inc., 5.90%, 12/01/21 (a) | | 50 | | 58 | |
Dynegy Finance I Inc., 6.75%, 11/01/19 (a) | | 100 | | 102 | |
Israel Electric Corp. Ltd. | | | | | |
5.63%, 06/21/18 | | 200 | | 211 | |
7.25%, 01/15/19 (a) | | 200 | | 223 | |
Korea Hydro & Nuclear Power Co. Ltd., 2.88%, 10/02/18 (a) | | 200 | | 204 | |
Laclede Group Inc., 0.98%, 08/15/17 (b) | | 200 | | 200 | |
MidAmerican Energy Holdings Co., 6.50%, 09/15/37 | | 50 | | 66 | |
Niagara Mohawk Power Corp., 2.72%, 11/28/22 (a) | | 100 | | 98 | |
NRG Energy Inc. Refinancing Term Loan B, 2.75%, 07/01/18 (b) | | 200 | | 196 | |
Western Massachusetts Electric Co., 3.50%, 09/15/21 | | 100 | | 104 | |
| | | | 1,868 | |
Total Corporate Bonds and Notes (cost $63,466) | | | | 63,430 | |
| | | | | |
GOVERNMENT AND AGENCY OBLIGATIONS - 17.4% | | | | | |
| | | | | |
GOVERNMENT SECURITIES - 16.4% | | | | | |
Municipals - 0.2% | | | | | |
California Earthquake Authority, 2.81%, 07/01/19 | | 200 | | 199 | |
Sovereign - 1.5% | | | | | |
Hellenic Republic Government Bond, 2.00%, 02/24/36 (i), EUR | | 100 | | 61 | |
Indonesia Government International Bond, 2.88%, 07/08/21 (a), EUR | | 100 | | 123 | |
Italy Buoni Poliennali Del Tesoro, 5.50%, 11/01/22, EUR | | 500 | | 778 | |
Slovenia Government International Bond | | | | | |
4.70%, 11/01/16 (a), EUR | | 100 | | 129 | |
4.13%, 02/18/19 (a) | | 200 | | 209 | |
| | | | 1,300 | |
Treasury Inflation Index Securities - 1.3% | | | | | |
U.S. Treasury Inflation Indexed Note, 2.38%, 01/15/25 (k) | | 1,008 | | 1,185 | |
U.S. Treasury Securities - 13.4% | | | | | |
U.S. Treasury Bond | | | | | |
3.13%, 11/15/41 - 02/15/42 | | 360 | | 389 | |
3.00%, 05/15/42 (l) | | 800 | | 841 | |
3.63%, 08/15/43 - 02/15/44 | | 1,050 | | 1,236 | |
0.00%, 11/15/43 (f) | | 2,500 | | 1,099 | |
3.75%, 11/15/43 | | 3,700 | | 4,450 | |
3.38%, 05/15/44 | | 25 | | 28 | |
3.13%, 08/15/44 (m) | | 2,050 | | 2,207 | |
Principal Only, 0.00%, 08/15/43 - 02/15/44 (f) | | 2,600 | | 1,143 | |
U.S. Treasury Note | | | | | |
0.25%, 02/28/15 (l) | | 64 | | 64 | |
0.25%, 05/15/15 | | 100 | | 100 | |
2.25%, 11/15/24 | | 250 | | 252 | |
| | | | 11,809 | |
U.S. GOVERNMENT AGENCY MORTGAGE-BACKED SECURITIES - 1.0% | | | | | |
Federal National Mortgage Association - 1.0% | | | | | |
Federal National Mortgage Association, 3.00%, 01/15/45, TBA (m) | | 900 | | 910 | |
Total Government and Agency Obligations
(cost $14,304) | | | | 15,403 | |
| | | | | |
COMMON STOCKS - 0.9% | | | | | |
| | | | | |
CONSUMER DISCRETIONARY - 0.7% | | | | | |
Cedar Fair LP | | — | | 11 | |
Las Vegas Sands Corp. | | 2 | | 141 | |
Melco Crown Entertainment Ltd. - ADR | | 7 | | 180 | |
MGM Resorts International (n) | | 8 | | 175 | |
Wynn Resorts Ltd. | | 1 | | 154 | |
| | | | 661 | |
FINANCIALS - 0.0% | | | | | |
Citigroup Inc. | | 1 | | 42 | |
| | | | | |
INFORMATION TECHNOLOGY - 0.2% | | | | | |
QUALCOMM Inc. | | 2 | | 132 | |
Total Common Stocks (cost $903) | | | | 835 | |
| | | | | |
PREFERRED STOCKS - 0.4% | | | | | |
| | | | | |
FINANCIALS - 0.4% | | | | | |
American Realty Capital Properties Inc., 6.70%, (callable at 25 beginning 01/03/19) (g) | | 2 | | 39 | |
CoBank ACB, 6.20%, (callable at 100 beginning 01/01/25) (a) (g) | | 3 | | 300 | |
Total Preferred Stocks (cost $337) | | | | 339 | |
| | | | | |
PURCHASED OPTIONS - 0.1% | | | | | |
Euro Stoxx 50 Index Call Option, Strike Price EUR 3,600, Expiration 12/20/19, CSI (d) | | 17 | | 48 | |
Put Swaption, 3-Month LIBOR versus 3.45% fixed, Expiration 09/21/15, DUB (d) | | 1 | | 1 | |
Put Swaption, 3-Month LIBOR versus 3.85% fixed, Expiration 03/04/15, JPM (d) | | 11 | | — | |
Put Swaption, 3-Month LIBOR versus 3.85% fixed, Expiration 03/04/15, MSS (d) | | 11 | | — | |
Total Purchased Options (cost $163) | | | | 49 | |
| | | | | |
TRUST PREFERREDS - 0.5% | | | | | |
| | | | | |
FINANCIALS - 0.5% | | | | | |
Citigroup Capital XIII, 7.88%, (callable at 25 beginning 10/30/15) | | 17 | | 438 | |
UTILITIES - 0.0% | | | | | |
SCE Trust III, 5.75%, (callable at 25 beginning 03/15/24) (g) | | — | | 11 | |
Total Trust Preferreds (cost $463) | | | | 449 | |
See accompanying Notes to Financial Statements.
| | Shares/Par † | | Value | |
SHORT TERM INVESTMENTS - 8.7% | | | | | |
| | | | | |
Certificates of Deposit - 0.8% | | | | | |
Banco Bilbao Vizcaya Argentaria | | | | | |
0.98%, 10/23/15 (b) | | $ | 250 | | 250 | |
1.08%, 05/16/16 (b) | | 250 | | 250 | |
Credit Suisse, 0.61%, 01/28/16 (b) | | 200 | | 200 | |
| | | | 700 | |
Federal Home Loan Bank - 1.2% | | | | | |
Federal Home Loan Bank | | | | | |
0.08%, 04/17/15 (o) | | 300 | | 300 | |
0.09%, 04/29/15 (o) | | 500 | | 500 | |
0.11%, 05/20/15 (o) | | 300 | | 300 | |
| | | | 1,100 | |
Federal Home Loan Mortgage Corp. - 1.5% | | | | | |
Federal Home Loan Mortgage Corp. | | | | | |
0.06%, 02/09/15 (o) | | 100 | | 100 | |
0.09%, 02/13/15 (o) | | 300 | | 300 | |
0.05%, 03/11/15 (o) | | 600 | | 600 | |
0.07%, 04/09/15 (o) | | 300 | | 300 | |
| | | | 1,300 | |
Federal National Mortgage Association - 1.3% | | | | | |
Federal National Mortgage Association | | | | | |
0.05%, 03/16/15 (o) | | 100 | | 100 | |
0.07%, 04/08/15 (o) | | 200 | | 200 | |
0.09%, 04/27/15 - 05/01/15 (o) | | 900 | | 900 | |
| | | | 1,200 | |
Investment Company - 0.9% | | | | | |
JNL Money Market Fund, 0.01% (p) (q) | | 817 | | 817 | |
Treasury Securities - 3.0% | | | | | |
Hellenic Republic Treasury Bill, 0.00%, 02/06/15, EUR | | 100 | | 121 | |
Mexico Cetes, 0.20%, 04/30/15, MXN | | 2,867 | | 1,924 | |
U.S. Treasury Bill, 0.02%, 01/29/15 | | $ | 600 | | 600 | |
| | | | 2,645 | |
Total Short Term Investments (cost $7,796) | | | | 7,762 | |
| | | | | |
Total Investments - 103.7% (cost $90,887) | | | | 91,810 | |
Other Assets and Liabilities, Net - (3.7%) | | | | (3,299 | ) |
Total Net Assets - 100.0% | | | | $ | 88,511 | |
| | | | | | | |
(a) | The Sub-Adviser has deemed this security which is exempt from registration under the 1933 Act to be liquid based on procedures approved by the Trust’s Board of Trustees. As of December 31, 2014, the aggregate value of these liquid securities was $16,034 which represented 18.1% of net assets. |
(b) | Variable rate security. Rate stated was in effect as of December 31, 2014. |
(c) | Security is restricted to resale to institutional investors. See the Restricted Securities tables accompanying the Summary Schedules of Investments presented in the Trust’s annual report. |
(d) | The Sub-Adviser has deemed this security to be illiquid based on procedures approved by the Trust’s Board of Trustees. |
(e) | The interest rate for this security is inversely affected by upgrades or downgrades to the credit rating of the issuer. |
(f) | Security issued with a zero coupon. Income is recognized through the accretion of discount. |
(g) | Perpetual security. |
(h) | Convertible security. |
(i) | Security is a “step-up” bond where the coupon may increase or step up at a future date. Rate stated was the coupon as of December 31, 2014. |
(j) | This variable rate senior loan will settle after December 31, 2014, at which time the interest rate will be determined. |
(k) | Treasury inflation indexed note, par amount is adjusted for inflation. |
(l) | All or a portion of the security is pledged or segregated as collateral. See the Notes to Financial Statements. |
(m) | All or a portion of the investment was purchased on a delayed delivery basis. As of December 31, 2014, the total cost of investments purchased on a delayed delivery basis was $3,086. |
(n) | Non-income producing security. |
(o) | This security is a direct debt of the agency and not collateralized by mortgages. |
(p) | Investment in affiliate. |
(q) | Yield changes daily to reflect current market conditions. Rate was the quoted yield as of December 31, 2014. |
Investments by Country* | | Percentage of Total
Long-Term
Investments | |
Australia | | 0.4 | % |
Brazil | | 1.6 | |
Canada | | 0.5 | |
Cayman Islands | | 0.3 | |
Chile | | 0.6 | |
China | | 2.7 | |
Colombia | | 0.1 | |
Ecuador | | 0.1 | |
France | | 1.5 | |
Germany | | 0.1 | |
Greece | | 0.2 | |
Hong Kong | | 0.2 | |
India | | 0.9 | |
Indonesia | | 0.1 | |
Israel | | 0.5 | |
Italy | | 3.2 | |
Japan | | 1.0 | |
Luxembourg | | 0.9 | |
Macau | | 0.2 | |
Mexico | | 0.2 | |
Netherlands | | 1.9 | |
Peru | | 0.5 | |
Portugal | | 0.3 | |
Russian Federation | | 1.9 | |
Singapore | | 0.6 | |
Slovenia | | 0.4 | |
South Africa | | 0.2 | |
South Korea | | 0.5 | |
Spain | | 0.7 | |
Switzerland | | 2.4 | |
United Kingdom | | 5.0 | |
United States | | 70.3 | |
Total Long-Term Investments | | 100.0 | % |
* The country table is presented for this Fund because its strategy includes investment in non-U.S. securities as deemed significant by the Fund’s Adviser.
Curian/T. Rowe Price Capital Appreciation Fund
| | Shares/Par † | | Value | |
COMMON STOCKS - 60.3% | | | | | |
| | | | | |
CONSUMER DISCRETIONARY - 7.1% | | | | | |
| | | | | |
AutoZone Inc. (a) | | 5 | | $ | 2,848 | |
Delphi Automotive Plc | | 15 | | 1,113 | |
Johnson Controls Inc. | | 24 | | 1,141 | |
Liberty Global Plc - Class A (a) | | 5 | | 231 | |
Liberty Global Plc - Class C (a) | | 21 | | 1,005 | |
Lowe’s Cos. Inc. | | 14 | | 943 | |
O’Reilly Automotive Inc. (a) | | 1 | | 231 | |
Twenty-First Century Fox Inc. - Class B | | 10 | | 376 | |
Viacom Inc. - Class B | | 2 | | 165 | |
| | | | 8,053 | |
| | | | | | |
See accompanying Notes to Financial Statements.
| | Shares/Par † | | Value | |
CONSUMER STAPLES - 2.9% | | | | | |
CVS Health Corp. | | 6 | | 539 | |
JM Smucker Co. | | 1 | | 121 | |
Mondelez International Inc. - Class A | | 20 | | 712 | |
PepsiCo Inc. | | 9 | | 823 | |
Philip Morris International Inc. | | 10 | | 823 | |
Wal-Mart Stores Inc. | | 4 | | 300 | |
| | | | 3,318 | |
ENERGY - 2.7% | | | | | |
Apache Corp. | | 5 | | 320 | |
California Resources Corp. (a) | | 3 | | 15 | |
Canadian Natural Resources Ltd. | | 57 | | 1,760 | |
Occidental Petroleum Corp. | | 7 | | 597 | |
Range Resources Corp. | | 6 | | 308 | |
| | | | 3,000 | |
FINANCIALS - 10.3% | | | | | |
American Tower Corp. | | 7 | | 662 | |
Bank of New York Mellon Corp. | | 21 | | 840 | |
Crown Castle International Corp. | | 12 | | 960 | |
Invesco Ltd. | | 7 | | 277 | |
JPMorgan Chase & Co. | | 16 | | 983 | |
Julius Baer Group Ltd. | | 4 | | 199 | |
Marsh & McLennan Cos. Inc. | | 54 | | 3,102 | |
State Street Corp. | | 28 | | 2,198 | |
TD Ameritrade Holding Corp. | | 30 | | 1,059 | |
UBS Group AG | | 81 | | 1,385 | |
| | | | 11,665 | |
HEALTH CARE - 15.0% | | | | | |
Abbott Laboratories | | 26 | | 1,157 | |
Actavis plc (a) | | 7 | | 1,725 | |
Allergan Inc. | | 9 | | 1,828 | |
Becton Dickinson & Co. | | 11 | | 1,489 | |
CareFusion Corp. (a) | | 14 | | 819 | |
CIGNA Corp. | | 10 | | 988 | |
DaVita HealthCare Partners Inc. (a) | | 5 | | 348 | |
Eli Lilly & Co. | | 29 | | 1,994 | |
Henry Schein Inc. (a) | | 2 | | 259 | |
Merck & Co. Inc. | | 4 | | 233 | |
Pfizer Inc. | | 33 | | 1,015 | |
Thermo Fisher Scientific Inc. | | 24 | | 3,032 | |
UnitedHealth Group Inc. | | 9 | | 950 | |
Zoetis Inc. - Class A | | 26 | | 1,102 | |
| | | | 16,939 | |
INDUSTRIALS - 11.2% | | | | | |
AMETEK Inc. | | 23 | | 1,189 | |
Boeing Co. | | 6 | | 832 | |
Danaher Corp. | | 59 | | 5,074 | |
IDEX Corp. | | 6 | | 498 | |
Iron Mountain Inc. | | 15 | | 582 | |
Pentair Plc (b) | | 27 | | 1,820 | |
Roper Industries Inc. | | 6 | | 1,001 | |
Tyco International Plc | | 28 | | 1,215 | |
United Technologies Corp. | | 3 | | 391 | |
| | | | 12,602 | |
INFORMATION TECHNOLOGY - 7.7% | | | | | |
Agilent Technologies Inc. | | 13 | | 520 | |
Cisco Systems Inc. | | 8 | | 223 | |
eBay Inc. (a) | | 5 | | 281 | |
Fidelity National Information Services Inc. | | 21 | | 1,275 | |
Fiserv Inc. (a) (b) | | 39 | | 2,789 | |
Google Inc. - Class A (a) | | 1 | | 371 | |
Google Inc. - Class C (a) | | 1 | | 684 | |
Texas Instruments Inc. | | 15 | | 802 | |
Vantiv Inc. - Class A (a) | | 4 | | 132 | |
Visa Inc. - Class A | | 6 | | 1,678 | |
| | | | 8,755 | |
MATERIALS - 0.6% | | | | | |
Cytec Industries Inc. | | 15 | | 697 | |
| | | | | |
TELECOMMUNICATION SERVICES - 0.3% | | | | | |
SBA Communications Corp. (a) | | 3 | | 299 | |
| | | | | |
UTILITIES - 2.5% | | | | | |
FirstEnergy Corp. | | 9 | | 355 | |
PG&E Corp. | | 39 | | 2,050 | |
Xcel Energy Inc. | | 11 | | 402 | |
| | | | 2,807 | |
Total Common Stocks (cost $62,736) | | | | 68,135 | |
| | | | | |
PREFERRED STOCKS - 0.3% | | | | | |
| | | | | |
ENERGY - 0.0% | | | | | |
Chesapeake Energy Corp., 4.50% (c) (d) | | — | | 2 | |
| | | | | |
FINANCIALS - 0.1% | | | | | |
State Street Corp., 6.00%, (callable at 25 beginning 12/15/19) (d) | | 3 | | 76 | |
| | | | | |
TELECOMMUNICATION SERVICES - 0.2% | | | | | |
T-Mobile US Inc., 5.50%, 12/15/17 | | 5 | | 290 | |
Total Preferred Stocks (cost $351) | | | | 368 | |
| | | | | |
TRUST PREFERREDS - 0.1% | | | | | |
| | | | | |
UTILITIES - 0.1% | | | | | |
SCE Trust I, 5.63%, (callable at 25 beginning 06/15/17) (d) | | 2 | | 37 | |
SCE Trust II, 5.10%, (callable at 25 beginning 03/15/18) (d) | | — | | 6 | |
SCE Trust III, 5.75%, (callable at 25 beginning 03/15/24) (d) | | 3 | | 88 | |
Total Trust Preferreds (cost $123) | | | | 131 | |
| | | | | |
INVESTMENT COMPANIES - 0.9% | | | | | |
T. Rowe Price Institutional Floating Rate Fund (e) | | 101 | | 1,017 | |
Total Investment Companies (cost $1,041) | | | | 1,017 | |
| | | | | |
NON-U.S. GOVERNMENT AGENCY ASSET-BACKED SECURITIES - 0.1% | | | | | |
Ally Master Owner Trust, 1.23%, 08/15/15 (f) | | $ | 100 | | 100 | |
Continental Airlines Inc. Pass-Through Trust, 4.15%, 04/11/24 | | 19 | | 19 | |
Total Non-U.S. Government Agency Asset-Backed Securities (cost $119) | | | | 119 | |
| | | | | |
CORPORATE BONDS AND NOTES - 23.6% | | | | | |
| | | | | |
CONSUMER DISCRETIONARY - 4.0% | | | | | |
Amazon.com Inc. | | | | | |
2.60%, 12/05/19 | | 165 | | 167 | |
3.80%, 12/05/24 | | 85 | | 87 | |
AmeriGas Finance LLC | | | | | |
6.75%, 05/20/20 | | 25 | | 26 | |
7.00%, 05/20/22 | | 50 | | 52 | |
AmeriGas Partners LP, 6.25%, 08/20/19 | | 25 | | 26 | |
CCO Holdings LLC | | | | | |
8.13%, 04/30/20 | | 75 | | 79 | |
7.38%, 06/01/20 | | 100 | | 106 | |
Cedar Fair LP, 5.25%, 03/15/21 | | 25 | | 25 | |
| | | | | | |
See accompanying Notes to Financial Statements.
| | Shares/Par † | | Value | |
Charter Communications Term Loan, 4.25%, 08/12/21 (f) | | 175 | | 176 | |
Delphi Corp. | | | | | |
6.13%, 05/15/21 | | 100 | | 109 | |
5.00%, 02/15/23 | | 200 | | 213 | |
Group 1 Automotive Inc., 5.00%, 06/01/22 (g) | | 50 | | 49 | |
L Brands Inc. | | | | | |
6.90%, 07/15/17 | | 25 | | 27 | |
8.50%, 06/15/19 | | 25 | | 30 | |
5.63%, 02/15/22 | | 25 | | 27 | |
5.63%, 10/15/23 | | 100 | | 108 | |
Lamar Media Corp., 5.88%, 02/01/22 | | 75 | | 78 | |
Penske Automotive Group Inc., 5.38%, 12/01/24 | | 50 | | 51 | |
Priceline Group Inc., 0.35%, 06/15/20 (b) (c) | | 64 | | 71 | |
Suburban Propane Partners LP, 7.38%, 03/15/20 | | 75 | | 78 | |
Unitymedia Hessen GmbH & Co. KG | | | | | |
7.50%, 03/15/19 (g) | | 150 | | 157 | |
5.50%, 01/15/23 (g) | | 200 | | 209 | |
Unitymedia KabelBW GmbH, 6.13%, 01/15/25 (g) | | 200 | | 206 | |
Univision Communications Inc. | | | | | |
6.88%, 05/15/19 (g) | | 625 | | 651 | |
7.88%, 11/01/20 (g) | | 425 | | 453 | |
6.75%, 09/15/22 (g) | | 263 | | 281 | |
5.13%, 05/15/23 (g) | | 50 | | 50 | |
UPC Financing Partnership Term Loan AH, 3.25%, 06/30/21 (f) | | 1,000 | | 974 | |
| | | | 4,566 | |
CONSUMER STAPLES - 1.0% | | | | | |
B&G Foods Inc., 4.63%, 06/01/21 | | 25 | | 24 | |
D.E. Master Blenders Term Loan, 3.50%, 05/09/21 (f) | | 200 | | 196 | |
HJ Heinz Co. Term Loan B-2, 3.50%, 03/27/20 (f) | | 428 | | 425 | |
Rite Aid Corp., 8.00%, 08/15/20 | | 425 | | 454 | |
| | | | 1,099 | |
ENERGY - 5.6% | | | | | |
Antero Resources Corp., 5.13%, 12/01/22 (b) (g) | | 75 | | 71 | |
Antero Resources Finance Corp. | | | | | |
6.00%, 12/01/20 | | 100 | | 100 | |
5.38%, 11/01/21 | | 75 | | 72 | |
Canadian Natural Resources Ltd. | | | | | |
1.75%, 01/15/18 | | 50 | | 50 | |
3.90%, 02/01/25 | | 105 | | 103 | |
Chesapeake Energy Corp. | | | | | |
3.25%, 03/15/16 | | 100 | | 100 | |
3.48%, 04/15/19 (f) | | 75 | | 73 | |
Concho Resources Inc. | | | | | |
7.00%, 01/15/21 | | 375 | | 393 | |
6.50%, 01/15/22 | | 100 | | 104 | |
5.50%, 10/01/22 | | 25 | | 25 | |
5.50%, 04/01/23 | | 400 | | 402 | |
CONSOL Energy Inc., 5.88%, 04/15/22 (g) | | 75 | | 70 | |
Energy Transfer Partners LP | | | | | |
4.15%, 10/01/20 | | 35 | | 36 | |
4.90%, 02/01/24 | | 30 | | 31 | |
EQT Corp. | | | | | |
8.13%, 06/01/19 | | 95 | | 114 | |
4.88%, 11/15/21 | | 125 | | 135 | |
Laredo Petroleum Inc. | | | | | |
9.50%, 02/15/19 | | 200 | | 199 | |
5.63%, 01/15/22 | | 50 | | 44 | |
7.38%, 05/01/22 | | 25 | | 23 | |
MarkWest Energy Partners LP | | | | | |
6.75%, 11/01/20 | | 250 | | 260 | |
6.50%, 08/15/21 | | 175 | | 180 | |
6.25%, 06/15/22 | | 225 | | 233 | |
5.50%, 02/15/23 | | 300 | | 304 | |
4.50%, 07/15/23 | | 400 | | 385 | |
4.88%, 12/01/24 | | 150 | | 147 | |
Noble Energy Inc., 3.90%, 11/15/24 | | 25 | | 25 | |
Range Resources Corp. | | | | | |
6.75%, 08/01/20 | | 300 | | 312 | |
5.75%, 06/01/21 | | 675 | | 697 | |
5.00%, 08/15/22 | | 600 | | 600 | |
5.00%, 03/15/23 | | 675 | | 675 | |
SM Energy Co. | | | | | |
6.50%, 11/15/21 | | 75 | | 73 | |
6.50%, 01/01/23 | | 10 | | 10 | |
Targa Resources Partners LP | | | | | |
6.88%, 02/01/21 | | 75 | | 77 | |
5.25%, 05/01/23 | | 125 | | 121 | |
4.25%, 11/15/23 | | 50 | | 45 | |
WPX Energy Inc., 5.25%, 01/15/17 | | 100 | | 101 | |
| | | | 6,390 | |
FINANCIALS - 2.3% | | | | | |
American Tower Corp., 5.00%, 02/15/24 | | 15 | | 16 | |
Caterpillar Financial Services Corp. | | | | | |
0.70%, 11/06/15 | | 20 | | 20 | |
1.25%, 11/06/17 | | 15 | | 15 | |
2.25%, 12/01/19 | | 60 | | 60 | |
3.25%, 12/01/24 | | 70 | | 71 | |
CBRE Services Inc., 5.00%, 03/15/23 | | 25 | | 25 | |
CNH Capital LLC, 3.88%, 11/01/15 | | 25 | | 25 | |
Crown Castle International Corp., 4.88%, 04/15/22 | | 100 | | 101 | |
E*TRADE Financial Corp., 6.38%, 11/15/19 | | 200 | | 212 | |
Ford Motor Credit Co. LLC | | | | | |
6.63%, 08/15/17 | | 200 | | 223 | |
0.81%, 12/06/17 (f) | | 200 | | 199 | |
5.00%, 05/15/18 | | 200 | | 217 | |
2.38%, 03/12/19 | | 200 | | 199 | |
2.60%, 11/04/19 | | 400 | | 398 | |
Host Hotels & Resorts LP, 5.88%, 06/15/19 | | 20 | | 21 | |
John Deere Capital Corp. | | | | | |
0.30%, 01/12/15 (f) | | 60 | | 60 | |
0.70%, 09/04/15 | | 15 | | 15 | |
KFW, 2.50%, 11/20/24 | | 652 | | 661 | |
Toyota Motor Credit Corp., 0.40%, 01/23/15 (f) | | 25 | | 25 | |
| | | | 2,563 | |
HEALTH CARE - 2.8% | | | | | |
Becton Dickinson and Co. | | | | | |
1.80%, 12/15/17 | | 90 | | 90 | |
2.68%, 12/15/19 | | 80 | | 81 | |
3.73%, 12/15/24 | | 90 | | 93 | |
4.69%, 12/15/44 | | 20 | | 22 | |
DaVita HealthCare Partners Inc. | | | | | |
5.75%, 08/15/22 | | 325 | | 344 | |
5.13%, 07/15/24 | | 700 | | 714 | |
DaVita HealthCare Partners Inc. Term Loan B, 3.50%, 06/20/21 (f) | | 274 | | 271 | |
DaVita Inc., 6.63%, 11/01/20 | | 125 | | 131 | |
Fresenius Medical Care US Finance II Inc. | | | | | |
5.63%, 07/31/19 (g) | | 100 | | 107 | |
5.88%, 01/31/22 (g) | | 100 | | 108 | |
Johnson & Johnson | | | | | |
1.13%, 11/21/17 | | 45 | | 45 | |
3.38%, 12/05/23 | | 250 | | 268 | |
See accompanying Notes to Financial Statements.
| | Shares/Par † | | Value | |
Medtronic Inc. | | | | | |
1.50%, 03/15/18 (g) | | 65 | | 65 | |
2.50%, 03/15/20 (g) | | 110 | | 110 | |
3.50%, 03/15/25 (g) | | 145 | | 148 | |
4.63%, 03/15/45 (g) | | 195 | | 211 | |
Novartis Capital Corp., 3.40%, 05/06/24 | | 25 | | 26 | |
Omnicare Inc., 5.00%, 12/01/24 | | 50 | | 51 | |
Roche Holdings Inc., 3.35%, 09/30/24 (g) | | 200 | | 207 | |
UnitedHealth Group Inc., 1.40%, 12/15/17 | | 65 | | 65 | |
| | | | 3,157 | |
INDUSTRIALS - 0.3% | | | | | |
Amphenol Corp., 1.55%, 09/15/17 | | 25 | | 25 | |
CNH Capital LLC | | | | | |
6.25%, 11/01/16 | | 25 | | 26 | |
3.63%, 04/15/18 | | 75 | | 74 | |
Moog Inc., 5.25%, 12/01/22 (g) | | 25 | | 25 | |
United Airlines Inc., 4.50%, 01/15/15 (c) | | 26 | | 91 | |
Xylem Inc., 3.55%, 09/20/16 | | 60 | | 63 | |
| | | | 304 | |
INFORMATION TECHNOLOGY - 0.8% | | | | | |
Kronos Inc. 2nd Lien Term Loan, 9.75%, 04/30/20 (f) | | 250 | | 254 | |
Kronos Inc. Extended Term Loan, 4.50%, 10/31/19 (f) | | 250 | | 248 | |
NXP BV | | | | | |
3.75%, 06/01/18 (g) | | 200 | | 200 | |
5.75%, 03/15/23 (g) | | 200 | | 210 | |
| | | | 912 | |
MATERIALS - 0.2% | | | | | |
Cytec Industries Inc., 3.95%, 05/01/25 | | 155 | | 157 | |
Rexam Plc, 6.75%, 06/29/67 (f), EUR | | 50 | | 60 | |
| | | | 217 | |
TELECOMMUNICATION SERVICES - 6.0% | | | | | |
Crown Castle International Corp., 5.25%, 01/15/23 | | 100 | | 102 | |
Crown Castle International Corp. New Term Loan B, 3.00%, 01/31/21 (f) | | 370 | | 363 | |
Intelsat Jackson Holdings SA | | | | | |
7.25%, 04/01/19 | | 275 | | 287 | |
7.25%, 10/15/20 | | 760 | | 803 | |
7.50%, 04/01/21 | | 325 | | 348 | |
5.50%, 08/01/23 | | 120 | | 119 | |
Intelsat Jackson Holdings SA Term Loan B-2, 3.75%, 06/30/19 (f) | | 2,075 | | 2,041 | |
Matterhorn Mobile SA, 6.75%, 05/15/19 (g), CHF | | 150 | | 158 | |
SBA Communications Corp., 5.63%, 10/01/19 | | 25 | | 26 | |
SBA Telecommunications Inc., 5.75%, 07/15/20 | | 25 | | 25 | |
Sprint Communications Inc., 9.00%, 11/15/18 (g) | | 75 | | 85 | |
Telesat Canada Inc., 6.00%, 05/15/17 (g) | | 35 | | 36 | |
Telesat Canada Inc. Term Loan, 3.50%, 03/28/19 (f) | | 247 | | 244 | |
UPCB Finance III Ltd., 6.63%, 07/01/20 (g) | | 900 | | 945 | |
UPCB Finance V Ltd., 7.25%, 11/15/21 (g) | | 450 | | 492 | |
UPCB Finance VI Ltd., 6.88%, 01/15/22 (g) | | 600 | | 653 | |
Verizon Communications Inc., 0.44%, 03/06/15 (f) (g) | | 45 | | 45 | |
| | | | 6,772 | |
UTILITIES - 0.6% | | | | | |
Berkshire Hathaway Energy Co. | | | | | |
2.40%, 02/01/20 (g) | | 105 | | 105 | |
3.50%, 02/01/25 (g) | | 120 | | 121 | |
4.50%, 02/01/45 (g) | | 75 | | 78 | |
CMS Energy Corp. | | | | | |
6.55%, 07/17/17 | | 10 | | 11 | |
8.75%, 06/15/19 | | 50 | | 63 | |
Dominion Resources Inc. | | | | | |
2.50%, 12/01/19 | | 185 | | 186 | |
3.63%, 12/01/24 | | 100 | | 101 | |
Texas Competitive Electric Holdings Co. LLC Term Loan, 3.75%, 05/05/16 (f) | | 28 | | 28 | |
| | | | 693 | |
Total Corporate Bonds and Notes (cost $26,731) | | | | 26,673 | |
| | | | | |
GOVERNMENT AND AGENCY OBLIGATIONS - 0.1% | | | | | |
| | | | | |
GOVERNMENT SECURITIES - 0.1% | | | | | |
| | | | | |
Sovereign - 0.1% | | | | | |
Kreditanstalt fuer Wiederaufbau, 0.50%, 04/19/16 | | 90 | | 90 | |
Total Government and Agency Obligations (cost $90) | | | | 90 | |
| | | | | |
SHORT TERM INVESTMENTS - 17.4% | | | | | |
| | | | | |
Investment Companies - 16.5% | | | | | |
JNL Money Market Fund, 0.01% (e) (h) | | 2,056 | | 2,056 | |
T. Rowe Price Reserves Investment Fund, 0.07% (e) (h) | | 16,536 | | 16,536 | |
| | | | 18,592 | |
Securities Lending Collateral - 0.9% | | | | | |
Repurchase Agreement with MLP, 0.06% (Collateralized by $333 U.S. Treasury Bond, 6.25%, due 05/15/30, value $499 and $550 U.S. Treasury Note, 0.13%, due 07/15/24, value $528) acquired on 12/31/14, due 01/02/15 at $1,007 | | $ | 1,007 | | 1,007 | |
Total Short Term Investments (cost $19,599) | | | | 19,599 | |
Total Investments - 102.8% (cost $110,790) | | | | 116,132 | |
Other Assets and Liabilities, Net - (2.8%) | | | | (3,202 | ) |
Total Net Assets - 100.0% | | | | $ | 112,930 | |
| | | | | | | |
(a) Non-income producing security.
(b) All or portion of the security was on loan.
(c) Convertible security.
(d) Perpetual security.
(e) Investment in affiliate.
(f) Variable rate security. Rate stated was in effect as of December 31, 2014.
(g) The Sub-Adviser has deemed this security which is exempt from registration under the 1933 Act to be liquid based on procedures approved by the Trust’s Board of Trustees. As of December 31, 2014, the aggregate value of these liquid securities was $6,308 which represented 5.6% of net assets.
(h) Yield changes daily to reflect current market conditions. Rate was the quoted yield as of December 31, 2014.
See accompanying Notes to Financial Statements.
Curian/UBS Global Long Short Fixed Income Opportunities Fund
| | Shares/Par † | | Value | |
NON-U.S. GOVERNMENT AGENCY ASSET-BACKED SECURITIES - 13.4% | | | | | |
| | | | | |
UNITED STATES OF AMERICA - 13.4% | | | | | |
AIMCO CLO, 3.07%, 07/20/26 (a) (b) | | $ | 500 | | $ | 475 | |
Americold 2010 LLC Trust REMIC, 6.81%, 01/14/21 (a) | | 595 | | 689 | |
Apidos CDO, 3.08%, 04/15/25 (a) (b) | | 330 | | 318 | |
ARES CLO Ltd., 2.98%, 07/28/25 (a) (b) | | 500 | | 479 | |
Avery Point CLO Ltd., 3.33%, 04/25/26 (a) (b) | | 1,000 | | 976 | |
Babson CLO Ltd., 2.88%, 01/18/25 (a) (b) | | 1,250 | | 1,190 | |
BlueMountain CLO Ltd., 2.88%, 04/15/25 (a) (b) | | 720 | | 684 | |
Boca Hotel Portfolio Trust REMIC, 3.21%, 08/15/18 (a) (b) | | 500 | | 500 | |
Capital Auto Receivables Asset Trust, 3.39%, 07/22/19 | | 550 | | 560 | |
Catamaran CLO Ltd., 3.27%, 10/18/26 (a) (b) | | 500 | | 479 | |
CIFC Funding Ltd. | | | | | |
3.03%, 04/18/25 (a) (b) | | 1,100 | | 1,044 | |
2.91%, 10/24/25 (a) (b) | | 350 | | 330 | |
Dryden Senior Loan Fund, 3.08%, 04/18/26 (a) (b) | | 1,200 | | 1,157 | |
Extended Stay America Trust REMIC, 3.60%, 12/05/19 (a) | | 500 | | 511 | |
Fortress Credit BSL Ltd., 3.13%, 10/19/25 (a) (b) | | 750 | | 718 | |
Galaxy CLO Ltd. | | | | | |
2.83%, 11/16/25 (a) (b) | | 500 | | 475 | |
3.23%, 10/15/26 (a) (b) | | 850 | | 825 | |
Goldentree Loan Opportunities VIII Ltd., 3.85%, 04/19/26 (a) (b) | | 750 | | 713 | |
GS Mortgage Securities Trust REMIC, 4.95%, 01/10/24 (b) | | 750 | | 800 | |
Halcyon Loan Advisors Funding Ltd., 3.23%, 04/18/26 (a) (b) | | 1,150 | | 1,104 | |
JFIN CLO Ltd., 3.23%, 04/21/25 (a) (b) | | 950 | | 914 | |
JPMorgan Chase Commercial Mortgage Securities Trust REMIC, 4.52%, 07/05/22 (a) (b) | | 500 | | 517 | |
JPMorgan Chase Commercial Mortgage Securities Trust REMIC, 2.66%, 10/15/19 (a) (b) | | 725 | | 725 | |
Madison Avenue Trust, 4.03%, 10/12/20 (a) (b) | | 500 | | 511 | |
Morgan Stanley Bank of America Merrill Lynch Trust REMIC | | | | | |
4.08%, 06/15/23 (b) | | 500 | | 507 | |
4.83%, 01/15/24 (b) | | 1,000 | | 1,075 | |
Northwoods Capital Corp., 3.39%, 09/15/25 (a) (b) | | 1,000 | | 965 | |
Northwoods Capital XIV Ltd., 3.58%, 11/12/25 (a) (b) | | 500 | | 488 | |
Octagon Investment Partners XIX Ltd., 3.08%, 04/15/26 (a) (b) | | 725 | | 696 | |
Octagon Investment Partners XVII Ltd., 3.03%, 10/25/25 (a) (b) | | 250 | | 241 | |
Octagon Investment Partners XVIII Ltd., 2.98%, 12/16/24 (a) (b) | | 750 | | 717 | |
OZLM VIII Ltd., 3.28%, 10/17/26 (a) (b) | | 850 | | 818 | |
WhiteHorse VIII Ltd., 2.98%, 05/01/26 (a) | | 1,000 | | 943 | |
Total Non-U.S. Government Agency Asset-Backed Securities (cost $23,427) | | | | 23,144 | |
| | | | | |
CORPORATE BONDS AND NOTES - 67.3% | | | | | |
| | | | | |
AUSTRALIA - 1.8% | | | | | |
Crown Group Finance Ltd., 5.75%, 07/18/17, AUD | | 1,450 | | 1,242 | |
DBNGP Finance Co. Pty Ltd., 6.00%, 10/11/19, AUD | | 500 | | 436 | |
Mirvac Group Finance Ltd., 5.50%, 12/18/17, AUD | | 1,000 | | 857 | |
Qantas Airways Ltd., 7.50%, 06/11/21, AUD | | 700 | | 610 | |
| | | | 3,145 | |
BRAZIL - 4.2% | | | | | |
Banco do Brasil SA, 9.00%, (callable at 100 beginning 06/18/24) (a) (c) | | 880 | | 818 | |
Caixa Economica Federal, 2.38%, 11/06/17 (a) | | 2,250 | | 2,124 | |
Centrais Eletricas Brasileiras SA, 5.75%, 10/27/21 | | 1,200 | | 1,152 | |
Petrobras Global Finance BV, 4.38%, 05/20/23 | | 200 | | 172 | |
Petrobras International Finance Co. | | | | | |
5.38%, 01/27/21 | | 1,550 | | 1,436 | |
6.75%, 01/27/41 | | 700 | | 637 | |
Vale Overseas Ltd., 4.38%, 01/11/22 | | 1,000 | | 964 | |
| | | | 7,303 | |
CANADA - 2.7% | | | | | |
Barrick Gold Corp., 3.85%, 04/01/22 | | 1,600 | | 1,540 | |
NOVA Chemicals Corp., 5.25%, 08/01/23 (a) | | 1,830 | | 1,848 | |
Yamana Gold Inc., 4.95%, 07/15/24 | | 1,270 | | 1,240 | |
| | | | 4,628 | |
COLOMBIA - 0.5% | | | | | |
Avianca Holdings SA, 8.38%, 05/10/20 | | 200 | | 206 | |
Ecopetrol SA, 4.13%, 01/16/25 | | 740 | | 703 | |
| | | | 909 | |
COSTA RICA - 0.7% | | | | | |
Banco Nacional de Costa Rica, 4.88%, 11/01/18 (a) | | 1,250 | | 1,237 | |
| | | | | |
CROATIA - 0.9% | | | | | |
Agrokor dd, 8.88%, 02/01/20 (a) | | 1,370 | | 1,478 | |
| | | | | |
FRANCE - 0.4% | | | | | |
Credit Agricole SA, 7.88%, (callable at 100 beginning 01/23/24) (a) (c) | | 750 | | 763 | |
| | | | | |
GEORGIA - 0.2% | | | | | |
Georgian Railway JSC, 7.75%, 07/11/22 | | 300 | | 313 | |
| | | | | |
GERMANY - 2.8% | | | | | |
HeidelbergCement Finance Luxembourg SA, 8.50%, 10/31/19, EUR | | 1,250 | | 1,995 | |
Trionista HoldCo GmbH, 5.00%, 04/30/20 (a), EUR | | 1,015 | | 1,271 | |
Unitymedia KabelBW GmbH, 6.13%, 01/15/25 (a) | | 1,470 | | 1,518 | |
| | | | 4,784 | |
HONG KONG - 0.6% | | | | | |
China Oil & Gas Group Ltd., 5.25%, 04/25/18 (a) | | 1,000 | | 976 | |
| | | | | |
HUNGARY - 0.6% | | | | | |
Magyar Export-Import Bank RT, 5.50%, 02/12/18 | | 950 | | 1,008 | |
| | | | | |
INDONESIA - 1.0% | | | | | |
Pertamina Persero PT | | | | | |
6.00%, 05/03/42 | | 950 | | 927 | |
6.45%, 05/30/44 (a) | | 700 | | 731 | |
| | | | 1,658 | |
IRELAND - 1.1% | | | | | |
Vnesheconombank Via VEB Finance Plc | | | | | |
6.90%, 07/09/20 | | 200 | | 160 | |
6.80%, 11/22/25 | | 700 | | 549 | |
XL Group Plc, 6.50%, (callable at 100 beginning 04/15/17) (c) | | 1,255 | | 1,199 | |
| | | | 1,908 | |
| | | | | | | |
See accompanying Notes to Financial Statements.
| | Shares/Par † | | Value | |
ITALY - 0.1% | | | | | |
Generali Finance BV, 6.21%, (callable at 100 beginning 06/16/16) (c), GBP | | 150 | | 238 | |
| | | | | |
KAZAKHSTAN - 0.8% | | | | | |
Kazakhstan Temir Zholy Finance BV, 6.95%, 07/10/42 | | 600 | | 580 | |
Kazatomprom Natsionalnaya Atomnaya Kompaniya AO, 6.25%, 05/20/15 | | 800 | | 794 | |
| | | | 1,374 | |
MALAYSIA - 0.4% | | | | | |
SSG Resources Ltd., 4.25%, 10/04/22 | | 640 | | 659 | |
| | | | | |
MEXICO - 1.7% | | | | | |
Cemex SAB de CV | | | | | |
5.88%, 03/25/19 (a) | | 500 | | 508 | |
7.25%, 01/15/21 (a) | | 1,100 | | 1,152 | |
5.70%, 01/11/25 (a) | | 550 | | 534 | |
Fermaca Enterprises S de RL de CV, 6.38%, 03/30/38 (a) | | 650 | | 661 | |
| | | | 2,855 | |
MOROCCO - 0.2% | | | | | |
OCP SA, 5.63%, 04/25/24 (a) | | 350 | | 368 | |
| | | | | |
NIGERIA - 0.5% | | | | | |
FBN Finance Co. BV, 8.00%, 07/23/21 (a) | | 950 | | 845 | |
| | | | | |
NORWAY - 2.3% | | | | | |
Eksportfinans ASA | | | | | |
5.50%, 05/25/16 | | 2,700 | | 2,821 | |
5.50%, 06/26/17 | | 1,000 | | 1,066 | |
| | | | 3,887 | |
PORTUGAL - 1.6% | | | | | |
EDP Finance BV | | | | | |
4.75%, 09/26/16, EUR | | 1,200 | | 1,539 | |
4.90%, 10/01/19 (a) | | 1,200 | | 1,249 | |
| | | | 2,788 | |
RUSSIAN FEDERATION - 1.1% | | | | | |
Bank of Moscow via BOM Capital Plc, 6.70%, 03/11/15 | | 250 | | 246 | |
Russian Agricultural Bank OJSC Via RSHB Capital SA | | | | | |
7.75%, 05/29/18 | | 400 | | 352 | |
5.10%, 07/25/18 | | 450 | | 370 | |
VTB Bank OJSC Via VTB Capital SA, 6.95%, 10/17/22 | | 1,250 | | 925 | |
| | | | 1,893 | |
SINGAPORE - 1.1% | | | | | |
Flextronics International Ltd., 5.00%, 02/15/23 | | 960 | | 979 | |
Olam International Ltd., 5.75%, 09/20/17 | | 900 | | 933 | |
| | | | 1,912 | |
SOUTH AFRICA - 0.2% | | | | | |
Eskom Holdings SOC Ltd., 6.75%, 08/06/23 | | 400 | | 415 | |
| | | | | |
SPAIN - 1.4% | | | | | |
Cirsa Funding Luxembourg SA, 8.75%, 05/15/18, EUR | | 300 | | 373 | |
Santander US Debt SAU, 3.72%, 01/20/15 (a) | | 2,100 | | 2,103 | |
| | | | 2,476 | |
SRI LANKA - 0.6% | | | | | |
National Savings Bank, 8.88%, 09/18/18 | | 950 | | 1,057 | |
| | | | | |
SWITZERLAND - 0.3% | | | | | |
Credit Suisse Group AG, 6.25%, (callable at 100 beginning 12/18/24) (a) (c) | | 490 | | 471 | |
| | | | | |
TURKEY - 1.0% | | | | | |
Turkiye Halk Bankasi A/S, 3.88%, 02/05/20 | | 1,000 | | 963 | |
Turkiye Vakiflar Bankasi Tao, 5.00%, 10/31/18 | | 700 | | 713 | |
| | | | 1,676 | |
UNITED KINGDOM - 6.3% | | | | | |
Aviva Plc, 6.12%, 11/14/36, GBP | | 370 | | 654 | |
Barclays Plc, 4.38%, 09/11/24 | | 860 | | 829 | |
HBOS Plc | | | | | |
4.88%, 03/20/15, EUR | | 200 | | 244 | |
6.75%, 05/21/18 (a) | | 1,700 | | 1,894 | |
HSBC Holdings Plc, 6.37%, (callable at 100 beginning 09/17/24) (c) (d) | | 250 | | 252 | |
Lloyds Bank Plc, 6.50%, 03/24/20, EUR | | 2,050 | | 3,056 | |
Pension Insurance Corp. Plc, 6.50%, 07/03/24, GBP | | 270 | | 433 | |
Royal Bank of Scotland Group Plc | | | | | |
6.10%, 06/10/23 | | 2,660 | | 2,885 | |
5.13%, 05/28/24 | | 700 | | 712 | |
| | | | 10,959 | |
UNITED STATES OF AMERICA - 29.7% | | | | | |
Access Midstream Partners LP, 4.88%, 05/15/23 | | 500 | | 507 | |
ADT Corp., 3.50%, 07/15/22 | | 1,700 | | 1,449 | |
Allstate Corp., 5.75%, 08/15/53 (b) | | 1,170 | | 1,233 | |
Ally Financial Inc. | | | | | |
8.30%, 02/12/15 | | 100 | | 101 | |
4.63%, 06/26/15 | | 800 | | 806 | |
3.50%, 01/27/19 | | 1,150 | | 1,136 | |
ArcelorMittal, 6.00%, 03/01/21 (e) | | 2,100 | | 2,184 | |
Case New Holland Inc., 7.88%, 12/01/17 | | 2,300 | | 2,530 | |
Cemex Finance LLC, 6.00%, 04/01/24 (a) | | 750 | | 731 | |
CIT Group Inc., 5.00%, 08/15/22 | | 2,325 | | 2,389 | |
Citigroup Inc. | | | | | |
6.30% (callable at 100 beginning 05/15/24) (c) | | 1,400 | | 1,379 | |
0.76%, 05/31/17 (b), EUR | | 2,700 | | 3,234 | |
5.50%, 09/13/25 | | 400 | | 443 | |
DISH DBS Corp., 7.88%, 09/01/19 | | 2,230 | | 2,531 | |
El Paso LLC, 7.25%, 06/01/18 | | 1,500 | | 1,700 | |
Energy Transfer Partners LP | | | | | |
9.00%, 04/15/19 | | 461 | | 566 | |
6.05%, 06/01/41 | | 100 | | 109 | |
6.50%, 02/01/42 | | 500 | | 575 | |
Fidelity National Financial Inc., 5.50%, 09/01/22 | | 150 | | 163 | |
FirstEnergy Transmission LLC, 5.45%, 07/15/44 (a) | | 420 | | 453 | |
Frontier Communications Corp., 7.13%, 01/15/23 | | 1,150 | | 1,170 | |
General Motors Co., 3.50%, 10/02/18 | | 400 | | 408 | |
General Motors Financial Co. Inc. | | | | | |
4.75%, 08/15/17 | | 2,000 | | 2,109 | |
3.00%, 09/25/17 | | 420 | | 425 | |
Glencore Funding LLC, 4.63%, 04/29/24 (a) | | 725 | | 728 | |
Intelsat Jackson Holdings SA, 7.50%, 04/01/21 | | 2,400 | | 2,568 | |
International Lease Finance Corp., 8.63%, 09/15/15 (f) | | 2,250 | | 2,346 | |
Kinder Morgan Finance Co. ULC, 5.70%, 01/05/16 | | 1,120 | | 1,163 | |
Kinder Morgan Inc. | | | | | |
5.63%, 11/15/23 (a) | | 800 | | 856 | |
5.30%, 12/01/34 | | 800 | | 812 | |
See accompanying Notes to Financial Statements.
| | Shares/Par † | | Value | |
MetLife Inc., 6.40%, 12/15/36 (b) | | 2,035 | | 2,269 | |
Midstates Petroleum Co. Inc., 10.75%, 10/01/20 | | 2,300 | | 1,219 | |
Pacific Drilling SA, 5.38%, 06/01/20 (a) | | 2,300 | | 1,874 | |
Perrigo Finance Plc, 3.50%, 12/15/21 | | 300 | | 303 | |
PNC Preferred Funding Trust, 1.89%, (callable at 100 beginning 03/15/17) (a) (c) | | 1,800 | | 1,692 | |
Prudential Financial Inc. | | | | | |
5.87%, 09/15/42 (b) | | 420 | | 443 | |
5.20%, 03/15/44 (b) | | 1,670 | | 1,653 | |
QVC Inc., 4.45%, 02/15/25 | | 480 | | 469 | |
Reynolds American Inc., 6.15%, 09/15/43 | | 100 | | 116 | |
Sabine Pass Liquefaction LLC, 6.25%, 03/15/22 | | 770 | | 782 | |
Seagate HDD Cayman, 5.75%, 12/01/34 (a) | | 480 | | 506 | |
SLM Corp., 6.25%, 01/25/16 | | 1,000 | | 1,040 | |
Starwood Hotels & Resorts Worldwide Inc., 4.50%, 10/01/34 | | 280 | | 286 | |
Valeant Pharmaceuticals International, 7.00%, 10/01/20 (a) | | 920 | | 971 | |
WESCO Distribution Inc., 5.38%, 12/15/21 | | 350 | | 353 | |
Xerox Corp., 3.80%, 05/15/24 | | 700 | | 687 | |
| | | | 51,467 | |
VENEZUELA - 0.5% | | | | | |
Petroleos de Venezuela SA | | | | | |
5.25%, 04/12/17 | | 900 | | 405 | |
8.50%, 11/02/17 | | 700 | | 401 | |
9.00%, 11/17/21 | | 300 | | 131 | |
| | | | 937 | |
Total Corporate Bonds and Notes (cost $120,358) | | | | 116,387 | |
| | | | | |
GOVERNMENT AND AGENCY OBLIGATIONS - 13.6% | | | | | |
| | | | | |
ARGENTINA - 0.5% | | | | | |
Argentina Boden Bond, 7.00%, 10/03/15 | | 750 | | 740 | |
Argentina Republic Government International Bond | | | | | |
0.00%, 12/15/35 (b) | | 1,750 | | 120 | |
0.00%, 12/15/35 (b) | | 425 | | 31 | |
| | | | 891 | |
BELARUS - 1.0% | | | | | |
Republic of Belarus, 8.75%, 08/03/15 | | 1,950 | | 1,836 | |
| | | | | |
BRAZIL - 0.6% | | | | | |
Brazil Inflation Indexed Notas do Tesouro Nacional, 6.00%, 05/15/45 - 08/15/50 (g), BRL | | 1,050 | | 986 | |
| | | | | |
CROATIA - 1.0% | | | | | |
Croatia Government International Bond, 6.25%, 04/27/17 | | 1,650 | | 1,750 | |
| | | | | |
ECUADOR - 0.2% | | | | | |
Ecuador Government International Bond | | | | | |
9.38%, 12/15/15 | | 140 | | 136 | |
7.95%, 06/20/24 (a) | | 200 | | 171 | |
| | | | 307 | |
GABON - 0.3% | | | | | |
Gabonese Republic, 6.38%, 12/12/24 (a) | | 600 | | 570 | |
| | | | | |
GHANA - 0.6% | | | | | |
Republic of Ghana | | | | | |
8.50%, 10/04/17 | | 650 | | 649 | |
7.88%, 08/07/23 | | 200 | | 185 | |
7.88%, 08/07/23 (a) | | 200 | | 185 | |
| | | | 1,019 | |
GREECE - 0.9% | | | | | |
Hellenic Republic Government Bond, 2.00%, 02/24/31 (f), EUR | | 2,420 | | 1,523 | |
| | | | | |
KENYA - 0.3% | | | | | |
Kenya Government International Bond | | | | | |
5.88%, 06/24/19 (a) | | 200 | | 203 | |
6.88%, 06/24/24 (a) | | 295 | | 309 | |
| | | | 512 | |
MEXICO - 0.3% | | | | | |
Mexico Inflation Indexed Udibonos, 4.00%, 11/15/40 (h), MXN | | 6,586 | | 506 | |
| | | | | |
NIGERIA - 0.5% | | | | | |
Nigeria Government International Bond, 5.13%, 07/12/18 | | 850 | | 841 | |
| | | | | |
PAKISTAN - 0.1% | | | | | |
Pakistan Government International Bond, 7.13%, 03/31/16 | | 100 | | 101 | |
| | | | | |
RUSSIAN FEDERATION - 0.1% | | | | | |
Russian Federal Bond, 7.00%, 01/25/23, RUB | | 22,500 | | 249 | |
| | | | | |
UNITED STATES OF AMERICA - 6.4% | | | | | |
Federal National Mortgage Association REMIC, Interest Only, 2.50%, 03/25/28 - 06/25/28 | | 3,873 | | 385 | |
State of California | | | | | |
7.55%, 04/01/39 | | 200 | | 309 | |
7.30%, 10/01/39 | | 850 | | 1,252 | |
State of Illinois | | | | | |
5.67%, 03/01/18 | | 555 | | 608 | |
5.88%, 03/01/19 | | 780 | | 861 | |
4.95%, 06/01/23 | | 410 | | 429 | |
U.S. Treasury Bond | | | | | |
3.75%, 11/15/43 (i) | | 2,500 | | 3,007 | |
Principal Only, 0.00%, 02/15/43 (i) (j) | | 5,000 | | 2,242 | |
U.S. Treasury Inflation Indexed Note, 0.13%, 07/15/24 (h) (i) | | 2,000 | | 1,929 | |
| | | | 11,022 | |
VENEZUELA - 0.5% | | | | | |
Venezuela Government International Bond, 8.25%, 10/13/24 | | 2,025 | | 881 | |
| | | | | |
ZAMBIA - 0.3% | | | | | |
Zambia Government International Bond, 8.50%, 04/14/24 (a) | | 500 | | 548 | |
Total Government and Agency Obligations (cost $25,329) | | | | 23,542 | |
| | | | | |
PURCHASED OPTIONS - 2.5% | | | | | |
10-Year U.S. Treasury Note Future Call Option, Strike Price 126.5, Expiration 01/23/15 | | 193 | | 148 | |
10-Year U.S. Treasury Note Future Put Option, Strike Price 124, Expiration 01/23/15 | | 257 | | 12 | |
10-Year U.S. Treasury Note Future Put Option, Strike Price 126.5, Expiration 01/23/15 | | 193 | | 90 | |
See accompanying Notes to Financial Statements.
| | Shares/Par † | | Value | |
5-Year U.S. Treasury Note Future Call Option, Strike Price 119, Expiration 02/20/15 | | 134 | | 73 | |
5-Year U.S. Treasury Note Future Put Option, Strike Price 118.25, Expiration 01/23/15 | | 257 | | 34 | |
5-Year U.S. Treasury Note Future Put Option, Strike Price 119, Expiration 02/20/15 | | 134 | | 83 | |
90-Day Eurodollar Future Put Option, Expiration 99.25, Expiration 06/15/15 | | 979 | | 37 | |
90-Day Eurodollar Future Put Option, Strike Price 98.25, Expiration 06/13/16 | | 429 | | 260 | |
90-Day Eurodollar Future Put Option, Strike Price 99.25, Expiration 03/16/15 | | 516 | | 3 | |
Call Swaption, 6-Month GBP LIBOR versus 2.19% fixed, Expiration 06/17/15, JPM | | 250 | | 840 | |
Euro versus USD Call Option, Strike Price EUR 0.77, Expiration 05/22/15, BOA | | 2,250,000 | | 158 | |
Euro versus USD Call Option, Strike Price EUR 0.77, Expiration 05/22/15, MSS | | 2,250,000 | | 158 | |
Euro versus USD Call Option, Strike Price EUR 0.79, Expiration 04/21/15, MSS | | 5,900,000 | | 303 | |
Japanese Yen versus USD Call Option, Strike Price JPY 120, Expiration 03/20/15, BOA | | 3,950,000 | | 79 | |
Put Swaption, 3-Month LIBOR versus 3.00% fixed, Expiration 12/19/17, BBP | | 388 | | 852 | |
Put Swaption, 3-Month LIBOR versus 7.00% fixed, Expiration 12/19/17, BBP | | 388 | | 50 | |
Put Swaption, 3-Month LIBOR versus 3.00% fixed, Expiration 12/07/17, BBP | | 19 | | 40 | |
Put Swaption, 3-Month LIBOR versus 3.00% fixed, Expiration 12/19/17, JPM | | 240 | | 528 | |
Put Swaption, 3-Month LIBOR versus 4.38% fixed, Expiration 01/17/18, JPM | | 114 | | 253 | |
Put Swaption, 3-Month LIBOR versus 7.00% fixed, Expiration 12/07/17, BBP | | 19 | | 2 | |
Put Swaption, 3-Month LIBOR versus 7.00% fixed, Expiration 12/19/17, JPM | | 240 | | 31 | |
Put Swaption, 6-Month Japanese Yen LIBOR versus 2.35% fixed, Expiration 05/22/15, BBP | | 10,390 | | — | |
Put Swaption, 6-Month GBP LIBOR versus 2.19% fixed, Expiration 06/17/15, JPM | | 250 | | 7 | |
Put Swaption, 6-Month Japanese Yen LIBOR versus 2.35% fixed, Expiration 05/22/15, JPM | | 1,650 | | — | |
Put Swaption, 6-Month Japanese Yen LIBOR versus 2.35% fixed, Expiration 05/22/15, JPM | | 900 | | — | |
U.S. Treasury Long Bond Future Call Option, Strike Price 146, Expiration 01/23/15 | | 225 | | 127 | |
U.S. Treasury Long Bond Future Put Option, Strike Price 141, Expiration 01/23/15 | | 200 | | 34 | |
U.S. Treasury Long Bond Future Put Option, Strike Price 141, Expiration 02/20/15 | | 257 | | 137 | |
Total Purchased Options (cost $7,878) | | | | 4,339 | |
| | | | | |
SHORT TERM INVESTMENTS - 0.1% | | | | | |
| | | | | |
Investment Companies - 0.1% | | | | | |
JNL Money Market Fund, 0.01% (k) (l) | | 227 | | 227 | |
Total Short Term Investments (cost $227) | | | | 227 | |
| | | | | |
Total Investments - 96.9% (cost $177,219) | | | | 167,639 | |
Other Assets and Liabilities, Net - 3.1% | | | | 5,608 | |
Total Net Assets - 100.0% | | | | $ | 173,020 | |
| | | | | | |
(a) | The Sub-Adviser has deemed this security which is exempt from registration under the 1933 Act to be liquid based on procedures approved by the Trust’s Board of Trustees. As of December 31, 2014, the aggregate value of these liquid securities was $52,549 which represented 30.4% of net assets. |
(b) | Variable rate security. Rate stated was in effect as of December 31, 2014. |
(c) | Perpetual security. |
(d) | Convertible security. |
(e) | The interest rate for this security is inversely affected by upgrades or downgrades to the credit rating of the issuer. |
(f) | Security is a “step-up” bond where the coupon may increase or step up at a future date. Rate stated was the coupon as of December 31, 2014. |
(g) | Treasury inflation indexed note, par amount is not adjusted for inflation. |
(h) | Treasury inflation indexed note, par amount is adjusted for inflation. |
(i) | All or a portion of the security is pledged or segregated as collateral. See the Notes to Financial Statements. |
(j) | Security issued with a zero coupon. Income is recognized through the accretion of discount. |
(k) | Investment in affiliate. |
(l) | Yield changes daily to reflect current market conditions. Rate was the quoted yield as of December 31, 2014. |
See accompanying Notes to Financial Statements.
Currency Abbreviations: | | |
| | |
ARS - Argentine Peso | IDR - Indonesian Rupiah | PLN - Polish Zloty |
AUD - Australian Dollar | ILS - Israeli New Sheqel | RON - Romanian New Leu |
BRL - Brazilian Real | INR - Indian Rupee | RSD - Serbian Dinar |
CAD - Canadian Dollar | JPY - Japanese Yen | RUB - Russian Ruble |
CHF - Swiss Franc | KRW - Korean Won | SEK - Swedish Krona |
CLF - Chilean Unidad de Fomento | KZT - Kazakhstani Tenge | SGD - Singapore Dollar |
CLP - Chilean Peso | LBP - Lebanese Pound | THB - Thai Baht |
CNH - Chinese Offshore Yuan | LKR - Sri Lankan Rupee | TRY - New Turkish Lira |
CNY - Chinese Yuan | MXN - Mexican Peso | TWD - Taiwan Dollar |
DOP - Dominican Peso | MYR - Malaysian Ringgit | UGX - Ugandan Shilling |
EGP – Egyptian Pound | NGN - Nigerian Naira | USD - United States Dollar |
EUR - European Currency Unit (Euro) | NOK - Norwegian Krone | UYU - Uruguayan Peso |
GBP - British Pound | NZD - New Zealand Dollar | ZAR - South African Rand |
HKD - Hong Kong Dollar | PEN - Peruvian Nuevo Sol | ZMW - Zambian Kwacha |
HUF - Hungarian Forint | PHP - Philippine Peso | |
Abbreviations: | |
| |
ABS - Asset-Backed Security | IBEX - Iberia Index |
ADR - American Depositary Receipt | ICE - IntercontinentalExchange |
ADS - American Depository Shares | iTraxx - Group of international credit derivative indexes monitored by the International Index Company |
ASX - Australian Stock Exchange | JSE - Johannesburg Stock Exchange |
BDR - Brazilian Depositary Receipt | KOSPI - Korea Composite Stock Price Index |
CAC - Cotation Assistee en Continu | LIBOR - London Interbank Offer Rate |
CDI - Chess Depository Interest | LME - London Metal Exchange |
CDX.EM - Credit Default Swap Index - Emerging Markets | MBS - Mortgage Backed Security |
CDX.NA.HY - Credit Default Swap Index - North American - High Yield | MIB - Milano Italia Borsa |
CDX.NA.IG - Credit Default Swap Index - North American - Investment Grade | MLP - Master Limited Partnership |
CLO - Collateralized Loan Obligation | MSCI - Morgan Stanley Capital International |
CNX - CRISIL NSE Index | NASDAQ - National Association of Securities Dealers Automated Quotations |
CPURNSA - CPI Consumers Index Non-Seasonally Adjusted | NSE - National Stock Exchange |
CVA - Commanditaire Vennootschap op Aandelen | NYSE - New York Stock Exchange |
EAFE - Europe, Australia and Far East | OJSC - Open Joint-Stock Company |
EMU - Economic and Monetary Union (Europe) | OTC - Over the Counter |
ETF - Exchange Traded Fund | PCL - Public Company Limited |
ETN - Exchange Traded Note | RBOB - Reformulated Gasoline Blendstock for Oxygen Blending |
Euribor - Europe Interbank Offered Rate | REIT - Real Estate Investment Trust |
Euro-Bobl - debt instrument issued by the Federal Republic of Germany with a term of 4.5 to 5.5 years | REMIC - Real Estate Mortgage Investment Conduit |
Euro-Bund - debt instrument issued by the Federal Republic of Germany with a term of 8.5 to 10.5 years | SGX - Singapore Exchange |
Euro-Schatz - debt instrument issued by the Federal Republic of Germany with a term of 1.75 to 2.25 years | SPDR - Standard & Poor’s Depositary Receipt |
FTSE - Financial Times and the London Stock Exchange | SPI - Schedule Performance Index |
GDR - Global Depositary Receipt | ULSD - Ultra Low Sulfur Diesel |
HICP - Harmonized Index of Consumer Prices | VIX - Volatility Index |
| WIG - Warszawski Indeks Giedowy |
| WTI - West Texas Intermediate |
Counterparty Abbreviations: | |
| |
BBP - Barclays Bank Plc | IMP - Imperial Capital Inc. |
BCL - Barclays Capital Inc. | JPM - JPMorgan Chase Bank N.A. |
BMO - BMO Capital Markets Corp. | MLP - Merrill Lynch, Pierce, Fenner, & Smith |
BNP - BNP Paribas Securities | MSC - Morgan Stanley & Co., Incorporated |
BOA - Banc of America Securities LLC/Bank of America NA | MSS - Morgan Stanley Capital Services Inc. |
CGM - Citigroup Global Markets | NSI - Nomura Securities International |
CIB - CIBC World Markets Corp. | NTS - Northern Trust Securities |
CIT - Citibank, Inc. | RBC - Royal Bank of Canada |
CSI - Credit Suisse Securities, LLC | RBS - Royal Bank of Scotland |
DUB - Deutsche Bank Alex Brown Inc. | SCB - Standard Chartered Bank |
GSB - Goldman Sachs Bank | SGB - Societe Generale Bannon LLC |
GSC - Goldman Sachs & Co. | SSB - State Street Brokerage Services, Inc. |
GSI - Goldman Sachs International | UBS - UBS Securities LLC |
HSB - HSBC Securities, Inc. | |
† For funds with fixed income securities, par amounts are listed in United States Dollars unless otherwise noted. Options are quoted in unrounded number of contracts.
“-” Amount rounds to less than one thousand
See accompanying Notes to Financial Statements.
Report of Independent Registered Public Accounting Firm
To the Shareholders and Board of Trustees
Curian Variable Series Trust:
We have audited the accompanying (consolidated, where applicable) statements of assets and liabilities of Curian/Ashmore Emerging Market Small Cap Equity Fund, Curian/BlackRock Global Long Short Credit Fund, Curian/DFA U.S. Micro Cap Fund, Curian/Epoch Global Shareholder Yield Fund, Curian Long Short Credit Fund, Curian/PIMCO Credit Income Fund, Curian/T. Rowe Price Capital Appreciation Fund and Curian/UBS Global Long Short Fixed Income Opportunities Fund (the “Funds”), including the summary schedules of investments, as of December 31, 2014, and the related statements of operations for the year then ended, the statements of changes in net assets for each of the years or periods in the two-year period then ended (collectively, the “financial statements”), the financial highlights for each of the years or periods in the three-year period then ended (the financial statements and financial highlights are included in Item 1 of this Form N-CSR), and the schedules of investments as of December 31, 2014 (included in Item 6 of this Form N-CSR). These financial statements, financial highlights, and schedules of investments are the responsibility of the Funds’ management. Our responsibility is to express an opinion on these financial statements, financial highlights, and schedules of investments based on our audits.
We conducted our audits in accordance with the standards of the Public Company Accounting Oversight Board (United States). Those standards require that we plan and perform the audit to obtain reasonable assurance about whether the financial statements, financial highlights, and schedule of investments in securities are free of material misstatement. An audit includes examining, on a test basis, evidence supporting the amounts and disclosures in the financial statements and schedule of investments in securities. Our procedures included confirmation of securities owned as of December 31, 2014, by correspondence with the custodian, transfer agents and brokers or other appropriate auditing procedures. An audit also includes assessing the accounting principles used and significant estimates made by management, as well as evaluating the overall financial statement presentation. We believe that our audits provide a reasonable basis for our opinion.
In our opinion, the financial statements (consolidated where applicable), financial highlights, and schedules of investments referred to above present fairly, in all material respects, the financial position of the Funds as of December 31, 2014, and the results of their operations for the year then ended, the changes in its net assets for each of the years or periods in the two-year period then ended, and the financial highlights for each of the years or periods in the three-year period then ended, in conformity with U.S. generally accepted accounting principles.
/s/ KPMG LLP
Chicago, Illinois
February 26, 2015
(b) Not applicable.
Item 7. Disclosure of Proxy Voting Policies and Procedures for Closed-End Management Investment Companies.
Not applicable.
Item 8. Portfolio Managers of Closed-End Management Investment Companies.
Not applicable.
Item 9. Purchases of Equity Securities by Closed-End Management Investment Company and Affiliated Purchasers.
Not applicable.
Item 10. Submission of Matters to a Vote of Security Holders.
No material changes have been made.
Item 11. Controls and Procedures.
(a) The registrant maintains disclosure controls and procedures that are designed to ensure that information required to be disclosed in the registrant’s filings under the Securities Exchange Act of 1934, as amended, and the Investment Company Act of 1940, as amended, is recorded, processed, summarized, and reported within the periods specified in the rules and forms of the U.S. Securities and Exchange Commission. Such information is accumulated and communicated to the registrant’s management, including its principal executive officer and principal financial officer, as appropriate, to allow timely decisions regarding required disclosure. The registrant’s management, including the principal executive officer and the principal financial officer, recognizes that any set of controls and procedures, no matter how well designed and operated, can provide only reasonable assurance of achieving the desired control objectives.
Within ninety (90) days prior to the filing date of this report on Form N-CSR, the registrant had carried out an evaluation, under the supervision and with the participation of the registrant’s management, including the registrant’s principal executive officer and the registrant’s principal financial officer, of the effectiveness of the design and operation of the registrant’s disclosure controls and procedures. Based on such evaluation, the registrant’s principal executive officer and principal financial officer concluded that the registrant’s disclosure controls and procedures are effective.
(b) There have been no significant changes in the registrant’s internal controls over financial reporting during the registrant’s second fiscal quarter of the period covered by this report that have materially affected, or are reasonably likely to materially affect, the registrant’s internal controls over financial reporting. There have been no significant changes in the registrant’s internal controls or in other factors that could significantly affect the internal controls subsequent to the date of their evaluation in connection with the preparation of this report on Form N-CSR.
Item 12. Exhibits.
(a) | | (1) Code of Ethics pursuant to Section 406 of the Sarbanes-Oxley Act of 2002 (as defined in Item 2(b) of Form N-CSR) is attached hereto. |
| | (2) The certifications required by Rule 30a-2(a) under the Investment Company Act of 1940, as amended, are attached hereto. |
| | (3) Not applicable. |
| | |
(b) | | The certification required by Rule 30a-2(b) under the Investment Company Act of 1940, as amended, is attached hereto. |
SIGNATURES
Pursuant to the requirements of the Securities Exchange Act of 1934, as amended, and the Investment Company Act of 1940, as amended, the registrant has duly caused this report to be signed on its behalf by the undersigned, thereunto duly authorized.
Curian Variable Series Trust | |
| |
| |
By: | /s/ Mark D. Nerud | |
| Mark D. Nerud | |
| Principal Executive Officer | |
| | |
Date: | March 6, 2015 | |
Pursuant to the requirements of the Securities Exchange Act of 1934, as amended, and the Investment Company Act of 1940, as amended, this report has been signed below by the following persons on behalf of the registrant and in the capacities and on the dates indicated.
By: | /s/ Mark D. Nerud | |
| Mark D. Nerud | |
| Principal Executive Officer | |
| | |
Date: | March 6, 2015 | |
| | |
| | |
By: | /s/ Daniel W. Koors | |
| Daniel W. Koors | |
| Principal Financial Officer | |
| | |
Date: | March 6, 2015 | |
EXHIBIT LIST
Exhibit 12(a)(1) | | Registrant’s Code of Ethics pursuant to Section 406 of the Sarbanes-Oxley Act of 2002. |
| | |
Exhibit 12(a)(2) | | Certification of the Principal Executive Officer required by Rule 30a-2(a) under the Investment Company Act of 1940, as amended. |
| | |
| | Certification of the Principal Financial Officer required by Rule 30a-2(a) under the Investment Company Act of 1940, as amended. |
| | |
Exhibit 12(b) | | Certification required by Rule 30a-2(b) under the Investment Company Act of 1940, as amended. |