| 2011 Qualifying Report |
| for the |
| Carmacks Copper Deposit, |
| Yukon Territory |
| |
| |
| NTS Map Sheet: 115I07 |
| Latitude 62°21'N |
| Longitude 136°41'W |
| |
| |
| Report By: |
| |
| Scott Casselman, B.Sc., P.Geo |
| Casselman Geological Services Ltd. |
| 33 Firth Road |
| Whitehorse, Yukon, Canada |
| |
| and |
| |
| Dr. Gilles Arseneau, P.Geo |
| |
| |
| Report For: |
| |
| Copper North Mining Corp. and |
| Carmacks Mining Corp. |
| 2050 – 1111 West Georgia Street |
| Vancouver, British Columbia, Canada |
| |
| |
| |
| October 17, 2011 |
TABLE OF CONTENTS
i
ii
LIST OF TABLES
LIST OF FIGURES
iii
iv
COPPERNORTHMININGCORP.
On October 17, 2011, Western Copper Corporation (Western Copper) completed a plan of arrangement (the Arrangement) involving Western Copper and two of its wholly-owned subsidiaries: Copper North Mining Corp. (Copper North) and NorthIsle Copper and Gold Inc. (NorthIsle). Pursuant to the Arrangement, Western Copper transferred 100% interest in the Carmacks Copper Project, 100% interest in the Redstone Project, and $2 million in cash to Copper North and 100% interest in the Island Copper property and $2.5 million in cash to NorthIsle in consideration for common shares of each respective company. Western Copper then changed its name to Western Copper and Gold Corp. (“Western Gold”) and distributed the shares of Copper North and NorthIsle to its shareholders.
Shareholders of Western Copper as at the effective date of the Arrangement (the “Effective Date”) received, for each common share of Western Copper held as at such date, one common share of Western Gold, 0.5 of a common share of Copper North, and 0.5 of a common share of NorthIsle. Upon closing of the Arrangement, Copper North and NorthIsle were owned exclusively by existing Western Copper shareholders.
The Carmacks Copper Project is located approximately 192 kilometres (km) north of Whitehorse, Yukon, within the Whitehorse Mining District. The property consists of 338 full-size and fractional claims in two claim blocks; one containing 312 claims, the other 26 claims. All of the claims owned 100% by Carmacks Copper Corp., a 100% owned subsidiary of Western Copper.
Western Copper (formerly Western Copper Holdings Ltd.) and Thermal Exploration Company (Thermal Exploration) acquired the Carmacks Copper Project in 1989 from Archer, Cathro & Associates subject to a 3% Net Smelter Royalty (NSR). Western Copper completed a feasibility study on the property which was subsequently updated in 1995. Following this, Western Copper made the decision to proceed with project development and filed for environmental review together with Quartz Mining and Water Licence Applications. In 1998, after completing some early construction work on the project Western Copper suspended work on the project indefinitely due to low copper prices. In 2006, an exploration program was re-initiated on the Carmacks property consisting of diamond drilling, Rapid Air Blast (RAB) drilling and environmental baseline studies. Western Copper continued exploration drilling, environmental studies and geotechnical investigations, seasonally, in 2007 and 2008.
1
COPPERNORTHMININGCORP.
To date, a total of 241 diamond drill holes, 11 reverse circulation holes, and 61 Rapid Air Blast holes, amounting to approximately 38,207 metres of drilling, were drilled in the exploration of the property. In addition, 71 geotechnical holes have been drilled for an additional 3,847 m.
The Carmacks copper-gold deposit lies within the Yukon Cataclastic Terrane. The deposit is hosted by feldspathic-mafic gneisses (generally quartz deficient) that form a roof pendant within Triassic hornblende-biotite granodiorite of the Granite Mountain Batholith. The deposit constitutes the No. 1, No. 4 and No. 7 Zones, which are 3 of 14 defined zones containing copper mineralization known on or in the immediate vicinity of the property. The No. 1, 4 and 7 Zones, as presently defined, extend over a 700 m strike length and at least 450 m down dip. The deposit is open at depth. These zones are oxidized to an approximate depth of 250 m below surface. Within the oxidized area pyrite is virtually absent and pyrrhotite is absent. Weathering has resulted in 1% to 3% pore space and the rock is quite permeable. Secondary copper and iron minerals line and in-fill cavities, form both irregular and coliform masses and fill fractures and rim sulphides. Primary sulphide minerals and magnetite are disseminated and form narrow massive bands or heavy disseminations in bands.
The character of the deposit changes along strike leading to a division into northern and southern halves. The northern half is more regular in thickness, dip angle, width, and down dip characteristics. The southern half splays into irregular intercalations, terminating against subparallel faults down dip. Both the north and south ends of the deposit are offset by cross-cutting faults. The No. 4 Zone is interpreted as the southern offset extension of the No. 1 Zone. The northern offset has not been identified yet.
An updated mineral resource was estimated by Dr. Gilles Arseneau, P. Geo. while employed by Wardrop Engineering Inc., in 2007. The updated resource estimate was prepared using historical and recent drill hole data. The oxide sulphide boundary was modelled using a minimum 20% ratio of oxide copper to total copper. A specific gravity of 2.65 was used for granodiorite, 2.68 for the oxide mineralization and 2.71 for the sulphide mineralization.
At a 0.25% total copper cut-off, the Carmacks deposit contains 12 million tonnes of oxide resource in the Measured plus Indicated categories grading 1.07 Cu, 0.86 CuX (oxide copper), 0.21% CuS (sulphide copper), 0.46 g/t Au, and 4.58 g/t Ag at a 0.25% total copper (TCu) cut-off grade.
Zone 1 also contained an additional 4.3 million tonnes of sulphide resource in the Measured plus Indicated categories grading 0.75% Cu, 0.03% CuX (oxide copper), 0.73% CuS (sulphide copper), 0.22 g/t Au, and 2.37 g/t Ag.
2
COPPERNORTHMININGCORP.
In addition to the measured and indicted resource, the deposit contains 90,000 tonnes of oxide inferred resource grading 0.73% Cu, 0.53% CuX (oxide copper), 0.20 CuS (sulphide copper), 0.12 g/t Au and 1.8 g/t Ag and 4 million tonnes of sulphide inferred resources grading 0.71 Cu, 0.01 CuX (oxide copper), 0.70 CuS (sulphide copper), 0.18 g/t Au and 1.9 g/t Ag.
In June 2005, the project entered the environmental assessment process and in April 15, 2009 the company received a Quartz Mining Licence. The company then entered the Yukon Water Board review for a water licence. On May 10, 2010 the company was notified that the Water Licence had been denied with a list of deficiencies in the application and design process.
Copper North is currently studying alternative heap leach designs to resolve the Water Licence issues, including modifications to the plant design. These may require additional geotechnical investigations to support the design change and an updated capital cost estimate for the project.
Exploration potential for oxide copper and sulphide resources exists in the Zone 2, 12, 13 and 14 areas. Additional drilling will be required to define these zones. Drilling to test and define these areas is estimated at 5,000 to 15,000 m.
The Phase 1 budget estimate for the alternative heap leach and plant design, geotechnical investigation and updating the feasibility study is $600,000. The Phase 2 budget estimate for evaluation of the under-explored zones is $1,000,000 to $3,000,000, although the project does not require the additional zones to be economic.
3
COPPERNORTHMININGCORP.
On October 17, 2011, Western Copper Corporation (Western Copper) completed a plan of arrangement (the Arrangement) involving Western Copper and two of its wholly-owned subsidiaries: Copper North Mining Corp. (Copper North) and NorthIsle Copper and Gold Inc. (NorthIsle). Pursuant to the Arrangement, Western Copper transferred 100% interest in the Carmacks Copper Project, 100% interest in the Redstone Project, and $2 million in cash to Copper North and 100% interest in the Island Copper property and $2.5 million in cash to NorthIsle in consideration for common shares of each respective company. Western Copper then changed its name to Western Copper and Gold Corp. (“Western Gold”) and distributed the shares of Copper North and NorthIsle to its shareholders.
Shareholders of Western Copper as at the effective date of the Arrangement (the “Effective Date”) received, for each common share of Western Copper held as at such date, one common share of Western Gold, 0.5 of a common share of Copper North, and 0.5 of a common share of NorthIsle. Upon closing of the Arrangement, Copper North and NorthIsle were owned exclusively by existing Western Copper shareholders.
The Carmacks Copper Project site is located 192 kilometres (km) north of Whitehorse in the Whitehorse Mining Division of the Yukon Territory, Canada. The property consists of 312 full-size and fractional claims in one contiguous blocks, and 26 claims in a second contiguous block.
In 1995, Western Copper commissioned Kilborn Engineering Pacific Ltd. (Kilborn) to prepare a Feasibility Study for the Carmacks Copper Project. This study contains resource estimates that were prepared prior to the inception of National Instrument 43-101 (NI 43-101) but were verified by the authors in a 2007 Aurora Geosciences Ltd. (Aurora) report. Aurora concluded that the resource estimates presented in the Kilborn feasibility study were a reasonable interpretation of the quantity and grade of the mineralization present, and satisfied the definitions and standards of the Canadian Institute of Mining, Metallurgy, and Petroleum (CIM) and as defined under NI 43-101. In the spring of 2007, mineral resources were re-estimated for the Carmacks deposit by Dr. Gilles Arseneau, P. Geo., using a 3 dimensional block modelling approach based on both historical (pre-2006) and the new data from the 2006 and 2007 campaigns.
4
COPPERNORTHMININGCORP.
The 2007 drilling program commenced in March and was completed in mid-October. The program further defined zones of mineralization at the No. 1, No. 7 and No. 7A zones, delineated mineralization at the No. 4, No. 12 and No. 13 zones and identified copper-molybdenum mineralization in a new zone, the No. 14 Zone.
In this report, all dollar amounts are expressed in Canadian currency unless otherwise specified.
Casselman Geological Services Ltd. and Gilles Arseneau have been commissioned to prepare an updated report utilizing the 43-101 standard in preparation for a spin-out of assets from Western Copper to a newly formed company. This report relies on the resource estimate of 2007 prepared by Dr. Arseneau while employed by Wardrop Engineering Inc. and is based on historical data plus data from the 2006, 2007 and 2008 exploration campaigns. The mineral resource estimate of 2007 was in conformance with the CIM Mineral Resource and Mineral Reserve definitions referred to in NI 43-101 Standards and Disclosure for Mineral Projects.
Scott Casselman, B.Sc., P.Geo., of Casselman Geological Services Ltd is the qualified person as defined by National Instrument 43-101, responsible for the preparation of this report. Mr. Casselman is independent of Western Copper and Copper North and managed the exploration programs as field supervisor on this project from July 10 to October 21, 2006, from February 3 to October 16, 2007 and from March 31 to May 30, 2008. Mr. Casselman most recently visited the property on June 29, 2011.
Dr. Gilles Arseneau, P. Geo., is responsible for the mineral resources presented in this report. Dr. Arseneau visited the Carmacks property on the 16th and 17th of May 2007 and is independent of Western Copper, Copper North and the Carmacks property.
5
COPPERNORTHMININGCORP.
| 3.0 | RELIANCEONOTHEREXPERTS |
This report relies on information and data gathered from existing reports prepared by other consultants and companies. This report relies primarily on information contained in the Basic Engineering Report, dated December 1997 and the Feasibility Study, dated September 1995, both of which were prepared by Kilborn. This report also relies on a technical report prepared by Aurora dated January 8, 2007 and the Resource Estimate Report prepared by Wardrop and Casselman in 2007.
The author relied on data provided by Western Copper and Copper North for drill data, assay data, resource estimation, surveying, claim status, environmental studies and permitting.
6
COPPERNORTHMININGCORP.
| 4.0 | PROPERY DESCRIPTIONANDLOCATION |
The Carmacks Copper Project is located in the Dawson Range Mountains on NTS map sheet 115I07 at latitude 62°21'N and longitude 136°41'W, some 192 km north of Whitehorse, Yukon as shown on Figure 4.1. The project site is located on Williams Creek, 8 km west of the Yukon River and some 38 km northwest of the town of Carmacks.
The Carmacks Copper Project site, located in the Whitehorse Mining District, consists of 318 quartz claims and quartz claim fractions and 20 quartz leases and quartz lease fractions measuring 4933 hectares, as shown on Figure 4.2. The term ‘quartz’ for a claim in the Yukon is the nomenclature used to distinguish between a bedrock or lode mineral rights and ‘placer’ claims for placer mineral rights. Pursuant to the transaction described in section 2.0 – Introduction, the claims will be registered in the name of Carmacks Mining Corp., a 100% owned subsidiary of Copper North Mining Corp.
A list of claims derived from the Yukon Mining Records and Claim Status Report, which describe the status of the Mineral claims and leases comprising the Carmacks property is presented in Table 4.1 and Table 4.2, respectively.
7
COPPERNORTHMININGCORP.
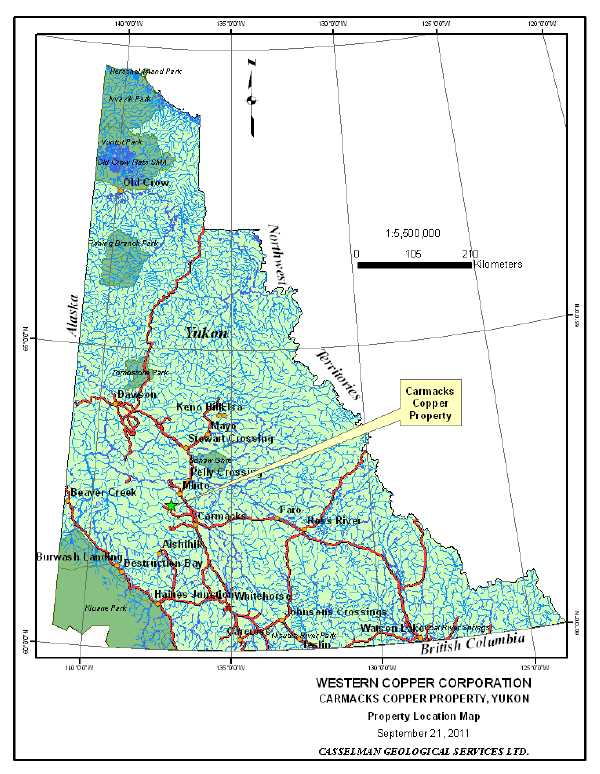
Figure 4.1 Property Location Map
8
COPPERNORTHMININGCORP.
| | Table 4.1 Quartz Claim Status |
Claim Name
and No. | Grant No. | Expiry
Date | Registered
Owner | %Owned |
BOY 20
BOY 51, 53
BOY 52, 54
BOY 83
DUN 1
TT 1
TT 2
VW 11, 13
VW 17-18
VW 19–21
VW 23, 25
VW 27–38
VW 40-50
VW 60-61
REM 1-14
REM 19-30
REM 32-35
W 1-6
W 7-10
W 11,13,15,17,19,20
W 12,14,16,18
W 21-24
W 25-28
W 29-30
W 31-37
W 41-43
W 50-53
W 55 ,W 57
W 91-93
W 95
X 3-4
X 5-7
WC 5-18
WC 23-36
WC 40-54
WC 57-72
WAR 22
WAR 23-29
WAR 30-31
WAR 32-37
WAR 38-44
WAR 45
WAR 46
WAR 47-50
WCC 1-40
GAP 1-5
HIP 1-12
HIP 13, 14
HIP 15-27
JIM 1-30 | Y51118
Y51149, Y51151
Y51150, Y51152
Y51181
Y59382
YB97068
YB97251
YB96620, YB 96622
YB96626-YB6627
YB96628–YB96630
YB96632, YB6634
YB96636-YB96647
YB96986-YB96996
YB96997-YB96998
YC39221-YC39234
YC39239-YC39250
YC39251-YC39254
YB26708-YB26713
YB26714-YB26717
YB26718,20,22,24,26,27
YB26719,21,23,25
YB26728-YB26731
YB26732-YB26735
YB26736-YB26737
YB26738-YB26744
YB26748-YB26750
YB36249-YB36252
YB36254, YB36256
YB36929-YB36931
YB36933
YB36898, 899
YB36962-YB36964
YB36693-YB36706
YB36711-YB36724
YB36728-YB36742
YB36745-YB36760
Y59373
YB36240-YB36246
YB36247-YB36248
YB36446-YB36451
YB36765-YB36771
YB36772
YB36773
YB36774-YB36777
YC60381-YC60420
YC65320-YC65324
YC65554-YC65565
YC65566-YC65567
YC65568-YC65580
YC66844-YC66873 | 2012/03/09
2012/03/09
2014/03/09
2012/03/09
2012/03/09
2015/03/09
2012/03/09
2012/03/09
2015/03/09
2016/03/09
2015/03/09
2015/03/09
2012/03/09
2015/03/09
2012/04/11
2012/04/11
2012/04/11
2012/03/09
2015/03/09
2012/03/09
2013/03/09
2015/03/09
2013/03/09
2012/03/09
2015/03/09
2013/03/09
2015/03/09
2013/03/09
2015/03/09
2015/03/09
2015/03/09
2015/03/09
2012/03/09
2012/03/09
2012/03/09
2012/03/09
2016/03/09
2015/03/09
2012/03/09
2015/03/09
2015/03/09
2012/03/09
2015/03/09
2012/03/09
2013/05/10
2013/03/09
2013/03/09
2012/14/08
2013/03/09
2012/03/09 | Carmacks Copper Corp.
Carmacks Copper Corp.
Carmacks Copper Corp.
Carmacks Copper Corp.
Carmacks Copper Corp.
Carmacks Copper Corp.
Carmacks Copper Corp.
Carmacks Copper Corp.
Carmacks Copper Corp.
Carmacks Copper Corp.
Carmacks Copper Corp.
Carmacks Copper Corp.
Carmacks Copper Corp.
Carmacks Copper Corp.
Carmacks Copper Corp.
Carmacks Copper Corp.
Carmacks Copper Corp.
Carmacks Copper Corp.
Carmacks Copper Corp.
Carmacks Copper Corp.
Carmacks Copper Corp.
Carmacks Copper Corp.
Carmacks Copper Corp.
Carmacks Copper Corp.
Carmacks Copper Corp.
Carmacks Copper Corp.
Carmacks Copper Corp.
Carmacks Copper Corp.
Carmacks Copper Corp.
Carmacks Copper Corp.
Carmacks Copper Corp.
Carmacks Copper Corp.
Carmacks Copper Corp.
Carmacks Copper Corp.
Carmacks Copper Corp.
Carmacks Copper Corp.
Carmacks Copper Corp.
Carmacks Copper Corp.
Carmacks Copper Corp.
Carmacks Copper Corp.
Carmacks Copper Corp.
Carmacks Copper Corp.
Carmacks Copper Corp.
Carmacks Copper Corp.
Carmacks Copper Corp.
Carmacks Copper Corp.
Carmacks Copper Corp.
Carmacks Copper Corp.
Carmacks Copper Corp.
Carmacks Copper Corp. | 100
100
100
100
100
100
100
100
100
100
100
100
100
100
100
100
100
100
100
100
100
100
100
100
100
100
100
100
100
100
100
100
100
100
100
100
100
100
100
100
100
100
100
100
100
100
100
100
100
100 |
9
COPPERNORTHMININGCORP.
| | Table 4.2 Quartz Lease Status |
Claim Name
and No. |
Grant No. | Expiry
Date | Registered
Owner | %
Owned | Quartz
Lease |
AC # 2-3
BOY 22
BOY 24
BOY 55–58
BOY 85
DUN 2-3
W 38-40
W 44-48
W 49 | Y91722–Y91723
Y51120
Y51122
Y51153–Y51156
Y51183
Y59383–Y59384
YB26745-YB26747
YB26751-YB26755
YB26756 | 2019/10/28
2019/10/28
2019/10/28
2019/10/28
2019/10/28
2019/10/28
2019/10/28
2019/10/28
2025/03/09 | Carmacks Copper Corp.
Carmacks Copper Corp.
Carmacks Copper Corp.
Carmacks Copper Corp.
Carmacks Copper Corp.
Carmacks Copper Corp.
Carmacks Copper Corp.
Carmacks Copper Corp.
Carmacks Copper Corp. | 100
100
100
100
100
100
100
100
100 | OW00070-71
OW00061
OW00062
OW00063-66
OW00067
OW00068-69
OW00072-74
OW00075-79
OW00080 |
The above claim information has been verified with the Yukon Mining Recorder NMRS database, current to August 12, 2011, which states that the expiry dates listed are valid and that all the claims and leases are in good standing (www.yukonminingrecorder.ca). Archer, Cathro & Associates (1981) Limited, at the election of the claim holder, retain a 3.0% NSR royalty to a maximum of $2.5 million. Annual advanced royalty payments of $100,000 are made whenever the average annual price of copper is above US$1.10/pound. To date $300,000 of the royalty has been paid.
In the Yukon, claims are good for one year and may be renewed yearly provided annual assessment work of $100 per claim is carried out or a payment of $100 per claim in lieu of work is made. A fee of $5 per claim per year of work recorded is also applicable to record the assessment work. Assessment work on a full-size fraction (greater than 25 acres) is the same as a claim but on a small-size fraction (less than 25 acres) only $50 per year assessment work is required. Quartz leases have a term of 20 years and may be renewed.
The property is located on Crown Land and the surface rights are unencumbered. Immediately west of the property is First Nations Class A Land Reserve LSC R-9A belonging to the Little Salmon Carmacks First Nation. Both surface and mineral rights are reserved for First Nation on Class A land.
In 1972, the leases on the property were surveyed as per one of the requirements of obtaining a lease. In 2007, the majority of the claims in the center part of the claim block, covering the No. 1, 4, 7, 7A, 12, 13, and 14 zones were legally surveyed. The far northern claims (WC claims), southern claims (VW, TT and X) and eastern claims (REM) have not been legally surveyed.
Figure 4.2 shows the location of the claims and leases.
10
COPPERNORTHMININGCORP.
For exploration (and development) in the Yukon, the Quartz Mining Act and Quartz Mining Land Use Regulations require that:
| | • | all areas disturbed must be left in a condition conducive to successful regeneration by native plant species. |
| | | |
| | • | all areas disturbed must be re- sloped, contoured, or otherwise stabilized to prevent long-term soil erosion. |
| | | |
| | • | structures must be removed and the site restored to a level of utility comparable to the previous level of utility. |
Western Copper has had environmental baseline monitoring programs in place since 1992. An Initial Environmental Evaluation (IEE) was compiled in 1994 and since then four addendums to the IEE have been filed by Hallam, Knight Piésold Ltd. (HKP), Knight Piésold Ltd. and Kilborn to detail additional information on the environmental parameters of the project. Programs have consisted of, but are not limited to, the following:
| | • | overburden and waste characterization studies. |
| | | |
| | • | in 23 waste rock samples, only one was over detection limit in elemental sulphur, overall Neutralization potential was NP/AP of 90:1, recent work using rainwater through waste sections of core, all three samples returned net NP greater than five and, although metals were present in the rock, the leachate metal content was low to very low for all metals. |
| | | |
| | • | leach pad neutralization, initial difficulty in increasing pH above 4 has been rectified by using sodium carbonate instead of lime for treatment of the leached material. |
In June 2005, Western Silver filed a Project Description with the Yukon Territorial Government (YTG) to initiate an environmental assessment under the Yukon Environmental Assessment (YEA) process and at the same time made application for both a Water License and a Quartz Mining License. Federal legislation passed in November of 2005 required Western Copper to enter into a second, parallel, assessment process pursuant to the Yukon Environmental and Socioeconomic Assessment Act (YESAA). A Project Proposal prepared in accordance with YESAA requirements was formally submitted in February 2006 and deemed adequate for public review in February 2007. On April 15, 2009 the company received a Quartz Mining Licence.
Prior to conducting the review of the Water Licence application, the Yukon Water Board required the recommendations of the Quartz Mining Licence. This review commenced shortly after April 15, 2009. On May 10, 2010 Western Copper was notified that the Water Licence had been denied. The Water Board indicated a number of deficiencies and concerns in the application, which the company is currently working to address.
11
COPPERNORTHMININGCORP.
Copper North will need to place environmental reclamation bonding to cover future and current potential environmental liabilities that at this time would consist of re-contouring and re-vegetating the camp areas and any old exploration trenches that remain intact.
The authors are not aware of any existing environmental liabilities on the property.
12
COPPERNORTHMININGCORP.

13
COPPERNORTHMININGCORP.
| 5.0 | ACCESIBILITY, CLIMATE, LOCALRESOURCES, INFRASTRUCTURE ANDPHYSIOGRAPHY |
The project site is currently accessible by way of the Freegold Road that leads northwest of Carmacks for 34 km then by the Carmacks Copper access road for 13 km to the property. The property access road is narrow and rough with steep sections and requires 4x4 capabilities in inclement weather conditions. The Freegold Road is maintained by the territorial government and is currently open seasonally, generally from April through September. Carmacks, on the Yukon River, is 175 km by paved road north of Whitehorse, which is 180 km north of the year-round port at Skagway, Alaska. A new 13 km access road is proposed to be constructed as a part of the project development; brush clearing in preparation of this has occurred. Vegetation in wet areas, especially along the Williams Creek valley, consists of willows and alders. Drier areas are covered by spruce and pine trees. The property as a whole is below the tree line.
The climate in the Carmacks area is marked by warm summers and cold winters. Mean daily temperatures range from -30°C in January to 12°C in July. The location close to the Arctic Circle provides 22 hours of daylight in late June but similarly long nights in late December. Precipitation is light with moderate snowfall, the heaviest precipitation being in the summer months. The average annual precipitation is approximately 375 millimetres (mm) (water equivalent) with one third falling as snow. July is the wettest month. Mean annual evaporation is approximately 404 mm to yield a net loss of 29 mm. Maximum evaporation occurs in July. The weather does not impede year round commercial operations in the Yukon, including outdoor activities in the winter, except in the harshest cold snaps when temperatures may plummet to -50°C. The Cyprus Anvil open pit lead/zinc mine at Faro and the Brewery Creek open pit/heap leach gold mine, not far from the project, both operated successfully for many years in this climate.
Winter conditions may be considered to extend over the period where daytime maximum temperatures average below zero, November to March. The extreme cold temperatures in the region make outside construction in the winter difficult. In general, the outdoor construction season will be from May to October.
Topography at the property area is subdued. Topographic relief for the entire property is 515 metres (m). In the immediate area of the No. 1 Zone, topographic relief is 230 m. Elevations range from 485 m at the Yukon River to 1,000 m on the western edge of the claim block.
14
COPPERNORTHMININGCORP.
Outcrop is uncommon because of the subdued topography and lack of glaciation. The major portion of the claim block lying north of Williams Creek is unglaciated above the 760 m elevation. The claim block area south of the Williams Creek valley and peripheral portions of the claim block, especially to the east, are covered by a veneer of ablation and lodgement boulder till with a sandy to silty matrix, generally less than 1 m thick.
Overburden is generally thin; a few centimetres(cm) of moss and organic material overlie 5 to 20 cm of white felsic volcanic ash (White River ash, approximately 1,250 years old). In unglaciated areas, the white ash is underlain by 10 cm of organics or peat and 15 to 50 cm of soil. Bedrock is extensively weathered, particularly the gneissic units. At the eastern end of Trench 91-6, bedrock is 7 m below surface, the deepest recorded in the unglaciated area. In the glaciated areas, the white ash is underlain by tills, generally 1 m thick, except along Williams Creek valley where till and colluvium to 55 m deep has been measured in the centre of the valley. Northeast of the deposit, in the North Williams Creek valley, overburden has been measured up to 100 m deep. Permafrost is present at varying depths on most north facing slopes and at depth in other areas. Facilities should be located to avoid frost-susceptible, poorly drained soils.
The project is 220 km from Whitehorse, the capital of Yukon Territory. Whitehorse has a population of around 26,000, which is roughly 3/4 of the entire Yukon. Whitehorse is serviced by daily commercial flights from British Columbia and Alberta to the south and other northern communities and all-weather paved highways to the south and west to Alaska. Historically, mining has been the Yukon’s most important industry. In the past, the Yukon & White Pass Route (Y&WPR) railroad provided rail service from Whitehorse to port at Skagway, Alaska. In fact, concentrate from the Faro mine was transported in this way after being trucked from the mine but when Faro closed down so did the railroad, except for tourist excursions. Concentrate from the Minto Mine is currently trucked to Skagway, for shipping over-seas.
Carmacks has little infrastructure but may provide a location for camp or town site for the project. The nearest access point to the power grid is 9.5 km east-northeast of the deposit, to the power line along the Klondike Highway. Running a transmission line from here to the property would require the line to be strung across the Yukon River.
15
COPPERNORTHMININGCORP.
There are no permanent facilities on the property as all previous work was performed from a tent and trailer camp. Some clearing of brush has been performed in the areas of the pit and leach pad locations. Areas sufficient for all leach pads, waste dumps, and other mine facilities have been located and designed in the feasibility study. Although it is planned to use a local well water source, make up water could also be brought from the Yukon River, which runs year round.
16
COPPERNORTHMININGCORP.
The first reported copper discovery in this region was made by Dr. G.M. Dawson in 1887 at Hoochekoo Bluff, on the Yukon River, 12 km north of the property. In 1898, the first claims were staked to cover copper showings that were associated with copper bearing quartz veins located in Williams Creek and Merrice Creek Canyons, east of the present Carmacks Copper deposit.
In the late 1960's, exploration for porphyry copper deposits in the Dawson Range led to the discovery of the Casino porphyry copper deposit, 104 km to the northwest of the Carmacks Copper deposit. This discovery precipitated a staking rush that led to the staking of the Williams Creek property in 1970 by G. Wing and A. Arsenault of Whitehorse. The Dawson Range Joint Venture (Straus Exploration Inc., Great Plains Development of Canada Ltd., Trojan Consolidated Minerals Ltd., and Molybdenum Corporation of America) optioned the property and contracted Archer, Cathro and Associates to conduct reconnaissance prospecting and geochemical sampling. During this program, the present No. 1 and No. 2 Zones were discovered.
Extensive drilling campaigns were undertaken on the property in 1971 (5,583 m of diamond drilling in 25 holes) and 1972 (1,531 m of diamond drilling in 8 holes) along with other exploration activities such as trenching, access road construction, ground magnetic surveys, ground VLF-EM surveys, airborne geophysical surveying, geological mapping, soil and rock sampling. From 1972 to 1990 there was no significant work performed on the property.
The property was purchased by Western Copper Holdings and Thermal Exploration Ltd in 1991. Later that year, they performed 3,464 m of diamond drilling in 36 holes and initiated a baseline environmental study. In 1992, they drilled 1,164 m in 11 diamond drill holes and 856 m in 11 reverse circulation holes. The companies also conducted additional metallurgical test work, baseline environmental testing, a biophysical assessment of the area and contracted Knight Piesold Ltd to conduct geotechnical studies on the deposit consisting of test pit excavation, overburden sampling, oriented diamond drill core logging and geologic mapping.
In 1994, Kilborn Engineering Pacific Ltd. was contracted to perform a Feasibility Study. The study indicated that, based on the copper price at the time the project was viable using open pit mining methods and solvent extraction-electrowinning.
In 1995, Western Copper Holdings and Thermal Exploration Ltd. merged to become Western Copper Holdings Ltd. The company contracted Knight and Piesold Ltd. to initiate a preliminary mine design and also initiated clearing and grubbing of a site access road and leach pad area. The company submitted a mine permit application later that year.
17
COPPERNORTHMININGCORP.
While the company was awaiting a mine permit, they contracted Kilborn Engineering to produce a basic engineering report, in 1997. The permit was not forthcoming and, due to changing market conditions the company withdrew the permit application. The property sat dormant until the re-initiation of permitting in 2004.
In February 2003, Western Copper Holdings Ltd. changed their name to Western Silver Corporation as a result of a corporate redirection toward silver mining.
In late 2004, based in part on renewed optimism in the price of copper, Western Silver agreed with the Yukon Territorial Government to re-enter the permitting process and re-engaged in the environmental review process under the YEA process and more recently the newly enacted Yukon Environmental and Socioeconomic Assessment Act (YESAA) process.
In early 2006, Glamis Gold Ltd. purchased Western Silver Corporation and spun off a separate firm named Western Copper Corporation. Western Copper retained the rights to the Carmacks Copper Project.
The Carmacks deposit has been subject to some historical tonnage and grade estimations over the years as summarized in Table 6.1. The historic resources are presented here to show the progression of development of the resources over the years on the property.
| | Table 6.1 Historical Tonnage & Grade Estimates of the Carmacks Copper Deposit |
Year |
Source |
Tons | Cu
ox. % | Cu
% | Au
oz/t |
Comments |
1991 | MPH Consulting
Ltd.(No. 1 Zone) |
14,564,600 |
0.90 |
1.05 |
- | Conventional by section 76%
proven, 13% probable |
1991 | MPH Consulting
Ltd.(No. 1 Zone) |
14,564,600 |
0.88 |
1.00 |
- | IDS block model 78% proven,
10% probable |
1993 | Western Copper
Audited by Kilborn |
12,984,240 |
0.911 |
1.195 |
0.016 | Measured and indicated at
cutoff of 0.8% total copper |
1993 | Western Copper
Audited by Kilborn |
15,867,140 |
0.829 |
1.096 |
0.014 | Measured and indicated at
cutoff of 0.5% total copper |
1993 | Western Copper
Audited by Kilborn |
19,062,390 |
0.725 |
0.972 |
0.013 | Measured and indicated at
cutoff of 0.01% total copper |
1997 | Western est. Audit
by Kilborn/SNC |
13,300,000 |
- |
0.97 |
- | Cutoff grade 0.29%T Cu Mine
use 4.6:1 strip ratio |
2007 | Wardrop (No. 1, 4
and 7 Zones) |
10,000,000 |
0.96 |
1.13 |
0.017 | Oxide Resource, Measured and
indicated at cutoff of 0.25%
total copper |
18
COPPERNORTHMININGCORP.
The mineral resource calculations presented in Table 6.1 have not been classified in accordance with the CIM approved standards as required in NI 43-101. These estimates have been obtained from sources believed reliable and conform to disclosure standards in use at the time of their publication, but have not all been independently verified. These resource estimates are no longer relevant and should not be relied upon, as they are replaced by the estimate which is re-presented in Section 14.0 of this report.
19
COPPERNORTHMININGCORP.
| 7.0 | GEOLOGICAL SETTINGANDMINERALIZATION |
The regional geology was described by Bostock in 1936 and more recently by Tempelman- Kluit in 1981 and 1985 and is shown in Figure 7.1. The Carmacks region lies within the Intermontane Belt, which in the Carmacks map-area is divisible into the Yukon Cataclastic Terrane, Yukon Crystalline Terrane and Whitehorse Trough.
The Whitehorse Trough lies to the east of the Hoochekoo Fault, east of the Carmacks Copper Project. The Whitehorse Trough comprises Upper Triassic intermediate to basic volcanic capped by carbonate reefs (Povoas Formation) and Lower Jurassic greywacke, shale and conglomerate, derived from the underlying Upper Triassic granitic rocks (Laberge Group).
The Yukon Cataclastic Terrane includes hornblende-biotite-chlorite gneiss with interfoliated biotite granite gneiss, Permian Selwyn Gneiss and is intruded by Early Jurassic Aishihik Suite Granite Mountain Batholith. Weakly foliated, mesocratic, biotite-hornblende, Granite Mountain granodiorite contains screens or pendants of strongly foliated feldspar-biotite-hornblende-quartz gneisses that host the Carmacks Copper deposit.
Younger plutonic rocks intrude all three divisions of the Intermontane Belt and the contacts between them. Carmacks Group and Mount Nansen volcanic rocks overlie portions of all older rocks, suggesting that they should not be classified in the Yukon Crystalline Terrane, but are younger rocks that obscure relationships between the older terrane rocks. Tempelman-Kluit (1985) has included the Carmacks Group in the Yukon Crystalline Terrane.
Mesozoic strata of the Whitehorse Trough are only exposed in fault contact with the Yukon Crystalline Terrane and Yukon Cataclastic Terrane, but may rest depositionally on them or certain of their strata. The relationship between the Yukon Crystalline Terrane and Yukon Cataclastic Terrane is unknown.
The predominant northwest structural trend is represented by the major Hoochekoo, Tatchun and Teslin faults to the east of the Carmacks Copper Project and the Big Creek Fault to the west. East to northeast younger faulting is represented by the major Miller Fault to the south of the Carmacks Copper Project.
20
COPPERNORTHMININGCORP.

Figure 7.1 Regional Geology
21
COPPERNORTHMININGCORP.
The Carmacks Copper-Gold deposit lies within the Yukon Cataclastic Terrane. The deposit area is underlain by intrusive and meta-intrusive rocks of the Granite Mountain Intrusion. Compositions range from granodiorite to diorite. These rocks are equigranular to porphyritic, and massive to moderately foliated. The porphyritic phases contain phenocrysts of K-(potassium) feldspar, plagioclase and/or quartz. In some instances the K-feldspar phenocrysts range up to 3 cm long. Post mineralization granitic pegmatite and aplite dykes are widespread in the area.
Hornblende is present in dioritic intrusive rocks and locally in the granodioritic phases. Quartz, K-feldspar and plagioclase are present in all intrusive phases. Plagioclase is subhedral and very locally displays growth zoning.
The host rocks for copper and gold mineralization at the No. 1, 4 and 7 Zones can be divided into three types:
| | • | biotite-rich gneiss and quartzo-feldspathic gneiss |
| | | |
| | • | ‘siliceous ore’ |
| | | |
| | • | fine-grained ‘amphibolite’ and biotite schist. |
In addition, 13 identified zones containing Cu mineralization are known on, or in the immediate vicinity of, the property.
Most of the geological information shown in Figure 7.2 comes from geophysics and drill core, as there is only limited outcrop on the property found along spines on the ridges and hill tops. Float, derived locally because the area was not glaciated by continental glaciation, can be seen in the old trenches on the property and along the cuts of the drill roads.
Petrographic examination indicates Granite Mountain granodiorites have a varied mineralogical content with areas of silica under-saturation and plagioclase oversaturation. These variations are probably the result of the assimilation of precursor rock to the gneiss units.
The general lack or very low quartz content and the high mafic content suggest a volcanic origin for the gneisses. Occasional drill intercepts of the “gneiss” in Zone No. 4 and in Zone No. 12 returned rock that resembled arkosic sediment, possibly derived from a mafic volcanic or indicating the gneiss is from a mixed volcano-sedimentary environment. An andesitic to basaltic pyroclastic volcanic, probably tuffaceous, agglomeratic or breccia precursor rock with some sedimentary re-working is considered the most likely.
22
COPPERNORTHMININGCORP.
Post mineralization aplite and pegmatites are common. They range in thickness from a few centimetres up to three metres. Quartz veins are uncommon and average two to five centimetres in thickness. Thin mafic dykes that were feeders for Carmacks Group volcanic are also uncommon. The only copper mineralization in these dykes and veins is non-sulphide secondary copper in aplite and pegmatite.
All of the historically estimated resources are contained in the No. 1 Zone which extends over a 700 m strike length and at least 450 m down dip. The deposit is open at depth and is oxidized to approximately 230 m in depth. Copper-gold mineralization at Carmacks Copper is hosted by feldspathic-biotite-hornblende-quartz gneisses. These gneisses have been subdivided into nine categories based on coarseness and biotite-hornblende content. All of the gneisses are silica undersaturated and mafic rich.
The character of the No. 1 deposit changes along strike leading to a division into northern and southern halves. The northern half is more regular in thickness, dip angle, width, and down dip characteristics. The southern half splays into irregular intercalations, in zones No. 7 and 7A, and appears to terminate against sub-parallel faults down dip. At the north end the deposit pinches out. The combined strike length of the No. 1, 7 and 7A is 800 m. The mineralized portions of zones No 7 and 7A extend down 120 m, below which the gneiss continues, but with very little copper mineralization. The copper and gold mineralization in No. 7 and 7A are similar to No. 1, with the exception that in some locations the depth of oxidation is shallower.
The No. 4 Zone is fault offset, south east of the No. 1 Zone. It measures 60 m wide by 90 m long and goes down to 90 m deep. It varies from biotite-hornblende gneiss, as seen in the No. 1 zone, in the northern part to a more granular, meta-volcano-sedimentary host rock in the south. The copper content is lower in the No. 4 zone and there is a shallower depth of oxidation. The shape of the No. 4 zone is an irregular, wavy, shallowly dipping body, which forms a large “bowl” shape in the centre of the zone.
23
COPPERNORTHMININGCORP.
In the northern half of the No. 1 zone, copper grades are higher in the footwall relative to the hanging wall. Oxide copper grades increase with depth in both the footwall and hanging wall. There is no association of copper values with rock type, mafic mineral content, or grain size. Gold values are higher in the north half of the deposit. They average 0.022 ounces (oz) gold per ton (0.75 grams per tonne (g/t)) compared with 0.008 ounces gold per ton (0.27 g/t) in the south half. There is no apparent increase in values with depth and the highest grade gold values are not associated with the highest copper values; however, gold values in the northern half are higher in the footwall section. This lack of increase in gold values with depth suggests that the gold distribution reflects a primary distribution rather than a secondary distribution, such as oxide copper values. As with oxide copper, gold content does not correlate with rock type, mafic constituents, or grain size. The majority of the gold occurs in a higher-grade zone between section 1700 N and section 1200 N.
24
COPPERNORTHMININGCORP.

Figure 7.2 Property Geology
25
COPPERNORTHMININGCORP.
The majority of the copper found in oxide portion of the No. 1, No. 4, No. 7 and No. 7A zones are in the form of the secondary minerals malachite, cuprite, azurite and tenorite (copper limonite) with very minor other secondary copper minerals (covellite, digenite, djurlite). Native copper occurs as dendritic secondary precipitates on fractures, occasionally up to 50 m from the deposits. Other secondary minerals include limonite, goethite, specular hematite and gypsum. Primary copper mineralization is restricted to bornite and chalcopyrite. Other primary minerals include magnetite, gold, molybdenite, native bismuth, bismuthinite, arsenopyrite, pyrite, pyrrhotite, and carbonate. Molybdenite, visible gold, native bismuth, bismuthinite, and arsenopyrite occur rarely.
Alteration minerals that could be considered strictly related to the mineralizing event rather than weathering or dyke intrusion are not recognizable. Epidotization and potassium feldspathization are obviously related to a pegmatite dyke intrusion, which is a post-mineralization event. Clay (montmorillonite type) and sericite development are clearly weathering products. Silica introduction, usually as narrow veinlets, is not common and may be related to aplite dyking or metasomatism. Chloritization of mafics, biotitization of hornblende, rare garnets, carbonate, and possibly anhydrite all appear related to metasomatism and assimilation of precursor rocks to the gneissic units.
The upper 230 m of the No. 1 Zone is oxidized. Within the oxidized area, pyrite is virtually absent and pyrrhotite is absent. Weathering has resulted in 1% to 3% pore space and the rock is quite permeable. Secondary copper and iron minerals line and in-fill cavities, form both irregular and coliform masses, and fill fractures and rim sulphides. Primary sulphide minerals and magnetite are disseminated and form narrow massive bands or heavy disseminations in bands. Non-copper sulphides are not common in the weathered zone and are usually intergrown or associated with each other when they do occur. They most commonly occur in hematite but also occur in copper sulphides and in the gangue minerals. Gypsum occurs as microveinlets. Carbonate occurs as pervasive matter, irregular patches or microveinlets, not commonly but on the order of 1% where present. Gold occurs as native grains, most commonly in cavities with limonite or in limonite adjacent to sulphides, but also in malachite, plagioclase, chlorite, and rarely in quartz grains. Gold is rarely greater than five microns in size.
Secondary copper mineralization does not appear to be preferential to a particular rock type. In the north half of the No. 1 Zone, copper mineralization forms high and low grade zones that are reasonably consistent, both along strike and down dip, and these zones transcend lithologic boundaries. Higher grades tend to form a footwall zone, while lower grades form a hanging wall zone.
26
COPPERNORTHMININGCORP.
Primary mineralization, below the zone of oxidation comprises chalcopyrite, bornite, molybdenite, magnetite, pyrite and pyrrhotite. Primary copper mineralization appears to be zoned from bornite on the north to chalcopyrite, and finally to pyrite and pyrrhotite on the south. Narrow veinlets of anhydride were found in the deepest drill hole.
27
COPPERNORTHMININGCORP.
The Carmacks Copper deposit is similar to the Minto deposit, located 50 km to the northwest (Sinclair, 1976; Pearson, 1977), except that the Minto deposit is flat lying and primarily a sulphide deposit. A number of theories for the genesis of the Carmacks Deposit have been postulate over the years and by different operators. Evidence from the 2006 and 2007 drilling campaigns suggests the deposit was formed by assimilation of older, copper-bearing volcano-sedimentary rocks into the Jurassic Granite Batholith. These “rafts” of mineralized rock would have been variably metamorphosed, and in places completely assimilated into the granodiorite. The volcano-sedimentary rafts would tend to pull apart along bedding planes forming large tabular sheets as observed in the No. 1, 7, 7A, 8, 12 and 13 zones. Evidence suggests the sulphide mineralization has been re-mobilized out of the rafts into the surrounding granodiorite and in some locations the sulphur has been driven off leaving native copper in the granodiorite matrix. At a later time, when the upper parts of the batholith where eroded and the gneiss was exposed to the atmosphere and meteoric waters, the sulphide mineralization began to oxidize and precipitate as the oxide minerals.
The Minto deposit is owned by Sherwood Mining Corporation and began production in June of 2007. The Minto deposit has been interpreted as a either a metamorphosed stratiform sedimentary copper deposit or a metamorphosed porphyry copper deposit.
28
COPPERNORTHMININGCORP.
Copper North has not carried out any exploration on the Carmacks property. The exploration programs described in this section were carried out by Western Copper.
A considerable amount of historical exploration and drilling has been carried out on the property leading up to and during the discovery and definition of the Carmacks Copper deposit. In addition to drilling, the main mode of exploration has been trenching. The main No. 1, 4, 7 and 7A zones has been trenched at 200-foot spacing and one or two trenches have been excavated on most of the other known anomalies (Figure 9.1) . All trenches across the No. 1 Zone were channel sampled with 5 or 10 foot (1.52 m or 3.05 m) sample lengths. Trenches parallel to the zone were not sampled.
Ground geophysics was carried out in 1991 by Interpretex Ltd, over the No. 1 Zone area and continued north and south over a total 20,000-foot strike length. The survey was done at 200-foot line spacing for a total of 52.4 line miles. The VLF-EM and magnetometer survey identified numerous structures assumed to be faults as well as the main zone style mineralization.
In 1993, Sander Geophysics Ltd conducted an airborne magnetic, radiometric, and VLF-EM survey over an even larger grid. Two hundred and fifteen line km were flown at 100-metre line spacing.
The Carmacks area in general was also covered by a regional fixed wing airborne geophysical survey conducted by Fugro Airborne Surveys for the Yukon government in 2001 (Shives et al, 2002).
In 2006, Western Copper conducted 7,100 m of diamond drilling in 34 holes, 1,200 m of rotary air blast drilling in 61 holes, and re-initiated environmental baseline studies. In 2007, the company continued the exploration and environmental sampling program and conducted geotechnical studies of the proposed heap leach pad, waste rock storage area, processing plant and camp location. The 2007 program consisted of 17,000 m of diamond drilling in 123 holes, 845 m of geotechnical drilling in 34 holes, 31.7 line km of induced polarization surveys and surveying of all drill hole locations including all the historic drill holes, geotechnical holes, and rapid air blast drill holes.
The surveying was conducted by Lamerton and Associates of Whitehorse, Yukon and was performed by Differential GPS. The hole markers at a few of the historic drill holes were destroyed during later road building, trenching or drill pad construction and these sites were located approximately. The accuracy of the post processed survey points is estimated at approximately 20 mm.
29
COPPERNORTHMININGCORP.
In 2008, Western Copper drilled 6 geotechnical holes (1,492 m) in the pit area, 2 water wells in the camp area (253.5 m), one water monitoring well below the heap leach pad (151 m) and conducts a small soil geochemical sampling program.
30
COPPERNORTHMININGCORP.
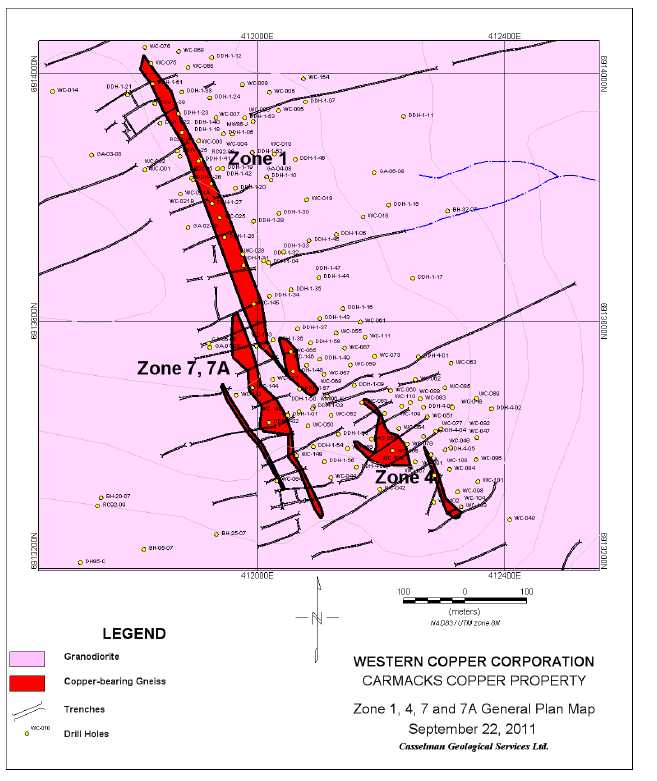
Figure 9.1 General Plan Map
31
COPPERNORTHMININGCORP.
Prior to 2006, a total of 80 diamond drill holes and 11 reverse circulation holes, amounting to approximately 12,900 m of drilling, were drilled in the exploration of the property. Five very short holes totalling 63 m were also drilled on the property. The drill holes prior to 2006 are numbered by zone, so hole 101 would be the first hole drilled on the No. 1 Zone and hole 1302 would be the second hole in No. 13 Zone.
Core drilling of the No. 1 Zone utilized BQ size in 1971, NQ size in 1990, and HQ size in 1991 and 1992. Three NQ size holes drilled in 1990 had variable recoveries. Hole 118 recovered virtually 100% of the core, hole 119 averaged in the high 80% range, and the third hole, hole 120, averaged in the low 90% range. Core recovery for the HQ size holes averaged in the mid to high 90% range.
In 1992, an NQ size hole, number 158, was drilled using the triple (split) tube system. Except for rare instances where the core tube failed to latch, core recovery was 100%. Friable or broken sections were more completely recovered using larger diameter core (HQ) and the triple tube system.
Three reverse circulation down-hole hammer holes were drilled on the No. 1 Zone in 1992. They were drilled to twin diamond drill holes 119 (NQ), 125 (HQ) and 126 (HQ). The purpose of these holes was to determine if significant quantities of copper mineralization were lost through water circulation during diamond drilling and to determine if the expected higher recovery of friable or broken mineralized gneiss in large diameter holes would improve the grade.
The three reverse circulation holes, RC-4, RC-5, and RC-6, were drilled dry through the mineralized section so that no losses to washing could take place. Hole RC-4 twinned HQ-core hole 125 and was similar in grade and width, 39.62 m averaging 1.40% Cu versus 48.16 m averaging 1.36% Cu, respectively. Hole RC-5 twinned HQ-core hole 126 and improved the grade, 48.77 m averaging 1.07% Cu versus 44.50 m averaging 0.83% Cu, respectively. Hole RC-6 twinned NQ-core hole 119 and also improved the grade, 44.20 m averaging 1.11% Cu versus 49.68 m averaging 0.96% Cu, respectively. Hole 125 recoveries averaged in the mid-90% range while holes 126 and 119 both averaged in the high 80% range. The improved grades in RC-5 and RC-6 suggest that when core recoveries were below the mid-90% range, grades are possibly understated by diamond drill results; however, a t-test comparison of reverse circulation holes versus diamond drill holes indicates there is no statistical difference in the results.
32
COPPERNORTHMININGCORP.
For the 2006 and 2007 drill programs, each hole started with HQ core (63.5 mm) and most holes reduced to NTW (56.0 mm) with the occasional hole having to reduce down to BTW (42.0 mm) at greater depths. In general, core recovery for the 2006 and 2007 programs was greater than 97%.
The object of the 2006 program was to examine the down-dip extension of the No. 1 Zone, with a goal to delineate the oxidation-reduction front at depth on the deposit; confirm historic drill results by twinning two of the previously drilled holes and explore along strike to search for lateral extensions of the No. 1 Zone, and to expand the knowledge of some of the other mineralized zones.
In addition, a RAB drilling program commenced in August 2006, which was designed to condemn areas of the property for future plant development.
The object of the 2007 program was to define the northern and southern limits of the No.1, 7 and 7A zones, to delineated the No. 4 Zone, to further test and define the N. 12 and 13 zones, exploration drilling at the newly discovered No. 14 Zone and condemnation drilling in the proposed waste rock storage, heap leach pad and the processing plant areas.
The 2008 program was designed to complete the geotechnical studies initiated in 2007.
33
COPPERNORTHMININGCORP.
| 11.0 | SAMPLE PREPARATION,ANALYSESAND SECURITY |
Drill core in 1971 and 1990 was sampled in 10-foot (3.05 m) intervals. In 1991 and 1992, drill core was sampled by rock type for geological information but sampling was largely within 10-foot intervals to facilitate later statistical analysis of assay data.
Reverse circulation holes were sampled over five foot (1.52 m) intervals within the No. 1 Zone and at 10-foot intervals for 25 to 50 feet (7.62 m to 15.24 m) on either side of the mineralization. Duplicate 12.5% splits were collected with one sample for assay and one sample kept at the core storage area.
In 1971, rock assays were performed by Whitehorse Assay Office in Whitehorse. Two batches of sample rejects were sent to ALS Chemex Labs Ltd. (Chemex) in North Vancouver, B.C. for check assays. The first batch results from Chemex were 5.9% higher than the originals but the second batch returned values 5.7% lower on average. In the 1990s programs, trench and drilling samples were sent to Chemex for analysis. All samples were dried and crushed to better than 60% minus 10 mesh. An appropriate size split then underwent Chrome-steel ring pulverization until >90% was minus 150 mesh size.
Total copper was assayed by HCIO4 – HNO3 digestion followed by Atomic Absorption Spectrometry (AAS) with a 0.01% detection limit. Non-sulphide copper was assayed by dilute H2SO4 digestion followed by AAS with a 0.01% detection limit. Gold was assayed by 1/2 assay ton fire assay followed by AAS with a 0.002 oz/ton (0.0686 g/t) detection limit and an upper limit of 20 oz/ton (685.71 g/t). Silver was assayed by aqua regia digestion followed by AAS with a 0.01 oz/ton (0.34 g/t) detection limit and an upper limit of 20 oz/ton (685.71 g/t).
All 1990 to 1992 drill samples were assayed for total copper, non-sulphide copper, gold, and silver. Most trench samples were assayed for the same elements but a few peripheral trench samples were not assayed for non-sulphide copper, gold, or silver. In 1971, any drill sample without obvious copper oxides or carbonates was not assayed for non-sulphide copper and deeper intercepts were generally not assayed for gold or silver.
For the 2006 and 2007 programs, all drill core sample intervals were marked at 1.0 m intervals by a qualified geologist. All samples were cut using a diamond core saw to obtain the best possible representative sample. Samples were packaged and shipped using industry standard secure packaging and were sent to Chemex for processing.
34
COPPERNORTHMININGCORP.
Samples were processed by crushing to >70% <2 mm and pulverizing a 250-g split to >85% -75 mm according to Chemex’s Prep 31 procedure. The samples were then analyzed for 27 elements by “Near Total” digestion and Inductively Couple Plasma Emission Spectroscopy (ICP-ES) by Chemex’s ME-ICP61 or ME-ICP61a procedures.
As well, each sample was analyzed for:
| | • | gold by fire assay and AAS on a 30- g sample by procedure Au-AA23 |
| | | |
| | • | total copper content by four-acid (HF-NNO3-HClO4-HCl) digestion and Atomic Absorption according to procedure Cu-AA62 |
| | | |
| | • | non-sulphide copper by sulphuric acid leach and AAS according to procedure Cu-AA05. |
Duplicate samples were collected regularly, nominally every 20th sample, and were given unique sample numbers. For the first portion of the program, the duplicates were sent along with the original samples to Chemex for processing and were processed as described above. For the latter portion of the program the duplicates were sent to Acme Analytical Laboratories (ACME) in Vancouver for analysis. The samples sent to Acme were processed by crushing to >70% <-10 mesh and pulverizing a 250 g split to >95% -150 mesh according to the Acme R1 50 procedure. The samples were then analyzed for 43 elements by “Four Acid” digestion and Inductively Couple Plasma Mass Spectroscopy (ICP-MS) by Acme’s 1T-MS procedure. As well, all samples were analyzed for gold by fire assay and Inductively Coupled Plasma Emission Spectroscopy (ICP-ES) on a 30 gm sample by procedure 3B ICP-ES. Total copper content was determined by four-acid (HF-NNO3-HClO4-HCl) digestion and ICP-ES according to procedure 7TD and, for non-sulphide copper, by sulphuric acid leach and AAS according to procedure 8.
For the 2007 program a set of 3 standards were included with each sample shipment to Chemex and ACME. These standards were collected from the property and represented “high-grade” oxide mineralized material (AGL-1), “low-grade” oxide mineralized material (AGL-2) and a blank which was comprised of unmineralized granodiorite (AGL-3). The standard samples were collected in the 2006 exploration season and prepared by CDN Resource Laboratories in Vancouver with assay certification by Smee and Associates of Vancouver, BC. The processed standards were received in February of 2007, hence were not available in time to be included in the 2006 sample shipments.
35
COPPERNORTHMININGCORP.
Standard sample handling practices of the era were used on the property in pre-2006 work. No special security precautions were noted in the sampling, shipping, and analysis of the mineralization from the deposit. No irregularities were found in the historical data, and some check assays were performed.
ALS Chemex and Acme Labs are independent of Western Copper and Copper North. Both labs are ISO 9001 accredited.
The 2006 and 2007 sampling and shipping procedure was handled in a secure manner. The sampling procedure was set-up by Scott Casselman, P. Geo. and all shipments were supervised by a representative of Aurora Geosciences Ltd. to the point that they were delivered to the trucking company in Whitehorse for trucking to Chemex or Acme in Vancouver. There has been no indication from either of the labs that samples or shipments had been tampered with.
36
COPPERNORTHMININGCORP.
For the 2007 NI43-101 report (Arsenault and Casselman, 2007), the digital assay data integrity was checked by verifying 69% of the database records against the original electronic assay certificates. Assay records from 53 drill holes were verified and a total of 8 data entry errors were found as a result of the check. All of the discrepancies found were negligible based on their low-grade values. All errors were corrected in the digital database. Collar coordinates were checked against the database entries. No discrepancies were observed. It was concluded that the assay and survey database was sufficiently free of error to be adequate for resource estimation of the Carmacks deposit.
In August 2006, two historical diamond drill holes were twinned to verify the validity of the historical assay results using current diamond drilling, sample handling, and assaying practices.
The twin holes, WC-003 and WC-004, were drilled to test historical holes 91-140 and 91-141 respectively, drilled in 1991. The locations and orientations of the holes are listed in Table 12.1 below:
Table 12.1 Coordinates of Twin Drill Holes
| Hole | NAD83UTME | NAD83UTMN | Az_True | Dip |
1-40-91
WC-003
1-41-91
WC-004 | 411878
411875
411902
411905 | 6913907
6913902
6913855
6913857 | 248.5
245
248.5
245 | -50
-50
-50
-50 |
A comparison between the historical and current assay results can be found in Table12.2 below. The hanging wall and footwall contacts were well defined in all four drill holes. The lengths of the intercepts listed in the table are from the hanging wall contact to the footwall. There were well-mineralized intersections below the footwall contact in all four holes, but these were not used in the comparison below.
37
COPPERNORTHMININGCORP.
| | Table 12.2 Comparison of Check Drilling and Historical Drilling |
| 1-40-91 | WC-003 | Difference
(%)
(new-old) | 1-41-91 | WC-004 | Difference
(%)
(old-new) |
Total
Cu | OX
Cu | Total
Cu | OX
Cu | Total
Cu | OX
Cu | Total
Cu | OX
Cu |
| Length | 39.6m | 39.6m | 39m | 39m | -1.54% | 48.8 | 48.8m | 48m | 48m | -1.67% |
Average |
1.24 |
0.84 |
1.67 |
0.97 | +15.77%
(OX Cu) |
1.23 |
0.98 |
1.13 |
0.99 | +1%
(OX Cu) |
| SD (%) | 0.7 | 0.5 | 0.87 | 0.44 | | 1.45 | 1.05 | 0.94 | 0.87 | |
| Var (%) | 0.59 | 0.41 | 0.7 | 0.34 | | 0.91 | 0.66 | 0.65 | 0.59 | |
The historical grade and geological interpretations are repeatable using modern drilling, core handling and sampling methods, and assay procedures. The differences in section widths are a function of the fact that the historical drill results were sampled on a 10-foot interval while the 2006 drilling was sampled on a three-metre interval. The small discrepancy between total copper values in hole 91-141 and WC-004 are caused by a short intersection of anomalously high grade copper (6.5%) over a length of 9 feet (2.74 m) in 91-141 that was not present in hole WC-004.
A number of check samples were also collected from selected portions of 1991 drill core stored on the property. The samples were collected by quartering remaining split core with a rock saw. The samples were collected at one-metre intervals falling within 1991sample intervals for comparison purposes. Results are presented in Table 12.3. The sample handling, shipping, and preparation control procedures followed were the same as those employed for the 2006 diamond drill program.
38
COPPERNORTHMININGCORP.
| | Table 12.3 Comparison of Check Drilling to Historical Drill Intersections |
Hole
No.
| 1991 Sample Intervals | 2006 One Metre Re- Assays |
From
(m) |
To
(m) |
Length
(m) |
Oxide
Cu pct |
Total
Cu pct |
Au
ppm |
From
(m) |
To
(m) |
Length
(m) |
Oxide
Cu pct | Total
Cu
pct |
Au
ppm |
1-22-91
1-27-91
1-28-91
1-32-91
1-35-91
1-38-91
1-50-91
1-56-91
1-57-91
1-58-91 | 38.40
34.75
23.77
50.90
77.42
117.81
64.53
54.86
79.25
88.39 | 42.06
37.80
26.82
53.95
80.47
119.18
67.00
57.91
81.69
91.44 | 3.66
3.05
3.05
3.05
3.05
1.37
2.47
3.05
2.44
3.05 | 0.77
2.95
1.61
1.81
1.82
1.12
0.90
1.86
1.20
0.18 | 1.60
3.11
1.72
2.02
1.96
1.20
1.00
1.90
1.33
0.19 | 1.10
0.34
0.41
0.07
0.27
0.55
0.07
0.45
3.63
0.00 | 39.92
36.88
24.68
51.81
77.41
118.56
64.31
54.86
78.94
88.39 | 40.84
37.79
25.60
52.70
78.33
119.48
65.22
55.77
79.85
89.30 | 0.92
0.91
0.92
0.89
0.92
0.92
0.91
0.91
0.91
0.91 | 0.51
2.43
3.00
2.93
3.14
0.93
0.90
1.28
0.81
0.37 | 1.32
2.80
3.34
3.25
3.54
1.04
1.14
1.39
1.03
0.42 | 0.748
0.289
1.925
0.250
0.296
0.399
0.454
0.944
0.181
0.013 |
| Average | | | 1.42 | 1.60 | 0.689 | | | | 1.63 | 1.93 | 0.550 |
It was not possible to sample exactly the same intervals of drill core as were sampled in 1991; nonetheless, the results are consistent with the previous sampling. On average, the new assay values are close to, and in most cases are higher than, the historic values. In fact, the average values of the re-assays are substantially higher than the historic assay results.
In 2007, Dr. Arseneau collected three representative samples from surface trenches. The samples contain visible copper oxide mineralization and appeared representative of the oxide mineralization of Zone 1 oxide at Carmacks. Results of the samples collected are shown in Table 12.4.
| | Table 12.4 Assay results of Representative Samples of No. 1 Zone |
| Sample No | Description | Total Cu % |
| C048024 | Trench 1 grab sample | 2.09 |
| C048025 | Trench 1 grab sample | 1.08 |
| C048026 | Trench 1 grab sample | 2.16 |
These samples were assayed by ICP at ALS Chemex in North Vancouver. The purpose of the sample was to demonstrate that copper mineralization was present on the property in the range of values that had been previously reported by past exploration programs.
The sample standards submitted with each batch of samples to each of the analytical labs for the 2007 program returned results that are considered consistent. The greatest variability occurred with the gold and copper values in the high grade standard, which can be expected due to the potential for the nugget effect from such a high grade sample. These results are considered acceptable. Table 12.5 lists the statistical results from the standards analyses from both Chemex and Acme:
39
COPPERNORTHMININGCORP.
| | Table 12.5 2007 standard samples analytical statistics. |
| AGL-1 (high grade Cu) | AGL-2 (moderate grade Cu) | AGL-3 (blank) |
Au
(ppm) |
Non Sul.
Cu (%) | Total
Cu
(%) |
Au
(ppm) |
Non Sul.
Cu (%) |
Total
Cu (%) |
Au
(ppm) |
Non Sul.
Cu (%) | Total
Cu
(%) |
Certification
value |
0.60 |
1.616 |
1.713 |
0.45 |
0.885 |
0.913 |
0.05 |
0.04 |
0.05 |
| Maximum | 0.713 | 1.711 | 1.96 | 0.495 | 0.935 | 0.98 | 0.021 | 0.025 | 0.02 |
| Minimum | 0.531 | 1.430 | 1.64 | 0.391 | 0.754 | 0.82 | 0.004 | 0.006 | 0.01 |
Standard
Deviation |
0.041 |
0.061 |
0.06 |
0.020 |
0.039 |
0.03 |
0.003 |
0.003 |
0.00 |
The duplicate samples submitted in 2007 returned generally acceptable values. Figures 12.1 to 12.6 show the results of the comparisons between original samples and duplicate samples, submitted to ALS Chemex and between original samples submitted to ALS Chemex and duplicate samples submitted to ACME for gold, non-sulphide copper and total copper analyses:
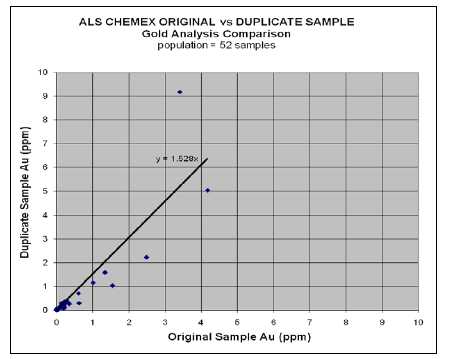
Figure 12.1 ALS Chemex Original vs Duplicate Sample Gold Analysis Comparison
40
COPPERNORTHMININGCORP.
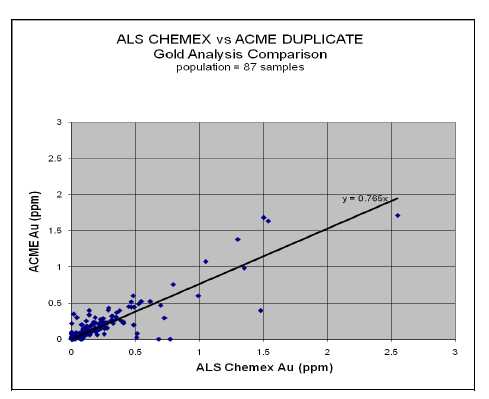
Figure 12.2 ALS Chemex Original vs Acme Duplicate Gold Analysis Comparison.
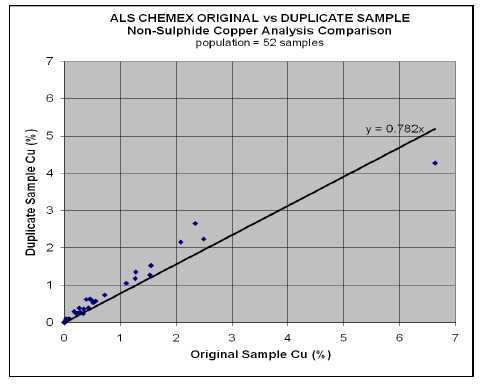
Figure 12.3 ALS Chemex Original vs Duplicate Non-Sulphide Copper Analysis Comparison
41
COPPERNORTHMININGCORP.

Figure 12.4 ALS Chemex Original vs Acme Duplicate Non-Sulphide Copper Analysis Comparison
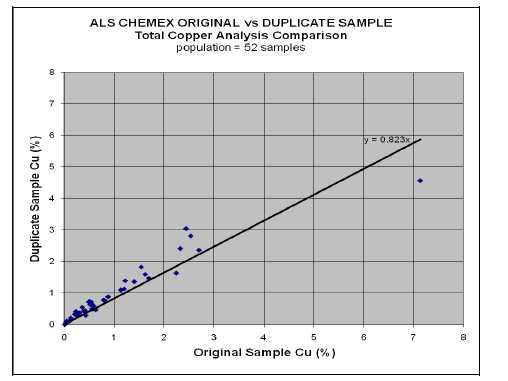
Figure 12.5 ALS Chemex Original vs Duplicate Total Copper Analysis Comparison
42
COPPERNORTHMININGCORP.

Figure 12.6 ALS Chemex Original vs Acme Duplicate Total Copper Analysis Comparison
The greatest variability is seen in the gold analyses, which can be expected due to the coasre free-gold that has been observed from petrographic work on the core and due to the nugget effect of gold. The copper analyses show acceptable correlation.
43
COPPERNORTHMININGCORP.
| 13.0 | MINERAL PROCESSING ANDMETALLURGICALTESTING |
A series of metallurgical tests have been carried out on representative mineralized material from the Carmacks property beginning in 1971 and continuing, intermittently, to the present. The testing programs focused mainly on the recovery of acid soluble copper mineralization in the oxide cap of the No. 1 Zone as summarized in Table 13.1.
Table 13.1 Summary of Metallurgical Testing on the No. 1 Zone
Test
Date |
Company |
Test By | Ore Classification,
Sample or
Composite
Description |
Test Type |
| 9/1971 | Treadwell Corp. | Goodwin, J | Unknown | B. Roll |
| 10/1989 | Coastech Research | Lawrence, R | Unknown | Reactor & column |
| 6/1990 | BD&A | Unkown | Ore Composite | B. Roll |
| 5/1992 | BD&A | Beattie, M | Drill Core Composite | B. Roll |
| 6/1992 | Lakefield | Webster, S. | Drill Core Composite | B. Roll |
| 4/1994 | Brown & Root, Inc. | Schlitt, W.J. | Ore Composite | Crib |
| 5/1994 | Beattie Consulting, PRA | Beattie, M | Unknown | Column |
| 2/1/1996 | Beattie Consulting, PRA | Beattie, M | Drill Core Composite | Column |
| 2/1/2001 | Beattie Consulting, PRA | Beattie, M | Ore Composite | Column |
| 4/20/2005 | Westcoast Biotech | Bruynesteyn, A. | Ore Composite | Column |
| 3/1/2006 | Westcoast Biotech | Bruynesteyn, A. | Ore Composite | Column |
Tests carried out by Beattie Consulting PRA (Beattie) between 1996 and 2001 closely mimic the conditions being considered commercially. These use samples crushed to -20 mm and agglomerated; columns were greater than 5 m in height, and the columns were irrigated with solution at a pH of 1-1.5 for 160-190 days.
Copper extraction for all of these tests exceeded 80%, and columns that were leached for longer periods of time reached 85% or greater. As well, 80% recovery with 85% recovery after an extended leach time was observed in several other tests. The 1990 composite columns both achieved greater than 85% copper extraction. Bottle rolls on assay rejects performed by Beattie in 1992 all achieved greater than 85% extraction except for the lower grade (<0.5% copper).
44
COPPERNORTHMININGCORP.
The best indication of copper recovery for the resource comes from sequential leaching tests run by PRA Labs in 2007. The sequential leaching results were reduced to the following equations:
If Cu(oxide)/Cu(total) > 0.79, Leachable Copper = 85%
If Cu(oxide)/Cu(total) < 0.79, Leachable Copper = 95% x Cu(oxide)/Cu(total) + 10%
The acid consumption rates calculated during the sequential leaching tests indicated average acid consumption of 25 kilograms per tonne (kg/t). These tests were performed on pulverized samples; the actual acid consumption from this material at the planned coarser crush size would be expected to be lower.
The test results indicate that acid consumption during leaching of the Carmacks Copper ore increases with the level of acid addition and with a decrease in particle size for the various ore types. Excess acid provided is readily consumed by the constituents of the rock.
The multi-element analysis of drill core samples has returned results that indicate the deposit does not contain any deleterious elements that could have significant effect on potential economic extraction.
45
COPPERNORTHMININGCORP.
| 14.0 | MINERALRESOURCEESTIMATE |
The current resource estimate for the Carmacks Deposit was prepared in 2007 by Mr. Michael Waldegger and Dr. Gilles Arseneau, employees of Wardrop at the time. A summary of the estimate can found in the report, “Resource Estimate of the No. 1, No. 4 and No. 7 Zones, Carmacks Deposit, Yukon Territory” filed on SEDAR on behalf of Western Copper. Mineral resources were estimated for Zones No. 1, No. 4, and No. 7 with the use of 3D geological modelling software, GEMS Version 6.1.2, provided by Gemcom. Resources were estimated under the supervision of Dr. Gilles Arseneau (P.Geo.). Scott Casselman (P.Geo.), Project Geologist from Aurora, provided the geological interpretation and database.
| 14.1 | EXPLORATION DATA ANALYSIS |
The data received included files with surveyed drill hole collar locations for all drill holes, down hole survey data, assay data, and specific gravity data. A cross-sectional geological interpretation of the zones on north east sections spaced 100 feet apart was received. Each dataset was formatted and imported into GEMS.
A review of the assay data concluded that there were no appreciable differences between the historical (pre-2006) and the recent (2006-2007) drill hole assay populations. The two sample populations were separated and analyzed to determine any statistical variances (Table 14.1 and Table 14.2) . The two populations were ranked separately and plotted against each other on a Quantile-Quantile (QQ) plot (Figure 14.1) . The points lie very close to the one to one line indicating no apparent bias present.
Note in tables 14.1 to 14.4, CUX refers to the percentage of copper assayed as acid soluble copper (commonly referred to as oxide copper).
46
COPPERNORTHMININGCORP.
Table 14.1 Descriptive Statistics of Assay Data in Zone No. 1 Oxide - Historical Drilling
| Historical Assays | LENGTH | CU | CUX | AU | AG |
| Valid cases | 673 | 673 | 673 | 673 | 673 |
| Mean | 2.266 | 1.16 | 0.98 | 0.557 | 5.009 |
| Std. error of mean | 0.035 | 0.04 | 0.03 | 0.042 | 0.247 |
| Variance | 0.840 | 0.92 | 0.70 | 1.203 | 41.208 |
| Std. Deviation | 0.916 | 0.96 | 0.83 | 1.097 | 6.419 |
| Skew | -0.41 | 1.98 | 1.88 | 9.62 | 3.14 |
| Kurtosis | -1.10 | 6.05 | 4.88 | 130.16 | 14.15 |
| Minimum | 0.18 | 0 | 0 | 0 | 0 |
| 25th percentile | 1.52 | 0.47 | 0.40 | 0.137 | 1.029 |
| Median | 2.56 | 0.93 | 0.77 | 0.274 | 3.086 |
| 75th percentile | 3.05 | 1.55 | 1.28 | 0.651 | 5.829 |
| Maximum | 4.27 | 7.07 | 5.70 | 17.143 | 59.200 |
Table 14.2 Descriptive Statistics of Assay Data in Zone No. 1 Oxide - Recent Drilling
| Recent Assays | LENGTH | CU | CUX | AU | AG |
| Valid cases | 1357 | 1357 | 1357 | 1357 | 1357 |
| Mean | 0.996 | 1.23 | 0.96 | 0.603 | 6.358 |
| Std. error of mean | 0.002 | 0.03 | 0.02 | 0.025 | 0.222 |
| Variance | 0.007 | 1.22 | 0.72 | 0.847 | 66.942 |
| Std. Deviation | 0.085 | 1.11 | 0.85 | 0.920 | 8.182 |
| Skew | 1.81 | 2.98 | 2.74 | 3.73 | 2.86 |
| Kurtosis | 76.25 | 14.37 | 12.16 | 20.11 | 10.32 |
| Minimum | 0.32 | 0.005 | 0.0005 | 0.0025 | 0.25 |
| 25th percentile | 1.00 | 0.55 | 0.42 | 0.131 | 1.600 |
| Median | 1.00 | 0.93 | 0.73 | 0.283 | 3.500 |
| 75th percentile | 1.00 | 1.59 | 1.25 | 0.662 | 7.400 |
| Maximum | 2.00 | 10.95 | 7.82 | 10.000 | 60.000 |
47
COPPERNORTHMININGCORP.
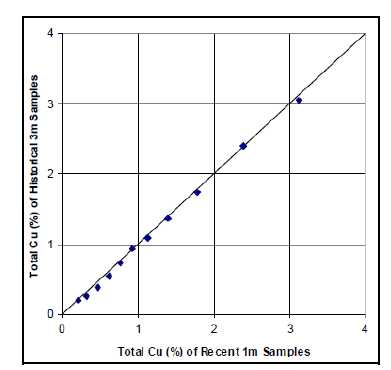
Figure 14.1 QQ Plot of Historical 3 m sample Grades vs. Recent 1 m Sample Grades for Zone No. 1 Oxide
Grade capping was considered and evaluated by examining the cumulative frequency distribution and histograms for copper oxide and total copper. Dr. Arseneau decided not to apply grade capping to the assay data because the assay data were observed to be log normal distributed and did not appear to reflect multiple populations or contain significant high-grade outliers.
Assays were composited to a fixed length of five metres, within the wireframes representing the mineralized zones. Composites were generated starting from the toe of the drill hole upwards and incorporated all assay data. Composite lengths were interrupted at geological contacts. A total of 920 composites for all zones modelled, were generated within the wireframes representing the mineralized zones (Table 14.3) . A total of 134 composites were less than 5 m in length. Composites that were less than 2.5 m in length were incorporated in to their neighbouring composites creating 62 composites between 5 m and 7.5 m in length. A total of 72 composites greater than 2.5 m and less than 5 m were used as is. One composite less than 2.5 m was used as it is in an area of very thin mineralization. A total of 3094 composites were generated within the surrounding country rock in the same manner as described above. These composites were used to estimate a grade of mineralized material immediately outside of the wireframes (‘seepage zones’ of mineralized gneiss and granodiorite) (Table 14.4) .
48
COPPERNORTHMININGCORP.
Table 14.3 Descriptive Statistics of Composites within all Mineralized Zones
| | LENGTH | CU | CUX | AU | AG |
| Valid cases | 920 | 920 | 920 | 920 | 920 |
| Mean | 4.984 | 1.00 | 0.71 | 0.441 | 4.506 |
| Std. error of mean | 0.019 | 0.02 | 0.02 | 0.019 | 0.164 |
| Variance | 0.320 | 0.51 | 0.43 | 0.338 | 24.643 |
| Std. Deviation | 0.566 | 0.72 | 0.66 | 0.582 | 4.964 |
| Skew | -0.59 | 1.72 | 1.53 | 3.49 | 2.61 |
| Kurtosis | 10.14 | 4.96 | 3.98 | 18.02 | 8.46 |
| Minimum | 1.00 | 0 | 0 | 0 | 0 |
| 25th percentile | 5.00 | 0.50 | 0.20 | 0.137 | 1.681 |
| Median | 5.00 | 0.83 | 0.57 | 0.249 | 3.008 |
| 75th percentile | 5.00 | 1.34 | 1.04 | 0.474 | 5.338 |
| Maximum | 7.38 | 5.51 | 4.73 | 5.701 | 36.991 |
49
COPPERNORTHMININGCORP.
Table 14.4 Descriptive Statistics of Composites within Granodiorite
| | LENGTH | CU | CUX | AU | AG |
| Valid cases | 3094 | 3094 | 3094 | 3094 | 3094 |
| Mean | 4.984 | 0.01 | 0.01 | 0.003 | 0.085 |
| Std. error of mean | 0.008 | 0.00 | 0.00 | 0.000 | 0.007 |
| Variance | 0.176 | 0.00 | 0.00 | 0.000 | 0.169 |
| Std. Deviation | 0.419 | 0.06 | 0.03 | 0.018 | 0.411 |
| Skew | -1.23 | 15.63 | 7.50 | 10.82 | 13.94 |
| Kurtosis | 24.00 | 433.66 | 69.60 | 165.78 | 286.80 |
| Minimum | 1.21 | 0 | 0 | 0 | 0 |
| 25th percentile | 5.00 | 0.00 | 0.00 | 0.000 | 0.000 |
| Median | 5.00 | 0.00 | 0.00 | 0.000 | 0.000 |
| 75th percentile | 5.00 | 0.00 | 0.00 | 0.000 | 0.000 |
| Maximum | 7.62 | 2.11 | 0.49 | 0.426 | 10.910 |
In 1991, specific gravities were estimated by Chemex on 21 drill core samples. Granodiorite comprised five samples, pegmatite two samples, and gneiss 14 samples.
The specific gravity of granodiorite samples surrounding the mineralization ranged between 2.69 to 2.71 for an average of 2.70. The specific gravity of gneissic material hosting the mineralization ranged from 2.59 to 2.97 although only one sample was greater than 2.73.
In 2006 and 2007, specific gravity was measured by Aurora in the field on 1,358 drill core samples. An average specific gravity of 2.64 was determined for samples collected within the Zone No. 1 Oxide zone, and 2.75 within the Zone No. 1 Sulphide zone (Table 14.5 and Figure 14.2) ..
50
COPPERNORTHMININGCORP.
Table 14.5 Descriptive Statistics of Specific Gravity Data
| Zone No. 1
Oxide | Zone No. 4
Oxide | Zone No. 7
Oxide | Zone No. 1
Sulphide |
Granodiorite |
| Valid cases | 132 | 50 | 22 | 59 | 1095 |
| Mean | 2.643 | 2.646 | 2.663 | 2.749 | 2.661 |
| Std. error of mean | 0.009 | 0.010 | 0.016 | 0.014 | 0.003 |
| Variance | 0.010 | 0.005 | 0.005 | 0.012 | |
| Std. Deviation | 0.100 | 0.068 | 0.074 | 0.110 | 0.088 |
| Skew | -0.44 | -0.05 | 0.58 | -1.08 | -1.38 |
| Kurtosis | 2.99 | 0.20 | -0.37 | 2.28 | 16.27 |
| Minimum | 2.24 | 2.48 | 2.55 | 2.37 | 1.80 |
| 25th percentile | 2.60 | 2.60 | 2.60 | 2.69 | 2.62 |
| Median | 2.64 | 2.65 | 2.66 | 2.76 | 2.66 |
| 75th percentile | 2.70 | 2.70 | 2.70 | 2.82 | 2.70 |
| Maximum | 2.93 | 2.83 | 2.82 | 2.95 | 3.08 |

Figure 14.2 Box and Whisker Plot of Specific Gravity by Zone
Note: Z1S = Zone 1 Sulphide; Z1X = Zone 1 Oxide; Z4X = Zone 4 Oxide; Z7X = Zone 7 Oxide
51
COPPERNORTHMININGCORP.
| 14.6 | GEOLOGICAL INTERPRETATION |
Three mineralized zones (Zone No. 1, No. 4, and No. 7) were interpreted on the basis of total copper grade and geological cross-sections prepared by Aurora. Polylines representing a 0.2% total copper cut-off were generated on northeast sections spaced at 100 foot intervals. The polylines honoured the drill hole intersections in 3D. Wireframes were created from the lines and then clipped against the overburden-bedrock surface.
A surface representing the boundary between the upper oxide and lower sulphide mineralization was interpolated based on drill hole intersections. The transition between oxide and sulphide mineralization occurs over several metres. The actual transition was positioned along each drill hole where the proportion of oxide copper to total copper dropped below 20%. A 3D surface was then generated by connecting all drill hole points to form the oxide-sulphide interface (Figure 14.3) .
The No. 1 Zone wireframe was then clipped above and below the oxide boundary to create final oxide and sulphide wireframes. Zones No. 4 and No. 7 were interpreted to be all oxide mineralization (Figure 14.4) .
52
COPPERNORTHMININGCORP.
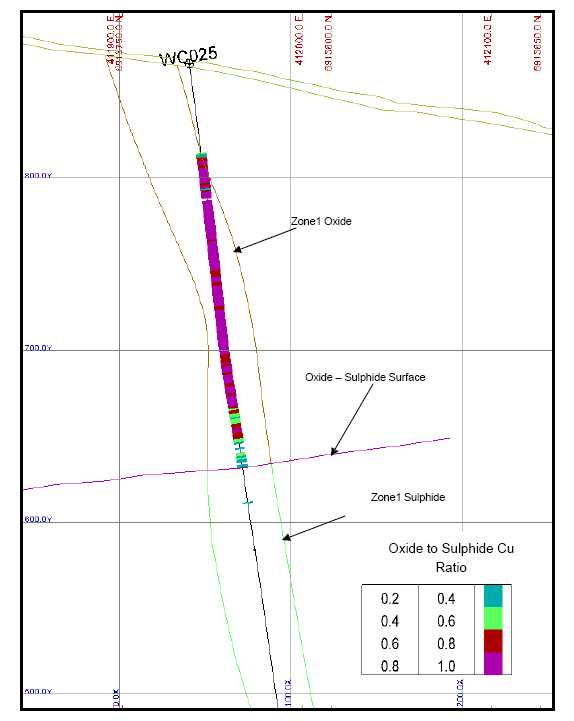
Figure 14.3 Cross Section (1100 N) - Oxide Copper to Total Copper Proportion in Drill Hole Assays and Interpreted Oxide/Sulphide Surface
53
COPPERNORTHMININGCORP.
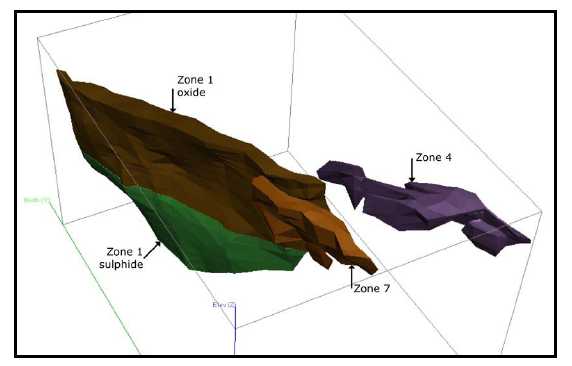
Figure 14.4 Mineralized Zones Clipped to Overburden, Viewed from Southwest
A block model was generated using the parameters outlined in Table 14.6.
Table 14.6 Block Model Parameters, UTM NAD83 Coordinates
| | Model Origin | No of Blocks | Block Size |
| Easting | 412050 | 70 columns | 5 m |
| Northing | 6913130 | 195 rows | 5 m |
| Elevation | 900 | 110 levels | 5 m |
The block model was rotated 24.2 degrees anti-clockwise around the origin, aligning it parallel to the strike of the deposit and the property exploration grid.
The block model project contains three separate folders; each folder essentially contains a separate block model. The Standard folder contains the block model grades for the mineralized zones, the Dilution folder contains the block model grades for all non-mineralized rock (i.e. waste or dilution), and the Waste folder is a system default folder that remains empty.
54
COPPERNORTHMININGCORP.
The rock type model in the standard folder was coded as described below, using the modelled wireframes, and as outlined in Table 14.7.
The rock type model was first coded with waste, rock code (99), in the following sequence:
1. All blocks in the model were initialized to air, rock code (0).
2. All blocks below the topography surface were then initialized to overburden, rock code (9).
3. All blocks below the overburden-bedrock surface were then initialized to waste.
The rock type model in the Standard folder was then updated from the wireframes representing the mineralized zone. An accuracy level of nine needles per block oriented horizontally along rows was uses to update the rock type model. Any block that was more than 0.001% by volume within the wireframe was re-code as being part of the mineralized zone according to the wireframe rock code.
Table 14.7 Block Model Rock Codes
Rock Type | Block Model
Code |
| Air | 0 |
| Overburden | 9 |
| Waste | 99 |
| Zone 1 Oxide | 101 |
| Zone 4 Oxide | 104 |
| Zone 7 Oxide | 107 |
| Zone 7 Sulphide | 207 |
55
COPPERNORTHMININGCORP.
A percent model was generated in the standard folder and updated from the wireframes. The Percent Model represents the volume or the mineralized zones (oxide and sulphide combined) contained within any given block. An accuracy level of nine needles per block oriented horizontally along rows was used to generate the Percent Model.
The percent model can be used to weight the volume of each block during resource reporting in order to estimate an accurate tonnage from the model.
Density was interpolated into blocks in two passes using isotropic inverse distance weighted to the second power. Interpolation occurred in two passes with sample support summarized in Table 14.8.
Table 14.8 Interpolation Parameters for Density Model
Pass | Axes
Rotation | Ranges
(m) | Occurrence
per Hole | Minimum
Samples | Maximum
Samples |
1
| Z=0
X=70
Z=0 | X=50
Y=50
Z=50 | Not limited
| 3
| 8
|
2
| Z=0
X=70
Z=0 | X=20
Y=20
Z=20 | Not limited
| 1
| 8
|
After the estimation process, any mineralized blocks that had a specific gravity value less than 2.5 were re-initialized to an average value based on their rock type as summarized in Table 14.9.
Table 14.9 Density by Rock Type
| Rock Type | Density |
| Zone 1 Oxide | 2.64 |
| Zone 4 Oxide | 2.64 |
| Zone 7 Oxide | 2.64 |
| Zone 1 Sulphide | 2.75 |
56
COPPERNORTHMININGCORP.
Geostatisticians use a variety of tools to describe the pattern of spatial continuity, or strength of the spatial similarity of a variable with separation distance and direction. The correlogram measures the correlation between data values as a function of their separation distance and direction. The distance at which the correlogram reaches the maximum variance is called the "range of correlation" or simply the range. The range of the correlogram corresponds roughly to the more qualitative notion of the "range of influence" of a sample; it is the distance over which sample values show some persistence or covariance Using Sage 2001 software, variography was completed for Zone No. 1 at Carmacks. Directional sample correlograms were calculated along horizontal azimuths of 0, 30, 60, 90, 120, 150, 180, 210, 240, 270, 300, and 330 degrees. For each azimuth, sample correlograms were also calculated at dips of 30 and 60 degrees in addition to horizontally. Lastly, a correlogram was calculated in the vertical direction. Using the 24 correlograms, an algorithm determined the best-fit model. This model is described by the nugget (C0), two nested structure variance contributions (C1, C2), ranges for the variance contributions and the model type (spherical or exponential). After fitting the variance parameters, the algorithm then fits an ellipsoid to the 48 ranges from the directional models for each structure. The final models of anisotropy are given by the lengths and orientations of the axes of the ellipsoids.
Results of the variography on the entire sample population of Total Cu composites were mixed because the sample density was too low for Zone No. 1 Sulphide so variography was completed using only Zone No. 1 Oxide composites. Correlograms were calculated for Total Cu grades in Zone No. 1 Oxide, and modelled with a nugget and two nested exponential structures. The results are summarized in Table 14.10.
Rotation angles were set to correspond to the software’s rotational convention, which follows the right hand rule with rotation about Z-axis being positive when X moves towards the Y-axis; rotation about the Y-axis is positive when Z moves towards the X-axis.
Grade models were interpolated for total copper, oxide copper, gold, and silver grades as described below. Sulphide copper was estimated as a function of the total copper and oxide copper contents as defined below.
57
COPPERNORTHMININGCORP.
Table 14.10 Correlogram data for Zone No. 1 Oxide
Element |
Domain | Model | Z
Rotation | Y
Rotation | Z
Rotation | Z
Range | Y
Range | X
Range |
| Cu | Zone 1 Oxide |
| | | C0=0.025 | | | | | | |
| | | C1=0.64 | -24.8 | 39 | -49 | 17.4 | 126.9 | 16.1 |
| | | C2=0.335 | -35.2 | -23 | 48 | 268.5 | 381.5 | 27.4 |
Copper grades (total copper percent and oxide copper percent) were interpolated into blocks using ordinary kriging with weighting parameters based on the exponential correlograms calculated.
Grade interpolation search ellipses were designed from the correlogram information, trend of mineralization, and sample data distribution. The grades were interpolated in two separate passes with differing sample support and search ellipses, as summarized in Table 14.11 and Table 14.12.
Table 14.11 Sample Selection Criteria for Grade Interpolation
Rock Code | Coded Composites used for
Grade Interpolation |
Domain |
| 101 | 101 | Zone 1 Oxide |
| 104 | 104, 101 | Zone 4 Oxide |
| 107 | 107, 101 | Zone 7 Oxide |
| 201 | 201 | Zone 1 Sulphide |
| 99 | 99 | Waste |
Table 14.12 Copper Grade Interpolation Parameters
Pass | Axes
Rotation | Ranges
(m) | Occurrence
per hole | Minimum
Samples | Maximum
Samples |
1
| Z=0
X=70
Z=0 | X=100
Y=100
Z=15 | 1
| 3
| 10
|
2
| Z=0
X=70
Z=0 | X=150
Y=150
Z=50 | 1
| 2
| 12
|
Grades were only interpolated in the first pass if at least three samples, no more than one sample per hole, were found within the search ellipse and no more than ten samples were used to interpolate grade within a block. The second pass only estimated grades in blocks that were un-assigned during pass one.
58
COPPERNORTHMININGCORP.
Blocks were assigned a grade in pass two if at least two samples, no more than one per hole, were found within the search radius and no more than twelve samples were used to interpolate grade in a block. Sample selections for grade interpolations were restricted by geological zones as indicated in Table 14.11. All drill holes used in the estimation are listed in Appendix A along with the down hole intervals representing the mineralized units.
| 14.11.2 | SULPHIDECOPPERPER CENTCALCU L AT I ON |
Sulphide copper grades were calculated using a simple manipulation of the block model parameters according to the following formula:
Cu Sulphide% = Cu Total% – Cu Oxide%
As a result of the block model estimation, approximately 6500 blocks had slightly higher oxide copper values than total copper grades values resulting in a negative copper sulphide grade after running the simple manipulation. The blocks with negative sulphide copper grades were selected and the oxide copper grade was set to the total copper grade and the sulphide copper grade was reset to 0.0% .
| 14.11.3 | GOLD ANDSILVERGRADES |
Gold and silver grades were interpolated into blocks using isotropic inverse distance weighted to the second power.
Gold and silver grades were interpolated using the same parameters as for the pass two copper search ellipse. The grades were interpolated in one pass with sample support summarized in Table 14.11 and search ellipse as summarized below in Table 14.13.
Table 14.13 Grade Interpolation Parameters for Gold and Silver
Axes
Rotation | Ranges
(m) | Occurrence
per hole | Minimum
Samples | Maximum
Samples |
Z=0
X=70
Z=0 | X=150
Y=150
Z=50 |
1
|
3
|
8
|
59
COPPERNORTHMININGCORP.
| 14.12 | MINERAL RESOURCE ESTIMATION |
Mineral resources were classified in accordance with definitions provided by CIM as stipulated in NI 43-101. The Carmacks Copper mineral resources are classified as Measured, Indicated, and Inferred.
The Carmacks block model contains 78,636 partial blocks coded as Zone No. 1, 4 and 7. There are 17,983 blocks classified as Measured, 43,955 as Indicated, and 16,698 as Inferred. There were no blocks within the mineralized units left unassigned (Figure 14.5) .
The classification model was based on the average distance of the samples used to interpolate grade within a block. For classification purpose only, both holes in the sulphide and oxide mineralization were used to estimate the average distance of points used. All blocks that were interpolated during pass one and had an average distance of samples used less than 50 m were assigned to the Measured category. Blocks interpolated with an average distance of points used greater than 50 m were assigned to the Indicated category. Blocks that had not been interpolated during pass one were assigned to the Inferred category.
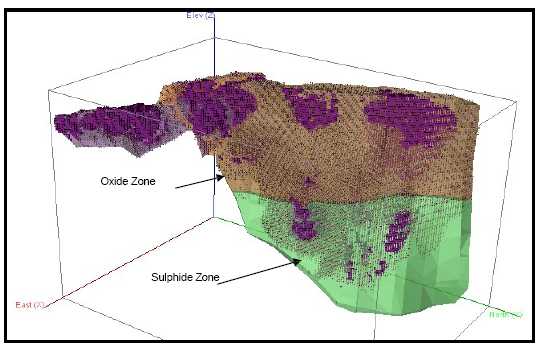
Figure 14.5 Three Dimensional Representation of Block Model Classification
Note: Magenta colour blocks are Measured mineral resource and the smaller grey blocks are Indicated mineral resource.
60
COPPERNORTHMININGCORP.
| 14.13 | MINERAL RESOURCE TABULATION |
Dr. Arseneau estimated that the combined Zones 1, 4 and 7 contained approximately 12 million tonnes of oxide resource in the Measured plus Indicated categories grading 1.07 TCu, 0.86 CuX, 0.21% CuS, 0.46 g/t Au, and 4.58 g/t Ag at a 0.25% total copper (TCu) cut-off grade (Table 14.14) .
Zone 1 also contained an additional 4.3 million tonnes of sulphide resource in the Measured plus Indicated categories grading 0.75% TCu, 0.03% CuX, 0.73% CuS, 0.22 g/t Au, and 2.37 g/t Ag.
In addition to the measured and indicted resource, the deposit contains 90,000 tonnes of oxide inferred resource grading 0.73% TCu, 0.53% CuX, 0.20 CuS, 0.12 g/t Au and 1.8 g/t Ag and 4 million tonnes of sulphide inferred resources grading 0.71 TCu, 0.01 CuX, 0.70 CuS, 0.18 g/t Au and 1.9 g/t Ag.
Note, in tables 14.14 and 14.15, TCu refers to total copper, CuX refers to oxide copper, and CuS refers to sulphide copper.
Table 14.14 Mineral Resources at 0.25% Total Copper cut-off
Zone
| Class
| Tonnage t
(000) | TCu
(%) | CuX
(%) | CuS
(%) | Au
(g/t) | Ag
(g/t) |
Z1
Oxide
| Measured (ME)
Indicated (IN)
ME+IN
Inferred | 2,985
7,058
10,043
64 | 1.25
1.07
1.13
0.84 | 1.02
0.86
0.91
0.62 | 0.23
0.21
0.22
0.22 | 0.696
0.405
0.492
0.122 | 6.514
4.094
4.813
1.793 |
Z4
Oxide
| Measured (ME)
Indicated (IN)
ME+IN
Inferred | 614
257
871
23 | 0.48
0.51
0.50
0.41 | 0.37
0.35
0.36
0.25 | 0.11
0.16
0.15
0.16 | 0.211
0.184
0.192
0.139 | 2.414
2.230
2.285
1.871 |
Z7
Oxide
| Measured (ME)
Indicated (IN)
ME+IN
Inferred | 432
634
1,066
3 | 0.97
0.90
0.92
0.81 | 0.82
0.74
0.76
0.64 | 0.15
0.16
0.16
0.18 | 0.376
0.317
0.335
0.179 | 4.430
4.155
4.237
1.665 |
1+4+7
1+4+7
1+4+7
1+4+7 | Measured (ME)
Indicated (IN)
ME+IN
Inferred | 4,031
7,949
11,980
90 | 1.10
1.04
1.07
0.73 | 0.90
0.83
0.86
0.53 | 0.20
0.20
0.21
0.20 | 0.588
0.391
0.456
0.128 | 5.666
4.039
4.578
1.809 |
Z1
Sulphide
| Measured (ME)
Indicated (IN)
ME+IN
Inferred | 695
3,645
4,340
4,031 | 0.80
0.74
0.75
0.71 | 0.02
0.03
0.03
0.01 | 0.77
0.71
0.73
0.70 | 0.261
0.205
0.221
0.179 | 2.542
2.296
2.369
1.900 |
The mineral resources were also estimated the mineral resources the 3D wireframes of the mineralized zones using a 0.50% cut-off (Table 14.15) .
61
COPPERNORTHMININGCORP.
Table 14.15 Mineral Resources at 0.50% Total Copper cut-off
Zone
| Class
| Tonnage t
(000) | TCu
(%) | CuX
(%) | CuS
(%) | Au
(g/t) | Ag
(g/t) |
Z1
Oxide
| Measured (ME)
Indicated (IN)
ME+IN
Inferred | 2,827
6,767
9,594
63 | 1.30
1.10
1.16
0.85 | 1.06
0.89
0.94
0.63 | 0.24
0.21
0.22
0.22 | 0.726
0.416
0.507
0.123 | 6.787
4.202
4.963
1.817 |
Z4
Oxide
| Measured (ME)
Indicated (IN)
ME+IN
Inferred | 252
116
368
4 | 0.63
0.69
0.67
0.60 | 0.48
0.47
0.47
0.39 | 0.15
0.22
0.20
0.21 | 0.274
0.238
0.249
0.190 | 3.001
2.838
2.886
2.796 |
Z7
Oxide
| Measured (ME)
Indicated (IN)
ME+IN
Inferred | 405
623
1,028
3 | 1.00
0.91
0.94
0.81 | 0.85
0.74
0.77
0.64 | 0.16
0.17
0.16
0.18 | 0.390
0.321
0.341
0.179 | 4.607
4.203
4.322
1.665 |
Z1
Sulphide
| Measured (ME)
Indicated (IN)
ME+IN
Inferred | 608
2,917
3,525
3,082 | 0.85
0.82
0.83
0.81 | 0.02
0.03
0.03
0.02 | 0.83
0.78
0.80
0.80 | 0.277
0.222
0.238
0.216 | 2.607
2.442
2.491
2.291 |
On May 10, 2010 Western Copper was notified that their Water Licence had been denied. The Water Board indicated a number of deficiencies and concerns in the application, which the company is currently working to address.
Copper North will need to place environmental reclamation bonding to cover future and current potential environmental liabilities that at this time would consist of re-contouring and re-vegetating the camp areas and any old exploration trenches that remain intact.
The authors are not aware of any existing environmental, legal, title, taxation, socio-economic, marketing or political factors that may adversely affect the mineral resource estimates.
| 14.14 | BLOCK MODEL VALIDATION |
The block model was validated through a detailed visual validation on section and plan views. The model was checked for proper coding of drill hole intervals and block model cells. Coding was found to be properly done. Grade interpolation was examined relative to drill hole composite values by inspecting sections and plans. The checks showed good agreement between drill hole composite values and model cell values (Figure 14.6) .
62
COPPERNORTHMININGCORP.

Figure 14.6 Cross Section (1700 N) with Drill Hole Composites Showing Total Cu and Interpolated Block Model Grades
63
COPPERNORTHMININGCORP.
BC Gold has claims immediately north, south and east of the Carmacks Copper Property. Based on news releases obtained from BC Gold’s website, in 2007 and 2008, they reported that they conducted exploration programs consisting of airborne geophysical surveying, mobile metal ion soil geochemical sampling (MMI sampling), prospecting, geological mapping and 1,360 m of diamond drilling in 7 holes and in 2008 drilled a further 5 holes for 1,235 m. The most significant results included 4.69 m grading 0.46% copper in hole ICE 07-02, 5.47 m grading 0.39% copper in hole ICD07-04 and 63.1 m grading 0.17% copper in hole WS08-08.
These results are not verifiable by the author and they are not necessarily indicative of mineralization on the Carmacks Copper Property.
64
COPPERNORTHMININGCORP.
| 16.0 | OTHER RELEVANTDATAANDINFORMATION |
There is no other relevant data or information available that has not been included in this report.
65
COPPERNORTHMININGCORP.
| 17.0 | INTERPRETATIONANDCONCLUSIONS |
Work carried out in 2007 concluded that both the historical and current drilling databases were of sufficient quality for the purpose of resource estimation. The Carmacks Deposit is sufficiently defined for the estimation of Measured, Indicated, and Inferred mineral resources.
At a 0.25% total copper cut-off, the Carmacks deposit contains 12 million tonnes of oxide resource in the Measured plus Indicated categories grading 1.07 Cu, 0.86 CuX (oxide copper), 0.21% CuS (sulphide copper), 0.46 g/t Au, and 4.58 g/t Ag at a 0.25% total copper (TCu) cut-off grade.
Zone 1 also contained an additional 4.3 million tonnes of sulphide resource in the Measured plus Indicated categories grading 0.75% Cu, 0.03% CuX (oxide copper), 0.73% CuS (sulphide copper), 0.22 g/t Au, and 2.37 g/t Ag.
In addition to the measured and indicted resource, the deposit contains 90,000 tonnes of oxide inferred resource grading 0.73% Cu, 0.53% CuX (oxide copper), 0.20 CuS (sulphide copper), 0.12 g/t Au and 1.8 g/t Ag and 4 million tonnes of sulphide inferred resources grading 0.71 Cu, 0.01 CuX (oxide copper), 0.70 CuS (sulphide copper), 0.18 g/t Au and 1.9 g/t Ag.
66
COPPERNORTHMININGCORP.
Copper North is currently studying alternative heap leach designs to resolve the Water Licence issues, including modifications to the plant design. These may require additional geotechnical investigations to support the design change and an updated capital cost estimate for the project.
Exploration potential for oxide copper and sulphide resources exists in the Zone 2, 12, 13 and 14 areas. Additional drilling will be required to define these zones. Drilling to test and define these areas is estimated at 5,000 to 15,000 m.
The Phase 1 budget estimate for the alternative heap leach and plant design, geotechnical investigation and updating the feasibility study is shown in Table 25 and totals $600,000. The Phase 2 budget estimate for evaluation of the under-explored zones is $1,000,000 to $3,000,000, although the project does not require the additional zones to be economic.
Table 16: Project cost to up-date Carmacks Feasibility Study
| | | | Cost $ | |
| | | | | |
| | Complete development of alternative designs | | 50,000 | |
| | Develop design of selected alternative to Feasibility study level | | 100,000 | |
| | Goetechnical investigation to support design of selected alternative | | 100,000 | |
| | Modify plant design and impacted facilities to coordinate with selected heap leach facility design | | 20,000 | |
| | Revise and up-date Feasibility Study to reflect the above | | 75,000 | |
| | Evaluation of permitting impacts and cost related to revised design basis | | 50,000 | |
| | Up-date capital cost estimate of acid plant | | 20,000 | |
| | Owner's cost (salary, benefits, travel, etc) | | 100,000 | |
| | | | | |
| | Sub-total | | 515,000 | |
| | Contingency | | 85,000 | |
| | Total | | 600,000 | |
67
COPPERNORTHMININGCORP.
Arseneau, G. and Casselman, S, November, 2007, Resource Estimate of the No. 1, No. 4 and No. 7 zones, Carmacks Deposit, Yukon Territory.
Aurora Geoscience, January 2007, Mineral Resource Estimate for the Carmacks Copper Project, 88p.
BC Gold Corp., 2007, BC Gold Corp. website, August 13, 2011.
Beattie Consulting Ltd., 2001, Western Copper Holdings Leaching and Decommissioning of Samples from Carmacks Oxide Copper Deposit.
Bostock, H.S., 1936, Carmacks District, Yukon, G. S. C. Memoir 189.
Casselman, S., 2007, 2006 Assessment Report for the Carmacks Copper Project. Yukon Mining Recorder assessment report.
Kilborn Engineering Pacific Ltd., 1995, Carmacks Copper Project Feasibility Study.
Kilborn Engineering Pacific Ltd., 1997, Carmacks Copper Project, Basic Engineering Report and Definitive Cost Estimate.
Orequest Consultants Ltd., 2005, Technical Report on the Carmacks Copper Project, 37p.
Pearson, W. N., 1977, The Minto Copper Deposit, Yukon Territory: a metamorphosed orebody in the Yukon Crystalline Terrane. Unpublished M.Sc. thesis, Queen’s University, Kingston, Ontario, 193p.
Shives, R.B.K., Carson, J.M., Ford, K.L., Holman, P,B, and Abbott, J.G., 2002 Airborne multisensor geophysical survey, Minto, Yukon. Geological Survey of Canada, Open Files 4331 and 4332.
Sinclair, W.D., 1976, Geology and Minearl Deposit of the Minto Area, Yukon Territory, in North of 60, Mineral Industry Report 1976, Yukon Territory, EGS 1977-1, Department of Indian and Northern Affairs.
Tempelman-Kluit, D., 1981, Yukon Geology and Exploration, 1979-80, Geology Section, Dept. of Indian and Northern Affairs, Whitehorse, Y.T. p. 22, 262, 263.
68
COPPERNORTHMININGCORP.
Tempelman-Kluit, D., 1985, Geology Laberge (105 E) and Carmacks (115 I), Open File 1101, Exploration and Geological Services Division, Dept. of Indian and Northern Affairs, Whitehorse, Y.T. p. 22, 262, 263.
69
COPPERNORTHMININGCORP.
| 20.0 | CERTIFICATESOF QUALIFIEDPEOPLE |
70
COPPERNORTHMININGCORP.
I, Scott Casselman of Whitehorse Yukon, do hereby certify as author of this “2011 Qualifying Report for the Carmacks Copper Deposit, Yukon Territory”, dated 17 October, 2011, make the following statements:
I am a consulting geologist, employed by Casselman Geological Services Ltd, 33 Firth Road, Whitehorse, Yukon, Y1A 4R5.
I have a B.Sc. in Geology from the Carleton University of Ottawa, obtained in 1985.
I am a member in good standing of the Association of Professional Engineers and Geoscientists of British Columbia, License #20032.
I have practiced my profession in mineral exploration continuously since 1985. I have over twenty five years of experience in mineral exploration.
I have read the definition of “qualified person” set out in National Instrument 43- 101 (NI 43- 101) and certify that, by reason of my education, affiliation with a professional association (as defined in NI 43- 101) and past relevant work experience, I fulfill the requirements to be a “qualified person” for the purpose of NI 43-101.
I am responsible for all sections except for section 14 of the Technical Report.
I was field supervisor on this project as an independent consultant from July 10 to October 21, 2006, from February 3 to October 16, 2007 and from March 31 to May 30, 2008. I most recently visited the Carmacks property on June 29, 2011.
As of the date of this Certificate, to the best of my knowledge, information and belief, this Technical Report contains all scientific and technical information that is required to be disclosed to make the Technical Report not misleading.
I am independent of the Issuer as described in Section 1.5 NI 43-101.
I have read NI 43-101 and the Technical Report has been prepared in compliance with NI 43-101 and Form 43-101F1.
Signed and dated this 17th day of October, 2011 at Whitehorse, Yukon.
| | “signed and sealed” | |
| | Scott Casselman, P.Geo. | |
| | Geologist | |
| | Casselman Geological Services Ltd | |
71
COPPERNORTHMININGCORP.
I, Dr. Gilles Arseneau of North Vancouver, British Columbia, hereby certify as an author of this “2011 Qualifying Report for the Carmacks Copper Deposit, Yukon Territory”, dated 17 October, 2011, the following statements:
I am an independent geological consultant with a business address at 2200- 1066 West Hastings Street, Vancouver, BC, V6E 3X2.
I have a B.Sc. in Geology from the University of New Brunswick, 1979; a M.Sc. in Geology from the University of Western Ontario, 1984; and a Ph.D. in Geology from the Colorado School of Mines, 1995.
I am a member in good standing of the Association of Professional Engineers and Geoscientists of British Columbia, License #25474.
I have practiced my profession in mineral exploration continuously since graduation. I have over twenty years of experience in mineral exploration and I have over ten years of experience preparing mineral resource estimates using block-modeling software.
I have read the definition of “qualified person” set out in National Instrument 43- 101 (NI 43- 101) and certify that, by reason of my education, affiliation with a professional association (as defined in NI 43- 101) and past relevant work experience, I fulfill the requirements to be a “qualified person” for the purpose of NI 43-101.
I am responsible for section 14 of the Technical Report. I visited the Carmacks property on May 15 to 16, 2007.
I have had prior involvement with the Property that is the subject of the Technical Report in that I am an author of a technical report and mineral resource estimate prepared for the Carmacks property in 2007.
As of the date of this Certificate, to the best of my knowledge, information and belief, this Technical Report contains all scientific and technical information that is required to be disclosed to make the Technical Report not misleading.
I am independent of the Issuer as described in Section 1.5 of NI 43-101.
I have read NI 43-101 and the Technical Report has been prepared in compliance with NI 43-101 and Form 43-101F1.
Signed and dated this 17th day of October, 2011 at Vancouver, British Columbia.
“Original Document, signed and sealed by
Dr. Gilles Arseneau, P.Geo.”
72