Exhibit 99.1
| Brookfield Renewable Energy Partners L.P. | ||
| Q3 2013 INTERIM REPORT | ||
| TABLE OF CONTENTS | ||
| Letter To Shareholders | 1 | |
| Financial Review for the Three Months Ended September 30, 2013 | 9 | |
| Financial Review for the Nine Months Ended September 30, 2013 | 15 | |
| Analysis Of Consolidated Financial Statements and Other Information | 21 | |
Unaudited Interim Consolidated Financial Statements as at and for the Three and Nine Months Ended September 30, 2013 | 40 | |
OUR OPERATIONS
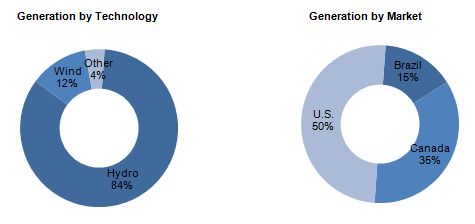
We operate our facilities through three regional operating centers in the United States, Canada and Brazil which are designed to maintain and enhance the value of our assets, while cultivating positive relations with local stakeholders. We own and manage 193 hydroelectric generating stations, 11 wind facilities, and two natural gas-fired plants. Overall, the assets we own or manage have 5,900 MW of generating capacity and annual generation of 22,200 GWh based on long-term averages. The table below outlines our portfolio as at September 30, 2013:
| River | Generating | Generating | Capacity | LTA(1)(2) | Storage | |||||||||||||||||||
| Markets | Systems | Stations | Units | (MW) | (GWh) | (GWh) | ||||||||||||||||||
| Operating Assets | ||||||||||||||||||||||||
Hydroelectric generation(3) | ||||||||||||||||||||||||
| United States | 28 | 126 | 371 | 2,696 | 9,951 | 3,582 | ||||||||||||||||||
| Canada | 18 | 32 | 72 | 1,323 | 5,062 | 1,261 | ||||||||||||||||||
| Brazil | 23 | 35 | 75 | 671 | 3,656 | N/A | ||||||||||||||||||
| 69 | 193 | 518 | 4,690 | 18,669 | 4,843 | |||||||||||||||||||
| Wind energy | ||||||||||||||||||||||||
| United States | - | 8 | 724 | 538 | 1,394 | - | ||||||||||||||||||
| Canada | - | 3 | 220 | 406 | 1,197 | - | ||||||||||||||||||
| - | 11 | 944 | 944 | 2,591 | - | |||||||||||||||||||
| Other | - | 2 | 6 | 215 | 899 | - | ||||||||||||||||||
| 69 | 206 | 1,468 | 5,849 | 22,159 | 4,843 | |||||||||||||||||||
| (1) | Long-term average (“LTA”) is calculated on an annualized basis from the beginning of the year, regardless of the acquisition or commercial operation date. |
| (2) | Brazilian hydroelectric assets benefit from a market framework which levelizes generation risk across producers. |
| (3) | Long-term average is the expected average level of generation, as obtained from the results of a simulation based on historical inflow data performed over a period of typically 30 years. In Brazil, assured generation levels are used as a proxy for long-term average. |
| The following table presents the annualized long-term average generation of our operating portfolio on a quarterly basis as at September 30, 2013: |
LTA (GWh)(1)(2) | Q1 | Q2 | Q3 | Q4 | Total | |||||||||||||||
| Operating Assets | ||||||||||||||||||||
Hydroelectric generation(3) | ||||||||||||||||||||
| United States | 2,659 | 2,829 | 2,013 | 2,450 | 9,951 | |||||||||||||||
| Canada | 1,196 | 1,461 | 1,234 | 1,171 | 5,062 | |||||||||||||||
| Brazil | 947 | 892 | 894 | 923 | 3,656 | |||||||||||||||
| 4,802 | 5,182 | 4,141 | 4,544 | 18,669 | ||||||||||||||||
| Wind energy | ||||||||||||||||||||
| United States | 311 | 468 | 341 | 274 | 1,394 | |||||||||||||||
| Canada | 324 | 292 | 238 | 343 | 1,197 | |||||||||||||||
| 635 | 760 | 579 | 617 | 2,591 | ||||||||||||||||
| Other | 222 | 218 | 240 | 219 | 899 | |||||||||||||||
| Total | 5,659 | 6,160 | 4,960 | 5,380 | 22,159 | |||||||||||||||
| (1) | Long-term average (“LTA”) is calculated on an annualized basis from the beginning of the year, regardless of the acquisition or commercial operation date. |
| (2) | Brazilian hydroelectric assets benefit from a market framework which levelizes generation risk across producers. |
| (3) | Long-term average is the expected average level of generation, as obtained from the results of a simulation based on historical inflow data performed over a period of typically 30 years. In Brazil, assured generation levels are used as a proxy for long-term average. |
Statement Regarding Forward-Looking Statements and Use of Non-IFRS Measures
This Management's Discussion and Analysis contains forward-looking information within the meaning of Canadian and U.S. securities laws. We may make such statements in this Management's Discussion and Analysis, in other filings with Canadian regulators or the U.S. Securities and Exchange Commission or in other communications - see “Cautionary Statement Regarding Forward-Looking Statements” beginning on page 38. We make use of non-IFRS measures in this Management's Discussion and Analysis - see “Cautionary Statement Regarding Use Of Non-IFRS Measures” beginning on page 39. This Management's Discussion and Analysis and additional information, including our Annual Information Form filed with securities regulators in Canada and our Form 20-F filed with the U.S. Securities and Exchange Commission, are available on our website at www.brookfieldrenewable.com, on SEDAR’s website at www.sedar.com or on EDGAR’s website at www.sec.gov.

LETTER TO SHAREHOLDERS
As we near the end of 2013, we can begin to look back on the year and be pleased with the continued success of our operating and growth plans. This month also marks two years since Brookfield Renewable was launched as a global, listed pure-play renewable power company. In that time, we have been able to expand our platform, increase cash flows and raise our distributions - all while strengthening our financial position and delivering strong returns to shareholders.
Renewable energy continues to grow around the world owing to its positive environmental attributes, supply diversification benefits, and increasing cost-competitiveness with traditional technologies. The global renewable power market is 1.5 times the size of the entire U.S. electricity market (the world’s largest) and is growing by about 100 GW or $200 billion of new supply each year.
The launch of a number of dedicated private funds and publicly-traded renewable power investment vehicles in North America and Europe is an indication of the growing attractiveness of the industry and the opportunity it presents. Brookfield Renewable is extremely well positioned within this universe by virtue of its differentiating attributes:
| · | A global mandate and scale of operations that traverses 12 power markets in 3 countries, with plans to expand into new markets; |
| · | Our track record that is among the longest and strongest of the publicly-traded pure-plays; |
| · | A unique hydroelectric focus, expertise and scale that confers a strong competitive advantage; |
| · | An operating platform that in addition to supporting our acquisition strategy, allows us to develop, build and operate high-value projects at premium returns; and |
| · | The financial strength, liquidity and proven ability to access capital in the pursuit of accretive growth opportunities. |
| Brookfield Renewable Energy Partners L.P | Q3 2013 Interim Report | September 30, 2013 |
| Page 1 |
In recent months, we have invested considerable time and resources in building our organic growth profile in a number of ways. The addition of merchant assets in the current environment has embedded the business with significant upside tied to rising power prices and economic recovery. We have also continued to develop our project pipeline which should support the deployment over the next five years of approximately $500 million of capital into high-value projects delivering premium returns. Our contracted assets continue to benefit from contractual inflation protection which results in margin preservation and a real return profile. And with more than 200 facilities and $17 billion in assets, the scale of our operating platform allows us to operate and integrate assets with high efficiency and at very low cost.
Accordingly, we believe that the business remains very well positioned to deliver cash flow growth and distribution increases at the higher end of our 3% to 5% distribution growth target, by virtue of these organic initiatives alone. The addition of acquisition-based growth, including the penetration of new markets and the diversification into new technologies, gives us even more reason to be very excited about the future of this business.
Our business has never been stronger and our growth prospects are better than have ever seen them. We remain focused on producing investment returns of 12 to 15 percent on average over the long term from a high-quality, scalable portfolio of renewable power assets.
I look forward to reporting on our continued progress and thank you for your ongoing support.
Sincerely,

Richard Legault
President and Chief Executive Officer
| Brookfield Renewable Energy Partners L.P | Q3 2013 Interim Report | September 30, 2013 |
| Page 2 |
| Management’s Discussion and Analysis |
For the three and nine months ended September 30, 2013
HIGHLIGHTS FOR THE THREE MONTHS ENDED SEPTEMBER 30, 2013
| Financial results |
| Funds from operations totaled $108 million for the three months ended September 30, 2013, which was $97 million higher year-over-year primarily due to the return to long-term average hydrology, improved wind conditions, and the contribution from assets acquired within the last year. |
| Capital markets initiatives |
With the closing of a private fund sponsored by Brookfield Asset Management, institutional partners co-invested 49.9% in our recently acquired, 360 MW portfolio of hydroelectric generation facilities located in the Northeastern United States. |
| We extended the maturity of all credit facilities to October 2017, and increased available liquidity by $270 million to $1.25 billion. |
| Portfolio growth |
| In November 2013, we announced an agreement to acquire a 70 MW hydroelectric portfolio in Maine consisting of nine facilities on three rivers. The portfolio is expected to generate approximately 375 GWh annually. The acquisition is being pursued with institutional partners and we will assume an approximate 40% interest in the portfolio. |
We also announced an agreement to acquire, with our institutional partners, the remaining 50% interest in the 30 MW Malacha Hydro facility in California. We will retain an approximate 25% interest in the facility. |
| The transactions above are subject to regulatory approvals and other customary closing conditions and are expected to close before the end of 2013. |
Generation results |
Total generation was 5,154 GWh for the three months ended September 30, 2013 compared to the long-term average of 4,960 GWh, and to 2,971 GWh for the same period in the prior year. |
The hydroelectric portfolio continued to benefit from strong inflows, especially when compared to the prior year when significantly below average inflows were experienced given the dry conditions across much of the portfolio. Generation from existing hydroelectric assets was 3,688 GWh while contributions from acquisitions and assets reaching commercial operations within the last year resulted in 851 GWh of generation. |
| Generation from the wind portfolio increased compared to the prior year due to contributions of 82 GWh from facilities acquired in California in the first quarter, and an increase of 58 GWh from existing wind facilities attributable to stronger wind conditions across the U.S. portfolio. |
| Brookfield Renewable Energy Partners L.P | Q3 2013 Interim Report | September 30, 2013 |
| Page 3 |
| SUMMARY OF HISTORICAL CONSOLIDATED FINANCIAL AND OTHER INFORMATION |
| Three months ended Sep 30 | Nine months ended Sep 30 | |||||||||||||||
| (US$ MILLIONS, UNLESS OTHERWISE STATED) | 2013 | 2012 | 2013 | 2012 | ||||||||||||
Operational Information(1): | ||||||||||||||||
| Capacity (MW) | 5,849 | 4,915 | 5,849 | 4,915 | ||||||||||||
| Long-term average generation (GWh) | 4,960 | 4,049 | 16,456 | 13,596 | ||||||||||||
| Actual generation (GWh) | 5,154 | 2,971 | 16,954 | 11,889 | ||||||||||||
| Average revenue ($ per MWh) | 76 | 77 | 77 | 83 | ||||||||||||
| Selected Financial Information: | ||||||||||||||||
| Revenues | $ | 392 | $ | 229 | $ | 1,313 | $ | 992 | ||||||||
Adjusted EBITDA(2) | 260 | 118 | 936 | 657 | ||||||||||||
Funds from operations(2) | 108 | 11 | 457 | 273 | ||||||||||||
Adjusted funds from operations(2) | 94 | (2 | ) | 415 | 234 | |||||||||||
| Net income (loss) | 28 | (59 | ) | 191 | (31 | ) | ||||||||||
| Distributions per share: | ||||||||||||||||
Preferred equity(3) | 0.29 | 0.33 | 0.89 | 0.98 | ||||||||||||
Limited partners' equity(4) | 0.36 | 0.35 | 1.09 | 1.04 | ||||||||||||
| Sep 30 | Dec 31 | |||||||
| (US$ MILLIONS, UNLESS OTHERWISE STATED) | 2013 | 2012 | ||||||
| Balance sheet data: | ||||||||
| Property, plant and equipment, at fair value | $ | 16,336 | $ | 15,658 | ||||
| Equity-accounted investments | 314 | 344 | ||||||
| Total assets | 17,591 | 16,925 | ||||||
| Long-term debt and credit facilities | 6,654 | 6,119 | ||||||
| Deferred income tax liabilities | 2,414 | 2,349 | ||||||
| Total liabilities | 9,712 | 9,117 | ||||||
| Preferred equity | 821 | 500 | ||||||
| Participating non-controlling interests - in operating subsidiaries | 1,188 | 1,028 | ||||||
| General partnership interest in a holding subsidiary held by Brookfield | 59 | 63 | ||||||
| Participating non-controlling interests - in a holding subsidiary - | ||||||||
| Redeemable/Exchangeable units held by Brookfield | 2,869 | 3,070 | ||||||
| Limited partners' equity | 2,942 | 3,147 | ||||||
| Total liabilities and equity | 17,591 | 16,925 | ||||||
Net asset value(2)(5) | $ | 8,564 | $ | 8,548 | ||||
Net asset value per LP Unit(2)(6) | $ | 32.28 | $ | 32.23 | ||||
Debt to total capitalization(2) | 39 | % | 38 | % | ||||
| (1) | Includes 100% of generation or capacity from equity-accounted investments. |
| (2) | Non-IFRS measures. See "Cautionary Statement Regarding Use of Non-IFRS Measures". |
| (3) | Represents the weighted-average distribution to Series 1, Series 3, Series 5 and Series 6 preferred shares for 2013. |
| (4) | Represents distributions per share to holders of Redeemable/Exchangeable Units, LP Units and general partnership interest. |
| (5) | Net asset value is on a consolidated basis and is attributable to Redeemable/Exchangeable Units, LP Units and general partnership interest. |
| (6) | LP Units outstanding as at September 30, 2013 was 133.0 million (December 31, 2012: 132.9 million). |
| Brookfield Renewable Energy Partners L.P | Q3 2013 Interim Report | September 30, 2013 |
| Page 4 |
OUR COMPETITIVE STRENGTHS
We are an owner and operator of a diversified portfolio of high quality assets that produce electricity from renewable resources and have evolved into one of the world’s largest listed pure-play renewable power businesses.
Our assets generate high quality, stable cash flows derived from a highly contracted portfolio. Our business model is simple: utilize our global reach to identify and acquire high quality renewable power assets at favourable valuations, finance them on a long-term, low-risk basis, and enhance the cash flows and values of these assets using our experienced operating teams to earn reliable, attractive, long-term total returns for the benefit of our shareholders.
One of the largest, listed pure-play renewable platforms. We own one of the world’s largest, publicly-traded, pure-play renewable power portfolios with $17 billion in power generating and development assets, approximately 5,900 MW of installed capacity, and long-term average generation from operating assets of approximately 22,200 GWh annually. Our portfolio includes 193 hydroelectric generating stations on 69 river systems and 11 wind facilities, diversified across 12 power markets in the United States, Canada and Brazil.
 |
Focus on attractive hydroelectric asset class. Our assets are predominantly hydroelectric and represent one of the longest life, lowest cost and most environmentally preferred forms of power generation. Our North American assets have the ability to store water in reservoirs approximating 32% of their annual generation. Our assets in Brazil benefit from a framework that exists in the country to levelize generation risk across hydroelectric producers. This ability to store water and have levelized generation in Brazil, provides partial protection against short-term changes in water supply. As a result of our scale and the quality of our assets, we are competitively positioned compared to other listed renewable power platforms, providing significant scarcity value to investors.
Well positioned for global growth mandate. Over the last ten years we have acquired or developed approximately 160 hydroelectric assets totaling approximately 3,200 MW and 11 wind generating assets totaling approximately 950 MW. Since the beginning of 2013, we acquired or developed hydroelectric generating assets that have an installed capacity of 389 MW and 165 MW of wind generating assets. We also have strong organic growth potential with an approximately 1,800 MW development pipeline spread across all of our operating jurisdictions.
| Brookfield Renewable Energy Partners L.P | Q3 2013 Interim Report | September 30, 2013 |
| Page 5 |
Our net asset value in renewable power has grown from approximately $900 million in 1999 to $8.6 billion as at September 30, 2013, representing a 18% compounded annualized growth rate. We are able to acquire and develop assets due to our established operating and project development teams, strategic relationship with Brookfield Asset Management, and our strong liquidity and capitalization profile.
Attractive distribution profile. We pursue a strategy which we expect will provide for highly stable, predictable cash flows sourced from predominantly long-life hydroelectric assets ensuring an attractive distribution yield. We target a distribution payout ratio in the range of approximately 60% to 70% of funds from operations and pursue a long-term distribution growth rate target in the range of 3% to 5% annually.
Stable, high quality cash flows with attractive long-term value for limited partnership unitholders. We intend to maintain a highly stable, predictable cash flow profile sourced from a diversified portfolio of low operating cost, long-life hydroelectric and wind power assets that sell electricity under long-term, fixed price contracts with creditworthy counterparties. Over 90% of our generation output is sold pursuant to power purchase agreements, to public power authorities, load-serving utilities, industrial users or to affiliates of Brookfield Asset Management. The power purchase agreements for our assets have a weighted-average remaining duration of 19 years, providing long-term cash flow stability.
Strong financial profile. With $17 billion of power generating and development assets and a conservative leverage profile, consolidated debt-to-capitalization is approximately 39%. Our liquidity position remains strong with approximately $1.25 billion of cash and unutilized portion of committed bank lines. Approximately 76% of our borrowings are non-recourse to Brookfield Renewable. Corporate borrowings and subsidiary borrowings have weighted-average terms of approximately 8 and 12 years, respectively.
| Brookfield Renewable Energy Partners L.P | Q3 2013 Interim Report | September 30, 2013 |
| Page 6 |
BASIS OF PRESENTATION
| This Management's Discussion and Analysis for the three and nine months ended September 30, 2013 is provided as of November 6, 2013. Unless the context indicates or requires otherwise, the terms “Brookfield Renewable”, “we”, “us”, and “our” mean Brookfield Renewable Energy Partners L.P. and its controlled entities. |
Brookfield Renewable’s financial statements are prepared in accordance with International Financial Reporting Standards (“IFRS”) as issued by the International Accounting Standards Board (“IASB”), which require estimates and assumptions that affect the reported amounts of assets and liabilities and disclosure of contingent liabilities as at the date of the financial statements and the amounts of revenue and expense during the reporting periods.
Reconciliations of each of Adjusted EBITDA, funds from operations and adjusted funds from operations to net income on a consolidated basis are presented in “Net Income, Adjusted EBITDA, Funds from Operations and Adjusted Funds from Operations on a Consolidated Basis”.
Certain comparative figures have been reclassified to conform to the current year’s presentation.
Unless otherwise indicated, all dollar amounts are expressed in United States (“U.S.”) dollars.
PRESENTATION TO PUBLIC STAKEHOLDERS
Brookfield Renewable’s consolidated equity interests include LP Units held by public unitholders and Redeemable/Exchangeable partnership units in Brookfield Renewable Energy L.P. (“BRELP”), a holding subsidiary of Brookfield Renewable, held by Brookfield (“Participating non-controlling interests – in a holding subsidiary – Redeemable/Exchangeable units held by Brookfield”). The LP Units and the Redeemable/Exchangeable partnership units have the same economic attributes in all respects, except that the Redeemable/Exchangeable partnership units provide Brookfield the right to request that their units be redeemed for cash consideration after two years from the date of issuance. In the event that Brookfield exercises this right, Brookfield Renewable has the right, at its sole discretion, to satisfy the redemption request with LP Units, rather than cash, on a one-for-one basis. Brookfield, as holder of Redeemable/Exchangeable partnership units, participates in earnings and distributions on a per unit basis equivalent to the per unit participation of the LP Units. As Brookfield Renewable, at its sole discretion, has the right to settle the obligation with LP Units, the Redeemable/Exchangeable partnership units are classified under equity, and not as a liability.
Given the exchange feature referenced above, we are presenting the LP Units and the Redeemable/Exchangeable partnership units as separate components of consolidated equity. This presentation does not impact the total income (loss), per unit or share information, or total consolidated equity. For information on our restatement due to a change in accounting policy see Note 26 in our 2012 Annual Report.
As at the date of this report, Brookfield Asset Management owns an approximate 65% limited partnership interest, on a fully-exchanged basis.
PERFORMANCE MEASUREMENT
We present our key financial metrics based on total results prior to distributions made to LP Unitholders, the Redeemable/Exchangeable Unitholders and GP Unitholders. In addition, our operations are segmented by country geography and asset type (i.e. Hydroelectric and Wind), as that is how we review our results, manage operations and allocate resources. Accordingly, we report our results in accordance with these segments.
One of our primary business objectives is to generate reliable and growing cash flows while minimizing risk for the benefit of all stakeholders. We monitor our performance in this regard through five key metrics — i) Net Income, ii) Adjusted Earnings Before Interest, Taxes, Depreciation and Amortization, iii) Funds From Operations, iv) Adjusted Funds from Operations, and v) Net Asset Value.
It is important to highlight that Adjusted EBITDA, funds from operations, adjusted funds from operations, and net asset value do not have any standardized meaning prescribed by IFRS and therefore are unlikely to be comparable to similar measures presented by other companies. We provide additional information on how we determine Adjusted EBITDA, funds from operations, adjusted funds from operations, and net asset value and we provide reconciliations to net income. See “Net Income, Adjusted EBITDA, Funds from Operations and Adjusted Funds from Operations on a Consolidated Basis”.
Net Income (Loss)
Net income (loss) is calculated in accordance with IFRS.
| Brookfield Renewable Energy Partners L.P | Q3 2013 Interim Report | September 30, 2013 |
| Page 7 |
Adjusted Earnings Before Interest, Taxes, Depreciation, and Amortization (Adjusted EBITDA)
Adjusted EBITDA means revenues less direct costs (including energy marketing costs), plus our share of cash earnings from equity-accounted investments and other income, before interest, income taxes, depreciation, amortization, management service costs and the cash portion of non-controlling interests.
Funds From Operations
Funds from operations is defined as Adjusted EBITDA less interest, current income taxes and management service costs, which is then adjusted for the cash portion of non-controlling interests.
Adjusted Funds From Operations |
| Adjusted funds from operations is defined as funds from operations less Brookfield Renewable’s share of levelized sustaining capital expenditures (based on long term capital expenditure plans) and any incentive distributions paid or accrued. The incentive distributions are calculated in increments based on the amount by which quarterly distributions exceed specified target levels. |
Net Asset Value
Net asset value represents our capital at carrying value, on a pre-tax basis prepared in accordance with the procedures and assumptions utilized to prepare Brookfield Renewable's IFRS financial statements, adjusted to reflect asset values not otherwise recognized under IFRS.
| Brookfield Renewable Energy Partners L.P | Q3 2013 Interim Report | September 30, 2013 |
| Page 8 |
FINANCIAL REVIEW FOR THE THREE MONTHS ENDED SEPTEMBER 30, 2013
The following table reflects the actual and long-term average generation for the three months ended September 30:
| Variance of Results | ||||||||||||||||||||||||||||
| Actual vs. | ||||||||||||||||||||||||||||
| Actual Generation | LTA Generation | Actual vs. LTA | Prior Year | |||||||||||||||||||||||||
| GENERATION (GWh) | 2013 | 2012 | 2013 | 2012 | 2013 | 2012 | ||||||||||||||||||||||
| Hydroelectric generation | ||||||||||||||||||||||||||||
| United States | 2,353 | 889 | 2,013 | 1,378 | 340 | (489 | ) | 1,464 | ||||||||||||||||||||
| Canada | 1,292 | 705 | 1,234 | 1,232 | 58 | (527 | ) | 587 | ||||||||||||||||||||
Brazil(1) | 894 | 868 | 894 | 868 | - | - | 26 | |||||||||||||||||||||
| 4,539 | 2,462 | 4,141 | 3,478 | 398 | (1,016 | ) | 2,077 | |||||||||||||||||||||
| Wind energy | ||||||||||||||||||||||||||||
| United States | 295 | 150 | 341 | 236 | (46 | ) | (86 | ) | 145 | |||||||||||||||||||
| Canada | 146 | 151 | 238 | 238 | (92 | ) | (87 | ) | (5 | ) | ||||||||||||||||||
| 441 | 301 | 579 | 474 | (138 | ) | (173 | ) | 140 | ||||||||||||||||||||
| Other | 174 | 208 | 240 | 97 | (66 | ) | 111 | (34 | ) | |||||||||||||||||||
Total generation(2) | 5,154 | 2,971 | 4,960 | 4,049 | 194 | (1,078 | ) | 2,183 | ||||||||||||||||||||
| (1) | In Brazil, assured generation levels are used as a proxy for long-term average. |
| (2) | Includes 100% of generation from equity-accounted investments. |
We compare actual generation levels against the long-term average to highlight the impact of one of the important factors that affect the variability of our business results. In the short-term, we recognize that hydrology will vary from one period to the next; over time however, we expect our facilities will continue to produce in line with their long-term averages, which have proven to be reliable indicators of performance.
Accordingly, we present our generation and the corresponding Adjusted EBITDA, funds from operations and adjusted funds from operations on both an actual generation and a long-term average basis. See “Adjusted EBITDA and Funds from Operations on a Pro forma Basis Assuming Long-term Average”.
Generation levels during the three months ended September 30, 2013 totaled 5,154 GWh, an increase of 2,183 GWh as compared to the same period of the prior year.
The hydroelectric portfolio generated 4,539 GWh which is above the long-term average of 4,141 GWh. Generation increased 2,077 GWh as compared to the same period of the prior year. Generation from existing hydroelectric assets was 3,688 GWh compared to 2,462 GWh for the same period in the prior year. Generation in the third quarter of 2012 was well below long-term average due to dry conditions across most of the portfolio. Recent acquisitions and assets reaching commercial operations resulted in contributions to generation of 851 GWh compared to a long-term average of 701 GWh.
The wind portfolio generated 441 GWh which is below the long-term average of 579 GWh. Generation increased 140 GWh compared to the same period in the prior year. The facilities recently acquired in California resulted in generation increasing by 82 GWh, and existing wind facilities contributed an additional 58 GWh compared to the prior year attributable to stronger wind conditions across the U.S. portfolio.
| Brookfield Renewable Energy Partners L.P | Q3 2013 Interim Report | September 30, 2013 |
| Page 9 |
NET INCOME, ADJUSTED EBITDA, FUNDS FROM OPERATIONS AND ADJUSTED FUNDS FROM OPERATIONS ON A CONSOLIDATED BASIS |
| The following table reflects Adjusted EBITDA, funds from operations, adjusted funds from operations, and reconciliation to net income (loss) for the three months ended September 30: |
| (MILLIONS, EXCEPT AS NOTED) | 2013 | 2012 | ||||||
| Generation (GWh) - LTA | 4,960 | 4,049 | ||||||
| Generation (GWh) - actual | 5,154 | 2,971 | ||||||
| Revenues | $ | 392 | $ | 229 | ||||
| Other income | 1 | 2 | ||||||
| Share of cash earnings from equity-accounted investments | 7 | 3 | ||||||
| Direct operating costs | (140 | ) | (116 | ) | ||||
Adjusted EBITDA(1) | 260 | 118 | ||||||
| Interest expense – borrowings | (105 | ) | (99 | ) | ||||
| Management service costs | (9 | ) | (10 | ) | ||||
| Current income taxes | (4 | ) | 1 | |||||
| Less: cash portion of non-controlling interests | ||||||||
| Preferred equity | (10 | ) | (3 | ) | ||||
| Participating non-controlling interests - in operating subsidiaries | (24 | ) | 4 | |||||
Funds from operations(1) | 108 | 11 | ||||||
| Less: sustaining capital expenditures | (14 | ) | (13 | ) | ||||
Adjusted funds from operations(1) | 94 | (2 | ) | |||||
| Add: cash portion of non-controlling interests | 34 | (1 | ) | |||||
| Add: sustaining capital expenditures | 14 | 13 | ||||||
| Other items: | ||||||||
| Depreciation and amortization | (133 | ) | (117 | ) | ||||
| Unrealized financial instrument gain (loss) | 11 | 6 | ||||||
| Share of non-cash loss from equity-accounted investments | (4 | ) | (5 | ) | ||||
| Deferred income tax recovery | 10 | 37 | ||||||
| Other | 2 | 10 | ||||||
| Net income (loss) | $ | 28 | $ | (59 | ) | |||
| Net income (loss) attributable to: | ||||||||
| Non-controlling interests | ||||||||
| Preferred equity | $ | 10 | $ | 4 | ||||
| Participating non-controlling interests - in operating subsidiaries | 8 | (11 | ) | |||||
| Participating non-controlling interests - in a holding subsidiary - | ||||||||
| Redeemable/Exchangeable units held by Brookfield | 5 | (26 | ) | |||||
| Limited partners' equity | 5 | (26 | ) | |||||
Basic and diluted earnings per LP Unit (2) | $ | 0.04 | $ | (0.20 | ) | |||
| (1) | Non-IFRS measures. See “Cautionary Statement Regarding Use of Non-IFRS Measures”. |
| (2) | Average LP Units outstanding during the period totaled 133.0 million (2012:132.9 million). |
| Brookfield Renewable Energy Partners L.P | Q3 2013 Interim Report | September 30, 2013 |
| Page 10 |
Net income (loss) is one important measure of profitability, in particular because it has a standardized meaning under IFRS. The presentation of net income (loss) on an IFRS basis for our business will often lead to the recognition of a loss even though the underlying cash flow generated by the assets is supported by high margins and stable, long-term contracts. The primary reason for this is that we recognize a significantly higher level of depreciation for our assets than we are required to reinvest in the business as sustaining capital expenditures.
As a result, we also measure our financial results based on Adjusted EBITDA, funds from operations, adjusted funds from operations, and net asset value to provide readers with an assessment of the cash flow generated by our assets and the residual cash flow retained to fund distributions and growth initiatives.
Revenues totaled $392 million for the three months ended September 30, 2013, representing a year-over-year increase of $163 million. Approximately $120 million is attributable to generation levels at existing facilities that were significantly higher than the prior year, while approximately $58 million of the increase in revenues was attributable to generation from facilities acquired or commissioned within the last year. Revenues were negatively impacted by the appreciation of the U.S. dollar relative to the Brazilian real.
Direct operating costs totaled $140 million for the three months ended September 30, 2013, representing a year-over-year increase of $24 million. The increase is primarily attributable to the growth in our portfolio.
| Interest expense totaled $105 million for the three months ended September 30, 2013, representing a year-over-year increase of $6 million due to increased borrowings related to growth in our portfolio. Our average annualized interest rate on subsidiary borrowings was 6.0% for the three months ended September 30, 2013, (2012: 6.7%). Lower borrowing costs associated with the early repayment of higher-yielding subsidiary borrowings in the prior year provided savings of $13 million. Borrowing costs increased by $21 million with the financing related to the growth in our portfolio. |
Management service costs reflect a base fee of $20 million annually plus 1.25% of the growth in total capitalization value. Management service costs totaled $9 million for the three months ended September 30, 2013, a decrease of $1 million from the prior year due to a lower fair market value of the limited partnership units.
The cash portion of non-controlling interests for the three months ended September 30, 2013 was $34 million, an increase of $35 million as compared to the same period in the prior year. The increase is attributable to higher year-over-year revenues from existing facilities, revenues from facilities acquired or commissioned within the last year, and an increase in distributions to preferred shareholders of $7 million.
Funds from operations totaled $108 million for the three months ended September 30, 2013, which was $97 million higher year-over-year, with the return to more normal generation levels and the contribution from assets acquired or commissioned within the last year, which amounted to $13 million of the increase.
Depreciation expense for the three months ended September 30, 2013 increased by $16 million primarily due to assets acquired or commissioned within the last year.
Net income was $28 million for the three months ended September 30, 2013 (2012: loss of $59 million).
| Brookfield Renewable Energy Partners L.P | Q3 2013 Interim Report | September 30, 2013 |
| Page 11 |
| SEGMENTED DISCLOSURES |
| HYDROELECTRIC |
The following table reflects the results of our hydroelectric operations for the three months ended September 30: |
| (MILLIONS, EXCEPT AS NOTED) | 2013 | |||||||||||||||
| United States | Canada | Brazil | Total | |||||||||||||
Generation (GWh) – LTA(1) | 2,013 | 1,234 | 894 | 4,141 | ||||||||||||
Generation (GWh) – actual(1) | 2,353 | 1,292 | 894 | 4,539 | ||||||||||||
| Revenues | $ | 160 | $ | 93 | $ | 69 | $ | 322 | ||||||||
| Other income | - | - | 1 | 1 | ||||||||||||
| Share of cash earnings from equity- | ||||||||||||||||
| accounted investments | 5 | 1 | 1 | 7 | ||||||||||||
| Direct operating costs | (54 | ) | (18 | ) | (24 | ) | (96 | ) | ||||||||
Adjusted EBITDA(2) | 111 | 76 | 47 | 234 | ||||||||||||
| Interest expense - borrowings | (38 | ) | (17 | ) | (5 | ) | (60 | ) | ||||||||
| Current income taxes | - | - | (4 | ) | (4 | ) | ||||||||||
| Cash portion of non-controlling interests | (15 | ) | - | (2 | ) | (17 | ) | |||||||||
Funds from operations(2) | $ | 58 | $ | 59 | $ | 36 | $ | 153 | ||||||||
| (1) | Includes 100% generation from equity-accounted investments. |
| (2) | Non-IFRS measures. See “Cautionary Statement Regarding Use of Non-IFRS Measures”. |
| (MILLIONS, EXCEPT AS NOTED) | 2012 | |||||||||||||||
| United States | Canada | Brazil | Total | |||||||||||||
Generation (GWh) – LTA(1) | 1,378 | 1,232 | 868 | 3,478 | ||||||||||||
Generation (GWh) – actual(1) | 889 | 705 | 868 | 2,462 | ||||||||||||
| Revenues | $ | 55 | $ | 42 | $ | 83 | $ | 180 | ||||||||
| Other income | - | - | 2 | 2 | ||||||||||||
| Share of cash earnings from equity- | ||||||||||||||||
| accounted investments | - | 1 | 2 | 3 | ||||||||||||
| Direct operating costs | (32 | ) | (15 | ) | (31 | ) | (78 | ) | ||||||||
Adjusted EBITDA(2) | 23 | 28 | 56 | 107 | ||||||||||||
| Interest expense - borrowings | (34 | ) | (18 | ) | (8 | ) | (60 | ) | ||||||||
| Current income taxes | 5 | - | (4 | ) | 1 | |||||||||||
| Cash portion of non-controlling interests | 4 | - | (2 | ) | 2 | |||||||||||
Funds from operations(2) | $ | (2 | ) | $ | 10 | $ | 42 | $ | 50 | |||||||
| (1) | Includes 100% generation from equity-accounted investments. |
| (2) | Non-IFRS measures. See “Cautionary Statement Regarding Use of Non-IFRS Measures”. |
United States
Generation from the U.S. portfolio was 2,353 GWh for the three months ended September 30, 2013 compared to the long-term average of 2,013 GWh and prior year generation of 889 GWh. The increase from prior year was driven by an additional 796 GWh of generation from the recently acquired assets in Tennessee, North Carolina, and Maine and a significant increase in generation from the existing facilities in New York and Louisiana, which provided an additional 537 GWh. In 2012, sustained dry conditions, and low levels of precipitation at most of our U.S. facilities resulted in generation levels being well below long-term average.
| Brookfield Renewable Energy Partners L.P | Q3 2013 Interim Report | September 30, 2013 |
| Page 12 |
Revenues totaled $160 million for the three months ended September 30, 2013 representing a year-over-year increase of $105 million. Approximately $70 million is attributable to the increase in generation levels at existing facilities, and approximately $39 million is from facilities acquired within the last year.
Funds from operations totaled $58 million for the three months ended September 30, 2013, a year-over-year increase of $60 million. Funds from operations were impacted by the increase in Adjusted EBITDA net of the cash portion of non-controlling interests.
Canada
Generation from the Canadian portfolio was 1,292 GWh for the three months ended September 30, 2013 compared to the long-term average of 1,234 GWh and prior year generation of 705 GWh. Results were slightly above long-term average, with strong inflows at our Ontario assets. The increase in generation from prior year is primarily due to the return to more normal generation levels relative to the very dry conditions in the same period last year.
Revenues totaled $93 million for the three months ended September 30, 2013, representing a year-over-year increase of $51 million, primarily due to the increased generation levels in the current quarter.
Funds from operations totaled $59 million for the three months ended September 30, 2013, representing a year-over-year increase of $49 million, primarily attributed to the significantly higher revenues.
Brazil
Generation from the Brazilian portfolio was 894 GWh for the three months ended September 30, 2013 compared to the prior year generation of 868 GWh. The increase in generation is attributable to facilities acquired and commissioned within the last year.
Our risk of a generation shortfall in Brazil continues to be minimized by participation in a hydrological balancing pool administered by the government of Brazil. This program mitigates hydrology risk by assuring that all participants receive, at any particular point in time, a reference amount of electricity (assured energy), irrespective of the actual volume of energy generated. The program reallocates energy, transferring surplus energy from those who generated in excess of their assured energy to those who generate less than their assured energy, up to the total generation within the pool.
Revenues totaled $69 million for the three months ended September 30, 2013, representing a year-over-year decrease of $14 million. The appreciation of the U.S. dollar compared to the Brazilian real lowered revenue by $11 million.
Funds from operations totaled $36 million for the three months ended September 30, 2013 representing a year-over-year decrease of $6 million. Funds from operations were impacted by the decrease in revenues, and by lower interest expense from the repayment of higher-yielding subsidiary borrowings within the last year.
| Brookfield Renewable Energy Partners L.P | Q3 2013 Interim Report | September 30, 2013 |
| Page 13 |
| WIND |
The following table reflects the results of our wind operations for the three months ended September 30: |
| (MILLIONS, EXCEPT FOR AS NOTED) | 2013 | |||||||||||
| United States | Canada | Total | ||||||||||
Generation (GWh) – LTA(1) | 341 | 238 | 579 | |||||||||
Generation (GWh) – actual(1) | 295 | 146 | 441 | |||||||||
| Revenues | $ | 34 | $ | 19 | $ | 53 | ||||||
| Direct operating costs | (10 | ) | (5 | ) | (15 | ) | ||||||
Adjusted EBITDA(2) | 24 | 14 | 38 | |||||||||
| Interest expense - borrowings | (11 | ) | (10 | ) | (21 | ) | ||||||
| Cash portion of non-controlling interests | (7 | ) | - | (7 | ) | |||||||
Funds from operations(2) | $ | 6 | $ | 4 | $ | 10 | ||||||
| (1) | Includes 100% generation from equity-accounted investments. |
| (2) | Non-IFRS measures. See “Cautionary Statement Regarding Use of Non-IFRS Measures”. |
| (MILLIONS, EXCEPT FOR AS NOTED) | 2012 | |||||||||||
| United States | Canada | Total | ||||||||||
Generation (GWh) – LTA(1) | 236 | 238 | 474 | |||||||||
Generation (GWh) – actual(1) | 150 | 151 | 301 | |||||||||
| Revenues | $ | 17 | $ | 18 | $ | 35 | ||||||
| Direct operating costs | (11 | ) | (4 | ) | (15 | ) | ||||||
Adjusted EBITDA(2) | 6 | 14 | 20 | |||||||||
| Interest expense - borrowings | (7 | ) | (11 | ) | (18 | ) | ||||||
| Cash portion of non-controlling interests | 2 | - | 2 | |||||||||
Funds from operations(2) | $ | 1 | $ | 3 | $ | 4 | ||||||
| (1) | Includes 100% generation from equity-accounted investments. |
| (2) | Non-IFRS measures. See “Cautionary Statement Regarding Use of Non-IFRS Measures”. |
United States
Generation from our U.S. wind portfolio was 295 GWh for the three months ended September 30, 2013 compared to the long-term average of 341 GWh and prior year generation of 150 GWh. The increase in generation from prior year is primarily attributable to the facilities acquired in California in the first quarter of 2013, and from stronger wind conditions experienced during the current quarter as compared to the prior year period.
Revenues totaled $34 million for the three months ended September 30, 2013, representing a year-over-year increase of $17 million. The increase in revenues is attributable to generation from the assets acquired in California in the first quarter, and higher generation resulting from stronger wind conditions.
Funds from operations totaled $6 million for the three months ended September 30, 2013. Funds from operations were positively impacted by the increase Adjusted EBITDA, partially offset by increased borrowing costs associated with the recently acquired facilities and an increase in the cash portion of non-controlling interests.
| Brookfield Renewable Energy Partners L.P | Q3 2013 Interim Report | September 30, 2013 |
| Page 14 |
Canada
Generation from our Canadian wind portfolio was 146 GWh for the three months ended September 30, 2013, below the long-term average of 238 GWh due to wind conditions.
Revenues and funds from operations totaled $19 million and $4 million, respectively, for the three months ended September 30, 2013, which is virtually unchanged from the same period of the prior year.
FINANCIAL REVIEW FOR THE NINE MONTHS ENDED SEPTEMBER 30, 2013
The following table reflects the actual and long-term average generation for the nine months ended September 30:
| Variance of Results | ||||||||||||||||||||||||||||
| Actual vs. | ||||||||||||||||||||||||||||
| Actual Generation | LTA Generation | Actual vs. LTA | Prior Year | |||||||||||||||||||||||||
| GENERATION (GWh) | 2013 | 2012 | 2013 | 2012 | 2013 | 2012 | ||||||||||||||||||||||
| Hydroelectric generation | ||||||||||||||||||||||||||||
| United States | 7,856 | 4,466 | 7,231 | 5,336 | 625 | (870 | ) | 3,390 | ||||||||||||||||||||
| Canada | 4,093 | 2,999 | 3,891 | 3,797 | 202 | (798 | ) | 1,094 | ||||||||||||||||||||
Brazil(1) | 2,733 | 2,546 | 2,733 | 2,546 | - | - | 187 | |||||||||||||||||||||
| 14,682 | 10,011 | 13,855 | 11,679 | 827 | (1,668 | ) | 4,671 | |||||||||||||||||||||
| Wind energy | ||||||||||||||||||||||||||||
| United States | 970 | 461 | 1,067 | 646 | (97 | ) | (185 | ) | 509 | |||||||||||||||||||
| Canada | 747 | 765 | 854 | 854 | (107 | ) | (89 | ) | (18 | ) | ||||||||||||||||||
| 1,717 | 1,226 | 1,921 | 1,500 | (204 | ) | (274 | ) | 491 | ||||||||||||||||||||
| Other | 555 | 652 | 680 | 417 | (125 | ) | 235 | (97 | ) | |||||||||||||||||||
Total generation(2) | 16,954 | 11,889 | 16,456 | 13,596 | 498 | (1,707 | ) | 5,065 | ||||||||||||||||||||
| (1) | In Brazil, assured generation levels are used as a proxy for long-term average. |
| (2) | Includes 100% of generation from equity-accounted investments. |
Generation levels during the nine months ended September 30, 2013 totaled 16,954 GWh, an increase of 5,065 GWh as compared to the same period of the prior year.
Generation from the hydroelectric portfolio totaled 14,682 GWh, above the long-term average of 13,855 GWh and an increase of 4,671 GWh as compared to the same period of the prior year. Generation from existing hydroelectric assets was 12,039 GWh compared to 10,011 GWh for the same period in the prior year and the contribution from facilities acquired and commissioned within the last year was 2,643 GWh. The variance in year-over-year results reflects increased generation levels from existing facilities, and the contributions from assets acquired and commissioned in the U.S. and in Brazil.
Generation from the wind portfolio totaled 1,717 GWh, below the long-term average of 1,921 GWh and an increase of 491 GWh as compared to the same period of the prior year. The increase from prior year is a result of generation increasing by 273 GWh related to facilities recently acquired in the United States, and stronger wind conditions. The prior year results also do not reflect a full nine months of operations for assets acquired or commissioned.
| Brookfield Renewable Energy Partners L.P | Q3 2013 Interim Report | September 30, 2013 |
| Page 15 |
NET INCOME, ADJUSTED EBITDA, FUNDS FROM OPERATIONS AND ADJUSTED FUNDS FROM OPERATIONS ON A CONSOLIDATED BASIS |
The following table reflects Adjusted EBITDA, funds from operations, adjusted funds from operations, and reconciliation to net income for the nine months ended September 30: |
| (MILLIONS, EXCEPT AS NOTED) | 2013 | 2012 | ||||||
| Generation (GWh) - LTA | 16,456 | 13,596 | ||||||
| Generation (GWh) - actual | 16,954 | 11,889 | ||||||
| Revenues | $ | 1,313 | $ | 992 | ||||
| Other income | 5 | 12 | ||||||
| Share of cash earnings from equity-accounted investments | 19 | 11 | ||||||
| Direct operating costs | (401 | ) | (358 | ) | ||||
Adjusted EBITDA(1) | 936 | 657 | ||||||
| Interest expense – borrowings | (313 | ) | (313 | ) | ||||
| Management service costs | (32 | ) | (25 | ) | ||||
| Current income taxes | (15 | ) | (12 | ) | ||||
| Less: cash portion of non-controlling interests | ||||||||
| Preferred equity | (27 | ) | (10 | ) | ||||
| Participating non-controlling interests - in operating subsidiaries | (92 | ) | (24 | ) | ||||
Funds from operations(1) | 457 | 273 | ||||||
| Less: sustaining capital expenditures | (42 | ) | (39 | ) | ||||
Adjusted funds from operations(1) | 415 | 234 | ||||||
| Add: cash portion of non-controlling interests | 119 | 34 | ||||||
| Add: sustaining capital expenditures | 42 | 39 | ||||||
| Other items: | ||||||||
| Depreciation and amortization | (398 | ) | (360 | ) | ||||
| Unrealized financial instrument gain (loss) | 30 | (6 | ) | |||||
| Share of non-cash loss from equity-accounted investments | (10 | ) | (13 | ) | ||||
| Deferred income tax (expense) recovery | (1 | ) | 40 | |||||
| Other | (6 | ) | 1 | |||||
| Net income (loss) | $ | 191 | $ | (31 | ) | |||
| Net income (loss) attributable to: | ||||||||
| Non-controlling interests | ||||||||
| Preferred equity | $ | 27 | $ | 10 | ||||
| Participating non-controlling interests - in operating subsidiaries | 48 | (26 | ) | |||||
| General partnership interest in a holding subsidiary held by Brookfield | 1 | - | ||||||
| Participating non-controlling interests - in a holding subsidiary - | ||||||||
| Redeemable/Exchangeable units held by Brookfield | 57 | (8 | ) | |||||
| Limited partners' equity | 58 | (7 | ) | |||||
Basic and diluted earnings per LP Unit (2) | $ | 0.44 | $ | (0.06 | ) | |||
| (1) | Non-IFRS measures. See “Cautionary Statement Regarding Use of Non-IFRS Measures”. |
| (2) | Average LP Units outstanding during the period totaled 132.9 million (2012:132.9 million). |
| Brookfield Renewable Energy Partners L.P | Q3 2013 Interim Report | September 30, 2013 |
| Page 16 |
Revenues totaled $1,313 million for the nine months ended September 30, 2013, representing a year-over-year increase of $321 million. The increase is attributable to generation levels at existing facilities that were significantly higher than the prior year which experienced drier than normal conditions and below average precipitation across the portfolio. In addition, approximately $173 million of the increase is attributable to generation from facilities acquired or commissioned within the last year. Revenues were also impacted by the appreciation of the U.S. dollar as compared to the Brazilian real.
Direct operating costs totaled $401 million for the nine months ended September 30, 2013, representing a year-over-year increase of $43 million. The increase is primarily attributable to facilities acquired or commissioned within the last year, partially offset by cost savings resulting from the appreciation of the U.S. dollar relative to the Brazilian real.
Interest expense totaled $313 million for the nine months ended September 30, 2013, which is consistent year-over-year. Lower borrowing costs are attributable to the early repayment of higher-yielding subsidiary borrowings in the prior year which provided savings of $56 million, and savings of $5 million from the impact of changes in foreign exchange rates. Borrowing costs increased by $61 million with the financing related to the growth in our portfolio.
Management service costs reflect a base fee of $20 million annually plus 1.25% of the growth in total capitalization value. Management services costs totaled $32 million for the nine months ended September 30, 2013, which is $7 million higher than the same period in the prior year primarily due to the increase in the fair market value of the limited partnership units, increased corporate borrowings and the issuance of preferred equity.
The cash portion of non-controlling interests for the nine months ended September 30, 2013 was $119 million as compared to $34 million in the prior year. The increase is attributable to higher year-over year revenues from existing facilities, revenues from facilities acquired or commissioned within the last year, and an increase in distributions to preferred shareholders of $17 million.
Funds from operations totaled $457 million for the nine months ended September 30, 2013, which was $184 million higher year-over-year. The increase is primarily attributed to the increase in generation with a return to long-term average levels. The cash portion of non-controlling interests and management service costs partially offset the increase.
Depreciation expense for the nine months ended September 30, 2013 increased by $55 million due to assets acquired or commissioned within last year, which was partly offset by a $15 million decrease in depreciation due to change in estimated service lives of certain assets.
Net income was $191 million for the nine months ended September 30, 2013 (2012: net loss $31 million).
| Brookfield Renewable Energy Partners L.P | Q3 2013 Interim Report | September 30, 2013 |
| Page 17 |
| SEGMENTED DISCLOSURES |
| HYDROELECTRIC |
The following table reflects the results of our hydroelectric operations for the nine months ended September 30: |
| (MILLIONS, EXCEPT AS NOTED) | 2013 | |||||||||||||||
| United States | Canada | Brazil | Total | |||||||||||||
Generation (GWh) – LTA(1) | 7,231 | 3,891 | 2,733 | 13,855 | ||||||||||||
Generation (GWh) – actual(1) | 7,856 | 4,093 | 2,733 | 14,682 | ||||||||||||
| Revenues | $ | 546 | $ | 294 | $ | 223 | $ | 1,063 | ||||||||
| Other income | - | - | 5 | 5 | ||||||||||||
| Share of cash earnings from equity- | ||||||||||||||||
| accounted investments | 11 | 4 | 4 | 19 | ||||||||||||
| Direct operating costs | (150 | ) | (55 | ) | (72 | ) | (277 | ) | ||||||||
Adjusted EBITDA(2) | 407 | 243 | 160 | 810 | ||||||||||||
| Interest expense - borrowings | (111 | ) | (50 | ) | (18 | ) | (179 | ) | ||||||||
| Current income taxes | (3 | ) | - | (13 | ) | (16 | ) | |||||||||
| Cash portion of non-controlling interests | (57 | ) | - | (9 | ) | (66 | ) | |||||||||
Funds from operations(2) | $ | 236 | $ | 193 | $ | 120 | $ | 549 | ||||||||
| (1) | Includes 100% generation from equity-accounted investments. |
| (2) | Non-IFRS measures. See “Cautionary Statement Regarding Use of Non-IFRS Measures”. |
| (MILLIONS, EXCEPT AS NOTED) | 2012 | |||||||||||||||
| United States | Canada | Brazil | Total | |||||||||||||
Generation (GWh) – LTA(1) | 5,336 | 3,797 | 2,546 | 11,679 | ||||||||||||
Generation (GWh) – actual(1) | 4,466 | 2,999 | 2,546 | 10,011 | ||||||||||||
| Revenues | $ | 343 | $ | 207 | $ | 262 | $ | 812 | ||||||||
| Other income | 1 | 2 | 9 | 12 | ||||||||||||
| Share of cash earnings from equity- | 5 | 2 | 4 | 11 | ||||||||||||
| accounted investments | ||||||||||||||||
| Direct operating costs | (110 | ) | (48 | ) | (89 | ) | (247 | ) | ||||||||
Adjusted EBITDA(2) | 239 | 163 | 186 | 588 | ||||||||||||
| Interest expense - borrowings | (102 | ) | (51 | ) | (51 | ) | (204 | ) | ||||||||
| Current income taxes | 1 | - | (13 | ) | (12 | ) | ||||||||||
| Cash portion of non-controlling interests | (12 | ) | - | (10 | ) | (22 | ) | |||||||||
Funds from operations(2) | $ | 126 | $ | 112 | $ | 112 | $ | 350 | ||||||||
| (1) | Includes 100% generation from equity-accounted investments. |
| (2) | Non-IFRS measures. See “Cautionary Statement Regarding Use of Non-IFRS Measures”. |
United States
Generation from the U.S. portfolio was 7,856 GWh for the nine months ended September 30, 2013 compared to the long-term average of 7,231 GWh and prior year generation of 4,466 GWh. The increase from prior year was driven by an additional 2,484 GWh from the recently acquired assets in Tennessee, North Carolina, and Maine and a significant increase in generation from existing assets. In the prior year, dry conditions in New York and the mid-western United States resulted in generation levels being well below long-term average.
Revenues totaled $546 million for the nine months ended September 30, 2013 representing a year-over-year increase of $203 million. Approximately $114 million of the increase in revenues is attributable to generation from the facilities acquired within the last year, and the remaining is attributable to the increase in generation levels at existing facilities.
| Brookfield Renewable Energy Partners L.P | Q3 2013 Interim Report | September 30, 2013 |
| Page 18 |
Funds from operations totaled $236 million for the nine months ended September 30, 2013, an increase of $110 million from prior year. Funds from operations were impacted by the increase in Adjusted EBITDA net of the cash portion of non-controlling interests.
Canada
Generation from the Canadian portfolio was 4,093 GWh for the nine months ended September 30, 2013 compared to the long-term average of 3,891 GWh and to prior year generation of 2,999 GWh. Results were above long-term average, with strong inflows at our Ontario assets. The increase in generation from prior year was primarily due to the return to normal hydrology conditions in the current period as lower inflows associated with drier than usual conditions were experienced across eastern Canada in the prior year.
Revenues totaled $294 million for the nine months ended September 30, 2013, representing a year-over-year increase of $87 million, primarily due to the increased generation levels in the current year.
Funds from operations totaled $193 million for the nine months ended September 30, 2013, representing a year-over-year increase of $81 million. Funds from operations were significantly impacted by the increase in revenues.
Brazil
Generation from the Brazilian portfolio was 2,733 GWh for the nine months ended September 30, 2013 compared to the prior year generation of 2,546 GWh. The increase in generation is primarily attributable to one facility acquired and two commissioned within the last year.
Revenues totaled $223 million for the nine months ended September 30, 2013, representing a year-over-year decrease of $39 million. Revenues declined with appreciation of the U.S. dollar compared to the Brazilian real by $30 million, and were higher by $10 million due to generation from facilities acquired or commissioned within the last year. In addition, lower allocated energy volumes which allow us to purchase power at cost and re-sell at contracted rates added $18 million to costs, with incremental revenues included in revenues.
Funds from operations totaled $120 million for the nine months ended September 30, 2013 representing a year-over-year increase of $8 million. Funds from operations were positively impacted by the $33 million decrease in interest expense from the repayment of higher-yielding subsidiary borrowings within the last year, and lower direct operating costs. The decrease in revenues negatively impacted funds from operations.
| Brookfield Renewable Energy Partners L.P | Q3 2013 Interim Report | September 30, 2013 |
| Page 19 |
WIND
The following table reflects the results of our wind operations for the nine months ended September 30:
| (MILLIONS, EXCEPT FOR AS NOTED) | 2013 | |||||||||||
| United States | Canada | Total | ||||||||||
Generation (GWh) – LTA(1) | 1,067 | 854 | 1,921 | |||||||||
Generation (GWh) – actual(1) | 970 | 747 | 1,717 | |||||||||
| Revenues | $ | 107 | $ | 93 | $ | 200 | ||||||
| Direct operating costs | (30 | ) | (15 | ) | (45 | ) | ||||||
Adjusted EBITDA(2) | 77 | 78 | 155 | |||||||||
| Interest expense - borrowings | (29 | ) | (34 | ) | (63 | ) | ||||||
| Cash portion of non-controlling interests | (26 | ) | - | (26 | ) | |||||||
Funds from operations(2) | $ | 22 | $ | 44 | $ | 66 | ||||||
| (1) | Includes 100% generation from equity-accounted investments. |
| (2) | Non-IFRS measures. See “Cautionary Statement Regarding Use of Non-IFRS Measures”. |
| (MILLIONS, EXCEPT FOR AS NOTED) | 2012 | |||||||||||
| United States | Canada | Total | ||||||||||
Generation (GWh) – LTA(1) | 646 | 854 | 1,500 | |||||||||
Generation (GWh) – actual(1) | 461 | 765 | 1,226 | |||||||||
| Revenues | $ | 42 | $ | 89 | $ | 131 | ||||||
| Direct operating costs | (20 | ) | (13 | ) | (33 | ) | ||||||
Adjusted EBITDA(2) | 22 | 76 | 98 | |||||||||
| Interest expense - borrowings | (17 | ) | (32 | ) | (49 | ) | ||||||
| Cash portion of non-controlling interests | (2 | ) | - | (2 | ) | |||||||
Funds from operations(2) | $ | 3 | $ | 44 | $ | 47 | ||||||
| (1) | Includes 100% generation from equity-accounted investments. |
| (2) | Non-IFRS measures. See “Cautionary Statement Regarding Use of Non-IFRS Measures”. |
United States
Generation from our U.S. wind portfolio was 970 GWh for the nine months ended September 30, 2013, lower than the long-term average of 1,067 GWh and significantly higher than the prior year generation of 461 GWh. The increase in generation from prior year is attributable to the facilities acquired or commissioned within the last year, and from stronger wind conditions.
Revenues totaled $107 million for the nine months ended September 30, 2013, representing a year-over-year increase of $65 million. The increase in revenues is primarily attributable to generation from the assets acquired within the last year, a full nine months of contribution from generation delivered under power purchase agreements, and from stronger wind conditions.
Funds from operations totaled $22 million for the nine months ended September 30, 2013 compared to $3 million in the prior year. Funds from operations were positively impacted by the increase in revenues, and partially offset by increases in interest expense, direct operating costs, and the cash portion of non-controlling interest associated with the growth of the portfolio. The prior year result also does not reflect a full nine months of operations for assets acquired or commissioned.
Canada
Generation from our Canadian wind portfolio was 747 GWh for the nine months ended September 30, 2013, below the long-term average of 854 GWh.
Revenues and funds from operations totaled $93 million and $44 million, respectively, for the nine months ended September 30, 2013, virtually unchanged from the prior year.
| Brookfield Renewable Energy Partners L.P | Q3 2013 Interim Report | September 30, 2013 |
| Page 20 |
ANALYSIS OF CONSOLIDATED FINANCIAL STATEMENTS AND OTHER INFORMATION
NET ASSET VALUE
The following table presents our net asset value:
| Total | Per Share | |||||||||||||||
| Sep 30 | Dec 31 | Sep 30 | Dec 31 | |||||||||||||
| (MILLIONS, EXCEPT AS NOTED) | 2013 | 2012 | 2013 | 2012 | ||||||||||||
| Property, plant and equipment, at fair value | ||||||||||||||||
Hydroelectric(1) | $ | 13,626 | $ | 13,005 | $ | 51.36 | $ | 49.04 | ||||||||
| Wind energy | 2,614 | 2,244 | 9.85 | 8.46 | ||||||||||||
| Other | 68 | 71 | 0.26 | 0.27 | ||||||||||||
| 16,308 | 15,320 | 61.47 | 57.77 | |||||||||||||
| Development assets | 455 | 382 | 1.72 | 1.44 | ||||||||||||
| Equity-accounted investments | 314 | 344 | 1.18 | 1.30 | ||||||||||||
| Working capital and other, net | 150 | 149 | 0.57 | 0.56 | ||||||||||||
| Long-term debt and credit facilities | (6,654 | ) | (6,119 | ) | (25.09 | ) | (23.07 | ) | ||||||||
| Participating non-controlling interests - in operating | ||||||||||||||||
| subsidiaries | (1,188 | ) | (1,028 | ) | (4.48 | ) | (3.88 | ) | ||||||||
| Preferred equity | (821 | ) | (500 | ) | (3.09 | ) | (1.89 | ) | ||||||||
Net asset value(2) | $ | 8,564 | $ | 8,548 | $ | 32.28 | $ | 32.23 | ||||||||
Net asset value attributable to: (3) | ||||||||||||||||
| General partnership interest in a holding subsidiary | ||||||||||||||||
| held by Brookfield | $ | 86 | $ | 85 | $ | 32.28 | $ | 32.23 | ||||||||
| Participating non-controlling interests - in a holding | ||||||||||||||||
| subsidiary - Redeemable /Exchangeable units | ||||||||||||||||
| held by Brookfield | 4,186 | 4,179 | 32.28 | 32.23 | ||||||||||||
| Limited partners' equity | 4,292 | 4,284 | 32.28 | 32.23 | ||||||||||||
| $ | 8,564 | $ | 8,548 | |||||||||||||
| (1) | Includes $35 million of intangible assets (2012: $44 million). |
| (2) | Non-IFRS measure. See "Cautionary Statement Regarding Use of Non-IFRS Measures". |
| (3) | Net asset value per share is based on LP Units, Redeemable/Exchangeable units and General partnership units outstanding as at September 30, 2013 of 133.0 million, 129.7 million and 2.6 million respectively (2012: 132.9 million, 129.7 million and 2.6 million respectively). |
| Net asset value totaled approximately $8.6 billion as at September 30, 2013, an increase of $16 million from December 31, 2012. During the nine months ended September 30, 2013, over 590 MW of hydroelectric and wind facilities were acquired or commissioned and consolidated into the operating results, and we continued to invest in construction and development of new renewable power projects. These investments totaled $1.6 billion, and were partially offset by the changes in foreign exchange rates in the amount of $471 million. The net asset value was also impacted by the issuance of preferred shares, and additional long-term debt associated with portfolio growth and refinancing of indebtedness on existing renewable power generating facilities. |
Property, Plant, Equipment and Development Assets
The assets deployed in our renewable power operations are revalued on an annual basis, with the exception of foreign exchange impacts which are calculated quarterly.
| Brookfield Renewable Energy Partners L.P | Q3 2013 Interim Report | September 30, 2013 |
| Page 21 |
We value our assets based on discounted cash flows over a 20-year period and key assumptions utilized in 2012 were as follows:
| United States | Canada | Brazil | ||||||||||
| Discount rate | 5.7% | 5.2% | 9.4% | |||||||||
| Terminal capitalization rate | 7.0% | 6.5% | N/A | |||||||||
| Exit date | 2032 | 2032 | 2029 | |||||||||
NET ASSET VALUE FOR HYDROELECTRIC FACILITIES |
| The following table presents the net asset value of the hydroelectric facilities: |
| Sep 30 | Dec 31 | |||||||||||||||||||
| (MILLIONS) | United States | Canada | Brazil | 2013 | 2012 | |||||||||||||||
Hydroelectric power assets(1) | $ | 5,966 | $ | 5,196 | $ | 2,464 | $ | 13,626 | $ | 13,005 | ||||||||||
| Development assets | 112 | 265 | 25 | 402 | 369 | |||||||||||||||
| Equity-accounted investments | 197 | 57 | 60 | 314 | 344 | |||||||||||||||
| 6,275 | 5,518 | 2,549 | 14,342 | 13,718 | ||||||||||||||||
| Working capital and other, net | 154 | 13 | 118 | 285 | 286 | |||||||||||||||
| Subsidiary borrowings | (2,179 | ) | (1,184 | ) | (255 | ) | (3,618 | ) | (3,258 | ) | ||||||||||
| Participating non-controlling interests - | ||||||||||||||||||||
| in operating subsidiaries | (654 | ) | (27 | ) | (246 | ) | (927 | ) | (737 | ) | ||||||||||
Net asset value(2) | $ | 3,596 | $ | 4,320 | $ | 2,166 | $ | 10,082 | $ | 10,009 | ||||||||||
| (1) | Includes $35 million of intangible assets (2012: $44 million). |
| (2) | Non-IFRS measure. See "Cautionary Statement Regarding Use of Non-IFRS Measures". |
The net asset value of hydroelectric facilities was $10.1 billion as at September 30, 2013, an increase of $73 million from December 31, 2012. The increase was primarily attributable to the acquisition of a 360 MW portfolio of hydroelectric facilities in Northeastern United States and the step acquisition of the 83 MW facility in British Columbia in the amount of $927 million partially offset by the impact on property, plant and equipment of changes in foreign exchange rates in the amount of $404 million. The net asset value was impacted by additional borrowings as a result of our portfolio growth.
| Brookfield Renewable Energy Partners L.P | Q3 2013 Interim Report | September 30, 2013 |
| Page 22 |
| NET ASSET VALUE FOR WIND FACILITIES |
| The following table presents the net asset value of our wind facilities: |
| Sep 30 | Dec 31 | |||||||||||||||
| (MILLIONS) | United States | Canada | 2013 | 2012 | ||||||||||||
| Wind power assets | $ | 1,254 | $ | 1,360 | $ | 2,614 | $ | 2,244 | ||||||||
| Development assets | 27 | 26 | 53 | 13 | ||||||||||||
| 1,281 | 1,386 | 2,667 | 2,257 | |||||||||||||
| Working capital and other, net | 51 | (42 | ) | 9 | (55 | ) | ||||||||||
| Subsidiary borrowings | (654 | ) | (755 | ) | (1,409 | ) | (1,089 | ) | ||||||||
| Participating non-controlling interests - | ||||||||||||||||
| in operating subsidiaries | (253 | ) | (8 | ) | (261 | ) | (291 | ) | ||||||||
Net asset value(1) | $ | 425 | $ | 581 | $ | 1,006 | $ | 822 | ||||||||
| (1) | Non-IFRS measure. See "Cautionary Statement Regarding Use of Non-IFRS Measures". |
The net asset value of wind facilities was $1.0 billion as at September 30, 2013, compared to $822 million as at December 31, 2012. This increase is primarily due to the acquisition of 165 MW of wind assets in California in the amount of $421 million, partially offset by the impact of changes in foreign exchange rates in the amount of $52 million. Partially offsetting the increase were subsidiary borrowings attributable to the recent acquisition as well as the re-financing associated with an Ontario wind facility.
| Brookfield Renewable Energy Partners L.P | Q3 2013 Interim Report | September 30, 2013 |
| Page 23 |
| SEGMENTED NET ASSET VALUE |
| The following table provides a breakdown of our consolidated net asset value: |
| Corporate | Sep 30 | Dec-31 | ||||||||||||||||||
| (MILLIONS) | Hydroelectric | Wind energy | and other | 2013 | 2012 | |||||||||||||||
Property, plant and equipment, at fair value(1) | $ | 13,626 | $ | 2,614 | $ | 68 | $ | 16,308 | $ | 15,320 | ||||||||||
| Development assets | 402 | 53 | - | 455 | 382 | |||||||||||||||
| Equity-accounted investments | 314 | - | - | 314 | 344 | |||||||||||||||
| 14,342 | 2,667 | 68 | 17,077 | 16,046 | ||||||||||||||||
| Working capital and other, net | 285 | 9 | (144 | ) | 150 | 149 | ||||||||||||||
| Long-term debt and credit facilities | (3,618 | ) | (1,409 | ) | (1,627 | ) | (6,654 | ) | (6,119 | ) | ||||||||||
| Participating non-controlling interests - in | ||||||||||||||||||||
| operating subsidiaries | (927 | ) | (261 | ) | - | (1,188 | ) | (1,028 | ) | |||||||||||
| Preferred equity | - | - | (821 | ) | (821 | ) | (500 | ) | ||||||||||||
Net asset value(2) | $ | 10,082 | $ | 1,006 | $ | (2,524 | ) | $ | 8,564 | $ | 8,548 | |||||||||
| Deferred income tax liabilities | (2,414 | ) | (2,349 | ) | ||||||||||||||||
| Deferred income tax assets | 112 | 81 | ||||||||||||||||||
| Values not recognized under IFRS | (392 | ) | - | |||||||||||||||||
| $ | 5,870 | $ | 6,280 | |||||||||||||||||
| General partnership interest in a holding | ||||||||||||||||||||
| subsidiary held by Brookfield | $ | 59 | $ | 63 | ||||||||||||||||
| Participating non-controlling interests - in a | ||||||||||||||||||||
| holding subsidiary - Redeemable | ||||||||||||||||||||
| /Exchangeable units held by Brookfield | 2,869 | 3,070 | ||||||||||||||||||
| Limited partners' equity | 2,942 | 3,147 | ||||||||||||||||||
| $ | 5,870 | $ | 6,280 | |||||||||||||||||
| (1) | Includes $35 million of intangible assets (2012: $44 million). |
| (2) | Non-IFRS measure. See “Cautionary Statement Regarding Use of Non-IFRS Measures”. |
| Brookfield Renewable Energy Partners L.P | Q3 2013 Interim Report | September 30, 2013 |
| Page 24 |
LIQUIDITY AND CAPITAL RESOURCES
A key element of our financing strategy is to raise the majority our debt in the form of asset-specific, non-recourse borrowings at our subsidiaries on an investment grade basis. As at September 30, 2013, long-term indebtedness increased from December 31, 2012 as a result of the portfolio growth. The debt to capitalization ratio increased to 39% from 38% at December 31, 2012 primarily due to the increase in subsidiary borrowings to fund the portfolio growth.
Capitalization
The following table summarizes the capitalization using book values:
| Sep 30 | Dec 31 | ||||||
| (MILLIONS) | 2013 | 2012 | |||||
Credit facilities(1) | $ | 178 | $ | 268 | |||
Corporate borrowings(1) | 1,449 | 1,504 | |||||
Subsidiary borrowings(2) | 5,027 | 4,347 | |||||
| Long-term indebtedness | 6,654 | 6,119 | |||||
| Preferred equity | 821 | 500 | |||||
| Participating non-controlling interests - in operating subsidiaries | 1,188 | 1,028 | |||||
Net asset value(3) | 8,564 | 8,548 | |||||
| Total capitalization | $ | 17,227 | $ | 16,195 | |||
Debt to total capitalization(3) | 39% | 38% | |||||
| (1) | Issued by a subsidiary of Brookfield Renewable and guaranteed by Brookfield Renewable. The amounts are unsecured. |
| (2) | Issued by a subsidiary of Brookfield Renewable and secured against its assets. The amounts are not guaranteed. |
| (3) | Non-IFRS measures. See "Cautionary Statement Regarding the Use of Non-IFRS Measures". |
During the nine months ended September 30, 2013, we completed a number of financings associated with the growth in our portfolio. Highlights include the following:
| · | Purchased 88% of the $575 million in operating company notes and 100% of the $125 million in holding notes outstanding with respect to the acquired hydroelectric portfolio in Northeastern United States. The purchase of the tendered notes was partially funded through a non-recourse, 24-month bridge loan of up to $350 million. |
| · | Refinanced indebtedness on a 166 MW Ontario wind facility through a C$450 million loan for a term of 18 years at 5.1%. |
| · | Refinanced indebtedness on a 51 MW Ontario wind facility through a C$130 million loan for a term of 19 years at 5.0%. |
| · | Issued C$175 million of the Series 5 and Series 6 Class A Preference Shares with a fixed, annual, yield of 5%. |
| · | With the acquisition of Western Wind, subsidiary borrowings increased by $250 million. |
| Brookfield Renewable Energy Partners L.P | Q3 2013 Interim Report | September 30, 2013 |
| Page 25 |
Available liquidity
| We operate with substantial liquidity, which along with ongoing cash flow from operations enables us to fund growth initiatives, capital expenditures, distributions, and to finance the business on an investment grade basis. |
The following table summarizes the available liquidity:
| Sep 30 | Dec 31 | |||||||
| (MILLIONS) | 2013 | 2012 | ||||||
| Cash and cash equivalents | $ | 185 | $ | 137 | ||||
| Credit facilities | ||||||||
| Authorized credit facilities | 1,480 | 990 | ||||||
| Draws on credit facilities | (178 | ) | (268 | ) | ||||
| Issued letters of credit | (240 | ) | (182 | ) | ||||
| Available portion of credit facilities | 1,062 | 540 | ||||||
| Available liquidity | $ | 1,247 | $ | 677 | ||||
Available liquidity is comprised of cash and the unused portion of credit facilities. As at September 30, 2013, we had $1,247 million of available liquidity (December 31, 2012: $677 million) which provides the flexibility to fund ongoing portfolio growth initiatives and to protect against short-term fluctuations in generation.
During the nine months ended September 30, 2013, we expanded the revolving credit facilities from $990 million to $1,280 million and extended the maturity date of all credit facilities to October 31, 2017. In addition, Brookfield Asset Management provided a $200 million committed unsecured revolving credit facility expiring in December 2013, at LIBOR plus 2%.
| Long-term debt and credit facilities |
The following table summarizes our principal repayments and maturities as at September 30, 2013: |
| (MILLIONS) | Balance of 2013 | 2014 | 2015 | 2016 | 2017 | Thereafter | Total | |||||||||||||||||||||
| Principal repayments | �� | |||||||||||||||||||||||||||
| Subsidiary borrowings | $ | 50 | $ | 517 | $ | 504 | $ | 264 | $ | 579 | $ | 3,149 | $ | 5,063 | ||||||||||||||
| Corporate borrowings and | ||||||||||||||||||||||||||||
| credit facilities | - | - | - | 291 | 178 | 1,165 | 1,634 | |||||||||||||||||||||
| Equity-accounted investments | - | - | 35 | 1 | 126 | 8 | 170 | |||||||||||||||||||||
| $ | 50 | $ | 517 | $ | 539 | $ | 556 | $ | 883 | $ | 4,322 | $ | 6,867 | |||||||||||||||
Subsidiary borrowings maturing in 2014 include $375 million on hydroelectric facilities in the United States. All borrowings are expected to be refinanced in the normal course.
| Brookfield Renewable Energy Partners L.P | Q3 2013 Interim Report | September 30, 2013 |
| Page 26 |
The overall maturity profile and average interest rates associated with our borrowings and credit facilities are as follows:
| Average term (years) | Average interest rate (%) | |||||||||||||||
| Sep 30 | Dec 31 | Sep 30 | Dec 31 | |||||||||||||
| 2013 | 2012 | 2013 | 2012 | |||||||||||||
| Corporate borrowings | 8.0 | 8.7 | 5.3 | 5.3 | ||||||||||||
| Subsidiary borrowings | 12.1 | 11.8 | 6.0 | 6.4 | ||||||||||||
| Credit facilities | 4.1 | 3.8 | 1.5 | 2.0 | ||||||||||||
| For the nine months ended September 30, 2013, we reduced our borrowing costs and extended the maturity of all our subsidiary borrowings and credit facilities, in an environment where interest rates are near historical lows. |
| Brookfield Renewable Energy Partners L.P | Q3 2013 Interim Report | September 30, 2013 |
| Page 27 |
CONTRACT PROFILE
We have a predictable profile driven by both long-term power purchase agreements with a weighted-average remaining duration of 19 years, combined with a well-diversified portfolio that reduces variability in our generation volumes. We operate the business on a largely contracted basis to ensure a high degree of predictability in funds from operations. We do however maintain a long-term view that electricity prices and the demand for electricity from renewable sources will rise due to a growing level of acceptance around climate change and the legislated requirements in some areas to diversify away from fossil fuel based generation.
As at September 30, 2013, we had contracted 91% of the 2013 generation output at an average price of $81 per MWh. The following table sets out contracts over the next five years for generation output from existing facilities assuming long-term average hydrology and wind conditions:
| FOR THE YEAR ENDED DECEMBER 31 | Balance of 2013 | 2014 | 2015 | 2016 | 2017 | |||||||||||||||
| Generation (GWh) | ||||||||||||||||||||
Contracted(1) | ||||||||||||||||||||
Hydroelectric(2) | 4,130 | 15,920 | 14,294 | 14,002 | 13,384 | |||||||||||||||
| Wind energy | 603 | 2,490 | 2,490 | 2,489 | 2,489 | |||||||||||||||
| Other | 100 | 134 | - | - | - | |||||||||||||||
| 4,833 | 18,544 | 16,784 | 16,491 | 15,873 | ||||||||||||||||
| Uncontracted | 459 | 3,012 | 4,655 | 4,921 | 5,539 | |||||||||||||||
| Total long-term average | 5,292 | 21,556 | 21,439 | 21,412 | 21,412 | |||||||||||||||
Long-term average on a proportionate basis(3) | 4,390 | 17,727 | 17,598 | 17,571 | 17,571 | |||||||||||||||
| Contracted generation – as at September 30 | ||||||||||||||||||||
| % of total generation | 91 | % | 86 | % | 78 | % | 77 | % | 74 | % | ||||||||||
% of total generation on a proportionate basis(3) | 95 | % | 92 | % | 85 | % | 84 | % | 81 | % | ||||||||||
| Price per MWh | $ | 81 | $ | 83 | $ | 85 | $ | 85 | $ | 84 | ||||||||||
| (1) | Assets under construction are included when long-term average and pricing details are available and the commercial operation date is established in a definitive construction contract. |
| (2) | Long-term average for 2014 to 2017 includes generation from one facility in Canada that is currently under construction with estimated commercial operation date in mid-2014. |
| (3) | Long-term average on a proportionate basis includes wholly-owned assets, and our share of partially-owned assets and equity-accounted investments. |
| The majority of the long-term power sales agreements are with investment-rated or creditworthy counterparties: |
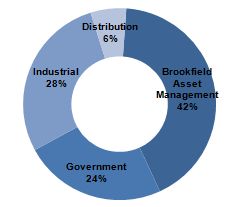 |
| Brookfield Renewable Energy Partners L.P | Q3 2013 Interim Report | September 30, 2013 |
| Page 28 |
SUMMARY CONSOLIDATED BALANCE SHEETS |
The following table provides a summary of the key line items on the consolidated balance sheets: |
| Sep 30 | Dec 31 | |||||||
| (MILLIONS) | 2013 | 2012 | ||||||
| Property, plant and equipment, at fair value | $ | 16,336 | $ | 15,658 | ||||
| Equity-accounted investments | 314 | 344 | ||||||
| Total assets | 17,591 | 16,925 | ||||||
| Long-term debt and credit facilities | 6,654 | 6,119 | ||||||
| Deferred income tax liabilities | 2,414 | 2,349 | ||||||
| Total liabilities | 9,712 | 9,117 | ||||||
| Preferred equity | 821 | 500 | ||||||
| Participating non-controlling interests - in operating subsidiaries | 1,188 | 1,028 | ||||||
| General partnership interest in a holding subsidiary held by Brookfield | 59 | 63 | ||||||
| Participating non-controlling interests - in a holding subsidiary - | ||||||||
| Redeemable/Exchangeable units held by Brookfield | 2,869 | 3,070 | ||||||
| Limited partners' equity | 2,942 | 3,147 | ||||||
| Total liabilities and equity | 17,591 | 16,925 | ||||||
CAPITAL EXPENDITURES
Total sustaining capital expenditures are in line with the long-term plan for 2013 and are expected to be between $50 million to $70 million annually.
Project costs on the 45 MW hydroelectric project in British Columbia are expected to be $200 million. The project is progressing on scope, schedule and budget.
GUARANTEES
Brookfield Renewable, on behalf of its subsidiaries, and subsidiaries of Brookfield Renewable provided letters of credit, which include, but are not limited to, guarantees for debt service reserves, capital reserves, construction completion and performance. As at September 30, 2013 letters of credit issued by subsidiaries of Brookfield Renewable amounted to $93 million.
In the normal course of operations, we execute agreements that provide for indemnification and guarantees to third parties in transactions such as acquisitions, construction projects, capital projects, and purchases of assets. We have also agreed to indemnify our directors and certain of our officers and employees. The nature of the indemnifications prevents us from making a reasonable estimate of the maximum potential amount that could be required to pay third parties, as many of the agreements do not specify a maximum amount and the amounts are dependent upon the outcome of future contingent events, the nature and likelihood of which cannot be determined at this time. Historically, we have made no significant payments under indemnification agreements.
OFF-BALANCE SHEET ARRANGEMENTS
Brookfield Renewable has no off-balance sheet financing arrangements.
| RELATED PARTY TRANSACTIONS |
Brookfield Renewable’s related party transactions are in the normal course of business, and are recorded at the exchange amount. Brookfield Renewable’s related party transactions are primarily with Brookfield Asset Management. |
Brookfield Renewable sells electricity to subsidiaries of Brookfield Asset Management through long-term power purchase agreements to provide stable cash flow and reduce Brookfield Renewable’s exposure to electricity prices in deregulated power markets. Brookfield Renewable also benefits from a wind levelization agreement with a subsidiary of Brookfield Asset Management which reduces the exposure to the fluctuation of wind generation at certain facilities and thus improves the stability of its cash flow. |
In addition to these agreements, Brookfield Renewable and Brookfield Asset Management have executed other agreements that are fully described in Note 8 — Related Party Transactions in our December 31, 2012 audited consolidated financial statements. |
| Brookfield Renewable Energy Partners L.P | Q3 2013 Interim Report | September 30, 2013 |
| Page 29 |
| The following table reflects the related party agreements and transactions on the interim consolidated statements of income (loss): |
| Three months ended Sep 30 | Nine months ended Sep 30 | |||||||||||||||
| (MILLIONS) | 2013 | 2012 | 2013 | 2012 | ||||||||||||
| Revenues | ||||||||||||||||
| Purchase and revenue support agreements | $ | 102 | $ | 54 | $ | 339 | $ | 289 | ||||||||
| Wind levelization agreement | 3 | 1 | 5 | 1 | ||||||||||||
| $ | 105 | $ | 55 | $ | 344 | $ | 290 | |||||||||
| Direct operating costs | ||||||||||||||||
| Energy purchases | $ | (8 | ) | $ | (8 | ) | $ | (26 | ) | $ | (38 | ) | ||||
| Energy marketing fee | (5 | ) | (5 | ) | (15 | ) | (14 | ) | ||||||||
| Insurance services | (6 | ) | (5 | ) | (19 | ) | (13 | ) | ||||||||
| $ | (19 | ) | $ | (18 | ) | $ | (60 | ) | $ | (65 | ) | |||||
| Management service costs | $ | (9 | ) | $ | (10 | ) | $ | (32 | ) | $ | (25 | ) | ||||
| Brookfield Renewable Energy Partners L.P | Q3 2013 Interim Report | September 30, 2013 |
| Page 30 |
CONSOLIDATED STATEMENTS OF CASH FLOWS |
| The following table summarizes the key items on the consolidated statements of cash flows: |
| Three months ended Sep 30 | Nine months ended Sep 30 | |||||||||||||||
| (MILLIONS) | 2013 | 2012 | 2013 | 2012 | ||||||||||||
| Cash flow provided by (used in): | ||||||||||||||||
| Operating activities | $ | 225 | $ | 84 | $ | 655 | $ | 378 | ||||||||
| Financing activities | (275 | ) | (204 | ) | (246 | ) | (402 | ) | ||||||||
| Investing activities | 4 | 61 | (355 | ) | (17 | ) | ||||||||||
| Foreign exchange (loss) gain on cash | - | 1 | (6 | ) | (7 | ) | ||||||||||
| (Decrease) increase in cash and cash | ||||||||||||||||
| equivalents | $ | (46 | ) | �� | $ | (58 | ) | $ | 48 | $ | (48 | ) | ||||
Cash and cash equivalents as at September 30, 2013 totaled $185 million, representing an increase of $48 million since December 31, 2012. |
Operating Activities |
Cash flows provided by operating activities totaled $225 million for the three months ended September 30, 2013, resulting in a year-over-year increase of $141 million. |
Cash flows provided by operating activities totaled $655 million for nine months ended September 30, 2013, resulting in a year-over-year increase of $277 million. |
The increases are primarily attributable to funds from operations and net changes in working capital balances. |
Financing Activities |
Cash flows used in financing activities totaled $275 million for the three months ended September 30, 2013. The net repayments on existing borrowings and distributions totaled $341 million and $139 million, respectively. Upon closing of a private fund sponsored by Brookfield Asset Management, institutional partners co-invested 49.9% in our recently acquired, 360 MW portfolio of hydroelectric generation facilities located in the Northeastern United States for $205 million. |
For the three months ended September 30, 2013 cash distributions to shareholders were $95 million (2012: $92 million). The distributions related to preferred shareholders and participating non-controlling interests - in operating subsidiaries were $10 million and $34 million, respectively (2012: $3 million and $ nil, respectively). |
| Cash flows used in financing activities totaled $246 million for the nine months ended September 30, 2013. Repayments related to subsidiary borrowings and credit facilities were approximately $1.6 billion. Long-term debt increased by $1.2 billion due to the growth in our portfolio and re-financings at two Ontario wind facilities. Capital was provided from the issuance of C$175 million of Series 5 and Series 6 Class A Preference Shares and the $246 million from participating non-controlling interests. |
For the nine months ended September 30, 2013 cash distributions to shareholders were $282 million (2012: $271 million). The distributions related to preferred shareholders and participating non-controlling interests - in operating subsidiaries were $25 million and $113 million, respectively (2012: $10 million and $23 million, respectively). |
Investing Activities |
Cash flows provided by investing activities for the three months September 30, 2013 totaled $4 million and related primarily to cash inflows that were partially offset by the continued investment in construction of renewable power generating assets of $33 million and sustaining capital expenditures of $23 million. |
Cash flows used in investing activities for the nine months ended September 30, 2013 totaled $355 million. Our investments were with respect to the acquisition of 443 MW of hydroelectric facilities and 165 MW of wind portfolio that when combined totaled $243 million. In addition, our investment in construction of renewable power generating assets amounted to $113 million and sustainable capital expenditures totaled $44 million. |
| Brookfield Renewable Energy Partners L.P | Q3 2013 Interim Report | September 30, 2013 |
| Page 31 |
NON-CONTROLLING INTERESTS |
Preferred equity |
In January 2013 and May 2013 we issued C$175 million of Series 5 and Series 6 Class A preference shares with fixed, annual, cumulative dividends yielding 5%. The net proceeds were used to repay outstanding indebtedness and for general corporate purposes. |
For the three and nine months ended September 30, 2013, dividends declared on all series of preference shares were $10 million and $27 million respectively (2012: $3 million and $10 million). |
As at September 30, 2013, no preference shares have been redeemed. |
General partnership interest in a holding subsidiary held by Brookfield |
| Brookfield, as the owner of the 1% general partnership interest in BRELP, is entitled to regular distributions plus an incentive distribution based on the amount by which quarterly distributions exceed specified target levels. To the extent that distributions exceed $0.375 per unit per quarter, the incentive is 15% of distributions above this threshold. To the extent that quarterly distributions exceed $0.4225 per unit, the incentive distribution is equal to 25% of distributions above this threshold. During the nine months ended September 30, 2013, no incentive distributions were paid. |
Participating non-controlling interests - in a holding subsidiary - Redeemable/Exchangeable units held by Brookfield |
| BRELP has issued Redeemable/Exchangeable Partnership Units to Brookfield Asset Management, which may at the request of the holder, require BRELP to redeem these units for cash consideration after a mandatory two-year holding period from the date of issuance. The right is subject to Brookfield Renewable’s right of first refusal which entitles it, at its sole discretion, to elect to acquire all of the units presented to BRELP that are tendered for redemption in exchange for LP Units. If Brookfield Renewable elects not to exchange the Redeemable/Exchangeable Partnership Units for LP Units, the Redeemable/Exchangeable Partnership Units are required to be redeemed for cash. As Brookfield Renewable, at its sole discretion, has the right to settle the obligation with LP Units, the Redeemable/Exchangeable Partnership Units are classified as equity, and not as a liability. |
For the three and nine months ended September 30, 2013, BRELP declared distributions on Redeemable/Exchangeable Partnership Unit to Brookfield Asset Management of $47 million and $141 million respectively (2012: $45 million and $134 million). |
As at September 30, 2013, Redeemable/Exchangeable Partnership Units outstanding were 129,658,623. |
| LIMITED PARTNERS’ EQUITY |
A secondary offering was completed during the first quarter of 2013 in which Brookfield Asset Management sold 8,065,000 of its LP Units at an offering price of C$31.00 per LP Unit. As a result, Brookfield Asset Management now owns, directly and indirectly, 169,685,609 LP Units and Redeemable/Exchangeable partnership units, representing approximately 65% of Brookfield Renewable on a fully-exchanged basis. The fully-exchanged amounts assume the exchange of LP Units for the participating non-controlling interests in BRELP, which may or may not occur since Brookfield can elect to continue to hold its direct interest in BRELP through Redeemable/Exchangeable partnership units rather than exchanging this interest for LP Units. |
Brookfield Renewable maintains a distribution reinvestment plan, which allows holders of LP Units who are resident in Canada to acquire additional LP Units by reinvesting all or a portion of their cash distributions without paying commissions. The LP Units increased by 21,832 and 57,785, respectively for the three and nine months ended September 30, 2013 (2012: 11,587 and 57,359, respectively). |
| As at September 30, 2013, the total amount of LP Units outstanding were 132,959,701. |
Distributions |
For the three and nine months ended September 30, 2013, Brookfield Renewable declared distributions on its LP Units of $49 million and $145 million or $0.3625 and $1.09 per LP Unit respectively (2012: $46 million and $138 million or $0.345 and $1.04 per LP Unit respectively). |
| Brookfield Renewable Energy Partners L.P | Q3 2013 Interim Report | September 30, 2013 |
| Page 32 |
The composition of the distribution is presented in the following table: |
| Three months ended Sep 30 | Nine months ended Sep 30 | |||||||||||||||
| (MILLIONS) | 2013 | 2012 | 2013 | 2012 | ||||||||||||
| Brookfield Asset Management | $ | 15 | $ | 17 | $ | 44 | $ | 50 | ||||||||
| External LP Unitholders | 34 | 29 | 101 | 88 | ||||||||||||
| $ | 49 | $ | 46 | $ | 145 | $ | 138 | |||||||||
During the nine months ended September 30, 2013, unitholder distributions were increased to $1.45 per unit from $1.38 per unit, on an annualized basis. |
CRITICAL JUDGEMENTS IN APPLYING ACCOUNTING POLICIES |
The consolidated annual financial statements are prepared in accordance with IFRS, which require the use of estimates and judgments in reporting assets, liabilities, revenues, expenses and contingencies. In the judgment of management, none of the estimates outlined in Note 2 – Significant Accounting Policies in our audited consolidated financial statements for the year ended December 31, 2012 are considered critical accounting estimates as defined in regulation 51-102 with the exception of the estimates related to the valuation of property, plant and equipment and the related deferred income tax liabilities. These assumptions include estimates of future electricity prices, discount rates, expected long-term average generation, inflation rates, terminal year and operating and capital costs, the amount, the timing and the income tax rates of future income tax provisions. Estimates also include determination of accruals, purchase price allocations, useful lives, asset valuations, asset impairment testing, deferred tax liabilities, decommissioning retirement obligations and those relevant to the defined benefit pension and non-pension benefit plans in Mississagi Power Trust and Great Lakes Power Limited. Estimates are based on historical experience, current trends and various other assumptions that are believed to be reasonable under the circumstances. |
In making estimates, management relies on external information and observable conditions where possible, supplemented by internal analysis, as required. These estimates have been applied in a manner consistent with that in the prior year and there are no known trends, commitments, events or uncertainties that we believe will materially affect the methodology or assumptions utilized in this report. These estimates are impacted by, among other things, future power prices, movements in interest rates, foreign exchange and other factors, some of which are highly uncertain, as described in the analysis of business and environmental risks section of the 2012 Annual report. The interrelated nature of these factors prevents us from quantifying the overall impact of these movements on Brookfield Renewable’s financial statements in a meaningful way. These sources of estimation uncertainty relate in varying degrees to virtually all asset and liability account balances. Actual results could differ from those estimates. |
FUTURE CHANGES IN ACCOUNTING POLICIES |
(i) Financial Instruments |
| IFRS 9, Financial Instruments (“IFRS 9”) was issued by the IASB on October 28, 2010, and will replace IAS 39. IFRS 9 uses a single approach to determine whether a financial asset is measured at amortized cost or fair value, replacing the multiple rules in IAS 39. The approach in IFRS 9 is based on how an entity manages its financial instruments in the context of its business model and the contractual cash flow characteristics of the financial assets. Two measurement categories continue to exist to account for financial liabilities in IFRS 9, fair value through profit or loss (“FVTPL”) and amortized cost. Financial liabilities held for trading are measured at FVTPL, and all other financial liabilities are measured at amortized cost unless the fair value option is applied. The treatment of embedded derivatives under the new standard is consistent with IAS 39 and is applied to financial liabilities and non-derivative hosts not within the scope of the standard. IFRS 9 is effective for annual periods beginning on or after January 1, 2015. Management is currently evaluating the impact of IFRS 9 on the consolidated financial statements. |
| Brookfield Renewable Energy Partners L.P | Q3 2013 Interim Report | September 30, 2013 |
| Page 33 |
ADOPTION OF ACCOUNTING STANDARDS
The following new accounting standards were applied or adopted by Brookfield Renewable during the year and overall had no material impact on the interim consolidated financial statements. See Note 2 (c) – Significant accounting policies in our interim consolidated financial statements and Note 2 (q) – Future changes in accounting policies in the audited consolidated financial statements for the year ended December 31, 2012.
| · | IAS 1, Presentation of Items of Other Comprehensive Income – Amendments to IAS 1, |
| · | IFRS 10, Consolidated Financial Statements, |
| · | IFRS 11, Joint Arrangements, and IAS 28, Investment in Associates and Joint Ventures, |
| · | IFRS 12, Disclosure of Interests in Other Entities, |
| · | IFRS 13, Fair Value Measurement, |
| · | IAS 19, Employee Benefits (Revised 2011) (IAS 19R), and |
| · | IAS 34, Interim financial reporting and segment information for total assets and liabilities |
| Brookfield Renewable Energy Partners L.P | Q3 2013 Interim Report | September 30, 2013 |
| Page 34 |
| SUMMARY OF HISTORICAL QUARTERLY RESULTS ON A CONSOLIDATED BASIS |
The following is a summary of unaudited quarterly financial information for the last eight consecutive quarters: |
| 2013 | 2012 | 2011 | ||||||||||||||||||||||||||||||
| (MILLIONS, EXCEPT AS NOTED) | Q3 | Q2 | Q1 | Q4 | Q3 | Q2 | Q1 | Q4 | (1) | |||||||||||||||||||||||
Generation (GWh)(2) | 5,154 | 6,265 | 5,535 | 4,053 | 2,971 | 4,101 | 4,817 | 3,848 | ||||||||||||||||||||||||
| Revenues | $ | 392 | $ | 484 | $ | 437 | $ | 317 | $ | 229 | $ | 337 | $ | 426 | $ | 267 | ||||||||||||||||
Adjusted EBITDA(3) | 260 | 357 | 319 | 195 | 118 | 221 | 318 | 154 | ||||||||||||||||||||||||
Funds from operations(3) | 108 | 187 | 162 | 74 | 11 | 87 | 175 | 34 | ||||||||||||||||||||||||
| Net (loss) income: | ||||||||||||||||||||||||||||||||
| Non-controlling interests | ||||||||||||||||||||||||||||||||
| Preferred equity | 10 | 10 | 7 | 6 | 4 | 3 | 3 | 3 | ||||||||||||||||||||||||
| Participating non-controlling | ||||||||||||||||||||||||||||||||
| interests - in operating subsidiaries | 8 | 24 | 16 | (14 | ) | (11 | ) | (14 | ) | (1 | ) | 1 | ||||||||||||||||||||
| General partnership interest in a | ||||||||||||||||||||||||||||||||
| holding subsidiary held by Brookfield | - | - | 1 | (1 | ) | - | - | - | (1 | ) | ||||||||||||||||||||||
| Participating non-controlling | ||||||||||||||||||||||||||||||||
| interests - in a holding subsidiary | ||||||||||||||||||||||||||||||||
| Redeemable/Exchangeable | ||||||||||||||||||||||||||||||||
| units held by Brookfield | 5 | 22 | 30 | (27 | ) | (26 | ) | 4 | 14 | (44 | ) | |||||||||||||||||||||
| Limited partners' equity | 5 | 22 | 31 | (28 | ) | (26 | ) | 4 | 15 | (45 | ) | |||||||||||||||||||||
| 28 | 78 | 85 | (64 | ) | (59 | ) | (3 | ) | 31 | (86 | ) | |||||||||||||||||||||
| Basic and diluted earnings (loss) income | ||||||||||||||||||||||||||||||||
per LP Unit(4) | 0.04 | 0.17 | 0.23 | (0.20 | ) | (0.20 | ) | 0.03 | 0.11 | (0.33 | ) | |||||||||||||||||||||
| Distributions: | ||||||||||||||||||||||||||||||||
| Preferred equity | 10 | 10 | 7 | 6 | 3 | 4 | 3 | 3 | ||||||||||||||||||||||||
| General partnership interest in a holding | ||||||||||||||||||||||||||||||||
| subsidiary held by Brookfield | 1 | 1 | 1 | 1 | 1 | 1 | 1 | 1 | ||||||||||||||||||||||||
| Participating non-controlling | ||||||||||||||||||||||||||||||||
| interests - in a holding subsidiary - | ||||||||||||||||||||||||||||||||
| Redeemable/Exchangeable | ||||||||||||||||||||||||||||||||
| units held by Brookfield | 47 | 47 | 47 | 45 | 45 | 45 | 44 | 43 | ||||||||||||||||||||||||
| Limited partners' equity | 49 | 48 | 48 | 45 | 46 | 47 | 45 | 45 | ||||||||||||||||||||||||
| (1) | Comparative quarterly consolidated financial information for the year ended December 31, 2011 was revised to reflect adjustments, primarily related to deferred income tax and foreign currency translation, which were identified through the completion of the Combination. The adjustments do not impact the comparative annual consolidated financial information for the year ended December 31, 2011. |
| (2) | Actual generation includes 100% of generation from equity-accounted investments. |
| (3) | Non-IFRS measures. See "Cautionary Statement Regarding Use of Non-IFRS Measures". |
| (4) | Average LP Units outstanding during 2013 and 2012 totaled 132.9 million (2011: 132.8 million). |
RISK FACTORS |
| For a discussion on risks affecting our business, see our Annual Information Form, Form 20-F and other public disclosures which can be accessed on SEDAR and EDGAR. |
| Brookfield Renewable Energy Partners L.P | Q3 2013 Interim Report | September 30, 2013 |
| Page 35 |
| ADDITIONAL INFORMATION |
Additional information, including our Annual Information Form filed with securities regulators in Canada and our Form 20-F filed with the Securities Exchange Commission, are available on our website at www.brookfieldrenewable.com, on SEDAR’s website at www.sedar.com and on EDGAR’s website at www.sec.gov. |
SUBSEQUENT EVENTS |
In November 2013, we announced an agreement to acquire a 70 MW hydroelectric portfolio in Maine consisting of nine facilities on three rivers. The portfolio is expected to generate approximately 375 GWh annually. The acquisition is being pursued with institutional partners and we will assume an approximate 40% interest in the portfolio. |
We also announced an agreement to acquire, with our institutional partners, the remaining 50% interest in the 30 MW Malacha Hydro facility in California. We will retain an approximate 25% interest in the facility. |
| The transactions above are subject to regulatory approvals and other customary closing conditions and are expected to close before the end of 2013. |
| Brookfield Renewable Energy Partners L.P | Q3 2013 Interim Report | September 30, 2013 |
| Page 36 |
ADJUSTED EBITDA AND FUNDS FROM OPERATIONS ON A PRO FORMA BASIS ASSUMING LONG-TERM AVERAGE |
Revenues on a pro forma basis are computed by using long-term average generation for each facility, and multiplied by the pricing in the respective power purchase agreements, where applicable. The majority of direct operating costs are fixed, regardless of changes in generation levels or revenue, except for certain items such as water royalty fees which are charged based on generation or revenues and will vary from time to time. The following table reflects Adjusted EBITDA and funds from operations, assuming long-term average generation: |
| Three months ended Sep 30 | Nine months ended Sep 30 | |||||||||||||||
| (MILLIONS, EXCEPT AS NOTED) | 2013 | 2012 | 2013 | 2012 | ||||||||||||
| Generation (GWh) | 4,960 | 4,049 | 16,456 | 13,596 | ||||||||||||
| Revenues | $ | 369 | $ | 328 | $ | 1,275 | $ | 1,157 | ||||||||
| Other income | 1 | 2 | 5 | 12 | ||||||||||||
| Share of cash earnings from equity-accounted | ||||||||||||||||
| investments | 7 | 3 | 19 | 11 | ||||||||||||
| Direct operating costs | (139 | ) | (118 | ) | (399 | ) | (363 | ) | ||||||||
Adjusted EBITDA(1) | 238 | 215 | 900 | 817 | ||||||||||||
| Interest expense – borrowings | (105 | ) | (99 | ) | (313 | ) | (313 | ) | ||||||||
| Management service costs | (9 | ) | (10 | ) | (32 | ) | (25 | ) | ||||||||
| Current income taxes | (4 | ) | 1 | (15 | ) | (12 | ) | |||||||||
| Less: cash portion of non-controlling interests | ||||||||||||||||
| Preferred equity | (10 | ) | (3 | ) | (27 | ) | (10 | ) | ||||||||
| Participating non-controlling interests - in | ||||||||||||||||
| operating subsidiaries | (19 | ) | (11 | ) | (80 | ) | (38 | ) | ||||||||
Funds from operations(1) | $ | 91 | $ | 93 | $ | 433 | $ | 419 | ||||||||
| (1) | Non-IFRS measures. See “Cautionary Statement Regarding Use of Non-IFRS Measures”. |
| Brookfield Renewable Energy Partners L.P | Q3 2013 Interim Report | September 30, 2013 |
| Page 37 |
CAUTIONARY STATEMENT REGARDING FORWARD-LOOKING STATEMENTS |
| This Management's Discussion and Analysis contains forward-looking statements and information, within the meaning of Canadian securities laws and “forward-looking statements” within the meaning of Section 27A of the U.S. Securities Act of 1933, as amended, Section 21E of the U.S. Securities Exchange Act of 1934, as amended, “safe harbor” of the United States Private Securities Litigation Reform Act of 1995 and in any applicable Canadian securities regulations, concerning the business and operations of Brookfield Renewable. Forward-looking statements may include estimates, plans, expectations, opinions, forecasts, projections, guidance or other statements that are not statements of fact. Forward-looking statements in this Management's Discussion and Analysis include statements regarding the quality of Brookfield Renewable’s assets and the resiliency of the cash flow they will generate, Brookfield Renewable’s anticipated financial performance, future commissioning of assets, contracted portfolio, technology diversification, acquisition opportunities, expected completion of acquisitions, future energy prices and demand for electricity, economic recovery, the future growth prospects, achieving long term average generation, project development and capital expenditure costs, diversification of shareholder base, energy policies, economic growth, growth potential of renewable asset class and distribution profile of Brookfield Renewable and Brookfield Renewable’s access to capital. Forward-looking statements can be identified by the use of words such as “plans”, “expects”, “scheduled”, “estimates”, “intends”, “anticipates”, “believes”, “potentially”, “tends”, “continue”, “attempts”, “likely”, “primarily”, “approximately”, “endeavours”, “pursues”, “strives”, “seeks”, or variations of such words and phrases, or statements that certain actions, events or results “may”, “could”, “would”, “might” or “will” be taken, occur or be achieved. Although we believe that our anticipated future results, performance or achievements expressed or implied by the forward-looking statements and information in this Management's Discussion and Analysis are based upon reasonable assumptions and expectations, we cannot assure you that such expectations will prove to have been correct. You should not place undue reliance on forward-looking statements and information as such statements and information involve known and unknown risks, uncertainties and other factors which may cause our actual results, performance or achievements to differ materially from anticipated future results, performance or achievement expressed or implied by such forward-looking statements and information. |
Factors that could cause actual results to differ materially from those contemplated or implied by forward-looking statements include, but are not limited to: our limited operating history; the risk that we may be deemed an “investment company” under the Investment Company Act; the fact that we are not subject to the same disclosure requirements as a U.S. domestic issuer; the risk that the effectiveness of our internal controls over financial reporting could have a material effect on our business; changes to hydrology at our hydroelectric stations or in wind conditions at our wind energy facilities; the risk that counterparties to our contracts do not fulfill their obligations, and as our contracts expire, we may not be able to replace them with agreements on similar terms; increases in water rental costs (or similar fees) or changes to the regulation of water supply; volatility in supply and demand in the energy market; our operations are highly regulated and exposed to increased regulation which could result in additional costs; the risk that our concessions and licenses will not be renewed; increases in the cost of operating our plants; our failure to comply with conditions in, or our inability to maintain, governmental permits; equipment failure; dam failures and the costs of repairing such failures; exposure to force majeure events; exposure to uninsurable losses; adverse changes in currency exchange rates; availability and access to interconnection facilities and transmission systems; health, safety, security and environmental risks; disputes and litigation; our operations could be affected by local communities; losses resulting from fraud, bribery, corruption, other illegal acts, inadequate or failed internal processes or systems, or from external events; general industry risks relating to the North American and Brazilian power market sectors; advances in technology that impair or eliminate the competitive advantage of our projects; newly developed technologies in which we invest not performing as anticipated; labour disruptions and economically unfavourable collective bargaining agreements; our inability to finance our operations due to the status of the capital markets; the operating and financial restrictions imposed on us by our loan, debt and security agreements; changes in our credit ratings; changes to government regulations that provide incentives for renewable energy; our inability to identify and complete sufficient investment opportunities; the growth of our portfolio; our inability to develop existing sites or find new sites suitable for the development of greenfield projects; risks associated with the development of our generating facilities and the various types of arrangements we enter into with communities and joint venture partners; Brookfield Asset Management’s election not to source acquisition opportunities for us and our lack of access to all renewable power acquisitions that Brookfield Asset Management identifies; our lack of control over our operations conducted through joint ventures, partnerships and consortium arrangements; our ability to issue equity or debt for future acquisitions and developments will be dependent on capital markets; foreign laws or regulation to which we become subject as a result of future acquisitions in new markets; the departure of some or all of Brookfield’s key professionals; and the completion and expected benefits of announced transactions. |
| Brookfield Renewable Energy Partners L.P | Q3 2013 Interim Report | September 30, 2013 |
| Page 38 |
We caution that the foregoing list of important factors that may affect future results is not exhaustive. The forward-looking statements represent our views as of the date of this Management's Discussion and Analysis and should not be relied upon as representing our views as of any date subsequent to November 6, 2013, the date of this Management's Discussion and Analysis. While we anticipate that subsequent events and developments may cause our views to change, we disclaim any obligation to update the forward-looking statements, other than as required by applicable law. For further information on these known and unknown risks, please see “Risk Factors” included in our Annual Information Form and Form 20-F. |
CAUTIONARY STATEMENT REGARDING USE OF NON-IFRS MEASURES |
This Management's Discussion and Analysis contains references to Adjusted EBITDA, funds from operations, adjusted funds from operations and net asset value which are not generally accepted accounting measures under IFRS and therefore may differ from definitions of Adjusted EBITDA, funds from operations, adjusted funds from operations and net asset value used by other entities. We believe that Adjusted EBITDA, funds from operations, adjusted funds from operations and net asset value are useful supplemental measures that may assist investors in assessing the financial performance and the cash anticipated to be generated by our operating portfolio. Neither Adjusted EBITDA, funds from operations, adjusted funds from operations nor net asset value should be considered as the sole measure of our performance and should not be considered in isolation from, or as a substitute for, analysis of our financial statements prepared in accordance with IFRS. |
A reconciliation of Adjusted EBITDA, funds from operations and adjusted funds from operations to net income is presented in our Management’s Discussion and Analysis and in Note 14 — Segmented information in our interim consolidated financial statements. |
| Brookfield Renewable Energy Partners L.P | Q3 2013 Interim Report | September 30, 2013 |
| Page 39 |
| BROOKFIELD RENEWABLE ENERGY PARTNERS L.P. | ||||||||||||
| CONSOLIDATED BALANCE SHEETS | ||||||||||||
| Sep 30 | Dec 31 | |||||||||||
| 2013 | 2012 | |||||||||||
| Restated | ||||||||||||
| UNAUDITED (MILLIONS) | Notes | (See Note 2(c)) | ||||||||||
| Assets | ||||||||||||
| Current assets | ||||||||||||
| Cash and cash equivalents | $ | 185 | $ | 137 | ||||||||
| Restricted cash | 206 | 157 | ||||||||||
| Trade receivables and other current assets | 159 | 194 | ||||||||||
| Due from related parties | 28 | 34 | ||||||||||
| 578 | 522 | |||||||||||
| Due from related parties | - | 22 | ||||||||||
| Equity-accounted investments | 6 | 314 | 344 | |||||||||
| Property, plant and equipment, at fair value | 7 | 16,336 | 15,658 | |||||||||
| Intangible assets | 35 | 44 | ||||||||||
| Deferred income tax assets | 10 | 112 | 81 | |||||||||
| Other long-term assets | 216 | 254 | ||||||||||
| $ | 17,591 | $ | 16,925 | |||||||||
| Liabilities | ||||||||||||
| Current liabilities | ||||||||||||
| Accounts payable and accrued liabilities | 8 | $ | 280 | $ | 207 | |||||||
| Financial instrument liabilities | 4 | 74 | 113 | |||||||||
| Due to related parties | 116 | 109 | ||||||||||
| Current portion of long-term debt | 9 | 520 | 532 | |||||||||
| 990 | 961 | |||||||||||
| Financial instrument liabilities | 4 | - | 32 | |||||||||
| Long-term debt and credit facilities | 9 | 6,134 | 5,587 | |||||||||
| Deferred income tax liabilities | 10 | 2,414 | 2,349 | |||||||||
| Other long-term liabilities | 174 | 188 | ||||||||||
| 9,712 | 9,117 | |||||||||||
| Equity | ||||||||||||
| Non-controlling interests | ||||||||||||
| Preferred equity | 11 | 821 | 500 | |||||||||
| Participating non-controlling interests - in operating subsidiaries | 11 | 1,188 | 1,028 | |||||||||
| General partnership interest in a holding subsidiary held by | ||||||||||||
| Brookfield | 11 | 59 | 63 | |||||||||
| Participating non-controlling interests - in a holding subsidiary - | ||||||||||||
| Redeemable/Exchangeable units held by Brookfield | 11 | 2,869 | 3,070 | |||||||||
| Limited partners' equity | 12 | 2,942 | 3,147 | |||||||||
| 7,879 | 7,808 | |||||||||||
| $ | 17,591 | $ | 16,925 | |||||||||
| The accompanying notes are an integral part of these interim consolidated financial statements. | ||||||||||||
| Approved on behalf of Brookfield Renewable Energy Partners L.P.: |
 |  |
| Patricia Zuccotti | David Mann |
| Director | Director |
| Brookfield Renewable Energy Partners L.P | Q3 2013 Interim Report | September 30, 2013 |
| Page 40 |
| BROOKFIELD RENEWABLE ENERGY PARTNERS L.P. | ||||||||||||||||||||
| CONSOLIDATED STATEMENTS OF INCOME (LOSS) | ||||||||||||||||||||
| Three months ended Sep 30 | Nine months ended Sep 30 | |||||||||||||||||||
| 2013 | 2012 | 2013 | 2012 | |||||||||||||||||
| UNAUDITED | Restated | Restated | ||||||||||||||||||
| (MILLIONS, EXCEPT PER UNIT AMOUNTS) | Notes | (see note 16) | (see note 16) | |||||||||||||||||
| Revenues | 5 | $ | 392 | $ | 229 | $ | 1,313 | $ | 992 | |||||||||||
| Other income | 1 | 2 | 5 | 12 | ||||||||||||||||
| Direct operating costs | (140 | ) | (116 | ) | (401 | ) | (358 | ) | ||||||||||||
| Management service costs | 5 | (9 | ) | (10 | ) | (32 | ) | (25 | ) | |||||||||||
| Interest expense – borrowings | (105 | ) | (99 | ) | (313 | ) | (313 | ) | ||||||||||||
| Share of earnings (loss) from equity-accounted | ||||||||||||||||||||
| investments | 6 | 3 | (2 | ) | 9 | (2 | ) | |||||||||||||
| Unrealized financial instrument gain (loss) | 4 | 11 | 6 | 30 | (6 | ) | ||||||||||||||
| Depreciation and amortization | 7 | (133 | ) | (117 | ) | (398 | ) | (360 | ) | |||||||||||
| Other | 3 | 2 | 10 | (6 | ) | 1 | ||||||||||||||
| Income (loss) before income taxes | 22 | (97 | ) | 207 | (59 | ) | ||||||||||||||
| Income tax recovery (expense) | ||||||||||||||||||||
| Current | 10 | (4 | ) | 1 | (15 | ) | (12 | ) | ||||||||||||
| Deferred | 10 | 10 | 37 | (1 | ) | 40 | ||||||||||||||
| 6 | 38 | (16 | ) | 28 | ||||||||||||||||
| Net income (loss) | $ | 28 | $ | (59 | ) | $ | 191 | $ | (31 | ) | ||||||||||
| Net income (loss) attributable to: | ||||||||||||||||||||
| Non-controlling interests | ||||||||||||||||||||
| Preferred equity | 11 | $ | 10 | $ | 4 | $ | 27 | $ | 10 | |||||||||||
| Participating non-controlling interests - in | ||||||||||||||||||||
| operating subsidiaries | 11 | 8 | (11 | ) | 48 | (26 | ) | |||||||||||||
| General partnership interest in a holding | ||||||||||||||||||||
| subsidiary held by Brookfield | 11 | - | - | 1 | - | |||||||||||||||
| Participating non-controlling interests - in a | ||||||||||||||||||||
| holding subsidiary - | ||||||||||||||||||||
| Redeemable/Exchangeable units held by | ||||||||||||||||||||
| Brookfield | 11 | 5 | (26 | ) | 57 | (8 | ) | |||||||||||||
| Limited partners' equity | 12 | 5 | (26 | ) | 58 | (7 | ) | |||||||||||||
| $ | 28 | $ | (59 | ) | $ | 191 | $ | (31 | ) | |||||||||||
| Basic and diluted earnings (loss) per LP Unit | $ | 0.04 | $ | (0.20 | ) | $ | 0.44 | $ | (0.06 | ) | ||||||||||
| The accompanying notes are an integral part of these interim consolidated financial statements. | ||||||||||||||||||||
| Brookfield Renewable Energy Partners L.P | Q3 2013 Interim Report | September 30, 2013 |
| Page 41 |
| BROOKFIELD RENEWABLE ENERGY PARTNERS L.P. | ||||||||||||||||||||
| CONSOLIDATED STATEMENTS OF COMPREHENSIVE INCOME (LOSS) | ||||||||||||||||||||
| Three months ended Sep 30 | Nine months ended Sep 30 | |||||||||||||||||||
| 2013 | 2012 | 2013 | 2012 | |||||||||||||||||
| UNAUDITED | Restated | Restated | ||||||||||||||||||
| (MILLIONS) | Notes | (See Notes 2(c) and 16) | (See Notes 2(c) and 16) | |||||||||||||||||
| Net income (loss) | $ | 28 | $ | (59 | ) | $ | 191 | $ | (31 | ) | ||||||||||
| Other comprehensive income (loss) that will not be | ||||||||||||||||||||
| reclassified to net income (loss) | ||||||||||||||||||||
| Revaluations of property, plant and equipment | 6,7 | - | - | - | 53 | |||||||||||||||
| Actuarial losses on defined benefit plans | 2 | 9 | - | 9 | (8 | ) | ||||||||||||||
| Deferred income taxes on above items | 10 | (2 | ) | - | (2 | ) | 1 | |||||||||||||
| Total items that will not be reclassified to net income (loss) | 7 | - | 7 | 46 | ||||||||||||||||
| Other comprehensive income (loss) that may be | ||||||||||||||||||||
| reclassified to net income (loss) | ||||||||||||||||||||
| Financial instruments designated as cash-flow | ||||||||||||||||||||
| hedges | ||||||||||||||||||||
| Gains (losses) arising during the period | 4 | (1 | ) | (2 | ) | 49 | (5 | ) | ||||||||||||
| Reclassification adjustments for amounts | ||||||||||||||||||||
| recognized in net income (loss) | 4 | (9 | ) | (3 | ) | (5 | ) | 8 | ||||||||||||
| Foreign currency translation | 31 | 66 | (316 | ) | (114 | ) | ||||||||||||||
| Deferred income taxes on above items | 10 | (1 | ) | - | (13 | ) | (3 | ) | ||||||||||||
| Total items that may be reclassified subsequently | ||||||||||||||||||||
| to net income (loss) | 20 | 61 | (285 | ) | (114 | ) | ||||||||||||||
| Other comprehensive income (loss) | 27 | 61 | (278 | ) | (68 | ) | ||||||||||||||
| Comprehensive income (loss) | $ | 55 | $ | 2 | $ | (87 | ) | $ | (99 | ) | ||||||||||
| Comprehensive income (loss) attributable to: | ||||||||||||||||||||
| Non-controlling interests | ||||||||||||||||||||
| Preferred equity | 11 | $ | 27 | $ | 12 | $ | (1 | ) | $ | 19 | ||||||||||
| Participating non-controlling interests - in | ||||||||||||||||||||
| operating subsidiaries | 11 | 6 | (10 | ) | 34 | (26 | ) | |||||||||||||
| General partnership interest in a holding | ||||||||||||||||||||
| subsidiary held by Brookfield | 11 | - | - | (1 | ) | (2 | ) | |||||||||||||
| Participating non-controlling interests - in a | ||||||||||||||||||||
| holding subsidiary - Redeemable/Exchangeable | ||||||||||||||||||||
| units held by Brookfield | 11 | 11 | - | (59 | ) | (45 | ) | |||||||||||||
| Limited partners' equity | 12 | 11 | - | (60 | ) | (45 | ) | |||||||||||||
| $ | 55 | $ | 2 | $ | (87 | ) | $ | (99 | ) | |||||||||||
| The accompanying notes are an integral part of these interim consolidated financial statements. | ||||||||||||||||||||
| Brookfield Renewable Energy Partners L.P | Q3 2013 Interim Report | September 30, 2013 |
| Page 42 |
| BROOKFIELD RENEWABLE ENERGY PARTNERS L.P. | ||||||||||||||||||||||||||||||||||||||||||||
| CONSOLIDATED STATEMENTS OF CHANGES IN EQUITY | ||||||||||||||||||||||||||||||||||||||||||||
| Accumulated other comprehensive income | ||||||||||||||||||||||||||||||||||||||||||||
THREE MONTHS ENDED SEPTEMBER 30 | Limited | Foreign | Actuarial losses on | Total limited | Participating non-controlling | General interest in | Participating non-controlling interests - in a - Redeemable /Exchangeable | |||||||||||||||||||||||||||||||||||||
| UNAUDITED | partners' | currency | Revaluation | benefit | Cash flow | partners' | Preferred | operating | held by | units held by | Total | |||||||||||||||||||||||||||||||||
| (MILLIONS) | equity | translation | surplus | plans | hedges | equity | equity | subsidiaries | Brookfield | Brookfield | equity | |||||||||||||||||||||||||||||||||
| Balance, as at June 30, 2012 | $ | (81 | ) | $ | 111 | $ | 3,039 | $ | - | $ | (33 | ) | $ | 3,036 | $ | 242 | $ | 724 | $ | 60 | $ | 2,966 | $ | 7,028 | ||||||||||||||||||||
| Effect of retrospectively adopting IAS 19R | - | - | - | (11 | ) | - | (11 | ) | - | - | - | (11 | ) | (22 | ) | |||||||||||||||||||||||||||||
| Balance at June 30, 2012 (restated) | $ | (81 | ) | $ | 111 | $ | 3,039 | $ | (11 | ) | $ | (33 | ) | $ | 3,025 | $ | 242 | $ | 724 | $ | 60 | $ | 2,955 | $ | 7,006 | |||||||||||||||||||
| Net income (loss) | (26 | ) | - | - | - | - | (26 | ) | 4 | (11 | ) | - | (26 | ) | (59 | ) | ||||||||||||||||||||||||||||
| Other comprehensive income (loss) | - | 29 | - | - | (3 | ) | 26 | 8 | 1 | - | 26 | 61 | ||||||||||||||||||||||||||||||||
| Acquisitions | - | - | - | - | - | - | - | 17 | - | - | 17 | |||||||||||||||||||||||||||||||||
| Distributions | (46 | ) | - | - | - | - | (46 | ) | (3 | ) | - | (1 | ) | (45 | ) | (95 | ) | |||||||||||||||||||||||||||
| Other | (2 | ) | - | 4 | - | - | 2 | (1 | ) | (3 | ) | 1 | - | (1 | ) | |||||||||||||||||||||||||||||
| Change in period | (74 | ) | 29 | 4 | - | (3 | ) | (44 | ) | 8 | 4 | - | (45 | ) | (77 | ) | ||||||||||||||||||||||||||||
| Balance, as at September 30, 2012 (restated) | $ | (155 | ) | $ | 140 | $ | 3,043 | $ | (11 | ) | $ | (36 | ) | $ | 2,981 | $ | 250 | $ | 728 | $ | 60 | $ | 2,910 | $ | 6,929 | |||||||||||||||||||
| Balance as at June 30, 2013 | $ | (258 | ) | $ | (15 | ) | $ | 3,271 | $ | (11 | ) | $ | (9 | ) | $ | 2,978 | $ | 804 | $ | 1,019 | $ | 59 | $ | 2,904 | $ | 7,764 | ||||||||||||||||||
| Net income | 5 | - | - | - | - | 5 | 10 | 8 | - | 5 | 28 | |||||||||||||||||||||||||||||||||
| Other comprehensive income (loss) | - | 4 | - | 4 | (2 | ) | 6 | 17 | (2 | ) | - | 6 | 27 | |||||||||||||||||||||||||||||||
| Acquisitions (note 3) | - | - | - | - | - | - | - | 205 | - | - | 205 | |||||||||||||||||||||||||||||||||
| Distributions | (49 | ) | - | - | - | - | (49 | ) | (10 | ) | (33 | ) | (1 | ) | (47 | ) | (140 | ) | ||||||||||||||||||||||||||
| Contributions and other | 2 | - | - | - | - | 2 | - | (9 | ) | 1 | 1 | (5 | ) | |||||||||||||||||||||||||||||||
| Change in period | (42 | ) | 4 | - | 4 | (2 | ) | (36 | ) | 17 | 169 | - | (35 | ) | 115 | |||||||||||||||||||||||||||||
| Balance, as at September 30, 2013 | $ | (300 | ) | $ | (11 | ) | $ | 3,271 | $ | (7 | ) | $ | (11 | ) | $ | 2,942 | $ | 821 | $ | 1,188 | $ | 59 | $ | 2,869 | $ | 7,879 | ||||||||||||||||||
| The accompanying notes are an integral part of these interim consolidated financial statements. | ||||||||||||||||||||||||||||||||||||||||||||
| Brookfield Renewable Energy Partners L.P | Q3 2013 Interim Report | September 30, 2013 |
| Page 43 |
| BROOKFIELD RENEWABLE ENERGY PARTNERS L.P. | ||||||||||||||||||||||||||||||||||||||||||||
| CONSOLIDATED STATEMENTS OF CHANGES IN EQUITY | ||||||||||||||||||||||||||||||||||||||||||||
| Accumulated other comprehensive income | ||||||||||||||||||||||||||||||||||||||||||||
NINE MONTHS ENDED SEPTEMBER 30 | Limited | Foreign | Actuarial losses on | Total limited | Participating non-controlling | General partnership | Participating non-controllingholding subsidiary - Redeemable | |||||||||||||||||||||||||||||||||||||
| UNAUDITED | partners' | currency | Revaluation | benefit | Cash flow | partners' | Preferred | operating | held by | units held by | Total | |||||||||||||||||||||||||||||||||
| (MILLIONS) | equity | translation | surplus | plans | hedges | equity | equity | subsidiaries | Brookfield | Brookfield | equity | |||||||||||||||||||||||||||||||||
| Balance, as at January 1, 2012 | $ | (9 | ) | $ | 194 | $ | 3,015 | $ | - | $ | (31 | ) | $ | 3,169 | $ | 241 | $ | 629 | $ | 64 | $ | 3,097 | $ | 7,200 | ||||||||||||||||||||
| Effect of retrospectively adopting IAS 19R | - | - | - | (8 | ) | - | (8 | ) | - | - | - | (8 | ) | (16 | ) | |||||||||||||||||||||||||||||
| Balance at January 1, 2012 (restated) | $ | (9 | ) | $ | 194 | $ | 3,015 | $ | (8 | ) | $ | (31 | ) | $ | 3,161 | $ | 241 | $ | 629 | $ | 64 | $ | 3,089 | $ | 7,184 | |||||||||||||||||||
| Net income (loss) | (7 | ) | - | - | - | - | (7 | ) | 10 | (26 | ) | - | (8 | ) | (31 | ) | ||||||||||||||||||||||||||||
| Other comprehensive income (loss) | - | (54 | ) | 24 | (3 | ) | (5 | ) | (38 | ) | 9 | - | (2 | ) | (37 | ) | (68 | ) | ||||||||||||||||||||||||||
| Acquisitions | - | - | - | - | - | - | - | 146 | - | - | 146 | |||||||||||||||||||||||||||||||||
| Distributions | (138 | ) | - | - | - | - | (138 | ) | (10 | ) | (23 | ) | (3 | ) | (134 | ) | (308 | ) | ||||||||||||||||||||||||||
| Other | (1 | ) | - | 4 | - | - | 3 | - | 2 | 1 | - | 6 | ||||||||||||||||||||||||||||||||
| Change in period | (146 | ) | (54 | ) | 28 | (3 | ) | (5 | ) | (180 | ) | 9 | 99 | (4 | ) | (179 | ) | (255 | ) | |||||||||||||||||||||||||
| Balance, as at September 30, 2012 (restated) | $ | (155 | ) | $ | 140 | $ | 3,043 | $ | (11 | ) | $ | (36 | ) | $ | 2,981 | $ | 250 | $ | 728 | $ | 60 | $ | 2,910 | $ | 6,929 | |||||||||||||||||||
| Balance, as at January 1, 2013 | $ | (227 | ) | $ | 125 | $ | 3,285 | $ | - | $ | (25 | ) | $ | 3,158 | $ | 500 | $ | 1,028 | $ | 63 | $ | 3,081 | $ | 7,830 | ||||||||||||||||||||
| Effect of retrospectively adopting IAS 19R | - | - | - | (11 | ) | - | (11 | ) | - | - | - | (11 | ) | (22 | ) | |||||||||||||||||||||||||||||
| Balance as at January 1, 2013 (restated) | $ | (227 | ) | $ | 125 | $ | 3,285 | $ | (11 | ) | $ | (25 | ) | $ | 3,147 | $ | 500 | $ | 1,028 | $ | 63 | $ | 3,070 | $ | 7,808 | |||||||||||||||||||
| Net income | 58 | - | - | - | - | 58 | 27 | 48 | 1 | 57 | 191 | |||||||||||||||||||||||||||||||||
| Other comprehensive income (loss) | - | (136 | ) | - | 4 | 14 | (118 | ) | (28 | ) | (14 | ) | (2 | ) | (116 | ) | (278 | ) | ||||||||||||||||||||||||||
| Shares issued | - | - | - | - | - | - | 349 | - | - | - | 349 | |||||||||||||||||||||||||||||||||
| Acquisitions (note 3) | 14 | - | (14 | ) | - | - | - | - | 205 | - | - | 205 | ||||||||||||||||||||||||||||||||
| Distributions | (145 | ) | - | - | - | - | (145 | ) | (27 | ) | (113 | ) | (3 | ) | (141 | ) | (429 | ) | ||||||||||||||||||||||||||
| Contributions and other | - | - | - | - | - | - | - | 34 | - | (1 | ) | 33 | ||||||||||||||||||||||||||||||||
| Change in period | (73 | ) | (136 | ) | (14 | ) | 4 | 14 | (205 | ) | 321 | 160 | (4 | ) | (201 | ) | 71 | |||||||||||||||||||||||||||
| Balance, as at September 30, 2013 | $ | (300 | ) | $ | (11 | ) | $ | 3,271 | $ | (7 | ) | $ | (11 | ) | $ | 2,942 | $ | 821 | $ | 1,188 | $ | 59 | $ | 2,869 | $ | 7,879 | ||||||||||||||||||
| The accompanying notes are an integral part of these interim consolidated financial statements. | ||||||||||||||||||||||||||||||||||||||||||||
| Brookfield Renewable Energy Partners L.P | Q3 2013 Interim Report | September 30, 2013 |
| Page 44 |
| BROOKFIELD RENEWABLE ENERGY PARTNERS L.P. | ||||||||||||||||||||
| CONSOLIDATED STATEMENTS OF CASH FLOWS | ||||||||||||||||||||
| Three months ended | Nine months ended | |||||||||||||||||||
| UNAUDITED | Sep 30 | Sep 30 | ||||||||||||||||||
| (MILLIONS) | Notes | 2013 | 2012 | 2013 | 2012 | |||||||||||||||
| Operating activities | ||||||||||||||||||||
| Net income (loss) | $ | 28 | $ | (59 | ) | $ | 191 | $ | (31 | ) | ||||||||||
| Adjustments for the following non-cash items: | ||||||||||||||||||||
| Depreciation and amortization | 7 | 133 | 117 | 398 | 360 | |||||||||||||||
| Unrealized financial instrument (gain) loss | 4 | (11 | ) | (6 | ) | (30 | ) | 6 | ||||||||||||
| Share of (earnings) loss from equity accounted | ||||||||||||||||||||
| investments | 6 | (3 | ) | 2 | (9 | ) | 2 | |||||||||||||
| Deferred income tax expense (recovery) | 10 | (10 | ) | (37 | ) | 1 | (40 | ) | ||||||||||||
| Other non-cash items | 1 | (6 | ) | 3 | 23 | |||||||||||||||
| Dividends received from equity-accounted investments | 8 | 1 | 14 | 8 | ||||||||||||||||
| Net change in working capital balances | 79 | 72 | 87 | 50 | ||||||||||||||||
| 225 | 84 | 655 | 378 | |||||||||||||||||
| Financing activities | ||||||||||||||||||||
| Long-term debt – borrowings | 9 | - | 448 | 1,222 | 1,294 | |||||||||||||||
| Long-term debt – repayments | 9 | (341 | ) | (582 | ) | (1,631 | ) | (1,534 | ) | |||||||||||
| Capital provided by participating non-controlling interests - | ||||||||||||||||||||
| in operating subsidiaries | 3,11 | 205 | 25 | 246 | 142 | |||||||||||||||
| Issuance of preferred equity | 11 | - | - | 337 | - | |||||||||||||||
| Distributions: | ||||||||||||||||||||
| To participating non-controlling interests - in operating | ||||||||||||||||||||
| subsidiaries and preferred equity | 11 | (44 | ) | (3 | ) | (138 | ) | (33 | ) | |||||||||||
| To unitholders of Brookfield Renewable or BRELP | 11,12 | (95 | ) | (92 | ) | (282 | ) | (271 | ) | |||||||||||
| (275 | ) | (204 | ) | (246 | ) | (402 | ) | |||||||||||||
| Investing activities | ||||||||||||||||||||
| Acquisitions | 3 | - | (15 | ) | (243 | ) | (177 | ) | ||||||||||||
| Investment in: | ||||||||||||||||||||
| Sustaining capital expenditures | (23 | ) | (20 | ) | (44 | ) | (45 | ) | ||||||||||||
| Development and construction of renewable power | ||||||||||||||||||||
| generating assets | (33 | ) | (63 | ) | (113 | ) | (237 | ) | ||||||||||||
| Investment tax credits related to renewable power generating | ||||||||||||||||||||
| assets | - | 84 | - | 199 | ||||||||||||||||
| Due to or from related parties | 24 | 54 | 14 | 192 | ||||||||||||||||
| Investment in securities | - | (28 | ) | - | (28 | ) | ||||||||||||||
| Restricted cash and other | 36 | 49 | 31 | 79 | ||||||||||||||||
| 4 | 61 | (355 | ) | (17 | ) | |||||||||||||||
| Foreign exchange gain (loss) on cash | - | 1 | (6 | ) | (7 | ) | ||||||||||||||
| Cash and cash equivalents | ||||||||||||||||||||
| (Decrease) increase | (46 | ) | (58 | ) | 48 | (48 | ) | |||||||||||||
| Balance, beginning of period | 231 | 235 | 137 | 225 | ||||||||||||||||
| Balance, end of period | $ | 185 | $ | 177 | $ | 185 | $ | 177 | ||||||||||||
| Supplemental cash flow information: | ||||||||||||||||||||
| Interest paid | $ | 52 | $ | 49 | $ | 249 | $ | 232 | ||||||||||||
| Interest received | 1 | 3 | 5 | 13 | ||||||||||||||||
| Income taxes paid (recovered) | 5 | (1 | ) | 24 | 10 | |||||||||||||||
| The accompanying notes are an integral part of these interim consolidated financial statements. | ||||||||||||||||||||
| Brookfield Renewable Energy Partners L.P | Q3 2013 Interim Report | September 30, 2013 |
| Page 45 |
BROOKFIELD RENEWABLE ENERGY PARTNERS L.P.
NOTES TO THE CONSOLIDATED FINANCIAL STATEMENTS
1. ORGANIZATION AND DESCRIPTION OF THE BUSINESS
The business activities of Brookfield Renewable Energy Partners L.P. (“Brookfield Renewable”) consist of owning a portfolio of renewable power generating facilities in the United States, Canada and Brazil.
Brookfield Renewable is a publicly traded limited partnership established under the laws of Bermuda pursuant to an amended and restated limited partnership agreement dated November 20, 2011.
The registered office of Brookfield Renewable is 73 Front Street, Fifth Floor, Hamilton HM12, Bermuda.
The immediate parent of Brookfield Renewable is its general partner. The ultimate parent of Brookfield Renewable is Brookfield Asset Management Inc. (“Brookfield Asset Management”).
2. BASIS OF PREPARATION AND CHANGES TO BROOKFIELD RENEWABLE’S ACCOUNTING POLICIES
(a) Statement of compliance
The condensed interim consolidated financial statements have been prepared in accordance with IAS 34, Interim Financial Reporting on a basis consistent with the accounting policies disclosed in the audited consolidated financial statements for the fiscal year ended December 31, 2012, with the exception of the changes in accounting policy related to IAS 19, Employee Benefits.
Certain information and footnote disclosure normally included in the annual audited consolidated financial statements prepared in accordance with International Financial Reporting Standards (“IFRS”), as issued by the International Accounting Standards Board (“IASB”) have been omitted or condensed. These interim consolidated financial statements should be read in conjunction with Brookfield Renewable’s audited 2012 annual consolidated financial statements.
The interim consolidated financial statements are unaudited and reflect any adjustments (consisting of normal recurring adjustments) that are, in the opinion of management, necessary to a fair statement of results for the interim periods in accordance with IFRS.
The results reported in these interim consolidated financial statements should not be regarded as necessarily indicative of results that may be expected for an entire year. Certain comparative figures have been reclassified to conform to the current year’s presentation.
These interim consolidated financial statements have been authorized for issuance by the Board of Directors of its general partner, Brookfield Renewable Partners Limited, on November 4, 2013.
All figures are presented in millions of United States (“U.S.”) dollars unless otherwise noted.
(b) Basis of preparation
The interim consolidated financial statements have been prepared on the basis of historical cost, except for the revaluation of property, plant and equipment and certain assets and liabilities which have been measured at fair value. Cost is recorded based on the fair value of the consideration given in exchange for assets.
Consolidation
These interim consolidated financial statements include the accounts of Brookfield Renewable and its subsidiaries, which are the entities over which Brookfield Renewable has control. An investor controls an investee when it is exposed, or has rights, to variable returns from its involvement with the investee and has the ability to affect those returns through its power over the investee. Non-controlling interests in the equity of Brookfield Renewable’s subsidiaries are shown separately in equity in the consolidated balance sheets.
| Brookfield Renewable Energy Partners L.P | Q3 2013 Interim Report | September 30, 2013 |
| Page 46 |
(c) New standards, interpretations and amendments adopted by Brookfield Renewable
The accounting policies adopted in the preparation of the interim consolidated financial statements are consistent with those followed in the preparation of Brookfield Renewable’s audited 2012 annual consolidated financial statements, except for the adoption of new standards and interpretations effective January 1, 2013.
The following new accounting standards applied or adopted had no material impact on the interim consolidated financial statements. Please see Note 2(q) – Future changes in accounting policies in the audited consolidated financial statements for the year ended December 31, 2012.
| ● | IFRS 10, Consolidated Financial Statements, |
| ● | IFRS 11, Joint Arrangements, and IAS 28, Investment in Associates and Joint Ventures, |
| ● | IFRS 12, Disclosure of Interests in Other Entities, |
| ● | IFRS 13, Fair Value Measurement, and |
| ● | IAS 34, Interim Financial Reporting and Segment Information for Total Assets and Liabilities. |
Brookfield Renewable applied, for the first time, certain standards and amendments that require restatement of previous financial statements. These include IAS 19 (Revised 2011), Employee Benefits, and amendments to IAS 1, Presentation of Financial Statements. The nature and the impact of the new standard/amendment are described below:
IAS 1 Presentation of Items of Other Comprehensive Income – Amendments to IAS 1
The amendments to IAS 1 introduced a grouping of items presented in other comprehensive income (“OCI”). Items that could be reclassified (or recycled) to profit or loss at a future point in time (e.g., net gain on hedge of net investment, exchange differences on translation of foreign operations, net movement on cash flow hedges and net loss or gain on available-for-sale financial assets) now have to be presented separately from items that will never be reclassified (e.g., actuarial gains and losses on defined benefit plans and revaluation of power generating assets). The amendment affected presentation only and had no impact on Brookfield Renewable’s financial position or performance.
IAS 19 Employee Benefits (Revised 2011) (IAS 19R)
IAS 19R introduced amendments to the accounting for defined benefit plans, including the treatment of actuarial gains and losses that are now recognized in OCI and permanently excluded from profit and loss. Also, expected returns on plan assets are no longer recognized in profit or loss, instead there is a requirement to recognize interest on the net defined benefit liability (asset) in profit or loss, calculated using the discount rate used to measure the defined benefit obligation.
Brookfield Renewable assessed its accounting policy on the recognition of actuarial gains and losses from its defined benefit plans. Brookfield Renewable previously recognized the net cumulative unrecognized actuarial gains and losses, which exceeded 10% of the higher of the defined benefit obligation and the fair value of the plan assets.
| Brookfield Renewable Energy Partners L.P | Q3 2013 Interim Report | September 30, 2013 |
| Page 47 |
The adoption of IAS 19R, Employee Benefits, required Brookfield Renewable to retroactively restate its consolidated financial statements. The following table summarizes these amounts:
| As at December 31, 2012 | As at January 1, 2012 | |||||||||||||||||||||||
| Previously | Previously | |||||||||||||||||||||||
| (MILLIONS) | presented | Adjustment | Restated | presented | Adjustment | Restated | ||||||||||||||||||
| Consolidated Balance Sheets: | ||||||||||||||||||||||||
| Other long-term liabilities | $ | 157 | $ | 31 | $ | 188 | $ | 164 | $ | 23 | $ | 187 | ||||||||||||
| Deferred income tax liabilities | 2,358 | (9 | ) | 2,349 | 2,374 | (7 | ) | 2,367 | ||||||||||||||||
| Participating non-controlling interests - in a | ||||||||||||||||||||||||
| holding subsidiary - Redeemable/Exchangeable | ||||||||||||||||||||||||
| units held by Brookfield | 3,081 | (11 | ) | 3,070 | 3,097 | (8 | ) | 3,089 | ||||||||||||||||
| Limited partners' equity | 3,158 | (11 | ) | 3,147 | 3,169 | (8 | ) | 3,161 | ||||||||||||||||
| Consolidated Statements of Changes in Equity: | ||||||||||||||||||||||||
| Actuarial losses on defined benefit plans | $ | - | $ | (11 | ) | $ | (11 | ) | ||||||||||||||||
| For the nine months ended September 30, 2012 | ||||||||||||||||||||||||
| Consolidated Statements of Comprehensive Income (Loss): | ||||||||||||||||||||||||
| Actuarial losses on defined benefit plans | $ | - | $ | (8 | ) | $ | (8 | ) | ||||||||||||||||
| Deferred income taxes on above items, net | (4 | ) | 2 | (2 | ) | |||||||||||||||||||
There was no impact to earnings per LP Unit.
(d) Future changes
There are no future changes to IFRS with potential impact on Brookfield Renewable other than the changes disclosed in the 2012 annual consolidated financial statements.
3. BUSINESS COMBINATIONS
The following investments were accounted for using the acquisition method, and the results of operations have been included in the consolidated financial statements since the respective dates of acquisition.
Northeastern United States Hydroelectric Generation Assets
In March 2013, Brookfield Renewable acquired a 100% interest in a 360 MW portfolio of hydroelectric generation facilities, located in Northeastern United States. Total consideration paid of $57 million included $55 million in cash and $2 million related to the pre-closing payments and working capital adjustments. Holding and project level notes, with a face value of $700 million, were also assumed. The acquisition costs of $8 million were expensed as incurred. In September 2013, upon closing of a private fund sponsored by Brookfield Asset Management, institutional partners co-invested 49.9% in these facilities for $205 million.
California Wind Generation Assets
In August 2012, Brookfield Renewable acquired 16% of the outstanding common shares of Western Wind Energy Corp. ("Western Wind") for a total cash consideration of $25 million.
On March 1, 2013, the Board of Directors were replaced by directors appointed by Brookfield Renewable and, as a result Brookfield Renewable began consolidating the operating results, cash flows and net assets of Western Wind. Further, Brookfield Renewable was required to re-measure its previously held 16% interest to fair value, and the net impact of this re-measurement was not material.
On March 7, 2013, Brookfield Renewable increased its ownership to 93% of the outstanding common shares for additional cash consideration of $143 million. As Brookfield Renewable held more than 90% of the common shares, on May 21, 2013, it acquired all of the remaining common shares on the same terms that the common shares were acquired under the Offer, for additional cash consideration of $15 million. The common shares of Western Wind were delisted from the TSX Venture Exchange on May 24, 2013.
Canadian Hydroelectric Generation Asset
In March 2013, Brookfield Renewable acquired the remaining 50% interest, previously held by its partner, in a hydroelectric generation facility in Canada taking its total investment to 100% (the “Step Acquisition”).
The Step Acquisition included cash consideration of $32 million and the assumption of the partner’s portion of the non-recourse debt. Prior to the Step Acquisition, Brookfield Renewable’s financial interest amounted to $22 million. Brookfield Renewable re-measured its previously held 50% interest to fair value and reversed any amounts previously recorded in OCI. In addition, $30 million related to revaluation surplus on the initial 50% interest was reclassified within equity of which $14 million related to limited partners’ equity.
| Brookfield Renewable Energy Partners L.P | Q3 2013 Interim Report | September 30, 2013 |
| Page 48 |
Purchase price allocations, at fair values, with respect to the acquisitions were as follows:
| Northeastern | ||||||||||||||||
| (MILLIONS) | United States | California | Canada | Total | ||||||||||||
| Cash and cash equivalents | $ | - | $ | 2 | $ | 6 | $ | 8 | ||||||||
| Restricted cash | 32 | 8 | - | 40 | ||||||||||||
| Other current assets | 12 | 9 | 9 | 30 | ||||||||||||
| Property, plant and equipment | 721 | 444 | 213 | 1,378 | ||||||||||||
| Other long-term assets | 22 | 30 | - | 52 | ||||||||||||
| Current liabilities | (10 | ) | (26 | ) | (29 | ) | (65 | ) | ||||||||
| Long-term debt | (720 | ) | (250 | ) | (105 | ) | (1,075 | ) | ||||||||
| Other long-term liabilities | - | (31 | ) | (39 | ) | (70 | ) | |||||||||
| Non-controlling interests | - | (68 | ) | - | (68 | ) | ||||||||||
| Net assets acquired | $ | 57 | $ | 118 | $ | 55 | $ | 230 | ||||||||
The estimated fair values of the assets acquired and liabilities assumed are expected to be finalized within 12 months of the acquisition date.
4. RISK MANAGEMENT AND FINANCIAL INSTRUMENTS
Risk Management
Brookfield Renewable’s activities expose it to a variety of financial risks, including market risk (i.e., commodity price risk, interest rate risk, and foreign currency risk), credit risk and liquidity risk. Brookfield Renewable uses financial instruments primarily to manage these risks.
There have been no material changes in exposure to these risks since the December 31, 2012 audited annual consolidated financial statements.
Financial Instrument Disclosures
The fair value of financial instruments is the amount of consideration that would be agreed upon in an arm’s length transaction between knowledgeable willing parties who are under no compulsion to act.
Fair values determined using the valuation models require the use of assumptions concerning the amount and timing of estimated future cash flows and discount rates. In determining those assumptions, management looks primarily to external readily observable market inputs such as interest rate yield curves, currency rates, and price, as applicable. The fair value of interest rate swap contracts, which form part of financing arrangements, is calculated by way of discounted cash flows, using market interest rates and applicable credit spreads.
Financial instruments measured at fair value are categorized into one of three hierarchy levels, described below. Each level is based on the transparency of the inputs used to measure the fair values of assets and liabilities.
Level 1 – inputs are based on unadjusted quoted prices in active markets for identical assets and liabilities;
Level 2 – inputs, other than quoted prices in Level 1, that are observable for the asset or liability, either directly or indirectly; and
Level 3 – inputs for the asset or liability that are not based on observable market data.
| Brookfield Renewable Energy Partners L.P | Q3 2013 Interim Report | September 30, 2013 |
| Page 49 |
The following table presents Brookfield Renewable’s financial assets and financial liabilities measured at fair value classified by the fair value hierarchy:
| Sep 30, 2013 | Dec 31, 2012 | |||||||||||||||||||
| (MILLIONS) | Level 1 | Level 2 | Level 3 | Total | ||||||||||||||||
| Cash and cash equivalents | $ | 185 | $ | - | $ | - | $ | 185 | $ | 137 | ||||||||||
| Restricted cash | 206 | - | 206 | 157 | ||||||||||||||||
Available-for-sale investments(1) | - | - | - | - | 26 | |||||||||||||||
| Financial instrument liabilities | ||||||||||||||||||||
| Energy derivative contracts | - | (4 | ) | - | (4 | ) | (13 | ) | ||||||||||||
| Interest rate swaps | - | (70 | ) | - | (70 | ) | (132 | ) | ||||||||||||
| Total | $ | 391 | $ | (74 | ) | $ | - | $ | 317 | $ | 175 | |||||||||
| (1) | Available-for-sale investments represent an investment in securities of Western Wind and were included in Other long-term assets. |
There were no transfers between levels during the three and nine months ended September 30, 2013.
The aggregate amount of Brookfield Renewable’s financial instrument positions are as follows:
| Sep 30, 2013 | Dec 31, 2012 | |||||||||||||||
| (MILLIONS) | Asset | Liabilities | Net Liabilities | Net Liabilities | ||||||||||||
| Energy derivative contracts | $ | 7 | $ | 11 | $ | 4 | $ | 13 | ||||||||
| Interest rate swaps | 14 | 84 | 70 | 132 | ||||||||||||
| Total | 21 | 95 | 74 | 145 | ||||||||||||
| Less: current portion | 7 | 81 | 74 | 113 | ||||||||||||
| Long-term portion | $ | 14 | $ | 14 | $ | - | $ | 32 | ||||||||
Energy derivative contracts
Brookfield Renewable has entered into long-term energy derivative contracts primarily to stabilize the price of gas purchases or eliminate the price risk on the sale of certain future power generation. Certain energy contracts are recorded in Brookfield Renewable’s interim consolidated financial statements at an amount equal to fair value, using quoted market prices or, in their absence, a valuation model using both internal and third-party evidence and forecasts.
For the three and nine months ended September 30, 2013, unrealized gains of $2 million and $12 million, respectively, were recognized in the statement of income (loss) (2012: unrealized gains of $7 million and $14 million, respectively).
Interest rate swaps
Brookfield Renewable has entered into interest rate swap contracts primarily to minimize exposure to interest rate fluctuations on its variable rate debt or to lock in interest rates on future debt refinancing. All interest rate swap contracts are recorded in the interim consolidated financial statements at an amount equal to fair value.
For the three and nine months ended September 30, 2013, unrealized gains of $9 million and $18 million respectively were recognized in the statement of income (loss) (2012: unrealized losses of $1 million and $20 million, respectively). For the three and nine months ended September 30, 2013, unrealized losses of $1 million and gains of $47 million, respectively, were recognized in OCI (2012: unrealized losses of $2 million and $5 million, respectively).
For the three and nine months ended September 30, 2013, losses of $9 million and $5 million, respectively, relating to cash flow hedges were reclassified from OCI to net income (loss) (2012: losses at $3 million and gains at $8 million, respectively).
5. RELATED PARTY TRANSACTIONS
Brookfield Renewable’s related party transactions are recorded at the exchange amount. Brookfield Renewable’s related party transactions are primarily with Brookfield Asset Management and its subsidiaries.
| Brookfield Renewable Energy Partners L.P | Q3 2013 Interim Report | September 30, 2013 |
| Page 50 |
The following table reflects the related party agreements and transactions on the interim consolidated statements of income (loss):
| Three months ended Sep 30 | Nine months ended Sep 30 | |||||||||||||||
| (MILLIONS) | 2013 | 2012 | 2013 | 2012 | ||||||||||||
| Revenues | ||||||||||||||||
| Purchase and revenue support agreements | $ | 102 | $ | 54 | $ | 339 | $ | 289 | ||||||||
| Wind levelization agreement | 3 | 1 | 5 | 1 | ||||||||||||
| $ | 105 | $ | 55 | $ | 344 | $ | 290 | |||||||||
| Direct operating costs | ||||||||||||||||
| Energy purchases | $ | (8 | ) | $ | (8 | ) | $ | (26 | ) | $ | (38 | ) | ||||
| Energy marketing fee | (5 | ) | (5 | ) | (15 | ) | (14 | ) | ||||||||
| Insurance services | (6 | ) | (5 | ) | (19 | ) | (13 | ) | ||||||||
| $ | (19 | ) | $ | (18 | ) | $ | (60 | ) | $ | (65 | ) | |||||
| Management service costs | $ | (9 | ) | $ | (10 | ) | $ | (32 | ) | $ | (25 | ) | ||||
6. EQUITY-ACCOUNTED INVESTMENTS
The following table presents the changes in Brookfield Renewable’s equity-accounted investments:
| Three months ended | Nine months ended | Year ended | ||||||||||
| (MILLIONS) | Sep 30, 2013 | Sep 30, 2013 | Dec 31, 2012 | |||||||||
| Balance, beginning of period | $ | 318 | $ | 344 | $ | 405 | ||||||
| Step acquisitions | - | (22 | ) | (63 | ) | |||||||
| Revaluation recognized through OCI | - | - | 16 | |||||||||
| Share of OCI | - | 2 | - | |||||||||
| Share of net income (loss) | 3 | 9 | (5 | ) | ||||||||
| Dividends received | (8 | ) | (14 | ) | (12 | ) | ||||||
| Foreign exchange loss | - | (9 | ) | (5 | ) | |||||||
| Other | 1 | 4 | 8 | |||||||||
| Balance, end of period | $ | 314 | $ | 314 | $ | 344 | ||||||
The following table summarizes certain financial information of equity-accounted investments:
| Three months ended Sep 30 | Nine months ended Sep 30 | |||||||||||||||
| (MILLIONS) | 2013 | 2012 | 2013 | 2012 | ||||||||||||
| Revenue | $ | 28 | $ | 27 | $ | 87 | $ | 80 | ||||||||
| Net income (loss) | 5 | (4 | ) | 17 | (4 | ) | ||||||||||
| Share of net income (loss) | ||||||||||||||||
| Cash earnings | 7 | 3 | 19 | 11 | ||||||||||||
| Non-cash loss | (4 | ) | (5 | ) | (10 | ) | (13 | ) | ||||||||
7. PROPERTY, PLANT AND EQUIPMENT, AT FAIR VALUE
The composition of the net book value of Brookfield Renewable’s property, plant and equipment, is presented in the following table:
| (MILLIONS) | Hydroelectric | Wind energy | CWIP | Other(1) | Total | |||||||||||||||
| As at December 31, 2012 | $ | 12,947 | $ | 2,249 | $ | 392 | $ | 70 | $ | 15,658 | ||||||||||
| Foreign exchange | (404 | ) | (52 | ) | (13 | ) | (2 | ) | (471 | ) | ||||||||||
Additions(2) | 945 | 421 | 186 | - | 1,552 | |||||||||||||||
| Transfers and other | 103 | (4 | ) | (110 | ) | - | (11 | ) | ||||||||||||
Depreciation(3) | (280 | ) | (103 | ) | - | (9 | ) | (392 | ) | |||||||||||
| As at September 30, 2013 | $ | 13,311 | $ | 2,511 | $ | 455 | $ | 59 | $ | 16,336 | ||||||||||
| (1) | Included in “Other” are gas-fired generating (“co-gen”) units. |
| (2) | Includes acquisitions of $1,378 (Note 3). |
| (3) | Assets not subject to depreciation include construction work in process (“CWIP”) and land. |
| Brookfield Renewable Energy Partners L.P | Q3 2013 Interim Report | September 30, 2013 |
| Page 51 |
8. ACCOUNTS PAYABLE AND ACCRUED LIABILITIES
The composition of accounts payable and accrued liabilities are as follows:
| Sep 30 | Dec 31 | |||||||
| (MILLIONS) | 2013 | 2012 | ||||||
| Operating accrued liabilities | $ | 119 | $ | 97 | ||||
| Interest payable on corporate and subsidiary borrowings | 97 | 41 | ||||||
| Accounts payable | 17 | 23 | ||||||
| LP Unitholders’ distribution and preferred dividends payable | 40 | 34 | ||||||
| Other | 7 | 12 | ||||||
| $ | 280 | $ | 207 | |||||
9. LONG-TERM DEBT AND CREDIT FACILITIES
The composition of debt obligations is presented in the following table:
| Sep 30, 2013 | Dec 31, 2012 | |||||||||||||||||||||||
| Weighted-average | Weighted-average | |||||||||||||||||||||||
| (MILLIONS EXCEPT AS NOTED) | Interest rate (%) | Term (years) | Interest rate (%) | Term (years) | ||||||||||||||||||||
| Corporate borrowings | �� | |||||||||||||||||||||||
| Series 3 (CDN$200) | 5.3 | 5.1 | $ | 194 | 5.3 | 5.8 | $ | 202 | ||||||||||||||||
| Series 4 (CDN$150) | 5.8 | 23.1 | 146 | 5.8 | 23.9 | 151 | ||||||||||||||||||
| Series 6 (CDN$300) | 6.1 | 3.2 | 291 | 6.1 | 3.9 | 302 | ||||||||||||||||||
| Series 7 (CDN$450) | 5.1 | 7.1 | 437 | 5.1 | 7.8 | 454 | ||||||||||||||||||
| Series 8 (CDN$400) | 4.8 | 8.4 | 388 | 4.8 | 9.1 | 403 | ||||||||||||||||||
| 5.3 | 8.0 | $ | 1,456 | 5.3 | 8.7 | $ | 1,512 | |||||||||||||||||
| Subsidiary borrowings | ||||||||||||||||||||||||
| United States | 6.1 | 10.0 | $ | 2,856 | 6.4 | 11.4 | $ | 2,264 | ||||||||||||||||
| Canada | 5.8 | 15.4 | 1,951 | 5.9 | 12.7 | 1,781 | ||||||||||||||||||
| Brazil | 7.4 | 11.2 | 256 | 8.5 | 9.7 | 348 | ||||||||||||||||||
| 6.0 | 12.1 | $ | 5,063 | 6.4 | 11.8 | $ | 4,393 | |||||||||||||||||
Credit facilities(1) | 1.5 | 4.1 | $ | 178 | 2.0 | 3.8 | $ | 268 | ||||||||||||||||
| Total debt | $ | 6,697 | $ | 6,173 | ||||||||||||||||||||
Add: Unamortized premiums(2) | 14 | - | ||||||||||||||||||||||
Less: Unamortized financing fees(2) | (57 | ) | (54 | ) | ||||||||||||||||||||
| Less: Current portion | (520 | ) | (532 | ) | ||||||||||||||||||||
| $ | 6,134 | $ | 5,587 | |||||||||||||||||||||
| (1) | Amounts are unsecured and revolving. Interest rate is at the London Interbank Offered Rate (“LIBOR”) plus 1.25% (2012: 1.75%). |
| (2) | Unamortized premiums and unamortized financing fees are amortized to interest expense over the terms of the borrowing. |
Corporate borrowings
Corporate borrowings are obligations of a finance subsidiary of Brookfield Renewable (Note 13 – Subsidiary Public Issuers). The finance subsidiary may redeem some or all of the borrowings from time to time, pursuant to the terms of the indenture. The balance is payable upon maturity, and interest on corporate borrowings is paid semi-annually.
Subsidiary borrowings
Subsidiary borrowings are generally asset-specific, long-term, non-recourse borrowings denominated in the domestic currency of the subsidiary. Subsidiary borrowings in the United States and Canada consist of both fixed and floating interest rate debt. Brookfield Renewable uses interest rate swap agreements to minimize its exposure to floating interest rates. Subsidiary borrowings in Brazil consist of floating interest rates of TJLP, the Brazil National Bank for Economic Development’s long-term interest rate, or Interbank Deposit Certificate rate, plus a margin.
| Brookfield Renewable Energy Partners L.P | Q3 2013 Interim Report | September 30, 2013 |
| Page 52 |
In February 2013, Brookfield Renewable refinanced indebtedness associated with a 166 MW Ontario wind facility through a C$450 million loan for a term of 18 years at 5.1%.
In February 2013, a subsidiary of Brookfield Renewable issued a $75 million floating rate credit facility maturing in 2015.
In March 2013, Brookfield Renewable refinanced indebtedness associated with a 51 MW Ontario wind facility through a C$130 million loan for a term of 19 years at 5.0%.
In March 2013, Brookfield Renewable purchased 88% of the $575 million in operating company notes outstanding with respect to the recently acquired, 360 MW hydroelectric portfolio in Northeastern United States. In May 2013, Brookfield Renewable purchased 100% of the $125 million of holding level notes with respect to the same facilities. Brookfield Renewable financed a portion of the tendered notes through a 24-month, bridge loan of up to $350 million.
As part of the acquisition of wind assets in California, Brookfield Renewable assumed an aggregate of $250 million in subsidiary borrowings, of which $200 million is subject to a fixed interest rate of 7.2% and matures in 2032.
With the Step Acquisition and the assumption of the other partners’ portion of the non-recourse debt, Brookfield Renewable increased subsidiary borrowings by $96 million. The debt matures in 2016 and bears a fixed interest rate of 6.5%.
Net repayments of $671 million made during the nine months ended September 30, 2013 were primarily funded from proceeds of preferred share issuances.
Credit facilities
In 2013, Brookfield Renewable expanded its revolving credit facilities from $990 million to $1,280 million and in September 2013, extended the maturity date by one year to October 31, 2017.
In May 2013, Brookfield Asset Management provided a $200 million committed unsecured revolving credit facility, expiring in December 2013, at LIBOR plus 2%.
Brookfield Renewable and its subsidiaries issue letters of credit from its credit facilities for general corporate purposes, which include, but are not limited to, security deposits, performance bonds and guarantees for debt service reserve accounts.
| Brookfield Renewable Energy Partners L.P | Q3 2013 Interim Report | September 30, 2013 |
| Page 53 |
| Sep 30 | Dec 31 | |||||||
| (MILLIONS) | 2013 | 2012 | ||||||
| Available revolving credit facilities | $ | 1,480 | $ | 990 | ||||
| Drawings | (178 | ) | (268 | ) | ||||
| Issued letters of credit | (240 | ) | (182 | ) | ||||
| Unutilized revolving credit facilities | $ | 1,062 | $ | 540 | ||||
Net repayments of $90 million were made during the nine months ended September 30, 2013. The repayments were financed primarily by funds from operations.
10. INCOME TAXES
Brookfield Renewable’s effective income tax rate was 7.7% for the nine months ended September 30, 2013 (2012: 47.4%). The effective tax rate is less than the statutory rate primarily due to rate differentials and non-controlling interests income not subject to tax.
11. NON-CONTROLLING INTERESTS
Brookfield Renewable’s non-controlling interests are comprised of the following:
| Sep 30 | Dec 31 | |||||||
| (MILLIONS) | 2013 | 2012 | ||||||
| Preferred equity | $ | 821 | $ | 500 | ||||
| Participating non-controlling interests - in operating subsidiaries | 1,188 | 1,028 | ||||||
| General partnership interest in a holding subsidiary held by Brookfield | 59 | 63 | ||||||
| Participating non-controlling interests - in a holding subsidiary - | ||||||||
| Redeemable/Exchangeable units held by Brookfield | 2,869 | 3,070 | ||||||
| Total | $ | 4,937 | $ | 4,661 | ||||
Preferred equity
In January 2013 and May 2013, Brookfield Renewable Power Preferred Equity Inc. (“BRP Equity”) issued 7 million of Series 5 and Series 6 perpetual preferred shares respectively at a price of C$25 per share. The holders of the preferred shares are entitled to receive fixed cumulative dividends at an annual rate of C$1.25 per share, for a yield of 5%.
Brookfield Renewable, Brookfield Renewable Energy L.P. (“BRELP”), and certain holding company subsidiaries fully and unconditionally guarantee the payment of dividends on the preferred shares, the amount due on redemption, and the amounts due on the liquidation, dissolution or winding-up of BRP Equity.
For the three and nine months ended September 30, 2013, dividends declared on the issued preferred shares were $10 million and $27 million, respectively (2012: $3 million and $10 million, respectively).
As at September 30, 2013, none of the issued preferred shares have been redeemed.
| Brookfield Renewable Energy Partners L.P | Q3 2013 Interim Report | September 30, 2013 |
| Page 54 |
Participating non-controlling interests – in operating subsidiaries
The net change in participating non-controlling interests – in operating entities is as follows:
| Brookfield | ||||||||||||||||||||||||
| Americas | Brookfield | |||||||||||||||||||||||
| Infrastructure | Infrastructure | The Catalyst | Brascan | |||||||||||||||||||||
| (MILLIONS) | Fund | Fund | Group | Energetica | Other | Total | ||||||||||||||||||
| As at December 31, 2011 | $ | 380 | $ | - | $ | 167 | $ | 74 | $ | 8 | $ | 629 | ||||||||||||
| Net income (loss) | (44 | ) | - | 2 | 2 | - | (40 | ) | ||||||||||||||||
| OCI | 24 | - | (28 | ) | (7 | ) | 25 | 14 | ||||||||||||||||
| Acquisitions | 447 | - | - | (9 | ) | 8 | 446 | |||||||||||||||||
| Distributions | - | - | (18 | ) | (6 | ) | - | (24 | ) | |||||||||||||||
| Other | (1 | ) | - | - | 4 | - | 3 | |||||||||||||||||
| As at December 31, 2012 | $ | 806 | $ | - | $ | 123 | $ | 58 | $ | 41 | $ | 1,028 | ||||||||||||
| Net income | 26 | - | 22 | - | - | 48 | ||||||||||||||||||
| OCI | (8 | ) | - | - | (5 | ) | (1 | ) | (14 | ) | ||||||||||||||
| Acquisitions and contributions | 42 | 205 | - | - | 1 | 248 | ||||||||||||||||||
| Distributions | (111 | ) | - | - | (2 | ) | - | (113 | ) | |||||||||||||||
| Other | (2 | ) | (7 | ) | - | 1 | (1 | ) | (9 | ) | ||||||||||||||
| As at September 30, 2013 | $ | 753 | $ | 198 | $ | 145 | $ | 52 | $ | 40 | $ | 1,188 | ||||||||||||
| Interests held by third parties | 75-80 | % | 50 | % | 25 | % | 20-30 | % | 24-50 | % | ||||||||||||||
General partnership interest in a holding subsidiary held by Brookfield
Brookfield, as the owner of the 1% general partnership interest in BRELP, is entitled to regular distributions plus an incentive distribution based on the amount by which quarterly distributions exceed specified target levels. For the three and nine months ended September 30, 2013, BRELP declared $1 million and $3 million, respectively, in distributions on the general partnership interest (2012: $1 million and $3 million, respectively) and no incentive distributions have been paid since the formation of Brookfield Renewable.
Participating non-controlling interests – in a holding subsidiary - Redeemable/Exchangeable units held by Brookfield
Consolidated equity includes Redeemable/Exchangeable Partnership Units issued by BRELP. The Redeemable/Exchangeable Partnership Units are held 100% by Brookfield Asset Management, which at its discretion has the right to redeem these units for cash consideration after a mandatory holding period expiring on November 28, 2013. Since this redemption right is subject to Brookfield Renewable’s right, at its sole discretion, to satisfy the redemption request with LP Units of Brookfield Renewable, the Redeemable/Exchangeable Partnership Units are classified as equity in accordance with IAS 32, Financial Instruments: Presentation. Both the LP Units issued by Brookfield Renewable and the Redeemable/Exchangeable Partnership Units issued by its subsidiary BRELP have the same economic attributes in all respects, except for the redemption right described above. The Redeemable/Exchangeable Partnership Units participate in earnings and distributions on a per unit basis equivalent to the per unit participation of the LP Units of Brookfield Renewable.
As at September 30, 2013, Redeemable/Exchangeable Partnership Units outstanding were 129,658,623 (December 31, 2012: 129,658,623).
For the three and nine months ended September 30, 2013, BRELP declared distributions on the Redeemable/Exchangeable Partnership Units held by Brookfield of $47 million and $141 million, respectively (2012: $45 million and $134 million, respectively).
| Brookfield Renewable Energy Partners L.P | Q3 2013 Interim Report | September 30, 2013 |
| Page 55 |
12. LIMITED PARTNERS’ EQUITY
Limited partners’ equity
As at September 30, 2013, LP Units outstanding were 132,959,701 (December 31, 2012: 132,901,916) including 40,026,986 (December 31, 2012: 48,091,986) held by Brookfield Asset Management. General partnership interests represent 0.01% of Brookfield Renewable.
During 2012, a distribution re-investment plan was implemented, allowing holders of LP Units who are resident in Canada to acquire additional LP Units by reinvesting all or a portion of their cash distributions without paying commissions. During the three and nine months ended September 30, 2013, respectively, 21,832 and 57,785 LP Units were issued (2012: 11,587 and 57,359 LP Units, respectively).
Distributions
Distributions may be made by the general partner of Brookfield Renewable with the exception of instances that there is insufficient cash available, payment rends Brookfield Renewable unable to pay its debt or payment of which might leave Brookfield Renewable unable to meet any future contingent obligations.
For the three and nine months ended September 30, 2013, Brookfield Renewable declared distributions on its LP Units of $49 million and $145 million or $0.3625 per LP Unit and $1.09 per LP Unit, respectively (2012: $46 million and $138 million or $0.345 and $1.04 per LP Unit).
The composition of the distribution is presented in the following table:
| (MILLIONS) | Three months ended Sep 30 | Nine months ended Sep 30 | ||||||||||||||
| 2013 | 2012 | 2013 | 2012 | |||||||||||||
| Brookfield Asset Management | $ | 15 | $ | 17 | $ | 44 | $ | 50 | ||||||||
| External LP Unitholders | 34 | 29 | 101 | 88 | ||||||||||||
| $ | 49 | $ | 46 | $ | 145 | $ | 138 | |||||||||
In March 2013, unitholder distributions were increased to $1.45 per unit from $1.38 per unit, on an annualized basis.
| Brookfield Renewable Energy Partners L.P | Q3 2013 Interim Report | September 30, 2013 |
| Page 56 |
13. SUBSIDIARY PUBLIC ISSUERS
See Note 9 – Long-term debt and credit facilities for additional details regarding issuances of mid-term corporate notes. See Note 11 – Non-controlling Interests for additional details regarding the issuances of Class A Preference Shares.
The following tables provide consolidated summary financial information for Brookfield Renewable, BRP Equity, and Brookfield Renewable Energy Partners ULC (“BREP Finance”):
| Brookfield | ||||||||||||||||||||||||
| Brookfield | BRP | BREP | Other | Consolidating | Renewable | |||||||||||||||||||
| (MILLIONS) | Renewable | Equity | Finance | Subsidiaries(1) | adjustments(2) | consolidated | ||||||||||||||||||
| As at September 30, 2013: | ||||||||||||||||||||||||
| Current assets | $ | 48 | $ | - | $ | 1,483 | $ | 584 | $ | (1,537 | ) | $ | 578 | |||||||||||
| Long-term assets | 2,942 | 809 | - | 17,008 | (3,746 | ) | 17,013 | |||||||||||||||||
| Current liabilities | 48 | 10 | 28 | 2,408 | (1,504 | ) | 990 | |||||||||||||||||
| Long-term liabilities | - | - | 1,449 | 8,077 | (804 | ) | 8,722 | |||||||||||||||||
| Preferred equity | - | 821 | - | - | - | 821 | ||||||||||||||||||
| Participating non-controlling interests - | ||||||||||||||||||||||||
| in operating subsidiaries | - | - | - | 1,188 | - | 1,188 | ||||||||||||||||||
| Participating non-controlling interests - | ||||||||||||||||||||||||
| in a holding subsidiary - Redeemable/ | ||||||||||||||||||||||||
| Exchangeable units held by Brookfield | - | - | - | 2,869 | - | 2,869 | ||||||||||||||||||
| As at December 31, 2012: | ||||||||||||||||||||||||
| Current assets | $ | 46 | $ | - | $ | 1,528 | $ | 530 | $ | (1,582 | ) | $ | 522 | |||||||||||
| Long-term assets | 3,153 | 495 | - | 16,398 | (3,643 | ) | 16,403 | |||||||||||||||||
| Current liabilities | 52 | 7 | 16 | 2,468 | (1,582 | ) | 961 | |||||||||||||||||
| Long-term liabilities | - | - | 1,506 | 7,142 | (492 | ) | 8,156 | |||||||||||||||||
| Preferred equity | - | 500 | - | - | - | 500 | ||||||||||||||||||
| Participating non-controlling interests - | ||||||||||||||||||||||||
| in operating subsidiaries | - | - | - | 1,028 | - | 1,028 | ||||||||||||||||||
| Participating non-controlling interests - | ||||||||||||||||||||||||
| in a holding subsidiary - Redeemable/ | ||||||||||||||||||||||||
| Exchangeable units held by Brookfield | - | - | - | 3,070 | - | 3,070 | ||||||||||||||||||
| (1) | Includes subsidiaries of Brookfield Renewable, other than BRP Equity and BREP Finance. |
| (2) | Includes elimination of intercompany transactions and balances necessary to present Brookfield Renewable on a consolidated basis. |
| Brookfield Renewable Energy Partners L.P | Q3 2013 Interim Report | September 30, 2013 |
| Page 57 |
| Brookfield | ||||||||||||||||||||||||
| Brookfield | BRP | BREP | Other | Consolidating | Renewable | |||||||||||||||||||
| (MILLIONS) | Renewable | Equity | Finance | Subsidiaries(1) | adjustments(2) | consolidated | ||||||||||||||||||
| For the three months ended Sep 30, 2013 | ||||||||||||||||||||||||
| Revenues | $ | - | $ | - | $ | - | $ | 392 | $ | - | $ | 392 | ||||||||||||
| Net income (loss) | 5 | - | - | 28 | (5 | ) | 28 | |||||||||||||||||
| For the three months ended Sep 30, 2012 | ||||||||||||||||||||||||
| Revenues | $ | - | $ | - | $ | - | $ | 229 | $ | - | $ | 229 | ||||||||||||
| Net income (loss) | (26 | ) | - | - | (59 | ) | 26 | (59 | ) | |||||||||||||||
| For the nine months ended Sep 30, 2013 | ||||||||||||||||||||||||
| Revenues | $ | - | $ | - | $ | - | $ | 1,313 | $ | - | $ | 1,313 | ||||||||||||
| Net income (loss) | 58 | - | 1 | 190 | (58 | ) | 191 | |||||||||||||||||
| For the nine months ended Sep 30, 2012 | ||||||||||||||||||||||||
| Revenues | $ | - | $ | - | $ | - | $ | 992 | $ | - | $ | 992 | ||||||||||||
| Net income (loss) | (7 | ) | 1 | (2 | ) | (30 | ) | 7 | (31 | ) | ||||||||||||||
| (1) | Includes subsidiaries of Brookfield Renewable, other than BRP Equity and BREP Finance, general partnership interest in a holding subsidiary held by Brookfield and participating non-controlling interests - in a holding subsidiary - Redeemable/Exchangeable units held by Brookfield. |
| (2) | Includes elimination of intercompany transactions and balances necessary to present Brookfield Renewable on a consolidated basis. |
| Brookfield Renewable Energy Partners L.P | Q3 2013 Interim Report | September 30, 2013 |
| Page 58 |
14. SEGMENTED INFORMATION
Brookfield Renewable operates renewable power assets, which include conventional hydroelectric generating assets located in the United States, Canada and Brazil, wind farms located in the United States and Canada and a pumped storage hydroelectric facility located in the United States. Brookfield Renewable also operates two natural gas-fired co-gen facilities. Management evaluates the business based on the type of power generation (Hydroelectric, Wind and Co-gen). Hydroelectric and wind are further evaluated by major region (United States, Canada and Brazil). “Equity-accounted investments” includes Brookfield Renewable’s interest in hydroelectric facilities. The “Other” segment includes CWIP and corporate costs.
In accordance with IFRS 8, Operating Segments, Brookfield Renewable discloses information about its reportable segments based upon the measures used by management in assessing performance. The accounting policies of the reportable segments are the same as those described in Note 2 of the audited 2012 consolidated financial statements. Brookfield Renewable analyzes the performance of its operating segments based on revenues less direct costs (including energy marketing costs), plus Brookfield Renewable’s share of cash earnings from equity-accounted investments and other income, before interest, income taxes, depreciation, amortization and management service costs and the cash portion of non-controlling interests (“Adjusted EBITDA”). Funds from operations is defined as Adjusted EBITDA less interest, current income taxes and management service cost, which is then adjusted for the cash portion of non-controlling interests included in funds from operations. Transactions between the reportable segments occur at fair value.
| Hydroelectric | Wind energy | |||||||||||||||||||||||||||||||
| (MILLIONS) | U.S. | Canada | Brazil | U.S. | Canada | Co-gen | Other | Total | ||||||||||||||||||||||||
| For the three months ended Sep 30, 2013: | ||||||||||||||||||||||||||||||||
| Revenues | $ | 160 | $ | 93 | $ | 69 | $ | 34 | $ | 19 | $ | 17 | $ | - | $ | 392 | ||||||||||||||||
| Adjusted EBITDA | 111 | 76 | 47 | 24 | 14 | 4 | (16 | ) | 260 | |||||||||||||||||||||||
| Interest expense - borrowings | (38 | ) | (17 | ) | (5 | ) | (11 | ) | (10 | ) | - | (24 | ) | (105 | ) | |||||||||||||||||
| Funds from operations prior to | ||||||||||||||||||||||||||||||||
| non-controlling interests | 73 | 59 | 38 | 13 | 4 | 4 | (49 | ) | 142 | |||||||||||||||||||||||
| Cash portion of non-controlling interests | (15 | ) | - | (2 | ) | (7 | ) | - | - | (10 | ) | (34 | ) | |||||||||||||||||||
| Funds from operations | 58 | 59 | 36 | 6 | 4 | 4 | (59 | ) | 108 | |||||||||||||||||||||||
| Depreciation and amortization | (37 | ) | (20 | ) | (37 | ) | (17 | ) | (19 | ) | (3 | ) | - | (133 | ) | |||||||||||||||||
| For the three months ended Sep 30, 2012: | ||||||||||||||||||||||||||||||||
| Revenues | $ | 55 | $ | 42 | $ | 83 | $ | 17 | $ | 18 | $ | 14 | $ | - | $ | 229 | ||||||||||||||||
| Adjusted EBITDA | 23 | 28 | 56 | 6 | 14 | 3 | (12 | ) | 118 | |||||||||||||||||||||||
| Interest expense - borrowings | (34 | ) | (18 | ) | (8 | ) | (7 | ) | (11 | ) | - | (21 | ) | (99 | ) | |||||||||||||||||
| Funds from operations prior to | ||||||||||||||||||||||||||||||||
| non-controlling interests | (6 | ) | 10 | 44 | (1 | ) | 3 | 3 | (43 | ) | 10 | |||||||||||||||||||||
| Cash portion of non-controlling interests | 4 | - | (2 | ) | 2 | - | - | (3 | ) | 1 | ||||||||||||||||||||||
| Funds from operations | (2 | ) | 10 | 42 | 1 | 3 | 3 | (46 | ) | 11 | ||||||||||||||||||||||
| Depreciation and amortization | (27 | ) | (18 | ) | (36 | ) | (12 | ) | (19 | ) | (5 | ) | - | (117 | ) | |||||||||||||||||
| Brookfield Renewable Energy Partners L.P | Q3 2013 Interim Report | September 30, 2013 |
| Page 59 |
| Hydroelectric | Wind energy | |||||||||||||||||||||||||||||||
| (MILLIONS) | U.S. | Canada | Brazil | U.S. | Canada | Co-gen | Other | Total | ||||||||||||||||||||||||
| For the nine months ended Sep 30, 2013: | ||||||||||||||||||||||||||||||||
| Revenues | $ | 546 | $ | 294 | $ | 223 | $ | 107 | $ | 93 | $ | 50 | $ | - | $ | 1,313 | ||||||||||||||||
| Adjusted EBITDA | 407 | 243 | 160 | 77 | 78 | 15 | (44 | ) | 936 | |||||||||||||||||||||||
| Interest expense - borrowings | (111 | ) | (50 | ) | (18 | ) | (29 | ) | (34 | ) | - | (71 | ) | (313 | ) | |||||||||||||||||
| Funds from operations prior to | ||||||||||||||||||||||||||||||||
| non-controlling interests | 293 | 193 | 129 | 48 | 44 | 15 | (146 | ) | 576 | |||||||||||||||||||||||
| Cash portion of non-controlling interests | (57 | ) | - | (9 | ) | (26 | ) | - | - | (27 | ) | (119 | ) | |||||||||||||||||||
| Funds from operations | 236 | 193 | 120 | 22 | 44 | 15 | (173 | ) | 457 | |||||||||||||||||||||||
| Depreciation and amortization | (104 | ) | (64 | ) | (118 | ) | (46 | ) | (57 | ) | (9 | ) | - | (398 | ) | |||||||||||||||||
| For the nine months ended Sep 30, 2012: | ||||||||||||||||||||||||||||||||
| Revenues | $ | 343 | $ | 207 | $ | 262 | $ | 42 | $ | 89 | $ | 49 | $ | - | $ | 992 | ||||||||||||||||
| Adjusted EBITDA | 239 | 163 | 186 | 22 | 76 | 13 | (42 | ) | 657 | |||||||||||||||||||||||
| Interest expense - borrowings | (102 | ) | (51 | ) | (51 | ) | (17 | ) | (32 | ) | - | (60 | ) | (313 | ) | |||||||||||||||||
| Funds from operations prior to | ||||||||||||||||||||||||||||||||
| non-controlling interests | 138 | 112 | 122 | 5 | 44 | 13 | (127 | ) | 307 | |||||||||||||||||||||||
| Cash portion of non-controlling interests | (12 | ) | - | (10 | ) | (2 | ) | - | - | (10 | ) | (34 | ) | |||||||||||||||||||
| Funds from operations | 126 | 112 | 112 | 3 | 44 | 13 | (137 | ) | 273 | |||||||||||||||||||||||
| Depreciation and amortization | (86 | ) | (60 | ) | (114 | ) | (29 | ) | (56 | ) | (15 | ) | - | (360 | ) | |||||||||||||||||
| Brookfield Renewable Energy Partners L.P | Q3 2013 Interim Report | September 30, 2013 |
| Page 60 |
The following table reconciles Adjusted EBITDA and funds from operations, presented in the above tables, to net income as presented in the interim consolidated statements of income (loss):
| Three months ended Sep 30 | Nine months ended Sep 30 | |||||||||||||||||||
| (MILLIONS) | Notes | 2013 | 2012 | 2013 | 2012 | |||||||||||||||
| Revenues | 5 | $ | 392 | $ | 229 | $ | 1,313 | $ | 992 | |||||||||||
| Other income | 1 | 2 | 5 | 12 | ||||||||||||||||
| Share of cash earnings from equity-accounted | ||||||||||||||||||||
| investments | 6 | 7 | 3 | 19 | 11 | |||||||||||||||
| Direct operating costs | (140 | ) | (116 | ) | (401 | ) | (358 | ) | ||||||||||||
| Adjusted EBITDA | 260 | 118 | 936 | 657 | ||||||||||||||||
| Interest expense - borrowings | 9 | (105 | ) | (99 | ) | (313 | ) | (313 | ) | |||||||||||
| Management service costs | 5 | (9 | ) | (10 | ) | (32 | ) | (25 | ) | |||||||||||
| Current income tax (expense) recovery | 10 | (4 | ) | 1 | (15 | ) | (12 | ) | ||||||||||||
| Funds from operations prior to non-controlling interests | 142 | 10 | 576 | 307 | ||||||||||||||||
| Less: cash portion of non-controlling interests | ||||||||||||||||||||
| Preferred equity | (10 | ) | (3 | ) | (27 | ) | (10 | ) | ||||||||||||
| Participating non-controlling interests - in operating | ||||||||||||||||||||
| subsidiaries | (24 | ) | 4 | (92 | ) | (24 | ) | |||||||||||||
| Funds from operations | 108 | 11 | 457 | 273 | ||||||||||||||||
| Add: cash portion of non-controlling interests | 34 | (1 | ) | 119 | 34 | |||||||||||||||
| Depreciation and amortization | 7 | (133 | ) | (117 | ) | (398 | ) | (360 | ) | |||||||||||
| Unrealized financial instruments gain (loss) | 3,4 | 11 | 6 | 30 | (6 | ) | ||||||||||||||
| Share of non-cash loss from equity-accounted | ||||||||||||||||||||
| investments | 6 | (4 | ) | (5 | ) | (10 | ) | (13 | ) | |||||||||||
| Deferred income tax (expense) recovery | 10 | 10 | 37 | (1 | ) | 40 | ||||||||||||||
| Other | 2 | 10 | (6 | ) | 1 | |||||||||||||||
| Net income (loss) | $ | 28 | $ | (59 | ) | $ | 191 | $ | (31 | ) | ||||||||||
| Brookfield Renewable Energy Partners L.P | Q3 2013 Interim Report | September 30, 2013 |
| Page 61 |
The following table presents information about Brookfield Renewable’s certain balance sheet items on a segmented basis:
| Hydroelectric | Wind energy | Equity- | Co-gen | Other | Total | |||||||||||||||||||||||||||||||
| accounted | ||||||||||||||||||||||||||||||||||||
| (MILLIONS) | U.S. | Canada | Brazil | U.S. | Canada | investments | ||||||||||||||||||||||||||||||
| As at September 30, 2013: | ||||||||||||||||||||||||||||||||||||
| Property, plant and | ||||||||||||||||||||||||||||||||||||
| equipment | $ | 5,862 | $ | 5,132 | $ | 2,317 | $ | 1,206 | $ | 1,305 | $ | - | $ | 59 | $ | 455 | $ | 16,336 | ||||||||||||||||||
| Total assets | 6,153 | 5,219 | 2,610 | 1,304 | 1,327 | 314 | 67 | 597 | 17,591 | |||||||||||||||||||||||||||
| Total borrowings | 2,179 | 1,184 | 255 | 654 | 755 | - | - | 1,627 | 6,654 | |||||||||||||||||||||||||||
| Total liabilities | 3,463 | 2,244 | 439 | 725 | 1,025 | - | 7 | 1,809 | 9,712 | |||||||||||||||||||||||||||
| For the nine months ended | ||||||||||||||||||||||||||||||||||||
| September 30, 2013: | ||||||||||||||||||||||||||||||||||||
| Additions to property, plant | ||||||||||||||||||||||||||||||||||||
| and equipment | 738 | 207 | - | 421 | - | - | - | 186 | 1,552 | |||||||||||||||||||||||||||
| As at December 31, 2012: | ||||||||||||||||||||||||||||||||||||
| Property, plant and | ||||||||||||||||||||||||||||||||||||
| equipment | $ | 5,244 | $ | 5,191 | $ | 2,526 | $ | 834 | $ | 1,410 | $ | - | $ | 71 | $ | 382 | $ | 15,658 | ||||||||||||||||||
| Total assets | 5,418 | 5,386 | 2,805 | 910 | 1,452 | 344 | 83 | 527 | 16,925 | |||||||||||||||||||||||||||
| Total borrowings | 1,784 | 1,126 | 348 | 460 | 629 | - | - | 1,772 | 6,119 | |||||||||||||||||||||||||||
| Total liabilities | 2,997 | 2,162 | 556 | 531 | 957 | - | 15 | 1,899 | 9,117 | |||||||||||||||||||||||||||
| For the year ended | ||||||||||||||||||||||||||||||||||||
| December 31, 2012: | ||||||||||||||||||||||||||||||||||||
| Additions to property, plant | ||||||||||||||||||||||||||||||||||||
| and equipment | 621 | 85 | 147 | 610 | 14 | - | 5 | - | 1,482 | |||||||||||||||||||||||||||
| Brookfield Renewable Energy Partners L.P | Q3 2013 Interim Report | September 30, 2013 |
| Page 62 |
15. COMMITMENTS, CONTINGENCIES AND GUARANTEES
Commitments
In the course of its operations, Brookfield Renewable and its subsidiaries have entered into agreements for the use of water, land and dams. Payment under those agreements varies with the amount of power generated. The various agreements are renewable and extend up to 2054.
Project costs on the 45 MW hydroelectric project in British Columbia are expected to total $200 million.
Contingencies
Brookfield Renewable and its subsidiaries are subject to various legal proceedings, arbitrations and actions arising in the normal course of business. While the final outcome of such legal proceedings and actions cannot be predicted with certainty, it is the opinion of management that the resolution of such proceedings and actions will not have a material impact on Brookfield Renewable’s consolidated financial position or results of operations.
Guarantees
Brookfield Renewable, on behalf of Brookfield Renewable’s subsidiaries, and the subsidiaries themselves have provided letters of credit, which include, but are not limited to, guarantees for debt service reserves, capital reserves, construction completion and performance. The activity on the issued letters of credit by Brookfield Renewable can be found in Note 9 – Long-term debt and credit facilities. As at September 30, 2013, letters of credit issued by subsidiaries of Brookfield Renewable amounted to $93 million.
In the normal course of operations, Brookfield Renewable and its subsidiaries execute agreements that provide for indemnification and guarantees to third parties of transactions such as business dispositions, capital project purchases, business acquisitions, and sales and purchases of assets and services. Brookfield Renewable has also agreed to indemnify its directors and certain of its officers and employees. The nature of substantially all of the indemnification undertakings prevents Brookfield Renewable from making a reasonable estimate of the maximum potential amount that Brookfield Renewable could be required to pay third parties as the agreements do not always specify a maximum amount and the amounts are dependent upon the outcome of future contingent events, the nature and likelihood of which cannot be determined at this time. Historically, neither Brookfield Renewable nor its subsidiaries have made material payments under such indemnification agreements.
16. RESTATEMENT
During the year ended December 31, 2012, Brookfield Renewable changed its accounting policy to reflect the Redeemable/Exchangeable Partnership Units issued to Brookfield Asset Management by BRELP as Participating non-controlling interests - in a holding subsidiary - Redeemable/Exchangeable units held by Brookfield since the Redeemable/Exchangeable Partnership Units provide Brookfield Asset Management the direct economic benefits and exposures to the underlying performance of BRELP. Brookfield Renewable also reclassified the general partnership interest in BRELP held by Brookfield Asset Management to non-controlling interests.
This restatement has no impact on Brookfield Renewable’s reported consolidated income (loss), income (loss) per LP Unit, comprehensive income (loss) or total equity. The impact of this restatement on the consolidated balance sheet, statements of income (loss), comprehensive income (loss) and changes in equity as at September 30, 2012 and for the three and nine months ended September 30, 2012 is shown in the following table.
| Brookfield Renewable Energy Partners L.P | Q3 2013 Interim Report | September 30, 2013 |
| Page 63 |
The following table also includes Brookfield Renewable’s retroactive restatements to its consolidated financial statements resulting from the adoption of the amended IAS 19, Employee Benefits, as discussed in Note 2(c).
| Change in | ||||||||||||||||
| accounting | ||||||||||||||||
| Previously | policy | �� | ||||||||||||||
| (MILLIONS) | Presented | Adjustment | (Note 2(c)) | Restated | ||||||||||||
| As at and for the three and nine months ended September 30, 2012: | ||||||||||||||||
| Consolidated Balance Sheet and Consolidated Statements of Changes in Equity | ||||||||||||||||
| General partnership interest in a holding subsidiary held by | ||||||||||||||||
| Brookfield | $ | - | $ | 60 | $ | - | $ | 60 | ||||||||
| Participating non-controlling interests - in a holding subsidiary | ||||||||||||||||
| - Redeemable/Exchangeable units held by Brookfield | - | 2,921 | (11 | ) | 2,910 | |||||||||||
| Limited partners' equity | 5,973 | (2,981 | ) | (11 | ) | 2,981 | ||||||||||
| For the three months ended September 30, 2012: | ||||||||||||||||
| Consolidated Statements of Income (Loss) | ||||||||||||||||
| Net loss attributable to: | ||||||||||||||||
| Participating non-controlling interests - in a holding subsidiary | ||||||||||||||||
| - Redeemable/Exchangeable units held by Brookfield | $ | - | $ | (26 | ) | $ | - | $ | (26 | ) | ||||||
| Limited partners' equity | (52 | ) | 26 | - | (26 | ) | ||||||||||
| For the nine months ended September 30, 2012: | ||||||||||||||||
| Consolidated Statements of Income (Loss) | ||||||||||||||||
| Net loss attributable to: | ||||||||||||||||
| Participating non-controlling interests - in a holding subsidiary | ||||||||||||||||
| - Redeemable/Exchangeable units held by Brookfield | $ | - | $ | (8 | ) | $ | - | $ | (8 | ) | ||||||
| Limited partners' equity | (15 | ) | 8 | - | (7 | ) | ||||||||||
| Consolidated Statements of Comprehensive Income (Loss) | ||||||||||||||||
| Comprehensive loss attributable to: | ||||||||||||||||
| General partnership interest in a holding subsidiary held by | ||||||||||||||||
| Brookfield | $ | - | $ | (2 | ) | $ | - | $ | (2 | ) | ||||||
| Participating non-controlling interests - in a holding subsidiary | ||||||||||||||||
| - Redeemable/Exchangeable units held by Brookfield | - | (42 | ) | (3 | ) | (45 | ) | |||||||||
| Limited partners' equity | (86 | ) | 44 | (3 | ) | (45 | ) | |||||||||
17. SUBSEQUENT EVENTS |
In November 2013, Brookfield Renewable announced an agreement to acquire a 70 MW hydroelectric portfolio in Maine consisting of nine facilities on three rivers. The portfolio is expected to generate approximately 375 GWh annually. The acquisition is being pursued with institutional partners and Brookfield Renewable will assume an approximate 40% interest in the portfolio. |
Brookfield Renewable also announced an agreement to acquire, with our institutional partners, the remaining 50% interest in the 30 MW Malacha Hydro facility in California. Brookfield Renewable will retain an approximate 25% interest in the facility. |
| The transactions above are subject to regulatory approvals and other customary closing conditions and are expected to close before the end of 2013. |
| Brookfield Renewable Energy Partners L.P | Q3 2013 Interim Report | September 30, 2013 |
| Page 64 |
| GENERAL INFORMATION | ||
Corporate Office 73 Front Street Fifth Floor Hamilton, HM12 Bermuda Tel: +1(441) 294-3304 Fax: +1(441) 516-1988 www.brookfieldrenewable.com Officers of Brookfield Renewable Energy Partners L.P.’s Manager, BRP Energy Group L.P. Harry Goldgut Chairman of BRE Group Richard Legault President and Chief Executive Officer Sachin Shah Chief Financial Officer Transfer Agent & Registrar Computershare Trust Company of Canada 100 University Avenue 9th floor Toronto, Ontario, M5J 2Y1 Tel Toll Free: 1 (800) 564-6253 Fax Toll Free: 1 (888) 453-0330 www.computershare.com | Directors of the General Partner of Brookfield Renewable Energy Partners L.P. Jeffrey Blidner Eleazar de Carvalho Filho John Van Egmond David Mann Lou Maroun Patricia Zuccotti Lars Josefsson Exchange Listing TSX: BEP.UN (L.P. Units) NYSE: BEP (L.P. Units) TSX: BRF.PR.A (Preferred shares – Series 1) TSX: BRF.PR.C (Preferred shares – Series 3) TSX: BRF.PR.E (Preferred shares – Series 5) TSX: BRF.PR.F (Preferred shares – Series 6) Investor Information Visit Brookfield Renewable online at www.brookfieldrenewable.com for more information. The 2012 Annual Report is also available online. For detailed and up-to-date news and information, please visit the News Release section. Additional financial information is filed electronically with various securities regulators in Canada and United States through SEDAR at www.sedar.com and through EDGAR at www.sec.gov. Shareholder enquiries should be directed to the Investor Relations Department at (416) 359-1955 or unitholderenquiries@brookfieldrenewable.com | |
| TSX: |
| BEP.UN |
| NYSE: |
| BEP |
| www.brookfieldrenewable.com |