 Fourth Quarter and Year Ended 2012 Earnings Conference Call and Webcast March 14, 2013 |
 Forward Looking Statements 1 The following information contains forward-looking statements within the meaning of the Private Securities Litigation Reform Act of 1995. These forward-looking statements are based on management’s current expectations and beliefs, as well as a number of assumptions concerning future events. You can identify forward-looking statements by words such as “anticipate,” “believe,” “estimate,” “forecast,” “project,” “could,” “may,” “should,” “would,” “will or other similar expression that convey the uncertainty of future events or outcomes. These forward-looking statements are based on our current expectations and beliefs concerning future developments and their potential effect on us. While management believes that these forward-looking statements are reasonable as and when made, there can be no assurance that future developments affecting us will be those that we anticipate. All comments concerning our expectations for future revenues and operating results are based on our forecasts for our existing operations and do not include the potential impact of any future acquisitions. Our forward-looking statements involve significant risks and uncertainties (some of which are beyond our control) and assumptions that could cause actual results to differ materially from our historical experience and our present expectations or projections. Important factors that could cause actual results to differ materially from those in the forward-looking statements include, but are not limited to, the overall demand for hydrocarbon products, fuels and other refined products; our ability to produce products and fuels that meet our customers’ unique and precise specifications; the impact of fluctuations and rapid increases or decreases in crude oil, refined products, fuel and utility services prices and crack spreads, including the impact of these factors on our liquidity; fluctuations in refinery capacity; accidents or other unscheduled shutdowns or disruptions affecting our refinery, machinery, or equipment, or those of our suppliers or customers; changes in the cost or availability of transportation for feedstocks and refined products; the results of our hedging and other risk management activities; our ability to comply with covenants contained in our debt instruments; labor relations; relationships with our partners and franchisees; successful integration and future performance of acquired assets, businesses or third-party product supply and processing relationships; our access to capital to fund expansions, acquisitions and our working capital needs and our ability to obtain debt or equity financing on satisfactory terms; currently unknown liabilities in connection with the Marathon Acquisition (as defined herein); environmental liabilities or events that are not covered by an indemnity, insurance or existing reserves; dependence on one principal supplier for merchandise; maintenance of our credit ratings and ability to receive open credit lines from our suppliers; the effects of competition; continued creditworthiness of, and performance by, counterparties; the impact of current and future laws, rulings and governmental regulations, including guidance related to the Dodd-Frank Wall Street Reform and Consumer Protection Act; shortages or cost increases of power supplies, natural gas, materials or labor; weather interference with business operations; seasonal trends in the industries in which we operate; fluctuations in the debt markets; potential product liability claims and other litigation; and changes in economic conditions, generally, and in the markets we serve, consumer behavior, and travel and tourism trends. For additional information regarding known material factors that could cause our actual results to differ from our projected results, please see Part I, “Item 1A. Risk Factors” and elsewhere in our Form 10-K, dated March 14, 2013 (File No. 001-35612). The presentation also includes non-GAAP measures. We believe that these non-GAAP financial measures provide useful information about our operating performance and should not be viewed in isolation or considered as alternatives to comparable GAAP measures. Our non-GAAP financial measures may also differ from similarly names measures used by other companies. See the disclosures in the “Management’s Discussion and Analysis of Financial Condition and Results of Operations” included in our Form 10-K, dated March 14, 2013, for additional information on the non –GAAP measures used in this presentation and reconciliations to the most directly comparable GAAP measures. |
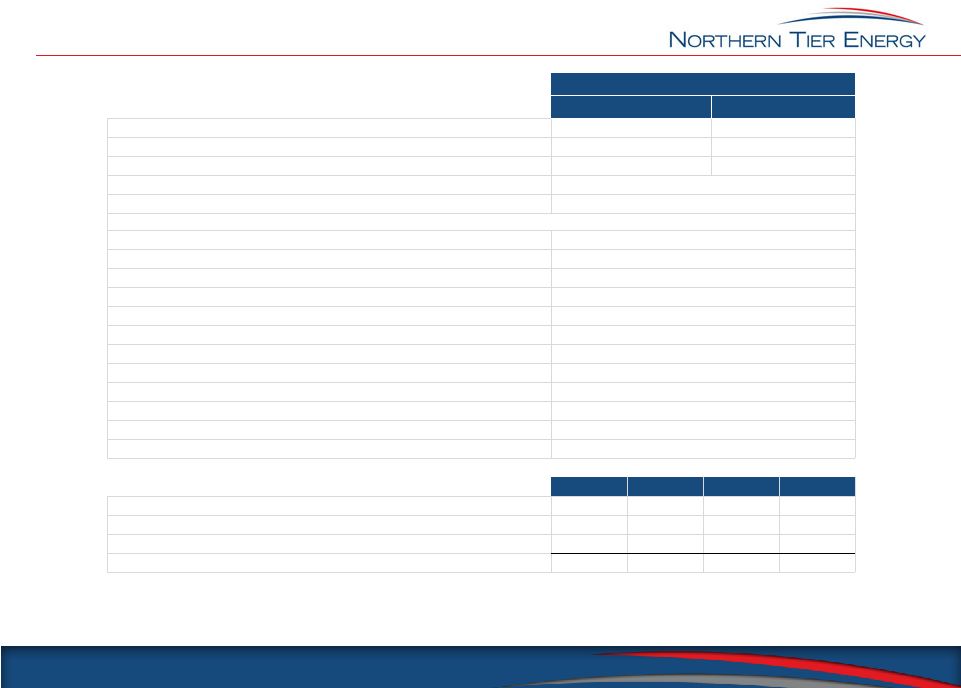
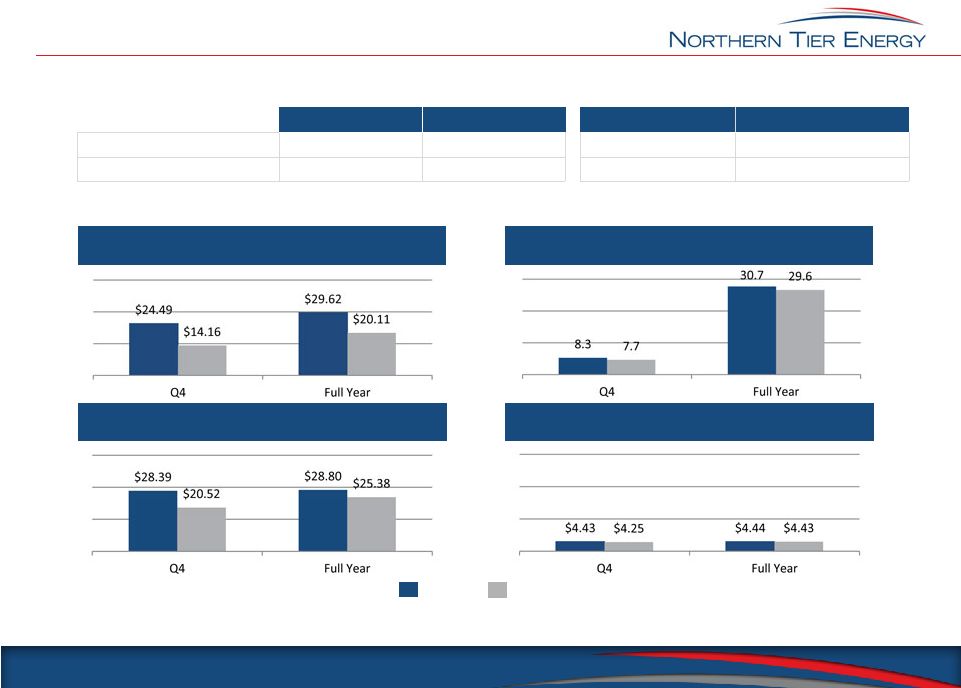 Q4 and Full Year 2012 Financial Results and Key Refining Performance Metrics 2 Q4 2012 Q4 2011 Full Year 2012 Full Year 2011 Net Income $84.5 $292.7 $197.6 $28.3 Adjusted EBITDA 162.4 66.5 739.7 430.7 Consolidated Financial Results Key Refining Performance Metrics 1 See Appendix for reconciliation of Net Income to Adjusted EBITDA. 2 See Appendix for the components used in this calculation (revenue and cost of sales). Gross margin per barrel is our average margin per barrel across all refined products. Whereas the 3-2-1 crack spread is specific to light products only (gasoline and distillates). 3 Direct operating expenses per barrel is calculated by dividing direct operating expenses by the total barrels of throughput for the respective periods presented. ($ in millions) Gross Margin² ($ per throughput barrel) Group 3 3-2-1 Benchmark Crack Spread (per bbl) Direct Operating Expenses³ ($ per throughput barrel) Throughput (millions of barrels) 2012 2011 1 |
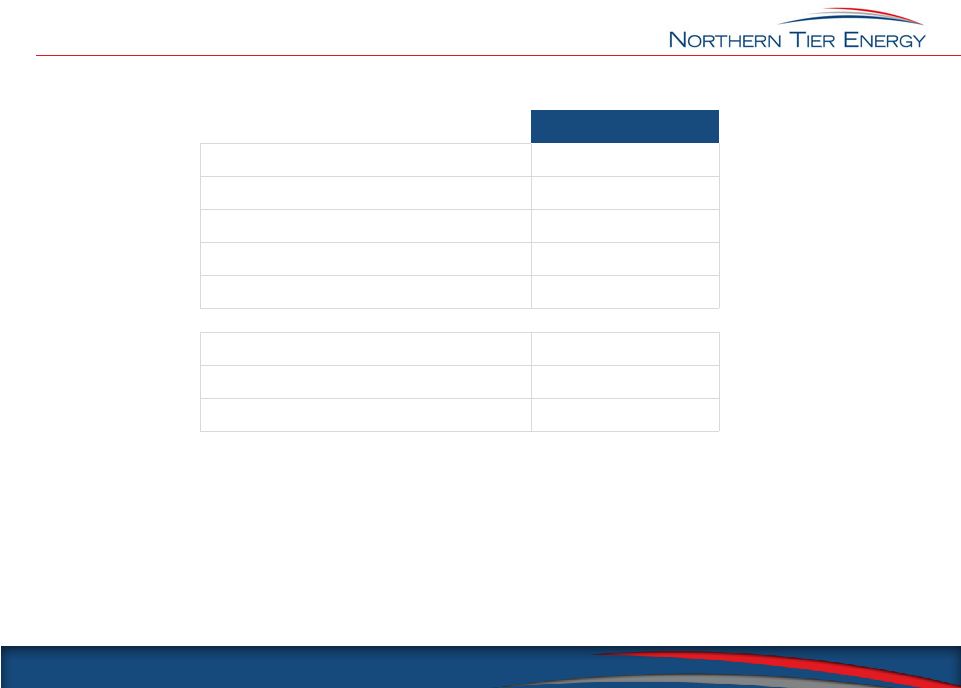 Select Balance Sheet & Cash Flow Data 3 Q4 2012 Cash and Cash Equivalents $272.9 Total Debt 282.5 Equity 483.8 Full Year Adjusted EBITDA 739.7 Net Debt to Full Year Adjusted EBITDA 0.0x Cash Flow from Operations $133.7 Cash Available for Distribution¹ 116.7 Distribution per Unit $1.27 ($ in millions) 1 See Appendix for reconciliation of Net Income to Cash Available for Distribution. |
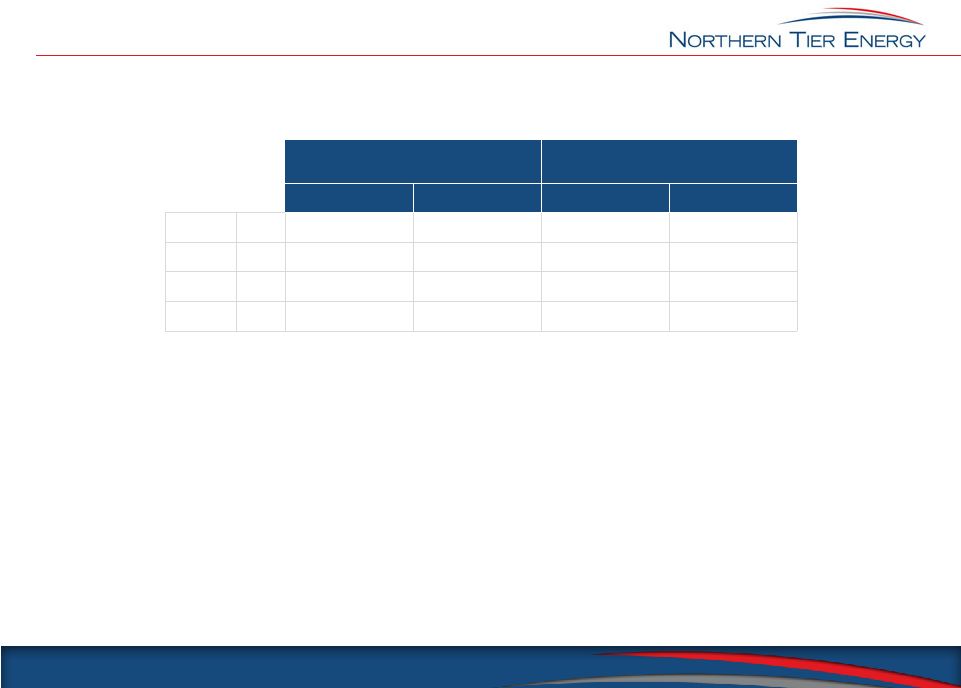 Hedge Positions 4 Volume Hedged (000 barrels) NTI Strike Price Gasoline Diesel Gasoline Distillate 2013 Q1 504 761 $16.08 $21.40 Q2 504 761 16.08 21.40 Q3 504 761 16.08 21.40 Q4 504 761 16.08 21.40 1 30,000 barrels of gasoline per quarter and 15,000 barrels of diesel per quarter are hedged at cracks against WCS, while the remaining barrels are hedged at cracks against WTI. 1 |
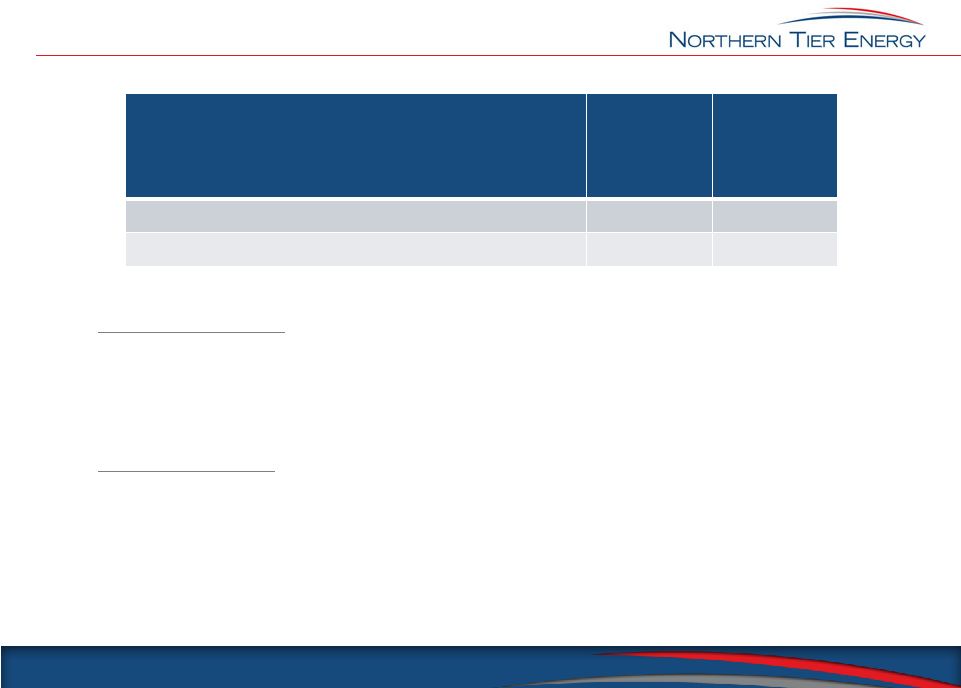 Expansion Capital #2 Crude Unit Expansion •Increase the processing capability of NDL crude via modifications to the #2 Crude unit, Sats Plant, and LSR Hydrotreater •Allows for additional crude rate capability (8,000 bpd) during periods of increased demand for light products and more flexibility in the winter to optimize crude supply Other Refining Projects •Start up of North Dakota trucking operation to purchase crude from well head in order to improve delivered cost of crude •Install dedicated slurry separation column on the fuel oil product stream to capture light product value uplift Project Estimated 2013 Capital Estimated Annual EBITDA Impact #2 Crude Unit Expansion $29 $36 Other Refining Projects $10 $10 1 Assumes a 10% expansion of throughput at an average gross margin of $13 per barrel. 5 1 |
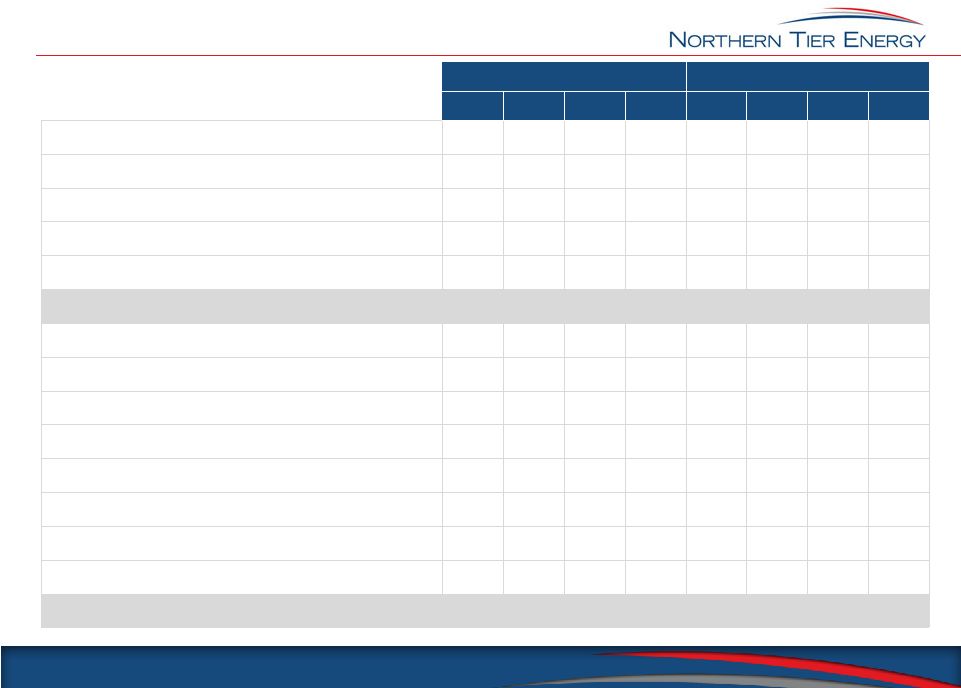
 Q1 ‘13 Operating and Full Year Capex Guidance 6 Q1 2013 Low High Refinery Statistics: Total throughput (bpd) 80,000 85,000 Refined products sold (bpd)¹ 75,000 80,000 Direct opex ex. turnaround ($/throughput bbl) $4.85 Turnaround reserve ($ in mm) $10.0 Retail Statistics: Forecasted gallons (mm) 72.0 Retail fuel margin ($/gallon) $0.16 Merchandise sales ($ in mm) $80.0 Merchandise gross margin (%) 25.5% Direct operating expense ($ in mm) $29.0 Other Guidance ($ in mm): SG&A $22.0 Depreciation & amortization $10.0 Cash interest expense $5.1 Taxes $0.5 Capital Program: Q1 2013 Q2 2013 Q3 2013 Q4 2013 Maintenance and replacement capital $7.2 $10.4 $7.4 $6.2 Waste Water Treatment (non recurring regulatory capital) 3.8 1.9 8.7 7.2 Expansion capital 20.5 13.7 2.7 1.7 Total Planned Capital Expenditures ($ in mm) $31.5 $26.0 $18.8 $15.1 1 GAAP Net Income and Adjusted EBITDA are based on volume of refined products sold. For Q1 2013, products sold are anticipated to be below throughput. Q1 2013 working capital will increase given the planned inventory build leading into the April 2013 turnaround. Management anticipates to manage 2013 working capital requirements using available liquidity while not impacting the Cash Available for Distribution in any given quarter. If availableliquidity is not sufficient to mitigate working capital requirements, the board of directors of NTE GP LLC may determine that incremental cash reserves are required. |
 APPENDIX |
 Adjusted EBITDA Reconciliation 8 2011 2012 1Q 2Q 3Q 4Q 1Q 2Q 3Q 4Q Net Income (Loss) $(224.5) $(42.1) $2.2 $292.7 $(193.6) $246.6 $61.1 $84.5 Adjustments: Interest Expense 10.0 10.2 10.4 11.5 10.4 10.7 15.6 5.5 Income Tax Provision 0.1 (0.1) - - - 0.1 7.7 2.0 Depreciation and Amortization 7.3 7.6 7.4 7.2 8.5 7.8 8.3 8.6 EBITDA Subtotal $(207.1) $(24.4) $20.0 $311.4 (174.7) $265.2 $92.7 $100.6 Minnesota Pipe Line Proportionate EBITDA 0.9 0.9 0.9 0.1 0.7 0.7 0.7 0.7 Turnaround and Related Expenses 3.3 19.2 - 0.1 3.5 11.5 2.1 9.0 Equity-based Compensation Impacts 0.3 0.4 0.4 0.5 0.4 0.5 0.5 (0.5) Unrealized (Gains) / Losses on Derivative Activities 262.9 31.0 40.6 (292.6) 88.4 (191.3) 70.3 (35.4) Contingent Consideration (Income) / Loss (31.8) (9.2) 3.4 (18.2) 65.7 0.1 38.5 - Formation and Offering Costs 2.5 1.9 1.7 1.3 - - - 0.4 Loss on Early Extinguishment of Derivatives/Debt - - - - 44.6 92.2 - 50.0 Realized losses on derivative activities 52.2 81.7 112.5 63.9 52.9 67.4 44.7 37.6 Adjusted EBITDA $83.2 $101.5 $179.5 $66.5 $81.5 $246.3 $249.5 $162.4 ($ in millions) |
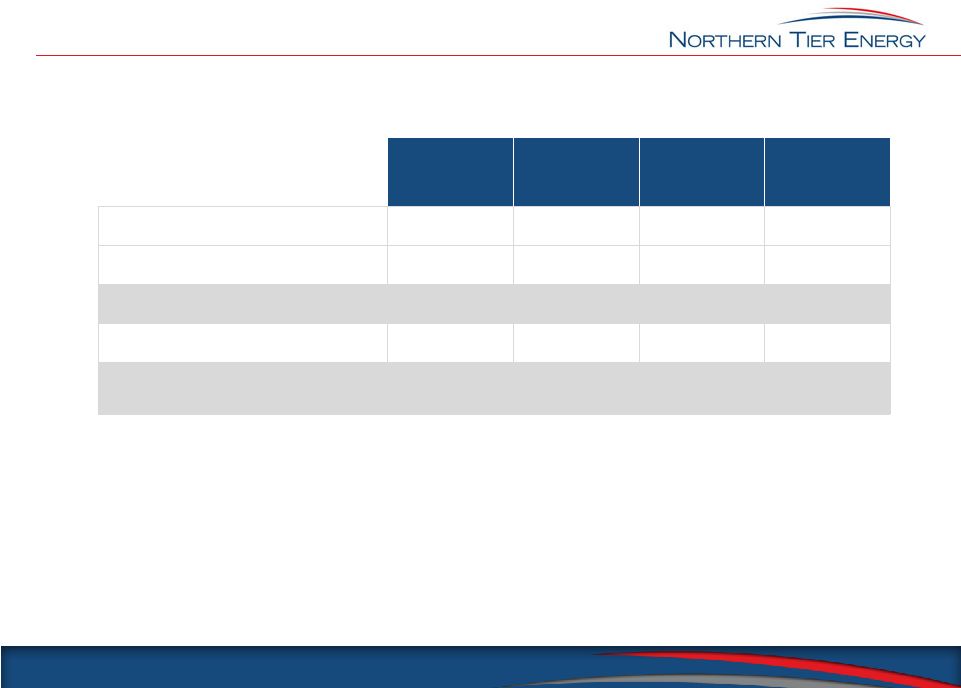 Refining Gross Product Margin Per Barrel of Throughput Reconciliation 9 Q4 2012 Full Year 2012 Q4 2011 Full Year 2011 Refinery Revenue $1,127.8 $4,212.6 $946.4 $3,804.1 Refinery Costs of Sales 924.4 3,303.7 837.8 3,208.5 Refinery Gross Product Margin $203.4 $908.9 $108.6 $595.6 Total Refinery Throughput (bpd) 90,265 83,851 83,335 81,150 Refinery Gross Product Margin Per Barrel of Throughput $24.49 $29.62 $14.16 $20.11 ($ in millions, unless otherwise indicated) |
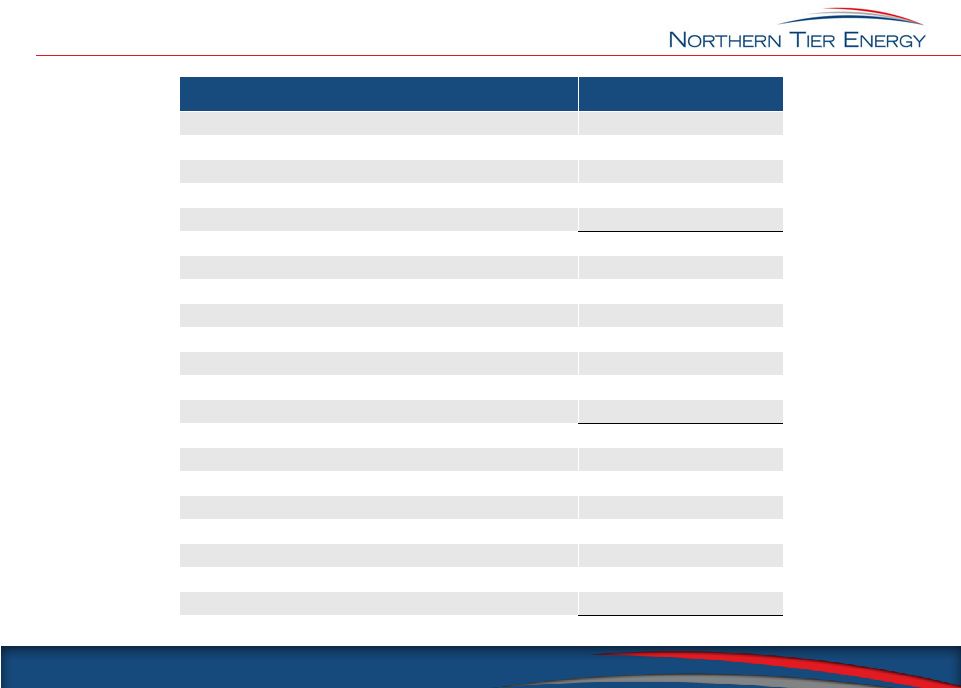 Cash Available for Distribution Reconciliation For the 3 months ending 12/31/12 Net income $84.5 Adjustments: Interest expense 5.5 Income tax provision 2.0 Depreciation and amortization 8.6 EBITDA subtotal 100.6 Minnesota Pipe Line proportionate EBITDA 0.7 Turnaround and related expenses 9.0 Equity-based compensation impacts (0.5) Unrealized gains on derivative activities (35.4) Formation and offering Costs 0.4 Loss on early extinguishment of debt 50.0 Realized losses on derivative activities 37.6 Adjusted EBITDA 162.4 Cash interest expense (6.4) Current tax provision 0.0 Minnesota Pipe Line proportionate EBITDA (0.7) Realized losses on derivative activities (37.6) Capital expenditures (17.6) Reserve for turnaround and related expenses (10.0) Working capital impacts 26.6 Cash Available for Distribution $116.7 ($ in millions) 10 |