UNITED STATES
SECURITIES AND EXCHANGE COMMISSION
Washington, D.C. 20549
FORM N-CSR
CERTIFIED SHAREHOLDER REPORT OF REGISTERED
MANAGEMENT INVESTMENT COMPANIES
Investment Company Act file number | 811-22621 |
|
Cohen & Steers Real Assets Fund, Inc. |
(Exact name of registrant as specified in charter) |
|
280 Park Avenue, New York, NY | | 10017 |
(Address of principal executive offices) | | (Zip code) |
|
Tina M. Payne
Cohen & Steers Capital Management, Inc.
280 Park Avenue
New York, New York 10017 |
(Name and address of agent for service) |
|
Registrant’s telephone number, including area code: | (212) 832-3232 | |
|
Date of fiscal year end: | December 31 | |
|
Date of reporting period: | June 30, 2013 | |
| | | | | | | | |
Item 1. Reports to Stockholders.
COHEN & STEERS REAL ASSETS FUND, INC.
To Our Shareholders:
We would like to share with you our report for the six months ended June 30, 2013. The net asset values (NAV) per share at that date were $9.15, $9.12, $9.16, $9.18 and $9.15 for Class A, Class C, Class I, Class R and Class Z shares, respectively.
The total returns, including income and change in NAV, for the Fund and its comparative benchmarks were:
| | | Six Months
Ended
June 30, 2013 | |
Cohen & Steers Real Assets Fund—Class A | | | –8.33 | % | |
Cohen & Steers Real Assets Fund—Class C | | | –8.68 | % | |
Cohen & Steers Real Assets Fund—Class I | | | –8.21 | % | |
Cohen & Steers Real Assets Fund—Class R | | | –8.49 | % | |
Cohen & Steers Real Assets Fund—Class Z | | | –8.25 | % | |
Blended benchmark—30% FTSE EPRA/NAREIT Developed Real
Estate Index-net/30% Dow Jones-UBS Commodity Index/20%
S&P Global Natural Resources Index-net/12.5% BofA Merrill Lynch
1-3 Year Global Corporate Index/7.5% Gold Indexa | | | –7.07 | % | |
Consumer Price Index plus 4%a | | | 2.78 | % | |
| MSCI World Index—neta | | | 8.43 | % | |
a The FTSE EPRA/NAREIT Developed Real Estate Index is an unmanaged portfolio of approximately 304 constituents from 20 countries and is net of dividend withholding taxes. The Dow Jones-UBS Commodity Index is composed of futures contracts on physical commodities. These commodities are traded on U.S. exchanges, with the exception of aluminum, nickel and zinc, which trade on the London Metal Exchange (LME). The S&P Global Natural Resources Index includes 89 of the largest publicly-traded companies in natural resources and commodities businesses that meet specific investability requirements and is net of dividend withholding taxes. The BofA Merrill Lynch 1-3 Year Global Corporate Index is a subset of The BofA Merrill Lynch Global Corporate Index including all securities with a remaining term to final maturity less than 3 years. The Gold Index is represented by the gold spot price in U.S. dollars per Troy ounce. The Consumer Price Index (CPI) is a broad yardstick of consumer inflation. It measures the average price changes for a diverse basket of goods and services typically purchased by urban consumers, across diverse households and geographies. The index is represented by the change in the CPI plus 4% per year. The MSCI World Index is a free float-adjusted market capitalization weighted index that is designed to measure the equity market performance of developed markets and is net of dividend withholding taxes. The MSCI World Index consists of the following 24 developed market country indices: Australia, Austria, Belgium, Canada, Denmark, Finland, France, Germany, Greece, Hong Kong, Ireland, Israel, Italy, Japan, Netherlands, New Zealand, Norway, Portugal, Singapore, Spain, Sweden, Switzerland, the United Kingdom, and the United States.
1
COHEN & STEERS REAL ASSETS FUND, INC.
The performance data quoted represent past performance. Past performance is no guarantee of future results. The investment return and the principal value of an investment will fluctuate and shares, if redeemed, may be worth more or less than their original cost. Current performance may be lower or higher than the performance data quoted. Current total returns of the Fund can be obtained by visiting our website at cohenandsteers.com. All share class returns assume the reinvestment of all dividends and distributions at NAV. Fund performance figures reflect fee waivers and/or expense reimbursements, without which the performance would have been lower. Performance quoted does not reflect the deduction of the maximum 4.5% initial sales charge on Class A shares or the 1% maximum contingent deferred sales charge on Class C shares. If such charges were included, returns would have been lower. Index performance does not reflect the deduction of any fees, taxes or expenses. An investor cannot invest directly in an index. Performance figures for periods shorter than one year are not annualized.
The Fund implements fair value pricing when the daily change in a specific U.S. market index exceeds a predetermined percentage. Fair value pricing adjusts the valuation of certain non-U.S. holdings to account for such index change following the close of foreign markets. This standard practice has been adopted by a majority of the fund industry. In the event fair value pricing is implemented on the first and/or last day of a performance measurement period, the Fund's return may diverge from the relative performance of its benchmark index, which does not use fair value pricing.
Please note that distributions paid by the Fund to shareholders are subject to recharacterization for tax purposes and are taxable up to the amount of the Fund's investment company taxable income and net realized gains. Distributions in excess of the Fund's investment company taxable income and realized gains are a return of capital distributed from the Fund's assets.
Investment Review
Capital markets began the year on a positive note, but came under pressure in May after the U.S. Federal Reserve (the "Fed") indicated that further bond purchases could be tapered later this year, given the pace of U.S. economic improvement. Treasury yields moved sharply higher—the yield on the 10-year Treasury note rose from 1.8% to 2.6%—prompting a selloff in fixed income and interest-rate-sensitive equities. Markets also reacted negatively to news from China, including tighter bank liquidity in the second quarter and some lighter-than-expected economic data. Real asset classes had an overall decline, hindered by sizable downturns in precious metals commodities and natural resources stocks.
Fund performance
The investments of Cohen & Steers Real Assets Fund include commodities, global real estate securities, natural resource equities, gold, global infrastructure and fixed income securities (some of which are denominated in foreign currencies). Effective June 1, 2013, the Fund's advisor assumed the management of the Fund's investments in commodities, which were previously managed through a third party sudabvisory arrangement. The decision to bring the management of this allocation in-house was made in connection with Cohen & Steers' recent hiring of a commodities management team from GE Asset Management that employs an active, fundamental approach to commodities investment. The Fund's advisor also will begin managing the natural resource equities allocation on the close of business
2
COHEN & STEERS REAL ASSETS FUND, INC.
on July 29, 2013. This allocation was also formerly managed by a third party subadvisor. The Fund's advisor believes that these changes will integrate the management of all of the Fund's investment strategies, enhance oversight and administration, and improve overall Fund performance.
The Fund underperformed its blended benchmark, primarily due to the performance of the Fund's investments in commodities and fixed income securities. Factors that contributed to Fund performance are summarized below.
Commodities
The Fund's investments in commodities, which as a group declined 10.5% as measured by the Dow Jones-UBS Commodity Index, generated a negative total return during the period. In the energy sector, natural gas prices retreated late in the period, due to greater-than-expected storage builds and year-over-year upticks in U.S. natural gas production. In crude oil, West Texas Intermediate rose 5.2% while North Sea Brent declined 8.1%. Notably, the spread (premium) between North Sea Brent crude oil and West Texas Intermediate fell from close to $20 a barrel to $5.60 a barrel—its lowest level since January 2011.
Within the grains sector, soybean meal had a gain for the period, accelerating in the second quarter due to robust demand for U.S. product as the two largest exporters, Brazil and Argentina, were both plagued with export restriction issues. In softs (primarily those agriculture commodities that are deemed tropical), coffee declined to a four-year low on harvest pressure from Brazil's (the leading producer/exporter) record "off-year" and currency weakness.
In precious metals, gold, which opened the year at $1,675, fell to $1,234 by the end of the period. The decline, in our view, reflected weakening investment demand, reduced macroeconomic tail risks and expectations of low inflation and a stronger dollar. Base metals held up better than precious metals, but still printed sizable negative absolute returns, hindered in part by continued China growth concerns. China accounts for roughly 40% of global base metal demand.
Global Real Estate Securities
The Fund's investments in global real estate securities outperformed the FTSE EPRA/NAREIT Developed Real Estate Index, which had a 2.0% total return (net of dividend taxes) for the period. Performance diverged widely by region. U.S. REITs advanced in the period, helped by improving demand, low financing costs and very little new supply in most property sectors.
Europe had pockets of strength despite economic challenges; landlords with prime assets in London fared well, benefiting from strong investor demand for centrally located properties. The prospect of better economic growth in Japan rippled across Asia Pacific, although this was countered by fears that China's economy was decelerating more rapidly than markets expected. For the period, the Fund's allocations to the U.S. and Japan were noteworthy positive contributors to performance.
Natural Resource Equities
Natural resource equities held by the Fund also detracted from performance and slightly underperformed the S&P Global Natural Resources Index, which declined 11.1%. The group's performance was in line with the underlying commodities, represented by the Dow Jones-UBS
3
COHEN & STEERS REAL ASSETS FUND, INC.
Commodity Index. The metals and mining sectors (particularly precious metals) posted steeper losses. Gold miners were down significantly given the sharp losses in the underlying price of gold. Several larger miners had significant write offs.
Portfolio Diversifiers
The Fund's portfolio diversifiers were almost equally divided between short-duration fixed income securities and gold, and both allocations detracted from Fund performance. Within fixed income, securities denominated in Australian dollars detracted from Fund performance. China concerns drove down the value of Australia's dollar—the country is a major trading partner with China.
Investment Outlook
Commodities
In our view, improving macro growth trends favor commodities and natural resource equities. We believe that a number of commodities are exhibiting attractive valuations based on their supply/demand fundamentals, supported in many cases by prices that have declined to low enough levels to stimulate physical demand, drive production cuts, and/or find support near their marginal cost of supply.
In addition to increasingly favorable macro trends, and attractive individual commodity valuations (given the dispersion of returns over the last several years between commodities and equities), commodities appear to be attractively valued in comparison. We remain steadfast in our fundamental research-based approach to actively managing commodities, navigating through varied global market environments, with a keen focus on individual commodity supply/demand drivers in determining positioning.
Global Real Estate Securities
In the U.S., we expect the Fed to moderate quantitative easing once stronger and more sustained economic growth is observed. In this scenario, we believe the yield on the 10-year Treasury note could approach and cross 3% in 2014, but we maintain a view that the path to higher interest rates runs through an improving economy. Better growth could have a greater impact on investor sentiment than a move away from historically low rates, in our view.
Economic growth in Europe remains weak, but we expect a modest second-half recovery, factoring in the likelihood of more stimulus (possibility of another rate cut) to turn around the negative feedback loop and to create new jobs. While the fundamental picture may be challenged, we see opportunities to benefit from a great rotation into equities with reasonable dividend yields. We continue to focus on prime assets, especially in London.
With regard to Asia Pacific, we have become more positive on Japan, and favor certain developers that we think could benefit from increased buyer demand and rising asset values as a result of monetary stimulus. We remain overweight Australia.
Natural Resource Equities
With respect to natural resource stocks, we continue to position ourselves in select, well-run companies, with volume growth that can maintain margins and have the potential to outperform, despite a volatile price environment.
4
COHEN & STEERS REAL ASSETS FUND, INC.
Our Macro Perspective
In closing, we expect to see a second half rebound in the global economy, with growth picking up in the U.S., Europe and Japan. China is showing signs of a slowdown, but we believe that a hard landing is unlikely. We further believe that global liquidity will remain abundant. In the U.S., the Fed may taper its bond purchases, although it appears committed to keeping interest rates low until 2015. The European Central Bank, Bank of England and Bank of Japan are all still in easing mode, and the Bank of Japan's balance sheet is expanding. In short, we feel that an environment of growth accompanied by liquidity could be favorable for real assets.
Sincerely,
| | | | | 
| | 
| |
| | | | | MARTIN COHEN | | ROBERT H. STEERS | |
| | | | | Co-chairman | | Co-chairman | |
| | | | | 
| | 
| |
| | | | | JOSEPH M. HARVEY | | YIGAL D. JHIRAD | |
| | | | | Portfolio Manager | | Portfolio Manager | |
| | | | | 
| | 
| |
| | | | | WILLIAM F. SCAPELL | | JON CHEIGH | |
| | | | | Portfolio Manager | | Portfolio Manager | |
| | | | | 
| | 
| |
| | | | | JASON YABLON | | ELAINE ZAHARIS-NIKAS | |
| | | | | PORTFOLIO MANAGER | | PORTFOLIO MANAGER | |
5
COHEN & STEERS REAL ASSETS FUND, INC.
| | | | | 
| | 
| |
| | | ROBERT S. BECKER | | BEN MORTON | |
| | | Portfolio Manager | | Portfolio Manager | |
| | | | | 
| | 
| |
| | | | | BEN ROSS | | NICK KOUTSOFTAS | |
| | | | | PORTFOLIO MANAGER | | PORTFOLIO MANAGER | |
The views and opinions in the preceding commentary are subject to change and are as of the date of publication. There is no guarantee that any market forecast set forth in the commentary will be realized. This material represents an assessment of the market environment at a specific point in time, should not be relied upon as investment advice and is not intended to predict or depict performance of any investment.
Visit Cohen & Steers online at cohenandsteers.com
For more information about any of our funds, visit cohenandsteers.com, where you will find net asset values, fund fact sheets and portfolio highlights. You can also access newsletters, education tools and market updates covering the global real estate, commodities, global natural resource equities, listed infrastructure, utilities, large cap value and preferred securities sectors.
In addition, our website contains comprehensive information about our firm, including our most recent press releases, profiles of our senior investment professionals and an overview of our investment approach.
6
COHEN & STEERS REAL ASSETS FUND, INC.
Performance Review (Unaudited)
Average Annual Total Returns for the Periods Ended June 30, 2013
| | | Class A
Shares | | Class C
Shares | | Class I
Shares | | Class R
Shares | | Class Z
Shares | |
1 Year (with sales charge) | | | –6.43 | %a | | | –3.70 | %b | | | — | | | | — | | | | — | | |
1 Year (without sales charge) | | | –2.02 | % | | | –2.73 | % | | | –1.77 | % | | | –2.27 | % | | | –2.02 | % | |
Since Inceptionc (with sales charge) | | | –7.92 | %a | | | –5.58 | % | | | — | | | | — | | | | — | | |
Since Inceptionc (without sales charge) | | | –4.87 | % | | | –5.58 | % | | | –4.55 | % | | | –5.06 | % | | | –4.76 | % | |
The performance data quoted represent past performance. Past performance is no guarantee of future results. The investment return and principal value of an investment will fluctuate and shares, if redeemed, may be worth more or less than their original cost. Current performance may be lower or higher than the performance data quoted. Performance information current to the most recent month end can be obtained by visiting our website at cohenandsteers.com. All share class returns assume the reinvestment of all dividends and distributions at NAV. The performance table does not reflect the deduction of taxes that a shareholder would pay on Fund distributions or the redemption of Fund shares. During the periods presented above, the advisor waived fees and/or reimbursed expenses. Without this arrangement, performance would have been lower.
The annualized gross and net expense ratios, respectively, for each class of shares as disclosed in the May 1, 2013 prospectuses were as follows: Class A—2.46% and 1.35%; Class C—3.11% and 2.00%; Class I—2.12% and 1.00%; Class R—2.61% and 1.50%; and Class Z—2.26% and 1.15%. Through June 30, 2015, the advisor has contractually agreed to waive its fee and/or reimburse the Fund for expenses incurred to the extent necessary to maintain the Fund's annual operating expenses, which include the expenses of the subsidiary (excluding applicable distribution and shareholder servicing fees for Class A, Class C, Class R and Class Z shares, acquired fund fees and expenses and extraordinary expenses) as a percentage of average net assets at 1.35% for Class A shares, 2.00% for Class C shares, 1.00% for Class I shares, 1.50% for Class R shares and 1.15% for Class Z shares. This contractual agreement can be amended at any time by agreement of the Fund and the advisor and will terminate automatically in the event of termination of the investment advisory agreement between the advisor and the Fund.
a Reflects a 4.50% front-end sales charge.
b Reflects a contingent deferred sales charge of 1%.
c Inception date of January 31, 2012.
7
COHEN & STEERS REAL ASSETS FUND, INC.
Expense Example
(Unaudited)
As a shareholder of the Fund, you incur two types of costs: (1) transaction costs, including sales charges (loads) on purchase payments; and (2) ongoing costs including management fees; distribution and/or service (12b-1) fees; and other Fund expenses. This example is intended to help you understand your ongoing costs (in dollars) of investing in the Fund and to compare these costs with the ongoing costs of investing in other mutual funds.
The example is based on an investment of $1,000 invested at the beginning of the period and held for the entire period January 1, 2013—June 30, 2013.
Actual Expenses
The first line of the following table provides information about actual account values and expenses. You may use the information in this line, together with the amount you invested, to estimate the expenses that you paid over the period. Simply divide your account value by $1,000 (for example, an $8,600 account value divided by $1,000 = 8.6), then multiply the result by the number in the first line under the heading entitled "Expenses Paid During Period" to estimate the expenses you paid on your account during this period.
Hypothetical Example for Comparison Purposes
The second line of the following table provides information about hypothetical account values and hypothetical expenses based on the Fund's actual expense ratio and an assumed rate of return of 5% per year before expenses, which is not the Fund's actual return. The hypothetical account values and expenses may not be used to estimate the actual ending account balance or expenses you paid for the period. You may use this information to compare the ongoing cost of investing in the Fund and other funds. To do so, compare this 5% hypothetical example with the 5% hypothetical examples that appear in the shareholder reports of other funds.
Please note that the expenses shown in the table are meant to highlight your ongoing costs only and do not reflect any transaction costs, such as sales charges (loads). Therefore, the second line of the table is useful in comparing ongoing costs only, and will not help you determine the relative total costs of owning different funds. In addition, if these transactional costs were included, your costs would have been higher.
8
COHEN & STEERS REAL ASSETS FUND, INC.
Expense Example (Unaudited)—(Continued)
| | | Beginning
Account Value
January 1, 2013 | | Ending
Account Value
June 30, 2013 | | Expenses Paid
During Perioda
January 1, 2013–
June 30, 2013 | |
Class A | |
Actual (–8.33% return) | | $ | 1,000.00 | | | $ | 916.70 | | | $ | 6.42 | | |
Hypothetical (5% annual return before
expenses) | | $ | 1,000.00 | | | $ | 1,018.10 | | | $ | 6.76 | | |
Class C | |
Actual (–8.68% return) | | $ | 1,000.00 | | | $ | 913.20 | | | $ | 9.49 | | |
Hypothetical (5% annual return before
expenses) | | $ | 1,000.00 | | | $ | 1,014.88 | | | $ | 9.99 | | |
Class I | |
Actual (–8.21% return) | | $ | 1,000.00 | | | $ | 917.90 | | | $ | 4.76 | | |
Hypothetical (5% annual return before
expenses) | | $ | 1,000.00 | | | $ | 1,019.84 | | | $ | 5.01 | | |
Class R | |
Actual (–8.49% return) | | $ | 1,000.00 | | | $ | 915.10 | | | $ | 7.12 | | |
Hypothetical (5% annual return before
expenses) | | $ | 1,000.00 | | | $ | 1,017.36 | | | $ | 7.50 | | |
Class Z | |
Actual (–8.25% return) | | $ | 1,000.00 | | | $ | 917.50 | | | $ | 5.47 | | |
Hypothetical (5% annual return before
expenses) | | $ | 1,000.00 | | | $ | 1,019.09 | | | $ | 5.76 | | |
a Expenses are equal to the Fund's Class A, Class C, Class I, Class R and Class Z annualized expense ratios of 1.35%, 2.00%, 1.00%, 1.50% and 1.15%, respectively, multiplied by the average account value over the period, multiplied by 181/365 (to reflect the one-half year period). If the Fund had borne all of its expenses that were assumed by the advisor, the annualized expense ratios would have been 2.14%, 2.77%, 1.76%, 1.93% and 2.02%, respectively.
9
COHEN & STEERS REAL ASSETS FUND, INC.
June 30, 2013
Top Ten Holdingsa
(Unaudited)
Security | | Value | | % of
Net
Assets | |
iShares Gold Trust ETF | | $ | 2,398,000 | | | | 2.6 | | |
Sprott Physical Gold Trust ETF (USD) | | | 1,882,320 | | | | 2.0 | | |
BHP Billiton PLC | | | 1,742,902 | | | | 1.9 | | |
Simon Property Group | | | 1,201,140 | | | | 1.3 | | |
Central GoldTrust (USD) | | | 1,166,880 | | | | 1.3 | | |
Mitsui Fudosan Co., Ltd. | | | 882,335 | | | | 1.0 | | |
Australia Government Bond, 4.50%, due 10/21/14, Series 131 | | | 844,487 | | | | 0.9 | | |
Equity Residential | | | 803,666 | | | | 0.9 | | |
UDR | | | 785,908 | | | | 0.9 | | |
Prologis | | | 752,778 | | | | 0.8 | | |
a Top ten holdings are determined on the basis of the value of individual securities held. The Fund may also hold positions in other types of securities issued by the companies listed above. See the Consolidated Schedule of Investments for additional details on such other positions.
Strategy Breakdownb
(Unaudited)
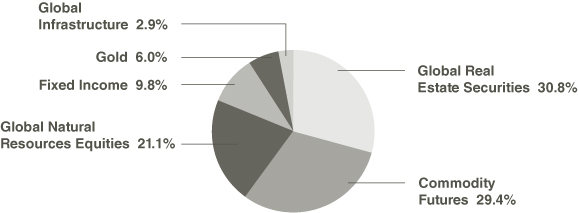
b The strategy breakdown is expressed as an approximate percentage of the Fund's total long-term investments inclusive of derivative exposure.
10
COHEN & STEERS REAL ASSETS FUND, INC.
CONSOLIDATED SCHEDULE OF INVESTMENTS
June 30, 2013 (Unaudited)
| | | | | Number
of Shares | | Value | |
COMMON STOCK | | 60.3% | | | | | |
AUSTRALIA | | 3.8% | | | | | |
ENERGY—OIL & GAS | | 0.5% | | | | | |
Santos Ltd. | | | | | 37,598 | | | $ | 430,847 | | |
MATERIALS | | 0.7% | | | | | |
CHEMICALS | | 0.3% | | | | | |
Incitec Pivot Ltd. | | | | | 118,708 | | | | 310,494 | | |
METALS & MINING | | 0.4% | | | | | |
Fortescue Metals Group Ltd. | | | | | 120,832 | | | | 335,941 | | |
Metminco Ltd.a | | | | | 836,048 | | | | 9,940 | | |
| | | | | | | | 345,881 | | |
TOTAL MATERIALS | | | | | | | 656,375 | | |
REAL ESTATE | | 2.6% | | | | | |
DIVERSIFIED | | 1.0% | | | | | |
Cromwell Property Group | | | | | 466,963 | | | | 416,385 | | |
GPT Group | | | | | 51,196 | | | | 179,794 | | |
Mirvac Group | | | | | 231,443 | | | | 339,724 | | |
| | | | | | | | 935,903 | | |
OFFICE | | 0.2% | | | | | |
Commonwealth Property Office Fund | | | | | 184,905 | | | | 186,015 | | |
RETAIL | | 1.4% | | | | | |
Charter Hall Retail REIT | | | | | 77,804 | | | | 271,103 | | |
Federation Centres Ltd. | | | | | 237,032 | | | | 513,763 | | |
Westfield Retail Trust | | | | | 178,636 | | | | 506,452 | | |
| | | | | | | | 1,291,318 | | |
TOTAL REAL ESTATE | | | | | | | 2,413,236 | | |
TOTAL AUSTRALIA | | | | | | | 3,500,458 | | |
BERMUDA | | 0.2% | | | | | |
CONSUMER—NON-CYCLICAL—FOOD PRODUCTS | | | | | | | |
Asian Citrus Holdings Ltd. (GBP) | | | | | 311,983 | | | | 109,731 | | |
Asian Citrus Holdings Ltd. (HKD) | | | | | 193,000 | | | | 69,177 | | |
TOTAL BERMUDA | | | | | | | 178,908 | | |
See accompanying notes to the consolidated financial statements.
11
COHEN & STEERS REAL ASSETS FUND, INC.
CONSOLIDATED SCHEDULE OF INVESTMENTS—(Continued)
June 30, 2013 (Unaudited)
| | | | | Number
of Shares | | Value | |
BRAZIL | | 0.6% | | | | | |
ENERGY—OIL & GAS | | 0.4% | | | | | |
Petroleo Brasileiro SA, ADR | | | | | 26,171 | | | $ | 383,667 | | |
REAL ESTATE—RETAIL | | 0.2% | | | | | |
BR Malls Participacoes SA | | | | | 14,792 | | | | 132,451 | | |
TOTAL BRAZIL | | | | | | | 516,118 | | |
CANADA | | 6.2% | | | | | |
ENERGY—OIL & GAS | | 0.8% | | | | | |
Suncor Energy | | | | | 24,216 | | | | 713,793 | | |
GOLD | | 3.3% | | | | | |
Central GoldTrust (USD)a | | | | | 26,400 | | | | 1,166,880 | | |
Sprott Physical Gold Trust ETF (USD)a | | | | | 184,000 | | | | 1,882,320 | | |
| | | | | | | | 3,049,200 | | |
MARINE PORTS | | 0.2% | | | | | | | |
Westshore Terminals Investment Corp. | | | | | 6,230 | | | | 170,189 | | |
MATERIALS | | 1.3% | | | | | |
CHEMICALS | | 0.3% | | | | | |
Potash Corp. of Saskatchewan (USD) | | | | | 6,165 | | | | 235,072 | | |
METALS & MINING | | 1.0% | | | | | |
First Quantum Minerals Ltd. | | | | | 22,476 | | | | 333,389 | | |
Franco-Nevada Corp. | | | | | 9,486 | | | | 339,591 | | |
Goldcorp (USD) | | | | | 7,923 | | | | 195,936 | | |
Nevsun Resources Ltd. | | | | | 33,250 | | | | 98,324 | | |
| | | | | | | | 967,240 | | |
TOTAL MATERIALS | | | | | | | 1,202,312 | | |
PIPELINES—C-CORP | | 0.3% | | | | | |
Enbridge | | | | | 8,030 | | | | 337,555 | | |
REAL ESTATE—OFFICE | | 0.3% | | | | | |
Allied Properties Real Estate Investment Trust | | | | | 8,384 | | | | 255,179 | | |
TOTAL CANADA | | | | | | | 5,728,228 | | |
FRANCE | | 1.6% | | | | | |
AIRPORTS | | 0.2% | | | | | |
Aeroports de Paris | | | | | 1,780 | | | | 173,098 | | |
See accompanying notes to the consolidated financial statements.
12
COHEN & STEERS REAL ASSETS FUND, INC.
CONSOLIDATED SCHEDULE OF INVESTMENTS—(Continued)
June 30, 2013 (Unaudited)
| | | | | Number
of Shares | | Value | |
ENERGY—OIL & GAS | | 0.4% | | | | | |
Total SA | | | | | 8,352 | | | $ | 407,731 | | |
REAL ESTATE | | 1.0% | | | | | |
DIVERSIFIED | | 0.2% | | | | | |
Societe Fonciere Lyonnaise SA | | | | | 3,251 | | | | 165,035 | | |
RETAIL | | 0.8% | | | | | |
Klepierre | | | | | 7,173 | | | | 282,716 | | |
Unibail-Rodamco | | | | | 1,897 | | | | 441,992 | | |
| | | | | | | | 724,708 | | |
TOTAL REAL ESTATE | | | | | | | 889,743 | | |
TOTAL FRANCE | | | | | | | 1,470,572 | | |
GERMANY | | 0.3% | | | | | |
REAL ESTATE—RESIDENTIAL | | | | | | | |
Deutsche Wohnen AG | | | | | 17,280 | | | | 293,415 | | |
HONG KONG | | 2.8% | | | | | |
ENERGY—OIL & GAS | | 0.3% | | | | | |
CNOOC Ltd. | | | | | 185,000 | | | | 313,897 | | |
MATERIALS—METALS & MINING | | 0.1% | | | | | |
China Polymetallic Mining Ltd.a,b | | | | | 323,000 | | | | 42,478 | | |
REAL ESTATE | | 2.4% | | | | | |
DIVERSIFIED | | 1.2% | | | | | |
Sino Land Co., Ltd. | | | | | 116,057 | | | | 162,503 | | |
Sun Hung Kai Properties Ltd. | | | | | 55,397 | | | | 714,956 | | |
Wharf Holdings Ltd. | | | | | 32,000 | | | | 269,209 | | |
| | | | | | | | 1,146,668 | | |
OFFICE | | 0.5% | | | | | |
Hongkong Land Holdings Ltd. (USD) | | | | | 62,000 | | | | 425,940 | | |
RESIDENTIAL | | 0.4% | | | | | |
China Overseas Land & Investment Ltd. | | | | | 52,812 | | | | 137,885 | | |
Country Garden Holdings Co. | | | | | 437,000 | | | | 227,063 | | |
| | | | | | | | 364,948 | | |
See accompanying notes to the consolidated financial statements.
13
COHEN & STEERS REAL ASSETS FUND, INC.
CONSOLIDATED SCHEDULE OF INVESTMENTS—(Continued)
June 30, 2013 (Unaudited)
| | | | | Number
of Shares | | Value | |
RETAIL | | 0.3% | | | | | |
Link REIT | | | | | 50,000 | | | $ | 246,259 | | |
TOTAL REAL ESTATE | | | | | | | 2,183,815 | | |
TOTAL HONG KONG | | | | | | | 2,540,190 | | |
ITALY | | 0.4% | | | | | |
ENERGY—OIL & GAS | | | | | | | |
Eni S.p.A. | | | | | 18,470 | | | | 379,374 | | |
JAPAN | | 5.0% | | | | | |
ENERGY—OIL & GAS | | 0.4% | | | | | |
Inpex Corp. | | | | | 90 | | | | 375,681 | | |
REAL ESTATE | | 4.6% | | | | | |
DIVERSIFIED | | 3.2% | | | | | |
Activia Properties | | | | | 36 | | | | 283,484 | | |
Mitsubishi Estate Co., Ltd. | | | | | 28,000 | | | | 745,594 | | |
Mitsui Fudosan Co., Ltd. | | | | | 30,000 | | | | 882,335 | | |
Nomura Real Estate Holdings | | | | | 10,752 | | | | 237,849 | | |
NTT Urban Development Corp. | | | | | 123 | | | | 151,053 | | |
Sumitomo Realty & Development Co., Ltd. | | | | | 16,000 | | | | 638,032 | | |
| | | | | | | | 2,938,347 | | |
INDUSTRIAL | | 0.6% | | | | | |
Industrial & Infrastructure Fund Investment Corp. | | | | | 18 | | | | 175,136 | | |
Nippon Prologis REIT | | | | | 39 | | | | 339,353 | | |
| | | | | | | | 514,489 | | |
OFFICE | | 0.5% | | | | | |
Japan Excellent | | | | | 44 | | | | 247,994 | | |
Japan Prime Realty Investment Corp. | | | | | 46 | | | | 140,764 | | |
Japan Real Estate Investment Corp. | | | | | 8 | | | | 89,292 | | |
| | | | | | | | 478,050 | | |
RETAIL | | 0.3% | | | | | |
AEON Mall Co., Ltd. | | | | | 7,200 | | | | 178,367 | | |
Japan Retail Fund Investment Corp. | | | | | 63 | | | | 131,615 | | |
| | | | | | | | 309,982 | | |
TOTAL REAL ESTATE | | | | | | | 4,240,868 | | |
TOTAL JAPAN | | | | | | | 4,616,549 | | |
See accompanying notes to the consolidated financial statements.
14
COHEN & STEERS REAL ASSETS FUND, INC.
CONSOLIDATED SCHEDULE OF INVESTMENTS—(Continued)
June 30, 2013 (Unaudited)
| | | | | Number
of Shares | | Value | |
JERSEY | | 1.0% | | | | | |
MATERIALS—METALS & MINING | | | | | | | |
Glencore International PLC (GBP) | | | | | 154,425 | | | $ | 639,206 | | |
Randgold Resources Ltd. (GBP) | | | | | 4,752 | | | | 295,245 | | |
TOTAL JERSEY | | | | | | | 934,451 | | |
MEXICO | | 0.3% | | | | | |
TOLL ROADS | | | | | | | |
OHL Mexico SAB de CVa | | | | | 99,860 | | | | 237,368 | | |
NETHERLANDS | | 0.6% | | | | | |
REAL ESTATE—RETAIL | | | | | | | |
Corio NV | | | | | 9,767 | | | | 388,579 | | |
Eurocommercial Properties NV | | | | | 4,293 | | | | 157,581 | | |
TOTAL NETHERLANDS | | | | | | | 546,160 | | |
NORWAY | | 0.7% | | | | | |
ENERGY—OIL & GAS | | 0.3% | | | | | |
Statoil ASA | | | | | 14,879 | | | | 306,920 | | |
MATERIALS—CHEMICALS | | 0.3% | | | | | |
Yara International ASA | | | | | 5,804 | | | | 231,420 | | |
REAL ESTATE—OFFICE | | 0.1% | | | | | |
Norwegian Property ASA | | | | | 101,174 | | | | 128,251 | | |
TOTAL NORWAY | | | | | | | 666,591 | | |
PHILIPPINES | | 0.5% | | | | | |
REAL ESTATE | | | | | | | |
DIVERSIFIED | | 0.2% | | | | | |
Ayala Land | | | | | 260,400 | | | | 183,244 | | |
RETAIL | | 0.3% | | | | | |
SM Prime Holdings | | | | | 631,875 | | | | 238,416 | | |
TOTAL PHILIPPINES | | | | | | | 421,660 | | |
RUSSIA | | 1.3% | | | | | |
ENERGY—OIL & GAS | | 0.5% | | | | | |
Gazprom OAO, ADRa | | | | | 30,915 | | | | 203,112 | | |
Rosneft OAO (USD) | | | | | 40,279 | | | | 275,911 | | |
| | | | | | | | 479,023 | | |
See accompanying notes to the consolidated financial statements.
15
COHEN & STEERS REAL ASSETS FUND, INC.
CONSOLIDATED SCHEDULE OF INVESTMENTS—(Continued)
June 30, 2013 (Unaudited)
| | | | | Number
of Shares | | Value | |
MATERIALS | | 0.8% | | | | | |
CHEMICALS | | 0.2% | | | | | |
Phosagro OAO, GDR | | | | | 14,708 | | | $ | 177,967 | | |
METALS & MINING | | 0.6% | | | | | |
MMC Norilsk Nickel OJSC (USD) | | | | | 36,753 | | | | 529,610 | | |
TOTAL MATERIALS | | | | | | | 707,577 | | |
TOTAL RUSSIA | | | | | | | 1,186,600 | | |
SINGAPORE | | 1.0% | | | | | |
REAL ESTATE | | | | | | | |
DIVERSIFIED | | 0.3% | | | | | |
Capitaland Ltd. | | | | | 102,000 | | | | 247,858 | | |
INDUSTRIALS | | 0.4% | | | | | |
Global Logistic Properties Ltd. | | | | | 180,000 | | | | 390,532 | | |
RETAIL | | 0.3% | | | | | |
CapitaMall Trust | | | | | 86,747 | | | | 136,537 | | |
Suntec Real Estate Investment Trust | | | | | 116,000 | | | | 144,142 | | |
| | | | | | | | 280,679 | | |
TOTAL SINGAPORE | | | | | | | 919,069 | | |
SOUTH AFRICA | | 0.5% | | | | | |
MATERIALS—METALS & MINING | | | | | | | |
Northam Platinum Ltd.a | | | | | 137,711 | | | | 445,800 | | |
SPAIN | | 0.2% | | | | | |
TOLL ROADS | | | | | | | |
Abertis Infraestructuras SA | | | | | 13,100 | | | | 228,492 | | |
SWITZERLAND | | 0.4% | | | | | |
ENERGY—OIL & GAS EQUIPMENT & SERVICES | | | | | | | |
Weatherford International Ltd. (USD)a | | | | | 25,871 | | | | 354,433 | | |
THAILAND | | 0.2% | | | | | |
REAL ESTATE—RETAIL | | | | | | | |
Central Pattana PCL | | | | | 124,200 | | | | 180,203 | | |
UNITED KINGDOM | | 5.8% | | | | | |
ELECTRIC—REGULATED ELECTRIC | | 0.2% | | | | | |
National Grid PLC | | | | | 20,020 | | | | 227,152 | | |
See accompanying notes to the consolidated financial statements.
16
COHEN & STEERS REAL ASSETS FUND, INC.
CONSOLIDATED SCHEDULE OF INVESTMENTS—(Continued)
June 30, 2013 (Unaudited)
| | | | | Number
of Shares | | Value | |
ENERGY | | 1.4% | | | | | |
INTEGRATED OIL & GAS | | 0.8% | | | | | |
New Britain Palm Oil Ltd. | | | | | 22,757 | | | $ | 171,331 | | |
Royal Dutch Shell PLC | | | | | 18,457 | | | | 610,850 | | |
| | | | | | | | 782,181 | | |
OIL & GAS EQUIPMENT & SERVICES | | 0.6% | | | | | |
Ensco PLC, Class A (USD) | | | | | 9,400 | | | | 546,328 | | |
TOTAL ENERGY | | | | | | | 1,328,509 | | |
MATERIALS—METALS & MINING | | 2.2% | | | | | |
BHP Billiton PLC | | | | | 68,129 | | | | 1,742,902 | | |
London Mining PLCa | | | | | 92,971 | | | | 131,152 | | |
Vedanta Resources PLC | | | | | 6,866 | | | | 106,517 | | |
| | | | | | | | 1,980,571 | | |
REAL ESTATE | | 2.0% | | | | | |
DIVERSIFIED | | 1.1% | | | | | |
Hammerson PLC | | | | | 47,946 | | | | 355,356 | | |
Land Securities Group PLC | | | | | 36,786 | | | | 494,595 | | |
Londonmetric Property PLC | | | | | 100,015 | | | | 157,746 | | |
| | | | | | | | 1,007,697 | | |
INDUSTRIALS | | 0.2% | | | | | |
Segro PLC | | | | | 54,249 | | | | 230,368 | | |
OFFICE | | 0.5% | | | | | |
Derwent London PLC | | | | | 12,520 | | | | 437,973 | | |
SELF STORAGE | | 0.2% | | | | | |
Big Yellow Group PLC | | | | | 25,352 | | | | 148,298 | | |
TOTAL REAL ESTATE | | | | | | | 1,824,336 | | |
TOTAL UNITED KINGDOM | | | | | | | 5,360,568 | | |
UNITED STATES | | 26.9% | | | | | |
COMMUNICATIONS—TOWERS | | 0.2% | | | | | |
American Tower Corp. | | | | | 3,040 | | | | 222,437 | | |
CONSUMER—NON-CYCLICAL—AGRICULTURE | | 0.3% | | | | | |
Bunge Ltd. | | | | | 4,320 | | | | 305,726 | | |
See accompanying notes to the consolidated financial statements.
17
COHEN & STEERS REAL ASSETS FUND, INC.
CONSOLIDATED SCHEDULE OF INVESTMENTS—(Continued)
June 30, 2013 (Unaudited)
| | | | | Number
of Shares | | Value | |
ENERGY | | 5.9% | | | | | |
OIL & GAS | | 4.5% | | | | | |
Anadarko Petroleum Corp. | | | | | 6,991 | | | $ | 600,737 | | |
Apache Corp. | | | | | 5,180 | | | | 434,239 | | |
Chevron Corp. | | | | | 6,053 | | | | 716,312 | | |
CONSOL Energy | | | | | 17,257 | | | | 467,665 | | |
Marathon Oil Corp. | | | | | 19,576 | | | | 676,938 | | |
Noble Energy | | | | | 8,568 | | | | 514,423 | | |
Occidental Petroleum Corp. | | | | | 4,602 | | | | 410,636 | | |
SM Energy Co. | | | | | 5,284 | | | | 316,934 | | |
| | | | | | | | 4,137,884 | | |
OIL & GAS SERVICES | | 1.4% | | | | | |
National Oilwell Varco | | | | | 8,430 | | | | 580,827 | | |
Schlumberger Ltd. | | | | | 4,401 | | | | 315,376 | | |
Valero Energy Corp. | | | | | 10,764 | | | | 374,264 | | |
| | | | | | | | 1,270,467 | | |
TOTAL ENERGY | | | | | | | 5,408,351 | | |
GAS DISTRIBUTION | | 0.4% | | | | | |
Sempra Energy | | | | | 4,140 | | | | 338,486 | | |
GOLD | | 2.6% | | | | | |
iShares Gold Trust ETFa | | | | | 200,000 | | | | 2,398,000 | | |
INDUSTRIALS—MACHINERY | | 0.9% | | | | | |
AGCO Corp. | | | | | 9,794 | | | | 491,561 | | |
Deere & Co. | | | | | 3,698 | | | | 300,462 | | |
| | | | | | | | 792,023 | | |
MATERIALS—CHEMICALS | | 0.9% | | | | | |
Monsanto Co. | | | | | 6,200 | | | | 612,560 | | |
Mosaic Co./The | | | | | 4,334 | | | | 233,213 | | |
| | | | | | | | 845,773 | | |
PIPELINES | | 0.6% | | | | | |
PIPELINES—C-CORP | | 0.3% | | | | | |
SemGroup Corp., Class A | | | | | 5,360 | | | | 288,690 | | |
PIPELINES—MLP | | 0.3% | | | | | |
EQT Midstream Partners LP | | | | | 5,620 | | | | 274,537 | | |
TOTAL PIPELINES | | | | | | | 563,227 | | |
See accompanying notes to the consolidated financial statements.
18
COHEN & STEERS REAL ASSETS FUND, INC.
CONSOLIDATED SCHEDULE OF INVESTMENTS—(Continued)
June 30, 2013 (Unaudited)
| | | | | Number
of Shares | | Value | |
REAL ESTATE | | 14.9% | | | | | |
DIVERSIFIED | | 2.0% | | | | | |
American Assets Trust | | | | | 5,690 | | | $ | 175,593 | | |
Blackstone Mortgage Trust, Class A | | | | | 3,572 | | | | 88,228 | | |
Colony Financial | | | | | 8,439 | | | | 167,852 | | |
Cousins Properties | | | | | 21,895 | | | | 221,140 | | |
Duke Realty Corp. | | | | | 15,585 | | | | 242,970 | | |
Vornado Realty Trust | | | | | 7,229 | | | | 598,923 | | |
WP Carey | | | | | 4,605 | | | | 304,713 | | |
| | | | | | | | 1,799,419 | | |
HEALTH CARE | | 1.6% | | | | | |
Emeritus Corp.a | | | | | 8,326 | | | | 192,997 | | |
Health Care REIT | | | | | 10,519 | | | | 705,088 | | |
Ventas | | | | | 8,532 | | | | 592,633 | | |
| | | | | | | | 1,490,718 | | |
HOTEL | | 1.4% | | | | | |
Hersha Hospitality Trust | | | | | 39,307 | | | | 221,691 | | |
Host Hotels & Resorts | | | | | 17,459 | | | | 294,533 | | |
Pebblebrook Hotel Trust | | | | | 7,647 | | | | 197,675 | | |
RLJ Lodging Trust | | | | | 9,141 | | | | 205,581 | | |
Strategic Hotels & Resorts Worldwidea | | | | | 22,609 | | | | 200,316 | | |
Sunstone Hotel Investorsa | | | | | 10,074 | | | | 121,694 | | |
| | | | | | | | 1,241,490 | | |
INDUSTRIALS | | 0.9% | | | | | |
First Industrial Realty Trust | | | | | 7,545 | | | | 114,458 | | |
Prologis | | | | | 19,957 | | | | 752,778 | | |
| | | | | | | | 867,236 | | |
OFFICE | | 1.5% | | | | | |
Corporate Office Properties Trust | | | | | 7,013 | | | | 178,832 | | |
Douglas Emmett | | | | | 16,171 | | | | 403,466 | | |
Hudson Pacific Properties | | | | | 8,416 | | | | 179,093 | | |
Parkway Properties | | | | | 11,420 | | | | 191,399 | | |
SL Green Realty Corp. | | | | | 5,034 | | | | 443,948 | | |
| | | | | | | | 1,396,738 | | |
See accompanying notes to the consolidated financial statements.
19
COHEN & STEERS REAL ASSETS FUND, INC.
CONSOLIDATED SCHEDULE OF INVESTMENTS—(Continued)
June 30, 2013 (Unaudited)
| | | | | Number
of Shares | | Value | |
OFFICE/INDUSTRIAL | | 0.3% | | | | | |
PS Business Parks | | | | | 3,522 | | | $ | 254,183 | | |
RESIDENTIAL | | 2.5% | | | | | |
APARTMENT | | 2.0% | | | | | |
Colonial Properties Trust | | | | | 10,283 | | | | 248,026 | | |
Equity Residential | | | | | 13,842 | | | | 803,666 | | |
UDR | | | | | 30,832 | | | | 785,908 | | |
| | | | | | | | 1,837,600 | | |
MANUFACTURED HOME | | 0.5% | | | | | |
Sun Communities | | | | | 4,488 | | | | 223,323 | | |
TRI Pointe Homesa | | | | | 14,214 | | | | 235,668 | | |
| | | | | | | | 458,991 | | |
TOTAL RESIDENTIAL | | | | | | | 2,296,591 | | |
SELF STORAGE | | 1.2% | | | | | |
CubeSmart | | | | | 21,817 | | | | 348,636 | | |
Extra Space Storage | | | | | 6,026 | | | | 252,670 | | |
Public Storage | | | | | 1,364 | | | | 209,142 | | |
Sovran Self Storage | | | | | 5,045 | | | | 326,865 | | |
| | | | | | | | 1,137,313 | | |
SHOPPING CENTERS | | 3.5% | | | | | |
COMMUNITY CENTER | | 1.5% | | | | | |
Kimco Realty Corp. | | | | | 20,597 | | | | 441,394 | | |
Ramco-Gershenson Properties Trust | | | | | 11,856 | | | | 184,124 | | |
Regency Centers Corp. | | | | | 8,910 | | | | 452,717 | | |
Weingarten Realty Investors | | | | | 9,215 | | | | 283,545 | | |
| | | | | | | | 1,361,780 | | |
FREE STANDING | | 0.3% | | | | | |
National Retail Properties | | | | | 7,573 | | | | 260,511 | | |
REGIONAL MALL | | 1.7% | | | | | |
General Growth Properties | | | | | 5,985 | | | | 118,922 | | |
Glimcher Realty Trust | | | | | 20,975 | | | | 229,047 | | |
Simon Property Group | | | | | 7,606 | | | | 1,201,140 | | |
| | | | | | | | 1,549,109 | | |
TOTAL SHOPPING CENTERS | | | | | | | 3,171,400 | | |
TOTAL REAL ESTATE | | | | | | | 13,655,088 | | |
See accompanying notes to the consolidated financial statements.
20
COHEN & STEERS REAL ASSETS FUND, INC.
CONSOLIDATED SCHEDULE OF INVESTMENTS—(Continued)
June 30, 2013 (Unaudited)
| | | | | Number
of Shares | | Value | |
WATER | | 0.2% | | | | | |
American Water Works Co. | | | | | 4,160 | | | $ | 171,517 | | |
TOTAL UNITED STATES | | | | | | | 24,700,628 | | |
TOTAL COMMON STOCK
(Identified cost—$59,141,063) | �� | | | | | | 55,405,835 | | |
PREFERRED SECURITIES—$25 PAR VALUE | | 3.8% | | | | | |
NETHERLANDS | | 0.5% | | | | | |
INSURANCE—LIFE/HEALTH INSURANCE—FOREIGN | | | | | | | |
Aegon NV, 7.25% (USD) | | | | | 17,000 | | | | 426,870 | | |
UNITED STATES | | 3.3% | | | | | |
BANKS | | 1.4% | | | | | |
Countrywide Capital V, 7.00%, due 11/1/36 | | | | | 22,000 | | | | 553,520 | | |
HSBC USA, 3.50%, Series F (FRN) | | | | | 10,000 | | | | 225,000 | | |
US Bancorp, 3.50%,
Series A, ($1,000 Par Value)(FRN) | | | | | 600 | | | | 520,569 | | |
| | | | | | | | 1,299,089 | | |
ELECTRIC—INTEGRATED | | 1.2% | | | | | |
Entergy Texas, 7.875%, due 6/1/39 | | | | | 10,000 | | | | 262,100 | | |
NextEra Energy Capital Holdings, 8.75%,
due 3/1/69, Series F | | | | | 8,000 | | | | 210,160 | | |
Southern California Edison Co., 4.63%,
Series D ($100 Par Value)(FRN) | | | | | 6,431 | | | | 653,752 | | |
| | | | | | | | 1,126,012 | | |
INSURANCE | | 0.4% | | | | | |
MetLife, 4.00%, Series A (FRN) | | | | | 15,000 | | | | 364,800 | | |
UTILITIES | | 0.3% | | | | | |
Dominion Resources, 8.375%, due 6/15/64,
Series A | | | | | 10,000 | | | | 262,900 | | |
TOTAL UNITED STATES | | | | | | | 3,052,801 | | |
TOTAL PREFERRED SECURITIES—$25 PAR VALUE
(Identified cost—$3,537,893) | | | | | | | 3,479,671 | | |
See accompanying notes to the consolidated financial statements.
21
COHEN & STEERS REAL ASSETS FUND, INC.
CONSOLIDATED SCHEDULE OF INVESTMENTS—(Continued)
June 30, 2013 (Unaudited)
| | | | | Number
of Shares | | Value | |
PREFERRED SECURITIES—CAPITAL SECURITIES | | 1.2% | | | | | |
UNITED STATES | | | | | | | |
BANKS | | | | | | | |
Mellon Capital IV, 4.00%, Series 1 (FRN) | | | | | 515,000 | | | $ | 475,087 | | |
Wachovia Capital Trust III, 5.57%, (FRN) | | | | | 650,000 | | | | 638,625 | | |
TOTAL PREFERRED SECURITIES—CAPITAL SECURITIES
(Identified cost—$1,130,263) | | | | | | | 1,113,712 | | |
| | | | | Principal
Amount | | | |
CORPORATE BONDS—CANADA | | 1.0% | |
BANKS | | 0.3% | |
Toronto-Dominion Bank, 2.948%, due 8/2/16,
Series DPNT | | | | CAD | 250,000 | | | | 243,698 | | |
INTEGRATED TELECOMMUNICATIONS SERVICES | | 0.4% | | | | | |
Bell Canada, 4.85%, due 6/30/14 | | | | CAD | 400,000 | | | | 391,557 | | |
PIPELINES | | 0.3% | | | | | |
TransCanada PipeLines Ltd., 5.05%, due 8/20/13 | | | | CAD | 250,000 | | | | 238,856 | | |
TOTAL CORPORATE BONDS
(Identified cost—$919,949) | | | | | | | 874,111 | | |
GOVERNMENT ISSUES—AUSTRALIA | | 0.9% | | | | | |
Australia Government Bond, 4.50%, due 10/21/14,
Series 131 | | | | AUD | 900,000 | | | | 844,487 | | |
TOTAL GOVERNMENT ISSUES
(Identified cost—$932,107) | | | | | | | 844,487 | | |
| | | | | Number
of Shares | | | |
SHORT-TERM INVESTMENTS | | 35.1% | | | | | |
MONEY MARKET FUNDS | | 5.9% | | | | | |
State Street Institutional Treasury Money
Market Fund, 0.09%c | | | | | 5,387,252 | | | | 5,387,252 | | |
See accompanying notes to the consolidated financial statements.
22
COHEN & STEERS REAL ASSETS FUND, INC.
CONSOLIDATED SCHEDULE OF INVESTMENTS—(Continued)
June 30, 2013 (Unaudited)
| | | | | Principal
Amount | | Value | |
U.S. TREASURY BILLS | | | 29.2% | | | | | | |
U.S. Treasury Bills, 0.00%, due 7/25/13 | | | | $ | 8,109,000 | | | $ | 8,108,615 | | |
U.S. Treasury Bills, 0.00%, due 9/19/13 | | | | | 9,009,000 | | | | 9,008,397 | | |
U.S. Treasury Bills, 0.00%, due 11/14/13d | | | | | 9,691,000 | | | | 9,688,761 | | |
| | | | | | | | 26,805,773 | | |
TOTAL SHORT-TERM INVESTMENTS
(Identified cost—$32,192,517) | | | | | | | 32,193,025 | | |
TOTAL INVESTMENTS (Identified cost—$97,853,792) | | | 102.3 | % | | | | | | | 93,910,841 | | |
LIABILITIES IN EXCESS OF OTHER ASSETSe | | | (2.3 | )% | | | | | | | (2,068,542 | ) | |
NET ASSETS | | | 100.0 | % | | | | | | $ | 91,842,299 | | |
Glossary of Portfolio Abbreviations
ADR American Depositary Receipt
AUD Australian Dollar
CAD Canadian Dollar
ETF Exchange-Traded Fund
FRN Floating Rate Note
GBP Great British Pound
GDR Global Depositary Receipt
HKD Hong Kong Dollar
REIT Real Estate Investment Trust
USD United States Dollar
Note: Percentages indicated are based on the net assets of the Fund.
a Non-income producing security.
b Illiquid security. Aggregate holdings equal 0.1% of the net assets of the Fund.
c Rate quoted represents the seven-day yield of the Fund.
d All or a portion of this security has been segregated and/or pledged as collateral for futures contracts. $3,857,105 in aggregate has been pledged as collateral to Morgan Stanley & Co. LLC.
e Liabilities in excess of other assets include unrealized appreciation/depreciation on open futures contracts at June 30, 2013.
See accompanying notes to the consolidated financial statements.
23
COHEN & STEERS REAL ASSETS FUND, INC.
CONSOLIDATED SCHEDULE OF INVESTMENTS—(Continued)
June 30, 2013 (Unaudited)
Futures contracts outstanding at June 30, 2013 were as follows:
Number of
Contractsa | | Description | | Notional
Value | | Expiration
Date | | Unrealized
Appreciation
(Depreciation) | |
| | | | | LONG FUTURES OUTSTANDING | | | | | | | |
| | 39 | | | Aluminum HG LME | | $ | 1,725,018 | | | September 18, 2013 | | $ | (123,712 | ) | |
| | 39 | | | Aluminum HG LME | | | 1,693,819 | | | July 17, 2013 | | | (147,588 | ) | |
| | 3 | | | Brent Crude Oilb | | | 301,380 | | | November 14, 2013 | | | (3,008 | ) | |
| | 21 | | | Brent Crude Oilb | | | 2,117,850 | | | October 16, 2013 | | | (38,274 | ) | |
| | 21 | | | Brent Crude Oilb | | | 2,136,120 | | | August 15, 2013 | | | (501 | ) | |
| | 24 | | | Cattle Feeder | | | 1,793,400 | | | August 29, 2013 | | | 62,328 | | |
| | 18 | | | Coffee C | | | 812,700 | | | September 18, 2013 | | | (34,774 | ) | |
| | 23 | | | Copper LME | | | 1,758,063 | | | September 26, 2013 | | | (128,624 | ) | |
| | 14 | | | Corn | | | 357,700 | | | December 13, 2013 | | | (19,501 | ) | |
| | 102 | | | Corn | | | 2,790,975 | | | September 13, 2013 | | | (189,129 | ) | |
| | 3 | | | Gold | | | 367,110 | | | August 28, 2013 | | | (56,560 | ) | |
| | 6 | | | Lead LME | | | 307,538 | | | September 18, 2013 | | | (315 | ) | |
| | 19 | | | Lean Hogsb | | | 628,140 | | | December 13, 2013 | | | 15,191 | | |
| | 3 | | | Light Sweet Crude Oil | | | 264,660 | | | November 20, 2014 | | | (1,810 | ) | |
| | 21 | | | Light Sweet Crude Oil | | | 1,895,460 | | | June 20, 2014 | | | 352 | | |
| | 6 | | | Live Cattle | | | 301,620 | | | October 31, 2013 | | | 6,561 | | |
| | 21 | | | Natural Gas | | | 841,050 | | | October 29, 2014 | | | (31,048 | ) | |
| | 88 | | | Natural Gas | | | 3,131,920 | | | August 28, 2013 | | | (293,609 | ) | |
| | 12 | | | Nickel LME | | | 986,652 | | | September 18, 2013 | | | (43,642 | ) | |
| | 9 | | | Nickel LME | | | 737,397 | | | July 17, 2013 | | | (60,067 | ) | |
| | 27 | | | Palladium | | | 1,783,890 | | | September 26, 2013 | | | (186,308 | ) | |
| | 20 | | | Platinum | | | 1,339,900 | | | October 29, 2013 | | | (177,564 | ) | |
| | 12 | | | Silver | | | 1,168,200 | | | September 26, 2013 | | | (178,089 | ) | |
| | 24 | | | Soybean | | | 1,502,400 | | | November 14, 2013 | | | (85,871 | ) | |
| | 6 | | | Soybean | | | 390,975 | | | September 13, 2013 | | | (9,446 | ) | |
| | 25 | | | Soybean Meal | | | 935,000 | | | December 13, 2013 | | | (19,444 | ) | |
| | 37 | | | Soybean Oil | | | 1,001,664 | | | December 13, 2013 | | | (52,734 | ) | |
| | 96 | | | Sugar 11 | | | 1,819,238 | | | September 30, 2013 | | | 758 | | |
| | 24 | | | Wheat | | | 828,600 | | | September 13, 2013 | | | (78,422 | ) | |
| | 60 | | | Zinc LME | | | 2,781,000 | | | September 18, 2013 | | | (31,391 | ) | |
| | 61 | | | Zinc LME | | | 2,787,700 | | | July 17, 2013 | | | (142,427 | ) | |
| | | | | SHORT FUTURES OUTSTANDING | | | | | | | |
| | 39 | | | Aluminum HG LME | | | (1,693,819 | ) | | July 17, 2013 | | | 124,876 | | |
| | 3 | | | Brent Crude Oil | | | (288,840 | ) | | November 13, 2014 | | | 3,322 | | |
| | 12 | | | Cattle Feeder | | | (918,900 | ) | | October 31, 2013 | | | (31,056 | ) | |
See accompanying notes to the consolidated financial statements.
24
COHEN & STEERS REAL ASSETS FUND, INC.
CONSOLIDATED SCHEDULE OF INVESTMENTS—(Continued)
June 30, 2013 (Unaudited)
Number of
Contractsa | | Description | | Notional
Value | | Expiration
Date | | Unrealized
Appreciation
(Depreciation) | |
| | 3 | | | Copper LME | | $ | (231,413 | ) | | March 27, 2014 | | $ | 28 | | |
| | 15 | | | Copper LME | | | (1,151,625 | ) | | December 27, 2013 | | | 103,002 | | |
| | 21 | | | Cotton No. 2 | | | (882,105 | ) | | December 6, 2013 | | | 19,381 | | |
| | 28 | | | Lean Hogs | | | (1,091,440 | ) | | August 14, 2013 | | | (8,948 | ) | |
| | 3 | | | Light Sweet Crude Oil | | | (283,140 | ) | | November 20, 2013 | | | (100 | ) | |
| | 3 | | | Light Sweet Crude Oil | | | (289,320 | ) | | August 20, 2013 | | | 5,885 | | |
| | 21 | | | Natural Gas | | | (765,660 | ) | | October 29, 2013 | | | 61,732 | | |
| | 9 | | | Nickel LME | | | (737,397 | ) | | July 17, 2013 | | | 40,729 | | |
| | 36 | | | Sugar 11 | | | (720,115 | ) | | September 30, 2014 | | | 10,098 | | |
| | 8 | | | Wheat | | | (268,600 | ) | | December 13, 2013 | | | 21,771 | | |
| | 11 | | | Wheat | | | (361,763 | ) | | September 13, 2013 | | | 28,216 | | |
| | 24 | | | Zinc LME | | | (1,125,300 | ) | | December 18, 2013 | | | 68,789 | | |
| | 61 | | | Zinc LME | | | (2,787,700 | ) | | July 17, 2013 | | | 36,444 | | |
| | | $ | (1,564,499 | ) | |
a Represents positions held in the subsidiary.
b Futures contracts are cash settled based upon the price of the underlying commodity.
Glossary of Portfolio Abbreviations
LME London Metal Exchange
See accompanying notes to the consolidated financial statements.
25
COHEN & STEERS REAL ASSETS FUND, INC.
CONSOLIDATED STATEMENT OF ASSETS AND LIABILITIES
June 30, 2013 (Unaudited)
ASSETS: | |
Investments in securities, at value (Identified cost—$97,853,792) | | $ | 93,910,841 | | |
Foreign currency, at value (Identified cost—$65,008) | | | 64,284 | | |
Deposits at broker for futures contracts | | | 1,283,346 | | |
Receivable for: | |
Investment securities sold | | | 2,844,638 | | |
Fund shares sold | | | 264,753 | | |
Dividends and interest | | | 178,078 | | |
Due from advisor | | | 20,815 | | |
Other assets | | | 9,626 | | |
Total Assets | | | 98,576,381 | | |
LIABILITIES: | |
Payable for: | |
Investment securities purchased | | | 2,840,398 | | |
Variation margin on futures contracts | | | 1,737,560 | | |
Fund shares redeemed | | | 1,597,396 | | |
Dividends declared | | | 376,760 | | |
Foreign capital gains tax | | | 14,835 | | |
Administration fees | | | 6,369 | | |
Directors' fees | | | 4,152 | | |
Interest expense | | | 2,901 | | |
Shareholder servicing fees | | | 2,411 | | |
Due to custodian | | | 2,202 | | |
Distribution fees | | | 825 | | |
Other liabilities | | | 148,273 | | |
Total Liabilities | | | 6,734,082 | | |
NET ASSETS | | $ | 91,842,299 | | |
NET ASSETS consist of: | |
Paid-in capital | | $ | 100,270,929 | | |
Dividends in excess of net investment income | | | (505,272 | ) | |
Accumulated net realized loss | | | (2,392,909 | ) | |
Net unrealized depreciation | | | (5,530,449 | ) | |
| | | $ | 91,842,299 | | |
See accompanying notes to the consolidated financial statements.
26
COHEN & STEERS REAL ASSETS FUND, INC.
CONSOLIDATED STATEMENT OF ASSETS AND LIABILITIES—(Continued)
June 30, 2013 (Unaudited)
CLASS A SHARES: | |
NET ASSETS | | $ | 16,107,048 | | |
Shares issued and outstanding ($0.001 par value common stock outstanding) | | | 1,760,725 | | |
Net asset value and redemption price per share | | $ | 9.15 | | |
Maximum offering price per share ($9.15 ÷ 0.955)a | | $ | 9.58 | | |
CLASS C SHARES: | |
NET ASSETS | | $ | 4,700,569 | | |
Shares issued and outstanding ($0.001 par value common stock outstanding) | | | 515,136 | | |
Net asset value and offering price per shareb | | $ | 9.12 | | |
CLASS I SHARES: | |
NET ASSETS | | $ | 64,282,464 | | |
Shares issued and outstanding ($0.001 par value common stock outstanding) | | | 7,017,433 | | |
Net asset value, offering and redemption price per share | | $ | 9.16 | | |
CLASS R SHARES: | |
NET ASSETS | | $ | 964 | | |
Shares issued and outstanding ($0.001 par value common stock outstanding) | | | 105 | | |
Net asset value, offering and redemption price per share | | $ | 9.18 | | |
CLASS Z SHARES: | |
NET ASSETS | | $ | 6,751,254 | | |
Shares issued and outstanding ($0.001 par value common stock outstanding) | | | 737,974 | | |
Net asset value, offering and redemption price per share | | $ | 9.15 | | |
a On investments of $100,000 or more, the offering price is reduced.
b Redemption price per share is equal to the net asset value per share less any applicable contingent deferred sales charge of 1% on shares held for less than one year.
See accompanying notes to the consolidated financial statements.
27
COHEN & STEERS REAL ASSETS FUND, INC.
CONSOLIDATED STATEMENT OF OPERATIONS
For the Six Months Ended June 30, 2013 (Unaudited)
Investment Income: | |
Dividend income (net of $54,696 of foreign withholding tax) | | $ | 824,894 | | |
Interest income | | | 67,410 | | |
Total Investment Income | | | 892,304 | | |
Expenses: | |
Investment advisory fees | | | 398,370 | | |
Professional fees | | | 101,467 | | |
Administration fees | | | 91,420 | | |
Custodian fees and expenses | | | 86,663 | | |
Registration and filing fees | | | 37,410 | | |
Distribution fees—Class A | | | 14,126 | | |
Distribution fees—Class C | | | 16,953 | | |
Distribution fees—Class R | | | 3 | | |
Shareholder reporting expenses | | | 22,006 | | |
Transfer agent fees and expenses | | | 21,788 | | |
Shareholder servicing fees—Class A | | | 5,650 | | |
Shareholder servicing fees—Class C | | | 5,651 | | |
Shareholder servicing fess—Class I | | | 1,505 | | |
Shareholder servicing fees—Class Z | | | 2,194 | | |
Directors' fees and expenses | | | 10,364 | | |
Interest expense | | | 2,552 | | |
Line of credit fees | | | 642 | | |
Miscellaneous | | | 8,372 | | |
Total Expenses | | | 827,136 | | |
Reduction of Expenses (See Note 2) | | | (339,924 | ) | |
Net Expenses | | | 487,212 | | |
Net Investment Income | | | 405,092 | | |
Net Realized and Unrealized Gain (Loss): | |
Net realized gain (loss) on: | |
Investments | | | (49,057 | ) | |
Futures contracts | | | (908,991 | ) | |
Commodity swap transactions | | | (897,965 | ) | |
Foreign currency transactions | | | (12,748 | ) | |
Net realized loss | | | (1,868,761 | ) | |
Net change in unrealized appreciation (depreciation) on: | | | | | |
Investments (net of $2,306 of foreign capital gains tax) | | | (5,756,129 | ) | |
Futures contracts | | | (1,473,443 | ) | |
Commodity swap transactions | | | 64,387 | | |
Foreign currency translations | | | (7,872 | ) | |
Net change in unrealized appreciation (depreciation) | | | (7,173,057 | ) | |
Net realized and unrealized loss | | | (9,041,818 | ) | |
Net Decrease in Net Assets Resulting from Operations | | $ | (8,636,726 | ) | |
See accompanying notes to the consolidated financial statements.
28
COHEN & STEERS REAL ASSETS FUND, INC.
CONSOLIDATED STATEMENT OF CHANGES IN NET ASSETS (Unaudited)
| | | For the
Six Months Ended
June 30, 2013 | | For the Period
January 31, 2012a
through
December 31, 2012 | |
Change in Net Assets: | |
From Operations: | |
Net investment income | | $ | 405,092 | | | $ | 461,155 | | |
Net realized loss | | | (1,868,761 | ) | | | (739,088 | ) | |
Net change in unrealized appreciation
(depreciation) | | | (7,173,057 | ) | | | 1,642,608 | | |
Net increase (decrease) in net assets resulting
from operations | | | (8,636,726 | ) | | | 1,364,675 | | |
Dividends to Shareholders from: | |
Net investment income: | |
Class A | | | (78,837 | ) | | | (51,410 | ) | |
Class C | | | (6,178 | ) | | | (31,728 | ) | |
Class I | | | (391,948 | ) | | | (891,182 | ) | |
Class R | | | (3 | ) | | | (16 | ) | |
Class Z | | | (38,725 | ) | | | (13,751 | ) | |
Total dividends to shareholders | | | (515,691 | ) | | | (988,087 | ) | |
Capital Stock Transactions: | |
Increase in net assets from Fund share
transactions | | | 27,387,638 | | | | 73,130,490 | | |
Total increase in net assets | | | 18,235,221 | | | | 73,507,078 | | |
Net Assets: | |
Beginning of period | | | 73,607,078 | | | | 100,000 | | |
End of periodb | | $ | 91,842,299 | | | $ | 73,607,078 | | |
a Commencement of operations.
b Includes dividends in excess of net investment income of $505,272 and $394,673, respectively.
See accompanying notes to the consolidated financial statements.
29
COHEN & STEERS REAL ASSETS FUND, INC.
CONSOLIDATED FINANCIAL HIGHLIGHTS (Unaudited)
The following table includes selected data for a share outstanding throughout each period and other performance information derived from the consolidated financial statements. It should be read in conjunction with the consolidated financial statements and notes thereto.
| | | Class A | |
Per Share Operating Performance: | | For the Six
Months Ended
June 30, 2013 | | For the Period
January 31, 2012a
through
December 31, 2012 | |
Net asset value, beginning of period | | $ | 10.03 | | | $ | 10.00 | | |
Income (loss) from investment operations: | |
Net investment incomeb | | | 0.04 | | | | 0.06 | | |
Net realized and unrealized gain (loss) | | | (0.87 | ) | | | 0.10 | | |
Total income (loss) from investment operations | | | (0.83 | ) | | | 0.16 | | |
Less dividends to shareholders from: | |
Net investment income | | | (0.05 | ) | | | (0.13 | ) | |
Total dividends to shareholders | | | (0.05 | ) | | | (0.13 | ) | |
Net increase (decrease) in net asset value | | | (0.88 | ) | | | 0.03 | | |
Net asset value, end of period | | $ | 9.15 | | | $ | 10.03 | | |
Total investment returnc,d,e | | | –8.33 | % | | | 1.66 | % | |
Ratios/Supplemental Data: | |
Net assets, end of period (in millions) | | $ | 16.1 | | | $ | 4.6 | | |
Ratio of expenses to average daily net assets (before expense reduction)f | | | 2.14 | % | | | 2.40 | % | |
Ratio of expenses to average daily net assets (net of expense reduction)f | | | 1.35 | % | | | 1.35 | % | |
Ratio of net investment income (loss) to average daily assets (before
expense reduction)f | | | 0.07 | % | | | (0.43 | )% | |
Ratio of net investment income to average daily net assets (net of expense
reduction)f | | | 0.87 | % | | | 0.62 | % | |
Portfolio turnover ratee | | | 59 | % | | | 128 | % | |
a Commencement of operations.
b Calculation based on average shares outstanding.
c Return assumes the reinvestment of all dividends and distributions at NAV.
d Does not reflect sales charges, which would reduce return.
e Not annualized.
f Annualized.
See accompanying notes to the consolidated financial statements.
30
COHEN & STEERS REAL ASSETS FUND, INC.
CONSOLIDATED FINANCIAL HIGHLIGHTS (Unaudited)—(Continued)
| | | Class C | |
Per Share Operating Performance: | | For the Six
Months Ended
June 30, 2013 | | For the Period
January 31, 2012a
through
December 31, 2012 | |
Net asset value, beginning of period | | $ | 10.00 | | | $ | 10.00 | | |
Income (loss) from investment operations: | |
Net investment incomeb | | | 0.00 | | | | 0.00 | c | |
Net realized and unrealized gain (loss) | | | (0.87 | ) | | | 0.09 | | |
Total income (loss) from investment operations | | | (0.87 | ) | | | 0.09 | | |
Less dividends to shareholders from: | |
Net investment income | | | (0.01 | ) | | | (0.09 | ) | |
Total dividends to shareholders | | | (0.01 | ) | | | (0.09 | ) | |
Net increase (decrease) in net asset value | | | (0.88 | ) | | | 0.00 | | |
Net asset value, end of period | | $ | 9.12 | | | $ | 10.00 | | |
Total investment returnd,e,f | | | –8.68 | % | | | 0.97 | % | |
Ratios/Supplemental Data: | |
Net assets, end of period (in millions) | | $ | 4.7 | | | $ | 3.8 | | |
Ratio of expenses to average daily net assets (before expense reduction)g | | | 2.77 | % | | | 3.06 | % | |
Ratio of expenses to average daily net assets (net of expense reduction)g | | | 2.00 | % | | | 2.00 | % | |
Ratio of net investment loss to average daily assets (before expense
reduction)g | | | (0.76 | )% | | | (1.11 | )% | |
Ratio of net investment income (loss) to average daily net assets (net of
expense reduction)g | | | 0.01 | % | | | (0.05 | )% | |
Portfolio turnover ratef | | | 59 | % | | | 128 | % | |
a Commencement of operations.
b Calculation based on average shares outstanding.
c Amount is less than $0.005.
d Return assumes the reinvestment of all dividends and distributions at NAV.
e Does not reflect sales charges, which would reduce return.
f Not annualized.
g Annualized.
See accompanying notes to the consolidated financial statements.
31
COHEN & STEERS REAL ASSETS FUND, INC.
CONSOLIDATED FINANCIAL HIGHLIGHTS (Unaudited)—(Continued)
| | | Class I | |
Per Share Operating Performance: | | For the Six
Months Ended
June 30, 2013 | | For the Period
January 31, 2012a
through
December 31, 2012 | |
Net asset value, beginning of period | | $ | 10.04 | | | $ | 10.00 | | |
Income (loss) from investment operations: | |
Net investment incomeb | | | 0.05 | | | | 0.09 | | |
Net realized and unrealized gain (loss) | | | (0.87 | ) | | | 0.11 | | |
Total income (loss) from investment operations | | | (0.82 | ) | | | 0.20 | | |
Less dividends to shareholders from: | |
Net investment income | | | (0.06 | ) | | | (0.16 | ) | |
Total dividends to shareholders | | | (0.06 | ) | | | (0.16 | ) | |
Net increase (decrease) in net asset value | | | (0.88 | ) | | | 0.04 | | |
Net asset value, end of period | | $ | 9.16 | | | $ | 10.04 | | |
Total investment returnc,d | | | –8.21 | % | | | 2.00 | % | |
Ratios/Supplemental Data: | |
Net assets, end of period (in millions) | | $ | 64.3 | | | $ | 63.7 | | |
Ratio of expenses to average daily net assets (before expense reduction)e | | | 1.76 | % | | | 2.12 | % | |
Ratio of expenses to average daily net assets (net of expense reduction)e | | | 1.00 | % | | | 1.00 | % | |
Ratio of net investment income (loss) to average daily assets (before
expense reduction)e | | | 0.21 | % | | | (0.17 | )% | |
Ratio of net investment income to average daily net assets (net of expense
reduction)e | | | 0.97 | % | | | 0.95 | % | |
Portfolio turnover rated | | | 59 | % | | | 128 | % | |
a Commencement of operations.
b Calculation based on average shares outstanding.
c Return assumes the reinvestment of all dividends and distributions at NAV.
d Not annualized.
e Annualized.
See accompanying notes to the consolidated financial statements.
32
COHEN & STEERS REAL ASSETS FUND, INC.
CONSOLIDATED FINANCIAL HIGHLIGHTS (Unaudited)—(Continued)
| | | Class R | |
Per Share Operating Performance: | | For the Six
Months Ended
June 30, 2013 | | For the Period
January 31, 2012a
through
December 31, 2012 | |
Net asset value, beginning of period | | $ | 10.06 | | | $ | 10.00 | | |
Income (loss) from investment operations: | |
Net investment incomeb | | | 0.02 | | | | 0.04 | | |
Net realized and unrealized gain (loss) | | | (0.87 | ) | | | 0.11 | | |
Total income (loss) from investment operations | | | (0.85 | ) | | | 0.15 | | |
Less dividends to shareholders from: | |
Net investment income | | | (0.03 | ) | | | (0.09 | ) | |
Total dividends to shareholders | | | (0.03 | ) | | | (0.09 | ) | |
Net increase (decrease) in net asset value | | | (0.88 | ) | | | 0.06 | | |
Net asset value, end of period | | $ | 9.18 | | | $ | 10.06 | | |
Total investment returnc,d | | | –8.49 | % | | | 1.54 | % | |
Ratios/Supplemental Data: | |
Net assets, end of period (in 000s) | | $ | 1.0 | | | $ | 1.0 | | |
| Ratio of expenses to average daily net assets (before expense reduction)e | | | 1.93 | %f | | | 2.55 | % | |
Ratio of expenses to average daily net assets (net of expense reduction)e | | | 1.50 | % | | | 1.50 | % | |
Ratio of net investment income (loss) to average daily assets (before
expense reduction)e | | | (0.09 | )%f | | | (0.55 | )% | |
Ratio of net investment income to average daily net assets (net of expense
reduction)e | | | 0.34 | % | | | 0.46 | % | |
Portfolio turnover rated | | | 59 | % | | | 128 | % | |
a Commencement of operations.
b Calculation based on average shares outstanding.
c Return assumes the reinvestment of all dividends and distributions at NAV.
d Not annualized.
e Annualized.
f Due to the size of net assets and fixed expenses, ratios may appear disproportionate.
See accompanying notes to the consolidated financial statements.
33
COHEN & STEERS REAL ASSETS FUND, INC.
CONSOLIDATED FINANCIAL HIGHLIGHTS (Unaudited)—(Continued)
| | | Class Z | |
Per Share Operating Performance: | | For the Six
Months Ended
June 30, 2013 | | For the Period
January 31, 2012a
through
December 31, 2012 | |
Net asset value, beginning of period | | $ | 10.03 | | | $ | 10.00 | | |
Income (loss) from investment operations: | |
Net investment incomeb | | | 0.05 | | | | 0.06 | | |
Net realized and unrealized gain (loss) | | | (0.88 | ) | | | 0.11 | | |
Total income (loss) from investment operations | | | (0.83 | ) | | | 0.17 | | |
Less dividends to shareholders from: | |
Net investment income | | | (0.05 | ) | | | (0.14 | ) | |
Total dividends to shareholders | | | (0.05 | ) | | | (0.14 | ) | |
Net increase (decrease) in net asset value | | | (0.88 | ) | | | 0.03 | | |
Net asset value, end of period | | $ | 9.15 | | | $ | 10.03 | | |
Total investment returnc,d | | | –8.25 | % | | | 1.73 | % | |
Ratios/Supplemental Data: | |
Net assets, end of period (in millions) | | $ | 6.8 | | | $ | 1.5 | | |
Ratio of expenses to average daily net assets (before expense reduction)e | | | 2.02 | % | | | 2.12 | % | |
Ratio of expenses to average daily net assets (net of expense reduction)e | | | 1.15 | % | | | 1.15 | % | |
Ratio of net investment income (loss) to average daily net assets (before
expense reduction)e | | | 0.25 | % | | | (0.31 | )% | |
Ratio of net investment income to average daily net assets (net of expense
reduction)e | | | 1.12 | % | | | 0.68 | % | |
Portfolio turnover rated | | | 59 | % | | | 128 | % | |
a Commencement of operations.
b Calculation based on average shares outstanding.
c Return assumes the reinvestment of all dividends and distributions at NAV.
d Not annualized.
e Annualized.
See accompanying notes to the consolidated financial statements.
34
COHEN & STEERS REAL ASSETS FUND, INC.
NOTES TO CONSOLIDATED FINANCIAL STATEMENTS (Unaudited)
Note 1. Significant Accounting Policies
Cohen & Steers Real Assets Fund, Inc. (the Fund) was incorporated under the laws of the State of Maryland on October 25, 2011 and is registered under the Investment Company Act of 1940, as amended (the 1940 Act), as a non-diversified, open-end management investment company. The Fund's investment objective is to achieve attractive total returns over the long term and to maximize real returns during inflationary environments. The Fund had no operations until January 17, 2012 when it sold 100 shares each of Class A, C, R and Z and 9,600 shares of Class I for $100,000 to Cohen & Steers Capital Management, Inc. (the advisor). Investment operations commenced on January 31, 2012. The authorized shares of the Fund are divided into five classes designated Class A, C, I, R and Z shares. Each of the Fund's shares has equal dividend, liquidation and voting rights (except for matters relating to distributions and shareholder servicing of such shares.)
Cohen & Steers Real Assets Fund Ltd. (the Subsidiary), a wholly-owned subsidiary of the Fund organized under the laws of the Cayman Islands, was incorporated on November 22, 2011 and commenced operations on January 31, 2012. The Subsidiary acts as an investment vehicle for the Fund in order to effect certain investments on behalf of the Fund, consistent with the Fund's investment objectives and policies as described in the Fund's prospectus. The Fund expects that it will achieve a significant portion of its exposure to commodities and commodities-related investments through investment in the Subsidiary. Unlike the Fund, the Subsidiary may invest without limitation in commodities. As of June 30, 2013, the Fund held $18,019,255 in the Subsidiary, representing 19.6% of the Fund's net assets. The Consolidated Schedule of Investments includes positions of the Fund and the Subsidiary. The financial statements have been consolidated and include the accounts of the Fund and the Subsidiary. All significant inter-company balances and transactions have been eliminated in consolidation.
The following is a summary of significant accounting policies consistently followed by the Fund in the preparation of its consolidated financial statements. The policies are in conformity with accounting principles generally accepted in the United States of America (GAAP). The preparation of the consolidated financial statements in accordance with GAAP requires management to make estimates and assumptions that affect the reported amounts of assets and liabilities at the date of the consolidated financial statements and the reported amounts of income and expenses during the reporting period. Actual results could differ from those estimates.
Portfolio Valuation: Investments in securities that are listed on the New York Stock Exchange (NYSE) are valued, except as indicated below, at the last sale price reflected at the close of the NYSE on the business day as of which such value is being determined. If there has been no sale on such day, the securities are valued at the mean of the closing bid and ask prices on such day or, if no ask price is available, at the bid price. Futures contracts traded on a commodities exchange or board of trade are valued at their settlement price at the close of trading on such exchange or board of trade. Commodity swaps are valued based on the values of underlying futures contracts, using the settlement price from the principal exchange on which the contract is traded.
Securities not listed on the NYSE but listed on other domestic or foreign securities exchanges are valued in a similar manner. Securities traded on more than one securities exchange are valued at the
35
COHEN & STEERS REAL ASSETS FUND, INC.
NOTES TO CONSOLIDATED FINANCIAL STATEMENTS (Unaudited)—(Continued)
last sale price reflected at the close of the exchange representing the principal market for such securities on the business day as of which such value is being determined. If after the close of a foreign market, but prior to the close of business on the day the securities are being valued, market conditions change significantly, certain foreign securities may be fair valued pursuant to procedures established by the Board of Directors.
Readily marketable securities traded in the over-the-counter market, including listed securities whose primary market is believed by advisor to be over-the-counter, are valued at the last sale price on the valuation date as reported by sources deemed appropriate by the Board of Directors to reflect their fair market value. If there has been no sale on such day, the securities are valued at the mean of the closing bid and ask prices on such day or, if no ask price is available, at the bid price. However, certain fixed-income securities may be valued on the basis of prices provided by a pricing service when such prices are believed by the advisor, pursuant to delegation by the Board of Directors, to reflect the fair market value of such securities.
Short-term debt securities with a maturity date of 60 days or less are valued at amortized cost, which approximates value. Investments in open-end mutual funds are valued at their closing net asset value.
The policies and procedures approved by the Fund's Board of Directors delegate authority to make fair value determinations to the advisor, subject to the oversight of the Board of Directors. The advisor has established a valuation committee (Valuation Committee) to administer, implement and oversee the fair valuation process according to the policies and procedures approved annually by the Board of Directors. Among other things, these procedures allow the Fund to utilize independent pricing services, quotations from securities and financial instrument dealers and other market sources to determine fair value.
Securities for which market prices are unavailable, or securities for which the advisor determines that the bid and/or ask price or a counterparty valuation does not reflect market value, will be valued at fair value, as determined in good faith by the Valuation Committee, pursuant to procedures approved by the Fund's Board of Directors. Circumstances in which market prices may be unavailable include, but are not limited to, when trading in a security is suspended, the exchange on which the security is traded is subject to an unscheduled close or disruption or material events occur after the close of the exchange on which the security is principally traded. In these circumstances, the Fund determines fair value in a manner that fairly reflects the market value of the security on the valuation date based on consideration of any information or factors it deems appropriate. These may include, but are not limited to, recent transactions in comparable securities, information relating to the specific security and developments in the markets.
Foreign equity fair value pricing procedures utilized by the Fund may cause certain foreign securities to be fair valued on the basis of fair value factors provided by a pricing service to reflect any significant market movements between the time the Fund values such securities and the earlier closing of foreign markets.
36
COHEN & STEERS REAL ASSETS FUND, INC.
NOTES TO CONSOLIDATED FINANCIAL STATEMENTS (Unaudited)—(Continued)
The Fund's use of fair value pricing may cause the net asset value of Fund shares to differ from the net asset value that would be calculated using market quotations. Fair value pricing involves subjective judgments and it is possible that the fair value determined for a security may be materially different than the value that could be realized upon the sale of that security.
Fair value is defined as the price that the Fund would expect to receive upon the sale of an investment or expect to pay to transfer a liability in an orderly transaction with an independent buyer in the principal market or, in the absence of a principal market, the most advantageous market for the investment or liability. The hierarchy of inputs that are used in determining the fair value of the Fund's investments is summarized below.
• Level 1—quoted prices in active markets for identical investments
• Level 2—other significant observable inputs (including quoted prices for similar investments, interest rates, credit risk, etc.)
• Level 3—significant unobservable inputs (including the Fund's own assumptions in determining the fair value of investments)
The inputs or methodology used for valuing securities are not necessarily an indication of the risk associated with investing in those securities.
For movements between the levels within the fair value hierarchy, the Fund has adopted a policy of recognizing the transfer at the end of the period in which the underlying event causing the movement occurred. Changes in valuation techniques may result in transfers into or out of an assigned level within the disclosure hierarchy. As of June 30, 2013, there were $15,626,526 of securities transferred between Level 1 and Level 2, which resulted from not utilizing foreign equity fair value pricing procedures by the Fund as of June 30, 2013.
The following is a summary of the inputs used as of June 30, 2013 in valuing the Fund's investments carried at value:
| | | Total | | Quoted Prices
In Active
Markets for
Identical
Investments
(Level 1) | | Other
Significant
Observable
Inputs
(Level 2) | | Significant
Unobservable
Inputs
(Level 3) | |
Common Stock | | $ | 55,405,835 | | | $ | 55,405,835 | | | $ | — | | | $ | — | | |
Preferred Securities—$25 Par
Value—Netherlands | | | 426,870 | | | | 426,870 | | | | — | | | | — | | |
Preferred Securities—$25 Par
Value—United States | | | 3,052,801 | | | | 2,399,049 | | | | 653,752 | | | | — | | |
Preferred Securities—
Capital Securities | | | 1,113,712 | | | | — | | | | 1,113,712 | | | | — | | |
Corporate Bonds | | | 874,111 | | | | — | | | | 874,111 | | | | — | | |
37
COHEN & STEERS REAL ASSETS FUND, INC.
NOTES TO CONSOLIDATED FINANCIAL STATEMENTS (Unaudited)—(Continued)
| | | Total | | Quoted Prices
In Active
Markets for
Identical
Investments
(Level 1) | | Other
Significant
Observable
Inputs
(Level 2) | | Significant
Unobservable
Inputs
(Level 3) | |
Government Issues | | $ | 844,487 | | | $ | — | | | $ | 844,487 | | | $ | — | | |
Short-Term Instruments | | | 32,193,025 | | | | — | | | | 32,193,025 | | | | — | | |
Total Investmentsa | | $ | 93,910,841 | | | $ | 58,231,754 | | | $ | 35,679,087 | | | $ | — | | |
Futures Contracts | | $ | 609,463 | | | $ | 609,463 | | | $ | — | | | $ | — | | |
Total Appreciation in Other
Financial Instrumentsa | | $ | 609,463 | | | $ | 609,463 | | | $ | — | | | $ | — | | |
Futures Contracts | | $ | (2,173,962 | ) | | $ | (2,173,962 | ) | | $ | — | | | $ | — | | |
Total Depreciation in Other
Financial Instrumentsa | | $ | (2,173,962 | ) | | $ | (2,173,962 | ) | | $ | — | | | $ | — | | |
a Portfolio holdings are disclosed individually on the Consolidated Schedule of Investments.
Security Transactions, Investment Income and Expense Allocations: Security transactions are recorded on trade date. Realized gains and losses on investments sold are recorded on the basis of identified cost. Interest income is recorded on the accrual basis. Discounts are accreted and premiums are amortized over the life of the respective securities. Dividend income is recorded on the ex-dividend date, except for certain dividends on foreign securities, which are recorded as soon as the Fund is informed after the ex-dividend date. Distributions from Real Estate Investment Trusts (REITs) are recorded as ordinary income, net realized capital gain or return of capital based on information reported by the REITs and management's estimates of such amounts based on historical information. These estimates are adjusted when the actual source of distributions is disclosed by the REITs and actual amounts may differ from the estimated amounts. Income, expenses (other than expenses attributable to a specific class), and realized and unrealized gains or losses on investments are allocated to each class of shares based on its relative net assets.
Foreign Currency Translation: The books and records of the Fund are maintained in U.S. dollars. Investment securities and other assets and liabilities denominated in foreign currencies are translated into U.S. dollars based upon prevailing exchange rates on the date of valuation. Purchases and sales of investment securities and income and expense items denominated in foreign currencies are translated into U.S. dollars based upon prevailing exchange rates on the respective dates of such transactions. The Fund does not isolate that portion of the results of operations resulting from fluctuations in foreign exchange rates on investments from the fluctuations arising from changes in market prices of securities held. Such fluctuations are included with the net realized and unrealized gain or loss on investments.
38
COHEN & STEERS REAL ASSETS FUND, INC.
NOTES TO CONSOLIDATED FINANCIAL STATEMENTS (Unaudited)—(Continued)
Net realized foreign exchange gains or losses arise from sales of foreign currencies, currency gains or losses realized between the trade and settlement dates on securities transactions, and the difference between the amounts of dividends, interest, and foreign withholding taxes recorded on the Fund's books and the U.S. dollar equivalent of the amounts actually received or paid. Net unrealized foreign exchange gains and losses arise from changes in the values of assets and liabilities, other than investments in securities, on the date of valuation, resulting from changes in exchange rates. Pursuant to U.S. federal income tax regulations, certain foreign currency gains/losses included in realized and unrealized gains/losses are included in or are a reduction of ordinary income for federal income tax purposes.
Foreign Securities: The Fund may directly purchase securities of foreign issuers. Investing in securities of foreign issuers involves special risks not typically associated with investing in securities of U.S. issuers. The risks include possible revaluation of currencies, the ability to repatriate funds, less complete financial information about companies and possible future adverse political and economic developments. Moreover, securities of many foreign issuers and their markets may be less liquid and their prices more volatile than those of securities of comparable U.S. issuers.
Futures Contracts: The Fund uses futures contracts in order to gain exposure to the underlying commodities markets. Futures contracts provide for the delayed delivery of the underlying instrument at a fixed price or for a cash amount based on the change in the value of the underlying instrument at a specific date in the future. Upon entering into a futures contract, the Fund is required to deposit with the broker, cash or securities in an amount equal to a certain percentage of the contract amount, which is referred to as the initial margin deposit. Subsequent payments, referred to as variation margin, are made or received by the Fund periodically and are based on changes in the market value of open futures contracts. Changes in the market value of open futures contracts are recorded as change in unrealized appreciation or depreciation on futures in the Consolidated Statement of Operations. Realized gain or loss, representing the difference between the value of the contract at the time it was opened and the value at the time it was closed, is reported in the Consolidated Statement of Operations at the closing or expiration of the futures contract. Securities deposited as initial margin are designated as such on the Consolidated Schedule of Investments and cash deposited is recorded on the Consolidated Statement of Assets and Liabilities. A receivable from and/or a payable to brokers for the daily variation margin is also recorded on the Consolidated Statement of Assets and Liabilities.
The Fund may be subject to the risk that the change in the value of the futures contract may not correlate perfectly with the underlying instrument. Use of long futures contracts subjects the Fund to risk of loss, up to the notional value of the futures contracts. Use of short futures contracts subjects the Fund to unlimited risk of loss. With exchange traded futures contracts, the exchange or board of trade acts as the counterparty to futures transactions; therefore, the Fund's credit risk is limited to failure of the exchange or board of trade. Under some circumstances, futures exchanges may establish daily limits on the amount that the price of a futures contract can vary from the previous day's settlement price, which could effectively prevent liquidation of certain positions. In certain circumstances, the futures commissions merchant (FCM) can require additional margin on the futures contracts which would subject the Fund to counterparty credit risk with the FCM.
39
COHEN & STEERS REAL ASSETS FUND, INC.
NOTES TO CONSOLIDATED FINANCIAL STATEMENTS (Unaudited)—(Continued)
On April 22, 2013, the Fund's Board of Directors approved Morgan Stanley & Co. LLC to serve as the Fund's FCM for the purpose of trading in commodities and commodity futures contracts, options therein, and interests therein (including, without limitation, exchange for physical transactions, exchange for swap transactions, block trades and other cleared derivative transactions).
Commodity Swaps: The Fund uses swaps on commodity futures in order to gain exposure to the underlying commodities markets. Swap values are based on the values of underlying futures contracts, using the settlement price from the principal exchange on which the contract is traded. Changes in swap values are recorded as change in net unrealized appreciation or depreciation on commodity swaps in the Consolidated Statement of Operations. Realized gain or loss, based on the difference between the contract price and market price of the underlying instrument, is recorded upon termination date.
Upon entering into a swap, the Fund is required to post an initial margin (referred to as "Independent Amount", as defined in the swap agreement). Independent amounts are posted to a segregated account at the Fund's custodian. The Fund is required to post additional collateral to the segregated account, for the benefit of the counterparty, as applicable, for mark-to-market losses on swaps.
The Fund pays a monthly financing charge to the counterparty, which is calculated based on the daily balance of the segregated account for the benefit of the counterparty and a LIBOR-based rate.
The Fund is entitled to receive cash from the counterparty as collateral for mark-to-market gains on swap contracts. When the Fund receives such cash collateral, a corresponding liability is recorded, and included in due to broker for swap contracts on the Consolidated Statement of Assets and Liabilities. At June 30, 2013, the Fund did not hold any cash collateral from the counterparty.
Daily movement of collateral is subject to minimum threshold amounts.
The Fund may be subject to various risks from the use of swaps including: (i) the risk that changes in the value of the swap may not correlate perfectly with the underlying instrument; (ii) counterparty credit risk related to the failure, by the counterparty to an over-the-counter derivative, to perform under the terms of the contract; (iii) liquidity risk related to the lack of a liquid market for these contracts to allow the Fund to close out its position(s); and, (iv) documentation risk relating to disagreement over contract terms.
At June 30, 2013, the Fund did not have any open commodity swaps.
Dividends and Distributions to Shareholders: Dividends from net investment income and capital gain distributions are determined in accordance with U.S. federal income tax regulations, which may differ from GAAP. Dividends from net investment income, if any, are declared and paid semi-annually. Net realized capital gains, unless offset by any available capital loss carryforward, are typically distributed to shareholders at least annually. Dividends and distributions to shareholders are recorded on the ex-dividend date and are automatically reinvested in full and fractional shares of the Fund based on the net asset value per share at the close of business on the payable date, unless the shareholder has elected to have them paid in cash. Distributions paid by the Fund are subject to recharacterization for tax purposes.
40
COHEN & STEERS REAL ASSETS FUND, INC.
NOTES TO CONSOLIDATED FINANCIAL STATEMENTS (Unaudited)—(Continued)
Income Taxes: It is the policy of the Fund to continue to qualify as a regulated investment company, if such qualification is in the best interest of the shareholders, by complying with the requirements of Subchapter M of the Internal Revenue Code applicable to regulated investment companies, and by distributing substantially all of its taxable earnings to its shareholders. Accordingly, no provision for federal income or excise tax is necessary. Dividend and interest income from holdings in non-U.S. securities is recorded net of non-U.S. taxes paid. Realized gains on security and foreign currency transactions and any gains realized by the Fund on the sale of securities in certain non-U.S. markets are subject to non-U.S. taxes. The Fund records a liability based on any unrealized gains on securities held in these markets in order to estimate the potential non-U.S. taxes due upon the sale of these securities. Management has analyzed the Fund's federal tax positions as well as its tax positions in non-U.S. jurisdictions where it trades has concluded that as of June 30, 2013, no additional provisions for income tax are required in the Fund's financial statements.
The Subsidiary is classified as a controlled foreign corporation under the Internal Revenue Code. The Subsidiary's taxable income, including net gains, is included, as ordinary income, in the calculation of the Fund's taxable income. Net losses of the Subsidiary are not deductible by the Fund either in the current period or carried forward to future periods.
Note 2. Investment Advisory and Administration Fees and Other Transactions with Affiliates
Investment Advisory Fees: The advisor serves as the Fund's and Subsidiary's investment advisor pursuant to an investment advisory agreement (the investment advisory agreement). Under the terms of the investment advisory agreement, the advisor provides the Fund with day-to-day investment decisions and generally manages the Fund's investments in accordance with the stated policies of the Fund, subject to the supervision of the Board of Directors.
For the services provided to the Fund, the advisor receives a fee, accrued daily and paid monthly, at the annual rate of 0.90% of the average daily net assets of the Fund.
For the six months ended June 30, 2013, and through June 30, 2015, the advisor has contractually agreed to waive its fee and/or reimburse the Fund for expenses incurred (excluding distribution and shareholder servicing fees applicable to Class A, Class C, Class R and Class Z shares, acquired fund fees and expenses and extraordinary expenses) to the extent necessary to maintain the Fund's total annual operating expenses, which include the expenses of the Subsidiary, as a percentage of average net assets at 1.35% for Class A shares, 2.00% for Class C shares, 1.00% for Class I shares, 1.50% for Class R shares and 1.15% for Class Z shares. This contractual agreement can be amended at any time by agreement of the Fund and the advisor. For the six months ended June 30, 2013, fees waived and/or expenses reimbursed totaled $339,924.
Under subadvisory agreements between the advisor and each of Cohen & Steers Asia Limited and Cohen & Steers UK Limited (each an affiliate of the advisor), Gresham Investment Management LLC (until May 31, 2013) and Investec Asset Management US Ltd. (collectively the subadvisors), the subadvisors are responsible for the managing a portion of the Fund's assets. For their services provided under the respective subadvisory agreement, the advisor (not the Fund) pays each subadvisor a fee based on a
41
COHEN & STEERS REAL ASSETS FUND, INC.
NOTES TO CONSOLIDATED FINANCIAL STATEMENTS (Unaudited)—(Continued)
percentage of the Fund's average net assets managed by each subadvisor. Effective May 31, 2013, the Board of Directors approved the termination of the sub-advisory agreement with Gresham Investment Management LLC.
Administration Fees: The Fund has entered into an administration agreement with the advisor under which the advisor performs certain administrative functions for the Fund and receives a fee, accrued daily and paid monthly, at the annual rate of 0.08% of the average daily net assets of the Fund. For the six months ended June 30, 2013, the Fund incurred $35,411 in fees under this administration agreement. Additionally, the Fund pays State Street Bank and Trust Company as co-administrator under a fund accounting and administration agreement.
Distribution Fees: Shares of the Fund are distributed by Cohen & Steers Securities, LLC (the distributor), an affiliated entity of the advisor. The Fund has adopted a distribution plan (the plan) pursuant to Rule 12b-1 under the 1940 Act. The plan provides that the Fund will pay the distributor a fee, accrued daily and paid monthly, at an annual rate of up to 0.25% of the average daily net assets attributable to Class A shares, up to 0.75% of the average daily net assets attributable to Class C shares and up to 0.50% of the average daily net assets attributable to Class R shares.
There is a maximum initial sales charge of 4.50% for Class A shares. There is a contingent deferred sales charge (CDSC) of 1.00% on Class C shares, which applies if redemption occurs within one year from purchase. For the six months ended June 30, 2013, the Fund has been advised that the distributor received $1,075 in sales commissions from the sale of Class A shares and $396 of CDSC relating to redemptions of Class C shares. The distributor has advised the Fund that proceeds from the CDSC on this class are used by the distributor to defray its expenses related to providing distribution-related services to the Fund in connection with the sale of this class, including payments to dealers and other financial intermediaries for selling this class.
Shareholder Servicing Fees: For shareholder services, the Fund pays the distributor a fee, accrued daily and paid monthly, at an annual rate of up to 0.10% of the average daily net assets of the Fund's Class A shares, up to 0.25% of the average daily net assets of the Fund's Class C shares, up to 0.10% of the average daily net assets of the Fund's Class I shares and up to 0.15% of the average daily net assets of the Fund's Class Z shares. The distributor is responsible for paying qualified financial institutions for shareholder services.
Directors' and Officers' Fees: Certain directors and officers of the Fund are also directors, officers and/or employees of the advisor. The Fund does not pay compensation to directors and officers affiliated with the advisor except for the Chief Compliance Officer, who received compensation from the advisor, which was reimbursed by the Fund, in the amount of $574 for the six months ended June 30, 2013.
Other: At June 30, 2013, the advisor and affiliated persons of the advisor owned 51% of the Fund's outstanding shares. Investment activities of these shareholders could have a significant impact on the Fund. In addition, a person who beneficially owns, either directly or indirectly, more than 25% of the voting securities of the Fund may be presumed to control the Fund. A control person could potentially control the outcome of any proposal submitted to the shareholders for approval, including changes to the Fund's fundamental policies or terms of the investment advisory agreement with the advisor.
42
COHEN & STEERS REAL ASSETS FUND, INC.
NOTES TO CONSOLIDATED FINANCIAL STATEMENTS (Unaudited)—(Continued)
Note 3. Purchases and Sales of Securities
Purchases and sales of securities, excluding short-term investments, for the six months ended June 30, 2013, totaled $52,909,976 and $35,503,929, respectively.
Note 4. Derivative Investments
The following tables present the value of derivatives held at June 30, 2013 and the effect of derivatives held during the six months ended June 30, 2013, along with the respective location in the consolidated financial statements.
Consolidated Statement of Assets and Liabilities | |
| | | Assets | | Liabilities | |
Derivatives | | Location | | Fair Value | | Location | | Fair Value | |
Commodity Contracts: | |
Futures Contracts
| | | —
| | | $ | —
| | | Payable for variation
margin on futures contracts | | $ | 1,564,499 | a | |
a Includes cumulative appreciation (depreciation) on futures contracts as reported on the Consolidated Schedule of Investments. The Consolidated Statement of Assets and Liabilities only reflects the current day variation margin payable to broker.
Consolidated Statement of Operations | |
Derivatives | | Location | | Realized
Loss | | Change in
Unrealized
Appreciation
(Depreciation) | |
Commodity Contracts: | |
Futures Contracts | | Net Realized and Unrealized Gain (Loss) | | $ | (908,991 | ) | | $ | (1,473,443 | ) | |
Commodity Swaps | | Net Realized and Unrealized Gain (Loss) | | | (897,965 | ) | | | 64,387 | | |
The following summarizes the volume of the Fund's futures contracts and commodity swaps activity during the six months ended June 30, 2013:
| | | Futures
Contracts | | Commodity
Swaps | |
Average Notional Balance—Long | | $ | 27,854,440 | | | $ | 5,179,202 | | |
Average Notional Balance—Short | | | (4,878,531 | ) | | | (1,979,759 | ) | |
Ending Notional Balance—Long | | | 41,287,139 | | | | — | | |
Ending Notional Balance—Short | | | (13,597,136 | ) | | | — | | |
43
COHEN & STEERS REAL ASSETS FUND, INC.
NOTES TO CONSOLIDATED FINANCIAL STATEMENTS (Unaudited)—(Continued)
The following table presents the Fund's derivative assets by counterparty net of amounts available for offset under a master netting agreement and net of the related collateral received by the Fund, if any, as of June 30, 2013:
| Counterparty | | Gross Amounts
of Assets
Presented in the
Consolidated
Statement of
Assets and
Liabilities | | Financial
Instruments
and
Derivatives
Available for
Offset | | Collateral
Received | | Net Amount
of Derivative
Assetsb | |
Exchanged Traded
Futures Contractsa | | $ | 609,463 | | | $ | — | | | $ | — | | | $ | 609,463 | | |
The following table presents the Fund's derivative liabilities by counterparty net of amounts available for offset under a master netting agreement and net of the related collateral pledged by the Fund, if any, as of June 30, 2013:
| Counterparty | | Gross Amounts
of Liabilities
Presented in the
Consolidated
Statement of
Assets and
Liabilities | | Financial
Instruments
and
Derivatives
Available for
Offset | | Collateral
Pledgedc | | Net Amount
of Derivative
Liabilitiesd | |
Exchanged Traded
Futures Contractsa | | $ | 2,173,962 | | | $ | — | | | $ | (2,173,962 | ) | | $ | — | | |
a Amounts represent the cumulative appreciation (depreciation) on futures contracts as reported on the Consolidated Schedule of Investments. The Consolidated Statement of Assets and Liabilities only reflects the current day variation margin receivable/payable to brokers.
b Net amount represents the net receivable due from counterparty in the event of default.
c In some instances, the actual collateral pledged may be more than amount shown.
d Net amount represents the net payable due to counterparty in the event of default.
Note 5. Income Tax Information
As of June 30, 2013, the federal tax cost and unrealized appreciation and depreciation in value of securities held were as follows:
Cost for federal income tax purposes | | $ | 97,853,792 | | |
Gross unrealized appreciation | | $ | 2,572,294 | | |
Gross unrealized depreciation | | | (6,515,245 | ) | |
Net unrealized depreciation | | $ | (3,942,951 | ) | |
44
COHEN & STEERS REAL ASSETS FUND, INC.
NOTES TO CONSOLIDATED FINANCIAL STATEMENTS (Unaudited)—(Continued)
As of December 31, 2012, the Fund had a net capital loss carryforward of $225,198, which may be used to offset future capital gains. These losses are comprised of a short-term capital loss carryover of $225,198 recognized during the year ended December 31, 2012, which, under federal income tax rules, may offset capital gains recognized in any future period.
Note 6. Capital Stock
The Fund is authorized to issue 1 billion shares of capital stock, at a par value of $0.001 per share. The Board of Directors of the Fund may increase or decrease the aggregate number of shares of common stock that the Fund has authority to issue. Transactions in Fund shares were as follows:
| | | For the
Six Months Ended
June 30, 2013 | | For the Period
January 31, 2012a
through
December 31, 2012 | |
| | | Shares | | Amount | | Shares | | Amount | |
Class A: | |
Sold | | | 1,463,750 | | | $ | 14,735,329 | | | | 515,342 | | | $ | 5,137,340 | | |
Issued as reinvestment
of dividends | | | 8,140 | | | | 74,478 | | | | 3,593 | | | | 35,322 | | |
Redeemed | | | (172,443 | ) | | | (1,685,792 | ) | | | (57,657 | ) | | | (564,140 | ) | |
Net increase | | | 1,299,447 | | | $ | 13,124,015 | | | | 461,278 | | | $ | 4,608,522 | | |
Class C: | |
Sold | | | 168,349 | | | $ | 1,679,588 | | | | 386,814 | | | $ | 3,811,165 | | |
Issued as reinvestment
of dividends | | | 342 | | | | 3,117 | | | | 1,415 | | | | 13,857 | | |
Redeemed | | | (37,120 | ) | | | (366,478 | ) | | | (4,664 | ) | | | (44,372 | ) | |
Net increase | | | 131,571 | | | $ | 1,316,227 | | | | 383,565 | | | $ | 3,780,650 | | |
Class I: | |
Sold | | | 1,375,293 | | | $ | 13,816,758 | | | | 6,654,556 | | | $ | 66,324,151 | | |
Issued as reinvestment
of dividends | | | 3,752 | | | | 34,368 | | | | 8,748 | | | | 86,051 | | |
Redeemed | | | (705,157 | ) | | | (6,747,858 | ) | | | (319,759 | ) | | | (3,176,433 | ) | |
Net increase | | | 673,888 | | | $ | 7,103,268 | | | | 6,343,545 | | | $ | 63,233,769 | | |
Class R: | |
Sold | | | 2 | | | $ | 18 | | | | 269 | | | $ | 1,674 | | |
Issued as reinvestment
of dividends | | | — | | | | — | | | | 1 | | | | 7 | | |
Redeemed | | | (15 | ) | | | (150 | ) | | | (152 | ) | | | (1,519 | ) | |
Net increase (decrease) | | | (13 | ) | | $ | (132 | ) | | | 118 | | | $ | 162 | | |
45
COHEN & STEERS REAL ASSETS FUND, INC.
NOTES TO CONSOLIDATED FINANCIAL STATEMENTS (Unaudited)—(Continued)
| | | For the
Six Months Ended
June 30, 2013 | | For the Period
January 31, 2012a
through
December 31, 2012 | |
| | | Shares | | Amount | | Shares | | Amount | |
Class Z: | |
Sold | | | 628,686 | | | $ | 6,215,568 | | | | 489,674 | | | $ | 4,888,019 | | |
Issued as reinvestment
of dividends | | | 2,947 | | | | 26,968 | | | | 1,395 | | | | 13,737 | | |
Redeemed | | | (41,139 | ) | | | (398,276 | ) | | | (343,589 | ) | | | (3,394,369 | ) | |
Net increase | | | 590,494 | | | $ | 5,844,260 | | | | 147,480 | | | $ | 1,507,387 | | |
a Commencement of operations.
Note 7. Borrowings
The Fund, in conjunction with other Cohen & Steers open-end funds, is a party to a $200,000,000 syndicated credit agreement (the credit agreement) with State Street Bank and Trust Company, as administrative agent and operations agent, and the lenders identified in the credit agreement, which expires January 24, 2014. The Fund pays a commitment fee of 0.10% per annum on its proportionate share of the unused portion of the credit agreement.
During the six months ended June 30, 2013, the Fund did not borrow under the credit agreement.
Note 8. Other
In the normal course of business, the Fund enters into contracts that provide general indemnifications. The Fund's maximum exposure under these arrangements is dependent on claims that may be made against the Fund in the future and, therefore, cannot be estimated; however, based on experience, the risk of material loss from such claims is considered remote.
The Fund and its Subsidiary are commodity pools under the Commodity Exchange Act (CEA). As a result of the Commodity Futures Trading Commission (CFTC) rule amendments, the advisor has recently registered with the CFTC as a commodity pool operator with respect to the Fund and the Subsidiary. The CFTC's rule amendments mandate disclosure, reporting and recordkeeping obligations that will apply with respect to the Fund once the CFTC proposal that seeks to "harmonize" these obligations with overlapping SEC regulations is finalized. Until the CFTC's and SEC's overlapping regulations are harmonized, the nature and extent of the impact of the new CFTC requirements on the Fund is uncertain. Compliance with the CFTC's new regulatory requirements could increase Fund expenses. The CFTC rule amendments also may affect the ability of the Fund to use commodity interests (including futures, options on futures, commodities, and swaps.)
46
COHEN & STEERS REAL ASSETS FUND, INC.
NOTES TO CONSOLIDATED FINANCIAL STATEMENTS (Unaudited)—(Continued)
Note 9. Subsequent Events
The Board of Directors of the Fund has approved the termination of the Fund's subadvisory agreement with Investec Asset Management US Ltd. effective at the close of business on July 29, 2013. The advisor will manage the Fund's allocation to natural resource companies beginning July 29, 2013.
On August 13, 2013, the CFTC issued the final harmonization rule release with respect to disclosure, reporting and recordkeeping requirements that will apply to the Fund and the Subsidiary. Compliance with the CFTC's new disclosure, reporting and recordkeeping requirements could increase Fund expenses. Please see note 8 for more information.
Management has evaluated events and transactions occurring after June 30, 2013 through the date that the financial statements were issued, and has determined that no additional disclosure in the financial statements is required.
47
COHEN & STEERS REAL ASSETS FUND, INC.
OTHER INFORMATION
A description of the policies and procedures that the Fund uses to determine how to vote proxies relating to portfolio securities is available (i) without charge, upon request, by calling 800-330-7348, (ii) on our website at cohenandsteers.com or (iii) on the Securities and Exchange Commission's (the SEC) website at http://www.sec.gov. In addition, the Fund's proxy voting record for the most recent 12-month period ended June 30 is available by August 31 of each year (i) without charge, upon request, by calling 800-330-7348 or (ii) on the SEC's website at http://www.sec.gov.
The Fund files its complete schedule of portfolio holdings with the SEC for the first and third quarters of each fiscal year on Form N-Q. The Fund's Forms N-Q are available (i) without charge, upon request, by calling 800-330-7348 or (ii) on the SEC's website at http://www.sec.gov. In addition, the Forms N-Q may be reviewed and copied at the SEC's Public Reference Room in Washington, DC. Information on the operation of the Public Reference Room may be obtained by calling 800-SEC-0330.
Please note that distributions paid by the Fund to shareholders are subject to recharacterization for tax purposes. The Fund may also pay distributions in excess of the Fund's net investment company taxable income and this excess could be a tax free return of capital distributed from the Fund's assets. The final tax treatment of all distributions is reported to shareholders on their 1099-DIV forms, which are mailed after the close of each calendar year.
APPROVAL OF INVESTMENT ADVISORY AND SUBADVISORY AGREEMENTS
The Board of Directors of the Fund, including a majority of the directors who are not parties to the Fund's investment advisory and subadvisory agreements (the Advisory Agreements), or interested persons of any such party (Independent Directors), has the responsibility under the 1940 Act to approve the Fund's Advisory Agreements for their initial two year term and their continuation annually thereafter at a meeting of the Board of Directors called for the purpose of voting on the approval or continuation. At a telephonic meeting of the Board of Directors held on June 12, 2013 and at a meeting held in person on June 18, 2013, the Advisory Agreements were discussed and, except as noted below, were unanimously continued for a term ending June 30, 2014 by the Fund's Board of Directors, including the Independent Directors. The Board of Directors did not consider the subadvisory agreements for Gresham Investment Management LLC or Investec Asset Management US ltd, two subadvisors that provided services to the Fund during the previous year, as the termination of these subadvisory agreements was previously approved by the Board of Directors. The Independent Directors were represented by independent counsel who assisted them in their deliberations during the meeting and executive session.
In considering whether to continue the Advisory Agreements, the Board of Directors reviewed materials provided by the Investment Advisor and Fund counsel which included, among other things, fee, expense and performance information compared to peer funds (Peer Funds) and performance comparisons to a larger category universe prepared by an independent data provider; summary information prepared by the Investment Advisor; and a memorandum outlining the legal duties of the Board of Directors. The Board of Directors also spoke directly with representatives of the independent data provider and met with investment advisory personnel. In addition, the Board of Directors considered information provided from time to time by the Investment Advisor throughout the year at meetings of the Board of Directors, including presentations by portfolio managers relating to the investment performance
48
COHEN & STEERS REAL ASSETS FUND, INC.
of the Fund and the investment strategies used in pursuing the Fund's objective. In particular, the Board of Directors considered the following:
(i) The nature, extent and quality of services to be provided by the Investment Advisor and the Subadvisors: The Board of Directors reviewed the services that the Investment Advisor and the sub-investment advisors affiliated with the Investment Advisor (the Subadvisors) provide to the Fund, including, but not limited to, making the day-to-day investment decisions for the Fund, and, for the Investment Advisor, generally managing the Fund's investments in accordance with the stated policies of the Fund. The Board of Directors also discussed with officers and portfolio managers of the Fund the types of transactions that were being done on behalf of the Fund. Additionally, the Board of Directors took into account the services provided by the Investment Advisor and the Subadvisors to other funds, including those that have investment objectives and strategies similar to the Fund. The Board of Directors next considered the education, background and experience of the Investment Advisor's and Subadvisor's personnel, noting particularly that the favorable history and reputation of the portfolio managers for the Fund has had, and would likely continue to have, a favorable impact on the Fund. The Board of Directors further noted the Investment Advisor's and Subadvisors's ability to attract qualified and experienced personnel noting the changes to the Fund's Portfolio Management team. The Board of Directors also considered the administrative services provided by the Investment Advisor, including compliance and accounting services. After consideration of the above factors, among others, the Board of Directors concluded that the nature, extent and quality of services provided by the Investment Advisor and the Subadvisors are adequate and appropriate.
(ii) Investment performance of the Fund and the Investment Advisor and Subadvisors: The Board of Directors noted that the Fund has been in existence for over one year and considered the investment performance of the Fund versus Peer Funds and compared to a relevant blended benchmark index. The Board of Directors noted that the Fund underperformed the Peer Funds' median and blended benchmark for the one-year period ended March 31, 2013, ranking the Fund in the fifth quintile. The Board of Directors engaged in discussions with the Investment Advisor regarding the contributors and detractors to the Fund's performance during the period. The Board of Directors also considered supplemental information provided by the Investment Advisor, including a narrative summary of various factors affecting performance, including the impact to performance of the Fund's investment sleeves managed during the period by subadvisors not affiliated with the Investment Advisor whose contracts were not being renewed. The Board of Directors further considered the recent changes to the Fund's portfolio management team. The Board of Directors further considered the Fund's performance versus a group of open-end funds compiled by the Investment Advisor, and noted that the Fund outperformed the median of the group for the one-year period ended March 31, 2013, ranking four out of eight. At the Investment Advisor's request, a supplemental peer group was compiled consisting of Class I share (or equivalent) real assets funds, as a result of a shift by distribution partners offering the lowest fee share classes to their clients. The Board of Directors then determined that Fund performance, in light of all considerations noted above, was satisfactory.
(iii) Cost of the services to be provided and profits to be realized by the Investment Advisor from the relationship with the Fund: Next, the Board of Directors considered the advisory fees and administrative fees payable by the Fund as well as total expense ratios. As part of its analysis, the Board of Directors gave consideration to the fee and expense analyses provided by the independent data provider. The Board of Directors noted that the Fund's actual management fee and net expense ratio were lower than the Peer Funds medians, ranking in the first and second quintiles, respectively. The Board of Directors
49
COHEN & STEERS REAL ASSETS FUND, INC.
also noted that the Fund's contractual management fee was higher than the Peer Funds median, ranking in the third quintile. The Board of Directors considered that the Investment Advisor is waiving its fees and/or reimbursing expenses to limit the overall operating expenses of the Fund. The Board of Directors further considered the Fund's expenses versus a group of open-end funds selected by the Investment Advisor. The Board of Directors then considered the administrative services provided by the Investment Advisor, including compliance and accounting services, and further noted that the Fund pays an administration fee to the Investment Advisor. The Board of Directors concluded that the Fund's expense structure was satisfactory.
The Board of Directors also reviewed information regarding the profitability to the Investment Advisor of its relationship with the Fund. The Board of Directors considered the level of the Investment Advisor's profits and whether the profits were reasonable for the Investment Advisors. Since the Subadvisors are paid by the Investment Advisor and not by the Fund, the Board of Directors considered the profitability of the Investment Advisor as a whole, and the Board of Directors did not consider the Subadvisors' separate profitability to be relevant to their considerations. The Board of Directors took into consideration other benefits to be derived by the Investment Advisor in connection with the Advisory Agreements, noting particularly the research and related services, within the meaning of Section 28(e) of the Securities Exchange Act of 1934, as amended, that the Investment Advisor receives by allocating the Fund's brokerage transactions. The Board of Directors also considered the fees received by the Investment Advisor under the Administration Agreement, and noted the significant services received, such as compliance, accounting and operational services and furnishing office space and facilities for the Fund, and providing persons satisfactory to the Board of Directors to serve as officers of the Fund, and that these services were beneficial to the Fund. The Board of Directors noted that because of the Fund's small size, the operating expenses continue to be subsidized, and the Fund is not yet profitable to the Investment Advisor.
(iv) The extent to which economies of scale would be realized as the Fund grows and whether fee levels would reflect such economies of scale: The Board of Directors considered the Fund's asset size and determined that there were not at this time significant economies of scale that were not being shared with shareholders.
(v) Comparison of services to be rendered and fees to be paid to those under other investment advisory contracts, such as contracts of the same and other investment advisors or other clients: As discussed above in (iii), the Board of Directors compared the fees paid under the Advisory Agreements to those under other investment advisory contracts of other investment advisors managing Peer Funds. The Board of Directors also considered the services rendered, fees paid and profitability under the Advisory Agreements to those under the Investment Advisor's other advisory agreements and advisory contracts with institutional and other clients with similar investment mandates. The Board of Directors also considered the entrepreneurial risk and financial exposure assumed by the Investment Advisor in developing and managing the Fund that the Investment Advisor does not have with institutional and other clients. The Board of Directors determined that on a comparative basis the fees under the Advisory Agreements were reasonable in relation to the services provided.
No single factor was cited as determinative to the decision of the Board of Directors. Rather, after weighing all of the considerations and conclusions discussed above, the Board of Directors, including the Independent Directors, unanimously approved the continuance of the Advisory Agreements.
50
COHEN & STEERS REAL ASSETS FUND, INC.
Cohen & Steers Privacy Policy
Facts | | What Does Cohen & Steers Do With Your Personal Information? | |
Why? | | Financial companies choose how they share your personal information. Federal law gives consumers the right to limit some but not all sharing. Federal law also requires us to tell you how we collect, share, and protect your personal information. Please read this notice carefully to understand what we do. | |
What? | | The types of personal information we collect and share depend on the product or service you have with us. This information can include:
• Social Security number and account balances
• Transaction history and account transactions
• Purchase history and wire transfer instructions | |
How? | | All financial companies need to share customers' personal information to run their everyday business. In the section below, we list the reasons financial companies can share their customers' personal information; the reasons Cohen & Steers chooses to share; and whether you can limit this sharing. | |
Reasons we can share your personal information | | Does Cohen & Steers
share? | | Can you limit this
sharing? | |
For our everyday business purposes—
such as to process your transactions, maintain your account(s), respond to court orders and legal investigations, or reports to credit bureaus | | Yes | | No | |
For our marketing purposes—
to offer our products and services to you | | Yes | | No | |
For joint marketing with other financial companies— | | No | | We don't share | |
For our affiliates' everyday business purposes—
information about your transactions and experiences | | No | | We don't share | |
For our affiliates' everyday business purposes—
information about your creditworthiness | | No | | We don't share | |
For our affiliates to market to you— | | No | | We don't share | |
For non-affiliates to market to you— | | No | | We don't share | |
Questions? Call 800.330.7348
51
COHEN & STEERS REAL ASSETS FUND, INC.
Cohen & Steers Privacy Policy—(Continued)
Who we are | | | |
Who is providing this notice? | | Cohen & Steers Capital Management, Inc., Cohen & Steers Asia Limited, Cohen & Steers UK Limited, Cohen & Steers Europe SPRL, Cohen & Steers Securities, LLC, Cohen & Steers Private Funds and Cohen & Steers Open and Closed-End Funds (collectively, Cohen & Steers). | |
What we do | | | |
How does Cohen & Steers protect my personal information? | | To protect your personal information from unauthorized access and use, we use security measures that comply with federal law. These measures include computer safeguards and secured files and buildings. We restrict access to your information to those employees who need it to perform their jobs, and also require companies that provide services on our behalf to protect your information. | |
How does Cohen & Steers collect my personal information? | | We collect your personal information, for example, when you:
• Open an account or buy securities from us
• Provide account information or give us your contact information
• Make deposits or withdrawals from your account
We also collect your personal information from other companies. | |
Why can't I limit all sharing? | | Federal law gives you the right to limit only:
• sharing for affiliates' everyday business purposes—information about your creditworthiness
• affiliates from using your information to market to you
• sharing for non-affiliates to market to you
State law and individual companies may give you additional rights to limit sharing. | |
Definitions | | | |
Affiliates | | Companies related by common ownership or control. They can be financial and nonfinancial companies.
• Cohen & Steers does not share with affiliates. | |
Non-affiliates | | Companies not related by common ownership or control. They can be financial and nonfinancial companies.
• Cohen & Steers does not share with non-affiliates. | |
Joint marketing | | A formal agreement between non-affiliated financial companies that together market financial products or services to you.
• Cohen & Steers does not jointly market. | |
52
COHEN & STEERS REAL ASSETS FUND, INC.
Cohen & Steers Investment Solutions
COHEN & STEERS GLOBAL REALTY SHARES
• Designed for investors seeking total return, investing primarily in global real estate equity securities
• Symbols: CSFAX, CSFBX*, CSFCX, CSSPX
COHEN & STEERS INSTITUTIONAL REALTY SHARES
• Designed for institutional investors seeking total return, investing primarily in REITs
• Symbol: CSRIX
COHEN & STEERS REALTY INCOME FUND
• Designed for investors seeking total return, investing primarily in real estate securities with an emphasis on both income and capital appreciation
• Symbols: CSEIX, CSBIX*, CSCIX, CSDIX
COHEN & STEERS INTERNATIONAL REALTY FUND
• Designed for investors seeking total return, investing primarily in international real estate securities
• Symbols: IRFAX, IRFCX, IRFIX
COHEN & STEERS
EMERGING MARKETS REAL ESTATE FUND
• Designed for investors seeking total return, investing primarily in emerging market real estate securities
• Symbols: APFAX, APFCX, APFIX
COHEN & STEERS REALTY SHARES
• Designed for investors seeking total return, investing primarily in REITs
• Symbol: CSRSX
COHEN & STEERS
INSTITUTIONAL GLOBAL REALTY SHARES
• Designed for institutional investors seeking total return, investing primarily in global real estate securities
• Symbol: GRSIX
COHEN & STEERS GLOBAL INFRASTRUCTURE FUND
• Designed for investors seeking total return, investing primarily in global infrastructure securities
• Symbols: CSUAX, CSUBX*, CSUCX, CSUIX
COHEN & STEERS DIVIDEND VALUE FUND
• Designed for investors seeking long-term growth of income and capital appreciation, investing primarily in dividend paying common stocks and preferred stocks
• Symbols: DVFAX, DVFCX, DVFIX
COHEN & STEERS
PREFERRED SECURITIES AND INCOME FUND
• Designed for investors seeking total return (high current income and capital appreciation), investing primarily in preferred and debt securities
• Symbols: CPXAX, CPXCX, CPXIX
COHEN & STEERS REAL ASSETS FUND
• Designed for investors seeking total return and the maximization of real returns during inflationary environments by investing primarily in real assets
• Symbols: RAPAX, RAPCX, RAPIX, RAPRX, RAPZX
Distributed by Cohen & Steers Securities, LLC.
COHEN & STEERS GLOBAL REALTY MAJORS ETF
• Designed for investors who seek a relatively low-cost "passive" approach for investing in a portfolio of real estate equity securities of companies in a specified index
• Symbol: GRI
Distributed by ALPS Distributors, Inc.
ISHARES COHEN & STEERS
REALTY MAJORS INDEX FUND
• Designed for investors who seek a relatively low-cost "passive" approach for investing in a portfolio of real estate equity securities of companies in a specified index
• Symbol: ICF
Distributed by SEI Investments Distribution Co.
* Class B shares are no longer offered except through dividend reinvestment and permitted exchanges by existing Class B shareholders.
Please consider the investment objectives, risks, charges and expenses of the fund carefully before investing. A summary prospectus and prospectus containing this and other information can be obtained by calling 800-330-7348 or by visiting cohenandsteers.com. Please read the summary prospectus and prospectus carefully before investing.
53
COHEN & STEERS REAL ASSETS FUND, INC.
OFFICERS AND DIRECTORS
Robert H. Steers
Director and co-chairman
Martin Cohen
Director and co-chairman
Michael G. Clark
Director
Bonnie Cohen
Director
George Grossman
Director
Richard E. Kroon
Director
Richard J. Norman
Director
Frank K. Ross
Director
C. Edward Ward, Jr.
Director
Adam M. Derechin
President and chief executive officer
Joseph M. Harvey
Vice president
Yigal D. Jhirad
Vice president
William Scapell
Vice president
Jon Cheigh
Vice president
Jason Yablon
Vice president
Francis C. Poli
Secretary
James Giallanza
Treasurer and chief financial officer
Lisa D. Phelan
Chief compliance officer
KEY INFORMATION
Investment Advisor
Cohen & Steers Capital Management, Inc.
280 Park Avenue
New York, NY 10017
(212) 832-3232
Sub-advisor
Investec Asset Management Limited
2 Gresham Street
London EC2V 7QP
Co-administrator and Custodian
State Street Bank and Trust Company
One Lincoln Street
Boston, MA 02111
Transfer Agent
Boston Financial Data Services, Inc.
30 Dan Road
Canton, MA 02021
(800) 437-9912
Legal Counsel
Ropes & Gray LLP
1211 Avenue of the Americas
New York, NY 10036
Distributor
Cohen & Steers Securities, LLC
280 Park Avenue
New York, NY 10017
Nasdaq Symbol: Class A—RAPAX
Class C—RAPCX
Class I—RAPIX
Class R—RAPRX
Class Z—RAPZX
Website: cohenandsteers.com
This report is authorized for delivery only to shareholders of Cohen & Steers Real Assets Fund, Inc. unless accompanied or preceded by the delivery of a currently effective prospectus setting forth details of the Fund. Performance data quoted represent past performance. Past performance is no guarantee of future results and your investment may be worth more or less at the time you sell your shares.
54
COHEN & STEERS
REAL ASSETS FUND
280 PARK AVENUE
NEW YORK, NY 10017
eDelivery NOW AVAILABLE
Stop traditional mail delivery; receive your shareholder reports and prospectus online.
Sign up at cohenandsteers.com

Semiannual Report June 30, 2013
Cohen & Steers Real Assets Fund
Item 2. Code of Ethics.
Not applicable.
Item 3. Audit Committee Financial Expert.
Not applicable.
Item 4. Principal Accountant Fees and Services.
Not applicable.
Item 5. Audit Committee of Listed Registrants.
Not applicable.
Item 6. Schedule of Investments.
Included in Item 1 above.
Item 7. Disclosure of Proxy Voting Policies and Procedures for Closed-End Management Investment Companies.
Not applicable.
Item 8. Portfolio Managers of Closed-End Management Investment Companies.
Not applicable.
Item 9. Purchases of Equity Securities by Closed-End Management Investment Company and Affiliated Purchasers.
Not applicable.
Item 10. Submission of Matters to a Vote of Security Holders.
None.
Item 11. Controls and Procedures.
(a) The registrant’s principal executive officer and principal financial officer have concluded, based upon their evaluation of the registrant’s disclosure controls and procedures as conducted within 90 days of the filing date of this report, that these disclosure controls and procedures provide reasonable assurance that material information required to be disclosed by the registrant in the report it files or submits on Form N-CSR is recorded, processed, summarized and reported within the time periods specified in the Securities and Exchange Commission’s rules and forms
and that such material information is accumulated and communicated to the registrant’s management, including its principal executive officer and principal financial officer, as appropriate, in order to allow timely decisions regarding required disclosure.
(b) There were no changes in the registrant’s internal control over financial reporting that occurred during the second fiscal quarter of the period covered by this report that have materially affected, or are reasonably likely to materially affect, the registrant’s internal control over financial reporting.
Item 12. Exhibits.
(a)(1) Not applicable.
(a)(2) Certifications of principal executive officer and principal financial officer as required by Rule 30a-2(a) under the Investment Company Act of 1940.
(a)(3) Not applicable.
(b) Certifications of principal executive officer and principal financial officer as required by Rule 30a- 2(b) under the Investment Company Act of 1940.
SIGNATURES
Pursuant to the requirements of the Securities Exchange Act of 1934 and the Investment Company Act of 1940, the registrant has duly caused this report to be signed on its behalf by the undersigned, thereunto duly authorized.
COHEN & STEERS REAL ASSETS FUND, INC.
By: | /s/ Adam M. Derechin | |
| Name: Adam M. Derechin | |
| Title: President and Chief Executive Officer | |
| | |
Date: August 23, 2013 | |
Pursuant to the requirements of the Securities Exchange Act of 1934 and the Investment Company Act of 1940, this report has been signed below by the following persons on behalf of the registrant and in the capacities and on the dates indicated.
By: | /s/ Adam M. Derechin | |
| Name: | Adam M. Derechin | |
| Title: | President and Chief Executive Officer | |
| | (Principal Executive Officer) | |
| | |
By: | /s/ James Giallanza | |
| Name: | James Giallanza | |
| Title: | Treasurer and Chief Financial Officer | |
| | (Principal Financial Officer) | |
| | |
| | |
Date: August 23, 2013 | |