UNITED STATES
SECURITIES AND EXCHANGE COMMISSION
Washington, D.C. 20549
FORM N-CSR
CERTIFIED SHAREHOLDER REPORT OF REGISTERED
MANAGEMENT INVESTMENT COMPANIES
Investment Company Act File Number: 811-22621
Cohen & Steers Real Assets Fund, Inc.
(Exact name of registrant as specified in charter)
| 280 Park Avenue, New York, NY | 10017 | |
| (Address of principal executive offices) | (Zip code) |
Francis C. Poli
Cohen & Steers Capital Management, Inc.
280 Park Avenue
New York, New York 10017
(Name and address of agent for service)
Registrant’s telephone number, including area code: (212) 832-3232
Date of fiscal year end: December 31
Date of reporting period: December 31, 2017
Item 1. Reports to Stockholders.
COHEN & STEERS REAL ASSETS FUND, INC.
To Our Shareholders:
We would like to share with you our report for the year ended December 31, 2017. The total returns for the Fund and its comparative benchmarks were:
| Six Months Ended December 31, 2017 | Year Ended December 31, 2017 | |||||||
Cohen & Steers Real Assets Fund—Class A | 6.83 | % | 6.33 | % | ||||
Cohen & Steers Real Assets Fund—Class C | 6.43 | % | 5.48 | % | ||||
Cohen & Steers Real Assets Fund—Class I | 6.97 | % | 6.62 | % | ||||
Cohen & Steers Real Assets Fund—Class R | 6.53 | % | 5.99 | % | ||||
Cohen & Steers Real Assets Fund—Class Z | 6.86 | % | 6.51 | % | ||||
Blended Benchmarka | 7.26 | % | 9.72 | % | ||||
Consumer Price Index +4%a | 3.71 | % | 6.12 | % | ||||
MSCI World Index—neta | 10.61 | % | 22.40 | % | ||||
The performance data quoted represent past performance. Past performance is no guarantee of future results. The investment return and the principal value of an investment will fluctuate and shares, if redeemed, may be worth more or less than their original cost. Current performance may be lower or higher than the performance data quoted. Current total returns of the Fund can be obtained by visiting our website at cohenandsteers.com. All share class returns assume the reinvestment of all dividends and distributions at net asset value (NAV). Fund performance figures reflect fee waivers and/or expense reimbursements, without which the performance would have been lower. Performance quoted does not reflect the deduction of the maximum 4.50% initial sales charge on Class A shares or the 1.00% maximum contingent deferred sales charge on Class C shares. The 1.00% maximum contingent deferred sales charge on Class C shares applies if redemption occurs on or before the one year anniversary date of their purchase. If such charges were included, returns would have been lower. Index performance does not reflect the deduction of any fees, taxes or expenses. An investor cannot invest directly in an index. Performance figures for periods shorter than one year are not annualized.
Please note that distributions paid by the Fund to shareholders are subject to recharacterization for tax purposes and are taxable up to the amount of the Fund’s investment company taxable income and net realized gains. Distributions in excess of the Fund’s investment company taxable income and net realized gains are a return of capital distributed from the Fund’s assets.
Market Review
Listed real assets advanced in 2017 amid a broad-based acceleration in global growth—the most expansive since the IMF began collecting data in 1980. The U.S. economy accelerated toward 3% annualized growth, and consumer confidence neared a 20-year high. Europe grew at its fastest pace in a decade following years of subdued growth. Within Asia Pacific, China’s GDP growth continued to moderate, although it held up better than expected and the country’s industrial sector showed steady expansion. Growth in Japan picked up from lackluster levels, with improvements in both manufacturing and services. Despite better global growth, benign inflation kept interest rates low even as central banks moved to reduce monetary stimulus.
| a | For benchmark descriptions, see page 6. |
1
COHEN & STEERS REAL ASSETS FUND, INC.
Fund Performance
The Fund had a positive total return in the period, although it underperformed its blended benchmark. Natural resource equities generally had the strongest returns, led by metals & mining companies that benefited from favorable fundamentals for copper, nickel and other industrial metals. Stock selection in the natural resource group detracted from the Fund’s relative performance, in part due to our underweight in metals & mining companies. Stock selection among energy companies also hindered performance.
Within commodities, crude oil continued to recover, aided by improving global demand and OPEC’s (Organization of Petroleum Exporting Countries) announcement that it would extend its production cuts through the end of 2018. Gold outperformed on rising geopolitical risks and a weaker U.S. dollar. Agriculture commodities underperformed, as overproduction resulted in broad-based weakness across the complex. Our allocation to commodities hindered relative performance, due in part to having underweights in copper and gold and an overweight in natural gas, which declined in the period.
Global real estate stocks had a solid gain in 2017, aided by improving fundamentals across many property markets. However, real estate trailed global equities, restrained by relatively modest earnings acceleration compared to more cyclical sectors and by a challenging environment for retail landlords. Stock selection within real estate aided the Fund’s relative performance. In the U.S., we were overweight data center companies, which had strong gains, and were underweight regional malls, which struggled in a difficult retail environment. The Fund’s U.K. real estate holdings also outperformed, reflecting our focus on less-cyclical sectors such as industrial and self storage that outperformed amid Brexit uncertainty and concerns over the country’s slowing economy.
Global listed infrastructure achieved strong returns, with sizable gains from more-cyclical sectors, including airports and toll roads. However, the asset class lagged the broad equity market, reflecting more-modest gains in utilities and weakness in midstream energy stocks. Our underweight in the asset class hindered performance, although the effect was partly offset by favorable stock selection, led by outperformance from the Fund’s midstream energy and electric utilities holdings.
Impact of Foreign Currency on Fund Performance
The currency impact of the Fund’s investments in foreign securities contributed positively to absolute performance during the period. Although the Fund reports its NAV and pays dividends in U.S. dollars, the Fund’s investments denominated in foreign currencies are subject to foreign currency risk. Most currencies appreciated against the U.S. dollar, including the euro, U.K. pound and Japanese yen. Consequently, changes in the exchange rates between foreign currencies and the U.S. dollar were a net tailwind for absolute returns.
Impact of Derivatives on Fund Performance
The Fund engaged in the buying and selling of commodities contracts with the intention of enhancing total returns. These contracts significantly detracted from the Fund’s total return for the 12-month period ended December 31, 2017.
2
COHEN & STEERS REAL ASSETS FUND, INC.
Sincerely,
VINCENT L. CHILDERS |
JON CHEIGH |
BENJAMIN ROSS | ||
Portfolio Manager | Portfolio Manager | Portfolio Manager | ||


NICK KOUTSOFTAS |
BEN MORTON |
CHRISTOPHER RHINE | ||
Portfolio Manager | Portfolio Manager | Portfolio Manager | ||


The views and opinions in the preceding commentary are subject to change without notice and are as of the date of the report. There is no guarantee that any market forecast set forth in the commentary will be realized. This material represents an assessment of the market environment at a specific point in time, should not be relied upon as investment advice and is not intended to predict or depict performance of any investment.
Visit Cohen & Steers online at cohenandsteers.com
For more information about the Cohen & Steers family of mutual funds, visit cohenandsteers.com. Here you will find fund net asset values, fund fact sheets and portfolio highlights, as well as educational resources and timely market updates.
Our website also provides comprehensive information about Cohen & Steers, including our most recent press releases, profiles of our senior investment professionals and their investment approach to each asset class. The Cohen & Steers family of mutual funds invests in major real asset categories including real estate securities, listed infrastructure, commodities and natural resource equities, as well as preferred securities and other income solutions.
3
COHEN & STEERS REAL ASSETS FUND, INC.
Performance Review (Unaudited)
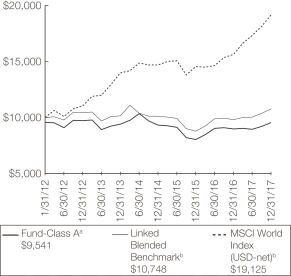
Class A—Growth of a $10,000 Investment
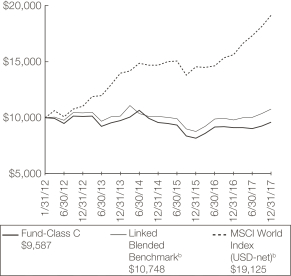
| Class C—Growth of a $10,000 Investment
|
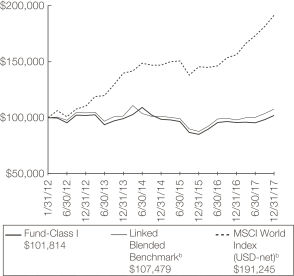
Class I—Growth of a $100,000 Investment
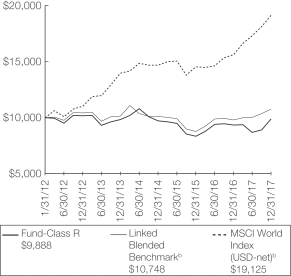
| Class R—Growth of a $10,000 Investment
|
4
COHEN & STEERS REAL ASSETS FUND, INC.
Performance Review (Unaudited)—(Continued)
Class Z—Growth of a $10,000 Investment
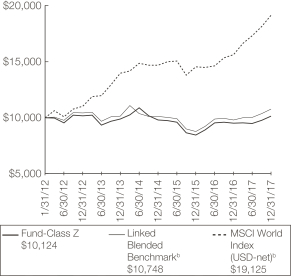
Average Annual Total Returns—For Periods Ended December 31, 2017
| Class A Shares | Class C Shares | Class I Shares | Class R Shares | Class Z Shares | ||||||||||||||||
1 Year (with sales charge) | 1.54 | %a | 4.48 | %c | — | — | — | |||||||||||||
1 Year (without sales charge) | 6.33 | % | 5.48 | % | 6.62 | % | 5.99 | % | 6.51 | % | ||||||||||
5 Years (with sales charge) | –1.26 | %a | –1.03 | % | — | — | — | |||||||||||||
5 Years (without sales charge) | –0.35 | % | –1.03 | % | –0.04 | % | –0.53 | % | –0.10 | % | ||||||||||
Since Inceptiond (with sales charge) | –0.79 | %a | –0.71 | % | — | — | — | |||||||||||||
Since Inceptiond (without sales charge) | –0.02 | % | –0.71 | % | 0.30 | % | –0.19 | % | 0.21 | % | ||||||||||
The performance data quoted represent past performance. Past performance is no guarantee of future results. The investment return and principal value of an investment will fluctuate and shares, if redeemed, may be worth more or less than their original cost. Current performance may be lower or higher than the performance data quoted. Performance information current to the most recent month end can be obtained by visiting our website at cohenandsteers.com. All share class returns assume the reinvestment of all dividends and distributions at NAV. The performance graph and table do not reflect the deduction of taxes that a shareholder would pay on Fund distributions or the redemption of Fund shares. During the periods presented above, the investment advisor waived fees and/or reimbursed expenses. Without this arrangement, performance would have been lower.
The annualized gross and net expense ratios, respectively, for each class of shares as disclosed in the April 1, 2017 prospectus were as follows: Class A—1.65% and 1.16%; Class C—2.30% and 1.81%; Class I—1.34% and 0.81%; Class R—1.80% and 1.31%; and Class Z—1.30% and 0.81%. Through
5
COHEN & STEERS REAL ASSETS FUND, INC.
Performance Review (Unaudited)—(Continued)
June 30, 2019, the investment advisor has contractually agreed to waive its fee and/or reimburse the Fund for expenses incurred to the extent necessary to maintain the Fund’s total annual operating expenses, which include the expenses of the Subsidiary (excluding acquired fund fees and expenses, taxes and extraordinary expenses) do not exceed 1.15% for Class A shares, 1.80% for Class C shares, 0.80% for Class I shares, 1.30% for Class R shares and 0.80% for Class Z shares. This contractual agreement can be amended at any time by agreement of the Board of Directors of the Fund and the investment advisor and will terminate automatically in the event of termination of the investment advisory agreement between the investment advisor and the Fund.
a Reflects a 4.50% front-end sales charge.
| b | The Linked Blended Benchmark is represented by the performance of the blended benchmark consisting of 30% FTSE EPRA/NAREIT Developed Real Estate Index—net, 30% Bloomberg Commodity Total Return Index, 20% S&P Global Natural Resources Index—net, 12.5% ICE BofAML 1-3 Year Global Corporate Index and 7.5% Gold Index from January 31, 2012 through September 30, 2013 and the blended benchmark consists of 27.5% FTSE EPRA/NAREIT Developed Real Estate Index—net, 27.5% Bloomberg Commodity Total Return Index, 15% S&P Global Natural Resources Index—net, 10% ICE BofAML 1-3 Year U.S. Corporate Index, 5% Gold Index and 15% Dow Jones-Brookfield Global Infrastructure Index from October 1, 2013 and thereafter. The FTSE EPRA/NAREIT Developed Real Estate Index—net is an unmanaged market-capitalization-weighted total-return index, which consists of publicly traded equity real estate investment trusts (REITs) and listed property companies from developed markets and is net of dividend withholding taxes. The Bloomberg Commodity Index Total Return is a broadly diversified index that tracks the commodity markets through commodity futures contracts. The index is made up of exchange-traded futures on physical commodities, which are weighted to account for economic significance and market liquidity. The S&P Global Natural Resources Index—net includes the largest publicly-traded companies in natural resources and commodities businesses that meet specific investability requirements and is net of dividend withholding taxes. The ICE BofAML 1-3 Year U.S. Corporate Index tracks the performance of U.S. dollar-denominated investment-grade corporate debt publicly issued in the U.S. domestic market, with a remaining term to final maturity of less than 3 years. The ICE BofAML 1-3 Year Global Corporate Index is a subset of The ICE BofAML Global Corporate Index including all securities with a remaining term to final maturity less than 3 years. The Gold Index is represented by the gold spot price in U.S. dollars per Troy ounce. The Dow Jones Brookfield Global Infrastructure Index is a float-adjusted market-capitalization-weighted index that measures performance of globally domiciled companies that derive more than 70% of their cash flows from infrastructure lines of business. The Consumer Price Index (CPI) is a broad measure of average price changes for a diverse basket of goods and services. The CPI is focused on items typically purchased by urban consumers, across diverse households and geographies. The benchmark is represented by the change in the CPI +4% per year. The MSCI World Index—net is a free-float-adjusted index that measures performance of large- and mid-capitalization companies representing developed market countries and is net of dividend withholding taxes. |
6
COHEN & STEERS REAL ASSETS FUND, INC.
Performance Review (Unaudited)—(Continued)
| The comparative indexes are not adjusted to reflect expenses or other fees that the U.S. Securities and Exchange Commission (SEC) requires to be reflected in the Fund’s performance. Index performance does not reflect the deduction of any fees, taxes or expenses. An investor cannot invest directly in an index. The Fund’s performance assumes the reinvestment of all dividends and distributions at NAV. For more information, including charges and expenses, please read the prospectus carefully before you invest. |
| c | Reflects a contingent deferred sales charge of 1.00%. |
| d | Inception date of January 31, 2012. |
7
COHEN & STEERS REAL ASSETS FUND, INC.
Expense Example (Unaudited)
As a shareholder of the Fund, you incur two types of costs: (1) transaction costs, including sales charges (loads) on purchase payments; and (2) ongoing costs including investment advisory fees; distribution and/or service (12b-1) fees; and other Fund expenses. This example is intended to help you understand your ongoing costs (in dollars) of investing in the Fund and to compare these costs with the ongoing costs of investing in other mutual funds.
The example is based on an investment of $1,000 invested at the beginning of the period and held for the entire period July 1, 2017—December 31, 2017.
Actual Expenses
The first line of the following table provides information about actual account values and expenses. You may use the information in this line, together with the amount you invested, to estimate the expenses that you paid over the period. Simply divide your account value by $1,000 (for example, an $8,600 account value divided by $1,000 = 8.6), then multiply the result by the number in the first line under the heading entitled “Expenses Paid During Period” to estimate the expenses you paid on your account during this period.
Hypothetical Example for Comparison Purposes
The second line of the following table provides information about hypothetical account values and hypothetical expenses based on the Fund’s actual expense ratio and an assumed rate of return of 5% per year before expenses, which is not the Fund’s actual return. The hypothetical account values and expenses may not be used to estimate the actual ending account balance or expenses you paid for the period. You may use this information to compare the ongoing cost of investing in the Fund and other funds. To do so, compare this 5% hypothetical example with the 5% hypothetical examples that appear in the shareholder reports of other funds.
Please note that the expenses shown in the table are meant to highlight your ongoing costs only and do not reflect any transaction costs, such as sales charges (loads). Therefore, the second line of the table is useful in comparing ongoing costs only, and will not help you determine the relative total costs of owning different funds. In addition, if these transactional costs were included, your costs would have been higher.
8
COHEN & STEERS REAL ASSETS FUND, INC.
Expense Example (Unaudited)—(Continued)
| Beginning Account Value July 1, 2017 | Ending Account Value December 31, 2017 | Expenses Paid During Perioda July 1, 2017— December 31, 2017 | ||||||||||
Class A | ||||||||||||
Actual (6.83% return) | $ | 1,000.00 | $ | 1,068.30 | $ | 5.63 | ||||||
Hypothetical (5% annual return before expenses) | $ | 1,000.00 | $ | 1,019.76 | $ | 5.50 | ||||||
Class C | ||||||||||||
Actual (6.43% return) | $ | 1,000.00 | $ | 1,064.30 | $ | 9.37 | ||||||
Hypothetical (5% annual return before expenses) | $ | 1,000.00 | $ | 1,016.13 | $ | 9.15 | ||||||
Class I | ||||||||||||
Actual (6.97% return) | $ | 1,000.00 | $ | 1,069.70 | $ | 4.17 | ||||||
Hypothetical (5% annual return before expenses) | $ | 1,000.00 | $ | 1,021.17 | $ | 4.08 | ||||||
Class R | ||||||||||||
Actual (6.53% return) | $ | 1,000.00 | $ | 1,065.30 | $ | 6.77 | ||||||
Hypothetical (5% annual return before expenses) | $ | 1,000.00 | $ | 1,018.65 | $ | 6.61 | ||||||
Class Z | ||||||||||||
Actual (6.86% return) | $ | 1,000.00 | $ | 1,068.60 | $ | 4.17 | ||||||
Hypothetical (5% annual return before expenses) | $ | 1,000.00 | $ | 1,021.17 | $ | 4.08 | ||||||
| a | Expenses are equal to the Fund’s Class A, Class C, Class I, Class R and Class Z annualized net expense ratios of 1.08%, 1.80%, 0.80%, 1.30% and 0.80%, respectively, multiplied by the average account value over the period, multiplied by 184/365 (to reflect the one-half year period). |
9
COHEN & STEERS REAL ASSETS FUND, INC.
December 31, 2017
Top Ten Holdingsa
(Unaudited)
Security | Value | % of Net Assets | ||||||
iShares Gold Trust ETF | $ | 5,530,421 | 3.4 | |||||
American Tower Corp. | 2,342,213 | 1.4 | ||||||
Total SA | 1,526,587 | 0.9 | ||||||
Exxon Mobil Corp. | 1,518,735 | 0.9 | ||||||
Royal Dutch Shell PLC | 1,501,900 | 0.9 | ||||||
Mitsui Fudosan Co., Ltd. | 1,490,170 | 0.9 | ||||||
Sun Hung Kai Properties Ltd. | 1,468,760 | 0.9 | ||||||
Enbridge | 1,427,361 | 0.9 | ||||||
CK Asset Holdings Ltd. | 1,346,269 | 0.8 | ||||||
Realty Income Corp. | 1,335,352 | 0.8 | ||||||
| a | Top ten holdings are determined on the basis of the value of individual securities held. The Fund may also hold positions in other types of securities issued by the companies listed above. See the Consolidated Schedule of Investments for additional details on such other positions. |
Strategy Breakdownb
(Unaudited)
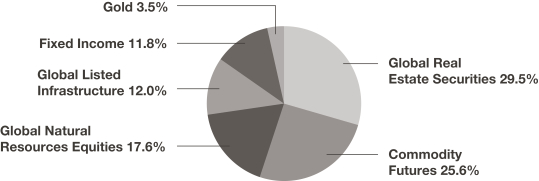
| b | The strategy breakdown is expressed as an approximate percentage of the Fund’s total long-term investments inclusive of derivative exposure. |
10
COHEN & STEERS REAL ASSETS FUND, INC.
CONSOLIDATED SCHEDULE OF INVESTMENTS
December 31, 2017
| Number of Shares | Value | |||||||||||
COMMON STOCK | 61.1% | |||||||||||
AUSTRALIA | 2.8% | |||||||||||
ELECTRIC—REGULATED ELECTRIC | 0.3% | |||||||||||
Spark Infrastructure Group |
| 240,419 | $ | 470,843 | ||||||||
|
| |||||||||||
MATERIALS—METALS & MINING | 0.7% | |||||||||||
Rio Tinto Ltd. |
| 11,903 | 704,072 | |||||||||
South32 Ltd. (GBP) |
| 160,026 | 438,060 | |||||||||
|
| |||||||||||
| 1,142,132 | ||||||||||||
|
| |||||||||||
REAL ESTATE | 1.8% | |||||||||||
DIVERSIFIED | 1.3% | |||||||||||
Charter Hall Group |
| 105,531 | 495,690 | |||||||||
Dexus Property Group |
| 175,114 | 1,332,169 | |||||||||
Mirvac Group |
| 189,508 | 347,480 | |||||||||
|
| |||||||||||
| 2,175,339 | ||||||||||||
|
| |||||||||||
INDUSTRIALS | 0.5% | |||||||||||
Goodman Group |
| 121,093 | 795,546 | |||||||||
|
| |||||||||||
TOTAL REAL ESTATE |
| 2,970,885 | ||||||||||
|
| |||||||||||
TOTAL AUSTRALIA |
| 4,583,860 | ||||||||||
|
| |||||||||||
AUSTRIA | 0.2% | |||||||||||
REAL ESTATE—DIVERSIFIED | ||||||||||||
BUWOG AG |
| 8,321 | 287,038 | |||||||||
|
| |||||||||||
BELGIUM | 0.0% | |||||||||||
REAL ESTATE—RESIDENTIAL | ||||||||||||
Aedifica SA |
| 263 | 24,841 | |||||||||
|
| |||||||||||
BRAZIL | 1.0% | |||||||||||
CONSUMER—NON-CYCLICAL—FOOD PRODUCTS | 0.1% | |||||||||||
BRF SA, ADR (USD)a |
| 19,329 | 217,644 | |||||||||
|
| |||||||||||
ENERGY—OIL & GAS | 0.0% | |||||||||||
Petroleo Brasileiro SA, ADR (USD)a |
| 6,216 | 63,963 | |||||||||
|
| |||||||||||
MATERIALS—METALS & MINING | 0.5% | |||||||||||
Vale SA, ADR (USD) |
| 58,695 | 717,840 | |||||||||
|
| |||||||||||
RAILWAYS | 0.1% | |||||||||||
Rumo SAa |
| 36,502 | 142,724 | |||||||||
|
| |||||||||||
See accompanying notes to the consolidated financial statements.
11
COHEN & STEERS REAL ASSETS FUND, INC.
CONSOLIDATED SCHEDULE OF INVESTMENTS—(Continued)
December 31, 2017
| Number of Shares | Value | |||||||||||
REAL ESTATE—RETAIL | 0.2% | |||||||||||
BR Malls Participacoes SA |
| 60,774 | $ | 233,232 | ||||||||
|
| |||||||||||
WATER | 0.1% | |||||||||||
Cia de Saneamento Basico do Estado de Sao Paulo |
| 19,298 | 199,723 | |||||||||
|
| |||||||||||
TOTAL BRAZIL |
| 1,575,126 | ||||||||||
|
| |||||||||||
CANADA | 4.0% | |||||||||||
ENERGY—OIL & GAS | 0.4% | |||||||||||
Suncor Energy |
| 15,455 | 567,421 | |||||||||
|
| |||||||||||
MATERIALS | 1.1% | |||||||||||
CHEMICALS | 0.7% | |||||||||||
Agrium (USD) |
| 3,901 | 448,615 | |||||||||
Potash Corp. of Saskatchewan (USD) |
| 30,678 | 633,500 | |||||||||
|
| |||||||||||
| 1,082,115 | ||||||||||||
|
| |||||||||||
METALS & MINING | 0.4% | |||||||||||
First Quantum Minerals Ltd. |
| 25,598 | 358,617 | |||||||||
Franco-Nevada Corp. |
| 4,961 | 396,485 | |||||||||
|
| |||||||||||
| 755,102 | ||||||||||||
|
| |||||||||||
TOTAL MATERIALS |
| 1,837,217 | ||||||||||
|
| |||||||||||
PIPELINES—C-CORP | 1.5% | |||||||||||
Enbridge |
| 36,497 | 1,427,361 | |||||||||
Pembina Pipeline Corp. |
| 23,177 | 839,129 | |||||||||
TransCanada Corp. |
| 2,826 | 137,545 | |||||||||
|
| |||||||||||
| 2,404,035 | ||||||||||||
|
| |||||||||||
REAL ESTATE | 1.0% | |||||||||||
OFFICE | 0.6% | |||||||||||
Allied Properties REIT |
| 29,373 | 983,306 | |||||||||
|
| |||||||||||
RESIDENTIAL | 0.4% | |||||||||||
Boardwalk REIT |
| 18,203 | 624,000 | |||||||||
|
| |||||||||||
TOTAL REAL ESTATE |
| 1,607,306 | ||||||||||
|
| |||||||||||
TOTAL CANADA |
| 6,415,979 | ||||||||||
|
| |||||||||||
CHILE | 0.1% | |||||||||||
MATERIALS—CHEMICALS | ||||||||||||
Sociedad Quimica y Minera de Chile SA, ADR (USD) |
| 3,389 | 201,205 | |||||||||
|
| |||||||||||
See accompanying notes to the consolidated financial statements.
12
COHEN & STEERS REAL ASSETS FUND, INC.
CONSOLIDATED SCHEDULE OF INVESTMENTS—(Continued)
December 31, 2017
| Number of Shares | Value | |||||||||||
CHINA | 0.2% | |||||||||||
TOLL ROADS | ||||||||||||
Jiangsu Expressway Co., Ltd., Class H (HKD) |
| 166,000 | $ | 252,840 | ||||||||
|
| |||||||||||
FRANCE | 2.9% | |||||||||||
AIRPORTS | 0.0% | |||||||||||
Aeroports de Paris |
| 313 | 59,525 | |||||||||
|
| |||||||||||
ENERGY—OIL & GAS | 1.0% | |||||||||||
Total SA |
| 27,632 | 1,526,587 | |||||||||
|
| |||||||||||
REAL ESTATE | 0.8% | |||||||||||
DIVERSIFIED | 0.2% | |||||||||||
Fonciere des Regions |
| 3,342 | 378,855 | |||||||||
|
| |||||||||||
OFFICE | 0.4% | |||||||||||
Gecina SA |
| 3,526 | 651,100 | |||||||||
|
| |||||||||||
RETAIL | 0.2% | |||||||||||
Unibail-Rodamco SE |
| 938 | 236,346 | |||||||||
|
| |||||||||||
TOTAL REAL ESTATE |
| 1,266,301 | ||||||||||
|
| |||||||||||
TOLL ROADS | 1.1% | |||||||||||
Eiffage SA |
| 4,788 | 524,737 | |||||||||
Vinci SA |
| 12,789 | 1,306,616 | |||||||||
|
| |||||||||||
| 1,831,353 | ||||||||||||
|
| |||||||||||
TOTAL FRANCE |
| 4,683,766 | ||||||||||
|
| |||||||||||
GERMANY | 1.6% | |||||||||||
AIRPORTS | 0.2% | |||||||||||
Fraport AG |
| 2,565 | 282,709 | |||||||||
|
| |||||||||||
ELECTRIC—REGULATED ELECTRIC | 0.1% | |||||||||||
Innogy SE, 144Ab |
| 6,777 | 265,693 | |||||||||
|
| |||||||||||
MATERIALS—METALS & MINING | 0.1% | |||||||||||
ThyssenKrupp AG |
| 4,225 | 122,755 | |||||||||
|
| |||||||||||
REAL ESTATE | 1.2% | |||||||||||
OFFICE | 0.2% | |||||||||||
Alstria Office REIT AG |
| 18,190 | 281,546 | |||||||||
|
| |||||||||||
See accompanying notes to the consolidated financial statements.
13
COHEN & STEERS REAL ASSETS FUND, INC.
CONSOLIDATED SCHEDULE OF INVESTMENTS—(Continued)
December 31, 2017
| Number of Shares | Value | |||||||||||
RESIDENTIAL | 1.0% | |||||||||||
ADO Properties SA, 144Ab |
| 9,127 | $ | 463,009 | ||||||||
Deutsche Wohnen AG |
| 27,379 | 1,197,736 | |||||||||
|
| |||||||||||
| 1,660,745 | ||||||||||||
|
| |||||||||||
TOTAL REAL ESTATE |
| 1,942,291 | ||||||||||
|
| |||||||||||
TOTAL GERMANY |
| 2,613,448 | ||||||||||
|
| |||||||||||
HONG KONG | 3.5% | |||||||||||
CONSUMER STAPLES—FOOD | 0.3% | |||||||||||
WH Group Ltd., 144Ab |
| 426,900 | 481,932 | |||||||||
|
| |||||||||||
ELECTRIC—REGULATED ELECTRIC | 0.2% | |||||||||||
CLP Holdings Ltd. |
| 29,000 | 296,761 | |||||||||
|
| |||||||||||
ENERGY—OIL & GAS | 0.2% | |||||||||||
CNOOC Ltd. |
| 197,000 | 282,911 | |||||||||
|
| |||||||||||
REAL ESTATE | 2.7% | |||||||||||
DIVERSIFIED | 2.1% | |||||||||||
CK Asset Holdings Ltd. |
| 154,000 | 1,346,269 | |||||||||
Hang Lung Properties Ltd. |
| 264,000 | 645,398 | |||||||||
Sun Hung Kai Properties Ltd. |
| 88,000 | 1,468,760 | |||||||||
|
| |||||||||||
| 3,460,427 | ||||||||||||
|
| |||||||||||
RETAIL | 0.6% | |||||||||||
Link REIT |
| 99,500 | 922,682 | |||||||||
|
| |||||||||||
TOTAL REAL ESTATE |
| 4,383,109 | ||||||||||
|
| |||||||||||
WATER | 0.1% | |||||||||||
Guangdong Investment Ltd. |
| 137,339 | 183,872 | |||||||||
|
| |||||||||||
TOTAL HONG KONG |
| 5,628,585 | ||||||||||
|
| |||||||||||
ITALY | 0.5% | |||||||||||
COMMUNICATIONS—TOWERS | 0.2% | |||||||||||
Infrastrutture Wireless Italiane S.p.A., 144Ab |
| 54,301 | 403,949 | |||||||||
|
| |||||||||||
ENERGY—OIL & GAS | 0.3% | |||||||||||
Eni S.p.A. |
| 28,130 | 465,774 | |||||||||
|
| |||||||||||
TOTAL ITALY |
| 869,723 | ||||||||||
|
| |||||||||||
See accompanying notes to the consolidated financial statements.
14
COHEN & STEERS REAL ASSETS FUND, INC.
CONSOLIDATED SCHEDULE OF INVESTMENTS—(Continued)
December 31, 2017
| Number of Shares | Value | |||||||||||
JAPAN | 4.4% | |||||||||||
CONSUMER—NON-CYCLICAL | 0.1% | |||||||||||
NH Foods Ltd. |
| 10,292 | $ | 251,009 | ||||||||
|
| |||||||||||
INDUSTRIAL—MACHINERY | 0.5% | |||||||||||
Kubota Corp. |
| 40,045 | 785,262 | |||||||||
|
| |||||||||||
MATERIALS—METALS & MINING | 0.4% | |||||||||||
JFE Holdings |
| 14,200 | 341,027 | |||||||||
Nippon Steel & Sumitomo Metal Corp. |
| 13,300 | 341,250 | |||||||||
|
| |||||||||||
| 682,277 | ||||||||||||
|
| |||||||||||
RAILWAYS | 0.3% | |||||||||||
West Japan Railway Co. |
| 6,100 | 445,393 | |||||||||
|
| |||||||||||
REAL ESTATE | 3.1% | |||||||||||
DIVERSIFIED | 2.2% | |||||||||||
Activia Properties |
| 111 | 464,984 | |||||||||
Hulic Co., Ltd. |
| 47,000 | 528,085 | |||||||||
Invincible Investment Corp. |
| 562 | 239,165 | |||||||||
Mitsui Fudosan Co., Ltd. |
| 66,497 | 1,490,170 | |||||||||
Sumitomo Realty & Development Co., Ltd. |
| 9,000 | 295,780 | |||||||||
Tokyo Tatemono Co., Ltd. |
| 44,267 | 597,953 | |||||||||
|
| |||||||||||
| 3,616,137 | ||||||||||||
|
| |||||||||||
OFFICE | 0.5% | |||||||||||
Kenedix Office Investment Corp. |
| 72 | 408,964 | |||||||||
Nippon Building Fund |
| 69 | 337,421 | |||||||||
|
| |||||||||||
| 746,385 | ||||||||||||
|
| |||||||||||
RESIDENTIAL | 0.1% | |||||||||||
Daiwa House REIT Investment Corp. |
| 104 | 247,089 | |||||||||
|
| |||||||||||
RETAIL | 0.3% | |||||||||||
Japan Retail Fund Investment Corp. |
| 241 | 441,896 | |||||||||
|
| |||||||||||
TOTAL REAL ESTATE |
| 5,051,507 | ||||||||||
|
| |||||||||||
TOTAL JAPAN |
| 7,215,448 | ||||||||||
|
| |||||||||||
JERSEY | 0.8% | |||||||||||
MATERIALS—METALS & MINING | ||||||||||||
Glencore PLC (GBP) |
| 246,543 | 1,298,194 | |||||||||
|
| |||||||||||
See accompanying notes to the consolidated financial statements.
15
COHEN & STEERS REAL ASSETS FUND, INC.
CONSOLIDATED SCHEDULE OF INVESTMENTS—(Continued)
December 31, 2017
| Number of Shares | Value | |||||||||||
LUXEMBOURG | 0.2% | |||||||||||
MATERIALS—METALS & MINING | ||||||||||||
ArcelorMittala |
| 9,696 | $ | 315,449 | ||||||||
|
| |||||||||||
MEXICO | 0.1% | |||||||||||
TOLL ROADS | ||||||||||||
OHL Mexico SAB de CV |
| 111,397 | 181,635 | |||||||||
|
| |||||||||||
NEW ZEALAND | 0.2% | |||||||||||
AIRPORTS | ||||||||||||
Auckland International Airport Ltd. |
| 60,590 | 278,252 | |||||||||
|
| |||||||||||
NORWAY | 0.4% | |||||||||||
MATERIALS—CHEMICALS | 0.2% | |||||||||||
Yara International ASA |
| 6,239 | 286,244 | |||||||||
|
| |||||||||||
REAL ESTATE—OFFICE | 0.2% | |||||||||||
Entra ASA, 144Ab |
| 20,442 | 303,744 | |||||||||
|
| |||||||||||
TOTAL NORWAY |
| 589,988 | ||||||||||
|
| |||||||||||
RUSSIA | 0.2% | |||||||||||
ENERGY—OIL & GAS | ||||||||||||
Gazprom OAO, ADR (USD) |
| 54,444 | 240,098 | |||||||||
Lukoil PJSC, ADR (USD) |
| 1,616 | 92,468 | |||||||||
|
| |||||||||||
| 332,566 | ||||||||||||
|
| |||||||||||
SINGAPORE | 0.2% | |||||||||||
CONSUMER STAPLES—FOOD PRODUCTS | ||||||||||||
Golden Agri-Resources Ltd. |
| 281,900 | 77,987 | |||||||||
Wilmar International Ltd. |
| 77,500 | 179,053 | |||||||||
|
| |||||||||||
| 257,040 | ||||||||||||
|
| |||||||||||
SOUTH KOREA | 0.6% | |||||||||||
MATERIALS—METALS & MINING | ||||||||||||
Korea Zinc Co., Ltd. |
| 579 | 266,636 | |||||||||
POSCO |
| 2,183 | 678,014 | |||||||||
|
| |||||||||||
| 944,650 | ||||||||||||
|
| |||||||||||
SPAIN | 1.8% | |||||||||||
AIRPORTS | 0.3% | |||||||||||
Aena SME SA, 144Ab |
| 2,764 | 560,469 | |||||||||
|
| |||||||||||
See accompanying notes to the consolidated financial statements.
16
COHEN & STEERS REAL ASSETS FUND, INC.
CONSOLIDATED SCHEDULE OF INVESTMENTS—(Continued)
December 31, 2017
| Number of Shares | Value | |||||||||||
REAL ESTATE | 1.1% | |||||||||||
APARTMENT | 0.2% | |||||||||||
Aedas Homes SAU, 144Aa,b |
| 7,226 | $ | 265,305 | ||||||||
|
| |||||||||||
DIVERSIFIED | 0.7% | |||||||||||
Merlin Properties Socimi SA |
| 89,580 | 1,214,552 | |||||||||
|
| |||||||||||
OFFICE | 0.2% | |||||||||||
Inmobiliaria Colonial Socimi SA |
| 24,611 | 244,593 | |||||||||
|
| |||||||||||
TOTAL REAL ESTATE |
| 1,724,450 | ||||||||||
|
| |||||||||||
TOLL ROADS | 0.4% | |||||||||||
Ferrovial SA |
| 29,465 | 669,066 | |||||||||
|
| |||||||||||
TOTAL SPAIN |
| 2,953,985 | ||||||||||
|
| |||||||||||
SWEDEN | 0.5% | |||||||||||
REAL ESTATE | ||||||||||||
DIVERSIFIED | 0.2% | |||||||||||
Fastighets AB Balder, Class Ba |
| 10,775 | 288,188 | |||||||||
|
| |||||||||||
HOTEL | 0.3% | |||||||||||
Pandox AB |
| 27,992 | 540,860 | |||||||||
|
| |||||||||||
TOTAL SWEDEN |
| 829,048 | ||||||||||
|
| |||||||||||
UNITED KINGDOM | 4.6% | |||||||||||
CONSUMER—NON-CYCLICAL—FOOD PRODUCTS | 0.3% | |||||||||||
Associated British Foods PLC |
| 13,071 | 497,669 | |||||||||
|
| |||||||||||
ELECTRIC—REGULATED ELECTRIC | 0.2% | |||||||||||
National Grid PLC |
| 35,357 | 417,749 | |||||||||
|
| |||||||||||
ENERGY | 1.3% | |||||||||||
INTEGRATED OIL & GAS | 0.9% | |||||||||||
Royal Dutch Shell PLC |
| 44,345 | 1,501,900 | |||||||||
|
| |||||||||||
OIL & GAS | 0.4% | |||||||||||
BP PLC |
| 84,096 | 593,486 | |||||||||
|
| |||||||||||
TOTAL ENERGY |
| 2,095,386 | ||||||||||
|
| |||||||||||
MATERIALS—METALS & MINING | 0.5% | |||||||||||
Antofagasta PLC |
| 15,171 | 205,855 | |||||||||
BHP Billiton PLC |
| 29,003 | 596,187 | |||||||||
|
| |||||||||||
| 802,042 | ||||||||||||
|
| |||||||||||
See accompanying notes to the consolidated financial statements.
17
COHEN & STEERS REAL ASSETS FUND, INC.
CONSOLIDATED SCHEDULE OF INVESTMENTS—(Continued)
December 31, 2017
| Number of Shares | Value | |||||||||||
REAL ESTATE | 2.0% | |||||||||||
DIVERSIFIED | 0.4% | |||||||||||
British Land Co., PLC |
| 32,501 | $ | 303,439 | ||||||||
Hammerson PLC |
| 32,858 | 242,667 | |||||||||
LondonMetric Property PLC |
| 63,140 | 158,562 | |||||||||
|
| |||||||||||
| 704,668 | ||||||||||||
|
| |||||||||||
HEALTH CARE | 0.3% | |||||||||||
Assura PLC |
| 552,675 | 476,818 | |||||||||
|
| |||||||||||
INDUSTRIALS | 0.6% | |||||||||||
Segro PLC |
| 85,181 | 675,092 | |||||||||
Tritax Big Box REIT PLC |
| 102,828 | 206,723 | |||||||||
|
| |||||||||||
| 881,815 | ||||||||||||
|
| |||||||||||
OFFICE | 0.2% | |||||||||||
Derwent London PLC |
| 5,052 | 212,678 | |||||||||
Workspace Group PLC |
| 12,687 | 171,636 | |||||||||
|
| |||||||||||
| 384,314 | ||||||||||||
|
| |||||||||||
RESIDENTIAL | 0.2% | |||||||||||
UNITE Group PLC |
| 23,875 | 259,491 | |||||||||
|
| |||||||||||
SELF STORAGE | 0.3% | |||||||||||
Big Yellow Group PLC |
| 16,215 | 190,357 | |||||||||
Safestore Holdings PLC |
| 41,570 | 280,404 | |||||||||
|
| |||||||||||
| 470,761 | ||||||||||||
|
| |||||||||||
TOTAL REAL ESTATE |
| 3,177,867 | ||||||||||
|
| |||||||||||
WATER—WATER UTILITIES | 0.3% | |||||||||||
United Utilities Group PLC |
| 41,015 | 459,347 | |||||||||
|
| |||||||||||
TOTAL UNITED KINGDOM |
| 7,450,060 | ||||||||||
|
| |||||||||||
UNITED STATES | 30.3% | |||||||||||
COMMUNICATIONS—TOWERS | 2.2% | |||||||||||
American Tower Corp. |
| 16,417 | 2,342,213 | |||||||||
Crown Castle International Corp. |
| 10,549 | 1,171,045 | |||||||||
|
| |||||||||||
| 3,513,258 | ||||||||||||
|
| |||||||||||
See accompanying notes to the consolidated financial statements.
18
COHEN & STEERS REAL ASSETS FUND, INC.
CONSOLIDATED SCHEDULE OF INVESTMENTS—(Continued)
December 31, 2017
| Number of Shares | Value | |||||||||||
CONSUMER—NON-CYCLICAL | 1.8% | |||||||||||
AGRICULTURE | 0.7% | |||||||||||
Archer-Daniels-Midland Co. |
| 10,753 | $ | 430,980 | ||||||||
Bunge Ltd. |
| 10,838 | 727,013 | |||||||||
|
| |||||||||||
| 1,157,993 | ||||||||||||
|
| |||||||||||
FOOD PRODUCTS | 1.1% | |||||||||||
Ingredion |
| 6,975 | 975,105 | |||||||||
Pinnacle Foods |
| 5,105 | 303,594 | |||||||||
Tyson Foods, Class A |
| 5,207 | 422,132 | |||||||||
|
| |||||||||||
| 1,700,831 | ||||||||||||
|
| |||||||||||
TOTAL CONSUMER—NON-CYCLICAL |
| 2,858,824 | ||||||||||
|
| |||||||||||
DIVERSIFIED | 0.1% | |||||||||||
Macquarie Infrastructure Co. LLC |
| 2,625 | 168,525 | |||||||||
|
| |||||||||||
ELECTRIC | 1.3% | |||||||||||
INTEGRATED ELECTRIC | 0.4% | |||||||||||
NextEra Energy |
| 2,324 | 362,985 | |||||||||
Pattern Energy Group |
| 13,334 | 286,548 | |||||||||
|
| |||||||||||
| 649,533 | ||||||||||||
|
| |||||||||||
REGULATED ELECTRIC | 0.9% | |||||||||||
Edison International |
| 8,486 | 536,655 | |||||||||
Great Plains Energy |
| 6,478 | 208,851 | |||||||||
Xcel Energy |
| 15,091 | 726,028 | |||||||||
|
| |||||||||||
| 1,471,534 | ||||||||||||
|
| |||||||||||
TOTAL ELECTRIC |
| 2,121,067 | ||||||||||
|
| |||||||||||
ENERGY | 3.4% | |||||||||||
ENERGY EQUIPMENT & SERVICES | 0.6% | |||||||||||
Halliburton Co. |
| 19,077 | 932,293 | |||||||||
|
| |||||||||||
OIL & GAS | 2.2% | |||||||||||
Anadarko Petroleum Corp. |
| 9,672 | 518,806 | |||||||||
Chevron Corp. |
| 4,466 | 559,099 | |||||||||
EOG Resources |
| 2,856 | 308,191 | |||||||||
Exxon Mobil Corp. |
| 18,158 | 1,518,735 | |||||||||
Marathon Petroleum Corp. |
| 2,115 | 139,548 | |||||||||
Pioneer Natural Resources Co. |
| 2,959 | 511,463 | |||||||||
|
| |||||||||||
| 3,555,842 | ||||||||||||
|
| |||||||||||
See accompanying notes to the consolidated financial statements.
19
COHEN & STEERS REAL ASSETS FUND, INC.
CONSOLIDATED SCHEDULE OF INVESTMENTS—(Continued)
December 31, 2017
| Number of Shares | Value | |||||||||||
OIL & GAS SERVICES | 0.6% | |||||||||||
Schlumberger Ltd. |
| 14,367 | $ | 968,192 | ||||||||
|
| |||||||||||
TOTAL ENERGY |
| 5,456,327 | ||||||||||
|
| |||||||||||
GAS DISTRIBUTION | 0.4% | |||||||||||
Atmos Energy Corp. |
| 3,992 | 342,873 | |||||||||
Southwest Gas Holdings |
| 4,866 | 391,615 | |||||||||
|
| |||||||||||
| 734,488 | ||||||||||||
|
| |||||||||||
GOLD | 3.4% | |||||||||||
iShares Gold Trust ETFa |
| 442,080 | 5,530,421 | |||||||||
|
| |||||||||||
INDUSTRIALS—MACHINERY | 0.4% | |||||||||||
Deere & Co. |
| 4,083 | 639,030 | |||||||||
|
| |||||||||||
MATERIALS | 1.6% | |||||||||||
CHEMICALS | 0.6% | |||||||||||
CF Industries Holdings |
| 9,918 | 421,912 | |||||||||
FMC Corp. |
| 6,597 | 624,472 | |||||||||
|
| |||||||||||
| 1,046,384 | ||||||||||||
|
| |||||||||||
METALS & MINING | 1.0% | |||||||||||
Alcoa Corp.a |
| 16,072 | 865,799 | |||||||||
Newmont Mining Corp. |
| 10,847 | 406,979 | |||||||||
Steel Dynamics |
| 6,909 | 297,985 | |||||||||
|
| |||||||||||
| 1,570,763 | ||||||||||||
|
| |||||||||||
TOTAL MATERIALS |
| 2,617,147 | ||||||||||
|
| |||||||||||
PIPELINES | 1.8% | |||||||||||
PIPELINES—C-CORP | 1.5% | |||||||||||
Antero Midstream GP LP |
| 18,304 | 360,955 | |||||||||
Cheniere Energya |
| 14,513 | 781,380 | |||||||||
Kinder Morgan |
| 49,106 | 887,345 | |||||||||
ONEOK |
| 2,768 | 147,950 | |||||||||
SemGroup Corp., Class A |
| 5,544 | 167,429 | |||||||||
|
| |||||||||||
| 2,345,059 | ||||||||||||
|
| |||||||||||
See accompanying notes to the consolidated financial statements.
20
COHEN & STEERS REAL ASSETS FUND, INC.
CONSOLIDATED SCHEDULE OF INVESTMENTS—(Continued)
December 31, 2017
| Number of Shares | Value | |||||||||||
PIPELINES—MLP | 0.3% | |||||||||||
Hess Midstream Partners LP |
| 8,819 | $ | 174,704 | ||||||||
MPLX LP |
| 10,055 | 356,651 | |||||||||
|
| |||||||||||
| 531,355 | ||||||||||||
|
| |||||||||||
TOTAL PIPELINES |
| 2,876,414 | ||||||||||
|
| |||||||||||
REAL ESTATE | 13.5% | |||||||||||
DATA CENTERS | 1.2% | |||||||||||
CyrusOne |
| 4,804 | 285,982 | |||||||||
Digital Realty Trust |
| 10,414 | 1,186,155 | |||||||||
Equinix |
| 997 | 451,860 | |||||||||
|
| |||||||||||
| 1,923,997 | ||||||||||||
|
| |||||||||||
HEALTH CARE | 0.7% | |||||||||||
HCP |
| 588 | 15,335 | |||||||||
Welltower |
| 17,251 | 1,100,096 | |||||||||
|
| |||||||||||
| 1,115,431 | ||||||||||||
|
| |||||||||||
HOTEL | 1.2% | |||||||||||
Hilton Worldwide Holdings |
| 6,317 | 504,476 | |||||||||
Host Hotels & Resorts |
| 47,225 | 937,416 | |||||||||
Sunstone Hotel Investors |
| 33,045 | 546,234 | |||||||||
|
| |||||||||||
| 1,988,126 | ||||||||||||
|
| |||||||||||
INDUSTRIALS | 0.7% | |||||||||||
Prologis |
| 18,939 | 1,221,755 | |||||||||
|
| |||||||||||
OFFICE | 2.0% | |||||||||||
Corporate Office Properties Trust |
| 11,208 | 327,274 | |||||||||
Cousins Properties |
| 63,873 | 590,825 | |||||||||
Douglas Emmett |
| 17,054 | 700,237 | |||||||||
Empire State Realty Trust, Class A |
| 25,598 | 525,527 | |||||||||
Kilroy Realty Corp. |
| 14,122 | 1,054,207 | |||||||||
SL Green Realty Corp. |
| 60 | 6,056 | |||||||||
|
| |||||||||||
| 3,204,126 | ||||||||||||
|
| |||||||||||
RESIDENTIAL | 3.9% | |||||||||||
APARTMENT | 2.2% | |||||||||||
Apartment Investment & Management Co., Class A |
| 15,436 | 674,708 | |||||||||
AvalonBay Communities |
| 7,008 | 1,250,297 | |||||||||
See accompanying notes to the consolidated financial statements.
21
COHEN & STEERS REAL ASSETS FUND, INC.
CONSOLIDATED SCHEDULE OF INVESTMENTS—(Continued)
December 31, 2017
| Number of Shares | Value | |||||||||||
Essex Property Trust |
| 2,550 | $ | 615,493 | ||||||||
UDR |
| 26,744 | 1,030,179 | |||||||||
|
| |||||||||||
| 3,570,677 | ||||||||||||
|
| |||||||||||
MANUFACTURED HOME | 1.1% | |||||||||||
Equity Lifestyle Properties |
| 8,370 | 745,097 | |||||||||
Sun Communities |
| 11,391 | 1,056,857 | |||||||||
|
| |||||||||||
| 1,801,954 | ||||||||||||
|
| |||||||||||
SINGLE FAMILY | 0.4% | |||||||||||
Invitation Homes |
| 24,552 | 578,691 | |||||||||
|
| |||||||||||
STUDENT HOUSING | 0.2% | |||||||||||
American Campus Communities |
| 9,223 | 378,420 | |||||||||
|
| |||||||||||
TOTAL RESIDENTIAL |
| 6,329,742 | ||||||||||
|
| |||||||||||
SELF STORAGE | 1.1% | |||||||||||
Extra Space Storage |
| 14,562 | 1,273,447 | |||||||||
Life Storage |
| 6,519 | 580,647 | |||||||||
|
| |||||||||||
| 1,854,094 | ||||||||||||
|
| |||||||||||
SHOPPING CENTERS | 2.6% | |||||||||||
COMMUNITY CENTER | 0.6% | |||||||||||
Weingarten Realty Investors |
| 30,344 | 997,407 | |||||||||
|
| |||||||||||
FREE STANDING | 0.9% | |||||||||||
Realty Income Corp. |
| 23,419 | 1,335,352 | |||||||||
|
| |||||||||||
REGIONAL MALL | 1.1% | |||||||||||
GGP |
| 24,849 | 581,218 | |||||||||
Simon Property Group |
| 7,146 | 1,227,254 | |||||||||
|
| |||||||||||
| 1,808,472 | ||||||||||||
|
| |||||||||||
TOTAL SHOPPING CENTERS |
| 4,141,231 | ||||||||||
|
| |||||||||||
SPECIALTY | 0.1% | |||||||||||
GEO Group/The |
| 5,717 | 134,921 | |||||||||
|
| |||||||||||
TOTAL REAL ESTATE |
| 21,913,423 | ||||||||||
|
| |||||||||||
See accompanying notes to the consolidated financial statements.
22
COHEN & STEERS REAL ASSETS FUND, INC.
CONSOLIDATED SCHEDULE OF INVESTMENTS—(Continued)
December 31, 2017
| Number of Shares | Value | |||||||||||
WATER | 0.4% | |||||||||||
American Water Works Co. |
| 7,894 | $ | 722,222 | ||||||||
|
| |||||||||||
TOTAL UNITED STATES |
| 49,151,146 | ||||||||||
|
| |||||||||||
TOTAL COMMON STOCK |
| 98,933,872 | ||||||||||
|
| |||||||||||
PREFERRED SECURITIES—$25 PAR VALUE | 0.3% | |||||||||||
UNITED STATES | ||||||||||||
BANKS | ||||||||||||
GMAC Capital Trust I, 7.201%, due 2/15/40, Series 2 |
| 19,254 | 499,641 | |||||||||
|
| |||||||||||
TOTAL PREFERRED SECURITIES—$25 PAR VALUE |
| 499,641 | ||||||||||
|
| |||||||||||
| Principal Amount | ||||||||||||
PREFERRED SECURITIES—CAPITAL SECURITIES | 7.9% | |||||||||||
CAYMAN ISLANDS | 0.9% | |||||||||||
BANKS—FOREIGN | 0.5% | |||||||||||
SMFG Preferred Capital, 9.50% to 7/25/18, 144A (USD)b,d,e |
| $ | 700,000 | 727,631 | ||||||||
|
| |||||||||||
INTEGRATED TELECOMMUNICATIONS SERVICES | 0.4% | |||||||||||
Centaur Funding Corp., 9.08%, due 4/21/20, 144A (USD)b |
| 593 | † | 677,775 | ||||||||
|
| |||||||||||
TOTAL CAYMAN ISLANDS |
| 1,405,406 | ||||||||||
|
| |||||||||||
FRANCE | 0.5% | |||||||||||
BANKS—FOREIGN | 0.3% | |||||||||||
Credit Agricole SA, 8.375% to 10/13/19, 144A (USD)b,d,e |
| 400,000 | 438,000 | |||||||||
|
| |||||||||||
INSURANCE—LIFE/HEALTH INSURANCE—FOREIGN | 0.2% | |||||||||||
CNP Assurances, 7.50% to 10/18/2018 (USD)d,e |
| 400,000 | 415,699 | |||||||||
|
| |||||||||||
TOTAL FRANCE |
| 853,699 | ||||||||||
|
| |||||||||||
JAPAN | 0.5% | |||||||||||
INSURANCE—LIFE/HEALTH INSURANCE—FOREIGN | ||||||||||||
Dai-ichi Life Insurance Co. Ltd., 7.25% to 7/25/21, 144A (USD)b,d,e |
| 750,000 | 847,500 | |||||||||
|
| |||||||||||
NETHERLANDS | 0.6% | |||||||||||
BANKS—FOREIGN | ||||||||||||
Rabobank Nederland, 11.00% to 6/30/19, 144A (USD)b,d,e |
| 900,000 | 1,009,125 | |||||||||
|
| |||||||||||
See accompanying notes to the consolidated financial statements.
23
COHEN & STEERS REAL ASSETS FUND, INC.
CONSOLIDATED SCHEDULE OF INVESTMENTS—(Continued)
December 31, 2017
| Principal Amount | Value | |||||||||||
SWITZERLAND | 0.5% | |||||||||||
INSURANCE—REINSURANCE—FOREIGN | ||||||||||||
Aquarius + Investments PLC, 8.25% to 9/1/18, |
| $ | 750,000 | $ | 777,924 | |||||||
|
| |||||||||||
UNITED KINGDOM | 0.2% | |||||||||||
INSURANCE—LIFE/HEALTH INSURANCE—FOREIGN | ||||||||||||
Friends Life Holdings PLC, 7.875% to 11/8/2018 (USD)d,e |
| 300,000 | 314,723 | |||||||||
|
| |||||||||||
UNITED STATES | 4.7% | |||||||||||
BANKS | 0.8% | |||||||||||
Citigroup, 6.125% to 11/15/20, Series Rd,e |
| 290,000 | 308,850 | |||||||||
Goldman Sachs Group/The, 3.128%, due 10/28/27, |
| 175,000 | 185,260 | |||||||||
PNC Financial Services Group, 6.75% to 8/1/21d,e |
| 425,000 | 472,302 | |||||||||
Wells Fargo & Co., 7.98% to 3/15/18, Series Kd,e |
| 350,000 | 356,108 | |||||||||
|
| |||||||||||
| 1,322,520 | ||||||||||||
|
| |||||||||||
ELECTRIC—INTEGRATED | 0.4% | |||||||||||
Dominion Energy, 2.50%, due 12/1/19 |
| 135,000 | 135,267 | |||||||||
Emera US Finance LP, 2.15%, due 6/15/19 |
| 424,000 | 422,501 | |||||||||
|
| |||||||||||
| 557,768 | ||||||||||||
|
| |||||||||||
FINANCIAL | 0.7% | |||||||||||
CREDIT CARD | 0.1% | |||||||||||
American Express Credit Corp., 2.375%, |
| 150,000 | 149,878 | |||||||||
|
| |||||||||||
DIVERSIFIED FINANCIAL SERVICES | 0.6% | |||||||||||
Caterpillar Financial Services Corp., 1.85%, |
| 100,000 | 98,871 | |||||||||
Daimler Finance North America LLC, 2.20%, due 5/5/20, 144Ab |
| 250,000 | 248,665 | |||||||||
Ford Motor Credit Co. LLC,, 2.343%, due 11/2/20 |
| 200,000 | 198,237 | |||||||||
General Motors Financial Co., 2.909%, due 1/14/22, |
| 100,000 | 102,486 | |||||||||
General Motors Financial Co., 2.234%, due 4/13/20, |
| 188,000 | 189,944 | |||||||||
Morgan Stanley, 5.55% to 7/15/20, Series Jd,e |
| 200,000 | 208,000 | |||||||||
|
| |||||||||||
| 1,046,203 | ||||||||||||
|
| |||||||||||
TOTAL FINANCIAL |
| 1,196,081 | ||||||||||
|
| |||||||||||
See accompanying notes to the consolidated financial statements.
24
COHEN & STEERS REAL ASSETS FUND, INC.
CONSOLIDATED SCHEDULE OF INVESTMENTS—(Continued)
December 31, 2017
| Principal Amount | Value | |||||||||||
INSURANCE | 0.6% | |||||||||||
LIFE/HEALTH INSURANCE | 0.4% | |||||||||||
Metropolitan Life Global Funding I, 1.95%, due 9/15/21, 144Ab |
| $ | 250,000 | $ | 245,013 | |||||||
Prudential Financial, 8.875% to 6/15/18, due 6/15/38e |
| 364,000 | 374,829 | |||||||||
|
| |||||||||||
| 619,842 | ||||||||||||
|
| |||||||||||
MULTI-LINE | 0.2% | |||||||||||
Hartford Financial Services Group/The, 8.125% to 6/15/18, due 6/15/38e |
| 300,000 | 308,250 | |||||||||
|
| |||||||||||
TOTAL INSURANCE |
| 928,092 | ||||||||||
|
| |||||||||||
INTEGRATED TELECOMMUNICATIONS SERVICES | 0.1% | |||||||||||
Verizon Communications, 3.45%, due 3/15/21 |
| 150,000 | 154,689 | |||||||||
|
| |||||||||||
PIPELINES | 0.1% | |||||||||||
Enterprise Products Operating LLC, 5.25%, due 1/31/20 |
| 150,000 | 158,454 | |||||||||
|
| |||||||||||
REAL ESTATE | 2.0% | |||||||||||
DIVERSIFIED | 0.3% | |||||||||||
VEREIT, 3.00%, due 8/1/18, (Convertible) |
| 550,000 | 550,687 | |||||||||
|
| |||||||||||
FINANCE | 0.3% | |||||||||||
iStar, 6.50%, due 7/1/21 |
| 200,000 | 208,250 | |||||||||
Ventas Realty LP/Ventas Capital Corp., 4.00%, due 4/30/19 |
| 245,000 | 249,522 | |||||||||
|
| |||||||||||
| 457,772 | ||||||||||||
|
| |||||||||||
HEALTH CARE | 0.7% | |||||||||||
HCP, 2.625%, due 2/1/20 |
| 750,000 | 753,024 | |||||||||
Senior Housing Properties Trust, 3.25%, due 5/1/19 |
| 200,000 | 201,122 | |||||||||
Welltower, 4.125%, due 4/1/19 |
| 100,000 | 101,808 | |||||||||
|
| |||||||||||
| 1,055,954 | ||||||||||||
|
| |||||||||||
SPECIALTY | 0.7% | |||||||||||
Digital Realty Trust LP, 5.25%, due 3/15/21 |
| 550,000 | 590,460 | |||||||||
Digital Realty Trust LP, 5.875%, due 2/1/20 |
| 100,000 | 106,108 | |||||||||
Digital Realty Trust LP, 3.40%, due 10/1/20 |
| 500,000 | 510,199 | |||||||||
|
| |||||||||||
| 1,206,767 | ||||||||||||
|
| |||||||||||
TOTAL REAL ESTATE |
| 3,271,180 | ||||||||||
|
| |||||||||||
TOTAL UNITED STATES |
| 7,588,784 | ||||||||||
|
| |||||||||||
TOTAL PREFERRED SECURITIES—CAPITAL SECURITIES |
| 12,797,161 | ||||||||||
|
| |||||||||||
See accompanying notes to the consolidated financial statements.
25
COHEN & STEERS REAL ASSETS FUND, INC.
CONSOLIDATED SCHEDULE OF INVESTMENTS—(Continued)
December 31, 2017
| Principal Amount | Value | |||||||||||
CORPORATE BONDS | 1.5% | |||||||||||
CAYMAN ISLANDS | 0.1% | |||||||||||
INSURANCE | ||||||||||||
XLIT Ltd., 2.30%, due 12/15/18 (USD) |
| $ | 100,000 | $ | 99,998 | |||||||
|
| |||||||||||
UNITED KINGDOM | 0.2% | |||||||||||
BANKS—FOREIGN | ||||||||||||
HSBC Holdings PLC, 2.801%, due 1/5/22, (FRN) (USD) (3 Month US LIBOR + 1.500%)c |
| 300,000 | 310,332 | |||||||||
|
| |||||||||||
UNITED STATES | 1.2% | |||||||||||
ELECTRIC—REGULATED ELECTRIC | 0.2% | |||||||||||
Southern Co./The, 2.15%, due 9/1/19 |
| 300,000 | 299,225 | |||||||||
|
| |||||||||||
FINANCIAL—DIVERSIFIED FINANCIAL SERVICES | 0.1% | |||||||||||
General Motors Financial Co, 2.40%, due 5/9/19 |
| 200,000 | 200,115 | |||||||||
|
| |||||||||||
REAL ESTATE | 0.7% | |||||||||||
DIVERSIFIED | 0.3% | |||||||||||
WEA Finance LLC, 2.70%, due 9/17/19, 144Ab |
| 435,000 | 437,521 | |||||||||
|
| |||||||||||
FINANCE | 0.3% | |||||||||||
VEREIT Operating Partnership LP, 3.00%, due 2/6/19 |
| 500,000 | 502,537 | |||||||||
|
| |||||||||||
SHOPPING CENTERS | 0.1% | |||||||||||
Kimco Realty Corp., 6.875%, due 10/1/19 |
| 250,000 | 268,800 | |||||||||
|
| |||||||||||
TOTAL REAL ESTATE |
| 1,208,858 | ||||||||||
|
| |||||||||||
UTILITIES—INTEGRATED ELECTRIC | 0.2% | |||||||||||
Progress Energy, 4.875%, due 12/1/19 |
| 350,000 | 366,261 | |||||||||
|
| |||||||||||
TOTAL UNITED STATES |
| 2,074,459 | ||||||||||
|
| |||||||||||
TOTAL CORPORATE BONDS |
| 2,484,789 | ||||||||||
|
| |||||||||||
U.S. TREASURY INFLATION-PROTECTED SECURITIES | 1.7% | |||||||||||
U.S. Treasury Inflation Indexed Bonds, 1.875%, |
| 635,393 | 655,278 | |||||||||
U.S. Treasury Inflation Indexed Bonds, 1.375%, |
| 941,061 | 965,962 | |||||||||
U.S. Treasury Inflation Indexed Bonds, 1.25%, |
| 1,131,060 | 1,168,081 | |||||||||
|
| |||||||||||
TOTAL U.S. TREASURY INFLATION-PROTECTED SECURITIES |
| 2,789,321 | ||||||||||
|
| |||||||||||
See accompanying notes to the consolidated financial statements.
26
COHEN & STEERS REAL ASSETS FUND, INC.
CONSOLIDATED SCHEDULE OF INVESTMENTS—(Continued)
December 31, 2017
| Number of Shares | Value | |||||||||||
SHORT-TERM INVESTMENTS | 26.6% | |||||||||||
MONEY MARKET FUNDS | 7.3% | |||||||||||
State Street Institutional Treasury Money Market Fund, Premier Class, 1.15%f |
| 11,823,028 | $ | 11,823,028 | ||||||||
|
| |||||||||||
| Principal Amount | ||||||||||||
U.S. TREASURY BILLS | 19.3% | |||||||||||
U.S. Treasury Bills, 1.06%, due 1/18/18g,h |
| $ | 9,610,000 | 9,605,178 | ||||||||
U.S. Treasury Bills, 1.22%, due 2/8/18g |
| 10,000,000 | 9,987,147 | |||||||||
U.S. Treasury Bills, 1.265%, due 3/1/18g |
| 11,640,000 | 11,616,230 | |||||||||
|
| |||||||||||
| 31,208,555 | ||||||||||||
|
| |||||||||||
TOTAL SHORT-TERM INVESTMENTS |
| 43,031,583 | ||||||||||
|
| |||||||||||
TOTAL INVESTMENTSIN SECURITIES | 99.1 | % | 160,536,367 | |||||||||
OTHER ASSETSIN EXCESSOF LIABILITIESi | 0.9 | 1,414,063 | ||||||||||
|
|
|
| |||||||||
NET ASSETS | 100.0 | % | $ | 161,950,430 | ||||||||
|
|
|
| |||||||||
See accompanying notes to the consolidated financial statements.
27
COHEN & STEERS REAL ASSETS FUND, INC.
CONSOLIDATED SCHEDULE OF INVESTMENTS—(Continued)
December 31, 2017
Glossary of Portfolio Abbreviations
ADR | American Depositary Receipt | |
ETF | Exchange-Traded Fund | |
FRN | Floating Rate Note | |
GBP | Great British Pound | |
HKD | Hong Kong Dollar | |
LIBOR | London Interbank Offered Rate | |
MLP | Master Limited Partnership | |
REIT | Real Estate Investment Trust | |
TruPS | Trust Preferred Securities | |
USD | United States Dollar |
Note: Percentages indicated are based on the net assets of the Fund.
| † | Represents shares. |
| a | Non-income producing security. |
| b | Resale is restricted to qualified institutional investors. Aggregate holdings amounted to $7,375,331 or 4.6% of the net assets of the Fund, of which 0.0% are illiquid. |
| c | Variable rate. Rate shown is in effect at December 31, 2017. |
| d | Perpetual security. Perpetual securities have no stated maturity date, but they may be called/redeemed by the issuer. The date indicated, if any, represents the next call date. |
| e | Security converts to floating rate after the indicated fixed-rate coupon period. |
| f | Rate quoted represents the annualized seven-day yield of the fund. |
| g | The rate shown is the effective yield on the date of purchase. |
| h | All or a portion of this security has been pledged as collateral for futures contracts. $3,016,486 in aggregate has been pledged as collateral to Morgan Stanley & Co. LLC. |
| i | Other assets in excess of liabilities include unrealized appreciation/depreciation on open futures contracts at December 31, 2017. |
See accompanying notes to the consolidated financial statements.
28
COHEN & STEERS REAL ASSETS FUND, INC.
CONSOLIDATED SCHEDULE OF INVESTMENTS—(Continued)
December 31, 2017
Futures contracts
| Description | Number of Contracts | Expiration Date | Notional Amount | Notional Value | Unrealized Appreciation (Depreciation) | |||||||||||
LONG FUTURES OUTSTANDING | ||||||||||||||||
| Aluminum HG LME | 69 | January 15, 2018 | $ | 3,715,198 | $ | 3,895,481 | $ | 180,283 | ||||||||
| Aluminum HG LME | 55 | March 19, 2018 | 3,134,480 | 3,123,312 | (11,168 | ) | ||||||||||
| Brent Crude Oila | 52 | January 31, 2018 | 3,289,995 | 3,477,240 | 187,245 | |||||||||||
| Coffee C | 38 | March 19, 2018 | 1,852,423 | 1,798,350 | (54,073 | ) | ||||||||||
| Copper | 32 | March 27, 2018 | 2,495,900 | 2,640,400 | 144,500 | |||||||||||
| Corn | 188 | March 14, 2018 | 3,330,034 | 3,297,050 | (32,984 | ) | ||||||||||
| Gasoline RBOB | 39 | February 28, 2018 | 2,873,178 | 2,970,186 | 97,008 | |||||||||||
| Gold | 23 | February 26, 2018 | 2,957,181 | 3,011,390 | 54,209 | |||||||||||
| KC Wheat | 38 | March 14, 2018 | 838,767 | 811,775 | (26,992 | ) | ||||||||||
| Light Sweet Crude Oil | 59 | February 20, 2018 | 3,291,676 | 3,565,960 | 274,284 | |||||||||||
| Live Cattle | 43 | February 28, 2018 | 2,199,230 | 2,090,660 | (108,570 | ) | ||||||||||
| Natural Gas | 112 | February 26, 2018 | 3,070,935 | 3,254,720 | 183,785 | |||||||||||
| Nickel LME | 31 | January 15, 2018 | 2,058,202 | 2,364,804 | 306,602 | |||||||||||
| Nickel LME | 30 | March 19, 2018 | 2,002,960 | 2,296,800 | 293,840 | |||||||||||
| NY Harbor ULSD | 3 | February 28, 2018 | 239,100 | 257,518 | 18,418 | |||||||||||
| NY Harbor ULSD | 7 | May 31, 2018 | 560,342 | 581,591 | 21,249 | |||||||||||
| Platinum | 13 | April 26, 2018 | 577,676 | 609,895 | 32,219 | |||||||||||
| Silver | 18 | March 27, 2018 | 1,527,331 | 1,543,050 | 15,719 | |||||||||||
| Silver | 10 | May 29, 2018 | 819,767 | 861,050 | 41,283 | |||||||||||
| Soybean | 65 | March 14, 2018 | 3,244,830 | 3,125,687 | (119,143 | ) | ||||||||||
| Soybean Meal | 48 | March 14, 2018 | 1,611,831 | 1,520,640 | (91,191 | ) | ||||||||||
| Soybean Oil | 29 | March 14, 2018 | 585,963 | 578,724 | (7,239 | ) | ||||||||||
| Sugar 11 | 90 | February 28, 2018 | 1,488,637 | 1,528,128 | 39,491 | |||||||||||
| Wheat | 59 | March 14, 2018 | 1,313,003 | 1,259,650 | (53,353 | ) | ||||||||||
| Zinc LME | 30 | January 15, 2018 | 2,424,978 | 2,501,250 | 76,272 | |||||||||||
| Zinc LME | 30 | March 19, 2018 | 2,344,939 | 2,494,125 | 149,186 | |||||||||||
| Zinc LME | 17 | May 14, 2018 | 1,349,288 | 1,407,388 | 58,100 | |||||||||||
| Zinc LME | 17 | December 17, 2018 | 1,268,039 | 1,376,150 | 108,111 | |||||||||||
See accompanying notes to the consolidated financial statements.
29
COHEN & STEERS REAL ASSETS FUND, INC.
CONSOLIDATED SCHEDULE OF INVESTMENTS—(Continued)
December 31, 2017
Futures contracts—(Continued)
| Description | Number of Contracts | Expiration Date | Notional Amount | Notional Value | Unrealized Appreciation (Depreciation) | |||||||||||
SHORT FUTURES OUTSTANDING | ||||||||||||||||
| Aluminum HG LME | 69 | January 15, 2018 | $ | (3,836,408 | ) | $ | (3,895,481 | ) | $ | (59,073 | ) | |||||
| Brent Crude Oila | 20 | October 31, 2018 | (1,215,037 | ) | (1,272,800 | ) | (57,763 | ) | ||||||||
| Cotton No. 2 | 24 | March 7, 2018 | (827,789 | ) | (943,560 | ) | (115,771 | ) | ||||||||
| Feeder Cattlea | 16 | March 29, 2018 | (1,155,939 | ) | (1,141,400 | ) | 14,539 | |||||||||
| Gold | 6 | June 27, 2018 | (771,222 | ) | (791,220 | ) | (19,998 | ) | ||||||||
| Lean Hogsa | 12 | February 14, 2018 | (327,686 | ) | (344,520 | ) | (16,834 | ) | ||||||||
| Nickel LME | 31 | January 15, 2018 | (2,109,550 | ) | (2,364,804 | ) | (255,254 | ) | ||||||||
| Palladium | 6 | March 27, 2018 | (597,468 | ) | (636,600 | ) | (39,132 | ) | ||||||||
| Soybean | 21 | July 13, 2018 | (1,061,301 | ) | (1,032,413 | ) | 28,888 | |||||||||
| Zinc LME | 30 | January 15, 2018 | (2,339,259 | ) | (2,501,250 | ) | (161,991 | ) | ||||||||
| Zinc LME | 17 | May 14, 2018 | (1,297,198 | ) | (1,407,387 | ) | (110,189 | ) | ||||||||
| Zinc LME | 17 | December 17, 2018 | (1,304,224 | ) | (1,376,150 | ) | (71,926 | ) | ||||||||
|
| |||||||||||||||
| $ | 912,587 | |||||||||||||||
|
| |||||||||||||||
| a | Futures contracts are cash settled based upon the price of the underlying commodity. |
Glossary of Portfolio Abbreviations
HG | High Grade | |
LME | London Metal Exchange | |
RBOB | Reformulated Gasoline Blendstock for Oxygen Blending | |
ULSD | Ultra Low Sulfur Diesel |
See accompanying notes to the consolidated financial statements.
30
COHEN & STEERS REAL ASSETS FUND, INC.
CONSOLIDATED STATEMENT OF ASSETS AND LIABILITIES
December 31, 2017
ASSETS: |
| |||
Investments in securities, at value (Identified cost—$145,967,496) | $ | 160,536,367 | ||
Foreign currency, at value (Identified cost—$57,487) | 58,039 | |||
Receivable for: | ||||
Variation margin on futures contracts | 691,037 | |||
Dividends and interest | 568,530 | |||
Fund shares sold | 360,545 | |||
Investment securities sold | 157,759 | |||
Other assets | 1,618 | |||
|
| |||
Total Assets | 162,373,895 | |||
|
| |||
LIABILITIES: |
| |||
Payable for: | ||||
Investment securities purchased | 84,804 | |||
Investment advisory fees | 51,370 | |||
Fund shares redeemed | 50,854 | |||
Shareholder servicing fees | 25,287 | |||
Administration fees | 10,632 | |||
Distribution fees | 1,323 | |||
Directors’ fees | 85 | |||
Other liabilities | 199,110 | |||
|
| |||
Total Liabilities | 423,465 | |||
|
| |||
NET ASSETS | $ | 161,950,430 | ||
|
| |||
NET ASSETS consist of: |
| |||
Paid-in capital | $ | 154,997,860 | ||
Dividends in excess of net investment income | (563,845 | ) | ||
Accumulated net realized loss | (7,966,318 | ) | ||
Net unrealized appreciation | 15,482,733 | |||
|
| |||
| $ | 161,950,430 | |||
|
| |||
See accompanying notes to the consolidated financial statements.
31
COHEN & STEERS REAL ASSETS FUND, INC.
CONSOLIDATED STATEMENT OF ASSETS AND LIABILITIES—(Continued)
December 31, 2017
CLASS A SHARES: |
| |||
NET ASSETS | $ | 28,524,237 | ||
Shares issued and outstanding ($0.001 par value common stock outstanding) | 3,122,241 | |||
|
| |||
Net asset value and redemption price per share | $ | 9.14 | ||
|
| |||
Maximum offering price per share ($9.14 ÷ 0.955)a | $ | 9.57 | ||
|
| |||
CLASS C SHARES: |
| |||
NET ASSETS | $ | 6,576,145 | ||
Shares issued and outstanding ($0.001 par value common stock outstanding) | 721,407 | |||
|
| |||
Net asset value, offering and redemption price per shareb | $ | 9.12 | ||
|
| |||
CLASS I SHARES: |
| |||
NET ASSETS | $ | 124,719,257 | ||
Shares issued and outstanding ($0.001 par value common stock outstanding) | 13,621,803 | |||
|
| |||
Net asset value, offering and redemption price per share | $ | 9.16 | ||
|
| |||
CLASS R SHARES: |
| |||
NET ASSETS | $ | 89,456 | ||
Shares issued and outstanding ($0.001 par value common stock outstanding) | 9,702 | |||
|
| |||
Net asset value, offering and redemption price per share | $ | 9.22 | ||
|
| |||
CLASS Z SHARES: |
| |||
NET ASSETS | $ | 2,041,335 | ||
Shares issued and outstanding ($0.001 par value common stock outstanding) | 223,373 | |||
|
| |||
Net asset value, offering and redemption price per share | $ | 9.14 | ||
|
| |||
| a | On investments of $100,000 or more, the offering price is reduced. |
| b | Redemption price per share is equal to the net asset value per share less any applicable contingent deferred sales charge of 1.00% on shares held for less than one year. |
See accompanying notes to the consolidated financial statements.
32
COHEN & STEERS REAL ASSETS FUND, INC.
CONSOLIDATED STATEMENT OF OPERATIONS
For the Year Ended December 31, 2017
Investment Income: | ||||
Dividend income (net of $130,777 of foreign withholding tax) | $ | 2,848,002 | ||
Interest income | 796,298 | |||
|
| |||
Total Investment Income | 3,644,300 | |||
|
| |||
Expenses: | ||||
Investment management fees | 1,315,037 | |||
Administration fees | 211,649 | |||
Custodian fees and expenses | 181,169 | |||
Professional fees | 130,952 | |||
Shareholder servicing fees—Class A | 15,202 | |||
Shareholder servicing fees—Class C | 19,292 | |||
Shareholder servicing fees—Class I | 86,565 | |||
Distribution fees—Class A | 61,651 | |||
Distribution fees—Class C | 57,876 | |||
Distribution fees—Class R | 1,047 | |||
Registration and filing fees | 92,385 | |||
Shareholder reporting expenses | 65,384 | |||
Transfer agent fees and expenses | 44,177 | |||
Directors’ fees and expenses | 29,640 | |||
Interest expense | 2,201 | |||
Miscellaneous | 25,867 | |||
|
| |||
Total Expenses | 2,340,094 | |||
Reduction of Expenses (See Note 2) | (782,322 | ) | ||
|
| |||
Net Expenses | 1,557,772 | |||
|
| |||
Net Investment Income (Loss) | 2,086,528 | |||
|
| |||
Net Realized and Unrealized Gain (Loss): | ||||
Net realized gain (loss) on: | ||||
Investments in securities | 2,912,607 | |||
Futures contracts | (4,015,792 | ) | ||
Written option contracts | 10,326 | |||
Foreign currency transactions | (13,980 | ) | ||
|
| |||
Net realized gain (loss) | (1,106,839 | ) | ||
|
| |||
Net change in unrealized appreciation (depreciation) on: | ||||
Investments in securities | 8,307,913 | |||
Futures contracts | 407,747 | |||
Foreign currency translations | 4,020 | |||
|
| |||
Net change in unrealized appreciation (depreciation) | 8,719,680 | |||
|
| |||
Net Realized and Unrealized Gain (Loss) | 7,612,841 | |||
|
| |||
Net Increase (Decrease) in Net Assets Resulting from Operations | $ | 9,699,369 | ||
|
|
See accompanying notes to the consolidated financial statements.
33
COHEN & STEERS REAL ASSETS FUND, INC.
CONSOLIDATED STATEMENT OF CHANGES IN NET ASSETS
| For the Year Ended December 31, 2017 | For the Year Ended December 31, 2016 | |||||||
Change in Net Assets: | ||||||||
From Operations: | ||||||||
Net investment income (loss) | $ | 2,086,528 | $ | 1,488,057 | ||||
Net realized gain (loss) | (1,106,839 | ) | 5,351,002 | |||||
Net change in unrealized appreciation (depreciation) | 8,719,680 | 7,961,128 | ||||||
|
|
|
| |||||
Net increase (decrease) in net assets resulting from operations | 9,699,369 | 14,800,187 | ||||||
|
|
|
| |||||
Dividends and Distributions to Shareholders from: | ||||||||
Net investment income: | ||||||||
Class A | (423,066 | ) | (283,447 | ) | ||||
Class C | (51,015 | ) | (136,016 | ) | ||||
Class I | (2,302,257 | ) | (3,527,682 | ) | ||||
Class R | (2,931 | ) | (3,892 | ) | ||||
Class Z | (38,491 | ) | (54,026 | ) | ||||
Return of capital: | ||||||||
Class A | — | (28,455 | ) | |||||
Class C | — | (13,655 | ) | |||||
Class I | — | (354,144 | ) | |||||
Class R | — | (391 | ) | |||||
Class Z | — | (5,423 | ) | |||||
|
|
|
| |||||
Total dividends and distributions to shareholders | (2,817,760 | ) | (4,407,131 | ) | ||||
|
|
|
| |||||
Capital Stock Transactions: | ||||||||
Increase (decrease) in net assets from Fund share transactions | (12,433,932 | ) | 46,057,580 | |||||
|
|
|
| |||||
Total increase (decrease) in net assets | (5,552,323 | ) | 56,450,636 | |||||
Net Assets: | ||||||||
Beginning of year | 167,502,753 | 111,052,117 | ||||||
|
|
|
| |||||
End of yeara | $ | 161,950,430 | $ | 167,502,753 | ||||
|
|
|
| |||||
| a | Includes dividends in excess of net investment income of $563,845 and $223,381, respectively. |
See accompanying notes to the consolidated financial statements.
34
COHEN & STEERS REAL ASSETS FUND, INC.
CONSOLIDATED FINANCIAL HIGHLIGHTS
The following tables include selected data for a share outstanding throughout each year and other performance information derived from the consolidated financial statements. It should be read in conjunction with the consolidated financial statements and notes thereto.
| Class A | ||||||||||||||||||||
| For the Year Ended December 31, | ||||||||||||||||||||
Per Share Operating Performance: | 2017 | 2016 | 2015 | 2014 | 2013 | |||||||||||||||
Net asset value, beginning of year | $ | 8.73 | $ | 7.99 | $ | 9.42 | $ | 9.62 | $ | 10.03 | ||||||||||
|
|
|
|
|
|
|
|
|
| |||||||||||
Income (loss) from investment operations: | ||||||||||||||||||||
Net investment income (loss)a | 0.09 | 0.05 | 0.08 | 0.08 | 0.06 | |||||||||||||||
Net realized and unrealized gain (loss) | 0.46 | 0.91 | (1.37 | ) | (0.18 | ) | (0.39 | ) | ||||||||||||
|
|
|
|
|
|
|
|
|
| |||||||||||
Total from investment operations | 0.55 | 0.96 | (1.29 | ) | (0.10 | ) | (0.33 | ) | ||||||||||||
|
|
|
|
|
|
|
|
|
| |||||||||||
Less dividends and distributions to shareholders from: | ||||||||||||||||||||
Net investment income | (0.14 | ) | (0.20 | ) | (0.12 | ) | (0.08 | ) | (0.06 | ) | ||||||||||
Net realized gain | — | — | — | (0.01 | ) | — | ||||||||||||||
Return of capital | — | (0.02 | ) | (0.02 | ) | (0.01 | ) | (0.02 | ) | |||||||||||
|
|
|
|
|
|
|
|
|
| |||||||||||
Total dividends and distributions to shareholders | (0.14 | ) | (0.22 | ) | (0.14 | ) | (0.10 | ) | (0.08 | ) | ||||||||||
|
|
|
|
|
|
|
|
|
| |||||||||||
Net increase (decrease) in net asset value | 0.41 | 0.74 | (1.43 | ) | (0.20 | ) | (0.41 | ) | ||||||||||||
|
|
|
|
|
|
|
|
|
| |||||||||||
Net asset value, end of year | $ | 9.14 | $ | 8.73 | $ | 7.99 | $ | 9.42 | $ | 9.62 | ||||||||||
|
|
|
|
|
|
|
|
|
| |||||||||||
Total investment returnb,c | 6.33 | % | 11.99 | % | –13.80 | % | –1.07 | % | –3.22 | % | ||||||||||
|
|
|
|
|
|
|
|
|
| |||||||||||
Ratios/Supplemental Data: | ||||||||||||||||||||
Net assets, end of year (in millions) | $ | 28.5 | $ | 12.9 | $ | 13.2 | $ | 19.7 | $ | 17.8 | ||||||||||
|
|
|
|
|
|
|
|
|
| |||||||||||
Ratio of expenses to average daily net assets (before expense reduction) | 1.51 | % | 1.69 | % | 1.63 | % | 1.74 | % | 2.13 | % | ||||||||||
|
|
|
|
|
|
|
|
|
| |||||||||||
Ratio of expenses to average daily net assets (net of expense reduction) | 1.11 | % | 1.24 | % | 1.20 | % | 1.35 | % | 1.35 | % | ||||||||||
|
|
|
|
|
|
|
|
|
| |||||||||||
Ratio of net investment income (loss) to average daily net assets (before expense reduction) | 0.62 | 0.18 | % | 0.43 | % | 0.42 | % | (0.21 | )% | |||||||||||
|
|
|
|
|
|
|
|
|
| |||||||||||
Ratio of net investment income (loss) to average daily net assets (net of expense reduction) | 1.02 | 0.63 | % | 0.86 | % | 0.81 | % | 0.57 | % | |||||||||||
|
|
|
|
|
|
|
|
|
| |||||||||||
Portfolio turnover rated | 124 | % | 118 | % | 101 | % | 96 | % | 145 | % | ||||||||||
|
|
|
|
|
|
|
|
|
| |||||||||||
| a | Calculation based on average shares outstanding. |
| b | Return assumes the reinvestment of all dividends and distributions at net asset value. |
| c | Does not reflect sales charges, which would reduce return. |
| d | The Fund’s portfolio turnover rate is calculated in accordance with regulatory requirements, without regard to transactions involving short-term investments and certain derivatives. If such transactions were included, the Fund’s portfolio turnover rate would be higher. |
See accompanying notes to the consolidated financial statements.
35
COHEN & STEERS REAL ASSETS FUND, INC.
CONSOLIDATED FINANCIAL HIGHLIGHTS—(Continued)
| Class C | ||||||||||||||||||||
| For the Year Ended December 31, | ||||||||||||||||||||
Per Share Operating Performance: | 2017 | 2016 | 2015 | 2014 | 2013 | |||||||||||||||
Net asset value, beginning of year | $ | 8.71 | $ | 7.97 | $ | 9.38 | $ | 9.60 | $ | 10.00 | ||||||||||
|
|
|
|
|
|
|
|
|
| |||||||||||
Income (loss) from investment operations: | ||||||||||||||||||||
Net investment income (loss)a | 0.02 | (0.01 | ) | 0.00 | b | 0.00 | b | (0.01 | ) | |||||||||||
Net realized and unrealized gain (loss) | 0.46 | 0.91 | (1.35 | ) | (0.16 | ) | (0.37 | ) | ||||||||||||
|
|
|
|
|
|
|
|
|
| |||||||||||
Total from investment operations | 0.48 | 0.90 | (1.35 | ) | (0.16 | ) | (0.38 | ) | ||||||||||||
|
|
|
|
|
|
|
|
|
| |||||||||||
Less dividends and distributions to shareholders from: | ||||||||||||||||||||
Net investment income | (0.07 | ) | (0.14 | ) | (0.05 | ) | (0.04 | ) | (0.00 | )b | ||||||||||
Net realized gain | — | — | — | (0.01 | ) | — | ||||||||||||||
Return of capital | — | (0.02 | ) | (0.01 | ) | (0.01 | ) | (0.02 | ) | |||||||||||
|
|
|
|
|
|
|
|
|
| |||||||||||
Total dividends and distributions to shareholders | (0.07 | ) | (0.16 | ) | (0.06 | ) | (0.06 | ) | (0.02 | ) | ||||||||||
|
|
|
|
|
|
|
|
|
| |||||||||||
Net increase (decrease) in net asset value | 0.41 | 0.74 | (1.41 | ) | (0.22 | ) | (0.40 | ) | ||||||||||||
|
|
|
|
|
|
|
|
|
| |||||||||||
Net asset value, end of year | $ | 9.12 | $ | 8.71 | $ | 7.97 | $ | 9.38 | $ | 9.60 | ||||||||||
|
|
|
|
|
|
|
|
|
| |||||||||||
Total investment returnc,d | 5.48 | % | 11.28 | % | –14.46 | % | –1.74 | % | –3.76 | % | ||||||||||
|
|
|
|
|
|
|
|
|
| |||||||||||
Ratios/Supplemental Data: | ||||||||||||||||||||
Net assets, end of year (in millions) | $ | 6.6 | $ | 8.3 | $ | 8.7 | $ | 15.3 | $ | 5.6 | ||||||||||
|
|
|
|
|
|
|
|
|
| |||||||||||
Ratio of expenses to average daily net assets (before expense reduction) | 2.20 | % | 2.37 | % | 2.35 | % | 2.40 | % | 2.78 | % | ||||||||||
|
|
|
|
|
|
|
|
|
| |||||||||||
Ratio of expenses to average daily net assets (net of expense reduction) | 1.80 | % | 1.92 | % | 2.00 | % | 2.00 | % | 2.00 | % | ||||||||||
|
|
|
|
|
|
|
|
|
| |||||||||||
Ratio of net investment income (loss) to average daily net assets (before expense reduction) | (0.14 | )% | (0.59 | )% | (0.30 | )% | (0.38 | )% | (0.93 | )% | ||||||||||
|
|
|
|
|
|
|
|
|
| |||||||||||
Ratio of net investment income (loss) to average daily net assets (net of expense reduction) | 0.26 | % | (0.14 | )% | 0.05 | % | 0.02 | % | (0.14 | )% | ||||||||||
|
|
|
|
|
|
|
|
|
| |||||||||||
Portfolio turnover ratee | 124 | % | 118 | % | 101 | % | 96 | % | 145 | % | ||||||||||
|
|
|
|
|
|
|
|
|
| |||||||||||
| a | Calculation based on average shares outstanding. |
| b | Amount is less than $0.005. |
| c | Return assumes the reinvestment of all dividends and distributions at net asset value. |
| d | Does not reflect sales charges, which would reduce return. |
| e | The Fund’s portfolio turnover rate is calculated in accordance with regulatory requirements, without regard to transactions involving short-term investments and certain derivatives. If such transactions were included, the Fund’s portfolio turnover rate would be higher. |
See accompanying notes to the consolidated financial statements.
36
COHEN & STEERS REAL ASSETS FUND, INC.
CONSOLIDATED FINANCIAL HIGHLIGHTS—(Continued)
| Class I | ||||||||||||||||||||
| For the Year Ended December 31, | ||||||||||||||||||||
Per Share Operating Performance: | 2017 | 2016 | 2015 | 2014 | 2013 | |||||||||||||||
Net asset value, beginning of year | $ | 8.75 | $ | 8.01 | $ | 9.45 | $ | 9.64 | $ | 10.04 | ||||||||||
|
|
|
|
|
|
|
|
|
| |||||||||||
Income (loss) from investment operations: | ||||||||||||||||||||
Net investment income (loss)a | 0.11 | 0.10 | 0.09 | 0.10 | 0.08 | |||||||||||||||
Net realized and unrealized gain (loss) | 0.46 | 0.89 | (1.37 | ) | (0.16 | ) | (0.37 | ) | ||||||||||||
|
|
|
|
|
|
|
|
|
| |||||||||||
Total from investment operations | 0.57 | 0.99 | (1.28 | ) | (0.06 | ) | (0.29 | ) | ||||||||||||
|
|
|
|
|
|
|
|
|
| |||||||||||
Less dividends and distributions to shareholders from: | ||||||||||||||||||||
Net investment income | (0.16 | ) | (0.23 | ) | (0.14 | ) | (0.11 | ) | (0.09 | ) | ||||||||||
Net realized gain | — | — | — | (0.01 | ) | — | ||||||||||||||
Return of capital | — | (0.02 | ) | (0.02 | ) | (0.01 | ) | (0.02 | ) | |||||||||||
|
|
|
|
|
|
|
|
|
| |||||||||||
Total dividends and distributions to shareholders | (0.16 | ) | (0.25 | ) | (0.16 | ) | (0.13 | ) | (0.11 | ) | ||||||||||
|
|
|
|
|
|
|
|
|
| |||||||||||
Net increase (decrease) in net asset value | 0.41 | 0.74 | (1.44 | ) | (0.19 | ) | (0.40 | ) | ||||||||||||
|
|
|
|
|
|
|
|
|
| |||||||||||
Net asset value, end of year | $ | 9.16 | $ | 8.75 | $ | 8.01 | $ | 9.45 | $ | 9.64 | ||||||||||
|
|
|
|
|
|
|
|
|
| |||||||||||
Total investment returnb | 6.62 | % | 12.32 | % | –13.64 | % | –0.67 | % | –2.83 | % | ||||||||||
|
|
|
|
|
|
|
|
|
| |||||||||||
Ratios/Supplemental Data: | ||||||||||||||||||||
Net assets, end of year (in millions) | $ | 124.7 | $ | 143.9 | $ | 85.9 | $ | 160.6 | $ | 65.2 | ||||||||||
|
|
|
|
|
|
|
|
|
| |||||||||||
Ratio of expenses to average daily net assets (before expense reduction) | 1.26 | % | 1.41 | % | 1.39 | % | 1.44 | % | 1.79 | % | ||||||||||
|
|
|
|
|
|
|
|
|
| |||||||||||
Ratio of expenses to average daily net assets (net of expense reduction) | 0.80 | % | 0.91 | % | 1.00 | % | 1.00 | % | 1.00 | % | ||||||||||
|
|
|
|
|
|
|
|
|
| |||||||||||
Ratio of net investment income (loss) to average daily net assets (before expense reduction) | 0.81 | % | 0.72 | % | 0.66 | % | 0.55 | % | 0.05 | % | ||||||||||
|
|
|
|
|
|
|
|
|
| |||||||||||
Ratio of net investment income (loss) to average daily net assets (net of expense reduction) | 1.27 | % | 1.22 | % | 1.05 | % | 0.99 | % | 0.84 | % | ||||||||||
|
|
|
|
|
|
|
|
|
| |||||||||||
Portfolio turnover ratec | 124 | % | 118 | % | 101 | % | 96 | % | 145 | % | ||||||||||
|
|
|
|
|
|
|
|
|
| |||||||||||
| a | Calculation based on average shares outstanding. |
| b | Return assumes the reinvestment of all dividends and distributions at net asset value. |
| c | The Fund’s portfolio turnover rate is calculated in accordance with regulatory requirements, without regard to transactions involving short-term investments and certain derivatives. If such transactions were included, the Fund’s portfolio turnover rate would be higher. |
See accompanying notes to the consolidated financial statements.
37
COHEN & STEERS REAL ASSETS FUND, INC.
CONSOLIDATED FINANCIAL HIGHLIGHTS—(Continued)
| Class R | ||||||||||||||||||||
| For the Year Ended December 31, | ||||||||||||||||||||
Per Share Operating Performance: | 2017 | 2016 | 2015 | 2014 | 2013 | |||||||||||||||
Net asset value, beginning of year | $ | 8.81 | $ | 8.01 | $ | 9.45 | $ | 9.65 | $ | 10.06 | ||||||||||
|
|
|
|
|
|
|
|
|
| |||||||||||
Income (loss) from investment operations: | ||||||||||||||||||||
Net investment income (loss)a | 0.06 | (0.06 | ) | 0.05 | 0.05 | 0.09 | ||||||||||||||
Net realized and unrealized gain (loss) | 0.46 | 1.01 | (1.37 | ) | (0.16 | ) | (0.42 | ) | ||||||||||||
|
|
|
|
|
|
|
|
|
| |||||||||||
Total from investment operations | 0.52 | 0.95 | (1.32 | ) | (0.11 | ) | (0.33 | ) | ||||||||||||
|
|
|
|
|
|
|
|
|
| |||||||||||
Less dividends and distributions to shareholders from: | ||||||||||||||||||||
Net investment income | (0.11 | ) | (0.13 | ) | (0.10 | ) | (0.07 | ) | (0.06 | ) | ||||||||||
Net realized gain | — | — | — | (0.01 | ) | — | ||||||||||||||
Return of capital | — | (0.02 | ) | (0.02 | ) | (0.01 | ) | (0.02 | ) | |||||||||||
|
|
|
|
|
|
|
|
|
| |||||||||||
Total dividends and distributions to shareholders | (0.11 | ) | (0.15 | ) | (0.12 | ) | (0.09 | ) | (0.08 | ) | ||||||||||
|
|
|
|
|
|
|
|
|
| |||||||||||
Net increase (decrease) in net asset value | 0.41 | 0.80 | (1.44 | ) | (0.20 | ) | (0.41 | ) | ||||||||||||
|
|
|
|
|
|
|
|
|
| |||||||||||
Net asset value, end of year | $ | 9.22 | $ | 8.81 | $ | 8.01 | $ | 9.45 | $ | 9.65 | ||||||||||
|
|
|
|
|
|
|
|
|
| |||||||||||
Total investment returnb | 5.99 | % | 11.90 | % | –14.06 | % | –1.20 | % | –3.29 | % | ||||||||||
|
|
|
|
|
|
|
|
|
| |||||||||||
Ratios/Supplemental Data: | ||||||||||||||||||||
Net assets, end of year (in 000s) | $ | 89.5 | $ | 250.7 | $ | 1,190.8 | $ | 1,079.0 | $ | 150.0 | ||||||||||
|
|
|
|
|
|
|
|
|
| |||||||||||
Ratio of expenses to average daily net assets (before expense reduction) | 1.70 | % | 1.90 | % | 1.85 | % | 1.90 | % | 2.28 | % | ||||||||||
|
|
|
|
|
|
|
|
|
| |||||||||||
Ratio of expenses to average daily net assets (net of expense reduction) | 1.30 | % | 1.45 | % | 1.50 | % | 1.50 | % | 1.50 | % | ||||||||||
|
|
|
|
|
|
|
|
|
| |||||||||||
Ratio of net investment income (loss) to average daily net assets (before expense reduction) | 0.32 | % | (1.10 | )% | 0.26 | % | 0.09 | % | 0.12 | % | ||||||||||
|
|
|
|
|
|
|
|
|
| |||||||||||
Ratio of net investment income (loss) to average daily net assets (net of expense reduction) | 0.72 | % | (0.65 | )% | 0.61 | % | 0.49 | % | 0.89 | % | ||||||||||
|
|
|
|
|
|
|
|
|
| |||||||||||
Portfolio turnover ratec | 124 | % | 118 | % | 101 | % | 96 | % | 145 | % | ||||||||||
|
|
|
|
|
|
|
|
|
| |||||||||||
| a | Calculation based on average shares outstanding. |
| b | Return assumes the reinvestment of all dividends and distributions at net asset value. |
| c | The Fund’s portfolio turnover rate is calculated in accordance with regulatory requirements, without regard to transactions involving short-term investments and certain derivatives. If such transactions were included, the Fund’s portfolio turnover rate would be higher. |
See accompanying notes to the consolidated financial statements.
38
COHEN & STEERS REAL ASSETS FUND, INC.
CONSOLIDATED FINANCIAL HIGHLIGHTS—(Continued)
| Class Z | ||||||||||||||||||||
| For the Year Ended December 31, | ||||||||||||||||||||
Per Share Operating Performance: | 2017 | 2016 | 2015 | 2014 | 2013 | |||||||||||||||
Net asset value, beginning of year | $ | 8.74 | $ | 8.00 | $ | 9.43 | $ | 9.62 | $ | 10.03 | ||||||||||
|
|
|
|
|
|
|
|
|
| |||||||||||
Income (loss) from investment operations: |
| |||||||||||||||||||
Net investment income (loss)a | 0.11 | 0.09 | 0.08 | 0.08 | 0.07 | |||||||||||||||
Net realized and unrealized gain (loss) | 0.45 | 0.90 | (1.35 | ) | (0.15 | ) | (0.38 | ) | ||||||||||||
|
|
|
|
|
|
|
|
|
| |||||||||||
Total from investment operations | 0.56 | 0.99 | (1.27 | ) | (0.07 | ) | (0.31 | ) | ||||||||||||
|
|
|
|
|
|
|
|
|
| |||||||||||
Less dividends and distributions to shareholders from: |
| |||||||||||||||||||
Net investment income | (0.16 | ) | (0.23 | ) | (0.14 | ) | (0.10 | ) | (0.08 | ) | ||||||||||
Net realized gain | — | — | — | (0.01 | ) | — | ||||||||||||||
Return of capital | — | (0.02 | ) | (0.02 | ) | (0.01 | ) | (0.02 | ) | |||||||||||
|
|
|
|
|
|
|
|
|
| |||||||||||
Total dividends and distributions to shareholders | (0.16 | ) | (0.25 | ) | (0.16 | ) | (0.12 | ) | (0.10 | ) | ||||||||||
|
|
|
|
|
|
|
|
|
| |||||||||||
Net increase (decrease) in net asset value | 0.40 | 0.74 | (1.43 | ) | (0.19 | ) | (0.41 | ) | ||||||||||||
|
|
|
|
|
|
|
|
|
| |||||||||||
Net asset value, end of year | $ | 9.14 | $ | 8.74 | $ | 8.00 | $ | 9.43 | $ | 9.62 | ||||||||||
|
|
|
|
|
|
|
|
|
| |||||||||||
Total investment returnb | 6.51 | % | 12.48 | %c | –13.67 | %c | –0.78 | % | –3.03 | % | ||||||||||
|
|
|
|
|
|
|
|
|
| |||||||||||
Ratios/Supplemental Data: | ||||||||||||||||||||
Net assets, end of year (in millions) | $ | 2.0 | $ | 2.2 | $ | 2.1 | $ | 9.9 | $ | 11.1 | ||||||||||
|
|
|
|
|
|
|
|
|
| |||||||||||
Ratio of expenses to average daily net assets (before expense reduction) | 1.20 | % | 1.37 | % | 1.35 | % | 1.50 | % | 1.93 | % | ||||||||||
|
|
|
|
|
|
|
|
|
| |||||||||||
Ratio of expenses to average daily net assets (net of expense reduction) | 0.80 | % | 0.92 | % | 1.00 | % | 1.11 | % | 1.15 | % | ||||||||||
|
|
|
|
|
|
|
|
|
| |||||||||||
Ratio of net investment income (loss) to average daily net assets (before expense reduction) | 0.87 | % | 0.56 | % | 0.55 | % | 0.41 | % | (0.03 | )% | ||||||||||
|
|
|
|
|
|
|
|
|
| |||||||||||
Ratio of net investment income (loss) to average daily net assets (net of expense reduction) | 1.27 | % | 1.01 | % | 0.90 | % | 0.80 | % | 0.75 | % | ||||||||||
|
|
|
|
|
|
|
|
|
| |||||||||||
Portfolio turnover rated | 124 | % | 118 | % | 101 | % | 96 | % | 145 | % | ||||||||||
|
|
|
|
|
|
|
|
|
| |||||||||||
| a | Calculation based on average shares outstanding. |
| b | Return assumes the reinvestment of all dividends and distributions at net asset value. |
| c | The net asset value disclosed in the December 31, 2015 annual report reflects adjustments in accordance with accounting principles generally accepted in the United States of America and as such, differs from the net asset value reported on December 31, 2015. The total return reported is based on the unadjusted net asset value which was the official net asset value for executing transactions on December 31, 2015. |
| d | The Fund’s portfolio turnover rate is calculated in accordance with regulatory requirements, without regard to transactions involving short-term investments and certain derivatives. If such transactions were included, the Fund’s portfolio turnover rate would be higher. |
See accompanying notes to the consolidated financial statements.
39
COHEN & STEERS REAL ASSETS FUND, INC.
NOTES TO CONSOLIDATED FINANCIAL STATEMENTS
Note 1. Organization and Significant Accounting Policies
Cohen & Steers Real Assets Fund, Inc. (the Fund) was incorporated under the laws of the State of Maryland on October 25, 2011 and is registered under the Investment Company Act of 1940 (the 1940 Act), as a diversified, open-end management investment company. The Fund’s investment objective is to provide attractive total returns over the long term and to maximize real returns during inflationary environments. The authorized shares of the Fund are divided into seven classes designated Class A, C, F, I, R, T and Z shares. Each of the Fund’s shares has equal dividend, liquidation and voting rights (except for matters relating to distribution and shareholder servicing of such shares). Class F shares and Class T shares are currently not available for purchase.
Cohen & Steers Real Assets Fund Ltd. (the Subsidiary), a wholly-owned subsidiary of the Fund organized under the laws of the Cayman Islands, was incorporated on November 22, 2011 and commenced operations on January 31, 2012. The Subsidiary acts as an investment vehicle for the Fund in order to effect certain investments on behalf of the Fund, consistent with the Fund’s investment objectives and policies as described in the Fund’s prospectus. The Fund expects that it will achieve a significant portion of its exposure to commodities and commodities-related investments through investment in the Subsidiary. Unlike the Fund, the Subsidiary may invest without limitation in commodities. The Consolidated Schedule of Investments includes positions of the Fund and the Subsidiary. The financial statements have been consolidated and include the accounts of the Fund and the Subsidiary. All significant inter-company balances and transactions have been eliminated in consolidation.
The following is a summary of significant accounting policies consistently followed by the Fund in the preparation of its consolidated financial statements. The Fund is an investment company and, accordingly, follows the investment company accounting and reporting guidance of the Financial Accounting Standards Board Accounting Standards Codification (ASC) Topic 946—Investment Companies. The accounting policies of the Fund are in conformity with accounting principles generally accepted in the United States of America (GAAP). The preparation of the consolidated financial statements in accordance with GAAP requires management to make estimates and assumptions that affect the reported amounts of assets and liabilities at the date of the consolidated financial statements and the reported amounts of income and expenses during the reporting period. Actual results could differ from those estimates.
Portfolio Valuation: Investments in securities that are listed on the New York Stock Exchange (NYSE) are valued, except as indicated below, at the last sale price reflected at the close of the NYSE on the business day as of which such value is being determined. If there has been no sale on such day, the securities are valued at the mean of the closing bid and ask prices on such day or, if no ask price is available, at the bid price. Futures contracts traded on a commodities exchange or board of trade are valued at their settlement price at the close of trading on such exchange or board of trade. Exchange-traded options are valued at their last sale price as of the close of options trading on applicable exchanges on the valuation date. In the absence of a last sale price on such day, options are valued at the average of the quoted bid and ask prices as of the close of business. Over-the-counter (OTC) options are valued based upon prices provided by a third-party pricing service or counterparty.
40
COHEN & STEERS REAL ASSETS FUND, INC.
NOTES TO CONSOLIDATED FINANCIAL STATEMENTS—(Continued)
Securities not listed on the NYSE but listed on other domestic or foreign securities exchanges (including NASDAQ) are valued in a similar manner. Securities traded on more than one securities exchange are valued at the last sale price reflected at the close of the exchange representing the principal market for such securities on the business day as of which such value is being determined. If after the close of a foreign market, but prior to the close of business on the day the securities are being valued, market conditions change significantly, certain non-U.S. equity holdings may be fair valued pursuant to procedures established by the Board of Directors.
Readily marketable securities traded in the OTC market, including listed securities whose primary market is believed by Cohen & Steers Capital Management, Inc. (the investment advisor) to be OTC, are valued on the basis of prices provided by a third-party pricing service or third-party broker-dealers when such prices are believed by the investment advisor, pursuant to delegation by the Board of Directors, to reflect the fair value of such securities.
Fixed-income securities are valued on the basis of prices provided by a third-party pricing service or third-party broker-dealers when such prices are believed by the investment advisor, pursuant to delegation by the Board of Directors, to reflect the fair value of such securities. The pricing services or broker-dealers use multiple valuation techniques to determine fair value. In instances where sufficient market activity exists, the pricing services or broker-dealers may utilize a market-based approach through which quotes from market makers are used to determine fair value. In instances where sufficient market activity may not exist or is limited, the pricing services or broker-dealers also utilize proprietary valuation models which may consider market transactions in comparable securities and the various relationships between securities in determining fair value and/or characteristics such as benchmark yield curves, option-adjusted spreads, credit spreads, estimated default rates, coupon rates, anticipated timing of principal repayments, underlying collateral, and other unique security features which are then used to calculate the fair values.
Short-term debt securities with a maturity date of 60 days or less are valued at amortized cost, which approximates fair value. Investments in open-end mutual funds are valued at their closing net asset value (NAV).
The policies and procedures approved by the Fund’s Board of Directors delegate authority to make fair value determinations to the investment advisor, subject to the oversight of the Board of Directors. The investment advisor has established a valuation committee (Valuation Committee) to administer, implement and oversee the fair valuation process according to the policies and procedures approved annually by the Board of Directors. Among other things, these procedures allow the Fund to utilize independent pricing services, quotations from securities and financial instrument dealers and other market sources to determine fair value.
Securities for which market prices are unavailable, or securities for which the investment advisor determines that the bid and/or ask price or a counterparty valuation does not reflect market value, will be valued at fair value, as determined in good faith by the Valuation Committee, pursuant to procedures approved by the Fund’s Board of Directors. Circumstances in which market prices may be unavailable include, but are not limited to, when trading in a security is suspended, the exchange on which the security is traded is subject to an unscheduled close or disruption or material events occur after the close of the exchange on which the security is principally traded. In these circumstances, the Fund
41
COHEN & STEERS REAL ASSETS FUND, INC.
NOTES TO CONSOLIDATED FINANCIAL STATEMENTS—(Continued)
determines fair value in a manner that fairly reflects the market value of the security on the valuation date based on consideration of any information or factors it deems appropriate. These may include, but are not limited to, recent transactions in comparable securities, information relating to the specific security and developments in the markets.
Foreign equity fair value pricing procedures utilized by the Fund may cause certain non-U.S. equity holdings to be fair valued on the basis of fair value factors provided by a pricing service to reflect any significant market movements between the time the Fund values such securities and the earlier closing of foreign markets.
The Fund’s use of fair value pricing may cause the NAV of Fund shares to differ from the NAV that would be calculated using market quotations. Fair value pricing involves subjective judgments and it is possible that the fair value determined for a security may be materially different than the value that could be realized upon the sale of that security.
Fair value is defined as the price that the Fund would expect to receive upon the sale of an investment or expect to pay to transfer a liability in an orderly transaction with an independent buyer in the principal market or, in the absence of a principal market, the most advantageous market for the investment or liability. The hierarchy of inputs that are used in determining the fair value of the Fund’s investments is summarized below.
| • | Level 1—quoted prices in active markets for identical investments |
| • | Level 2—other significant observable inputs (including quoted prices for similar investments, interest rates, credit risk, etc.) |
| • | Level 3—significant unobservable inputs (including the Fund’s own assumptions in determining the fair value of investments) |
The inputs or methodology used for valuing investments may or may not be an indication of the risk associated with those investments.
For movements between the levels within the fair value hierarchy, the Fund has adopted a policy of recognizing the transfer at the end of the period in which the underlying event causing the movement occurred. Changes in valuation techniques may result in transfers into or out of an assigned level within the disclosure hierarchy. There were no transfers between Level 1 and Level 2 investments as of December 31, 2017.
42
COHEN & STEERS REAL ASSETS FUND, INC.
NOTES TO CONSOLIDATED FINANCIAL STATEMENTS—(Continued)
The following is a summary of the inputs used as of December 31, 2017 in valuing the Fund’s investments carried at value:
| Total | Quoted Prices in Active Markets for Identical Investments (Level 1) | Other Significant Observable Inputs (Level 2) | Significant Unobservable Inputs (Level 3) | |||||||||||||
Common Stock | $ | 98,933,872 | $ | 98,933,872 | $ | — | $ | — | ||||||||
Preferred Securities— | ||||||||||||||||
$25 Par Value | 499,641 | 499,641 | — | — | ||||||||||||
Preferred Securities— | ||||||||||||||||
Capital Securities | 12,797,161 | — | 12,797,161 | — | ||||||||||||
Corporate Bonds | 2,484,789 | — | 2,484,789 | — | ||||||||||||
U.S. Treasury Inflation | ||||||||||||||||
Protected Bonds | 2,789,321 | — | 2,789,321 | — | ||||||||||||
Short-Term Investments | 43,031,583 | — | 43,031,583 | — | ||||||||||||
|
|
|
|
|
|
|
| |||||||||
Total Investments | $ | 160,536,367 | $ | 99,433,513 | $ | 61,102,854 | $ | — | ||||||||
|
|
|
|
|
|
|
| |||||||||
Futures Contracts | $ | 2,325,231 | $ | 2,325,231 | $ | — | $ | — | ||||||||
|
|
|
|
|
|
|
| |||||||||
Total Unrealized | $ | 2,325,231 | $ | 2,325,231 | $ | — | $ | — | ||||||||
|
|
|
|
|
|
|
| |||||||||
Futures Contracts | $ | (1,412,644 | ) | $ | (1,412,644 | ) | $ | — | $ | — | ||||||
|
|
|
|
|
|
|
| |||||||||
Total Unrealized | $ | (1,412,644 | ) | $ | (1,412,644 | ) | $ | — | $ | — | ||||||
|
|
|
|
|
|
|
| |||||||||
| a | Portfolio holdings are disclosed individually on the Schedule of Investments. |
The following is a reconciliation of investments for which significant unobservable inputs (Level 3) were used in determining fair value:
| Common Stock— United States | ||||
Balance as of December 31, 2016 | $ | 1,133,640 | ||
Sales | (981,264 | ) | ||
Realized gain (loss) | (168,760 | ) | ||
Change in unrealized appreciation (depreciation) | 16,384 | |||
|
| |||
Balance as of December 31, 2017 | $ | — | ||
|
| |||
43
COHEN & STEERS REAL ASSETS FUND, INC.
NOTES TO CONSOLIDATED FINANCIAL STATEMENTS—(Continued)
Security Transactions, Investment Income and Expense Allocations: Security transactions are recorded on trade date. Realized gains and losses on investments sold are recorded on the basis of identified cost. Interest income, which includes the amortization of premiums and accretion of discounts, is recorded on the accrual basis. Inflation adjustments to the principal amount of inflation-adjusted securities are reflected as interest income. Deflation adjustments to the principal amount of inflation-adjusted securities are reflected as reductions to interest income. Dividend income is recorded on the ex-dividend date, except for certain dividends on foreign securities, which are recorded as soon as the Fund is informed after the ex-dividend date. Distributions from REITs are recorded as ordinary income, net realized capital gain or return of capital based on information reported by the REITs and management’s estimates of such amounts based on historical information. These estimates are adjusted when the actual source of distributions is disclosed by the REITs and actual amounts may differ from the estimated amounts. Distributions from Master Limited Partnerships (MLPs) are recorded as income and return of capital based on information reported by the MLPs and management’s estimates of such amounts based on historical information. These estimates are adjusted when the actual source of distributions is disclosed by the MLPs and actual amounts may differ from the estimated amounts. Income, expenses (other than expenses attributable to a specific class), and realized and unrealized gains or losses on investments are allocated to each class of shares based on its relative net assets.
Foreign Currency Translation: The books and records of the Fund are maintained in U.S. dollars. Investment securities and other assets and liabilities denominated in foreign currencies are translated into U.S. dollars based upon prevailing exchange rates on the date of valuation. Purchases and sales of investment securities and income and expense items denominated in foreign currencies are translated into U.S. dollars based upon prevailing exchange rates on the respective dates of such transactions. The Fund does not isolate that portion of the results of operations resulting from fluctuations in foreign exchange rates on investments from the fluctuations arising from changes in market prices of securities held. Such fluctuations are included with the net realized and unrealized gain or loss on investments.
Net realized foreign exchange gains or losses arise from sales of foreign currencies, currency gains or losses realized between the trade and settlement dates on securities transactions, and the difference between the amounts of dividends, interest, and foreign withholding taxes recorded on the Fund’s books and the U.S. dollar equivalent of the amounts actually received or paid. Net unrealized foreign exchange gains and losses arise from changes in the values of assets and liabilities, other than investments in securities, on the date of valuation, resulting from changes in exchange rates. Pursuant to U.S. federal income tax regulations, certain foreign currency gains/losses included in realized and unrealized gains/losses are included in or are a reduction of ordinary income for federal income tax purposes.
Futures Contracts: The Fund uses futures contracts in order to gain exposure to the underlying commodities markets. Futures contracts provide for the delayed delivery of the underlying instrument at a fixed price or for a cash amount based on the change in the value of the underlying instrument at a specific date in the future. Upon entering into a futures contract, the Fund is required to deposit with the broker, cash or securities in an amount equal to a certain percentage of the contract amount, which is referred to as the initial margin deposit. Subsequent payments, referred to as variation margin, are made or received by the Fund periodically and are based on changes in the market value of open
44
COHEN & STEERS REAL ASSETS FUND, INC.
NOTES TO CONSOLIDATED FINANCIAL STATEMENTS—(Continued)
futures contracts. Changes in the market value of open futures contracts are recorded as change in unrealized appreciation or depreciation on futures in the Consolidated Statement of Operations. Realized gain or loss, representing the difference between the value of the contract at the time it was opened and the value at the time it was closed, is reported in the Consolidated Statement of Operations at the closing or expiration of the futures contract. Securities deposited as initial margin are designated as such on the Consolidated Schedule of Investments and cash deposited is recorded on the Consolidated Statement of Assets and Liabilities. A receivable from and/or a payable to brokers for the daily variation margin is also recorded on the Consolidated Statement of Assets and Liabilities.
The Fund may be subject to the risk that the change in the value of the futures contract may not correlate perfectly with the underlying instrument. Use of long futures contracts subjects the Fund to risk of loss, up to the notional value of the futures contracts. Use of short futures contracts subjects the Fund to unlimited risk of loss. With exchange traded futures contracts, the exchange or board of trade acts as the counterparty to futures transactions; therefore, the Fund’s credit risk is limited to failure of the exchange or board of trade. Additionally, credit risk exists in exchange traded futures contracts with respect to initial and variation margin that is held in a clearing broker’s customer accounts. While clearing brokers are required to segregate customer margin from their own assets, in the event that a clearing broker becomes insolvent or goes into bankruptcy and at that time there is a shortfall in the aggregate amount of margin held by the clearing broker for all its clients, typically the shortfall would be allocated on a pro rata basis across all the clearing broker’s customers, potentially resulting in losses to the Fund.
Under some circumstances, futures exchanges may establish daily limits on the amount that the price of a futures contract can vary from the previous day’s settlement price, which could effectively prevent liquidation of certain positions. In certain circumstances, the futures commission merchant (FCM) can require additional margin on the futures contracts which would subject the Fund to counterparty credit risk with the FCM.
Options: The Fund may purchase and write exchange-listed and OTC put or call options on securities, stock indices and other financial instruments for hedging purposes, to enhance portfolio returns and reduce overall volatility.
When the Fund writes (sells) an option, an amount equal to the premium received by the Fund is recorded on the Statement of Assets and Liabilities as a liability. The amount of the liability is subsequently marked-to-market to reflect the current market value of the option written. When an option expires, the Fund realizes a gain on the option to the extent of the premium received. Premiums received from writing options which are exercised or closed are added to or offset against the proceeds or amount paid on the transaction to determine the realized gain or loss. If a put option on a security is exercised, the premium reduces the cost basis of the security purchased by the Fund. If a call option is exercised, the premium is added to the proceeds of the security sold to determine the realized gain or loss. The Fund, as writer of an option, bears the market risk of an unfavorable change in the price of the underlying index or security. Other risks include the possibility of an illiquid options market or the inability of the counterparties to fulfill their obligations under the contracts.
Put and call options purchased are accounted for in the same manner as portfolio securities. Premiums paid for purchasing options which expire are treated as realized losses. Premiums paid for purchasing options which are exercised or closed are added to the amounts paid or offset against the
45
COHEN & STEERS REAL ASSETS FUND, INC.
NOTES TO CONSOLIDATED FINANCIAL STATEMENTS—(Continued)
proceeds on the underlying investment transaction to determine the realized gain or loss when the underlying transaction is executed. The risk associated with purchasing an option is that the Fund pays a premium whether or not the option is exercised. Additionally, the Fund bears the risk of loss of the premium and change in market value should the counterparty not perform under the contract.
Morgan Stanley & Co. LLC serves as the Fund’s FCM for the purpose of trading in commodity futures contracts, options and interests therein.
At December 31, 2017, the Fund did not have any option contracts outstanding.
U.S. Treasury Inflation-Protected Securities: U.S. Treasury Inflation-Protected Securities (TIPS) are fixed income securities whose principal value is periodically adjusted according to the rate of inflation. If the index measuring inflation rises or falls, the principal value of TIPS will be adjusted upward or downward, and consequently the interest payable on these securities (calculated with respect to a larger or smaller principal amount) will increase or decrease, respectively. Any upward or downward adjustment in the principal amount of an inflation-indexed security will be included as interest income in the Consolidated Statement of Operations, even though investors do not receive their principal until maturity. Repayment of the original principal upon maturity (as adjusted for inflation) is guaranteed in the case of TIPS.
Dividends and Distributions to Shareholders: Dividends from net investment income and capital gain distributions are determined in accordance with U.S. federal income tax regulations, which may differ from GAAP. Dividends from net investment income, if any, are declared and paid semi-annually. Net realized capital gains, unless offset by any available capital loss carryforward, are typically distributed to shareholders at least annually. Dividends and distributions to shareholders are recorded on the ex-dividend date and are automatically reinvested in full and fractional shares of the Fund based on the NAV per share at the close of business on the payable date, unless the shareholder has elected to have them paid in cash. Dividends from net investment income are subject to recharacterization for tax purposes.
Income Taxes: It is the policy of the Fund to continue to qualify as a regulated investment company (RIC), if such qualification is in the best interest of the shareholders, by complying with the requirements of Subchapter M of the Internal Revenue Code applicable to RICs, and by distributing substantially all of its taxable earnings to its shareholders. Also, in order to avoid the payment of any federal excise taxes, the Fund will distribute substantially all of its net investment income and net realized gains on a calendar year basis. Accordingly, no provision for federal income or excise tax is necessary. Dividend and interest income from holdings in non-U.S. securities is recorded net of non-U.S. taxes paid. Management has analyzed the Fund’s tax positions taken on federal and applicable state income tax returns as well as its tax positions in non-U.S. jurisdictions in which it trades for all open tax years and has concluded that as of December 31, 2017, no additional provisions for income tax are required in the Fund’s consolidated financial statements. The Fund’s tax positions for the tax years for which the applicable statutes of limitations have not expired are subject to examination by the Internal Revenue Service, state departments of revenue and by foreign tax authorities.
The Subsidiary is classified as a controlled foreign corporation under the Internal Revenue Code. The Subsidiary’s taxable income, including net gains, is included, as ordinary income, in the calculation
46
COHEN & STEERS REAL ASSETS FUND, INC.
NOTES TO CONSOLIDATED FINANCIAL STATEMENTS—(Continued)
of the Fund’s taxable income. Net losses of the Subsidiary are not deductible by the Fund either in the current period or carried forward to future periods.
Note 2. Investment Advisory, Administration Fees and Other Transactions with Affiliates
Investment Advisory Fees: Cohen & Steers Capital Management, Inc. serves as the Fund’s and Subsidiary’s investment advisor pursuant to an investment advisory agreement (the investment advisory agreement). Under the terms of the investment advisory agreement, the investment advisor provides the Fund with day-to-day investment decisions and generally manages the Fund’s investments in accordance with the stated policies of the Fund, subject to the supervision of the Board of Directors.
For the services provided to the Fund, the investment advisor receives a fee, accrued daily and paid monthly, at an annual rate of 0.75% of the average daily net assets of the Fund.
For the year ended December 31, 2017 and through June 30, 2019, the investment advisor has contractually agreed to waive its fee and/or reimburse expenses so that the Fund’s total annual operating expenses, which include the expenses of the Subsidiary (excluding acquired fund fees and expenses, taxes and extraordinary expenses), do not exceed 1.15% for Class A shares, 1.80% for Class C shares, 0.80% for Class I shares, 1.30% for Class R shares and 0.80% for Class Z shares. This contractual agreement can be amended at any time by agreement of the Fund and the investment advisor and will terminate automatically in the event of termination of the investment advisory agreement between the investment advisor and the Fund. For the year ended December 31, 2017, fees waived and/or expenses reimbursed totaled $782,322.
Under subadvisory agreements between the investment advisor and each of Cohen & Steers Asia Limited and Cohen & Steers UK Limited (collectively, the subadvisors), affiliates of the investment advisor, the subadvisors are responsible for managing the Fund’s investments in certain non-U.S. holdings. For their services provided under the subadvisory agreements, the investment advisor (not the Fund) pays the subadvisors. The investment advisor allocates 50% of the investment advisory fee received from the Fund among itself and each subadvisor based on the portion of the Fund’s average daily net assets managed by the investment advisor and each subadvisor.
Administration Fees: The Fund has entered into an administration agreement with the investment advisor under which the investment advisor performs certain administrative functions for the Fund and receives a fee, accrued daily and paid monthly, at the annual rate of 0.08% of the average daily net assets of the Fund. For the year ended December 31, 2017, the Fund incurred $140,271 in fees under this administration agreement. Additionally, the Fund pays State Street Bank and Trust Company as co-administrator under a fund accounting and administration agreement.
Distribution Fees: Shares of the Fund are distributed by Cohen & Steers Securities, LLC (the distributor), an affiliated entity of the investment advisor. The Fund has adopted a distribution and service plan (the plan) pursuant to Rule 12b-1 under the 1940 Act. The plan provides that the Fund will pay the distributor a fee, accrued daily and paid monthly, at an annual rate of up to 0.25% of the average daily net assets attributable to Class A shares, up to 0.75% of the average daily net assets attributable to Class C shares and up to 0.50% of the average daily net assets attributable to Class R shares. In addition, with respect to Class R shares, such amounts may also be used to pay for services to Fund shareholders or services related to the maintenance of shareholder accounts.
47
COHEN & STEERS REAL ASSETS FUND, INC.
NOTES TO CONSOLIDATED FINANCIAL STATEMENTS—(Continued)
There is a maximum initial sales charge of 4.50% for Class A shares. There is a contingent deferred sales charge (CDSC) of 1.00% on purchases of $1 million or more of Class A shares, which applies if redemption occurs within one year from purchase. There is a CDSC of 1.00% on Class C shares, which applies if redemption occurs within one year from purchase. For the year ended December 31, 2017, the Fund has been advised that the distributor received $1,693, which represents a portion of the sales commissions paid by shareholders from the sale of Class A shares, and $24,712 and $4,316 of CDSC relating to redemptions of Class A and Class C shares, respectively. The distributor has advised the Fund that proceeds from the CDSC on this class are used by the distributor to defray its expenses related to providing distribution-related services to the Fund in connection with the sale of this class, including payments to dealers and other financial intermediaries for selling this class. The payment of a CDSC may result in the distributor receiving amounts greater or less than the upfront commission paid by the distributor to the financial intermediary.
Shareholder Servicing Fees: For shareholder services, the Fund pays the distributor or its affiliates a fee, accrued daily, at an annual rate of up to 0.10% of the average daily net assets of the Fund’s Class A and Class I shares and up to 0.25% of the average daily net assets of the Fund’s Class C shares. The distributor is responsible for paying qualified financial institutions for shareholder services.
Directors’ and Officers’ Fees: Certain directors and officers of the Fund are also directors, officers and/or employees of the investment advisor. The Fund does not pay compensation to directors and officers affiliated with the investment advisor except for the Chief Compliance Officer, who received compensation from the investment advisor, which was reimbursed by the Fund, in the amount of $2,001 for the year ended December 31, 2017.
Note 3. Purchases and Sales of Securities
Purchases and sales of securities and U.S. government obligations, excluding short-term investments, for the year ended December 31, 2017 were as follows:
| Securities | U.S. Government Obligations | Total | ||||||||||
Purchases | $ | 148,570,131 | $ | 1,591,197 | $ | 150,161,328 | ||||||
Sales | 156,521,644 | 1,886,735 | 158,408,379 | |||||||||
Note 4. Derivative Investments
The following tables present the value of derivatives held at December 31, 2017 and the effect of derivatives held during the year ended December 31, 2017, along with the respective location in the consolidated financial statements.
48
COHEN & STEERS REAL ASSETS FUND, INC.
NOTES TO CONSOLIDATED FINANCIAL STATEMENTS—(Continued)
Consolidated Statement of Assets and Liabilities
Assets | Liabilities | |||||||||||
Derivatives | Location | Fair Value | Location | Fair Value | ||||||||
Commodity Risk: | ||||||||||||
Futures Contractsa | Receivable for variation margin on futures contracts | $ | 912,587 | b | — | $ | — | |||||
| a | Futures contracts cleared through Morgan Stanley & Co. LLC are not subject to a master netting arrangement or another similar agreement. |
| b | Amount represents the cumulative appreciation/depreciation on futures contracts as reported on the Consolidated Schedule of Investments. The Consolidated Statement of Assets and Liabilities only reflects the current day variation margin receivable from broker. |
Consolidated Statement of Operations
Derivatives | Location | Realized Gain (Loss) | Change in Unrealized Appreciation (Depreciation) | |||||||
Commodity Risk: | ||||||||||
Futures Contracts | Net Realized and Unrealized Gain (Loss) | $ | (4,015,792 | ) | $ | 407,747 | ||||
Equity Risk: | ||||||||||
Written Option Contracts | Net Realized and Unrealized Gain (Loss) | 10,326 | — | |||||||
The following summarizes the volume of the Fund’s futures contracts and written option contracts activity during the year ended December 31, 2017:
| Futures Contracts | ||||
Average Notional Amount—Long | $ | 67,832,090 | ||
Average Notional Amount—Short | (16,765,331 | ) | ||
Ending Notional Amount—Long | 58,242,974 | |||
Ending Notional Amount—Short | (17,707,585 | ) | ||
| Written Option Contracts | ||||
Average Notional Amount | $ | 862,375 | a | |
Ending Notional Amount | — | |||
| a | Average for the period February 16, 2017 through April 23, 2017, which represents the period the Fund had option contracts outstanding. Notional amount is calculated using the number of contracts multiplied by notional contract size multiplied by the underlying price. |
49
COHEN & STEERS REAL ASSETS FUND, INC.
NOTES TO CONSOLIDATED FINANCIAL STATEMENTS—(Continued)
Note 5. Income Tax Information
The tax character of dividends and distributions paid was as follows:
| For the Year Ended December 31, | ||||||||
| 2017 | 2016 | |||||||
Ordinary income | $ | 2,817,760 | $ | 4,005,063 | ||||
Return of capital | — | 402,068 | ||||||
|
|
|
| |||||
Total dividends and distributions | $ | 2,817,760 | $ | 4,407,131 | ||||
|
|
|
| |||||
As of December 31, 2017, the tax-basis components of accumulated earnings, the federal tax cost and net unrealized appreciation (depreciation) in value of investments held were as follows:
Cost of investments in securities for federal income tax purposes | $ | 148,276,851 | ||
|
| |||
Gross unrealized appreciation on investments | $ | 13,788,118 | ||
Gross unrealized depreciation on investments | (1,532,264 | ) | ||
|
| |||
Net unrealized appreciation (depreciation) on investments | $ | 12,255,854 | ||
|
| |||
Undistributed ordinary income | $ | 1,194 | ||
|
|
As of December 31, 2017, the Fund has a net capital loss carryforward of $5,214,313 which may be used to offset future capital gains. These losses are a short-term capital loss carryforward of $2,941,939 and a long-term capital loss carryforward of $2,272,374, which under current federal income tax rules, may offset capital gains recognized in any future period.
During the year ended December 31, 2017, the Fund utilized net capital loss carryforwards of $1,221,463.
As of December 31, 2017, the Fund had temporary book/tax differences primarily attributable to wash sales on portfolio securities and unrealized gain on passive foreign investment companies and permanent book/tax differences primarily attributable to foreign currency transactions, sales of passive foreign investment companies and Subsidiary losses. To reflect reclassifications arising from the permanent differences, paid-in capital was charged $3,236,832, accumulated net realized loss was credited $2,846,064 and dividends in excess of net investment income was credited $390,768. Net assets were not affected by this reclassification.
Note 6. Capital Stock
On December 6, 2016, the Board of Directors of the Fund approved an increase to the Fund’s authorized shares of capital stock. The Fund is authorized to issue 1.4 billion shares of capital stock, at a par value of $0.001 per share, classified in seven classes as follows: 200 million of Class A capital stock, 200 million of Class C capital stock, 200 million of Class F capital stock, 200 million of Class I capital stock, 200 million of Class R capital stock, 200 million of Class T capital stock and 200 million of Class Z capital stock. Class F and Class T shares are currently not available for purchase.
50
COHEN & STEERS REAL ASSETS FUND, INC.
NOTES TO CONSOLIDATED FINANCIAL STATEMENTS—(Continued)
The Board of Directors of the Fund may increase or decrease the number of shares of common stock that the Fund has authority to issue. Transactions in Fund shares were as follows:
| For the Year Ended December 31, 2017 | For the Year Ended December 31, 2016 | |||||||||||||||
| Shares | Amount | Shares | Amount | |||||||||||||
Class A: | ||||||||||||||||
Sold | 2,669,053 | $ | 23,576,164 | 564,859 | $ | 4,916,926 | ||||||||||
Issued as reinvestment of dividends and distributions | 45,027 | 394,241 | 29,442 | 258,517 | ||||||||||||
Redeemed | (1,064,536 | ) | (9,398,652 | ) | (776,514 | ) | (6,441,682 | ) | ||||||||
|
|
|
|
|
|
|
| |||||||||
Net increase (decrease) | 1,649,544 | $ | 14,571,753 | (182,213 | ) | $ | (1,266,239 | ) | ||||||||
|
|
|
|
|
|
|
| |||||||||
Class C: | ||||||||||||||||
Sold | 208,595 | $ | 1,842,040 | 306,883 | $ | 2,626,587 | ||||||||||
Issued as reinvestment of dividends and distributions | 2,956 | 25,868 | 6,884 | 60,176 | ||||||||||||
Redeemed | (440,294 | ) | (3,862,210 | ) | (450,826 | ) | (3,808,858 | ) | ||||||||
|
|
|
|
|
|
|
| |||||||||
Net increase (decrease) | (228,743 | ) | $ | (1,994,302 | ) | (137,059 | ) | $ | (1,122,095 | ) | ||||||
|
|
|
|
|
|
|
| |||||||||
Class I: | ||||||||||||||||
Sold | 8,242,208 | $ | 72,740,818 | 10,847,661 | $ | 93,509,297 | ||||||||||
Issued as reinvestment of dividends and distributions | 182,256 | 1,596,665 | 339,833 | 2,988,772 | ||||||||||||
Redeemed | (11,243,561 | ) | (98,901,998 | ) | (5,469,286 | ) | (46,967,029 | ) | ||||||||
|
|
|
|
|
|
|
| |||||||||
Net increase (decrease) | (2,819,097 | ) | $ | (24,564,515 | ) | 5,718,208 | $ | 49,531,040 | ||||||||
|
|
|
|
|
|
|
| |||||||||
Class R: | ||||||||||||||||
Sold | 21,689 | $ | 191,113 | 28,215 | $ | 236,852 | ||||||||||
Issued as reinvestments of dividends and distributions | 323 | 2,828 | 465 | 4,101 | ||||||||||||
Redeemed | (40,769 | ) | (362,286 | ) | (148,907 | ) | (1,294,072 | ) | ||||||||
|
|
|
|
|
|
|
| |||||||||
Net increase (decrease) | (18,757 | ) | $ | (168,345 | ) | (120,227 | ) | $ | (1,053,119 | ) | ||||||
|
|
|
|
|
|
|
| |||||||||
51
COHEN & STEERS REAL ASSETS FUND, INC.
NOTES TO CONSOLIDATED FINANCIAL STATEMENTS—(Continued)
| For the Year Ended December 31, 2017 | For the Year Ended December 31, 2016 | |||||||||||||||
| Shares | Amount | Shares | Amount | |||||||||||||
Class Z: | ||||||||||||||||
Sold | 41,480 | $ | 367,021 | 67,027 | $ | 589,425 | ||||||||||
Issued as reinvestment of dividends and distributions | 4,377 | 38,301 | 6,761 | 59,393 | ||||||||||||
Redeemed | (77,471 | ) | (683,845 | ) | (79,251 | ) | (680,825 | ) | ||||||||
|
|
|
|
|
|
|
| |||||||||
Net increase (decrease) | (31,614 | ) | $ | (278,523 | ) | (5,463 | ) | $ | (32,007 | ) | ||||||
|
|
|
|
|
|
|
| |||||||||
Note 7. Other Risks
Common Stock Risk: While common stocks have historically generated higher average returns than fixed income securities over the long-term, common stock has also experienced significantly more volatility in those returns, although under certain market conditions, fixed-income investments may have comparable or greater price volatility. An adverse event, such as an unfavorable earnings report, may depress the value of common stock held by the Fund. Also, the price of common stock is sensitive to general movements in the stock market. A drop in the stock market may depress the price of common stock held by the Fund.
Commodities Risk: Investing in physical commodities, either directly or through complex instruments such as commodity futures contracts and options on commodity futures contracts presents unique risks, is speculative and can be extremely volatile. Market prices of commodities may fluctuate rapidly based on numerous factors including: drought, floods, weather, livestock disease, embargoes, tariffs and international economic, political and regulatory developments. Because the Fund has a significant portion of its assets concentrated in commodity-related derivative instruments, developments affecting commodities may have a disproportionate impact on the Fund. The Fund’s investment in commodity-linked derivative instruments may subject the Fund to greater volatility than investments in traditional securities, particularly if the instruments involve leverage. The value of commodity-related derivative instruments may be affected by changes in overall market movements, commodity index volatility, changes in interest rates, or factors affecting a particular industry or commodity. The use of derivatives presents risks different from, and possibly greater than, the risks associated with investing directly in traditional securities. Among the risks presented are market risk, credit risk, counterparty risk, leverage risk and liquidity risk. In addition, the relationships between various commodities and related derivatives may not behave as expected. Use of leveraged commodity-related derivatives, if any, creates an opportunity for increased return but, at the same time, creates the possibility for greater loss (including the likelihood of greater volatility of the Fund’s net asset value).
Investments in commodity futures contracts and options on commodity futures contracts have a high degree of price variability and are subject to rapid and substantial price changes. Such investments could incur significant losses. There can be no assurance that the options strategy will be successful.
52
COHEN & STEERS REAL ASSETS FUND, INC.
NOTES TO CONSOLIDATED FINANCIAL STATEMENTS—(Continued)
The use of options on commodity futures contracts is to enhance risk-adjusted total returns. The use of options, however, may not provide any, or only partial, protection for market declines. The return performance of the commodity futures contracts may not parallel the performance of the commodities or indexes that serve as the basis for the options it buys or sells; this basis risk may reduce overall returns.
Preferred Securities Risk: Preferred securities are subject to credit risk, which is the risk that a security will decline in price, or the issuer of the security will fail to make dividend, interest or principal payments when due, because the issuer experiences a decline in its financial status. Preferred securities are also subject to interest rate risk and may decline in value because of changes in market interest rates. The Fund may be subject to a greater risk of rising interest rates than would normally be the case in an environment of low interest rates and the effect of potential government fiscal policy initiatives and resulting market reaction to those initiatives. In addition, an issuer may be permitted to defer or omit distributions. Preferred securities are also generally subordinated to bonds and other debt instruments in a company’s capital structure. During periods of declining interest rates, an issuer may be able to exercise an option to redeem (call) its issue at par earlier than scheduled, and the Fund may be forced to reinvest in lower yielding securities. Certain preferred securities may be substantially less liquid than many other securities, such as common stocks. Generally, preferred security holders have no voting rights with respect to the issuing company unless certain events occur. Certain preferred securities may give the issuers special redemption rights allowing the securities to be redeemed prior to a specified date if certain events occur, such as changes to tax or securities laws.
Real Estate Market Risk: Risks of investing in real estate securities include falling property values due to increasing vacancies, declining rents resulting from economic, legal, tax, political or technological developments, lack of liquidity, limited diversification, and sensitivity to certain economic factors such as interest-rate changes and market recessions. Real estate company prices also may drop because of the failure of borrowers to pay their loans and poor management, and residential developers, in particular, could be negatively impacted by falling home prices, slower mortgage origination and rising construction costs. The risks of investing in REITs are similar to those associated with direct investments in real estate securities.
REIT Risk: In addition to the risks of securities linked to the real estate industry, REITs are subject to certain other risks related to their structure and focus. REITs are dependent upon management skills and generally may not be diversified. REITs are also subject to heavy cash flow dependency, defaults by borrowers and self-liquidation. In addition, REITs could possibly fail to (i) qualify for pass-through of income under applicable tax law, or (ii) maintain their exemptions from registration under the 1940 Act. The above factors may also adversely affect a borrower’s or a lessee’s ability to meet its obligations to the REIT. In the event of a default by a borrower or lessee, the REIT may experience delays in enforcing its rights as a mortgagee or lessor and may incur substantial costs associated with protecting its investments.
Small- and Medium-Sized Companies Risk: Real estate companies in the industry tend to be small-to medium-sized companies in relation to the equity markets as a whole. There may be less trading in a smaller company’s stock, which means that buy and sell transactions in that stock could have a larger impact on the stock’s price than is the case with larger company stocks. Smaller companies also may have fewer lines of business so that changes in any one line of business may have a greater impact on a smaller company’s stock price than is the case for a larger company. Further,
53
COHEN & STEERS REAL ASSETS FUND, INC.
NOTES TO CONSOLIDATED FINANCIAL STATEMENTS—(Continued)
smaller company stocks may perform differently in different cycles than larger company stocks. Accordingly, real estate company shares can, and at times will, perform differently than large company stocks.
Natural Resources Risk: The Fund’s investments in securities of natural resource companies involve risks. The market value of securities of natural resource companies may be affected by numerous factors, including events occurring in nature, inflationary pressures and international politics. Because the Fund invests significantly in natural resource companies, there is the risk that the Fund will perform poorly during a downturn in the natural resource sector. For example, events occurring in nature (such as earthquakes or fires in prime natural resource areas) and political events (such as coups, military confrontations or acts of terrorism) can affect the overall supply of a natural resource and the value of companies involved in such natural resource. Political risks and the other risks to which foreign securities are subject may also affect domestic natural resource companies if they have significant operations or investments in foreign countries. Rising interest rates and general economic conditions may also affect the demand for natural resources.
Infrastructure Companies Risk: Securities and instruments of infrastructure companies are more susceptible to adverse economic or regulatory occurrences affecting their industries. Infrastructure companies may be subject to a variety of factors that may adversely affect their business or operations, including high interest costs in connection with capital construction and improvement programs, high leverage, costs associated with environmental and other regulations, the effects of economic slowdown, surplus capacity, increased competition from other providers of services, uncertainties concerning the availability of fuel at reasonable prices, the effects of energy conservation policies and other factors. Infrastructure companies may also be affected by or subject to high interest costs in connection with capital construction and improvement programs; difficulty in raising capital in adequate amounts on reasonable terms in periods of high inflation and unsettled capital markets; inexperience with and potential losses resulting from a developing deregulatory environment; costs associated with compliance with and changes in environmental and other regulations; regulation by various government authorities; government regulation of rates charged to customers; service interruption due to environmental, operational or other mishaps; the imposition of special tariffs and changes in tax laws, regulatory policies and accounting standards; technological innovations that may render existing plants, equipment or products obsolete; and general changes in market sentiment towards infrastructure and utilities assets.
Subsidiary Risk: By investing in the Subsidiary, the Fund is indirectly exposed to the risks associated with the Subsidiary’s investments. The types of derivatives and other investments held by the Subsidiary generally are similar to those that are permitted to be held by the Fund and are subject to the same risks that apply to similar investments if held directly by the Fund. The Subsidiary is not registered under the 1940 Act and is not subject to all of the investor protections of the 1940 Act.
Changes in the laws of the United States and/or the Cayman Islands, under which the Fund and the Subsidiary are organized, respectively, could result in the inability of the Fund and/or the Subsidiary to operate as described in this Prospectus and the statement of additional information (SAI) and could negatively affect the Fund and its shareholders. For example, Cayman Islands law does not currently impose any income, corporate or capital gains tax, estate duty, inheritance tax, gift tax or withholding
54
COHEN & STEERS REAL ASSETS FUND, INC.
NOTES TO CONSOLIDATED FINANCIAL STATEMENTS—(Continued)
tax on the Subsidiary. If Cayman Islands law changes such that the Subsidiary must pay Cayman Islands governmental authority taxes, the Fund’s shareholders would likely suffer decreased investment returns.
Foreign (Non-U.S.) and Emerging Market Securities Risk: The Fund directly purchases securities of foreign issuers. Risks of investing in foreign securities, which can be expected to be greater for investments in emerging markets, include currency risks, future political and economic developments and possible imposition of foreign withholding taxes on income or proceeds payable on the securities. In addition, there may be less publicly available information about a foreign issuer than about a domestic issuer, and foreign issuers may not be subject to the same accounting, auditing and financial recordkeeping standards and requirements as domestic issuers. Moreover, securities of many foreign issuers and their markets may be less liquid and their prices more volatile than securities of comparable U.S. issuers.
Derivatives Risk: The use of derivatives presents risks different from, and possibly greater than, the risks associated with investing directly in traditional securities. Among the risks presented are market risk, credit risk, counterparty risk, leverage risk and liquidity risk. The use of derivatives can lead to losses because of adverse movements in the price or value of the underlying asset, index or rate, which may be magnified by certain features of the derivatives. In addition, the use of derivatives to hedge the Fund’s foreign currency risks may reduce returns or increase volatility, perhaps substantially.
Tax Risk: The Fund’s ability to make direct and indirect investments in commodity-related derivative instruments and certain related investments, is limited by the Fund’s intention to qualify as a RIC under the Internal Revenue Code of 1986; if the Fund does not appropriately limit such investments or if such investments are recharacterized for U.S. tax purposes, the Fund’s status as a RIC may be jeopardized. The Fund’s investment in the Subsidiary is intended to provide additional exposure to commodities while allowing the Fund to satisfy the requirements applicable to RICs. If the Fund were to fail to qualify as a RIC in any taxable year, and were ineligible to or otherwise did not cure such failure, the Fund would be subject to tax on its taxable income at corporate rates, and all distributions from earnings and profits, including any distributions of net long-term capital gains, would be taxable to shareholders as dividend income.
Geopolitical Risk: Occurrence of global events similar to those in recent years, such as war, terrorist attacks, natural disasters, country instability, infectious disease epidemics, market instability, debt crises and downgrades, embargoes, tariffs, sanctions and other trade barriers and other governmental trade or market control programs, the potential exit of a country from its respective union and related geopolitical events, may result in market volatility and may have long-lasting impacts on both the U.S. and global financial markets. Additionally, those events, as well as other changes in foreign and domestic political and economic conditions, could adversely affect individual issuers or related groups of issuers, securities markets, interest rates, secondary trading, credit ratings, inflation, investor sentiment and other factors affecting the value of the Fund’s investments. The decision of the United Kingdom (UK) to exit from the European Union following the June 2016 vote on the matter (referred to as Brexit) may cause uncertainty and thus adversely impact financial results of the Fund and the global financial markets. Growing tensions between the United States and other foreign powers, or among foreign powers, and possible diplomatic, trade or other sanctions could adversely impact the markets and the Fund. The strengthening
55
COHEN & STEERS REAL ASSETS FUND, INC.
NOTES TO CONSOLIDATED FINANCIAL STATEMENTS—(Continued)
of the U.S. dollar relative to other currencies may, among other things, adversely affect the Fund’s investments denominated in non-U.S. dollar currencies. It is difficult to predict when similar events affecting the U.S. or global financial markets may occur, the effects that such events may have, and the duration of those effects.
Regulatory Risk: The U.S. government has proposed and adopted multiple regulations that could have a long-lasting impact on the Fund and on the mutual fund industry in general. The Department of Labor’s (DOL) final rule on conflicts of interest on fiduciary investment advice, as well as the U.S. Securities and Exchange Commission’s (SEC) final rules and amendments to modernize reporting and disclosure and to develop and implement a Liquidity Risk Management Program for open-end investment companies could, among other things, restrict and/or increase the cost of the Fund’s ability to engage in transactions, impact flows into the Fund and/or increase overall expenses of the Fund. In addition, Congress, various exchanges and regulatory and self-regulatory authorities both domestic and foreign, have undertaken reviews of options and futures trading in light of market volatility. Among the actions that have been taken or proposed to be taken are new limits and reporting requirements for speculative positions, new or more stringent daily price fluctuation limits for futures and options transactions, and increased margin requirements for various types of futures transactions. While the full extent of all of these regulations is still unclear, these regulations and actions may adversely affect the instruments in which the Fund invests and its ability to execute its investment strategy.
The investment advisor is registered with the Commodity Futures Trading Commission (CFTC) as a commodity pool operator (CPO) with respect to the Fund and the Subsidiary. Compliance with the CFTC’s disclosure, reporting and recordkeeping requirements may increase Fund expenses and may affect the ability of the Fund to use commodity interests (including futures, options on futures, commodities, and swaps) to the extent or in the manner desired.
LIBOR Risk: Many financial instruments use or may use a floating rate based on the LIBOR, which is the offered rate for short-term Eurodollar deposits between major international banks. On July 27, 2017, the head of the UK Financial Conduct Authority announced a desire to phase out the use of LIBOR by the end of 2021. Due to the recency of this announcement, there remains uncertainty regarding the future utilization of LIBOR and the nature of any replacement rate. As such, the potential effect of a transition away from LIBOR on the Fund or the financial instruments in which the Fund invests cannot yet be determined.
Qualified REIT Dividends Paid by the Fund Ineligible for Pass-Through Deduction: Starting in 2018, non-corporate taxpayers are permitted to deduct a portion of any amounts received from a REIT that are “qualified REIT dividends.” This deduction is currently not available in respect of such amounts paid by a REIT to the Fund, and distributed by the Fund to its shareholders. As a result, a non-corporate shareholder will generally be subject to a higher effective tax rate on any such amounts received from the Fund compared to the effective rate applicable to any qualified REIT dividends a shareholder would receive if the shareholder invested directly in a REIT.
This is not a complete list of the risks of investing in the Fund. For additional information concerning the risks of investing in the Fund, please consult the Fund’s prospectus.
56
COHEN & STEERS REAL ASSETS FUND, INC.
NOTES TO CONSOLIDATED FINANCIAL STATEMENTS—(Continued)
Note 8. Other
In the normal course of business, the Fund enters into contracts that provide general indemnifications. The Fund’s maximum exposure under these arrangements is dependent on claims that may be made against the Fund in the future and, therefore, cannot be estimated; however, based on experience, the risk of material loss from such claims is considered remote.
The Fund and its Subsidiary are commodity pools under the Commodity Exchange Act. The investment advisor has registered with the CFTC as a commodity pool operator with respect to the Fund and the Subsidiary. Because of its management of other strategies, the Fund’s investment advisor is also registered with the CFTC as a commodity trading advisor. The CFTC has neither reviewed nor approved the Fund’s investment strategies.
Note 9. New Accounting Guidance
In October 2016, the SEC adopted new rules and amended existing rules (together, the “final rules”) intended to modernize the reporting and disclosure of information by registered investment companies. In part, the final rules amend Regulation S-X and require standardized, enhanced disclosure about derivatives in investment company financial statements, as well as other amendments. The compliance date for the amendments to Regulation S-X was for periods ending after August 1, 2017. The adoption of these amendments, effective with these financial statements for the year ended December 31, 2017, required amended and additional disclosures reflected herein, but had no effect on the Fund’s net assets or results of operations.
In March 2017, the Financial Accounting Standards Board (FASB) issued Accounting Standards Update (ASU) No. 2017-08, Receivables—Nonrefundable Fees and Other Costs (Subtopic 310-20): Premium Amortization on Purchased Callable Debt Securities. The amendments in the ASU shorten the amortization period for certain callable debt securities, held at a premium, to be amortized to the earliest call date. The ASU is effective for fiscal years and interim periods within those fiscal years beginning after December 15, 2018. The adoption will have no effect on the Fund’s net assets or results of operations.
Note 10. Subsequent Events
Management has evaluated events and transactions occurring after December 31, 2017 through the date that the financial statements were issued, and has determined that no additional disclosure in the financial statements is required.
57
COHEN & STEERS REAL ASSETS FUND, INC.
REPORT OF INDEPENDENT REGISTERED PUBLIC ACCOUNTING FIRM
To the Board of Directors and Shareholders of
Cohen & Steers Real Assets Fund, Inc.
Opinion on the Financial Statements
We have audited the accompanying consolidated statement of assets and liabilities, including the consolidated schedule of investments, of Cohen & Steers Real Assets Fund, Inc. and its subsidiary (the “Fund”) as of December 31, 2017, the related consolidated statement of operations for the year ended December 31, 2017, the consolidated statement of changes in net assets for each of the two years in the period ended December 31, 2017, including the related notes, and the consolidated financial highlights for each of the five years in the period ended December 31, 2017 (collectively referred to as the “consolidated financial statements”). In our opinion, the consolidated financial statements present fairly, in all material respects, the financial position of the Fund as of December 31, 2017, the results of their operations for the year then ended, the changes in their net assets for each of the two years in the period ended December 31, 2017 and the financial highlights for each of the five years in the period ended December 31, 2017 in conformity with accounting principles generally accepted in the United States of America.
Basis for Opinion
These consolidated financial statements are the responsibility of the Fund’s management. Our responsibility is to express an opinion on the Fund’s consolidated financial statements based on our audits. We are a public accounting firm registered with the Public Company Accounting Oversight Board (United States) (“PCAOB”) and are required to be independent with respect to the Fund in accordance with the U.S. federal securities laws and the applicable rules and regulations of the Securities and Exchange Commission and the PCAOB.
We conducted our audits of these consolidated financial statements in accordance with the standards of the PCAOB. Those standards require that we plan and perform the audit to obtain reasonable assurance about whether the consolidated financial statements are free of material misstatement, whether due to error or fraud.
Our audits included performing procedures to assess the risks of material misstatement of the consolidated financial statements, whether due to error or fraud, and performing procedures that respond to those risks. Such procedures included examining, on a test basis, evidence regarding the amounts and disclosures in the consolidated financial statements. Our audits also included evaluating the accounting principles used and significant estimates made by management, as well as evaluating the overall presentation of the consolidated financial statements. Our procedures included confirmation of securities owned as of December 31, 2017 by correspondence with the custodian, transfer agent and brokers; when replies were not received from brokers, we performed other auditing procedures. We believe that our audits provide a reasonable basis for our opinion.
PricewaterhouseCoopers LLP
New York, New York
February 22, 2018
We have served as the auditor of one or more investment companies in the Cohen & Steers family of mutual funds since 1991.
58
COHEN & STEERS REAL ASSETS FUND, INC.
TAX INFORMATION—2017 (Unaudited)
Pursuant to the Jobs and Growth Relief Reconciliation Act of 2003, the Fund designates qualified dividend income of $2,016,842. Additionally, 14.44% of the ordinary dividends qualified for the dividends received deduction available to corporations.
The Fund has elected, pursuant to Section 853 of the Internal Revenue Code, to pass through foreign taxes of $130,688. The Fund generated net foreign source income of $1,784,213 with respect to this election.
OTHER INFORMATION
A description of the policies and procedures that the Fund uses to determine how to vote proxies relating to portfolio securities is available (i) without charge, upon request, by calling 800-330-7348, (ii) on our website at cohenandsteers.com or (iii) on the SEC’s website at http://www.sec.gov. In addition, the Fund’s proxy voting record for the most recent 12-month period ended June 30 is available by August 31 of each year (i) without charge, upon request, by calling 800-330-7348 or (ii) on the SEC’s website at http://www.sec.gov.
The Fund files its complete schedule of portfolio holdings with the SEC for the first and third quarters of each fiscal year on Form N-Q. The Fund’s Forms N-Q are available (i) without charge, upon request, by calling 800-330-7348 or (ii) on the SEC’s website at http://www.sec.gov. In addition, the Forms N-Q may be reviewed and copied at the SEC’s Public Reference Room in Washington, DC. Information on the operation of the Public Reference Room may be obtained by calling 800-SEC-0330.
Please note that distributions paid by the Fund to shareholders are subject to recharacterization for tax purposes. The Fund may also pay distributions in excess of the Fund’s net investment company taxable income and net realized gains and this excess would be a tax free return of capital distributed from the Fund’s assets. The final tax treatment of all distributions is reported to shareholders on their 1099-DIV forms, which are mailed after the close of each calendar year.
Election of Additional Director
Effective September 12, 2017, the Board of Directors voted to increase the number of directors on the Fund’s Board of Directors from twelve to thirteen and elected Daphne L. Richards as a Director of the Fund.
In addition to her tenure as a Director of various Cohen & Steers Funds, Ms. Richards has served as an Independent Director of Cartica Management, LLC since 2015. She has also been a Member of the Investment Committee of the Berkshire Taconic Community Foundation since 2015, a Member of the Advisory Board of Northeast Dutchess Fund since 2016, a Member of the “100 Women in Finance” Global Association Board and Chair of its Advisory Council since 2012, and has been the President and CIO of Ledge Harbor Management since 2016. Previously, Ms. Richards worked at Bessemer Trust Company from 1999 to 2014. Prior thereto, Ms. Richards held investment positions at Frank Russell Company from 1996 to 1999, Union Bank of Switzerland from 1993 to 1996, Credit Suisse from 1990 to 1993, and Hambros International Venture Capital Fund from 1988 to 1989.
Changes to the Board of Directors
On December 5, 2017, the Board of Directors voted to decrease the number of directors on the Fund’s Board of Directors from thirteen to ten, effective January 1, 2018. Directors Bonnie Cohen and Richard E. Kroon retired from the Board of Directors on December 31, 2017 pursuant to the Fund’s mandatory retirement policy. Director Richard J. Norman resigned from the Board of Directors effective December 31, 2017.
59
COHEN & STEERS REAL ASSETS FUND, INC.
MANAGEMENT OF THE FUND
The business and affairs of the Fund are managed under the direction of the Board of Directors. The Board of Directors approves all significant agreements between the Fund and persons or companies furnishing services to it, including the Fund’s agreements with its investment advisor, administrator, co-administrator, custodian and transfer agent. The management of the Fund’s day-to-day operations is delegated to its officers, the investment advisor, administrator and co-administrator, subject always to the investment objective and policies of the Fund and to the general supervision of the Board of Directors.
The Board of Directors and officers of the Fund and their principal occupations during at least the past five years are set forth below. The SAI includes additional information about fund directors and is available, without charge, upon request by calling 800-330-7348.
Name, Address and Year of Birth1 | Position(s) Held With Fund | Term of Office2 | Principal Occupation During At Least The Past 5 Years (Including Other Directorships Held) | Number of Fund Complex Overseen by Director (Including the Fund) | Length of Time Served3 | |||||||
| Interested Directors4 | ||||||||||||
Robert H. Steers Year of Birth: 1953 | Director, Chairman | Until Next Election of Directors | Chief Executive Officer of Cohen & Steers Capital Management, Inc. (CSCM or the Advisor) and its parent, Cohen & Steers, Inc. (CNS) since 2014. Prior to that, Co-Chairman and Co-Chief Executive Officer of the Advisor since 2003 and CNS since 2004. Prior to that, Chairman of the Advisor; Vice President of Cohen & Steers Securities, LLC. | 22 | Since 1991 | |||||||
Joseph M. Harvey Year of Birth: 1963 | Director | Until Next Election of Directors | President and Chief Investment Officer of the Advisor (since 2003) and President of CNS (since 2004). Prior to that, Senior Vice President and Director of Investment Research of CSCM. | 22 | Since 2014 | |||||||
(table continued on next page)
60
COHEN & STEERS REAL ASSETS FUND, INC.
(table continued from previous page)
Name, Address and Year of Birth1 | Position(s) Held With Fund | Term of Office2 | Principal Occupation During At Least The Past 5 Years (Including Other Directorships Held) | Number of Fund Complex Overseen by Director (Including the Fund) | Length of Time Served3 | |||||||
| Disinterested Directors | ||||||||||||
Michael G. Clark Year of Birth: 1965 | Director | Until Next Election of Directors | From 2006 to 2011, President and Chief Executive Officer of DWS Funds and Managing Director of Deutsche Asset Management. | 22 | Since 2011 | |||||||
Bonnie Cohen Year of Birth: 1942 | Director | —5 | Consultant. Board Member, DC Public Library Foundation since 2012, President since 2014; Board member, Telluride Mountain Film Festival since 2010; Trustee, H. Rubenstein Foundation since 1996; Trustee, District of Columbia Public Libraries from 2004 to 2014. | 22 | Since 2001 | |||||||
George Grossman Year of Birth: 1953 | Director | Until Next Election of Directors | Attorney-at-law. | 22 | Since 1993 | |||||||
(table continued on next page)
61
COHEN & STEERS REAL ASSETS FUND, INC.
(table continued from previous page)
Name, Address and Year of Birth1 | Position(s) Held With Fund | Term of Office2 | Principal Occupation During At Least The Past 5 Years (Including Other Directorships Held) | Number of Fund Complex Overseen by Director (Including the Fund) | Length of Time Served3 | |||||
Dean Junkans Year of Birth: 1959 | Director | Until Next Election of Directors | C.F.A.; Adjunct Professor and Executive-In-Residence, Bethel University since 2015; Chief Investment Officer at Wells Fargo Private Bank from 2004 to 2014 and Chief Investment Officer of the Wealth, Brokerage and Retirement group at Wells Fargo & Company from 2011 to 2014; Former member and Chair, Claritas Advisory Committee at the CFA Institute from 2013 to 2015; Board Member and Investment Committee member, Bethel University Foundation since 2010; formerly Corporate Executive Board Member of the National Chief Investment Officers Circle, 2010 to 2015; formerly, Member of the Board of Governors of the University of Wisconsin Foundation, River Falls, 1996 to 2004; U.S. Army Veteran, Gulf War. | 22 | Since 2015 | |||||
Richard E. Kroon Year of Birth: 1942 | Director | —5 | Former member of Investment Committee, Monmouth University from 2004 to 2016; Former Director, Retired Chairman and Managing Partner of Sprout Group venture capital funds, then an affiliate of Donaldson, Lufkin and Jenrette Securities Corporation from 1981 to 2001. Former Director of the National Venture Capital Association from 1997 to 2000, and Chairman for the year 2000. | 22 | Since 2004 | |||||
(table continued on next page)
62
COHEN & STEERS REAL ASSETS FUND, INC.
(table continued from previous page)
Name, Address and Year of Birth1 | Position(s) Held With Fund | Term of Office2 | Principal Occupation During At Least The Past 5 Years (Including Other Directorships Held) | Number of Fund Complex Overseen by Director (Including the Fund) | Length of Time Served3 | |||||
Gerald J. Maginnis Year of Birth: 1955 | Director | Until Next Election of Directors | Philadelphia Office Managing Partner, KPMG LLP from 2006 to 2015; Partner in Charge, KPMG Pennsylvania Audit Practice from 2002 to 2008; President, Pennsylvania Institute of Certified Public Accountants (PICPA) from 2014 to 2015; member, PICPA Board of Directors from 2012 to 2016; member, Council of the American Institute of Certified Public Accountants (AICPA) from 2014 to 2017; member, Board of Trustees of AICPA Foundation since 2015. | 22 | Since 2015 | |||||
Jane F. Magpiong Year of Birth: 1960 | Director | Until Next Election of Directors | President, Untap Potential since 2013; Board Member, Crespi High School, from 2014 to 2017; Senior Managing Director, TIAA-CREF, from 2011 to 2013; National Head of Wealth Management, TIAA-CREF, from 2008 to 2011; and prior to that, President, Bank of America Private Bank from 2005 to 2008. | 22 | Since 2015 | |||||
(table continued on next page)
63
COHEN & STEERS REAL ASSETS FUND, INC.
(table continued from previous page)
Name, Address and Year of Birth1 | Position(s) Held With Fund | Term of Office2 | Principal Occupation During At Least The Past 5 Years (Including Other Directorships Held) | Number of Fund Complex Overseen by Director (Including the Fund) | Length of Time Served3 | |||||
Richard J. Norman Year of Birth: 1943 | Director | —5 | Private Investor. Member, Montgomery County, Maryland Department of Corrections Volunteer Corps. since 2010; Liaison for Business Leadership, Salvation Army World Service Organization (SAWSO) since 2010; Advisory Board Member, The Salvation Army since 1985; Prior thereto, Investment Representative of Morgan Stanley Dean Witter from 1966 to 2000. | 22 | Since 2001 | |||||
(table continued on next page)
64
COHEN & STEERS REAL ASSETS FUND, INC.
(table continued from previous page)
Name, Address and Year of Birth1 | Position(s) Held With Fund | Term of Office2 | Principal Occupation During At Least The Past 5 Years (Including Other Directorships Held) | Number of Funds Within Fund Complex Overseen by Director (Including the Fund) | Length of Time Served3 | |||||
Daphne L. Richards Year of Birth: 1966 | Director | Until Next Election of Directors | Independent Director of Cartica Management, LLC since 2015; Member of the Investment Committee of the Berkshire Taconic Community Foundation since 2015; Member of the Advisory Board of Northeast Dutchess Fund since 2016; Member of the 100 Women in Finance Global Association Board and Chair of its Advisory Council since 2012; President and CIO of Ledge Harbor Management since 2016; Previously, worked at Bessemer Trust Company from 1999 to 2014; Prior thereto, Ms. Richards held investment positions at Frank Russell Company from 1996 to1999, Union Bank of Switzerland from 1993 to 1996; Credit Suisse from 1990 to 1993; and Hambros International Venture Capital Fund from 1988 to 1989. | 22 | Since September 2017 | |||||
(table continued on next page)
65
COHEN & STEERS REAL ASSETS FUND, INC.
(table continued from previous page)
Name, Address and Year of Birth1 | Position(s) Held With Fund | Term of Office2 | Principal Occupation During At Least The Past 5 Years (Including Other Directorships Held) | Number of Funds Within Fund Complex Overseen by Director (Including the Fund) | Length of Time Served3 | |||||
Frank K. Ross Year of Birth: 1943 | Director | Until Next Election of Directors | Visiting Professor of Accounting and Director of the Center for Accounting Education at Howard University School of Business since 2004; Board member and member of Audit Committee (Chairman from 2007 to 2012) and Human Resources and Compensation Committee Member, Pepco Holdings, Inc. (electric utility) from 2004 to 2014; Formerly, Mid-Atlantic Area Managing Partner for Assurance Services at KPMG LLP and Managing Partner of its Washington, DC offices from 1995 to 2003. | 22 | Since 2004 | |||||
C. Edward Ward, Jr. Year of Birth: 1946 | Director | Until Next Election of Directors | Member of The Board of Trustees of Manhattan College, Riverdale, New York from 2004 to 2014. Formerly, Director of closed-end fund management for the NYSE where he worked from 1979 to 2004. | 22 | Since 2004 | |||||
| 1 | The address for each director is 280 Park Avenue, New York, NY 10017. |
| 2 | On March 12, 2008, the Board of Directors adopted a mandatory retirement policy stating a Director must retire from the Board on December 31st of the year in which he or she turns 75 years of age. |
| 3 | The length of time served represents the year in which the Director was first elected or appointed to any fund in the Cohen & Steers fund complex. |
| 4 | “Interested person” as defined in the 1940 Act, of the Fund because of affiliation with CSCM (Interested Directors). |
| 5 | Bonnie Cohen and Richard E. Kroon retired from the Board of Directors on December 31, 2017 pursuant to the Fund’s mandatory retirement policy. Richard J. Norman resigned from the Board of Directors effective December 31, 2017. |
66
COHEN & STEERS REAL ASSETS FUND, INC.
The officers of the Fund (other than Messrs. Steers and Harvey, whose biographies are provided above), their address, their year of birth and their principal occupations for at least the past five years are set forth below.
Name, Address and Year of Birth1 | Position(s) Held With Fund | Principal Occupation During At Least the Past 5 Years | Length of Time Served2 | |||
Adam M. Derechin 1964 | President and Chief Executive Officer | Chief Operating Officer of CSCM since 2003 and CNS since 2004. | Since 2005 | |||
Vincent L. Childers 1976 | Vice President | Senior Vice President of CSCM since 2013. Prior to that, portfolio manager for real asset strategies at AllianceBernstein. | Since 2013 | |||
Jon Cheigh 1973 | Vice President | Executive Vice President of CSCM since 2012. Prior to that, Senior Vice President of CSCM since 2007. | Since 2007 | |||
Nicholas Koutsoftas 1973 | Vice President | Senior Vice President of CSCM since 2013. Prior to that, Senior Vice President, co-portfolio manager and head of the Active Commodities strategy at GE Asset Management. | Since 2013 | |||
Benjamin Ross 1971 | Vice President | Senior Vice President of CSCM since 2013. Prior to that, co-portfolio manager at GE Asset Management of the GE Active Commodities strategy since its 2006 inception. | Since 2013 | |||
Francis C. Poli 1962 | Secretary and Chief Legal Officer | Executive Vice President, Secretary and General Counsel of CSCM and CNS since March 2007. | Since 2007 | |||
James Giallanza 1966 | Chief Financial Officer | Executive Vice President of CSCM since 2014. Prior to that, Senior Vice President of CSCM since 2006. | Since 2006 | |||
Albert Laskaj 1977 | Treasurer | Vice President of CSCM since 2015. Prior to that, Director of Legg Mason & Co. since 2013. Vice President of Legg Mason from 2008 to 2013 and Treasurer of certain mutual funds since 2010. | Since 2015 | |||
Lisa D. Phelan 1968 | Chief Compliance Officer | Executive Vice President of CSCM since 2015. Prior to that, Senior Vice President of CSCM since 2008. Chief Compliance Officer of CSCM, the Cohen & Steers funds, Cohen & Steers Asia Limited and CSSL since 2007, 2006, 2005 and 2004, respectively. | Since 2006 | |||
| 1 | The address of each officer is 280 Park Avenue, New York, NY 10017. |
| 2 | Officers serve one-year terms. The length of time served represents the year in which the officer was first elected as an officer of any fund in the Cohen & Steers fund complex. All of the officers listed above are officers of one or more of the other funds in the complex. |
67
COHEN & STEERS REAL ASSETS FUND, INC.
Cohen & Steers Privacy Policy
| Facts | What Does Cohen & Steers Do With Your Personal Information? | |
| Why? | Financial companies choose how they share your personal information. Federal law gives consumers the right to limit some but not all sharing. Federal law also requires us to tell you how we collect, share, and protect your personal information. Please read this notice carefully to understand what we do. | |
| What? | The types of personal information we collect and share depend on the product or service you have with us. This information can include:
• Social Security number and account balances
• Transaction history and account transactions
• Purchase history and wire transfer instructions | |
| How? | All financial companies need to share customers’ personal information to run their everyday business. In the section below, we list the reasons financial companies can share their customers’ personal information; the reasons Cohen & Steers chooses to share; and whether you can limit this sharing. | |
| Reasons we can share your personal information | Does Cohen & Steers share? | Can you limit this sharing? | ||
For our everyday business purposes— such as to process your transactions, maintain your account(s), respond to court orders and legal investigations, or reports to credit bureaus | Yes | No | ||
For our marketing purposes— to offer our products and services to you | Yes | No | ||
| For joint marketing with other financial companies— | No | We don’t share | ||
For our affiliates’ everyday business purposes— information about your transactions and experiences | No | We don’t share | ||
For our affiliates’ everyday business purposes— information about your creditworthiness | No | We don’t share | ||
| For our affiliates to market to you— | No | We don’t share | ||
| For non-affiliates to market to you— | No | We don’t share | ||
| Questions? Call 800.330.7348 | ||||
68
COHEN & STEERS REAL ASSETS FUND, INC.
Cohen & Steers Privacy Policy—(Continued)
| Who we are | ||
| Who is providing this notice? | Cohen & Steers Capital Management, Inc., Cohen & Steers Asia Limited, Cohen & Steers Japan, LLC, Cohen & Steers UK Limited, Cohen & Steers Securities, LLC, Cohen & Steers Private Funds and Cohen & Steers Open and Closed-End Funds (collectively, Cohen & Steers). | |
| What we do | ||
| How does Cohen & Steers protect my personal information? | To protect your personal information from unauthorized access and use, we use security measures that comply with federal law. These measures include computer safeguards and secured files and buildings. We restrict access to your information to those employees who need it to perform their jobs, and also require companies that provide services on our behalf to protect your information. | |
| How does Cohen & Steers collect my personal information? | We collect your personal information, for example, when you:
• Open an account or buy securities from us
• Provide account information or give us your contact information
• Make deposits or withdrawals from your account
We also collect your personal information from other companies. | |
| Why can’t I limit all sharing? | Federal law gives you the right to limit only:
• sharing for affiliates’ everyday business purposes—information about your creditworthiness
• affiliates from using your information to market to you
• sharing for non-affiliates to market to you
State law and individual companies may give you additional rights to limit sharing. | |
| Definitions | ||
| Affiliates | Companies related by common ownership or control. They can be financial and nonfinancial companies.
• Cohen & Steers does not share with affiliates. | |
| Non-affiliates | Companies not related by common ownership or control. They can be financial and nonfinancial companies.
• Cohen & Steers does not share with non-affiliates. | |
| Joint marketing | A formal agreement between non-affiliated financial companies that together market financial products or services to you.
• Cohen & Steers does not jointly market. | |
69
COHEN & STEERS REAL ASSETS FUND, INC.
Cohen & Steers Investment Solutions
COHEN & STEERS REAL ASSETS FUND
| • | Designed for investors seeking total return and the maximization of real returns during inflationary environments by investing primarily in real assets |
| • | Symbols: RAPAX, RAPCX, RAPIX, RAPRX, RAPZX |
COHEN & STEERS
INSTITUTIONAL GLOBAL REALTY SHARES
| • | Designed for institutional investors seeking total return, investing primarily in global real estate securities |
| • | Symbol: GRSIX |
COHEN & STEERS GLOBAL REALTY SHARES
| • | Designed for investors seeking total return, investing primarily in global real estate equity securities |
| • | Symbols: CSFAX, CSFCX, CSSPX, GRSRX, CSFZX |
COHEN & STEERS REALTY SHARES
| • | Designed for investors seeking total return, investing primarily in U.S. real estate securities |
| • | Symbol: CSRSX |
COHEN & STEERS REAL ESTATE SECURITIES FUND
| • | Designed for investors seeking total return, investing primarily in U.S. real estate securities |
| • | Symbols: CSEIX, CSCIX, CREFX, CSDIX, CIRRX, CSZIX |
COHEN & STEERS INSTITUTIONAL REALTY SHARES
| • | Designed for institutional investors seeking total return, investing primarily in U.S. real estate securities |
| • | Symbol: CSRIX |
COHEN & STEERS INTERNATIONAL REALTY FUND
| • | Designed for investors seeking total return, investing primarily in international (non-U.S.) real estate securities |
| • | Symbols: IRFAX, IRFCX, IRFIX, IRFRX, IRFZX |
COHEN & STEERS
ACTIVE COMMODITIES STRATEGY FUND
| • | Designed for investors seeking total return, investing primarily in a diversified portfolio of exchange-traded commodity future contracts and other commodity-related derivative instruments |
| • | Symbols: CDFAX, CDFCX, CDFIX, CDFRX, CDFZX |
COHEN & STEERS GLOBAL INFRASTRUCTURE FUND
| • | Designed for investors seeking total return, investing primarily in global infrastructure securities |
| • | Symbols: CSUAX, CSUCX, CSUIX, CSURX, CSUZX |
COHEN & STEERS
MLP & ENERGY OPPORTUNITY FUND
| • | Designed for investors seeking total return, investing primarily in midstream energy master limited partnership (MLP) units and related stocks |
| • | Symbols: MLOAX, MLOCX, MLOIX, MLORX, MLOZX |
COHEN & STEERS
LOW DURATION PREFERREDAND INCOME FUND
| • | Designed for investors seeking high current income and capital preservation by investing in low-duration preferred and other income securities issued by U.S. and non-U.S. companies |
| • | Symbols: LPXAX, LPXCX, LPXIX, LPXRX, LPXZX |
COHEN & STEERS
PREFERRED SECURITIESAND INCOME FUND
| • | Designed for investors seeking total return (high current income and capital appreciation), investing primarily in preferred and debt securities issued by U.S. and non-U.S. companies |
| • | Symbols: CPXAX, CPXCX, CPXFX, CPXIX, CPRRX, CPXZX |
COHEN & STEERS DIVIDEND VALUE FUND
| • | Designed for investors seeking long-term growth of income and capital appreciation, investing primarily in dividend paying common stocks and preferred stocks |
| • | Symbols: DVFAX, DVFCX, DVFIX, DVFRX, DVFZX |
Distributed by Cohen & Steers Securities, LLC.
COHEN & STEERS GLOBAL REALTY MAJORS ETF
| • | Designed for investors who seek a relatively low-cost passive approach for investing in a portfolio of global real estate equity securities of companies in a specified index |
| • | Symbol: GRI |
Distributed by ALPS Distributors, Inc.
ISHARES COHEN & STEERS REALTY MAJORS INDEX FUND
| • | Designed for investors who seek a relatively low-cost passive approach for investing in a portfolio of U.S. real estate equity securities of companies in a specified index |
| • | Symbol: ICF |
Distributed by SEI Investments Distribution Co.
Please consider the investment objectives, risks, charges and expenses of any Cohen & Steers U.S. registered open-end fund carefully before investing. A summary prospectus and prospectus containing this and other information can be obtained by calling 800-330-7348 or by visiting cohenandsteers.com. Please read the summary prospectus and prospectus carefully before investing.
70
COHEN & STEERS REAL ASSETS FUND, INC.
OFFICERS AND DIRECTORS
Robert H. Steers
Director and Chairman
Joseph M. Harvey
Director and Vice President
Michael G. Clark
Director
Bonnie Cohen
Director
George Grossman
Director
Dean Junkans
Director
Richard E. Kroon
Director
Gerald J. Maginnis
Director
Jane F. Magpiong
Director
Richard J. Norman
Director
Daphne L. Richards
Director
Frank K. Ross
Director
C. Edward Ward, Jr.
Director
Adam M. Derechin
President and Chief Executive Officer
Vincent L. Childers
Vice President
Jon Cheigh
Vice President
Nick Koutsoftas
Vice President
Benjamin Ross
Vice President
Francis C. Poli
Secretary and Chief Legal Officer
James Giallanza
Chief Financial Officer
Albert Laskaj
Treasurer
Lisa D. Phelan
Chief Compliance Officer
KEY INFORMATION
Investment Advisor
Cohen & Steers Capital Management, Inc.
280 Park Avenue
New York, NY 10017
(212) 832-3232
Co-administrator and Custodian
State Street Bank and Trust Company
One Lincoln Street
Boston, MA 02111
Transfer Agent
DST Asset Manager Solutions, Inc.
P.O. Box 8123
Boston, MA 02266
(800) 437-9912
Legal Counsel
Ropes & Gray LLP
1211 Avenue of the Americas
New York, NY 10036
Distributor
Cohen & Steers Securities, LLC
280 Park Avenue
New York, NY 10017
| NASDAQ Symbol: | Class A—RAPAX | |
| Class C—RAPCX | ||
| Class F—RAPFX* | ||
| Class I—RAPIX | ||
| Class R—RAPRX | ||
| Class T—RAPTX* | ||
| Class Z—RAPZX |
Website: cohenandsteers.com
This report is authorized for delivery only to shareholders of Cohen & Steers Real Assets Fund, Inc. unless accompanied or preceded by the delivery of a currently effective prospectus setting forth details of the Fund. Performance data quoted represent past performance. Past performance is no guarantee of future results and your investment may be worth more or less at the time you sell your shares.
| * | Class F and Class T shares are currently not available for purchase. |
71
COHEN & STEERS
REAL ASSETS FUND
280 PARK AVENUE
NEW YORK, NY 10017
eDelivery AVAILABLE
Stop traditional mail delivery;
receive your shareholder reports
and prospectus online.
Sign up at cohenandsteers.com

Annual Report December 31, 2017
Cohen & Steers
Real Assets
Fund
RAPAXAR
Item 2. Code of Ethics.
The Registrant has adopted an Amended and Restated Code of Ethics that applies to its Principal Executive Officer and Principal Financial Officer. The Code of Ethics was in effect during the reporting period. The Registrant has not amended the Code of Ethics as described in Form N-CSR during the reporting period. The Registrant has not granted any waiver, including an implicit waiver, from a provision of the Code of Ethics as described in Form N-CSR during the reporting period. A current copy of the Code of Ethics is available on the Registrant’s website at https://www.cohenandsteers.com/assets/content/uploads/Code_of_Ethics_for_Principal_Executive_and_Principal_Financial_Officers_of_the_Funds.pdf. Upon request, a copy of the Code of Ethics can be made by calling 800-330-7348 or writing to the Secretary of the Registrant, 280 Park Avenue, 10th floor, New York, NY 10017.
Item 3. Audit Committee Financial Expert.
The registrant’s board has determined that Gerald J. Maginnis and Frank K. Ross qualify as audit committee financial experts based on their years of experience in the public accounting profession. The registrant’s board has determined that Michael G. Clark qualifies as an audit committee financial expert based on his years of experience in the public accounting profession and the investment management and financial services industry. Each of Messrs. Clark, Maginnis and Ross is a member of the board’s audit committee, and each is “independent” as such term is defined in Form N-CSR.
Item 4. Principal Accountant Fees and Services.
(a) – (d) Aggregate fees billed to the registrant for the last two fiscal years ended December 31, 2017 and December 31, 2016 for professional services rendered by the registrant’s principal accountant were as follows:
| 2017 | 2016 | |||||||
Audit Fees | $ | 54,470 | $ | 61,800 | ||||
Audit-Related Fees | $ | 0 | $ | 0 | ||||
Tax Fees | $ | 11,050 | $ | 12,700 | ||||
All Other Fees | $ | 0 | $ | 0 | ||||
Tax fees were billed in connection with tax compliance services, including the preparation and review of federal and state tax returns.
(e)(1) The audit committee is required to pre-approve audit and non-audit services performed for the registrant by the principal accountant. The audit committee also is required to pre-approve non-audit services performed by the registrant’s principal accountant for the registrant’s investment advisor and any sub-advisor (not including any sub-advisor whose role is primarily portfolio management and is subcontracted with or overseen by another investment advisor) and/or to any entity controlling, controlled by or under common control with the registrant’s investment advisor that provides ongoing services to the registrant, if the engagement for services relates directly to the operations and financial reporting of the registrant.
The audit committee may delegate pre-approval authority to one or more of its members who are independent members of the board of directors of the registrant. The member or members to whom such authority is delegated shall report any pre-approval decisions to the audit committee at its next scheduled meeting. The audit committee may not delegate its responsibility to pre-approve services to be performed by the registrant’s principal accountant to the investment advisor.
(e)(2) No services included in (b) – (d) above were approved by the audit committee pursuant to paragraphs (c)(7)(i)(C) of Rule 2-01 of Regulation S-X.
(f) Not applicable.
(g) For the fiscal years ended December 31, 2017 and December 31, 2016, the aggregate fees billed by the registrant’s principal accountant for non-audit services rendered to the registrant and for non-audit services rendered to the registrant’s investment advisor (not including any sub-advisor whose role is primarily portfolio management and is subcontracted with or overseen by another investment advisor) and/or to any entity controlling, controlled by or under common control with the registrant’s investment advisor that provides ongoing services to the registrant were:
| 2017 | 2016 | |||||||||
Registrant | $ | 11,050 | $ | 12,700 | ||||||
Investment Advisor | $ | 0 | $ | 0 | ||||||
(h) The registrant’s audit committee considered whether the provision of non-audit services that were rendered to the registrant’s investment advisor (not including any sub-advisor whose role is primarily portfolio management and is subcontracted with or overseen by another investment advisor) and/or to any entity controlling, controlled by or under common control with the registrant’s investment advisor that provides ongoing services to the registrant that were not required to be pre-approved pursuant to paragraph (c)(7)(ii) of Rule 2-01 of Regulation S-X was compatible with maintaining the principal accountant’s independence.
Item 5. Audit Committee of Listed Registrants.
Not applicable.
Item 6. Schedule of Investments.
Included in Item 1 above.
Item 7. Disclosure of Proxy Voting Policies and Procedures for Closed-End Management Investment Companies.
Not applicable.
Item 8. Portfolio Managers of Closed-End Investment Companies.
Not applicable.
Item 9. Purchases of Equity Securities by Closed-End Management Investment Company and Affiliated Purchasers.
Not applicable.
Item 10. Submission of Matters to a Vote of Security Holders.
None.
Item 11. Controls and Procedures.
(a) The registrant’s principal executive officer and principal financial officer have concluded that the registrant’s disclosure controls and procedures are reasonably designed to ensure that information required to be disclosed by the registrant in this Form N-CSR was recorded, processed, summarized and reported within the time periods specified in the Securities and Exchange Commission’s rules and forms, based upon such officers’ evaluation of these controls and procedures as of a date within 90 days of the filing date of this report.
(b) There were no changes in the registrant’s internal control over financial reporting that occurred during the period covered by this report that have materially affected, or are reasonably likely to materially affect, the registrant’s internal control over financial reporting.
Item 12. Disclosure of Securities Lending Activities for Closed-End Management Investment Companies.
Not applicable.
Item 13. Exhibits.
(a)(1) Not Applicable.
(a)(2) Certifications of principal executive officer and principal financial officer as required by Rule 30a-2(a) under the Investment Company Act of 1940.
(a)(3) Not applicable.
(b) Certifications of chief executive officer and chief financial officer as required by Rule 30a- 2(b) under the Investment Company Act of 1940.
SIGNATURES
Pursuant to the requirements of the Securities Exchange Act of 1934 and the Investment Company Act of 1940, the registrant has duly caused this report to be signed on its behalf by the undersigned, thereunto duly authorized.
COHEN & STEERS REAL ASSETS FUND, INC.
| By: | /s/ Adam M. Derechin | |||
Name: Adam M. Derechin Title: President and Chief Executive Officer | ||||
| Date: | March 5, 2018 | |||
Pursuant to the requirements of the Securities Exchange Act of 1934 and the Investment Company Act of 1940, this report has been signed below by the following persons on behalf of the registrant and in the capacities and on the dates indicated.
| By: | /s/ Adam M. Derechin | |||
Name: Adam M. Derechin Title: President and Chief Executive Officer (Principal Executive Officer) | ||||
| By: | /s/ James Giallanza | |||
Name: James Giallanza Title: Chief Financial Officer (Principal Financial Officer) | ||||
| Date: | March 5, 2018 | |||