UNITED STATES
SECURITIES AND EXCHANGE COMMISSION
Washington, D.C. 20549
FORM N-CSR
CERTIFIED SHAREHOLDER REPORT OF REGISTERED
MANAGEMENT INVESTMENT COMPANIES
Investment Company Act File Number: 811-22621
Cohen & Steers Real Assets Fund, Inc.
(Exact name of registrant as specified in charter)
280 Park Avenue, New York, NY 10017
(Address of principal executive offices) (Zip code)
Dana A. DeVivo
Cohen & Steers Capital Management, Inc.
280 Park Avenue
New York, New York 10017
(Name and address of agent for service)
Registrant’s telephone number, including area code: (212) 832-3232
Date of fiscal year end: December 31
Date of reporting period: June 30, 2021
Item 1. Reports to Stockholders.
COHEN & STEERS REAL ASSETS FUND, INC.
To Our Shareholders:
We would like to share with you our report for the six months ended June 30, 2021. The total returns for Cohen & Steers Real Assets Fund, Inc. (the Fund) and its comparative benchmarks were:
| | | | |
| | | Six Months Ended
June 30, 2021 | |
Cohen & Steers Real Assets Fund: | | | | |
Class A | | | 16.22 | % |
Class C | | | 15.88 | % |
Class I | | | 16.48 | % |
Class R | | | 16.21 | % |
Class Z | | | 16.52 | % |
Blended Benchmarka | | | 14.54 | % |
Consumer Price Index +4%a | | | 5.60 | % |
MSCI World Index—neta | | | 13.05 | % |
The performance data quoted represent past performance. Past performance is no guarantee of future results. The investment return and the principal value of an investment will fluctuate and shares, if redeemed, may be worth more or less than their original cost. Current performance may be lower or higher than the performance data quoted. Current total returns of the Fund can be obtained by visiting our website at cohenandsteers.com. All share class returns assume the reinvestment of all dividends and distributions at net asset value (NAV). Fund performance figures reflect fee waivers and/or expense reimbursements, without which the performance would have been lower. Performance quoted does not reflect the deduction of the maximum 4.50% initial sales charge on Class A shares or the 1.00% maximum contingent deferred sales charge on Class C shares. The 1.00% maximum contingent deferred sales charge on Class C shares applies if redemption occurs on or before the one year anniversary date of their purchase. If such charges were included, returns would have been lower. Index performance does not reflect the deduction of any fees, taxes or expenses. An investor cannot invest directly in an index. Performance figures for periods shorter than one year are not annualized.
Please note that distributions paid by the Fund to shareholders are subject to recharacterization for tax purposes and are taxable up to the amount of the Fund’s investment company taxable income and net realized gains. Distributions in excess of the Fund’s investment company taxable income and net realized gains are a return of capital distributed from the Fund’s assets.
| a | For benchmark descriptions, see page 5. |
1
COHEN & STEERS REAL ASSETS FUND, INC.
Market Review
Real assets classes advanced in the six-month period ended June 30, 2021 and outperformed broader equities as financial markets continued to recover from severe pandemic-driven weakness seen in early 2020. Natural resources, real estate and infrastructure stocks all posted double-digit gains, as did commodities futures.
Global economic news was generally favorable in the period, aided by significant fiscal stimulus and positive COVID vaccine rollout trends. However, in the U.S., this anticipated growth (along with manufacturing bottlenecks and higher commodity prices) generated concerns about inflation and about the prospect of monetary policy accommodation ending sooner than previously anticipated. Bond yields rose in this environment from near historical lows, with the yield on the 10-year U.S. Treasury increasing from 0.9% to 1.5% by period end (down from 1.7% reached in mid-period).
Fund Performance
The Fund had a positive total return in the period and outperformed its blended benchmark.
Natural resources stocks had strong returns as investors favored economically sensitive and value-type companies. The energy sector rallied as vaccine rollouts continued to drive the reopening of global economies and greater energy demand, particularly from increased driving and airline travel. The diversified metals & mining sector also performed well on economic optimism. Stock selection in the Fund’s natural resources allocation helped relative performance. Top contributors included an overweight in oil producer ConocoPhillips, which had a sizable gain in the period. Out-of-index allocations to ARC resources and natural gas company Vine Energy also aided performance. The Fund’s non-investment in paper products companies, which had a relatively modest gain, was beneficial as well. Stock selection in the agribusiness and metals & mining sectors detracted from relative performance.
Global real estate stocks also outperformed broader equity markets following significant underperformance in 2020. All major regions advanced, and top performers by sector included previously struggling retail landlords, which rose on optimism about economic reopenings. Stock selection in real estate contributed to performance, led by the Fund’s U.S. and Germany holdings. In the U.S., an overweight in retail landlord Simon Property Group gained more than 50%. The Fund had an underweight in LEG Immobilien, a German apartment owner that declined.
Global infrastructure stocks had a positive but lesser return, with mixed performance by sector. Midstream energy companies were a standout, rising more than 30% amid a recovery in oil prices and an improving outlook for midstream energy fundamentals. Airports underperformed, as lingering virus concerns was a headwind for the sector given expectations for a choppier recovery for air travel. Overall stock selection in the Fund’s infrastructure allocation helped performance, led by selection in the electric utilities, railways and gas distribution sectors. Stock selection in the communications and water sectors hindered relative performance.
Commodities had mostly significant gains in the period outside of precious metals, which were out of favor as investors moved away from assets viewed as safe havens. The energy group outperformed on rising oil prices. Industrial metals had a double-digit gain amid improving demand from China, the leading global consumer of metals. Soybean oil and corn were top performers within the grains group. Security selection in the Fund’s commodities allocation aided relative performance in the period; contributors included an underweight in wheat and overweights in corn and gasoline.
2
COHEN & STEERS REAL ASSETS FUND, INC.
The Fund’s underweight in the dedicated gold allocation helped performance. An overweight in the short-duration credit allocation modestly detracted from performance, as the group had only a slight gain, although the effect was offset by favorable security selection in the group.
Impact of Derivatives on Fund Performance
The Fund engaged in the buying and selling of commodities futures contracts to obtain exposure to commodities markets. These contracts significantly contributed to the Fund’s total return for the six-month period ended June 30, 2021.
The Fund also engaged in the buying and selling of commodities options with the intention of enhancing total returns and reducing overall volatility. These options did not have a material impact on the Fund’s total return for the six-month period ended June 30, 2021.
Sincerely,
| | | | |

VINCENT L. CHILDERS | | 
JON CHEIGH | | 
BENJAMIN ROSS |
Portfolio Manager | | Portfolio Manager | | Portfolio Manager |
| | | | |
| | |

NICK KOUTSOFTAS | | 
BEN MORTON | | 
CHRISTOPHER RHINE |
Portfolio Manager | | Portfolio Manager | | Portfolio Manager |
The views and opinions in the preceding commentary are subject to change without notice and are as of the date of the report. There is no guarantee that any market forecast set forth in the commentary will be realized. This material represents an assessment of the market environment at a specific point in time, should not be relied upon as investment advice and is not intended to predict or depict performance of any investment.
Visit Cohen & Steers online at cohenandsteers.com
For more information about the Cohen & Steers family of mutual funds, visit cohenandsteers.com. Here you will find fund net asset values, fund fact sheets and portfolio highlights, as well as educational resources and timely market updates.
Our website also provides comprehensive information about Cohen & Steers, including our most recent press releases, profiles of our senior investment professionals and their investment approach to each asset class. The Cohen & Steers family of mutual funds specializes in liquid real assets, including real estate securities, listed infrastructure and natural resource equities, as well as preferred securities and other income solutions.
3
COHEN & STEERS REAL ASSETS FUND, INC.
Performance Review (Unaudited)
Average Annual Total Returns—For Periods Ended June 30, 2021
| | | | | | | | | | | | | | | | | | | | |
| | | Class A
Shares | | | Class C
Shares | | | Class I
Shares | | | Class R
Shares | | | Class Z
Shares | |
1 Year (with sales charge) | | | 28.08 | %a | | | 32.29 | %b | | | — | | | | — | | | | — | |
1 Year (without sales charge) | | | 34.12 | % | | | 33.29 | % | | | 34.64 | % | | | 34.01 | % | | | 34.73 | % |
5 Years (with sales charge) | | | 4.43 | %a | | | 4.71 | % | | | — | | | | — | | | | — | |
5 Years (without sales charge) | | | 5.40 | % | | | 4.71 | % | | | 5.78 | % | | | 5.24 | % | | | 5.77 | % |
Since Inception (with sales charge)c | | | 1.71 | %a | | | 1.52 | % | | | — | | | | — | | | | — | |
Since Inception (without sales charge)c | | | 2.21 | % | | | 1.52 | % | | | 2.55 | % | | | 2.05 | % | | | 2.50 | % |
The performance data quoted represent past performance. Past performance is no guarantee of future results. The investment return and principal value of an investment will fluctuate and shares, if redeemed, may be worth more or less than their original cost. Current performance may be lower or higher than the performance data quoted. Performance information current to the most recent month end can be obtained by visiting our website at cohenandsteers.com. All share class returns assume the reinvestment of all dividends and distributions at NAV. The performance table does not reflect the deduction of taxes that a shareholder would pay on Fund distributions or the redemption of Fund shares. During the periods presented above, the investment advisor waived fees and/or reimbursed expenses. Without this arrangement, performance would have been lower.
The annualized gross and net expense ratios, respectively, for each class of shares as disclosed in the May 1, 2021 prospectus, were as follows: Class A—1.70% and 1.16%; Class C—2.35% and 1.81%; Class I—1.43% and 0.81%; Class R—1.85% and 1.31%; and Class Z—1.35% and 0.81%. Through June 30, 2023, the investment advisor has contractually agreed to waive its fee and/or reimburse expenses so that the Fund’s total annual operating expenses, which include the expenses of the Subsidiary (excluding acquired fund fees and expenses, taxes and extraordinary expenses) do not exceed 1.15% for Class A shares, 1.80% for Class C shares, 0.80% for Class I shares, 1.30% for Class R shares and 0.80% for Class Z shares. This contractual agreement can only be amended or terminated at any time by agreement of the Fund’s Board of Directors and the investment advisor and will terminate automatically in the event of termination of the investment advisory agreement between the investment advisor and the Fund.
| a | Reflects a 4.50% front-end sales charge. |
| b | Reflects a contingent deferred sales charge of 1.00%. |
| c | Inception date of January 31, 2012. |
4
COHEN & STEERS REAL ASSETS FUND, INC.
Performance Review (Unaudited)—(Continued)
Benchmark Descriptions
The Blended Benchmark consists of 27.5% FTSE EPRA Nareit Developed Real Estate Index—net, 27.5% Bloomberg Commodity Total Return Index, 15% S&P Global Natural Resources Index—net, 10% ICE BofA 1-3 Year U.S. Corporate Index, 5% Gold Spot price and 15% Dow Jones Brookfield Global Infrastructure Index. The FTSE EPRA Nareit Developed Real Estate Index—net is an unmanaged market capitalization-weighted total-return index, which consists of publicly traded equity real estate investment trusts (REITs) and listed property companies from developed markets and is net of dividend withholding taxes. The Bloomberg Commodity Total Return Index is a broadly diversified index that tracks the commodity markets through commodity futures contracts. The index is made up of exchange-traded futures on physical commodities, which are weighted to account for economic significance and market liquidity. The S&P Global Natural Resources Index—net includes the largest publicly-traded companies in natural resources and commodities businesses that meet specific investability requirements and is net of dividend withholding taxes. The ICE BofA 1-3 Year U.S. Corporate Index tracks the performance of U.S. dollar-denominated investment-grade corporate debt publicly issued in the U.S. domestic market, with a remaining term to final maturity of less than 3 years. The ICE BofA 1-3 Year Global Corporate Index is a subset of the ICE BofA Global Corporate Index including all securities with a remaining term to final maturity less than 3 years. Gold is represented by the Gold Spot price in U.S. Dollars per Troy ounce. The Dow Jones Brookfield Global Infrastructure Index is a float-adjusted market-capitalization-weighted index that measures performance of globally domiciled companies that derive more than 70% of their cash flows from infrastructure lines of business. The Consumer Price Index (CPI) is a broad measure of average price changes for a diverse basket of goods and services. The CPI is focused on items typically purchased by urban consumers, across diverse households and geographies. The benchmark is represented by the change in the CPI +4% per year. The MSCI World Index—net is a free-float-adjusted index that measures performance of large- and mid-capitalization companies representing developed market countries and is net of dividend withholding taxes.
5
COHEN & STEERS REAL ASSETS FUND, INC.
Expense Example (Unaudited)
As a shareholder of the Fund, you incur two types of costs: (1) transaction costs, including sales charges (loads) on purchase payments; and (2) ongoing costs including investment advisory fees; distribution and/or service (12b-1) fees; and other Fund expenses. This example is intended to help you understand your ongoing costs (in dollars) of investing in the Fund and to compare these costs with the ongoing costs of investing in other mutual funds.
The example is based on an investment of $1,000 invested at the beginning of the period and held for the entire period January 1, 2021—June 30, 2021.
Actual Expenses
The first line of the following table provides information about actual account values and expenses. You may use the information in this line, together with the amount you invested, to estimate the expenses that you paid over the period. Simply divide your account value by $1,000 (for example, an $8,600 account value divided by $1,000 = 8.6), then multiply the result by the number in the first line under the heading entitled “Expenses Paid During Period” to estimate the expenses you paid on your account during this period.
Hypothetical Example for Comparison Purposes
The second line of the following table provides information about hypothetical account values and hypothetical expenses based on the Fund’s actual expense ratio and an assumed rate of return of 5% per year before expenses, which is not the Fund’s actual return. The hypothetical account values and expenses may not be used to estimate the actual ending account balance or expenses you paid for the period. You may use this information to compare the ongoing cost of investing in the Fund and other funds. To do so, compare this 5% hypothetical example with the 5% hypothetical examples that appear in the shareholder reports of other funds.
Please note that the expenses shown in the table are meant to highlight your ongoing costs only and do not reflect any transaction costs, such as sales charges (loads). Therefore, the second line of the table is useful in comparing ongoing costs only, and will not help you determine the relative total costs of owning different funds. In addition, if these transactional costs were included, your costs would have been higher.
6
COHEN & STEERS REAL ASSETS FUND, INC.
Expense Example (Unaudited)—(Continued)
| | | | | | | | | | | | |
| | | Beginning
Account Value
January 1, 2021 | | | Ending
Account Value
June 30, 2021 | | | Expenses Paid
During Perioda
January 1, 2021—
June 30, 2021 | |
Class A | |
Actual (16.22% return) | | $ | 1,000.00 | | | $ | 1,162.20 | | | $ | 6.17 | |
Hypothetical (5% annual return before expenses) | | $ | 1,000.00 | | | $ | 1,019.09 | | | $ | 5.76 | |
|
Class C | |
Actual (15.88% return) | | $ | 1,000.00 | | | $ | 1,158.80 | | | $ | 9.63 | |
Hypothetical (5% annual return before expenses) | | $ | 1,000.00 | | | $ | 1,015.87 | | | $ | 9.00 | |
|
Class I | |
Actual (16.48% return) | | $ | 1,000.00 | | | $ | 1,164.80 | | | $ | 4.29 | |
Hypothetical (5% annual return before expenses) | | $ | 1,000.00 | | | $ | 1,020.83 | | | $ | 4.01 | |
|
Class R | |
Actual (16.21% return) | | $ | 1,000.00 | | | $ | 1,162.10 | | | $ | 6.97 | |
Hypothetical (5% annual return before expenses) | | $ | 1,000.00 | | | $ | 1,018.35 | | | $ | 6.51 | |
|
Class Z | |
Actual (16.52% return) | | $ | 1,000.00 | | | $ | 1,165.20 | | | $ | 4.29 | |
Hypothetical (5% annual return before expenses) | | $ | 1,000.00 | | | $ | 1,020.83 | | | $ | 4.01 | |
| a | Expenses are equal to the Fund’s Class A, Class C, Class I, Class R and Class Z annualized net expense ratios of 1.15%, 1.80%, 0.80%, 1.30% and 0.80%, respectively, multiplied by the average account value over the period, multiplied by 181/365 (to reflect the one-half year period). |
7
COHEN & STEERS REAL ASSETS FUND, INC.
June 30, 2021
Top Ten Holdingsa
(Unaudited)
| | | | | | | | |
Security | | Value | | | % of
Net
Assets | |
| | |
SPDR Gold MiniShares Trust | | $ | 6,853,812 | | | | 2.9 | |
Public Storage | | | 4,174,780 | | | | 1.7 | |
American Tower Corp. | | | 3,952,148 | | | | 1.7 | |
Enbridge, Inc. | | | 3,007,748 | | | | 1.3 | |
iShares Gold Trust | | | 2,644,549 | | | | 1.1 | |
UDR, Inc. | | | 2,314,648 | | | | 1.0 | |
Vinci SA | | | 2,238,898 | | | | 0.9 | |
Healthpeak Properties, Inc. | | | 2,074,267 | | | | 0.9 | |
Vonovia SE | | | 2,032,828 | | | | 0.9 | |
Prologis, Inc. | | | 1,993,880 | | | | 0.8 | |
| a | Top ten holdings (excluding short-term investments and derivative instruments) are determined on the basis of the value of individual securities held. The Fund may also hold positions in other securities issued by the companies listed above. See the Consolidated Schedule of Investments for additional details on such other positions. |
Strategy Breakdownb
(Unaudited)
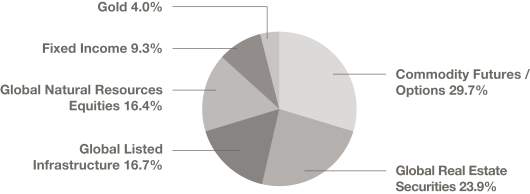
| b | The strategy breakdown is expressed as an approximate percentage of the Fund’s total long-term investments inclusive of derivative exposure. |
8
COHEN & STEERS REAL ASSETS FUND, INC.
CONSOLIDATED SCHEDULE OF INVESTMENTS
June 30, 2021 (Unaudited)
| | | | | | | | | | | | |
| | | | | | Shares | | | Value | |
COMMON STOCK | | | 56.0% | | | | | |
AIRPORTS—FOREIGN | | | 0.3% | | | | | |
Airports of Thailand PCL (Thailand) | | | | 67,500 | | | $ | 130,577 | |
Grupo Aeroportuario del Centro Norte SAB de CV (Mexico)a | | | | 18,787 | | | | 123,067 | |
Grupo Aeroportuario del Pacifico SAB de CV, Class B (Mexico) | | | | 34,841 | | | | 373,019 | |
| | | | | | | | | | | | |
| | | | | | | | | | | 626,663 | |
| | | | | | | | | | | | |
COMMUNICATIONS | | | 3.1% | | | | | | | | | |
TOWERS | | | | | | | | | | | | |
American Tower Corp. | | | | 14,630 | | | | 3,952,148 | |
Crown Castle International Corp. | | | | 9,068 | | | | 1,769,167 | |
SBA Communications Corp. | | | | 5,298 | | | | 1,688,473 | |
| | | | | | | | | | | | |
| | | | | | | | | | | 7,409,788 | |
| | | | | | | | | | | | |
COMMUNICATIONS—FOREIGN | | | 0.6% | | | | | | | | | |
TOWERS | | | | | | | | | | | | |
Cellnex Telecom SA, 144A (Spain)b | | | | 22,593 | | | | 1,439,140 | |
| | | | | | | | | | | | |
CONSUMER STAPLES | | | 0.6% | | | | | | | | | |
FOOD PRODUCTS | | | | | | | | | | | | |
Darling Ingredients, Inc.a | | | | 21,388 | | | | 1,443,690 | |
| | | | | | | | | | | | |
CONSUMER STAPLES—FOREIGN | | | 0.5% | | | | | | | | | |
AGRICULTURE | | | 0.2% | | | | | | | | | |
Farmers Edge, Inc. (Canada)a | | | | 36,860 | | | | 356,230 | |
| | | | | | | | | | | | |
FOOD PRODUCTS | | | 0.3% | | | | | | | | | |
WH Group Ltd., 144A (Hong Kong)b | | | | 433,345 | | | | 389,571 | |
Wilmar International Ltd. (China)(SGD) | | | | 120,430 | | | | 403,016 | |
| | | | | | | | | | | | |
| | | | | | | | | | | 792,587 | |
| | | | | | | | | | | | |
TOTAL CONSUMER STAPLES—FOREIGN | | | | | | | | 1,148,817 | |
| | | | | | | | | | | | |
CONSUMER—CYCLICAL | | | 0.5% | | | | | |
HOTEL | | | | | | | | | | | | |
Boyd Gaming Corp.a | | | | 14,196 | | | | 872,912 | |
Caesars Entertainment, Inc.a | | | | 4,148 | | | | 430,355 | |
| | | | | | | | | | | | |
| | | | | | | | | | | 1,303,267 | |
| | | | | | | | | | | | |
See accompanying notes to the consolidated financial statements.
9
COHEN & STEERS REAL ASSETS FUND, INC.
CONSOLIDATED SCHEDULE OF INVESTMENTS—(Continued)
June 30, 2021 (Unaudited)
| | | | | | | | | | | | |
| | | | | | Shares | | | Value | |
CONSUMER—NON-CYCLICAL | | | 2.3% | | | | | | | | | |
AGRICULTURE | | | 1.3% | | | | | | | | | |
AGCO Corp. | | | | 2,172 | | | $ | 283,185 | |
Archer-Daniels-Midland Co. | | | | 13,095 | | | | 793,557 | |
Bunge Ltd. | | | | 7,813 | | | | 610,586 | |
Corteva, Inc. | | | | 32,193 | | | | 1,427,760 | |
| | | | | | | | | | | | |
| | | | | | | | | | | 3,115,088 | |
| | | | | | | | | | | | |
FOOD PRODUCTS | | | 0.7% | | | | | | | | | |
Tyson Foods, Inc., Class A | | | | 22,905 | | | | 1,689,473 | |
| | | | | | | | | | | | |
FOOD PRODUCTS—FOREIGN | | | 0.3% | | | | | | | | | |
Associated British Foods PLC (United Kingdom) | | | | 10,442 | | | | 320,088 | |
Mowi ASA (Norway) | | | | 15,613 | | | | 397,118 | |
| | | | | | | | | | | | |
| | | | | | | | | | | 717,206 | |
| | | | | | | | | | | | |
TOTAL CONSUMER—NON-CYCLICAL | | | | | | | | 5,521,767 | |
| | | | | | | | | | | | |
ELECTRIC | | | 1.1% | | | | | |
American Electric Power Co., Inc. | | | | 3,322 | | | | 281,008 | |
Evergy, Inc. | | | | 9,071 | | | | 548,161 | |
Eversource Energy | | | | 4,041 | | | | 324,250 | |
FirstEnergy Corp. | | | | 10,378 | | | | 386,165 | |
NextEra Energy, Inc. | | | | 5,255 | | | | 385,086 | |
Portland General Electric Co. | | | | 6,398 | | | | 294,820 | |
PPL Corp. | | | | 11,034 | | | | 308,621 | |
| | | | | | | | | | | | |
| | | | | | | | | | | 2,528,111 | |
| | | | | | | | | | | | |
ELECTRIC—FOREIGN | | | 1.0% | | | | | | | | | |
E.ON SE (Germany) | | | | 30,813 | | | | 356,377 | |
Enel S.p.A. (Italy) | | | | 29,739 | | | | 276,180 | |
Hydro One Ltd., 144A (Canada)b | | | | 24,981 | | | | 603,768 | |
Kansai Electric Power Co., Inc. (Japan) | | | | 19,600 | | | | 186,923 | |
National Grid PLC (United Kingdom) | | | | 82,330 | | | | 1,048,672 | |
| | | | | | | | | | | | |
| | | | | | | | | | | 2,471,920 | |
| | | | | | | | | | | | |
ENERGY | | | 6.8% | | | | | | | | | |
GAS—DISTRIBUTION | | | 0.0% | | | | | | | | | |
Southwest Gas Holdings, Inc.a | | | | 820 | | | | 54,276 | |
| | | | | | | | | | | | |
See accompanying notes to the consolidated financial statements.
10
COHEN & STEERS REAL ASSETS FUND, INC.
CONSOLIDATED SCHEDULE OF INVESTMENTS—(Continued)
June 30, 2021 (Unaudited)
| | | | | | | | | | | | |
| | | | | | Shares | | | Value | |
GAS—DISTRIBUTION—FOREIGN | | | 0.5% | | | | | | | | | |
Enn Energy Holdings Ltd. (China)(H shares) | | | | 45,557 | | | $ | 867,216 | |
Towngas China Co., Ltd. (China)(H shares) | | | | 323,000 | | | | 238,788 | |
| | | | | | | | | | | | |
| | | | | | | | | | | 1,106,004 | |
| | | | | | | | | | | | |
INTEGRATED OIL & GAS—FOREIGN | | | 0.4% | | | | | | | | | |
Royal Dutch Shell PLC, Class B (Netherlands) | | | | 44,683 | | | | 864,722 | |
| | | | | | | | | | | | |
OIL & GAS | | | 3.1% | | | | | | | | | |
Chevron Corp. | | | | 15,275 | | | | 1,599,904 | |
ConocoPhillips | | | | 8,336 | | | | 507,662 | |
Exxon Mobil Corp. | | | | 29,735 | | | | 1,875,684 | |
Renewable Energy Group, Inc.a | | | | 31,971 | | | | 1,993,072 | |
Vine Energy, Inc.a | | | | 101,224 | | | | 1,578,082 | |
| | | | | | | | | | | | |
| | | | | | | | | | | 7,554,404 | |
| | | | | | | | | | | | |
OIL & GAS—FOREIGN | | | 2.8% | | | | | | | | | |
ARC Resources Ltd. (Canada) | | | | 106,741 | | | | 908,452 | |
BP PLC (United Kingdom) | | | | 369,487 | | | | 1,610,001 | |
CIMC Enric Holdings Ltd. (China) | | | | 402,000 | | | | 418,346 | |
Lukoil PJSC, ADR (Russia)(USD) | | | | 6,934 | | | | 642,227 | |
Reliance Industries Ltd., 144A (India)(USD)b | | | | 15,159 | | | | 857,999 | |
Suncor Energy, Inc. (Canada) | | | | 23,844 | | | | 571,094 | |
TotalEnergies SE (France) | | | | 25,474 | | | | 1,152,502 | |
Woodside Petroleum Ltd. (Australia) | | | | 28,953 | | | | 482,253 | |
| | | | | | | | | | | | |
| | | | | | | | | | | 6,642,874 | |
| | | | | | | | | | | | |
TOTAL ENERGY | | | | | | | | 16,222,280 | |
| | | | | | | | | | | | |
ENVIRONMENTAL SERVICES | | | 0.1% | | | | | | | | | |
Waste Management, Inc | | | | 1,478 | | | | 207,083 | |
| | | | | | | | | | | | |
INDUSTRIAL | | | 0.5% | | | | | | | | | |
MACHINERY | | | 0.3% | | | | | | | | | |
Deere & Co. | | | | 1,994 | | | | 703,304 | |
| | | | | | | | | | | | |
MACHINERY—FOREIGN | | | 0.2% | | | | | | | | | |
Kubota Corp. (Japan) | | | | 23,397 | | | | 473,226 | |
| | | | | | | | | | | | |
TOTAL INDUSTRIAL | | | | | | | | 1,176,530 | |
| | | | | | | | | | | | |
INFRASTRUCTURE | | | 0.9% | | | | | |
ELECTRIC | | | 0.4% | | | | | |
CenterPoint Energy, Inc. | | | | 37,104 | | | | 909,790 | |
| | | | | | | | | | | | |
See accompanying notes to the consolidated financial statements.
11
COHEN & STEERS REAL ASSETS FUND, INC.
CONSOLIDATED SCHEDULE OF INVESTMENTS—(Continued)
June 30, 2021 (Unaudited)
| | | | | | | | | | | | |
| | | | | | Shares | | | Value | |
FREIGHT RAILS | | | 0.3% | | | | | | | | | |
Norfolk Southern Corp. | | | | 2,813 | | | $ | 746,598 | |
| | | | | | | | | | | | |
PIPELINES—C-CORP | | | 0.2% | | | | | | | | | |
ONEOK, Inc. | | | | 8,164 | | | | 454,245 | |
| | | | | | | | | | | | |
TOTAL INFRASTRUCTURE | | | | | | | | 2,110,633 | |
| | | | | | | | | | | | |
INFRASTRUCTURE—FOREIGN | | | 3.3% | | | | | |
AIRPORTS | | | 0.5% | | | | | |
Aena SME SA, 144A (Spain)a,b | | | | 5,300 | | | | 869,143 | |
Auckland International Airport Ltd. (New Zealand)a | | | | 49,912 | | | | 253,639 | |
| | | | | | | | | | | | |
| | | | | | | | | | | 1,122,782 | |
| | | | | | | | | | | | |
FREIGHT RAILS | | | 0.1% | | | | | | | | | |
Canadian National Railway Co. (Canada) | | | | 2,700 | | | | 284,877 | |
| | | | | | | | | | | | |
GAS—DISTRIBUTION | | | 0.2% | | | | | | | | | |
Snam S.p.A. (Italy) | | | | 83,577 | | | | 483,119 | |
| | | | | | | | | | | | |
PIPELINES—C-CORP | | | 2.3% | | | | | | | | | |
Enbridge, Inc. (Canada) | | | | 75,124 | | | | 3,007,748 | |
Gibson Energy, Inc. (Canada) | | | | 12,548 | | | | 240,412 | |
Pembina Pipeline Corp. (Canada) | | | | 30,987 | | | | 984,655 | |
TC Energy Corp. (Canada) | | | | 27,219 | | | | 1,346,897 | |
| | | | | | | | | | | | |
| | | | | | | | 5,579,712 | |
| | | | | | | | | | | | |
TOLL ROADS | | | 0.2% | | | | | | | | | |
Eiffage SA (France) | | | | 3,765 | | | | 383,041 | |
| | | | | | | | | | | | |
TOTAL INFRASTRUCTURE—FOREIGN | | | | | | | | 7,853,531 | |
| | | | | | | | | | | | |
MARINE PORTS—FOREIGN | | | 0.2% | | | | | | | | | |
COSCO SHIPPING Ports Ltd. (China)(H shares) | | | | 304,337 | | | | 237,533 | |
Koninklijke Vopak NV (Netherlands) | | | | 4,560 | | | | 207,089 | |
| | | | | | | | | | | | |
| | | | | | | | | | | 444,622 | |
| | | | | | | | | | | | |
MATERIALS | | | 5.8% | | | | | | | | | |
CHEMICALS | | | 0.5% | | | | | | | | | |
CF Industries Holdings, Inc. | | | | 3,715 | | | | 191,137 | |
FMC Corp. | | | | 3,459 | | | | 374,264 | |
Mosaic Co. | | | | 21,151 | | | | 674,928 | |
| | | | | | | | | | | | |
| | | | | | | | | | | 1,240,329 | |
| | | | | | | | | | | | |
See accompanying notes to the consolidated financial statements.
12
COHEN & STEERS REAL ASSETS FUND, INC.
CONSOLIDATED SCHEDULE OF INVESTMENTS—(Continued)
June 30, 2021 (Unaudited)
| | | | | | | | | | | | |
| | | | | | Shares | | | Value | |
CHEMICALS—FOREIGN | | | 0.9% | | | | | | | | | |
Nutrien Ltd. (Canada) | | | | 23,014 | | | $ | 1,394,878 | |
Sociedad Quimica y Minera de Chile SA, ADR (Chile)(USD) | | | | 14,978 | | | | 708,909 | |
| | | | | | | | | | | | |
| | | | | | | | | | | 2,103,787 | |
| | | | | | | | | | | | |
METALS & MINING | | | 0.8% | | | | | | | | | |
Freeport-McMoRan, Inc. | | | | 16,280 | | | | 604,151 | |
Newmont Corp. | | | | 15,735 | | | | 997,284 | |
Nucor Corp. | | | | 2,850 | | | | 273,401 | |
| | | | | | | | | | | | |
| | | | | | | | | | | 1,874,836 | |
| | | | | | | | | | | | |
METALS & MINING—FOREIGN | | | 3.6% | | | | | | | | | |
Agnico Eagle Mines Ltd. (Canada) | | | | 3,715 | | | | 224,650 | |
Anglo American PLC (South Africa) | | | | 37,420 | | | | 1,486,895 | |
ArcelorMittal SA (Luxembourg) | | | | 13,974 | | | | 428,326 | |
Barrick Gold Corp. (Canada) | | | | 6,618 | | | | 136,860 | |
BHP Group PLC (Australia) | | | | 67,597 | | | | 1,991,698 | |
Fortescue Metals Group Ltd. (Australia) | | | | 12,569 | | | | 220,006 | |
Franco-Nevada Corp. (Canada) | | | | 999 | | | | 144,974 | |
Glencore PLC (Switzerland)(GBP) | | | | 45,600 | | | | 195,196 | |
Kirkland Lake Gold Ltd. (Canada) | | | | 18,185 | | | | 700,788 | |
MMC Norilsk Nickel PJSC, ADR (Russia)(USD) | | | | 7,716 | | | | 262,884 | |
Newcrest Mining Ltd. (Australia) | | | | 6,350 | | | | 120,388 | |
Nippon Steel Corp. (Japan) | | | | 21,519 | | | | 362,895 | |
POSCO (South Korea) | | | | 2,498 | | | | 771,926 | |
Rio Tinto Ltd. (Australia) | | | | 3,341 | | | | 317,307 | |
Vale SA, ADR (Brazil)(USD) | | | | 51,564 | | | | 1,176,175 | |
Wheaton Precious Metals Corp. (Brazil)(CAD) | | | | 6,009 | | | | 264,817 | |
| | | | | | | | | | | | |
| | | | | | | | 8,805,785 | |
| | | | | | | | | | | | |
TOTAL MATERIALS | | | | | | | | 14,024,737 | |
| | | | | | | | | | | | |
PIPELINES | | | 1.4% | | | | | | | | | |
Cheniere Energy, Inc.a | | | | 14,924 | | | | 1,294,508 | |
Targa Resources Corp. | | | | 17,098 | | | | 760,006 | |
Williams Cos., Inc. | | | | 48,014 | | | | 1,274,772 | |
| | | | | | | | | | | | |
| | | | | | | | | | | 3,329,286 | |
| | | | | | | | | | | | |
See accompanying notes to the consolidated financial statements.
13
COHEN & STEERS REAL ASSETS FUND, INC.
CONSOLIDATED SCHEDULE OF INVESTMENTS—(Continued)
June 30, 2021 (Unaudited)
| | | | | | | | | | | | |
| | | | | | Shares | | | Value | |
RAILWAYS—FOREIGN | | | 0.3% | | | | | | | | | |
Canadian Pacific Railway Ltd. (Canada) | | | | 2,431 | | | $ | 186,933 | |
Getlink SE (France) | | | | 25,406 | | | | 396,146 | |
Santos Brasil Participacoes SA (Brazil) | | | | 139,843 | | | | 253,887 | |
| | | | | | | | | | | | |
| | | | | | | | | | | 836,966 | |
| | | | | | | | | | | | |
REAL ESTATE | | | 23.2% | | | | | | | | | |
DATA CENTERS | | | 1.0% | | | | | | | | | |
CyrusOne, Inc. | | | | 21,475 | | | | 1,535,892 | |
Equinix, Inc. | | | | 1,085 | | | | 870,821 | |
| | | | | | | | | | | | |
| | | | | | | | | | | 2,406,713 | |
| | | | | | | | | | | | |
DATA CENTERS—FOREIGN | | | 0.2% | | | | | | | | | |
GDS Holdings Ltd., ADR (China)(H shares)a | | | | 2,193 | | | | 172,129 | |
NEXTDC Ltd. (Australia)a | | | | 27,678 | | | | 246,179 | |
| | | | | | | | | | | | |
| | | | | | | | | | | 418,308 | |
| | | | | | | | | | | | |
DIVERSIFIED—FOREIGN | | | 4.5% | | | | | | | | | |
Activia Properties, Inc. (Japan) | | | | 123 | | | | 582,366 | |
British Land Co., PLC (United Kingdom) | | | | 101,151 | | | | 692,475 | |
Castellum AB (Sweden) | | | | 21,341 | | | | 543,119 | |
Charter Hall Group (Australia) | | | | 77,211 | | | | 898,676 | |
City Developments Ltd. (Singapore) | | | | 53,600 | | | | 290,581 | |
CK Asset Holdings Ltd. (Hong Kong) | | | | 140,000 | | | | 966,475 | |
ESR Cayman Ltd., 144A (China)(H Shares)a,b | | | | 59,000 | | | | 199,091 | |
Fastighets AB Balder, Class B (Sweden)a | | | | 10,589 | | | | 664,434 | |
ICADE (France) | | | | 5,320 | | | | 459,236 | |
Invincible Investment Corp. (Japan) | | | | 1,305 | | | | 502,759 | |
Keppel DC REIT (Singapore) | | | | 93,845 | | | | 173,774 | |
Merlin Properties Socimi SA (Spain) | | | | 4,972 | | | | 51,504 | |
Mirvac Group (Australia) | | | | 498,476 | | | | 1,091,590 | |
Mitsubishi Estate Co., Ltd. (Japan) | | | | 45,400 | | | | 734,156 | |
Mitsui Fudosan Co., Ltd. (Japan) | | | | 65,800 | | | | 1,523,952 | |
Mitsui Fudosan Logistics Park, Inc. (Japan) | | | | 88 | | | | 468,932 | |
Sun Hung Kai Properties Ltd. (Hong Kong) | | | | 60,000 | | | | 894,092 | |
| | | | | | | | | | | | |
| | | | | | | | | | | 10,737,212 | |
| | | | | | | | | | | | |
HEALTH CARE | | | 2.2% | | | | | | | | | |
Healthpeak Properties, Inc. | | | | 62,309 | | | | 2,074,267 | |
Medical Properties Trust, Inc. | | | | 34,593 | | | | 695,319 | |
See accompanying notes to the consolidated financial statements.
14
COHEN & STEERS REAL ASSETS FUND, INC.
CONSOLIDATED SCHEDULE OF INVESTMENTS—(Continued)
June 30, 2021 (Unaudited)
| | | | | | | | | | | | |
| | | | | | Shares | | | Value | |
Ventas, Inc. | | | | 29,466 | | | $ | 1,682,509 | |
Welltower, Inc. | | | | 9,445 | | | | 784,879 | |
| | | | | | | | | | | | |
| | | | | | | | | | | 5,236,974 | |
| | | | | | | | | | | | |
HEALTH CARE—FOREIGN | | | 0.5% | | | | | | | | | |
Assura PLC (United Kingdom) | | | | 548,072 | | | | 561,409 | |
Parkway Life Real Estate Investment Trust (Singapore) | | | | 171,400 | | | | 585,057 | |
| | | | | | | | | | | | |
| | | | | | | | | | | 1,146,466 | |
| | | | | | | | | | | | |
HOTEL | | | 0.7% | | | | | | | | | |
Host Hotels & Resorts, Inc.a | | | | 77,735 | | | | 1,328,491 | |
Park Hotels & Resorts, Inc.a | | | | 13,766 | | | | 283,717 | |
| | | | | | | | | | | | |
| | | | | | | | | | | 1,612,208 | |
| | | | | | | | | | | | |
HOTEL—FOREIGN | | | 0.1% | | | | | | | | | |
Sands China Ltd. (Macau)(H Shares)a | | | | 70,800 | | | | 298,180 | |
| | | | | | | | | | | | |
INDUSTRIALS | | | 1.7% | | | | | | | | | |
Americold Realty Trust | | | | 22,144 | | | | 838,150 | |
Duke Realty Corp. | | | | 27,991 | | | | 1,325,374 | |
Prologis, Inc. | | | | 16,681 | | | | 1,993,880 | |
| | | | | | | | | | | | |
| | | | | | | | | | | 4,157,404 | |
| | | | | | | | | | | | |
INDUSTRIALS—FOREIGN | | | 0.8% | | | | | | | | | |
CTP NV, 144A (Netherlands)a,b | | | | 12,876 | | | | 259,551 | |
Frasers Logistics & Commercial Trust (Singapore) | | | | 40,500 | | | | 43,370 | |
GLP J-REIT (Japan) | | | | 305 | | | | 526,018 | |
Goodman Group (Australia) | | | | 13,981 | | | | 221,969 | |
Segro PLC (United Kingdom) | | | | 30,869 | | | | 467,364 | |
Tritax Big Box REIT PLC (United Kingdom) | | | | 133,858 | | | | 363,480 | |
| | | | | | | | | | | | |
| | | | | | | | | | | 1,881,752 | |
| | | | | | | | | | | | |
NET LEASE | | | 0.8% | | | | | | | | | |
VEREIT, Inc. | | | | 39,777 | | | | 1,826,958 | |
| | | | | | | | | | | | |
NET LEASE—FOREIGN | | | 0.2% | | | | | | | | | |
ARGAN SA (France) | | | | 1,875 | | | | 228,998 | |
VGP NV (Belgium) | | | | 883 | | | | 174,224 | |
| | | | | | | | | | | | |
| | | | | | | | | | | 403,222 | |
| | | | | | | | | | | | |
OFFICE—FOREIGN | | | 1.0% | | | | | | | | | |
Alstria Office REIT AG (Germany) | | | | 24,141 | | | | 446,267 | |
See accompanying notes to the consolidated financial statements.
15
COHEN & STEERS REAL ASSETS FUND, INC.
CONSOLIDATED SCHEDULE OF INVESTMENTS—(Continued)
June 30, 2021 (Unaudited)
| | | | | | | | | | | | |
| | | | | | Shares | | | Value | |
Fabege AB (Sweden) | | | | 15,789 | | | $ | 253,307 | |
Keppel REIT (Singapore) | | | | 401,800 | | | | 352,587 | |
Nippon Building Fund, Inc. (Japan) | | | | 83 | | | | 517,746 | |
Orix JREIT, Inc. (Japan) | | | | 292 | | | | 561,948 | |
Workspace Group PLC (United Kingdom) | | | | 32,465 | | | | 374,540 | |
| | | | | | | | | | | | |
| | | | | | | | | | | 2,506,395 | |
| | | | | | | | | | | | |
REAL ESTATE SERVICES | | | 0.3% | | | | | | | | | |
Jones Lang LaSalle, Inc.a | | | | 3,291 | | | | 643,259 | |
| | | | | | | | | | | | |
RESIDENTIAL | | | 2.8% | | | | | | | | | |
Apartment Income REIT Corp. | | | | 16,015 | | | | 759,591 | |
Essex Property Trust, Inc. | | | | 5,274 | | | | 1,582,253 | |
Highwoods Properties, Inc. | | | | 9,543 | | | | 431,057 | |
Invitation Homes, Inc. | | | | 17,820 | | | | 664,508 | |
Sun Communities, Inc. | | | | 6,325 | | | | 1,084,105 | |
UDR, Inc. | | | | 47,257 | | | | 2,314,648 | |
| | | | | | | | | | | | |
| | | | | | | | | | | 6,836,162 | |
| | | | | | | | | | | | |
RESIDENTIAL—FOREIGN | | | 1.8% | | | | | | | | | |
Aedifica SA (Belgium) | | | | 3,892 | | | | 513,643 | |
Deutsche Wohnen SE (Germany) | | | | 1,803 | | | | 110,273 | |
Instone Real Estate Group AG, 144A (Germany)b | | | | 16,743 | | | | 504,266 | |
LEG Immobilien SE (Germany) | | | | 2,861 | | | | 412,011 | |
Neinor Homes SA, 144A (Spain)a,b | | | | 10,572 | | | | 142,406 | |
Vonovia SE (Germany) | | | | 31,445 | | | | 2,032,828 | |
Wharf Real Estate Investment Co., Ltd. (Hong Kong) | | | | 88,000 | | | | 511,727 | |
| | | | | | | | | | | | |
| | | | | | | | | | | 4,227,154 | |
| | | | | | | | | | | | |
RETAIL—FOREIGN | | | 1.4% | | | | | | | | | |
CapitaLand Integrated Commercial Trust (Singapore) | | | | 281,732 | | | | 437,882 | |
Catena AB (Sweden) | | | | 5,453 | | | | 291,953 | |
Japan Retail Fund Investment Corp. (Japan) | | | | 512 | | | | 554,884 | |
Klepierre SA (France)a | | | | 25,582 | | | | 659,155 | |
Link REIT (Hong Kong) | | | | 64,900 | | | | 628,997 | |
RioCan Real Estate Investment Trust (Canada) | | | | 16,840 | | | | 299,957 | |
Unibail-Rodamco-Westfield (France)a | | | | 4,409 | | | | 381,590 | |
VIB Vermoegen AG (Germany) | | | | 3,152 | | | | 133,802 | |
| | | | | | | | | | | | |
| | | | | | | | | | | 3,388,220 | |
| | | | | | | | | | | | |
See accompanying notes to the consolidated financial statements.
16
COHEN & STEERS REAL ASSETS FUND, INC.
CONSOLIDATED SCHEDULE OF INVESTMENTS—(Continued)
June 30, 2021 (Unaudited)
| | | | | | | | | | | | |
| | | | | | Shares | | | Value | |
SELF STORAGE | | | 1.7% | | | | | | | | | |
Public Storage | | | | 13,884 | | | $ | 4,174,780 | |
| | | | | | | | | | | | |
SELF STORAGE—FOREIGN | | | 0.2% | | | | | | | | | |
Safestore Holdings PLC (United Kingdom) | | | | 35,262 | | | | 461,927 | |
| | | | | | | | | | | | |
SHOPPING CENTERS | | | 1.1% | | | | | | | | | |
Kimco Realty Corp. | | | | 38,573 | | | | 804,247 | |
Simon Property Group, Inc. | | | | 14,596 | | | | 1,904,486 | |
| | | | | | | | | | | | |
| | | | | | | | | | | 2,708,733 | |
| | | | | | | | | | | | |
TIMBER | | | 0.2% | | | | | | | | | |
Weyerhaeuser Co. | | | | 12,193 | | | | 419,683 | |
| | | | | | | | | | | | |
TOTAL REAL ESTATE | | | | | | | | 55,491,710 | |
| | | | | | | | | | | | |
TOLL ROADS—FOREIGN | | | 1.4% | | | | | | | | | |
Transurban Group (Australia) | | | | 97,025 | | | | 1,035,430 | |
Vinci SA (France) | | | | 20,982 | | | | 2,238,898 | |
Zhejiang Expressway Co., Ltd. (China)(H shares) | | | | 218,000 | | | | 194,014 | |
| | | | | | | | | | | | |
| | | | | | | | | | | 3,468,342 | |
| | | | | | | | | | | | |
UTILITIES | | | 2.1% | | | | | | | | | |
GAS UTILITIES—FOREIGN | | | 0.1% | | | | | | | | | |
Hong Kong and China Gas Co., Ltd. (Hong Kong) | | | | 218,600 | | | | 339,543 | |
| | | | | | | | | | | | |
MULTI-UTILITIES | | | 0.9% | | | | | | | | | |
NiSource, Inc. | | | | 23,945 | | | | 586,653 | |
Sempra Energy | | | | 11,763 | | | | 1,558,362 | |
| | | | | | | | | | | | |
| | | | | | | | | | | 2,145,015 | |
| | | | | | | | | | | | |
MULTI-UTILITIES—FOREIGN | | | 0.1% | | | | | | | | | |
Engie (France) | | | | 21,771 | | | | 298,266 | |
| | | | | | | | | | | | |
WATER UTILITIES | | | 0.7% | | | | | | | | | |
American Water Works Co., Inc. | | | | 7,294 | | | | 1,124,224 | |
Essential Utilities, Inc. | | | | 11,251 | | | | 514,171 | |
| | | | | | | | | | | | |
| | | | | | | | | | | 1,638,395 | |
| | | | | | | | | | | | |
See accompanying notes to the consolidated financial statements.
17
COHEN & STEERS REAL ASSETS FUND, INC.
CONSOLIDATED SCHEDULE OF INVESTMENTS—(Continued)
June 30, 2021 (Unaudited)
| | | | | | | | | | | | |
| | | | | | Shares | | | Value | |
WATER UTILITIES—FOREIGN | | | 0.3% | | | | | | | | | |
Guangdong Investment Ltd., (China) (H shares) | | | | 181,339 | | | $ | 260,647 | |
Pennon Group PLC (United Kingdom) | | | | 26,021 | | | | 408,722 | |
| | | | | | | | | | | | |
| | | | | | | | | | | 669,369 | |
| | | | | | | | | | | | |
TOTAL UTILITIES | | | | | | | | 5,090,588 | |
| | | | | | | | | | | | |
TOTAL COMMON STOCK
(Identified cost—$108,599,728) | | | | | | | | 134,149,471 | |
| | | | | | | | | | | | |
EXCHANGE-TRADED FUNDS—GOLD | | | 4.0% | | | | | | | | | |
iShares Gold Trust ETFa | | | | 78,450 | | | | 2,644,550 | |
SPDR Gold MiniShares Trusta | | | | 389,200 | | | | 6,853,812 | |
| | | | | | | | | | | | |
TOTAL EXCHANGE-TRADED FUNDS
(Identified cost—$8,734,066) | | | | | | | | 9,498,362 | |
| | | | | | | | | | | | |
PREFERRED SECURITIES—$25 PAR VALUE | | | 0.7% | | | | | | | | | |
BANKS | | | 0.6% | | | | | | | | | |
GMAC Capital Trust I, 5.941% (3 Month US LIBOR + 5.785%), due 2/15/40, Series 2 (TruPS) (FRN)d | | | | 3,020 | | | | 76,436 | |
PNC Financial Services Group, Inc., 6.125% to 5/1/22, Series Pe,f | | | | 32,735 | | | | 862,567 | |
US Bancorp, 6.50% to 1/15/22, Series Fe,f | | | | 24,200 | | | | 626,538 | |
| | | | | | | | | | | | |
| | | | | | | | | | | 1,565,541 | |
| | | | | | | | | | | | |
INSURANCE | | | 0.1% | | | | | | | | | |
Hartford Financial Services Group, Inc./The, 7.875% to 4/15/22, due 4/15/42f | | | | 7,000 | | | | 186,550 | |
| | | | | | | | | | | | |
TOTAL PREFERRED SECURITIES—$25 PAR VALUE
(Identified cost—$1,761,278) | | | | | | | | 1,752,091 | |
| | | | | | | | | | | | |
| | | |
| | | | | | Principal
Amount | | | | |
PREFERRED SECURITIES—CAPITAL SECURITIES | | | 4.6% | | | | | | | | | |
BANKS | | | 0.8% | | | | | | | | | |
JPMorgan Chase & Co., 3.98% (3 Month US LIBOR + 3.80%), Series Z (FRN)d,e | | | $ | 300,000 | | | | 1,026,264 | |
JPMorgan Chase & Co., 6.75% to 2/1/24, Series Se,f | | | | 300,000 | | | | 300,814 | |
PNC Financial Services Group, Inc./The, 6.75% to 8/1/21, Series Oe,f | | | | 375,000 | | | | 376,296 | |
See accompanying notes to the consolidated financial statements.
18
COHEN & STEERS REAL ASSETS FUND, INC.
CONSOLIDATED SCHEDULE OF INVESTMENTS—(Continued)
June 30, 2021 (Unaudited)
| | | | | | | | | | | | |
| | | | | | Principal
Amount | | | Value | |
Truist Bank, 0.769% (3 Month US LIBOR + 0.650%), due 3/15/28 (FRN)d | | | $ | 200,000 | | | $ | 195,041 | |
| | | | | | | | | | | | |
| | | | | | | | | | | 1,898,415 | |
| | | | | | | | | | | | |
BANKS—FOREIGN | | | 0.9% | | | | | | | | | |
Barclays PLC, 7.875% to 3/15/22 (United Kingdom)e,f,g,h | | | | 400,000 | | | | 417,700 | |
Credit Suisse Group AG, 7.125% to 7/29/22 (Switzerland)e,f,g,h | | | | 600,000 | | | | 626,544 | |
DNB Bank ASA, 6.50% to 3/26/22 (Norway)e,f,g,h | | | | 200,000 | | | | 207,562 | |
Natwest Group PLC, 8.625% to 8/15/21 (United Kingdom)e,f,h | | | | 200,000 | | | | 201,909 | |
Societe Generale SA, 7.375% to 9/13/21, 144A (France)b,e,f,h | | | | 300,000 | | | | 303,429 | |
Standard Chartered PLC, 7.75% to 4/2/23, 144A (United Kingdom)b,e,f,h | | | | 200,000 | | | | 218,538 | |
UBS Group AG, 7.125% to 8/10/21 (Switzerland)e,f,g,h | | | | 250,000 | | | | 251,563 | |
| | | | | | | | | | | | |
| | | | | | | | | | | 2,227,245 | |
| | | | | | | | | | | | |
ELECTRIC | | | 0.1% | | | | | | | | | |
Dominion Energy, Inc., 3.071%, due 8/15/24 | | | | 325,000 | | | | 344,804 | |
| | | | | | | | | | | | |
ELECTRIC—FOREIGN | | | 0.4% | | | | | | | | | |
Emera US Finance LP, due 6/15/24, 144A (Canada)(USD)b | | | | 80,000 | | | | 79,606 | |
Enel SpA, 8.75% to 9/24/23, due 9/24/73, 144A (Italy)(USD)b,f | | | | 800,000 | | | | 931,140 | |
| | | | | | | | | | | | |
| | | | | | | | | | | 1,010,746 | |
| | | | | | | | | | | | |
FINANCIAL | | | 0.1% | | | | | | | | | |
DIVERSIFIED FINANCIAL SERVICES | | | | | | | | | | | | |
Newmark Group, Inc., 6.125% due 11/15/23 | | | | 225,000 | | | | 247,936 | |
| | | | | | | | | | | | |
INSURANCE | | | 2.1% | | | | | | | | | |
LIFE/HEALTH INSURANCE | | | 0.6% | | | | | | | | | |
Prudential Financial, Inc., 5.625% to 6/15/23, due 6/15/43f | | | | 500,000 | | | | 536,814 | |
Prudential Financial, Inc., 5.875% to 9/15/22, due 9/15/42f | | | | 907,000 | | | | 958,928 | |
| | | | | | | | | | | | |
| | | | | | | | | | | 1,495,742 | |
| | | | | | | | | | | | |
See accompanying notes to the consolidated financial statements.
19
COHEN & STEERS REAL ASSETS FUND, INC.
CONSOLIDATED SCHEDULE OF INVESTMENTS—(Continued)
June 30, 2021 (Unaudited)
| | | | | | | | | | | | |
| | | | | | Principal
Amount | | | Value | |
LIFE/HEALTH INSURANCE—FOREIGN | | | 0.9% | | | | | | | | | |
Dai-ichi Life Insurance Co., Ltd./The, 7.25% to 7/25/21, 144A (Japan)(USD)b,e,f | | | $ | 750,000 | | | $ | 754,875 | |
Nippon Life Insurance Co., 5.00% to 10/18/22, due 10/18/42, 144A (Japan)(USD)b,f | | | | 1,200,000 | | | | 1,257,000 | |
| | | | | | | | | | | | |
| | | | | | | | | | | 2,011,875 | |
| | | | | | | | | | | | |
PROPERTY CASUALTY—FOREIGN | | | 0.6% | | | | | | | | | |
Mitsui Sumitomo Insurance Co., Ltd., 7.00% to 3/15/22, due 3/15/72, 144A (Japan)(USD)b,f | | | | 1,375,000 | | | | 1,432,399 | |
| | | | | | | | | | | | |
TOTAL INSURANCE | | | | | | | | 4,940,016 | |
| | | | | | | | | | | | |
REAL ESTATE | | | 0.2% | | | | | | | | | |
DATA CENTERS | | | | | | | | | | | | |
Equinix, Inc., 2.625%, due 11/18/24 | | | | 368,000 | | | | 387,366 | |
| | | | | | | | | | | | |
TOTAL PREFERRED SECURITIES—CAPITAL SECURITIES
(Identified cost—$10,971,244) | | | | | | | | 11,056,528 | |
| | | | | | | | | | | | |
CORPORATE BONDS | | | 3.7% | | | | | | | | | |
COMMUNICATIONS—TOWERS | | | 0.3% | | | | | | | | | |
American Tower Corp., 2.95%, due 1/15/25 | | | | 320,000 | | | | 340,596 | |
SBA Communications Corp., 4.875%, due 9/1/24 | | | | 425,000 | | | | 433,655 | |
| | | | | | | | | | | | |
| | | | | | | | | | | 774,251 | |
| | | | | | | | | | | | |
CONSUMER STAPLES | | | 0.1% | | | | | | | | | |
7-Eleven, Inc., 0.80%, due 2/10/24, 144Ab | | | | 160,000 | | | | 159,664 | |
| | | | | | | | | | | | |
ELECTRIC | | | 0.7% | | | | | | | | | |
DTE Energy Co., 2.529%, due 10/1/24, Series C | | | | 275,000 | | | | 289,675 | |
NextEra Energy Capital Holdings, Inc., 0.65%, due 3/1/23 | | | | 500,000 | | | | 502,162 | |
NextEra Energy Capital Holdings, Inc., 2.75%, due 5/1/25 | | | | 240,000 | | | | 255,086 | |
Progress Energy, Inc., 3.15%, due 4/1/22 | | | | 200,000 | | | | 202,915 | |
Southern California Edison Co., 0.70%, due 4/3/23 | | | | 260,000 | | | | 260,185 | |
Southern California Edison Co., 1.10%, due 4/1/24 | | | | 260,000 | | | | 261,864 | |
| | | | | | | | | | | | |
| | | | | | | | | | | 1,771,887 | |
| | | | | | | | | | | | |
FINANCIAL | | | 0.1% | | | | | | | | | |
DIVERSIFIED FINANCIAL SERVICES | | | | | | | | | | | | |
General Motors Financial Co., Inc., 1.736% (3 Month US LIBOR + 1.55%), due 1/14/22 (FRN)d | | | | 100,000 | | | | 100,689 | |
| | | | | | | | | | | | |
See accompanying notes to the consolidated financial statements.
20
COHEN & STEERS REAL ASSETS FUND, INC.
CONSOLIDATED SCHEDULE OF INVESTMENTS—(Continued)
June 30, 2021 (Unaudited)
| | | | | | | | | | | | |
| | | | | | Principal
Amount | | | Value | |
INTEGRATED TELECOMMUNICATIONS SERVICES | | | 0.7% | | | | | | | | | |
AT&T, Inc., 0.90%, due 3/25/24 | | | $ | 500,000 | | | $ | 501,139 | |
T-Mobile USA, Inc., 3.50%, due 4/15/25 | | | | 275,000 | | | | 298,804 | |
Verizon Communications, Inc., 0.75%, due 3/22/24 | | | | 500,000 | | | | 502,302 | |
Verizon Communications, Inc., 3.376%, due 2/15/25 | | | | 155,000 | | | | 168,498 | |
Verizon Communications, Inc. 1.256% (3 Month US LIBOR + 1.10%), due 5/15/25 (FRN)d | | | | 200,000 | | | | 206,378 | |
| | | | | | | | | | | | |
| | | | | | | | | | | 1,677,121 | |
| | | | | | | | | | | | |
REAL ESTATE | | | 1.8% | | | | | | | | | |
DATA CENTERS | | | 0.1% | | | | | | | | | |
Equinix, Inc., 1.25%, due 7/15/25 | | | | 200,000 | | | | 200,633 | |
| | | | | | | | | | | | |
DIVERSIFIED | | | 0.1% | | | | | | | | | |
National Retail Properties, Inc., 3.90%, due 6/15/24 | | | | 235,000 | | | | 253,966 | |
| | | | | | | | | | | | |
HEALTH CARE | | | 0.3% | | | | | | | | | |
Sabra Health Care LP, 5.125%, due 8/15/26 | | | | 70,000 | | | | 78,795 | |
Welltower, Inc., 3.625%, due 3/15/24 | | | | 390,000 | | | | 418,379 | |
Welltower, Inc., 4.50%, due 1/15/24 | | | | 100,000 | | | | 108,452 | |
| | | | | | | | | | | | |
| | | | | | | | | | | 605,626 | |
| | | | | | | | | | | | |
NET LEASE | | | 0.5% | | | | | | | | | |
Duke Realty LP, 3.625%, due 4/15/23 | | | | 444,000 | | | | 464,780 | |
Highwoods Realty LP, 3.625%, due 1/15/23 | | | | 250,000 | | | | 258,533 | |
VEREIT Operating Partnership LP, 4.60%, due 2/6/24 | | | | 100,000 | | | | 109,025 | |
WP Carey, Inc., 4.00%, due 2/1/25 | | | | 116,000 | | | | 126,669 | |
WP Carey, Inc., 4.60%, due 4/1/24 | | | | 325,000 | | | | 355,168 | |
| | | | | | | | | | | | |
| | | | | | | | | | | 1,314,175 | |
| | | | | | | | | | | | |
OFFICE | | | 0.3% | | | | | | | | | |
Brandywine Operating Partnership LP, 3.95%, due 2/15/23 | | | | 275,000 | | | | 286,864 | |
Kilroy Realty LP, 3.45%, due 12/15/24 | | | | 396,000 | | | | 422,901 | |
| | | | | | | | | | | | |
| | | | | | | | | | | 709,765 | |
| | | | | | | | | | | | |
SELF STORAGE | | | 0.2% | | | | | | | | | |
CubeSmart LP, 3.125%, due 9/1/26 | | | | 290,000 | | | | 310,423 | |
CubeSmart LP, 4.375%, due 12/15/23 | | | | 270,000 | | | | 291,840 | |
| | | | | | | | | | | | |
| | | | | | | | | | | 602,263 | |
| | | | | | | | | | | | |
See accompanying notes to the consolidated financial statements.
21
COHEN & STEERS REAL ASSETS FUND, INC.
CONSOLIDATED SCHEDULE OF INVESTMENTS—(Continued)
June 30, 2021 (Unaudited)
| | | | | | | | | | | | |
| | | | | | Principal
Amount | | | Value | |
SHOPPING CENTERS | | | 0.3% | | | | | | | | | |
Kimco Realty Corp., 3.125%, due 6/1/23 | | | $ | 85,000 | | | $ | 88,660 | |
Weingarten Realty Investors, 3.50%, due 4/15/23 | | | | 156,000 | | | | 162,813 | |
Weingarten Realty Investors, 3.85%, due 6/1/25 | | | | 150,000 | | | | 162,805 | |
Weingarten Realty Investors, 4.45%, due 1/15/24 | | | | 200,000 | | | | 215,195 | |
| | | | | | | | | | | | |
| | | | | | | | | | | 629,473 | |
| | | | | | | | | | | | |
TOTAL REAL ESTATE | | | | | | | | 4,315,901 | |
| | | | | | | | | | | | |
TOTAL CORPORATE BONDS
(Identified cost—$8,666,315) | | | | | | | | 8,799,513 | |
| | | | | | | | | | | | |
U.S. TREASURY INFLATION-PROTECTED SECURITIES | | | 0.2% | | | | | | | | | |
U.S. Treasury Inflation Indexed Bonds, 2.375%, due 1/15/25 | | | | 354,093 | | | | 411,595 | |
| | | | | | | | | | | | |
TOTAL U.S. TREASURY INFLATION-PROTECTED SECURITIES
(Identified cost—$388,085) | | | | | | | | 411,595 | |
| | | | | | | | | | | | |
| | | |
| | | | | | Shares | | | | |
SHORT-TERM INVESTMENTS | | | 30.9% | | | | | | | | | |
MONEY MARKET FUNDS | | | 3.8% | | | | | | | | | |
State Street Institutional Treasury Money Market Fund, Premier Class I, 0.01%i | | | | 9,242,828 | | | | 9,242,828 | |
| | | | | | | | | | | | |
| | | |
| | | | | | Principal
Amount | | | | |
U.S. TREASURY BILLS | | | 27.1% | | | | | | | | | |
United States Treasury Bills, 0.012%, due 7/1/21j | | | $ | 2,946,000 | | | | 2,946,000 | |
United States Treasury Bills, 0.00%, due 7/8/21j | | | | 19,000 | | | | 19,000 | |
United States Treasury Bills, 0.01%, due 7/8/21j | | | | 10,215,000 | | | | 10,214,981 | |
United States Treasury Bills, 0.079%, due 7/8/21j | | | | 65,000 | | | | 65,001 | |
United States Treasury Bills, 0.015%, due 7/15/21j,k | | | | 6,832,000 | | | | 6,831,960 | |
United States Treasury Bills, 0.005%, due 7/29/21j | | | | 3,797,000 | | | | 3,796,984 | |
United States Treasury Bills, 0.011%, due 8/5/21j | | | | 20,346,000 | | | | 20,345,792 | |
United States Treasury Bills, 0.011%, due 8/12/21j | | | | 2,016,000 | | | | 2,015,974 | |
United States Treasury Bills, 0.007%, due 8/19/21j | | | | 393,000 | | | | 392,996 | |
United States Treasury Bills, 0.005%, due 8/26/21j | | | | 2,939,000 | | | | 2,938,977 | |
United States Treasury Bills, 0.006%, due 8/26/21j | | | | 6,734,000 | | | | 6,733,937 | |
See accompanying notes to the consolidated financial statements.
22
COHEN & STEERS REAL ASSETS FUND, INC.
CONSOLIDATED SCHEDULE OF INVESTMENTS—(Continued)
June 30, 2021 (Unaudited)
| | | | | | | | | | | | |
| | | | | | Principal
Amount | | | Value | |
United States Treasury Bills, 0.022%, due 9/9/21j,k | | | $ | 8,628,000 | | | $ | 8,627,287 | |
| | | | | | | | | | | | |
| | | | | | | | | | | 64,928,889 | |
| | | | | | | | | | | | |
TOTAL SHORT-TERM INVESTMENTS
(Identified cost—$74,172,061) | | | | | | | | 74,171,717 | |
| | | | | | | | | | | | |
PURCHASED OPTION CONTRACTS | | | 0.0% | | | | | | | | | |
(Premiums paid—$78,332) | | | | | | | | 45,450 | |
| | | | | | | | | | | | |
TOTAL INVESTMENTSIN SECURITIES
(Identified cost—$213,371,109) | | | 100.1% | | | | | | | | 239,884,727 | |
WRITTEN OPTION CONTRACTS | | | (0.0) | | | | | | | | (22,815 | ) |
LIABILITIESIN EXCESSOF OTHER ASSETSl | | | (0.1) | | | | | | | | (317,415 | ) |
| | | | | | | | | | | | |
NET ASSETS | | | 100.0% | | | | | | | $ | 239,544,497 | |
| | | | | | | | | | | | |
Exchange-Traded Option Contracts
Purchased Options
| | | | | | | | | | | | | | | | | | | | | | |
| | | | | | | |
| Description | | Exercise
Price | | Expiration
Date | | | Number of
Contracts | | | Notional
Amountm | | | Premiums
Paid | | | Value | |
Call—Coffee C | | $170.00 | | | 8/13/21 | | | | 24 | | | | $1,437,750 | | | | $78,332 | | | | $45,450 | |
| | | | | | | | | | | | | | | | | | | | | | |
|
Written Options | |
| | | | | | | |
| Description | | Exercise
Price | | Expiration
Date | | | Number of
Contracts | | | Notional
Amountm | | | Premiums
Received | | | Value | |
Call—Coffee C | | $185.00 | | | 8/13/21 | | | | (24 | ) | | $ | (1,437,750 | ) | | | $(45,210) | | | | $(22,815) | |
| | | | | | | | | | | | | | | | | | | | | | |
Unfunded Subscription Agreement
| | | | | | | | | | | | | | | | | | | | | | |
| | | | | | | |
| Counterparty | | Referenced
Obligation | | Subscription
Price Per
Share | | | Notional
Amounto | | | Settlement
Daten | | | Unrealized
Appreciation
(Depreciation) | | | % of Net
Assets | |
Star Peak Corp. IIc | | Benson Hill,
Inc.a,n | | | $10.00 | | | | $375,000 | | | | 9/30/21 | | | | $(6,750) | | | | 0.00 | % |
| | | | | | | | | | | | | | | | | | | | | | |
The total amount of the Unfunded Subscription Agreement as presented in the table above is representative of the volume of activity for this derivative type during the period May 7, 2021 through June 30, 2021, which was the period the Fund had the Unfunded Subscription Agreement outstanding.
See accompanying notes to the consolidated financial statements.
23
COHEN & STEERS REAL ASSETS FUND, INC.
CONSOLIDATED SCHEDULE OF INVESTMENTS—(Continued)
June 30, 2021 (Unaudited)
Glossary of Portfolio Abbreviations
| | |
ADR | | American Depositary Receipt |
CAD | | Canadian Dollar |
ETF | | Exchange-Traded Fund |
FRN | | Floating Rate Note |
GBP | | Great British Pound |
LIBOR | | London Interbank Offered Rate |
REIT | | Real Estate Investment Trust |
SPDR | | Standard & Poor’s Depositary Receipt |
TruPS | | Trust Preferred Securities |
USD | | United States Dollar |
Note: Percentages indicated are based on the net assets of the Fund.
| a | Non-income producing security. |
| b | Securities exempt from registration under Rule 144A of the Securities Act of 1933. These securities may only be resold to qualified institutional buyers. Aggregate holdings amounted to $10,401,586 which represents 4.3% of the net assets of the Fund, of which 0.0% are illiquid. |
| c | Security value is determined based on significant unobservable inputs (Level 3). |
| d | Variable rate. Rate shown is in effect at June 30, 2021. |
| e | Perpetual security. Perpetual securities have no stated maturity date, but they may be called/redeemed by the issuer. |
| f | Security converts to floating rate after the indicated fixed-rate coupon period. |
| g | Securities exempt from registration under Regulation S of the Securities Act of 1933. These securities are subject to resale restrictions. Aggregate holdings amounted to $1,503,369 which represents 0.6% of the net assets of the Fund, of which 0.0% are illiquid. |
| h | Contingent Capital security (CoCo). CoCos are debt or preferred securities with loss absorption characteristics built into the terms of the security for the benefit of the issuer. Aggregate holdings amounted to $2,227,245 or 0.9% of the net assets of the Fund. |
| i | Rate quoted represents the annualized seven-day yield. |
| j | The rate shown is the effective yield on the date of purchase. |
| k | All or a portion of this security has been pledged as collateral for futures contracts. $7,575,864 in aggregate has been pledged as collateral to Morgan Stanley & Co. LLC. |
See accompanying notes to the consolidated financial statements.
24
COHEN & STEERS REAL ASSETS FUND, INC.
CONSOLIDATED SCHEDULE OF INVESTMENTS—(Continued)
June 30, 2021 (Unaudited)
| l | Liabilities in excess of other assets include unrealized appreciation/depreciation on open futures contracts at June 30, 2021. |
| m | Amount represents number of contracts multiplied by notional contract size multiplied by the underlying price. |
| n | Represents an unfunded subscription agreement with a special purpose acquisition company (SPAC) to purchase unregistered shares of a target company. The settlement date shown reflects the estimated date based upon the subscription agreement and is subject to change. The investment is restricted from resale until the shares are registered. Investment market value is determined based on significant unobservable inputs (Level 3). |
| o | Represents the number of shares multiplied by the subscription price. |
Futures Contracts
| | | | | | | | | | | | | | | | |
| | | | | | |
| Description | | Number of
Contracts | | Expiration
Date | | | Notional
Amount | | | Notional
Value | | Unrealized
Appreciation
(Depreciation) | |
LONG FUTURES OUTSTANDING | | | | | | | | | | | | | | |
| Aluminum HG LME | | 17 | | | July 19, 2021 | | | | $1,024,185 | | | $1,070,788 | | | $46,603 | |
| Aluminum HG LME | | 39 | | | August 16, 2021 | | | | 2,031,611 | | | 2,459,437 | | | 427,826 | |
| Aluminum HG LME | | 42 | | | November 15, 2021 | | | | 2,309,860 | | | 2,643,900 | | | 334,040 | |
| Aluminum HG LME | | 95 | | | December 15, 2021 | | | | 5,599,336 | | | 5,968,375 | | | 369,039 | |
| Aluminum HG LME | | 48 | | | January 17, 2022 | | | | 2,942,638 | | | 3,012,000 | | | 69,362 | |
| Brent Crude Oila | | 54 | | | July 30, 2021 | | | | 3,694,506 | | | 4,029,480 | | | 334,974 | |
| Brent Crude Oila | | 25 | | | September 30, 2021 | | | | 1,695,789 | | | 1,826,250 | | | 130,461 | |
| Cattle Feeder | | 13 | | | August 26, 2021 | | | | 963,526 | | | 1,005,063 | | | 41,537 | |
| Coffee C | | 37 | | | September 20, 2021 | | | | 2,213,334 | | | 2,216,531 | | | 3,197 | |
| Coffee C | | 18 | | | December 20, 2021 | | | | 1,096,471 | | | 1,097,887 | | | 1,416 | |
| Coffee Robusta | | 32 | | | September 24, 2021 | | | | 516,894 | | | 545,600 | | | 28,706 | |
| Copper | | 34 | | | December 29, 2021 | | | | 3,804,156 | | | 3,640,975 | | | (163,181 | ) |
| Corn | | 203 | | | September 14, 2021 | | | | 5,851,074 | | | 6,082,387 | | | 231,313 | |
| Cotton No. 2 | | 46 | | | December 8, 2021 | | | | 1,917,668 | | | 1,952,700 | | | 35,032 | |
| Gasoline | | 45 | | | August 31, 2021 | | | | 4,128,970 | | | 4,202,226 | | | 73,256 | |
| Gold | | 45 | | | October 27, 2021 | | | | 8,438,257 | | | 7,980,750 | | | (457,507 | ) |
| KC Wheat | | 42 | | | September 14, 2021 | | | | 1,328,755 | | | 1,383,900 | | | 55,145 | |
| Lean Hogsa | | 23 | | | October 14, 2021 | | | | 880,322 | | | 802,930 | | | (77,392 | ) |
| Live Cattle | | 47 | | | August 31, 2021 | | | | 2,280,282 | | | 2,307,230 | | | 26,948 | |
| Live Cattle | | 2 | | | October 29, 2021 | | | | 97,778 | | | 102,520 | | | 4,742 | |
| Low Sulphur Gasoil | | 73 | | | September 10, 2021 | | | | 4,211,498 | | | 4,378,175 | | | 166,677 | |
| Natural Gas | | 179 | | | August 27, 2021 | | | | 5,492,554 | | | 6,486,960 | | | 994,406 | |
| Nickel LME | | 31 | | | July 19, 2021 | | | | 3,270,227 | | | 3,386,316 | | | 116,089 | |
| Nickel LME | | 15 | | | August 16, 2021 | | | | 1,606,303 | | | 1,638,720 | | | 32,417 | |
See accompanying notes to the consolidated financial statements.
25
COHEN & STEERS REAL ASSETS FUND, INC.
CONSOLIDATED SCHEDULE OF INVESTMENTS—(Continued)
June 30, 2021 (Unaudited)
| | | | | | | | | | | | | | | | |
| | | | | | |
| Description | | Number of
Contracts | | Expiration
Date | | | Notional
Amount | | | Notional
Value | | Unrealized
Appreciation
(Depreciation) | |
| Nickel LME | | 3 | | | September 13, 2021 | | | | $ 331,124 | | | $ 327,852 | | | $ (3,272 | ) |
| Nickel LME | | 15 | | | October 18, 2021 | | | | 1,611,955 | | | 1,639,710 | | | 27,755 | |
| NY Harbor ULSD | | 47 | | | August 31, 2021 | | | | 4,193,940 | | | 4,206,002 | | | 12,062 | |
| Palladium | | 2 | | | September 28, 2021 | | | | 527,206 | | | 555,840 | | | 28,634 | |
| Silver | | 22 | | | September 28, 2021 | | | | 3,030,754 | | | 2,881,340 | | | (149,414 | ) |
| Soybean | | 62 | | | November 12, 2021 | | | | 4,343,466 | | | 4,336,900 | | | (6,566 | ) |
| Soybean Meal | | 50 | | | January 14, 2022 | | | | 1,952,780 | | | 1,900,500 | | | (52,280 | ) |
| Soybean Oil | | 104 | | | December 14, 2021 | | | | 3,745,917 | | | 3,916,224 | | | 170,307 | |
| Sugar 11 | | 27 | | | September 30, 2021 | | | | 525,681 | | | 540,994 | | | 15,313 | |
| Wheat | | 43 | | | September 14, 2021 | | | | 1,422,819 | | | 1,460,925 | | | 38,106 | |
| WTI Crude Oil | | 96 | | | August 20, 2021 | | | | 6,547,043 | | | 6,985,920 | | | 438,877 | |
| WTI Crude Oil | | 32 | | | October 20, 2021 | | | | 1,930,413 | | | 2,268,480 | | | 338,067 | |
| Zinc LME | | 54 | | | July 19, 2021 | | | | 3,850,290 | | | 4,009,837 | | | 159,547 | |
| Zinc LME | | 4 | | | September 13, 2021 | | | | 302,238 | | | 297,700 | | | (4,538 | ) |
| Zinc LME | | 27 | | | October 18, 2021 | | | | 1,932,599 | | | 2,008,800 | | | 76,201 | |
SHORT FUTURES OUTSTANDING | | | | | | | | | | | | | | | | |
| Aluminum HG LME | | 17 | | | July 19, 2021 | | | | (970,382 | ) | | (1,070,787) | | | (100,405 | ) |
| Aluminum HG LME | | 39 | | | August 16, 2021 | | | | (2,128,545 | ) | | (2,459,438) | | | (330,893 | ) |
| Aluminum HG LME | | 11 | | | September 13, 2021 | | | | (662,020 | ) | | (694,237) | | | (32,217 | ) |
| Aluminum HG LME | | 42 | | | November 15, 2021 | | | | (2,397,259 | ) | | (2,643,900) | | | (246,641 | ) |
| Aluminum HG LME | | 47 | | | December 15, 2021 | | | | (2,884,590 | ) | | (2,952,775) | | | (68,185 | ) |
| Aluminum HG LME | | 48 | | | January 17, 2022 | | | | (2,902,924 | ) | | (3,012,000) | | | (109,076 | ) |
| Brent Crude Oila | | 20 | | | October 29, 2021 | | | | (1,319,236 | ) | | (1,447,400) | | | (128,164 | ) |
| Copper | | 7 | | | September 28, 2021 | | | | (779,756 | ) | | (750,575) | | | 29,181 | |
| Corn | | 39 | | | December 14, 2021 | | | | (1,041,933 | ) | | (1,147,575) | | | (105,642 | ) |
| Gasoline | | 22 | | | November 30, 2021 | | | | (1,862,105 | ) | | (1,871,377) | | | (9,272 | ) |
| Gold | | 12 | | | August 27, 2021 | | | | (2,237,753 | ) | | (2,125,920) | | | 111,833 | |
| Lean Hogsa | | 17 | | | August 13, 2021 | | | | (789,717 | ) | | (702,100) | | | 87,617 | |
| Low Sulphur Gasoil | | 11 | | | December 10, 2021 | | | | (665,739 | ) | | (655,600) | | | 10,139 | |
| Natural Gas | | 11 | | | November 26, 2021 | | | | (375,867 | ) | | (411,730) | | | (35,863 | ) |
| Nickel LME | | 31 | | | July 19, 2021 | | | | (3,210,991 | ) | | (3,386,316) | | | (175,325 | ) |
| Nickel LME | | 15 | | | August 16, 2021 | | | | (1,609,505 | ) | | (1,638,720) | | | (29,215 | ) |
| Nickel LME | | 8 | | | September 13, 2021 | | | | (858,931 | ) | | (874,272) | | | (15,341 | ) |
| NY Harbor ULSD | | 20 | | | November 30, 2021 | | | | (1,803,342 | ) | | (1,787,856) | | | 15,486 | |
| Soybean Meal | | 18 | | | December 14, 2021 | | | | (661,233 | ) | | (687,060) | | | (25,827 | ) |
| WTI Crude Oil | | 22 | | | November 19, 2021 | | | | (1,388,708 | ) | | (1,542,860) | | | (154,152 | ) |
See accompanying notes to the consolidated financial statements.
26
COHEN & STEERS REAL ASSETS FUND, INC.
CONSOLIDATED SCHEDULE OF INVESTMENTS—(Continued)
June 30, 2021 (Unaudited)
| | | | | | | | | | | | | | | | |
| | | | | | |
| Description | | Number of
Contracts | | Expiration
Date | | | Notional
Amount | | | Notional
Value | | Unrealized
Appreciation
(Depreciation) | |
| Zinc LME | | 54 | | | July 19, 2021 | | | | $ (3,817,590 | ) | | $ (4,009,838) | | | $ (192,248 | ) |
| Zinc LME | | 22 | | | September 13, 2021 | | | | (1,687,011 | ) | | (1,637,350) | | | 49,661 | |
| Zinc LME | | 1 | | | October 18, 2021 | | | | (74,190 | ) | | (74,400) | | | (210 | ) |
| | | | |
| | | | | | | | | | | | | | | $2,459,146 | |
| | | | |
| a | Futures contracts are cash settled based upon the price of the underlying commodity. |
Glossary of Portfolio Abbreviations
| | |
HG | | High Grade |
LME | | London Metal Exchange |
ULSD | | Ultra Low Sulfur Diesel |
| | | | |
Country Summary | | % of Net
Assets | |
United States | | | 66.0 | |
Canada | | | 4.8 | |
Japan | | | 4.4 | |
United Kingdom | | | 3.0 | |
Australia | | | 2.8 | |
France | | | 2.7 | |
Germany | | | 1.7 | |
Hong Kong | | | 1.6 | |
China | | | 1.2 | |
Spain | | | 1.0 | |
Singapore | | | 0.8 | |
Sweden | | | 0.7 | |
Brazil | | | 0.7 | |
Italy | | | 0.7 | |
South Africa | | | 0.6 | |
Netherlands | | | 0.6 | |
Other (includes short-term investments) | | | 6.7 | |
| | | | |
| | | 100.0 | |
| | | | |
See accompanying notes to the consolidated financial statements.
27
COHEN & STEERS REAL ASSETS FUND, INC.
CONSOLIDATED STATEMENT OF ASSETS AND LIABILITIES
June 30, 2021 (Unaudited)
| | | | |
ASSETS: | |
Investments in securities, at value (Identified cost—$213,371,109) | | $ | 239,884,727 | |
Foreign currency, at value (Identified cost—$236,491) | | | 235,118 | |
Receivable for: | | | | |
Investment securities sold | | | 2,416,118 | |
Variation margin on futures contracts | | | 1,444,657 | |
Fund shares sold | | | 822,940 | |
Dividends and interest | | | 643,423 | |
Other assets | | | 17,348 | |
| | | | |
Total Assets | | | 245,464,331 | |
| | | | |
LIABILITIES: | |
Written option contracts, at value (Premiums received—$45,210) | | | 22,815 | |
Unrealized depreciation on unfunded subscription agreement | | | 6,750 | |
Payable for: | | | | |
Investment securities purchased | | | 4,941,649 | |
Fund shares redeemed | | | 411,586 | |
Dividends declared | | | 143,432 | |
Investment advisory fees | | | 82,817 | |
Shareholder servicing fees | | | 38,662 | |
Administration fees | | | 15,634 | |
Distribution fees | | | 253 | |
Other liabilities | | | 256,236 | |
| | | | |
Total Liabilities | | | 5,919,834 | |
| | | | |
NET ASSETS | | $ | 239,544,497 | |
| | | | |
NET ASSETS consist of: | |
Paid-in capital | | $ | 197,782,946 | |
Total distributable earnings/(accumulated loss) | | | 41,761,551 | |
| | | | |
| | $ | 239,544,497 | |
| | | | |
See accompanying notes to the consolidated financial statements.
28
COHEN & STEERS REAL ASSETS FUND, INC.
CONSOLIDATED STATEMENT OF ASSETS AND LIABILITIES—(Continued)
June 30, 2021 (Unaudited)
| | | | |
CLASS A SHARES: | |
NET ASSETS | | $ | 9,180,605 | |
Shares issued and outstanding ($0.001 par value common stock outstanding) | | | 866,702 | |
| | | | |
Net asset value and redemption price per share | | $ | 10.59 | |
| | | | |
Maximum offering price per share ($10.59 ÷ 0.955)a | | $ | 11.09 | |
| | | | |
CLASS C SHARES: | |
NET ASSETS | | $ | 3,044,308 | |
Shares issued and outstanding ($0.001 par value common stock outstanding) | | | 287,976 | |
| | | | |
Net asset value and offering price per shareb | | $ | 10.57 | |
| | | | |
CLASS I SHARES: | |
NET ASSETS | | $ | 222,251,987 | |
Shares issued and outstanding ($0.001 par value common stock outstanding) | | | 20,948,098 | |
| | | | |
Net asset value, offering and redemption price per share | | $ | 10.61 | |
| | | | |
CLASS R SHARES: | |
NET ASSETS | | $ | 70,476 | |
Shares issued and outstanding ($0.001 par value common stock outstanding) | | | 6,593 | |
| | | | |
Net asset value, offering and redemption price per share | | $ | 10.69 | |
| | | | |
CLASS Z SHARES: | |
NET ASSETS | | $ | 4,997,121 | |
Shares issued and outstanding ($0.001 par value common stock outstanding) | | | 471,848 | |
| | | | |
Net asset value, offering and redemption price per share | | $ | 10.59 | |
| | | | |
| a | On investments of $100,000 or more, the offering price is reduced. |
| b | Redemption price per share is equal to the net asset value per share less any applicable contingent deferred sales charge of 1.00% on shares held for less than one year. |
See accompanying notes to the consolidated financial statements.
29
COHEN & STEERS REAL ASSETS FUND, INC.
CONSOLIDATED STATEMENT OF OPERATIONS
For the Six Months Ended June 30, 2021 (Unaudited)
| | | | |
Investment Income: | |
Dividend income (net of $95,899 of foreign withholding tax) | | $ | 1,637,191 | |
Interest income | | | 198,668 | |
| | | | |
Total Investment Income | | | 1,835,859 | |
| | | | |
Expenses: | |
Investment advisory fees | | | 714,125 | |
Administration fees | | | 117,578 | |
Shareholder servicing fees—Class A | | | 4,138 | |
Shareholder servicing fees—Class C | | | 3,592 | |
Shareholder servicing fees—Class I | | | 67,465 | |
Professional fees | | | 69,360 | |
Custodian fees and expenses | | | 56,034 | |
Registration and filing fees | | | 49,523 | |
Shareholder reporting expenses | | | 22,635 | |
Distribution fees—Class A | | | 10,344 | |
Distribution fees—Class C | | | 10,776 | |
Distribution fees—Class R | | | 164 | |
Transfer agent fees and expenses | | | 15,904 | |
Directors’ fees and expenses | | | 5,017 | |
Miscellaneous | | | 9,645 | |
| | | | |
Total Expenses | | | 1,156,300 | |
Reduction of Expenses (See Note 2) | | | (365,560 | ) |
| | | | |
Net Expenses | | | 790,740 | |
| | | | |
Net Investment Income (Loss) | | | 1,045,119 | |
| | | | |
Net Realized and Unrealized Gain (Loss): | |
Net realized gain (loss) on: | |
Investments in securities | | | 5,667,672 | |
Futures contracts | | | 11,742,755 | |
Written option contracts | | | 68,642 | |
Foreign currency transactions | | | (11,501 | ) |
| | | | |
Net realized gain (loss) | | | 17,467,568 | |
| | | | |
Net change in unrealized appreciation (depreciation) on: | |
Investments in securities | | | 9,763,214 | |
Futures contracts | | | 141,504 | |
Written option contracts | | | (21,345 | ) |
Unfunded subscription agreement | | | (6,750 | ) |
Foreign currency translations | | | (4,732 | ) |
| | | | |
Net change in unrealized appreciation (depreciation) | | | 9,871,891 | |
| | | | |
Net Realized and Unrealized Gain (Loss) | | | 27,339,459 | |
| | | | |
Net Increase (Decrease) in Net Assets Resulting from Operations | | $ | 28,384,578 | |
| | | | |
See accompanying notes to the consolidated financial statements.
30
COHEN & STEERS REAL ASSETS FUND, INC.
CONSOLIDATED STATEMENT OF CHANGES IN NET ASSETS (Unaudited)
| | | | | | | | |
| | | For the
Six Months Ended
June 30, 2021 | | | For the
Year Ended
December 31, 2020 | |
Change in Net Assets: | | | | | | | | |
From Operations: | | | | | | | | |
Net investment income (loss) | | $ | 1,045,119 | | | $ | 1,553,398 | |
Net realized gain (loss) | | | 17,467,568 | | | | (6,790,886 | ) |
Net change in unrealized appreciation (depreciation) | | | 9,871,891 | | | | 5,725,691 | |
| | | | | | | | |
Net increase (decrease) in net assets resulting from operations | | | 28,384,578 | | | | 488,203 | |
| | | | | | | | |
Distributions to Shareholders: | | | | | | | | |
Class A | | | (38,011 | ) | | | (107,794 | ) |
Class C | | | (2,878 | ) | | | (24,732 | ) |
Class I | | | (1,249,898 | ) | | | (1,884,712 | ) |
Class R | | | (237 | ) | | | (742 | ) |
Class Z | | | (28,125 | ) | | | (72,008 | ) |
| | | | | | | | |
Total distributions | | | (1,319,149 | ) | | | (2,089,988 | ) |
| | | | | | | | |
Capital Stock Transactions: | | | | | | | | |
Increase (decrease) in net assets from Fund share transactions | | | 63,125,430 | | | | 28,775,775 | |
| | | | | | | | |
Total increase (decrease) in net assets | | | 90,190,859 | | | | 27,173,990 | |
Net Assets: | | | | | | | | |
Beginning of period | | | 149,353,638 | | | | 122,179,648 | |
| | | | | | | | |
End of period | | $ | 239,544,497 | | | $ | 149,353,638 | |
| | | | | | | | |
See accompanying notes to the consolidated financial statements.
31
COHEN & STEERS REAL ASSETS FUND, INC.
CONSOLIDATED FINANCIAL HIGHLIGHTS (Unaudited)
The following tables include selected data for a share outstanding throughout each period and other performance information derived from the consolidated financial statements. They should be read in conjunction with the consolidated financial statements and notes thereto.
| | | | | | | | | | | | | | | | | | | | | | | | |
| | | Class A | |
| | | For the Six
Months Ended
June 30, 2021 | | | For the Year Ended December 31, | |
Per Share Operating Data: | | 2020 | | | 2019 | | | 2018 | | | 2017 | | | 2016 | |
Net asset value, beginning of period | | | $9.15 | | | | $9.40 | | | | $8.23 | | | | $9.14 | | | | $8.73 | | | | $7.99 | |
| | | | | | | | | | | | | | | | | | | | | | | | |
Income (loss) from investment operations: | | | | | | | | | | | | | | | | | | | | | | | | |
| | | | | | |
Net investment income (loss)a | | | 0.03 | | | | 0.09 | | | | 0.16 | | | | 0.11 | | | | 0.09 | | | | 0.05 | |
Net realized and unrealized gain (loss) | | | 1.45 | | | | (0.22 | ) | | | 1.25 | | | | (0.89 | ) | | | 0.46 | | | | 0.91 | |
| | | | | | | | | | | | | | | | | | | | | | | | |
Total from investment operations | | | 1.48 | | | | (0.13 | ) | | | 1.41 | | | | (0.78 | ) | | | 0.55 | | | | 0.96 | |
| | | | | | | | | | | | | | | | | | | | | | | | |
Less dividends and distributions to shareholders from: | | | | | | | | | | | | | | | | | | | | | | | | |
| | | | | | |
Net investment income | | | (0.04 | ) | | | (0.09 | ) | | | (0.22 | ) | | | (0.12 | ) | | | (0.14 | ) | | | (0.20 | ) |
Net realized gain | | | — | | | | (0.03 | ) | | | (0.02 | ) | | | — | | | | — | | | | — | |
Tax return of capital | | | — | | | | — | | | | — | | | | (0.01 | ) | | | — | | | | (0.02 | ) |
| | | | | | | | | | | | | | | | | | | | | | | | |
Total dividends and distributions to shareholders | | | (0.04 | ) | | | (0.12 | ) | | | (0.24 | ) | | | (0.13 | ) | | | (0.14 | ) | | | (0.22 | ) |
| | | | | | | | | | | | | | | | | | | | | | | | |
Net increase (decrease) in net asset value | | | 1.44 | | | | (0.25 | ) | | | 1.17 | | | | (0.91 | ) | | | 0.41 | | | | 0.74 | |
| | | | | | | | | | | | | | | | | | | | | | | | |
Net asset value, end of period | | | $10.59 | | | | $9.15 | | | | $9.40 | | | | $8.23 | | | | $9.14 | | | | $8.73 | |
| | | | | | | | | | | | | | | | | | | | | | | | |
| | | | | | |
| | | | | | | | | | | | | | | | | | | | | | | | | |
Total returnb,c | | | 16.22 | %d | | | –1.22 | % | | | 17.19 | % | | | –8.61 | % | | | 6.33 | % | | | 11.99 | % |
| | | | | | | | | | | | | | | | | | | | | | | | |
| | | | | | |
| | | | | | | | | | | | | | | | | | | | | | | | | |
Ratios/Supplemental Data: | | | | | | | | | | | | | | | | | | | | | | | | |
| | | | | | |
Net assets, end of period (in millions) | | | $9.2 | | | | $8.4 | | | | $10.8 | | | | $9.4 | | | | $28.5 | | | | $12.9 | |
| | | | | | | | | | | | | | | | | | | | | | | | |
Ratios to average daily net assets: | | | | | | | | | | | | | | | | | | | | | | | | |
| | | | | | |
Expenses (before expense reduction) | | | 1.46 | %e | | | 1.69 | % | | | 1.62 | % | | | 1.51 | % | | | 1.51 | % | | | 1.69 | % |
| | | | | | | | | | | | | | | | | | | | | | | | |
Expenses (net of expense reduction) | | | 1.15 | %e | | | 1.15 | % | | | 1.15 | % | | | 1.14 | % | | | 1.11 | % | | | 1.24 | % |
| | | | | | | | | | | | | | | | | | | | | | | | |
Net investment income (loss) (before expense reduction) | | | 0.40 | %e | | | 0.58 | % | | | 1.26 | % | | | 0.88 | % | | | 0.62 | % | | | 0.18 | % |
| | | | | | | | | | | | | | | | | | | | | | | | |
Net investment income (loss) (net of expense reduction) | | | 0.71 | %e | | | 1.12 | % | | | 1.73 | % | | | 1.25 | % | | | 1.02 | % | | | 0.63 | % |
| | | | | | | | | | | | | | | | | | | | | | | | |
Portfolio turnover ratef | | | 43 | %d | | | 139 | % | | | 115 | % | | | 99 | % | | | 124 | % | | | 118 | % |
| | | | | | | | | | | | | | | | | | | | | | | | |
| a | Calculation based on average shares outstanding. |
| b | Return assumes the reinvestment of all dividends and distributions at net asset value. |
| c | Does not reflect sales charges, which would reduce return. |
| f | The Fund’s portfolio turnover rate is calculated in accordance with regulatory requirements, without regard to transactions involving short term investments and certain derivatives. If such transactions were included, the Fund’s portfolio turnover rate may be higher. |
See accompanying notes to the consolidated financial statements.
32
COHEN & STEERS REAL ASSETS FUND, INC.
CONSOLIDATED FINANCIAL HIGHLIGHTS (Unaudited)—(Continued)
| | | | | | | | | | | | | | | | | | | | | | | | |
| | | Class C | |
| | | For the Six
Months Ended
June 30, 2021 | | | For the Year Ended December 31, | |
Per Share Operating Data: | | 2020 | | | 2019 | | | 2018 | | | 2017 | | | 2016 | |
Net asset value, beginning of period | | | $9.13 | | | | $9.37 | | | | $8.21 | | | | $9.12 | | | | $8.71 | | | | $7.97 | |
| | | | | | | | | | | | | | | | | | | | | | | | |
Income (loss) from investment operations: | | | | | | | | | | | | | | | | | | | | | | | | |
| | | | | | |
Net investment income (loss)a | | | 0.00 | b | | | 0.04 | | | | 0.10 | | | | 0.06 | | | | 0.02 | | | | (0.01 | ) |
Net realized and unrealized gain (loss) | | | 1.45 | | | | (0.21 | ) | | | 1.23 | | | | (0.89 | ) | | | 0.46 | | | | 0.91 | |
| | | | | | | | | | | | | | | | | | | | | | | | |
Total from investment operations | | | 1.45 | | | | (0.17 | ) | | | 1.33 | | | | (0.83 | ) | | | 0.48 | | | | 0.90 | |
| | | | | | | | | | | | | | | | | | | | | | | | |
Less dividends and distributions to shareholders from: | | | | | | | | | | | | | | | | | | | | | | | | |
| | | | | | |
Net investment income | | | (0.01 | ) | | | (0.04 | ) | | | (0.15 | ) | | | (0.07 | ) | | | (0.07 | ) | | | (0.14 | ) |
Net realized gain | | | — | | | | (0.03 | ) | | | (0.02 | ) | | | — | | | | — | | | | — | |
Tax return of capital | | | — | | | | — | | | | — | | | | (0.01 | ) | | | — | | | | (0.02 | ) |
| | | | | | | | | | | | | | | | | | | | | | | | |
Total dividends and distributions to shareholders | | | (0.01 | ) | | | (0.07 | ) | | | (0.17 | ) | | | (0.08 | ) | | | (0.07 | ) | | | (0.16 | ) |
| | | | | | | | | | | | | | | | | | | | | | | | |
Net increase (decrease) in net asset value | | | 1.44 | | | | (0.24 | ) | | | 1.16 | | | | (0.91 | ) | | | 0.41 | | | | 0.74 | |
| | | | | | | | | | | | | | | | | | | | | | | | |
Net asset value, end of period | | | $10.57 | | | | $9.13 | | | | $9.37 | | | | $8.21 | | | | $9.12 | | | | $8.71 | |
| | | | | | | | | | | | | | | | | | | | | | | | |
| | | | | | |
| | | | | | | | | | | | | | | | | | | | | | | | | |
Total returnc,d | | | 15.88 | %e | | | –1.80 | % | | | 16.31 | % | | | –9.18 | % | | | 5.48 | % | | | 11.28 | % |
| | | | | | | | | | | | | | | | | | | | | | | | |
| | | | | | |
| | | | | | | | | | | | | | | | | | | | | | | | | |
Ratios/Supplemental Data: | | | | | | | | | | | | | | | | | | | | | | | | |
| | | | | | |
Net assets, end of period (in millions) | | | $3.0 | | | | $2.7 | | | | $4.3 | | | | $5.0 | | | | $6.6 | | | | $8.3 | |
| | | | | | | | | | | | | | | | | | | | | | | | |
Ratios to average daily net assets: | | | | | | | | | | | | | | | | | | | | | | | | |
| | | | | | |
Expenses (before expense reduction) | | | 2.11 | %f | | | 2.34 | % | | | 2.27 | % | | | 2.19 | % | | | 2.20 | % | | | 2.37 | % |
| | | | | | | | | | | | | | | | | | | | | | | | |
Expenses (net of expense reduction) | | | 1.80 | %f | | | 1.80 | % | | | 1.80 | % | | | 1.80 | % | | | 1.80 | % | | | 1.92 | % |
| | | | | | | | | | | | | | | | | | | | | | | | |
Net investment income (loss) (before expense reduction) | | | (0.24 | )%f | | | (0.02 | )% | | | 0.61 | % | | | 0.31 | % | | | (0.14 | )% | | | (0.59 | )% |
| | | | | | | | | | | | | | | | | | | | | | | | |
Net investment income (loss) (net of expense reduction) | | | 0.07 | %f | | | 0.52 | % | | | 1.08 | % | | | 0.70 | % | | | 0.26 | % | | | (0.14 | )% |
| | | | | | | | | | | | | | | | | | | | | | | | |
Portfolio turnover rateg | | | 43 | %e | | | 139 | % | | | 115 | % | | | 99 | % | | | 124 | % | | | 118 | % |
| | | | | | | | | | | | | | | | | | | | | | | | |
| a | Calculation based on average shares outstanding. |
| b | Amount is less than $0.005. |
| c | Return assumes the reinvestment of all dividends and distributions at net asset value. |
| d | Does not reflect sales charges, which would reduce return. |
| g | The Fund’s portfolio turnover rate is calculated in accordance with regulatory requirements, without regard to transactions involving short term investments and certain derivatives. If such transactions were included, the Fund’s portfolio turnover rate may be higher. |
See accompanying notes to the consolidated financial statements.
33
COHEN & STEERS REAL ASSETS FUND, INC.
CONSOLIDATED FINANCIAL HIGHLIGHTS (Unaudited)—(Continued)
| | | | | | | | | | | | | | | | | | | | | | | | |
| | | Class I | |
| | | For the Six
Months Ended
June 30, 2021 | | | For the Year Ended December 31, | |
Per Share Operating Data: | | 2020 | | | 2019 | | | 2018 | | | 2017 | | | 2016 | |
Net asset value, beginning of period | | | $9.16 | | | | $9.41 | | | | $8.24 | | | | $9.16 | | | | $8.75 | | | | $8.01 | |
| | | | | | | | | | | | | | | | | | | | | | | | |
Income (loss) from investment operations: | | | | | | | | | | | | | | | | | | | | | | | | |
| | | | | | |
Net investment income (loss)a | | | 0.06 | | | | 0.13 | | | | 0.19 | | | | 0.15 | | | | 0.11 | | | | 0.10 | |
Net realized and unrealized gain (loss) | | | 1.45 | | | | (0.22 | ) | | | 1.25 | | | | (0.90 | ) | | | 0.46 | | | | 0.89 | |
| | | | | | | | | | | | | | | | | | | | | | | | |
Total from investment operations | | | 1.51 | | | | (0.09 | ) | | | 1.44 | | | | (0.75 | ) | | | 0.57 | | | | 0.99 | |
| | | | | | | | | | | | | | | | | | | | | | | | |
Less dividends and distributions to shareholders from: | | | | | | | | | | | | | | | | | | | | | | | | |
| | | | | | |
Net investment income | | | (0.06 | ) | | | (0.13 | ) | | | (0.25 | ) | | | (0.16 | ) | | | (0.16 | ) | | | (0.23 | ) |
Net realized gain | | | — | | | | (0.03 | ) | | | (0.02 | ) | | | — | | | | — | | | | — | |
Tax return of capital | | | — | | | | — | | | | — | | | | (0.01 | ) | | | — | | | | (0.02 | ) |
| | | | | | | | | | | | | | | | | | | | | | | | |
Total dividends and distributions to shareholders | | | (0.06 | ) | | | (0.16 | ) | | | (0.27 | ) | | | (0.17 | ) | | | (0.16 | ) | | | (0.25 | ) |
| | | | | | | | | | | | | | | | | | | | | | | | |
Net increase (decrease) in net asset value | | | 1.45 | | | | (0.25 | ) | | | 1.17 | | | | (0.92 | ) | | | 0.41 | | | | 0.74 | |
| | | | | | | | | | | | | | | | | | | | | | | | |
Net asset value, end of period | | | $10.61 | | | | $9.16 | | | | $9.41 | | | | $8.24 | | | | $9.16 | | | | $8.75 | |
| | | | | | | | | | | | | | | | | | | | | | | | |
| | | | | | |
| | | | | | | | | | | | | | | | | | | | | | | | | |
Total returnb | | | 16.48 | %c | | | –0.85 | % | | | 17.58 | % | | | –8.31 | % | | | 6.62 | % | | | 12.32 | % |
| | | | | | | | | | | | | | | | | | | | | | | | |
| | | | | | |
| | | | | | | | | | | | | | | | | | | | | | | | | |
Ratios/Supplemental Data: | | | | | | | | | | | | | | | | | | | | | | | | |
| | | | | | |
Net assets, end of period (in millions) | | | $222.3 | | | | $133.9 | | | | $102.9 | | | | $111.1 | | | | $124.7 | | | | $143.9 | |
| | | | | | | | | | | | | | | | | | | | | | | | |
Ratios to average daily net assets: | | | | | | | | | | | | | | | | | | | | | | | | |
| | | | | | |
Expenses (before expense reduction) | | | 1.19 | %d | | | 1.42 | % | | | 1.34 | % | | | 1.26 | % | | | 1.26 | % | | | 1.41 | % |
| | | | | | | | | | | | | | | | | | | | | | | | |
Expenses (net of expense reduction) | | | 0.80 | %d | | | 0.80 | % | | | 0.80 | % | | | 0.80 | % | | | 0.80 | % | | | 0.91 | % |
| | | | | | | | | | | | | | | | | | | | | | | | |
Net investment income (loss) (before expense reduction) | | | 0.74 | %d | | | 0.87 | % | | | 1.54 | % | | | 1.27 | % | | | 0.81 | % | | | 0.72 | % |
| | | | | | | | | | | | | | | | | | | | | | | | |
Net investment income (loss) (net of expense reduction) | | | 1.13 | %d | | | 1.49 | % | | | 2.08 | % | | | 1.73 | % | | | 1.27 | % | | | 1.22 | % |
| | | | | | | | | | | | | | | | | | | | | | | | |
Portfolio turnover ratee | | | 43 | %c | | | 139 | % | | | 115 | % | | | 99 | % | | | 124 | % | | | 118 | % |
| | | | | | | | | | | | | | | | | | | | | | | | |
| a | Calculation based on average shares outstanding. |
| b | Return assumes the reinvestment of all dividends and distributions at net asset value. |
| e | The Fund’s portfolio turnover rate is calculated in accordance with regulatory requirements, without regard to transactions involving short term investments and certain derivatives. If such transactions were included, the Fund’s portfolio turnover rate may be higher. |
See accompanying notes to the consolidated financial statements.
34
COHEN & STEERS REAL ASSETS FUND, INC.
CONSOLIDATED FINANCIAL HIGHLIGHTS (Unaudited)—(Continued)
| | | | | | | | | | | | | | | | | | | | | | | | |
| | | Class R | |
| | | For the Six
Months Ended
June 30, 2021 | | | For the Year Ended December 31, | |
Per Share Operating Data: | | 2020 | | | 2019 | | | 2018 | | | 2017 | | | 2016 | |
Net asset value, beginning of period | | | $9.23 | | | | $9.48 | | | | $8.30 | | | | $9.22 | | | | $8.81 | | | | $8.01 | |
| | | | | | | | | | | | | | | | | | | | | | | | |
Income (loss) from investment operations: | | | | | | | | | | | | | | | | | | | | | | | | |
| | | | | | |
Net investment income (loss)a | | | 0.03 | | | | 0.08 | | | | 0.14 | | | | 0.11 | | | | 0.06 | | | | (0.06 | ) |
Net realized and unrealized gain (loss) | | | 1.47 | | | | (0.22 | ) | | | 1.26 | | | | (0.91 | ) | | | 0.46 | | | | 1.01 | |
| | | | | | | | | | | | | | | | | | | | | | | | |
Total from investment operations | | | 1.50 | | | | (0.14 | ) | | | 1.40 | | | | (0.80 | ) | | | 0.52 | | | | 0.95 | |
| | | | | | | | | | | | | | | | | | | | | | | | |
Less dividends and distributions to shareholders from: | | | | | | | | | | | | | | | | | | | | | | | | |
| | | | | | |
Net investment income | | | (0.04 | ) | | | (0.08 | ) | | | (0.20 | ) | | | (0.11 | ) | | | (0.11 | ) | | | (0.13 | ) |
Net realized gain | | | — | | | | (0.03 | ) | | | (0.02 | ) | | | — | | | | — | | | | — | |
Tax return of capital | | | — | | | | — | | | | — | | | | (0.01 | ) | | | — | | | | (0.02 | ) |
| | | | | | | | | | | | | | | | | | | | | | | | |
Total dividends and distributions to shareholders | | | (0.04 | ) | | | (0.11 | ) | | | (0.22 | ) | | | (0.12 | ) | | | (0.11 | ) | | | (0.15 | ) |
| | | | | | | | | | | | | | | | | | | | | | | | |
Net increase (decrease) in net asset value | | | 1.46 | | | | (0.25 | ) | | | 1.18 | | | | (0.92 | ) | | | 0.41 | | | | 0.80 | |
| | | | | | | | | | | | | | | | | | | | | | | | |
Net asset value, end of period | | | $10.69 | | | | $9.23 | | | | $9.48 | | | | $8.30 | | | | $9.22 | | | | $8.81 | |
| | | | | | | | | | | | | | | | | | | | | | | | |
| | | | | | |
| | | | | | | | | | | | | | | | | | | | | | | | | |
Total returnb | | | 16.21 | %c | | | –1.32 | % | | | 16.99 | % | | | –8.72 | % | | | 5.99 | % | | | 11.90 | % |
| | | | | | | | | | | | | | | | | | | | | | | | |
| | | | | | |
| | | | | | | | | | | | | | | | | | | | | | | | | |
Ratios/Supplemental Data: | | | | | | | | | | | | | | | | | | | | | | | | |
| | | | | | |
Net assets, end of period (in 000s) | | | $70.5 | | | | $60.6 | | | | $61.5 | | | | $59.2 | | | | $89.5 | | | | $250.7 | |
| | | | | | | | | | | | | | | | | | | | | | | | |
Ratios to average daily net assets: | | | | | | | | | | | | | | | | | | | | | | | | |
| | | | | | |
Expenses (before expense reduction) | | | 1.61 | %d | | | 1.84 | % | | | 1.77 | % | | | 1.69 | % | | | 1.70 | % | | | 1.90 | % |
| | | | | | | | | | | | | | | | | | | | | | | | |
Expenses (net of expense reduction) | | | 1.30 | %d | | | 1.30 | % | | | 1.30 | % | | | 1.30 | % | | | 1.30 | % | | | 1.45 | % |
| | | | | | | | | | | | | | | | | | | | | | | | |
Net investment income (loss) (before expense reduction) | | | 0.27 | %d | | | 0.45 | % | | | 1.10 | % | | | 0.79 | % | | | 0.32 | % | | | (1.10 | )% |
| | | | | | | | | | | | | | | | | | | | | | | | |
Net investment income (loss) (net of expense reduction) | | | 0.58 | %d | | | 0.99 | % | | | 1.57 | % | | | 1.18 | % | | | 0.72 | % | | | (0.65 | )% |
| | | | | | | | | | | | | | | | | | | | | | | | |
Portfolio turnover ratee | | | 43 | %c | | | 139 | % | | | 115 | % | | | 99 | % | | | 124 | % | | | 118 | % |
| | | | | | | | | | | | | | | | | | | | | | | | |
| a | Calculation based on average shares outstanding. |
| b | Return assumes the reinvestment of all dividends and distributions at net asset value. |
| e | The Fund’s portfolio turnover rate is calculated in accordance with regulatory requirements, without regard to transactions involving short term investments and certain derivatives. If such transactions were included, the Fund’s portfolio turnover rate may be higher. |
See accompanying notes to the consolidated financial statements.
35
COHEN & STEERS REAL ASSETS FUND, INC.
CONSOLIDATED FINANCIAL HIGHLIGHTS (Unaudited)—(Continued)
| | | | | | | | | | | | | | | | | | | | | | | | |
| | | Class Z | |
| | | For the Six
Months Ended
June 30, 2021 | | | For the Year Ended December 31, | |
Per Share Operating Data: | | 2020 | | | 2019 | | | 2018 | | | 2017 | | | 2016 | |
Net asset value, beginning of period | | | $9.14 | | | | $9.39 | | | | $8.23 | | | | $9.14 | | | | $8.74 | | | | $8.00 | |
| | | | | | | | | | | | | | | | | | | | | | | | |
Income (loss) from investment operations: | | | | | | | | | | | | | | | | | | | | | | | | |
| | | | | | |
Net investment income (loss)a | | | 0.05 | | | | 0.13 | | | | 0.19 | | | | 0.15 | | | | 0.11 | | | | 0.09 | |
Net realized and unrealized gain (loss) | | | 1.46 | | | | (0.22 | ) | | | 1.24 | | | | (0.89 | ) | | | 0.45 | | | | 0.90 | |
| | | | | | | | | | | | | | | | | | | | | | | | |
Total from investment operations | | | 1.51 | | | | (0.09 | ) | | | 1.43 | | | | (0.74 | ) | | | 0.56 | | | | 0.99 | |
| | | | | | | | | | | | | | | | | | | | | | | | |
Less dividends and distributions to shareholders from: | | | | | | | | | | | | | | | | | | | | | | | | |
| | | | | | |
Net investment income | | | (0.06 | ) | | | (0.13 | ) | | | (0.25 | ) | | | (0.16 | ) | | | (0.16 | ) | | | (0.23 | ) |
Net realized gain | | | — | | | | (0.03 | ) | | | (0.02 | ) | | | — | | | | — | | | | — | |
Tax return of capital | | | — | | | | — | | | | — | | | | (0.01 | ) | | | — | | | | (0.02 | ) |
| | | | | | | | | | | | | | | | | | | | | | | | |
Total dividends and distributions to shareholders | | | (0.06 | ) | | | (0.16 | ) | | | (0.27 | ) | | | (0.17 | ) | | | (0.16 | ) | | | (0.25 | ) |
| | | | | | | | | | | | | | | | | | | | | | | | |
Net increase (decrease) in net asset value | | | 1.45 | | | | (0.25 | ) | | | 1.16 | | | | (0.91 | ) | | | 0.40 | | | | 0.74 | |
| | | | | | | | | | | | | | | | | | | | | | | | |
Net asset value, end of period | | | $10.59 | | | | $9.14 | | | | $9.39 | | | | $8.23 | | | | $9.14 | | | | $8.74 | |
| | | | | | | | | | | | | | | | | | | | | | | | |
| | | | | | |
| | | | | | | | | | | | | | | | | | | | | | | | | |
Total returnb | | | 16.52 | %c | | | –0.85 | % | | | 17.48 | % | | | –8.22 | % | | | 6.51 | % | | | 12.48 | %d |
| | | | | | | | | | | | | | | | | | | | | | | | |
| | | | | | |
| | | | | | | | | | | | | | | | | | | | | | | | | |
Ratios/Supplemental Data: | | | | | | | | | | | | | | | | | | | | | | | | |
| | | | | | |
Net assets, end of period (in millions) | | | $5.0 | | | | $4.3 | | | | $4.1 | | | | $1.6 | | | | $2.0 | | | | $2.2 | |
| | | | | | | | | | | | | | | | | | | | | | | | |
Ratios to average daily net assets: | | | | | | | | | | | | | | | | | | | | | | | | |
| | | | | | |
Expenses (before expense reduction) | | | 1.11 | %e | | | 1.34 | % | | | 1.27 | % | | | 1.19 | % | | | 1.20 | % | | | 1.37 | % |
| | | | | | | | | | | | | | | | | | | | | | | | |
Expenses (net of expense reduction) | | | 0.80 | %e | | | 0.80 | % | | | 0.80 | % | | | 0.80 | % | | | 0.80 | % | | | 0.92 | % |
| | | | | | | | | | | | | | | | | | | | | | | | |
Net investment income (loss) (before expense reduction) | | | 0.77 | %e | | | 0.95 | % | | | 1.62 | % | | | 1.32 | % | | | 0.87 | % | | | 0.56 | % |
| | | | | | | | | | | | | | | | | | | | | | | | |
Net investment income (loss) (net of expense reduction) | | | 1.08 | %e | | | 1.49 | % | | | 2.09 | % | | | 1.71 | % | | | 1.27 | % | | | 1.01 | % |
| | | | | | | | | | | | | | | | | | | | | | | | |
Portfolio turnover ratef | | | 43 | %c | | | 139 | % | | | 115 | % | | | 99 | % | | | 124 | % | | | 118 | % |
| | | | | | | | | | | | | | | | | | | | | | | | |
| a | Calculation based on average shares outstanding. |
| b | Return assumes the reinvestment of all dividends and distributions at net asset value. |
| d | The net asset value (NAV) disclosed in the December 31, 2015 annual report reflects adjustments in accordance with accounting principles generally accepted in the United States of America and as such, differs from the NAV reported on December 31, 2015. The total return reported is based on the unadjusted NAV which was the official NAV for executing transactions on December 31, 2015. |
| f | The Fund’s portfolio turnover rate is calculated in accordance with regulatory requirements, without regard to transactions involving short term investments and certain derivatives. If such transactions were included, the Fund’s portfolio turnover rate would be higher. |
See accompanying notes to the consolidated financial statements.
36
COHEN & STEERS REAL ASSETS FUND, INC.
NOTES TO CONSOLIDATED FINANCIAL STATEMENTS (Unaudited)
Note 1. Organization and Significant Accounting Policies
Cohen & Steers Real Assets Fund, Inc. (the Fund) was incorporated under the laws of the State of Maryland on October 25, 2011 and is registered under the Investment Company Act of 1940 (the 1940 Act) as a diversified, open-end management investment company. The Fund’s investment objective is to provide attractive total returns over the long term and to maximize real returns during inflationary environments. The authorized shares of the Fund are divided into six classes designated Class A, C, F, I, R and Z shares. Each of the Fund’s shares has equal dividend, liquidation and voting rights (except for matters relating to distribution and shareholder servicing of such shares). Class F shares are not currently available for purchase.
Cohen & Steers Real Assets Fund Ltd. (the Subsidiary), a wholly-owned subsidiary of the Fund organized under the laws of the Cayman Islands, was incorporated on November 22, 2011 and commenced operations on January 31, 2012. The Subsidiary acts as an investment vehicle for the Fund in order to effect certain investments on behalf of the Fund, consistent with the Fund’s investment objectives and policies as described in the Fund’s prospectus. The Fund expects that it will achieve a significant portion of its exposure to commodities and commodities-related investments through investment in the Subsidiary. Unlike the Fund, the Subsidiary may invest without limitation in commodities. Investments in the Subsidiary are limited to 25% of the Fund’s total assets. The Consolidated Schedule of Investments includes positions of the Fund and the Subsidiary. The financial statements have been consolidated and include the accounts of the Fund and the Subsidiary. All significant inter-company balances and transactions have been eliminated in consolidation.
The following is a summary of significant accounting policies consistently followed by the Fund in the preparation of its consolidated financial statements. The Fund is an investment company and, accordingly, follows the investment company accounting and reporting guidance of the Financial Accounting Standards Board Accounting Standards Codification (ASC) Topic 946—Investment Companies. The accounting policies of the Fund are in conformity with accounting principles generally accepted in the United States of America (GAAP). The preparation of the consolidated financial statements in accordance with GAAP requires management to make estimates and assumptions that affect the reported amounts of assets and liabilities at the date of the consolidated financial statements and the reported amounts of income and expenses during the reporting period. Actual results could differ from those estimates.
Portfolio Valuation: Investments in securities that are listed on the New York Stock Exchange (NYSE) are valued, except as indicated below, at the last sale price reflected at the close of the NYSE on the business day as of which such value is being determined. If there has been no sale on such day, the securities are valued at the mean of the closing bid and ask prices on such day or, if no ask price is available, at the bid price. Futures contracts traded on a commodities exchange or board of trade are valued at their settlement price at the close of trading on such exchange or board of trade. Exchange-traded options are valued at their last sale price as of the close of options trading on applicable exchanges on the valuation date. In the absence of a last sale price on such day, options are valued at the average of the quoted bid and ask prices as of the close of business. Over-the-counter (OTC) options are valued based upon prices provided by a third-party pricing service or counterparty.
37
COHEN & STEERS REAL ASSETS FUND, INC.
NOTES TO CONSOLIDATED FINANCIAL STATEMENTS (Unaudited)—(Continued)
Securities not listed on the NYSE but listed on other domestic or foreign securities exchanges (including NASDAQ) are valued in a similar manner. Securities traded on more than one securities exchange are valued at the last sale price reflected at the close of the exchange representing the principal market for such securities on the business day as of which such value is being determined. If after the close of a foreign market, but prior to the close of business on the day the securities are being valued, market conditions change significantly, certain non-U.S. equity holdings may be fair valued pursuant to procedures established by the Board of Directors.
Readily marketable securities traded in the OTC market, including listed securities whose primary market is believed by Cohen & Steers Capital Management, Inc. (the investment advisor) to be OTC, are valued on the basis of prices provided by a third-party pricing service or third-party broker-dealers when such prices are believed by the investment advisor, pursuant to delegation by the Board of Directors, to reflect the fair value of such securities.
Fixed-income securities are valued on the basis of prices provided by a third-party pricing service or third-party broker-dealers when such prices are believed by the investment advisor, pursuant to delegation by the Board of Directors, to reflect the fair value of such securities. The pricing services or broker-dealers use multiple valuation techniques to determine fair value. In instances where sufficient market activity exists, the pricing services or broker-dealers may utilize a market-based approach through which quotes from market makers are used to determine fair value. In instances where sufficient market activity may not exist or is limited, the pricing services or broker-dealers also utilize proprietary valuation models which may consider market transactions in comparable securities and the various relationships between securities in determining fair value and/or characteristics such as benchmark yield curves, option-adjusted spreads, credit spreads, estimated default rates, coupon rates, anticipated timing of principal repayments, underlying collateral, and other unique security features which are then used to calculate the fair values.
Short-term debt securities with a maturity date of 60 days or less are valued at amortized cost, which approximates fair value. Investments in open-end mutual funds are valued at their closing net asset value (NAV).
The policies and procedures approved by the Fund’s Board of Directors delegate authority to make fair value determinations to the investment advisor, subject to the oversight of the Board of Directors. The investment advisor has established a valuation committee (Valuation Committee) to administer, implement and oversee the fair valuation process according to the policies and procedures approved annually by the Board of Directors. Among other things, these procedures allow the Fund to utilize independent pricing services, quotations from securities and financial instrument dealers and other market sources to determine fair value.
38
COHEN & STEERS REAL ASSETS FUND, INC.
NOTES TO CONSOLIDATED FINANCIAL STATEMENTS (Unaudited)—(Continued)
Securities for which market prices are unavailable, or securities for which the investment advisor determines that the bid and/or ask price or a counterparty valuation does not reflect market value, will be valued at fair value, as determined in good faith by the Valuation Committee, pursuant to procedures approved by the Fund’s Board of Directors. Circumstances in which market prices may be unavailable include, but are not limited to, when trading in a security is suspended, the exchange on which the security is traded is subject to an unscheduled close or disruption or material events occur after the close of the exchange on which the security is principally traded. In these circumstances, the Fund determines fair value in a manner that fairly reflects the market value of the security on the valuation date based on consideration of any information or factors it deems appropriate. These may include, but are not limited to, recent transactions in comparable securities, information relating to the specific security and developments in the markets.
Foreign equity fair value pricing procedures utilized by the Fund may cause certain non-U.S. equity holdings to be fair valued on the basis of fair value factors provided by a pricing service to reflect any significant market movements between the time the Fund values such securities and the earlier closing of foreign markets.
The Fund’s use of fair value pricing may cause the NAV of Fund shares to differ from the NAV that would be calculated using market quotations. Fair value pricing involves subjective judgments and it is possible that the fair value determined for a security may be materially different than the value that could be realized upon the sale of that security.
Fair value is defined as the price that the Fund would expect to receive upon the sale of an investment or expect to pay to transfer a liability in an orderly transaction with an independent buyer in the principal market or, in the absence of a principal market, the most advantageous market for the investment or liability. The hierarchy of inputs that are used in determining the fair value of the Fund’s investments is summarized below.
| | • | | Level 1—quoted prices in active markets for identical investments |
| | • | | Level 2—other significant observable inputs (including quoted prices for similar investments, interest rates, credit risk, etc.) |
| | • | | Level 3—significant unobservable inputs (including the Fund’s own assumptions in determining the fair value of investments) |
The inputs or methodology used for valuing investments may or may not be an indication of the risk associated with those investments. Changes in valuation techniques may result in transfers into or out of an assigned level within the disclosure hierarchy.
39
COHEN & STEERS REAL ASSETS FUND, INC.
NOTES TO CONSOLIDATED FINANCIAL STATEMENTS (Unaudited)—(Continued)
The following is a summary of the inputs used as of June 30, 2021 in valuing the Fund’s investments carried at value:
| | | | | | | | | | | | | | | | |
| | | Total | | | Quoted Prices
in Active
Markets for
Identical
Investments
(Level 1) | | | Other
Significant
Observable
Inputs
(Level 2) | | | Significant
Unobservable
Inputs
(Level 3) | |
Common Stock: | | | | | | | | | | | | | | | | |
Airports—Foreign | | $ | 626,663 | | | $ | 496,086 | | | $ | 130,577 | | | $ | — | |
Other | | | 133,522,808 | | | | 133,522,808 | | | | — | | | | — | |
Exchange-Traded Funds | | | 9,498,362 | | | | 9,498,362 | | | | — | | | | — | |
Preferred Securities— $25 Par Value | | | 1,752,091 | | | | 1,752,091 | | | | — | | | | — | |
Preferred Securities— Capital Securities | | | 11,056,528 | | | | — | | | | 11,056,528 | | | | — | |
Corporate Bonds | | | 8,799,513 | | | | — | | | | 8,799,513 | | | | — | |
U.S. Treasury Inflation Protected Bonds | | | 411,595 | | | | — | | | | 411,595 | | | | — | |
Short-Term Investments | | | 74,171,717 | | | | — | | | | 74,171,717 | | | | — | |
Purchased Option Contracts | | | 45,450 | | | | 45,450 | | | | — | | | | — | |
| | | | | | | | | | | | | | | | |
Total Investments in Securitiesa | | $ | 239,884,727 | | | $ | 145,314,797 | | | $ | 94,569,930 | | | $ | — | |
| | | | | | | | | | | | | | | | |
Futures Contracts | | $ | 5,131,972 | | | $ | 5,131,972 | | | $ | — | | | $ | — | |
| | | | | | | | | | | | | | | | |
Total Derivative Assetsa | | $ | 5,131,972 | | | $ | 5,131,972 | | | $ | — | | | $ | — | |
| | | | | | | | | | | | | | | | |
Futures Contracts | | $ | (2,672,826 | ) | | $ | (2,672,826 | ) | | $ | — | | | $ | — | |
Unfunded Subscription Agreement | | | (6,750 | ) | | | — | | | | — | | | | (6,750 | )b |
Written Option Contracts | | | (22,815 | ) | | | — | | | | (22,815 | ) | | | — | |
| | | | | | | | | | | | | | | | |
Total Derivative Liabilitiesa | | $ | (2,702,391 | ) | | $ | (2,672,826 | ) | | $ | (22,815 | ) | | $ | (6,750 | ) |
| | | | | | | | | | | | | | | | |
| a | Portfolio holdings are disclosed individually on the Consolidated Schedule of Investments. |
| b | Investment is valued based on the underlying stock price and significant unobservable inputs that factor in volatility and discount for lack of marketability, as such, this security has been fair valued by the Valuation Committee, pursuant to the Fund’s fair value procedures and classified as Level 3 security. |
40
COHEN & STEERS REAL ASSETS FUND, INC.
NOTES TO CONSOLIDATED FINANCIAL STATEMENTS (Unaudited)—(Continued)
The following is a reconciliation of investments for which significant unobservable inputs (Level 3) were used in determining fair value:
| | | | |
| | | Unfunded
Subscription
Agreement | |
Balance as of December 31, 2020 | | $ | — | |
Change in unrealized appreciation (depreciation) | | | (6,750 | ) |
| | | | |
Balance as of June 30, 2021 | | $ | (6,750 | ) |
| | | | |
The change in unrealized appreciation (depreciation) attributable to securities owned on June 30, 2021 which were valued using significant unobservable inputs (Level 3) amounted to $(6,750).
The following table summarizes the quantitative inputs and assumptions used for investments categorized in Level 3 of the fair value hierarchy.
| | | | | | | | | | | | | | | | | | |
| | | Fair Value at
June 30, 2021 | | | Valuation
Technique | | Unobservable
Inputs | | | Amount | | | Valuation Impact
from an
Increase in
Inputa | |
Unfunded Subscription Agreement | | $ | (6,750 | ) | | Market
Price less
Discount | | | Liquidity Discount | | | | 0.83 | % | | | Decrease | |
| a | Represents the directional change in the fair value of the Level 3 investments that could have resulted from an increase in the corresponding input as of period end. A decrease to the unobservable input would have had the opposite effect. Significant changes in these inputs may result in a materially higher or lower fair value measurement. |
Security Transactions, Investment Income and Expense Allocations: Security transactions are recorded on trade date. Realized gains and losses on investments sold are recorded on the basis of identified cost. Interest income, which includes the amortization of premiums and accretion of discounts, is recorded on the accrual basis. Inflation adjustments to the principal amount of inflation-adjusted securities are reflected as interest income or reductions to interest income. Dividend income is recorded on the ex-dividend date, except for certain dividends on foreign securities, which are recorded as soon as the Fund is informed after the ex-dividend date. Distributions from Real Estate Investment Trusts (REITs) are recorded as ordinary income, net realized capital gain or return of capital based on information reported by the REITs and management’s estimates of such amounts based on historical information. These estimates are adjusted when the actual source of distributions is disclosed by the REITs and actual amounts may differ from the estimated amounts. Distributions from Master Limited Partnerships (MLPs) are recorded as income and return of capital based on information reported by the MLPs and management’s estimates of such amounts based on historical information. These estimates are adjusted when the actual source of distributions is disclosed by the MLPs and actual amounts may differ from the estimated amounts. Income, expenses (other than expenses attributable to a specific class), and realized and unrealized gains or losses on investments are allocated to each class of shares based on its relative net assets.
41
COHEN & STEERS REAL ASSETS FUND, INC.
NOTES TO CONSOLIDATED FINANCIAL STATEMENTS (Unaudited)—(Continued)
Foreign Currency Translation: The books and records of the Fund are maintained in U.S. dollars. Investment securities and other assets and liabilities denominated in foreign currencies are translated into U.S. dollars based upon prevailing exchange rates on the date of valuation. Purchases and sales of investment securities and income and expense items denominated in foreign currencies are translated into U.S. dollars based upon prevailing exchange rates on the respective dates of such transactions. The Fund does not isolate that portion of the results of operations resulting from fluctuations in foreign exchange rates on investments from the fluctuations arising from changes in market prices of securities held. Such fluctuations are included with the net realized and unrealized gain or loss on investments.
Net realized foreign currency transaction gains or losses arise from sales of foreign currencies, (excluding gains and losses on forward foreign currency exchange contracts, which are presented separately, if any) currency gains or losses realized between the trade and settlement dates on securities transactions, and the difference between the amounts of dividends, interest, and foreign withholding taxes recorded on the Fund’s books and the U.S. dollar equivalent of the amounts actually received or paid. Net unrealized foreign currency translation gains and losses arise from changes in the values of assets and liabilities, other than investments in securities, on the date of valuation, resulting from changes in exchange rates. Pursuant to U.S. federal income tax regulations, certain foreign currency gains/losses included in realized and unrealized gains/losses are included in or are a reduction of ordinary income for federal income tax purposes.
Futures Contracts: The Fund uses futures contracts in order to gain exposure to the underlying commodities markets. Futures contracts provide for the delayed delivery of the underlying instrument at a fixed price or for a cash amount based on the change in the value of the underlying instrument at a specific date in the future. Upon entering into a futures contract, the Fund is required to deposit with the broker, cash or securities in an amount equal to a certain percentage of the contract amount, which is referred to as the initial margin deposit. Subsequent payments, referred to as variation margin, are made or received by the Fund periodically and are based on changes in the market value of open futures contracts. Changes in the market value of open futures contracts are recorded as change in unrealized appreciation or depreciation on futures in the Consolidated Statement of Operations. Realized gain or loss, representing the difference between the value of the contract at the time it was opened and the value at the time it was closed, is reported in the Consolidated Statement of Operations at the closing or expiration of the futures contract. Securities deposited as initial margin are designated as such on the Consolidated Schedule of Investments and cash deposited is recorded on the Consolidated Statement of Assets and Liabilities. A receivable from and/or a payable to brokers for the daily variation margin is also recorded on the Consolidated Statement of Assets and Liabilities.
The Fund may be subject to the risk that the change in the value of the futures contract may not correlate perfectly with the underlying instrument. Use of long futures contracts subjects the Fund to risk of loss, up to the notional value of the futures contracts. Use of short futures contracts subjects the Fund to unlimited risk of loss. With exchange traded futures contracts, the exchange or board of trade acts as the counterparty to futures transactions; therefore, the Fund’s credit risk is limited to failure of the exchange or board of trade. Additionally, credit risk exists in exchange traded futures contracts with respect to initial and variation margin that is held in a clearing broker’s customer accounts. While clearing brokers are required to segregate customer margin from their own assets, in the event that a
42
COHEN & STEERS REAL ASSETS FUND, INC.
NOTES TO CONSOLIDATED FINANCIAL STATEMENTS (Unaudited)—(Continued)
clearing broker becomes insolvent or goes into bankruptcy and at that time there is a shortfall in the aggregate amount of margin held by the clearing broker for all its clients, typically the shortfall would be allocated on a pro rata basis across all the clearing broker’s customers, potentially resulting in losses to the Fund.
Under some circumstances, futures exchanges may establish daily limits on the amount that the price of a futures contract can vary from the previous day’s settlement price, which could effectively prevent liquidation of certain positions. In certain circumstances, the futures commission merchant (FCM) can require additional margin on the futures contracts which would subject the Fund to counterparty credit risk with the FCM.
Morgan Stanley & Co. LLC serves as the Fund’s FCM for the purpose of trading in commodity futures contracts, options and interests therein.
U.S. Treasury Inflation-Protected Securities: U.S. Treasury Inflation-Protected Securities (TIPS) are fixed income securities whose principal value is periodically adjusted according to the rate of inflation. If the index measuring inflation rises or falls, the principal value of TIPS will be adjusted upward or downward, and consequently the interest payable on these securities (calculated with respect to a larger or smaller principal amount) will increase or decrease, respectively. Any upward or downward adjustment in the principal amount of an inflation-indexed security will be included as interest income in the Consolidated Statement of Operations, even though investors do not receive their principal until maturity. Repayment of the original principal upon maturity (as adjusted for inflation) is guaranteed in the case of TIPS.
Option Contracts: The Fund may purchase and write exchange-listed and OTC put or call options on securities, stock indices and other financial instruments for hedging purposes, to enhance portfolio returns and/or reduce overall volatility.
When the Fund writes (sells) an option, an amount equal to the premium received by the Fund is recorded on the Consolidated Statement of Assets and Liabilities as a liability. The amount of the liability is subsequently marked-to-market to reflect the current market value of the option written. When an option expires, the Fund realizes a gain on the option to the extent of the premium received. Premiums received from writing options which are exercised or closed are added to or offset against the proceeds or amount paid on the transaction to determine the realized gain or loss. If a put option on a security is exercised, the premium reduces the cost basis of the security purchased by the Fund. If a call option is exercised, the premium is added to the proceeds of the security sold to determine the realized gain or loss. The Fund, as writer of an option, bears the market risk of an unfavorable change in the price of the underlying index or security. Other risks include the possibility of an illiquid options market or the inability of the counterparties to fulfill their obligations under the contracts.
Put and call options purchased are accounted for in the same manner as portfolio securities. Premiums paid for purchasing options which expire are treated as realized losses. Premiums paid for purchasing options which are exercised or closed are added to the amounts paid or offset against the proceeds on the underlying investment transaction to determine the realized gain or loss when the underlying transaction is executed. The risk associated with purchasing an option is that the Fund pays a premium whether or not the option is exercised. Additionally, the Fund bears the risk of loss of the premium and change in market value should the counterparty not perform under the contract.
43
COHEN & STEERS REAL ASSETS FUND, INC.
NOTES TO CONSOLIDATED FINANCIAL STATEMENTS (Unaudited)—(Continued)
Unfunded Subscription Agreement: The Fund has entered into a subscription agreement with Star Peak Corp II (NYSE: STPC), a special purpose acquisition company (SPAC) to purchase $375,000 of unregistered shares of Benson Hill, Inc. Among other closing conditions, the closing of the Fund’s subscription for the shares is conditioned upon the substantially concurrent consummation of the business combination of STPC and Benson Hill. This business combination requires approval by shareholders of STPC. Assuming timely approval of the business combination and the satisfaction of the conditions relating thereto, the closing of the subscription is expected to occur in September 2021. At closing, the Fund will deliver cash in the amount of the purchase price and receive restricted PIPE (Private Investment in Public Equity) shares of Benson Hill, Inc. that will be registered within 90 days.
Dividends and Distributions to Shareholders: Dividends from net investment income and capital gain distributions are determined in accordance with U.S. federal income tax regulations, which may differ from GAAP. Dividends from net investment income, if any, are declared and paid semi-annually. Net realized capital gains, unless offset by any available capital loss carryforward, are typically distributed to shareholders at least annually. Dividends and distributions to shareholders are recorded on the ex-dividend date and are automatically reinvested in full and fractional shares of the Fund based on the NAV per share at the close of business on the payable date, unless the shareholder has elected to have them paid in cash.
Dividends from net investment income are subject to recharacterization for tax purposes. Based upon the results of operations for the six months ended June 30, 2021, the investment advisor considers it likely that a portion of the dividends will be reclassified to distributions from net realized gain and/or tax return of capital upon the final determination of the Fund’s taxable income after December 31, 2021, the Fund’s fiscal year end.
Income Taxes: It is the policy of the Fund to continue to qualify as a regulated investment company (RIC), if such qualification is in the best interest of the shareholders, by complying with the requirements of Subchapter M of the Internal Revenue Code applicable to RICs, and by distributing substantially all of its taxable earnings to its shareholders. Also, in order to avoid the payment of any federal excise taxes, the Fund will distribute substantially all of its net investment income and net realized gains on a calendar year basis. Accordingly, no provision for federal income or excise tax is necessary. Dividend and interest income from holdings in non-U.S. securities is recorded net of non-U.S. taxes paid. Management has analyzed the Fund’s tax positions taken on federal and applicable state income tax returns as well as its tax positions in non-U.S. jurisdictions in which it trades for all open tax years and has concluded that as of June 30, 2021, no additional provisions for income tax are required in the Fund’s consolidated financial statements. The Fund’s tax positions for the tax years for which the applicable statutes of limitations have not expired are subject to examination by the Internal Revenue Service, state departments of revenue and by foreign tax authorities.
The Subsidiary is classified as a controlled foreign corporation under the Internal Revenue Code. The Subsidiary’s taxable income, including net gains, is included, as ordinary income, in the calculation of the Fund’s taxable income. Net losses of the Subsidiary are not deductible by the Fund either in the current period or carried forward to future periods.
44
COHEN & STEERS REAL ASSETS FUND, INC.
NOTES TO CONSOLIDATED FINANCIAL STATEMENTS (Unaudited)—(Continued)
Note 2. Investment Advisory, Administration Fees and Other Transactions with Affiliates
Investment Advisory Fees: Cohen & Steers Capital Management, Inc. serves as the Fund’s and Subsidiary’s investment advisor pursuant to an investment advisory agreement (the investment advisory agreement). Under the terms of the investment advisory agreement, the investment advisor provides the Fund with day-to-day investment decisions and generally manages the Fund’s investments in accordance with the stated policies of the Fund, subject to the supervision of the Board of Directors.
For the services provided to the Fund, the investment advisor receives a fee, accrued daily and paid monthly, at an annual rate of 0.75% of the average daily net assets of the Fund.
For the six months ended June 30, 2021 and through June 30, 2023, the investment advisor has contractually agreed to waive its fee and/or reimburse expenses so that the Fund’s total annual operating expenses, which include the expenses of the Subsidiary (excluding acquired fund fees and expenses, taxes and extraordinary expenses), do not exceed 1.15% for Class A shares, 1.80% for Class C shares, 0.80% for Class I shares, 1.30% for Class R shares and 0.80% for Class Z shares . This contractual agreement can only be amended or terminated by agreement of the Fund’s Board of Directors and the investment advisor and will terminate automatically in the event of termination of the investment advisory agreement between the investment advisor and the Fund. For the six months ended June 30, 2021, fees waived and/or expenses reimbursed totaled $365,560.
Under subadvisory agreements between the investment advisor and each of Cohen & Steers Asia Limited and Cohen & Steers UK Limited (collectively, the subadvisors), affiliates of the investment advisor, the subadvisors are responsible for managing the Fund’s investments in certain non-U.S. holdings. For their services provided under the subadvisory agreements, the investment advisor (not the Fund) pays the subadvisors. The investment advisor allocates 50% of the investment advisory fee received from the Fund among itself and each subadvisor based on the portion of the Fund’s average daily net assets managed by the investment advisor and each subadvisor.
Administration Fees: The Fund has entered into an administration agreement with the investment advisor under which the investment advisor performs certain administrative functions for the Fund and receives a fee, accrued daily and paid monthly, at the annual rate of 0.08% of the average daily net assets of the Fund. For the six months ended June 30, 2021, the Fund incurred $76,173 in fees under this administration agreement. Additionally, the Fund pays State Street Bank and Trust Company as co-administrator under a fund accounting and administration agreement.
Distribution Fees: Shares of the Fund are distributed by Cohen & Steers Securities, LLC (the distributor), an affiliated entity of the investment advisor. The Fund has adopted a distribution and service plan (the plan) pursuant to Rule 12b-1 under the 1940 Act, which allows the Fund to pay distribution fees for the sale and distribution of its shares. The plan provides that the Fund will pay the distributor a fee, accrued daily and paid monthly, at an annual rate of up to 0.25% of the average daily net assets attributable to Class A shares, up to 0.75% of the average daily net assets attributable to Class C shares and up to 0.50% of the average daily net assets attributable to Class R shares. In addition, with respect to Class R shares, such amounts may also be used to pay for services to Fund shareholders or services related to the maintenance of shareholder accounts.
45
COHEN & STEERS REAL ASSETS FUND, INC.
NOTES TO CONSOLIDATED FINANCIAL STATEMENTS (Unaudited)—(Continued)
There is a maximum initial sales charge of 4.50% for Class A shares. There is a contingent deferred sales charge (CDSC) of 1.00% on purchases of $1 million or more of Class A shares, which applies if redemption occurs within one year from purchase. There is a maximum CDSC of 1.00% on Class C shares, which applies if redemption occurs within one year from purchase. For the six months ended June 30, 2021, the Fund has been advised that the distributor received $1,012, which represents a portion of the sales commissions paid by shareholders from the sale of Class A shares, and $8 of CDSC relating to redemptions of Class C shares. The distributor has advised the Fund that proceeds from the CDSC on this class are used by the distributor to defray its expenses related to providing distribution-related services to the Fund in connection with the sale of this class, including payments to dealers and other financial intermediaries for selling this class. The payment of a CDSC may result in the distributor receiving amounts greater or less than the upfront commission paid by the distributor to the financial intermediary.
Shareholder Servicing Fees: For shareholder services, the Fund pays the distributor or its affiliates a fee, accrued daily, at an annual rate of up to 0.10% of the average daily net assets of the Fund’s Class A and Class I shares and up to 0.25% of the average daily net assets of the Fund’s Class C shares. The distributor is responsible for paying qualified financial institutions for shareholder services.
Directors’ and Officers’ Fees: Certain directors and officers of the Fund are also directors, officers and/or employees of the investment advisor. The Fund does not pay compensation to directors and officers affiliated with the investment advisor except for the Chief Compliance Officer, who received compensation from the investment advisor, which was reimbursed by the Fund, in the amount of $502 for the six months ended June 30, 2021.
Note 3. Purchases and Sales of Securities
Purchases and sales of securities, excluding short-term investments, for the six months ended June 30, 2021, totaled $103,421,962 and $57,818,273, respectively. For the six months ended June 30, 2021, there were no purchases and sales of U.S. government obligations.
Note 4. Derivative Investments
The following tables present the value of derivatives held at June 30, 2021 and the effect of derivatives held during the six months ended June 30, 2021, along with the respective location in the consolidated financial statements.
46
COHEN & STEERS REAL ASSETS FUND, INC.
NOTES TO CONSOLIDATED FINANCIAL STATEMENTS (Unaudited)—(Continued)
Consolidated Statement of Assets and Liabilities
| | | | | | | | | | | | |
Derivatives | | Assets | | | Liabilities | |
| | Location | | Fair Value | | | Location | | Fair Value | |
Commodity Risk: | | | | | | | | | | | | |
| | | | |
Futures Contractsa | | Receivable for variation margin on futures contracts | | $ | 2,459,146 | b | | — | | $ | — | |
| | | | |
Purchased Option Contracts—Exchange-Tradeda | | Investments in securities, at value | | | 45,450 | | | — | | | — | |
| | | | |
Written Option Contracts—Exchange-Tradeda | | — | | | — | | | Written option contracts, at value | | | 22,815 | |
| | | | |
Equity Risk: | | | | | | | | | | | | |
| | | | |
Unfunded Subscription Agreements | | — | | | — | | | Unrealized depreciation | | | 6,750 | |
| a | Not subject to a master netting agreement or another similar arrangement. |
| b | Amount represents the cumulative appreciation on futures contracts as reported on the Consolidated Schedule of Investments. The Consolidated Statement of Assets and Liabilities only reflects the current day variation margin receivable from broker. |
Consolidated Statement of Operations
| | | | | | | | | | |
Derivatives | | Location | | Realized
Gain (Loss) | | | Change in
Unrealized
Appreciation
(Depreciation) | |
Commodity Risk: | | | | | | | | | | |
| | | |
Futures Contracts | | Net Realized and Unrealized Gain (Loss) | | $ | 11,742,755 | | | $ | 141,504 | |
| | | |
Purchased Option Contractsa | | Net Realized and Unrealized Gain (Loss) | | | (66,200 | ) | | | 53,103 | |
| | | |
Written Option Contracts | | Net Realized and Unrealized Gain (Loss) | | | 68,642 | | | | (21,345 | ) |
| | | |
Equity Risk: | | | | | | | | | | |
| | | |
Unfunded Subscription Agreement | | Net Realized and Unrealized Gain (Loss) | | | — | | | | (6,750 | ) |
| a | Purchased options are included in net realized gain (loss) and change in unrealized appreciation (depreciation) on investments in securities. |
47
COHEN & STEERS REAL ASSETS FUND, INC.
NOTES TO CONSOLIDATED FINANCIAL STATEMENTS (Unaudited)—(Continued)
The following summarizes the volume of the Fund’s futures contracts and option contracts activity during the six months ended June 30, 2021:
| | | | |
| | | Futures
Contracts | |
Average Notional Amount—Long | | $ | 78,678,174 | |
Average Notional Amount—Short | | | (24,026,416 | ) |
| | | | | | | | |
| | | Purchased
Option
Contractsa,b | | | Written
Option
Contractsa,b | |
Average Notional Amount | | $ | 1,929,210 | | | $ | 1,929,210 | |
| a | Average notional amounts represent the average for all months in which the Fund had option contracts outstanding at month end. For the period, this represents three months for purchased option contracts and three months for written option contracts. |
| b | Notional amount is calculated using the number of contracts multiplied by notional contract size multiplied by the underlying price. |
Note 5. Income Tax Information
As of June 30, 2021, the federal tax cost and net unrealized appreciation (depreciation) in value of investments held were as follows:
| | | | |
Cost of investments in securities for federal income tax purposes | | $ | 213,371,109 | |
| | | | |
Gross unrealized appreciation on investments | | $ | 32,207,583 | |
Gross unrealized depreciation on investments | | | (3,219,174 | ) |
| | | | |
Net unrealized appreciation (depreciation) on investments | | $ | 28,988,409 | |
| | | | |
As of December 31, 2020, the Fund has a net capital loss carryforward of $2,657,787 which may be used to offset future capital gains. These losses are a short-term capital loss carryforward of $2,657,787, which under current federal income tax rules, may offset capital gains recognized in any future period.
48
COHEN & STEERS REAL ASSETS FUND, INC.
NOTES TO CONSOLIDATED FINANCIAL STATEMENTS (Unaudited)—(Continued)
Note 6. Capital Stock
The Fund is authorized to issue 1.4 billion shares of capital stock, at a par value of $0.001 per share, classified in six classes as follows: 200 million of Class A capital stock, 200 million of Class C capital stock, 200 million of Class F capital stock, 400 million of Class I capital stock, 200 million of Class R capital stock and 200 million of Class Z capital stock. Class F shares are currently not available for purchase. The Board of Directors of the Fund may increase or decrease the aggregate number of shares of common stock that the Fund has authority to issue. With the exception of Class C shares held through certain intermediaries, Class C shares will automatically convert into Class A shares on a monthly basis approximately eight years after the original date of purchase. Transactions in Fund shares were as follows:
| | | | | | | | | | | | | | | | |
| | | For the
Six Months Ended
June 30, 2021 | | | For the
Year Ended
December 31, 2020 | |
| | | Shares | | | Amount | | | Shares | | | Amount | |
Class A: | |
Sold | | | 217,980 | | | $ | 2,152,023 | | | | 255,311 | | | $ | 2,170,225 | |
Issued as reinvestment of dividends and distributions | | | 2,073 | | | | 21,954 | | | | 11,132 | | | | 93,232 | |
Redeemed | | | (273,013 | ) | | | (2,603,189 | ) | | | (493,267 | ) | | | (4,147,504 | ) |
| | | | | | | | | | | | | | | | |
Net increase (decrease) | | | (52,960 | ) | | $ | (429,212 | ) | | | (226,824 | ) | | $ | (1,884,047 | ) |
| | | | | | | | | | | | | | | | |
|
Class C: | |
Sold | | | 17,745 | | | $ | 183,052 | | | | 26,175 | | | $ | 231,816 | |
Issued as reinvestment of dividends and distributions | | | 229 | | | | 2,424 | | | | 2,080 | | | | 17,212 | |
Redeemed | | | (23,785 | ) | | | (247,675 | ) | | | (195,774 | ) | | | (1,616,791 | ) |
| | | | | | | | | | | | | | | | |
Net increase (decrease) | | | (5,811 | ) | | $ | (62,199 | ) | | | (167,519 | ) | | $ | (1,367,763 | ) |
| | | | | | | | | | | | | | | | |
Class I: | |
Sold | | | 6,906,791 | | | $ | 69,398,710 | | | | 7,895,061 | | | $ | 65,199,976 | |
Issued as reinvestment of dividends and distributions | | | 105,841 | | | | 1,122,978 | | | | 191,468 | | | | 1,634,622 | |
Redeemed | | | (679,031 | ) | | | (6,872,097 | ) | | | (4,409,320 | ) | | | (35,130,168 | ) |
| | | | | | | | | | | | | | | | |
Net increase (decrease) | | | 6,333,601 | | | $ | 63,649,591 | | | | 3,677,209 | | | $ | 31,704,430 | |
| | | | | | | | | | | | | | | | |
49
COHEN & STEERS REAL ASSETS FUND, INC.
NOTES TO CONSOLIDATED FINANCIAL STATEMENTS (Unaudited)—(Continued)
| | | | | | | | | | | | | | | | |
| | | For the
Six Months Ended
June 30, 2021 | | | For the
Year Ended
December 31, 2020 | |
| | | Shares | | | Amount | | | Shares | | | Amount | |
|
Class R: | |
Sold | | | — | | | $ | — | | | | — | | | $ | — | |
Issued as reinvestment of dividends and distributions | | | 22 | | | | 237 | | | | 87 | | | | 742 | |
Redeemed | | | — | | | | — | | | | (1 | ) | | | (9 | ) |
| | | | | | | | | | | | | | | | |
Net increase (decrease) | | | 22 | | | $ | 237 | | | | 86 | | | $ | 733 | |
| | | | | | | | | | | | | | | | |
|
Class Z: | |
Sold | | | 32,886 | | | $ | 327,743 | | | | 95,242 | | | $ | 778,618 | |
Issued as reinvestment of dividends and distributions | | | 2,656 | | | | 28,125 | | | | 8,547 | | | | 72,008 | |
Redeemed | | | (38,804 | ) | | | (388,855 | ) | | | (64,567 | ) | | | (528,204 | ) |
| | | | | | | | | | | | | | | | |
Net increase (decrease) | | | (3,262 | ) | | $ | (32,987 | ) | | | 39,222 | | | $ | 322,422 | |
| | | | | | | | | | | | | | | | |
Note 7. Other Risks
Common Stock Risk: While common stocks have historically generated higher average returns than fixed-income securities over the long-term, common stocks have also experienced significantly more volatility in those returns, although under certain market conditions, fixed-income investments may have comparable or greater price volatility. The value of common stocks and other equity securities will fluctuate in response to developments concerning the company, political and regulatory circumstances, the stock market, and the economy. In the short term, stock prices can fluctuate dramatically in response to these developments. Different parts of the market and different types of equity securities can react differently to these developments. For example, stocks of large companies can react differently than stocks of smaller companies, and value stocks (stocks of companies that are undervalued by various measures and have potential for long-term capital appreciation), can react differently from growth stocks (stocks of companies with attractive cash flow returns on invested capital and earnings that are expected to grow). These developments can affect a single company, all companies within the same industry, economic sector or geographic region, or the stock market as a whole.
Commodities Risk: Investing in physical commodities, either directly or through complex instruments such as commodity futures contracts and options on commodity futures contracts presents unique risks, is speculative and can be extremely volatile. Market prices of commodities may fluctuate rapidly based on numerous factors including: drought, floods, weather, livestock disease, embargoes, tariffs and international economic, political and regulatory developments. Because the Fund has a significant portion of its assets concentrated in commodity-related derivative instruments, developments affecting commodities may have a disproportionate impact on the Fund. The Fund’s investment in
50
COHEN & STEERS REAL ASSETS FUND, INC.
NOTES TO CONSOLIDATED FINANCIAL STATEMENTS (Unaudited)—(Continued)
commodity-linked derivative instruments may subject the Fund to greater volatility than investments in traditional securities, particularly if the instruments involve leverage. The value of commodity-related derivative instruments may be affected by changes in overall market movements, commodity index volatility, changes in interest rates, or factors affecting a particular industry or commodity. The use of derivatives presents risks different from, and possibly greater than, the risks associated with investing directly in traditional securities. Among the risks presented are market risk, credit risk, counterparty risk, leverage risk and liquidity risk. In addition, the relationships between various commodities and related derivatives may not behave as expected. Use of leveraged commodity-related derivatives, if any, creates an opportunity for increased return but, at the same time, creates the possibility for greater loss (including the likelihood of greater volatility of the Fund’s net asset value).
Investments in commodity futures contracts and options on commodity futures contracts have a high degree of price variability and are subject to rapid and substantial price changes. Such investments could incur significant losses. There can be no assurance that the options strategy will be successful.
The use of options on commodity futures contracts is to enhance risk-adjusted total returns. The use of options, however, may not provide any, or only partial, protection for market declines. The return performance of the commodity futures contracts may not parallel the performance of the commodities or indexes that serve as the basis for the options it buys or sells; this basis risk may reduce overall returns.
Preferred Securities Risk: Preferred securities are subject to credit risk, which is the risk that a security will decline in price, or the issuer of the security will fail to make dividend, interest or principal payments when due, because the issuer experiences a decline in its financial status. Preferred securities are also subject to interest rate risk and may decline in value because of changes in market interest rates. The Fund may be subject to a greater risk of rising interest rates than would normally be the case in an environment of low interest rates and the effect of potential government fiscal policy initiatives and resulting market reaction to those initiatives. In addition, an issuer may be permitted to defer or omit distributions. Preferred securities are also generally subordinated to bonds and other debt instruments in a company’s capital structure. During periods of declining interest rates, an issuer may be able to exercise an option to redeem (call) its issue at par earlier than scheduled, and the Fund may be forced to reinvest in lower yielding securities. Certain preferred securities may be substantially less liquid than many other securities, such as common stocks. Generally, preferred security holders have no voting rights with respect to the issuing company unless certain events occur. Certain preferred securities may give the issuers special redemption rights allowing the securities to be redeemed prior to a specified date if certain events occur, such as changes to tax or securities laws.
Real Estate Market Risk: Risks of investing in real estate securities include falling property values due to increasing vacancies, declining rents resulting from economic, legal, tax, political or technological developments, lack of liquidity, limited diversification, and sensitivity to certain economic factors such as interest-rate changes and market recessions. Real estate company prices also may drop because of the failure of borrowers to pay their loans and poor management, and residential developers, in particular, could be negatively impacted by falling home prices, slower mortgage origination and rising construction costs. The risks of investing in REITs are similar to those associated with direct investments in real estate securities.
51
COHEN & STEERS REAL ASSETS FUND, INC.
NOTES TO CONSOLIDATED FINANCIAL STATEMENTS (Unaudited)—(Continued)
REIT Risk: In addition to the risks of securities linked to the real estate industry, REITs are subject to certain other risks related to their structure and focus. REITs are dependent upon management skills and generally may not be diversified. REITs are also subject to heavy cash flow dependency, defaults by borrowers and self-liquidation. In addition, REITs could possibly fail to (i) qualify for pass-through of income under applicable tax law, or (ii) maintain their exemptions from registration under the 1940 Act. The above factors may also adversely affect a borrower’s or a lessee’s ability to meet its obligations to the REIT. In the event of a default by a borrower or lessee, the REIT may experience delays in enforcing its rights as a mortgagee or lessor and may incur substantial costs associated with protecting its investments.
Small-and Medium-Sized Companies Risk: Real estate companies in the industry tend to be small- to medium-sized companies in relation to the equity markets as a whole. There may be less trading in a smaller company’s stock, which means that buy and sell transactions in that stock could have a larger impact on the stock’s price than is the case with larger company stocks. Smaller companies also may have fewer lines of business so that changes in any one line of business may have a greater impact on a smaller company’s stock price than is the case for a larger company. Further, smaller company stocks may perform differently in different cycles than larger company stocks. Accordingly, real estate company shares can, and at times will, perform differently than large company stocks.
Natural Resources Risk: The Fund’s investments in securities of natural resource companies involve risks. The market value of securities of natural resource companies may be affected by numerous factors, including events occurring in nature, inflationary pressures and international politics. Because the Fund invests significantly in natural resource companies, there is the risk that the Fund will perform poorly during a downturn in the natural resource sector. For example, events occurring in nature (such as earthquakes or fires in prime natural resource areas) and political events (such as coups, military confrontations or acts of terrorism) can affect the overall supply of a natural resource and the value of companies involved in such natural resource. Political risks and the other risks to which foreign securities are subject may also affect domestic natural resource companies if they have significant operations or investments in foreign countries. Rising interest rates and general economic conditions may also affect the demand for natural resources.
Infrastructure Companies Risk: Securities and instruments of infrastructure companies are more susceptible to adverse economic or regulatory occurrences affecting their industries. Infrastructure companies may be subject to a variety of factors that may adversely affect their business or operations, including high interest costs in connection with capital construction and improvement programs, high leverage, costs associated with environmental and other regulations, the effects of economic slowdown, surplus capacity, increased competition from other providers of services, uncertainties concerning the availability of fuel at reasonable prices, the effects of energy conservation policies and other factors. Infrastructure companies may also be affected by or subject to high interest costs in connection with capital construction and improvement programs; difficulty in raising capital in adequate amounts on reasonable terms in periods of high inflation and unsettled capital markets; inexperience with and potential losses resulting from a developing deregulatory environment; costs associated with compliance with and changes in environmental and other regulations; regulation by various government authorities; government regulation of rates charged to customers; service interruption due to
52
COHEN & STEERS REAL ASSETS FUND, INC.
NOTES TO CONSOLIDATED FINANCIAL STATEMENTS (Unaudited)—(Continued)
environmental, operational or other mishaps; the imposition of special tariffs and changes in tax laws, regulatory policies and accounting standards; technological innovations that may render existing plants, equipment or products obsolete; and general changes in market sentiment towards infrastructure and utilities assets.
Gold and Other Precious Metals Risk: Investments related to gold and other precious metals are considered speculative and are affected by a variety of worldwide economic, financial and political factors. The price of gold and other precious metals may fluctuate sharply over short periods of time due to changes in inflation or expectations regarding inflation in various countries, the availability of supplies of gold and other precious metals, changes in industrial and commercial demand, gold and other precious metals sales by governments, central banks or international agencies, investment speculation, monetary and other economic policies of various governments and government restrictions on private ownership of gold and other precious metals. No income is derived from holding physical gold or other precious metals, which is unlike securities that may pay dividends or make other current payments. Although the Fund has contractual protections with respect to the credit risk of their custodian, gold held in physical form (even in a segregated account) involves the risk of delay in obtaining the assets in the case of bankruptcy or insolvency of the custodian. This could impair disposition of the assets under those circumstances. If it holds physical gold, the Fund is also subject to an increased risk of loss and expense in connection with the transportation of such assets to and from the Fund’s custodian. In addition, gains derived from trading in gold and other precious metals may result in negative tax consequences due to appreciation in value, which could limit the ability of the Fund to sell its holdings of physical gold and certain ETFs at the desired time.
Foreign (Non-U.S.) and Emerging Market Securities Risk: The Fund directly purchases securities of foreign issuers. Risks of investing in foreign securities, which can be expected to be greater for investments in emerging markets, include currency risks, future political and economic developments and possible imposition of foreign withholding taxes on income or proceeds payable on the securities. In addition, there may be less publicly available information about a foreign issuer than about a domestic issuer, and foreign issuers may not be subject to the same accounting, auditing and financial recordkeeping standards and requirements as domestic issuers. Moreover, securities of many foreign issuers and their markets may be less liquid and their prices more volatile than securities of comparable U.S. issuers.
Derivatives Risk: The use of derivatives presents risks different from, and possibly greater than, the risks associated with investing directly in traditional securities. Among the risks presented are market risk, credit risk, counterparty risk, leverage risk and liquidity risk. The use of derivatives can lead to losses because of adverse movements in the price or value of the underlying asset, index or rate, which may be magnified by certain features of the derivatives. In addition, the use of derivatives to hedge the Fund’s foreign currency risks may reduce returns or increase volatility, perhaps substantially.
Tax Risk: The Fund’s ability to make direct and indirect investments in commodity-related derivative instruments and certain related investments, is limited by the Fund’s intention to qualify as a RIC under the Internal Revenue Code of 1986; if the Fund does not appropriately limit such investments or if such investments are recharacterized for U.S. tax purposes, the Fund’s status as a RIC may be jeopardized. The Fund’s investment in the Subsidiary is intended to provide additional exposure to
53
COHEN & STEERS REAL ASSETS FUND, INC.
NOTES TO CONSOLIDATED FINANCIAL STATEMENTS (Unaudited)—(Continued)
commodities while allowing the Fund to satisfy the requirements applicable to RICs. If the Fund were to fail to qualify as a RIC in any taxable year, and were ineligible to or otherwise did not cure such failure, the Fund would be subject to tax on its taxable income at corporate rates, and all distributions from earnings and profits, including any distributions of net long-term capital gains, would be taxable to shareholders as dividend income.
Subsidiary Risk: By investing in the Subsidiary, the Fund is indirectly exposed to the risks associated with the Subsidiary’s investments. The types of derivatives and other investments held by the Subsidiary generally are similar to those that are permitted to be held by the Fund and are subject to the same risks that apply to similar investments if held directly by the Fund. The Subsidiary is not registered under the 1940 Act and is not subject to all of the investor protections of the 1940 Act.
Changes in the laws of the United States and/or the Cayman Islands, under which the Fund and the Subsidiary are organized, respectively, could result in the inability of the Fund and/or the Subsidiary to operate as described in the Prospectus and the statement of additional information (SAI) and could negatively affect the Fund and its shareholders. For example, Cayman Islands law does not currently impose any income, corporate or capital gains tax, estate duty, inheritance tax, gift tax or withholding tax on the Subsidiary. If Cayman Islands law changes such that the Subsidiary must pay Cayman Islands governmental authority taxes, the Fund’s shareholders would likely suffer decreased investment returns.
Geopolitical Risk: Occurrence of global events similar to those in recent years, such as war, terrorist attacks, natural or environmental disasters, country instability, infectious disease epidemics, such as that caused by the COVID-19 virus, market instability, debt crises and downgrades, embargoes, tariffs, sanctions and other trade barriers and other governmental trade or market control programs, the potential exit of a country from its respective union and related geopolitical events, may result in market volatility and may have long-lasting impacts on both the U.S. and global financial markets. Additionally, those events, as well as other changes in foreign and domestic political and economic conditions, could adversely affect individual issuers or related groups of issuers, securities markets, interest rates, secondary trading, credit ratings, inflation, investor sentiment and other factors affecting the value of the Fund’s investments.
An outbreak of respiratory disease caused by a novel coronavirus designated as COVID-19 has resulted in, among other things, extreme volatility in the financial markets and severe losses, reduced liquidity of many instruments, significant travel restrictions, significant disruptions to business operations, supply chains and customer activity, lower consumer demand for goods and services, service and event cancellations, reductions and other changes, strained healthcare systems, as well as general concern and uncertainty. The impact of the COVID-19 outbreak has negatively affected the global economy, the economies of individual countries, and the financial performance of individual issuers, sectors, industries, asset classes, and markets in significant and unforeseen ways. Pandemics may also exacerbate other pre-existing political, social, economic, market and financial risks. The effects of the outbreak in developing or emerging market countries may be greater due to less established health care systems and supply chains. The COVID-19 pandemic and its effects may result in a sustained economic downturn or a global recession, ongoing market volatility and/or decreased liquidity in the financial markets, exchange trading suspensions and closures, higher default rates,
54
COHEN & STEERS REAL ASSETS FUND, INC.
NOTES TO CONSOLIDATED FINANCIAL STATEMENTS (Unaudited)—(Continued)
domestic and foreign political and social instability and damage to diplomatic and international trade relations. While some vaccines have been developed and approved for use by various governments, the political, social, economic, market and financial risks of COVID-19 could persist for years to come. The foregoing could impair the Fund’s ability to maintain operational standards (such as with respect to satisfying redemption requests), disrupt the operations of the Fund’s service providers, adversely affect the value and liquidity of the Fund’s investments, and negatively impact the Fund’s performance and your investment in the Fund.
On January 31, 2020, the United Kingdom (UK) withdrew from the European Union (EU) (referred to as Brexit), commencing a transition period that ended on December 31, 2020. On January 1, 2021, the EU-UK Trade and Cooperation Agreement, a bilateral trade and cooperation deal governing the future relationship between the UK and the EU, provisionally went into effect. The UK Parliament ratified the agreement in December 2020 and the EU Parliament ratified the agreement in April 2021. The agreement must now be approved by EU member states to enter into force officially. Brexit has resulted in volatility in European and global markets and could have negative long-term impacts on financial markets in the UK and throughout Europe. There is considerable uncertainty about the potential consequences of Brexit, the EU-UK Trade and Cooperation Agreement, how future negotiations of trade relations will proceed, and how the financial markets will react to all of the preceding. As this process unfolds, markets may be further disrupted. Given the size and importance of the UK’s economy, uncertainty about its legal, political and economic relationship with the remaining member states of the EU may continue to be a source of instability.
Growing tensions, including trade disputes, between the United States and other nations, or among foreign powers, and possible diplomatic, trade or other sanctions could adversely impact the global economy, financial markets and the Fund. The strengthening or weakening of the U.S. dollar relative to other currencies may, among other things, adversely affect the Fund’s investments denominated in non-U.S. dollar currencies. It is difficult to predict when similar events affecting the U.S. or global financial markets may occur, the effects that such events may have, and the duration of those effects.
Regulatory Risk: The U.S. government has proposed and adopted multiple regulations that could have a long-lasting impact on the Fund and on the mutual fund industry in general. The U.S Securities and Exchange Commission’s (SEC) final rules, related requirements and amendments to modernize reporting and disclosure, along with other potential upcoming regulations, could, among other things, restrict the Fund’s ability to engage in transactions, impact flows into the Fund and/or increase overall expenses of the Fund. In addition, the SEC, Congress, various exchanges and regulatory and self-regulatory authorities, both domestic and foreign, have undertaken reviews of the use of derivatives by registered investment companies, which could affect the nature and extent of instruments used by the Fund. While the full extent of all of these regulations is still unclear, these regulations and actions may adversely affect both the Fund and the instruments in which the Fund invests and its ability to execute its investment strategy. Similarly, regulatory developments in other countries may have an unpredictable and adverse impact on the Fund.
The SEC has recently adopted a rule relating to a registered investment company’s use of derivatives and similar transactions that could potentially require the Fund to observe more stringent requirements than are currently imposed by the 1940 Act. The new rule will replace present SEC and
55
COHEN & STEERS REAL ASSETS FUND, INC.
NOTES TO CONSOLIDATED FINANCIAL STATEMENTS (Unaudited)—(Continued)
SEC staff regulatory guidance related to limits on a registered investment company’s use of derivative instruments and certain other transactions, such as short sales and reverse repurchase agreements. The rule may substantially curtail the Fund’s ability to use derivative instruments as part of the Fund’s investment strategy and could ultimately prevent the Fund from being able to achieve its investment goals.
LIBOR Risk: Many financial instruments are tied to the London Interbank Offered Rate, or “LIBOR,” to determine payment obligations, financing terms, hedging strategies, or investment value. LIBOR is the offered rate for short-term Eurodollar deposits between major international banks. In 2017, the head of the UK Financial Conduct Authority (the FCA) announced a desire to phase out the use of LIBOR by the end of 2021. Alternatives to LIBOR are in development in many major financial markets. For example, the U.S. Federal Reserve has begun publishing a Secured Overnight Financing Rate (SOFR), a broad measure of secured overnight U.S. Treasury repo rates, as a possible replacement for U.S. dollar LIBOR. Bank working groups and regulators in other countries have suggested other alternatives for their markets, including the Sterling Overnight Interbank Average Rate (SONIA) in England. Other countries are introducing their own local-currency-denominated alternative reference rates for short-term lending and global consensus on alternative rates is lacking. The FCA and LIBOR’s administrator, ICE Benchmark Administration (IBA), announced a delay in the phase out of a majority of the U.S. dollar LIBOR publications until mid-2023, with the remainder of LIBOR publications to end at the end of 2021. It is possible that the FCA may compel the IBA to publish a subset of LIBOR settings after these dates on a “synthetic” basis, but any such publications would be considered non-representative of the underlying market. There remains uncertainty and risk regarding the willingness and ability of issuers and lenders to include enhanced provisions in new and existing contracts or instruments, the suitability of the proposed replacement rates, and the process for amending existing contracts and instruments remains unclear. As such, the transition away from LIBOR may lead to increased volatility and illiquidity in markets that are tied to LIBOR, reduced values of, inaccurate valuations of, and miscalculations of payment amounts for LIBOR-related investments or investments in issuers that utilize LIBOR, increased difficulty in borrowing or refinancing and reduced effectiveness of hedging strategies, adversely affecting the Fund’s performance or NAV. In addition, any alternative reference rate may be an ineffective substitute resulting in prolonged adverse market conditions for the Fund. Since the usefulness of LIBOR as a benchmark could deteriorate during the transition period, these effects could occur prior to the cessation of LIBOR publications.
Large Shareholder Risk: The Fund may have one or more large shareholders or a group of shareholders investing in Fund shares indirectly through an account, platform or program sponsored by a financial institution. Investment and asset allocation decisions by such financial institutions regarding the account, platform or program through which multiple shareholders invest may result in subscription and redemption decisions that have a significant impact on the assets, expenses and trading activities of the Fund. Such a decision may cause the Fund to sell assets (or invest cash) at disadvantageous times or prices, increase or accelerate taxable gains or transaction costs and may negatively affect the Fund’s NAV, performance, or ability to satisfy redemptions in a timely manner.
This is not a complete list of the risks of investing in the Fund. For additional information concerning the risks of investing in the Fund, please consult the Fund’s prospectus.
56
COHEN & STEERS REAL ASSETS FUND, INC.
NOTES TO CONSOLIDATED FINANCIAL STATEMENTS (Unaudited)—(Continued)
Note 8. Other
In the normal course of business, the Fund enters into contracts that provide general indemnifications. The Fund’s maximum exposure under these arrangements is dependent on claims that may be made against the Fund in the future and, therefore, cannot be estimated; however, based on experience, the risk of material loss from such claims is considered remote.
The Fund and its Subsidiary are commodity pools under the Commodity Exchange Act. The investment advisor has registered with the CFTC as a commodity pool operator with respect to the Fund and the Subsidiary. Because of its management of other strategies, the Fund’s investment advisor is also registered with the CFTC as a commodity trading advisor. The CFTC has neither reviewed nor approved the Fund’s investment strategies.
Note 9. Subsequent Events
Management has evaluated events and transactions occurring after June 30, 2021 through the date that the consolidated financial statements were issued, and has determined that no additional disclosure in the consolidated financial statements is required.
57
COHEN & STEERS REAL ASSETS FUND, INC.
OTHER INFORMATION
A description of the policies and procedures that the Fund uses to determine how to vote proxies relating to portfolio securities is available (i) without charge, upon request, by calling 800-330-7348, (ii) on our website at cohenandsteers.com or (iii) on the SEC’s website at http://www.sec.gov. In addition, the Fund’s proxy voting record for the most recent 12-month period ended June 30 is available by August 31 of each year (i) without charge, upon request, by calling 800-330-7348 or (ii) on the SEC’s website at http://www.sec.gov.
Disclosures of the Fund’s complete holdings are required to be made monthly on Form N-PORT, with every third month made available to the public by the SEC 60 days after the end of the Fund’s fiscal quarter. The Fund’s Form N-PORT is available (i) without charge, upon request, by calling 800-330-7348 or (ii) on the SEC’s website at http://www.sec.gov.
Please note that distributions paid by the Fund to shareholders are subject to recharacterization for tax purposes and are taxable up to the amount of the Fund’s investment company taxable income and net realized gains. Distributions in excess of the Fund’s net investment company taxable income and realized gains are a return of capital distributed from the Fund’s assets. The final tax treatment of all distributions is reported to shareholders on their 1099-DIV forms, which are mailed after the close of each calendar year.
Changes to the Board of Directors
On March 8, 2021, the Board of Directors voted to set the number of directors on the Fund’s Board of Directors to ten. In addition, the Board of Directors elected Ms. Ramona Rogers-Windsor as a Director of the Fund.
Ramona Rogers-Windsor: In addition to serving as a Director of the Cohen & Steers funds, Ms. Rogers-Windsor serves as a member of the Capital Southwest Board of Directors since March 2021 and a member of the Thomas Jefferson University Board of Trustees since December 2020. Previously, Ms. Rogers-Windsor spent over 23 years in investment management with Northwestern Mutual Investment Company, LLC, most recently as Managing Director and Portfolio Manager. Prior to that, Ms. Rogers-Windsor served as a financial officer with Northwestern Mutual Life. Ms. Rogers-Windsor has over 38 years of experience across multiple segments of the financial services industry and has previously served on the boards of several non-profit organizations. Ms. Rogers-Windsor holds a BS in Accounting from Marquette University and is a Certified Public Accountant and a Chartered Financial Analyst charterholder.
58
COHEN & STEERS REAL ASSETS FUND, INC.
APPROVAL OF INVESTMENT ADVISORY AND SUBADVISORY AGREEMENTS
The Board of Directors of the Fund, including a majority of the directors who are not parties to the Fund’s investment advisory and subadvisory agreements (the Advisory Agreements), or interested persons of any such party (the Independent Directors), has the responsibility under the Investment Company Act of 1940 to approve the Fund’s Advisory Agreements for their initial two year terms and their continuation annually thereafter at a meeting of the Board of Directors called for the purpose of voting on the approval or continuation. The Advisory Agreements were discussed at a meeting of the Independent Directors held on June 8, 2021, and at meetings of the full Board of Directors held on March 16, 2021 and June 15, 2021. The Independent Directors, in their capacity as the Contract Review Committee, also discussed the Advisory Agreements in executive session on June 15, 2021. At the meeting of the full Board of Directors on June 15, 2021, the Advisory Agreements were discussed and were unanimously continued for a term ending June 30, 2022 by the Fund’s Board of Directors, including the Independent Directors. The Independent Directors were represented by independent counsel who assisted them in their deliberations during the meetings and executive session.
In considering whether to continue the Advisory Agreements, the Board of Directors reviewed materials provided by an independent data provider, which included, among other items, fee, expense and performance information compared to peer funds (the Peer Funds and, collectively with the Fund, the Peer Group) and performance comparisons to a larger category universe; summary information prepared by the Fund’s investment advisor (the Investment Advisor); and a memorandum from counsel to the Independent Directors outlining the legal duties of the Board of Directors. The Board of Directors also considered a supplemental peer group compiled by the Investment Advisor when evaluating the Fund’s performance and fees and expenses; the Investment Advisor believes the supplemental peer group is more representative of the Fund’s investment strategy because most Peer Funds are not real assets focused funds. The Board of Directors also spoke directly with representatives of the independent data provider and met with investment advisory personnel. In addition, the Board of Directors considered information provided from time to time by the Investment Advisor throughout the year at meetings of the Board of Directors, including presentations by portfolio managers relating to the investment performance of the Fund and the investment strategies used in pursuing the Fund’s objective. The Board of Directors also considered information provided in response to a request for information submitted by counsel to the Independent Directors, as well as information provided in response to a supplemental request. Additionally, the Independent Directors noted that in connection with their considerations, that they had received information from the Investment Advisor about, and discussed with the Investment Advisor, the operations of its business continuity plan and related matters and the operations of third party service providers during the COVID-19 pandemic. In particular, the Board of Directors considered the following:
(i) The nature, extent and quality of services to be provided by the Investment Advisor and the Subadvisors: The Board of Directors reviewed the services that the Investment Advisor and the sub-investment advisors (the Subadvisors) provide to the Fund, including, but not limited to, making the day-to-day investment decisions for the Fund, placing orders for the investment and reinvestment of the Fund’s assets, furnishing information to the Board of Directors of the Fund regarding the Fund’s portfolio, providing individuals to serve as Fund officers, and, for the Investment Advisor, generally managing the Fund’s investments in accordance with the stated policies of the Fund. The Board of Directors also discussed with officers and portfolio managers of the Fund the types of transactions
59
COHEN & STEERS REAL ASSETS FUND, INC.
conducted on behalf of the Fund. Additionally, the Board of Directors took into account the services provided by the Investment Advisor and the Subadvisors to other funds and accounts, including those that have investment objectives and strategies similar to those of the Fund. The Board of Directors also considered the education, background and experience of the Investment Advisor’s and Subadvisors’ personnel, particularly noting the potential benefit that the portfolio managers’ work experience and favorable reputation can have on the Fund. The Board of Directors further noted the Investment Advisor’s and Subadvisors’ ability to attract qualified and experienced personnel. The Board of Directors also considered the administrative services provided by the Investment Advisor, including compliance and accounting services. After consideration of the above factors, among others, the Board of Directors concluded that the nature, extent and quality of services provided by the Investment Advisor and the Subadvisors are satisfactory and appropriate.
(ii) Investment performance of the Fund and the Investment Advisor and the Subadvisors: The Board of Directors considered the investment performance of the Fund versus Peer Funds and compared to a relevant linked blended benchmark. The Board of Directors noted that the Fund outperformed the Peer Group median for the one- and three-year periods and underperformed for the five-year period ended March 31, 2021, ranking the Fund in the second, second and fourth quintiles, respectively. The Board of Directors also considered that the Fund outperformed the linked blended benchmark for the one- and three- year periods, ended March 31, 2021 and underperformed the linked blended benchmark for the five-year period ended March 31, 2021. The Board of Directors also considered the Fund’s performance as compared to a supplemental peer group compiled by the Investment Advisor, and noted that the Fund outperformed for the one- and three-year periods ended March 31, 2021 and performed in-line with the supplemental peer group median for the five-year period ended March 31, 2021, ranking three out of eight peers, three out of eight peers and five out of seven peers, respectively. The Board of Directors engaged in discussions with the Investment Advisor regarding the contributors to and detractors from the Fund’s performance during the period, including the relevant implications of the continuing COVID-19 pandemic. The Board of Directors also considered supplemental information provided by the Investment Advisor, including a narrative summary of various factors affecting performance and the Investment Advisor’s performance in managing similarly managed funds and accounts. The Board of Directors determined that Fund performance, in light of all the considerations noted above, supported the continuation of the Advisory Agreements.
(iii) Cost of the services to be provided and profits to be realized by the Investment Advisor from the relationship with the Fund: The Board of Directors considered the contractual and actual management fees paid by the Fund as well as the Fund’s total expense ratio. As part of its analysis, the Board of Directors gave consideration to the fee and expense analyses provided by the independent data provider. The Board of Directors noted that the Fund’s actual management fee is the lowest in the Peer Group, ranking the Fund in the first quintile. The Fund’s total expense ratio is lower than the Peer Group median, ranking the Fund in the first quintile. The Board of Directors considered that the Investment Advisor continues to waive a portion of its fees and/or reimburse expenses to limit the overall operating expenses of the Fund. The Board of Directors also considered the Fund’s fees and expenses versus the supplemental peer group compiled by the Investment Advisor, and noted that the Fund’s total expense ratio is lower than the supplemental peer group median, ranking four out of eight peers. The Fund’s actual management fee is lower than the supplemental peer group median, ranking four out of eight peers. The Board of Directors, in considering the Fund’s fees and expenses, took into account
60
COHEN & STEERS REAL ASSETS FUND, INC.
the additional complexity associated with managing a Fund with multiple investment disciplines. In light of the considerations above, the Board of Directors concluded that the Fund’s expense structure was satisfactory.
The Board of Directors also reviewed information regarding the profitability to the Investment Advisor of its relationship with the Fund. The Board of Directors considered the level of the Investment Advisor’s profits and whether the profits were reasonable for the Investment Advisor. Since the Subadvisors are paid by the Investment Advisor (and not by the Fund) for investment services provided to the Fund and are affiliates of the Investment Advisor, the Board of Directors considered the profitability of the Investment Advisor as a whole and did not consider the Subadvisors separate profitability to be particularly relevant to their determination. The Board of Directors took into consideration other benefits to be derived by the Investment Advisor in connection with the Advisory Agreement, noting particularly the research and related services, within the meaning of Section 28(e) of the Securities Exchange Act of 1934, that the Investment Advisor receives by allocating the Fund’s brokerage transactions. The Board of Directors further considered that the Investment Advisor continues to reinvest profits back in the business, including upgrading and/or implementing new trading, compliance and accounting systems, and by adding investment personnel to the portfolio management teams. The Board of Directors also considered the administrative services provided by the Investment Advisor and the associated administration fee paid to the Investment Advisor for such services under the Administration Agreement. The Board of Directors determined that the services received under the Administration Agreement are beneficial to the Fund. The Board of Directors noted that because of the Fund’s asset size, the operating expenses continue to be subsidized, and the Fund is not yet profitable.
(iv) The extent to which economies of scale would be realized as the Fund grows and whether fee levels would reflect such economies of scale: The Board of Directors considered the Fund’s asset size and determined that there were not at this time significant economies of scale that were not being shared with shareholders. In considering economies of scale, the Board of Directors also noted, as discussed above in (iii), that the Investment Advisor continues to reinvest profits back in the business.
(v) Comparison of services to be rendered and fees to be paid to those under other investment advisory contracts, such as contracts of the same and other investment advisors or other clients: As discussed above in (iii), the Board of Directors compared the fees paid under the Advisory Agreements to those under other investment advisory contracts of other investment advisors managing Peer Funds. The Board of Directors also compared the services rendered and fees paid under the Advisory Agreements to fees paid, including the ranges of such fees, under the Investment Advisor’s other fund advisory agreements and advisory contracts with institutional and other clients with similar investment mandates, noting that the Investment Advisor provides more services to the Fund than it does for institutional or subadvised accounts. The Board of Directors also considered the entrepreneurial risk and financial exposure assumed by the Investment Advisor in developing and managing the Fund that the Investment Advisor does not have with institutional and other clients and other differences in the management of registered investment companies and institutional accounts. The Board of Directors determined that on a comparative basis the fees under the Advisory Agreements were reasonable in relation to the services provided.
61
COHEN & STEERS REAL ASSETS FUND, INC.
No single factor was cited as determinative to the decision of the Board of Directors, and each Director may have assigned different weights to the various factors. Rather, after weighing all of the considerations and conclusions discussed above, the Board of Directors, including the Independent Directors, unanimously approved the continuation of the Advisory Agreements.
LIQUIDITY RISK MANAGEMENT PROGRAM
Pursuant to Rule 22e-4 under the Investment Company Act of 1940 (the Liquidity Rule), the Fund has adopted and implemented a liquidity risk management program (the Program). The Liquidity Rule requires an open-end investment company to adopt a program that is reasonably designed to assess and manage its liquidity risk, which is the risk that an open-end investment company could not meet redemption requests without significant dilution of remaining investors’ interests in the open-end investment company. The Board has designated Cohen & Steers Capital Management, Inc. (the Investment Advisor) as the administrator of the Program. The Investment Advisor has delegated this responsibility to the Liquidity Risk Management Committee (the LRM Committee), which is comprised of representatives from various departments within the Investment Advisor. The Program includes policies and procedures reasonably designed to: (1) assess, manage, and periodically review the Fund’s liquidity risk; (2) classify the Fund’s portfolio investments as highly liquid, moderately liquid, less liquid, or illiquid; (3) determine a highly liquid investment minimum (HLIM) for the Fund or determine that one is not required; (4) limit the Fund’s illiquid investments to no more than 15% of its net assets; and (5) establish how and when the Fund will engage in in-kind redemptions.
The Board met on June 15, 2021 (the Meeting) to review the Program. At the Meeting, the LRM Committee provided the Board with a report that addressed the operation of the Program, including its implementation and effectiveness in assessing and managing the Fund’s liquidity risk (the Report). The Report covered the period from April 1, 2020 through March 31, 2021 (the Reporting Period).
The Report described the LRM Committee’s role in administering the Program, which complied with the Liquidity Rule requirements for assessing, managing and reviewing the Fund’s liquidity risk through the LRM Committee’s daily monitoring and quarterly analysis of liquidity parameters which include historical net redemption activity and consideration of the Fund’s shareholder ownership concentration, as applicable. The Report noted that the Fund’s investments are categorized into one of four liquidity buckets: highly liquid, moderately liquid, less liquid and illiquid. Liquidity classifications take into account a variety of market, trading, and investment factors, including the Fund’s reasonably anticipated trade size. The Investment Advisor has engaged a third-party vendor to assist with the classification of portfolio investments. The Report also described the LRM Committee’s determination that the Fund is a primarily highly liquid fund under the Liquidity Rule.
The Report noted that there were no liquidity events during the Reporting Period that materially impacted the Fund’s ability to timely meet redemptions without significantly diluting remaining shareholders’ interests. The Report concluded that the Program is operating as intended, effective in implementing the requirements of the Liquidity Rule and reasonably designed to assess and manage the Fund’s liquidity risk.
There can be no assurance that the Program will achieve its objectives in the future. Please refer to the Fund’s prospectus for more information regarding the Fund’s exposure to liquidity risk and other principal risks to which an investment in the Fund may be subject.
62
COHEN & STEERS REAL ASSETS FUND, INC.
Cohen & Steers Privacy Policy
| | |
| | |
| Facts | | What Does Cohen & Steers Do With Your Personal Information? |
| |
| Why? | | Financial companies choose how they share your personal information. Federal law gives consumers the right to limit some but not all sharing. Federal law also requires us to tell you how we collect, share, and protect your personal information. Please read this notice carefully to understand what we do. |
| |
| What? | | The types of personal information we collect and share depend on the product or service you have with us. This information can include: • Social Security number and account balances • Transaction history and account transactions • Purchase history and wire transfer instructions |
| |
| How? | | All financial companies need to share customers’ personal information to run their everyday business. In the section below, we list the reasons financial companies can share their customers’ personal information; the reasons Cohen & Steers chooses to share; and whether you can limit this sharing. |
| | | | |
| Reasons we can share your personal information | | Does Cohen & Steers share? | | Can you limit this sharing? |
| | |
For our everyday business purposes— such as to process your transactions, maintain your account(s), respond to court orders and legal investigations, or reports to credit bureaus | | Yes | | No |
| | |
For our marketing purposes— to offer our products and services to you | | Yes | | No |
| | |
| For joint marketing with other financial companies— | | No | | We don’t share |
| | |
For our affiliates’ everyday business purposes— information about your transactions and experiences | | No | | We don’t share |
| | |
For our affiliates’ everyday business purposes— information about your creditworthiness | | No | | We don’t share |
| | |
| For our affiliates to market to you— | | No | | We don’t share |
| | |
| For non-affiliates to market to you— | | No | | We don’t share |
| | |
| | | | |
| | | |
| Questions? Call 800.330.7348 | | | | |
63
COHEN & STEERS REAL ASSETS FUND, INC.
Cohen & Steers Privacy Policy—(Continued)
| | |
| | |
| Who we are | | |
| |
| Who is providing this notice? | | Cohen & Steers Capital Management, Inc., Cohen & Steers Asia Limited, Cohen & Steers Japan Limited, Cohen & Steers UK Limited, Cohen & Steers Ireland Limited, Cohen & Steers Securities, LLC, Cohen & Steers Private Funds and Cohen & Steers Open and Closed-End Funds (collectively, Cohen & Steers). |
| |
| What we do | | |
| |
| How does Cohen & Steers protect my personal information? | | To protect your personal information from unauthorized access and use, we use security measures that comply with federal law. These measures include computer safeguards and secured files and buildings. We restrict access to your information to those employees who need it to perform their jobs, and also require companies that provide services on our behalf to protect your information. |
| |
| How does Cohen & Steers collect my personal information? | | We collect your personal information, for example, when you: • Open an account or buy securities from us • Provide account information or give us your contact information • Make deposits or withdrawals from your account We also collect your personal information from other companies. |
| |
| Why can’t I limit all sharing? | | Federal law gives you the right to limit only: • sharing for affiliates’ everyday business purposes—information about your creditworthiness • affiliates from using your information to market to you • sharing for non-affiliates to market to you State law and individual companies may give you additional rights to limit sharing. |
| |
| Definitions | | |
| |
| Affiliates | | Companies related by common ownership or control. They can be financial and nonfinancial companies. • Cohen & Steers does not share with affiliates. |
| |
| Non-affiliates | | Companies not related by common ownership or control. They can be financial and nonfinancial companies. • Cohen & Steers does not share with non-affiliates. |
| |
| Joint marketing | | A formal agreement between non-affiliated financial companies that together market financial products or services to you. • Cohen & Steers does not jointly market. |
64
COHEN & STEERS REAL ASSETS FUND, INC.
Cohen & Steers Open-End Mutual Funds
COHEN & STEERS REALTY SHARES
| • | | Designed for investors seeking total return, investing primarily in U.S. real estate securities |
| • | | Symbols: CSJAX, CSJCX, CSJIX, CSRSX, CSJRX, CSJZX |
COHEN & STEERS REAL ESTATE SECURITIES FUND
| • | | Designed for investors seeking total return, investing primarily in U.S. real estate securities |
| • | | Symbols: CSEIX, CSCIX, CREFX, CSDIX, CIRRX, CSZIX |
COHEN & STEERS INSTITUTIONAL REALTY SHARES
| • | | Designed for institutional investors seeking total return, investing primarily in U.S. real estate securities |
COHEN & STEERS GLOBAL REALTY SHARES
| • | | Designed for investors seeking total return, investing primarily in global real estate equity securities |
| • | | Symbols: CSFAX, CSFCX, CSSPX, GRSRX, CSFZX |
COHEN & STEERS INTERNATIONAL REALTY FUND
| • | | Designed for investors seeking total return, investing primarily in international (non-U.S.) real estate securities |
| • | | Symbols: IRFAX, IRFCX, IRFIX, IRFRX, IRFZX |
COHEN & STEERS REAL ASSETS FUND
| • | | Designed for investors seeking total return and the maximization of real returns during inflationary environments by investing primarily in real assets |
| • | | Symbols: RAPAX, RAPCX, RAPIX, RAPRX, RAPZX |
COHEN & STEERS
PREFERRED SECURITIESAND INCOME FUND
| • | | Designed for investors seeking total return (high current income and capital appreciation), investing primarily in preferred and debt securities issued by U.S. and non-U.S. companies |
| • | | Symbols: CPXAX, CPXCX, CPXFX, CPXIX, CPRRX, CPXZX |
COHEN & STEERS
LOW DURATION PREFERREDAND INCOME FUND
| • | | Designed for investors seeking high current income and capital preservation by investing in low-duration preferred and other income securities issued by U.S. and non-U.S. companies |
| • | | Symbols: LPXAX, LPXCX, LPXFX, LPXIX, LPXRX, LPXZX |
COHEN & STEERS MLP & ENERGY OPPORTUNITY FUND
| • | | Designed for investors seeking total return, investing primarily in midstream energy master limited partnership (MLP) units and related stocks |
| • | | Symbols: MLOAX, MLOCX, MLOIX, MLORX, MLOZX |
COHEN & STEERS GLOBAL INFRASTRUCTURE FUND
| • | | Designed for investors seeking total return, investing primarily in global infrastructure securities |
| • | | Symbols: CSUAX, CSUCX, CSUIX, CSURX, CSUZX |
COHEN & STEERS ALTERNATIVE INCOME FUND
| • | | Designed for investors seeking high current income and capital appreciation, investing in equity, preferred and debt securities, focused on real assets and alternative income strategies |
| • | | Symbols: DVFAX, DVFCX, DVFIX, DVFRX, DVFZX |
Distributed by Cohen & Steers Securities, LLC.
Please consider the investment objectives, risks, charges and expenses of any Cohen & Steers U.S. registered open-end fund carefully before investing. A summary prospectus and prospectus containing this and other information can be obtained by calling 800-330-7348 or by visiting cohenandsteers.com. Please read the summary prospectus and prospectus carefully before investing.
65
COHEN & STEERS REAL ASSETS FUND, INC.
OFFICERS AND DIRECTORS
Robert H. Steers
Director and Chairman
Joseph M. Harvey
Director and Vice President
Michael G. Clark
Director
George Grossman
Director
Dean A. Junkans
Director
Gerald J. Maginnis
Director
Jane F. Magpiong
Director
Daphne L. Richards
Director
Ramona Rogers-Windsor
Director
C. Edward Ward, Jr.
Director
Adam M. Derechin
President and Chief Executive Officer
James Giallanza
Chief Financial Officer
Dana A. DeVivo
Secretary and Chief Legal Officer
Albert Laskaj
Treasurer
Stephen Murphy
Chief Compliance Officer
and Vice President
Vincent L. Childers
Vice President
Jon Cheigh
Vice President
Nick Koutsoftas
Vice President
Benjamin Ross
Vice President
William F. Scapell
Vice President
Jason A. Yablon
Vice President
Yigal D. Jhirad
Vice President
KEY INFORMATION
Investment Advisor and Administrator
Cohen & Steers Capital Management, Inc.
280 Park Avenue
New York, NY 10017
(212) 832-3232
Co-administrator and Custodian
State Street Bank and Trust Company
One Lincoln Street
Boston, MA 02111
Transfer Agent
DST Asset Manager Solutions, Inc.
P.O. Box 219953
Kansas City, MO 64121-9953
(800) 437-9912
Legal Counsel
Ropes & Gray LLP
1211 Avenue of the Americas
New York, NY 10036
Distributor
Cohen & Steers Securities, LLC
280 Park Avenue
New York, NY 10017
| | |
| NASDAQ Symbol: | | Class A—RAPAX |
| | Class C—RAPCX |
| | Class F—RAPFX* |
| | Class I—RAPIX |
| | Class R—RAPRX |
| | Class Z—RAPZX |
Website: cohenandsteers.com
This report is authorized for delivery only to shareholders of Cohen & Steers Real Assets Fund, Inc. unless accompanied or preceded by the delivery of a currently effective prospectus setting forth details of the Fund. Performance data quoted represent past performance. Past performance is no guarantee of future results and your investment may be worth more or less at the time you sell your shares.
| * | Class F shares are currently not available for purchase. |
66
eDelivery AVAILABLE
Stop traditional mail delivery;
receive your shareholder reports
and prospectus online.
Sign up at cohenandsteers.com

Cohen & Steers
Real Assets
Fund
Semiannual Report June 30, 2021
As permitted by regulations adopted by the U.S. Securities and Exchange Commission, paper copies of the Fund’s annual and semi-annual shareholder reports are no longer sent by mail, unless you specifically requested paper copies of the reports. Instead, the reports are made available on the Fund’s website at www.cohenandsteers.com, and you will be notified by mail each time a report is posted and provided with a website link to access the report.
If you have already elected to receive shareholder reports electronically, you will not be affected by this change and you need not take any action. You may elect to receive shareholder reports and other communications from a Fund electronically anytime by contacting your financial intermediary or, if you are a direct investor, by signing up at www.cohenandsteers.com.
You may elect to receive all future reports in paper, free of charge, at any time. If you invest through a financial intermediary, you can contact your financial intermediary or, if you are a direct investor, you can call (800) 330-7348 to let the Fund know you wish to continue receiving paper copies of your shareholder reports. Your election to receive reports in paper will apply to all Funds held in your account if you invest through your financial intermediary or all Funds held within the fund complex if you invest directly with the Fund.
RAPAXSAR
Item 2. Code of Ethics.
Not applicable.
Item 3. Audit Committee Financial Expert.
Not applicable.
Item 4. Principal Accountant Fees and Services.
Not applicable.
Item 5. Audit Committee of Listed Registrants.
Not applicable.
Item 6. Schedule of Investments.
Included in Item 1 above.
Item 7. Disclosure of Proxy Voting Policies and Procedures for Closed-End Management Investment Companies.
Not applicable.
Item 8. Portfolio Managers of Closed-End Investment Companies.
Not applicable.
Item 9. Purchases of Equity Securities by Closed-End Management Investment Company and Affiliated Purchasers.
Not applicable.
Item 10. Submission of Matters to a Vote of Security Holders.
None.
Item 11. Controls and Procedures.
| (a) | The registrant’s principal executive officer and principal financial officer have concluded that the registrant’s disclosure controls and procedures are reasonably designed to ensure that information required to be disclosed by the registrant in this Form N-CSR was recorded, processed, summarized and reported within the time periods specified in the Securities and Exchange Commission’s rules and forms, based upon such officers’ evaluation of these controls and procedures as of a date within 90 days of the filing date of this report. |
| (b) | There were no changes in the registrant’s internal control over financial reporting that occurred during the period covered by this report that have materially affected, or are reasonably likely to materially affect, the registrant’s internal control over financial reporting. |
Item 12. Disclosure of Securities Lending Activities for Closed-End Management Investment Companies.
Not applicable.
Item 13. Exhibits.
(a)(1) Not applicable.
(a)(2) Certifications of principal executive officer and principal financial officer as required by Rule 30a-2(a) under the Investment Company Act of 1940.
(a)(3) Not applicable.
(a)(4) Not applicable.
(b) Certifications of principal executive officer and principal financial officer as required by Rule 30a-2(b) under the Investment Company Act of 1940.
SIGNATURES
Pursuant to the requirements of the Securities Exchange Act of 1934 and the Investment Company Act of 1940, the registrant has duly caused this report to be signed on its behalf by the undersigned, thereunto duly authorized.
COHEN & STEERS REAL ASSETS FUND, INC.
| | | | |
| | |
| | By: | | /s/ Adam M. Derechin |
| | | | Name: Adam M. Derechin |
| | | | Title: Principal Executive Officer |
| | | | (President and Chief Executive Officer) |
| | |
| | Date: | | October 22, 2021 |
Pursuant to the requirements of the Securities Exchange Act of 1934 and the Investment Company Act of 1940, this report has been signed below by the following persons on behalf of the registrant and in the capacities and on the dates indicated.
| | | | |
| | |
| | By: | | /s/ Adam M. Derechin |
| | | | Name: Adam M. Derechin |
| | | | Title: Principal Executive Officer |
| | | | (President and Chief Executive Officer) |
| | |
| | By: | | /s/ James Giallanza |
| | | | Name: James Giallanza |
| | | | Title: Principal Financial Officer |
| | | | (Chief Financial Officer) |
| | |
| | Date: | | October 22, 2021 |