UNITED STATES
SECURITIES AND EXCHANGE COMMISSION
Washington, D.C. 20549
FORM N-CSR
CERTIFIED SHAREHOLDER REPORT OF REGISTERED
MANAGEMENT INVESTMENT COMPANIES
Investment Company Act File Number: 811-22621
Cohen & Steers Real Assets Fund, Inc.
(Exact name of registrant as specified in charter)
280 Park Avenue, New York, NY 10017
(Address of principal executive offices) (Zip code)
Dana A. DeVivo
Cohen & Steers Capital Management, Inc.
280 Park Avenue
New York, New York 10017
(Name and address of agent for service)
Registrant’s telephone number, including area code: (212) 832-3232
Date of fiscal year end: December 31
Date of reporting period: December 31, 2022
Item 1. Reports to Stockholders.
COHEN & STEERS REAL ASSETS FUND, INC.
To Our Shareholders:
We would like to share with you our report for the year ended December 31, 2022. The total returns for Cohen & Steers Real Assets Fund, Inc. (the Fund) and its comparative benchmarks were:
| Six Months Ended December 31, 2022 | Year Ended December 31, 2022 | |||||||
Cohen & Steers Real Assets Fund: | ||||||||
Class A | –1.10 | % | –2.38 | % | ||||
Class C | –1.41 | % | –3.06 | % | ||||
Class I | –0.90 | % | –2.04 | % | ||||
Class R | –1.14 | % | –2.52 | % | ||||
Class Z | –0.90 | % | –2.05 | % | ||||
Blended Benchmarka | –0.56 | % | –3.11 | % | ||||
Consumer Price Index +4%a | 2.94 | % | 10.42 | % | ||||
MSCI World Index—neta | 2.97 | % | –18.14 | % | ||||
The performance data quoted represent past performance. Past performance is no guarantee of future results. The investment return and the principal value of an investment will fluctuate and shares, if redeemed, may be worth more or less than their original cost. Current performance may be lower or higher than the performance data quoted. Current total returns of the Fund can be obtained by visiting our website at cohenandsteers.com. All share class returns assume the reinvestment of all dividends and distributions at net asset value (NAV). Fund performance figures reflect fee waivers and/or expense reimbursements, without which the performance would have been lower. Performance quoted does not reflect the deduction of the maximum 4.50% initial sales charge on Class A shares or the 1.00% maximum contingent deferred sales charge on Class C shares. The 1.00% maximum contingent deferred sales charge on Class C shares applies if redemption occurs on or before the one year anniversary date of their purchase. If such charges were included, returns would have been lower. Index performance does not reflect the deduction of any fees, taxes or expenses. An investor cannot invest directly in an index. Performance figures for periods shorter than one year are not annualized.
Please note that distributions paid by the Fund to shareholders are subject to recharacterization for tax purposes and are taxable up to the amount of the Fund’s investment company taxable income and net realized gains. Distributions in excess of the Fund’s investment company taxable income and net realized gains are a return of capital distributed from the Fund’s assets.
| a | For benchmark descriptions, see page 8. |
1
COHEN & STEERS REAL ASSETS FUND, INC.
Market Review
Diversified real assets modestly declined in the 12-month period ended December 31, 2022, but considerably outperformed the broad global equities market. Equities were upended by an unsettling combination of elevated inflation and slowing economic growth. Interest rates moved sharply higher, with the yield on the 10-year U.S. Treasury rising from 1.5% at the start of the period to 3.9% at period end.
In early 2022, the U.S. Federal Reserve raised its fed funds rate for the first time since December 2018, eventually raising the rate to 4.5% during the period while affirming its commitment to reining in inflation. The European Central Bank took similar actions, also indicating a strong desire to fight inflation. In addition, the Bank of Japan entered the fray in December, surprising markets by announcing a wider yield target band for its term sovereign debt in response to a weakening yen.
Fund Performance
The Fund had a negative total return for the period but outperformed its blended benchmark.
Outperformance was largely driven by top-down asset allocation decisions and sleeve-level outperformance across natural resource equities, global real estate, and short duration fixed income, partially offset by underperformance within commodities and infrastructure.
Global real estate securities declined along with broader equities against the backdrop of rising rates and slowing economic growth. In the U.S., with the exception of offices (where questions remain about the long-term future of demand), underlying real estate fundamentals appeared to have little bearing on sector performance in the year. Fundamentals for most property types remained healthy, with rising demand and limited new supply.
Europe trailed as it contended with the Russia-Ukraine war and the risk to growth, especially as the costs associated with its transition away from energy supplied from Russia are likely to be inflationary. Nevertheless, real estate demand generally remained healthy, and companies maintained (if not raised) full-year earnings guidance. Asia Pacific outperformed other regions, benefiting from reopenings and relatively less inflation pressure. We also attribute the region’s outperformance to value-based rotation following the previous year’s underperformance.
The Fund’s underweight allocation and stock selection in global real estate helped relative performance. Contributors included the portfolio’s stock selection in the U.S. and Japan and its underweight in Sweden. In the U.S., stock selection in the industrials and self storage sectors and an underweight in office landlords proved beneficial. In Japan, the portfolio benefited from overweight positions in certain diversified real estate companies.
Listed infrastructure significantly outperformed global equities in the year, as is typical in a period of decelerating growth. Midstream energy rose materially amid elevated energy commodity prices. Electric utilities and gas distribution companies performed relatively well given their defensive characteristics (and as value stocks were generally in favor). As Covid concerns continued to recede, travel sectors (including toll roads and railways) benefited as volumes began to approach pre-pandemic levels. The communications sector was a notable laggard, as the higher-growth/higher-multiple stocks struggled along with technology-oriented names more broadly, following strong gains in 2021. The Fund’s
2
COHEN & STEERS REAL ASSETS FUND, INC.
overweight in global listed infrastructure modestly detracted from relative performance compared with the blended benchmark.
Commodities overall generated strong returns, bolstered by constructive fundamentals. Heading into the year, inventories for most commodities were tight amid strong consumer demand and supply chain bottlenecks. Supply disruptions stemming from Russia’s invasion of Ukraine then drove double-digit gains (and record highs) for many commodities. In the energy sector, oil and natural gas prices, while volatile, ended the period higher. Trading sanctions imposed on Russia, a key global supplier of natural gas, resulted in prices for that commodity climbing to 14-year highs.
Grains were driven by supply constraints that included higher input costs from lost fertilizer output, economic sanctions that slowed the flow of Russian grain exports, and lost production and exports from war-ravaged Ukraine. High energy prices also supported margins for ethanol and biodiesel producers, boosting domestic demand prospects for U.S. corn and soybean oil.
Industrial metals climbed early in the period as the war sparked concerns about disruptions to Russian supplies from economic sanctions, buyers’ strikes and export bans. However, that strength gave way to price weakness, driven by a slower-than-expected post-lockdown recovery in China and concerns of recession in other major economies (sparked by aggressive central bank tightening to contain inflation). Despite heightened geopolitical tensions, gold traded modestly lower in response to rising real (inflation-adjusted) yields and a strong U.S. dollar. The Fund’s contract selection in commodities detracted from relative performance, in part due to contract selection in the petroleum and grains complexes. The timing of our allocation to the dedicated gold weighting hindered relative returns as well.
Natural resource equities advanced in the period, in contrast to sizable declines in broader global equities. The energy sector was a positive standout, supported by strong earnings reports and positive commentary from energy companies. In addition, sentiment was aided by expectations that inflation may last longer than expected, which could provide a floor to crude prices. Metals & mining companies had a lesser gain, as softening economic indicators led to global growth concerns. Within agribusiness, fertilizer & agricultural had a significant absolute gain, as Russia and Belarus together produce a third of the world’s supply of potash.
The Fund’s stock selection in natural resource equities contributed to relative performance, as did our overweight allocation in the sleeve. Contributors included our non-investment in the defensive paper products and paper packaging sectors. Stock selection in the metals & mining and energy sectors additionally aided relative returns.
Short-duration fixed income traded lower as bond yields rose. Short-duration issues were also impacted by a widening in credit spreads as the economy slowed and the Fed began to tighten credit, which raised concerns around recession. Favorable security selection and the timing of our allocations in short-duration fixed income contributed to the Fund’s relative performance.
Impact of Foreign Currency on Fund Performance
The currency impact of the Fund’s investments in foreign securities detracted from absolute performance during the period. Although the Fund reports its NAV and pays dividends in U.S. dollars, the Fund’s investments denominated in foreign currencies are subject to foreign currency risk. Overall,
3
COHEN & STEERS REAL ASSETS FUND, INC.
the U.S. dollar appreciated against other currencies. Consequently, changes in the exchange rates between foreign currencies and the U.S. dollar were a headwind for absolute returns.
Impact of Derivatives on Fund Performance
The Fund engaged in the buying and selling of commodity futures contracts to obtain exposure to commodities markets. These contracts contributed significantly to the Fund’s total return for the 12-month period ended December 31, 2022.
The Fund also engaged in the buying and selling of commodity options with the intention of enhancing total returns and reducing overall volatility. These options did not have a material effect on the Fund’s total return for the 12-month period ended December 31, 2022.
Sincerely,
VINCENT L. CHILDERS |
JON CHEIGH |
BENJAMIN ROSS | ||
Portfolio Manager | Portfolio Manager | Portfolio Manager |


NICK KOUTSOFTAS |
BEN MORTON |
JEFFREY PALMA | ||
Portfolio Manager | Portfolio Manager | Portfolio Manager | ||


The views and opinions in the preceding commentary are subject to change without notice and are as of the date of the report. There is no guarantee that any market forecast set forth in the commentary will be realized. This material represents an assessment of the market environment at a specific point in time, should not be relied upon as investment advice and is not intended to predict or depict performance of any investment.
4
COHEN & STEERS REAL ASSETS FUND, INC.
Visit Cohen & Steers online at cohenandsteers.com
For more information about the Cohen & Steers family of mutual funds, visit cohenandsteers.com. Here you will find fund net asset values, fund fact sheets and portfolio highlights, as well as educational resources and timely market updates.
Our website also provides comprehensive information about Cohen & Steers, including our most recent press releases, profiles of our senior investment professionals and their investment approach to each asset class. The Cohen & Steers family of mutual funds specializes in liquid real assets, including real estate securities, listed infrastructure and natural resource equities, as well as preferred securities and other income solutions.
5
COHEN & STEERS REAL ASSETS FUND, INC.
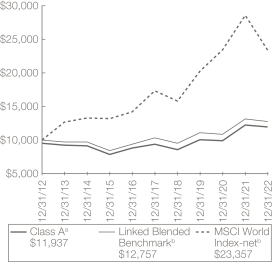
Performance Review (Unaudited)
Class A—Growth of a $10,000 Investment
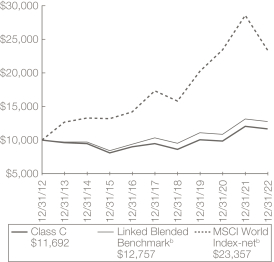
| Class C—Growth of a $10,000 Investment
|
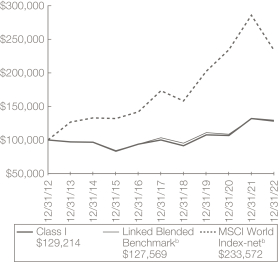
Class I—Growth of a $100,000 Investment
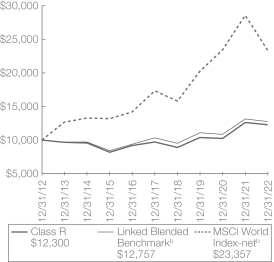
| Class R—Growth of a $10,000 Investment
|
6
COHEN & STEERS REAL ASSETS FUND, INC.
Performance Review (Unaudited)—(Continued)
Class Z—Growth of a $10,000 Investment
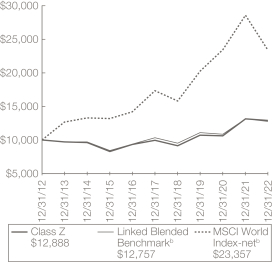
Average Annual Total Returns—For Periods Ended December 31, 2022
| Class A Shares | Class C Shares | Class I Shares | Class R Shares | Class Z Shares | ||||||||||||||||
1 Year (with sales charge) | –6.77 | %a | –4.02 | %c | — | — | — | |||||||||||||
1 Year (without sales charge) | –2.38 | % | –3.06 | % | –2.04 | % | –2.52 | % | –2.05 | % | ||||||||||
5 Years (with sales charge) | 3.97 | %a | 4.25 | % | — | — | — | |||||||||||||
5 Years (without sales charge) | 4.93 | % | 4.25 | % | 5.30 | % | 4.78 | % | 5.31 | % | ||||||||||
10 Years (with sales charge) | 1.79 | %a | 1.58 | % | — | — | — | |||||||||||||
10 Years (without sales charge) | 2.26 | % | 1.58 | % | 2.60 | % | 2.09 | % | 2.57 | % | ||||||||||
Since Inception (with sales charge)d | 1.79 | %a | 1.53 | % | — | — | — | |||||||||||||
Since Inception (without sales charge)d | 2.22 | % | 1.53 | % | 2.56 | % | 2.06 | % | 2.51 | % | ||||||||||
The performance data quoted represent past performance. Past performance is no guarantee of future results. The investment return and principal value of an investment will fluctuate and shares, if redeemed, may be worth more or less than their original cost. Current performance may be lower or higher than the performance data quoted. Performance information current to the most recent month end can be obtained by visiting our website at cohenandsteers.com. All share class returns assume the reinvestment of all dividends and distributions at NAV. The performance graphs and table do not reflect the deduction of taxes that a shareholder would pay on Fund distributions or the redemption of Fund shares. During the periods presented above, the investment advisor waived fees and/or reimbursed expenses. Without this arrangement, performance would have been lower.
7
COHEN & STEERS REAL ASSETS FUND, INC.
Performance Review (Unaudited)—(Continued)
The annualized gross and net expense ratios, respectively, for each class of shares as disclosed in the May 1, 2022 prospectus, were as follows: Class A—1.46% and 1.16%; Class C—2.11% and 1.81%; Class I—1.19% and 0.81%; Class R—1.61% and 1.31%; and Class Z—1.11% and 0.81%. Through June 30, 2024, the investment advisor has contractually agreed to waive its fee and/or reimburse expenses so that the Fund’s total annual operating expenses, which include the expenses of the Subsidiary (excluding acquired fund fees and expenses, taxes and extraordinary expenses), do not exceed 1.15% for Class A shares, 1.80% for Class C shares, 0.80% for Class I shares, 1.30% for Class R shares and 0.80% for Class Z shares. This contractual agreement can only be amended or terminated at any time by agreement of the Fund’s Board of Directors and the investment advisor and will terminate automatically in the event of termination of the investment advisory agreement between the investment advisor and the Fund.
| a | Reflects a 4.50% front-end sales charge. |
| b | The Linked Blended Benchmark is represented by the performance of the blended benchmark consisting of 30% FTSE EPRA Nareit Developed Real Estate Index—net, 30% Bloomberg Commodity Total Return Index, 20% S&P Global Natural Resources Index—net, 12.5% ICE BofA 1-3 Year Global Corporate Index and 7.5% Gold Spot price through September 30, 2013 and the blended benchmark consisting of 27.5% FTSE EPRA Nareit Developed Real Estate Index—net, 27.5% Bloomberg Commodity Total Return Index, 15% S&P Global Natural Resources Index—net, 10% ICE BofA 1-3 Year U.S. Corporate Index, 5% Gold Spot price and 15% Dow Jones Brookfield Global Infrastructure Index from October 1, 2013 and thereafter. The FTSE EPRA Nareit Developed Real Estate Index—net is an unmanaged market-capitalization-weighted total-return index, which consists of publicly traded equity real estate investment trusts (REITs) and listed property companies from developed markets and is net of dividend withholding taxes. The Bloomberg Commodity Total Return Index is a broadly diversified index that tracks the commodity markets through commodity futures contracts. The index is made up of exchange-traded futures on physical commodities, which are weighted to account for economic significance and market liquidity. The S&P Global Natural Resources Index—net includes the largest publicly-traded companies in natural resources and commodities businesses that meet specific investability requirements and is net of dividend withholding taxes. The ICE BofA 1-3 Year U.S. Corporate Index tracks the performance of U.S. dollar-denominated investment-grade corporate debt publicly issued in the U.S. domestic market, with a remaining term to final maturity of less than 3 years. The ICE BofA 1-3 Year Global Corporate Index is a subset of the ICE BofA Global Corporate Index including all securities with a remaining term to final maturity of less than 3 years. Gold is represented by the Gold Spot price in U.S. Dollars per Troy ounce. The Dow Jones Brookfield Global Infrastructure Index is a float-adjusted market-capitalization-weighted index that measures performance of globally domiciled companies that derive more than 70% of their cash flows from infrastructure lines of business. The Consumer Price Index (CPI) is a broad measure of average price changes for a diverse basket of goods and services. The CPI is focused on items typically purchased by urban consumers, across diverse households and geographies. The benchmark is represented by the change in the CPI +4% per year. The MSCI World Index—net is a free-float-adjusted index that measures performance of large- and mid-capitalization companies representing developed market countries and is net of dividend withholding taxes. |
8
COHEN & STEERS REAL ASSETS FUND, INC.
Performance Review (Unaudited)—(Continued)
The comparative indexes are not adjusted to reflect expenses or other fees that the U.S. Securities and Exchange Commission (SEC) requires to be reflected in the Fund’s performance. Index performance does not reflect the deduction of any fees, taxes or expenses. An investor cannot invest directly in an index. The Fund’s performance assumes the reinvestment of all dividends and distributions at NAV. For more information, including charges and expenses, please read the prospectus carefully before you invest. |
| c | Reflects a contingent deferred sales charge of 1.00%. |
| d | Inception date of January 31, 2012. |
9
COHEN & STEERS REAL ASSETS FUND, INC.
Expense Example (Unaudited)
As a shareholder of the Fund, you incur two types of costs: (1) transaction costs, including sales charges (loads) on purchase payments; and (2) ongoing costs including investment advisory fees; distribution and/or service (12b-1) fees; and other Fund expenses. This example is intended to help you understand your ongoing costs (in dollars) of investing in the Fund and to compare these costs with the ongoing costs of investing in other mutual funds.
The example is based on an investment of $1,000 invested at the beginning of the period and held for the entire period July 1, 2022—December 31, 2022.
Actual Expenses
The first line of the following table provides information about actual account values and expenses. You may use the information in this line, together with the amount you invested, to estimate the expenses that you paid over the period. Simply divide your account value by $1,000 (for example, an $8,600 account value divided by $1,000 = 8.6), then multiply the result by the number in the first line under the heading entitled “Expenses Paid During Period” to estimate the expenses you paid on your account during this period.
Hypothetical Example for Comparison Purposes
The second line of the following table provides information about hypothetical account values and hypothetical expenses based on the Fund’s actual expense ratio and an assumed rate of return of 5% per year before expenses, which is not the Fund’s actual return. The hypothetical account values and expenses may not be used to estimate the actual ending account balance or expenses you paid for the period. You may use this information to compare the ongoing cost of investing in the Fund and other funds. To do so, compare this 5% hypothetical example with the 5% hypothetical examples that appear in the shareholder reports of other funds.
Please note that the expenses shown in the table are meant to highlight your ongoing costs only and do not reflect any transaction costs, such as sales charges (loads). Therefore, the second line of the table is useful in comparing ongoing costs only, and will not help you determine the relative total costs of owning different funds. In addition, if these transactional costs were included, your costs would have been higher.
10
COHEN & STEERS REAL ASSETS FUND, INC.
Expense Example (Unaudited)—(Continued)
| Beginning Account Value July 1, 2022 | Ending Account Value December 31, 2022 | Expenses Paid During Perioda July 1, 2022— December 31, 2022 | ||||||||||
Class A | ||||||||||||
Actual (–1.10% return) | $ | 1,000.00 | $ | 989.00 | $ | 5.77 | ||||||
Hypothetical (5% annual return | $ | 1,000.00 | $ | 1,019.41 | $ | 5.85 | ||||||
Class C | ||||||||||||
Actual (–1.41% return) | $ | 1,000.00 | $ | 985.90 | $ | 9.01 | ||||||
Hypothetical (5% annual return | $ | 1,000.00 | $ | 1,016.13 | $ | 9.15 | ||||||
Class I | ||||||||||||
Actual (–0.90% return) | $ | 1,000.00 | $ | 991.00 | $ | 4.01 | ||||||
Hypothetical (5% annual return | $ | 1,000.00 | $ | 1,021.17 | $ | 4.08 | ||||||
Class R | ||||||||||||
Actual (–1.14% return) | $ | 1,000.00 | $ | 988.60 | $ | 6.52 | ||||||
Hypothetical (5% annual return | $ | 1,000.00 | $ | 1,018.65 | $ | 6.61 | ||||||
Class Z | ||||||||||||
Actual (–0.90% return) | $ | 1,000.00 | $ | 991.00 | $ | 4.01 | ||||||
Hypothetical (5% annual return | $ | 1,000.00 | $ | 1,021.17 | $ | 4.08 | ||||||
| a | Expenses are equal to the Fund’s Class A, Class C, Class I, Class R and Class Z annualized net expense ratios of 1.15%, 1.80%, 0.80%, 1.30% and 0.80%, respectively, multiplied by the average account value over the period, multiplied by 184/365 (to reflect the one-half year period). |
11
COHEN & STEERS REAL ASSETS FUND, INC.
December 31, 2022
Top Ten Holdingsa
(Unaudited)
Security | Value | % of Net Assets | ||||||
SPDR Gold MiniShares Trust | $ | 33,807,359 | 3.6 | |||||
Prologis, Inc. | 17,332,914 | 1.9 | ||||||
Public Storage | 15,329,755 | 1.6 | ||||||
iShares Gold Trust ETF | 14,417,354 | 1.5 | ||||||
Welltower, Inc. | 12,082,176 | 1.3 | ||||||
American Tower Corp. | 10,679,227 | 1.1 | ||||||
BHP Group Ltd. | 10,309,026 | 1.1 | ||||||
Realty Income Corp. | 10,145,502 | 1.1 | ||||||
Shell PLC (GBP) | 10,119,890 | 1.1 | ||||||
Digital Realty Trust, Inc. | 9,592,430 | 1.0 | ||||||
| a | Top ten holdings (excluding short-term investments and derivative instruments) are determined on the basis of the value of individual securities held. The Fund may also hold positions in other types of securities issued by the companies listed above. See the Consolidated Schedule of Investments for additional details on such other positions. |
Strategy Breakdownb
(Unaudited)
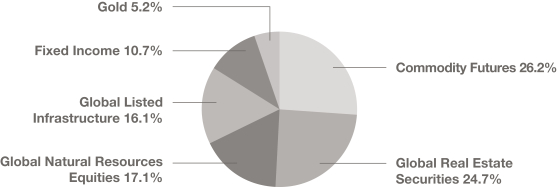
| b | The strategy breakdown is expressed as an approximate percentage of the Fund’s total long-term investments inclusive of derivatives exposure. |
12
COHEN & STEERS REAL ASSETS FUND, INC.
CONSOLIDATED SCHEDULE OF INVESTMENTS
December 31, 2022
| Shares | Value | |||||||||||
COMMON STOCK | 57.4% | |||||||||||
AIRPORTS—FOREIGN | 0.0% | |||||||||||
Grupo Aeroportuario del Sureste SAB de CV (Mexico) |
| 10,688 | $ | 249,017 | ||||||||
|
| |||||||||||
COMMUNICATIONS | 2.3% | |||||||||||
TOWERS | ||||||||||||
American Tower Corp. |
| 50,407 | 10,679,227 | |||||||||
Crown Castle, Inc. |
| 37,594 | 5,099,250 | |||||||||
SBA Communications Corp. |
| 20,448 | 5,731,779 | |||||||||
|
| |||||||||||
| 21,510,256 | ||||||||||||
|
| |||||||||||
COMMUNICATIONS—FOREIGN | 0.9% | |||||||||||
SATELLITES | 0.2% | |||||||||||
SES SA (Luxembourg) |
| 320,906 | 2,091,998 | |||||||||
|
| |||||||||||
TOWERS | 0.7% | |||||||||||
Cellnex Telecom SA, 144A (Spain)a |
| 200,188 | 6,625,882 | |||||||||
|
| |||||||||||
TOTAL COMMUNICATIONS—FOREIGN |
| 8,717,880 | ||||||||||
|
| |||||||||||
CONSUMER CYCLICAL | 0.1% | |||||||||||
HOTEL | ||||||||||||
Boyd Gaming Corp. |
| 22,508 | 1,227,361 | |||||||||
|
| |||||||||||
CONSUMER STAPLES | 0.5% | |||||||||||
FOOD PRODUCTS | ||||||||||||
Darling Ingredients, Inc.b |
| 33,491 | 2,096,201 | |||||||||
JBS SA |
| 297,940 | 1,240,911 | |||||||||
Mondelez International, Inc., Class A |
| 11,672 | 777,939 | |||||||||
|
| |||||||||||
| 4,115,051 | ||||||||||||
|
| |||||||||||
CONSUMER STAPLES—FOREIGN | 0.9% | |||||||||||
FOOD PRODUCTS | ||||||||||||
Bakkafrost P/F (Denmark) |
| 34,775 | 2,186,571 | |||||||||
Salmar ASA (Norway) |
| 59,140 | 2,322,909 | |||||||||
WH Group Ltd., 144A (Hong Kong)a |
| 3,857,000 | 2,243,405 | |||||||||
Wilmar International Ltd. (China) (SGD) |
| 539,830 | 1,680,671 | |||||||||
|
| |||||||||||
| 8,433,556 | ||||||||||||
|
| |||||||||||
CONSUMER—NON-CYCLICAL | 2.5% | |||||||||||
AGRICULTURE | 1.8% | |||||||||||
AGCO Corp. |
| 6,122 | 849,060 | |||||||||
Archer-Daniels-Midland Co. |
| 18,874 | 1,752,451 | |||||||||
See accompanying notes to the consolidated financial statements.
13
COHEN & STEERS REAL ASSETS FUND, INC.
CONSOLIDATED SCHEDULE OF INVESTMENTS—(Continued)
December 31, 2022
| Shares | Value | |||||||||||
Bunge Ltd. |
| 92,905 | $ | 9,269,132 | ||||||||
Corteva, Inc. |
| 87,277 | 5,130,142 | |||||||||
|
| |||||||||||
| 17,000,785 | ||||||||||||
|
| |||||||||||
FOOD PRODUCTS | 0.5% | |||||||||||
Kraft Heinz Co./The |
| 34,649 | 1,410,561 | |||||||||
Pilgrim’s Pride Corp.b |
| 87,910 | 2,086,104 | |||||||||
Tyson Foods, Inc., Class A |
| 18,439 | 1,147,828 | |||||||||
|
| |||||||||||
| 4,644,493 | ||||||||||||
|
| |||||||||||
FOOD PRODUCTS—FOREIGN | 0.2% | |||||||||||
Mowi ASA (Norway) |
| 102,658 | 1,752,043 | |||||||||
|
| |||||||||||
TOTAL CONSUMER—NON-CYCLICAL |
| 23,397,321 | ||||||||||
|
| |||||||||||
ELECTRIC | 1.5% | |||||||||||
Constellation Energy Corp. |
| 10,836 | 934,171 | |||||||||
DTE Energy Co. |
| 6,634 | 779,694 | |||||||||
Evergy, Inc. |
| 24,424 | 1,537,002 | |||||||||
Eversource Energy |
| 14,310 | 1,199,750 | |||||||||
Exelon Corp. |
| 135,242 | 5,846,512 | |||||||||
PG&E Corp.b |
| 59,218 | 962,885 | |||||||||
PPL Corp. |
| 89,994 | 2,629,625 | |||||||||
|
| |||||||||||
| 13,889,639 | ||||||||||||
|
| |||||||||||
ELECTRIC—FOREIGN | 1.1% | |||||||||||
E.ON SE (Germany) |
| 93,426 | 933,473 | |||||||||
Hydro One Ltd., 144A (Canada)a |
| 49,845 | 1,335,213 | |||||||||
Kansai Electric Power Co., Inc. /The (Japan) |
| 153,700 | 1,497,884 | |||||||||
National Grid PLC (United Kingdom) |
| 536,528 | 6,469,491 | |||||||||
|
| |||||||||||
| 10,236,061 | ||||||||||||
|
| |||||||||||
ENERGY | 6.8% | |||||||||||
GAS—DISTRIBUTION | 0.2% | |||||||||||
Atmos Energy Corp. |
| 20,226 | 2,266,728 | |||||||||
|
| |||||||||||
GAS—DISTRIBUTION—FOREIGN | 0.3% | |||||||||||
Enn Energy Holdings Ltd., (H shares) (China) |
| 210,057 | 2,949,510 | |||||||||
|
| |||||||||||
OIL & GAS | 2.1% | |||||||||||
APA Corp. |
| 19,668 | 918,102 | |||||||||
Chesapeake Energy Corp. |
| 6,779 | 639,734 | |||||||||
Chevron Corp. |
| 15,192 | 2,726,812 | |||||||||
See accompanying notes to the consolidated financial statements.
14
COHEN & STEERS REAL ASSETS FUND, INC.
CONSOLIDATED SCHEDULE OF INVESTMENTS—(Continued)
December 31, 2022
| Shares | Value | |||||||||||
ConocoPhillips |
| 12,648 | $ | 1,492,464 | ||||||||
Denbury, Inc.b |
| 8,494 | 739,148 | |||||||||
EOG Resources, Inc. |
| 8,393 | 1,087,061 | |||||||||
Exxon Mobil Corp. |
| 53,135 | 5,860,790 | |||||||||
Hess Corp. |
| 13,434 | 1,905,210 | |||||||||
Occidental Petroleum Corp. |
| 8,113 | 511,038 | |||||||||
PBF Energy, Inc., Class A |
| 17,438 | 711,122 | |||||||||
Phillips 66 |
| 28,119 | 2,926,626 | |||||||||
|
| |||||||||||
| 19,518,107 | ||||||||||||
|
| |||||||||||
OIL & GAS SERVICES | 0.1% | |||||||||||
Schlumberger Ltd. |
| 15,457 | 826,331 | |||||||||
|
| |||||||||||
OIL & GAS—FOREIGN | 3.9% | |||||||||||
BP PLC (United Kingdom) |
| 633,055 | 3,634,561 | |||||||||
Cenovus Energy, Inc. (Canada) |
| 34,470 | 668,779 | |||||||||
Equinor ASA (Norway) |
| 66,084 | 2,373,056 | |||||||||
MEG Energy Corp. (Canada)b |
| 86,871 | 1,209,393 | |||||||||
Reliance Industries Ltd., GDR, 144A (India)a |
| 49,301 | 3,032,011 | |||||||||
Repsol SA (Spain) |
| 271,470 | 4,315,335 | |||||||||
Shell PLC (Netherlands) |
| 359,880 | 10,119,890 | |||||||||
Suncor Energy, Inc. (Canada) |
| 170,364 | 5,404,087 | |||||||||
TotalEnergies SE (France) |
| 60,823 | 3,818,581 | |||||||||
Woodside Energy Group Ltd. (Australia) |
| 63,599 | 1,530,072 | |||||||||
|
| |||||||||||
| 36,105,765 | ||||||||||||
|
| |||||||||||
PIPELINES—C-CORP—FOREIGN | 0.2% | |||||||||||
Gibson Energy, Inc. (Canada) |
| 92,941 | 1,622,692 | |||||||||
|
| |||||||||||
TOTAL ENERGY |
| 63,289,133 | ||||||||||
|
| |||||||||||
FREIGHT RAILS | 0.2% | |||||||||||
Norfolk Southern Corp. |
| 8,573 | 2,112,559 | |||||||||
|
| |||||||||||
INDUSTRIAL | 0.5% | |||||||||||
MACHINERY |
| |||||||||||
Deere & Co. |
| 10,985 | 4,709,929 | |||||||||
|
| |||||||||||
INFRASTRUCTURE | 0.9% | |||||||||||
ELECTRIC | 0.4% | |||||||||||
CenterPoint Energy, Inc. |
| 114,922 | 3,446,511 | |||||||||
|
| |||||||||||
See accompanying notes to the consolidated financial statements.
15
COHEN & STEERS REAL ASSETS FUND, INC.
CONSOLIDATED SCHEDULE OF INVESTMENTS—(Continued)
December 31, 2022
| Shares | Value | |||||||||||
PIPELINES—C-CORP | 0.5% | |||||||||||
ONEOK, Inc. |
| 74,163 | $ | 4,872,509 | ||||||||
|
| |||||||||||
TOTAL INFRASTRUCTURE |
| 8,319,020 | ||||||||||
|
| |||||||||||
INFRASTRUCTURE—FOREIGN | 2.9% | |||||||||||
AIRPORTS | 0.3% | |||||||||||
Aena SME SA, 144A (Spain)a,b |
| 14,707 | 1,846,666 | |||||||||
Auckland International Airport Ltd. (New Zealand)b |
| 222,902 | 1,105,275 | |||||||||
|
| |||||||||||
| 2,951,941 | ||||||||||||
|
| |||||||||||
GAS—DISTRIBUTION | 0.3% | |||||||||||
AltaGas Ltd. (Canada) |
| 94,099 | 1,624,841 | |||||||||
Snam SpA (Italy) |
| 275,421 | 1,334,669 | |||||||||
|
| |||||||||||
| 2,959,510 | ||||||||||||
|
| |||||||||||
PIPELINES—C-CORP | 2.3% | |||||||||||
Enbridge, Inc. (Canada) |
| 194,664 | 7,608,286 | |||||||||
Pembina Pipeline Corp. (Canada) |
| 169,796 | 5,763,534 | |||||||||
TC Energy Corp. (Canada) |
| 196,305 | 7,826,103 | |||||||||
|
| |||||||||||
| 21,197,923 | ||||||||||||
|
| |||||||||||
TOTAL INFRASTRUCTURE—FOREIGN |
| 27,109,374 | ||||||||||
|
| |||||||||||
MARINE PORTS—FOREIGN | 0.1% | |||||||||||
TRANSPORTATION INFRASTRUCTURE |
| |||||||||||
International Container Terminal Services, Inc. (Philippines) |
| 130,750 | 469,248 | |||||||||
|
| |||||||||||
MATERIALS | 6.6% | |||||||||||
CHEMICALS | 0.8% | |||||||||||
Albemarle Corp. |
| 3,161 | 685,495 | |||||||||
CF Industries Holdings, Inc. |
| 55,226 | 4,705,255 | |||||||||
FMC Corp. |
| 15,115 | 1,886,352 | |||||||||
|
| |||||||||||
| 7,277,102 | ||||||||||||
|
| |||||||||||
CHEMICALS—FOREIGN | 0.6% | |||||||||||
Nutrien Ltd. (Canada) |
| 78,877 | 5,760,387 | |||||||||
|
| |||||||||||
METALS & MINING | 1.1% | |||||||||||
Freeport-McMoRan, Inc. |
| 138,492 | 5,262,696 | |||||||||
Newmont Corp. |
| 30,571 | 1,442,951 | |||||||||
Reliance Steel & Aluminum Co. |
| 7,632 | 1,545,022 | |||||||||
Steel Dynamics, Inc. |
| 24,877 | 2,430,483 | |||||||||
|
| |||||||||||
| 10,681,152 | ||||||||||||
|
| |||||||||||
See accompanying notes to the consolidated financial statements.
16
COHEN & STEERS REAL ASSETS FUND, INC.
CONSOLIDATED SCHEDULE OF INVESTMENTS—(Continued)
December 31, 2022
| Shares | Value | |||||||||||
METALS & MINING—FOREIGN | 4.1% | |||||||||||
Agnico Eagle Mines Ltd. (Canada) |
| 78,841 | $ | 4,096,937 | ||||||||
Anglo American PLC (South Africa) (GBP) |
| 39,041 | 1,527,583 | |||||||||
Barrick Gold Corp. (Canada) |
| 49,521 | 850,771 | |||||||||
BHP Group Ltd. (Australia) |
| 331,830 | 10,309,026 | |||||||||
First Quantum Minerals Ltd. (Zambia) |
| 20,436 | 426,983 | |||||||||
Fortescue Metals Group Ltd. (Australia) |
| 47,109 | 657,841 | |||||||||
Glencore PLC (Australia) (GBP) |
| 1,205,206 | 8,048,655 | |||||||||
Nippon Steel Corp. (Japan) |
| 65,619 | 1,145,983 | |||||||||
POSCO Holdings, Inc. (South Korea) |
| 4,607 | 1,007,383 | |||||||||
Teck Resources Ltd., Class B (Canada) |
| 61,115 | 2,311,369 | |||||||||
Vale SA, ADR (Brazil) (USD) |
| 266,411 | 4,520,995 | |||||||||
Wheaton Precious Metals Corp. (Brazil) |
| 73,263 | 2,862,343 | |||||||||
|
| |||||||||||
| 37,765,869 | ||||||||||||
|
| |||||||||||
TOTAL MATERIALS |
| 61,484,510 | ||||||||||
|
| |||||||||||
PIPELINES—C-CORP | 1.3% | |||||||||||
Cheniere Energy, Inc. |
| 31,925 | 4,787,473 | |||||||||
DT Midstream, Inc.b |
| 39,634 | 2,190,175 | |||||||||
Equitrans Midstream Corp. |
| 83,991 | 562,739 | |||||||||
Targa Resources Corp. |
| 45,530 | 3,346,455 | |||||||||
Williams Cos., Inc./The |
| 26,042 | 856,782 | |||||||||
|
| |||||||||||
| 11,743,624 | ||||||||||||
|
| |||||||||||
RAILWAYS—FOREIGN | 0.5% | |||||||||||
Canadian Pacific Railway Ltd. (Canada) |
| 11,848 | 883,350 | |||||||||
Getlink SE (France) |
| 45,011 | 721,525 | |||||||||
Santos Brasil Participacoes SA (Brazil) |
| 923,049 | 1,365,408 | |||||||||
West Japan Railway Co. (Japan) |
| 47,400 | 2,069,145 | |||||||||
|
| |||||||||||
| 5,039,428 | ||||||||||||
|
| |||||||||||
REAL ESTATE | 24.3% | |||||||||||
DATA CENTERS | 1.8% | |||||||||||
Digital Realty Trust, Inc. |
| 95,666 | 9,592,430 | |||||||||
Equinix, Inc. |
| 10,952 | 7,173,888 | |||||||||
|
| |||||||||||
| 16,766,318 | ||||||||||||
|
| |||||||||||
DIVERSIFIED—FOREIGN | 4.2% | |||||||||||
British Land Co., PLC/The (United Kingdom) |
| 341,560 | 1,631,482 | |||||||||
Capitaland Investment Ltd. (Singapore) |
| 1,217,100 | 3,362,155 | |||||||||
See accompanying notes to the consolidated financial statements.
17
COHEN & STEERS REAL ASSETS FUND, INC.
CONSOLIDATED SCHEDULE OF INVESTMENTS—(Continued)
December 31, 2022
| Shares | Value | |||||||||||
Charter Hall Group (Australia) |
| 397,411 | $ | 3,241,516 | ||||||||
CK Asset Holdings Ltd. (Hong Kong) |
| 347,500 | 2,139,194 | |||||||||
Covivio (France) |
| 13,557 | 804,695 | |||||||||
Hang Lung Properties Ltd. (Hong Kong) |
| 648,000 | 1,266,869 | |||||||||
ICADE (France) |
| 30,137 | 1,298,148 | |||||||||
Invincible Investment Corp. (Japan) |
| 3,497 | 1,358,938 | |||||||||
LondonMetric Property PLC (United Kingdom) |
| 262,024 | 545,802 | |||||||||
LXI REIT PLC (United Kingdom) |
| 389,045 | 529,598 | |||||||||
Merlin Properties Socimi SA (Spain) |
| 147,123 | 1,381,955 | |||||||||
Mitsubishi Estate Co., Ltd. (Japan) |
| 366,900 | 4,783,343 | |||||||||
Nomura Real Estate Master Fund, Inc. (Japan) |
| 2,047 | 2,542,373 | |||||||||
Stockland (Australia) |
| 1,410,811 | 3,486,800 | |||||||||
Sumitomo Realty & Development Co., Ltd. (Japan) |
| 186,875 | 4,444,048 | |||||||||
Sun Hung Kai Properties Ltd. (Hong Kong) |
| 271,000 | 3,708,025 | |||||||||
United Urban Investment Corp. (Japan) |
| 1,402 | 1,608,817 | |||||||||
Warehouses De Pauw CVA (Belgium) |
| 37,631 | 1,075,532 | |||||||||
|
| |||||||||||
| 39,209,290 | ||||||||||||
|
| |||||||||||
HEALTH CARE | 1.8% | |||||||||||
Healthcare Realty Trust, Inc., Class A |
| 218,784 | 4,215,968 | |||||||||
Welltower, Inc. |
| 184,320 | 12,082,176 | |||||||||
|
| |||||||||||
| 16,298,144 | ||||||||||||
|
| |||||||||||
HEALTH CARE—FOREIGN | 0.3% | |||||||||||
Assura PLC (United Kingdom) |
| 1,197,132 | 789,487 | |||||||||
Parkway Life Real Estate Investment Trust (Singapore) |
| 795,000 | 2,231,746 | |||||||||
|
| |||||||||||
| 3,021,233 | ||||||||||||
|
| |||||||||||
HOTEL | 0.4% | |||||||||||
Host Hotels & Resorts, Inc. |
| 231,845 | 3,721,112 | |||||||||
|
| |||||||||||
HOTEL—FOREIGN | 0.2% | |||||||||||
Sands China Ltd., (H shares) (Macau)b |
| 468,400 | 1,554,242 | |||||||||
|
| |||||||||||
INDUSTRIALS | 2.3% | |||||||||||
Americold Realty Trust, Inc. |
| 159,595 | 4,518,134 | |||||||||
Prologis, Inc. |
| 153,756 | 17,332,914 | |||||||||
|
| |||||||||||
| 21,851,048 | ||||||||||||
|
| |||||||||||
INDUSTRIALS—FOREIGN | 1.3% | |||||||||||
CapitaLand Ascendas REIT (Singapore) |
| 824,500 | 1,686,673 | |||||||||
See accompanying notes to the consolidated financial statements.
18
COHEN & STEERS REAL ASSETS FUND, INC.
CONSOLIDATED SCHEDULE OF INVESTMENTS—(Continued)
December 31, 2022
| Shares | Value | |||||||||||
Frasers Logistics & Commercial Trust (Singapore) |
| 1,638,700 | $ | 1,419,212 | ||||||||
Goodman Group (Australia) |
| 129,953 | 1,535,987 | |||||||||
Nippon Prologis REIT, Inc. (Japan) |
| 1,730 | 4,066,634 | |||||||||
Segro PLC (United Kingdom) |
| 102,240 | 943,833 | |||||||||
Sirius Real Estate Ltd. (Germany) |
| 694,248 | 621,090 | |||||||||
Tritax Big Box REIT PLC (United Kingdom) |
| 616,891 | 1,033,665 | |||||||||
Urban Logistics REIT PLC (United Kingdom) |
| 537,493 | 873,984 | |||||||||
|
| |||||||||||
| 12,181,078 | ||||||||||||
|
| |||||||||||
NET LEASE | 0.2% | |||||||||||
Spirit Realty Capital, Inc. |
| 46,460 | 1,855,148 | |||||||||
|
| |||||||||||
NET LEASE—FOREIGN | 0.2% | |||||||||||
ARGAN SA (France) |
| 17,602 | 1,428,228 | |||||||||
|
| |||||||||||
OFFICE | 0.2% | |||||||||||
Cousins Properties, Inc. |
| 67,737 | 1,713,069 | |||||||||
|
| |||||||||||
OFFICE—FOREIGN | 0.2% | |||||||||||
Great Portland Estates PLC (United Kingdom) |
| 90,445 | 541,250 | |||||||||
Kenedix Office Investment Corp. (Japan) |
| 347 | 846,084 | |||||||||
Wihlborgs Fastigheter AB (Sweden) |
| 95,585 | 719,073 | |||||||||
|
| |||||||||||
| 2,106,407 | ||||||||||||
|
| |||||||||||
REAL ESTATE SERVICES | 0.2% | |||||||||||
Jones Lang LaSalle, Inc.b |
| 13,533 | 2,156,754 | |||||||||
|
| |||||||||||
RESIDENTIAL | 3.8% | |||||||||||
Camden Property Trust |
| 61,173 | 6,844,035 | |||||||||
Essex Property Trust, Inc. |
| 3,694 | 782,833 | |||||||||
Highwoods Properties, Inc. |
| 60,459 | 1,691,643 | |||||||||
Invitation Homes, Inc. |
| 314,045 | 9,308,294 | |||||||||
Mid-America Apartment Communities, Inc. |
| 40,753 | 6,397,813 | |||||||||
Sun Communities, Inc. |
| 36,042 | 5,154,006 | |||||||||
UDR, Inc. |
| 138,945 | 5,381,340 | |||||||||
|
| |||||||||||
| 35,559,964 | ||||||||||||
|
| |||||||||||
RESIDENTIAL—FOREIGN | 0.9% | |||||||||||
Advance Residence Investment Corp. (Japan) |
| 731 | 1,888,212 | |||||||||
Aedifica SA (Belgium) |
| 9,052 | 734,480 | |||||||||
LEG Immobilien SE (Germany) |
| 45,861 | 2,987,732 | |||||||||
UNITE Group PLC/The (United Kingdom) |
| 50,269 | 553,032 | |||||||||
See accompanying notes to the consolidated financial statements.
19
COHEN & STEERS REAL ASSETS FUND, INC.
CONSOLIDATED SCHEDULE OF INVESTMENTS—(Continued)
December 31, 2022
| Shares | Value | |||||||||||
Wharf Real Estate Investment Co., Ltd. (Hong Kong) |
| 329,000 | $ | 1,917,827 | ||||||||
|
| |||||||||||
| 8,081,283 | ||||||||||||
|
| |||||||||||
RETAIL—FOREIGN | 1.9% | |||||||||||
Catena AB (Sweden) |
| 45,400 | 1,690,723 | |||||||||
Eurocommercial Properties NV (Netherlands) |
| 36,880 | 892,207 | |||||||||
Japan Metropolitan Fund Invest (Japan) |
| 4,244 | 3,385,757 | |||||||||
Klepierre SA (France)b |
| 143,372 | 3,304,263 | |||||||||
Link REIT (Hong Kong) |
| 480,900 | 3,530,299 | |||||||||
Mercialys SA (France) |
| 61,379 | 641,919 | |||||||||
RioCan Real Estate Investment Trust (Canada) |
| 188,067 | 2,934,901 | |||||||||
Unibail-Rodamco-Westfield (France)b |
| 18,480 | 961,994 | |||||||||
|
| |||||||||||
| 17,342,063 | ||||||||||||
|
| |||||||||||
SELF STORAGE | 1.6% | |||||||||||
Public Storage |
| 54,712 | 15,329,755 | |||||||||
|
| |||||||||||
SELF STORAGE—FOREIGN | 0.3% | |||||||||||
Safestore Holdings PLC (United Kingdom) |
| 243,958 | 2,787,117 | |||||||||
|
| |||||||||||
SHOPPING CENTERS | 2.5% | |||||||||||
Brixmor Property Group, Inc. |
| 31,232 | 708,029 | |||||||||
Kimco Realty Corp. |
| 185,609 | 3,931,198 | |||||||||
Realty Income Corp. |
| 159,948 | 10,145,502 | |||||||||
Simon Property Group, Inc. |
| 76,216 | 8,953,856 | |||||||||
|
| |||||||||||
| 23,738,585 | ||||||||||||
|
| |||||||||||
TOTAL REAL ESTATE |
| 226,700,838 | ||||||||||
|
| |||||||||||
TOLL ROADS—FOREIGN | 1.2% | |||||||||||
Atlas Arteria Ltd. (Australia)c |
| 309,562 | 1,393,159 | |||||||||
Transurban Group (Australia)c |
| 413,386 | 3,653,272 | |||||||||
Vinci SA (France) |
| 65,228 | 6,513,813 | |||||||||
|
| |||||||||||
| 11,560,244 | ||||||||||||
|
| |||||||||||
TRANSPORT LOGISTICS—FOREIGN | 0.1% | |||||||||||
Qube Holdings Ltd. (Australia) |
| 410,295 | 784,972 | |||||||||
|
| |||||||||||
UTILITIES | 2.2% | |||||||||||
ELECTRIC—FOREIGN | 0.3% | |||||||||||
Enel SpA (Italy) |
| 498,711 | 2,685,240 | |||||||||
|
| |||||||||||
See accompanying notes to the consolidated financial statements.
20
COHEN & STEERS REAL ASSETS FUND, INC.
CONSOLIDATED SCHEDULE OF INVESTMENTS—(Continued)
December 31, 2022
| Shares | Value | |||||||||||
MULTI-UTILITIES | 1.4% | |||||||||||
Consolidated Edison, Inc. |
| 26,731 | $ | 2,547,732 | ||||||||
NiSource, Inc. |
| 151,510 | 4,154,404 | |||||||||
Sempra Energy |
| 41,125 | 6,355,457 | |||||||||
|
| |||||||||||
| 13,057,593 | ||||||||||||
|
| |||||||||||
WATER | 0.2% | |||||||||||
Essential Utilities, Inc. |
| 33,216 | 1,585,400 | |||||||||
|
| |||||||||||
WATER—FOREIGN | 0.3% | |||||||||||
Guangdong Investment Ltd. (H shares) (China) |
| 1,322,000 | 1,353,257 | |||||||||
Pennon Group PLC (United Kingdom) |
| 136,673 | 1,468,076 | |||||||||
|
| |||||||||||
| 2,821,333 | ||||||||||||
|
| |||||||||||
TOTAL UTILITIES |
| 20,149,566 | ||||||||||
|
| |||||||||||
TOTAL COMMON STOCK |
| 535,248,587 | ||||||||||
|
| |||||||||||
EXCHANGE-TRADED FUNDS | 5.3% | |||||||||||
GOLD | 5.2% | |||||||||||
iShares Gold Trust ETFb |
| 416,807 | 14,417,354 | |||||||||
SPDR Gold MiniShares Trustb |
| 934,163 | 33,807,359 | |||||||||
|
| |||||||||||
| 48,224,713 | ||||||||||||
|
| |||||||||||
SHORT-TERM BOND | 0.1% | |||||||||||
SPDR Portfolio Short Term Corporate Bond ETF |
| 51,303 | 1,507,282 | |||||||||
|
| |||||||||||
TOTAL EXCHANGE-TRADED FUNDS |
| 49,731,995 | ||||||||||
|
| |||||||||||
| Principal Amount | ||||||||||||
PREFERRED SECURITIES—CAPITAL SECURITIES | 3.9% | |||||||||||
BANKS | 0.6% | |||||||||||
Bank of America Corp., 6.25% to 9/5/24, Series Xd,e |
| $ | 750,000 | 722,146 | ||||||||
Bank of America Corp., 6.50% to 10/23/24, Series Zd,e |
| 525,000 | 519,137 | |||||||||
Citigroup, Inc., 5.90% to 2/15/23, Series Bd,e |
| 275,000 | 272,822 | |||||||||
Citigroup, Inc., 5.95% to 1/30/23, Series Ad,e |
| 750,000 | 744,562 | |||||||||
Corestates Capital III, 5.176% (3 Month US LIBOR + 0.57%), due 2/15/27, 144A (TruPS) (FRN)a,f |
| 1,000,000 | 931,917 | |||||||||
JPMorgan Chase & Co., 6.75% to 2/1/24, Series Sd,e |
| 500,000 | 498,383 | |||||||||
See accompanying notes to the consolidated financial statements.
21
COHEN & STEERS REAL ASSETS FUND, INC.
CONSOLIDATED SCHEDULE OF INVESTMENTS—(Continued)
December 31, 2022
| Principal Amount | Value | |||||||||||
PNC Financial Services Group, Inc./The, 8.118% (3 Month US LIBOR + 3.678%), Series O (FRN)d,f |
| $ | 1,250,000 | $ | 1,251,248 | |||||||
Truist Financial Corp., 5.419% (3 Month US LIBOR + 0.65%), due 3/15/28, (TruPS) (FRN)f |
| 550,000 | 498,311 | |||||||||
|
| |||||||||||
| 5,438,526 | ||||||||||||
|
| |||||||||||
BANKS—FOREIGN | 0.4% | |||||||||||
Barclays PLC, 8.00% to 6/15/24 (United Kingdom) |
| 800,000 | 779,284 | |||||||||
Credit Agricole SA, 7.875% to 1/23/24, 144A (France) (USD)a,d,e,g |
| 1,000,000 | 994,056 | |||||||||
Lloyds Banking Group PLC, 7.50% to 6/27/24 (United Kingdom) (USD)d,e,g |
| 800,000 | 777,200 | |||||||||
Standard Chartered PLC, 7.75% to 4/2/23, 144A (United Kingdom) (USD)a,d,e,g |
| 600,000 | 596,780 | |||||||||
UBS Group AG, 7.00% to 1/31/24, 144A (Switzerland) (USD)a,d,e,g |
| 400,000 | 394,529 | |||||||||
|
| |||||||||||
| 3,541,849 | ||||||||||||
|
| |||||||||||
ELECTRIC | 0.2% | |||||||||||
Dominion Energy, Inc., 3.071%, due 8/15/24 |
| 1,806,000 | 1,741,343 | |||||||||
|
| |||||||||||
ELECTRIC—FOREIGN | 0.5% | |||||||||||
Electricite de France SA, 5.25% to 1/29/23, 144A (France) (USD)a,d,e |
| 1,000,000 | 997,822 | |||||||||
Emera, Inc., 6.75% to 6/15/26, due 6/15/76, Series 16-A (Canada) (USD)e |
| 1,300,000 | 1,253,161 | |||||||||
Enel SpA, 8.75% to 9/24/23, due 9/24/73, 144A (Italy) (USD)a,e |
| 3,100,000 | 3,109,931 | |||||||||
|
| |||||||||||
| 5,360,914 | ||||||||||||
|
| |||||||||||
INSURANCE | 2.1% | |||||||||||
LIFE/HEALTH INSURANCE | 0.5% | |||||||||||
Prudential Financial, Inc., 5.625% to 6/15/23, due 6/15/43e |
| 4,935,000 | 4,855,349 | |||||||||
|
| |||||||||||
LIFE/HEALTH INSURANCE—FOREIGN | 1.2% | |||||||||||
Dai-ichi Life Insurance Co., Ltd./The, 5.10% to 10/28/24, 144A (Japan) (USD)a,d,e |
| 800,000 | 781,865 | |||||||||
Fukoku Mutual Life Insurance Co., 6.50% to 9/19/23 (Japan) (USD)d,e,h |
| 2,400,000 | 2,398,032 | |||||||||
See accompanying notes to the consolidated financial statements.
22
COHEN & STEERS REAL ASSETS FUND, INC.
CONSOLIDATED SCHEDULE OF INVESTMENTS—(Continued)
December 31, 2022
| Principal Amount | Value | |||||||||||
Meiji Yasuda Life Insurance Co., 5.20% to 10/20/25, due 10/20/45, 144A (Japan) (USD)a,e |
| $ | 1,000,000 | $ | 969,655 | |||||||
Nippon Life Insurance Co., 5.10% to 10/16/24, due 10/16/44, 144A (Japan) (USD)a,e |
| 3,000,000 | 2,935,273 | |||||||||
Sumitomo Life Insurance Co., 6.50% to 9/20/23, due 9/20/73, 144A (Japan) (USD)a,e |
| 4,400,000 | 4,376,439 | |||||||||
|
| |||||||||||
| 11,461,264 | ||||||||||||
|
| |||||||||||
PROPERTY CASUALTY—FOREIGN | 0.4% | |||||||||||
QBE Insurance Group Ltd., 7.50% to 11/24/23, due 11/24/43, 144A (Australia) (USD)a,e |
| 800,000 | 800,013 | |||||||||
Sompo Japan Insurance, Inc., 5.325% to 3/28/23, due 3/28/73, 144A (Japan) (USD)a,e |
| 2,800,000 | 2,787,362 | |||||||||
|
| |||||||||||
| 3,587,375 | ||||||||||||
|
| |||||||||||
TOTAL INSURANCE |
| 19,903,988 | ||||||||||
|
| |||||||||||
INTEGRATED TELECOMMUNICATIONS SERVICES—FOREIGN | 0.1% | |||||||||||
Vodafone Group PLC, 6.25% to 7/3/24, due 10/3/78 (United Kingdom) (USD)e,h |
| 700,000 | 672,385 | |||||||||
|
| |||||||||||
TOTAL PREFERRED SECURITIES—CAPITAL SECURITIES |
| 36,659,005 | ||||||||||
|
| |||||||||||
CORPORATE BONDS | 6.5% | |||||||||||
BANKS | 0.3% | |||||||||||
Goldman Sachs Group, Inc./The, 1.757% to 1/24/24, due 1/24/25e |
| 850,000 | 813,927 | |||||||||
Morgan Stanley, 3.62% to 4/17/24, due 4/17/25e |
| 1,015,000 | 990,952 | |||||||||
Morgan Stanley, 5.022% (SOFR + 1.165%), due 4/17/25 (FRN)f |
| 1,275,000 | 1,270,026 | |||||||||
|
| |||||||||||
| 3,074,905 | ||||||||||||
|
| |||||||||||
COMMUNICATIONS—TOWERS | 0.2% | |||||||||||
American Tower Corp., 2.95%, due 1/15/25 |
| 570,000 | 544,080 | |||||||||
American Tower Corp., 4.00%, due 6/1/25 |
| 1,075,000 | 1,048,383 | |||||||||
American Tower Corp., 5.00%, due 2/15/24 |
| 300,000 | 299,028 | |||||||||
|
| |||||||||||
| 1,891,491 | ||||||||||||
|
| |||||||||||
ELECTRIC | 1.7% | |||||||||||
American Electric Power Co., Inc., 2.031%, due 3/15/24 |
| 940,000 | 906,772 | |||||||||
See accompanying notes to the consolidated financial statements.
23
COHEN & STEERS REAL ASSETS FUND, INC.
CONSOLIDATED SCHEDULE OF INVESTMENTS—(Continued)
December 31, 2022
| Principal Amount | Value | |||||||||||
DTE Energy Co., 4.22%, due 11/1/24 |
| $ | 2,439,000 | $ | 2,399,166 | |||||||
DTE Energy Co., 2.529%, due 10/1/24, Series C |
| 695,000 | 664,793 | |||||||||
Duke Energy Corp., 5.00%, due 12/8/25 |
| 925,000 | 924,034 | |||||||||
NextEra Energy Capital Holdings, Inc., 0.65%, due 3/1/23 |
| 500,000 | 496,608 | |||||||||
NextEra Energy Capital Holdings, Inc., 4.20%, due 6/20/24 |
| 1,525,000 | 1,505,777 | |||||||||
NextEra Energy Capital Holdings, Inc., 4.255%, due 9/1/24 |
| 1,750,000 | 1,727,388 | |||||||||
NextEra Energy Capital Holdings, Inc., 4.45%, due 6/20/25 |
| 1,430,000 | 1,413,661 | |||||||||
Southern California Edison Co., 1.10%, due 4/1/24 |
| 260,000 | 247,063 | |||||||||
Southern California Edison Co., 4.20%, due 6/1/25, Series C |
| 1,120,000 | 1,100,338 | |||||||||
Southern Co./The, 4.475%, due 8/1/24 |
| 1,380,000 | 1,363,562 | |||||||||
WEC Energy Group, Inc., 5.00%, due 9/27/25 |
| 1,750,000 | 1,751,430 | |||||||||
Wisconsin Public Service Corp., 5.35%, due 11/10/25 |
| 1,000,000 | 1,012,125 | |||||||||
|
| |||||||||||
| 15,512,717 | ||||||||||||
|
| |||||||||||
ELECTRIC—FOREIGN | 0.4% | |||||||||||
Emera US Finance LP, 0.833%, due 6/15/24 (Canada) (USD) |
| 1,555,000 | 1,452,044 | |||||||||
Enel Finance International NV, 4.25%, due 6/15/25, 144A (Italy) (USD)a |
| 1,250,000 | 1,211,435 | |||||||||
Enel Finance International NV, 6.80%, due 10/14/25, 144A (Italy) (USD)a |
| 800,000 | 822,325 | |||||||||
|
| |||||||||||
| 3,485,804 | ||||||||||||
|
| |||||||||||
FINANCIAL | 0.3% | |||||||||||
General Motors Financial Co., Inc., 3.80%, due 4/7/25 |
| 500,000 | 483,076 | |||||||||
General Motors Financial Co., Inc., 4.992% (SOFR + 1.30%), due 4/7/25 (FRN)f |
| 535,000 | 521,791 | |||||||||
National Rural Utilities Cooperative Finance Corp., 1.00%, due 10/18/24, Series D |
| 150,000 | 138,793 | |||||||||
Newmark Group, Inc., 6.125%, due 11/15/23 |
| 1,990,000 | 1,974,363 | |||||||||
|
| |||||||||||
| 3,118,023 | ||||||||||||
|
| |||||||||||
FINANCIAL—FOREIGN | 0.0% | |||||||||||
AerCap Ireland Capital DAC Trust, 1.65%, due 10/29/24 (Ireland) (USD) |
| 300,000 | 276,922 | |||||||||
|
| |||||||||||
See accompanying notes to the consolidated financial statements.
24
COHEN & STEERS REAL ASSETS FUND, INC.
CONSOLIDATED SCHEDULE OF INVESTMENTS—(Continued)
December 31, 2022
| Principal Amount | Value | |||||||||||
HEALTH CARE | 0.1% | |||||||||||
GSK Consumer Healthcare Capital US LLC, |
| $ | 600,000 | $ | 582,611 | |||||||
|
| |||||||||||
HEALTH CARE—FOREIGN | 0.1% | |||||||||||
GSK Consumer Healthcare Capital UK PLC, |
| 500,000 | 475,915 | |||||||||
|
| |||||||||||
INTEGRATED TELECOMMUNICATIONS SERVICES | 0.3% | |||||||||||
AT&T, Inc., 0.90%, due 3/25/24 |
| 900,000 | 855,082 | |||||||||
T-Mobile USA, Inc., 3.50%, due 4/15/25 |
| 1,640,000 | 1,578,618 | |||||||||
Verizon Communications, Inc., 3.376%, due 2/15/25 |
| 680,000 | 659,379 | |||||||||
Verizon Communications, Inc., 5.706% (3 Month |
| 200,000 | 201,692 | |||||||||
|
| |||||||||||
| 3,294,771 | ||||||||||||
|
| |||||||||||
MEDIA | 0.1% | |||||||||||
Warnermedia Holdings, Inc., 3.788%, due 3/15/25, 144Aa |
| 1,050,000 | 1,003,772 | |||||||||
|
| |||||||||||
PIPELINES—FOREIGN | 0.0% | |||||||||||
Enbridge, Inc., 2.50%, due 2/14/25 (Canada) (USD) |
| 115,000 | 108,588 | |||||||||
Enbridge, Inc., 4.785% (SOFR + 0.63%), due 2/16/24 (FRN) (Canada) (USD)f |
| 125,000 | 124,367 | |||||||||
|
| |||||||||||
| 232,955 | ||||||||||||
|
| |||||||||||
REAL ESTATE | 2.9% | |||||||||||
DATA CENTERS | 0.2% | |||||||||||
Equinix, Inc., 1.25%, due 7/15/25 |
| 500,000 | 452,567 | |||||||||
Equinix, Inc., 2.625%, due 11/18/24 |
| 1,408,000 | 1,341,834 | |||||||||
|
| |||||||||||
| 1,794,401 | ||||||||||||
|
| |||||||||||
DIVERSIFIED | 0.1% | |||||||||||
National Retail Properties, Inc., 3.90%, due 6/15/24 |
| 650,000 | 634,910 | |||||||||
Spirit Realty LP, 3.20%, due 1/15/27 |
| 359,000 | 318,829 | |||||||||
|
| |||||||||||
| 953,739 | ||||||||||||
|
| |||||||||||
FINANCE | 1.4% | |||||||||||
Boston Properties LP, 3.125%, due 9/1/23 |
| 1,200,000 | 1,181,473 | |||||||||
Essex Portfolio LP, 3.25%, due 5/1/23 |
| 500,000 | 496,267 | |||||||||
Essex Portfolio LP, 3.50%, due 4/1/25 |
| 1,500,000 | 1,447,754 | |||||||||
Essex Portfolio LP, 3.875%, due 5/1/24 |
| 1,075,000 | 1,053,138 | |||||||||
See accompanying notes to the consolidated financial statements.
25
COHEN & STEERS REAL ASSETS FUND, INC.
CONSOLIDATED SCHEDULE OF INVESTMENTS—(Continued)
December 31, 2022
| Principal Amount | Value | |||||||||||
Federal Realty Investment Trust, 3.95%, due 1/15/24 |
| $ | 2,237,000 | $ | 2,208,802 | |||||||
Kilroy Realty LP, 4.375%, due 10/1/25 |
| 650,000 | 630,693 | |||||||||
Kimco Realty Corp., 2.70%, due 3/1/24 |
| 550,000 | 532,557 | |||||||||
Mid-America Apartments LP, 3.75%, due 6/15/24 |
| 370,000 | 362,529 | |||||||||
Realty Income Corp., 4.60%, due 2/6/24 |
| 1,250,000 | 1,242,166 | |||||||||
Realty Income Corp., 4.625%, due 11/1/25 |
| 800,000 | 791,749 | |||||||||
Ventas Realty LP, 3.75%, due 5/1/24 |
| 500,000 | 489,019 | |||||||||
VICI Properties LP/VICI Note Co., Inc., 5.625%, due 5/1/24, 144Aa |
| 2,200,000 | 2,182,697 | |||||||||
|
| |||||||||||
| 12,618,844 | ||||||||||||
|
| |||||||||||
HEALTH CARE | 0.4% | |||||||||||
Healthcare Realty Holdings LP, 3.875%, due 5/1/25 |
| 1,650,000 | 1,577,081 | |||||||||
Healthpeak Properties, Inc., 3.40%, due 2/1/25 |
| 1,267,000 | 1,219,992 | |||||||||
Healthpeak Properties, Inc., 4.00%, due 6/1/25 |
| 455,000 | 443,508 | |||||||||
Sabra Health Care LP, 5.125%, due 8/15/26 |
| 70,000 | 66,687 | |||||||||
Welltower, Inc., 3.625%, due 3/15/24 |
| 390,000 | 381,831 | |||||||||
Welltower, Inc., 4.50%, due 1/15/24 |
| 400,000 | 395,079 | |||||||||
|
| |||||||||||
| 4,084,178 | ||||||||||||
|
| |||||||||||
INDUSTRIALS | 0.1% | |||||||||||
Regency Centers LP, 3.75%, due 6/15/24 |
| 1,436,000 | 1,393,587 | |||||||||
|
| |||||||||||
NET LEASE | 0.2% | |||||||||||
WP Carey, Inc., 4.00%, due 2/1/25 |
| 116,000 | 113,126 | |||||||||
WP Carey, Inc., 4.60%, due 4/1/24 |
| 1,657,000 | 1,642,057 | |||||||||
|
| |||||||||||
| 1,755,183 | ||||||||||||
|
| |||||||||||
OFFICE | 0.3% | |||||||||||
Boston Properties LP, 3.80%, due 2/1/24 |
| 600,000 | 589,523 | |||||||||
Kilroy Realty LP, 3.45%, due 12/15/24 |
| 2,250,000 | 2,155,315 | |||||||||
|
| |||||||||||
| 2,744,838 | ||||||||||||
|
| |||||||||||
RETAIL | 0.1% | |||||||||||
Retail Opportunity Investments Partnership LP, |
| 500,000 | 494,581 | |||||||||
|
| |||||||||||
SELF STORAGE | 0.0% | |||||||||||
CubeSmart LP, 3.125%, due 9/1/26 |
| 290,000 | 266,696 | |||||||||
|
| |||||||||||
See accompanying notes to the consolidated financial statements.
26
COHEN & STEERS REAL ASSETS FUND, INC.
CONSOLIDATED SCHEDULE OF INVESTMENTS—(Continued)
December 31, 2022
| Principal Amount | Value | |||||||||||
SHOPPING CENTERS | 0.1% | |||||||||||
Brixmor Operating Partnership LP, 3.85%, due 2/1/25 |
| $ | 153,000 | $ | 146,929 | |||||||
Kimco Realty Corp., 3.85%, due 6/1/25 |
| 150,000 | 144,421 | |||||||||
Kimco Realty Corp., 4.45%, due 1/15/24 |
| 300,000 | 296,447 | |||||||||
Kite Realty Group Trust, 4.00%, due 3/15/25 |
| 456,000 | 434,146 | |||||||||
|
| |||||||||||
| 1,021,943 | ||||||||||||
|
| |||||||||||
TOTAL REAL ESTATE |
| 27,127,990 | ||||||||||
|
| |||||||||||
UTILITIES | 0.1% | |||||||||||
ELECTRIC |
| |||||||||||
Sempra Energy, 3.30%, due 4/1/25 |
| 490,000 | 470,304 | |||||||||
|
| |||||||||||
TOTAL CORPORATE BONDS |
| 60,548,180 | ||||||||||
|
| |||||||||||
U.S. TREASURY INFLATION-PROTECTED SECURITIES | 0.1% | |||||||||||
U.S. Treasury Inflation Indexed Bonds, 2.375%, due 1/15/25 |
| 395,198 | 395,593 | |||||||||
|
| |||||||||||
TOTAL U.S. TREASURY INFLATION-PROTECTED SECURITIES |
| 395,593 | ||||||||||
|
| |||||||||||
| Shares | ||||||||||||
SHORT-TERM INVESTMENTS | 26.6% | |||||||||||
MONEY MARKET FUNDS | 2.0% | |||||||||||
State Street Institutional Treasury Money Market Fund Premier Class, 3.79%i |
| 18,846,072 | 18,846,072 | |||||||||
|
| |||||||||||
| Principal Amount | ||||||||||||
U.S. TREASURY BILLS | 24.6% | |||||||||||
United States Treasury Bills, 4.199%, due 2/9/23j |
| $ | 16,674,000 | 16,599,940 | ||||||||
United States Treasury Bills, 4.235%, due 2/16/23j |
| 13,603,000 | 13,531,144 | |||||||||
United States Treasury Bills, 4.236%, due 2/16/23j |
| 15,201,000 | 15,120,684 | |||||||||
United States Treasury Bills, 4.237%, due 2/16/23j,k |
| 25,549,000 | 25,413,993 | |||||||||
United States Treasury Bills, 4.241%, due 2/16/23j |
| 17,366,000 | 17,274,134 | |||||||||
United States Treasury Bills, 4.328%, due 3/2/23j |
| 9,597,000 | 9,531,537 | |||||||||
United States Treasury Bills, 4.332%, due 3/2/23j |
| 27,324,000 | 27,137,616 | |||||||||
United States Treasury Bills, 4.292%, due 3/16/23j |
| 44,193,000 | 43,826,949 | |||||||||
United States Treasury Bills, 4.324%, due 3/16/23j |
| 33,262,000 | 32,986,491 | |||||||||
See accompanying notes to the consolidated financial statements.
27
COHEN & STEERS REAL ASSETS FUND, INC.
CONSOLIDATED SCHEDULE OF INVESTMENTS—(Continued)
December 31, 2022
| Principal Amount | Value | |||||||||||
United States Treasury Bills, 3.992%, due 4/6/23j |
| $ | 9,022,000 | $ | 8,924,228 | |||||||
United States Treasury Bills, 4.281%, due 4/13/23j,k |
| 19,206,000 | 18,989,399 | |||||||||
|
| |||||||||||
| 229,336,115 | ||||||||||||
|
| |||||||||||
TOTAL SHORT-TERM INVESTMENTS |
| 248,182,187 | ||||||||||
|
| |||||||||||
TOTAL INVESTMENTSIN SECURITIES | 99.8% | 930,765,547 | ||||||||||
OTHER ASSETSIN EXCESSOF LIABILITIESl | 0.2 | 2,122,696 | ||||||||||
|
|
|
| |||||||||
NET ASSETS | 100.0% | $ | 932,888,243 | |||||||||
|
|
|
| |||||||||
Glossary of Portfolio Abbreviations
ADR | American Depositary Receipt | |
ETF | Exchange-Traded Fund | |
FRN | Floating Rate Note | |
GBP | Great British Pound | |
GDR | Global Depositary Receipt | |
LIBOR | London Interbank Offered Rate | |
REIT | Real Estate Investment Trust | |
SGD | Singapore Dollar | |
SOFR | Secured Overnight Financing Rate | |
SPDR | Standard & Poor’s Depositary Receipt | |
TruPS | Trust Preferred Securities | |
USD | United States Dollar |
Note: Percentages indicated are based on the net assets of the Fund.
| a | Securities exempt from registration under Rule 144A of the Securities Act of 1933. These securities may only be resold to qualified institutional buyers. Aggregate holdings amounted to $39,979,048 which represents 4.3% of the net assets of the Fund, of which 0.0% are illiquid. |
| b | Non-income producing security. |
| c | Stapled security. A security contractually bound to one or more other securities to form a single saleable unit which cannot be sold separately. |
| d | Perpetual security. Perpetual securities have no stated maturity date, but they may be called/redeemed by the issuer. |
| e | Security converts to floating rate after the indicated fixed-rate coupon period. |
See accompanying notes to the consolidated financial statements.
28
COHEN & STEERS REAL ASSETS FUND, INC.
CONSOLIDATED SCHEDULE OF INVESTMENTS—(Continued)
December 31, 2022
| f | Variable rate. Rate shown is in effect at December 31, 2022. |
| g | Contingent Capital security (CoCo). CoCos are debt or preferred securities with loss absorption characteristics built into the terms of the security for the benefit of the issuer. Aggregate holdings amounted to $3,541,849 or 0.4% of the net assets of the Fund. |
| h | Securities exempt from registration under Regulation S of the Securities Act of 1933. These securities are subject to resale restrictions. Aggregate holdings amounted to $3,070,417 which represents 0.3% of the net assets of the Fund, of which 0.0% are illiquid. |
| i | Rate quoted represents the annualized seven-day yield. |
| j | The rate shown is the effective yield on the date of purchase. |
| k | All or a portion of this security has been pledged as collateral for futures contracts. $32,630,431 in aggregate has been pledged as collateral to Morgan Stanley & Co. LLC. |
| l | Other assets in excess of liabilities include unrealized appreciation/depreciation on open futures contracts at December 31, 2022. |
Futures Contracts
| Description | Number of Contracts | Expiration Date | Notional Amount | Notional Value | Unrealized Appreciation (Depreciation) | |||||||||||||
LONG FUTURES OUTSTANDING | ||||||||||||||||||
| Aluminum HG LME | 264 | January 16, 2023 | $16,061,393 | $15,506,766 | $(554,627 | ) | ||||||||||||
| Aluminum HG LME | 33 | March 13, 2023 | 2,078,820 | 1,956,908 | (121,912 | ) | ||||||||||||
| Aluminum HG LME | 140 | April 17, 2023 | 8,857,196 | 8,351,000 | (506,196 | ) | ||||||||||||
| Brent Crude Oila | 276 | January 31, 2023 | 24,066,051 | 23,711,160 | (354,891 | ) | ||||||||||||
| Brent Crude Oila | 58 | April 28, 2023 | 4,779,488 | 4,916,080 | 136,592 | |||||||||||||
| Cattle Feedera | 19 | March 30, 2023 | 1,755,173 | 1,769,138 | 13,965 | |||||||||||||
| Coffee C | 74 | July 19, 2023 | 4,546,390 | 4,623,150 | 76,760 | |||||||||||||
| Coffee Robusta | 70 | March 27, 2023 | 1,318,368 | 1,259,300 | (59,068 | ) | ||||||||||||
| Copper | 27 | March 29, 2023 | 2,550,615 | 2,572,088 | 21,473 | |||||||||||||
| Copper | 116 | July 27, 2023 | 11,018,204 | 11,066,400 | 48,196 | |||||||||||||
| Corn | 431 | July 14, 2023 | 14,512,597 | 14,476,212 | (36,385 | ) | ||||||||||||
| Cotton No.2 | 58 | March 9, 2023 | 2,395,815 | 2,417,730 | 21,915 | |||||||||||||
| Gasoline RBOB | 31 | February 28, 2023 | 2,905,700 | 3,226,747 | 321,047 | |||||||||||||
| Gasoline RBOB | 15 | June 30, 2023 | 1,516,478 | 1,616,202 | 99,724 | |||||||||||||
| Gold 100 oz | 182 | February 24, 2023 | 32,443,674 | 33,236,840 | 793,166 | |||||||||||||
| KC HRW Wheat | 42 | March 14, 2023 | 1,768,207 | 1,864,800 | 96,593 | |||||||||||||
| Lean Hogsa | 83 | February 14, 2023 | 2,959,637 | 2,911,640 | (47,997 | ) | ||||||||||||
| Live Cattle | 182 | February 28, 2023 | 11,321,200 | 11,495,120 | 173,920 | |||||||||||||
| Low Sulphur Gasoil | 93 | March 10, 2023 | 8,334,076 | 8,207,250 | (126,826 | ) | ||||||||||||
| Natural Gas | 505 | February 24, 2023 | 25,154,806 | 20,725,200 | (4,429,606 | ) | ||||||||||||
See accompanying notes to the consolidated financial statements.
29
COHEN & STEERS REAL ASSETS FUND, INC.
CONSOLIDATED SCHEDULE OF INVESTMENTS—(Continued)
December 31, 2022
Futures Contracts—(Continued)
| Description | Number of Contracts | Expiration Date | Notional Amount | Notional Value | Unrealized Appreciation (Depreciation) | |||||||||||||
| Nickel LME | 69 | January 16, 2023 | $ 9,657,375 | $ 12,379,014 | $ 2,721,639 | |||||||||||||
| Nickel LME | 57 | March 13, 2023 | 8,086,446 | 10,275,390 | 2,188,944 | |||||||||||||
| Nickel LME | 54 | April 17, 2023 | 9,325,549 | 9,759,528 | 433,979 | |||||||||||||
| Nickel LME | 53 | June 19, 2023 | 7,315,732 | 9,631,266 | 2,315,534 | |||||||||||||
| NY Harbor ULSD | 35 | February 28, 2023 | 4,282,041 | 4,673,424 | 391,383 | |||||||||||||
| NY Harbor ULSD | 15 | March 31, 2023 | 1,794,085 | 1,927,863 | 133,778 | |||||||||||||
| Platinum | 15 | April 26, 2023 | 761,691 | 812,175 | 50,484 | |||||||||||||
| Silver | 104 | March 29, 2023 | 10,296,654 | 12,500,800 | 2,204,146 | |||||||||||||
| Soybean | 147 | March 14, 2023 | 10,623,573 | 11,201,400 | 577,827 | |||||||||||||
| Soybean | 47 | July 14, 2023 | 3,427,538 | 3,603,138 | 175,600 | |||||||||||||
| Soybean Meal | 202 | May 12, 2023 | 8,655,695 | 9,312,200 | 656,505 | |||||||||||||
| Soybean Oil | 241 | March 14, 2023 | 9,010,352 | 9,264,522 | 254,170 | |||||||||||||
| Sugar #11 (World) | 186 | February 28, 2023 | 3,862,156 | 4,174,733 | 312,577 | |||||||||||||
| Wheat | 31 | March 14, 2023 | 1,192,139 | 1,227,600 | 35,461 | |||||||||||||
| Wheat | 175 | July 14, 2023 | 6,627,275 | 7,026,250 | 398,975 | |||||||||||||
| WTI Crude Oil | 315 | February 21, 2023 | 24,277,814 | 25,341,750 | 1,063,936 | |||||||||||||
| WTI Crude Oil | 70 | July 20, 2023 | 5,396,801 | 5,555,200 | 158,399 | |||||||||||||
| Zinc LME | 109 | January 16, 2023 | 8,796,509 | 8,148,431 | (648,078 | ) | ||||||||||||
| Zinc LME | 103 | March 13, 2023 | 7,784,214 | 7,664,487 | (119,727 | ) | ||||||||||||
| Zinc LME | 88 | July 17, 2023 | 5,881,907 | 6,472,950 | 591,043 | |||||||||||||
|
|
|
|
|
| |||||||||||||
| $327,399,434 | $336,861,852 | $9,462,418 | ||||||||||||||||
|
|
|
|
|
| |||||||||||||
SHORT FUTURES OUTSTANDING |
| |||||||||||||||||
| Aluminum HG LME | 264 | January 16, 2023 | $(16,222,718 | ) | $(15,506,766 | ) | $715,952 | |||||||||||
| Aluminum HG LME | 22 | March 13, 2023 | (1,344,020 | ) | (1,304,606 | ) | 39,414 | |||||||||||
| Aluminum HG LME | 4 | April 17, 2023 | (245,530 | ) | (238,600 | ) | 6,930 | |||||||||||
| Brent Crude Oila | 121 | October 31, 2023 | (9,585,058 | ) | (9,879,650 | ) | (294,592 | ) | ||||||||||
| Coffee C | 24 | March 21, 2023 | (1,475,383 | ) | (1,505,700 | ) | (30,317 | ) | ||||||||||
| Corn | 113 | March 14, 2023 | (3,617,630 | ) | (3,833,525 | ) | (215,895 | ) | ||||||||||
| Lean Hogsa | 76 | April 17, 2023 | (2,922,204 | ) | (2,897,120 | ) | 25,084 | |||||||||||
| Lean Hogsa | 8 | June 14, 2023 | (339,865 | ) | (349,360 | ) | (9,495 | ) | ||||||||||
| Nickel LME | 69 | January 16, 2023 | (10,832,341 | ) | (12,379,014 | ) | (1,546,673 | ) | ||||||||||
| Nickel LME | 61 | March 13, 2023 | (8,488,126 | ) | (10,996,470 | ) | (2,508,344 | ) | ||||||||||
| Nickel LME | 3 | April 17, 2023 | (523,045 | ) | (542,196 | ) | (19,151 | ) | ||||||||||
| Nickel LME | 53 | June 19, 2023 | (7,336,702 | ) | (9,631,266 | ) | (2,294,564 | ) | ||||||||||
| WTI Crude Oil | 132 | November 20, 2023 | (10,255,466 | ) | (10,204,920 | ) | 50,546 | |||||||||||
| Zinc LME | 109 | January 16, 2023 | (8,269,502 | ) | (8,148,431 | ) | 121,071 | |||||||||||
See accompanying notes to the consolidated financial statements.
30
COHEN & STEERS REAL ASSETS FUND, INC.
CONSOLIDATED SCHEDULE OF INVESTMENTS—(Continued)
December 31, 2022
Futures Contracts—(Continued)
| Description | Number of Contracts | Expiration Date | Notional Amount | Notional Value | Unrealized Appreciation (Depreciation) | |||||||||||||
| Zinc LME | 83 | March 13, 2023 | $ (5,632,334 | ) | $ (6,176,238 | ) | $ (543,904 | ) | ||||||||||
| Zinc LME | 6 | July 17, 2023 | (461,991 | ) | (441,337 | ) | 20,654 | |||||||||||
|
|
|
|
|
| |||||||||||||
| $(87,551,915 | ) | $(94,035,199 | ) | $(6,483,284 | ) | |||||||||||||
|
|
|
|
|
| |||||||||||||
| a | Futures contracts are cash settled based upon the price of the underlying commodity. |
Glossary of Portfolio Abbreviations
HG | High Grade | |
HRW | Hard Red Winter | |
LME | London Metal Exchange | |
RBOB | Reformulated Gasoline Blendstock for Oxygen Blending | |
ULSD | Ultra Low Sulfur Diesel | |
WTI | West Texas Intermediate |
Country Summary | % of Net Assets | |||
United States | 67.7 | |||
Canada | 5.7 | |||
Japan | 4.7 | |||
Australia | 3.8 | |||
United Kingdom | 2.7 | |||
France | 2.3 | |||
Hong Kong | 1.6 | |||
Spain | 1.5 | |||
Netherlands | 1.2 | |||
Italy | 1.0 | |||
Brazil | 0.9 | |||
Singapore | 0.9 | |||
Norway | 0.7 | |||
China | 0.6 | |||
Germany | 0.5 | |||
Other (includes short-term investments) | 4.2 | |||
|
| |||
| 100.0 | ||||
|
| |||
See accompanying notes to the consolidated financial statements.
31
COHEN & STEERS REAL ASSETS FUND, INC.
CONSOLIDATED STATEMENT OF ASSETS AND LIABILITIES
December 31, 2022
ASSETS: |
| |||
Investments in securities, at value (Identified cost—$919,411,229) | $ | 930,765,547 | ||
Cash | 4,804 | |||
Foreign currency, at value (Identified cost—$296,310) | 296,917 | |||
Deposits at broker for futures contracts | 573,083 | |||
Receivable for: | ||||
Fund shares sold | 2,383,499 | |||
Dividends and interest | 2,352,580 | |||
Variation margin on futures contracts | 873,764 | |||
Investment securities sold | 10,201 | |||
Other assets | 11,339 | |||
|
| |||
Total Assets | 937,271,734 | |||
|
| |||
LIABILITIES: |
| |||
Payable for: | ||||
Fund shares redeemed | 3,017,022 | |||
Investment advisory fees | 309,557 | |||
Investment securities purchased | 169,063 | |||
Shareholder servicing fees | 157,855 | |||
Administration fees | 64,350 | |||
Distribution fees | 843 | |||
Directors’ fees | 632 | |||
Other liabilities | 664,169 | |||
|
| |||
Total Liabilities | 4,383,491 | |||
|
| |||
NET ASSETS | $ | 932,888,243 | ||
|
| |||
NET ASSETS consist of: |
| |||
Paid-in capital | $ | 972,584,704 | ||
Total distributable earnings/(accumulated loss) | (39,696,461 | ) | ||
|
| |||
| $ | 932,888,243 | |||
|
| |||
See accompanying notes to the consolidated financial statements.
32
COHEN & STEERS REAL ASSETS FUND, INC.
CONSOLIDATED STATEMENT OF ASSETS AND LIABILITIES—(Continued)
December 31, 2022
CLASS A SHARES: |
| |||
NET ASSETS | $ | 16,715,318 | ||
Shares issued and outstanding ($0.001 par value common stock outstanding) | 1,710,495 | |||
|
| |||
Net asset value and redemption price per share | $ | 9.77 | ||
|
| |||
Maximum offering price per share ($9.77 ÷ 0.955)a | $ | 10.23 | ||
|
| |||
CLASS C SHARES: |
| |||
NET ASSETS | $ | 8,165,772 | ||
Shares issued and outstanding ($0.001 par value common stock outstanding) | 838,908 | |||
|
| |||
Net asset value and offering price per shareb | $ | 9.73 | ||
|
| |||
CLASS I SHARES: |
| |||
NET ASSETS | $ | 886,398,525 | ||
Shares issued and outstanding ($0.001 par value common stock outstanding) | 90,521,558 | |||
|
| |||
Net asset value, offering and redemption price per share | $ | 9.79 | ||
|
| |||
CLASS R SHARES: |
| |||
NET ASSETS | $ | 42,278 | ||
Shares issued and outstanding ($0.001 par value common stock outstanding) | 4,277 | |||
|
| |||
Net asset value, offering and redemption price per share | $ | 9.88 | ||
|
| |||
CLASS Z SHARES: |
| |||
NET ASSETS | $ | 21,566,350 | ||
Shares issued and outstanding ($0.001 par value common stock outstanding) | 2,206,803 | |||
|
| |||
Net asset value, offering and redemption price per share | $ | 9.77 | ||
|
| |||
| a | On investments of $100,000 or more, the offering price is reduced. |
| b | Redemption price per share is equal to the net asset value per share less any applicable contingent deferred sales charge of 1.00% on shares held for less than one year. |
See accompanying notes to the consolidated financial statements.
33
COHEN & STEERS REAL ASSETS FUND, INC.
CONSOLIDATED STATEMENT OF OPERATIONS
For the Year Ended December 31, 2022
Investment Income: |
| |||
Dividend income (net of $789,564 of foreign withholding tax) | $ | 14,746,083 | ||
Interest income | 5,818,678 | |||
|
| |||
Total Investment Income | 20,564,761 | |||
|
| |||
Expenses: |
| |||
Investment advisory fees | 5,605,955 | |||
Distribution fees—Class A | 42,575 | |||
Distribution fees—Class C | 51,794 | |||
Distribution fees—Class R | 255 | |||
Shareholder servicing fees—Class A | 17,030 | |||
Shareholder servicing fees—Class C | 17,265 | |||
Shareholder servicing fees—Class I | 523,916 | |||
Administration fees | 715,244 | |||
Registration and filing fees | 367,281 | |||
Custodian fees and expenses | 210,214 | |||
Professional fees | 183,782 | |||
Transfer agent fees and expenses | 87,498 | |||
Shareholder reporting expenses | 75,129 | |||
Directors’ fees and expenses | 57,177 | |||
Miscellaneous | 34,188 | |||
|
| |||
Total Expenses | 7,989,303 | |||
Reduction of Expenses (See Note 2) | (1,880,927 | ) | ||
|
| |||
Net Expenses | 6,108,376 | |||
|
| |||
Net Investment Income (Loss) | 14,456,385 | |||
|
| |||
Net Realized and Unrealized Gain (Loss): |
| |||
Net realized gain (loss) on: |
| |||
Investments in securities (net of $1,493 of foreign capital gains tax) | (32,417,892 | ) | ||
Futures contracts | (6,787,766 | ) | ||
Written option contracts | 30,440 | |||
Foreign currency transactions | (207,804 | ) | ||
|
| |||
Net realized gain (loss) | (39,383,022 | ) | ||
|
| |||
Net change in unrealized appreciation (depreciation) on: |
| |||
Investments in securities | (23,841,576 | ) | ||
Futures contracts | (58,634 | ) | ||
Written option contracts | (1,075 | ) | ||
Foreign currency translations | 3,101 | |||
|
| |||
Net change in unrealized appreciation (depreciation) | (23,898,184 | ) | ||
|
| |||
Net Realized and Unrealized Gain (Loss) | (63,281,206 | ) | ||
|
| |||
Net Increase (Decrease) in Net Assets Resulting from Operations | $ | (48,824,821 | ) | |
|
| |||
See accompanying notes to the consolidated financial statements.
34
COHEN & STEERS REAL ASSETS FUND, INC.
CONSOLIDATED STATEMENT OF CHANGES IN NET ASSETS
| For the Year Ended December 31, 2022 | For the Year Ended December 31, 2021 | |||||||
Change in Net Assets: |
| |||||||
From Operations: |
| |||||||
Net investment income (loss) | $ | 14,456,385 | $ | 2,471,737 | ||||
Net realized gain (loss) | (39,383,022 | ) | 25,105,875 | |||||
Net change in unrealized appreciation (depreciation) | (23,898,184 | ) | 19,121,186 | |||||
|
|
|
| |||||
Net increase (decrease) in net assets resulting from operations | (48,824,821 | ) | 46,698,798 | |||||
|
|
|
| |||||
Distributions to Shareholders: |
| |||||||
Class A | (428,979 | ) | (934,494 | ) | ||||
Class C | (163,428 | ) | (267,800 | ) | ||||
Class I | (24,185,060 | ) | (24,491,206 | ) | ||||
Class R | (887 | ) | (6,217 | ) | ||||
Class Z | (496,640 | ) | (487,637 | ) | ||||
Tax Return of Capital to Shareholders: |
| |||||||
Class A | (40,925 | ) | — | |||||
Class C | (16,768 | ) | — | |||||
Class I | (1,715,624 | ) | — | |||||
Class R | (120 | ) | — | |||||
Class Z | (32,459 | ) | — | |||||
|
|
|
| |||||
Total distributions | (27,080,890 | ) | (26,187,354 | ) | ||||
|
|
|
| |||||
Capital Stock Transactions: |
| |||||||
Increase (decrease) in net assets from Fund share transactions | 615,827,853 | 223,101,019 | ||||||
|
|
|
| |||||
Total increase (decrease) in net assets | 539,922,142 | 243,612,463 | ||||||
Net Assets: |
| |||||||
Beginning of year | 392,966,101 | 149,353,638 | ||||||
|
|
|
| |||||
End of year | $ | 932,888,243 | $ | 392,966,101 | ||||
|
|
|
| |||||
See accompanying notes to the consolidated financial statements.
35
COHEN & STEERS REAL ASSETS FUND, INC.
CONSOLIDATED FINANCIAL HIGHLIGHTS
The following tables include selected data for a share outstanding throughout each year and other
performance information derived from the consolidated financial statements. They should be read in conjunction with the consolidated financial statements and notes thereto.
| Class A | ||||||||||||||||||||
| For the Year Ended December 31, | ||||||||||||||||||||
| 2022 | 2021 | 2020 | 2019 | 2018 | ||||||||||||||||
Per Share Operating Data: | ||||||||||||||||||||
Net asset value, beginning of year | $10.28 | $9.15 | $9.40 | $8.23 | $9.14 | |||||||||||||||
|
|
|
|
|
|
|
|
|
| |||||||||||
Income (loss) from investment operations: |
| |||||||||||||||||||
Net investment income (loss)a | 0.16 | 0.07 | 0.09 | 0.16 | 0.11 | |||||||||||||||
Net realized and unrealized gain (loss) | (0.41 | ) | 2.02 | (0.22 | ) | 1.25 | (0.89 | ) | ||||||||||||
|
|
|
|
|
|
|
|
|
| |||||||||||
Total from investment operations | (0.25 | ) | 2.09 | (0.13 | ) | 1.41 | (0.78 | ) | ||||||||||||
|
|
|
|
|
|
|
|
|
| |||||||||||
Less dividends and distributions to shareholders from: | ||||||||||||||||||||
Net investment income | (0.23 | ) | (0.79 | ) | (0.09 | ) | (0.22 | ) | (0.12 | ) | ||||||||||
Net realized gain | (0.01 | ) | (0.17 | ) | (0.03 | ) | (0.02 | ) | — | |||||||||||
Tax return of capital | (0.02 | ) | — | — | — | (0.01 | ) | |||||||||||||
|
|
|
|
|
|
|
|
|
| |||||||||||
Total dividends and distributions to shareholders | (0.26 | ) | (0.96 | ) | (0.12 | ) | (0.24 | ) | (0.13 | ) | ||||||||||
|
|
|
|
|
|
|
|
|
| |||||||||||
Net increase (decrease) in net asset value | (0.51 | ) | 1.13 | (0.25 | ) | 1.17 | (0.91 | ) | ||||||||||||
|
|
|
|
|
|
|
|
|
| |||||||||||
Net asset value, end of year | $9.77 | $10.28 | $9.15 | $9.40 | $8.23 | |||||||||||||||
|
|
|
|
|
|
|
|
|
| |||||||||||
Total returnb,c | –2.38 | % | 23.15 | % | –1.22 | % | 17.19 | % | –8.61 | % | ||||||||||
|
|
|
|
|
|
|
|
|
| |||||||||||
Ratios/Supplemental Data: |
| |||||||||||||||||||
Net assets, end of year (in millions) | $16.7 | $10.8 | $8.4 | $10.8 | $9.4 | |||||||||||||||
|
|
|
|
|
|
|
|
|
| |||||||||||
Ratios to average daily net assets: |
| |||||||||||||||||||
Expenses (before expense reduction) | 1.33 | % | 1.45 | % | 1.69 | % | 1.62 | % | 1.51 | % | ||||||||||
|
|
|
|
|
|
|
|
|
| |||||||||||
Expenses (net of expense reduction) | 1.15 | % | 1.15 | % | 1.15 | % | 1.15 | % | 1.14 | % | ||||||||||
|
|
|
|
|
|
|
|
|
| |||||||||||
Net investment income (loss) | 1.39 | % | 0.37 | % | 0.58 | % | 1.26 | % | 0.88 | % | ||||||||||
|
|
|
|
|
|
|
|
|
| |||||||||||
Net investment income (loss) | 1.57 | % | 0.67 | % | 1.12 | % | 1.73 | % | 1.25 | % | ||||||||||
|
|
|
|
|
|
|
|
|
| |||||||||||
Portfolio turnover rated | 83 | % | 71 | % | 139 | % | 115 | % | 99 | % | ||||||||||
|
|
|
|
|
|
|
|
|
| |||||||||||
| a | Calculation based on average shares outstanding. |
| b | Return assumes the reinvestment of all dividends and distributions at net asset value. |
| c | Does not reflect sales charges, which would reduce return. |
| d | The Fund’s portfolio turnover rate is calculated in accordance with regulatory requirements, without regard to transactions involving short-term investments and certain derivatives. If such transactions were included, the Fund’s portfolio turnover rate may be higher. |
See accompanying notes to the consolidated financial statements.
36
COHEN & STEERS REAL ASSETS FUND, INC.
CONSOLIDATED FINANCIAL HIGHLIGHTS—(Continued)
| Class C | ||||||||||||||||||||
| For the Year Ended December 31, | ||||||||||||||||||||
| 2022 | 2021 | 2020 | 2019 | 2018 | ||||||||||||||||
Per Share Operating Data: | ||||||||||||||||||||
Net asset value, beginning of year | $10.26 | $9.13 | $9.37 | $8.21 | $9.12 | |||||||||||||||
|
|
|
|
|
|
|
|
|
| |||||||||||
Income (loss) from investment operations: | ||||||||||||||||||||
Net investment income (loss)a | 0.10 | 0.00 | b | 0.04 | 0.10 | 0.06 | ||||||||||||||
Net realized and unrealized gain (loss) | (0.42 | ) | 2.03 | (0.21 | ) | 1.23 | (0.89 | ) | ||||||||||||
|
|
|
|
|
|
|
|
|
| |||||||||||
Total from investment operations | (0.32 | ) | 2.03 | (0.17 | ) | 1.33 | (0.83 | ) | ||||||||||||
|
|
|
|
|
|
|
|
|
| |||||||||||
Less dividends and distributions to shareholders from: | ||||||||||||||||||||
Net investment income | (0.18 | ) | (0.73 | ) | (0.04 | ) | (0.15 | ) | (0.07 | ) | ||||||||||
Net realized gain | (0.01 | ) | (0.17 | ) | (0.03 | ) | (0.02 | ) | — | |||||||||||
Tax return of capital | (0.02 | ) | — | — | — | (0.01 | ) | |||||||||||||
|
|
|
|
|
|
|
|
|
| |||||||||||
Total dividends and distributions to shareholders | (0.21 | ) | (0.90 | ) | (0.07 | ) | (0.17 | ) | (0.08 | ) | ||||||||||
|
|
|
|
|
|
|
|
|
| |||||||||||
Net increase (decrease) in net asset value | (0.53 | ) | 1.13 | (0.24 | ) | 1.16 | (0.91 | ) | ||||||||||||
|
|
|
|
|
|
|
|
|
| |||||||||||
Net asset value, end of year | $9.73 | $10.26 | $9.13 | $9.37 | $8.21 | |||||||||||||||
|
|
|
|
|
|
|
|
|
| |||||||||||
Total returnc,d | –3.06 | % | 22.44 | % | –1.80 | % | 16.31 | % | –9.18 | % | ||||||||||
|
|
|
|
|
|
|
|
|
| |||||||||||
Ratios/Supplemental Data: |
| |||||||||||||||||||
Net assets, end of year (in millions) | $8.2 | $3.4 | $2.7 | $4.3 | $5.0 | |||||||||||||||
|
|
|
|
|
|
|
|
|
| |||||||||||
Ratios to average daily net assets: |
| |||||||||||||||||||
Expenses (before expense reduction) | 1.98 | % | 2.10 | % | 2.34 | % | 2.27 | % | 2.19 | % | ||||||||||
|
|
|
|
|
|
|
|
|
| |||||||||||
Expenses (net of expense reduction) | 1.80 | % | 1.80 | % | 1.80 | % | 1.80 | % | 1.80 | % | ||||||||||
|
|
|
|
|
|
|
|
|
| |||||||||||
Net investment income (loss) | 0.80 | % | (0.27 | )% | (0.02 | )% | 0.61 | % | 0.31 | % | ||||||||||
|
|
|
|
|
|
|
|
|
| |||||||||||
Net investment income (loss) | 0.98 | % | 0.03 | % | 0.52 | % | 1.08 | % | 0.70 | % | ||||||||||
|
|
|
|
|
|
|
|
|
| |||||||||||
Portfolio turnover ratee | 83 | % | 71 | % | 139 | % | 115 | % | 99 | % | ||||||||||
|
|
|
|
|
|
|
|
|
| |||||||||||
| a | Calculation based on average shares outstanding. |
| b | Amount is less than $0.005. |
| c | Return assumes the reinvestment of all dividends and distributions at net asset value. |
| d | Does not reflect sales charges, which would reduce return. |
| e | The Fund’s portfolio turnover rate is calculated in accordance with regulatory requirements, without regard to transactions involving short-term investments and certain derivatives. If such transactions were included, the Fund’s portfolio turnover rate may be higher. |
See accompanying notes to the consolidated financial statements.
37
COHEN & STEERS REAL ASSETS FUND, INC.
CONSOLIDATED FINANCIAL HIGHLIGHTS—(Continued)
| Class I | ||||||||||||||||||||
| For the Year Ended December 31, | ||||||||||||||||||||
| 2022 | 2021 | 2020 | 2019 | 2018 | ||||||||||||||||
Per Share Operating Data: | ||||||||||||||||||||
Net asset value, beginning of year | $10.30 | $9.16 | $9.41 | $8.24 | $9.16 | |||||||||||||||
|
|
|
|
|
|
|
|
|
| |||||||||||
Income (loss) from investment operations: | ||||||||||||||||||||
Net investment income (loss)a | 0.20 | 0.11 | 0.13 | 0.19 | 0.15 | |||||||||||||||
Net realized and unrealized gain (loss) | (0.41 | ) | 2.03 | (0.22 | ) | 1.25 | (0.90 | ) | ||||||||||||
|
|
|
|
|
|
|
|
|
| |||||||||||
Total from investment operations | (0.21 | ) | 2.14 | (0.09 | ) | 1.44 | (0.75 | ) | ||||||||||||
|
|
|
|
|
|
|
|
|
| |||||||||||
Less dividends and distributions to shareholders from: | ||||||||||||||||||||
Net investment income | (0.27 | ) | (0.83 | ) | (0.13 | ) | (0.25 | ) | (0.16 | ) | ||||||||||
Net realized gain | (0.01 | ) | (0.17 | ) | (0.03 | ) | (0.02 | ) | — | |||||||||||
Tax return of capital | (0.02 | ) | — | — | — | (0.01 | ) | |||||||||||||
|
|
|
|
|
|
|
|
|
| |||||||||||
Total dividends and distributions to shareholders | (0.30 | ) | (1.00 | ) | (0.16 | ) | (0.27 | ) | (0.17 | ) | ||||||||||
|
|
|
|
|
|
|
|
|
| |||||||||||
Net increase (decrease) in net asset value | (0.51 | ) | 1.14 | (0.25 | ) | 1.17 | (0.92 | ) | ||||||||||||
|
|
|
|
|
|
|
|
|
| |||||||||||
Net asset value, end of year | $9.79 | $10.30 | $9.16 | $9.41 | $8.24 | |||||||||||||||
|
|
|
|
|
|
|
|
|
| |||||||||||
Total returnb | –2.04 | % | 23.62 | % | –0.85 | % | 17.58 | % | –8.31 | % | ||||||||||
|
|
|
|
|
|
|
|
|
| |||||||||||
Ratios/Supplemental Data: | ||||||||||||||||||||
Net assets, end of year (in millions) | $886.4 | $368.7 | $133.9 | $102.9 | $111.1 | |||||||||||||||
|
|
|
|
|
|
|
|
|
| |||||||||||
Ratios to average daily net assets: |
| |||||||||||||||||||
Expenses (before expense reduction) | 1.06 | % | 1.18 | % | 1.42 | % | 1.34 | % | 1.26 | % | ||||||||||
|
|
|
|
|
|
|
|
|
| |||||||||||
Expenses (net of expense reduction) | 0.80 | % | 0.80 | % | 0.80 | % | 0.80 | % | 0.80 | % | ||||||||||
|
|
|
|
|
|
|
|
|
| |||||||||||
Net investment income (loss) | 1.70 | % | 0.70 | % | 0.87 | % | 1.54 | % | 1.27 | % | ||||||||||
|
|
|
|
|
|
|
|
|
| |||||||||||
Net investment income (loss) | 1.96 | % | 1.08 | % | 1.49 | % | 2.08 | % | 1.73 | % | ||||||||||
|
|
|
|
|
|
|
|
|
| |||||||||||
Portfolio turnover ratec | 83 | % | 71 | % | 139 | % | 115 | % | 99 | % | ||||||||||
|
|
|
|
|
|
|
|
|
| |||||||||||
| a | Calculation based on average shares outstanding. |
| b | Return assumes the reinvestment of all dividends and distributions at net asset value. |
| c | The Fund’s portfolio turnover rate is calculated in accordance with regulatory requirements, without regard to transactions involving short-term investments and certain derivatives. If such transactions were included, the Fund’s portfolio turnover rate may be higher. |
See accompanying notes to the consolidated financial statements.
38
COHEN & STEERS REAL ASSETS FUND, INC.
CONSOLIDATED FINANCIAL HIGHLIGHTS—(Continued)
| Class R | ||||||||||||||||||||
| For the Year Ended December 31, | ||||||||||||||||||||
| 2022 | 2021 | 2020 | 2019 | 2018 | ||||||||||||||||
Per Share Operating Data: | ||||||||||||||||||||
Net asset value, beginning of year | $10.38 | $9.23 | $9.48 | $8.30 | $9.22 | |||||||||||||||
|
|
|
|
|
|
|
|
|
| |||||||||||
Income (loss) from investment operations: | ||||||||||||||||||||
Net investment income (loss)a | 0.13 | 0.06 | 0.08 | 0.14 | 0.11 | |||||||||||||||
Net realized and unrealized gain (loss) | (0.39 | ) | 2.03 | (0.22 | ) | 1.26 | (0.91 | ) | ||||||||||||
|
|
|
|
|
|
|
|
|
| |||||||||||
Total from investment operations | (0.26 | ) | 2.09 | (0.14 | ) | 1.40 | (0.80 | ) | ||||||||||||
|
|
|
|
|
|
|
|
|
| |||||||||||
Less dividends and distributions to shareholders from: | ||||||||||||||||||||
Net investment income | (0.21 | ) | (0.77 | ) | (0.08 | ) | (0.20 | ) | (0.11 | ) | ||||||||||
Net realized gain | (0.01 | ) | (0.17 | ) | (0.03 | ) | (0.02 | ) | — | |||||||||||
Tax return of capital | (0.02 | ) | — | — | — | (0.01 | ) | |||||||||||||
|
|
|
|
|
|
|
|
|
| |||||||||||
Total dividends and distributions to shareholders | (0.24 | ) | (0.94 | ) | (0.11 | ) | (0.22 | ) | (0.12 | ) | ||||||||||
|
|
|
|
|
|
|
|
|
| |||||||||||
Net increase (decrease) in net asset value | (0.50 | ) | 1.15 | (0.25 | ) | 1.18 | (0.92 | ) | ||||||||||||
|
|
|
|
|
|
|
|
|
| |||||||||||
Net asset value, end of year | $9.88 | $10.38 | $9.23 | $9.48 | $8.30 | |||||||||||||||
|
|
|
|
|
|
|
|
|
| |||||||||||
Total returnb | –2.52 | % | 22.96 | % | –1.32 | % | 16.99 | % | –8.72 | % | ||||||||||
|
|
|
|
|
|
|
|
|
| |||||||||||
Ratios/Supplemental Data: | ||||||||||||||||||||
Net assets, end of year (in 000s) | $42.3 | $74.6 | $60.6 | $61.5 | $59.2 | |||||||||||||||
|
|
|
|
|
|
|
|
|
| |||||||||||
Ratios to average daily net assets: |
| |||||||||||||||||||
Expenses (before expense reduction) | 1.48 | % | 1.60 | % | 1.84 | % | 1.77 | % | 1.69 | % | ||||||||||
|
|
|
|
|
|
|
|
|
| |||||||||||
Expenses (net of expense reduction) | 1.30 | % | 1.30 | % | 1.30 | % | 1.30 | % | 1.30 | % | ||||||||||
|
|
|
|
|
|
|
|
|
| |||||||||||
Net investment income (loss) | 1.06 | % | 0.23 | % | 0.45 | % | 1.10 | % | 0.79 | % | ||||||||||
|
|
|
|
|
|
|
|
|
| |||||||||||
Net investment income (loss) | 1.24 | % | 0.53 | % | 0.99 | % | 1.57 | % | 1.18 | % | ||||||||||
|
|
|
|
|
|
|
|
|
| |||||||||||
Portfolio turnover ratec | 83 | % | 71 | % | 139 | % | 115 | % | 99 | % | ||||||||||
|
|
|
|
|
|
|
|
|
| |||||||||||
| a | Calculation based on average shares outstanding. |
| b | Return assumes the reinvestment of all dividends and distributions at net asset value. |
| c | The Fund’s portfolio turnover rate is calculated in accordance with regulatory requirements, without regard to transactions involving short-term investments and certain derivatives. If such transactions were included, the Fund’s portfolio turnover rate may be higher. |
See accompanying notes to the consolidated financial statements.
39
COHEN & STEERS REAL ASSETS FUND, INC.
CONSOLIDATED FINANCIAL HIGHLIGHTS—(Continued)
| Class Z | ||||||||||||||||||||
| For the Year Ended December 31, | ||||||||||||||||||||
| 2022 | 2021 | 2020 | 2019 | 2018 | ||||||||||||||||
Per Share Operating Data: | ||||||||||||||||||||
Net asset value, beginning of year | $10.28 | $9.14 | $9.39 | $8.23 | $9.14 | |||||||||||||||
|
|
|
|
|
|
|
|
|
| |||||||||||
Income (loss) from investment operations: | ||||||||||||||||||||
Net investment income (loss)a | 0.19 | 0.11 | 0.13 | 0.19 | 0.15 | |||||||||||||||
Net realized and unrealized gain (loss) | (0.40 | ) | 2.03 | (0.22 | ) | 1.24 | (0.89 | ) | ||||||||||||
|
|
|
|
|
|
|
|
|
| |||||||||||
Total from investment operations | (0.21 | ) | 2.14 | (0.09 | ) | 1.43 | (0.74 | ) | ||||||||||||
|
|
|
|
|
|
|
|
|
| |||||||||||
Less dividends and distributions to shareholders from: | ||||||||||||||||||||
Net investment income | (0.27 | ) | (0.83 | ) | (0.13 | ) | (0.25 | ) | (0.16 | ) | ||||||||||
Net realized gain | (0.01 | ) | (0.17 | ) | (0.03 | ) | (0.02 | ) | — | |||||||||||
Tax return of capital | (0.02 | ) | — | — | — | (0.01 | ) | |||||||||||||
|
|
|
|
|
|
|
|
|
| |||||||||||
Total dividends and distributions to shareholders | (0.30 | ) | (1.00 | ) | (0.16 | ) | (0.27 | ) | (0.17 | ) | ||||||||||
|
|
|
|
|
|
|
|
|
| |||||||||||
Net increase (decrease) in net asset value | (0.51 | ) | 1.14 | (0.25 | ) | 1.16 | (0.91 | ) | ||||||||||||
|
|
|
|
|
|
|
|
|
| |||||||||||
Net asset value, end of year | $9.77 | $10.28 | $9.14 | $9.39 | $8.23 | |||||||||||||||
|
|
|
|
|
|
|
|
|
| |||||||||||
Total returnb | –2.05 | % | 23.68 | % | –0.85 | % | 17.48 | % | –8.22 | % | ||||||||||
|
|
|
|
|
|
|
|
|
| |||||||||||
Ratios/Supplemental Data: | ||||||||||||||||||||
Net assets, end of year (in millions) | $21.6 | $9.9 | $4.3 | $4.1 | $1.6 | |||||||||||||||
|
|
|
|
|
|
|
|
|
| |||||||||||
Ratios to average daily net assets: |
| |||||||||||||||||||
Expenses (before expense reduction) | 0.98 | % | 1.10 | % | 1.34 | % | 1.27 | % | 1.19 | % | ||||||||||
|
|
|
|
|
|
|
|
|
| |||||||||||
Expenses (net of expense reduction) | 0.80 | % | 0.80 | % | 0.80 | % | 0.80 | % | 0.80 | % | ||||||||||
|
|
|
|
|
|
|
|
|
| |||||||||||
Net investment income (loss) | 1.67 | % | 0.77 | % | 0.95 | % | 1.62 | % | 1.32 | % | ||||||||||
|
|
|
|
|
|
|
|
|
| |||||||||||
Net investment income (loss) | 1.85 | % | 1.07 | % | 1.49 | % | 2.09 | % | 1.71 | % | ||||||||||
|
|
|
|
|
|
|
|
|
| |||||||||||
Portfolio turnover ratec | 83 | % | 71 | % | 139 | % | 115 | % | 99 | % | ||||||||||
|
|
|
|
|
|
|
|
|
| |||||||||||
| a | Calculation based on average shares outstanding. |
| b | Return assumes the reinvestment of all dividends and distributions at net asset value. |
| c | The Fund’s portfolio turnover rate is calculated in accordance with regulatory requirements, without regard to transactions involving short-term investments and certain derivatives. If such transactions were included, the Fund’s portfolio turnover rate would be higher. |
See accompanying notes to the consolidated financial statements.
40
COHEN & STEERS REAL ASSETS FUND, INC.
NOTES TO CONSOLIDATED FINANCIAL STATEMENTS
Note 1. Organization and Significant Accounting Policies
Cohen & Steers Real Assets Fund, Inc. (the Fund) was incorporated under the laws of the State of Maryland on October 25, 2011 and is registered under the Investment Company Act of 1940 (the 1940 Act) as a diversified, open-end management investment company. The Fund’s investment objective is to provide attractive total returns over the long term and to maximize real returns during inflationary environments. The authorized shares of the Fund are divided into six classes designated Class A, C, F, I, R and Z shares. Each of the Fund’s shares has equal dividend, liquidation and voting rights (except for matters relating to distribution and shareholder servicing of such shares). Class F shares are currently not available for purchase.
Cohen & Steers Real Assets Fund, Ltd. (the Subsidiary), a wholly-owned subsidiary of the Fund organized under the laws of the Cayman Islands, was incorporated on November 22, 2011 and commenced operations on January 31, 2012. The Subsidiary acts as an investment vehicle for the Fund in order to effect certain investments on behalf of the Fund, consistent with the Fund’s investment objectives and policies as described in the Fund’s prospectus. The Fund expects that it will achieve a significant portion of its exposure to commodities and commodities-related investments through investment in the Subsidiary. Unlike the Fund, the Subsidiary may invest without limitation in commodities. Investments in the Subsidiary are limited to 25% of the Fund’s total assets. The Consolidated Schedule of Investments includes positions of the Fund and the Subsidiary. The financial statements have been consolidated and include the accounts of the Fund and the Subsidiary. All significant inter-company balances and transactions have been eliminated in consolidation.
The following is a summary of significant accounting policies consistently followed by the Fund in the preparation of its consolidated financial statements. The Fund is an investment company and, accordingly, follows the investment company accounting and reporting guidance of the Financial Accounting Standards Board Accounting Standards Codification (ASC) Topic 946—Investment Companies. The accounting policies of the Fund are in conformity with accounting principles generally accepted in the United States of America (GAAP). The preparation of the consolidated financial statements in accordance with GAAP requires management to make estimates and assumptions that affect the reported amounts of assets and liabilities at the date of the consolidated financial statements and the reported amounts of income and expenses during the reporting period. Actual results could differ from those estimates.
Portfolio Valuation: Investments in securities that are listed on the New York Stock Exchange (NYSE) are valued, except as indicated below, at the last sale price reflected at the close of the NYSE on the business day as of which such value is being determined. If there has been no sale on such day, the securities are valued at the mean of the closing bid and ask prices on such day or, if no ask price is available, at the bid price. Commodity futures contracts and options on futures contracts are valued at the settlement price as of the close of futures trading on the primary exchange on which the futures are traded. Exchange-traded options are valued at their last sale price as of the close of options trading on applicable exchanges on the valuation date. In the absence of a last sale price on such day, options are valued based upon prices provided by a third-party pricing service. Over-the-counter (OTC) options are valued based upon prices provided by a third-party pricing service or counterparty.
41
COHEN & STEERS REAL ASSETS FUND, INC.
NOTES TO CONSOLIDATED FINANCIAL STATEMENTS—(Continued)
Securities not listed on the NYSE but listed on other domestic or foreign securities exchanges (including NASDAQ) are valued in a similar manner. Securities traded on more than one securities exchange are valued at the last sale price reflected at the close of the exchange representing the principal market for such securities on the business day as of which such value is being determined. If after the close of a foreign market, but prior to the close of business on the day the securities are being valued, market conditions change significantly, certain non-U.S. equity holdings may be fair valued pursuant to procedures established by the Board of Directors.
Readily marketable securities traded in the OTC market, including listed securities whose primary market is believed by Cohen & Steers Capital Management, Inc. (the investment advisor) to be OTC, are valued on the basis of prices provided by a third-party pricing service or third-party broker-dealers when such prices are believed by the investment advisor, pursuant to delegation by the Board of Directors, to reflect the fair value of such securities.
Fixed-income securities are valued on the basis of prices provided by a third-party pricing service or third-party broker-dealers when such prices are believed by the investment advisor, pursuant to delegation by the Board of Directors, to reflect the fair value of such securities. The pricing services or broker-dealers use multiple valuation techniques to determine fair value. In instances where sufficient market activity exists, the pricing services or broker-dealers may utilize a market-based approach through which quotes from market makers are used to determine fair value. In instances where sufficient market activity may not exist or is limited, the pricing services or broker-dealers also utilize proprietary valuation models which may consider market transactions in comparable securities and the various relationships between securities in determining fair value and/or characteristics such as benchmark yield curves, option-adjusted spreads, credit spreads, estimated default rates, coupon rates, anticipated timing of principal repayments, underlying collateral, and other unique security features which are then used to calculate the fair values.
Short-term debt securities with a maturity date of 60 days or less are valued at amortized cost, which approximates fair value. Investments in open-end mutual funds are valued at their closing net asset value (NAV).
The Board of Directors has designated the investment advisor as the Fund’s “Valuation Designee” under Rule 2a-5 under the 1940 Act. As Valuation Designee, the investment advisor is authorized to make fair valuation determinations, subject to the oversight of the Board of Directors. The investment advisor has established a valuation committee (Valuation Committee) to administer, implement and oversee the fair valuation process according to the policies and procedures approved annually by the Board of Directors. Among other things, these procedures allow the Fund to utilize independent pricing services, quotations from securities and financial instrument dealers and other market sources to determine fair value.
Securities for which market prices are unavailable, or securities for which the investment advisor determines that the bid and/or ask price or a counterparty valuation does not reflect market value, will be valued at fair value, as determined in good faith by the Valuation Committee, pursuant to procedures approved by the Fund’s Board of Directors. Circumstances in which market prices may be unavailable include, but are not limited to, when trading in a security is suspended, the exchange on which the security is traded is subject to an unscheduled close or disruption or material events occur after the
42
COHEN & STEERS REAL ASSETS FUND, INC.
NOTES TO CONSOLIDATED FINANCIAL STATEMENTS—(Continued)
close of the exchange on which the security is principally traded. In these circumstances, the Fund determines fair value in a manner that fairly reflects the market value of the security on the valuation date based on consideration of any information or factors it deems appropriate. These may include, but are not limited to, recent transactions in comparable securities, information relating to the specific security and developments in the markets.
Foreign equity fair value pricing procedures utilized by the Fund may cause certain non-U.S. equity holdings to be fair valued on the basis of fair value factors provided by a pricing service to reflect any significant market movements between the time the Fund values such securities and the earlier closing of foreign markets.
The Fund’s use of fair value pricing may cause the NAV of Fund shares to differ from the NAV that would be calculated using market quotations. Fair value pricing involves subjective judgments and it is possible that the fair value determined for a security may be materially different than the value that could be realized upon the sale of that security.
Fair value is defined as the price that the Fund would expect to receive upon the sale of an investment or expect to pay to transfer a liability in an orderly transaction with an independent buyer in the principal market or, in the absence of a principal market, the most advantageous market for the investment or liability. The hierarchy of inputs that are used in determining the fair value of the Fund’s investments is summarized below.
| • | Level 1—quoted prices in active markets for identical investments |
| • | Level 2—other significant observable inputs (including quoted prices for similar investments, interest rates, credit risk, etc.) |
| • | Level 3—significant unobservable inputs (including the Fund’s own assumptions in determining the fair value of investments) |
The inputs or methodology used for valuing investments may or may not be an indication of the risk associated with those investments. Changes in valuation techniques may result in transfers into or out of an assigned level within the disclosure hierarchy.
43
COHEN & STEERS REAL ASSETS FUND, INC.
NOTES TO CONSOLIDATED FINANCIAL STATEMENTS—(Continued)
The following is a summary of the inputs used as of December 31, 2022 in valuing the Fund’s investments carried at value:
| Quoted Prices in Active Markets for Identical Investments (Level 1) | Other Significant Observable Inputs (Level 2) | Significant Unobservable Inputs (Level 3) | Total | |||||||||||||
Common Stock | $ | 535,248,587 | $ | — | $ | — | $ | 535,248,587 | ||||||||
Exchange-Traded Funds | 49,731,995 | — | — | 49,731,995 | ||||||||||||
Preferred Securities— Capital Securities | — | 36,659,005 | — | 36,659,005 | ||||||||||||
Corporate Bonds | — | 60,548,180 | — | 60,548,180 | ||||||||||||
U.S. Treasury Inflation Protected Bonds | — | 395,593 | — | 395,593 | ||||||||||||
Short-Term Investments | — | 248,182,187 | — | 248,182,187 | ||||||||||||
|
|
|
|
|
|
|
| |||||||||
Total Investments in Securitiesa | $ | 584,980,582 | $ | 345,784,965 | $ | — | $ | 930,765,547 | ||||||||
|
|
|
|
|
|
|
| |||||||||
Futures Contracts | $ | 17,447,382 | $ | — | $ | — | $ | 17,447,382 | ||||||||
|
|
|
|
|
|
|
| |||||||||
Total Derivative Assetsa | $ | 17,447,382 | $ | — | $ | — | $ | 17,447,382 | ||||||||
|
|
|
|
|
|
|
| |||||||||
Futures Contracts | $ | (14,468,248 | ) | $ | — | $ | — | $ | (14,468,248 | ) | ||||||
|
|
|
|
|
|
|
| |||||||||
Total Derivative Liabilitiesa | $ | (14,468,248 | ) | $ | — | $ | — | $ | (14,468,248 | ) | ||||||
|
|
|
|
|
|
|
| |||||||||
| a | Portfolio holdings are disclosed individually on the Consolidated Schedule of Investments. |
Security Transactions, Investment Income and Expense Allocations: Security transactions are recorded on trade date. Realized gains and losses on investments sold are recorded on the basis of identified cost. Interest income, which includes the amortization of premiums and accretion of discounts, is recorded on the accrual basis. Inflation adjustments to the principal amount of inflation-adjusted securities are reflected as interest income or reductions to interest income. Dividend income is recorded on the ex-dividend date, except for certain dividends on foreign securities, which are recorded as soon as the Fund is informed after the ex-dividend date. Distributions from Real Estate Investment Trusts (REITs) are recorded as ordinary income, net realized capital gain or return of capital based on information reported by the REITs and management’s estimates of such amounts based on historical information. These estimates are adjusted when the actual source of distributions is disclosed by the REITs and actual amounts may differ from the estimated amounts. Distributions from Master Limited Partnerships (MLPs) are recorded as income and return of capital based on information reported by the MLPs and management’s estimates of such amounts based on historical information. These estimates are adjusted when the actual source of distributions is disclosed by the MLPs and actual amounts may differ from the estimated amounts. Income, expenses (other than expenses attributable to a specific class), and realized and unrealized gains or losses on investments are allocated to each class of shares based on its relative net assets.
44
COHEN & STEERS REAL ASSETS FUND, INC.
NOTES TO CONSOLIDATED FINANCIAL STATEMENTS—(Continued)
Foreign Currency Translation: The books and records of the Fund are maintained in U.S. dollars. Investment securities and other assets and liabilities denominated in foreign currencies are translated into U.S. dollars based upon prevailing exchange rates on the date of valuation. Purchases and sales of investment securities and income and expense items denominated in foreign currencies are translated into U.S. dollars based upon prevailing exchange rates on the respective dates of such transactions. The Fund does not isolate that portion of the results of operations resulting from fluctuations in foreign exchange rates on investments from the fluctuations arising from changes in market prices of securities held. Such fluctuations are included with the net realized and unrealized gain or loss on investments.
Net realized foreign currency transaction gains or losses arise from sales of foreign currencies, (excluding gains and losses on forward foreign currency exchange contracts, which are presented separately, if any) currency gains or losses realized between the trade and settlement dates on securities transactions, and the difference between the amounts of dividends, interest, and foreign withholding taxes recorded on the Fund’s books and the U.S. dollar equivalent of the amounts actually received or paid. Net unrealized foreign currency translation gains and losses arise from changes in the values of assets and liabilities, other than investments in securities, on the date of valuation, resulting from changes in exchange rates. Pursuant to U.S. federal income tax regulations, certain foreign currency gains/losses included in realized and unrealized gains/losses are included in or are a reduction of ordinary income for federal income tax purposes.
Futures Contracts: The Fund uses futures contracts in order to gain exposure to the underlying commodities markets. Futures contracts provide for the delayed delivery of the underlying instrument at a fixed price or for a cash amount based on the change in the value of the underlying instrument at a specific date in the future. Upon entering into a futures contract, the Fund is required to deposit with the broker, cash or securities in an amount equal to a certain percentage of the contract amount, which is referred to as the initial margin deposit. Subsequent payments, referred to as variation margin, are made or received by the Fund periodically and are based on changes in the market value of open futures contracts. Changes in the market value of open futures contracts are recorded as change in unrealized appreciation or depreciation on futures in the Consolidated Statement of Operations. Realized gain or loss, representing the difference between the value of the contract at the time it was opened and the value at the time it was closed, is reported in the Consolidated Statement of Operations at the closing or expiration of the futures contract. Securities deposited as initial margin are designated as such on the Consolidated Schedule of Investments and cash deposited is recorded on the Consolidated Statement of Assets and Liabilities. A receivable from and/or a payable to brokers for the daily variation margin is also recorded on the Consolidated Statement of Assets and Liabilities.
The Fund may be subject to the risk that the change in the value of the futures contract may not correlate perfectly with the underlying instrument. Use of long futures contracts subjects the Fund to risk of loss, up to the notional value of the futures contracts. Use of short futures contracts subjects the Fund to unlimited risk of loss. With exchange traded futures contracts, the exchange or board of trade acts as the counterparty to futures transactions; therefore, the Fund’s credit risk is limited to failure of the exchange or board of trade. Additionally, credit risk exists in exchange traded futures contracts with respect to initial and variation margin that is held in a clearing broker’s customer accounts. While clearing brokers are required to segregate customer margin from their own assets, in the event that a
45
COHEN & STEERS REAL ASSETS FUND, INC.
NOTES TO CONSOLIDATED FINANCIAL STATEMENTS—(Continued)
clearing broker becomes insolvent or goes into bankruptcy and at that time there is a shortfall in the aggregate amount of margin held by the clearing broker for all its clients, typically the shortfall would be allocated on a pro rata basis across all the clearing broker’s customers, potentially resulting in losses to the Fund.
Under some circumstances, futures exchanges may establish daily limits on the amount that the price of a futures contract can vary from the previous day’s settlement price, which could effectively prevent liquidation of certain positions. In certain circumstances, the futures commission merchant (FCM) can require additional margin on the futures contracts which would subject the Fund to counterparty credit risk with the FCM.
Morgan Stanley & Co. LLC serves as the Fund’s FCM for the purpose of trading in commodity futures contracts, options and interests therein.
U.S. Treasury Inflation-Protected Securities: U.S. Treasury Inflation-Protected Securities (TIPS) are fixed income securities whose principal value is periodically adjusted according to the rate of inflation. If the index measuring inflation rises or falls, the principal value of TIPS will be adjusted upward or downward, and consequently the interest payable on these securities (calculated with respect to a larger or smaller principal amount) will increase or decrease, respectively. Any upward or downward adjustment in the principal amount of an inflation-indexed security will be included as interest income in the Consolidated Statement of Operations, even though investors do not receive their principal until maturity. Repayment of the original principal upon maturity (as adjusted for inflation) is guaranteed in the case of TIPS.
Option Contracts: The Fund may purchase and write exchange-listed and OTC put or call options on securities, stock indices and other financial instruments for hedging purposes, to enhance portfolio returns and/or reduce overall volatility.
When the Fund writes (sells) an option, an amount equal to the premium received by the Fund is recorded on the Consolidated Statement of Assets and Liabilities as a liability. The amount of the liability is subsequently marked-to-market to reflect the current market value of the option written. When an option expires, the Fund realizes a gain on the option to the extent of the premium received. Premiums received from writing options which are exercised or closed are added to or offset against the proceeds or amount paid on the transaction to determine the realized gain or loss. If a put option on a security is exercised, the premium reduces the cost basis of the security purchased by the Fund. If a call option is exercised, the premium is added to the proceeds of the security sold to determine the realized gain or loss. The Fund, as writer of an option, bears the market risk of an unfavorable change in the price of the underlying index or security. Other risks include the possibility of an illiquid options market or the inability of the counterparties to fulfill their obligations under the contracts.
Put and call options purchased are accounted for in the same manner as portfolio securities. Premiums paid for purchasing options which expire are treated as realized losses. Premiums paid for purchasing options which are exercised or closed are added to the amounts paid or offset against the proceeds on the underlying investment transaction to determine the realized gain or loss when the underlying transaction is executed. The risk associated with purchasing an option is that the Fund pays a premium whether or not the option is exercised. Additionally, the Fund bears the risk of loss of the premium and change in market value should the counterparty not perform under the contract.
At December 31, 2022, the Fund did not have any option contracts outstanding.
46
COHEN & STEERS REAL ASSETS FUND, INC.
NOTES TO CONSOLIDATED FINANCIAL STATEMENTS—(Continued)
Dividends and Distributions to Shareholders: Dividends from net investment income and capital gain distributions are determined in accordance with U.S. federal income tax regulations, which may differ from GAAP. Dividends from net investment income, if any, are declared and paid semi-annually. Net realized capital gains, unless offset by any available capital loss carryforward, are typically distributed to shareholders at least annually. Dividends and distributions to shareholders are recorded on the ex-dividend date and are automatically reinvested in full and fractional shares of the Fund based on the NAV per share at the close of business on the payable date, unless the shareholder has elected to have them paid in cash.
Dividends from net investment income are subject to recharacterization for tax purposes. Based upon the results of operations for the year ended December 31, 2022, a portion of the dividends has been reclassified to distributions from net realized gain and tax return of capital.
Income Taxes: It is the policy of the Fund to continue to qualify as a regulated investment company (RIC), if such qualification is in the best interest of the shareholders, by complying with the requirements of Subchapter M of the Internal Revenue Code applicable to RICs, and by distributing substantially all of its taxable earnings to its shareholders. Also, in order to avoid the payment of any federal excise taxes, the Fund will distribute substantially all of its net investment income and net realized gains on a calendar year basis. Accordingly, no provision for federal income or excise tax is necessary. Dividend and interest income from holdings in non-U.S. securities are recorded net of non-U.S. taxes paid. Management has analyzed the Fund’s tax positions taken on federal and applicable state income tax returns as well as its tax positions in non-U.S. jurisdictions in which it trades for all open tax years and has concluded that as of December 31, 2022, no additional provisions for income tax are required in the Fund’s consolidated financial statements. The Fund’s tax positions for the tax years for which the applicable statutes of limitations have not expired are subject to examination by the Internal Revenue Service, state departments of revenue and by foreign tax authorities.
The Subsidiary is classified as a controlled foreign corporation under the Internal Revenue Code. The Subsidiary’s taxable income, including net gains, is included, as ordinary income, in the calculation of the Fund’s taxable income. Net losses of the Subsidiary are not deductible by the Fund either in the current period or carried forward to future periods.
Note 2. Investment Advisory, Administration Fees and Other Transactions with Affiliates
Investment Advisory Fees: Cohen & Steers Capital Management, Inc. serves as the Fund’s and Subsidiary’s investment advisor pursuant to an investment advisory agreement (the investment advisory agreement). Under the terms of the investment advisory agreement, the investment advisor provides the Fund with day-to-day investment decisions and generally manages the Fund’s investments in accordance with the stated policies of the Fund, subject to the supervision of the Board of Directors.
For the services provided to the Fund, the investment advisor receives a fee, accrued daily and paid monthly, at an annual rate of 0.75% of the average daily net assets of the Fund.
For the year ended December 31, 2022 and through June 30, 2024, the investment advisor has contractually agreed to waive its fee and/or reimburse expenses so that the Fund’s total annual operating expenses, which include the expenses of the Subsidiary (excluding acquired fund fees and
47
COHEN & STEERS REAL ASSETS FUND, INC.
NOTES TO CONSOLIDATED FINANCIAL STATEMENTS—(Continued)
expenses, taxes and extraordinary expenses), do not exceed 1.15% for Class A shares, 1.80% for Class C shares, 0.80% for Class I shares, 1.30% for Class R shares and 0.80% for Class Z shares. This contractual agreement can only be amended or terminated by agreement of the Fund’s Board of Directors and the investment advisor and will terminate automatically in the event of termination of the investment advisory agreement between the investment advisor and the Fund. For the year ended December 31, 2022, fees waived and/or expenses reimbursed totaled $1,880,927.
Under subadvisory agreements between the investment advisor and each of Cohen & Steers Asia Limited and Cohen & Steers UK Limited (collectively, the subadvisors), affiliates of the investment advisor, the subadvisors are responsible for managing the Fund’s investments in certain non-U.S. holdings. For their services provided under the subadvisory agreements, the investment advisor (not the Fund) pays the subadvisors. The investment advisor allocates 50% of the investment advisory fee received from the Fund among itself and each subadvisor based on the portion of the Fund’s average daily net assets managed by the investment advisor and each subadvisor.
Administration Fees: The Fund has entered into an administration agreement with the investment advisor under which the investment advisor performs certain administrative functions for the Fund and receives a fee, accrued daily and paid monthly, at the annual rate of 0.08% of the average daily net assets of the Fund. For the year ended December 31, 2022, the Fund incurred $597,969 in fees under this administration agreement. Additionally, the Fund pays State Street Bank and Trust Company as co-administrator under a fund accounting and administration agreement.
Distribution Fees: Shares of the Fund are distributed by Cohen & Steers Securities, LLC (the distributor), an affiliated entity of the investment advisor. The Fund has adopted a distribution and service plan (the plan) pursuant to Rule 12b-1 under the 1940 Act, which allows the Fund to pay distribution fees for the sale and distribution of its shares. The plan provides that the Fund will pay the distributor a fee, accrued daily and paid monthly, at an annual rate of up to 0.25% of the average daily net assets attributable to Class A shares, up to 0.75% of the average daily net assets attributable to Class C shares and up to 0.50% of the average daily net assets attributable to Class R shares. In addition, with respect to Class R shares, such amounts may also be used to pay for services to Fund shareholders or services related to the maintenance of shareholder accounts.
There is a maximum initial sales charge of 4.50% for Class A shares. There is a maximum contingent deferred sales charge (CDSC) of 1.00% on purchases of $1 million or more of Class A shares, which applies if redemption occurs within one year from purchase. There is a maximum CDSC of 1.00% on Class C shares, which applies if redemption occurs within one year from purchase. For the year ended December 31, 2022, the Fund has been advised that the distributor received $10,480, which represents a portion of the sales commissions paid by shareholders from the sale of Class A shares, and $3,357 of CDSC relating to redemptions of Class C shares. The distributor has advised the Fund that proceeds from the CDSC on this class are used by the distributor to defray its expenses related to providing distribution-related services to the Fund in connection with the sale of this class, including payments to dealers and other financial intermediaries for selling this class. The payment of a CDSC may result in the distributor receiving amounts greater or less than the upfront commission paid by the distributor to the financial intermediary.
48
COHEN & STEERS REAL ASSETS FUND, INC.
NOTES TO CONSOLIDATED FINANCIAL STATEMENTS—(Continued)
Shareholder Servicing Fees: For shareholder services, the Fund pays the distributor or its affiliates a fee, accrued daily, at an annual rate of up to 0.10% of the average daily net assets of the Fund’s Class A and Class I shares and up to 0.25% of the average daily net assets of the Fund’s Class C shares. The distributor is responsible for paying qualified financial institutions for shareholder services.
Directors’ and Officers’ Fees: Certain directors and officers of the Fund are also directors, officers and/or employees of the investment advisor. The Fund does not pay compensation to directors and officers affiliated with the investment advisor except for the Chief Compliance Officer, who received compensation from the investment advisor, which was reimbursed by the Fund, in the amount of $5,092 for the year ended December 31, 2022.
Note 3. Purchases and Sales of Securities
Purchases and sales of securities, excluding short-term investments, for the year ended December 31, 2022, totaled $904,910,513 and $446,218,953, respectively. For the year ended December 31, 2022, there were no purchases and sales of U.S. government obligations.
Note 4. Derivative Investments
The following tables present the value of derivatives held at December 31, 2022 and the effect of derivatives held during the year ended December 31, 2022, along with the respective location in the consolidated financial statements.
Consolidated Statement of Assets and Liabilities
Assets | Liabilities | |||||||||||
Derivatives | Location | Fair Value | Location | Fair Value | ||||||||
Commodity Risk: | ||||||||||||
Futures Contractsa | Receivable for variation margin on futures contracts | $ | 2,979,134 | b | — | $ | — | |||||
| a | Not subject to a master netting agreement or another similar arrangement. |
| b | Amount represents the cumulative appreciation on futures contracts as reported on the Consolidated Schedule of Investments. The Consolidated Statement of Assets and Liabilities only reflects the current day variation margin receivable from broker. |
49
COHEN & STEERS REAL ASSETS FUND, INC.
NOTES TO CONSOLIDATED FINANCIAL STATEMENTS—(Continued)
Consolidated Statement of Operations
Derivatives | Location | Realized Gain (Loss) | Change in Unrealized Appreciation (Depreciation) | |||||||
Commodity Risk: | ||||||||||
Futures Contracts | Net Realized and Unrealized Gain (Loss) | $ | (6,787,766 | ) | $ | (58,634 | ) | |||
Purchased Option Contractsa | Net Realized and Unrealized Gain (Loss) | (441,139 | ) | (155 | ) | |||||
Written Option Contracts | Net Realized and Unrealized Gain (Loss) | 30,440 | (1,075 | ) | ||||||
| a | Purchased options are included in net realized gain (loss) and change in unrealized appreciation (depreciation) on investments in securities. |
The following summarizes the volume of the Fund’s futures contracts and option contracts activity during the year ended December 31, 2022:
| Futures Contracts | ||||
Average Notional Amount—Long | $ | 243,191,526 | ||
Average Notional Amount—Short | (52,537,100 | ) | ||
| Purchased Option Contracts | Written Option Contracts | |||||||
Average Notional Amounta,b | $ | 6,424,649 | $ | 5,879,993 | ||||
| a | Average notional amounts represent the average for all months in which the Fund had option contracts outstanding at month end. For the period, this represents nine months for purchased option contracts and eight months for written option contracts. |
| b | Notional amount is calculated using the number of contracts multiplied by notional contract size multiplied by the underlying price. |
Note 5. Income Tax Information
The tax character of dividends and distributions paid was as follows:
| For the Year Ended December 31, | ||||||||
| 2022 | 2021 | |||||||
Ordinary income | $ | 24,910,844 | $ | 24,349,720 | ||||
Long-term capital gain | 364,150 | 1,837,634 | ||||||
Tax return of capital | 1,805,896 | — | ||||||
|
|
|
| |||||
Total dividends and distributions | $ | 27,080,890 | $ | 26,187,354 | ||||
|
|
|
| |||||
50
COHEN & STEERS REAL ASSETS FUND, INC.
NOTES TO CONSOLIDATED FINANCIAL STATEMENTS—(Continued)
As of December 31, 2022, the tax-basis components of accumulated earnings, the federal tax cost and net unrealized appreciation (depreciation) in value of investments held were as follows:
Cost of investments in securities for federal income tax purposes | $ | 938,454,062 | ||
|
| |||
Gross unrealized appreciation on investments | $ | 36,682,556 | ||
Gross unrealized depreciation on investments | (41,388,941 | ) | ||
|
| |||
Net unrealized appreciation (depreciation) on investments | $ | (4,706,385 | ) | |
|
|
As of December 31, 2022, the Fund has a net capital loss carryforward of $18,518,380 which may be used to offset future capital gains. The loss is comprised of a short-term capital loss carryforward of $16,147,426 and a long-term capital loss carryforward of $2,370,954 which, under current federal income tax rules, may offset capital gains recognized in any future period.
As of December 31, 2022, the Fund had temporary book/tax differences primarily attributable to wash sales on portfolio securities and unrealized gain on passive foreign investment companies and permanent book/tax differences primarily attributable to certain fixed income securities and subsidiary adjustments. To reflect reclassifications arising from the permanent differences, paid-in capital was credited $776,872 and total distributable earnings/(accumulated loss) was charged $776,872. Net assets were not affected by this reclassification.
Note 6. Capital Stock
The Fund is authorized to issue 1.4 billion shares of capital stock, at a par value of $0.001 per share, classified in six classes as follows: 200 million of Class A capital stock, 200 million of Class C capital stock, 200 million of Class F capital stock, 400 million of Class I capital stock, 200 million of Class R capital stock and 200 million of Class Z capital stock. Class F shares are currently not available for purchase. The Board of Directors of the Fund may increase or decrease the aggregate number of shares of common stock that the Fund has authority to issue. With the exception of Class C shares held through certain intermediaries, Class C shares will automatically convert into Class A shares on a monthly basis approximately eight years after the original date of purchase. Transactions in Fund shares were as follows:
| For the Year Ended December 31, 2022 | For the Year Ended December 31, 2021 | |||||||||||||||
| Shares | Amount | Shares | Amount | |||||||||||||
Class A: | ||||||||||||||||
Sold | 1,503,433 | $ | 16,058,556 | 477,919 | $ | 4,973,061 | ||||||||||
Issued as reinvestment | 31,146 | 307,852 | 56,048 | 562,243 | ||||||||||||
Redeemed | (878,803 | ) | (8,889,323 | ) | (398,910 | ) | (3,981,596 | ) | ||||||||
|
|
|
|
|
|
|
| |||||||||
Net increase (decrease) | 655,776 | $ | 7,477,085 | 135,057 | $ | 1,553,708 | ||||||||||
|
|
|
|
|
|
|
| |||||||||
51
COHEN & STEERS REAL ASSETS FUND, INC.
NOTES TO CONSOLIDATED FINANCIAL STATEMENTS—(Continued)
| For the Year Ended December 31, 2022 | For the Year Ended December 31, 2021 | |||||||||||||||
| Shares | Amount | Shares | Amount | |||||||||||||
Class C: | ||||||||||||||||
Sold | 652,173 | $ | 7,062,770 | 75,501 | $ | 801,204 | ||||||||||
Issued as reinvestment | 6,304 | 62,057 | 22,575 | 225,661 | ||||||||||||
Redeemed | (151,581 | ) | (1,510,973 | ) | (59,851 | ) | (632,435 | ) | ||||||||
|
|
|
|
|
|
|
| |||||||||
Net increase (decrease) | 506,896 | $ | 5,613,854 | 38,225 | $ | 394,430 | ||||||||||
|
|
|
|
|
|
|
| |||||||||
Class I: | ||||||||||||||||
Sold | 85,149,571 | $ | 897,933,775 | 25,112,562 | $ | 256,433,529 | ||||||||||
Issued as reinvestment | 1,775,549 | 17,559,079 | 2,190,076 | 22,027,847 | ||||||||||||
Redeemed | (32,200,192 | ) | (325,186,920 | ) | (6,120,505 | ) | (62,368,865 | ) | ||||||||
|
|
|
|
|
|
|
| |||||||||
Net increase (decrease) | 54,724,928 | $ | 590,305,934 | 21,182,133 | $ | 216,092,511 | ||||||||||
|
|
|
|
|
|
|
| |||||||||
Class R: | ||||||||||||||||
Sold | — | $ | — | — | $ | — | ||||||||||
Issued as reinvestment | 101 | 1,007 | 614 | 6,217 | ||||||||||||
Redeemed | (3,009 | ) | (33,514 | ) | — | — | ||||||||||
|
|
|
|
|
|
|
| |||||||||
Net increase (decrease) | (2,908 | ) | $ | (32,507 | ) | 614 | $ | 6,217 | ||||||||
|
|
|
|
|
|
|
| |||||||||
Class Z: | ||||||||||||||||
Sold | 1,418,625 | $ | 14,315,641 | 506,639 | $ | 5,224,311 | ||||||||||
Issued as reinvestment | 53,766 | 529,099 | 48,561 | 487,637 | ||||||||||||
Redeemed | (232,097 | ) | (2,381,253 | ) | (63,801 | ) | (657,795 | ) | ||||||||
|
|
|
|
|
|
|
| |||||||||
Net increase (decrease) | 1,240,294 | $ | 12,463,487 | 491,399 | $ | 5,054,153 | ||||||||||
|
|
|
|
|
|
|
| |||||||||
Note 7. Other Risks
Common Stock Risk: While common stocks have historically generated higher average returns than fixed-income securities over the long-term, common stocks have also experienced significantly more volatility in those returns, although under certain market conditions, fixed-income investments may have comparable or greater price volatility. The value of common stocks and other equity securities will fluctuate in response to developments concerning the company, political and regulatory circumstances,
52
COHEN & STEERS REAL ASSETS FUND, INC.
NOTES TO CONSOLIDATED FINANCIAL STATEMENTS—(Continued)
the stock market, and the economy. In the short term, stock prices can fluctuate dramatically in response to these developments. Different parts of the market and different types of equity securities can react differently to these developments. For example, stocks of large companies can react differently than stocks of smaller companies, and value stocks (stocks of companies that are undervalued by various measures and have potential for long-term capital appreciation), can react differently from growth stocks (stocks of companies with attractive cash flow returns on invested capital and earnings that are expected to grow). These developments can affect a single company, all companies within the same industry, economic sector or geographic region, or the stock market as a whole.
Commodities Risk: Investing in physical commodities, either directly or through complex instruments such as commodity futures contracts and options on commodity futures contracts presents unique risks, is speculative and can be extremely volatile. Market prices of commodities may fluctuate rapidly based on numerous factors including: drought, floods, weather, livestock disease, embargoes, tariffs and international economic, political and regulatory developments. Because the Fund has a significant portion of its assets concentrated in commodity-related derivative instruments, developments affecting commodities may have a disproportionate impact on the Fund. The Fund’s investment in commodity-linked derivative instruments may subject the Fund to greater volatility than investments in traditional securities, particularly if the instruments involve leverage. The value of commodity-related derivative instruments may be affected by changes in overall market movements, commodity index volatility, changes in interest rates, or factors affecting a particular industry or commodity. The use of derivatives presents risks different from, and possibly greater than, the risks associated with investing directly in traditional securities. Among the risks presented are market risk, credit risk, counterparty risk, leverage risk and liquidity risk. In addition, the relationships between various commodities and related derivatives may not behave as expected. Use of leveraged commodity-related derivatives, if any, creates an opportunity for increased return but, at the same time, creates the possibility for greater loss (including the likelihood of greater volatility of the Fund’s net asset value).
Investments in commodity futures contracts and options on commodity futures contracts have a high degree of price variability and are subject to rapid and substantial price changes. Such investments could incur significant losses. There can be no assurance that the options strategy will be successful.
The use of options on commodity futures contracts is to enhance risk-adjusted total returns. The use of options, however, may not provide any, or only partial, protection for market declines. The return performance of the commodity futures contracts may not parallel the performance of the commodities or indexes that serve as the basis for the options it buys or sells; this basis risk may reduce overall returns.
Preferred Securities Risk: Preferred securities are subject to credit risk, which is the risk that a security will decline in price, or the issuer of the security will fail to make dividend, interest or principal payments when due, because the issuer experiences a decline in its financial status. Preferred securities are also subject to interest rate risk and may decline in value because of changes in market interest rates. The Fund may be subject to a greater risk of rising interest rates than would normally be the case in an environment of low interest rates and the effect of potential government fiscal policy initiatives and resulting market reaction to those initiatives. In addition, an issuer may be permitted to
53
COHEN & STEERS REAL ASSETS FUND, INC.
NOTES TO CONSOLIDATED FINANCIAL STATEMENTS—(Continued)
defer or omit distributions. Preferred securities are also generally subordinated to bonds and other debt instruments in a company’s capital structure. During periods of declining interest rates, an issuer may be able to exercise an option to redeem (call) its issue at par earlier than scheduled, and the Fund may be forced to reinvest in lower yielding securities. Certain preferred securities may be substantially less liquid than many other securities, such as common stocks. Generally, preferred security holders have no voting rights with respect to the issuing company unless certain events occur. Certain preferred securities may give the issuers special redemption rights allowing the securities to be redeemed prior to a specified date if certain events occur, such as changes to tax or securities laws.
Real Estate Market Risk: Risks of investing in real estate securities include falling property values due to increasing vacancies, declining rents resulting from economic, legal, tax, political or technological developments, lack of liquidity, limited diversification, and sensitivity to certain economic factors such as interest-rate changes and market recessions. Real estate company prices also may drop because of the failure of borrowers to pay their loans and poor management, and residential developers, in particular, could be negatively impacted by falling home prices, slower mortgage origination and rising construction costs. The risks of investing in REITs are similar to those associated with direct investments in real estate securities.
REIT Risk: In addition to the risks of securities linked to the real estate industry, REITs are subject to certain other risks related to their structure and focus. REITs are dependent upon management skills and generally may not be diversified. REITs are also subject to heavy cash flow dependency, defaults by borrowers and self-liquidation. In addition, REITs could possibly fail to (i) qualify for pass-through of income under applicable tax law, or (ii) maintain their exemptions from registration under the 1940 Act. The above factors may also adversely affect a borrower’s or a lessee’s ability to meet its obligations to the REIT. In the event of a default by a borrower or lessee, the REIT may experience delays in enforcing its rights as a mortgagee or lessor and may incur substantial costs associated with protecting its investments.
Small- and Medium-Sized Companies Risk: Real estate companies in the industry tend to be small- to medium-sized companies in relation to the equity markets as a whole. There may be less trading in a smaller company’s stock, which means that buy and sell transactions in that stock could have a larger impact on the stock’s price than is the case with larger company stocks. Smaller companies also may have fewer lines of business so that changes in any one line of business may have a greater impact on a smaller company’s stock price than is the case for a larger company. Further, smaller company stocks may perform differently in different cycles than larger company stocks. Accordingly, real estate company shares can, and at times will, perform differently than large company stocks.
Natural Resources Risk: The Fund’s investments in securities of natural resource companies involve risks. The market value of securities of natural resource companies may be affected by numerous factors, including events occurring in nature, inflationary pressures and international politics. Because the Fund invests significantly in natural resource companies, there is the risk that the Fund will perform poorly during a downturn in the natural resource sector. For example, events occurring in nature (such as earthquakes or fires in prime natural resource areas) and political events (such as coups, military confrontations or acts of terrorism) can affect the overall supply of a natural resource and
54
COHEN & STEERS REAL ASSETS FUND, INC.
NOTES TO CONSOLIDATED FINANCIAL STATEMENTS—(Continued)
the value of companies involved in such natural resource. Political risks and the other risks to which foreign securities are subject may also affect domestic natural resource companies if they have significant operations or investments in foreign countries. Rising interest rates and general economic conditions may also affect the demand for natural resources.
Infrastructure Companies Risk: Securities and instruments of infrastructure companies are more susceptible to adverse economic or regulatory occurrences affecting their industries. Infrastructure companies may be subject to a variety of factors that may adversely affect their business or operations, including high interest costs in connection with capital construction and improvement programs, high leverage, costs associated with environmental and other regulations, the effects of economic slowdown, surplus capacity, increased competition from other providers of services, uncertainties concerning the availability of fuel at reasonable prices, the effects of energy conservation policies and other factors. Infrastructure companies may also be affected by or subject to high interest costs in connection with capital construction and improvement programs; difficulty in raising capital in adequate amounts on reasonable terms in periods of high inflation and unsettled capital markets; inexperience with and potential losses resulting from a developing deregulatory environment; costs associated with compliance with and changes in environmental and other regulations; regulation by various government authorities; government regulation of rates charged to customers; service interruption due to environmental, operational or other mishaps; the imposition of special tariffs and changes in tax laws, regulatory policies and accounting standards; technological innovations that may render existing plants, equipment or products obsolete; and general changes in market sentiment towards infrastructure and utilities assets.
Gold and Other Precious Metals Risk: Investments related to gold and other precious metals are considered speculative and are affected by a variety of worldwide economic, financial and political factors. The price of gold and other precious metals may fluctuate sharply over short periods of time due to changes in inflation or expectations regarding inflation in various countries, the availability of supplies of gold and other precious metals, changes in industrial and commercial demand, gold and other precious metals sales by governments, central banks or international agencies, investment speculation, monetary and other economic policies of various governments and government restrictions on private ownership of gold and other precious metals. No income is derived from holding physical gold or other precious metals, which is unlike securities that may pay dividends or make other current payments. Although the Fund has contractual protections with respect to the credit risk of their custodian, gold held in physical form (even in a segregated account) involves the risk of delay in obtaining the assets in the case of bankruptcy or insolvency of the custodian. This could impair disposition of the assets under those circumstances. If it holds physical gold, the Fund is also subject to an increased risk of loss and expense in connection with the transportation of such assets to and from the Fund’s custodian. In addition, gains derived from trading in gold and other precious metals may result in negative tax consequences due to appreciation in value, which could limit the ability of the Fund to sell its holdings of physical gold and certain ETFs at the desired time.
55
COHEN & STEERS REAL ASSETS FUND, INC.
NOTES TO CONSOLIDATED FINANCIAL STATEMENTS—(Continued)
Foreign (Non-U.S.) and Emerging Market Securities Risk: The Fund directly purchases securities of foreign issuers. Risks of investing in foreign securities, which can be expected to be greater for investments in emerging markets, include currency risks, future political and economic developments and possible imposition of foreign withholding taxes on income or proceeds payable on the securities. In addition, there may be less publicly available information about a foreign issuer than about a domestic issuer, and foreign issuers may not be subject to the same accounting, auditing and financial recordkeeping standards and requirements as domestic issuers. Moreover, securities of many foreign issuers and their markets may be less liquid and their prices more volatile than securities of comparable U.S. issuers.
Derivatives Risk: The use of derivatives presents risks different from, and possibly greater than, the risks associated with investing directly in traditional securities. Among the risks presented are market risk, credit risk, counterparty risk, leverage risk and liquidity risk. The use of derivatives can lead to losses because of adverse movements in the price or value of the underlying asset, index or rate, which may be magnified by certain features of the derivatives. In addition, the use of derivatives to hedge the Fund’s foreign currency risks may reduce returns or increase volatility, perhaps substantially.
Tax Risk: The Fund’s ability to make direct and indirect investments in commodity-related derivative instruments and certain related investments, is limited by the Fund’s intention to qualify as a RIC under the Internal Revenue Code of 1986; if the Fund does not appropriately limit such investments or if such investments are recharacterized for U.S. tax purposes, the Fund’s status as a RIC may be jeopardized. The Fund’s investment in the Subsidiary is intended to provide additional exposure to commodities while allowing the Fund to satisfy the requirements applicable to RICs. If the Fund were to fail to qualify as a RIC in any taxable year, and were ineligible to or otherwise did not cure such failure, the Fund would be subject to tax on its taxable income at corporate rates, and all distributions from earnings and profits, including any distributions of net long-term capital gains, would be taxable to shareholders as dividend income.
Subsidiary Risk: By investing in the Subsidiary, the Fund is indirectly exposed to the risks associated with the Subsidiary’s investments. The types of derivatives and other investments held by the Subsidiary generally are similar to those that are permitted to be held by the Fund and are subject to the same risks that apply to similar investments if held directly by the Fund. The Subsidiary is not registered under the 1940 Act and is not subject to all of the investor protections of the 1940 Act.
Changes in the laws of the United States and/or the Cayman Islands, under which the Fund and the Subsidiary are organized, respectively, could result in the inability of the Fund and/or the Subsidiary to operate as described in the Prospectus and the statement of additional information (SAI) and could negatively affect the Fund and its shareholders. For example, Cayman Islands law does not currently impose any income, corporate or capital gains tax, estate duty, inheritance tax, gift tax or withholding tax on the Subsidiary. If Cayman Islands law changes such that the Subsidiary must pay Cayman Islands governmental authority taxes, the Fund’s shareholders would likely suffer decreased investment returns.
Geopolitical Risk: Occurrence of global events similar to those in recent years, such as war (including Russia’s military invasion of Ukraine), terrorist attacks, natural or environmental disasters, country instability, infectious disease epidemics or pandemics, such as that caused by the COVID-19
56
COHEN & STEERS REAL ASSETS FUND, INC.
NOTES TO CONSOLIDATED FINANCIAL STATEMENTS—(Continued)
virus and its variants (COVID-19), market instability, debt crises and downgrades, embargoes, tariffs, sanctions and other trade barriers and other governmental trade or market control programs, the potential exit of a country from its respective union and related geopolitical events, may result in market volatility and may have long-lasting impacts on U.S. and global economies and financial markets. Supply chain disruptions or significant changes in the supply or prices of commodities or other economic inputs may have material and unexpected effects on both global securities markets and individual countries, regions, sectors, companies or industries. Events occurring in one region of the world may negatively impact industries and regions that are not otherwise directly impacted by the events. Additionally, those events, as well as other changes in foreign and domestic political and economic conditions, could adversely affect individual issuers or related groups of issuers, securities markets, interest rates, secondary trading, credit ratings, inflation, investor sentiment and other factors affecting the value of the Fund’s investments.
Although the long-term economic fallout of COVID-19 is difficult to predict, it has contributed to, and may continue to contribute to, market volatility, inflation and systemic economic weakness. COVID-19 and efforts to contain its spread may also exacerbate other pre-existing political, social, economic, market and financial risks. In addition, the U.S. government and other central banks across Europe, Asia, and elsewhere announced and/or adopted economic relief packages in response to COVID-19. The end of any such program could cause market downturns, disruptions and volatility, particularly if markets view the ending as premature. The COVID-19 pandemic and its effects are expected to continue, and therefore the economic outlook, particularly for certain industries and businesses, remains inherently uncertain.
On January 31, 2020, the United Kingdom (UK) withdrew from the European Union (EU) (referred to as Brexit), commencing a transition period that ended on December 31, 2020. The EU-UK Trade and Cooperation Agreement, a bilateral trade and cooperation deal governing the future relationship between the UK and the EU (TCA), provisionally went into effect on January 1, 2021, and entered into force officially on May 1, 2021, but critical aspects of the relationship remain unresolved and subject to further negotiation and agreement. Brexit has resulted in volatility in European and global markets and could have negative long-term impacts on financial markets in the UK and throughout Europe. There is still considerable uncertainty relating to the potential consequences of the exit, how the negotiations for new trade agreements will be conducted, and whether the UK’s exit will increase the likelihood of other countries also departing the EU. During this period of uncertainty, the negative impact on the UK, European and broader global economies, could be significant, potentially resulting in increased market volatility and illiquidity, political, economic, and legal uncertainty, and lower economic growth for companies that rely significantly on Europe for their business activities and revenues.
On February 24, 2022, Russia launched a large-scale invasion of Ukraine significantly amplifying already existing geopolitical tensions. The United States and many other countries have instituted various economic sanctions against Russia, Russian individuals and entities and Belarus. The extent and duration of the military action, sanctions imposed and other punitive actions taken (including any Russian retaliatory responses to such sanctions and actions), and resulting disruptions in Europe and globally cannot be predicted, but could be significant and have a severe adverse effect on the global economy, securities markets and commodities markets globally, including through global supply chain
57
COHEN & STEERS REAL ASSETS FUND, INC.
NOTES TO CONSOLIDATED FINANCIAL STATEMENTS—(Continued)
disruptions, increased inflationary pressures and reduced economic activity. To the extent the Fund has exposure to the energy sector, the Fund may be especially susceptible to these risks. These disruptions may also make it difficult to value the Fund’s portfolio investments and cause certain of the Fund’s investments to become illiquid. The strengthening or weakening of the U.S. dollar relative to other currencies may, among other things, adversely affect the Fund’s investments denominated in non-U.S. dollar currencies. It is difficult to predict when similar events affecting the U.S. or global financial markets may occur, the effects that such events may have, and the duration of those effects.
Regulatory Risk: The U.S. government has proposed and adopted multiple regulations that could have a long-lasting impact on the Fund and on the mutual fund industry in general. The U.S. Securities and Exchange Commission’s (SEC) final rules, related requirements and amendments to modernize reporting and disclosure, along with other potential upcoming regulations, could, among other things, restrict the Fund’s ability to engage in transactions, impact flows into the Fund and/or increase overall expenses of the Fund. In addition to Rule 18f-4, which governs the way derivatives are used by registered investment companies, the SEC, Congress, various exchanges and regulatory and self-regulatory authorities, both domestic and foreign, have undertaken reviews of the use of derivatives by registered investment companies, which could affect the nature and extent of instruments used by the Fund. The Fund and the instruments in which it invests may be subject to new or additional regulatory constraints in the future. While the full extent of all of these regulations is unclear, these regulations and actions may adversely affect both the Fund and the instruments in which the Fund invests and its ability to execute its investment strategy. For example, climate change regulation (such as decarbonization legislation, other mandatory controls to reduce emissions of greenhouse gases, or related disclosure requirements) could significantly affect the Fund or its investments by, among other things, increasing compliance costs or underlying companies’ operating costs and capital expenditures. Similarly, regulatory developments in other countries may have an unpredictable and adverse impact on the Fund.
LIBOR Risk: Many financial instruments are tied to the London Interbank Offered Rate, or “LIBOR,” to determine payment obligations, financing terms, hedging strategies, or investment value. LIBOR is the offered rate for short-term Eurodollar deposits between major international banks. The Head of the UK Financial Conduct Authority (FCA) and LIBOR’s administrator, ICE Benchmark Administration (IBA) ceased publication of most LIBOR settings at the end of 2021 and the IBA is expected to cease publication of a majority of U.S. dollar LIBOR settings after June 30, 2023. In addition, global regulators have announced that, with limited exceptions, no new LIBOR-based contracts should be entered into after 2021. Actions by regulators have resulted in the establishment of alternative reference rates to LIBOR in most major currencies (e.g., the Secured Overnight Financing Rate (SOFR) for U.S. dollar LIBOR and the Sterling Overnight Interbank Average Rate for GBP LIBOR). Other countries are introducing their own local-currency-denominated alternative reference rates for short-term lending and global consensus on alternative rates is lacking.
In March 2022, the U.S. federal government enacted the Adjustable Interest Rate (LIBOR) Act (LIBOR Act) to establish a process for replacing LIBOR in certain existing contracts that do not already provide for the use of a clearly defined or practicable replacement benchmark rate as described in the LIBOR Act. Generally, for contracts that do not contain a fallback provision as described in the LIBOR
58
COHEN & STEERS REAL ASSETS FUND, INC.
NOTES TO CONSOLIDATED FINANCIAL STATEMENTS—(Continued)
Act, a benchmark replacement recommended by the Federal Reserve Board will effectively replace the U.S. dollar LIBOR benchmark in the contract after June 30, 2023. The recommended benchmark replacement will be based on SOFR published by the Federal Reserve Bank of New York, including certain spread adjustments and benchmark replacement conforming changes. On December 16, 2022, the Federal Reserve Board adopted a final rule that implements the LIBOR Act. The final rule restates safe harbor protections contained in the LIBOR Act for selection or use of the replacement benchmark rate selected by the Federal Reserve Board. Consistent with the LIBOR Act, the final rule is also intended to ensure that LIBOR contracts adopting a benchmark rate selected by the Federal Reserve Board will not be interrupted or terminated following LIBOR’s replacement.
There remains uncertainty and risk regarding the willingness and ability of issuers and lenders to include enhanced provisions in new and existing contracts or instruments, the suitability of the proposed replacement rates, and the process for amending existing contracts and instruments remains unclear. As such, the transition away from LIBOR may lead to increased volatility and illiquidity in markets that are tied to LIBOR, reduced values of, inaccurate valuations of, and miscalculations of payment amounts for LIBOR-related investments or investments in issuers that utilize LIBOR, increased difficulty in borrowing or refinancing and reduced effectiveness of hedging strategies, adversely affecting the Fund’s performance or NAV. In addition, any alternative reference rate may be a less effective substitute resulting in prolonged adverse market conditions for the Fund. Since the usefulness of LIBOR as a benchmark could deteriorate during the transition period, these effects could occur prior to the cessation of LIBOR publications.
Large Shareholder Risk: The Fund may have one or more large shareholders or a group of shareholders investing in Fund shares indirectly through an account, platform or program sponsored by a financial institution. Investment and asset allocation decisions by such financial institutions regarding the account, platform or program through which multiple shareholders invest may result in subscription and redemption decisions that have a significant impact on the assets, expenses and trading activities of the Fund. Such a decision may cause the Fund to sell assets (or invest cash) at disadvantageous times or prices, increase or accelerate taxable gains or transaction costs and may negatively affect the Fund’s NAV, performance, or ability to satisfy redemptions in a timely manner.
This is not a complete list of the risks of investing in the Fund. For additional information concerning the risks of investing in the Fund, please consult the Fund’s prospectus.
Note 8. Other
In the normal course of business, the Fund enters into contracts that provide general indemnifications. The Fund’s maximum exposure under these arrangements is dependent on claims that may be made against the Fund in the future and, therefore, cannot be estimated; however, based on experience, the risk of material loss from such claims is considered remote.
The Fund and its Subsidiary are commodity pools under the Commodity Exchange Act. The investment advisor has registered with the CFTC as a commodity pool operator with respect to the Fund and the Subsidiary. Because of its management of other strategies, the Fund’s investment advisor is also registered with the CFTC as a commodity trading advisor. The CFTC has neither reviewed nor approved the Fund’s investment strategies.
59
COHEN & STEERS REAL ASSETS FUND, INC.
NOTES TO CONSOLIDATED FINANCIAL STATEMENTS—(Continued)
Note 9. New Accounting Pronouncement
In January 2021, the Financial Accounting Standards Board (FASB) issued Accounting Standards Update No. 2021-01 (ASU 2021-01), “Reference Rate Reform (Topic 848)”. Additionally, in December 2022, the FASB issued Accounting Standards Update No. 2022-06 (ASU 2022-06), “Reference Rate Reform (Topic 848)”. ASU 2022-06 and ASU 2021-01 are updates to ASU 2020-04, which is in response to concerns about structural risks of interbank offered rates, and particularly the risk of cessation of LIBOR, and the reference rate reform initiatives regulators have undertaken to identify alternative reference rates that are more observable or transaction based and less susceptible to manipulation. ASU 2020-04 provides optional guidance for a limited period of time to ease the potential burden in accounting for (or recognizing the effects of) reference rate reform on financial reporting. ASU 2020-04 is elective and applies to all entities, subject to meeting certain criteria, that have contracts, hedging relationships, and other transactions that reference LIBOR or another reference rate expected to be discontinued because of reference rate reform. The ASU 2021-01 update clarifies that certain optional expedients and exceptions in Topic 848 for contract modifications and hedge accounting apply to derivatives that are affected by the discounting transition. The ASU 2022-06 update extends the period of time preparers can use the reference rate reform relief guidance by two years. ASU 2022-06 defers the sunset date of Topic 848 from December 31, 2022 to December 31, 2024, after which entities will no longer be permitted to apply the relief in Topic 848. The amendments in these updates are effective immediately through December 31, 2024, for all entities. Management does not expect ASU 2021-01 or ASU 2022-06 to have a material impact on the financial statements.
Note 10. Subsequent Events
Management has evaluated events and transactions occurring after December 31, 2022 through the date that the consolidated financial statements were issued, and has determined that no additional disclosure in the consolidated financial statements is required.
60
COHEN & STEERS REAL ASSETS FUND, INC.
REPORT OF INDEPENDENT REGISTERED PUBLIC ACCOUNTING FIRM
To the Board of Directors and Shareholders of
Cohen & Steers Real Assets Fund, Inc.
Opinion on the Consolidated Financial Statements
We have audited the accompanying consolidated statement of assets and liabilities, including the consolidated schedule of investments, of Cohen & Steers Real Assets Fund, Inc. and its subsidiary (the “Fund”) as of December 31, 2022, the related consolidated statement of operations for the year ended December 31, 2022, the consolidated statement of changes in net assets for each of the two years in the period ended December 31, 2022, including the related notes, and the consolidated financial highlights for each of the five years in the period ended December 31, 2022 (collectively referred to as the “consolidated financial statements”). In our opinion, the consolidated financial statements present fairly, in all material respects, the financial position of the Fund as of December 31, 2022, the results of its operations for the year then ended, the changes in its net assets for each of the two years in the period ended December 31, 2022 and the financial highlights for each of the five years in the period ended December 31, 2022 in conformity with accounting principles generally accepted in the United States of America.
Basis for Opinion
These consolidated financial statements are the responsibility of the Fund’s management. Our responsibility is to express an opinion on the Fund’s consolidated financial statements based on our audits. We are a public accounting firm registered with the Public Company Accounting Oversight Board (United States) (PCAOB) and are required to be independent with respect to the Fund in accordance with the U.S. federal securities laws and the applicable rules and regulations of the Securities and Exchange Commission and the PCAOB.
We conducted our audits of these consolidated financial statements in accordance with the standards of the PCAOB. Those standards require that we plan and perform the audit to obtain reasonable assurance about whether the consolidated financial statements are free of material misstatement, whether due to error or fraud.
Our audits included performing procedures to assess the risks of material misstatement of the consolidated financial statements, whether due to error or fraud, and performing procedures that respond to those risks. Such procedures included examining, on a test basis, evidence regarding the amounts and disclosures in the consolidated financial statements. Our audits also included evaluating the accounting principles used and significant estimates made by management, as well as evaluating the overall presentation of the consolidated financial statements. Our procedures included confirmation of securities owned as of December 31, 2022 by correspondence with the custodian, transfer agent and brokers; when replies were not received from brokers, we performed other auditing procedures. We believe that our audits provide a reasonable basis for our opinion.
/s/PricewaterhouseCoopers LLP
New York, New York
February 22, 2023
We have served as the auditor of one or more investment companies in the Cohen & Steers family of mutual funds since 1991.
61
COHEN & STEERS REAL ASSETS FUND, INC.
TAX INFORMATION—2022 (Unaudited)
For the calendar year ended December 31, 2022, for individual taxpayers, the Fund designates $10,850,384 as qualified dividend income eligible for reduced tax rates, long-term capital gain distributions of $315,048 taxable at the maximum 20% rate, long-term capital gain distributions of $49,102 taxable at the 25% maximum rate. In addition, for corporate taxpayers, 11.67% of the ordinary dividends paid qualified for the dividends received deduction (DRD).
OTHER INFORMATION
A description of the policies and procedures that the Fund uses to determine how to vote proxies relating to portfolio securities is available (i) without charge, upon request, by calling 800-330-7348, (ii) on our website at cohenandsteers.com or (iii) on the U.S. Securities and Exchange Commission’s (SEC) website at http://www.sec.gov. In addition, the Fund’s proxy voting record for the most recent 12-month period ended June 30 is available by August 31 of each year (i) without charge, upon request, by calling 800-330-7348 or (ii) on the SEC’s website at http://www.sec.gov.
Disclosures of the Fund’s complete holdings are required to be made monthly on Form N-PORT, with every third month made available to the public by the SEC 60 days after the end of the Fund’s fiscal quarter. The Fund’s Form N-PORT is available (i) without charge, upon request, by calling 800-330-7348 or (ii) on the SEC’s website at http://www.sec.gov.
Please note that distributions paid by the Fund to shareholders are subject to recharacterization for tax purposes and are taxable up to the amount of the Fund’s investment company taxable income and net realized gains. Distributions in excess of the Fund’s net investment company taxable income and realized gains are a return of capital distributed from the Fund’s assets. The final tax treatment of all distributions is reported to shareholders on their 1099-DIV forms, which are mailed after the close of each calendar year.
Changes to the Portfolio Management Team
Effective March 24, 2022, Mr. Christopher Rhine no longer serves as a portfolio manager to the Fund. Effective April 29, 2022, Mr. Jeffrey Palma was added as portfolio manager of the Fund. Mr. Palma joined the investment advisor in 2021 and currently serves as Senior Vice President of the investment advisor.
Effective February 1, 2023, Tyler S. Rosenlicht was added as a portfolio manager of the Fund. Vincent L. Childers, Jon Cheigh, Benjamin Ross, Nicholas Koutsoftas, Benjamin Morton and Jeffrey Palma continues to serve as portfolio managers of the Fund.
62
COHEN & STEERS REAL ASSETS FUND, INC.
MANAGEMENT OF THE FUND
The business and affairs of the Fund are managed under the direction of the Board of Directors. The Board of Directors approves all significant agreements between the Fund and persons or companies furnishing services to it, including the Fund’s agreements with its investment advisor, administrator, co-administrator, custodian and transfer agent. The management of the Fund’s day-to-day operations is delegated to its officers, the investment advisor, administrator and co-administrator, subject always to the investment objective and policies of the Fund and to the general supervision of the Board of Directors.
The Board of Directors and officers of the Fund and their principal occupations during at least the past five years are set forth below. The statement of additional information (SAI) includes additional information about fund directors and is available, without charge, upon request by calling 800-330-7348.
Name, Address and Year of Birth1 | Position(s) Held With Fund | Term of Office2 | Principal Occupation During At Least The Past 5 Years (Including Other Directorships Held) | Number of Funds Within Fund Complex Overseen by Director (Including the Fund) | Length of Time Served3 | |||||||
| Interested Directors4 | ||||||||||||
Joseph M. Harvey 1963 | Director, Chair | Until Next Election of Directors | Chief Executive Officer since 2022 and President since 2003 of Cohen & Steers Capital Management, Inc. (“CSCM”), and Chief Executive Officer since 2022 and President since 2004 of Cohen & Steers, Inc. (“CNS”). Chief Investment Officer of CSCM from 2003 to 2019. Prior to that, Senior Vice President and Director of Investment Research of CSCM. | 21 | Since 2014 | |||||||
Adam M. Derechin 1964 | Director | Until Next Election of Directors | Chief Operating Officer of CSCM since 2003 and CNS since 2004. President and Chief Executive Officer of the Funds from 2005 to 2021. | 21 | Since 2021 | |||||||
| Independent Directors | ||||||||||||
Michael G. Clark 1965 | Director | Until Next Election of Directors | CFA; From 2006 to 2011, President and Chief Executive Officer of DWS Funds and Managing Director of Deutsche Asset Management. | 21 | Since 2011 | |||||||
(table continued on next page)
63
COHEN & STEERS REAL ASSETS FUND, INC.
(table continued from previous page)
Name, Address and Year of Birth1 | Position(s) Held With Fund | Term of Office2 | Principal Occupation During At Least The Past 5 Years (Including Other Directorships Held) | Number of Funds Within Fund Complex Overseen by Director (Including the Fund) | Length of Time Served3 | |||||
George Grossman 1953 | Director | Until Next Election of Directors | Attorney-at-law. | 21 | Since 1993 | |||||
Dean A. Junkans 1959 | Director | Until Next Election of Directors | CFA; Advisor to SigFig (a registered investment advisor) since July, 2018; Chief Investment Officer at Wells Fargo Private Bank from 2004 to 2014 and Chief Investment Officer of the Wealth, Brokerage and Retirement group at Wells Fargo & Company from 2011 to 2014; former Member and Chair, Claritas Advisory Committee at the CFA Institute from 2013 to 2015; former Adjunct Professor and Executive-In-Residence, Bethel University, 2015 to 2022; former Board Member and Investment Committee member, Bethel University Foundation, 2010 to 2022; former Corporate Executive Board Member of the National Chief Investment Officers Circle, 2010 to 2015; formerly, Member of the Board of Governors of the University of Wisconsin Foundation, River Falls, 1996 to 2004; U.S. Army Veteran, Gulf War. | 21 | Since 2015 | |||||
(table continued on next page)
64
COHEN & STEERS REAL ASSETS FUND, INC.
(table continued from previous page)
Name, Address and Year of Birth1 | Position(s) Held With Fund | Term of Office2 | Principal Occupation During At Least The Past 5 Years (Including Other Directorships Held) | Number of Funds Within Fund Complex Overseen by Director (Including the Fund) | Length of Time Served3 | |||||
Gerald J. Maginnis 1955 | Director | Until Next Election of Directors | Philadelphia Office Managing Partner, KPMG LLP from 2006 to 2015; Partner in Charge, KPMG Pennsylvania Audit Practice from 2002 to 2008; President, Pennsylvania Institute of Certified Public Accountants (PICPA) from 2014 to 2015; Member, PICPA Board of Directors from 2012 to 2016; Member, Council of the American Institute of Certified Public Accountants (AICPA) from 2013 to 2017; Member, Board of Trustees of AICPA Foundation from 2015 to 2020; Board member and Audit Committee Chairman of inTEST Corporation since 2020; Chairman of the Advisory Board of Centri Consulting LLC since 2022. | 21 | Since 2015 | |||||
Jane F. Magpiong 1960 | Director | Until Next Election of Directors | President, Untap Potential since 2013; Senior Managing Director, TIAA-CREF, from 2011 to 2013; National Head of Wealth Management, TIAA- CREF, from 2008 to 2011; President, Bank of America Private Bank from 2005 to 2008; and prior to that, Executive Vice President, Fleet Private Clients Group, from 2003 to 2004. | 21 | Since 2015 | |||||
(table continued on next page)
65
COHEN & STEERS REAL ASSETS FUND, INC.
(table continued from previous page)
Name, Address and Year of Birth1 | Position(s) Held With Fund | Term of Office2 | Principal Occupation During At Least The Past 5 Years (Including Other Directorships Held) | Number of Funds Within Fund Complex Overseen by Director (Including the Fund) | Length of Time Served3 | |||||
Daphne L. Richards 1966 | Director | Until Next Election of Directors | President and CIO of Ledge Harbor Management since 2016; Investment Committee Member of the Berkshire Taconic Community Foundation since 2015 and Member of the Advisory Board of Northeast Dutchess Fund since 2016; former Independent Director of Cartica Management, LLC, 2015 to 2022; formerly, worked at Bessemer Trust Company from 1999 to 2014; Frank Russell Company from 1996 to 1999. Union Bank of Switzerland from 1993 to 1996; Credit Suisse from 1990 to 1993; and Hambros International Venture Capital Fund from 1988 to 1989. | 21 | Since 2017 | |||||
(table continued on next page)
66
COHEN & STEERS REAL ASSETS FUND, INC.
(table continued from previous page)
Name, Address and Year of Birth1 | Position(s) Held With Fund | Term of Office2 | Principal Occupation During At Least The Past 5 Years (Including Other Directorships Held) | Number of Funds Within Fund Complex Overseen by Director (Including the Fund) | Length of Time Served3 | |||||
Ramona Rogers-Windsor 1960 | Director | Until Next Election of Directors | CFA; Member, Capital Southwest Board of Directors since March 2021; member, Thomas Jefferson University Board of Trustees since 2020; Managing Director, Public Investments Department, Northwestern Mutual Investment Management Company, LLC from 2012 to 2019; member, Milwaukee Film, LLC Board of Directors from 2016 to 2019. | 21 | Since 2021 | |||||
| 1 | The address for each director is 280 Park Avenue, New York, NY 10017. |
| 2 | On March 12, 2008, the Board of Directors adopted a mandatory retirement policy stating a Director must retire from the Board on December 31st of the year in which he or she turns 75 years of age. |
| 3 | The length of time served represents the year in which the Director was first elected or appointed to any fund in the Cohen & Steers Fund Complex. |
| 4 | “Interested person” as defined in the 1940 Act, of the Fund because of affiliation with CSCM (Interested Directors). |
67
COHEN & STEERS REAL ASSETS FUND, INC.
The officers of the Fund (other than Mr. Harvey, whose biography is provided above), their address, their year of birth and their principal occupations for at least the past five years are set forth below.
Name, Address and Year of Birth1 | Position(s) Held With Fund | Principal Occupation During At Least the Past 5 Years | Length of Time Served2 | |||
James Giallanza 1966 | President and Chief Executive Officer | Executive Vice President of CSCM since 2014. Prior to that, Senior Vice President of CSCM since 2006. | Since 2006 | |||
Albert Laskaj 1977 | Treasurer and Chief Financial Officer | Senior Vice President of CSCM since 2019. Prior to that Vice President of CSCM since 2015. | Since 2015 | |||
Dana A. DeVivo 1981 | Secretary and Chief Legal Officer | Senior Vice President of CSCM since 2019. Prior to that, Vice President of CSCM since 2013. | Since 2015 | |||
Stephen Murphy 1966 | Chief Compliance Officer and Vice President | Senior Vice President of CSCM since 2019. Prior to that, Managing Director at Mirae Asset Securities (USA) Inc. since 2017. Prior to that, Vice President and Chief Compliance Officer of Weiss Multi-Strategy Advisers LLC since 2011. | Since 2019 | |||
Vincent L. Childers 1976 | Vice President | Senior Vice President of CSCM since 2013. Prior to that, portfolio manager for real asset strategies at AllianceBernstein. | Since 2013 | |||
Jon Cheigh 1973 | Vice President | Chief Investment Officer of CSCM since October 2019 and Executive Vice President of CSCM since 2012. Prior to that, Senior Vice President of CSCM since 2007. | Since 2007 | |||
Benjamin Ross 1971 | Vice President | Senior Vice President of CSCM since 2013. Prior to that, co-portfolio manager at GE Asset Management of the GE Active Commodities strategy since its 2006 inception. | Since 2013 | |||
William F. Scapell 1967 | Vice President | Executive Vice President of CSCM since 2014. Prior to that, Senior Vice President of CSCM since 2003. | Since 2003 | |||
Jason A. Yablon 1979 | Vice President | Executive Vice President of CSCM effective January 2022. Prior to that, Senior Vice President of CSCM since 2014. | Since 2012 | |||
Yigal D. Jhirad 1964 | Vice President | Senior Vice President of CSCM since 2007. | Since 2007 | |||
| 1 | The address of each officer is 280 Park Avenue, New York, NY 10017. |
| 2 | Officers serve one-year terms. The length of time served represents the year in which the officer was first elected as an officer of any fund in the Cohen & Steers fund complex. All of the officers listed above are officers of one or more of the other funds in the complex. |
68
COHEN & STEERS REAL ASSETS FUND, INC.
Cohen & Steers Privacy Policy
| Facts | What Does Cohen & Steers Do With Your Personal Information? | |
| Why? | Financial companies choose how they share your personal information. Federal law gives consumers the right to limit some but not all sharing. Federal law also requires us to tell you how we collect, share, and protect your personal information. Please read this notice carefully to understand what we do. | |
| What? | The types of personal information we collect and share depend on the product or service you have with us. This information can include:
• Social Security number and account balances
• Transaction history and account transactions
• Purchase history and wire transfer instructions | |
| How? | All financial companies need to share customers’ personal information to run their everyday business. In the section below, we list the reasons financial companies can share their customers’ personal information; the reasons Cohen & Steers chooses to share; and whether you can limit this sharing. | |
| Reasons we can share your personal information | Does Cohen & Steers share? | Can you limit this sharing? | ||
For our everyday business purposes— such as to process your transactions, maintain your account(s), respond to court orders and legal investigations, or reports to credit bureaus | Yes | No | ||
For our marketing purposes— to offer our products and services to you | Yes | No | ||
| For joint marketing with other financial companies— | No | We don’t share | ||
For our affiliates’ everyday business purposes— information about your transactions and experiences | No | We don’t share | ||
For our affiliates’ everyday business purposes— information about your creditworthiness | No | We don’t share | ||
| For our affiliates to market to you— | No | We don’t share | ||
| For non-affiliates to market to you— | No | We don’t share | ||
| Questions? Call 800.330.7348 | ||||
69
COHEN & STEERS REAL ASSETS FUND, INC.
Cohen & Steers Privacy Policy—(Continued)
| Who we are | ||
| Who is providing this notice? | Cohen & Steers Capital Management, Inc., Cohen & Steers Asia Limited, Cohen & Steers Japan Limited, Cohen & Steers UK Limited, Cohen & Steers Ireland Limited, Cohen & Steers Securities, LLC, Cohen & Steers Private Funds and Cohen & Steers Open and Closed-End Funds (collectively, Cohen & Steers). | |
| What we do | ||
| How does Cohen & Steers protect my personal information? | To protect your personal information from unauthorized access and use, we use security measures that comply with federal law. These measures include computer safeguards and secured files and buildings. We restrict access to your information to those employees who need it to perform their jobs, and also require companies that provide services on our behalf to protect your information. | |
| How does Cohen & Steers collect my personal information? | We collect your personal information, for example, when you:
• Open an account or buy securities from us
• Provide account information or give us your contact information
• Make deposits or withdrawals from your account
We also collect your personal information from other companies. | |
| Why can’t I limit all sharing? | Federal law gives you the right to limit only:
• sharing for affiliates’ everyday business purposes—information about your creditworthiness
• affiliates from using your information to market to you
• sharing for non-affiliates to market to you
State law and individual companies may give you additional rights to limit sharing. | |
| Definitions | ||
| Affiliates | Companies related by common ownership or control. They can be financial and nonfinancial companies.
• Cohen & Steers does not share with affiliates. | |
| Non-affiliates | Companies not related by common ownership or control. They can be financial and nonfinancial companies.
• Cohen & Steers does not share with non-affiliates. | |
| Joint marketing | A formal agreement between non-affiliated financial companies that together market financial products or services to you.
• Cohen & Steers does not jointly market. | |
70
COHEN & STEERS REAL ASSETS FUND, INC.
Cohen & Steers Open-End Mutual Funds
COHEN & STEERS REALTY SHARES
| • | Designed for investors seeking total return, investing primarily in U.S. real estate securities |
| • | Symbols: CSJAX, CSJCX, CSJIX, CSRSX, CSJRX, CSJZX |
COHEN & STEERS REAL ESTATE SECURITIES FUND
| • | Designed for investors seeking total return, investing primarily in U.S. real estate securities |
| • | Symbols: CSEIX, CSCIX, CREFX, CSDIX, CIRRX, CSZIX |
COHEN & STEERS INSTITUTIONAL REALTY SHARES
| • | Designed for institutional investors seeking total return, investing primarily in U.S. real estate securities |
| • | Symbol: CSRIX |
COHEN & STEERS GLOBAL REALTY SHARES
| • | Designed for investors seeking total return, investing primarily in global real estate equity securities |
| • | Symbols: CSFAX, CSFCX, CSSPX, GRSRX, CSFZX |
COHEN & STEERS INTERNATIONAL REALTY FUND
| • | Designed for investors seeking total return, investing primarily in international (non-U.S.) real estate securities |
| • | Symbols: IRFAX, IRFCX, IRFIX, IRFRX, IRFZX |
COHEN & STEERS REAL ASSETS FUND
| • | Designed for investors seeking total return and the maximization of real returns during inflationary environments by investing primarily in real assets |
| • | Symbols: RAPAX, RAPCX, RAPIX, RAPRX, RAPZX |
COHEN & STEERS
PREFERRED SECURITIESAND INCOME FUND
| • | Designed for investors seeking total return (high current income and capital appreciation), investing primarily in preferred and debt securities issued by U.S. and non-U.S. companies |
| • | Symbols: CPXAX, CPXCX, CPXFX, CPXIX, CPRRX, CPXZX |
COHEN & STEERS
LOW DURATION PREFERREDAND INCOME FUND
| • | Designed for investors seeking high current income and capital preservation by investing in low-duration preferred and other income securities issued by U.S. and non-U.S. companies |
| • | Symbols: LPXAX, LPXCX, LPXFX, LPXIX, LPXRX, LPXZX |
COHEN & STEERS MLP & ENERGY OPPORTUNITY FUND
| • | Designed for investors seeking total return, investing primarily in midstream energy master limited partnership (MLP) units and related stocks |
| • | Symbols: MLOAX, MLOCX, MLOIX, MLORX, MLOZX |
COHEN & STEERS GLOBAL INFRASTRUCTURE FUND
| • | Designed for investors seeking total return, investing primarily in global infrastructure securities |
| • | Symbols: CSUAX, CSUCX, CSUIX, CSURX, CSUZX |
COHEN & STEERS ALTERNATIVE INCOME FUND
| • | Designed for investors seeking high current income and capital appreciation, investing in equity, preferred and debt securities, focused on real assets and alternative income strategies |
| • | Symbols: DVFAX, DVFCX, DVFIX, DVFRX, DVFZX |
Distributed by Cohen & Steers Securities, LLC.
Please consider the investment objectives, risks, charges and expenses of any Cohen & Steers U.S. registered open-end fund carefully before investing. A summary prospectus and prospectus containing this and other information can be obtained by calling 800-330-7348 or by visiting cohenandsteers.com. Please read the summary prospectus and prospectus carefully before investing.
71
COHEN & STEERS REAL ASSETS FUND, INC.
OFFICERS AND DIRECTORS
Joseph M. Harvey
Director, Chair and Vice President
Adam M. Derechin
Director
Michael G. Clark
Director
George Grossman
Director
Dean A. Junkans
Director
Gerald J. Maginnis
Director
Jane F. Magpiong
Director
Daphne L. Richards
Director
Ramona Rogers-Windsor
Director
James Giallanza
President and Chief Executive Officer
Albert Laskaj
Treasurer and Chief Financial Officer
Dana A. DeVivo
Secretary and Chief Legal Officer
Stephen Murphy
Chief Compliance Officer
and Vice President
Vincent L. Childers
Vice President
Jon Cheigh
Vice President
Benjamin Ross
Vice President
William F. Scapell
Vice President
Jason A. Yablon
Vice President
Yigal D. Jhirad
Vice President
KEY INFORMATION
Investment Advisor and Administrator
Cohen & Steers Capital Management, Inc.
280 Park Avenue
New York, NY 10017
(212) 832-3232
Co-administrator and Custodian
State Street Bank and Trust Company
One Lincoln Street
Boston, MA 02111
Transfer Agent
SS&C GIDS, Inc.
P.O. Box 219953
Kansas City, MO 64121-9953
(800) 437-9912
Legal Counsel
Ropes & Gray LLP
1211 Avenue of the Americas
New York, NY 10036
Distributor
Cohen & Steers Securities, LLC
280 Park Avenue
New York, NY 10017
| NASDAQ Symbol: | Class A—RAPAX | |
| Class C—RAPCX | ||
| Class F—RAPFX* | ||
| Class I—RAPIX | ||
| Class R—RAPRX | ||
| Class Z—RAPZX |
Website: cohenandsteers.com
This report is authorized for delivery only to shareholders of Cohen & Steers Real Assets Fund, Inc. unless accompanied or preceded by the delivery of a currently effective prospectus setting forth details of the Fund. Performance data quoted represent past performance. Past performance is no guarantee of future results and your investment may be worth more or less at the time you sell your shares.
| * | Class F shares are currently not available for purchase. |
72
eDelivery AVAILABLE
Stop traditional mail delivery;
receive your shareholder reports
and prospectus online.
Sign up at cohenandsteers.com

Cohen & Steers
Real Assets
Fund
Annual Report December 31, 2022
As permitted by regulations adopted by the U.S. Securities and Exchange Commission, paper copies of the Fund’s annual and semi-annual shareholder reports are no longer sent by mail, unless you specifically requested paper copies of the reports. Instead, the reports are made available on the Fund’s website at www.cohenandsteers.com, and you will be notified by mail each time a report is posted and provided with a website link to access the report.
If you have already elected to receive shareholder reports electronically, you will not be affected by this change and you need not take any action. You may elect to receive shareholder reports and other communications from a Fund electronically anytime by contacting your financial intermediary or, if you are a direct investor, by signing up at www.cohenandsteers.com.
You may elect to receive all future reports in paper, free of charge, at any time. If you invest through a financial intermediary, you can contact your financial intermediary or, if you are a direct investor, you can call (800) 330-7348 to let the Fund know you wish to continue receiving paper copies of your shareholder reports. Your election to receive reports in paper will apply to all Funds held in your account if you invest through your financial intermediary or all Funds held within the fund complex if you invest directly with the Fund.
RAPAXAR
Item 2. Code of Ethics.
The registrant has adopted a code of ethics as defined in Item 2 of Form N-CSR (the “Code of Ethics”) that applies to its Principal Executive Officer and Principal Financial Officer. The Code of Ethics was in effect during the reporting period. The registrant has not amended the Code of Ethics as described in Form N-CSR during the reporting period. The registrant has not granted any waiver, including an implicit waiver, from a provision of the Code of Ethics, as described in Form N-CSR, during the reporting period. A current copy of the Code of Ethics is available on the registrant’s website at https://assets.cohenandsteers.com/assets/content/uploads/Code_of_Ethics_for_Principal_Executive_and_Principal_Financial_Officers_of_the_Funds.pdf.
Upon request, a copy of the Code of Ethics can be obtained free of charge by calling 800-330-7348 or writing to the Secretary of the Registrant, 280 Park Avenue, 10th floor, New York, NY 10017.
Item 3. Audit Committee Financial Expert.
The registrant’s board has determined that Gerald J. Maginnis qualifies as an audit committee financial expert based on his years of experience in the public accounting profession. The registrant’s board has determined that Michael G. Clark qualifies as an audit committee financial expert based on his years of experience in the public accounting profession and the investment management and financial services industry. The registrant’s board has determined that Ramona Rogers-Windsor qualifies as an audit committee financial expert based on her years of experience in the investment management and financial services industry. Each of Messrs. Clark and Maginnis and Ms. Rogers-Windsor is a member of the board’s audit committee, and each is independent as such term is defined in Form N-CSR.
Item 4. Principal Accountant Fees and Services.
(a) – (d) Aggregate fees billed to the registrant for the last two fiscal years ended December 31, 2022 and December 31, 2021 for professional services rendered by the registrant’s principal accountant were as follows:
| 2022 | 2021 | |||
Audit Fees | $59,819 | $57,518 | ||
Audit-Related Fees | $0 | $0 | ||
Tax Fees | $23,677 | $22,766 | ||
All Other Fees | $0 | $0 |
Tax fees were billed in connection with tax compliance services, including the preparation and review of federal and state tax returns.
(e)(1) The audit committee is required to pre-approve audit and non-audit services performed for the registrant by the principal accountant. The audit committee also is required to pre-approve non-audit services performed by the registrant’s principal accountant for the registrant’s investment advisor and any sub-advisor (not including any sub-advisor whose role is primarily portfolio management and is subcontracted with or overseen by another investment advisor) and/or to any entity controlling, controlled by or under common control with the registrant’s investment advisor that provides ongoing services to the registrant, if the engagement for services relates directly to the operations and financial reporting of the registrant.
The audit committee may delegate pre-approval authority to one or more of its members who are independent members of the board of directors of the registrant. The member or members to whom such authority is delegated shall report any pre-approval decisions to the audit committee at its next scheduled meeting. The audit committee may not delegate its responsibility to pre-approve services to be performed by the registrant’s principal accountant to the investment advisor.
(e)(2) No services included in (b) – (d) above were approved by the audit committee pursuant to paragraphs (c)(7)(i)(C) of Rule 2-01 of Regulation S-X.
(f) Not applicable.
(g) For the fiscal years ended December 31, 2022 and December 31, 2021, the aggregate fees billed by the registrant’s principal accountant for non-audit services rendered to the registrant and for non-audit services rendered to the registrant’s investment advisor (not including any sub-advisor whose role is primarily portfolio management and is subcontracted with or overseen by another investment advisor) and/or to any entity controlling, controlled by or under common control with the registrant’s investment advisor that provides ongoing services to the registrant were:
| 2022 | 2021 | |||
Registrant | $23,677 | $22,766 | ||
Investment Advisor | $0 | $0 |
(h) The registrant’s audit committee considered whether the provision of non-audit services that were rendered to the registrant’s investment advisor (not including any sub-advisor whose role is primarily portfolio management and is subcontracted with or overseen by another investment advisor) and/or to any entity controlling, controlled by or under common control with the registrant’s investment advisor that provides ongoing services to the registrant that were not required to be pre-approved pursuant to paragraph (c)(7)(ii) of Rule 2-01 of Regulation S-X was compatible with maintaining the principal accountant’s independence.
Item 5. Audit Committee of Listed Registrants.
Not applicable.
Item 6. Schedule of Investments.
Included in Item 1 above.
Item 7. Disclosure of Proxy Voting Policies and Procedures for Closed-End Management Investment Companies.
Not applicable.
Item 8. Portfolio Managers of Closed-End Investment Companies.
Not applicable.
Item 9. Purchases of Equity Securities by Closed-End Management Investment Company and Affiliated Purchasers.
Not applicable.
Item 10. Submission of Matters to a Vote of Security Holders.
None.
Item 11. Controls and Procedures.
| (a) | The registrant’s principal executive officer and principal financial officer have concluded that the registrant’s disclosure controls and procedures are reasonably designed to ensure that information required to be disclosed by the registrant in this Form N-CSR was recorded, processed, summarized and reported within the time periods specified in the Securities and Exchange Commission’s rules and forms, based upon such officers’ evaluation of these controls and procedures as of a date within 90 days of the filing date of this report. |
| (b) | There were no changes in the registrant’s internal control over financial reporting that occurred during the period covered by this report that have materially affected, or are reasonably likely to materially affect, the registrant’s internal control over financial reporting. |
Item 12. Disclosure of Securities Lending Activities for Closed-End Management Investment Companies.
Not applicable.
Item 13. Exhibits.
(a)(1) Not applicable.
(a)(3) Not applicable.
(a)(4) Not applicable.
SIGNATURES
Pursuant to the requirements of the Securities Exchange Act of 1934 and the Investment Company Act of 1940, the registrant has duly caused this report to be signed on its behalf by the undersigned, thereunto duly authorized.
COHEN & STEERS REAL ASSETS FUND, INC.
| By: | /s/ James Giallanza | |||
Name: James Giallanza Title: Principal Executive Officer (President and Chief Executive Officer) | ||||
| Date: March 3, 2023 | ||||
Pursuant to the requirements of the Securities Exchange Act of 1934 and the Investment Company Act of 1940, this report has been signed below by the following persons on behalf of the registrant and in the capacities and on the dates indicated.
| By: | /s/ James Giallanza | |||
Name: James Giallanza Title: Principal Executive Officer (President and Chief Executive Officer) | ||||
| By: | /s/ Albert Laskaj | |||
Name: Albert Laskaj Title: Principal Financial Officer (Treasurer and Chief Financial Officer) | ||||
| Date: March 3, 2023 | ||||