Exhibit 99.2
FOURTH QUARTER 2024 EARNINGS SUPPLEMENTAL www.globalmedicalreit.com NYSE: GMRE Atrium Health – Winston - Salem, NC

Forward - Looking Statements Certain statements contained herein may be considered “forward - looking statements” within the meaning of the Private Securities Litigation Reform Act of 1995 , and it is the Company’s intent that any such statements be protected by the safe harbor created thereby . These forward - looking statements are identified by their use of terms and phrases such as "anticipate," "believe," "could," "estimate," "expect," "intend," "may," "should," "plan," "predict," "project," "will," "continue" and other similar terms and phrases, including references to assumptions and forecasts of future results . Except for historical information, the statements set forth herein including, but not limited to, any statements regarding our earnings, our liquidity, our tenants’ ability to pay rent to us, expected financial performance (including future cash flows associated with our joint venture, new tenants or the expansion of current properties), future dividends or other financial items ; any other statements concerning our plans, strategies, objectives and expectations for future operations and future portfolio occupancy rates, our pipeline of acquisition opportunities and expected acquisition activity, including the timing and/or successful completion of any acquisitions and expected rent receipts on these properties, our expected disposition activity, including the timing and/or successful completion of any dispositions and the expected use of proceeds therefrom, and any statements regarding future economic conditions or performance are forward - looking statements . These forward - looking statements are based on our current expectations, estimates and assumptions and are subject to certain risks and uncertainties . Although the Company believes that the expectations, estimates and assumptions reflected in its forward - looking statements are reasonable, actual results could differ materially from those projected or assumed in any of the Company’s forward - looking statements . Additional information concerning us and our business, including additional factors that could materially and adversely affect our financial results, include, without limitation, the risks described under Part I, Item 1 A - Risk Factors, in our Annual Report on Form 10 - K, our Quarterly Reports on Form 10 - Q, and in our other filings with the SEC . You are cautioned not to place undue reliance on forward - looking statements . The Company does not intend, and undertakes no obligation, to update any forward - looking statement . TABLE OF CONTENTS 3 Company Overview 6 Select Quarterly Financial Data 7 Business Summary 8 Acquisitions / Dispositions 9 Portfolio Summary 12 Key Tenants 13 Debt and Hedging Summary 15 Total Capitalization and Equity Summary 16 Sustainability Summary 17 Condensed Consolidated Statements of Operations 18 Condensed Consolidated Balance Sheets 19 Condensed Consolidated Statements of Cash Flows 20 Non - GAAP Reconciliations 21 Reporting Definitions and Other Disclosures Legent Hospital for Special Surgery – Plano, TX 4Q - 2024 | Earnings Supplemental 2

3 4Q - 2024 | Earnings Supplemental *See page 22 for disclosure regarding the Company’s rent coverage calculation COMPANY OVERVIEW GLOBAL MEDICAL REIT INC. (GMRE) IS A NET - LEASE MEDICAL REAL ESTATE INVESTMENT TRUST (REIT) THAT ACQUIRES HEALTHCARE FACILITIES AND LEASES THOSE FACILITIES TO PHYSICIAN GROUPS AND REGIONAL AND NATIONAL HEALTHCARE SYSTEMS. PORTFOLIO SNAPSHOT (as of December 31, 2024) Blue Sky Vision – Grand Rapids, MI Gross Investment in Real Estate (billions) $1.5 Number of Buildings 190 Number of States 37 Weighted Average Portfolio Cap Rate 7.8% % of Health System or Other Affiliated Tenants 90% Weighted Average Lease Term (years) 5.6 Leased Occupancy 96.4% Portfolio Rent Coverage* 4.5x

4Q - 2024 | Earnings Supplemental 4 Chairman, Chief Executive Officer and President Jeffrey Busch Chief Financial Officer and Treasurer Robert Kiernan Chief Investment Officer Alfonzo Leon Chief Operating Officer Danica Holley General Counsel and Corporate Secretary Jamie Barber Board of Directors Chairman of the Board, Chief Executive Officer and President Jeffrey Busch ESG Committee Chair, Compensation Committee Member, Audit Committee Member, Nominating and Corporate Governance Committee Member Henry Cole Compensation Committee Chair, Audit Committee Member, Nominating and Corporate Governance Committee Member Paula Crowley Nominating and Corporate Governance Committee Chair, ESG Committee Member, Audit Committee Member Matthew Cypher, Ph.D. Nominating and Corporate Governance Committee Member, Compensation Committee Member Ronald Marston Lead Independent Director, Audit Committee Chair, ESG Committee Member Lori Wittman Director Zhang Huiqi INDEPENDENT DIRECTORS 71% BOARD % OF WOMEN COMPANY OVERVIEW 43% Executive Officers
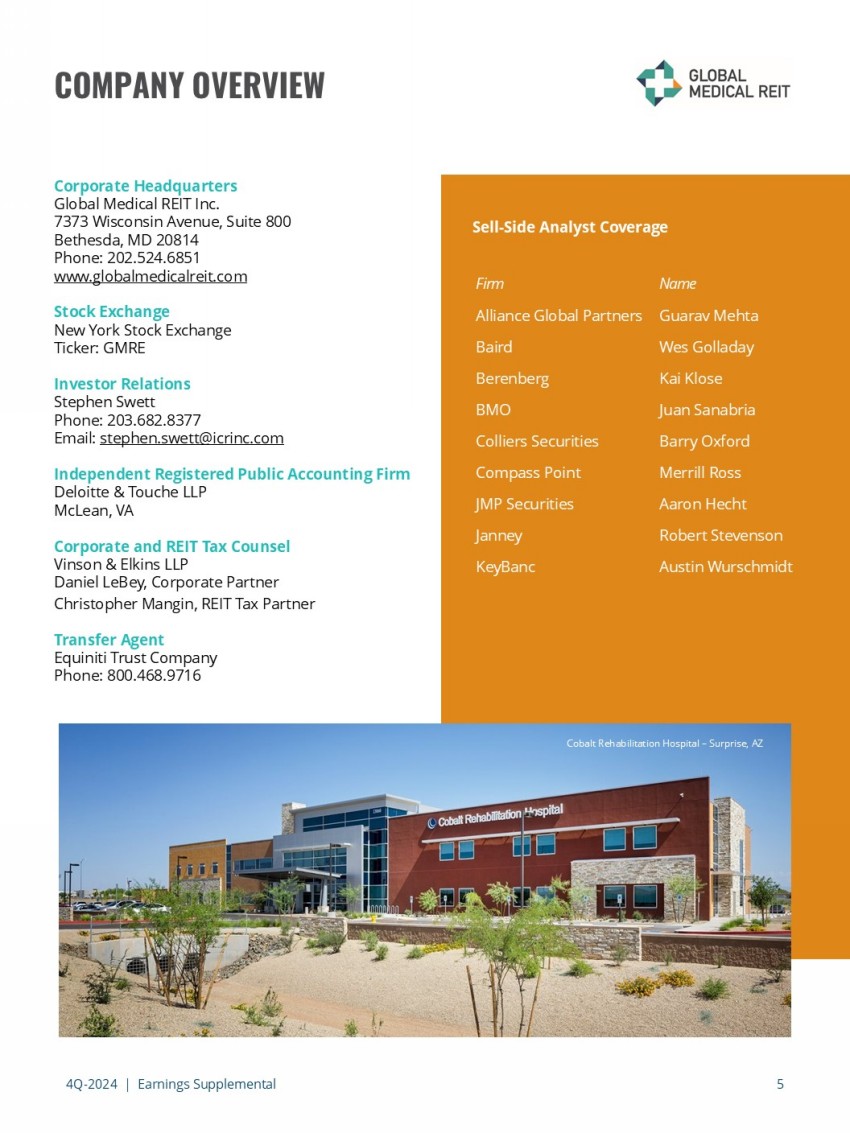
4Q - 2024 | Earnings Supplemental 5 COMPANY OVERVIEW Corporate Headquarters Global Medical REIT Inc. 7373 Wisconsin Avenue, Suite 800 Bethesda, MD 20814 Phone: 202.524.6851 www.globalmedicalreit.com Stock Exchange New York Stock Exchange Ticker: GMRE Investor Relations Stephen Swett Phone: 203.682.8377 Email: stephen.swett@icrinc.com Independent Registered Public Accounting Firm Deloitte & Touche LLP McLean, VA Corporate and REIT Tax Counsel Vinson & Elkins LLP Daniel LeBey, Corporate Partner Christopher Mangin, REIT Tax Partner Transfer Agent Equiniti Trust Company Phone: 800.468.9716 Cobalt Rehabilitation Hospital – Surprise, AZ Name Firm Guarav Mehta Alliance Global Partners Wes Golladay Baird Kai Klose Berenberg Juan Sanabria BMO Barry Oxford Colliers Securities Merrill Ross Compass Point Aaron Hecht JMP Securities Robert Stevenson Janney Austin Wurschmidt KeyBanc Sell - Side Analyst Coverage

4Q - 2024 | Earnings Supplemental *See page 20 for the Company’s Non - GAAP reconciliations 6 (unaudited, and in thousands, except per share and unit amounts) SELECT QUARTERLY FINANCIAL DATA December 31,September 30, June 30, March 31, December 31, As of Period End (Unless Otherwise Specified) 2024 2024 2024 2024 2023 Market capitalization (common and OP) $533,568 $684,256 $615,915 $593,521 $752,680 Market price per share – common $7.72 $9.91 $9.08 $8.75 $11.10 Common shares and OP units outstanding 69,115 69,047 67,832 67,831 67,809 Preferred equity $74,959 $74,959 $74,959 $74,959 $74,959 Common equity $459,167 $467,593 $481,480 $500,011 $508,625 Noncontrolling interest $21,790 $22,054 $21,933 $22,128 $22,230 Total equity $555,916 $564,606 $578,372 $597,098 $605,814 Investment in real estate, gross $1,450,916 $1,436,881 $1,415,288 $1,428,161 $1,426,969 Borrowings: Credit Facility - revolver, gross $136,600 $119,800 $105,000 $98,600 $92,400 Credit Facility - term loan A, gross $350,000 $350,000 $350,000 $350,000 $350,000 Credit Facility - term loan B, gross $150,000 $150,000 $150,000 $150,000 $150,000 Notes payable, gross $14,421 $14,524 $14,678 $25,735 $25,965 Weighted average interest rate (for quarter) 3.94% 3.97% 3.93% 3.90% 3.88% Debt covenants: Leverage ratio (as defined in Credit Facility) 44.8% 44.1% 43.8% 44.0% 43.6% Fixed charge coverage ratio for quarter (1.50x minimum) 2.70 2.80 2.82 2.87 2.76 December 31,September 30, June 30, March 31, December 31, Three Months Ended 2024 2024 2024 2024 2023 Rental revenue $34,953 $34,175 $34,214 $35,069 $32,931 Interest expense $7,571 $7,236 $6,992 $6,890 $6,984 General and administrative expenses $7,707 $4,381 $4,589 $4,446 $4,220 Depreciation and amortization expense $13,638 $13,642 $13,993 $14,084 $14,245 Operating expenses $7,196 $7,437 $7,236 $7,384 $6,094 Total expenses $36,267 $32,696 $32,810 $32,804 $31,543 Gain (loss) on sale of investment properties $5,765 $1,823 $(3,383) - - Impairment of investment property $(1,696) - - - - Equity loss from unconsolidated joint venture $(20) - - - - Loss on extinguishment of debt - - - - $(868) Net income (loss) attributable to common stockholders $1,374 $1,791 $(3,147) $794 $(840) Net income (loss) per share $0.02 $0.03 $(0.05) $0.01 $(0.01) Wtd. avg. basic and diluted common shares (GAAP) 66,838 65,737 65,588 65,573 65,565 FFO attributable to common stockholders and noncontrolling interest* $11,051 $13,731 $13,945 $14,883 $13,307 FFO attributable to common stockholders and noncontrolling interest per share and unit* $0.15 $0.19 $0.20 $0.21 $0.19 AFFO attributable to common stockholders and noncontrolling interest* $15,779 $15,345 $15,713 $16,529 $15,945 AFFO attributable to common stockholders and noncontrolling interest per share and unit* $0.22 $0.22 $0.22 $0.23 $0.23 Wtd. avg. common shares, OP and LTIP units 72,212 71,151 70,982 70,757 70,565

4Q - 2024 | Earnings Supplemental 7 BUSINESS SUMMARY FOURTH QUARTER 2024 OPERATING SUMMARY • Net income attributable to common stockholders was $1.4 million, or $0.02 per diluted share, as compared to net loss attributable to common stockholders of $0.8 million, or $0.01 per diluted share, in the comparable prior year period. o The results for the fourth quarter of 2024 included an aggregate gain on sale of investment properties of $5.8 million, a charge for $3.2 million in costs related to CEO severance and transition, and a non - cash impairment charge of $1.7 million on one of our properties, while the fourth quarter 2023 results included a loss on the extinguishment of debt of $0.9 million. • Funds from Operations attributable to common stockholders and noncontrolling interest (“FFO”) of $11.1 million, or $0.15 per share and unit, as compared to $13.3 million, or $0.19 per share and unit, in the comparable prior year period. • Adjusted Funds from Operations attributable to common stockholders and noncontrolling interest (“AFFO”) of $15.8 million, or $0.22 per share and unit, as compared to $15.9 million, or $0.23 per share and unit, in the comparable prior year period. INVESTMENT AND PORTFOLIO ACTIVITY • During the fourth quarter of 2024, the Company completed the acquisition of the remaining 10 properties in the 15 - property portfolio encompassing 159,726 leasable square feet for an aggregate purchase price of $49.5 million and annualized base rent of $3.9 million. In aggregate the 15 - property portfolio had a purchase price of $80.3 million with 254,220 leasable square feet and annualized base rent of $6.4 million. • As previously announced, the Company entered into a purchase agreement to acquire a five - property portfolio for an aggregate purchase price of $69.6 million at a cap rate of 9.0%. As of February 26, 2025, the Company completed the acquisition of three of the five properties for an aggregate purchase price of $31.5 million. The Company expects to complete the acquisition of the remaining two properties during the second quarter of 2025. The Company’s obligation to close the remainder of this acquisition is subject to certain customary terms and conditions. Accordingly, there is no assurance that the Company will close the remainder of this acquisition on a timely basis or at all. • During the fourth quarter of 2024, the Company entered into a joint venture (the “Joint Venture”) with Heitman Capital Management LLC (“Heitman”) and sold two properties to the Joint Venture, generating $35.2 million of gross proceeds, and completed the disposition of two additional properties generating gross proceeds of $5.3 million, resulting in an aggregate gain from the four dispositions of $5.8 million. • For the full year 2024, the Company completed seven dispositions, including the two properties sold to the Joint Venture, generating aggregate gross proceeds of $60.7 million, resulting in an aggregate gain on sale of $4.2 million. The weighted average cap rate of the Company’s 2024 dispositions was 9.0%. CAPITAL MARKETS AND DEBT ACTIVITY • Leverage was 44.8 % as of December 31, 2024. • As of February 26, 2025, we had unutilized borrowing capacity under the Credit Facility of $219 million. • During the year ended December 31, 2024, the Company issued 1.2 million shares of its common stock through its ATM program at an average offering price of $9.95 per share, generating gross proceeds of $12.0 million.

4Q - 2024 | Earnings Supplemental *See page 21 for disclosures regarding the Company’s Annualized Base Rent (ABR) and Capitalization Rate (Cap Rate) 8 ACQUISITIONS / DISPOSITIONS (as of February 26, 2025) Acquisitions Under Contract As previously announced, the Company entered into a purchase agreement to acquire a five - property portfolio for an aggregate purchase price of $69.6 million at a cap rate of 9.0%. As of February 26, 2025, the Company completed the acquisition of thre e o f the five properties for an aggregate purchase price of $31.5 million (see the table above). The Company expects to complete the acquisition of the remaining two properties during the second quarter of 2025. The Company’s obligation to close the remainde r o f this acquisition is subject to certain customary terms and conditions. Accordingly, there is no assurance that the Company wi ll close the remainder of this acquisition on a timely basis or at all. Pediatrics Plus – Russellville, AR Dispositions During the fourth quarter of 2024, the Company entered into the Joint Venture with Heitman and sold two properties to the Joi nt Venture, generating $35.2 million of gross proceeds, and completed the disposition of two additional properties generating gr oss proceeds of $5.3 million, resulting in an aggregate gain from the four dispositions of $5.8 million. For the full year 2024, the Company completed seven dispositions, including the two properties sold to the Joint Venture, gen era ting aggregate gross proceeds of $60.7 million, resulting in an aggregate gain on sale of $4.2 million. The weighted average cap r ate of the Company’s 2024 dispositions was 9.0%. Acquisition Date Property City, State Leasable Square Feet Contractual Purchase Price (in thousands) Annualized Base Rent* (in thousands) Capitalization Rate* 7/11/2024 Trinity Health Clinic and ASC Minot, ND 24,795 $9,060 $717 7.9% 7/11/2024 Henry Ford OptimEyes Vision Center Clinton Township, MI 20,548 6,773 554 8.2% 7/11/2024 Henry Ford OptimEyes Vision Center Westland, MI 20,000 5,271 468 8.9% 7/11/2024 Family Medicine Cerritos Cerritos, CA 11,551 5,200 379 7.3% 7/11/2024 Spartanburg County Clinic Spartanburg, SC 17,600 4,508 364 8.1% Third Quarter Total/Weighted Average: 94,494 $30,812 $2,482 8.1% 10/2/2024 Pediatrics Plus Conway, AR 40,108 $11,150 $891 8.0% 10/2/2024 Pediatrics Plus Little Rock, AR 31,700 8,700 705 8.1% 10/2/2024 Pediatrics Plus Russellville, AR 22,000 5,800 477 8.2% 10/2/2024 EHA Surgery Center Sarasota, FL 17,770 5,950 444 7.5% 10/2/2024 The Eye Associates Venice, FL 10,563 4,600 334 7.3% 10/2/2024 The Eye Associates Ruskin, FL 5,620 1,820 144 7.9% 10/2/2024 The Eye Associates Bradenton, FL 6,048 2,000 155 7.8% 10/2/2024 The Eye Associates Bradenton, FL 7,497 2,650 224 8.5% 10/2/2024 The Eye Associates Bradenton, FL 4,317 1,500 129 8.6% 10/2/2024 The Eye Associates ASC Bradenton, FL 14,103 5,350 421 7.9% Fourth Quarter Total/Weighted Average: 159,726 $49,520 $3,924 7.9% 2024 Total/Weighted Average: 254,220 $80,332 $6,407 8.0% 2/7/2025 St. Joseph's Medical Plaza Tucson, AZ 95,598 $16,000 $1,223 7.6% 2/7/2025 St. Mary's Medical Plaza Tucson, AZ 66,590 10,500 976 9.3% 2/7/2025 Slippery Rock MOB Slippery Rock, PA 26,686 5,000 574 11.5% 2025 Total/Weighted Average To-Date: 188,874 $31,500 $2,773 8.8% 2024 Acquisitions 2025 Acquisitions Completed To-Date
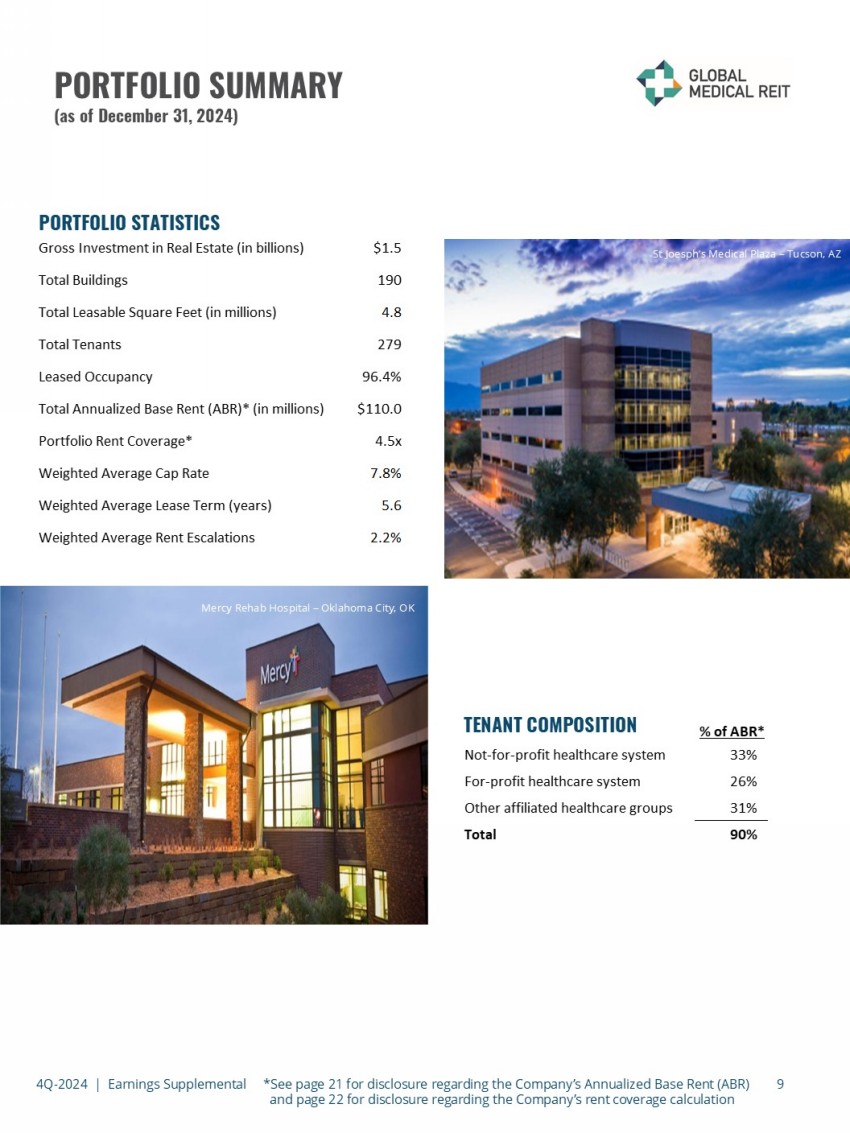
4Q - 2024 | Earnings Supplemental *See page 21 for disclosure regarding the Company’s Annualized Base Rent (ABR) and page 22 for disclosure regarding the Company’s rent coverage calculation 9 PORTFOLIO SUMMARY (as of December 31, 2024) PORTFOLIO STATISTICS TENANT COMPOSITION Texas Digestive Disease Consultants – Ft. Worth, TX Indiana Eye Clinic – Greenwood, IN Mercy Rehab Hospital – Oklahoma City, OK Gross Investment in Real Estate (in billions) $1.5 Total Buildings 190 Total Leasable Square Feet (in millions) 4.8 Total Tenants 279 Leased Occupancy 96.4% Total Annualized Base Rent (ABR)* (in millions) $110.0 Portfolio Rent Coverage* 4.5x Weighted Average Cap Rate 7.8% Weighted Average Lease Term (years) 5.6 Weighted Average Rent Escalations 2.2% St Joesph’s Medical Plaza – Tucson, AZ % of ABR* Not-for-profit healthcare system 33% For-profit healthcare system 26% Other affiliated healthcare groups 31% Total 90%

10 PORTFOLIO SUMMARY (as of December 31, 2024) LEASE TYPE RENT COVERAGE* 1) Includes surgical hospitals, long - term acute care hospitals (LTACH) and behavioral hospitals. cCare – San Marcos, CA Hialeah Medical Plaza – Hialeah, FL Asset Type % of ABR* Ratio MOB 15% 5.7x MOB/ASC 12% 3.9x Inpatient Rehab (IRF) 19% 4.1x Specialty Hospital (1) 3% 3.5x Total/Weighted Average 49% 4.5x Tenants Not Included Large/Credit Rated Tenants 32% N/A Not Reported 19% N/A % of ABR* Triple-net 55% Absolute-net 37% Modified gross 5% Gross 3% Total 100% 4Q - 2024 | Earnings Supplemental *See page 21 for disclosure regarding the Company’s Annualized Base Rent (ABR) and page 22 for disclosure regarding the Company’s rent coverage calculation

11 PORTFOLIO SUMMARY (as of December 31, 2024) 4Q - 2024 | Earnings Supplemental *See page 21 for disclosure regarding the Company’s Annualized Base Rent (ABR) Leasable % of Total Leasable % of Total Year # of Leases Square Feet Square Feet ABR* ABR* 2025 63 507,602 10.7% $9,860 9.0% 2026 72 497,259 10.5% $10,559 9.6% 2027 50 470,171 9.9% $12,204 11.1% 2028 36 261,753 5.5% $7,283 6.6% 2029 60 769,921 16.2% $19,077 17.3% 2030 39 492,601 10.4% $12,208 11.1% 2031 22 377,993 7.9% $7,830 7.1% 2032 6 64,510 1.4% $2,056 1.9% 2033 18 179,954 3.8% $4,767 4.3% 2034 12 234,770 4.9% $7,343 6.7% Thereafter 25 729,389 15.2% $16,815 15.3% Total Leased SF 403 4,585,923 96.4% $110,002 100.0% Current Vacancy 170,185 3.6% Total Leasable SF 4,756,108 100.0% Lease Expiration Schedule (ABR in thousands)

12 KEY TENANTS Asset Type % of Portfolio ABR* LifePoint Health operates 60 community hospital campuses, more than 60 rehabilitation and behavioral healthhospitalsandmorethan250additionalsitesof care, including managed acute rehabilitation units, outpatient centers and post-acute care facilities. IRF 7.2% Encompass Health (NYSE: EHC) is the largest owner and operator of inpatient rehabilitation hospitals in the United States, with a national footprint that includes more than 150 hospitals in 36 states and Puerto Rico. IRF 6.7% Memorial Health System is a not-for-profit integrated health system that operates the 199-bed Marietta MemorialHospitalandtwocriticalaccesshospitals,nine outpatient care centers, 26 medical staff offices, and clinical care delivery locations in southeast Ohio. MOB 5.4% TeamHealthprovidesstaffing,administrativesupportand management across the full continuum of care, from hospital-based practices to post-acute care and ambulatory centers. MOB 3.0% CarrusHealthprovidespatientswithhealthcarefacilities acrossdifferentlocationsinTexasandOklahoma,witha focusondevelopingandmanaginglong-termacutecare hospitals, rehabilitation hospitals, Hospice care, and nursing homes. IRF 2.8% 4Q - 2024 | Earnings Supplemental *See page 21 for disclosure regarding the Company’s Annualized Base Rent (ABR)

4Q - 2024 | Earnings Supplemental 13 DEBT AND HEDGING SUMMARY (1) The SOFR spread consists of a borrowing spread of 1.35% based on the Company’s overall leverage ratio (as defined in the cred it facility agreement) being between 40% and 45% at the end of the fourth quarter of 2024, plus a SOFR credit spread adjustment of 0.10%. Pursuant t o t he credit facility agreement, at each reporting date the credit spread will increase or decrease based on the Company’s overall leverage ratio. The revolver has two Company - controlled, six - month extension options. If the Company exercises those options, the maturity date of the revolver would be August 2027. (2) Rates reflect the effect of the Company’s interest rate swaps. See table on the next page for a detail of the Company’s inte res t rate swaps. Consists of the fixed base rate plus a borrowing spread of 1.30% based on a leverage ratio of between 40% and 45 % under our credit facility agreement, plus a SOFR credit spread adjustment of 0.10%, and is calculated using 365/360 method . Debt Statistics As of December 31, 2024 Total Gross Debt (in thousands) $651,021 Fixed Rate Debt-to-Total Debt 79% Weighted Average Interest Rate 3.75% Weighted Average Maturity (Years) 2.0 years Leverage Ratio 44.8% Fixed Charge Coverage Ratio 2.70 Debt Balance Rate Type Interest Rate Maturity (in thousands) Unsecured Credit Facility: Revolver $136,600 Floating SOFR + 1.45% (1) August-26 (1) Term Loan A $350,000 Fixed 2.80% (2) May-26 Term Loan B $150,000 Fixed 4.00% (2) February-28 Other: Rosedale Loan $13,158 Fixed 3.85% July-25 Toledo Loan $1,263 Fixed 5.00% July-33 Total/Weighted Average: $651,021 3.75% 2.0 years Debt Detail (as of December 31, 2024)

4Q - 2024 | Earnings Supplemental 14 DEBT AND HEDGING SUMMARY (1) Consists of a total of nine interest rates swaps whereby we pay the fixed base rate listed in the table above and receive the on e - month SOFR, which is the reference rate for the outstanding loans in our credit facility. (2) Consists of the fixed base rate plus a borrowing spread of 1.30% based on a leverage ratio of between 40% and 45% under our c red it facility agreement, plus a SFOR credit spread adjustment of 0.10%, and is calculated using 365/360 method. Citrus Valley Medical Associates – Corona, CA Notional Term Term Loan A - $350,000 Current – 4/2026 Fixed base rate: 1.36% Effective interest rate: 2.80% (2) Term Loan B - $150,000 Current – 2/2028 Fixed base rate: 2.54% Effective interest rate: 4.00% (2) Interest Rate Swap Detail (as of December 31, 2024) (1) Weighted Average Interest Rates
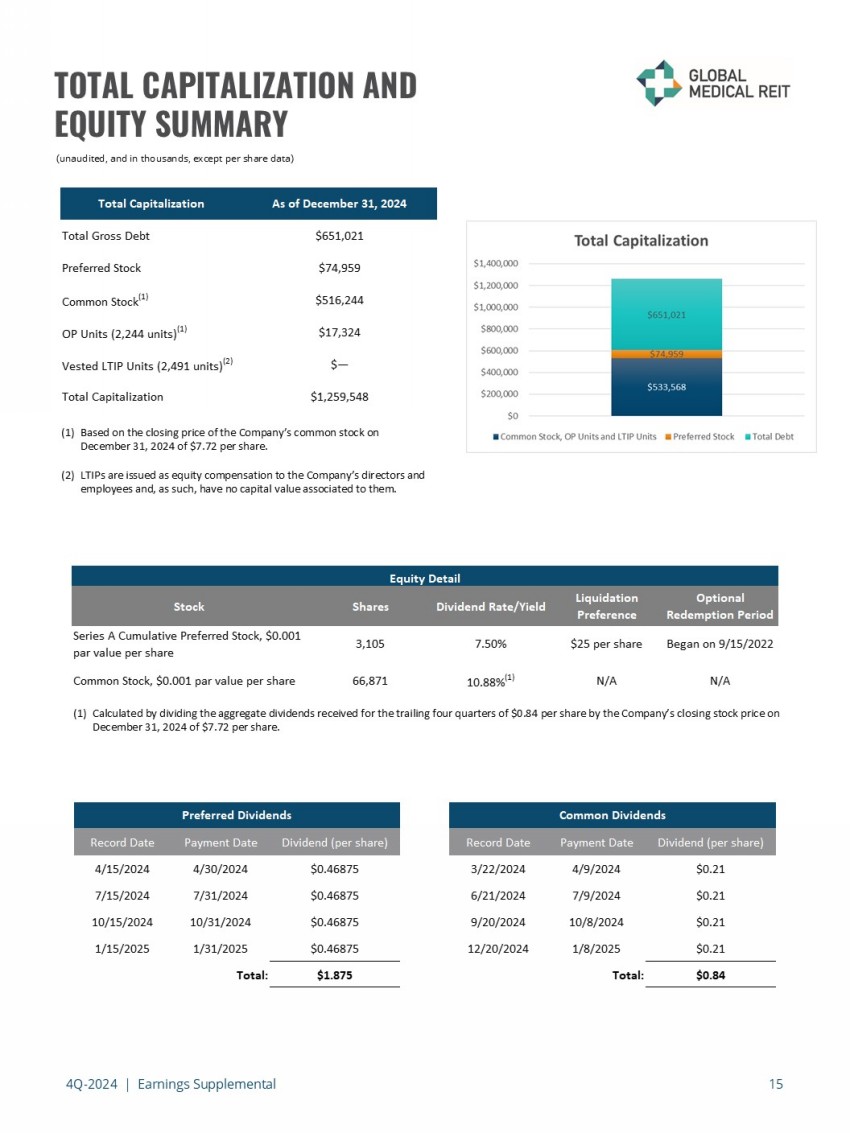
4Q - 2024 | Earnings Supplemental 15 TOTAL CAPITALIZATION AND EQUITY SUMMARY (unaudited, and in thousands, except per share data) (1) Based on the closing price of the Company’s common stock on December 31, 2024 of $7.72 per share. (2) LTIPs are issued as equity compensation to the Company’s directors and employees and, as such, have no capital value associated to them. (1) Calculated by dividing the aggregate dividends received for the trailing four quarters of $0.84 per share by the Company’s cl osi ng stock price on December 31, 2024 of $7.72 per share. Record Date Payment Date Dividend (per share) Record Date Payment Date Dividend (per share) 4/15/2024 4/30/2024 $0.46875 3/22/2024 4/9/2024 $0.21 7/15/2024 7/31/2024 $0.46875 6/21/2024 7/9/2024 $0.21 10/15/2024 10/31/2024 $0.46875 9/20/2024 10/8/2024 $0.21 1/15/2025 1/31/2025 $0.46875 12/20/2024 1/8/2025 $0.21 Total: $1.875 Total: $0.84 Preferred Dividends Common Dividends Stock Shares Dividend Rate/Yield Liquidation Preference Optional Redemption Period Series A Cumulative Preferred Stock, $0.001 par value per share 3,105 7.50% $25 per share Began on 9/15/2022 Common Stock, $0.001 par value per share 66,871 10.88% (1) N/A N/A Equity Detail Total Capitalization As of December 31, 2024 Total Gross Debt $651,021 Preferred Stock $74,959 Common Stock (1) $516,244 OP Units (2,244 units) (1) $17,324 Vested LTIP Units (2,491 units) (2) $— Total Capitalization $1,259,548

4Q - 2024 | Earnings Supplemental 16 SUSTAINABILITY SUMMARY We take climate change, and the risks associated with climate change, seriously — both physical and transitional . We utilized Moody’s 427 Risk Management platform to help us identify and measure the potential climate risk exposure for our properties . The analysis summarizes the climate change - related risks, groups them by onset potential, and identifies opportunities for risk mitigation . We utilize the ENERGY STAR platform to collect and track our energy consumption data and have identified properties that are strong candidates for the ENERGY STAR certificate program . In 2022 , we earned an ENERGY STAR certification for our Select Medical facility in Omaha, Nebraska, which scored 99 , and for our Brown Clinic facility in Watertown, South Dakota, which attained a score of 84 . In 2023 , our facilities located in Dumfries, Virginia, Hialeah, Florida, and Dallas, Texas joined those in Omaha and Watertown as ENERGY STAR certificate recipients .. In 2024 , properties in Fort Worth, Texas and two in Orlando, Florida were added to the list of facilities that receive certification . We prioritize energy efficiency and sustainability when evaluating investment opportunities . We utilize utility and energy audits that are performed by third - party engineering consultants during the due diligence phase of our acquisitions . The energy consumption data that we collect is used to assess our facilities’ carbon emission levels . We improved our overall GRESB score to 57 for 2024 . The scores reflect activity for the previous year . Since we began receiving a GRESB Assessment score in 2021 , we have improved our score by 15 points . In the 2023 GRESB public disclosure assessment, GMRE ranked 4 th of 10 in peer group . Fostering a resilient posture is essential to our business and we continue to explore methods to assess our climate - related risks and mitigate the impacts . For example, according to the 2023 GRESB assessment report for the risk management sector, GMRE received a score of 4 . 25 / 5 while the benchmark score was 3 . 97 / 5 . In the performance sector of the Risk Assessment, GMRE received a score of 6 . 46 / 9 while the benchmark average was 5 . 66 / 9 . In the second quarter of 2024 we published our 2023 corporate sustainability report, which can be found at https : //www . globalmedicalreit . com/about/corporate - responsibility/ . ENVIRONMENTAL SOCIAL Our Board continues to lead our social and governance efforts . With its diverse composition, our Board is a strong example of inclusive leadership with a composition of 43 % women . • Our commitment to employee engagement remains a high - priority, as we continue to make accommodations for health, safety, and work - life balance . With this commitment in mind, and with the compensation committee of the Board’s leadership, we conducted an employee survey that covered a comprehensive range of subjects related to our employees’ attitudes about our work culture and employee engagement . GOVERNANCE • The Board consists of a majority of independent directors and all standing Board committees are comprised of 100 % independent directors . • The Board formed a standing ESG committee that oversees the Company’s environmental, social, governance and resilience efforts . The 2025 appointment of Henry Cole as Chairman of the ESG Committee, with his background as an economist and futurist, continues to position the Company well for the challenges ahead . • The Company maintains comprehensive cyber - security incident prevention and response protocols which are overseen by the Audit Committee . • The Company has adopted an executive incentive compensation clawback policy . • GMRE is a member of the National Association of Corporate Directors .

4Q - 2024 | Earnings Supplemental 17 CONDENSED CONSOLIDATED STATEMENTS OF OPERATIONS (unaudited, and in thousands, except per share amounts) 2024 2023 2024 2023 Revenue Rental revenue 34,953$ 32,931$ 138,410$ 140,934$ Other income 204 31 370 115 Total revenue 35,157 32,962 138,780 141,049 Expenses General and administrative 7,707 4,220 21,123 16,853 Operating expenses 7,196 6,094 29,251 28,082 Depreciation expense 10,193 10,204 40,427 41,266 Amortization expense 3,445 4,041 14,932 16,869 Interest expense 7,571 6,984 28,689 30,893 Transaction expense 155 - 155 44 Total expenses 36,267 31,543 134,577 134,007 Income before other income (expense) (1,110) 1,419 4,203 7,042 Gain on sale of investment properties 5,765 - 4,205 15,560 Impairment of investment property (1,696) - (1,696) - Equity loss from unconsolidated joint venture (20) - (20) - Loss on extinguishment of debt - (868) - (868) Net income 2,939$ 551$ 6,692$ 21,734$ Less: Preferred stock dividends (1,455) (1,455) (5,822) (5,822) Less: Net (income) loss attributable to noncontrolling interest (110) 64 (59) (1,122) Net income (loss) attributable to common stockholders 1,374$ (840)$ 811$ 14,790$ Net income (loss) attributable to common stockholders per share - basic and diluted 0.02$ (0.01)$ 0.01$ 0.23$ Weighted average shares outstanding – basic and diluted 66,838 65,565 65,936 65,550 Three Months Ended December 31, Twelve Months Ended December 31,
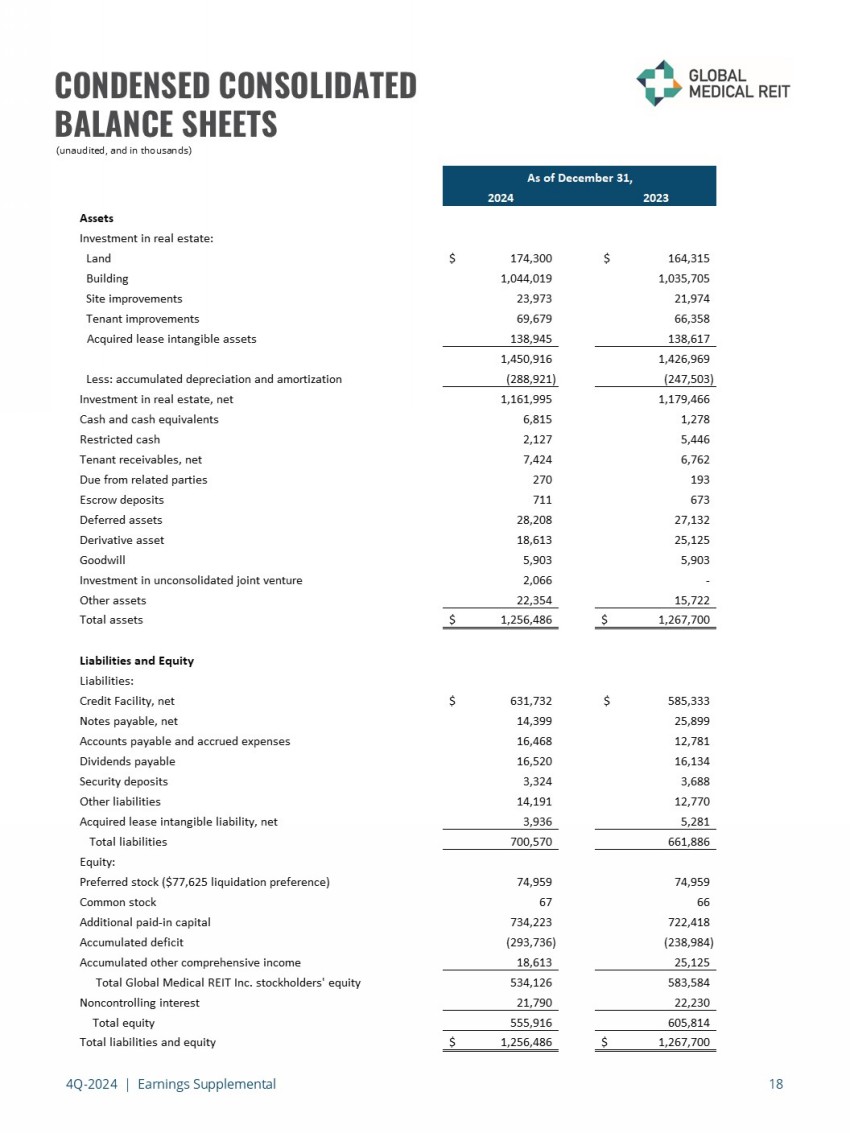
4Q - 2024 | Earnings Supplemental 18 CONDENSED CONSOLIDATED BALANCE SHEETS (unaudited, and in thousands) 2024 2023 Assets Investment in real estate: Land 174,300$ 164,315$ Building 1,044,019 1,035,705 Site improvements 23,973 21,974 Tenant improvements 69,679 66,358 Acquired lease intangible assets 138,945 138,617 1,450,916 1,426,969 Less: accumulated depreciation and amortization (288,921) (247,503) Investment in real estate, net 1,161,995 1,179,466 Cash and cash equivalents 6,815 1,278 Restricted cash 2,127 5,446 Tenant receivables, net 7,424 6,762 Due from related parties 270 193 Escrow deposits 711 673 Deferred assets 28,208 27,132 Derivative asset 18,613 25,125 Goodwill 5,903 5,903 Investment in unconsolidated joint venture 2,066 - Other assets 22,354 15,722 Total assets 1,256,486$ 1,267,700$ Liabilities and Equity Liabilities: Credit Facility, net 631,732$ 585,333$ Notes payable, net 14,399 25,899 Accounts payable and accrued expenses 16,468 12,781 Dividends payable 16,520 16,134 Security deposits 3,324 3,688 Other liabilities 14,191 12,770 Acquired lease intangible liability, net 3,936 5,281 Total liabilities 700,570 661,886 Equity: Preferred stock ($77,625 liquidation preference) 74,959 74,959 Common stock 67 66 Additional paid-in capital 734,223 722,418 Accumulated deficit (293,736) (238,984) Accumulated other comprehensive income 18,613 25,125 Total Global Medical REIT Inc. stockholders' equity 534,126 583,584 Noncontrolling interest 21,790 22,230 Total equity 555,916 605,814 Total liabilities and equity 1,256,486$ 1,267,700$ As of December 31,
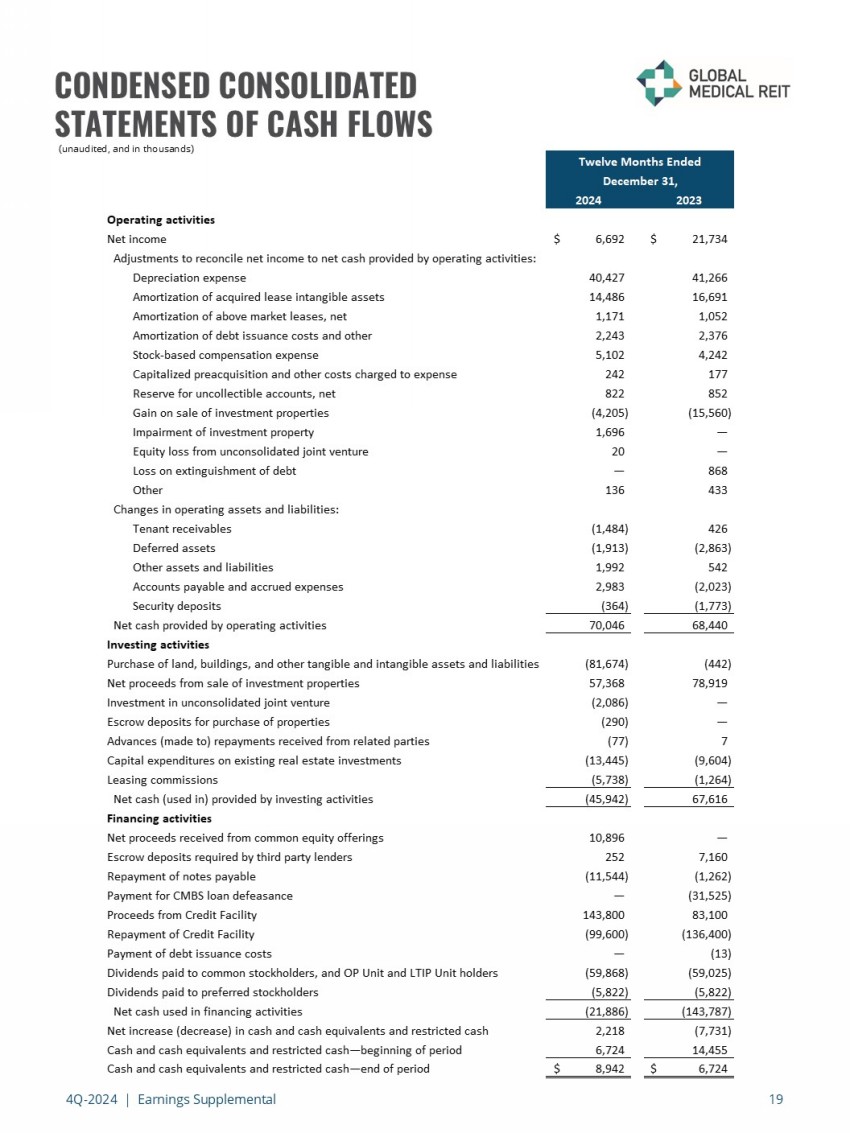
4Q - 2024 | Earnings Supplemental 19 CONDENSED CONSOLIDATED STATEMENTS OF CASH FLOWS (unaudited, and in thousands) 2024 2023 Operating activities Net income 6,692$ 21,734$ Adjustments to reconcile net income to net cash provided by operating activities: Depreciation expense 40,427 41,266 Amortization of acquired lease intangible assets 14,486 16,691 Amortization of above market leases, net 1,171 1,052 Amortization of debt issuance costs and other 2,243 2,376 Stock-based compensation expense 5,102 4,242 Capitalized preacquisition and other costs charged to expense 242 177 Reserve for uncollectible accounts, net 822 852 Gain on sale of investment properties (4,205) (15,560) Impairment of investment property 1,696 — Equity loss from unconsolidated joint venture 20 — Loss on extinguishment of debt — 868 Other 136 433 Changes in operating assets and liabilities: Tenant receivables (1,484) 426 Deferred assets (1,913) (2,863) Other assets and liabilities 1,992 542 Accounts payable and accrued expenses 2,983 (2,023) Security deposits (364) (1,773) Net cash provided by operating activities 70,046 68,440 Investing activities Purchase of land, buildings, and other tangible and intangible assets and liabilities (81,674) (442) Net proceeds from sale of investment properties 57,368 78,919 Investment in unconsolidated joint venture (2,086) — Escrow deposits for purchase of properties (290) — Advances (made to) repayments received from related parties (77) 7 Capital expenditures on existing real estate investments (13,445) (9,604) Leasing commissions (5,738) (1,264) Net cash (used in) provided by investing activities (45,942) 67,616 Financing activities Net proceeds received from common equity offerings 10,896 — Escrow deposits required by third party lenders 252 7,160 Repayment of notes payable (11,544) (1,262) Payment for CMBS loan defeasance — (31,525) Proceeds from Credit Facility 143,800 83,100 Repayment of Credit Facility (99,600) (136,400) Payment of debt issuance costs — (13) Dividends paid to common stockholders, and OP Unit and LTIP Unit holders (59,868) (59,025) Dividends paid to preferred stockholders (5,822) (5,822) Net cash used in financing activities (21,886) (143,787) Net increase (decrease) in cash and cash equivalents and restricted cash 2,218 (7,731) Cash and cash equivalents and restricted cash—beginning of period 6,724 14,455 Cash and cash equivalents and restricted cash—end of period 8,942$ 6,724$ Twelve Months Ended December 31,

4Q - 2024 | Earnings Supplemental *See pages 21 and 22 for definitions of FFO, AFFO, EBITDAre and Adjusted EBITDAre 20 NON - GAAP RECONCILIATIONS (unaudited, and in thousands, except per share and unit amounts) December 31, September 30, June 30, March 31, December 31, FFO and AFFO 2024 2024 2024 2024 2023 Net income (loss) 2,939$ 3,391$ (1,952)$ 2,314$ 551$ Less: Preferred stock dividends (1,455) (1,455) (1,455) (1,455) (1,455) Depreciation and amortization expense 13,616 13,618 13,969 14,024 14,211 (Gain) loss on sale of investment properties (5,765) (1,823) 3,383 — — Impairment of investment property 1,696 — — — — Equity loss from unconsolidated joint venture 20 — — — — FFO attributable to common stockholders and noncontrolling interest $ 11,051 $ 13,731 $ 13,945 $ 14,883 $ 13,307 Loss on extinguishment of debt — — — — 868 Amortization of above market leases, net 389 282 249 251 240 Straight line deferred rental revenue (827) (501) (363) (400) (273) Stock-based compensation expense 1,276 1,274 1,319 1,233 1,222 Amortization of debt issuance costs and other 559 559 563 562 581 Severance and transition related expense 3,176 — — — — Transaction expense 155 — — — — AFFO attributable to common stockholders and noncontrolling interest $ 15,779 $ 15,345 $ 15,713 $ 16,529 $ 15,945 Net income (loss) attributable to common stockholders per share – basic and diluted 0.02$ 0.03$ (0.05)$ 0.01$ (0.01)$ FFO attributable to common stockholders and noncontrolling interest per share and unit 0.15$ 0.19$ 0.20$ 0.21$ 0.19$ AFFO attributable to common stockholders and noncontrolling interest per share and unit 0.22$ 0.22$ 0.22$ 0.23$ 0.23$ Wtd Average Common Shares, OP and LTIP Units outstanding: Common shares 66,838 65,737 65,588 65,573 65,565 OP units 2,244 2,244 2,244 2,244 2,244 LTIP units 3,130 3,170 3,150 2,940 2,756 Wtd Average Common Shares, OP and LTIP Units Outstanding - basic and diluted 72,212 71,151 70,982 70,757 70,565 December 31, September 30, June 30, March 31, December 31, EBITDAre and Adjusted EBITDAre 2024 2024 2024 2024 2023 Net income (loss) 2,939$ 3,391$ (1,952)$ 2,314$ 551$ Interest expense 7,571 7,236 6,992 6,890 6,984 Depreciation and amortization expense 13,638 13,642 13,993 14,084 14,245 (Gain) loss on sale of investment properties (5,765) (1,823) 3,383 — — Impairment of investment property 1,696 — — — — Equity loss from unconsolidated joint venture 20 — — — — EBITDAre $ 20,099 $ 22,446 $ 22,416 $ 23,288 $ 21,780 Loss on extinguishment of debt — — — — 868 Stock-based compensation expense 1,276 1,274 1,319 1,233 1,222 Amortization of above market leases, net 389 282 249 251 240 Severance and transition related expense 3,176 — — — — Transaction expense 155 — — — — Adjusted EBITDAre $ 25,095 $ 24,002 $ 23,984 $ 24,772 $ 24,110 Three Months Ended Three Months Ended

4Q - 2024 | Earnings Supplemental 21 REPORTING DEFINITIONS AND OTHER DISCLOSURES Annualized Base Rent Annualized base rent represents monthly base rent for December 2024 (or, for recent acquisitions, monthly base rent for the month of acquisition), multiplied by 12 (or base rent net of annualized expenses for properties with gross leases). Accordingly, this methodology produces an annualized amount as of a point in time but does not take into account future ( i ) contractual rental rate increases, (ii) leasing activity or (iii) lease expirations. Additionally, leases that are accounte d f or on a cash - collected basis are not included in annualized base rent. Capitalization Rate The capitalization rate (“Cap Rate”) for an acquisition is calculated by dividing current Annualized Base Rent by contractual purchase price. For the portfolio cap rate, certain adjustments, including for subsequent capital invested, are made to the contractual purchase price. Earnings Before Interest, Taxes, Depreciation and Amortization for Real Estate (“EBITDAre” and “Adjusted EBITDAre”) We calculate EBITDAre in accordance with standards established by NAREIT and define EBITDAre as net income or loss computed in accordance with GAAP plus depreciation and amortization, interest expense, gain or loss on the sale of investment properties, property impairment losses, and adjustments for unconsolidated partnerships and joint ventures, as applicable. We define Adjusted EBITDAre as EBITDAre plus loss on extinguishment of debt, non - cash stock compensation expense, non - cash intangible amortization related to above and below market leases, severance and transition related expense, transaction expense, and other normalizing items. Management considers EBITDAre and Adjusted EBITDAre important measures because they provide additional information to allow management, investors, and our current and potential creditors to evaluate and compare our core operating results and our ability to service debt. Funds from Operations Attributable to Common Stockholders and Noncontrolling Interest and Adjusted Funds from Operations Attributable to Common Stockholders and Noncontrolling Interest Funds from operations attributable to common stockholders and noncontrolling interest (“FFO”) and adjusted funds from operations attributable to common stockholders and noncontrolling interest (“AFFO”) are non - GAAP financial measures within the meaning of the rules of the SEC. The Company considers FFO and AFFO to be important supplemental measures of its operating performance and believes FFO is frequently used by securities analysts, investors, and other interested parties in the evaluation of REITs, many of which present FFO when reporting their results. In accordance with the National Association of Real Estate Investment Trusts’ (“NAREIT”) definition, FFO means net income or loss computed in accordance with GAAP before noncontrolling interests of holders of OP units and LTIP units, excluding gains (or losses) from sales of property and extraordinary items, property impairment losses, less preferred stock dividends, plus real estate - related depreciation and amortization (excluding amortization of debt issuance costs and the amortization of above and below market leases), and after adjustments for unconsolidated partnerships and joint ventures. Because FFO excludes real estate - related depreciation and amortization (other than amortization of debt issuance costs and above and below market lease amortization expense), the Company believes that FFO provides a performance measure that, when compared period - over - period, reflects the impact to operations from trends in occupancy rates, rental rates, operating costs, development activities and interest costs, providing perspective not immediately apparent from the closest GAAP measurement, net income or loss. AFFO is a non - GAAP measure used by many investors and analysts to measure a real estate company’s operating performance by removing the effect of items that do not reflect ongoing property operations. Management calculates AFFO by modifying the NAREIT computation of FFO by adjusting it for certain cash and non - cash items and certain recurring and non - recurring items. For the Company these items include: recurring acquisition and disposition costs, loss on the extinguishment of debt, recurring straight line deferred rental revenue, recurring stock - based compensation expense, recurring amortization of above and below market leases, (f) recurring amortization of debt issuance costs, severance and transition related expense, and other items. Management believes that reporting AFFO in addition to FFO is a useful supplemental measure for the investment community to use when evaluating the operating performance of the Company on a comparative basis.

4Q - 2024 | Earnings Supplemental 22 REPORTING DEFINITIONS AND OTHER DISCLOSURES Rent Coverage Ratio For purposes of calculating our portfolio weighted - average EBITDARM coverage ratio (“Rent Coverage Ratio”), we excluded credit - rated tenants or their subsidiaries for which financial statements were either not available or not sufficiently detailed. These ratios are based on the latest available information only. Most tenant financial statements are unaudited and we have not independently verified any tenant financial information (audited or unaudited) and, therefore, we cannot assure you that such information is accurate or complete. Certain other tenants (approximately 19 % of our portfolio) are excluded from the calculation due to (i) lack of available financial information or (ii) small tenant size. Additionally, included within 19% of non - reporting tenants is Pipeline Healthcare, LLC, which (i) was sold to Heights Healthcare in October 2023 and is being operated under new management and (ii) occupies our only acute care hospital asset, which is not one of our core asset classes. Additionally, our Rent Coverage Ratio adds back physician distributions and compensation. Management believes all adjustments are reasonable and necessary. Other Disclosures Non - GAAP Financial Measures Management considers certain non - GAAP financial measures to be useful supplemental measures of the Company's operating performance. For the Company, non - GAAP measures consist of EBITDAre, Adjusted EBITDAre, FFO attributable to common stockholders and noncontrolling interest and AFFO attributable to common stockholders and noncontrolling interest. A non - GAAP financial measure is generally defined as one that purports to measure financial performance, financial position or cash flows, but excludes or includes amounts that would not be so adjusted in the most comparable measure determined in accordance with GAAP. The Company reports non - GAAP financial measures because these measures are observed by management to also be among the most predominant measures used by the REIT industry and by industry analysts to evaluate REITs. For these reasons, management deems it appropriate to disclose and discuss these non - GAAP financial measures. The non - GAAP financial measures presented herein are not necessarily identical to those presented by other real estate companies due to the fact that not all real estate companies use the same definitions. These measures should not be considered as alternatives to net income, as indicators of the Company's financial performance, or as alternatives to cash flow from operating activities as measures of the Company's liquidity, nor are these measures necessarily indicative of sufficient cash flow to fund all of the Company's needs. Management believes that in order to facilitate a clear understanding of the Company's historical consolidated operating results, these measures should be examined in conjunction with net income and cash flows from operations as presented elsewhere herein. Additional Information The information in this document should be read in conjunction with the Company’s Annual Report on Form 10 - K, Quarterly Reports on Form 10 - Q, Current Reports on Form 8 - K, and other information filed with, or furnished to, the SEC. You can access the Company’s reports and amendments to those reports filed or furnished to the SEC pursuant to Section 13(a) or 15(d) of the Exchange Act in the “Investor Relations” section on the Company’s website (www.globalmedicalreit.com) under “SEC Filings” as soon as reasonably practicable after they are filed with, or furnished to, the SEC. The information on or connected to the Company’s website is not, and shall not be deemed to be, a part of, or incorporated into, this Earnings Supplemental. You also can review these SEC filings and other information by accessing the SEC’s website at http://www.sec.gov . Certain information contained in this package, including, but not limited to, information contained in our Top 10 tenant profiles is derived from publicly - available third - party sources. The Company has not independently verified this information and there can be no assurance that such information is accurate or complete.
INVESTOR RELATIONS globalmedicalreit.com NYSE: GMRE Stephen Swett 203.682.8377 stephen.swett@icrinc.com