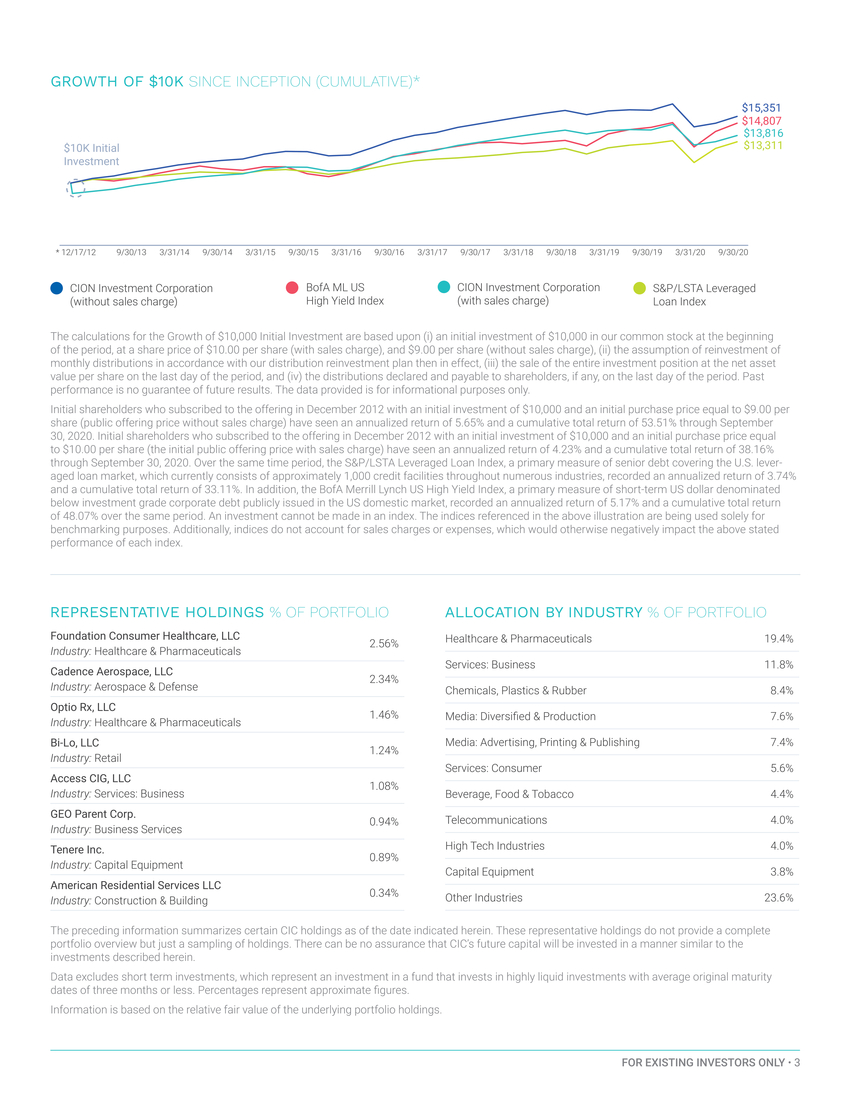
 | GROWTH OF $10K SINCE INCEPTION (CUMULATIVE)* $10K Initial Investment $15,351 $14,807 $13,816 $13,311 * 12/17/12 9/30/13 3/31/14 9/30/14 3/31/15 9/30/15 3/31/16 9/30/16 3/31/17 9/30/17 3/31/18 9/30/18 3/31/19 9/30/19 3/31/20 9/30/20 CION Investment Corporation (without sales charge) BofA ML US High Yield Index CION Investment Corporation (with sales charge) S&P/LSTA Leveraged Loan Index The calculations for the Growth of $10,000 Initial Investment are based upon (i) an initial investment of $10,000 in our common stock at the beginning of the period, at a share price of $10.00 per share (with sales charge), and $9.00 per share (without sales charge), (ii) the assumption of reinvestment of monthly distributions in accordance with our distribution reinvestment plan then in effect, (iii) the sale of the entire investment position at the net asset value per share on the last day of the period, and (iv) the distributions declared and payable to shareholders, if any, on the last day of the period. Past performance is no guarantee of future results. The data provided is for informational purposes only. Initial shareholders who subscribed to the offering in December 2012 with an initial investment of $10,000 and an initial purchase price equal to $9.00 per share (public offering price without sales charge) have seen an annualized return of 5.65% and a cumulative total return of 53.51% through September 30, 2020. Initial shareholders who subscribed to the offering in December 2012 with an initial investment of $10,000 and an initial purchase price equal to $10.00 per share (the initial public offering price with sales charge) have seen an annualized return of 4.23% and a cumulative total return of 38.16% through September 30, 2020. Over the same time period, the S&P/LSTA Leveraged Loan Index, a primary measure of senior debt covering the U.S. lever-aged loan market, which currently consists of approximately 1,000 credit facilities throughout numerous industries, recorded an annualized return of 3.74% and a cumulative total return of 33.11%. In addition, the BofA Merrill Lynch US High Yield Index, a primary measure of short-term US dollar denominated below investment grade corporate debt publicly issued in the US domestic market, recorded an annualized return of 5.17% and a cumulative total return of 48.07% over the same period. An investment cannot be made in an index. The indices referenced in the above illustration are being used solely for benchmarking purposes. Additionally, indices do not account for sales charges or expenses, which would otherwise negatively impact the above stated performance of each index. Foundation Consumer Healthcare, LLC Industry: Healthcare & Pharmaceuticals 2.56% Cadence Aerospace, LLC Industry: Aerospace & Defense 2.34% Optio Rx, LLC Industry: Healthcare & Pharmaceuticals 1.46% Bi-Lo, LLC Industry: Retail 1.24% Access CIG, LLC Industry: Services: Business 1.08% GEO Parent Corp. Industry: Business Services 0.94% Tenere Inc. Industry: Capital Equipment 0.89% American Residential Services LLC Industry: Construction & Building 0.34% Healthcare & Pharmaceuticals 19.4% Services: Business 11.8% Chemicals, Plastics & Rubber 8.4% Media: Diversified & Production 7.6% Media: Advertising, Printing & Publishing 7.4% Services: Consumer 5.6% Beverage, Food & Tobacco 4.4% Telecommunications 4.0% High Tech Industries 4.0% Capital Equipment 3.8% Other Industries 23.6% The preceding information summarizes certain CIC holdings as of the date indicated herein. These representative holdings do not provide a complete portfolio overview but just a sampling of holdings. There can be no assurance that CIC’s future capital will be invested in a manner similar to the investments described herein. Data excludes short term investments, which represent an investment in a fund that invests in highly liquid investments with average original maturity dates of three months or less. Percentages represent approximate figures. Information is based on the relative fair value of the underlying portfolio holdings. FOR EXISTING INVESTORS ONLY • 3 |