Exhibit 99.2

CION Investment Corporation Second Quarter 2022 Earnings Presentation
Disclosures and Forward - Looking Statements 2 The information contained in this earnings presentation should be viewed in conjunction with the earnings conference call of CION Investment Corporation (NYSE : CION) (“CION” or the “Company”) held on August 11 , 2022 as well as the Company’s Quarterly Report on Form 10 - Q for the quarter ended June 30 , 2022 that was filed with the Securities and Exchange Commission (the “SEC”) on August 11 , 2022 . The information contained herein may not be used, reproduced or distributed to others, in whole or in part, for any other purpose without the prior written consent of the Company . This earnings presentation may contain forward - looking statements that involve substantial risks and uncertainties, including the impact of COVID - 19 on the business, future operating results, access to capital and liquidity of the Company and its portfolio companies . You can identify these statements by the use of forward - looking terminology such as “may,” “will,” “should,” “expect,” “anticipate,” “project,” “target,” “estimate,” “intend,” “continue,” or “believe” or the negatives thereof or other variations thereon or comparable terminology, including references to assumptions, forecasts of future results, shareholder diversification, institutional research coverage and availability and access to capital . You should read statements that contain these words carefully because they discuss the Company’s plans, strategies, prospects and expectations concerning its business, operating results, financial condition and other similar matters . These statements represent the Company’s belief regarding future events that, by their nature, are uncertain and outside of the Company’s control, such as the price at which the Company’s shares of common stock will trade on the NYSE . Any forward - looking statement made by the Company in this earnings presentation speaks only as of the date on which the Company makes it . Factors or events that could cause the Company’s actual results to differ, possibly materially from its expectations, include, but are not limited to, the risks, uncertainties and other factors the Company identifies in the sections entitled “Risk Factors” and “Forward - Looking Statements” in filings the Company makes with the SEC, and it is not possible for the Company to predict or identify all of them . The Company undertakes no obligation to update or revise publicly any forward - looking statements, whether as a result of new information, future events or otherwise, except as required by law . This earnings presentation does not constitute a prospectus and should under no circumstances be understood as an offer to sell or the solicitation of an offer to buy the Company’s common stock or any other securities nor will there be any sale of common stock or any other securities referred to in this earnings presentation in any state or jurisdiction in which such offer, solicitation or sale would be unlawful prior to the registration or qualification under the securities laws of such state or jurisdiction . Nothing in these materials should be construed as a recommendation to invest in any securities that may be issued by the Company or as legal, accounting or tax advice . An investment in securities of the type described herein presents certain risks . The Company is managed by CION Investment Management, LLC, an affiliate of the Company . Nothing contained herein shall be relied upon as a promise or representation whether as to past or future performance . The information contained in this earnings presentation is summary information that is intended to be considered in the context of other public announcements that the Company may make, by press release or otherwise, from time to time . The Company undertakes no duty or obligation to publicly update or revise the information contained in this earnings presentation, except as required by law . These materials contain information about the Company, certain of its personnel and affiliates and its historical performance . You should not view information related to past performance of the Company as indicative of its future results, the achievement of which cannot be assured . Past performance does not guarantee future results, which may vary . The value of investments and the income derived from investments will fluctuate and can go down as well as up . A loss of principal may occur .
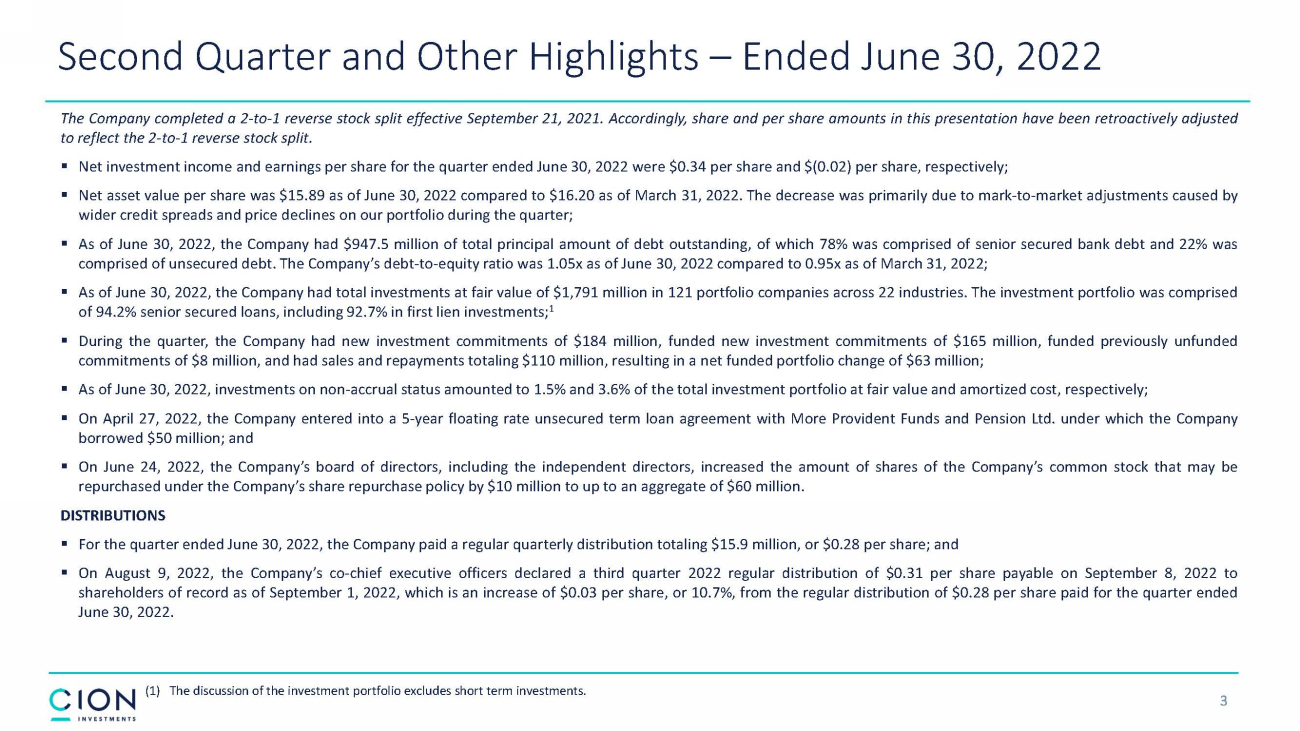
3 (1) The discussion of the investment portfolio excludes short term investments. Second Quarter and Other Highlights – Ended June 30, 2022 The Company completed a 2 - to - 1 reverse stock split effective September 21 , 2021 . Accordingly, share and per share amounts in this presentation have been retroactively adjusted to reflect the 2 - to - 1 reverse stock split . ▪ Net investment income and earnings per share for the quarter ended June 30 , 2022 were $ 0 . 34 per share and $ ( 0 . 02 ) per share, respectively ; ▪ Net asset value per share was $ 15 . 89 as of June 30 , 2022 compared to $ 16 . 20 as of March 31 , 2022 . The decrease was primarily due to mark - to - market adjustments caused by wider credit spreads and price declines on our portfolio during the quarter ; ▪ As of June 30 , 2022 , the Company had $ 947 . 5 million of total principal amount of debt outstanding, of which 78 % was comprised of senior secured bank debt and 22 % was comprised of unsecured debt . The Company’s debt - to - equity ratio was 1 . 05 x as of June 30 , 2022 compared to 0 . 95 x as of March 31 , 2022 ; ▪ As of June 30 , 2022 , the Company had total investments at fair value of $ 1 , 791 million in 121 portfolio companies across 22 industries . The investment portfolio was comprised of 94 . 2 % senior secured loans, including 92 . 7 % in first lien investments ; 1 ▪ During the quarter, the Company had new investment commitments of $ 184 million, funded new investment commitments of $ 165 million, funded previously unfunded commitments of $ 8 million, and had sales and repayments totaling $ 110 million, resulting in a net funded portfolio change of $ 63 million ; ▪ As of June 30 , 2022 , investments on non - accrual status amounted to 1 . 5 % and 3 . 6 % of the total investment portfolio at fair value and amortized cost, respectively ; ▪ On April 27 , 2022 , the Company entered into a 5 - year floating rate unsecured term loan agreement with More Provident Funds and Pension Ltd . under which the Company borrowed $ 50 million ; and ▪ On June 24 , 2022 , the Company’s board of directors, including the independent directors, increased the amount of shares of the Company’s common stock that may be repurchased under the Company’s share repurchase policy by $ 10 million to up to an aggregate of $ 60 million . DISTRIBUTIONS ▪ For the quarter ended June 30 , 2022 , the Company paid a regular quarterly distribution totaling $ 15 . 9 million, or $ 0 . 28 per share ; and ▪ On August 9 , 2022 , the Company’s co - chief executive officers declared a third quarter 2022 regular distribution of $ 0 . 31 per share payable on September 8 , 2022 to shareholders of record as of September 1 , 2022 , which is an increase of $ 0 . 03 per share, or 10 . 7 % , from the regular distribution of $ 0 . 28 per share paid for the quarter ended June 30 , 2022 .
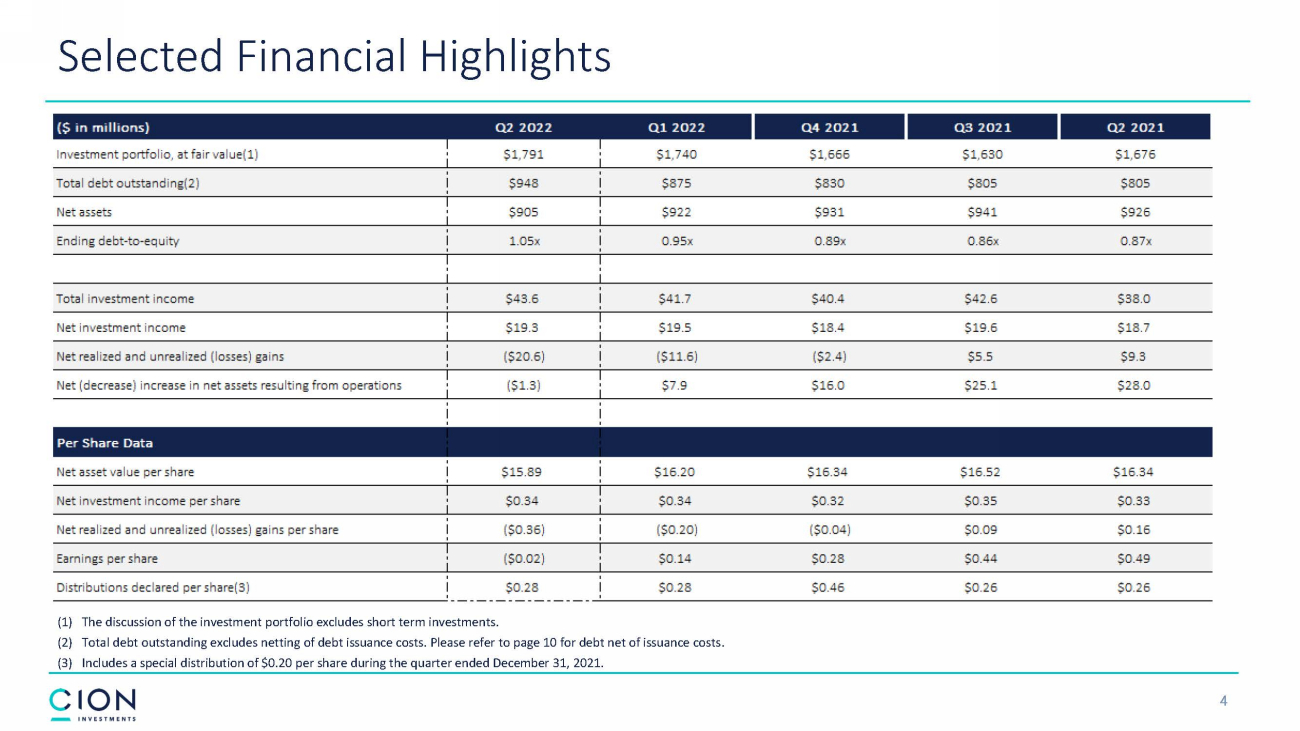
4 Selected Financial Highlights (1) The discussion of the investment portfolio excludes short term investments. (2) Total debt outstanding excludes netting of debt issuance costs. Please refer to page 10 for debt net of issuance costs . (3) Includes a special distribution of $0.20 per share during the quarter ended December 31, 2021.
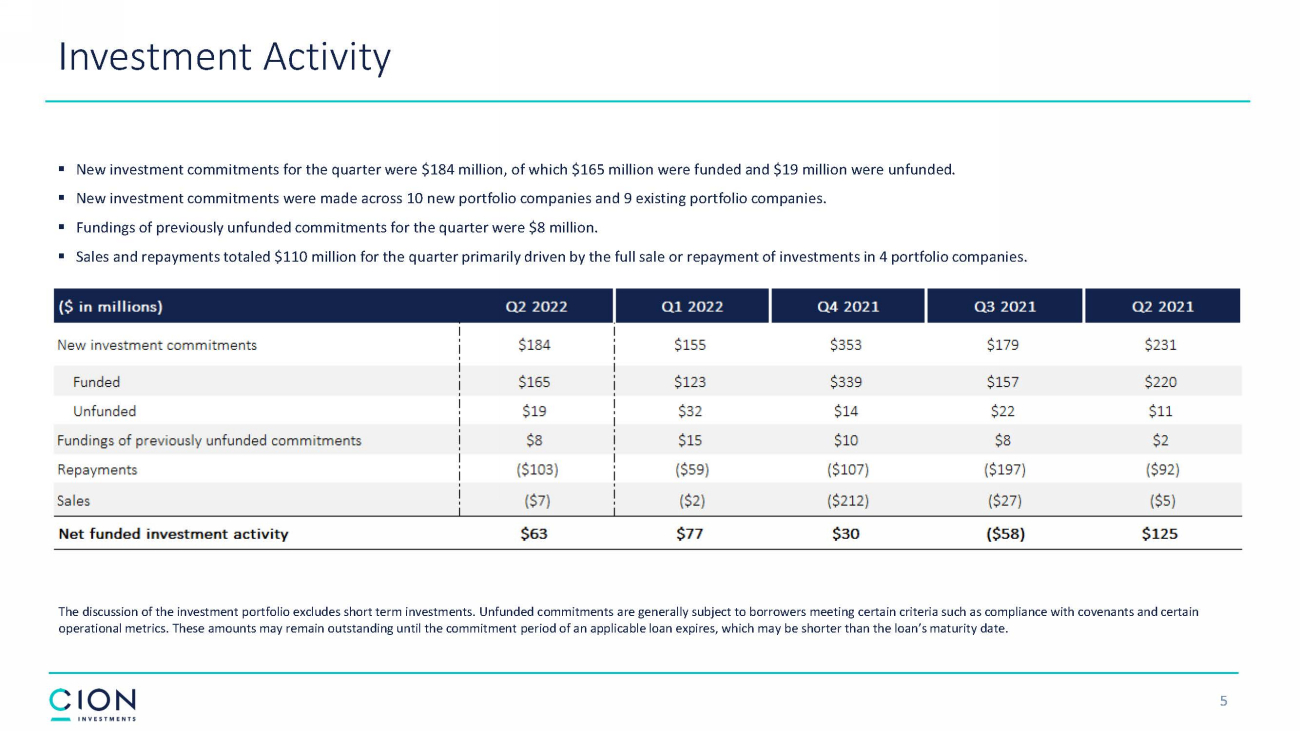
Investment Activity ▪ New investment commitments for the quarter were $184 million, of which $165 million were funded and $19 million were unfunded . ▪ New investment commitments were made across 10 new portfolio companies and 9 existing portfolio companies. ▪ Fundings of previously unfunded commitments for the quarter were $8 million. ▪ Sales and repayments totaled $110 million for the quarter primarily driven by the full sale or repayment of investments in 4 por tfolio companies. The discussion of the investment portfolio excludes short term investments. Unfunded c ommitments are generally subject to borrowers meeting certain criteria such as compliance with covenants and certain operational metrics. These amounts may remain outstanding until the commitment period of an applicable loan expires, which ma y b e shorter than the loan’s maturity date. 5
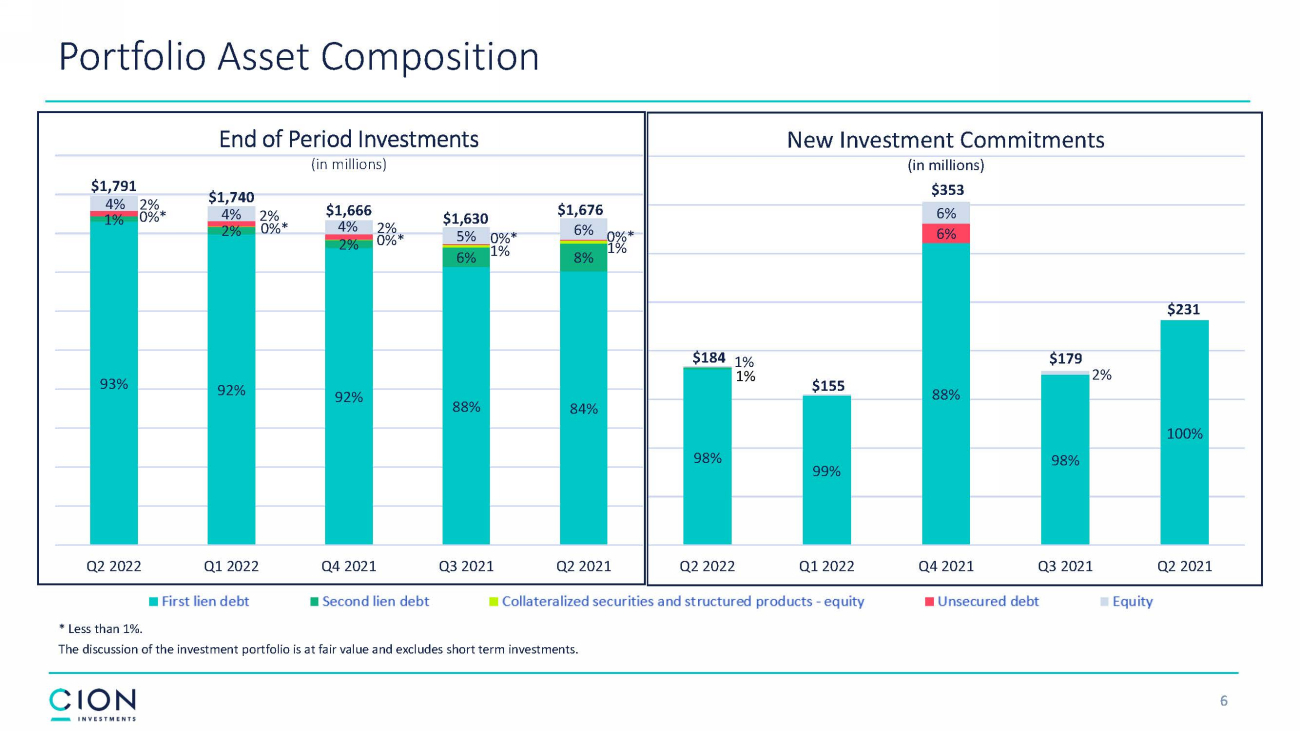
6 Portfolio Asset Composition 93% 92% 92% 88% 84% 1% 2% 2% 6% 8% 0% * 0% * 0% * 1% 1% 2% 2% 2% 0% * 0% * 4% 4% 4% 5% 6% $1,791 $1,740 $1,666 $1,630 $1,676 Q2 2022 Q1 2022 Q4 2021 Q3 2021 Q2 2021 End of Period Investments (in millions) * Less than 1%. The discussion of the investment portfolio is at fair value and excludes short term investments. 98% 99% 88% 98% 100% 6% 1% 6% 2% $184 $155 $353 $179 $231 Q2 2022 Q1 2022 Q4 2021 Q3 2021 Q2 2021 New Investment Commitments (in millions) 1%

7 INTERNAL INVESTMENT RISK RATINGS(1) (% of Total Portfolio, Fair Value) Q2 2022 NON - ACCRUAL %(1) Higher Credit Quality Lower Credit Quality Credit Quality of Investments 3.55% 1.49% Amortized Cost Fair Value (1) The discussion of the investment portfolio excludes short term investments. * - Less than 1%.

94% Senior Secured Debt Investments PORTFOLIO BY SECURITY TYPE(4) PORTFOLIO BY INTEREST RATE TYPE(4) 92.7% 1.5% 4.1% 0.1% 1.6% ▪ First Lien Debt (92.7%) ▪ Second Lien Debt (1.5%) ▪ Equity (4.1%) ▪ Collateralized Securities & Structured Products: Equity (0.1%) ▪ Unsecured Debt (1.6%) ▪ Floating Interest Rate Investments (84.9%) ▪ Fixed Interest Rate Investments (10.0%) ▪ Non - Income Producing Investments (4.0%) ▪ Other Income Producing Investments (1.1%) Portfolio Summary 8 ( 1 ) See endnote 4 in our press release filed with the SEC on August 11 , 2022 . ( 2 ) See endnote 5 in our press release filed with the SEC on August 11 , 2022 . ( 3 ) See endnote 6 in our press release filed with the SEC on August 11 , 2022 . ( 4 ) The discussion of the investment portfolio excludes short term investments . 84.9% 10.0% 4.0% 1.1%

Quarterly Operating Results 9
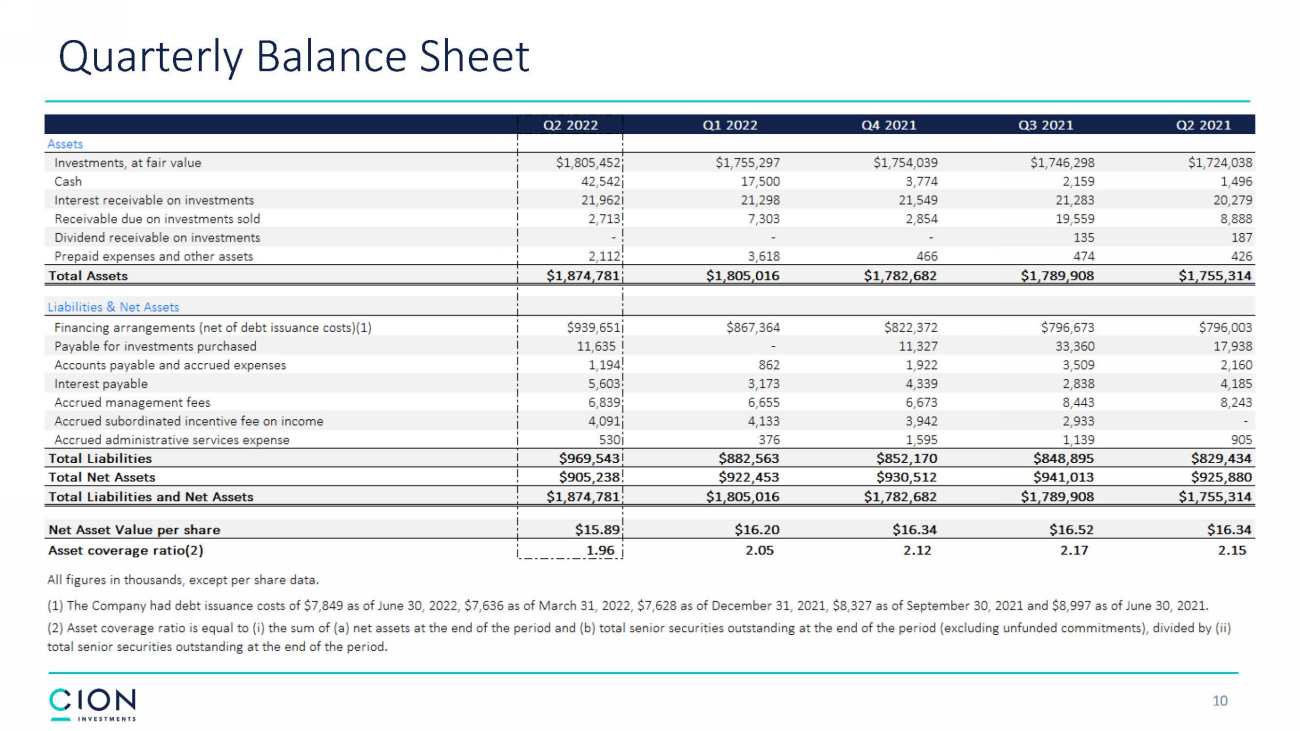
Quarterly Balance Sheet 10
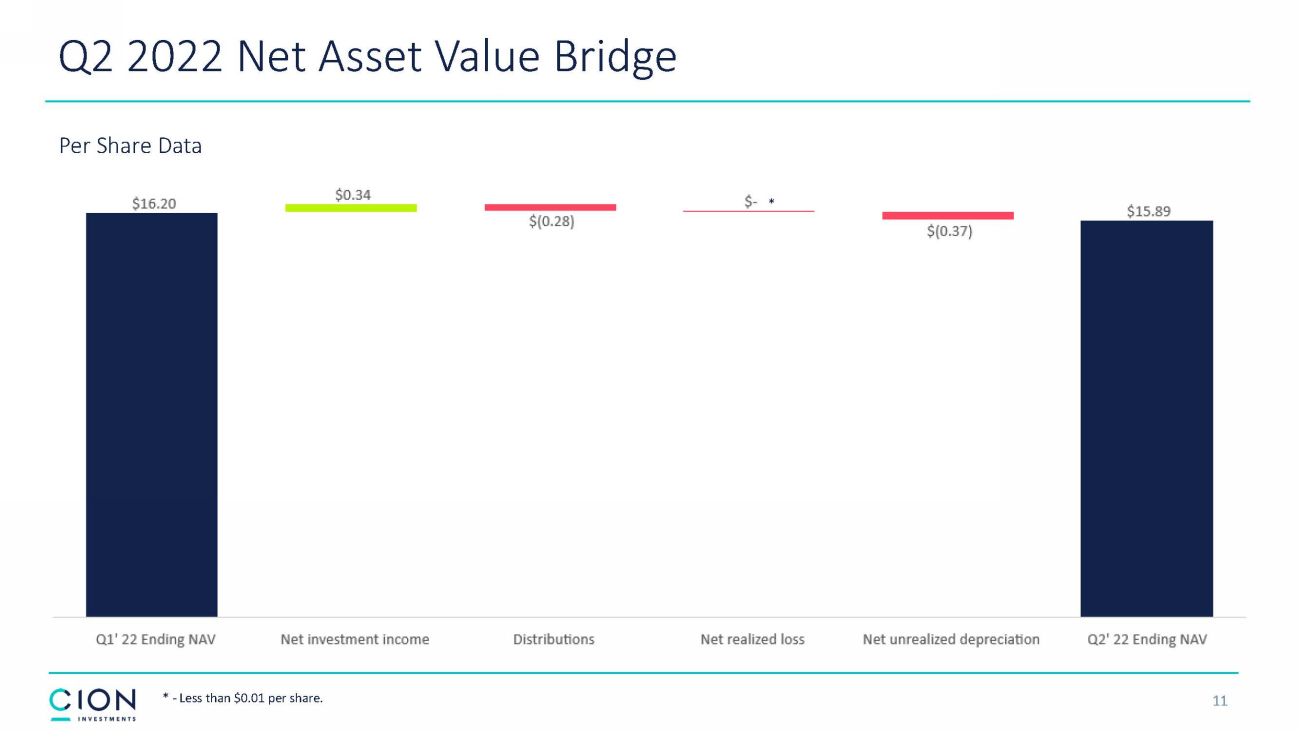
11 Q2 2022 Net Asset Value Bridge Per Share Data * - Less than $ 0 . 01 per share . * *

12 Total Commitment Amount Principal Amount Outstanding Interest Rate Maturity Date JPM Credit Facility $675 $600 L + 3.10% (2) 5/15/2024 UBS Facility 150 143 L + 3.375% 11/19/2023 Unsecured Notes, 2026(1) 125 125 4.50% 2/11/2026 2022 Unsecured Term Loan 50 50 S + 3.50% 4/27/2027 2021 Unsecured Term Loan(1) 30 30 5.20% 9/30/2024 Total Debt $1,030 $948 4.3% Debt Summary DEBT MATURITIES ($ in millions) DEBT SCHEDULE ($ in millions) $82 million in available capacity within existing senior secured facilities (1) Investment grade credit rating. (2) $100 million bears interest at a rate of SOFR + 3.10% and a LIBOR to SOFR credit spread adjustment of 0.15%.
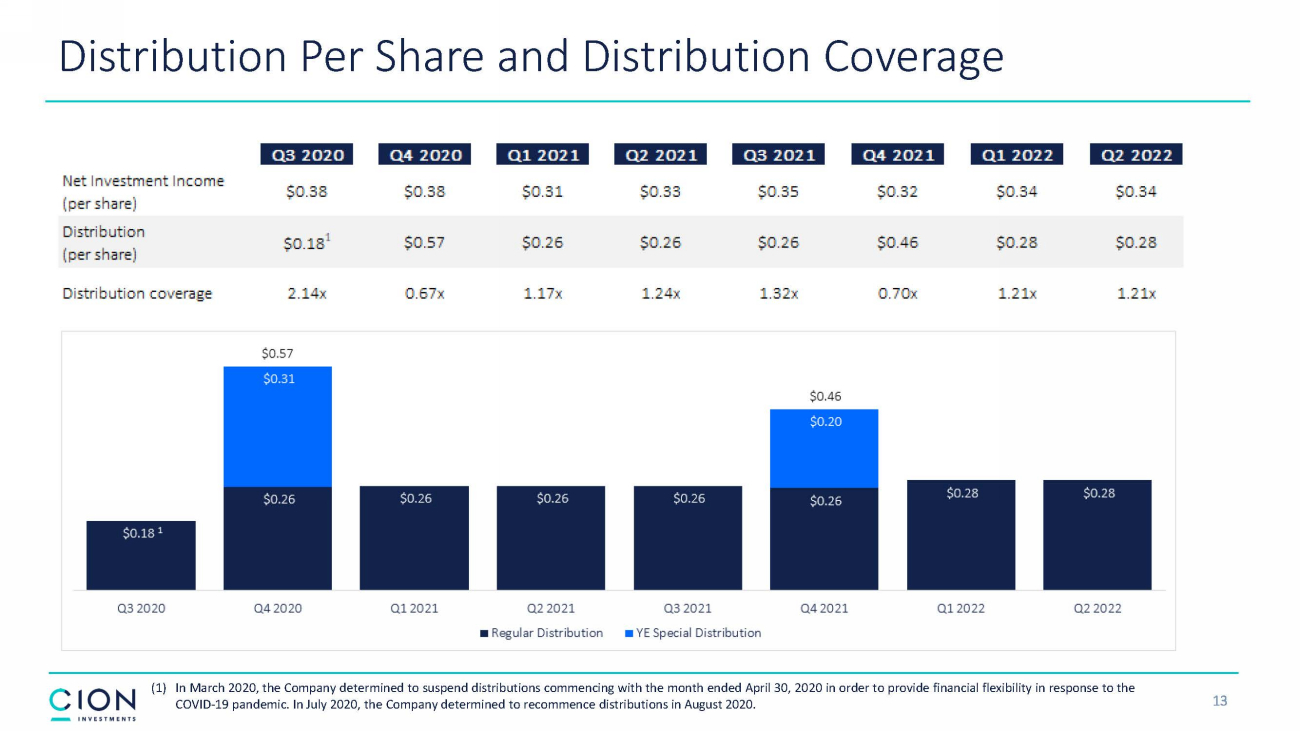
13 Distribution Per Share and Distribution Coverage (1) In March 2020 , the Company determined to suspend distributions commencing with the month ended April 30 , 2020 in order to provide financial flexibility in response to the COVID - 19 pandemic . In July 2020 , the Company determined to recommence distributions in August 2020 . 1
