UNITED STATES
SECURITIES AND EXCHANGE COMMISSION
Washington, D.C. 20549
FORMN-CSR
CERTIFIED SHAREHOLDER REPORT OF REGISTERED
MANAGEMENT INVESTMENT COMPANY
Investment Company Act file number:811-22626
Salient Midstream & MLP Fund
(Exact name of registrant as specified in charter)
4265 San Felipe, 8th Floor
Houston, TX 77027
(Address of principal executive offices) (Zip code)
| | |
Gregory A. Reid, Principal Executive Officer Salient Midstream & MLP Fund 4265 San Felipe, 8th Floor Houston, TX 77027 (Name and address of agent for service) | | With a Copy To: George J. Zornada K&L Gates LLP State Street Financial Center One Lincoln St. Boston, MA 02111-2950 (617) 261-3231 |
Registrant’s telephone number, including area code:(713)993-4001
Date of fiscal year end:November 30
Date of reporting period:November 30, 2019
FormN-CSR is to be used by management investment companies to file reports with the Commission, not later than 10 days after the transmission to stockholders of any report that is required to be transmitted to stockholders underRule 30e-1 under the Investment Company Act of 1940 (17CFR 270.30e-1). The Commission may use the information provided on FormN-CSR in its regulatory, disclosure review, inspection, and policymaking roles.
A registrant is required to disclose the information specified by FormN-CSR, and the Commission will make this information public. A registrant is not required to respond to the collection of information contained in FormN-CSR unless the Form displays a currently valid Office of Management and Budget (“OMB”) control number. Please direct comments concerning the accuracy of the information collection burden estimate and any suggestions for reducing the burden to the Secretary, Securities and Exchange Commission, 100 F Street, NE, Washington, DC 20549. The OMB has reviewed this collection of information under the clearance requirements of 44 U.S.C. § 3507.
| Item 1. | Report to Stockholders. |
The following is a copy of the report transmitted to shareholders of the Salient Midstream & MLP Fund (the “Fund”), pursuant to Rule30e-1 under the Investment Company Act of 1940, as amended (the “Act”) (17 CFR270.30e-1).
Table of Contents
| | |
 | | Midstream & MLP Fund |
Shareholder Letter (Unaudited)
Dear Fellow Shareholders:1
We are pleased to provide the annual report of the Salient Midstream & MLP Fund (the “Fund” or “SMM”) (NYSE: SMM) which contains updated data as of November 30, 2019.
As of November 30, 2019, the Fund had total gross assets of $188.5 million, net asset value of $8.39 per share and 17.7 million common shares outstanding. The Fund’s price per share was $7.09, which represents a 15.5% discount to its net asset value (“NAV”).2
The Fund’s investment allocation is shown in the pie chart below:
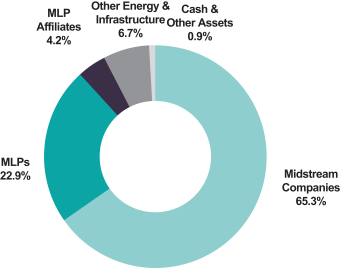
For illustrative purposes only.
Source: Salient Capital Advisors, LLC (“Adviser”), November 30, 2019.
Figures are based on the Fund’s gross assets.
1Certain statements in this letter are forward-looking statements. The forward-looking statements and other views expressed herein are those of the portfolio managers and the Fund as of the date of this letter. Actual future results or occurrences may differ significantly from those anticipated in any forward-looking statements, and there is no guarantee that any predictions will come to pass. The views expressed herein are subject to change at any time, due to numerous market and other factors. The Fund disclaims any obligation to update publicly or revise any forward-looking statements or views expressed herein. There can be no assurance that the Fund will achieve its investment objectives. The value of the Fund will fluctuate with the value of the underlying securities. Historically, exchange-listedclosed-end funds often trade at a discount to their net asset value.
2 Past performance is not indicative of future results. Current performance may be higher or lower than the data shown. The data shown are unaudited. Returns do not reflect the deduction of taxes that shareholders may have to pay on Fund distributions or upon the sale of Fund shares.
The Fund’s Top 10 holdings are shown below, as of November 30, 2019:1
| | | | | | | | | | |
| Company Name | | Sector | | % of Gross
Assets |
EMG Utica I OffshoreCo-Investment, LP | | | | Midstream Company | | | | | 12.5 | % |
Enbridge, Inc. | | | | Midstream Company | | | | | 9.9 | % |
The Williams Companies, Inc. | | | | Midstream Company | | | | | 9.4 | % |
Targa Resources Corp. | | | | Midstream Company | | | | | 6.8 | % |
Macquarie Infrastructure Corp. | | | | Other Energy & Infrastructure | | | | | 5.7 | % |
Energy Transfer LP | | | | MLP | | | | | 5.5 | % |
ONEOK, Inc. | | | | Midstream Company | | | | | 5.0 | % |
TC Energy Corp. | | | | Midstream Company | | | | | 4.9 | % |
Kinder Morgan, Inc. | | | | Midstream Company | | | | | 4.9 | % |
Pembina Pipeline Corp. | | | | Midstream Company | | | | | 4.7 | % |
| | | | | | | | | | |
Total | | | | | | | | | 69.3 | % |
| | | | | | | | | | |
For illustrative purposes only.
Current and future holdings are subject to change and risk. Figures are based on the Fund’s gross assets.
Source: Salient Capital Advisors, LLC (“Adviser”), November 30, 2019.
For the fiscal year (December 1, 2018 – November 30, 2019), the Fund’s NAV and market price total return were-9.0% and-8.2%, respectively, compared to 1.9% for the Alerian Midstream Energy Select Index (AMEI), during the same period.2,3 Some of the top contributing investments held by the Fund during the fiscal year include Enbridge, Inc. (NYSE: ENB), TC Energy Corp. (NYSE: TRP) and Kinder Morgan, Inc. (NYSE: KMI). Top detractors to Fund performance include Equitrans Midstream Corp. (NYSE: ETRN), Antero Midstream Corp. (NYSE: AM) and EnLink Midstream LLC (NYSE: ENLC). The Fund’s underperformance relative to the benchmark was primarily driven by its underweight aggregate exposure to Canadian based midstream companies, which generally outperformed US based midstream companies during the period, and the top 3 detractors listed above were all overweight relative to the benchmark.
Performance Snapshot
as of November 30, 2019 (unaudited)
| | | | | | | | | | |
| Price Per Share | | Fiscal YTD
Total Return* | | Since Inception*
(Annualized) |
$8.39 (NAV) | | | | -9.03 | % | | | | -3.57 | % |
$7.09 (Market Price) | | | | -8.23 | % | | | | -5.70 | % |
Source: Salient Capital Advisors, LLC (“Adviser”), November 30, 2019.
For illustrative purposes only. All figures represent past performance and are not indicative of future results. No investment strategy can guarantee performance results.
* Total returns are based on changes in NAV or market price, respectively. Returns reflect the deduction of all Fund expenses, including management fees, operating expenses, and other Fund expenses. Returns do not reflect the deduction of brokerage commissions or taxes that investors may pay on distributions or the sale of shares. Total return assumes the reinvestment of all distributions. Inception date of the Fund was May 25, 2012.
1 Fund shares do not represent a deposit or obligation of, and are not guaranteed or endorsed by, any bank or other insured depository institution, and are not federally insured by the Federal Deposit Insurance Corporation, the Federal Reserve Board or any other government agency. Data are based on total market value of Fund investments unless otherwise indicated. The data provided are for informational purposes only and are not intended for trading purposes.
2 Alerian, November 30, 2019. Effective on January 1, 2019, the Alerian Midstream Energy Select Index (AMEI Index) replaced the Alerian MLP Index (AMZ Index) as the Fund’s primary benchmark index. We believe the AMEI Index more closely aligns to the Fund’s investment strategies as a result of changes recently made to the composition of the AMEI Index. Alerian Midstream Energy Select Index”, “Alerian Midstream Energy Select Total Return Index”, “AMEI” and “AMEIX” are trademarks of Alerian and their use is granted under a license from Alerian. Past performance is not indicative of how the index will perform in the future. The index reflects the reinvestment of dividends and income and does not reflect deductions for fees, expenses, or taxes. The index is unmanaged and is not available for direct investment. Alerian Midstream Energy Select Index (AMEI) is a composite of North American midstream energy infrastructure companies that are engaged in activities involving energy commodities. The capped, float-adjusted, capitalization weighted index is disseminated in real time on a price-return basis. Inception date of the AMEI is April 1, 2013.
3Past performance is not indicative of future results.
Market Review
Midstream investments rebounded nicely over the first half of our fiscal year after starting the period with a precipitous 14% drop for the Alerian Midstream Energy Select Index (AMEI) during the first three weeks of December 2018.1 By the end of May 2019, the AMEI had recouped not only the December declines but had posted overall gains of 7.3% for the Fund’s fiscal year and 18.6% for 2019.1
By June, shifts in investor preferences were becoming apparent. Certain characteristics were being rewarded by investors and those companies that chose not to heed this shift did so at their own peril. First and foremost, capital discipline was being rewarded by investors as lingering concerns over global energy demand persisted amidst the ongoing trade dispute between the world’s two largest economies, United States and China. Added emphasis on ESG (Environmental, Social, Governance), particularly the corporate governance component for those still structured as MLPs, and an indication that the midstream company was on the path to generating true free cash flow were also being rewarded by investors.2 Given that the “L” in master limited partnerships (MLP) stands for limited, the structure is somewhat hamstrung.3 As such, we saw the MLP structure fall into disfavor among institutional investors which led to a real dispersion in stock performance, which all else being equal, seems to have been based on corporate structure rather than operational results. From May 31st through November 30th, the Alerian MLP Index (AMZ), which is comprised exclusively of MLPs, was down 13.8% vs. a 5% decline for the AMEI, and only 3.3% drop in the Alerian Midstream Energy Index (AMNA).1 Both the AMEI and the AMNA include corporations and Canadian-based midstream companies. For the Fund’s fiscal year, the AMZ provided a total return of-11% vs. a 1.9% gain for the AMEI and a 4.8% gain in the AMNA.1
The global importance of a robust and vibrant North American energy sector was highlighted with the shocking September 14th drone attack on Saudi Arabia’s largest oil processing facility at Abqaiq.4Unmanned drones fired missiles that damaged Abqaiq and sidelined upwards of 5.5 million barrels per day (mmbpd) (roughly half) of Saudi oil production and approximately 5% of the world’s production. For reference, the U.S.’s crude oil production has increased roughly 7.2 mmbpd from its low of 5 mmbpd in 2008 to current production levels.5 Effectively 75% of the gains in U.S. production over the last 11 years were wiped out in an afternoon. As one would expect, crude oil spiked as much as 15% when trading opened on September 16th but quickly retreated after the Saudis claimed it would bring about 1/3 of the sidelined production back online in two weeks and have the rest back online over the next several months. While time will tell if the Saudis will be able to do this, we absolutely believe that this attack highlights the critical importance that the North American energy complex is to keeping the global economic engine humming.
Midstream investments finished the fiscal year on a weak note as November has historically been the worst month of the year performance-wise given the potential fortax-loss selling. MLPs, as measured by the Alerian MLP Index (AMZ), were down 5.75% for the month but the AMEI was down “only” 2.3% as the divergence of returns by corporate structure continued.1 Outside oftax-loss selling, investors were also focusing on what appears to be a slowing rate of growth in U.S. crude oil production.6 Coming into the month, many analysts were calling for an additional-1.2 mmbpd growth in U.S. crude oil production in 2020 over the-1.4 mmbpd growth for 2019.
As several Exploration & Production (E&P) companies gave preliminary 2020 growth spending guidance that was below 2019 levels, it became apparent that the rate of production growth is slowing.7 This is having the expected impact on crude oil prices (driving them higher), but once again, worries over excess pipeline capacity in the Permian Basin have kept midstream equity prices subdued.8 While we acknowledge that the downshift in growth has heightened competitive pressures within the Permian Basin, we continue to believe that companies that can offer wellhead to export dock capabilities in addition to offering producers optionality on where that barrel can be delivered will continue to have an advantage over midstream operators that do not have that flexibility.
1 Alerian, December 2019. Past performance is not indicative of future results. One cannot directly invest in an index. Themidstream sector involves the transportation (by pipeline, rail, barge, oil tanker or truck), storage, gathering, processing, distributing and wholesale marketing of natural gas, natural gas liquids, crude oil or refined petroleum products.
2Environmental, Social, and Governance refers to the three central factors in measuring the sustainability and societal impact of an investment in a company or business. Free cash flow to firm is a way of looking at a business’s cash flow to see what is available for distribution among all the securities holders of a corporate entity.
3Master limited partnerships (MLPs) are publicly traded limited partnerships and limited liability companies that are treated as partnerships for federal income tax purposes.
4CNBC, September 2019.
5 Energy Information Administration (EIA), December 2019.
6Tax-loss selling is a means of lowering your tax burden by selling off underperforming stocks or securities at a loss.
7Exploration and Production (E&P) is also known as the upstream sector of the oil and gas industry. E&P is the process of looking for oil and natural gas deposits and taking measures to extract these resources from the earth for commercial sale.
8 ThePermian Basin is a large sedimentary basin in the southwestern part of the United States.
It is somewhat ironic, but a slowdown in production growth could have a positive impact on the free cash flow for midstream companies as slower production growth likely means less midstream capital expenditures will be required.9 We believe many more companies will be free cash flow positive in 2020 which could help attract incremental investment dollars as generalist investors have quite clearly expressed a preference to compare opportunities on anapples-to-apples basis using the same metrics (free cash flow/free cash flow yield, EV/EBITDA, debt/EBITDA) when making cross-asset investment decisions.10 We believe that a midstream industry focused on improving in these areas will stack up nicely given the critical importance that the U.S. and Canada have achieved in recent years in terms of global energy production.
Please note that this letter, including the financial information herein, is made available to shareholders of the Fund for their information. It is not a prospectus, circular or representation intended for use in the purchase or sale of shares of the Fund or of any securities mentioned in this letter.
Sincerely,
Gregory A. Reid
President
MLP Business, Salient Capital Advisors, LLC
9Capital Expenditure or CapEx, are funds used by a company to acquire, upgrade, and maintain physical assets such as property, industrial buildings, or equipment.
10Generalist Investor is investment that focus on multiple areas of interest.Free cash flow yield is a financial solvency ratio that compares the free cash flow per share a company is expected to earn against its market value per share.EV/EBITDA is a ratio that compares a company’s Enterprise Value (EV) to its Earnings Before Interest, Taxes, Depreciation & Amortization (EBITDA). The EV/EBITDA ratio is commonly used as a valuation metric to compare the relative value of different businesses.Debt/EBITDA is a ratio measuring the amount of income generated and available to pay down debt before covering interest, taxes, depreciation, and amortization expenses.
Key Financial Data (Unaudited)
We supplement the reporting of our financial information determined under United States generally accepted accounting principles (“GAAP”) with certainnon-GAAP financial measures: distributable cash flow and distributable cash flow coverage ratio. We believe thesenon-GAAP measures provide meaningful information to assist shareholders in understanding our financial results and assessing our performance. We pay distributions to our shareholders, funded in part by distributable cash flow generated from our portfolio investments. Distributable cash flow is the amount of income received by us from our portfolio investments less operating expenses, subject to certain adjustments as described below. Other companies with similar measures may calculate these measures differently, and as a result, it may not be possible to compare these financial measures with other companies’non-GAAP financial measures having the same or similar names. These adjusted financial measures should not be considered in isolation or as a substitute for reported net investment income. Thesenon-GAAP financial measures reflect an additional way of viewing an aspect of our operations that, when viewed with our GAAP results and the below reconciliation to the corresponding GAAP financial measures, provide a more complete understanding of our Fund. We strongly encourage shareholders to review our financial statements in their entirety and not rely on any single financial measure.
The table below reconciles thenon-GAAP financial measures, distributable cash flow and distributable cash flow coverage ratio, by starting with the most directly comparable GAAP financial measure, net investment income.
| | | | | |
| | | Year Ended
November 30, 2019 |
Net investment Loss | | | $ | (855,509 | ) |
Reconciling items: | | | | | |
Return of capital of distributions received(a) | | | | 12,560,155 | |
Option premium earnings(b) | | | | 700,269 | |
| |
Distributable cash flow(non-GAAP) | | | $ | 12,404,915 | |
Distributions paid on common stock | | | $ | 12,122,154 | |
Distributable cash flow coverage ratio(non-GAAP) | | | | 1.02x | |
Reconciliation of distributable cash flow to GAAP
(a) GAAP recognizes that a significant portion of the cash distributions received from MLPs is characterized as a return of capital and therefore excluded from net investment income, whereas the distributable cash flow calculation includes the return of capital portion of such distributions.
(b) We may sell covered call option contracts to generate income or to reduce our ownership of certain securities that we hold. In some cases, we are able to repurchase these call option contracts at a price less than the fee that we received, thereby generating a profit. The amount we received from selling call options, less the amount that we pay to repurchase such call option contracts is included in distributable cash flow. For GAAP purposes, “income” from call option contracts sold is not included in net investment income. See Note 2—Summary of Significant Accounting Policies and Practices for a full discussion of the GAAP treatment of option contracts.
Report of Independent Registered Public Accounting Firm
To the Shareholders and Board of Trustees
Salient Midstream & MLP Fund:
Opinion on the Financial Statements
We have audited the accompanying statement of assets, liabilities, and shareholders’ equity of Salient Midstream & MLP Fund (the “Fund”), including the schedule of investments, as of November 30, 2019, the related statements of operations and cash flows for the year then ended, the statements of changes in net assets for each of the years in the two-year period then ended, and the related notes (collectively, the financial statements) and the financial highlights for each of the years in the five-year period then ended. In our opinion, the financial statements and financial highlights present fairly, in all material respects, the financial position of the Fund as of November 30, 2019, the results of its operations and cash flows for the year then ended, the changes in its net assets for each of the years in the two-year period then ended, and the financial highlights for each of the years in the five-year period then ended, in conformity with U.S. generally accepted accounting principles.
Basis for Opinion
These financial statements and financial highlights are the responsibility of the Fund’s management. Our responsibility is to express an opinion on these financial statements and financial highlights based on our audits. We are a public accounting firm registered with the Public Company Accounting Oversight Board (United States) (PCAOB) and are required to be independent with respect to the Fund in accordance with the U.S. federal securities laws and the applicable rules and regulations of the Securities and Exchange Commission and the PCAOB.
We conducted our audits in accordance with the standards of the PCAOB. Those standards require that we plan and perform the audit to obtain reasonable assurance about whether the financial statements and financial highlights are free of material misstatement, whether due to error or fraud. Our audits included performing procedures to assess the risks of material misstatement of the financial statements and financial highlights, whether due to error or fraud, and performing procedures that respond to those risks. Such procedures included examining, on a test basis, evidence regarding the amounts and disclosures in the financial statements and financial highlights. Such procedures also included confirmation of securities owned as of November 30, 2019, by correspondence with the custodian, investee or other appropriate auditing procedures. Our audits also included evaluating the accounting principles used and significant estimates made by management, as well as evaluating the overall presentation of the financial statements and financial highlights. We believe that our audits provide a reasonable basis for our opinion.
/s/ KPMG LLP
We have served as the auditor of one or more Salient investment companies since 2003.
Columbus, Ohio
January 24, 2020
Schedule of Investments
Salient Midstream & MLP Fund
November 30, 2019
| | | | | | | | | | |
| | | Shares/Units | | Fair Value |
Master Limited Partnerships and Related Companies—125.6% | | | | | | |
Gathering & Processing—28.3% | | | | | | | | | | |
United States—28.3% | | | | | | | | | | |
CNX Midstream Partners LP(a)(b) | | | | 11,100 | | | | $ | 160,950 | |
EMG Utica I OffshoreCo-Investment, LP(b)(c) | | | | 16,000,000 | | | | | 23,481,353 | |
Enable Midstream Partners LP(b)(d) | | | | 212,711 | | | | | 1,954,814 | |
Noble Midstream Partners LP(b)(c) | | | | 174,484 | | | | | 3,629,267 | |
Targa Resources Corp.(a)(d) | | | | 350,471 | | | | | 12,802,706 | |
| | | | | | | | | | |
| | | | | | | | | 42,029,090 | |
| | | | | | | | | | |
Liquids Transportation & Storage—37.9% | | | | | | | | | | |
Canada—22.0% | | | | | | | | | | |
AltaGas, Ltd. | | | | 74,358 | | | | | 1,102,803 | |
Enbridge, Inc.(d) | | | | 489,637 | | | | | 18,606,206 | |
Inter Pipeline, Ltd. | | | | 226,834 | | | | | 3,756,943 | |
TC Energy Corp.(d) | | | | 182,019 | | | | | 9,270,228 | |
| | | | | | | | | | |
| | | | | | | | | 32,736,180 | |
| | | | | | | | | | |
United States—15.9% | | | | | | | | | | |
Genesis Energy LP(a)(b)(d) | | | | 416,429 | | | | | 7,916,315 | |
MPLX LP(b)(d) | | | | 89,790 | | | | | 2,123,533 | |
NGL Energy Partners LP(b)(d) | | | | 467,277 | | | | | 4,640,061 | |
Plains GP Holdings LP, Class A(a)(b)(d) | | | | 451,372 | | | | | 7,885,469 | |
SemGroup Corp., Class A | | | | 68,043 | | | | | 1,045,821 | |
| | | | | | | | | | |
| | | | | | | | | 23,611,199 | |
| | | | | | | | | | |
Natural Gas Pipelines & Storage—44.8% | | | | | | | | | | |
Canada—7.1% | | | | | | | | | | |
Keyera Corp. | | | | 71,464 | | | | | 1,743,694 | |
Pembina Pipeline Corp.(d) | | | | 254,133 | | | | | 8,894,655 | |
| | | | | | | | | | |
| | | | | | | | | 10,638,349 | |
| | | | | | | | | | |
United States—37.7% | | | | | | | | | | |
Energy Transfer LP(a)(b)(d) | | | | 880,554 | | | | | 10,399,343 | |
Enterprise Products Partners LP(a)(b)(d) | | | | 233,576 | | | | | 6,147,720 | |
Kinder Morgan, Inc.(a)(d) | | | | 471,295 | | | | | 9,242,095 | |
NextEra Energy Partners LP(b) | | | | 41,183 | | | | | 2,188,053 | |
ONEOK, Inc.(a)(d) | | | | 131,861 | | | | | 9,368,724 | |
Tallgrass Energy LP, Class A | | | | 56,237 | | | | | 1,007,204 | |
The Williams Companies, Inc.(d) | | | | 778,136 | | | | | 17,679,250 | |
| | | | | | | | | | |
| | | | | | | | | 56,032,389 | |
| | | | | | | | | | |
Oil Service & Other Specialty—1.4% | | | | | | | | | | |
United States—1.4% | | | | | | | | | | |
USA Compression Partners LP(b)(d) | | | | 71,370 | | | | | 1,173,323 | |
Westlake Chemical Partners LP(b) | | | | 43,495 | | | | | 965,154 | |
| | | | | | | | | | |
| | | | | | | | | 2,138,477 | |
| | | | | | | | | | |
| | | | |
| See accompanying Notes to Financial Statements. | | 7 | | |
Schedule of Investments
Salient Midstream & MLP Fund
November 30, 2019
| | | | | | | | | | |
| | | Shares/Units | | Fair Value |
Other Energy & Infrastructure—11.2% | | | | | | | | | | |
United States—11.2% | | | | | | | | | | |
Archrock, Inc. | | | | 220,593 | | | | $ | 1,855,187 | |
Macquarie Infrastructure Corp.(a)(d) | | | | 255,517 | | | | | 10,718,938 | |
Rattler Midstream LP(d) | | | | 257,706 | | | | | 4,100,103 | |
| | | | | | | | | | |
| | | | | | | | | 16,674,228 | |
| | | | | | | | | | |
Refining & Marketing—1.3% | | | | | | | | | | |
United States—1.3% | | | | | | | | | | |
Sunoco LP(b)(d) | | | | 59,801 | | | | | 1,862,801 | |
| | | | | | | | | | |
Utilities—0.7% | | | | | | | | | | |
Canada—0.7% | | | | | | | | | | |
Emera, Inc. | | | | 26,112 | | | | | 1,073,731 | |
| | | | | | | | | | |
Total Master Limited Partnerships and Related Companies
(Cost $153,992,512) | | | | | | | | | 186,796,444 | |
| | | | | | | | | | |
Total Investments—125.6% (Cost $153,992,512) | | | | | 186,796,444 | |
Credit Facility—(26.3%) | | | | | | | | | (39,089,219 | ) |
Other Assets and Liabilities—0.7% | | | | | | | | | 985,942 | |
| | | | | | | | | | |
Total Net Assets Applicable to Common Shareholders—100.0% | | | | | | | | $ | 148,693,167 | |
| | | | | | | | | | |
All percentages disclosed are calculated by dividing the indicated amounts by net assets applicable to common shareholders.
(a) All or a portion of these securities are held as collateral for the written call options. As of November 30, 2019 the total fair value of securities held as collateral for the written call options is $14,816,012.
(b) The security is considered a non-income producing security as the dividends received during the last twelve months are treated as return of capital per the Generally Accepted Accounting Principles.
(c) EMG Utica I Offshore Co-Investment, LP and Noble Midstream Partners LP are restricted securities exempt from registration under the Securities Act of 1933. EMG Utica Co-Investment, LP cannot be sold without consent from the general partner, EMG Utica Co-Investment GP, LLC. Noble Midstream Partners LP may be sold in transactions exempt from registration, normally to qualified institutional buyers. See footnote 2(g) in the Notes to Financial Statements for further information.
(d) All or a portion of these securities are held as collateral for the line of credit agreement. As of November 30, 2019, the total fair value of securities held as collateral for the line of credit agreement is $111,761,949.
| | | | |
| See accompanying Notes to Financial Statements. | | 8 | | |
Schedule of Investments
Salient Midstream & MLP Fund
November 30, 2019
Written Call Options:
| | | | | | | | | | | | | | | | | | | | | | | | | | | | | | | | | | | |
| Description | | Counterparty | | Exercise
Price | | Expiration
Date | | Number of
Contracts | | Notional
Value | | Fair Value | | Unrealized
Appreciation
(Depreciation) |
CNX Midstream Partners LP | | | | Morgan Stanley | | | | $ | 15.00 | | | | | December 2019 | | | | | 111 | | | | $ | 160,950 | | | | $ | (2,775 | ) | | | $ | (1,753 | ) |
Energy Transfer LP | | | | Morgan Stanley | | | | | 12.50 | | | | | December 2019 | | | | | 560 | | | | | 661,360 | | | | | (7,280 | ) | | | | 6,838 | |
Energy Transfer LP | | | | Morgan Stanley | | | | | 13.00 | | | | | December 2019 | | | | | 2,317 | | | | | 2,736,377 | | | | | (13,902 | ) | | | | 51,717 | |
Enterprise Products Partners LP | | | | Morgan Stanley | | | | | 28.00 | | | | | December 2019 | | | | | 233 | | | | | 613,256 | | | | | (582 | ) | | | | 7,624 | |
Genesis Energy LP | | | | Morgan Stanley | | | | | 22.50 | | | | | December 2019 | | | | | 373 | | | | | 709,073 | | | | | (4,662 | ) | | | | 4,742 | |
Kinder Morgan, Inc. | | | | Morgan Stanley | | | | | 21.00 | | | | | December 2019 | | | | | 1,463 | | | | | 2,868,943 | | | | | (3,658 | ) | | | | 21,521 | |
Macquarie Infrastructure Corp. | | | | Morgan Stanley | | | | | 42.50 | | | | | December 2019 | | | | | 568 | | | | | 2,382,760 | | | | | (24,140 | ) | | | | (6,108 | ) |
ONEOK, Inc. | | | | Morgan Stanley | | | | | 75.00 | | | | | December 2019 | | | | | 118 | | | | | 838,390 | | | | | (1,475 | ) | | | | 2,562 | |
Plains GP Holdings LP | | | | Morgan Stanley | | | | | 18.00 | | | | | December 2019 | | | | | 1,354 | | | | | 2,365,438 | | | | | (33,850 | ) | | | | (13,241 | ) |
Targa Resources Corp. | | | | Morgan Stanley | | | | | 44.00 | | | | | December 2019 | | | | | 405 | | | | | 1,479,465 | | | | | (3,038 | ) | | | | 10,817 | |
| | | | | | | | | | | | | | | | | | | | | | | | | | | | | | | | | | | |
| | | | | | | | | | | | | | | | | | | | | | | $ | 14,816,012 | | | | $ | (95,362 | ) | | | $ | 84,719 | |
| | | | | | | | | | | | | | | | | | | | | | | | | | | | | | | | | | | |
Salient Midstream & MLP Fund invested in the following industries as of November 30, 2019:
| | | | | | | | | | |
| | | Value | | % of
Total Investments |
Gathering & Processing | | | $ | 42,029,090 | | | | | 22.5 | % |
Liquids Transportation & Storage | | | | 56,347,379 | | | | | 30.2 | % |
Natural Gas Pipelines & Storage | | | | 66,670,738 | | | | | 35.7 | % |
Oil Service & Other Specialty | | | | 2,138,477 | | | | | 1.1 | % |
Other Energy & Infrastructure | | | | 16,674,228 | | | | | 8.9 | % |
Refining & Marketing | | | | 1,862,801 | | | | | 1.0 | % |
Utilities | | | | 1,073,731 | | | | | 0.6 | % |
| | | | | | | | | | |
Total | | | $ | 186,796,444 | | | | | 100.0 | % |
| | | | | | | | | | |
Salient Midstream & MLP Fund invested in securities with exposure to the following countries as of November 30, 2019:
| | | | | | | | | | |
| | | Value | | % of
Total Investments |
Canada | | | $ | 44,448,260 | | | | | 23.8 | % |
United States | | | | 142,348,184 | | | | | 76.2 | % |
| | | | | | | | | | |
Total | | | $ | 186,796,444 | | | | | 100.0 | % |
| | | | | | | | | | |
| | | | |
| See accompanying Notes to Financial Statements. | | 9 | | |
Statement of Assets, Liabilities and Shareholders’ Equity
Salient Midstream & MLP Fund
November 30, 2019
| | | | | |
Assets: | | | | | |
Investments, at value (cost $153,992,512) | | | $ | 186,796,444 | |
Cash and cash equivalents | | | | 1,143,457 | |
Receivable for investments sold | | | | 227,439 | |
Dividends receivable | | | | 316,732 | |
Prepaids and other assets | | | | 25,865 | |
| | | | | |
Total Assets | | | | 188,509,937 | |
| | | | | |
Liabilities: | | | | | |
Credit Facility | | | | 39,089,219 | |
Written options, at fair value (premiums received $180,081) | | | | 95,362 | |
Payable to advisor | | | | 192,511 | |
Interest payable | | | | 91,344 | |
Line of credit commitment fees payable | | | | 10,076 | |
Accounts payable and accrued expenses | | | | 338,258 | |
| | | | | |
Total Liabilities | | | | 39,816,770 | |
| | | | | |
Net Assets applicable to common shareholders | | | $ | 148,693,167 | |
| | | | | |
Net Assets Applicable to Common Shareholders: | |
Capital Stock, $0.01 par value; 17,722,449 shares issued and outstanding (unlimited shares authorized) | | | $ | 177,224 | |
Paid-in capital | | | | 345,250,970 | |
Total distributable earnings | | | | (196,735,027 | ) |
| | | | | |
Net assets applicable to common shareholders | | | $ | 148,693,167 | |
| | | | | |
Net Asset Value: | | | | | |
Net assets applicable to common shareholders | | | $ | 148,693,167 | |
Common shares outstanding | | | | 17,722,449 | |
Net asset value per common share outstanding | | | $ | 8.39 | |
| | | | |
| See accompanying Notes to Financial Statements. | | 10 | | |
Statement of Operations
Salient Midstream & MLP Fund
Year Ended November 30, 2019
| | | | | |
Investment Income: | |
Distributions from master limited partnerships | | | $ | 6,469,443 | |
Less return of capital on distributions | | | | (6,469,443 | ) |
| | | | | |
Net investment income from master limited partnerships | | | | — | |
Dividends from master limited partnership related companies | | | | 11,671,689 | |
Less return of capital on dividends | | | | (6,090,712 | ) |
| | | | | |
Net investment income from master limited partnership related companies | | | | 5,580,977 | |
Foreign taxes withheld | | | | (369,383 | ) |
| | | | | |
Total Investment Income | | | | 5,211,594 | |
| | | | | |
Operating Expenses: | |
Investment advisory fee | | | | 2,859,129 | |
Management fee | | | | 160,000 | |
Administration fees | | | | 150,414 | |
Custodian fees | | | | 17,060 | |
Interest expense | | | | 2,153,505 | |
Commitment fees | | | | 89,540 | |
Professional fees | | | | 307,152 | |
Transfer agent fees | | | | 21,718 | |
Compliance fees | | | | 85,390 | |
Other expenses | | | | 223,195 | |
| | | | | |
Total Expenses | | | | 6,067,103 | |
| | | | | |
Net Investment Loss | | | | (855,509 | ) |
| | | | | |
Realized and Unrealized Gain (Loss): | | | | | |
Net realized loss on investments | | | | (24,718,304 | ) |
Net realized gain on written options | | | | 700,269 | |
Net realized loss on foreign currency | | | | (2,056 | ) |
| | | | | |
Net realized loss | | | | (24,020,091 | ) |
| | | | | |
Change in unrealized appreciation/depreciation on: | | | | | |
Investments | | | | 7,729,542 | |
Written options | | | | 84,719 | |
| | | | | |
Change in unrealized appreciation/depreciation from investments and written options | | | | 7,814,261 | |
| | | | | |
Net Realized and Unrealized Gain/(Loss) from Investments and Written Options | | | | (16,205,830 | ) |
| | | | | |
Net Decrease in Net Assets Applicable to Common Shareholders Resulting from Operations | | | $ | (17,061,339 | ) |
| | | | | |
| | | | |
| See accompanying Notes to Financial Statements. | | 11 | | |
Statements of Changes in Net Assets
Salient Midstream & MLP Fund
| | | | | | | | | | |
| | | Year Ended
November 30, 2019 | | Year Ended
November 30, 2018 |
Operations: | |
Net investment loss | | | $ | (855,509 | ) | | | $ | (2,177,795 | ) |
Net realized gain/(loss), net of income taxes | | | | (24,020,091 | ) | | | | 2,485,779 | |
Change in unrealized appreciation/depreciation | | | | 7,814,261 | | | | | (8,060,518 | ) |
| | | | | | | | | | |
Net decrease in net assets applicable to common shareholders resulting
from operations | | | | (17,061,339 | ) | | | | (7,752,534 | ) |
| | | | | | | | | | |
Distributions: | | | | | | | | | | |
From distributable earnings | | | | (2,120,677 | ) | | | | (1,017,739 | ) |
From return of capital | | | | (10,001,477 | ) | | | | (12,398,154 | ) |
| | | | | | | | | | |
Total distributions to common shareholders | | | | (12,122,154 | ) | | | | (13,415,893 | ) |
| | | | | | | | | | |
Net decrease in net assets applicable to common shareholders | | | $ | (29,183,493 | ) | | | $ | (21,168,427 | ) |
| | | | | | | | | | |
Net Assets: | |
Beginning of period | | | | 177,876,660 | | | | | 199,045,087 | |
| | | | | | | | | | |
End of period | | | $ | 148,693,167 | | | | $ | 177,876,660 | |
| | | | | | | | | | |
| | | | |
| See accompanying Notes to Financial Statements. | | 12 | | |
Statement of Cash Flows
Salient Midstream & MLP Fund
For the Year Ended November 30, 2019
| | | | | |
Cash Flows from Operating Activities: | | | | | |
Net decrease in net assets resulting from operations | | | $ | (17,061,339 | ) |
Adjustments to reconcile net decrease in net assets resulting from operations to net cash provided by operating activities | | | | | |
Purchase of investments | | | | (105,226,355 | ) |
Proceeds from disposition of investments | | | | 152,766,901 | |
Premiums from written options | | | | 1,508,873 | |
Proceeds paid to cover written options | | | | (532,296 | ) |
Premiums paid on exercised written options | | | | (96,136 | ) |
Net realized loss on investments | | | | 24,718,304 | |
Net realized gain on written options | | | | (700,269 | ) |
Change in unrealized appreciation/depreciation from investments | | | | (7,729,542 | ) |
Change in unrealized appreciation/depreciation from written options | | | | (84,719 | ) |
Change in operating assets and liabilities: | | | | | |
Interest and dividends receivable | | | | (91,601 | ) |
Receivable for investments sold | | | | (227,439 | ) |
Prepaids and other assets | | | | (6,864 | ) |
Interest payable | | | | (121,560 | ) |
Payable to Advisor | | | | (64,348 | ) |
Line of credit commitment fees payable | | | | 2,913 | |
Accounts payable and accrued expenses | | | | 16,528 | |
| | | | | |
Net cash provided by operating activities | | | | 47,071,051 | |
| | | | | |
Cash Flows from Financing Activities: | | | | | |
Advances from credit facility | | | | 47,600,000 | |
Repayments on credit facility | | | | (82,550,000 | ) |
Distributions paid to common shareholders | | | | (12,122,154 | ) |
| | | | | |
Net cash used in financing activities | | | | (47,072,154 | ) |
| | | | | |
Net increase in cash and cash equivalents | | | | (1,103 | ) |
Cash and cash equivalents at beginning of year | | | | 1,144,560 | |
| | | | | |
Cash and cash equivalents at end of period | | | $ | 1,143,457 | |
| | | | | |
Supplemental Schedule of Cash Activity: | | | | | |
Cash paid for interest during the period | | | $ | 2,275,065 | |
Cash paid for line of credit commitment fees during the period | | | | 86,627 | |
| | | | |
| See accompanying Notes to Financial Statements. | | 13 | | |
Financial Highlights
Salient Midstream & MLP Fund
| | | | | | | | | | | | | | | | | | | | | | | | | |
| | | Year Ended
November 30,
2019 | | Year Ended
November 30,
2018 | | Year Ended
November 30,
2017 | | Year Ended
November 30,
2016(a) | | Year Ended
November 30,
2015(a) |
Per Common Share Data:(b) | | | | | | | | | | | | | | | | | | | | | | | | | |
Net Asset Value, beginning of period | | | $ | 10.04 | | | | $ | 11.23 | | | | $ | 14.37 | | | | $ | 14.23 | | | | $ | 27.80 | |
Income/(loss) from operations: | |
Net investment income/(loss)(c) | | | | (0.05 | ) | | | | (0.12 | ) | | | | 0.00 | (d) | | | | 0.11 | | | | | 0.09 | |
Net realized and unrealized gain/(loss) from investments | | | | (0.91 | ) | | | | (0.31 | ) | | | | (2.16 | ) | | | | 1.17 | | | | | (11.99 | ) |
| | | | | | | | | | | | | | | | | | | | | | | | | |
Net increase (decrease) resulting from operations | | | | (0.96 | ) | | | | (0.43 | ) | | | | (2.16 | ) | | | | 1.28 | | | | | (11.90 | ) |
| | | | | | | | | | | | | | | | | | | | | | | | | |
Distributions paid from: | | | | | | | | | | | | | | | | | | | | | | | | | |
Net investment income | | | | — | | | | | — | | | | | — | | | | | (0.11 | ) | | | | (0.09 | ) |
In excess of net investment income | | | | (0.12 | ) | | | | (0.06 | ) | | | | — | | | | | (1.00 | ) | | | | (1.28 | ) |
Net realized gains | | | | — | | | | | — | | | | | — | | | | | — | | | | | (0.20 | ) |
Return of capital | | | | (0.57 | ) | | | | (0.70 | ) | | | | (0.98 | ) | | | | (0.03 | ) | | | | (0.10 | ) |
| | | | | | | | | | | | | | | | | | | | | | | | | |
Net Asset Value, end of period | | | $ | 8.39 | | | | $ | 10.04 | | | | $ | 11.23 | | | | $ | 14.37 | | | | $ | 14.23 | |
| | | | | | | | | | | | | | | | | | | | | | | | | |
Per common share market value, end of period | | | $ | 7.09 | | | | $ | 8.41 | | | | $ | 10.22 | | | | $ | 13.40 | | | | $ | 12.82 | |
| | | | | | | | | | | | | | | | | | | | | | | | | |
Total investment return based on market value(e) | | | | (8.23 | )% | | | | (11.05 | )% | | | | (17.08 | )% | | | | 16.97 | % | | | | (46.45 | )% |
| | | | | | | | | | | | | | | | | | | | | | | | | |
Ratios to Average Net Assets: | | | | | | | | | | | | | | | | | | | | | | | | | |
Net investment income/(loss) | | | | (0.49 | )% | | | | (1.09 | )% | | | | 0.01 | % | | | | 1.01 | % | | | | 0.41 | % |
Net operating expenses (including tax expense/benefit) | | | | 3.49 | % | | | | 3.26 | % | | | | 2.40 | % | | | | 2.34 | % | | | | (1.90 | )% |
Net operating expenses (excluding tax benefit/expense) | | | | 3.49 | % | | | | 3.26 | % | | | | 2.87 | % | | | | 3.09 | % | | | | 2.72 | % |
Supplemental Data: | | | | | | | | | | | | | | | | | | | | | | | | | |
Net assets applicable to common shareholders, end of period (in 000s) | | | $ | 148,693 | | | | $ | 177,877 | | | | $ | 199,045 | | | | $ | 254,618 | | | | $ | 252,157 | |
Average net assets (000s) | | | $ | 173,820 | | | | $ | 200,269 | | | | $ | 236,834 | | | | $ | 201,307 | | | | $ | 396,335 | |
Portfolio turnover | | | | 44.75 | % | | | | 45.27 | % | | | | 23.72 | % | | | | 93.44 | % | | | | 28.64 | % |
Asset coverage per $1,000 unit of senior indebtedness(f) | | | $ | 4,804 | | | | $ | 3,402 | | | | $ | 3,585 | | | | $ | 3,817 | | | | $ | 3,284 | |
Short-term borrowings, end of period (000s) | | | $ | 39,089 | | | | $ | 74,039 | | | | $ | 76,989 | | | | $ | 90,389 | | | | $ | 110,400 | |
(a) At and prior to November 30, 2016, Salient Midstream & MLP Fund presented information on a consolidated basis. See Note 1 for additional information.
(b) Information presented relates to a common share outstanding for periods indicated.
(c) Per share net investment income/(loss) has been calculated using the average daily shares method.
(d) Amount represents less than $0.01 per share.
(e) Total investment return is calculated assuming a purchase of common shares at the current market price on the first day of the period and a sale at the closing market price on the last day of the period reported (excluding brokerage commissions). Dividends and distributions are assumed for the purpose of this calculation to be reinvested at prices obtained under the Dividend Reinvestment Plan (“DRIP”).
(f) Calculated by subtracting the Fund’s total liabilities (not including borrowings) from the Fund’s total assets and dividing by the total number of senior indebtedness units, where one unit equals $1,000 of senior indebtedness.
| | | | |
| See accompanying Notes to Financial Statements. | | 14 | | |
Notes to Financial Statements
November 30, 2019
(1) ORGANIZATION
Salient Midstream & MLP Fund (the “Fund”), a Delaware statutory trust registered under the Investment Company Act of 1940, as amended (the “1940 Act”), commenced operations on May 24, 2012 as anon-diversified,closed-end management investment company. The Fund is authorized to issue an unlimited number of common shares of beneficial interest (“Common Shares”), which may be issued in more than one class or series. The Fund’s Common Shares are listed on the New York Stock Exchange (“NYSE”) under the symbol “SMM”.
The Fund’s objective is to provide a high level of total return with an emphasis on making quarterly cash distributions to its common shareholders. The Fund seeks to achieve its investment objective by investing at least 80% of its total assets in securities of midstream companies and master limited partnerships (“MLPs”).
The board of trustees of the Fund (each member thereof a “Trustee” and collectively, the “Board”) is authorized to engage an investment advisor, and pursuant to an investment management agreement (the “Investment Management Agreement”), it has selected Salient Capital Advisors, LLC (the “Advisor”) to manage the Fund’s portfolio and operations. The Advisor is a Texas limited liability company that is registered as an investment advisor under the Investment Advisers Act of 1940, as amended. Under the Investment Management Agreement, the Advisor is responsible for the establishment of an investment committee (the “Investment Committee”), which is responsible for developing, implementing, and supervising the Fund’s investment program subject to the ultimate supervision of the Board.
Prior to September 30, 2016, the Fund invested up to 25% of its total assets in Salient Midstream & MLP Fund, Inc., a wholly owned subsidiary (the“C-Corp Subsidiary”). TheC-Corp Subsidiary, which was organized under the laws of the State of Delaware, was controlled by the Fund, and was therefore consolidated in the Fund’s financial statements until theC-Corp Subsidiary’s liquidation on September 30, 2016. The Fund invested in theC-Corp Subsidiary in order to gain additional exposure to the investment returns of the MLP markets, within the limitations of the federal tax law requirements applicable to regulated investment companies (“RIC”). In December 2015, the Advisor recommended, and the Board approved, a plan of liquidation of theC-Corp Subsidiary (the “Plan”). As of January 21, 2016, all investments held by theC-Corp Subsidiary were sold and none were transferred to the Fund. Pursuant to the Plan, theC-Corp Subsidiary ceased operation and simultaneously transferred its other assets and liabilities to the Fund. The liquidation of theC-Corp Subsidiary was completed on September 30, 2016. Where the context requires for reporting of years prior to the liquidation, the “Fund” includes both the Fund and theC-Corp Subsidiary.
The Fund owns 100% of the limited partnership interests of EMG Utica I OffshoreCo-Investment, LP (“EMG Utica”). EMG Utica holds a
non-controlling underlying interest in Mark West Utica EMG, L.L.C., which is a joint venture between Mark West Energy Partners, L.P. (“Mark West”) and The Energy and Minerals Group (“EMG”). Mark West is owned by MPLX LP (NYSE: MPLX), which is a U.S. domiciled publicly traded master limited partnership that owns, operates, develops, and acquires midstream energy infrastructure assets. EMG is a private investment firm that targets equity investments in the energy and minerals sector. EMG Utica is considered a variable interest entity (“VIE”) as it is a partnership and the Fund, as the limited partner, lacks the ability to remove the general partner and does not have any substantive participating rights, as these reside with EMG Utica Co-Investment GP, LLC, the general partner for EMG Utica. This means the general partner of EMG Utica has full, exclusive and unilateral power and authority to manage, control, administer and operate the assets and business affairs of EMG Utica. Under Financial Accounting Standards Board (“FASB”) Accounting Standards Codification (“ASC”) Topic 810, “Consolidation”, prior to the adoption of ASC update2015-02, management believed the Fund was the primary beneficiary as it owned 100% of EMG Utica and had the right to receive the economic benefit from the investment, and therefore consolidated EMG Utica in the Fund’s financial statements for the years ended November 30, 2016 and 2015. Under ASC Update2015-02, which the Fund adopted effective the year ended November 30, 2017, consolidation of a VIE’s financial statements would occur if a limited partner has the power to direct the activities and the right to receive the benefits from the entity considered for consolidation. EMG Utica is no longer consolidated within the Fund’s financial statements, effective the year ended November 30, 2017.
(2) SUMMARY OF SIGNIFICANT ACCOUNTING POLICIES AND PRACTICES
(a) BASIS OF ACCOUNTING
The financial statements have been prepared in conformity with generally accepted accounting principles in the United States of America (“U.S. GAAP”). The accompanying financial statements reflect the financial position of the Fund. The Fund is an investment company and follows the investment company accounting and reporting guidance under FASB ASC Topic 946, “Financial Services-Investment Companies”.
(b) CASH EQUIVALENTS
The Fund considers all unpledged temporary cash investments with a maturity date at the time of purchase of three months or less to be cash equivalents.
(c) PORTFOLIO SECURITIES TRANSACTIONS
Security transactions are accounted for on a trade date basis. Realized gains and losses are reported using the specific identification cost basis.
Notes to Financial Statements, continued
November 30, 2019
(d) INVESTMENT VALUATION
The valuation of the Fund’s investments is determined each day based on the most recent close of regular session trading on the NYSE and reported by ALPS Fund Services, Inc., the Fund’s independent administrator (the “Administrator” or “ALPS”).
The Board has formed a valuation committee (the “Board Valuation Committee”) that is responsible for overseeing the Fund’s valuation policies, making recommendations to the Board on valuation-related matters, and overseeing implementation by the Advisor of the Fund’s valuation policies.
The Board has authorized the Advisor to establish a valuation committee of the Advisor (the “Advisor Valuation Committee”). The Advisor Valuation Committee’s function, subject to oversight of the Board Valuation Committee and the Board, is generally to review the Fund’s valuation methodologies, valuation determinations, and any information provided to the Advisor Valuation Committee by the Advisor or the Administrator.
To the extent that the price of a security cannot be determined applying the methods described below, the Advisor Valuation Committee in conjunction with the Administrator will determine the price of the security pursuant to the fair value procedures approved by the Board.
Investments held by the Fund are valued as follows:
| | • | | SECURITIES LISTED ON A SECURITIES EXCHANGE OROVER-THE-COUNTER EXCHANGES—In general, the Fund values those securities at their last sales price on the exchange orover-the-counter market or a market’s official closing price on the valuation date. If the security is listed on more than one exchange, the Fund uses the price from the exchange that it considers to be the principal exchange on which the security is traded. If there have been no sales for that day on the exchange where the security is principally traded, then the price of the security will be valued at the mean between the closing “bid” and “ask” prices on the valuation date. |
| | • | | PUBLICLY-TRADED EQUITY SECURITIES ACQUIRED IN A DIRECT PLACEMENT TRANSACTION—Such securities may be subject to restrictions on resale that can affect the security’s liquidity and fair value. Such securities that are convertible or otherwise will become freely tradable will be valued based on the market value of the freely tradable security less an applicable restriction discount. Generally, the discount will initially be equal to the discount at which the Fund purchased the securities and thereafter will be periodically reassessed and likely reduced over the anticipated restricted period. |
| | • | | DERIVATIVES—Exchange traded futures contracts are valued using quoted final settlement prices from the national exchange on which they are principally traded. If no such price is reported by such exchange on the valuation date, the Advisor Valuation Committee will determine the fair value in good faith using information that is available at such time. |
Options that are listed on a securities exchange are generally valued on the valuation date at the mean of the closing bid and ask prices of the posted market on the exchange on which they are listed. If on the valuation date the primary exchange is closed, the prior day price will be used. If no such price is reported, the fair value of such options will be determined in good faith using industry standard pricing models utilizing publicly available input information on the valuation date.
Options traded on anover-the-counter market are generally valued using the mean of the closing bid and ask prices provided by an independent pricing service. If a quotation is not available from the independent pricing service, the price is obtained from a broker (typically counterparty to the option) on the valuation date. If no such price is available on the valuation date, the Advisor Valuation Committee in conjunction with the Administrator will determine the fair value of such options in good faith using information that is available at such time.
Non exchange-traded derivatives, such as swap agreements, are valued based on procedures approved by the Board. Credit default swaps and total return swaps are generally fair valued using evaluated quotes provided by an independent pricing service. If a quotation is not available from the independent pricing service, the price is obtained from a broker (typically the counterparty to the swap agreement) on the valuation date.
| | • | | SECURITIES NOT ACTIVELY TRADED—The value of securities, derivatives or synthetic securities that are not actively traded on an exchange are determined by obtaining quotes from brokers that normally deal in such securities or by an unaffiliated pricing service that may use actual trade data or procedures using market indices, matrices, yield curves, specific trading characteristics of certain groups of securities, pricing models or a combination of these procedures. Securities for which independent pricing services are not available are valued pursuant to the valuation procedures approved by the Board. |
| | • | | INVESTMENT FUNDS—Investments in investment limited partnerships and shares in unregistered investment funds (“Investment Funds”) for which a market value is not available will generally be valued using the partners’ capital or net |
Notes to Financial Statements, continued
November 30, 2019
| | asset value (the “NAV”) as a practical expedient, as reported by the Investment Fund managers or the administrators of such Investment Funds. These Investment Funds value their underlying investments in accordance with policies established by such Investment Funds. Prior to investing in any Investment Fund, the Adviser Valuation Committee, as part of the due diligence process, conducts a review of the valuation methodologies employed by the Investment Fund to determine whether such methods are appropriate for the asset types. The Adviser Valuation Committee will consider whether it is appropriate, in light of the relevant circumstances, to value shares at NAV as reported by an Investment Fund for valuation purposes, or whether to adjust such reported value to reflect an adjusted fair value. Because of the inherent uncertainty of valuation, fair value may differ significantly from the value that would have been used had readily available markets for the investments in Investment Funds existed. The Fund’s investments in Investment Funds are subject to the terms and conditions of the respective operating agreements and offering memoranda of such Investment Funds. |
| | • | | OTHER—Investments in private placement securities and other securities for which market quotations are not readily available will be valued in good faith by using fair value procedures approved by the Board. Such fair value procedures may consider among other factors discounts to publicly traded issues, time until conversion date, securities with similar yields, quality, type of issue, coupon, duration and rating, and an analysis of the issuer’s financial statements and reports. Valuation techniques such as the market approach and/or income approach may be used when sufficient and reliable data is available. If events occur that affect the value of the Fund’s securities before the NAV has been calculated, the securities so affected will generally be priced using fair value procedures. |
(e) FOREIGN CURRENCY
The accounting records of the Fund are maintained in U.S. dollars. Foreign currency amounts and investments denominated in a foreign currency, if any, are translated into U.S. dollar amounts at current exchange rates on the valuation date. Purchases and sales of investments denominated in foreign currencies are translated into U.S. dollar amounts at the exchange rate on the respective dates of such transactions. The Fund does not isolate the portion of the results of operations resulting from changes in foreign exchange rates on investments from fluctuations arising from changes in market prices of securities held. Such fluctuations are included with the net realized and unrealized gains on investments.
(f) MASTER LIMITED PARTNERSHIPS
Entities commonly referred to as MLPs are generally organized under state law as limited partnerships or limited liability companies. The Fund invests in MLPs receiving partnership taxation treatment under the Internal Revenue Code of 1986, as amended (the “Code”), and whose interests or “units” are traded on securities exchanges like shares of corporate stock. To be treated as a partnership for U.S. federal income tax purposes, an MLP whose units are traded on a securities exchange must receive at least 90% of its income from qualifying sources such as interest, dividends, real property rents, gains on dispositions of real property, income and gains from mineral or natural resources activities, income and gains from the transportation or storage of certain fuels, and, in certain circumstances, income and gains from commodities or futures, forwards and options on commodities. Mineral or natural resources activities include exploration, development, production, processing, mining, refining, marketing and transportation (including pipelines) of oil and gas, minerals, geothermal energy, fertilizer, timber or industrial source carbon dioxide. An MLP consists of a general partner and limited partners (or in the case of MLPs organized as limited liability companies, a managing member and members).
The general partner or managing member typically controls the operations and management of the MLP and has an ownership stake in the partnership or limited liability company. The limited partners or members, through their ownership of limited partner or member interests, provide capital to the entity, are intended to have no role in the operation and management of the entity and receive cash distributions. The Fund’s investments in MLPs consist only of limited partner or member interest ownership. The MLPs themselves generally do not pay U.S. federal income taxes. Thus, unlike investors in corporate securities, direct MLP investors are generally not subject to double taxation (i.e., corporate level tax and tax on corporate dividends). Currently, most MLPs operate in the energy and/or natural resources sector.
(g) RESTRICTED SECURITIES
The Fund may invest up to 30% of its total assets in unregistered or otherwise restricted securities of which up to 10% may be in securities of privately held companies. A restricted security is a security which has been purchased through a private offering and cannot be resold to the general public without prior registration under the Securities Act of 1933 (the “1933 Act”) or pursuant to the resale limitations provided by Rule 144 under the 1933 Act, or an exemption from the registration requirements of the 1933 Act. Certain restricted securities may be resold in transactions exempt from registration, normally to qualified institutional buyers.
Notes to Financial Statements, continued
November 30, 2019
The restricted securities held at November 30, 2019 are identified below and are also presented in the Fund’s Schedule of Investments.
| | | | | | | | | | | | | | | | | | | | | | | | | |
Security | | % of Net
Assets | | Acquisition
Date | | Shares/Units | | Cost | | Fair Value |
Noble Midstream Partners LP | | | | 2.4 | % | | | | 11/20/2019 | | | | | 174,484 | | | | $ | 3,611,819 | | | | $ | 3,629,267 | |
EMG Utica I OffshoreCo-Investment, LP | | | | 15.8 | % | | | | 2/22/2013 | | | | | 16,000,000 | | | | | 16,000,000 | | | | | 23,481,353 | |
| | | | | | | | | | | | | | | | | | | | | | | | | |
Total Restricted Securities | | | | 18.2 | % | | | | | | | | | | | | | $ | 19,611,819 | | | | $ | 27,110,620 | |
| | | | | | | | | | | | | | | | | | | | | | | | | |
(h) INVESTMENT INCOME
Interest income is recognized on the accrual basis. Distributions are recorded on theex-dividend date. Distributions received from the Fund’s investments in MLPs generally are composed of ordinary income, capital gains and return of capital from the MLPs.
(i) USE OF ESTIMATES
The financial statements have been prepared in conformity with U.S. GAAP, which requires management to make estimates and assumptions relating to the reported amounts of assets and liabilities and the disclosure of contingent assets and liabilities at the date of the financial statements and the reported amounts of income and expenses during the reporting period. Actual results may differ from those estimates and such differences may be significant.
(j) DERIVATIVE INSTRUMENTS
The Fund may invest in derivatives in order to meet its investment objectives. The risk in using derivatives varies depending upon the structure of the instruments. All open derivative positions at period end, if any, are presented in the Fund’s Schedule of Investments. The following is a description of the derivative instruments that the Fund has utilized as part of its investment strategy, including the primary underlying risk exposures related to each instrument type.
OPTIONS—The Fund may write equity call options with the purpose of generating realized gains from premiums as a means to enhance distributions to the Fund’s common shareholders. Options are secured by investments, as detailed in the Fund’s Schedule of Investments. A call option on a security is a contract that gives the holder of such call option the right to buy the security underlying the call option from the writer of such call option at a specified price at any time during the term of the option. At the time the call option is sold, the writer of a call option receives a premium from the buyer of such call option. If the Fund writes a call option, it will have the obligation upon exercise of such call option to deliver the underlying security upon payment of the exercise price. As the writer of a covered call option, during the option’s life, the Fund gives up the opportunity to profit from increases in the market value of the security covering the call option above the sum of the premium and the strike price of the call, but the Fund retains the risk of loss should the price of the underlying security decline.
FUTURES CONTRACTS—The Fund may invest in futures contracts as a part of its hedging strategy to manage exposure to interest rate, equity and market price movements, and commodity prices. A futures contract represents a commitment for the future purchase or sale of an asset at a specified price on a specified date. The underlying asset is not physically delivered. Futures contracts are valued at their quoted daily settlement prices. Upon entering into a futures contract, the Fund is required to segregate liquid assets in accordance with the initial margin requirements of the clearinghouse to secure the Fund’s performance. The clearinghouse also requires daily settlement of variation margin representing changes in the value of each contract. Fluctuations in the value of the contracts are recorded as unrealized appreciation (depreciation) until the contracts are closed, when they are recorded as net realized gain (loss) on futures contracts. The primary risks associated with the use of futures contracts are imperfect correlation between changes in fair values of the underlying assets and the prices of futures contracts, and the possibility of an illiquid market. Counterparty risk involving futures is mitigated because a regulated clearinghouse is the counterparty.
SWAP AGREEMENTS—The Fund may invest in swap agreements, including credit default and total return swap agreements, in connection with its hedging strategy to manage market risks.
A total return swap is a bilateral financial contract agreement where one party (the payer) agrees to pay the other (the receiver) the total return on a specified asset or index in exchange for a fixed or floating rate of return. A total return swap allows the receiver or payer to derive the economic benefit of owning or having short exposure to an asset without owning or shorting the underlying asset directly. The receiver is entitled to the amount, if any, by which the notional amount of the total return swap would have increased in value had it been invested in the particular instruments, plus an amount equal to any dividends or interest that would have been received on those instruments. In return, the payer is entitled to an amount equal to a fixed or floating rate of interest (e.g., a reference rate based on the average interest rate at which major global banks can borrow from one another) on the notional amount of the swap plus the amount, if any, by which the notional amount would have decreased in value had it been invested in such instruments, less any dividends or interest. The amounts to which each party is entitled are normally netted against each other at periodic settlement dates, resulting in a single amount that is either due to or from each party.
Notes to Financial Statements, continued
November 30, 2019
A credit default swap gives one party (the buyer) the right to recoup the economic value of a decline in the value of debt securities of the reference issuer if a credit event (a downgrade, bankruptcy or default) occurs. This value is obtained by delivering a debt security of the reference issuer to the party in return for a previously agreed upon payment from the other party (frequently, the par value of the debt security) or receive a net amount equal to the par value of the defaulted reference entity less its recovery value. The Fund is usually a net buyer of credit default swaps.
The Fund as a buyer of a credit default swap would have the right to deliver a referenced debt obligation and receive the par (or other agreed-upon) value of such debt obligation from the counterparty in the event of a default or other credit event by the reference issuer with respect to its debt obligations. In return, the Fund would pay the counterparty a periodic stream of payments over the term of the agreement provided that no event of default or other credit event has occurred. If no default or other credit event occurs, the counterparty would keep the stream of payments and would have no further obligations to the Fund.
In addition to being exposed to the credit risk of the underlying reference entity, swap agreements are subject to counterparty risk, market risk and interest rate risk. Swap agreements utilized by the Fund may not perform as expected. Risks may arise as a result of the failure of the counterparty to perform under the agreement. The loss incurred by the failure of a counterparty is generally limited to the market value and premium amounts recorded. The Fund considers the creditworthiness of each counterparty to a swap agreement in evaluating potential credit risk, and will not enter into any swap agreement unless the Advisor believes the counterparty to the transaction is creditworthy. Additionally, risks may arise from the unanticipated movements in interest rates or in the value of the underlying reference assets. The Fund may use various techniques to minimize credit risk including early termination or reset and payment. Collateral, in the form of cash, is held in broker segregated accounts for swap agreements.
| | | | | |
| | | Liabilities |
| | | Written
Options, at
Fair Value |
Equity Risk Exposure: | | | | | |
Written Call Options | | | $ | 95,362 | |
The following is a summary of the effect of derivative instruments on the Statement of Operations for the period ended November 30, 2019:
| | | | | | | | | | |
| | | Net Realized Gain
on Written Options | | Change in
Unrealized
Appreciation/
Depreciation
on Written Options |
Equity Risk Exposure: | | | | | | | | | | |
Written Call Options | | | $ | 700,269 | | | | $ | 84,719 | |
As described above, the Fund utilized derivative instruments to achieve its investment objective during the year ended November 30, 2019. The Fund may enter into International Swaps and Derivatives Association, Inc. Master Agreements (“ISDA Master Agreement”) or similar agreements with its derivative contract counterparties whereby the Fund may, under certain circumstances, offset with the counterparty certain derivative financial instruments’ payables and/or receivables with collateral held and/or posted and create one single net payment. There were no derivative financial instruments that are subject to enforceable netting arrangements or other similar agreements as of November 30, 2019.
The following is a summary of the average monthly notional value of written options during the year ended November 30, 2019:
| | | | | | | | | | |
| | | Average Monthly
Notional Value | | Notional Value
Outstanding at
November 30, 2019 |
Written Call Options | | | $ | 7,361,526 | | | | $ | 14,816,012 | |
(k) DISTRIBUTIONS TO SHAREHOLDERS
The Fund intends to continue to comply with the requirements under Subchapter M of the Code in order to continue to qualify as a RIC. If so qualified, the Fund will not be subject to federal income tax to the extent it distributes substantially all of its net investment income and net capital gains to its shareholders.
The Fund generally makes quarterly distributions to shareholders. Net realized capital gains, if any, are distributed annually. Distributions from net realized gains may include short-term capital gains. All net short term capital gains are included in ordinary income for tax purposes. Distributions to shareholders are recorded on theex-dividend date. The Fund may also pay, at the end of the calendar year, a special distribution to comply with requirements under the Code.
Each shareholder will automatically be a participant under the Fund’s Dividend Reinvestment Plan (“DRIP”) and have all income distributions and capital gains distributions automatically reinvested in Shares, unless a shareholder otherwise elects to receive distributions in cash. Generally, for U.S. federal income tax purposes, shareholders receiving Shares under the DRIP will be treated as having received a distribution equal to the amount of cash they would have received had the shareholder not participated in the DRIP.
The character of distributions made during the period from net investment income or net realized gains may differ from its ultimate characterization for federal income tax purposes.
The amount of distributions is determined in accordance with federal income tax regulations which may differ from U.S. GAAP. These “book/tax” differences are either considered temporary or permanent in
Notes to Financial Statements, continued
November 30, 2019
nature. To the extent these differences are permanent in nature (e.g., return of capital and differing treatment on partnership investments), such amounts are reclassified within the composition of net assets based on their federaltax-basis treatment; temporary differences (e.g., wash sales, differing treatment on partnership investments, late year ordinary loss deferrals and capital loss carryforwards) do not require a reclassification. Distributions which exceed net investment income and net realized gains for financial reporting purposes but not for tax purposes are reported as distributions in excess of net investment income or net realized gains. To the extent they exceed net investment income and net realized gains for tax purposes, they are reported as return of capital.
(l) CFTC REGULATION
The Commodity Futures Trading Commission (“CFTC”) adopted rules to harmonize conflicting United States Securities and Exchange Commission (the “SEC”) and CFTC disclosure, reporting and recordkeeping requirements for registered investment companies that do not meet an exemption from the definition of commodity pool. The harmonization rules provide that the CFTC will accept the SEC’s disclosure, reporting, and recordkeeping regime as substituted compliance for substantially all of the otherwise applicable CFTC regulations as long as such investment companies meet the applicable SEC requirements. With respect to the Fund, the Advisor has claimed an exemption from the definition of the term “commodity pool operator” under CFTC Regulation 4.5 of the Commodity Exchange Act (“CEA”). As such, the Fund is not currently subject to registration or regulation as a commodity pool under the CEA.
(m) RETURN OF CAPITAL ESTIMATES
Distributions received from the Fund’s investments in MLPs generally are composed of income, capital gains and return of capital. The Fund records investment income and return of capital based on estimates made at the time such distributions are received. Such estimates are based on historical information available from each MLP and other industry sources. These estimates may subsequently be revised based on information received from MLPs after their tax reporting periods are concluded.
For the year ended November 30, 2019, the Fund estimated that approximately 100% of the MLP distributions received and certain distributions received from master limited partnership related companies would be treated as a return of capital. The Fund recorded as return of capital the amount of $12,560,155 of dividends and distributions received from its investments.
(3) FAIR VALUE MEASUREMENTS
The Fund defines fair value as the price that would be received to sell an asset or paid to transfer a liability in an orderly transaction between market participants at the measurement date under current market conditions.
The valuation techniques employed by the Fund, as described below, maximize the use of observable inputs and minimize the use of unobservable inputs in determining fair value. The inputs used to determine the fair value of the Fund’s investments are summarized in the three broad levels listed below:
| | • | | Level 1—unadjusted quoted prices in active markets for identical investments |
| | • | | Level 2—investments with other significant observable inputs (including quoted prices for similar securities, interest rates, prepayment speeds, credit risk, etc.) |
| | • | | Level 3—investments with significant unobservable inputs (including the Fund’s own assumptions in determining the fair value of investments) that are developed based on the best information available |
Changes in valuation techniques may result in transfers in or out of an assigned level within the disclosure hierarchy. The Fund discloses transfers between levels based on valuations at the end of the reporting period. The inputs or methodology used for valuing investments are not necessarily an indication of the risk associated with investing in those investments.
Other assets and securities, which are generally not exchange-traded, or for which market quotations are not readily available, or are deemed unreliable are valued at fair value as determined in good faith by the Advisor Valuation Committee. Fair value pricing may be used for significant events such as securities for which trading has been suspended, prices have become stale or for which there is no currently available price at the close of the NYSE. When observable prices are not available, the Advisor Valuation Committee may use one or more valuation techniques such as the market approach, the income approach, or internal pricing models for which sufficient and reliable data is available. The market approach generally consists of using comparable market data and transactions. The income approach generally consists of estimating future cash flows from an investment to determine the net present value. A significant change in the unobservable inputs could result in a significantly lower or higher fair value measurement. Depending on the source and relative significance of valuation inputs, these investments may be classified as Level 2 or Level 3 in the fair value hierarchy.
The Fund establishes valuation processes and procedures to ensure that the valuation techniques for investments that are categorized within
Notes to Financial Statements, continued
November 30, 2019
Level 3 of the fair value hierarchy are fair, consistent, and appropriate. The Advisor is responsible for developing the Fund’s written valuation processes and procedures, conducting periodic reviews of the valuation policies, and evaluating the overall fairness and consistent application of the valuation policies. The Board Valuation Committee has authorized the Advisor to oversee the implementation of the Board approved valuation procedures by the Administrator. The Advisor Valuation Committee is comprised of various Fund personnel, which include members
from the Fund’s portfolio management and operations groups. The Advisor Valuation Committee meets monthly or as needed, to determine the valuations of the Fund’s Level 3 investments. Fund valuations are required to be supported by market data, industry accepted third-party valuation models, or other methods the Advisor Valuation Committee deems to be appropriate, including the use of internal proprietary valuation models.
The following is a summary categorization of the Fund’s investments based upon the three levels defined above as of November 30, 2019. The breakdown by category of equity securities is disclosed in the Schedule of Investments.
| | | | | | | | | | | | | | | | | | | | | | | | | | | | | | | | | | | |
| | | Level 1 | | Level 2 | | Level 3 | | Investments
Valued at
NAV as a
Practical
Expedient* | | Total |
| | | Investment
Securities | | Investment
Securities | | Other
Financial
Instruments^ | | Investment
Securities | | Investment
Securities | | Investment
Securities | | Other
Financial
Instruments^ |
Master Limited Partnerships and Related Companies | | | $ | 159,685,824 | | | | $ | 3,629,267 | | | | $ | — | | | | $ | — | | | | $ | 23,481,353 | | | | $ | 186,796,444 | | | | $ | — | |
Written Options | | | | — | | | | | — | | | | | (95,362 | ) | | | | — | | | | | | | | | | — | | | | | (95,362 | ) |
| | | | | | | | | | | | | | | | | | | | | | | | | | | | | | | | | | | |
Total | | | $ | 159,685,824 | | | | $ | 3,629,267 | | | | $ | (95,362 | ) | | | $ | — | | | | $ | 23,481,353 | | | | $ | 186,796,444 | | | | $ | (95,362 | ) |
| | | | | | | | | | | | | | | | | | | | | | | | | | | | | | | | | | | |
* In accordance with ASC Subtopic820-10, certain investments that are measured at fair value using the NAV (or its equivalent) practical expedient have not been classified in the fair value hierarchy. The fair value amounts presented in this table are intended to permit reconciliations of the fair value hierarchy to the amounts presented in the Statement of Assets, Liabilities and Shareholders’ Equity.
^ Other financial instruments include any derivative instruments not reflected in the Schedule of Investments as investment securities, such as written call options. The fair value and unrealized gain or loss on these investments are generally presented in the Schedule of Investments.
There were no transfers in or out of Level 3 for the year ended November 30, 2019.
EMG Utica’s latest dissolution date is December 31, 2021, with the ability to extend for up to a maximum of two consecutive one-year periods at the election of the general partner, EMG Utica Co-Investment GP, LLC. The Fund does not have any unfunded commitments in EMG Utica and the investment cannot be sold by the Fund without the consent of EMG Utica Co-Investment GP, LLC. EMG Utica is valued at NAV as a practical expedient as presented in the table above.
(4) CREDIT FACILITY
The Fund maintains a line of credit agreement (the “Agreement”) with Bank of Nova Scotia (“BNS”) which provides a $100,000,000 committed lending facility. Prior to October 9, 2019, BNS provided a $160,000,000 committed lending facility. Borrowings under the Agreement are secured by investments, as detailed in the Fund’s Schedule of Investments. The Agreement provides for a commitment fee of 0.10% per annum on undrawn amounts above a certain threshold plus interest accruing on outstanding borrowed amounts at the one month LIBOR
plus 0.95% per annum. The Fund initially entered the Agreement on November 17, 2014, and the Agreement provides the Fund with a rolling 364 day commitment period. The average principal balance and weighted average interest rate for the year ended November 30, 2019, was approximately $65,309,630 and 3.26%, respectively. At November 30, 2019, the principal balance outstanding was $39,089,219 at an interest rate of 2.65%.
On July 27, 2017, the head of the United Kingdom’s Financial Conduct Authority announced a desire to phase out the use of the London Interbank Offered Rate (“LIBOR”) by the end of 2021. Due to this announcement, there remains uncertainty regarding the future utilization of LIBOR and the nature of any replacement rate. As such, the potential effect of a transition away from LIBOR on the Fund, the Agreement or the financial instruments in which the Fund invests cannot yet be determined.
(5) FEDERAL INCOME TAXES
The Fund intends to continue to comply with the requirements of the Code applicable to RICs and to distribute all of its taxable income to
Notes to Financial Statements, continued
November 30, 2019
shareholders. Also, in order to avoid the payment of any federal excise taxes, the Fund will distribute substantially all of its net investment income and net realized gains on a calendar year basis.
For the tax years ended November 30, 2016 through November 30, 2019, and for all major jurisdictions, management of the Fund has evaluated the tax positions taken or expected to be taken in the course of preparing the Fund’s tax returns to determine whether the tax positions will“more-likely-than-not” be sustained by the Fund upon challenge by the applicable tax authority. Tax positions not deemed to meet themore-likely-than-not threshold and that would result in a tax benefit or expense to the Fund would be recorded as a tax benefit or expense in the current period. For the year ended November 30, 2019, the Fund did not recognize any amounts for unrecognized tax benefit/expense. A reconciliation of unrecognized tax benefit/expense is not provided herein, as the beginning and ending amounts of unrecognized tax benefit/expense are zero, with no interim additions, reductions or settlements.
TheC-Corp Subsidiary, as a corporation, was obligated to pay federal and state income tax on its taxable income. TheC-Corp Subsidiary invested its assets primarily in MLPs, which generally are treated as partnerships for federal income tax purposes. As a limited partner in the MLPs, theC-Corp Subsidiary included its allocable share of the MLP’s taxable income in computing its own taxable income.
For the tax year ended November 30, 2016, and for all major jurisdictions, management of theC-Corp Subsidiary concluded that there are no significant uncertain tax positions that would require recognition in the financial statements.
TheC-Corp Subsidiary’s policy was to classify interest and penalties associated with underpayment of federal and state income taxes, if any, as income tax expense on its Statement of Operations. The tax year ended November 30, 2016 remains open and subject to examination by tax jurisdictions.
In accordance with U.S. GAAP, the Fund has made reclassifications among its capital accounts, primarily attributable to partnership investments. These reclassifications are intended to adjust the components of the Fund’s net assets to reflect the tax character of permanent book/tax differences and have no impact on the net assets or the NAV of the Fund. As of November 30, 2019, the Fund made reclassifications to increase or (decrease) the components of the net assets detailed below:
| | | | | | | | |
Paid-in Capital | | Total
Distributable
Earnings |
| $(887,791) | | $887,791 |
The tax character of dividends paid to shareholders during the tax year ended in 2019 was as follows:
| | | | | | | | |
Ordinary
Income | | Net Long Term
Capital Gains | | Total Taxable
Distributions | | Tax Return of
Capital | | Total
Distributions
Paid |
| $ 2,120,677 | | $— | | $2,120,677 | | $ 10,001,477 | | $12,122,154 |
The tax character of dividends paid to shareholders during the tax year ended in 2018 was as follows:
| | | | | | | | |
Ordinary
Income | | Net Long Term
Capital Gains | | Total Taxable
Distributions | | Tax Return of
Capital | | Total Distributions
Paid |
| $1,017,739 | | $— | | $1,017,739 | | $12,398,154 | | $13,415,893 |
The following information is provided on a tax basis as of November 30, 2019:
| | | | | |
Cost of Investments | | | $ | 176,317,864 | |
| | | | | |
Gross unrealized appreciation | | | | 25,947,639 | |
Gross unrealized depreciation | | | | (15,469,059 | ) |
Net appreciation (depreciation) of foreign currency and derivatives | | | | 84,742 | |
| | | | | |
Net unrealized appreciation (depreciation) | | | | 10,563,322 | |
Undistributed net investment income | | | | — | |
Accumulated realized loss | | | | (207,298,349 | ) |
| | | | | |
Distributable earnings | | | | — | |
Other cumulative effect of timing differences | | | | — | |
| | | | | |
Total accumulated earnings (losses) | | | | (196,735,027 | ) |
| | | | | |
The differences between book-basis andtax-basis unrealized appreciation (depreciation) are primarily due to differences in the timing of recognition of gains and losses on partnership investments, straddle loss deferrals and wash sales for tax and book purposes.
As of the end of the tax year ended November 30, 2019, the Fund also has available for tax purposes unused capital loss carryovers (“CLCOs”) as follows:
| | | | | | | | |
| Short-Term | | Long-Term |
| | $ | 141,813,763 | | | | $ | 65,484,586 | |
| | | | | | | | | |
Notes to Financial Statements, continued
November 30, 2019
(6) INVESTMENT TRANSACTIONS
For the year ended November 30, 2019, the aggregate cost of purchases and proceeds from sales of investments (excluding short-term investments) were $105,226,355 and $140,110,456, respectively.
(7) SERVICE PROVIDERS
ALPS serves as administrator to the Fund. Under the administration agreement, ALPS is responsible for administrative, accounting and recordkeeping services of the Fund.
Citibank, N.A. serves as the Fund’s custodian.
Computershare, Inc. serves as the transfer agent, DRIP Plan Administrator agent and dividend paying agent for the Fund.
(8) RELATED PARTY TRANSACTIONS
INVESTMENT MANAGEMENT FEE
In consideration of the advisory and other services provided by the Advisor, under the terms of the Investment Management Agreement between the Advisor and the Fund, the Fund pays the Advisor a management fee equal to 1.20% annually of the average monthly total assets of the Fund. For purposes of calculating the management fee, the “average total assets” for each monthly period are determined by averaging the total assets on the last business day of that month with the total assets on the last business day of the prior month. The fee is accrued daily and payable monthly.
In connection with the investment in EMG Utica, the Fund pays a management fee to EMG MUH, LP, an affiliate of EMG Utica, calculated at 1.0% annually of the contributed capital. The fee is payable quarterly in advance.
Also in connection with the investment in EMG Utica, the Fund is entitled to distributions in accordance with the terms of the limited partnership agreement. The terms of the limited partnership agreement allows for a portion of certain distributions to be paid to EMG MUH, LP as “carried interest” and represents a share of the profits.
(9) TRUSTEE AND OFFICER FEES
The Fund’s operations are managed under the direction and oversight of the Board of Trustees. The Board of Trustees appoints Officers of the Fund who are responsible for the Fund’sday-to-day business decisions based on policies set by the Board of Trustees. The Officers serve at the pleasure of the Board of Trustees.
The Fund does not pay any compensation directly to the Officers or Trustees who are also Trustees, Officers or employees of Salient
Management or its affiliates, except as noted below. As of November 30, 2019, there were six Trustees, five of whom are not “interested persons” of the Fund within the meaning of that term under the 1940 Act (each, an “Independent Trustee”). The Trustees of the Fund may also serve as Trustees of other registered investment companies managed by the Advisor and its affiliates, including Salient MF Trust and Forward Funds (together with the Fund, the “Trusts”). Each fund within the Trusts pays Independent Trustees an allocated portion of the retainer of $50,000 per year. Each fund within the Trusts pays Independent Trustees an allocated portion of the amounts of: $6,250 for attendance in person at a regular meeting and $1,500 for attendance by telephone at a regular meeting; $1,500 for attendance in person or by video conference at a special meeting that is not held in conjunction with a regular meeting and $1,500 for attendance by telephone at a special meeting that is not held in conjunction with a regular meeting; and $1,500 per day for participation in Trust-related meetings not held in conjunction with a meeting. The Chairman of the Board of Trustees, the Chairman of the Audit Committee, the Chairman of the Nominating Committee, the Chairman of the Valuation Committee, and the Chairman of the Compliance Committee receive a special retainer fee in the amount of $16,000, $6,000, $5,000, $2,500 and $5,000, respectively per year. In addition, each member of the Audit Committee, Nominating Committee and Compliance Committee receives $1,000, respectively per year, and each member of the Valuation Committee receives $500 per year. In the interest of retaining Independent Trustees of the highest quality, the Board intends to periodically review such compensation and may modify it as the Board deems appropriate. The interested Trustees receive no compensation from the Fund. In addition, Independent Trustees receive reimbursements for reasonableout-of-pocket expenses incurred for their services as a Trustee, including for the transportation and other expenses that they incur in attending meetings.
The Chief Compliance Officer of the Fund (“CCO”) is an employee of, and is compensated by, the Advisor. As of November 30, 2019, the Fund has agreed to pay the Advisor approximately $86,000 per year as (i) an allocated portion of the compensation of an officer or employee of the Advisor to serve as CCO for the Fund (plus the cost of reasonable expenses related to the performance of the CCO’s duties, including travel expenses), and (ii) an allocation of the expenses of other officers or employees of the Advisor who serve in other compliance capacities for the Fund. The Board approves annually an allocation of such costs among such personnel, and the Fund bears its pro rata share of such expense. Other affiliated funds and registered investment companies managed by the Advisor pay additional compensation for the same purposes.
(10) INDEMNIFICATIONS
Under the Fund’s organizational documents, its Officers and Trustees are indemnified against certain liability arising out of the performance of their duties with respect to the Fund. In addition, in the normal course of
Notes to Financial Statements, continued
November 30, 2019
business, the Fund enters into contracts with vendors and others that provide general indemnification. The Fund’s maximum exposure under these arrangements is unknown, as this would involve future claims that may be made against the Fund. Based on experience, however, the Fund expects the risk of loss to be remote.
(11) RISK CONSIDERATIONS
The following summary of certain common principal risk factors is not meant to be comprehensive of all the Fund’s risks.
(a) GENERAL MARKET RISK
An investment in the Fund’s common shares represents an indirect investment in the securities owned by the Fund, some of which will be traded on a national securities exchange or in theover-the-counter markets. The value of the securities in which the Fund invests, like other market investments, may move up or down, sometimes rapidly and unpredictably. The value of the securities in which the Fund invests may affect the value of the Fund’s common shares. An investment in the Fund’s common shares at any point in time may be worth less than the original investment, even after taking into account the reinvestment of the Fund’s distributions.
(b) CONCENTRATION RISK
The Fund’s investment portfolio is concentrated in MLPs and midstream companies. The focus of the portfolio on a specific industry or industries within the midstream sector may present more risks than if the portfolio was broadly diversified over numerous sectors of the economy. A downturn in one or more industries within the midstream sector would have a larger impact on the Fund than on an investment company that does not concentrate solely in MLPs and midstream companies. To the extent that the Fund invests a relatively high percentage of the Fund’s assets in the obligations of a limited number of issuers, the Fund may be more susceptible than more widely diversified investment companies to any single economic, political or regulatory occurrence.
(c) LEVERAGE RISK
Financial leverage represents the leveraging of the Fund’s investment portfolio. The use of leverage can amplify losses. Unless the income and capital appreciation, if any, on securities acquired with the proceeds from financial leverage exceed the costs of such financial leverage, the use of leverage could cause the Fund’s NAV to decline. When financial leverage is used, the NAV and market value of the Fund’s common shares will be more volatile. There is no assurance that the Fund’s use of financial leverage will be successful.
(d) DERIVATIVES RISK
The Fund may purchase and sell derivative instruments (including, but not limited to, options, futures contracts and swap agreements). The use of derivatives has risks, including high price volatility, government intervention,non-performance by the counterparty, the imperfect correlation between the value of such instruments and the underlying assets, the possible default of the other party to the transaction and the illiquidity of the derivative investments. Furthermore, the ability to successfully use these techniques depends on the Advisor’s ability to predict pertinent market movements, which cannot be assured. The use of derivatives may result in losses greater than if they had not been used, may require the Fund to sell or purchase portfolio securities at inopportune times or for prices other than current market values, may limit the amount of appreciation the Fund can realize on an investment or may cause the Fund to hold a security that the Fund might otherwise sell. In addition, amounts paid by the Fund as premiums and cash or other assets held in margin accounts with respect to derivative transactions are not otherwise available to the Fund for investment purposes.
(e) COUNTERPARTY RISK
The Fund will be subject to the risk of the inability of counterparties to perform with respect to transactions, whether due to a contract dispute, insolvency, liquidity or other causes, which could subject the Fund to substantial losses. This risk increases and becomes more concentrated as the number of Fund counterparties decreases. Counterparty risk also increases with the Fund’s use of certainover-the-counter derivatives, which lack some of the safeguards afforded on a regulated exchange. Counterparty defaults may have a negative impact beyond the value of the contract as it could lead to the encumbrance of Fund collateral.
(f) CURRENCY RISK
Currency risk refers to the possibility that changes in currency exchange rates will negatively affect securities denominated in, and/or receiving revenues in, foreign currencies. The liquidity and trading value of foreign currencies could be affected by global economic factors, such as inflation, interest rate levels, and trade balances among countries, as well as the actions of sovereign governments. Adverse changes in currency exchange rates (relative to the U.S. dollar) may erode or reverse any potential gains from the Fund’s investments in securities denominated in a foreign currency or may widen existing losses. The Fund’s net currency positions may expose it to risks independent of its securities positions.
(g) MIDSTREAM RISK
Midstream Companies and MLPs and other entities that provide crude oil, refined product and natural gas services are subject to supply and
Notes to Financial Statements, continued
November 30, 2019
demand fluctuations in the markets they serve which may be impacted by a wide range of factors including fluctuating commodity prices, weather, increased conservation or use of alternative fuel sources, increased governmental or environmental regulation, depletion, rising interest rates, declines in domestic or foreign production, accidents or catastrophic events, and economic conditions, among others.
(12) CAPITAL SHARE TRANSACTIONS
The Fund has an unlimited number of shares of capital stock authorized, $0.01 par value per share, and 17,722,449 shares issued and outstanding at November 30, 2019. There was no capital share activity for the period ended November 30, 2019.
(13) ACCOUNTING PRONOUNCEMENTS
In August 2018, the FASB issued ASU 2018-13, which changes the fair value measurement disclosure requirements of FASB ASC Topic 820,
Fair Value Measurement. The update to Topic 820 includes new, eliminated, and modified disclosure requirements. ASU 2018-13 is effective for fiscal years beginning after December 15, 2019, including interim periods. Management has fully adopted ASU 2018-13 which have been included in the preceding Notes to the Financial Statements.
(14) SUBSEQUENT EVENTS
The Fund has evaluated the need for additional disclosures and/or adjustments resulting from subsequent events through the date the financial statements were issued. Based on this evaluation, no adjustments were required to the financial statements as of November 30, 2019.
Supplemental Information (Unaudited)
November 30, 2019
The table below shows each Trustee and executive officer’s full name, year of birth, the position held with the Fund, the length of time served in that position, his/her principal occupation during the past five years, and other directorships held by such Trustee. The address of each Trustee and officer is c/o Salient Midstream & MLP Fund, 4265 San Felipe, 8th Floor, Houston, Texas 77027.
Interested Trustees*
| | | | | | | | |
| Name and Year of Birth | | Position(s) Held with the Fund | | Principal Occupation(s)
During the Past 5 Years | | Number of
Portfolios in
Fund Complex
Overseen by
Trustee(1) | | Other Directorships
During Past 5 Years** |
John A. Blaisdell* Year of Birth: 1960 | | Trustee (since inception) | | Managing Director of Salient (since 2002). | | 6 | | Salient Private Access Funds (investment companies) (four funds) (since 2004); Endowment PMF Funds (investment companies) (three funds) (since 2014); Salient MF Trust (investment company) (two funds) (since 2012); Forward Funds (investment company) (three funds) (since 2015). |
Independent Trustees
| | | | | | | | |
| Name and Year of Birth | | Position(s) Held with the Fund | | Principal Occupation(s)
During the Past 5 Years | | Number of
Portfolios in
Fund Complex
Overseen by
Trustee(1) | | Other Directorships
During Past 5 Years** |
Julie Allecta Year of Birth: 1946 | | Trustee (since 2018) | | Retired Partner, Paul Hastings, Janofsky & Walker LLP (1999-2009); Trustee, Litman Gregory Masters Funds Trust (since 2013); Member of Executive Committee and Governing Council, Independent Directors Council (since 2014); Director, WildCare Bay Area (2007-2017). | | 6 | | Litman Gregory Funds Trust (since 2013); Salient MF Trust (investment company) (two funds) (since 2015); Forward Funds (investment company) (three funds) (since 2012). |
Jonathan P. Carroll Year of Birth: 1961 | | Trustee (since inception) | | President, Lazarus Capital LLC (Investment company) (since 2006); President, Lazarus Energy Holdings, LLC (Investment holding company) (since 2006); President and CEO of Blue Dolphin Energy Company (since 2012); private investor (since 1988). | | 6 | | Salient Private Access Funds (investment companies) (four funds) (since 2004); Endowment PMF Funds (investment companies) (three funds) (since 2014); LRR Energy, L.P. (LRE) (energy company) (2014-2015); Blue Dolphin Energy Company (BDCO) (energy company) (since 2014); Salient MF Trust (investment company) (two funds) (since 2012); Forward Funds (investment company) (three funds) (since 2015). |
Supplemental Information, continued (Unaudited)
November 30, 2019
| | | | | | | | |
| Name and Year of Birth | | Position(s) Held with the Fund | | Principal Occupation(s)
During the Past 5 Years | | Number of
Portfolios in
Fund Complex
Overseen by
Trustee(1) | | Other Directorships
During Past 5 Years** |
A. John Gambs Year of Birth: 1945 | | Trustee (since 2018); Audit Committee Chairperson (since 2018) | | Director and Compensation Committee Chair, NMI Holdings, Inc. (2011-2012); Trustee and Audit Committee Chair, Barclays Global Investors Funds (2006-2010); Trustee and Audit Committee Chair, Master Investment Portfolio (2006-2010); Advisory Board Member, Fairview Capital Management (since 2009); Director, San Francisco Classical Voice (2011-2016); Member, Board of Governors San Francisco Symphony (since 2001); Director, The New Century Chamber Orchestra (since 2010); Executive Vice President and Chief Financial Officer, The Charles Schwab Corporation (1988-1996); President and Director, Gambs Family Foundation (1997-2010). | | 6 | | Salient MF Trust (investment company) (two funds) (since 2015); Forward Funds (investment company) (three funds) (since 2012). |
Dr. Bernard A. Harris, Jr. Year of Birth: 1956 | | Trustee (since inception) | | Chief Executive Officer and Managing Partner, Vesalius Ventures, Inc. (venture investing) (since 2002); CEO, National Math and Science Initiative(non-profit) (since 2018); President and Founder, The Harris Foundation(non-profit) (since 1998); clinical scientist, flight surgeon and astronaut for NASA (1986-1996). | | 6 | | Salient Private Access Funds (investment companies) (four funds) (since 2009); Babson Funds (eleven funds) (since 2011); Monebo Technologies Inc. (since 2009); The National Math and Science Initiative (since 2008); Communities in Schools (since 2007); American Telemedicine Association (2007-2014); U.S. Physical Therapy, Inc. (since 2005); Houston Technology Center (2004-2016); The Harris Foundation, Inc. (since 1998); Salient MF Trust (investment company) (two funds) (since 2012); Forward Funds (investment company) (three funds) (since 2015). |
Supplemental Information, continued (Unaudited)
November 30, 2019
| | | | | | | | |
| Name and Year of Birth | | Position(s) Held with the Fund | | Principal Occupation(s)
During the Past 5 Years | | Number of
Portfolios in
Fund Complex
Overseen by
Trustee(1) | | Other Directorships
During Past 5 Years** |
Haig G. Mardikian Year of Birth: 1947 | | Trustee
(since 2018) | | Owner of Haig G. Mardikian Enterprises, a real estate investment business (since 1971); General Partner of M&B Development, a real estate investment business (since 1983); General Partner of George M. Mardikian Enterprises, a real estate investment business (1983-2002); President and Director of Adiuvana-Invest, Inc., a real estate investment business (since 1989); President of the William Saroyan Foundation (since 1992); Managing Director of the United Broadcasting Company, radio broadcasting (1983-2001); Trustee of the International House of UC Berkeley (2001-2007); Director of the Downtown Association of San Francisco (1982-2006); Director of the Market Street Association (1982-2006); Trustee of Trinity College (1998-2007); Trustee of the Herbert Hoover Presidential Library (since 1997); Trustee of the Herbert Hoover Foundation (since 2002); Trustee of the Advisor California Civil Liberties Public Education Fund (1997-2006); Director of The Walnut Management Co., a privately held family investment company (since 2008); President of the Foundation of City College (2006-2010); Director of Near East Foundation (since 2007). | | 6 | | Salient MF Trust (investment company) (two funds) (since 2015); Forward Funds (investment company) (three funds) (since 1998); Chairman and Director of SIFE Trust Fund (1978-2001). |
* This person’s status as an “interested” Trustee arises from his affiliation with the Advisor.
** This column includes only directorships of companies required to report to the SEC under the Securities Exchange Act of 1934 (i.e., public companies) or other investment companies registered under the 1940 Act.
(1) The Fund Complex for the purposes of this table consists of five(5) open-end funds in the Salient MF Trust and the Forward Funds (each, a “Trust”), with the series of each Trust being advised by either the Advisor or an affiliate of the Advisor; andone (1) public closed-end fund advised by either the Advisor or an affiliate of the Advisor. These figures reflect the liquidation of Salient International Small Cap Fund, a series of Forward Funds, on December 12, 2019.
Supplemental Information, continued (Unaudited)
November 30, 2019
Officers of the Fund Who Are Not Trustees***
| | | | |
| Name and Year of Birth | | Position(s) with the Fund | | Principal Occupation(s) During Past 5 Years |
Gregory A. Reid Year of Birth: 1965 | | President and Chief Executive Officer (since inception) | | Trustee, Salient Midstream & MLP Fund (2012-2018); President, MLP Complex, Salient, since 2011; Managing Partner (Houston), Telemus Capital Partners (2007-2010); Senior Vice President, Merrill Lynch Private Banking Group (1997-2007). |
Matt Hibbetts Year of Birth: 1982 | | Vice President (since 2018) | | Chief Financial Officer, Salient (since 2018); Vice President, Salient MF Trust (since 2018); Vice President, Forward Funds (since 2018); Vice President, Salient Midstream & MLP Fund (since 2018); Chief Operating Officer—MLP Investments, Salient (2013-2018). |
Thomas Dusenberry Year of Birth: 1977 | | Treasurer and Principal Financial Officer (since 2020) | | Assistant Treasurer, Salient MF Trust (April 2019-December 2019); Assistant Treasurer, Salient Midstream and MLP Fund (April 2019-December 2019); Assistant Treasurer, Forward Funds (April 2019-December 2019); Principal Financial Officer (since 2018) and Treasurer (since 2020), Salient Private Access Funds (four funds); Principal Financial Officer (since 2018) and Treasurer (since 2020), Endowment PMF Funds (three funds); Director of Fund Operations, Salient (since 2016); Vice President of Fund Accounting and Administration, Citi Fund Services Ohio, Inc. (2001 to 2016). |
Paul A. Bachtold Year of Birth: 1973 | | Chief Compliance Officer (since inception) | | Chief Compliance Officer and Secretary, Forward Securities (since 2016); Chief Compliance Officer, Forward Funds (since 2016); Chief Compliance Officer, Forward Management, LLC (since 2015); Chief Compliance Officer, Salient Private Access Funds (since 2010); Chief Compliance Officer, Endowment PMF Funds (since 2014); Chief Compliance Officer, Salient (since 2010); Chief Compliance Officer, Salient Midstream & MLP Fund (since 2012); Chief Compliance Officer, Salient MF Trust (since 2012). |
Kristen Bayazitoglu Year of Birth: 1981 | | Secretary (Since 2018) | | Secretary, Forward Funds (since 2018); Secretary, Salient MF Trust (since 2018); Secretary, Salient Midstream & MLP Fund (since 2018); Vice President, Forward Funds (2017-2018); Vice President, Salient MF Trust (2017-2018); Vice President, Salient Midstream & MLP Fund (2017-2018); Chief Operating Officer, Salient Partners, L.P. (since 2017); Vice President, Salient Private Access Funds (since 2017); Vice President, Endowment PMF Funds (since 2017); Vice President of Operations, Salient Partners, L.P. (March 2012 – June 2017). |
*** Barbara H. Tolle served as the Treasurer and Principal Financial Officer of the Fund during the fiscal year ended November 30, 2019. Ms. Tolle served from March 16, 2017 through her resignation on December 31, 2019.
FormN-Q &N-PORT Filings
The Fund files its complete schedule of portfolio holdings with the SEC for the first and third quarters of each fiscal year as an exhibit to its reports on FormN-PORT. The Fund’s FormN-PORT reports are available on the SEC’s web site at http://www.sec.gov. Prior to August 31, 2019, the Fund filed its complete schedule of portfolio holdings with the SEC for the first and third quarters of each fiscal year on FormN-Q. The Fund’s FormN-Q’s are available on the SEC’s website at http://www.sec.gov.
Supplemental Information, continued (Unaudited)
November 30, 2019
Forward-Looking Statements
This report contains “forward-looking statements” within the meaning of the 1933 Act and the Securities Exchange Act of 1934. By their nature, all forward-looking statements involve risks and uncertainties, and actual results could differ materially from those contemplated by the forward-looking statements. Several factors that could materially affect the Fund’s actual results are the performance of the portfolio of investments held by it, the conditions in the U.S. and international financial, petroleum and other markets, the price at which shares of the Fund will trade in the public markets and other factors discussed in filings with the SEC.
Proxy Voting Policies
The Fund is required tofile Form N-PX, with its complete proxy voting record for the twelve months ended June 30, no later than August 31 of each year. A description of the policies and procedures that the Fund uses to determine how to vote proxies relating to portfolio securities and information regarding how the Fund voted proxies for the period ended June 30 of each year will be available: (i) without charge, upon request, by calling (800)809-0525, or (ii) by visiting the SEC’s website at www.sec.gov.
Statement of Additional Information
The Statement of Additional Information (“SAI”) includes additional information about the Fund’s Trustees and is available upon request without charge by calling (800)809-0525 or by visiting the SEC website at http://www.sec.gov.
Certifications
The Fund’s Chief Executive Officer has submitted to the NYSE the annual CEO certification as required by Section 303A.12(a) of the NYSE Listed Fund Manual.
Board Consideration of the Investment Management Agreement
Atan in-person meeting of the Board held on October 22, 2019, the Board, including the Trustees who are not “interested persons” as that term is defined in the Investment Company Act of 1940, as amended (the “Independent Trustees”), considered and approved the continuation of the Investment Management Agreement (the “Advisory Agreement”) between the Fund and the Advisor. In preparation for review of this agreement, the Board requested the Advisor to provide detailed information which the Board determined to be reasonably necessary to evaluate the agreement. The Independent Trustees held a telephonic meeting of the Board on October 4, 2019 (the“Pre-15(c) Meeting”) to review and discuss materials from the Advisor, and alsomet in-person among themselves prior to the October 22, 2019 meeting to review and discuss the response materials of the Advisor in support of the consideration of the Advisory Agreement. At the request of the Independent Trustees, the Advisor made presentations regarding the materials and responded to questions from the Independent Trustees relating to, among other things, portfolio management, the Fund’s investment program, Fund and Advisor compliance programs, Fund performance including benchmarks and comparisons to other funds, Fund fee levels, other portfolios (including fees) managed by the Advisor and its affiliates and the Advisor’s profitability (including revenue of the Advisor across all its funds). The Board, including the Independent Trustees, also took into consideration information furnished for the Board’s review and consideration throughout the year at regular Board meetings. The Independent Trustees were assisted at all times by independent counsel.
The Independent Trustees met with counsel in executive session without the presence of Advisor personnel, along with independent counsel. After the executive session was adjourned, the meeting was reconvened and the other attendees rejoined the meeting. The Independent Trustees reported that the extensive prior discussions among themselves and with independent counsel, including during thePre-15(c) call, and their reviews of the Advisor’s response materials, left them satisfied that the Advisor had responded to requests. The Independent Trustees further reported that they had concluded that the Advisory Agreement enables the Fund’s shareholders to obtain high quality services at a cost that is appropriate, reasonable, and in the interests of investors. The Independent Trustees also reported that they took into account many factors, including overall down energy and MLP markets and the Fund’s leverage and fee structure, and believed management has taken reasonable steps in managing the Fund related to the energy markets. They stated that in light of the Advisor’s efforts, the prudent exercise of judgment warranted renewal of the advisory fee. It also was noted that the Board’s decision to renew the Advisory Agreement was not based on any single factor, but rather was based on a comprehensive consideration of all the information provided to the Board at its meetings throughout the year. Upon consideration of these and other factors, the Board also determined:
The nature, extent and quality of the advisory services provided.With respect to the Advisory Agreement, the Board considered: the specialized expertise required to manage the Fund’s strategy, personnel and staffing at the Advisor, the background and experience of key investment personnel;
Supplemental Information, continued (Unaudited)
November 30, 2019
the Advisor’s focus on analysis of complex asset categories; the Advisor’s disciplined investment approach and commitment to investment principles; the Advisor’s significant investment in and commitment to personnel, including hiring and extensive training; the Advisor’s significant compliance, risk oversight and tax reporting efforts; and, the Advisor’s oversight of and interaction with service providers.
The Board concluded that the nature, extent and quality of the management and advisory service provided were appropriate and thus supported a decision to renew the Advisory Agreement. The Board also concluded that the Advisor would be able to provide during the coming year quality of investment management and related services, and that these services are appropriate in scope and extent in light of the Fund’s operations, the competitive landscape and investor needs.
The investment performance of the Fund. The Board evaluated the comparative information provided by the Advisor regarding the Fund’s investment performance, distributions and information on the performance of other investment funds and indices, including the relevance of various indices. The Board also considered the various performance reports received throughout the year. The Board noted the drawdown in the MLP and energy markets and declines in energy prices during the year. On the basis of the Trustees’ assessment, the Trustees concluded that the Advisor, although faced with declines in the Fund’s area of investment focus during the year, was capable of generating a level of investment performance that is appropriate in light of the Fund’s investment objective, policies and strategies and competitive with comparable funds.
The cost of advisory service provided and the level of profitability.In analyzing the cost of services and profitability of the Advisor, the Board considered the revenues earned and expenses incurred by the Advisor. The Board took into account the significant investment by and cost to the Advisor in appropriate personnel and service infrastructure to support the operations and management of the Fund. On the basis of the Board’s review of the fees charged by the Advisor for investment advisory and related services, the specialized nature of the Fund’s investment program, the Fund’s use of leverage, the Advisor’s financial information and the costs associated with managing the Fund, the Board concluded that the level of investment management fees, and the Advisor’s profitability, are reasonable in light of the services provided, the management fees and overall expense ratios of comparable investment companies, and the anticipated profitability of the relationship between the Fund and the Advisor.
The extent to which economies of scale would be realized as the Fund grows and whether fee levels reflect these economies of scale for the benefit of Fund investors.While noting that the management fees will not decrease as the level of Fund assets increase, the Board concluded that as aclosed-end fund of a relatively fixed-scale the management fees reflect the Fund’s complex operations, the current markets for the MLP asset category, the economic environment for the Advisor, including its continued investment relating to support and monitoring of the Fund, and the competitive nature of the investment company market as relevant to the Fund. The Board noted that it would have the opportunity to periodicallyre-examine the matter of economies of scale, as well as the appropriateness of management fees payable to the Advisor.
Benefits (such as soft dollars) to the Advisor from its relationship with the Fund.The Board concluded that other benefits derived by the Advisor from its relationship with the Fund, to the extent such benefits are identifiable or determinable, are reasonable and fair, result from the provision of appropriate services to the Fund and investors therein, and are consistent with industry practice and the best interests of the Fund and its partners. In this regard, the Board noted that although the Advisor may use soft dollars, it has not done so to date with respect to the Fund.
Other considerations. The Board determined that the Advisor has made a continuing and substantial commitment both to the recruitment of high quality personnel, monitoring and investment decision-making, and maintained and expanded the financial, compliance and operational resources reasonably necessary to manage the Fund in a professional manner that is consistent with the best interests of the Fund and its investors. The Trustees also concluded that the Advisor continues to make a significant entrepreneurial commitment to the management and success of the Fund.
Additional Tax Information (Unaudited)
November 30, 2019
The following Funds designate the percentages listed below of the income dividends distributed between January 1, 2018 and December 31, 2018, as qualified dividend income (QDI) as defined in Section 1(h)(11) of the Internal Revenue Code:
| | | | | |
Salient Midstream & MLP Fund | | | | 100.00 | % |
The following Funds designate the percentages listed below of the income dividends distributed between January 1, 2018 and December 31, 2018, as qualifying for the corporate dividends received deduction (DRD) as defined in Section 854(b)(2) of the Internal Revenue Code:
| | | | | |
Salient Midstream & MLP Fund | | | | 100.00 | % |
Privacy Policy (Unaudited)
The Fund recognizes the importance of securing personal financial information. It is our policy to safeguard any personal and financial information that may be entrusted to us. The following is a description of the Fund’s policy regarding disclosure of nonpublic personal information.
We collect nonpublic personal information as follows:
We collect information about our investors, including, but not limited to, the investor’s name, address, telephonenumber, e-mail address, social security number and date of birth. We collect that information from subscription agreements, other forms of correspondence that we receive from investors, from personal conversations and from affiliated entities as permitted by law.
We receive information about investor transactions with us, including, but not limited to, account number, account balance, investment amounts, withdrawal amounts and other financial information.
We are permitted by law to disclose nonpublic information we collect, as described above, to the Fund’s service providers, including the Fund’s investmentadvisor, sub-advisors, servicing agent, independent administrator, custodian, legal counsel, accountant and auditor. We do not disclose any nonpublic information about our current or former investors to nonaffiliated third parties, except as required or permitted by law.
You may contact us at any time to manage the information we have about you.
You may request from us information about the categories of information we have collected about you, the categories of sources from which your information was collected, the business or commercial purpose for collecting your information, the categories of third parties with whom we share your information, and the specific pieces of information we have about you. You may email us at privacy@salientpartners.com with “Request for Information” in the subject line and in the body of your message to request this information.
You may also request that we delete any information about you that we collected from you. You may email us at privacy@salientpartners.com with “Request to Delete Information” in the subject line and in the body of your message. There are circumstances where we may not be able to fulfil your request and we will let you know if one of those situations arises.
We reserve the right to verify your identity before we process any request relating to your information.
We restrict access to investor nonpublic personal information to those persons who require such information to provide products or services to investors. We maintain physical, electronic and procedural safeguards that comply with federal standards to guard investors’ nonpublic personal information.
If an investor’s investment relationship with the Fund involves a financial intermediary, including, but not limited to, a broker-dealer, bank or trust company, the privacy policy of such investor’s financial intermediary would govern how any nonpublic personal information would be shared by them with nonaffiliated third parties.


4265 San Felipe
8th Floor
Houston, Texas 77027
800-809-0525
www.salientpartners.com
Salient Midstream & MLP Fund
NYSE: SMM
11/19
(a) The registrant has adopted a code of ethics that applies to the registrant’s principal executive officer, principal financial officer, principal accounting officer or controller, or persons performing similar functions. This code of ethics is included as Exhibit 13(a)(1).
(b) During the period covered by the report, with respect to the registrant’s code of ethics that applies to its principal executive officer, principal financial officer, principal accounting officer or controller, or persons performing similar functions; there have been no amendments to, nor any waivers granted from, a provision that relates to any element of the code of ethics definition enumerated in paragraph (b) of this Item 2.
| Item 3. | Audit Committee Financial Expert. |
The registrant’s board of trustees has determined that there is at least one audit committee financial expert serving on its audit committee. A. John Gambs is the “audit committee financial expert” and is considered to be “independent” as each term is defined in Item 3 of FormN-CSR.
| Item 4. | Principal Accountant Fees and Services. |
| | | | | | | | |
| | | 2019 | | | 2018 | |
Audit Fees | | $ | 76,500 | | | $ | 76,500 | |
Audit-Related Fees | | | 0 | | | | 0 | |
Tax Fees | | | 0 | | | | 0 | |
All Other Fees | | | 0 | | | | 0 | |
(e)(1) Disclose the audit committee’spre-approval policies and procedures described in paragraph (c)(7) of Rule2-01 of RegulationS-X.
The audit committee may delegate its authority topre-approve audit and permissiblenon-audit services to one or more members of the committee. Any decision of such members topre-approve services shall be presented to the full audit committee at its next regularly scheduled meeting.
(2) Disclose the percentage of services described in each of paragraphs (b) through (d) of this item that were approved by the audit committee pursuant to paragraph (c) (7)(i)(c) of Rule2-01 of RegulationS-X.
(f) Not applicable.
(g) Disclose the aggregatenon-audit fees billed by the registrant’s accountant for services rendered to registrant, and rendered to the registrant’s investment adviser (not including anysub-adviser whose role is primarily portfolio management and is subcontracted with or overseen by another investment adviser), and any entity controlling, controlled by, or under common control with the adviser that provides ongoing services to the registrant for each of the last two fiscal years of the registrant.
(h) Not applicable.
| Item 5. | Audit Committee of Listed Registrants. |
(a) The registrant has a separately-designated standing audit committee established in accordance with Section 3(a)(58)(A) of the Securities Exchange Act of 1934 (15 U.S.C 78c(a)(58)(A)), and is comprised of Julie Allecta, Jonathan P. Carroll, A. John Gambs, Dr. Bernard A. Harris, Jr., and Haig G. Mardikian.
(a) The registrant’s Schedule of Investments as of the close of the reporting period is included in the Report to Stockholders filed under Item 1 of FormN-CSR.
(b) Not applicable.
| Item 7. | Disclosure of Proxy Voting Policies and Procedures forClosed-End Management Investment Companies. |
Aclosed-end management investment company that is filing an annual report on this FormN-CSR must, unless it invests exclusively innon-voting securities, describe the policies and procedures that it uses to determine how to vote proxies relating to portfolio securities, including the procedures that the company uses when a vote presents a conflict between the interests of its shareholders, on the one hand, and those of the company’s investment adviser; principal underwriter; or any affiliated person (as defined in section 2(a)(3) of the Investment Company Act of 1940 (15 U.S.C.80a-2(a)(3)) and the rules thereunder) of the company, its investment adviser, or its principal underwriter, on the other. Include any policies and procedures of the company’s investment adviser, or any other third party, that the company uses, or that are used on the company’s behalf, to determine how to vote proxies relating to portfolio securities.
These policies are included as Exhibit 13(c).
| Item 8. | Portfolio Managers ofClosed-End Management Investment Companies. |
Greg A. Reid and Frank T. Gardner III (the “portfolio managers”) are primarily responsible for theday-to-day management of the registrant’s portfolio.
(a)(1) The following table provides biographical information about the registrant’s portfolio managers as of the date of this filing:
| | | | |
Name | | Position(s) Held With Registrant and Length of Time Served | | Principal Occupation During Past 5 Years |
Greg A. Reid | | Trustee, President and Chief Executive Officer (since inception). | | President, MLP Complex, Salient, since 2011. |
| | |
Frank T. Gardner III | | Managing Director and Portfolio Manager since 2010. | | Portfolio Manager of Salient Capital Advisors, LLC since 2010. |
(a)(2) The following table provides information about the other accounts managed on aday-to-day basis by the portfolio managers as of November 30, 2019:
| | | | | | | | | | | | | | | | |
Name | | Number of
Accounts | | | Total Assets
of Accounts | | | Number of
Accounts
Subject to a
Performance Fee | | | Total Assets of
Accounts
Subject to a
Performance Fee | |
Greg A. Reid | | | | | | | | | | | | | | | | |
Registered investment companies | | | 1 | | | $ | 761M | | | | 0 | | | $ | 0 | |
Other pooled investment companies | | | 4 | | | $ | 873M | | | | 1 | | | $ | 44M | |
Other accounts | | | 185 | | | $ | 1,710M | | | | 7 | | | $ | 10M | |
| | | | |
Frank T. Gardner III | | | | | | | | | | | | | | | | |
Registered investment companies | | | 1 | | | $ | 761M | | | | 0 | | | $ | 0 | |
Other pooled investment companies | | | 4 | | | $ | 873M | | | | 1 | | | $ | 44M | |
Other accounts | | | 185 | | | $ | 1710M | | | | 7 | | | $ | 10M | |
Conflicts of Interest with the Investment Adviser
Conflicts of interest may arise because Salient Partners, LP (“Salient”) and its affiliates generally carry on substantial investment activities for other clients in which we will have no interest. Salient or its affiliates may have financial incentives to favor certain of such accounts over us. Any of their proprietary accounts and other customer accounts may compete with us for specific trades. Salient or its affiliates may buy or sell securities for us which differ from securities bought or sold for other accounts and customers, although their investment objectives and policies may be similar to ours. Situations may occur when we could be disadvantaged because of the investment activities conducted by Salient or its affiliates for their other accounts. Such situations may be based on, among other things, legal or internal restrictions on the combined size of positions that may be taken for us and the other accounts, thereby limiting the size of our position, or the difficulty of liquidating an investment for us and the other accounts where the market cannot absorb the sale of the combined position.
Our investment opportunities may be limited by affiliations of Salient or its affiliates with MLPs and Energy Infrastructure Companies. In addition, to the extent that Salient sources and structures private investments in MLPs and Energy Infrastructure Companies, certain employees of Salient may become aware of actions planned by these companies, such as acquisitions, that may not be announced to the public. Although Salient maintains procedures to ensure that any materialnon-public information available to certain Salient employees not be shared with those employees responsible for the purchase and sale of publicly traded securities, it is possible that we could be precluded from investing in a company about which Salient has materialnon-public information.
The Advisor also manages other funds that invest primarily in MLPs (collectively “Affiliated Funds”) and some of the Affiliated Funds have investment objectives that are similar to or overlap with ours. In particular, certain Affiliated Funds invest in MLPs and Midstream Energy Infrastructure Companies. Furthermore, the Advisor may at some time in the future, manage other investment funds with the same investment objective as ours.
Investment decisions for us are made independently from those of Salient’s other clients; however, from time to time, the same investment decision may be made for more than one fund or account. When two or more clients advised by Salient or its affiliates seek to purchase or sell the same publicly traded securities, the securities actually purchased or sold are allocated among the clients on a good faith equitable basis by Salient in its discretion in accordance with the clients’ various investment objectives and procedures adopted by Salient and approved by our Board of Trustees. In some cases, this system may adversely affect the price or size of the position that we may obtain. In other cases, however, our ability to participate in volume transactions may produce better execution for us.
We and our affiliates, including Affiliated Funds, may be precluded fromco-investing in private placements of securities, including in any portfolio companies that we control. Except as permitted by law, Salient will notco-invest its other clients’ assets in the private transactions in which we invest. Salient will allocate private investment opportunities among its clients, including us, based on allocation policies that take into account several suitability factors, including the size of the investment opportunity, the amount of funds that each client has available for investment and the client’s investment objectives. These allocation policies may result in the allocation of investment opportunities to an Affiliated Fund rather than to us. The policies contemplate that Salient will exercise discretion, based on several factors relevant to the determination, in allocating the entirety, or a portion, of such investment opportunities to an Affiliated Fund, in priority to other prospectively interested advisory clients, including us. In this regard, when applied to specified investment opportunities that would normally be suitable for us, the allocation policies may result in certain Affiliated Funds having greater priority than us to participate in such opportunities depending on the totality of the considerations, including, among other things, our available capital for investment, our existing holdings, applicable tax and diversification standards to which we may then be subject and the ability to efficiently liquidate a portion of our existing portfolio in a timely and prudent fashion in the time period required to fund the transaction.
The investment management fee paid to our Adviser is based on the value of our assets, as periodically determined. A significant percentage of our assets may be illiquid securities acquired in private transactions for which market quotations will not be readily
available. Although we will adopt valuation procedures designed to determine valuations of illiquid securities in a manner that reflects their fair value, there typically is a range of prices that may be established for each individual security. Senior management of our Adviser, our Board of Trustees and its Valuation Committee, and a third-party valuation firm might participate in the valuation of our securities.
(a)(3) As of November 30, 2019:
Compensation
Messrs. Gardner and Reid are compensated by the Adviser through partnership distributions from Salient based on the amount of assets they manage, and they receive a portion of the advisory fees applicable to those accounts, which, with respect to certain amounts, as noted above, are based in part on the performance of those accounts. Some of the other accounts managed by Messrs. Gardner and Reid have investment strategies that are similar to ours. However, Salient manages potential conflicts of interest by allocating investment opportunities in accordance with its allocation policies and procedures. Messrs. Gardner and Reid did not own any of the Fund’s equity securities prior to this offering; however, through their limited partner interests in the parent company of the adviser, which owned all the Fund’s outstanding shares as of April 23, 2012 (with a value of approximately $100,000), Messrs. Gardner and Reid could be deemed to indirectly own a portion of the Fund’s securities.
(a)(4) As of November 30, 2019:
Securities Beneficially Owned in the Registrant by Portfolio Managers
The following table provides information about the dollar range of equity securities in the registrant beneficially owned by the portfolio managers:
| | |
Portfolio Manager | | Aggregate Dollar Range of Beneficial
Ownership in the Registrant |
Greg A. Reid | | $100,001 to $500,000 |
Frank T. Gardner III | | None |
| Item. 9. | Purchase of Equity Securities byClosed-End Management Investment Company and Affiliated Purchasers. |
| | | | | | | | | | | | | | | | |
Period | | (a)
Total
Number
of Shares
(or Units)
Purchased | | | (b)
Average
Price
Paid per
Share
(or Unit) | | | (c)
Total
Number
of Shares
(or Units)
Purchased
as
Part of
Publicly
Announced
Plans or
Programs | | | (d)
Maximum
Number
(or
Approximate
Dollar Value)
of
Shares (or
Units)
that May Yet
Be
Purchased
Under
the Plans or
Programs | |
December 1, 2018 through December 31, 2018 | | | N/A | | | | N/A | | | | N/A | | | | N/A | |
January 1, 2019 through January 31, 2019 | | | N/A | | | | N/A | | | | N/A | | | | N/A | |
February 1, 2019 through February 28, 2019 | | | N/A | | | | N/A | | | | N/A | | | | N/A | |
March 1, 2019 through March 31, 2019 | | | N/A | | | | N/A | | | | N/A | | | | N/A | |
April 1, 2019 through April 30, 2019 | | | N/A | | | | N/A | | | | N/A | | | | N/A | |
May 1, 2019 through May 31, 2019 | | | N/A | | | | N/A | | | | N/A | | | | N/A | |
June 1, 2019 through June 30, 2019 | | | N/A | | | | N/A | | | | N/A | | | | N/A | |
July 1, 2019 through July 31, 2019 | | | N/A | | | | N/A | | | | N/A | | | | N/A | |
August 1, 2019 through August 31, 2019 | | | N/A | | | | N/A | | | | N/A | | | | N/A | |
September 1, 2019 through September 30, 2019 | | | N/A | | | | N/A | | | | N/A | | | | N/A | |
October 1, 2019 through October 31, 2019 | | | N/A | | | | N/A | | | | N/A | | | | N/A | |
November 1, 2019 through November 30, 2019 | | | N/A | | | | N/A | | | | N/A | | | | N/A | |
| | | | | | | | | | | | | | | | |
Total | | | — | | | | | | | | | | | | | |
| | | | | | | | | | | | | | | | |
| Item 10. | Submission of Matters to a Vote of Security Holders. |
No material changes to the procedures by which the shareholders may recommend nominees to the registrant’s Board of Trustees have been implemented after the registrant’s last provided disclosure in response to the requirements of Item 407(c)(2)(iv) ofRegulation S-K (17 CFR 229.407) (as required by Item 22(b)(15) of Schedule 14A (17CFR 240.14a-101)), or this Item.
| Item 11. | Controls and Procedures. |
| | (a) | The registrant’s principal executive officer and principal financial officer, or persons performing similar functions, have concluded, based on their evaluation of the registrant’s disclosure controls and procedures as conducted within 90 days of the filing date of this report, that these disclosure controls and procedures are adequately designed and are operating effectively to ensure that information required to be disclosed by the registrant on FormN-CSR is (i) accumulated and communicated to the investment company’s management, including its certifying officers, to allow timely decisions regarding required disclosure; and (ii) recorded, processed, summarized and reported within the time periods specified in the Securities and Exchange Commission’s rules and forms. |
| | (b) | There were no changes in the registrant’s internal control over financial reporting (as defined in Rule30a-3(d) under the Act (17 CFR270.30a-3(d)) that occurred during the period covered by this report that have materially affected or are reasonably likely to materially affect the registrant’s internal control over financial reporting. |
| Item 12. | Disclosure of Securities Lending Activities forClosed-End Management Investment Companies. |
Not applicable
| | |
| |
(a)(1) | | Code of ethics that is subject to Item 2 is attached hereto. |
| |
(a)(2) | | Certifications pursuant to Rule30a-2(a) under the Act (17 CFR30a-2(a)) are attached hereto. |
| |
(a)(3) | | Not applicable. |
| |
(a)(4) | | Not applicable. |
| |
(b) | | Certifications pursuant to Rule30a-2(b) under the Act (17 CFR30a-2(b)) and Section 1350 of Chapter 63 of Title 18 of the United States Code (18 U.S.C. 1350) are attached hereto. |
| |
(c) | | Proxy voting policies and procedures pursuant to Item 7 are attached hereto. |
SIGNATURES
Pursuant to the requirements of the Securities Exchange Act of 1934 and the Investment Company Act of 1940, the registrant has duly caused this report to be signed on its behalf by the undersigned, thereunto duly authorized.
| | |
| Salient Midstream & MLP Fund |
| |
| By: | | /s/ Gregory A. Reid |
| | Gregory A. Reid Principal Executive Officer |
| |
| Date: | | 1/29/20 |
Pursuant to the requirements of the Securities Exchange Act of 1934 and the Investment Company Act of 1940, this report has been signed below by the following persons on behalf of the registrant and in the capacities and on the dates indicated.
| | |
| By: | | /s/ Gregory A. Reid |
| | Gregory A. Reid Principal Executive Officer |
| |
| Date: | | 1/29/20 |
| | |
| By: | | /s/ Thomas Dusenberry |
| | Thomas Dusenberry Principal Financial Officer |
| |
| Date: | | 1/28/20 |