UNITED STATES
SECURITIES AND EXCHANGE COMMISSION
Washington, D.C. 20549
FORM N-CSR
CERTIFIED SHAREHOLDER REPORT OF REGISTERED
MANAGEMENT INVESTMENT COMPANY
Investment Company Act file number: 811-22626
Salient Midstream & MLP Fund
(Exact name of registrant as specified in charter)
4265 San Felipe, 8th Floor
Houston, TX 77027
(Address of principal executive offices) (Zip code)
| | |
Gregory A. Reid, Principal Executive Officer Salient Midstream & MLP fund 4265 San Felipe, 8th Floor Houston, TX 77027 (Name and address of agent for service) | | With a Copy To: George J. Zornada K&L Gates LLP State Street Financial Center One Lincoln St. Boston, MA 02111-2950 (617) 261-3231 |
Registrant’s telephone number, including area code: (713) 993-4001
Date of fiscal year end: November 30
Date of reporting period: May 31, 2022
Form N-CSR is to be used by management investment companies to file reports with the Commission, not later than 10 days after the transmission to stockholders of any report that is required to be transmitted to stockholders under Rule 30e-1 under the Investment Company Act of 1940 (17 CFR 270.30e-1). The Commission may use the information provided on Form N-CSR in its regulatory, disclosure review, inspection, and policymaking roles.
A registrant is required to disclose the information specified by Form N-CSR, and the Commission will make this information public. A registrant is not required to respond to the collection of information contained in Form N-CSR unless the Form displays a currently valid Office of Management and Budget (“OMB”) control number. Please direct comments concerning the accuracy of the information collection burden estimate and any suggestions for reducing the burden to the Secretary, Securities and Exchange Commission, 100 F Street, NE, Washington, DC 20549. The OMB has reviewed this collection of information under the clearance requirements of 44 U.S.C. § 3507.
| Item 1. | Report to Stockholders. |
| | (a) | The following is a copy of the report transmitted to shareholders of the Salient Midstream & MLP Fund (the “Fund”), pursuant to Rule 30e-1 under the Investment Company Act of 1940, as amended (the “Act”) (17 CFR 270.30e-1). |
Table of Contents
| | |
 | | Midstream & MLP Fund |
Shareholder Letter (Unaudited)
Dear Fellow Shareholders:1
We are pleased to provide the semi-annual report of the Salient Midstream & MLP Fund (the “Fund” or “SMM”) (NYSE: SMM) which contains updated data as of May 31, 2022.
As of May 31, 2022, the Fund had total assets of $233.8 million, net asset value of $9.72 per share and 17.7 million common shares outstanding. The Fund’s price per share was $8.50, which represents a 12.6% discount to its net asset value (“NAV”).2
The Fund’s investment allocation is shown in the pie chart below:
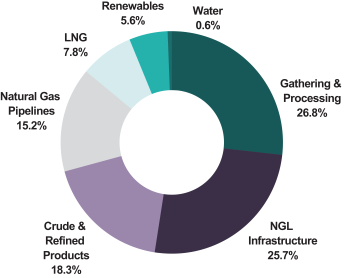
For illustrative purposes only.
Source: Salient Capital Advisors, LLC (“Adviser”), May 31, 2022.
Figures are based on the Fund’s gross assets ex-cash.
1 Certain statements in this letter are forward-looking statements. The forward-looking statements and other views expressed herein are those of the portfolio managers and the Fund as of the date of this letter. Actual future results or occurrences may differ significantly from those anticipated in any forward-looking statements, and there is no guarantee that any predictions will come to pass. The views expressed herein are subject to change at any time, due to numerous market and other factors. The Fund disclaims any obligation to update publicly or revise any forward-looking statements or views expressed herein. There can be no assurance that the Fund will achieve its investment objectives. The value of the Fund will fluctuate with the value of the underlying securities. Historically, closed-end funds often trade at a discount to their net asset value.
2 Past performance is not indicative of future results. Current performance may be higher or lower than the data shown. The data shown are unaudited. Returns do not reflect the deduction of taxes that shareholders may have to pay on Fund distributions or upon the sale of Fund shares.
The Fund’s Top 10 holdings are shown below, as of May 31, 2022:3
| | | | | | | | | | | | |
| No. | | Symbol | | Name | | Country | | Asset Type | | % of Gross
Assets | |
| 1 | | ET | | Energy Transfer L.P. | | United States | | MLP | | | 9.4 | % |
| 2 | | TRGP | | Targa Resources Corp. | | United States | | C-Corp | | | 6.9 | % |
| 3 | | LNG | | Cheniere Energy, Inc. | | United States | | C-Corp | | | 5.8 | % |
| 4 | | PPL CN | | Pembina Pipeline Corp. | | Canada | | C-Corp | | | 5.7 | % |
| 5 | | ENB | | Enbridge, Inc. | | United States | | C-Corp | | | 5.6 | % |
| 6 | | – | | EMG Utica I Offshore Co-Investment L.P. | | United States | | C-Corp | | | 5.5 | % |
| 7 | | WMB | | The Williams Companies, Inc. | | United States | | C-Corp | | | 4.8 | % |
| 8 | | MPLX | | MPLX L.P. | | United States | | MLP | | | 4.6 | % |
| 9 | | PAGP | | Plains GP Holdings L.P. | | United States | | C-Corp | | | 4.5 | % |
| 10 | | OKE | | ONEOK, Inc. | | United States | | C-Corp | | | 4.4 | % |
| | | | | | | | | | | | |
| | | | | | | | | | | 57.2 | % |
| | | | | | | | | | | | |
Source: Salient Capital Advisors, LLC (“Adviser”), May 31, 2022.
For illustrative purposes only. Current and future holdings are subject to change and risk. Figures are based on the Fund’s gross assets ex-cash.
During the reporting period (December 1, 2021 – May 31, 2022), the Fund’s NAV and market price total return were 32.2% and 36.4%, respectively, compared to 28.8% for the Alerian Midstream Energy Select Index (AMEI) during the same period.4,5
Performance Snapshot
as of May 31, 2022 (Unaudited)
| | | | | | | | | | |
| Price Per Share | | 12/01/21-05/31/22
Total Return* | | Since Inception*
(Annualized) |
$9.72 (NAV) | | | | 32.2 | % | | | | 0.1 | % |
$8.50 (Market Price) | | | | 36.4 | % | | | | -1.2 | % |
Source: Salient Capital Advisors, LLC (“Adviser”), May 31, 2022.
For illustrative purposes only. All figures represent past performance and are not indicative of future results. No investment strategy can guarantee performance results.
* Total returns are based on changes in NAV or market price, respectively. Returns reflect the deduction of all Fund expenses, including management fees, operating expenses and other Fund expenses. Returns do not reflect the deduction of brokerage commissions or taxes that investors may pay on distributions or the sale of shares. Total return assumes the reinvestment of all distributions. Inception date of the Fund was May 25, 2012.
3 Fund shares do not represent a deposit or obligation of, and are not guaranteed or endorsed by, any bank or other insured depository institution, and are not federally insured by the Federal Deposit Insurance Corporation, the Federal Reserve Board or any other government agency. Data are based on total market value of Fund investments unless otherwise indicated. The data provided are for informational purposes only and are not intended for trading purposes.
4 Source: Alerian, May 31, 2022. “Alerian Midstream Energy Select Index,” “Alerian Midstream Energy Select Total Return Index,” “AMEI” and “AMEIX” are trademarks of Alerian and their use is granted under a license from Alerian. Past performance is not indicative of how the index will perform in the future. The index reflects the reinvestment of dividends and income and does not reflect deductions for fees, expenses or taxes. The index is unmanaged and is not available for direct investment. Alerian Midstream Energy Select Index (AMEI) is a composite of North American midstream energy infrastructure companies that are engaged in activities involving energy commodities. The capped, float-adjusted, capitalization-weighted index is disseminated in real time on a price-return basis. Inception date of the AMEI is April 1, 2013.
5 Past performance is not indicative of future results.
Market Review
Russia’s invasion of Ukraine in February is a massive geopolitical event that we believe will have long-term reverberations throughout the global energy landscape. Since the war started, we have seen a shift in focus among global leaders from decarbonization/energy transition to energy security, with Europe taking center stage. Some quick facts: Russia was the second-largest producer globally of both crude oil and natural gas in 2020, with crude oil production of more than 10 million barrels per day (mmbpd) and natural gas production of almost 62 billion cubic feet per day (bcf/d).6 It was also the fourth-largest exporter of liquefied natural gas (LNG) at 3.9 bcf/d.6 On the crude oil front, Russia exports north of 5 mmbpd with roughly half of those exports going to Europe.6 Natural gas exports are roughly 40% of Russia’s production, with Europe receiving 72% of those exports.6
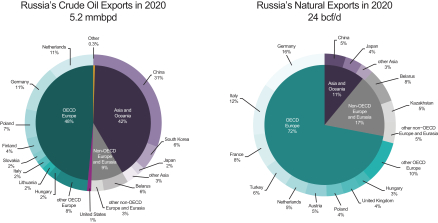
Source: EIA and BP Statistical Review of World Energy 2021. For illustrative purposes only.
Europe’s biggest concern is that it consumes ~52 bcf/d of natural gas but only produces around 20 bcf/d, thus requiring 32 bcf/d of imports—and Russia currently meets more than half of those needs (~18 bcf/d ).6 This is why we have not seen meaningful European sanctions on Russian commodity exports to date, and it is also why Europe will likely have to wean itself from Russian supply over time. The European Union (EU) is acutely aware of the need and announced a joint action plan in early March known as “REPowerEU,” which aims to make Europe free of Russian fossil fuels “well before 2030.”7 Among the initiatives: import ~5 bcf/d more LNG immediately from the likes of the U.S., Qatar, Egypt and West Africa; increase pipeline deliveries by ~1 bcf/d immediately from countries such as Azerbaijan, Algeria and Norway; increase biomethane production by ~3.5 bcf/d by 2030; triple solar and wind capacity by 2030; and increase energy efficiency across the board.8 This may be achievable by 2030, but we are skeptical that the near-term LNG import goals can be met due to current LNG market tightness.
Long term, the U.S. is in a good position to supply additional LNG to Europe with 10.8 bcf/d of current export capacity (averaging ~10.5 bcf/d of actual exports) and an additional 17.6 bcf/d of approved capacity.9 However, it typically takes 31⁄2 to 4 years to permit and build projects of this scale and there is only 4.2 bcf/d currently in progress, with only 0.7 bcf/d of that total coming online before 2025 (an additional 2 bcf/d in mid-2025 and 1.5 bcf/d in mid-2027).9 It is a similar situation with global facilities as only 3.1 bcf/d of capacity is expected to come online before 2025 based on projects currently underway.9
We believe Russia’s crude oil exports—if reduced through either production losses or sanctions—could be mitigated more easily than natural gas by pulling some levers across the global supply chain. One lever has already been pulled—a globally coordinated release from the Strategic Petroleum Reserve (SPR).10 SPRs are meant to be used in times of true supply disruption (not just when prices are high) and there were ~1.4 billion barrels of oil stored in global SPRs in late March.6 President Biden authorized a release of 1 mmbpd for six months (a total of 180 million barrels) on April 1, 2022, and 31 other member countries of the International Energy Agency (IEA) announced a combined release of 60 million barrels on April 6, 2022 (though daily amounts and length of time were not specified). These actions may help prices in the short term, but stockpiles eventually need to be
6 International Energy Agency (IEA), March 2022. The International Energy Agency works with countries around the world to shape energy policies for a secure and sustainable future.
7 European Commission and the White House, March 2022.
8 Liquefied natural gas (LNG) is natural gas that has been converted to a liquid form for the ease and safety of natural gas transport. Crude oil is a naturally occurring yellowish-black liquid mixture of mainly hydrocarbons and is found in geological formations. Natural gas is flammable gas, consisting largely of methane and other hydrocarbons, occurring naturally underground (often in association with petroleum) and used as fuel.
9 Morgan Stanley, March 2022.
10 The Strategic Petroleum Reserve is an emergency stockpile of petroleum maintained by the United States Department of Energy.
replaced, which will help support crude oil prices in the future as nations refill these reserves through open market purchases. Another lever is production: The Organization of the Petroleum Exporting Countries (OPEC) currently has somewhere between 1.5 and 2.0 mmbpd of spare production capacity that could ramp up fairly quickly and U.S. production is expected to grow by 600,000–800,000 bpd in 2022 and perhaps more in 2023.11 As potential wild cards, if sanctions are rolled back on both Iran and Venezuela, we could see another 1.5 mmbpd of production come online, although it may take a year or longer for production to ramp up given years of underinvestment in those countries.
What does this mean for North American energy infrastructure? Our current view is that Russian supplies will not be meaningfully reduced in the very near term, but it will happen over time as Europe diversifies its supply sources. As a result, we believe that North American production will continue to increase and effectively set a higher baseline level, which would be positive for midstream volumes. The biggest expansion opportunities will likely be for natural gas infrastructure related to LNG projects along the Gulf Coast and Florida (all approved and proposed LNG plants are in this area).
Inflation, Higher Interest Rates & Recession Fears
Performance over the past six months has certainly been supported by the firming of crude oil and natural gas prices following the onset of the Russia-Ukraine war. Inflation measures have moved to levels not seen since the early 1980s, and while this is supportive for inflation-linked contracts that are common in the energy infrastructure space, it has also brought concerns over meaningful interest rate hikes by the Federal Reserve that could lead to recession, which would thus lead to lower energy demand.12
Historically, energy demand has not typically declined in absolute terms during a recession—the growth rate has merely slowed (the notable exceptions have been the two most recent recessions that were spurred by global crises: the financial crisis of 2007–2009 and the COVID-19 pandemic in 2020). At this juncture, we believe that demand destruction would have to be immense—in the realm of 3.5 mmbpd or higher—to offset the global supply losses from both crude oil production and refining capacity. If we merely experience a “garden variety” recession, we do not believe that demand destruction will more than offset the lost capacity.13
We would also point out that energy infrastructure has a positive (albeit somewhat low) relationship with interest rates, as the long-term correlation with the yield on the 10-year U.S. Treasury Note has been +0.2 to +0.3.14 In other words, energy infrastructure stocks have tended to increase as yields increase. It’s a very intuitive relationship: rates (along with inflation) typically rise due to economic strength, which implies higher energy demand and thus more volumes moving through energy infrastructure assets. As such, we do not believe that investors should be overly concerned with the impact of interest rates on the Fund’s holdings.
As always, we sincerely appreciate your confidence and trust in us to manage your energy infrastructure allocation. Please call us with any questions.
Sincerely,
Gregory A. Reid
President
MLP Business, Salient Capital Advisors, LLC
11 Energy Information Administration (EIA), March 2022. The Organization of the Petroleum Exporting Countries (OPEC) refers to a group of 13 of the world’s major oil-exporting nations.
12 Inflation-linked contracts are contracts with rates that move up with inflation. Energy infrastructure companies are companies that own and operate assets that are used in the energy sector, including assets used in exploring, developing, producing, generating, transporting (including marine), transmitting, terminal operation, storing, gathering, processing, refining, distributing, mining or marketing of natural gas, natural gas liquids, crude oil, refined products, coal or electricity, or that provide energy-related services.
13 Garden variety is an expression meaning the usual or ordinary type; commonplace.
14 Correlation is a statistical term describing the degree to which two variables move in coordination with one another. Yield refers to the earnings generated and realized on an investment over a particular period of time.
Performance (Unaudited)
| | | | | | | | | | | | | | | |
| Average Annual Total Returns as of May 31, 2022 | | 1 Year | | 5 Year | | Since
Inception(a) |
Salient Midstream & MLP Fund—NAV(b) | | 35.07% | | | | 1.50 | % | | | | 0.11 | % |
Salient Midstream & MLP Fund—Market Price(c) | | 56.58% | | | | -0.34 | % | | | | -1.22 | % |
Alerian Midstream Energy Select Total Return Index | | 30.80% | | | | 7.28 | % | | | | 6.88 | % |
(a) The Fund commenced operations on May 24, 2012 and Alerian Midstream Energy Select Total Return Index commenced operations on December 31, 2012.
(b) Performance returns are net of management fees and other Fund expenses.
(c) Market price is the value at which the Fund trades on an exchange. This market price can be more or less than its NAV.
The performance quoted represents past performance, does not guarantee future results and current performance may be lower or higher than the data quoted. The investment return and principal value of an investment will fluctuate so that shares, when redeemed, may be worth more or less than their original cost. Performance data current to the most recent month-end may be obtained at www.salientpartners.com. Total return is assuming the reinvestment of all distributions. Performance does not reflect the deduction of taxes that a shareholder would pay on fund distributions or the redemption of fund shares.
Key Financial Data (Unaudited)
We supplement the reporting of our financial information determined under United States generally accepted accounting principles (“GAAP”) with certain non-GAAP financial measures: distributable cash flow and distributable cash flow coverage ratio. We believe these non-GAAP measures provide meaningful information to assist shareholders in understanding our financial results and assessing our performance. We pay distributions to our shareholders, funded in part by distributable cash flow generated from our portfolio investments. Distributable cash flow is the amount of income received by us from our portfolio investments less operating expenses, subject to certain adjustments as described below. Other companies with similar measures may calculate these measures differently, and as a result, it may not be possible to compare these financial measures with other companies’ non-GAAP financial measures having the same or similar names. These adjusted financial measures should not be considered in isolation or as a substitute for reported net investment income. These non-GAAP financial measures reflect an additional way of viewing an aspect of our operations that, when viewed with our GAAP results and the below reconciliation to the corresponding GAAP financial measures, provide a more complete understanding of our Fund. We strongly encourage shareholders to review our financial statements in their entirety and not rely on any single financial measure.
The table below reconciles the non-GAAP financial measures, distributable cash flow and distributable cash flow coverage ratio, by starting with the most directly comparable GAAP financial measure, net investment income.
| | | | | |
| | | Period Ended
May 31, 2022 |
Net investment loss | | | $ | (612,371 | ) |
Reconciling items: | | | | | |
Return of capital of distributions(a) | | | | 3,622,502 | |
Net realized gain on written options(b) | | | | 435,549 | |
| |
Distributable cash flow (non-GAAP) | | | $ | 3,445,680 | |
Distributions paid on common stock | | | $ | 3,101,428 | |
Distributable cash flow coverage ratio (non-GAAP) | | | | 1.11x | |
(a) GAAP recognizes that a significant portion of the cash distributions received from MLPs is characterized as a return of capital and therefore excluded from net investment income, whereas the distributable cash flow calculation includes the return of capital portion of such distributions.
(b) We may sell covered call option contracts to generate income or to reduce our ownership of certain securities that we hold. In some cases, we are able to repurchase these call option contracts at a price less than the fee that we received, thereby generating a profit. The amount we received from selling call options, less the amount that we pay to repurchase such call option contracts is included in distributable cash flow. For GAAP purposes, “income” from call option contracts sold is not included in net investment income. See Note 2—Summary of Significant Accounting Policies and Practices for a full discussion of the GAAP treatment of option contracts.
Schedule of Investments (Unaudited)
Salient Midstream & MLP Fund
May 31, 2022
| | | | | | | | | | |
| | | Shares/Units | | Fair Value |
Master Limited Partnerships—32.5% | | | | | | |
Crude & Refined Products—10.2% | | | | | | | | | | |
United States—10.2% | | | | | | | | | | |
Genesis Energy LP(b) | | | | 45,532 | | | | $ | 557,312 | |
Magellan Midstream Partners LP(b)(c) | | | | 67,234 | | | | | 3,475,998 | |
MPLX LP(b)(c) | | | | 326,829 | | | | | 10,769,015 | |
NuStar Energy LP(b)(c) | | | | 99,041 | | | | | 1,589,608 | |
Shell Midstream Partners LP(b) | | | | 79,245 | | | | | 1,120,524 | |
| | | | | | | | | | |
| | | | | | | | | 17,512,457 | |
| | | | | | | | | | |
Gathering & Processing—5.0% | | | | | | | | | | |
United States—5.0% | | | | | | | | | | |
Crestwood Equity Partners LP(b)(c) | | | | 81,301 | | | | | 2,369,111 | |
Western Midstream Partners LP(b)(c) | | | | 228,178 | | | | | 6,309,122 | |
| | | | | | | | | | |
| | | | | | | | | 8,678,233 | |
| | | | | | | | | | |
Natural Gas Liquids Infrastructure—17.3% | | | | | | | | | | |
United States—17.3% | | | | | | | | | | |
Energy Transfer LP(b)(c) | | | | 1,869,963 | | | | | 21,803,769 | |
Enterprise Products Partners LP(b)(c) | | | | 293,370 | | | | | 8,044,205 | |
| | | | | | | | | | |
| | | | | | | | | 29,847,974 | |
| | | | | | | | | | |
Total Master Limited Partnerships
(Cost $27,671,886) | | | | | | | | | 56,038,664 | |
| | | | | | | | | | |
MLP Related Companies—102.8% | | | | | | |
Crude & Refined Products—14.6% | | | | | | | | | | |
Canada—8.6% | | | | | | | | | | |
Enbridge, Inc.(b)(c) | | | | 285,258 | | | | | 13,164,657 | |
Gibson Energy, Inc. (CAD) | | | | 76,073 | | | | | 1,611,255 | |
| | | | | | | | | | |
| | | | | | | | | 14,775,912 | |
| | | | | | | | | | |
United States—6.0% | | | | | | | | | | |
Plains GP Holdings LP, Class A(b)(c) | | | | 870,489 | | | | | 10,411,048 | |
| | | | | | | | | | |
Energy—6.8% | | | | | | | | | | |
United States—6.8% | | | | | | | | | | |
Archaea Energy, Inc., Class A(a)(b) | | | | 404,919 | | | | | 8,074,085 | |
Excelerate Energy, Inc.(a)(b) | | | | 37,077 | | | | | 988,102 | |
Heliogen, Inc.(a) | | | | 76,900 | | | | | 297,603 | |
Kinetik Holdings, Inc.(b) | | | | 27,374 | | | | | 2,300,511 | |
| | | | | | | | | | |
| | | | | | | | | 11,660,301 | |
| | | | | | | | | | |
Gathering & Processing—29.9% | | | | | | | | | | |
United States—29.9% | | | | | | | | | | |
Antero Midstream Corp.(b)(c) | | | | 795,883 | | | | | 8,643,289 | |
EMG Utica I Offshore Co-Investment LP(d)(e) | | | | 16,000,000 | | | | | 12,841,593 | |
EnLink Midstream LLC(b)(c) | | | | 755,785 | | | | | 8,615,949 | |
Hess Midstream LP, Class A(b) | | | | 160,000 | | | | | 5,214,400 | |
Targa Resources Corp.(b)(c) | | | | 224,242 | | | | | 16,149,909 | |
| | | | | | | | | | |
| | | | | | | | | 51,465,140 | |
| | | | | | | | | | |
| | | | |
| See accompanying Notes to Financial Statements. | | 7 | | |
Schedule of Investments (Unaudited)
Salient Midstream & MLP Fund
May 31, 2022
| | | | | | | | | | |
| | | Shares/Units | | Fair Value |
Liquefied Natural Gas—10.0% | | | | | | | | | | |
United States—10.0% | | | | | | | | | | |
Cheniere Energy, Inc.(b)(c) | | | | 98,767 | | | | $ | 13,508,363 | |
Tellurian, Inc.(a)(b) | | | | 765,600 | | | | | 3,651,912 | |
| | | | | | | | | | |
| | | | | | | | | 17,160,275 | |
| | | | | | | | | | |
Natural Gas Liquids Infrastructure—17.4% | | | | | | | | | | |
Canada—11.5% | | | | | | | | | | |
Keyera Corp. (CAD) | | | | 249,503 | | | | | 6,649,600 | |
Pembina Pipeline Corp.(b)(c) | | | | 260,125 | | | | | 10,467,430 | |
Pembina Pipeline Corp. (CAD)(b)(c) | | | | 67,252 | | | | | 2,711,667 | |
| | | | | | | | | | |
| | | | | | | | | 19,828,697 | |
| | | | | | | | | | |
United States—5.9% | | | | | | | | | | |
ONEOK, Inc.(c) | | | | 154,543 | | | | | 10,176,656 | |
| | | | | | | | | | |
Natural Gas Pipelines—20.6% | | | | | | | | | | |
Canada—5.6% | | | | | | | | | | |
TC Energy Corp.(b)(c) | | | | 167,712 | | | | | 9,700,462 | |
| | | | | | | | | | |
United States—15.0% | | | | | | | | | | |
Equitrans Midstream Corp.(b)(c) | | | | 684,166 | | | | | 5,384,386 | |
Kinder Morgan, Inc.(b)(c) | | | | 468,449 | | | | | 9,223,761 | |
The Williams Companies, Inc.(b)(c) | | | | 301,414 | | | | | 11,170,403 | |
| | | | | | | | | | |
| | | | | | | | | 25,778,550 | |
| | | | | | | | | | |
Renewable Energy Infrastructure—2.7% | | | | | | | | | | |
Great Britain—0.7% | | | | | | | | | | |
Atlantica Sustainable Infrastructure PLC(b)(c) | | | | 39,077 | | | | | 1,275,864 | |
| | | | | | | | | | |
United States—2.0% | | | | | | | | | | |
Microvast Holdings Inc.(a)(d) | | | | 297,400 | | | | | 1,487,000 | |
NextEra Energy Partners LP(b)(c) | | | | 26,792 | | | | | 1,919,647 | |
| | | | | | | | | | |
| | | | | | | | | 3,406,647 | |
| | | | | | | | | | |
Water—0.8% | | | | | | | | | | |
United States—0.8% | | | | | | | | | | |
Rattler Midstream LP(c) | | | | 82,280 | | | | | 1,406,165 | |
| | | | | | | | | | |
Total MLP Related Companies
(Cost $119,279,096) | | | | | | | | | 177,045,717 | |
| | | | | | | | | | |
Special Purpose Acquisition Companies—0.0%(f) | | | | | | |
United States—0.0%(f) | | | | | | | | | | |
TortoiseEcofin Acquisition Corp III—Founder Shares(a)(d)(e) | | | | 41,550 | | | | | 125 | |
| | | | | | | | | | |
Total Special Purpose Acquisition Companies
(Cost $125) | | | | | | | | | 125 | |
| | | | | | | | | | |
Total Investments—135.3% (Cost $146,951,107) | | | | | | | | | 233,084,506 | |
Credit Facility—(35.2%) | | | | | | | | | (60,600,000 | ) |
Other Assets and Liabilities—(0.1)% | | | | | | | | | (224,329 | ) |
| | | | | | | | | | |
Total Net Assets Applicable to Common Shareholders—100.0% | | | | $ | 172,260,177 | |
| | | | | | | | | | |
| | | | |
| See accompanying Notes to Financial Statements. | | 8 | | |
Schedule of Investments (Unaudited)
Salient Midstream & MLP Fund
May 31, 2022
All percentages disclosed are calculated by dividing the indicated amounts by net assets applicable to common shareholders.
(a) The security is considered a non-income producing security as any distributions received during the period (if applicable) are treated as return of capital per the Generally Accepted Accounting Principles.
(b) All or a portion of these securities are held as collateral for the written call options. As of May 31, 2022, the total fair value of securities held as collateral for the written call options is $72,293,075.
(c) All or a portion of these securities are held as collateral for the line of credit agreement. As of May 31, 2022, the total fair value of securities held as collateral for the line of credit agreement is $132,307,401.
(d) These securities are exempt from registration under the Securities Act of 1933 and are subject to legal restrictions on resale. These securities generally may be resold in transactions exempt from registration, normally to qualified institutional buyers, or to the public if the securities are subsequently registered. See footnote 2(g) in the Notes to Financial Statements for further information.
(e) These investments are classified as Level 3 assets and such classification was a result of the unavailability of other significant observable inputs. At period end, the aggregate value of these securities was $12,841,718, representing 7.45% of net assets. See Note 3 in the Notes to Financial Statements for further information.
Written Call Options:
| | | | | | | | | | | | | | | | | | | | | | | | | | | | | | | | | | | |
| Description | | Counterparty | | Exercise
Price | | Expiration
Date | | Number of
Contracts | | Notional
Value | | Fair Value | | Unrealized
Appreciation
(Depreciation) |
Archaea Energy, Inc. | | | | Morgan Stanley & Co. LLC | | | | $ | 25.00 | | | | | June 2022 | | | | | 250 | | | | $ | 498,500 | | | | $ | (1,875 | ) | | | $ | 16,555 | |
Excelerate Energy, Inc. | | | | Morgan Stanley & Co. LLC | | | | | 30.00 | | | | | June 2022 | | | | | 74 | | | | | 197,210 | | | | | (3,330 | ) | | | | 1,034 | |
Hess Midstream LP | | | | Morgan Stanley & Co. LLC | | | | | 35.00 | | | | | June 2022 | | | | | 320 | | | | | 1,042,880 | | | | | (8,800 | ) | | | | 2,154 | |
Targa Resources Corp. | | | | Morgan Stanley & Co. LLC | | | | | 77.50 | | | | | June 2022 | | | | | 112 | | | | | 806,624 | | | | | (6,160 | ) | | | | 1,537 | |
Tellurian, Inc. | | | | Morgan Stanley & Co. LLC | | | | | 6.00 | | | | | June 2022 | | | | | 2,581 | | | | | 1,231,137 | | | | | (32,263 | ) | | | | 7,022 | |
Williams Cos., Inc. | | | | Morgan Stanley & Co. LLC | | | | | 39.00 | | | | | June 2022 | | | | | 86 | | | | | 318,716 | | | | | (1,290 | ) | | | | 793 | |
| | | | | | | | | | | | | | | | | | | | | | | | | | | | | | | | | | | |
| | | | | | | | | | | | | | | | | | | | | | | $ | 4,095,067 | | | | $ | (53,718 | ) | | | $ | 29,095 | |
| | | | | | | | | | | | | | | | | | | | | | | | | | | | | | | | | | | |
Salient Midstream & MLP Fund invested in the following industries as of May 31, 2022:
| | | | | | | | | | |
| | | Value | | % of
Total Investments |
Crude & Refined Products | | | $ | 42,699,417 | | | | | 18.3 | % |
Energy | | | | 11,660,301 | | | | | 5.0 | % |
Gathering & Processing | | | | 60,143,373 | | | | | 25.8 | % |
Liquefied Natural Gas | | | | 17,160,275 | | | | | 7.4 | % |
Natural Gas Liquids Infrastructure | | | | 59,853,327 | | | | | 25.7 | % |
Natural Gas Pipelines | | | | 35,479,012 | | | | | 15.2 | % |
Renewable Energy Infrastructure | | | | 3,195,511 | | | | | 1.4 | % |
Renewables | | | | 1,487,000 | | | | | 0.6 | % |
Special Purpose Acquisition Companies | | | | 125 | | | | | — | % |
Water | | | | 1,406,165 | | | | | 0.6 | % |
| | | | | | | | | | |
Total | | | $ | 233,084,506 | | | | | 100.0 | % |
| | | | | | | | | | |
| | | | |
| See accompanying Notes to Financial Statements. | | 9 | | |
Schedule of Investments (Unaudited)
Salient Midstream & MLP Fund
May 31, 2022
Salient Midstream & MLP Fund invested in securities with exposure to the following countries as of May 31, 2022:
| | | | | | | | | | |
| | | Value | | % of
Total Investments |
Canada | | | $ | 44,305,071 | | | | | 19.0 | % |
Great Britain | | | | 1,275,864 | | | | | 0.6 | % |
United States | | | | 187,503,571 | | | | | 80.4 | % |
| | | | | | | | | | |
Total | | | $ | 233,084,506 | | | | | 100.0 | % |
| | | | | | | | | | |
Currency Abbreviations:
CAD—The security is traded in Canadian Dollars. The Fair Value in the Schedule of Investments is expressed in US Dollars at the conversion rate on May 31, 2022.
| | | | |
| See accompanying Notes to Financial Statements. | | 10 | | |
Statement of Assets, Liabilities and Shareholders’ Equity (Unaudited)
Salient Midstream & MLP Fund
May 31, 2022
| | | | | |
Assets: | | | | | |
Investments, at value (cost $146,951,107) | | | $ | 233,084,506 | |
Cash and cash equivalents | | | | 293,897 | |
Foreign currency, at value (cost $104,773) | | | | 106,747 | |
Dividends receivable | | | | 255,082 | |
Prepaids and other assets | | | | 18,597 | |
| | | | | |
Total Assets | | | | 233,758,829 | |
| | | | | |
Liabilities: | | | | | |
Credit facility | | | | 60,600,000 | |
Written options, at fair value (premiums received $82,812) | | | | 53,718 | |
Payable for investments purchased | | | | 171,836 | |
Payable to advisor | | | | 242,345 | |
Interest payable | | | | 102,243 | |
Commitment fees payable | | | | 1,200 | |
Accounts payable and accrued expenses | | | | 327,310 | |
| | | | | |
Total Liabilities | | | | 61,498,652 | |
| | | | | |
Net Assets applicable to common shareholders | | | $ | 172,260,177 | |
| | | | | |
Net Assets Applicable to Common Shareholders: | |
Capital stock, $0.01 par value; 17,722,448 shares issued and outstanding (unlimited shares authorized) | | | $ | 177,224 | |
Paid-in capital | | | | 337,333,001 | |
Total distributable earnings | | | | (165,250,048 | ) |
| | | | | |
Net assets applicable to common shareholders | | | $ | 172,260,177 | |
| | | | | |
Net Asset Value: | | | | | |
Net assets applicable to common shareholders | | | $ | 172,260,177 | |
Common shares outstanding | | | | 17,722,448 | |
Net asset value per common share outstanding | | | $ | 9.72 | |
| | | | |
| See accompanying Notes to Financial Statements. | | 11 | | |
Statement of Operations (Unaudited)
Salient Midstream & MLP Fund
For the Six Months Ended May 31, 2022
| | | | | |
Investment Income: | |
Distributions from master limited partnerships | | | $ | 2,123,211 | |
Less return of capital on distributions | | | | (2,123,211 | ) |
| | | | | |
Net investment income from master limited partnerships | | | | — | |
Dividends from master limited partnership related companies | | | | 3,477,828 | |
Less return of capital on dividends | | | | (1,499,291 | ) |
| | | | | |
Net investment income from master limited partnership related companies | | | | 1,978,537 | |
Foreign taxes withheld | | | | (167,145 | ) |
| | | | | |
Total Investment Income | | | | 1,811,392 | |
| | | | | |
Operating Expenses: | |
Investment advisory fee | | | | 1,246,679 | |
Management fee | | | | 79,782 | |
Administration fees | | | | 74,161 | |
Custodian fees | | | | 10,392 | |
Interest expense | | | | 384,836 | |
Commitment fees | | | | 2,205 | |
Professional fees | | | | 461,243 | |
Transfer agent fees | | | | 13,420 | |
Compliance fees | | | | 50,084 | |
Other expenses | | | | 100,961 | |
| | | | | |
Total Expenses | | | | 2,423,763 | |
| | | | | |
Net Investment Loss | | | | (612,371 | ) |
| | | | | |
Realized and Unrealized Gain (Loss): | | | | | |
Net realized gain on investments | | | | 4,105,760 | |
Net realized gain on written options | | | | 435,549 | |
Net realized loss on foreign currency | | | | (10,373 | ) |
| | | | | |
Net realized gain | | | | 4,530,936 | |
| | | | | |
Change in unrealized appreciation/depreciation on: | | | | | |
Investments | | | | 38,234,919 | |
Written options | | | | (90,569 | ) |
| | | | | |
Change in unrealized appreciation/depreciation from investments and written options | | | | 38,144,350 | |
| | | | | |
Net Realized and Unrealized Gain from Investments and Written options | | | | 42,675,286 | |
| | | | | |
Net Increase in Net Assets Applicable to Common Shareholders Resulting from Operations | | | $ | 42,062,915 | |
| | | | | |
| | | | |
| See accompanying Notes to Financial Statements. | | 12 | | |
Statements of Changes in Net Assets
Salient Midstream & MLP Fund
| | | | | | | | | | |
| | | Six Months Ended
May 31, 2022
(Unaudited) | | Year Ended
November 30, 2021 |
Operations: | |
Net investment loss | | | $ | (612,371 | ) | | | $ | (174,162 | ) |
Net realized gain | | | | 4,530,936 | | | | | 11,408,456 | |
Change in unrealized appreciation | | | | 38,144,350 | | | | | 26,712,178 | |
| | | | | | | | | | |
Net increase in net assets applicable to common shareholders resulting from operations | | | | 42,062,915 | | | | | 37,946,472 | |
| | | | | | | | | | |
Distributions: | | | | | | | | | | |
From distributable earnings | | | | (3,101,428 | ) | | | | — | |
From return of capital | | | | — | | | | | (4,607,836 | ) |
| | | | | | | | | | |
Total distributions to common shareholders | | | | (3,101,428 | ) | | | | (4,607,836 | ) |
| | | | | | | | | | |
Net increase in net assets applicable to common shareholders | | | $ | 38,961,487 | | | | $ | 33,338,636 | |
| | | | | | | | | | |
Net Assets: | |
Beginning of period | | | | 133,298,690 | | | | | 99,960,054 | |
| | | | | | | | | | |
End of period | | | $ | 172,260,177 | | | | $ | 133,298,690 | |
| | | | | | | | | | |
| | | | |
| See accompanying Notes to Financial Statements. | | 13 | | |
Statement of Cash Flows (Unaudited)
Salient Midstream & MLP Fund
For the Six Months Ended May 31, 2022
| | | | | |
Cash Flows from Operating Activities: | | | | | |
Net increase in net assets resulting from operations | | | $ | 42,062,915 | |
Adjustments to reconcile net increase in net assets resulting from operations to net cash used in operating activities | | | | | |
Purchase of investments | | | | (39,794,323 | ) |
Proceeds from disposition of investments | | | | 34,685,432 | |
Premiums from written options | | | | 557,238 | |
Proceeds paid to cover written options | | | | (123,705 | ) |
Premiums paid on exercised written options | | | | (46,028 | ) |
Amortization of premium and accretion of discount on investments | | | | — | |
Net realized loss on investments | | | | (3,382,244 | ) |
Net realized gain on written options | | | | (435,549 | ) |
Change in unrealized appreciation/depreciation from investments | | | | (35,335,933 | ) |
Change in unrealized appreciation/depreciation from affliated investments | | | | — | |
Change in unrealized appreciation/depreciation from written options | | | | 90,569 | |
Change in operating assets and liabilities: | | | | | |
Dividends receivable | | | | (8,689 | ) |
Interest receivable | | | | 20 | |
Prepaids and other assets | | | | (13,298 | ) |
Interest payable | | | | 54,258 | |
Payable to Advisor | | | | 43,331 | |
Unrealized gain on unfuded SPAC PIPE commitments | | | | (769 | ) |
Commitment fees payable | | | | 875 | |
Accounts payable and accrued expenses | | | | (141,633 | ) |
| | | | | |
Net cash used in operating activities | | | | (1,787,533 | ) |
| | | | | |
Cash Flows from Financing Activities: | | | | | |
Advances from credit facility | | | | 4,500,000 | |
Repayments on credit facility | | | | — | |
Distributions paid to common shareholders, net of reinvestments | | | | (3,101,428 | ) |
| | | | | |
Net cash provided by financing activities | | | | 1,398,572 | |
| | | | | |
Effect of Exchange Rates on Cash | | | | 1,974 | |
Net increase in cash and cash equivalents | | | | (386,987 | ) |
Cash and cash equivalents at beginning of year | | | | 787,631 | |
| | | | | |
Cash and cash equivalents at end of period | | | $ | 400,644 | |
| | | | | |
Supplemental Schedule of Cash Activity: | | | | | |
Cash paid for interest during the period | | | $ | 332,783 | |
Cash paid for commitment fees during the period | | | | 875 | |
| | | | |
| See accompanying Notes to Financial Statements. | | 14 | | |
Financial Highlights
Salient Midstream & MLP Fund
| | | | | | | | | | | | | | | | | | | | | | | | | | | | | | |
| | | Six Months Ended
May 31, 2022
(Unaudited) | | Year Ended
November 30,
2021 | | Year Ended
November 30,
2020 | | Year Ended
November 30,
2019 | | Year Ended
November 30,
2018 | | Year Ended
November 30,
2017 |
Per Common Share Data:(a) | | | | | | | | | | | | | | | | | | | | | | | | | | | | | | |
Net Asset Value, beginning of period | | | $ | 7.52 | | | | $ | 5.64 | | | | $ | 8.39 | | | | $ | 10.04 | | | | $ | 11.23 | | | | $ | 14.37 | |
Income/(loss) from operations: | | | | | | | | | | | | | | | | | | | | | | | | | | | | | | |
Net investment income/(loss)(b) | | | | (0.03 | ) | | | | (0.01 | ) | | | | 0.12 | | | | | (0.05 | ) | | | | (0.12 | ) | | | | 0.00 | (c) |
Net realized and unrealized gain/(loss) from investments | | | | 2.40 | | | | | 2.15 | | | | | (2.52 | ) | | | | (0.91 | ) | | | | (0.31 | ) | | | | (2.16 | ) |
Net increase (decrease) resulting from operations | | | | 2.37 | | | | | 2.14 | | | | | (2.40 | ) | | | | (0.96 | ) | | | | (0.43 | ) | | | | (2.16 | ) |
Distributions paid from: | | | | | | | | | | | | | | | | | | | | | | | | | | | | | | |
Net investment income | | | | (0.17 | ) | | | | — | | | | | — | | | | | — | | | | | — | | | | | — | |
In excess of net investment income | | | | — | | | | | — | | | | | — | | | | | (0.12 | ) | | | | (0.06 | ) | | | | — | |
Return of capital | | | | — | | | | | (0.26 | ) | | | | (0.35 | ) | | | | (0.57 | ) | | | | (0.70 | ) | | | | (0.98 | ) |
| | | | | | | | | | | | | | | | | | | | | | | | | | | | | | |
Net Asset Value, end of period | | | $ | 9.72 | | | | $ | 7.52 | | | | $ | 5.64 | | | | $ | 8.39 | | | | $ | 10.04 | | | | $ | 11.23 | |
| | | | | | | | | | | | | | | | | | | | | | | | | | | | | | |
Per common share market value, end of period | | | $ | 8.50 | | | | $ | 6.37 | | | | $ | 4.22 | | | | $ | 7.09 | | | | $ | 8.41 | | | | $ | 10.22 | |
| | | | | | | | | | | | | | | | | | | | | | | | | | | | | | |
Total investment return based on market value(d)(e) | | | | 36.43 | % | | | | 57.95 | % | | | | (36.19 | )% | | | | (8.23 | )% | | | | (11.05 | )% | | | | (17.08 | )% |
| | | | | | | | | | | | | | | | | | | | | | | | | | | | | | |
Ratios to Average Net Assets:(f) | | | | | | | | | | | | | | | | | | | | | | | | | | | | | | |
Net investment income/(loss) | | | | (0.80 | )% | | | | (0.14 | )% | | | | 1.87 | % | | | | (0.49 | )% | | | | (1.09 | )% | | | | 0.01 | % |
Net operating expenses (including tax expense/benefit) | | | | 3.17 | % | | | | 2.75 | % | | | | 2.97 | % | | | | 3.49 | % | | | | 3.26 | % | | | | 2.40 | % |
Net operating expenses (excluding tax benefit/expense) | | | | 3.17 | % | | | | 2.75 | % | | | | 2.97 | % | | | | 3.49 | % | | | | 3.26 | % | | | | 2.87 | % |
Supplemental Data: | | | | | | | | | | | | | | | | | | | | | | | | | | | | | | |
Net assets applicable to common shareholders, end of period (in 000s) | | | $ | 172,260 | | | | $ | 133,299 | | | | $ | 99,960 | | | | $ | 148,693 | | | | $ | 177,877 | | | | $ | 199,045 | |
Average net assets (000s) | | | $ | 153,201 | | | | $ | 128,076 | | | | $ | 109,424 | | | | $ | 173,820 | | | | $ | 200,269 | | | | $ | 236,834 | |
Portfolio turnover(e) | | | | 16.97 | % | | | | 86.03 | % | | | | 155.52 | % | | | | 44.75 | % | | | | 45.27 | % | | | | 23.72 | % |
Asset coverage per $1,000 unit of senior indebtedness(g) | | | $ | 3,843 | | | | $ | 3,376 | | | | $ | 5,760 | | | | $ | 4,804 | | | | $ | 3,402 | | | | $ | 3,585 | |
Short-term borrowings, end of period (000s) | | | $ | 60,600 | | | | $ | 56,100 | | | | $ | 21,000 | | | | $ | 39,089 | | | | $ | 74,039 | | | | $ | 76,989 | |
(a) Information presented relates to a common share outstanding for periods indicated.
(b) Per share net investment income/(loss) has been calculated using the average daily shares method.
(c) Amount represents less than $0.01 per share.
(d) Total investment return is calculated assuming a purchase of common shares at the current market price on the first day of the period and a sale at the closing market price on the last day of the period reported (excluding brokerage commissions). Dividends and distributions are assumed for the purpose of this calculation to be reinvested at prices obtained under the Dividend Reinvestment Plan (“DRIP”).
(e) Not annualized for periods less than one year.
(f) Annualized for periods less than one year.
(g) Calculated by subtracting the Fund’s total liabilities (not including borrowings) from the Fund’s total assets and dividing by the total number of senior indebtedness units, where one unit equals $1,000 of senior indebtedness.
| | | | |
| See accompanying Notes to Financial Statements. | | 15 | | |
Notes to Financial Statements
May 31, 2022
(1) ORGANIZATION
Salient Midstream & MLP Fund (the “Fund”), a Delaware statutory trust registered under the Investment Company Act of 1940, as amended (the “1940 Act”), commenced operations on May 24, 2012 as a non-diversified, closed-end management investment company. The Fund is authorized to issue an unlimited number of common shares of beneficial interest (“Common Shares”), which may be issued in more than one class or series. The Fund’s Common Shares are listed on the New York Stock Exchange (“NYSE”) under the symbol “SMM”.
The Fund’s objective is to provide a high level of total return with an emphasis on making quarterly cash distributions to its common shareholders. The Fund seeks to achieve its investment objective by investing at least 80% of its total assets in securities of midstream companies and master limited partnerships (“MLPs”).
The board of trustees of the Fund (each member thereof a “Trustee” and collectively, the “Board”) is authorized to engage an investment advisor, and pursuant to an investment management agreement (the “Investment Management Agreement”), it has selected Salient Capital Advisors, LLC (the “Advisor”) to manage the Fund’s portfolio and operations. The Advisor is a Texas limited liability company that is registered as an investment advisor under the Investment Advisers Act of 1940, as amended. Under the Investment Management Agreement, the Advisor is responsible for the establishment of an investment committee (the “Investment Committee”), which is responsible for developing, implementing, and supervising the Fund’s investment program subject to the ultimate supervision of the Board.
The Fund owns 100% of the limited partnership interests of EMG Utica I Offshore Co-Investment, LP (“EMG Utica”). EMG Utica holds a non-controlling underlying interest in Mark West Utica EMG, L.L.C., which is a joint venture between Mark West Energy Partners, L.P. (“Mark West”) and The Energy and Minerals Group (“EMG”). Mark West is owned by MPLX LP (NYSE: MPLX), which is a U.S. domiciled publicly traded master limited partnership that owns, operates, develops, and acquires midstream energy infrastructure assets. EMG is a private investment firm that targets equity investments in the energy and minerals sector. EMG Utica is considered a variable interest entity (“VIE”) as it is a partnership and the Fund, as the limited partner, lacks the ability to remove the general partner and does not have any substantive participating rights, as these reside with EMG Utica Co-Investment GP, LLC, the general partner for EMG Utica. This means the general partner of EMG Utica has full, exclusive and unilateral power and authority to manage, control, administer and operate the assets and business affairs of EMG Utica. Under Financial Accounting Standards Board (“FASB”) Accounting Standards Codification (“ASC”) Topic 810, “Consolidation”, prior to the adoption of ASC update 2015-02, management believed the Fund was the primary beneficiary as it owned 100% of EMG Utica and had the right to receive the
economic benefit from the investment, and therefore consolidated EMG Utica in the Fund’s financial statements for the year ended November 30, 2016. Under ASC Update 2015-02, which the Fund adopted effective the year ended November 30, 2017, consolidation of a VIE’s financial statements would occur if a limited partner has the power to direct the activities and the right to receive the benefits from the entity considered for consolidation. EMG Utica is no longer consolidated within the Fund’s financial statements, effective the year ended November 30, 2017.
(2) SUMMARY OF SIGNIFICANT ACCOUNTING POLICIES AND PRACTICES
(a) BASIS OF ACCOUNTING
The financial statements have been prepared in conformity with generally accepted accounting principles in the United States of America (“U.S. GAAP”). The accompanying financial statements reflect the financial position of the Fund. The Fund is an investment company and follows the investment company accounting and reporting guidance under FASB ASC Topic 946, “Financial Services-Investment Companies”.
(b) CASH EQUIVALENTS
The Fund considers all unpledged temporary cash investments with a maturity date at the time of purchase of three months or less to be cash equivalents.
(c) PORTFOLIO SECURITIES TRANSACTIONS
Security transactions are accounted for on a trade date basis. Realized gains and losses are reported using the specific identification cost basis.
(d) INVESTMENT VALUATION
The valuation of the Fund’s investments is determined each day based on the most recent close of regular session trading on the NYSE and reported by ALPS Fund Services, Inc., the Fund’s independent administrator (the “Administrator” or “ALPS”). The Fund’s valuation policies are discussed in further detail in Note 3.
The Board has formed a valuation committee (the “Board Valuation Committee”) that is responsible for overseeing the Fund’s valuation policies, making recommendations to the Board on valuation-related matters, and overseeing implementation by the Advisor of the Fund’s valuation policies.
The Board has authorized the Advisor to establish a valuation committee of the Advisor (the “Advisor Valuation Committee”). The Advisor Valuation Committee’s function, subject to oversight of the Board
Notes to Financial Statements, continued
May 31, 2022
Valuation Committee and the Board, is generally to review the Fund’s valuation methodologies, valuation determinations, and any information provided to the Advisor Valuation Committee by the Advisor or the Administrator.
To the extent that the price of a security cannot be determined applying the methods described below, the Advisor Valuation Committee in conjunction with the Administrator will determine the price of the security pursuant to the fair value procedures approved by the Board.
Investments held by the Fund are valued as follows:
| | • | | SECURITIES LISTED ON A SECURITIES EXCHANGE OR OVER-THE-COUNTER EXCHANGES—In general, the Fund values those securities at their last sales price on the exchange or over-the-counter market or a market’s official closing price on the valuation date. If the security is listed on more than one exchange, the Fund uses the price from the exchange that it considers to be the principal exchange on which the security is traded. If there have been no sales for that day on the exchange where the security is principally traded, then the price of the security will be valued at the mean between the closing “bid” and “ask” prices on the valuation date. |
| | • | | PUBLICLY-TRADED EQUITY SECURITIES ACQUIRED IN A DIRECT PLACEMENT TRANSACTION—Such securities may be subject to restrictions on resale that can affect the security’s liquidity and fair value. Such securities that are convertible or otherwise will become freely tradable will be valued based on the market value of the freely tradable security less an applicable restriction discount. Generally, the discount will initially be equal to the discount at which the Fund purchased the securities and thereafter will be periodically reassessed and likely reduced over the anticipated restricted period. |
| | • | | DERIVATIVES—Exchange traded futures contracts are valued using quoted final settlement prices from the national exchange on which they are principally traded. If no such price is reported by such exchange on the valuation date, the Advisor Valuation Committee will determine the fair value in good faith using information that is available at such time. |
Options that are listed on a securities exchange are generally valued on the valuation date at the mean of the closing bid and ask prices of the posted market on the exchange on which they are listed. If on the valuation date the primary exchange is closed, the prior day price will be used. If no such price is reported, the fair value of such options will be determined in good faith using industry standard pricing models utilizing publicly available input information on the valuation date.
Options traded on an over-the-counter market are generally valued using the mean of the closing bid and ask prices provided by an independent pricing service. If a quotation is not available from the independent pricing service, the price is obtained from a broker (typically counterparty to the option) on the valuation date. If no such price is available on the valuation date, the Advisor Valuation Committee in conjunction with the Administrator will determine the fair value of such options in good faith using information that is available at such time.
Non exchange-traded derivatives, such as swap agreements, are valued based on procedures approved by the Board. Credit default swaps and total return swaps are generally fair valued using evaluated quotes provided by an independent pricing service. If a quotation is not available from the independent pricing service, the price is obtained from a broker (typically the counterparty to the swap agreement) on the valuation date.
| | • | | SECURITIES NOT ACTIVELY TRADED—The value of securities, derivatives or synthetic securities that are not actively traded on an exchange are determined by obtaining quotes from brokers that normally deal in such securities or by an unaffiliated pricing service that may use actual trade data or procedures using market indices, matrices, yield curves, specific trading characteristics of certain groups of securities, pricing models or a combination of these procedures. Securities for which independent pricing services are not available are valued pursuant to the valuation procedures approved by the Board. |
| | • | | INVESTMENT FUNDS—Investments in investment limited partnerships and shares in unregistered investment funds (“Investment Funds”) for which a market value is not available will generally be valued using the partners’ capital or net asset value (the “NAV”) as a practical expedient, as reported by the Investment Fund managers or the administrators of such Investment Funds. These Investment Funds value their underlying investments in accordance with policies established by such Investment Funds. Prior to investing in any Investment Fund, the Adviser Valuation Committee, as part of the due diligence process, conducts a review of the valuation methodologies employed by the Investment Fund to determine whether such methods are appropriate for the asset types. The Adviser Valuation Committee will consider whether it is appropriate, in light of the relevant circumstances, to value shares at NAV as reported by an Investment Fund for valuation purposes, or whether to adjust such reported value to reflect an adjusted fair value. Because of the inherent uncertainty of valuation, fair value may differ significantly from the value that would have been used had |
Notes to Financial Statements, continued
May 31, 2022
| | | readily available markets for the investments in Investment Funds existed. The Fund’s investments in Investment Funds are subject to the terms and conditions of the respective operating agreements and offering memoranda of such Investment Funds. |
| | • | | OTHER—Investments in private placement securities and other securities for which market quotations are not readily available will be valued in good faith by using fair value procedures approved by the Board. Such fair value procedures may consider among other factors discounts to publicly traded issues, time until conversion date, securities with similar yields, quality, type of issue, coupon, duration and rating, and an analysis of the issuer’s financial statements and reports. Valuation techniques such as the market approach and/or income approach may be used when sufficient and reliable data is available. If events occur that affect the value of the Fund’s securities before the NAV has been calculated, the securities so affected will generally be priced using fair value procedures. |
| | • | | SPECIAL PURPOSE ACQUISITION COMPANIES—The Fund may invest in stock, warrants, and other securities of special purpose acquisition companies (“SPACs”) or similar special purpose entities that pool funds to seek potential acquisition opportunities. The Fund may enter into a commitment with a SPAC for a private investment in a public equity (“PIPE”) which will be satisfied if and when the SPAC completes its merger or acquisition. PIPEs are illiquid and restricted, and unfunded SPAC PIPE commitments are marked-to-market with the unrealized appreciation/depreciation separately presented in the Statement of Assets and Liabilities and Statement of Operations. As of May 31, 2022, the Fund did not hold any unfunded SPAC PIPE Commitments. |
(e) FOREIGN CURRENCY
The accounting records of the Fund are maintained in U.S. dollars. Foreign currency amounts and investments denominated in a foreign currency, if any, are translated into U.S. dollar amounts at current exchange rates on the valuation date. Purchases and sales of investments denominated in foreign currencies are translated into U.S. dollar amounts at the exchange rate on the respective dates of such transactions. The Fund does not isolate the portion of the results of operations resulting from changes in foreign exchange rates on investments from fluctuations arising from changes in market prices of securities held. Such fluctuations are included with the net realized and unrealized gains on investments.
(f) MASTER LIMITED PARTNERSHIPS
Entities commonly referred to as MLPs are generally organized under state law as limited partnerships or limited liability companies. The Fund invests in MLPs receiving partnership taxation treatment under the Internal Revenue Code of 1986, as amended (the “Code”), and whose interests or “units” are traded on securities exchanges like shares of corporate stock. To be treated as a partnership for U.S. federal income tax purposes, an MLP whose units are traded on a securities exchange must receive at least 90% of its income from qualifying sources such as interest, dividends, real property rents, gains on dispositions of real property, income and gains from mineral or natural resources activities, income and gains from the transportation or storage of certain fuels, and, in certain circumstances, income and gains from commodities or futures, forwards and options on commodities. Mineral or natural resources activities include exploration, development, production, processing, mining, refining, marketing and transportation (including pipelines) of oil and gas, minerals, geothermal energy, fertilizer, timber or industrial source carbon dioxide. An MLP consists of a general partner and limited partners (or in the case of MLPs organized as limited liability companies, a managing member and members).
The general partner or managing member typically controls the operations and management of the MLP and has an ownership stake in the partnership or limited liability company. The limited partners or members, through their ownership of limited partner or member interests, provide capital to the entity, are intended to have no role in the operation and management of the entity and receive cash distributions. The Fund’s investments in MLPs consist only of limited partner or member interest ownership. The MLPs themselves generally do not pay U.S. federal income taxes. Thus, unlike investors in corporate securities, direct MLP investors are generally not subject to double taxation (i.e., corporate level tax and tax on corporate dividends). Currently, most MLPs operate in the energy and/or natural resources sector.
(g) RESTRICTED SECURITIES
The Fund may invest up to 30% of its total assets in unregistered or otherwise restricted securities of which up to 10% may be in securities of privately held companies. The percentage limitations applicable to the Fund’s portfolio described above apply only at the time of investment and the Fund is not required to sell securities due to subsequent changes in the value of securities it owns. A restricted security is a security which has been purchased through a private offering and cannot be resold to the general public without prior registration under the Securities Act of 1933 (the “1933 Act”) or pursuant to the resale limitations provided by Rule 144 under the 1933 Act, or an exemption from the registration requirements of the 1933 Act. Certain restricted securities may be resold in transactions exempt from registration, normally to qualified institutional buyers.
Notes to Financial Statements, continued
May 31, 2022
The restricted securities held at May 31, 2022 are identified below and are also presented in the Fund’s Schedule of Investments.
| | | | | | | | | | | | | | | | | | | | | | | | | |
Security | | % of Net
Assets | | Acquisition
Date | | Shares/Units | | Cost | | Fair Value |
EMG Utica I Offshore Co-Investment, LP | | | | 7.45 | % | | | | 2/22/2013 | | | | | 16,000,000 | | | | $ | 13,489,733 | | | | $ | 12,841,593 | |
Microvast Holdings, Inc. | | | | 0.86 | % | | | | 7/22/2021 | | | | | 297,400 | | | | $ | 3,026,045 | | | | $ | 1,487,000 | |
TortoiseEcofin Acquisition Corp. III - Founder Shares | | | | 0.00 | % | | | | 7/21/2021 | | | | | 41,550 | | | | $ | 125 | | | | $ | 125 | |
| | | | | | | | | | | | | | | | | | | | | | | | | |
Total Restricted Securities | | | | 8.32 | % | | | | | | | | | | | | | $ | 16,515,903 | | | | $ | 14,328,718 | |
| | | | | | | | | | | | | | | | | | | | | | | | | |
(h) INVESTMENT INCOME
Interest income is recognized on the accrual basis. Distributions are recorded on the ex-dividend date. Distributions received from the Fund’s investments in MLPs generally are composed of ordinary income, capital gains and return of capital from the MLPs.
(i) USE OF ESTIMATES
The financial statements have been prepared in conformity with U.S. GAAP, which requires management to make estimates and assumptions relating to the reported amounts of assets and liabilities and the disclosure of contingent assets and liabilities at the date of the financial statements and the reported amounts of income and expenses during the reporting period. Actual results may differ from those estimates and such differences may be significant.
(j) DERIVATIVE INSTRUMENTS
The Fund may invest in derivatives in order to meet its investment objectives. The risk in using derivatives varies depending upon the structure of the instruments. All open derivative positions at period end, if any, are presented in the Fund’s Schedule of Investments. The following is a description of the derivative instruments that the Fund has utilized as part of its investment strategy, including the primary underlying risk exposures related to each instrument type.
OPTIONS—The Fund may write equity call options with the purpose of generating realized gains from premiums as a means to enhance distributions to the Fund’s common shareholders. Options are secured by investments, as detailed in the Fund’s Schedule of Investments. A call option on a security is a contract that gives the holder of such call option the right to buy the security underlying the call option from the writer of such call option at a specified price at any time during the term of the option. At the time the call option is sold, the writer of a call option receives a premium from the buyer of such call option. If the Fund writes a call option, it will have the obligation upon exercise of such call option to deliver the underlying security upon payment of the exercise price. As the writer of a covered call option, during the option’s life, the Fund gives up the opportunity to profit from increases in the market
value of the security covering the call option above the sum of the premium and the strike price of the call, but the Fund retains the risk of loss should the price of the underlying security decline.
FUTURES CONTRACTS—The Fund may invest in futures contracts as a part of its hedging strategy to manage exposure to interest rate, equity and market price movements, and commodity prices. A futures contract represents a commitment for the future purchase or sale of an asset at a specified price on a specified date. The underlying asset is not physically delivered. Futures contracts are valued at their quoted daily settlement prices. Upon entering into a futures contract, the Fund is required to segregate liquid assets in accordance with the initial margin requirements of the clearinghouse to secure the Fund’s performance. The clearinghouse also requires daily settlement of variation margin representing changes in the value of each contract. Fluctuations in the value of the contracts are recorded as unrealized appreciation (depreciation) until the contracts are closed, when they are recorded as net realized gain (loss) on futures contracts. The primary risks associated with the use of futures contracts are imperfect correlation between changes in fair values of the underlying assets and the prices of futures contracts, and the possibility of an illiquid market. With exchange-traded futures, there is minimal counterparty credit risk to the Fund since the exchange is a regulated clearinghouse and is a counterparty to all exchange-traded futures which guarantees payment of the futures contract.
SWAP AGREEMENTS—The Fund may invest in swap agreements, including credit default and total return swap agreements, in connection with its hedging strategy to manage market risks.
A total return swap is a bilateral financial contract agreement where one party (the payer) agrees to pay the other (the receiver) the total return on a specified asset or index in exchange for a fixed or floating rate of return. A total return swap allows the receiver or payer to derive the economic benefit of owning or having short exposure to an asset without owning or shorting the underlying asset directly. The receiver is entitled to the amount, if any, by which the notional amount of the total return swap would have increased in value had it been invested in the particular instruments, plus an amount equal to any dividends or interest that would have been received on those instruments. In return, the payer is entitled to an amount equal to a fixed or floating rate of interest
Notes to Financial Statements, continued
May 31, 2022
(e.g., a reference rate based on the average interest rate at which major global banks can borrow from one another) on the notional amount of the swap plus the amount, if any, by which the notional amount would have decreased in value had it been invested in such instruments, less any dividends or interest. The amounts to which each party is entitled are normally netted against each other at periodic settlement dates, resulting in a single amount that is either due to or from each party.
A credit default swap gives one party (the buyer) the right to recoup the economic value of a decline in the value of debt securities of the reference issuer if a credit event (a downgrade, bankruptcy or default) occurs. This value is obtained by delivering a debt security of the reference issuer to the party in return for a previously agreed upon payment from the other party (frequently, the par value of the debt security) or receive a net amount equal to the par value of the defaulted reference entity less its recovery value. The Fund is usually a net buyer of credit default swaps.
The Fund as a buyer of a credit default swap would have the right to deliver a referenced debt obligation and receive the par (or other agreed-upon) value of such debt obligation from the counterparty in the event of a default or other credit event by the reference issuer with respect to its debt obligations. In return, the Fund would pay the counterparty a periodic stream of payments over the term of the agreement provided that no event of default or other credit event has occurred. If no default or other credit event occurs, the counterparty would keep the stream of payments and would have no further obligations to the Fund.
In addition to being exposed to the credit risk of the underlying reference entity, swap agreements are subject to counterparty risk, market risk and interest rate risk. Swap agreements utilized by the Fund may not perform as expected. Risks may arise as a result of the failure of the counterparty to perform under the agreement. The loss incurred by the failure of a counterparty is generally limited to the market value and premium amounts recorded. The Fund considers the creditworthiness of each counterparty to a swap agreement in evaluating potential credit risk, and will not enter into any swap agreement unless the Advisor believes the counterparty to the transaction is creditworthy. Additionally, risks may arise from the unanticipated movements in interest rates or in the value of the underlying reference assets. The Fund may use various techniques to minimize credit risk including early termination or reset and payment. Collateral, in the form of cash, is held in broker segregated accounts for swap agreements.
The following is a summary of the effect of derivative instruments on the Statement of Operations for the period ended May 31, 2022:
| | | | | | | | | | |
| | | Net Realized
Gain on
Written Options | | Change in
Unrealized
Appreciation/
Depreciation
on Written Options |
Equity Risk Exposure: | | | | | | | | | | |
Written Call Options | | | $ | 435,549 | | | | $ | (90,569 | ) |
As described above, the Fund utilized derivative instruments to achieve its investment objective during the period ended May 31, 2022. The Fund may enter into International Swaps and Derivatives Association, Inc. Master Agreements (“ISDA Master Agreement”) or similar agreements with its derivative contract counterparties whereby the Fund may, under certain circumstances, offset with the counterparty certain derivative financial instruments’ payables and/or receivables with collateral held and/or posted and create one single net payment. There were no derivative financial instruments that are subject to enforceable netting arrangements or other similar agreements as of May 31, 2022.
The following is a summary of the average monthly notional value of written options during the period ended May 31, 2022:
| | | | | | | | | | |
| | | Average Monthly
Notional Value | | Notional Value
Outstanding at
May 31, 2022 |
Written Call Options | | | $ | 1,976,333 | | | | $ | 4,095,067 | |
(k) DISTRIBUTIONS TO SHAREHOLDERS
The Fund intends to continue to comply with the requirements under Subchapter M of the Code in order to continue to qualify as a regulated investment company (“RIC”). If so qualified, the Fund will not be subject to federal income tax to the extent it distributes substantially all of its net investment income and net capital gains to its shareholders.
The Fund generally makes quarterly distributions to shareholders. Net realized capital gains, if any, are distributed annually. Distributions from net realized gains may include short-term capital gains. All net short term capital gains are included in ordinary income for tax purposes. Distributions to shareholders are recorded on the ex-dividend date. The Fund may also pay, at the end of the calendar year, a special distribution to comply with requirements under the Code.
Each shareholder will automatically be a participant under the Fund’s Dividend Reinvestment Plan (“DRIP”) and have all income distributions and capital gains distributions automatically reinvested in Shares, unless a shareholder otherwise elects to receive distributions in cash. Generally, for U.S. federal income tax purposes, shareholders receiving Shares under the DRIP will be treated as having received a distribution
Notes to Financial Statements, continued
May 31, 2022
equal to the amount of cash they would have received had the shareholder not participated in the DRIP.
The character of distributions made during the period from net investment income or net realized gains may differ from its ultimate characterization for federal income tax purposes.
The amount of distributions is determined in accordance with federal income tax regulations which may differ from U.S. GAAP. These “book/tax” differences are either considered temporary or permanent in nature. To the extent these differences are permanent in nature (e.g., return of capital and differing treatment on partnership investments), such amounts are reclassified within the composition of net assets based on their federal tax-basis treatment; temporary differences (e.g., wash sales, differing treatment on partnership investments, late year ordinary loss deferrals and capital loss carryforwards) do not require a reclassification. Distributions which exceed net investment income and net realized gains for financial reporting purposes but not for tax purposes are reported as distributions in excess of net investment income or net realized gains. To the extent they exceed net investment income and net realized gains for tax purposes, they are reported as return of capital.
(l) CFTC REGULATION
The Commodity Futures Trading Commission (“CFTC”) adopted rules to harmonize conflicting United States Securities and Exchange Commission (the “SEC”) and CFTC disclosure, reporting and recordkeeping requirements for registered investment companies that do not meet an exemption from the definition of commodity pool. The harmonization rules provide that the CFTC will accept the SEC’s disclosure, reporting, and recordkeeping regime as substituted compliance for substantially all of the otherwise applicable CFTC regulations as long as such investment companies meet the applicable SEC requirements. With respect to the Fund, the Advisor has claimed an exemption from the definition of the term “commodity pool operator” under CFTC Regulation 4.5 of the Commodity Exchange Act (“CEA”). As such, the Fund is not currently subject to registration or regulation as a commodity pool under the CEA. Effective November 18, 2019, the Advisor is no longer registered with the CFTC as a commodity pool operator and commodity trading adviser, and is no longer a member of the National Futures Association given the current activities.
(m) RETURN OF CAPITAL ESTIMATES
Distributions received from the Fund’s investments in MLPs generally are composed of income, capital gains and return of capital. The Fund records investment income and return of capital based on estimates made at the time such distributions are received. Such estimates are based on historical information available from each MLP and other industry sources. These estimates may subsequently be revised based
on information received from MLPs after their tax reporting periods are concluded.
For the period ended May 31, 2022, the Fund estimated that approximately 100% of the MLP distributions received and certain distributions received from master limited partnership related companies would be treated as a return of capital. The Fund recorded as return of capital the amount of $3,662,502 of dividends and distributions received from its investments.
(3) FAIR VALUE MEASUREMENTS
The Fund defines fair value as the price that would be received to sell an asset or paid to transfer a liability in an orderly transaction between market participants at the measurement date under current market conditions.
The valuation techniques employed by the Fund, as described below, maximize the use of observable inputs and minimize the use of unobservable inputs in determining fair value. The inputs used to determine the fair value of the Fund’s investments are summarized in the three broad levels listed below:
| | • | | Level 1—unadjusted quoted prices in active markets for identical investments |
| | • | | Level 2—investments with other significant observable inputs (including quoted prices for similar securities, interest rates, prepayment speeds, credit risk, etc.) |
| | • | | Level 3—investments with significant unobservable inputs (including the Fund’s own assumptions in determining the fair value of investments) that are developed based on the best information available |
Changes in valuation techniques may result in transfers in or out of an assigned level within the disclosure hierarchy. The Fund discloses transfers between levels based on valuations at the end of the reporting period. The inputs or methodology used for valuing investments are not necessarily an indication of the risk associated with investing in those investments.
Other assets and securities, which are generally not exchange-traded, or for which market quotations are not readily available, or are deemed unreliable are valued at fair value as determined in good faith by the Advisor Valuation Committee. Fair value pricing may be used for significant events such as securities for which trading has been suspended, prices have become stale or for which there is no currently available price at the close of the NYSE. When observable prices are not available, the Advisor Valuation Committee may use one or more valuation techniques such as the market approach, the income approach, or internal pricing models for which sufficient and reliable data is available.
Notes to Financial Statements, continued
May 31, 2022
The market approach generally consists of using comparable market data and transactions. The income approach generally consists of estimating future cash flows from an investment to determine the net present value. A significant change in the unobservable inputs could result in a significantly lower or higher fair value measurement. Depending on the source and relative significance of valuation inputs, these investments may be classified as Level 2 or Level 3 in the fair value hierarchy.
The Fund establishes valuation processes and procedures to ensure that the valuation techniques for investments that are categorized within Level 3 of the fair value hierarchy are fair, consistent, and appropriate. The Advisor is responsible for developing the Fund’s written valuation processes and procedures, conducting periodic reviews of the valuation policies, and evaluating the overall fairness and consistent application of the valuation policies. The Board Valuation Committee has authorized
the Advisor to oversee the implementation of the Board approved valuation procedures by the Administrator. The Advisor Valuation Committee is comprised of various Fund personnel, which include members from the Fund’s portfolio management and operations groups. The Advisor Valuation Committee meets monthly or as needed, to determine the valuations of the Fund’s Level 3 investments. Fund valuations are required to be supported by market data, industry accepted third-party valuation models, or other methods the Advisor Valuation Committee deems to be appropriate, including the use of internal proprietary valuation models. In addition, changes in the underlying assumptions used in the fair value measurement technique, including discount rates, liquidity risks, and estimates of future cash flows, could significantly affect these fair value estimates. Because of the inherent uncertainty of valuation, including Level 3 input risk, this estimated value may differ from the value that would have been used had a ready market for this investment existed, and the differences could be significant.
The following is a summary categorization of the Fund’s investments based upon the three levels defined above as of May 31, 2022. The breakdown by category of equity securities is disclosed in the Schedule of Investments.
| | | | | | | | | | | | | | | | | | | | | | | | | | | | | | | | | | | |
| | | Level 1 | | Level 2 | | Level 3 | | Investments
Valued at
NAV as a
Practical
Expedient | | Total |
| | | Investment
Securities | | Investment
Securities | | Other
Financial
Instruments | | Investment
Securities | | Investment
Securities | | Investment
Securities | | Other
Financial
Instruments |
Master Limited Partnerships | | | $ | 56,038,664 | | | | $ | — | | | | $ | — | | | | $ | — | (a) | | | $ | — | | | | $ | 56,038,664 | | | | $ | — | |
MLP Related Companies | | | $ | 164,204,124 | | | | $ | — | | | | $ | — | | | | $ | 12,841,593 | | | | $ | — | | | | $ | 177,045,717 | | | | $ | — | |
Special Purpose Acquisition Companies | | | | — | | | | | — | | | | | — | | | | | 125 | | | | | — | | | | | 125 | | | | | — | |
Written Options | | | | — | | | | | — | | | | | (53,718 | ) | | | | — | | | | | — | | | | | — | | | | | (53,718 | ) |
| | | | | | | | | | | | | | | | | | | | | | | | | | | | | | | | | | | |
Total | | | $ | 220,242,788 | | | | $ | — | | | | $ | (53,718 | ) | | | $ | 12,841,718 | | | | $ | — | | | | $ | 233,084,506 | | | | $ | (53,718 | ) |
| | | | | | | | | | | | | | | | | | | | | | | | | | | | | | | | | | | |
(a) During the period ended May 31, 2022, the Fund continued to value EMG Utica I Offshore Co-Investment LP with an income approach using a discounted cash flow model.
Notes to Financial Statements, continued
May 31, 2022
The following is a reconciliation of Level 3 investments based on the inputs used to determine fair value:
| | | | | | | | | | | | | | | | | | | | | | | | | | | | | | | | | | | | | | | | | | | | | |
Asset Type | | Balance as
of November 30,
2021 | | Purchases | | Sales
Proceeds | | Realized
Gain/(Loss) | | Change in
Unrealized
Appreciation/
(Depreciation) | | Transfer
into
Level 3 | | Transfer
Out of
Level 3 | | Balance as
of May 31,
2022 | | Net change in
unrealized
appreciation/
(depreciation)
included in the
Statement of
Operations
attributable
to Level 3
investments
held at
May 31,
2022 |
MLP Related Companies | | | $ | 15,591,011 | | | | $ | — | | | | $ | — | | | | $ | — | | | | $ | (2,749,418 | ) | | | $ | — | | | | $ | — | | | | $ | 12,841,593 | | | | $ | (2,749,418 | ) |
Special Purpose Acquisition Companies | | | | 125 | | | | | — | | | | | — | | | | | — | | | | | — | | | | | — | | | | | — | | | | | 125 | | | | | — | |
Unfunded SPAC PIPE Commitments | | | | (769 | ) | | | | — | | | | | — | | | | | — | | | | | 769 | | | | | — | | | | | — | | | | | — | | | | | — | |
| | | | | | | | | | | | | | | | | | | | | | | | | | | | | | | | | | | | | | | | | | | | | |
Total | | | $ | 15,590,367 | | | | $ | — | | | | $ | — | | | | $ | — | | | | $ | (2,748,649 | ) | | | $ | — | | | | $ | — | | | | $ | 12,841,718 | | | | $ | (2,749,418 | ) |
| | | | | | | | | | | | | | | | | | | | | | | | | | | | | | | | | | | | | | | | | | | | | |
The table below provides additional information about the Level 3 Fair Value Measurements as of May 31, 2022:
Qualitative Information about Level 3 Fair Value Measurements
| | | | | | | | | | | | | | |
Asset Class | | Fair Value | | Valuation
Technique | | Unobservable
Inputs(a) | | Input Value/
Range |
MLP Related Companies | | | $ | 12,841,593 | | | Discounted Cash Flow | | Discount Rate | | | | 11.5% | |
| | | | | | | | | Terminal Cash Flow Exit Multiple | | | | 10.8x | |
Special Purpose Acquisition Companies | | | | 125 | | | Recent Transaction | | Recent Transaction | | | $ | 0.003 | |
(a) A change to the unobservable input may result in a significant change to the value of the investment as follows:
| | | | |
Unobservable Inputs | | Impact to Value if Input Increases | | Impact to Value if Input Decreases |
Discount Rate | | Decrease | | Increase |
Terminal Cash Flow Exit Multiple | | Increase | | Decrease |
Recent Transaction | | Increase | | Decrease |
EMG Utica’s originally planned dissolution date of December 31, 2021 was extended to December 31, 2022, with the ability to extend for an additional one-year period at the election of the general partner, EMG Utica Co-Investment GP, LLC. Upon dissolution, the Fund would receive its share of the net proceeds from the sale of underlying assets in EMG Utica which may differ from the Fund’s valuation of its position in EMG Utica due to the inherent uncertainty of valuation, including Level 3 input risk currently being used for valuation purposes, and the difference could be significant. The Fund does not have any unfunded commitments in EMG Utica and the investment cannot be sold by the Fund without the consent of EMG Utica Co-Investment GP, LLC.
(4) CREDIT FACILITY
The Fund maintains a line of credit agreement (the “Agreement”) with Bank of Nova Scotia (“BNS”) which provides a $75,000,000 committed lending facility. Borrowings under the Agreement are secured by investments, as detailed in the Fund’s Schedule of Investments. The Agreement provides for a commitment fee of 0.10% per annum on undrawn amounts above a certain threshold plus interest accruing on outstanding borrowed amounts at the one month LIBOR plus 0.95% per annum. The Fund initially entered the Agreement on November 17, 2014, and the Agreement provides the Fund with a rolling 364 day commitment period. The average principal balance and weighted average interest rate for the period ended May 31, 2022, was approximately $55,504,945 and 1.35%, respectively. At May 31, 2022, the principal balance outstanding was $60,600,000 at an interest rate of 2.14%, and
Notes to Financial Statements, continued
May 31, 2022
the aggregate market value of the securities held as collateral was $132,307,401, representing 76.81% of net assets.
On July 27, 2017, the head of the United Kingdom’s Financial Conduct Authority announced a desire to phase out the use of the London Interbank Offered Rate (“LIBOR”). The ICE Benchmark Administration Limited, the administrator of LIBOR, ceased publishing most LIBOR maturities, including some US LIBOR maturities, on December 31, 2021, and is expected to cease publishing the remaining and most liquid US LIBOR maturities on June 30, 2023. Financial industry groups have begun planning for that transition, however, there remains uncertainty regarding the future utilization of LIBOR and the nature of any replacement rate. The U.S. Federal Reserve, in conjunction with the Alternative Reference Rates Committee, a steering committee comprised of large U.S. financial institutions, intends to replace LIBOR with the Secured Overnight Funding Rate (SOFR), a new index calculated
by short-term repurchase agreements, backed by U.S. Treasury securities. Abandonment of or modifications to LIBOR could have adverse impacts and represent a significant risk on newly issued financial instruments and existing financial instruments which reference LIBOR, could lead to significant short-term and long-term uncertainty and market instability and to the extent to which that may impact the Fund cannot yet be determined.
(5) FEDERAL INCOME TAXES
The Fund intends to continue to comply with the requirements of the Code applicable to RICs and to distribute all of its taxable income to shareholders. Also, in order to avoid the payment of any federal excise taxes, the Fund will distribute substantially all of its net investment income and net realized gains on a calendar year basis.
The tax character of dividends paid to shareholders during the tax year ended in 2021 was as follows:
| | | | | | | | |
Ordinary
Income | | Net Long Term
Capital Gains | | Total Taxable
Distributions | | Tax Return of
Capital | | Total
Distributions
Paid |
| $— | | $— | | $— | | $4,607,836 | | $4,607,836 |
The following information is provided on a tax basis as of May 31, 2022:
| | | | | |
Cost of Investments and written options | | | $ | 155,333,127 | |
| | | | | |
Gross unrealized appreciation | | | | 82,733,262 | |
Gross unrealized depreciation | | | | (4,981,883 | ) |
| | | | | |
Net unrealized appreciation (depreciation) | | | $ | 77,751,379 | |
| | | | | |
The differences between book-basis and tax-basis unrealized appreciation (depreciation) are primarily due to differences in the timing of recognition of gains and losses on partnership investments, straddle loss deferrals and wash sales for tax and book purposes.
As of the end of the tax year ended November 30, 2021, the Fund also has available for tax purposes unused capital loss carryovers (“CLCOs”) as follows:
| | | | | | | | |
| Short-Term | | Long-Term |
| | $ | 145,470,239 | | | | $ | 83,113,664 | |
| | | | | | | | | |
(6) INVESTMENT TRANSACTIONS
For the period ended May 31, 2022, the aggregate cost of purchases and proceeds from sales of investments (excluding short-term investments) were $39,966,159 and $35,398,282, respectively.
(7) SERVICE PROVIDERS
ALPS serves as administrator to the Fund. Under the administration agreement, ALPS is responsible for administrative, accounting and recordkeeping services of the Fund.
Citibank, N.A. serves as the Fund’s custodian.
Computershare, Inc. serves as the transfer agent, DRIP Plan Administrator agent and dividend paying agent for the Fund.
(8) RELATED PARTY TRANSACTIONS
INVESTMENT MANAGEMENT FEE
In consideration of the advisory and other services provided by the Advisor, under the terms of the Investment Management Agreement between the Advisor and the Fund, the Fund pays the Advisor a management fee equal to 1.20% annually of the average monthly total assets of the Fund. For purposes of calculating the management fee, the “average total assets” for each monthly period are determined by averaging the total assets on the last business day of that month with the total assets on the last business day of the prior month. The fee is accrued daily and payable monthly.
In connection with the investment in EMG Utica, the Fund pays a management fee to EMG MUH, LP, an affiliate of EMG Utica, calculated at 1.0% annually of the contributed capital. The fee is payable quarterly in advance.
Notes to Financial Statements, continued
May 31, 2022
Also in connection with the investment in EMG Utica, the Fund is entitled to distributions in accordance with the terms of the limited partnership agreement. The terms of the limited partnership agreement allows for a portion of certain distributions to be paid to EMG MUH, LP as “carried interest” and represents a share of the profits.
(9) TRUSTEE AND OFFICER FEES
The Fund’s operations are managed under the direction and oversight of the Board of Trustees. The Board of Trustees appoints Officers of the Fund who are responsible for the Fund’s day-to-day business decisions based on policies set by the Board of Trustees. The Officers serve at the pleasure of the Board of Trustees.
The Fund does not pay any compensation directly to the Officers or Trustees who are also Trustees, Officers or employees of Salient Management or its affiliates, except as noted below. As of May 31, 2022, there were six Trustees, five of whom are not “interested persons” of the Fund within the meaning of that term under the 1940 Act (each, an “Independent Trustee”). The Trustees of the Fund may also serve as Trustees of other registered investment companies managed by the Advisor and its affiliates, including Salient MF Trust and Forward Funds (together with the Fund, the “Trusts”). Each fund within the Trusts pays Independent Trustees an allocated portion of the retainer of $50,000 per year. Each fund within the Trusts pays Independent Trustees an allocated portion of the amounts of: $6,250 for attendance in person at a regular meeting and $1,500 for attendance by telephone at a regular meeting; $1,500 for attendance in person or by video conference at a special meeting that is not held in conjunction with a regular meeting and $1,500 for attendance by telephone at a special meeting that is not held in conjunction with a regular meeting; and $1,500 per day for participation in Trust-related meetings not held in conjunction with a meeting. The Chairman of the Board of Trustees, the Chairman of the Audit Committee, the Chairman of the Nominating Committee, the Chairman of the Valuation Committee, and the Chairman of the Compliance Committee receive a special retainer fee in the amount of $16,000, $6,000, $5,000, $2,500 and $5,000, respectively per year. In addition, each member of the Audit Committee, Nominating Committee and Compliance Committee receives $1,000, respectively per year, and each member of the Valuation Committee receives $500 per year. In the interest of retaining Independent Trustees of the highest quality, the Board intends to periodically review such compensation and may modify it as the Board deems appropriate. The interested Trustees receive no compensation from the Fund. In addition, Independent Trustees receive reimbursements for reasonable out-of-pocket expenses incurred for their services as a Trustee, including for the transportation and other expenses that they incur in attending meetings.
The Chief Compliance Officer of the Fund (“CCO”) is an employee of, and is compensated by, the Advisor. As of January 1, 2022, the Fund has agreed to pay the Advisor approximately $103,000 per year as
(i) an allocated portion of the compensation of an officer or employee of the Advisor to serve as CCO for the Fund (plus the cost of reasonable expenses related to the performance of the CCO’s duties, including travel expenses), and (ii) an allocation of the expenses of other officers or employees of the Advisor who serve in other compliance capacities for the Fund. The Board approves annually an allocation of such costs among such personnel, and the Fund bears its pro rata share of such expense. Other affiliated funds and registered investment companies managed by the Advisor pay additional compensation for the same purposes.
(10) INDEMNIFICATIONS
Under the Fund’s organizational documents, its Officers and Trustees are indemnified against certain liability arising out of the performance of their duties with respect to the Fund. In addition, in the normal course of business, the Fund enters into contracts with vendors and others that provide general indemnification. The Fund’s maximum exposure under these arrangements is unknown, as this would involve future claims that may be made against the Fund. Based on experience, however, the Fund expects the risk of loss to be remote.
(11) RISK CONSIDERATIONS
The following summary of certain common principal risk factors is not meant to be comprehensive of all the Fund’s risks.
(a) GENERAL MARKET RISK
An investment in the Fund’s common shares represents an indirect investment in the securities owned by the Fund, some of which will be traded on a national securities exchange or in the over-the-counter markets. The value of the securities in which the Fund invests, like other market investments, may move up or down, sometimes rapidly and unpredictably. The value of the securities in which the Fund invests may affect the value of the Fund’s common shares. An investment in the Fund’s common shares at any point in time may be worth less than the original investment, even after taking into account the reinvestment of the Fund’s distributions.
(b) CONCENTRATION RISK
The Fund’s investment portfolio is concentrated in MLPs and midstream companies. The focus of the portfolio on a specific industry or industries within the midstream sector may present more risks than if the portfolio was broadly diversified over numerous sectors of the economy. A downturn in one or more industries within the midstream sector would have a larger impact on the Fund than on an investment company that does not concentrate solely in MLPs and midstream companies. To the extent that the Fund invests a relatively high percentage of the Fund’s assets in the obligations of a limited number of
Notes to Financial Statements, continued
May 31, 2022
issuers, the Fund may be more susceptible than more widely diversified investment companies to any single economic, political or regulatory occurrence. The Fund may also hold large positions in the securities of a single issuer. As such, the Fund has a greater potential to realize losses upon the occurrence of adverse events affecting that issuer or in the event that the Fund has to quickly sell its position in that issuer.
(c) LEVERAGE RISK
Financial leverage represents the leveraging of the Fund’s investment portfolio. The use of leverage can amplify losses. Unless the income and capital appreciation, if any, on securities acquired with the proceeds from financial leverage exceed the costs of such financial leverage, the use of leverage could cause the Fund’s NAV to decline. When financial leverage is used, the NAV and market value of the Fund’s common shares will be more volatile. There is no assurance that the Fund’s use of financial leverage will be successful.
(d) DERIVATIVES RISK
The Fund may purchase and sell derivative instruments (including, but not limited to, options, futures contracts and swap agreements). The use of derivatives has risks, including high price volatility, government intervention, non-performance by the counterparty, the imperfect correlation between the value of such instruments and the underlying assets, the possible default of the other party to the transaction and the illiquidity of the derivative investments. Furthermore, successful use of these techniques may depend on the Advisor’s correct anticipation of pertinent market movements, which cannot be assured. The use of derivatives may result in losses greater than if they had not been used, may require the Fund to sell or purchase portfolio securities at inopportune times or for prices other than current market values, may limit the amount of appreciation the Fund can realize on an investment or may cause the Fund to hold a security that the Fund might otherwise sell. In addition, amounts paid by the Fund as premiums and cash or other assets held in margin accounts with respect to derivative transactions are not otherwise available to the Fund for investment purposes.
(e) COUNTERPARTY RISK
The Fund will be subject to the risk of the inability of counterparties to perform with respect to transactions, whether due to a contract dispute, insolvency, liquidity or other causes, which could subject the Fund to substantial losses. This risk increases and becomes more concentrated as the number of Fund counterparties decreases. Counterparty risk also increases with the Fund’s use of certain over-the-counter derivatives, which lack some of the safeguards afforded on a regulated exchange. Counterparty defaults may have a negative impact beyond the value of the contract as it could lead to the encumbrance of Fund collateral.
(f) CURRENCY RISK
Currency risk refers to the possibility that changes in currency exchange rates will negatively affect securities denominated in, and/or receiving revenues in, foreign currencies. The liquidity and trading value of foreign currencies could be affected by global economic factors, such as inflation, interest rate levels, and trade balances among countries, as well as the actions of sovereign governments. Adverse changes in currency exchange rates (relative to the U.S. dollar) may erode or reverse any potential gains from the Fund’s investments in securities denominated in a foreign currency or may widen existing losses. The Fund’s net currency positions may expose it to risks independent of its securities positions.
(g) MIDSTREAM RISK
Midstream Companies and MLPs and other entities that provide crude oil, refined product and natural gas services are subject to supply and demand fluctuations in the markets they serve which may be impacted by a wide range of factors including fluctuating commodity prices, weather, increased conservation or use of alternative fuel sources, increased governmental or environmental regulation, depletion, rising interest rates, declines in domestic or foreign production, accidents or catastrophic events, and economic conditions, among others.
(h) SPECIAL PURPOSE ACQUISITION COMPANIES RISK
The Fund may invest in stock, warrants, and other securities of special purpose acquisition companies (“SPACs”) or similar special purpose entities that pool funds to seek potential acquisition opportunities. Because SPACs and similar entities are in essence blank check companies without operating history or ongoing business other than seeking acquisitions, the value of their securities is particularly dependent on the ability of the entity’s management to identify and complete a profitable acquisition. An investment in a SPAC is subject to a variety of risks, including that (i) a portion of the monies raised by the SPAC for the purpose of effecting an acquisition or merger may be expended prior to the transaction for payment of taxes and other purposes; (ii) an attractive acquisition or merger target may not be identified at all, in which case the SPAC will be required to return any remaining monies to shareholders; (iii) if an acquisition or merger target is identified, the Fund may elect not to participate in the proposed transaction or the Fund may be required to divest its interests in the SPAC due to regulatory or other considerations, in which case the warrants or other rights with respect to the SPAC held by the Fund may expire worthless or may be repurchased or retired by the SPAC at an unfavorable price; (iv) any proposed merger or acquisition may be unable to obtain the requisite approval, if any, of SPAC shareholders; (v) under any circumstances in which the Fund receives a refund of all or a portion of its original investment (which typically represents a pro rata share of the proceeds of the SPAC’s assets, less any applicable taxes), the returns on that invest-
Notes to Financial Statements, continued
May 31, 2022
ment may be negligible, and the Fund may be subject to opportunity costs to the extent that alternative investments would have produced higher returns; (vi) to the extent an acquisition or merger is announced or completed, shareholders who sell their shares prior to that time may not reap any resulting benefits; (vii) the Fund may be delayed in receiving any redemption or liquidation proceeds from a SPAC to which it is entitled; (viii) an acquisition or merger once effected may prove unsuccessful and an investment in the SPAC may lose value; (ix) an investment in a SPAC may be diluted by additional later offerings of interests in the SPAC or by other investors exercising existing rights to purchase shares of the SPAC; (x) only a thinly traded market for shares of or interests in a SPAC may develop, or there may be no market at all, leaving the Fund unable to sell its interest in a SPAC or to sell its interest only at a price below what the Fund believes is the SPAC interest’s intrinsic value; (xi) the values of investments in SPACs may be highly volatile and may depreciate significantly over time; and (xii) SPACs may be subject to regulatory scrutiny, such as regarding offering and accounting matters, and uncertainty caused by such scrutiny, or the commencement of regulatory actions, could impact the prospects for success of, as well as the trading and value of, a SPAC.
(i) PANDEMICS AND ASSOCIATED ECONOMIC DISRUPTION
An outbreak of respiratory disease caused by a novel coronavirus was first detected in China in late 2019 and subsequently spread internationally. This coronavirus has resulted in closing borders, enhanced health screenings, healthcare service preparation and delivery, quarantines, cancellations, disruptions to supply chains and customer activity, as well as general anxiety and economic uncertainty. It is not known how long any negative impacts, or any future impacts of other significant events such as a substantial economic downturn, will last. Health crises caused by outbreaks of disease, such as the coronavirus outbreak, may exacerbate other pre-existing political, social and economic risks. This outbreak, and other epidemics and pandemics that may arise in the future, could negatively affect the global economy, as well as the economies of individual countries, individual companies and the market in general in significant and unforeseen ways. For example, a
widespread health crisis such as a global pandemic could cause substantial market volatility, exchange trading suspensions and closures, impact the Fund’s ability to complete repurchase requests, and affect Fund performance. Any such impact could adversely affect the Fund’s performance, the performance of the securities in which the Fund invests, lines of credit available to the Fund and may lead to losses on your investment in the Fund. In addition, the increasing interconnectedness of markets around the world may result in many markets being affected by events or conditions in a single country or region or events affecting a single or small number of issuers.
(12) CAPITAL SHARE TRANSACTIONS
The Fund has an unlimited number of shares of capital stock authorized, $0.01 par value per share, and 17,722,448 shares issued and outstanding at May 31, 2022. There was no capital share activity for the period ended May 31, 2022.
(13) SUBSEQUENT EVENTS
On June 28, 2022, the Board of Trustees of the Fund announced that it had approved the reorganization of the Fund into Salient MLP & Energy Infrastructure Fund (“SMAPX”). SMAPX is an open-end fund that is a series of Salient MF Trust, a Delaware statutory trust, that is also managed by Salient Capital Advisors, LLC, the investment adviser of SMM, using a similar investment strategy. After careful consideration of a variety of factors and alternatives, the Board of Trustees determined that it would be in the best interest of shareholders to reorganize the Fund into SMAPX. The reorganization is subject to approval by Fund shareholders, and the timing of a reorganization, following any approval of Fund shareholders, has not yet been determined.
On May 26, 2022, Westwood Holdings Group, Inc. (“Westwood”), announced that it had entered into a definitive agreement with Salient Partners, L.P. (“Salient”), the parent of Salient Capital Advisors, LLC, pursuant to which Westwood will acquire Salient’s asset management business, including SMAPX subject to a shareholder vote. The timing of such vote has not yet been determined.
Supplemental Information (Unaudited)
May 31, 2022
The table below shows each Trustee and executive officer’s full name, year of birth, the position held with the Fund, the length of time served in that position, his/her principal occupation during the past five years, and other directorships held by such Trustee. The address of each Trustee and officer is c/o Salient Midstream & MLP Fund, 4265 San Felipe, 8th Floor, Houston, Texas 77027.
Interested Trustees*
| | | | | | | | | | |
| Name and Year of Birth | | Position(s) Held with the Fund | | Principal Occupation(s)
During the Past 5 Years | | Number of
Portfolios in
Fund Complex
Overseen by
Trustee(1) | | | Other Directorships
During Past 5 Years** |
Gregory A. Reid* Year of Birth: 1965 | | Trustee (since 2020); President and Chief Executive Officer (since inception) | | President and Chief Executive Officer, Salient Midstream & MLP Fund (since inception); President, MLP Complex, Salient, (since 2011). | | | 6 | | | Forward Funds (investment company) (three funds) (since 2020); Salient MF Trust (investment company) (two funds) (since 2020); Salient Midstream &MLP Fund (investment company) (2012-2018) |
Independent Trustees
| | | | | | | | | | |
| Name and Year of Birth | | Position(s) Held with the Fund | | Principal Occupation(s)
During the Past 5 Years | | Number of
Portfolios in
Fund Complex
Overseen by
Trustee(1) | | | Other Directorships
During Past 5 Years** |
Julie Allecta Year of Birth: 1946 | | Trustee (since 2018) | | Retired Partner, Paul Hastings, Janofsky &Walker LLP (1999-2009); Trustee, Litman Gregory Masters Funds Trust (since 2013);Member of Executive Committee and Governing Council, Independent Directors Council (since 2014); Director, WildCare Bay Area (2007-2017). | | | 6 | | | Litman Gregory Funds Trust (since 2013); Salient MF Trust (investment company) (two funds) (since 2015); Forward Funds (investment company) (three funds) (since 2012). |
Supplemental Information, continued (Unaudited)
May 31, 2022
| | | | | | | | | | |
| Name and Year of Birth | | Position(s) Held with the Fund | | Principal Occupation(s)
During the Past 5 Years | | Number of
Portfolios in
Fund Complex
Overseen by
Trustee(1) | | | Other Directorships
During Past 5 Years** |
Jonathan P. Carroll Year of Birth: 1961 | | Trustee (since inception) | | President, Lazarus Capital LLC (since 2006); President, Lazarus Energy Holdings, LLC (since 2006); President and CEO, Blue Dolphin Energy Company (since 2012); President and Director, Starlight Relativity Acquisition Company, LLC (since 2019); President and Director, The San Antonio Refinery LLC (since 2019); President and Director, Lazarus San Antonio Refinery LLC (since 2019); private investor (since 1988). | | | 6 | | | Salient Private Access Funds (investment companies) (four funds) (2004-2021); Endowment PMF Funds (investment companies) (three funds) (2014-2021); Salient MF Trust (investment company) (two funds) (since 2012); Forward Funds (investment company) (three funds) (since 2015); LRR Energy, L.P. (LRE) (energy company) (2014-2015); Blue Dolphin Energy Company (BDCO) (energy company) (since 2014); Starlight Relativity Acquisition Company, LLC (Investment Company) (since 2019); The San Antonio Refinery LLC (energy company) (since 2019); Lazarus San Antonio Refinery LLC (energy company) (since 2019). |
A. John Gambs Year of Birth: 1945 | | Trustee (since 2018); Audit Committee Chairperson (since 2018) | | Director and Compensation Committee Chair, NMI Holdings, Inc. (2011-2012); Trustee and Audit Committee Chair, BarclaysGlobal Investors Funds (2006-2010); Trustee and Audit Committee Chair, Master Investment Portfolio (2006-2010); Advisory Board Member, Fairview CapitalManagement (since 2009); Director, San Francisco Classical Voice (2011-2016);Member, Board of Governors San Francisco Symphony (since 2001) and Vice President (2018-2020); Director, The New Century Chamber Orchestra (since 2010); Executive Vice President and Chief Financial Officer, The Charles Schwab Corporation (1988-1996); President and Director, Gambs Family Foundation (1997-2010). | | | 6 | | | Salient MF Trust (investment company) (two funds) (since 2015); Forward Funds (investment company) (three funds) (since 2012). |
Supplemental Information, continued (Unaudited)
May 31, 2022
| | | | | | | | | | |
| Name and Year of Birth | | Position(s) Held with the Fund | | Principal Occupation(s)
During the Past 5 Years | | Number of
Portfolios in
Fund Complex
Overseen by
Trustee(1) | | | Other Directorships
During Past 5 Years** |
Dr. Bernard A. Harris, Jr. Year of Birth: 1956 | | Trustee (since inception) | | Chief Executive Officer and Managing Partner, Vesalius Ventures, Inc. (venture investing) (since 2002); CEO, National Math and Science Initiative (non-profit) (since 2018); President and Founder, The Harris Foundation (non-profit) (since 1998); clinical scientist, flight surgeon and astronaut for NASA (1986-1996). | | | 6 | | | Salient Private Access Funds (investment companies) (four funds) (2009-2021); Babson Funds (eleven funds) (since 2011); Monebo Technologies Inc. (since 2009); The National Math and Science Initiative (since 2008); Communities in Schools (since 2007); American Telemedicine Association (2007-2014); U.S. Physical Therapy, Inc. (since 2005); Houston Technology Center (2004-2016); The Harris Foundation, Inc. (since 1998); Salient MF Trust (investment company) (two funds) (since 2012); Forward Funds (investment company) (three funds) (since 2015). |
Supplemental Information, continued (Unaudited)
May 31, 2022
| | | | | | | | | | |
| Name and Year of Birth | | Position(s) Held with the Fund | | Principal Occupation(s)
During the Past 5 Years | | Number of
Portfolios in
Fund Complex
Overseen by
Trustee(1) | | | Other Directorships
During Past 5 Years** |
Haig G. Mardikian Year of Birth: 1947 | | Trustee
(since 2018) | | Owner of Haig G. Mardikian Enterprises, a real estate investment business (since 1971); General Partner of M&B Development, a real estate investment business (since 1983); General Partner of George M. Mardikian Enterprises, a real estate investment business (1983- 2002); President and Director of Adiuvana-Invest, Inc., a real estate investment business (since 1989); President of the William Saroyan Foundation (since 1992);Managing Director of the United Broadcasting Company, radio broadcasting (1983-2001); Trustee of the International House of UC Berkeley (2001-2007); Director of the Downtown Association of San Francisco (1982-2006); Director of the Market Street Association (1982-2006); Trustee of Trinity College (1998-2007); Trustee of the Herbert Hoover Presidential Library (since 1997); Trustee of the Herbert Hoover Foundation (since 2002); Trustee of the Advisor California Civil Liberties Public Education Fund (1997-2006); Director of The Walnut Management Co., a privately held family investment company (since 2008); President of the Foundation of City College (2006-2010); Director of Near East Foundation (since 2007). | | | 6 | | | Salient MF Trust (investment company) (two funds) (since 2015); Forward Funds (investment company) (three funds) (since 1998); Chairman and Director of SIFE Trust Fund (1978-2001). |
* This person’s status as an “interested” Trustee arises from his affiliation with the Advisor.
** This column includes only directorships of companies required to report to the SEC under the Securities Exchange Act of 1934 (i.e., public companies) or other investment companies registered under the 1940 Act.
(1) The Fund Complex for the purposes of this table consists of five (5) open-end funds in the Salient MF Trust and the Forward Funds (each, a “Trust”), with the series of each Trust being advised by either the Advisor or an affiliate of the Advisor; and the Fund.
Supplemental Information, continued (Unaudited)
May 31, 2022
Officers of the Fund Who Are Not Trustees***
| | | | |
| Name and Year of Birth(1) | | Position(s) with the Fund | | Principal Occupation(s) During Past 5 Years |
Stephen Leonhardt Year of Birth: 1959 | | Treasurer and Principal Financial Officer (since April 2022) | | Treasurer and Principal Financial Officer, Salient Midstream and MLP Fund (since April 2022); Treasurer and Principal Financial Officer, Salient MF Trust (since April 2022); Treasurer and Principal Financial Officer, Forward Funds (since April 2022); Director of Fund Services, E78 Partners (2021 - 2022); Senior Vice President - Fund Administration, Citi Fund Services (2020 - 2021); Self-Employed Consultant (2018 - 2020); Senior Vice President, Salient Partners (2017 - 2018). |
Paul A. Bachtold Year of Birth: 1973 | | Chief Compliance Officer (since inception) | | Chief Compliance Officer and Secretary, Forward Securities (since 2016); Chief Compliance Officer, Forward Funds (since 2016); Chief Compliance Officer, Forward Management, LLC (since 2015); Chief Compliance Officer, Salient Private Access Funds (2010 - 2021); Chief Compliance Officer, Endowment PMF Funds (2014 - 2021); Chief Compliance Officer, Salient (since 2010); Chief Compliance Officer, Salient Midstream &MLP Fund (since 2012); Chief Compliance Officer, Salient MF Trust (since 2012). |
Kristen Bayazitoglu Year of Birth: 1981 | | Secretary (Since 2018) | | Secretary, Forward Funds (since 2018); Secretary, Salient MF Trust (since 2018); Secretary, Salient Midstream &MLP Fund (since 2018); Vice President, Forward Funds (2017-2018); Vice President, Salient MF Trust (2017-2018); Vice President, Salient Midstream &MLP Fund (2017-2018); Chief Operating Officer, Salient Partners, L.P. (since 2017); Vice President, Salient Private Access Funds (2017 - 2021); Vice President, Endowment PMF Funds (2017 - 2021); Vice President of Operations, Salient Partners, L.P. (March 2012-June 2017). |
(1) The business address of each officer is c/o Salient Midstream & MLP Fund, 4265 San Felipe, 8th Floor, Houston, Texas 77027.
*** Thomas Dusenberry served as the Treasurer and Principal Financial Officer of the Fund during the fiscal year ended November 30, 2021. Mr. Dusenberry served from January 1, 2020 through his resignation on April 14, 2022.
Privacy Policy (Unaudited)
The Fund recognizes the importance of securing personal financial information. It is our policy to safeguard any personal and financial information that may be entrusted to us. The following is a description of the Fund’s policy regarding disclosure of nonpublic personal information.
We collect nonpublic personal information as follows:
We collect information about our investors, including, but not limited to, the investor’s name, address, telephone number, e-mail address, social security number and date of birth. We collect that information from subscription agreements, other forms of correspondence that we receive from investors, from personal conversations and from affiliated entities as permitted by law.
We receive information about investor transactions with us, including, but not limited to, account number, account balance, investment amounts, withdrawal amounts and other financial information.
We are permitted by law to disclose nonpublic information we collect, as described above, to the Fund’s service providers, including the Fund’s investment advisor, sub-advisors, servicing agent, independent administrator, custodian, legal counsel, accountant and auditor. We do not disclose any nonpublic information about our current or former investors to nonaffiliated third parties, except as required or permitted by law.
You may contact us at any time to manage the information we have about you.
You may request from us information about the categories of information we have collected about you, the categories of sources from which your information was collected, the business or commercial purpose for collecting your information, the categories of third parties with whom we share your information, and the specific pieces of information we have about you. You may email us at privacy@salientpartners.com with “Request for Information” in the subject line and in the body of your message to request this information.
You may also request that we delete any information about you that we collected from you. You may email us at privacy@salientpartners.com with “Request to Delete Information” in the subject line and in the body of your message. There are circumstances where we may not be able to fulfil your request and we will let you know if one of those situations arises.
We reserve the right to verify your identity before we process any request relating to your information.
We restrict access to investor nonpublic personal information to those persons who require such information to provide products or services to investors. We maintain physical, electronic and procedural safeguards that comply with federal standards to guard investors’ nonpublic personal information.
If an investor’s investment relationship with the Fund involves a financial intermediary, including, but not limited to, a broker-dealer, bank or trust company, the privacy policy of such investor’s financial intermediary would govern how any nonpublic personal information would be shared by them with nonaffiliated third parties.


4265 San Felipe
8th Floor
Houston, Texas 77027
800-809-0525
www.salientpartners.com
Salient Midstream & MLP Fund
NYSE: SMM
05/23
Not applicable to semi-annual report.
| Item 3. | Audit Committee Financial Expert. |
Not applicable to semi-annual report.
| Item 4. | Principal Accountant Fees and Services. |
Not applicable to semi-annual report.
| Item 5. | Audit Committee of Listed Registrants. |
Not applicable to semi-annual report.
(a) The registrant’s Schedule of Investments as of the close of the reporting period is included in the Report to Stockholders filed under Item 1 of Form N-CSR.
(b) Not applicable.
| Item 7. | Disclosure of Proxy Voting Policies and Procedures for Closed-End Management Investment Companies. |
Not applicable to semi-annual report.
| Item 8. | Portfolio Managers of Closed-End Management Investment Companies. |
Not applicable to semi-annual report.
| Item 9. | Purchase of Equity Securities by Closed-End Management Investment Company and Affiliated Purchasers. |
Not applicable to semi-annual report.
| Item 10. | Submission of Matters to a Vote of Security Holders. |
No material changes to the procedures by which the shareholders may recommend nominees to the registrant’s Board of Trustees have been implemented after the registrant’s last
provided disclosure in response to the requirements of Item 407(c)(2)(iv) of Regulation S-K (17 CFR 229.407) (as required by Item 22(b)(15) of Schedule 14A (17 CFR 240.14a-101)), or this Item.
| Item 11. | Controls and Procedures. |
| | (a) | The registrant’s principal executive officer and principal financial officer, or persons performing similar functions, have concluded, based on their evaluation of the registrant’s disclosure controls and procedures as conducted within 90 days of the filing date of this report, that these disclosure controls and procedures are adequately designed and are operating effectively to ensure that information required to be disclosed by the registrant on Form N-CSR is (i) accumulated and communicated to the investment company’s management, including its certifying officers, to allow timely decisions regarding required disclosure; and (ii) recorded, processed, summarized and reported within the time periods specified in the Securities and Exchange Commission’s rules and forms. |
| | (b) | There were no changes in the registrant’s internal control over financial reporting (as defined in Rule 30a-3(d) under the Act (17 CFR 270.30a-3(d)) that occurred during the period covered by this report that have materially affected or are reasonably likely to materially affect the registrant’s internal control over financial reporting. |
| Item 12. | Disclosure of Securities Lending Activities for Closed-End Management Investment Companies. |
SIGNATURES
Pursuant to the requirements of the Securities Exchange Act of 1934 and the Investment Company Act of 1940, the registrant has duly caused this report to be signed on its behalf by the undersigned, thereunto duly authorized.
| | |
Salient Midstream & MLP Fund |
| |
| By: | | /s/ Gregory A. Reid |
| | Gregory A. Reid |
| | Principal Executive Officer |
| |
| Date: | | August 4, 2022 |
Pursuant to the requirements of the Securities Exchange Act of 1934 and the Investment Company Act of 1940, this report has been signed below by the following persons on behalf of the registrant and in the capacities and on the dates indicated.
| | |
By: | | /s/ Gregory A. Reid |
| | Gregory A. Reid |
| | Principal Executive Officer |
| |
Date: | | August 4, 2022 |
| | |
By: | | /s/ Stephen W. Leonhardt |
| | Stephen W. Leonhardt |
| | Principal Financial Officer |
| |
Date: | | August 4, 2022 |