Exhibit 99.1
Exhibit 99.1
Fiesta Restaurant Group, Inc.
Investor Presentation
January 16-17, 2013
Forward-Looking Statements
This presentation contains statements which constitute forward-looking statements within the meaning of Section 27A of the Securities Act of 1933, as amended (the “Securities Act”), and Section 21E of the Securities Exchange Act of 1934, as amended (the “Exchange Act”). Statements that are predictive in nature or that depend upon or refer to future events or conditions are forward-looking statements. These statements are often identified by the words “may,” “might,” “will,” “should,” “anticipate,” “believe,” “expect,” “intend,” “estimate,” “hope”, “plan” or similar expressions. In addition, expressions of our strategies, intentions or plans are also forward looking statements. These statements reflect management’s current views with respect to future events and are subject to risks and uncertainties, both known and unknown. You are cautioned not to place undue reliance on these forward-looking statements, which speak only as of their date. There are important factors that could cause actual results to differ materially from those in forward-looking statements, many of which are beyond our control. Investors are cautioned that any such forward-looking statements are not guarantees of future performance and involve risks and uncertainties, and that actual results may differ materially from those projected or implied in the forward-looking statements. We have identified significant factors that could cause actual results to differ materially from those stated or implied in the forward-looking statements. We believe important factors that could cause actual results to differ materially from our expectations include the following, in addition to other risks and uncertainties discussed herein: the effect of the spin-off of our company and the potential liability associated with the spin-off; increases in food and other commodity costs; competitive conditions; regulatory factors; environmental conditions and regulations; general economic conditions, particularly in the retail sector; weather conditions; fuel prices; significant disruptions in service or supply by any of our suppliers or distributors; changes in consumer perception of dietary health and food safety; labor and employment benefit costs; the outcome of pending or future legal claims or proceedings; our ability to manage our growth and successfully implement our business strategy; risks associated with the expansion of our business; our ability to integrateany businesses we acquire; our borrowing costsand credit ratings, which may be influenced by the credit ratings of our competitors; the availability and terms of necessary or desirable financing or refinancing and other related risks and uncertainties; the risk of an act of terrorism or escalation of any insurrection or armed conflict involving the United States or any other national or international calamity; factors that affect the restaurant industry generally, including recalls if products become adulterated or misbranded, liability if our products cause injury, ingredient disclosure and labeling laws and regulations, reports of cases of food borne illnesses such as “mad cow” disease and avian flu, and the possibility that consumers could lose confidence in the safety and quality of certain food products, as well as negative publicity regarding food quality, illness, injury or other health concerns; and other factors discussed in our filings with the SEC.

Company Overview

Senior Management Presenters
Timothy Taft
President and Chief Executive Officer
Lynn Schweinfurth
Chief Financial Officer and VP
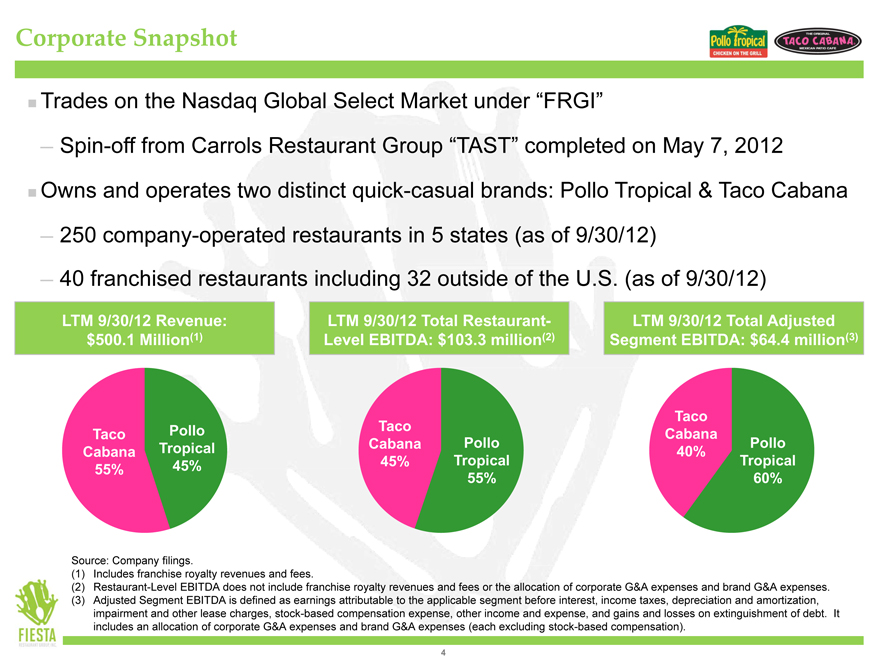
Corporate Snapshot
Trades on the Nasdaq Global Select Market under “FRGI”
Spin-off from Carrols Restaurant Group “TAST” completed on May 7, 2012
Owns and operates two distinct quick-casual brands: Pollo Tropical & Taco Cabana
250 company-operated restaurants in 5 states (as of 9/30/12)
40 franchised restaurants including 32 outside of the U.S. (as of 9/30/12)
LTM 9/30/12 Revenue: $500.1 Million(1)
Taco Pollo Cabana Tropical 55% 45%
LTM 9/30/12 Total Restaurant-Level EBITDA: $103.3 million(2)
Taco
Cabana Pollo 45% Tropical 55%
LTM 9/30/12 Total Adjusted Segment EBITDA: $64.4 million(3)
Taco Cabana
Pollo 40% Tropical 60%
Source: Company filings.
(1) | | Includes franchise royalty revenues and fees. |
(2) Restaurant-Level EBITDA does not include franchise royalty revenues and fees or the allocation of corporate G&A expenses and brand G&A expenses. (3) Adjusted Segment EBITDA is defined as earnings attributable to the applicable segment before interest, income taxes, depreciation and amortization, impairment and other lease charges, stock-based compensation expense, other income and expense, and gains and losses on extinguishment of debt. It includes an allocation of corporate G&A expenses and brand G&A expenses (each excluding stock-based compensation).
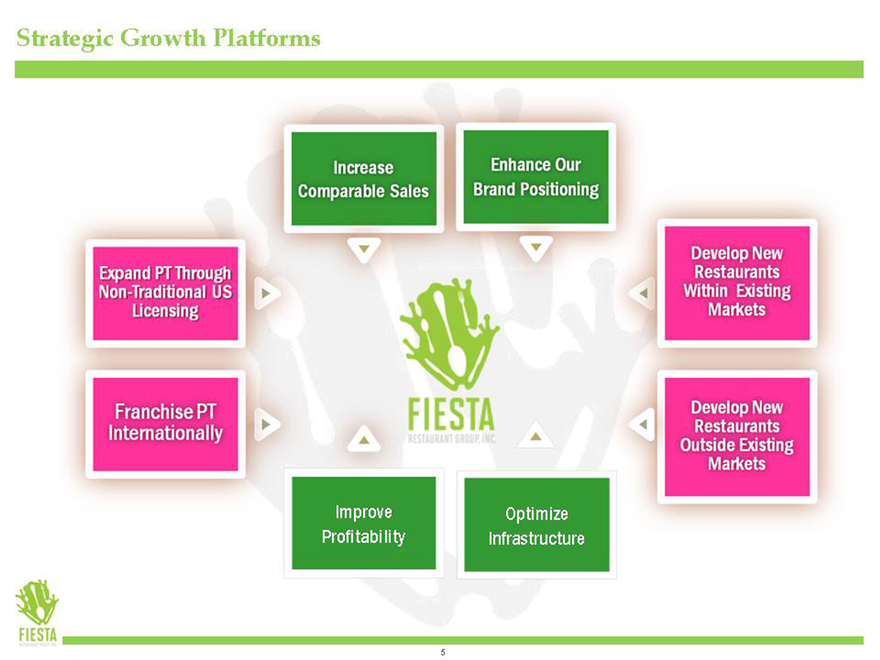
Strategic Growth Platforms
Increase
Comparable Sales
Enhance Our Brand Positioning
Expand PT Through Non-Traditional ditional US
Licensing
Develop New Restaurants Within Existing Markets
Franchise PT Internationally
Develop New Restaurants Outside Existing Markets
Improve Profitability
Optimize Infrastructure
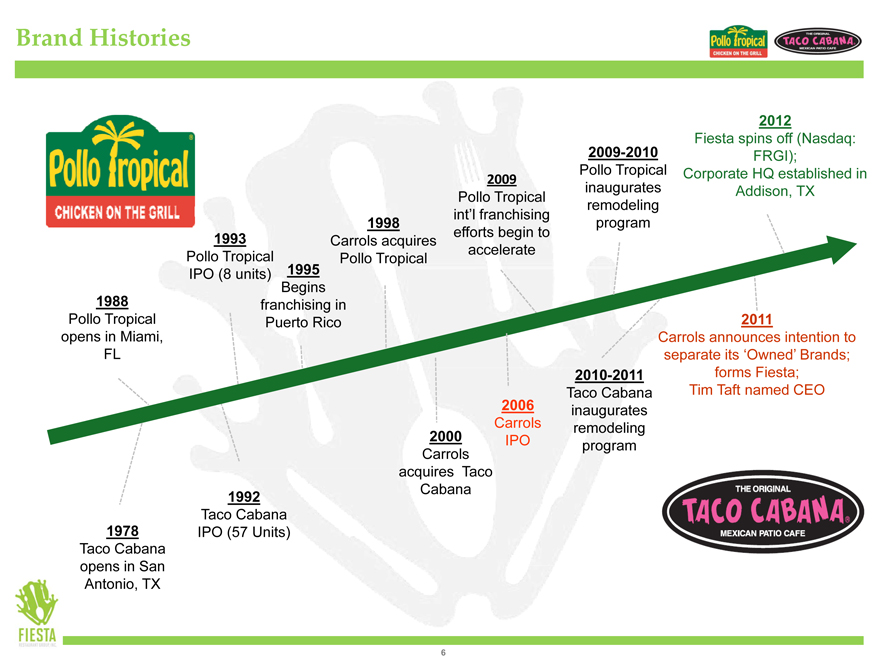
Brand Histories
2012
Fiesta spins off (Nasdaq:
2009-2010 FRGI);
Pollo Tropical Corporate HQ established in
2009 inaugurates Addison, TX
Pollo Tropical remodeling int’l franchising 1998 program efforts begin to 1993 Carrols acquires accelerate Pollo Tropical 1995 Pollo Tropical IPO (8 units) Begins 1988 franchising in
Pollo Tropical Puerto Rico 2011 opens in Miami, Carrols announces intention to FL separate its ‘Owned’ Brands; 2010-2011 forms Fiesta; Taco Cabana Tim Taft named CEO
2006 inaugurates 2000 Carrols remodeling Carrols IPO program acquires Taco Cabana
1992
Taco Cabana 1978 IPO (57 Units) Taco Cabana opens in San Antonio, TX
Investment Highlights
Differentiated Hispanic Brands in the Attractive Quick-Casual Segment
Industry Leading AUVs, Comparable Restaurant Sales Growth and Restaurant-Level Operating Margins
Significant White Space with Attractive New Restaurant Economics
Multiple Levers to Drive Comparable Restaurant Sales and Restaurant-Level Margins
Experienced Management Team
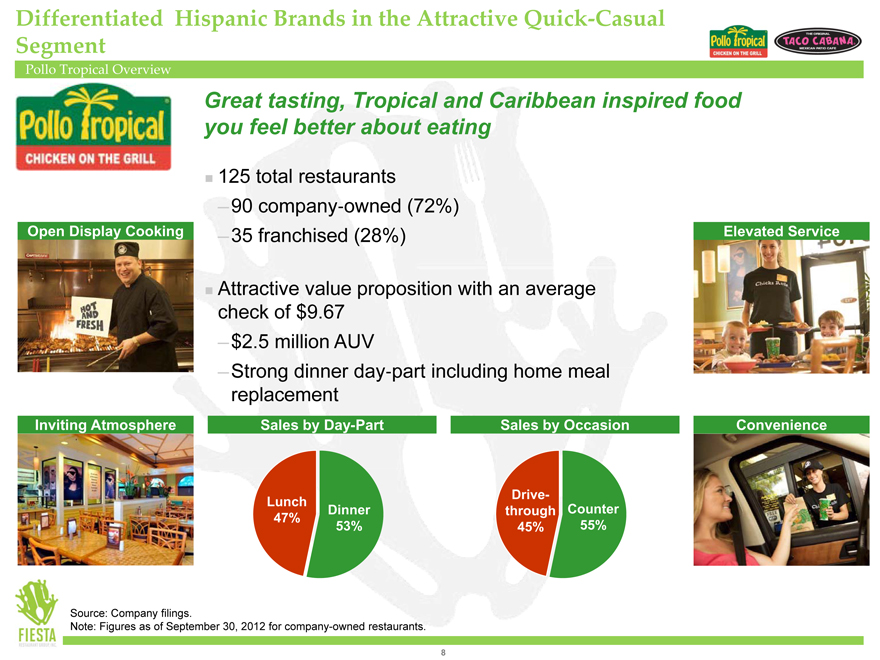
Differentiated Hispanic Brands in the Attractive Quick-Casual Segment
Pollo Tropical Overview
Great tasting, Tropical and Caribbean inspired food you feel better about eating
125 total restaurants
90 company owned (72%)
35 franchised (28%)
Attractive value proposition with an average check of $9.67
$2.5 million AUV
Strong dinner day part including home meal replacement
Open Display Cooking
Inviting Atmosphere
Sales by Day-Part
Lunch
Dinner 47% 53%
Sales by Occasion
Drive-through Counter 45% 55%
Elevated Service
Convenience
Source: Company filings.
Note: Figures as of September 30, 2012 for company-owned restaurants.
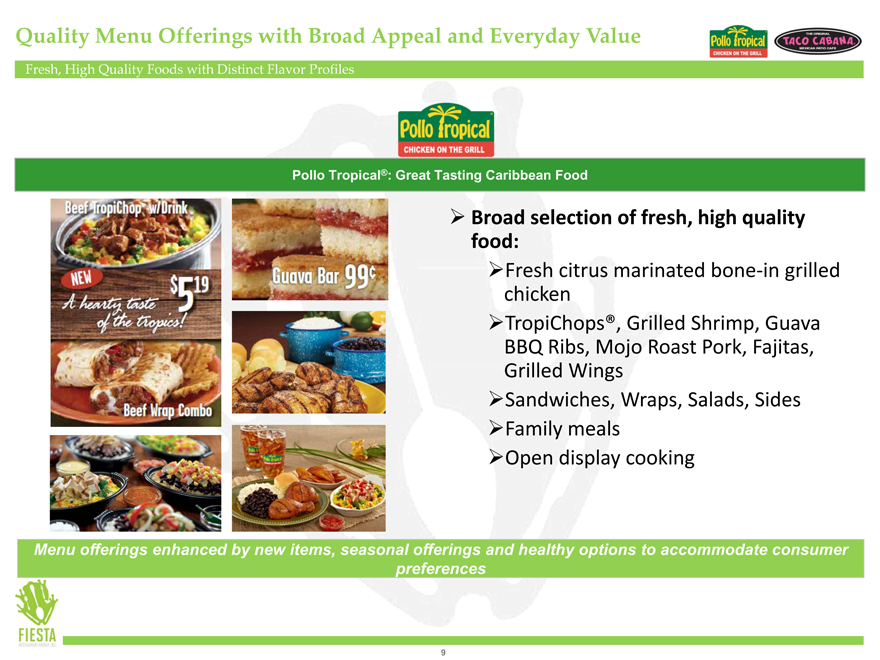
Quality Menu Offerings with Broad Appeal and Everyday Value
Fresh, High Quality Foods with Distinct Flavor Profiles
Pollo Tropical®: Great Tasting Caribbean Food
Broad selection of fresh, high quality food:
Fresh citrus marinated bone-in grilled chicken
TropiChops®, Grilled Shrimp, Guava BBQ Ribs, Mojo Roast Pork, Fajitas, Grilled Wings
Sandwiches, Wraps, Salads, Sides
Family meals
Open display cooking
Menu offerings enhanced by new items, seasonal offerings and healthy options to accommodate consumer preferences
9
Differentiated Hispanic Brands in the Attractive Quick-Casual Segment
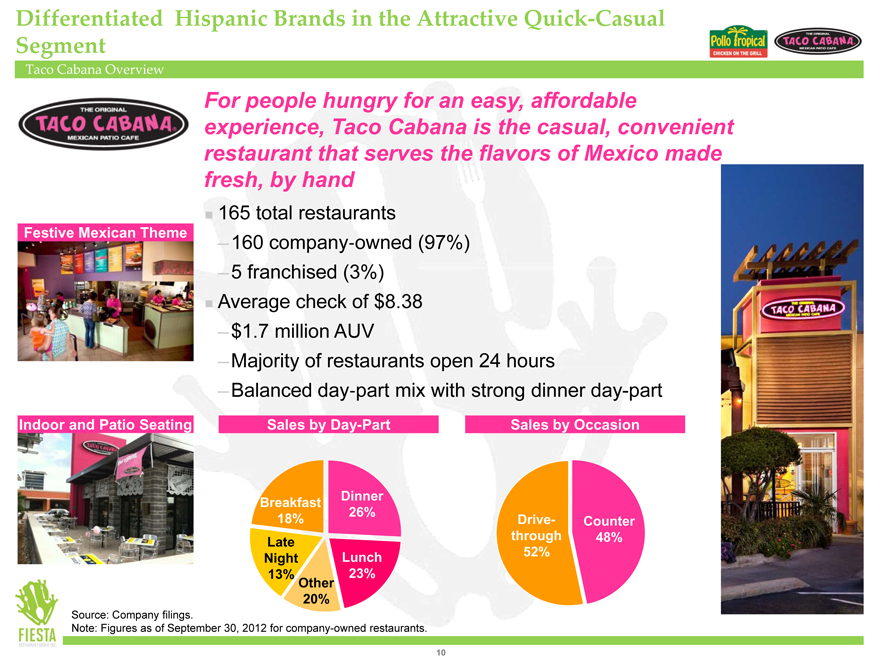
Taco Cabana Overview
For people hungry for an easy, affordable experience, Taco Cabana is the casual, convenient restaurant that serves the flavors of Mexico made fresh, by hand
165 total restaurants
160 company owned (97%)
5 franchised (3%)
Average check of $8.38
$1.7 million AUV
Majority of restaurants open 24 hours
Balanced day part mix with strong dinner day-part
Festive Mexican Theme
Indoor and Patio Seating
Sales by Day-Part
Dinner Breakfast 26% 18% Late Night Lunch 13% 23% Other 20%
Sales by Occasion
Drive- Counter through 48% 52% $1,094
Source: Company filings.
Note: Figures as of September 30, 2012 for company-owned restaurants.
10
Quality Menu Offerings with Broad Appeal and Everyday Value
Fresh, High Quality Foods with Distinct Flavor Profiles
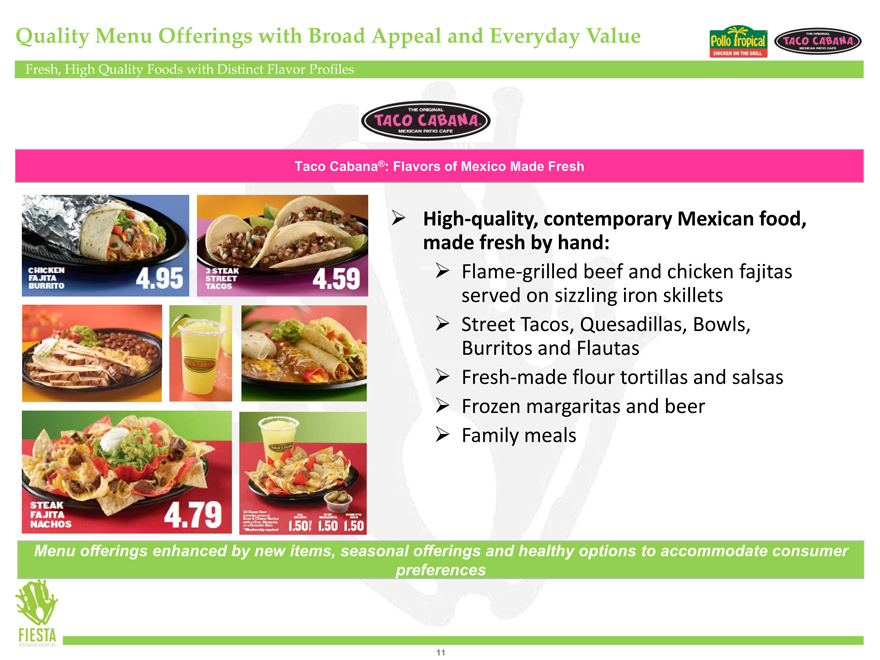
Taco Cabana®: Flavors of Mexico Made Fresh
High-quality, contemporary Mexican food, made fresh by hand:
Flame-grilled beef and chicken fajitas served on sizzling iron skillets
Street Tacos, Quesadillas, Bowls, Burritos and Flautas
Fresh-made flour tortillas and salsas
Frozen margaritas and beer
Family meals
Menu offerings enhanced by new items, seasonal offerings and healthy options to accommodate consumer preferences
11
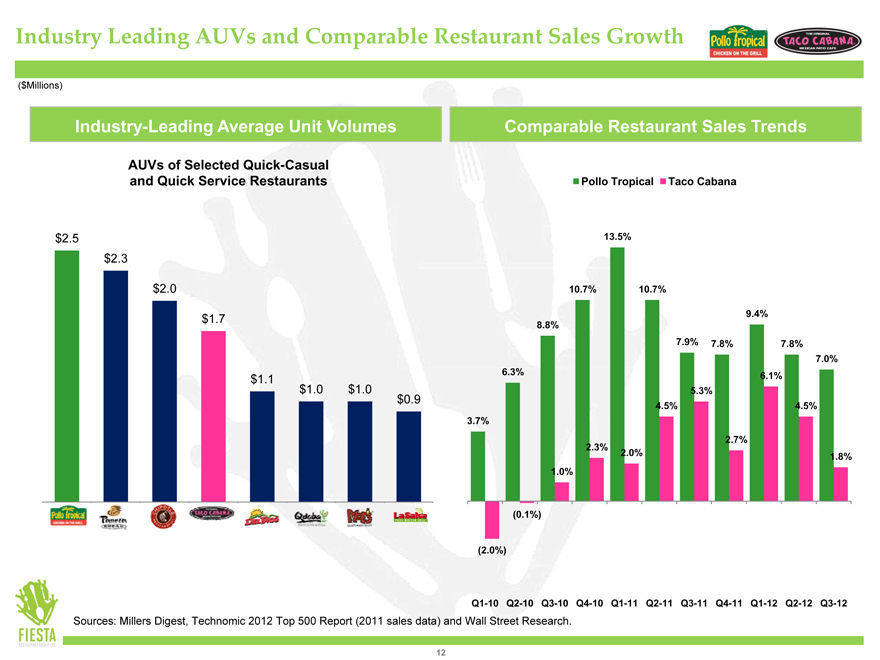
Industry Leading AUVs and Comparable Restaurant Sales Growth
($Millions)
Industry-Leading Average Unit Volumes
AUVs of Selected Quick-Casual and Quick Service Restaurants
$2.5
$2.3
$2.0
$1.7
$1.1
$1.0 $1.0
$0.9
Taco Cabana Del Taco Qdoba Moe’s La Salsa
Comparable Restaurant Sales Trends
Pollo Tropical Taco Cabana
13.5%
10.7% 10.7%
9.4% 8.8% 7.9% 7.8% 7.8% 7.0% 6.3% 61% .
5.3%
4.5% 4.5% 3.7% 2.7% 2.3% 2.0% 1.8% 10% .
(0.1%)
(2.0%)
Q1-10 Q2-10 Q3-10 Q4-10 Q1-11 Q2-11 Q3-11 Q4-11 Q1-12 Q2-12 Q3-12
Sources: Millers Digest, Technomic 2012 Top 500 Report (2011 sales data) and Wall Street Research.
12
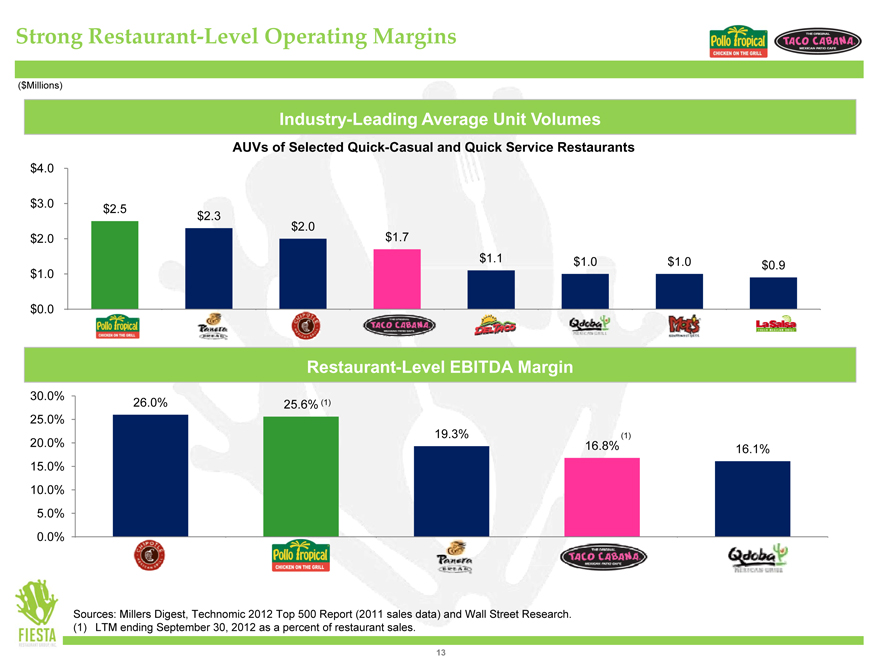
Strong Restaurant-Level Operating Margins
($Millions)
Industry-Leading Average Unit Volumes
AUVs of Selected Quick-Casual and Quick Service Restaurants
$4.0
$3.0 $2.5
$2.3 $2.0
$2.0 $1.7
$1.1 $1.0 $1.0
$0.9
$1.0
$0.0 Pollo Tropical Taco Cabana Del Taco Qdoba Moe’s La Salsa
Restaurant-Level EBITDA Margin
30.0%
26.0% 25.6% (1)
25.0%
19.3% (1)
20.0% 16.8%
16.1%
15.0%
10.0%
5.0%
0.0% Taco Cabana Qdoba
Sources: Millers Digest, Technomic 2012 Top 500 Report (2011 sales data) and Wall Street Research. (1) LTM ending September 30, 2012 as a percent of restaurant sales.
13
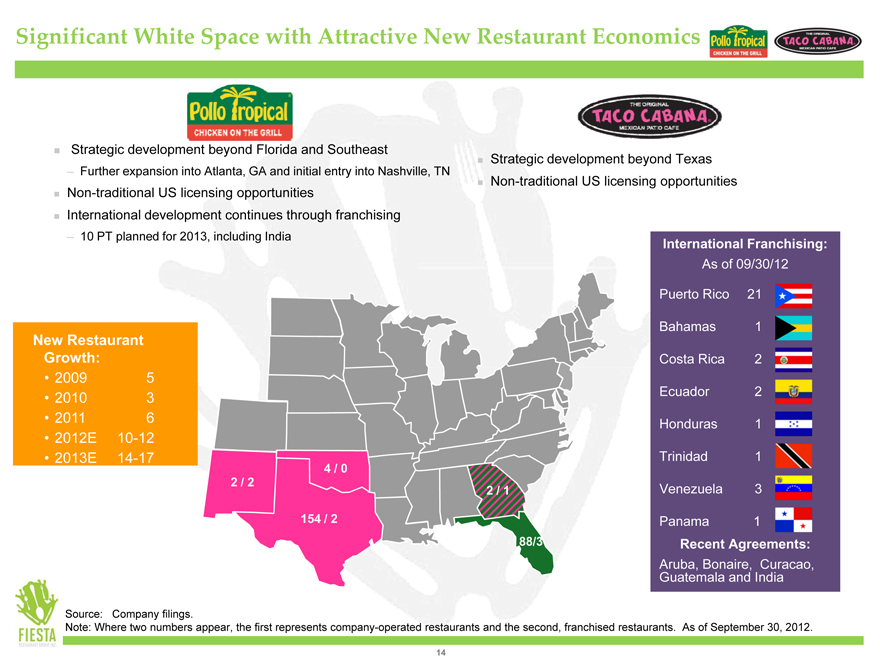
Significant White Space with Attractive New Restaurant Economics
?Strategic development beyond Florida and Southeast
? Further expansion into Atlanta, GA and initial entry into Nashville, TN
?Non-traditional US licensing opportunities
?International development continues through franchising
? 10 PT planned for 2013, including India
?Strategic development beyond Texas
?Non-traditional US licensing opportunities
New Restaurant Growth:
2009 5 2010 3 2011 6
2012E 10-12
2013E 14-17
4/0
154 / 2
88/3
International Franchising:
As of 09/30/12 Puerto Rico 21 Bahamas 1 Costa Rica 2 Ecuador 2 Honduras 1 Trinidad 1 Venezuela 3
Panama 1
Recent Agreements:
Aruba, Bonaire, Curacao,
Guatemala and India
Source: Company filings.
Note: Where two numbers appear, the first represents company-operated restaurants and the second, franchised restaurants. As of September 30, 2012.
14
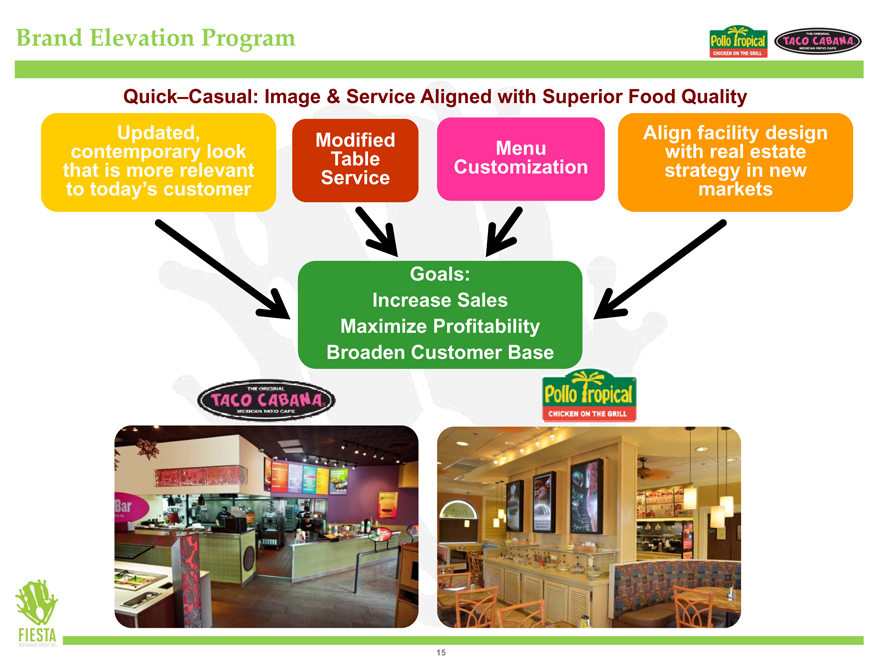
Brand Elevation Program
Quick–Casual: Image & Service Aligned with ith Superior uperior Food Quality
Updated, contemporary look that is more relevant to today’s customer
Modified Table Service
Menu Customization
Align facility design with real estate strategy in new markets
Goals: Increase Sales Maximize Profitability Broaden Customer Base
15
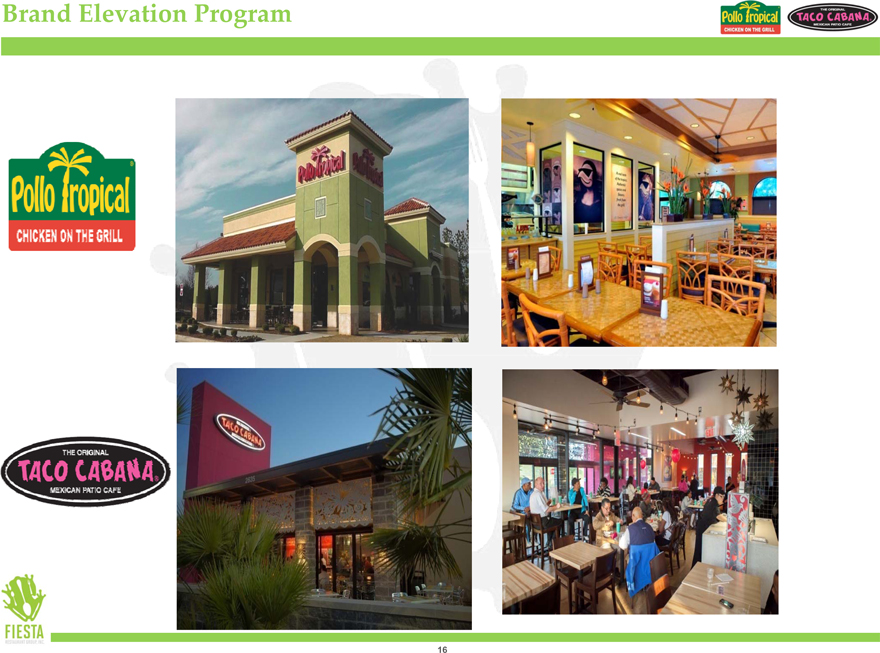
Brand Elevation Program
16
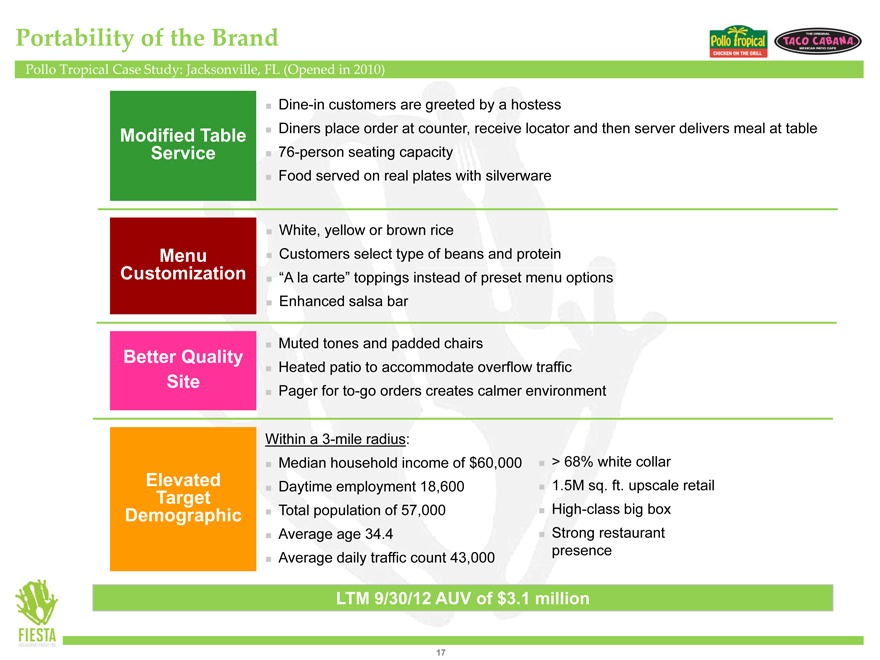
Portability of the Brand
Pollo Tropical Case Study: Jacksonville, FL (Opened in 2010)
Modified Table Service
Dine-in customers are greeted by a hostess
Diners place order at counter, receive locator and then server delivers meal at table
76-person seating capacity
Food served on real plates with silverware
Menu Customization
White, yellow or brown rice
Customers select type of beans and protein “A la carte” toppings instead of preset menu options Enhanced salsa bar
Better Quality Site
Muted tones and padded chairs
Heated patio to accommodate overflow traffic Pager for to-go orders creates calmer environment
Elevated Target Demographic
Within a 3-mile radius:
Median household income of $60,000 > 68% white collar
Daytime employment 18,600 1.5M sq. ft. upscale retail
Total population of 57,000 High-class big box
Average age 34.4 Strong restaurant presence
Average daily traffic count 43,000
LTM 9/30/12 AUV of $3.1 million
17
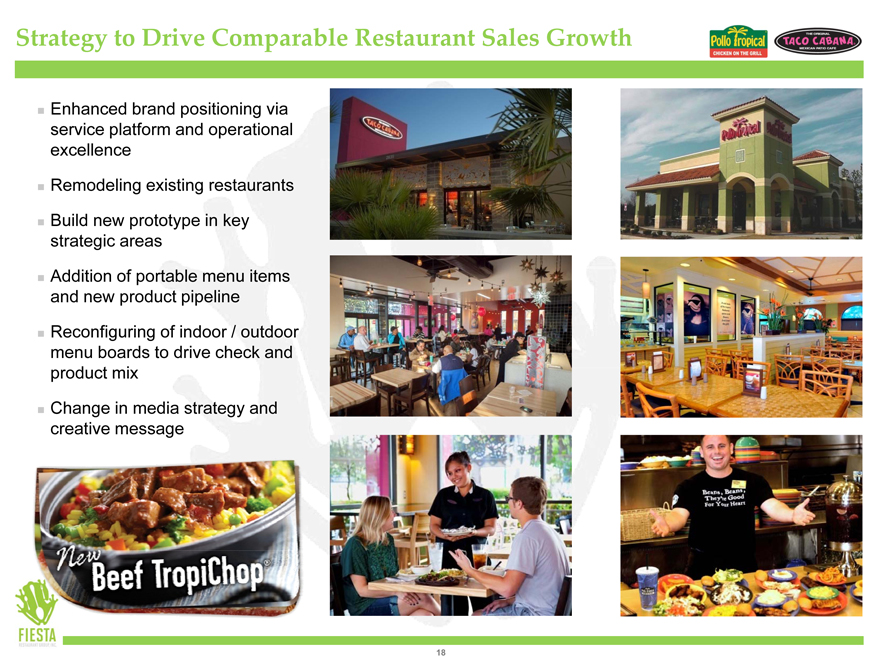
Strategy to Drive Comparable Restaurant Sales Growth
Enhanced brand positioning via service platform and operational excellence
Remodeling existing restaurants
Build new prototype in key strategic areas
Addition of portable menu items and new product pipeline
Reconfiguring of indoor / outdoor menu boards to drive check and product mix
Change in media strategy and creative message
18
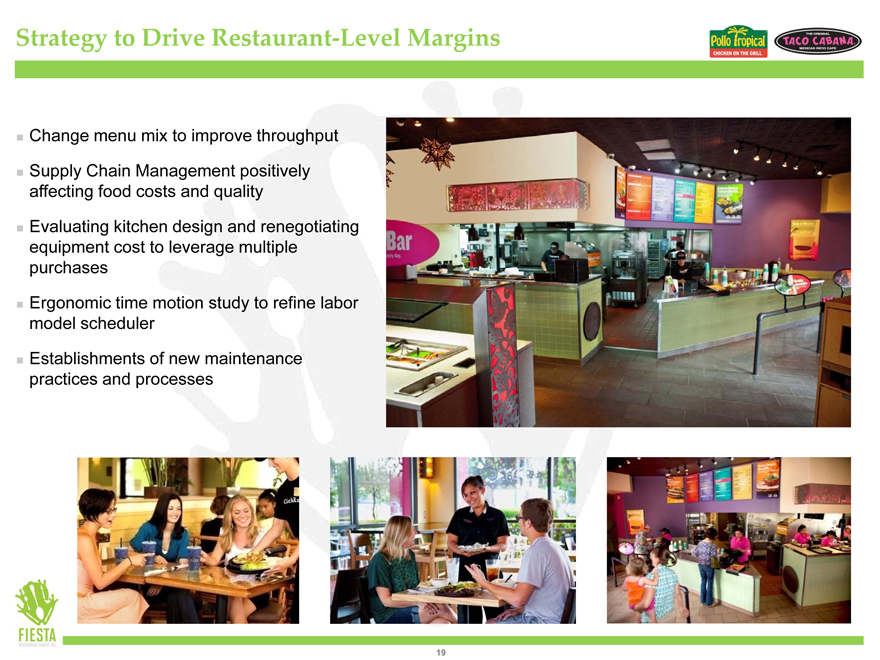
Strategy to Drive Restaurant-Level Margins
Change menu mix to improve throughput
Supply Chain Management positively affecting food costs and quality
Evaluating kitchen design and renegotiating equipment cost to leverage multiple purchases
Ergonomic time motion study to refine labor model scheduler
Establishments of new maintenance practices and processes
19
Experienced Management Team
Timothy Taft
Chief Executive Officer and President
Chief Executive Officer and President since August 2011
Previously served as the Chief Executive Officer and President of Grandy’s LLC, Souper Salad and Pizza Inn Holdings Inc.
Spent over a decade at Whataburger Inc., most recently as President and Chief Operating Officer
Lynn Schweinfurth
Chief Financial Officer and Vice President
Chief Financial Officer and Vice President since July 2012
Previously served as Chief Financial Officer of Lone Star Steakhouse and Texas Land & Cattle
Previously served in various leadership positions at Winn-Dixie Stores, Brinker International, Pepsico and Yum Brands
Joe Zirkman
General Counsel, Secretary and Vice President
General Counsel, Secretary and Vice President since April 2011
Vice President, General Counsel and Secretary of Carrols Corporation since 1993
Danny Meisenheimer
Chief Operating Officer of Pollo Tropical
Chief Operating Officer of Pollo Tropical since September 2012 Former Chief Brand Officer of Pollo Tropical since April 2012
Former Chief Operating Officer at Grandy’s LLC, Souper Salad and former Vice President of Brand Management at Pizza Inn Holdings Inc.
Todd Coerver
Chief Operating Officer of Taco Cabana
Chief Operating Officer of Taco Cabana since September 2012 Former Chief Brand Officer of Taco Cabana since December 2009
Spent fifteen years at Whataburger Inc., most recently as Vice President, Marketing and Innovation
John Todd
Chief Development Officer and Vice President
Chief Development Officer and Vice President since May 2012
Former Chief Development Officer at Arby’s Restaurant Group since 2008
Previously served in various leadership positions at Arby’s Restaurant Group and RTM Restaurant Group (Arby’s largest franchisee)
20
Financial Summary
21
Key Developments
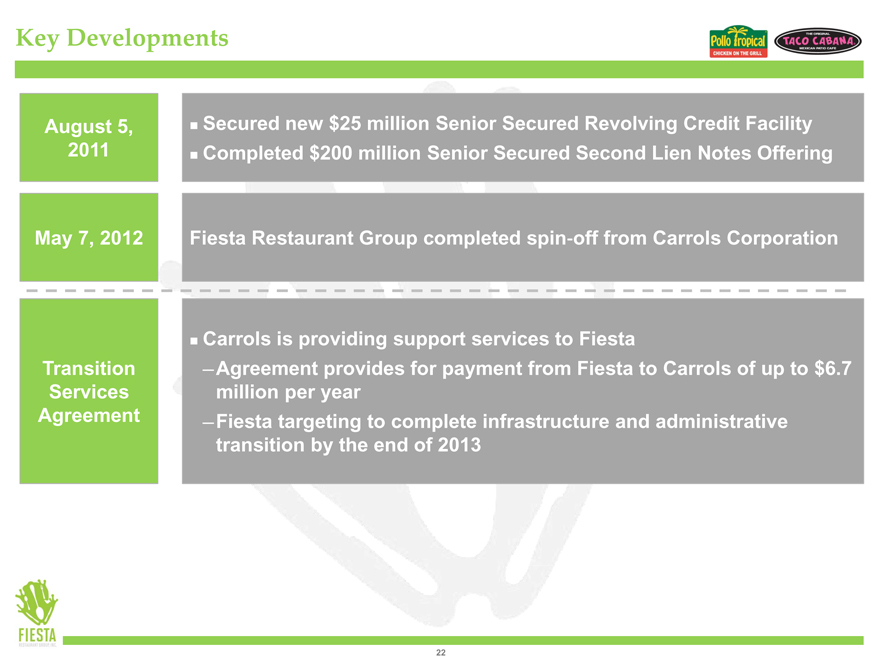
August 5, 2011
Secured new $25 million Senior Secured Revolving Credit Facility Completed $200 million Senior Secured Second Lien Notes Offering
May 7, 2012
Fiesta Restaurant Group completed spin off from Carrols Corporation
Transition Services Agreement
Carrols is providing support services to Fiesta
Agreement provides for payment from Fiesta to Carrols of up to $6.7 million per year
Fiesta targeting to complete infrastructure and administrative transition by the end of 2013
22
Strong Historical Brand Financial Performance
($ Millions)
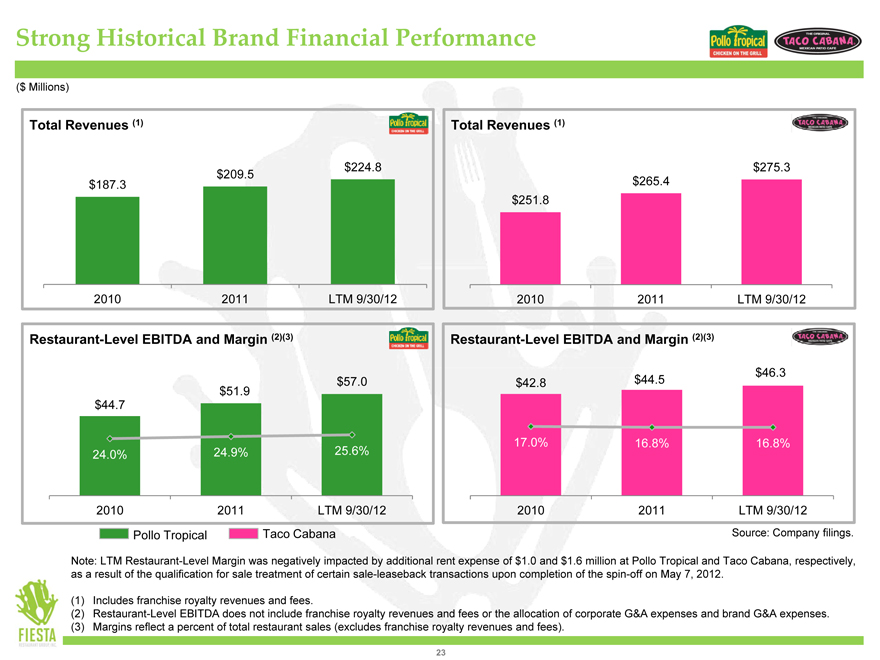
Total Revenues (1)
$224.8 $209.5 $187.3
2010 2011 LTM 9/30/12
Total Revenues (1)
$275.3 $265.4 $251.8
2010 2011 LTM 9/30/12
Restaurant-Level EBITDA and Margin (2)(3)
$57.0
$51.9
$44.7
24.0% 24.9% 25.6% 2010 2011 LTM 9/30/12
Restaurant-Level EBITDA and Margin (2)(3)
$46.3
$42.8 $44.5
17.0% 16.8% 16.8%
2010 2011 LTM 9/30/12
Pollo Tropical Taco Cabana
Note: LTM Restaurant-Level Margin was negatively impacted by additional rent expense of $1.0 and $1.6 million at Pollo Tropical and Taco Cabana, respectively, as a result of the qualification for sale treatment of certain sale-leaseback transactions upon completion of the spin-off on May 7, 2012.
(1) | | Includes franchise royalty revenues and fees. |
(2) Restaurant-Level EBITDA does not include franchise royalty revenues and fees or the allocation of corporate G&A expenses and brand G&A expenses. (3) Margins reflect a percent of total restaurant sales (excludes franchise royalty revenues and fees).
23
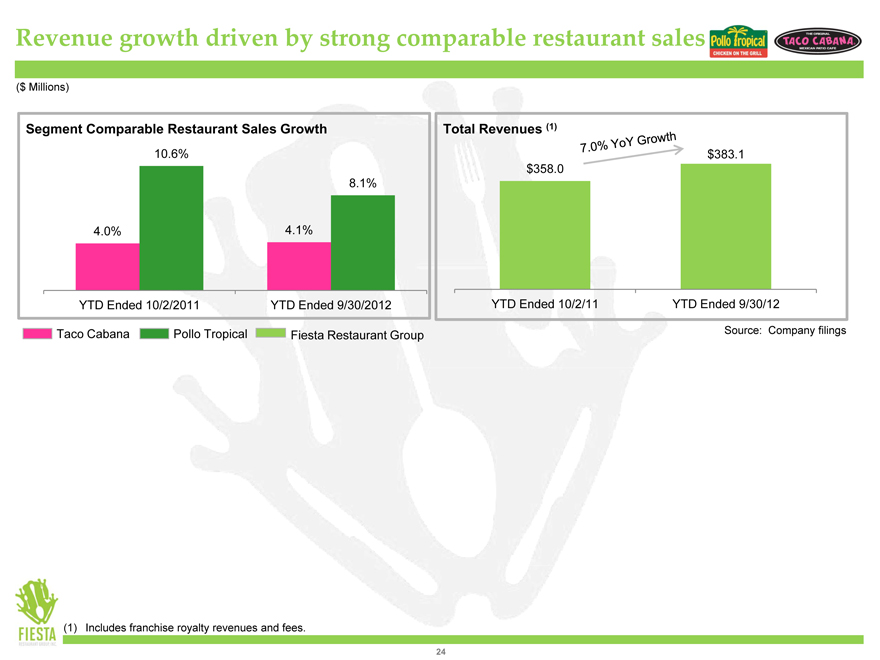
Revenue growth driven by strong comparable restaurant sales
($ Millions)
Segment Comparable Restaurant Sales Growth
10.6%
8.1%
4.0% 4.1%
YTD Ended 10/2/2011 YTD Ended 9/30/2012
Taco Cabana Pollo Tropical Fiesta Restaurant Group
Total Revenues (1)
$383.1
$358.0
YTD Ended 10/2/11 YTD Ended 9/30/12
Source: Company filings
(1) | | Includes franchise royalty revenues and fees. |
24
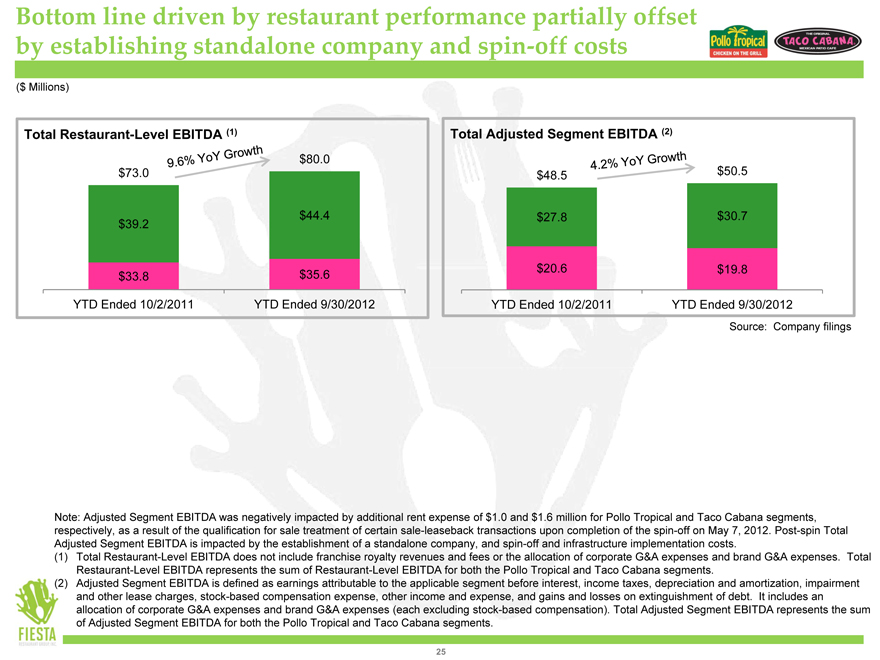
Bottom line driven by restaurant performance partially offset by establishing standalone company and spin-off costs
($ Millions)
Total Restaurant-Level EBITDA (1)
$ 80.0
$ 73.0
$ 44.4
$ 39.2
$ 33.8 $ 35.6
YTD Ended 10/2/2011 YTD Ended 9/30/2012
Total Adjusted Segment EBITDA (2)
$ 48.5 $ 50.5
$ 27.8 $ 30.7
$ 20.6 $ 19.8
YTD Ended 10/2/2011 YTD Ended 9/30/2012
Source: Company filings
Note: Adjusted Segment EBITDA was negatively impacted by additional rent expense of $1.0 and $1.6 million for Pollo Tropical and Taco Cabana segments, respectively, as a result of the qualification for sale treatment of certain sale-leaseback transactions upon completion of the spin-off on May 7, 2012. Post-spin Total Adjusted Segment EBITDA is impacted by the establishment of a standalone company, and spin-off and infrastructure implementation costs.
(1) Total Restaurant-Level EBITDA does not include franchise royalty revenues and fees or the allocation of corporate G&A expenses and brand G&A expenses. Total Restaurant-Level EBITDA represents the sum of Restaurant-Level EBITDA for both the Pollo Tropical and Taco Cabana segments.
(2) Adjusted Segment EBITDA is defined as earnings attributable to the applicable segment before interest, income taxes, depreciation and amortization, impairment and other lease charges, stock-based compensation expense, other income and expense, and gains and losses on extinguishment of debt. It includes an allocation of corporate G&A expenses and brand G&A expenses (each excluding stock-based compensation). Total Adjusted Segment EBITDA represents the sum of Adjusted Segment EBITDA for both the Pollo Tropical and Taco Cabana segments.
25
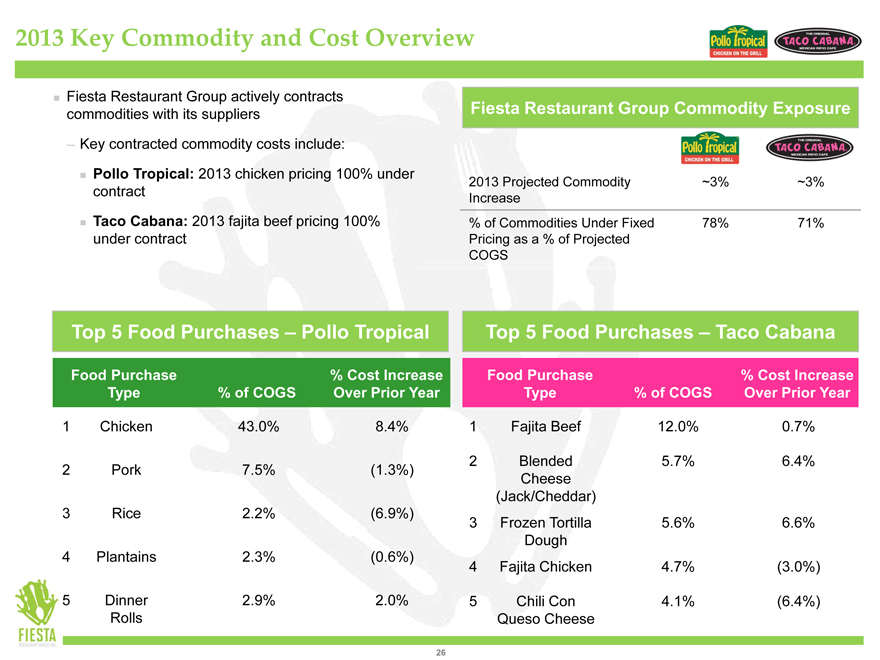
2013 Key Commodity and Cost Overview
Fiesta Restaurant Group actively contracts commodities with its suppliers
Key contracted commodity costs include:
Pollo Tropical: 2013 chicken pricing 100% under contract
Taco Cabana: 2013 fajita beef pricing 100% under contract
Fiesta Restaurant Group Commodity Exposure
2013 Projected Commodity ~3% ~3% Increase % of Commodities Under Fixed 78% 71% Pricing as a % of Projected COGS
Top 5 Food Purchases – Pollo Tropical
Food Purchase% Cost Increase
Type% of COGS Over Prior Year
Rolls
Top 5 Food Purchases – Taco Cabana
Food Purchase% Cost Increase
Type% of COGS Over Prior Year
Cheese
(Jack/Cheddar)
3 | | Frozen Tortilla 5.6% 6.6% |
Dough
Chicken 4.7%(3.0%)
Queso Cheese
26
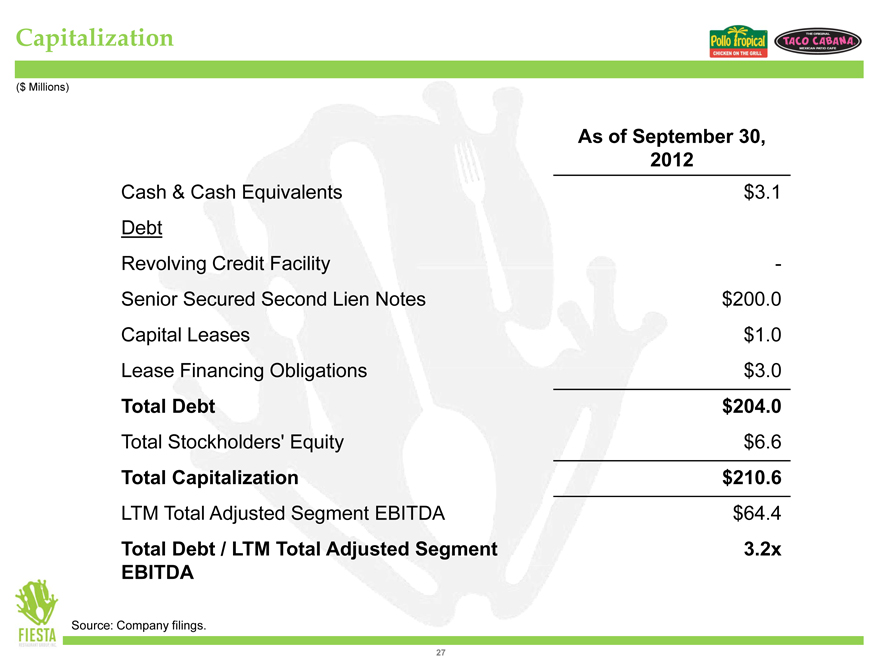
Capitalization
($ Millions)
As of September 30,
2012
Cash & Cash Equivalents $3.1
Debt
Revolving Credit Facility -
Senior Secured Second Lien Notes $200.0
Capital Leases $1.0
Lease Financing Obligations $3.0
Total Debt $204.0
Total Stockholders’ Equity $6.6
Total Capitalization $210.6
LTM Total Adjusted Segment EBITDA $64.4
Total Debt / LTM Total Adjusted Segment 3.2x
EBITDA
Source: Company filings.
27
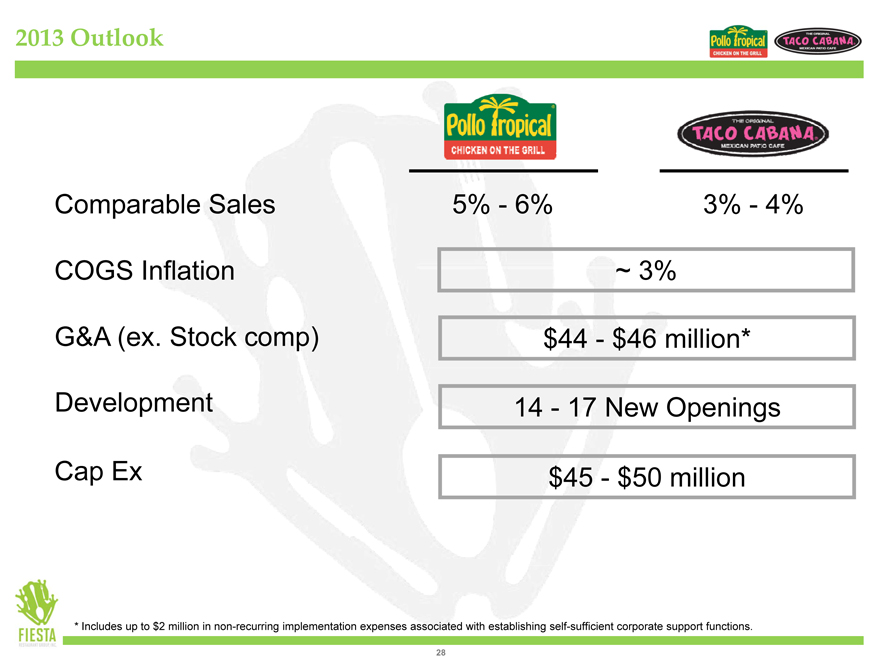
2013 Outlook
Comparable Sales 5%—6% 3%—4%
COGS Inflation ~ 3%
G&A (ex. Stock comp) $44—$46 million*
Development 14—17 New Openings
Cap Ex $45—$50 million
* Includes up to $2 million in non-recurring implementation expenses associated with establishing self-sufficient corporate support functions.
28

Appendix
29
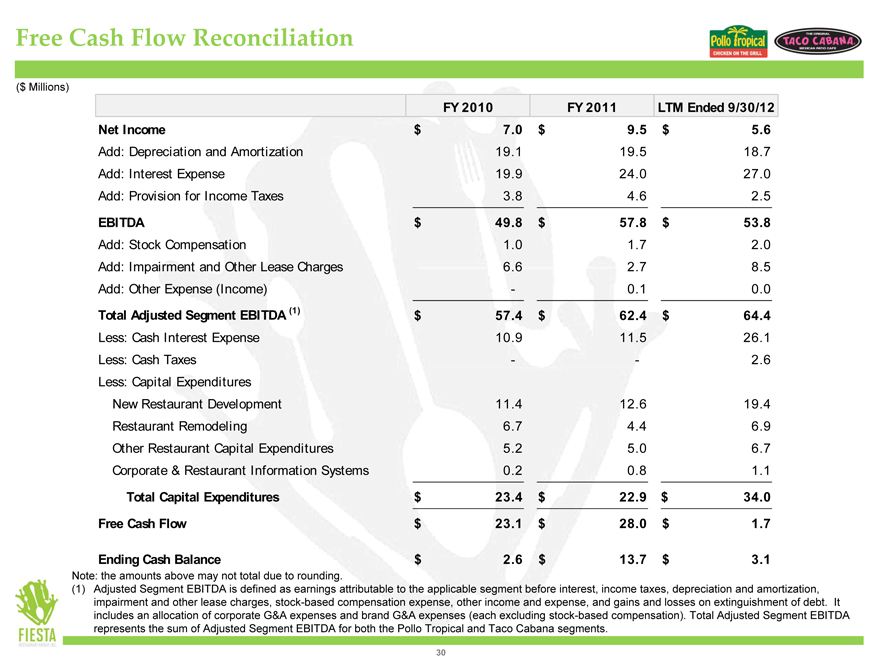
Free Cash Flow Reconciliation
($ Millions)
FY 2010 FY 2011 LTM Ended 9/30/12
Net Income $ 7.0 $ 9.5 $ 5.6
Add: Depreciation and Amortization 19.1 19.5 18.7
Add: Interest Expense 19.9 24.0 27.0
Add: Provision for Income Taxes 3.8 4.6 2.5
EBITDA $ 49.8 $ 57.8 $ 53.8
Add: Stock Compensation 1.0 1.7 2.0
Add: Impairment and Other Lease Charges 6.6 2.7 8.5
Add: Other Expense (Income)—0.1 0.0
Total Adjusted Segment EBITDA (1) $ 57.4 $ 62.4 $ 64.4
Less: Cash Interest Expense 10.9 11.5 26.1
Less: Cash Taxes—- 2.6
Less: Capital Expenditures
New Restaurant Development 11.4 12.6 19.4
Restaurant Remodeling 6.7 4.4 6.9
Other Restaurant Capital Expenditures 5.2 5.0 6.7
Corporate & Restaurant Information Systems 0.2 0.8 1.1
Total Capital Expenditures $ 23.4 $ 22.9 $ 34.0
Free Cash Flow $ 23.1 $ 28.0 $ 1.7
Ending Cash Balance $ 2.6 $ 13.7 $ 3.1
Note: the amounts above may not total due to rounding.
(1) Adjusted Segment EBITDA is defined as earnings attributable to the applicable segment before interest, income taxes, depreciation and amortization, impairment and other lease charges, stock-based compensation expense, other income and expense, and gains and losses on extinguishment of debt. It includes an allocation of corporate G&A expenses and brand G&A expenses (each excluding stock-based compensation). Total Adjusted Segment EBITDA represents the sum of Adjusted Segment EBITDA for both the Pollo Tropical and Taco Cabana segments.
30
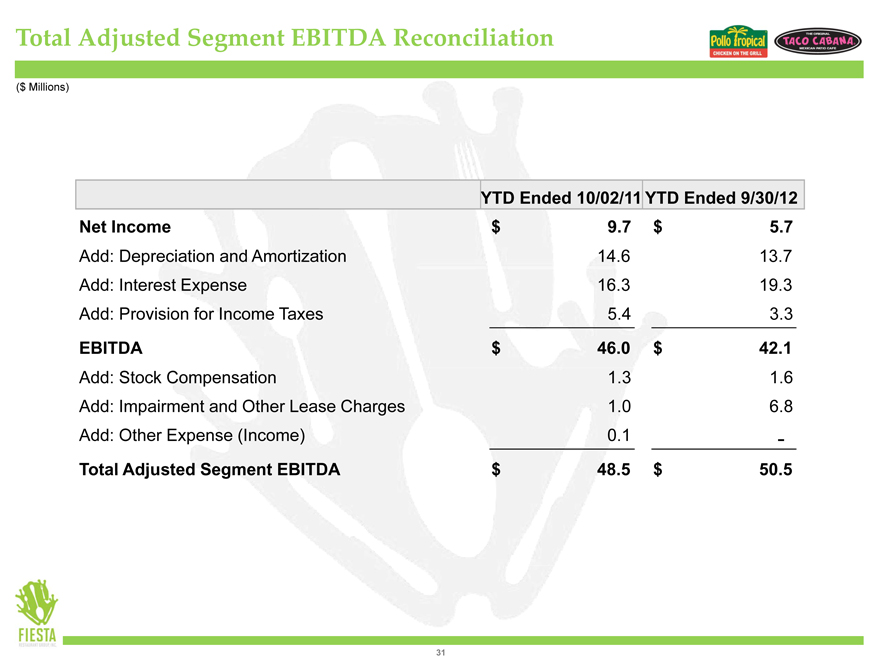
Total Adjusted Segment EBITDA Reconciliation
($ Millions)
YTD Ended 10/02/11 YTD Ended 9/30/12
Net Income $ 9.7 $ 5.7
Add: Depreciation and Amortization 14.6 13.7
Add: Interest Expense 16.3 19.3
Add: Provision for Income Taxes 5.4 3.3
EBITDA $ 46.0 $ 42.1
Add: Stock Compensation 1.3 16.
Add: Impairment and Other Lease Charges 1.0 6.8
Add: Other Expense (Income) 0.1 -
Total Adjusted Segment EBITDA $ 48.5 $ 50.5
31
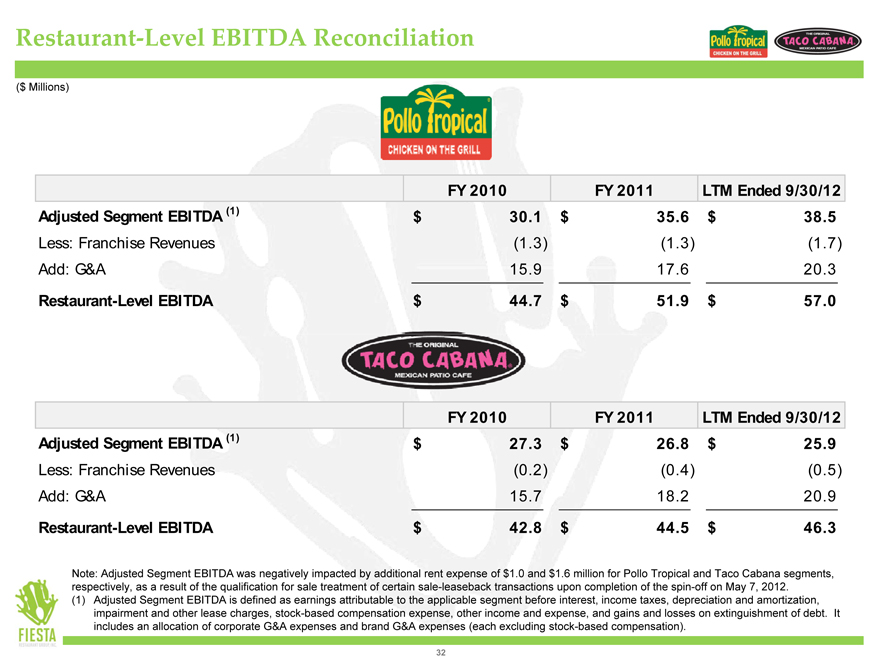
Restaurant-Level EBITDA Reconciliation
($ Millions)
FY 2010 FY 2011 LTM Ended 9/30/12
Adjusted Segment EBITDA (1) $ 30.1 $ 35 .6 $ 38 .5
Less: Franchise Revenues(1 .3)(1 .3)(1 .7)
Add: G&A 15.9 17 .6 20 .3
Restaurant-Level EBITDA $ 44 .7 $ 51 .9 $ 57 .0
FY 2010 FY 2011 LTM Ended 9/30/12
Adjusted Segment EBITDA (1) $ 27.3 $ 26 .8 $ 25 .9
Less: Franchise Revenues(0 .2)(0 .4)(0 .5)
Add: G&A 15.7 18 .2 20 .9
Restaurant-Level EBITDA $ 42 .8 $ 44 .5 $ 46 .3
Note: Adjusted Segment EBITDA was negatively impacted by additional rent expense of $1.0 and $1.6 million for Pollo Tropical and Taco Cabana segments, respectively, as a result of the qualification for sale treatment of certain sale-leaseback transactions upon completion of the spin-off on May 7, 2012.
(1) Adjusted Segment EBITDA is defined as earnings attributable to the applicable segment before interest, income taxes, depreciation and amortization, impairment and other lease charges, stock-based compensation expense, other income and expense, and gains and losses on extinguishment of debt. It includes an allocation of corporate G&A expenses and brand G&A expenses (each excluding stock-based compensation).
32
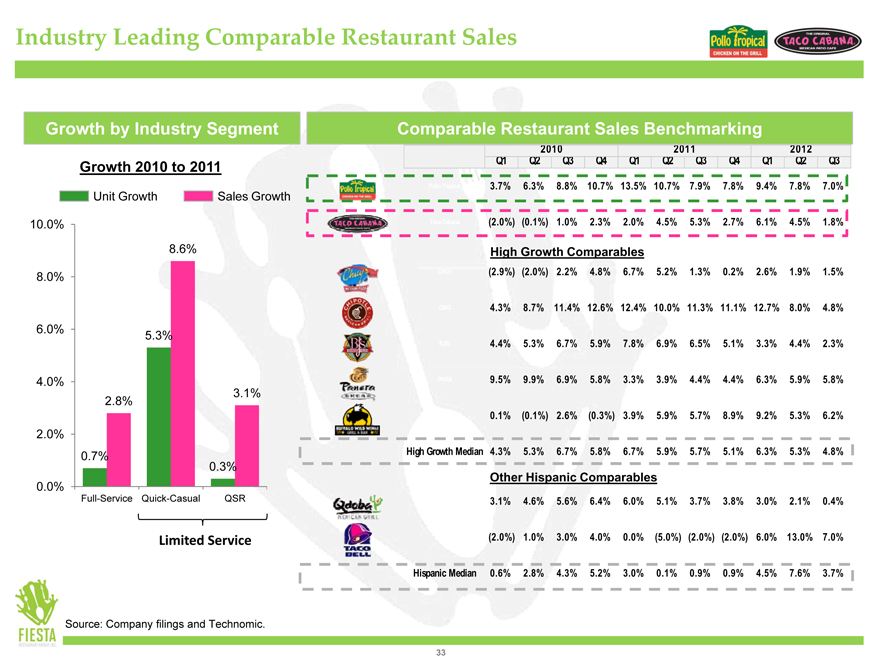
Industry Leading Comparable Restaurant Sales
Growth by Industry Segment Comparable Restaurant Sales Benchmarking
2010 2011 2012
Growth 2010 to 2011 Q1 Q2 Q3 Q4 Q1 Q2 Q3 Q4 Q1 Q2 Q3
Pollo Tropical 3.7% 6.3% 8.8% 10.7% 13.5% 10.7% 7.9% 7.8% 9.4% 7.8% 7.0%
Unit Growth Sales Growth
10.0% | | Taco Cabana(2.0%) (0.1%) 1.0% 2.3% 2.0% 4.5% 5.3% 2.7% 6.1% 4.5% 1.8% |
8.6% | | High Growth Comparables |
8.0% | | CHUY(2.9%) (2.0%) 2.2% 4.8% 6.7% 5.2% 1.3% 0.2% 2.6% 1.9% 1.5% |
CMG 4.3% 8.7% 11.4% 12.6% 12.4% 10.0% 11.3% 11.1% 12.7% 8.0% 4.8%
BJRI 4.4% 5.3% 6.7% 5.9% 7.8% 6.9% 6.5% 5.1% 3.3% 4.4% 2.3%
4.0% | | PNRA 9.5% 9.9% 6.9% 5.8% 3.3% 3.9% 4.4% 4.4% 6.3% 5.9% 5.8% |
BWLD 0.1%(0.1%) 2.6%(0.3%) 3.9% 5.9% 5.7% 8.9% 9.2% 5.3% 6.2%
2.0%
0.7% | | High Growth Median 4.3% 5.3% 6.7% 5.8% 6.7% 5.9% 5.7% 5.1% 6.3% 5.3% 4.8% |
0.3%
Other Hispanic Comparables
0.0%
Full-Service Quick-Casual QSR Qdoba 3.1% 4.6% 5.6% 6.4% 6.0% 5.1% 3.7% 3.8% 3.0% 2.1% 0.4%
Limited Service Taco Bell(2.0%) 1.0% 3.0% 4.0% 0.0%(5.0%) (2.0%) (2.0%) 6.0% 13.0% 7.0%
Hispanic Median 0.6% 2.8% 4.3% 5.2% 3.0% 0.1% 0.9% 0.9% 4.5% 7.6% 3.7%
Source: Company filings and Technomic.
33
Use of Non-GAAP Financial Measures
Total Adjusted Segment EBITDA and Total Restaurant-Level EBITDA (both on a consolidated basis and for each of our Pollo Tropical and Taco Cabana Segments) are all non-GAAP financial measures. Management believes that such financial measures, when viewed with our results of operations calculated in accordance with GAAP and our reconciliation of Total Restaurant-Level EBITDA and Total Adjusted Segment EBITDA to net income (i) provide useful information about our operating performance and period-over-period growth, (ii) provide additional information that is useful for evaluating the operating performance of our business, and (iii) permit investors to gain an understanding of the factors and trends affecting our ongoing earnings, from which capital investments are made and debt is serviced. However, such measures are not measures of financial performance or liquidity under GAAP and, accordingly should not be considered as alternatives to net income or cash flow from operating activities as indicators of operating performance or liquidity. Also these measures may not be comparable to similarly titled captions of other companies.
In addition, results of operations data for the twelve months ended September 30, 2012, are provided for information purposes only and are not indicative of our results of operations or financial performance for our fiscal year ended December 30, 2012, as will be reflected in our financial statements prepared in accordance with GAAP for such full fiscal year.
34