|
Exhibit 99.1 
|
INVESTOR PRESENTATION
DECEMBER 2013
NASDAQ : FRGI
Forward-Looking Statements
This presentation contains statements which constitute forward-looking statements within the meaning
of Section 27A of the Securities Act of 1933, as amended (the “Securities Act”), and Section 21E of the
Securities Exchange Act of 1934, as amended (the “Exchange Act”). Statements that are predictive in nature or that depend
upon or refer to future events or conditions are forward-looking statements. These statements are often identified by the words
“may,” “might,” “will,” “should,” “anticipate,” “believe,” “expect,” “intend,” “estimate,” “hope,” “plan,” or similar expressions.
In addition, expressions of our strategies, intentions, or plans are also forward-looking statements. These statements reflect
management’s current views with respect to future events and are subject to risks and uncertainties, both known and unknown.
You are cautioned not to place undue reliance on these forward-looking statements, which speak only as of their date. There are
important factors that could cause actual results to differ materially from those in forward-looking statements, many of which are
beyond our control. Investors are cautioned that any such forward-looking statements are not guarantees of future performance and
involve risks and uncertainties, and that actual results may differ materially from those projected or implied in the forward-looking
statements. We have identified significant factors that could cause actual results to differ materially from those stated or implied in
the forward-looking statements. We believe important factors that could cause actual results to differ materially from our expectations
include the following, in addition to other risks and uncertainties discussed herein: the effect of the spin-off of our company and the
potential tax liability associated with the spin-off; increases in food and other commodity costs; competitive conditions; regulatory factors;
environmental conditions and regulations; general economic conditions, particularly in the retail sector; weather conditions; fuel prices;
significant disruptions in service or supply by any of our suppliers or distributors; changes in consumer perception of dietary health and
food safety; labor and employment bene benefit costs; the outcome of pending or future legal claims or proceedings; our ability to manage
our growth and successfully implement our business strategy; risks associated with the expansion of our business; our borrowing costs
and credit ratings, which may be influenced by the credit ratings of our competitors; the availability and terms of necessary or desirable
financing or refinancing and other related risks and uncertainties; the risk of an act of terrorism, insurrection, or armed conflict involving
the United States or any other national or international calamity; factors that affect the restaurant industry generally, including product
recalls, liability if our products cause injury, ingredient disclosure and labeling laws and regulations, reports of cases of foodborne
illnesses such as mad cow disease and avian flu, and the possibility that consumers could lose confidence in the safety and quality of
certain food products, as well as negative publicity regarding food quality, illness, injury, or other health concerns; and other factors
discussed in our filings with the SEC.
FIESTA RESTAURANT GROUP 2013 INVESTOR PRESENTATION
Senior Management Representatives
Timothy Taft: Chief Executive Officer Lynn Schweinfurth: Chief Financial Officer
FIESTA RESTAURANT GROUP 2013 INVESTOR PRESENTATION
Company Overview
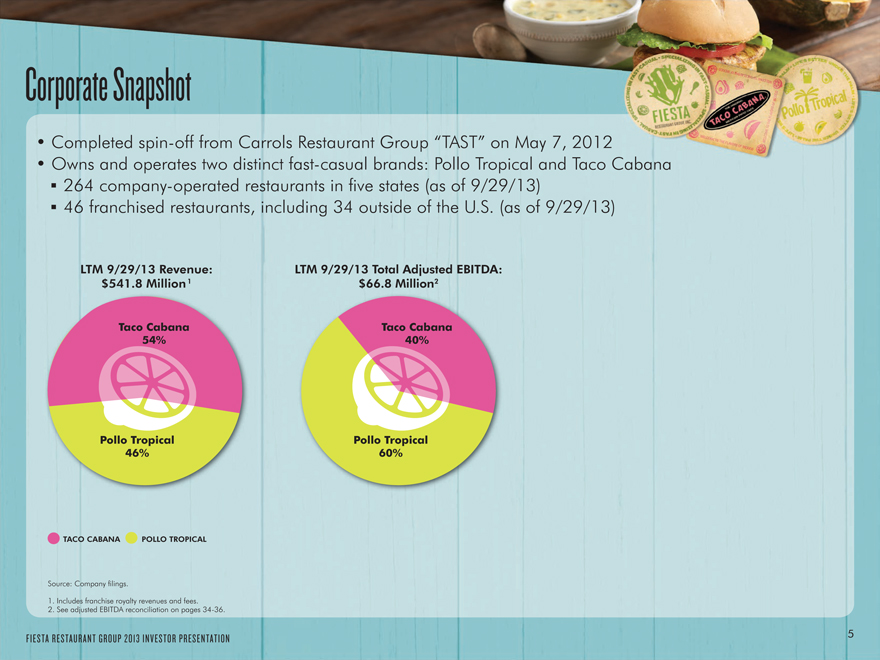
Corporate Snapshot
Completed spin-off from Carrols Restaurant Group “TAST” on May 7, 2012
Owns and operates two distinct fast-casual brands: Pollo Tropical and Taco Cabana
264 company-operated restaurants in five states (as of 9/29/13)
46 franchised restaurants, including 34 outside of the U.S. (as of 9/29/13)
LTM 9/29/13 Revenue: LTM 9/29/13 Total Adjusted EBITDA: $541.8 Million1 $66.8 Million2
Taco Cabana Taco Cabana 54% 40%
Pollo Tropical Pollo Tropical 46% 60%
TACO CABANA POLLO TROPICAL
Source: Company filings.
1. Includes franchise royalty revenues and fees.
2. See adjusted EBITDA reconciliation on pages 34-36.
FIESTA RESTAURANT GROUP 2013 INVESTOR PRESENTATION
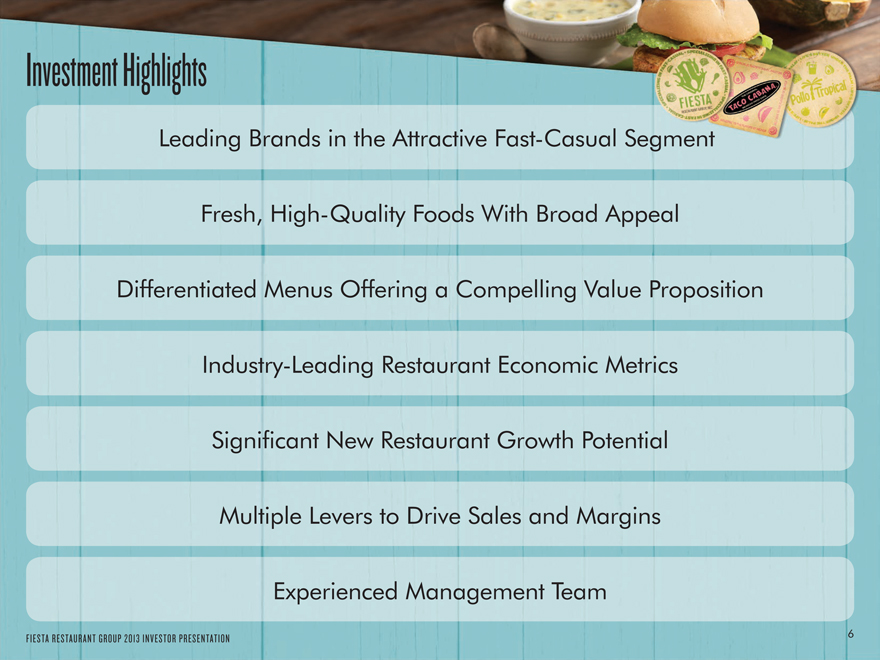
Investment Highlights
Leading Brands in the Attractive Fast-Casual Segment Fresh, High-Quality Foods With Broad Appeal Differentiated Menus Offering a Compelling Value Proposition Industry-Leading Restaurant Economic Metrics Significant New Restaurant Growth Potential Multiple Levers to Drive Sales and Margins Experienced Management Team
FIESTA RESTAURANT GROUP 2013 INVESTOR PRESENTATION
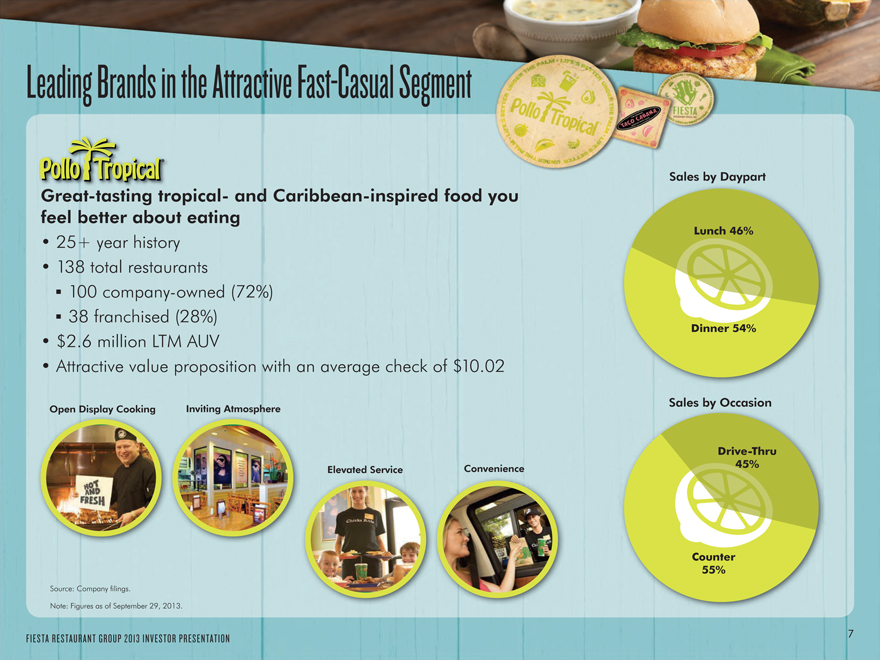
Leading Brands in the Attractive Fast-Casual Segment
Sales by Daypart
Great-tasting tropical- and Caribbean-inspired food you feel better about eating
Lunch 46%
25+ year history
138 total restaurants
100 company-owned (72%)
38 franchised (28%)
Dinner 54%
$2.6 million LTM AUV
Attractive value proposition with an average check of $10.02
Sales by Occasion
Open Display Cooking Inviting Atmosphere
Drive-Thru
Convenience 45% Elevated Service
Counter 55%
Source: Company filings.
Note: Figures as of September 29, 2013.
FIESTA RESTAURANT GROUP 2013 INVESTOR PRESENTATION
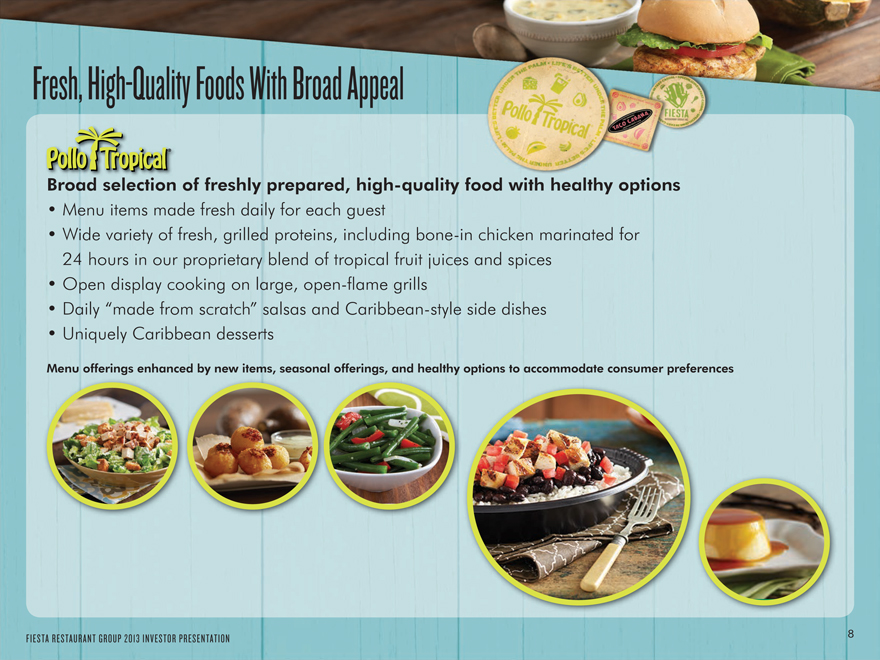
Fresh, High-Quality Foods With Broad Appeal
Broad selection of freshly prepared, high-quality food with healthy options
Menu items made fresh daily for each guest
Wide variety of fresh, grilled proteins, including bone-in chicken marinated for 24 hours in our proprietary blend of tropical fruit juices and spices
Open display cooking on large, open-flame grills
Daily “made from scratch” salsas and Caribbean-style side dishes
Uniquely Caribbean desserts
Menu offerings enhanced by new items, seasonal offerings, and healthy options to accommodate consumer preferences
FIESTA RESTAURANT GROUP 2013 INVESTOR PRESENTATION
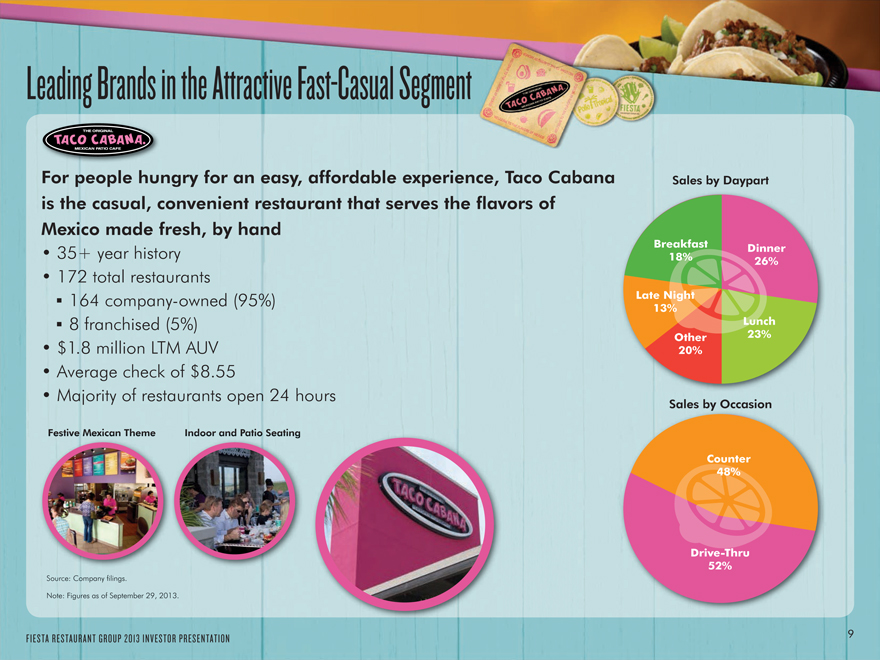
Leading Brands in the Attractive Fast-Casual Segment
For people hungry for an easy, affordable experience, Taco Cabana is the casual, convenient restaurant that serves the flavors of Mexico made fresh, by hand
35+ year history
172 total restaurants
164 company-owned (95%)
8 franchised (5%)
$1.8 million LTM AUV
Average check of $8.55
Majority of restaurants open 24 hours
Festive Mexican Theme Indoor and Patio Seating
Sales by Daypart
Breakfast Dinner 18% 26%
Late Night 13%
Lunch Other 23% 20%
Sales by Occasion
Counter
48%
Drive-Thru
52%
Source: Company filings.
Note: Figure as of September 29, 2013.
FIESTA RESTAURANT GROUP 2013 INVESTOR PRESENTATION
9
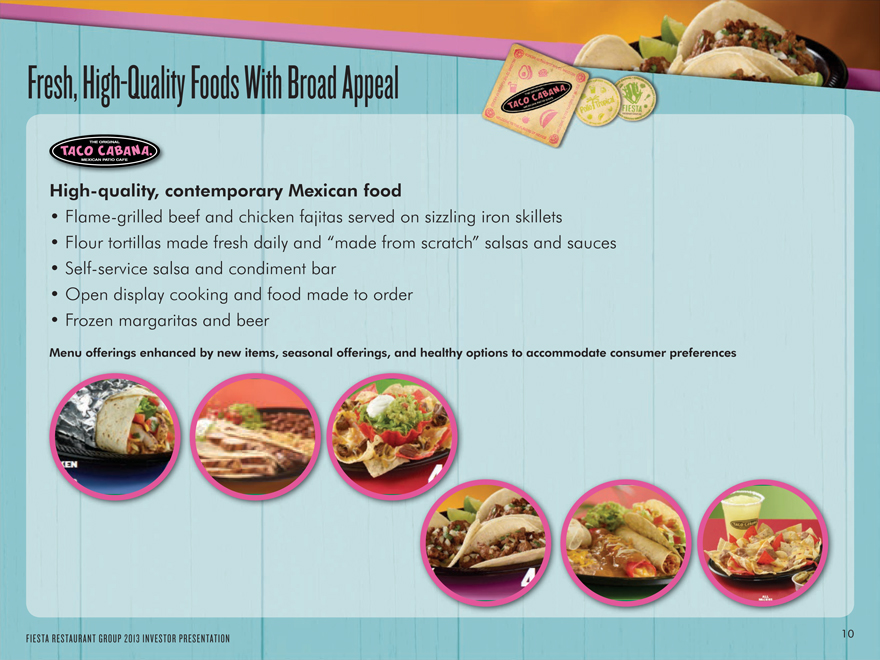
Fresh, High-Quality Foods With Broad Appeal
High-quality, contemporary Mexican food
Flame-grilled beef and chicken fajitas served on sizzling iron skillets
Flour tortillas made fresh daily and “made from scratch” salsas and sauces
Self-service salsa and condiment bar
Open display cooking and food made to order
Frozen margaritas and beer
Menu offerings enhanced by new items, seasonal offerings, and healthy options to accommodate consumer preferences
FIESTA RESTAURANT GROUP 2013 INVESTOR PRESENTATION
10
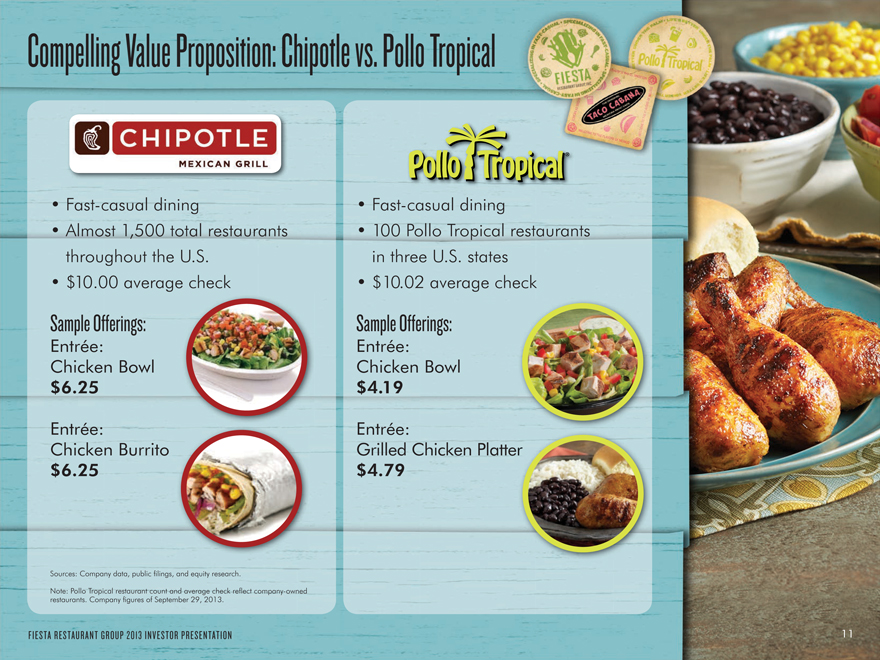
Compelling Value Proposition: Chipotle vs. Pollo Tropical
Fast-casual dining
Almost 1,500 total restaurants throughout the U.S.
$10.00 average check
Sample Offerings:
Entrée: Chicken Bowl
$6.25
Entrée: Chicken Burrito
$6.25
Sources: Company data, public filings, and equity research.
Note: Pollo Tropical restaurant count and average check reflect company-owned restaurants. Company figures of September 29, 2013.
FIESTA RESTAURANT GROUP 2013 INVESTOR PRESENTATION
Fast-casual dining
100 Pollo Tropical restaurants in three U.S. states
$10.02 average check
Sample Offerings:
Entrée:
Chicken Bowl
$4.19
Entrée:
Grilled Chicken Platter
$4.79
11
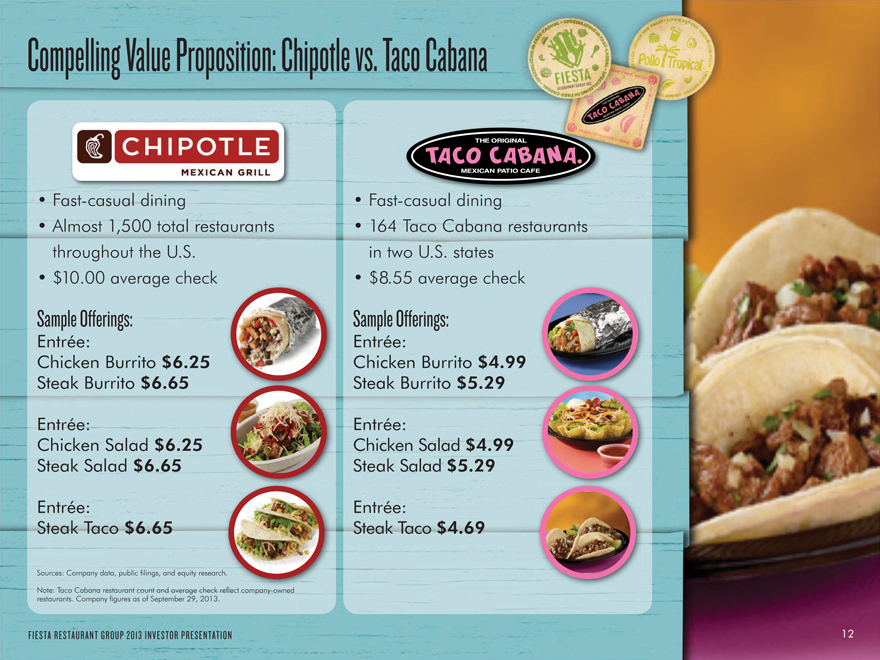
Compelling Value Proposition: Chipotle vs. Taco Cabana
Fast-casual dining
Almost 1,500 total restaurants throughout the U.S.
$10.00 average check
Sample Offerings:
Entrée:
Chicken Burrito $6.25 Steak Burrito $6.65
Entrée:
Chicken Salad $6.25 Steak Salad $6.65
Entrée:
Steak Taco $6.65
Fast-casual dining
164 Taco Cabana restaurants in two U.S. states
$8.55 average check
Sample Offerings:
Entrée:
Chicken Burrito $4.99
Steak Burrito $5.29
Entrée:
Chicken Salad $4.99
Steak Salad $5.29
Entrée:
Steak Taco $4.69
Sources: Company data, public filings, and equity research.
Note: Taco Cabana restaurant count and average check reflect company-owned
restaurants. Company figures as of September 29, 2013.
FIESTA RESTAURANT GROUP 2013 INVESTOR PRESENTATION
12
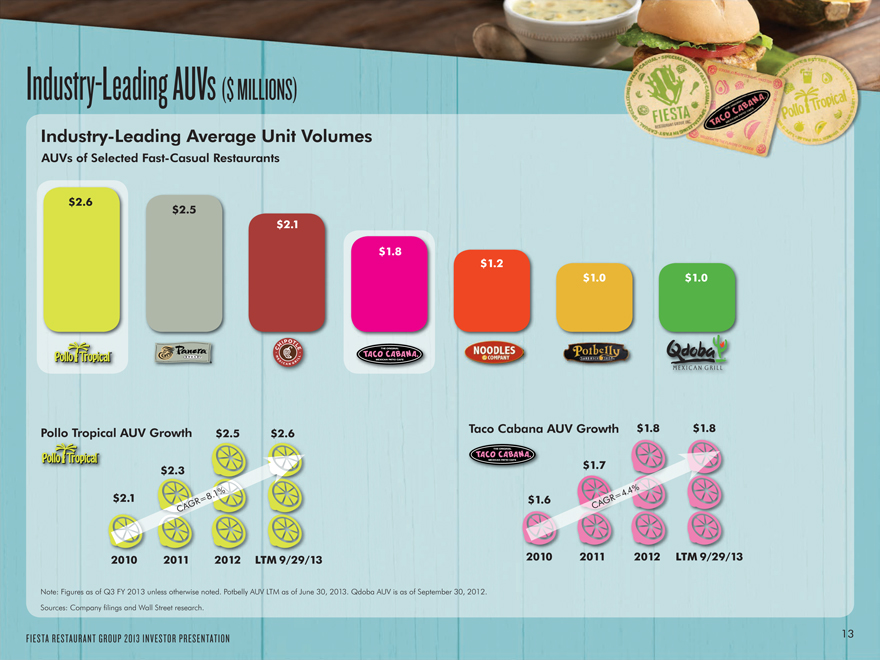
Industry-Leading AUVs ($ MILLIONS)
Industry-Leading Average Unit Volumes
AUVs of Selected Fast-Casual Restaurants
$2.6
$2.5
$2.1
$1.8 $1.2 $1.0 $1.0
Pollo Tropical AUV Growth Taco Cabana AUV Growth $1.8 $1.8
$2.5 $2.6
1% . 4%
$2.1 . $1.6
$2.3
$1.7
GR=8 GR=4
CA CA
2010 2011 2012 LTM 9/29/13 2010 2011 2012 LTM 9/29/13
Note: Figures as of Q3 FY 2013 unless otherwise noted. Potbelly AUV LTM as of June 30, 2013. Qdoba AUV is as of September 30, 2012. Sources: Company filings and Wall Street research.
13
FIESTA RESTAURANT GROUP 2013 INVESTOR PRESENTATION
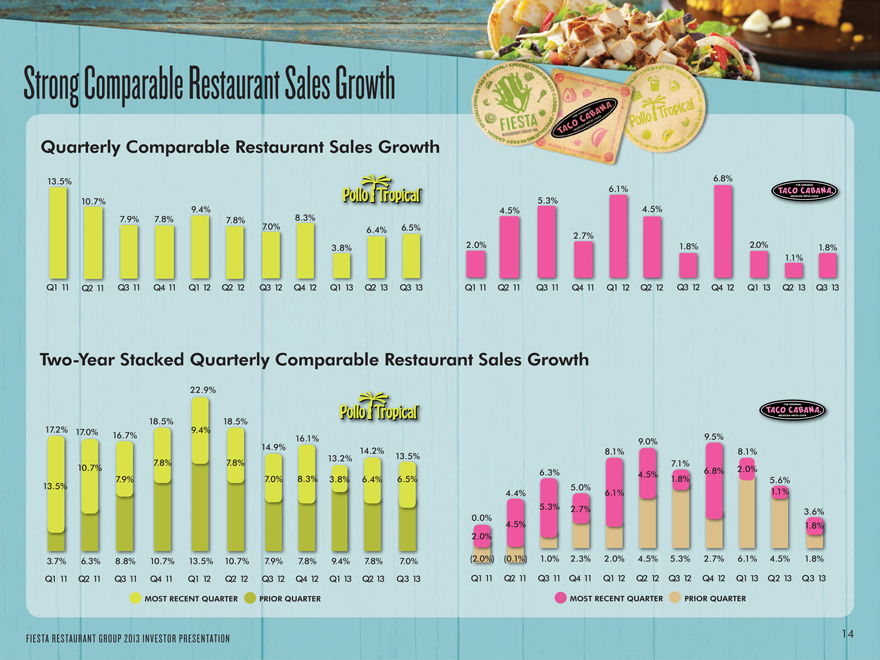
Strong Comparable Restaurant Sales Growth
Quarterly Comparable Restaurant Sales Growth
13.5% 6.8%
6.1%
10.7% 5.3% 4.5% 9.4% 8.3% 4.5% 7.9% 7.8% 7.8% 7.0% 6.4% 6.5%
2.7%
3.8% 2.0% 1.8% 2.0% 1.8%
1.1%
Q1 11 Q2 11 Q3 11 Q4 11 Q1 12 Q2 12 Q3 12 Q4 12 Q1 13 Q2 13 Q3 13 Q1 11 Q2 11 Q3 11 Q4 11 Q1 12 Q2 12 Q3 12 Q4 12 Q1 13 Q2 13 Q3 13
Two-Year Stacked Quarterly Comparable Restaurant Sales Growth
22.9%
17.2% 18.5% 9.4% 18.5%
17.0% 16.7%
16.1% 9.5% 9.0%
14.9% 14.2%
8.1% 8.1%
13.2% 13.5%
7.8% 7.8% 7.1%
10.7% 6.8% 2.0%
6.3% 4.5%
7.9% 7.0% 8.3% 3.8% 6.4% 6.5% 1.8% 5.6%
13.5% 5.0%
4.4% 6.1% 1.1%
5.3% 2.7%
3.6%
0.0%
4.5% 1.8%
2.0%
3.7% 6.3% 8.8% 10.7% 13.5% 10.7% 7.9% 7.8% 9.4% 7.8% 7.0% (2.0%) (0.1%) 1.0% 2.3% 2.0% 4.5% 5.3% 2.7% 6.1% 4.5% 1.8% Q1 11 Q2 11 Q3 11 Q4 11 Q1 12 Q2 12 Q3 12 Q4 12 Q1 13 Q2 13 Q3 13 Q1 11 Q2 11 Q3 11 Q4 11 Q1 12 Q2 12 Q3 12 Q4 12 Q1 13 Q2 13 Q3 13
MOST RECENT QUARTER PRIOR QUARTER MOST RECENT QUARTER PRIOR QUARTER
14
FIESTA RESTAURANT GROUP 2013 INVESTOR PRESENTATION
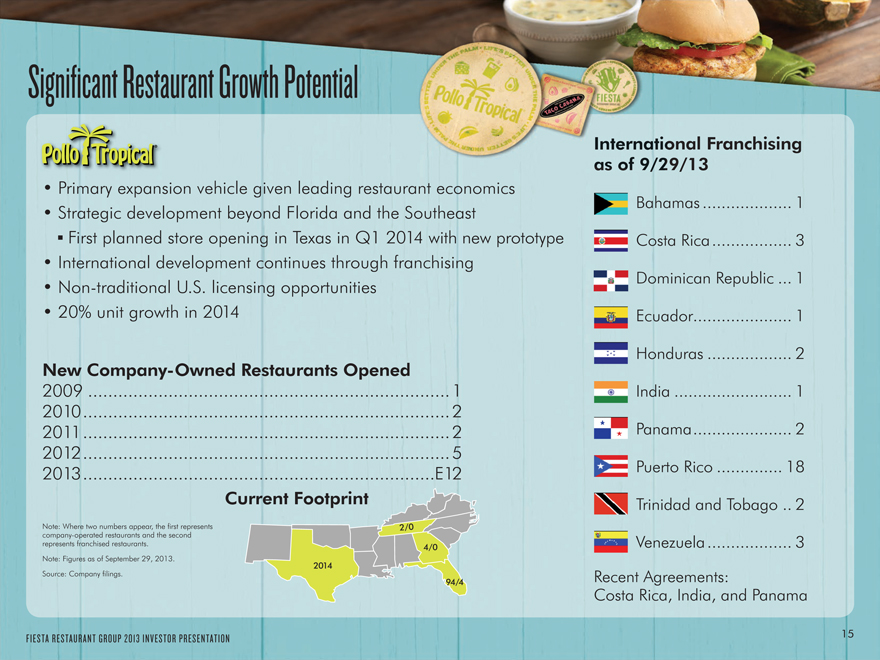
Significant Restaurant Growth Potential
Primary expansion vehicle given leading restaurant economics
Strategic development beyond Florida and the Southeast
First planned store opening in Texas in Q1 2014 with new prototype
International development continues through franchising
Non-traditional U.S. licensing opportunities
20% unit growth in 2014
New Company-Owned Restaurants Opened
2009 .1 2010.2 2011.2 2012.5 2013.E12
Current Footprint
Note: Where two numbers appear, the first represents 2/0 company-operated restaurants and the second represents franchised restaurants. 4/0 Note: Figures as of September 29, 2013.
Source: Company filings. 2014
94/4
FIESTA RESTAURANT GROUP 2013 INVESTOR PRESENTATION
International Franchising as of 9/29/13
Bahamas . 1 Costa Rica. 3 Dominican Republic . 1 Ecuador. 1 Honduras . 2 India . 1 Panama. 2 Puerto Rico . 18 Trinidad and Tobago . 2 Venezuela . 3
Recent Agreements:
Costa Rica, India, and Panama
15
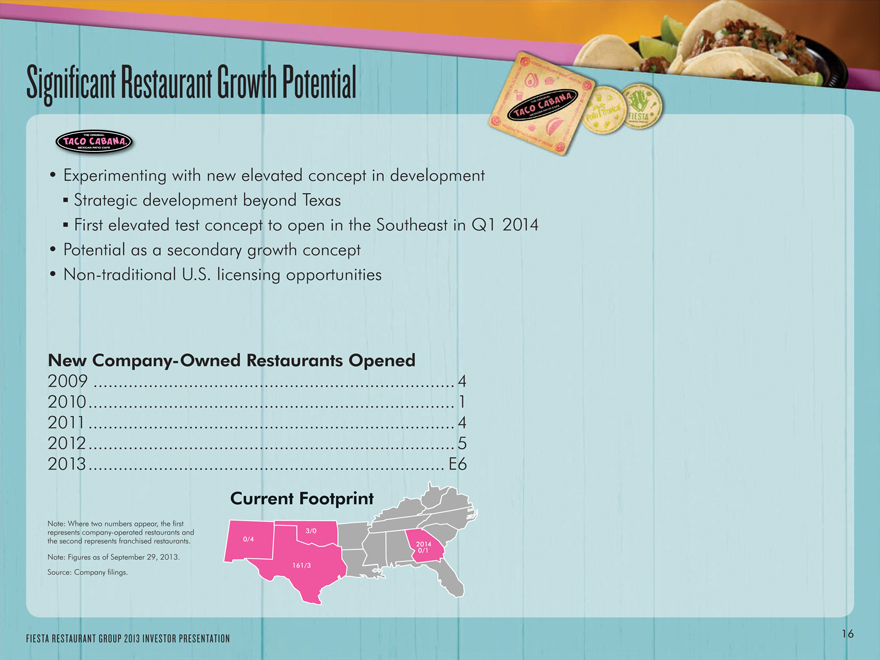
Significant Restaurant Growth Potential
Experimenting with new elevated concept in development Strategic development beyond Texas First elevated test concept to open in the Southeast in Q1 2014
Potential as a secondary growth concept
Non-traditional U.S. licensing opportunities
New Company-Owned Restaurants Opened
2009 .4 2010.1 2011.4 2012.5 2013. E6
current footprint
Note: Where two numbers appear, the first represents company-operated restaurants and [3 3/0 0] the second represents franchised restaurants. 0/4
2014 3/0
Note: Figures as of September 29, 2013.
161/3
Source: Company filings.
FIESTA RESTAURANT GROUP 2013 INVESTOR PRESENTATION
16
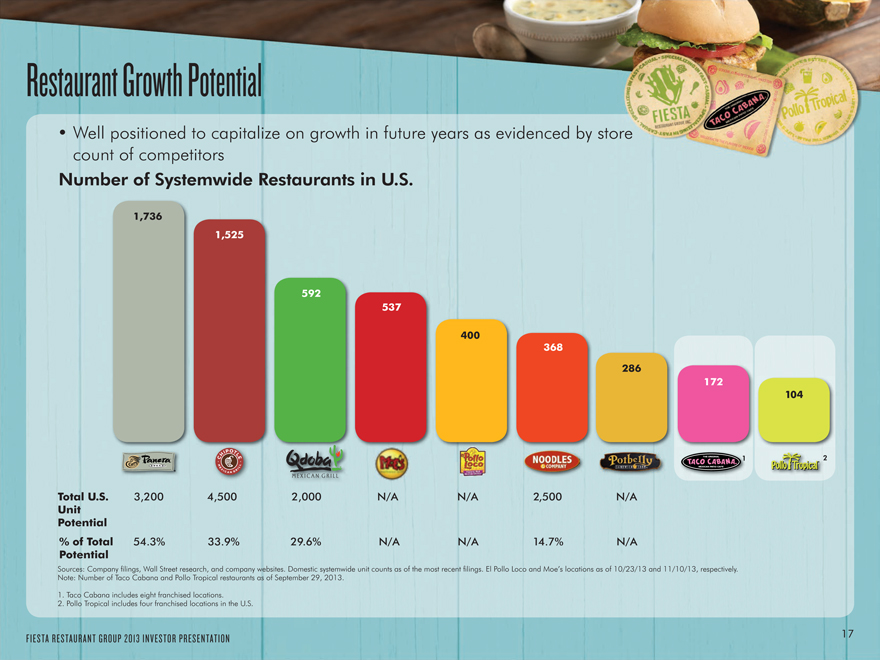
Restaurant Growth Potential
Well positioned to capitalize on growth in future years as evidenced by store count of competitors
Number of Systemwide Restaurants in U.S.
1,736
1,525
592
537
400
368
286
172
104
2
Total U.S. 3,200 4,500 2,000 N/A N/A 2,500 N/A
Unit Potential
% of Total 54.3% 33.9% 29.6% N/A N/A 14.7% N/A
Potential
Sources: Company filings, Wall Street research, and company websites. Domestic systemwide unit counts as of the most recent filings. El Pollo Loco and Moe’s locations as of 10/23/13 and 11/10/13, respectively. Note: Number of Taco Cabana and Pollo Tropical restaurants as of September 29, 2013.
1. Taco Cabana includes eight franchised locations.
2. Pollo Tropical includes four franchised locations in the U.S.
FIESTA RESTAURANT GROUP 2013 INVESTOR PRESENTATION
17
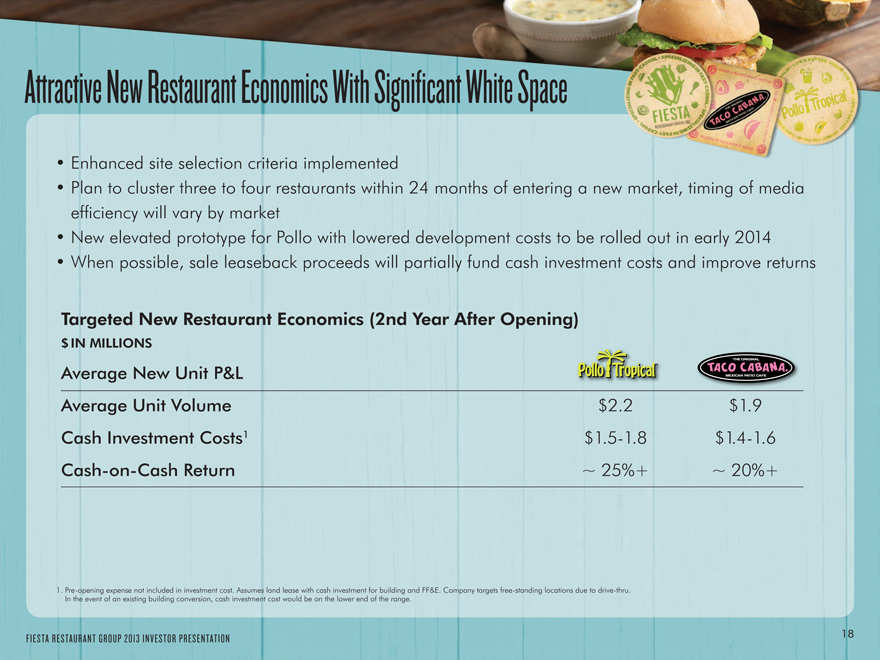
Attractive New Restaurant Economics With Significant White Space
Enhanced site selection criteria implemented
Plan to cluster three to four restaurants within 24 months of entering a new market, timing of media efficiency will vary by market
New elevated prototype for Pollo with lowered development costs to be rolled out in early 2014
When possible, sale leaseback proceeds will partially fund cash investment costs and improve returns
Targeted New Restaurant Economics (2nd Year After Opening)
$IN MILLIONS
Average New Unit P&L
Average Unit Volume $2.2 $1.9 Cash Investment Costs1 $1.5-1.8 $1.4-1.6 Cash-on-Cash Return ~ 25%+ ~ 20%+
1. Pre-opening expense not included in investment cost. Assumes land lease with cash investment for building and FF&E. Company targets free-standing locations due to drive-thru.
In the event of an existing building conversion, cash investment cost would be on the lower end of the range.
FIESTA RESTAURANT GROUP 2013 INVESTOR PRESENTATION
18
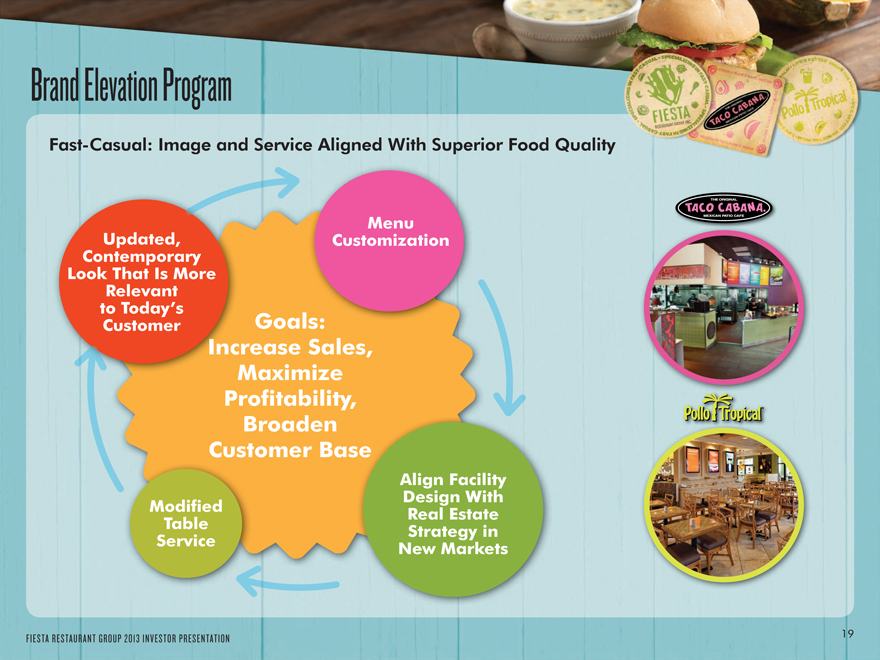
Brand Elevation Program
Fast-Casual: Image and Service Aligned With Superior Food Quality
Updated, Menu Contemporary Customization Look That Is More Relevant to Today’s Customer Goals:
Increase Sales, Maximize Profitability, Broaden Customer Base
Align Facility Design With Modified Real Estate Table Strategy in Service New Markets
FIESTA RESTAURANT GROUP 2013 INVESTOR PRESENTATION
19
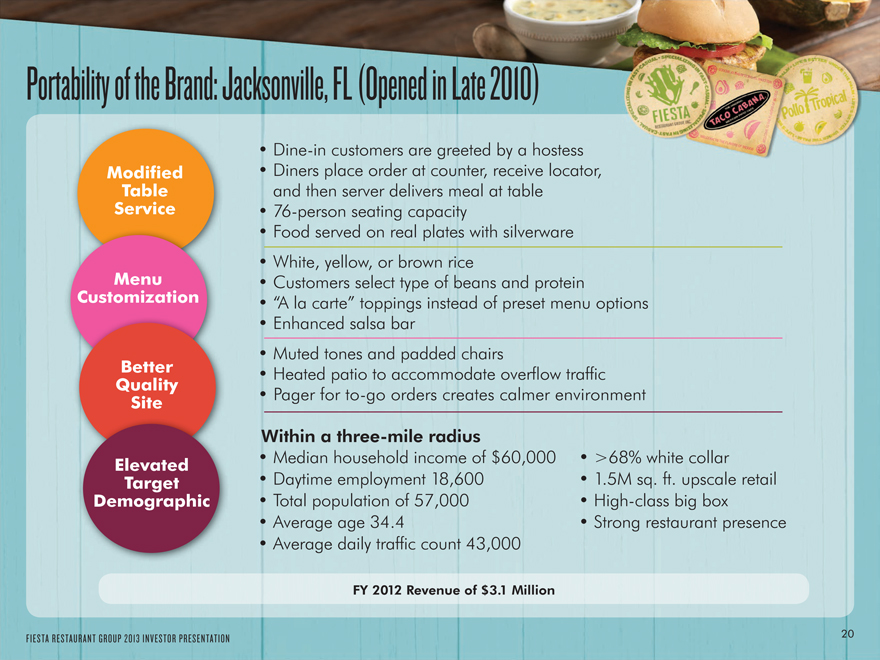
Portability of the Brand: Jacksonville, FL (Opened in Late 2010)
Modified Table Service
Menu Customization
Better Quality Site
Elevated Target Demographic
FIESTA RESTAURANT GROUP 2013 INVESTOR PRESENTATION
Dine-in customers are greeted by a hostess
Diners place order at counter, receive locator, and then server delivers meal at table
76-person seating capacity
Food served on real plates with silverware
White, yellow, or brown rice
Customers select type of beans and protein
“A la carte” toppings instead of preset menu options
Enhanced salsa bar
Muted tones and padded chairs
Heated patio to accommodate overflow traffic
Pager for to-go orders creates calmer environment
Within a three-mile radius
Median household income of $60,000 >68% white collar
Daytime employment 18,600 1.5M sq. ft. upscale retail
Total population of 57,000 High-class big box
Average age 34.4 Strong restaurant presence
Average daily traffic count 43,000
FY 2012 Revenue of $3.1 Million
20
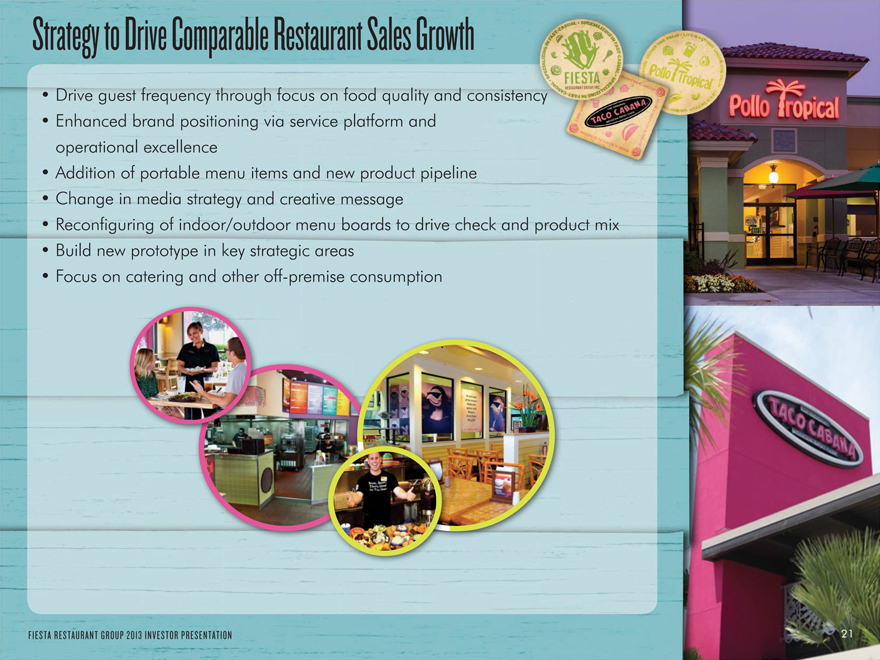
Strategy to Drive Comparable Restaurant Sales Growth
Drive guest frequency through focus on food quality and consistency
Enhanced brand positioning via service platform and operational excellence
Addition of portable menu items and new product pipeline
Change in media strategy and creative message
Reconfiguring of indoor/outdoor menu boards to drive check and product mix
Build new prototype in key strategic areas
Focus on catering and other off-premise consumption
FIESTA RESTAURANT GROUP 2013 INVESTOR PRESENTATION
21
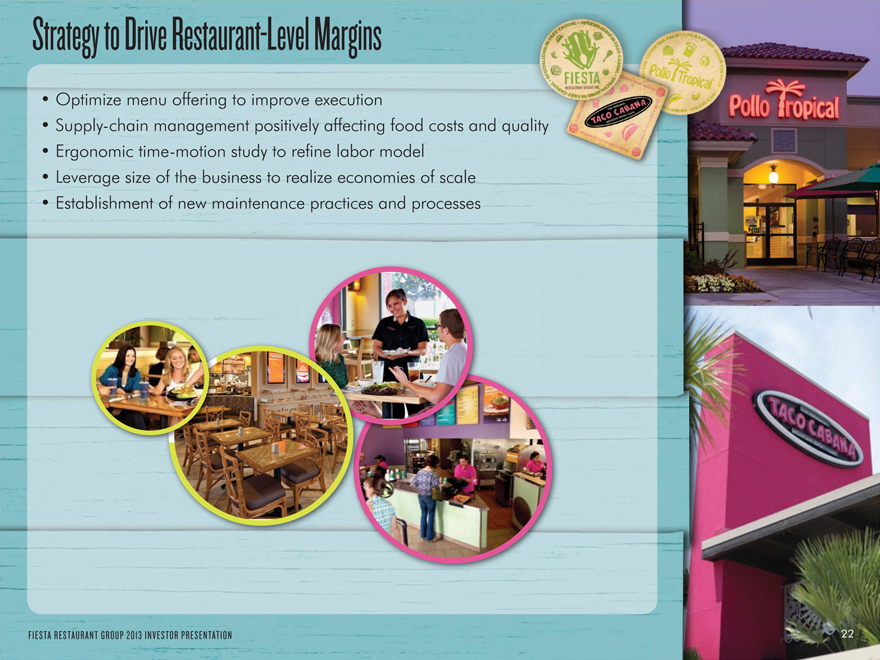
Strategy to Drive Restaurant-Level Margins
Optimize menu offering to improve execution
Supply-chain management positively affecting food costs and quality
Ergonomic time-motion study to refine labor model
Leverage size of the business to realize economies of scale
Establishment of new maintenance practices and processes
FIESTA RESTAURANT GROUP 2013 INVESTOR PRESENTATION
22
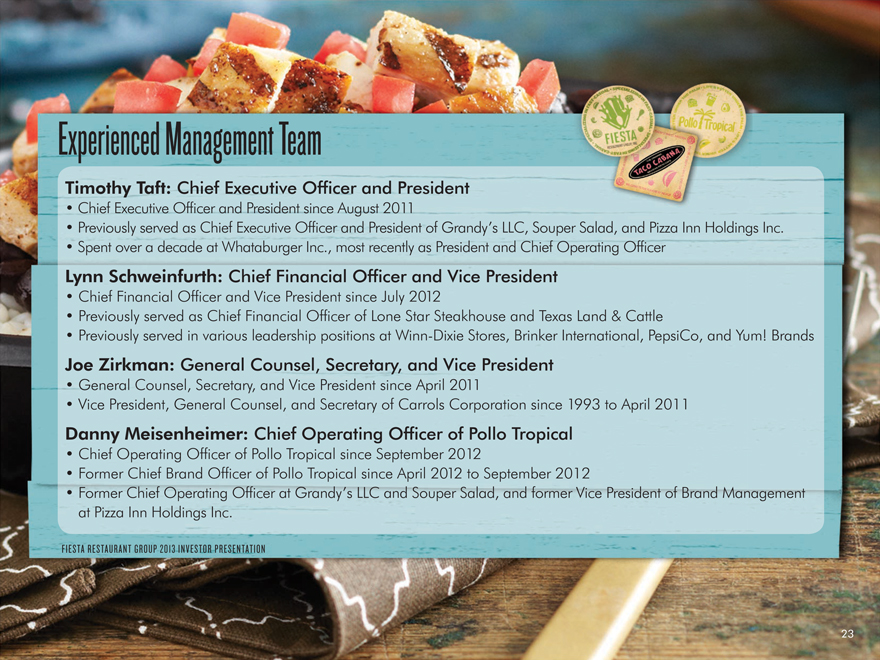
Experienced Management Team
Timothy Taft: Chief Executive Officer and President
Chief Executive Officer and President since August 2011
Previously served as Chief Executive Officer and President of Grandy’s LLC, Souper Salad, and Pizza Inn Holdings Inc.
Spent over a decade at Whataburger Inc., most recently as President and Chief Operating Officer
Lynn Schweinfurth: Chief Financial Officer and Vice President
Chief Financial Offi cer and Vice President since July 2012
Previously served as Chief Financial Officer of Lone Star Steakhouse and Texas Land & Cattle
Previously served in various leadership positions at Winn-Dixie Stores, Brinker International, PepsiCo, and Yum! Brands
Joe Zirkman: General Counsel, Secretary, and Vice President
General Counsel, Secretary, and Vice President since April 2011
Vice President, General Counsel, and Secretary of Carrols Corporation since 1993 to April 2011
Danny Meisenheimer: Chief Operating Of cer of Pollo Tropical
Chief Operating Officer of Pollo Tropical since September 2012
Former Chief Brand Offi cer of Pollo Tropical since April 2012 to September 2012
Former Chief Operating Officer at Grandy’s LLC and Souper Salad, and former Vice President of Brand Management at Pizza Inn Holdings Inc.
FIESTA RESTAURANT GROUP 2013 INVESTOR PRESENTATION
23
Experienced Management Team CONTINUED
Todd Coerver: Chief Operating Of cer of Taco Cabana
Chief Operating Offi cer of Taco Cabana since September 2012
Former Chief Brand Offi cer of Taco Cabana since December 2009 to September 2012
Spent 15 years at Whataburger Inc., most recently as Vice President, Marketing and Innovation
John Todd: Chief Development Of cer and Vice President
Chief Development Offi cer and Vice President since May 2012
Former Chief Development Offi cer at Arby’s Restaurant Group since 2008
Previously served in various leadership positions at Arby’s Restaurant Group and RTM Restaurant Group (Arby’s largest franchisee)
Joe Brink: Vice President of Supply Chain Management
Vice President of Supply Chain Management since November 2011
Former Vice President of Supply Chain Management for Souper Salad and Grandy’s LLC restaurants
Previously served in senior positions across supply chain management, purchasing, and R&D for both Pizza Inn and Grandy’s LLC
24
Financial Summary
25
Financial Summary ($ MILLIONS, EXCEPT STORE COUNTS)
Total Revenues1
$541.8 $509.7
$475.0 $439.1
.9%
CAGR=7
FY 2010 FY 2011 FY 2012 LTM 9/29/13
Total Restaurant-Level Adjusted EBITDA2
$109.2 $103.7 $61.6 $96.4 $57.1 $87.8
CAGR=8.3% $44.8
$42.9 $44.7 $46.6 $47.6
FY 2010 FY 2011 FY 2012 LTM 9/29/13
TACO CABANA POLLO TROPICAL FIESTA RESTAURANT GROUP FRANCHISED RESTAURANTS
Total Systemwide Store Count 310
294
264 285 251 279
GR=3.9%
246 CA
33 36 43 46 FY 2010 FY 2011 FY 2012 LTM 9/29/13
Total Adjusted EBITDA3
$66.8 $64.2 $40.3 $62.4 $38.6 $57.4 $30.1 CAGR=5.7% $35.6
$27.3 $26.8 $25.6 $26.4
FY 2010 FY 2011 FY 2012 LTM 9/29/13
Note: Post-spin profitability metrics are being impacted by the establishment of the Fiesta management team and infrastructure implementation costs. Source: Company filings.
1. Includes franchise royalty revenues and fees.
2. Total restaurant-level adjusted EBITDA does not include franchise royalty revenues and fees or the allocation of corporate G&A expenses and brand G&A expenses. Total restaurant-level adjusted EBITDA represents the sum of restaurant-level adjusted EBITDA for both brands and includes pre-opening expenses in LTM 9/29/13, FY 2012, FY 2011, and FY 2010 of $2.1 million, $1.1 million, $0.5 million, and $0.5 million, respectively, for Pollo Tropical. Includes pre-opening expenses in LTM 9/29/13, FY 2012, FY 2011, and FY 2010 of $0.9 million, $0.6 million, $0.2 million, and $0.1 million, respectively, for Taco Cabana. Pre-opening expenses include costs incurred prior to opening a restaurant, including restaurant employee wages and related expenses, travel expenditures, recruiting, training, and rent, in addition to promotional costs associated with the restaurant opening.
3. Adjusted EBITDA is a non-GAAP financial measure. Adjusted EBITDA is defined as earnings attributable to the applicable segment before interest, income taxes, depreciation and amortization, impairment and other lease charges, stock-based compensation expense, and other income and expense. Adjusted EBITDA is used because it is a measure of segment profit or loss reported to our chief operating decision maker along with earnings before taxes for purposes of allocating resources to the segments and assessing each segment’s performance. This may not be necessarily comparable to other similarly titled captions of other companies due to differences in methods of calculation.
FIESTA RESTAURANT GROUP 2013 INVESTOR PRESENTATION
26
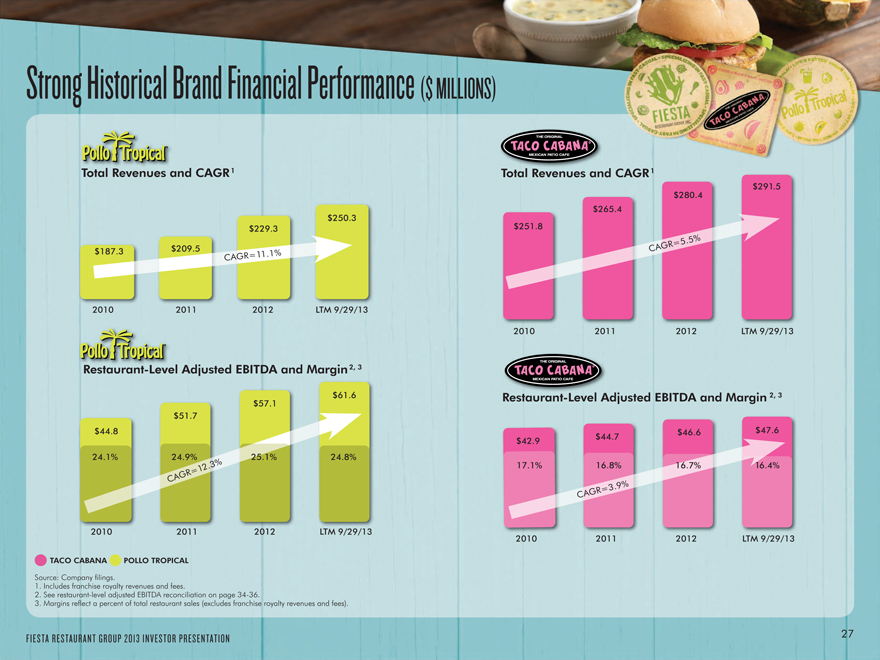
Strong Historical Brand Financial Performance ($ MILLIONS)
Total Revenues and CAGR 1
$250.3 $229.3 $209.5
$187.3
CAGR=11.1%
2010 2011 2012 LTM 9/29/13
Restaurant-Level Adjusted EBITDA and Margin 2, 3
$57.1 $61.6
$51.7
$44.8
24.1% 25.1% 24.8%
CAGR=12.3%
2010 2011 2012 LTM 9/29/13
TACO CABANA POLLO TROPICAL
Source: Company filings.
1. Includes franchise royalty revenues and fees.
2. See restaurant-level adjusted EBITDA reconciliation on page 34-36.
3. Margins reflect a percent of total restaurant sales (excludes franchise royalty revenues and fees).
FIESTA RESTAURANT GROUP 2013 INVESTOR PRESENTATION
Total Revenues and CAGR 1
$280.4 $291.5 $265.4 $251.8
CAGR=5.5%
2010 2011 2012 LTM 9/29/13
Restaurant-Level Adjusted EBITDA and Margin 2, 3
$46.6 $47.6
$44.7
$42.9
17.1% 16.7% 16.4% 16.8%
CAGR=3.9%
2010 2011 2012 LTM 9/29/13
27
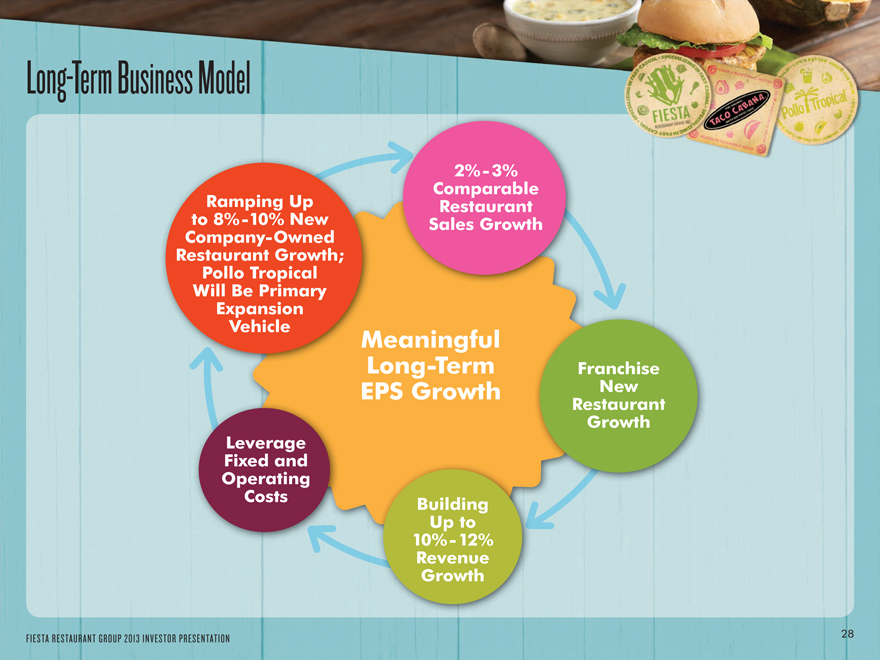
Long-Term Business Model
2%-3% Comparable Ramping Up Restaurant to 8%-10% New Sales Growth Company-Owned Restaurant Growth; Pollo Tropical Will Be Primary Expansion Vehicle
Meaningful
Long-Term Franchise EPS Growth New
Restaurant Growth Leverage Fixed and Operating Costs Building Up to 10%-12% Revenue Growth
FIESTA RESTAURANT GROUP 2013 INVESTOR PRESENTATION
28
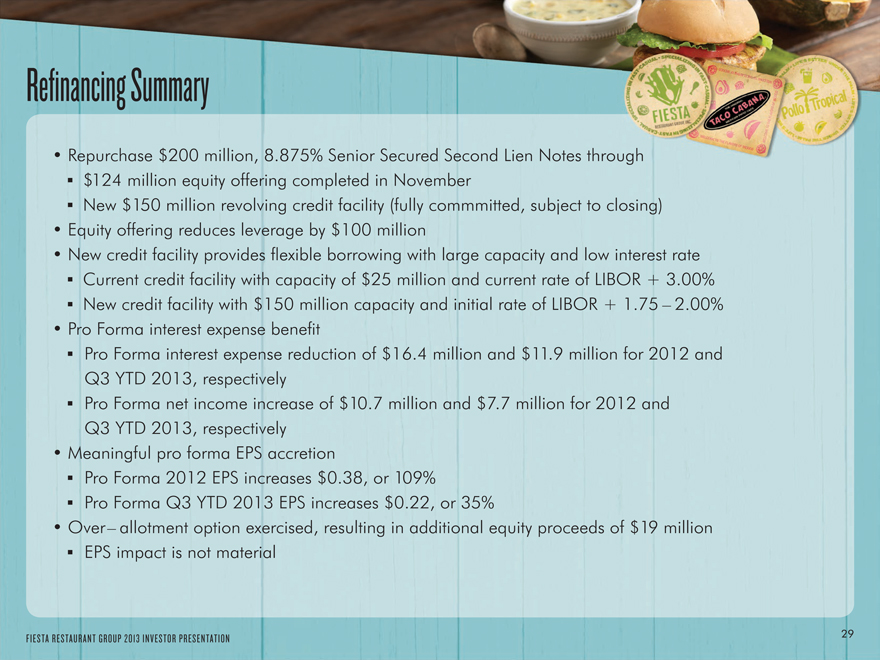
Refinancing Summary
Repurchase $200 million, 8.875% Senior Secured Second Lien Notes through $124 million equity offering completed in November New $150 million revolving credit facility (fully committed, subject to closing)
Equity offering reduces leverage by $100 million
New credit facility provides flexible borrowing with large capacity and low interest rate Current credit facility with capacity of $25 million and current rate of LIBOR + 3.00% New credit facility with $150 million capacity and initial rate of LIBOR + 1.75 – 2.00%
Pro Forma interest expense benefit
Pro Forma interest expense reduction of $16.4 million and $11.9 million for 2012 and Q3 YTD 2013, respectively
Pro Forma net income increase of $10.7 million and $7.7 million for 2012 and Q3 YTD 2013, respectively
Meaningful pro forma EPS accretion
Pro Forma 2012 EPS increases $0.38, or 109% Pro Forma Q3 YTD 2013 EPS increases $0.22, or 35%
Over– allotment option exercised, resulting in additional equity proceeds of $19 million EPS impact is not material
FIESTA RESTAURANT GROUP 2013 INVESTOR PRESENTATION
29
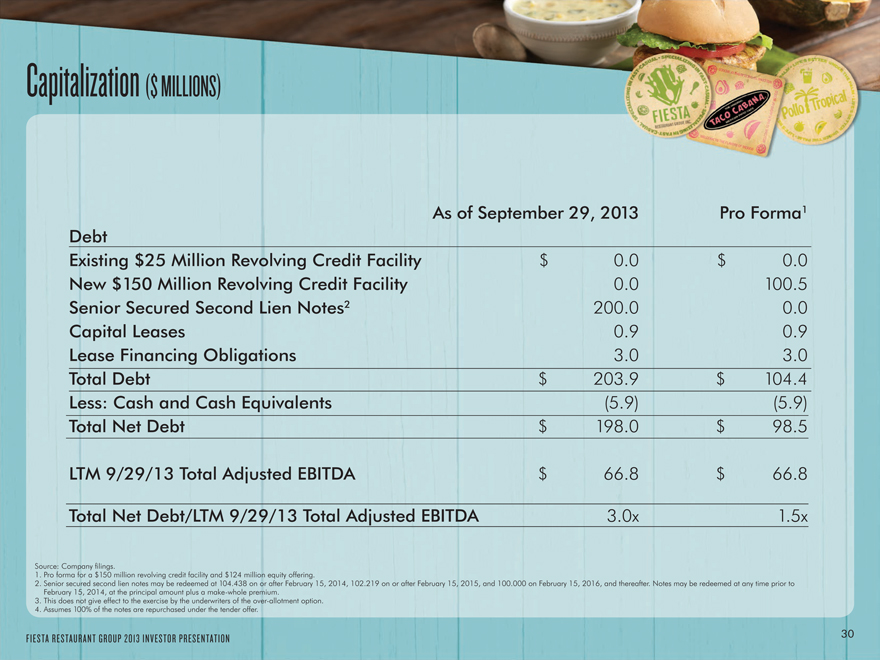
Capitalization ($ MILLIONS)
As of September 29, 2013 Pro Forma1 Debt Existing $25 Million Revolving Credit Facility $ 0.0 $ 0.0 New $150 Million Revolving Credit Facility 0.0 100.5 Senior Secured Second Lien Notes2 200.0 0.0 Capital Leases 0.9 0.9 Lease Financing Obligations 3.0 3.0
Total Debt $ 203.9 $ 104.4
Less: Cash and Cash Equivalents (5.9) (5.9) Total Net Debt $ 198.0 $ 98.5
LTM 9/29/13 Total Adjusted EBITDA $ 66.8 $ 66.8
Total Net Debt/LTM 9/29/13 Total Adjusted EBITDA 3.0x 1.5x
Source: Company filings.
1. Pro forma for a $150 million revolving credit facility and $124 million equity offering.
2. Senior secured second lien notes may be redeemed at 104.438 on or after February 15, 2014, 102.219 on or after February 15, 2015, and 100.000 on February 15, 2016, and thereafter. Notes may be redeemed at any time prior to February 15, 2014, at the principal amount plus a make-whole premium.
3. This does not give effect to the exercise by the underwriters of the over-allotment option.
4. Assumes 100% of the notes are repurchased under the tender offer.
FIESTA RESTAURANT GROUP 2013 INVESTOR PRESENTATION
30
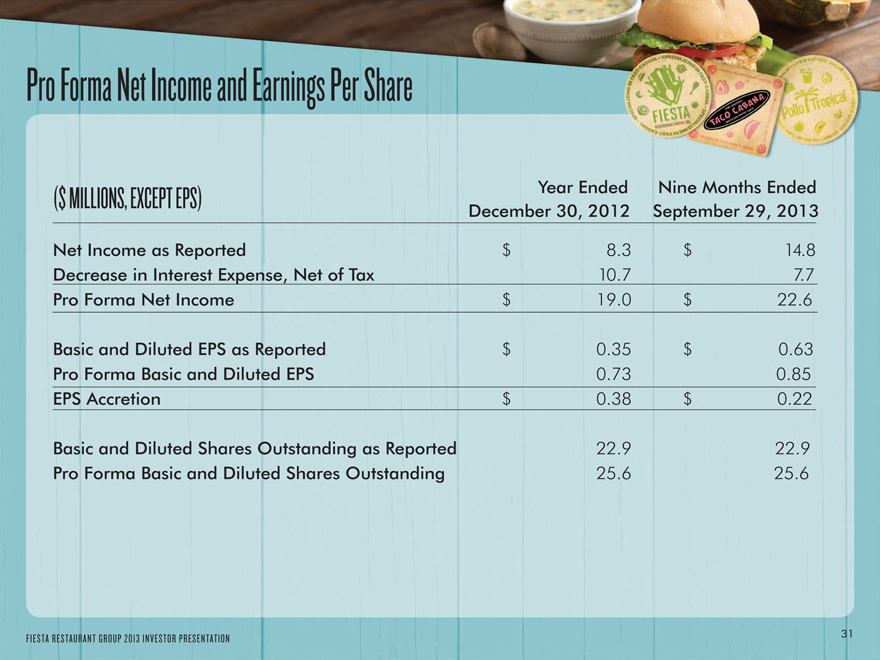
Pro Forma Net Income and Earnings Per Share
Year Ended Nine Months Ended
($ MILLIONS, EXCEPT EPS)
December 30, 2012 September 29, 2013
Net Income as Reported $ 8.3 $ 14.8 Decrease in Interest Expense, Net of Tax 10.7 7.7 Pro Forma Net Income $ 19.0 $ 22.6
Basic and Diluted EPS as Reported $ 0.35 $ 0.63 Pro Forma Basic and Diluted EPS 0.73 0.85 EPS Accretion $ 0.38 $ 0.22
Basic and Diluted Shares Outstanding as Reported 22.9 22.9 Pro Forma Basic and Diluted Shares Outstanding 25.6 25.6
FIE STA R E S TA U R A N T G R O U P 2 0 1 3 I N V E S TO R P R E S E N TAT I O N
31
Appendix
32
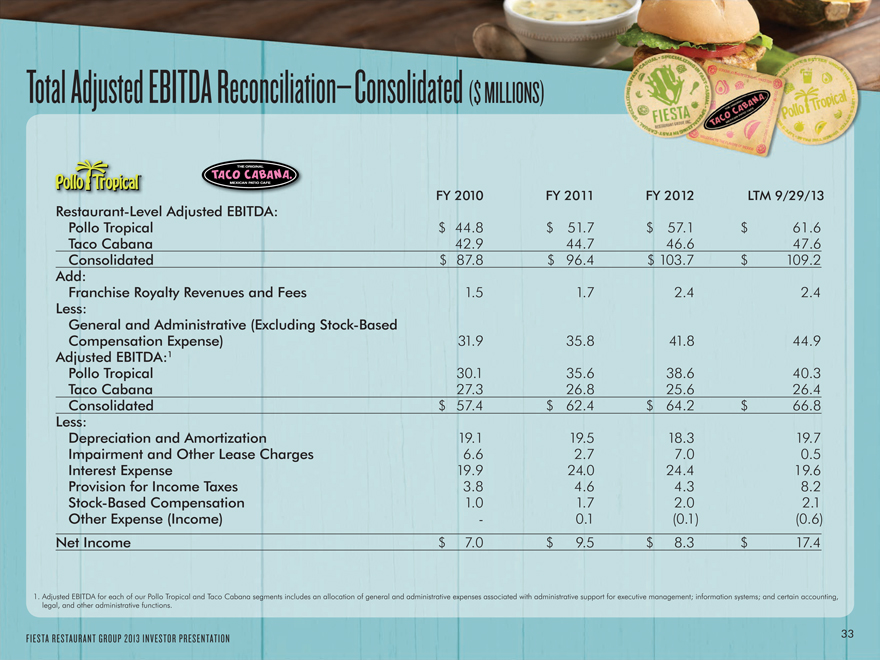
Total Adjusted EBITDA Reconciliation–Consolidated ($ MILLIONS)
FY 2010 FY 2011 FY 2012 LTM 9/29/13
Restaurant-Level Adjusted EBITDA:
Pollo Tropical $ 44.8 $ 51.7 $ 57.1 $ 61.6 Taco Cabana 42.9 44.7 46.6 47.6 Consolidated $ 87.8 $ 96.4 $ 103.7 $ 109.2
Add:
Franchise Royalty Revenues and Fees 1.5 1.7 2.4 2.4 Less: General and Administrative (Excluding Stock-Based Compensation Expense) 31.9 35.8 41.8 44.9 Adjusted EBITDA:1
Pollo Tropical 30.1 35.6 38.6 40.3 Taco Cabana 27.3 26.8 25.6 26.4 Consolidated $ 57.4 $ 62.4 $ 64.2 $ 66.8
Less:
Depreciation and Amortization 19.1 19.5 18.3 19.7 Impairment and Other Lease Charges 6.6 2.7 7.0 0.5
Interest Expense 19.9 24.0 24.4 19.6
Provision for Income Taxes 3.8 4.6 4.3 8.2 Stock-Based Compensation 1.0 1.7 2.0 2.1 Other Expense (Income) — 0.1 (0.1) (0.6)
Net Income $ 7.0 $ 9.5 $ 8.3 $ 17.4
1. Adjusted EBITDA for each of our Pollo Tropical and Taco Cabana segments includes an allocation of general and administrative expenses associated with administrative support for executive management; information systems; and certain accounting, legal, and other administrative functions.
FIE STA R E S TA U R A N T G R O U P 2 0 1 3 I N V E S TO R P R E S E N TAT I O N
33
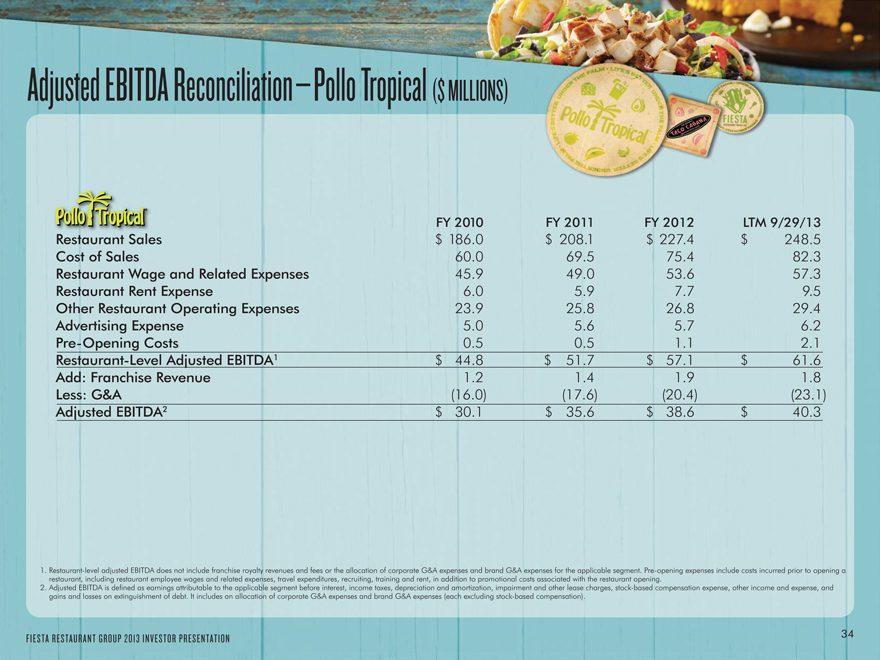
Adjusted EBITDA Reconciliation–Pollo Tropical ($ MILLIONS)
FY 2010 FY 2011 FY 2012 LTM 9/29/13
Restaurant Sales $ 186.0 $ 208.1 $ 227.4 $ 248.5 Cost of Sales 60.0 69.5 75.4 82.3
Restaurant Wage and Related Expenses 45.9 49.0 53.6 57.3 Restaurant Rent Expense 6.0 5.9 7.7 9.5 Other Restaurant Operating Expenses 23.9 25.8 26.8 29.4 Advertising Expense 5.0 5.6 5.7 6.2 Pre-Opening Costs 0.5 0.5 1.1 2.1
Restaurant-Level Adjusted EBITDA1 $ 44.8 $ 51.7 $ 57.1 $ 61.6
Add: Franchise Revenue 1.2 1.4 1.9 1.8
Less: G&A (16.0) (17.6) (20.4) (23.1) Adjusted EBITDA2 $ 30.1 $ 35.6 $ 38.6 $ 40.3
1. Restaurant-level adjusted EBITDA does not include franchise royalty revenues and fees or the allocation of corporate G&A expenses and brand G&A expenses for the applicable segment. Pre-opening expenses include costs incurred prior to opening a restaurant, including restaurant employee wages and related expenses, travel expenditures, recruiting, training and rent, in addition to promotional costs associated with the restaurant opening.
2. Adjusted EBITDA is defined as earnings attributable to the applicable segment before interest, income taxes, depreciation and amortization, impairment and other lease charges, stock-based compensation expense, other income and expense, and gains and losses on extinguishment of debt. It includes an allocation of corporate G&A expenses and brand G&A expenses (each excluding stock-based compensation).
FIE STA R E S TA U R A N T G R O U P 2 0 1 3 I N V E S TO R P R E S E N TAT I O N
34
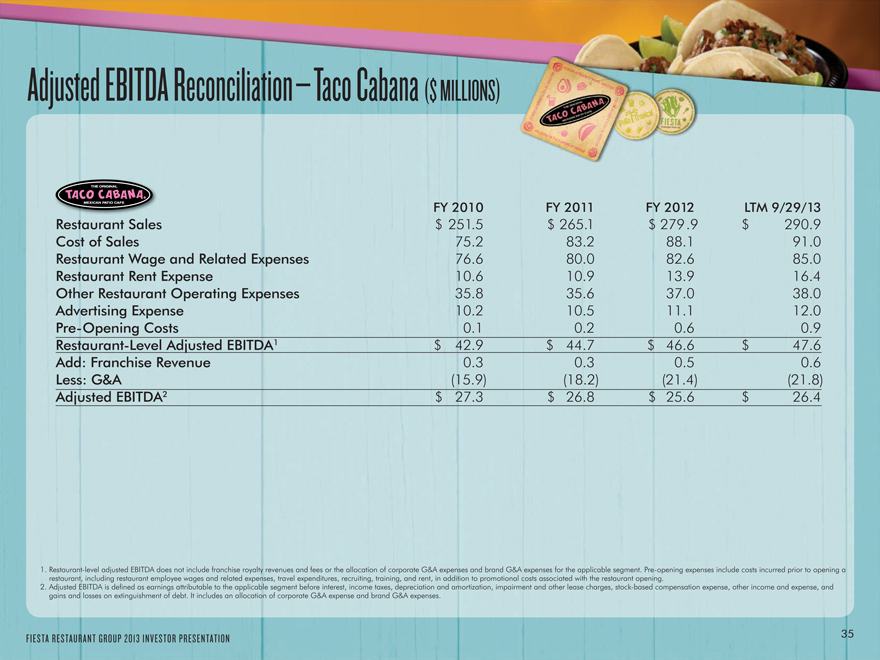
Adjusted EBITDA Reconciliation–Taco Cabana ($ MILLIONS)
FY 2010 FY 2011 FY 2012 LTM 9/29/13
Restaurant Sales $ 251.5 $ 265.1 $ 279.9 $ 290.9 Cost of Sales 75.2 83.2 88.1 91.0
Restaurant Wage and Related Expenses 76.6 80.0 82.6 85.0 Restaurant Rent Expense 10.6 10.9 13.9 16.4 Other Restaurant Operating Expenses 35.8 35.6 37.0 38.0
Advertising Expense 10.2 10.5 11.1 12.0
Pre-Opening Costs 0.1 0.2 0.6 0.9
Restaurant-Level Adjusted EBITDA1 $ 42.9 $ 44.7 $ 46.6 $ 47.6
Add: Franchise Revenue 0.3 0.3 0.5 0.6
Less: G&A (15.9) (18.2) (21.4) (21.8) Adjusted EBITDA2 $ 27.3 $ 26.8 $ 25.6 $ 26.4
1. Restaurant-level adjusted EBITDA does not include franchise royalty revenues and fees or the allocation of corporate G&A expenses and brand G&A expenses for the applicable segment. Pre-opening expenses include costs incurred prior to opening a restaurant, including restaurant employee wages and related expenses, travel expenditures, recruiting, training, and rent, in addition to promotional costs associated with the restaurant opening.
2. Adjusted EBITDA is defined as earnings attributable to the applicable segment before interest, income taxes, depreciation and amortization, impairment and other lease charges, stock-based compensation expense, other income and expense, and gains and losses on extinguishment of debt. It includes an allocation of corporate G&A expense and brand G&A expenses.
FIESTA RESTAURANT GROUP 2013 INVESTOR PRESENTATION
35
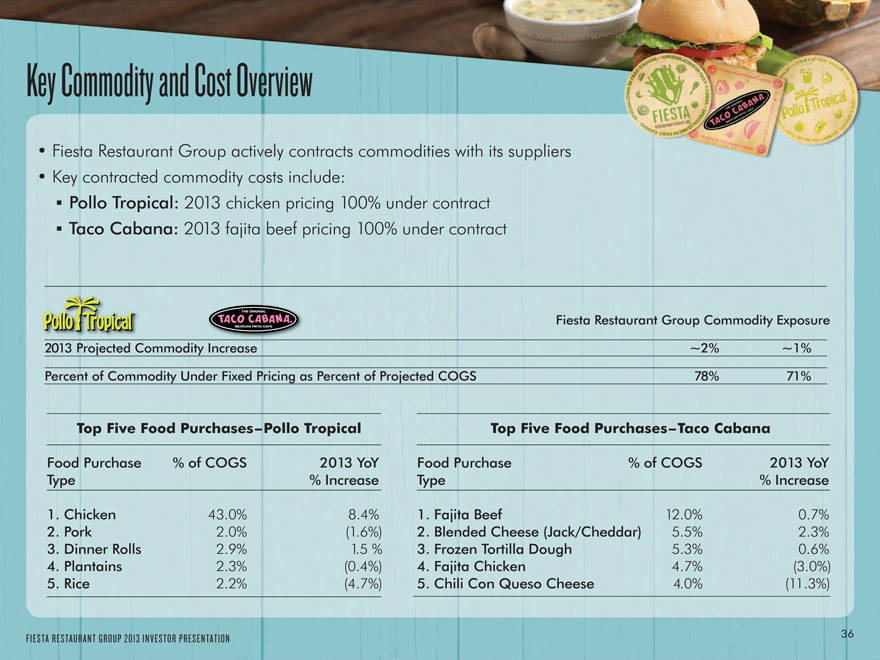
Key Commodity and Cost Overview
Fiesta Restaurant Group actively contracts commodities with its suppliers
Key contracted commodity costs include:
Pollo Tropical: 2013 chicken pricing 100% under contract Taco Cabana: 2013 fajita beef pricing 100% under contract
Fiesta Restaurant Group Commodity Exposure 2013 Projected Commodity Increase ~2% ~1% Percent of Commodity Under Fixed Pricing as Percent of Projected COGS 78% 71%
Top Five Food Purchases–Pollo Tropical Top Five Food Purchases–Taco Cabana
Food Purchase % of COGS 2013 YoY Food Purchase % of COGS 2013 YoY Type % Increase Type % Increase
1. Chicken 43.0% 8.4% 1. Fajita Beef 12.0% 0.7%
2. Pork 2.0% (1.6%) 2. Blended Cheese (Jack/Cheddar) 5.5% 2.3%
3. Dinner Rolls 2.9% 1.5 % 3. Frozen Tortilla Dough 5.3% 0.6%
4. Plantains 2.3% (0.4%) 4. Fajita Chicken 4.7% (3.0%)
5. Rice 2.2% (4.7%) 5. Chili Con Queso Cheese 4.0% (11.3%)
FIE STA R E S TA U R A N T G R O U P 2 0 1 3 I N V E S TO R P R E S E N TAT I O N
36
Use of Non-GAAP Financial Measures
Adjusted EBITDA, adjusted EBITDA margin, restaurant-level adjusted EBITDA, and restaurant-level adjusted EBITDA margin for both of our brands and total adjusted EBITDA, total adjusted EBITDA margin total restaurant-level adjusted EBITDA, and total restaurant-level adjusted EBITDA margin are all non-GAAP financial measures.
Management believes that such financial measures, when viewed with our results of operations calculated in accordance with GAAP and our reconciliation of total restaurant-level adjusted EBITDA (and restaurant-level adjusted EBITDA for each of our Pollo Tropical and Taco Cabana segments) and total adjusted EBITDA (and adjusted EBITDA for each of our Pollo Tropical and Taco Cabana segments) to net income (i) provide useful information about our operating performance and period-over-period growth (including at the restaurant level), (ii) provide additional information that is useful for evaluating the operating performance of our business, and (iii) permit investors to gain an understanding of the factors and trends affecting our ongoing earnings, from which capital investments are made and debt is serviced. However, such measures are not measures of financial performance or liquidity under GAAP and, accordingly, should not be considered as alternatives to net income or cash flow from operating activities as indicators of operating performance or liquidity. Also these measures may not be comparable to similarly titled captions of other companies.
The unaudited financial data for the 12 months ended September 29, 2013, has been derived by adding our statement of operations and other financial data for our fiscal year ended December 30, 2012, and for the nine months ended September 29, 2013, and deducts such statement of operations data and other financial data for the nine months ended September 30, 2012.
FIESTA RESTAURANT GROUP 2013 INVESTOR PRESENTATION
37