 Restoring the Health to Commonwealth Presentation to CWH Shareholders February 26, 2013 Exhibit 3 |
 2 Disclaimer This presentation does not constitute either an offer to sell or a solicitation of an offer to buy any interest in any fund associated with Corvex Management LP (“Corvex”) or Related Fund Management, LLC (“Related”). Any such offer would only be made at the time a qualified offeree receives a confidential offering memorandum and related subscription documentation. The information in this presentation is based on publicly available information about CommonWealth REIT (the “Company”), which has not been independently verified by Corvex or Related. This document includes certain forward-looking statements, estimates and projections prepared with respect to, among other things, general economic and market conditions, changes in management, changes in the composition of the Company’s Board of Trustees, actions of the Company and its subsidiaries or competitors, and the ability to implement business strategies and plans and pursue business opportunities. Such forward-looking statements, estimates, and projections reflect various assumptions concerning anticipated results that are inherently subject to significant uncertainties and contingencies and have been included solely for illustrative purposes, including those risks and uncertainties detailed in the continuous disclosure and other filings of the Company, copies of which are available on the U.S. Securities and Exchange Commission website (“EDGAR”) at www.sec.gov/edgar. No representations, express or implied, are made as to the accuracy or completeness of such forward-looking statements, estimates or projections or with respect to any other materials herein. Corvex and Related may buy, sell, cover or otherwise change the form of their investment in the Company for any reason at any time, without notice, and there can be no assurances that they will take any of the actions described in this document. Corvex and Related disclaim any duty to provide any updates or changes to the analyses contained in this document. Shareholders and others should conduct their own independent investigation and analysis of the Company. Except where otherwise indicated, the information in this document speaks only as of the date set forth on the cover page. |
 3 Table of Contents I. Executive Summary 4 II. History of Underperformance 18 III. Valuation Summary 29 IV. Related / Corvex Recommendations 39 V. Appendix 51 |
 4 Executive Summary |
 5 Executive Summary Introduction Company trades at 60% discount (1) to Related/Corvex estimate of $40 NAV per share based on property-by-property valuation analysis (representing 153%+ upside) – 70%+ discount to Related/Corvex target stock price of $55+ at 12/31/14 (representing 247%+ upside) achieved through internalization of management, improved operating performance, shareholder friendly capital allocation, and multiple expansion Externally managed structure skews incentives, reduces CWH cash flow through excessive fees, destroys investor confidence, and impairs valuation multiple (off already depressed earnings) – Management fees are primarily based on gross historical cost basis and incentivize growth through acquisitions regardless of financial returns or strategic rationale – $395 million of fees paid out from 2007-2012, nearly 30% of market cap – In contrast, management and board own less than 1% of CWH stock Poor corporate governance with misaligned incentives, classified board, complicated charter, poison pill, and limited independent trustees Extended track record of underperformance on key operating, return, and valuation metrics – However, diversified asset base with highly saleable properties Commonwealth REIT (“CWH” or the “Company”) represents a collection of hard assets which are massively undervalued today due to the Company’s externally advised management structure and track record of underperformance (1) Based on CWH closing price of $15.85 on February 25, 2013. |
 6 Executive Summary Introduction (continued) We believe CWH must take immediate steps to close the massive discount between its public market value of $15.85 per share and Related/Corvex NAV per share of $40 – Terminate plan to raise $450 million of equity at massive discount (see next page) – Internalize management structure, adopt a market cost structure, and align management compensation with shareholder returns – Replace its existing Charter and Bylaws with new ones which conform to ISS and Glass Lewis best practices – Use excess cash flow and proceeds from asset sales to buy back stock or delever until the Company’s stock price exceeds its NAV – We derive a target CWH stock price of $55+ as of 12/31/14 through these actions If CWH is unable or unwilling to do so, the board should be removed and replaced with leaders who can and will make the necessary changes |
 7 Executive Summary Proposed Equity Offering On the morning of February 25, 2013, Company announced a 27.0 million share follow-on offering (31.1 million shares including over-allotment option) – Would represent a 32% increase in share count (37% with over-allotment option) As a backdrop, CWH stock has materially underperformed over last year and multi-year time periods – After a recent bounce in the stock price caused largely by Related / Corvex stock purchases, Company apparently decided to pursue dilutive equity offering – At a recent price of $15.85, CWH is apparently seeking to sell equity at a 57% discount to book value of $36.82 (2) CWH’s proposed use of proceeds for equity offering at massive discount is to repay investment grade debt trading at prices ranging from 102% to 111% of par As the largest shareholders of CWH (1) , we call on management to immediately stop the equity offering and engage with us in discussions Recently proposed equity offering serves as latest example of poor management, skewed incentives, and unacceptable capital allocation (1) Per Bloomberg 13F filings as of 12/31/12. (2) Book value calculated using SIR and GOV market value as of 2/25/13. If the Board fails to adequately respond, Corvex and Related are prepared to seek the removal of the Board so that it may be replaced with five truly independent trustees. Corvex and Related would also be prepared to acquire all the outstanding shares at a significant premium to the current market value |
 8 Executive Summary Company Overview Commonwealth REIT is a REIT which owns central business district (CBD) office buildings, suburban office properties, and industrial properties in the U.S. and Australia Market capitalization of $1.3 billion and TEV of $4.9 billion (1) – Book value of $36.82 per share as of 12/31/12 (2) – $549.5 million of Stabilized NOI (3) and $487.3 million of LQA GAAP NOI as of 4Q12 (4) Company’s portfolio consists of 452 wholly owned properties (5) across the U.S. and Australia with a gross cost basis of approximately $7.0 billion – CWH generated 45%, 35%, and 20% of 3Q12 NOI from CBD, suburban, and industrial properties, respectively (5) – Diversified tenant mix, with no tenant accounting for more than 2% of NOI CWH is externally advised by REIT Management & Research LLC (“RMR”) – $77.3 million of business and property management fees paid during 2012 (7.5% of 2012 rental income and 5.8% of CWH market cap) Company also owns 56% of Select Income REIT (SIR) and 18% of Government Properties Income Trust (GOV), two REITs which were spun out of the predecessor company to CWH (1) Based on CWH closing price of $15.85 on February 25, 2013. TEV calculated using SIR and GOV market value as of 2/25/13. (2) Book value calculated using SIR and GOV market value as of 2/25/13. (3) Stabilized NOI per Related / Corvex property analyses. See pg. 35 for additional detail on Stabilized NOI. (4) Represents LQA GAAP NOI from wholly owned properties as of 4Q12, per CWH Supplemental. (5) Including properties moved to discontinued operations during 4Q12. |
 9 Executive Summary Related & Corvex Overview Related and Corvex collectively beneficially own 8.2 million shares of CWH (9.8% of shares outstanding) Related Companies – Related Fund Management, LLC is an affiliate of Related Companies (“Related”), one of the most prominent privately-owned real estate firms in the United States – Formed 40 years ago, Related is a fully-integrated, highly diversified industry leader with experience in virtually every aspect of development, acquisitions, management, finance, marketing and sales – Related’s existing portfolio of real estate assets, valued at over $15 billion, is made up of best-in-class mixed-use, residential, retail, office and affordable properties Corvex Management – Value-based investing across the capital structure in situations with clearly identifiable catalysts – Active investing to create asymmetric risk/reward opportunities – 13D investments since inception include AboveNet (acquired by Zayo in March 2012), Corrections Corporation of America (elected REIT status in February 2013), Ralcorp (acquired by ConAgra in November 2012), and ADT (Keith Meister joined Board in December 2012) |
 10 Executive Summary Investment Thesis CWH represents a collection of hard assets which are massively undervalued today due to the Company’s externally advised management structure and track record of underperformance Assets with cost basis of $7.0 billion and Related/Corvex NAV estimate of $40 per share, trapped inside an entity which structurally fails shareholders, resulting in enterprise value of only $4.9 billion and stock price of $15.85 Externally advised structure distorts management incentives, reduces CWH cash flow through excessive fees, destroys investor confidence, and impairs valuation multiple (off already depressed earnings) – Management fees are primarily based on gross historical cost basis and incentivize growth through acquisitions regardless of financial returns or strategic rationale – Over the last 3 years, CWH has paid out $209 million of management fees to RMR, while CWH’s market cap has declined by $647 million (1) Management and Board collectively own only 630,000 shares of CWH (0.8% of the Company) but 100% of RMR – We estimate difference between management fees and market cost structure alone represents a 15%+ improvement in CWH equity value (before multiple expansion) – Company trades at nearly 40% discount to peers on unlevered cap rate basis (1) Based on CWH closing price of $15.85 on February 25, 2013. Change in market capitalization excludes impact of CWH follow-on offerings during the last three years and SIR IPO and follow-on offering. |
 11 Executive Summary Investment Thesis (continued) – However, disconnect between CWH asset fundamentals and valuation, with diversified tenant mix, staggered lease expirations, and highly saleable properties 4 of CWH’s top 5 cities ranked in top 40 office investment markets (1) Poor corporate governance with misaligned incentives, classified board, complicated charter, poison pill, and limited independent trustees – “Independent” Trustees appear conflicted by common sense definition – Poor ISS and Glass Lewis corporate governance scores – Over $2 billion of CWH related party transactions in the last 5 years Management has track record of absolute and relative underperformance on basically every metric, over any relevant time period – Negative 8% three year FFO per share CAGR – 12-28% annualized stock price underperformance over 1, 2, and 3 year time frames Poor investor disclosure and investor communications – Unclear and inconsistent strategy – No published asset list Given its misaligned incentives and continued underperformance, management has lost the credibility of the investment community (1) Per Marcus & Millichap’s 2012 National Office Report. |
 12 Executive Summary Multiple Ways to Create Value We believe CWH must take immediate steps to close the massive discount between its public market value and NAV; if CWH is unable or unwilling to do so, the board should be removed and replaced with leaders who can and will make the necessary changes We call on CWH to immediately: – Terminate plan to raise $450 million of equity at massive discount – Internalize its management structure, adopt a market cost structure, and align management compensation with shareholder returns – Replace its existing Declaration of Trust and Bylaws with new ones which conform to ISS and Glass Lewis best practices – Appoint three new independent trustees – Cease all related party asset sales – Cease all acquisition and development activity until CWH’s stock price exceeds its NAV; no more dilutive equity offerings – Use excess cash flow and proceeds from asset sales to buy back stock or delever until the Company’s stock price exceeds its NAV – Manage the Company in ways which maximize long-term CWH shareholder value, not fees paid to RMR |
 13 Executive Summary Multiple Ways to Create Value (continued) If CWH disagrees with our proposal or fails to respond within 30 days, we plan to seek to remove the Board and replace it with 5 independent trustees – Requires action by written consent and 2/3 shareholder vote, which we believe is achievable – New independent board would then pursue same strategy we recommend on previous page Significant financial leverage enhances equity returns once CWH is properly structured, faith in operations and capital allocation is restored, and the Company’s assets are no longer severely mispriced – As summarized on the following pages, Related/Corvex estimate an NAV of $40 per share, and a target stock price of $55+ at 12/31/14 – Book value of $36.82 per share (1) as of 12/31/12, reaffirmed by Board’s independent compensation committee each time fees are paid to RMR (1) Book value calculated using SIR and GOV market value as of 2/25/13. |
 14 Executive Summary Valuation Summary We estimate an NAV per share of $40 based on bottom-up property-by-property analysis and a target price of $55+ at 12/31/14 NAV represents estimate of value today if market overhangs from external management, poor corporate governance, and extended underperformance are removed NAV can also be thought of as liquidation value of the current portfolio, before benefit from any other value enhancing actions (which we believe are plentiful) We value CWH at a stock price of $55 or higher at 12/31/14 through internalization of management, operational turnaround, improved capital allocation, and multiple expansion Stock Related / Corvex Price NAV Stock Price $15.85 $40.07 % Change -- 152.8% Cap Rate of Stabilized NOI (1) 11.18% 7.91% Cap Rate of LQA GAAP NOI (2) 9.92% 7.02% Price / LQA Normalized FFO 5.9x 14.9x Price / GAAP Book Value per Share 0.43x 1.09x Price / Square Foot (3) $89 $125 Dividend Yield @ Current $0.25 / Qtr 6.31% 2.50% (1) Stabilized NOI assumes stabilization costs of approximately $141 million. (2) Wholly-owned LQA GAAP NOI of $487.3 million per CWH 4Q12 Supplemental. (3) Wholly-owned square feet per Company filings and Related / Corvex analysis. |
 15 Executive Summary Valuation Summary (continued) While some metrics and peers are more relevant than others, it is clear that CWH trades at an enormous discount to comps across a variety of key measures (1) Office Comps group for Cap Rate, FFO, AFFO, and Price / Square Foot based on PDM, HIW, CLI, BDN, and PKY. (2) Office Comps group for LQA EBITDA and Dividend Yield per Citi Research. Office Implied Comps CWH % Current Avg. Price Change Cap Rate of Stabilized NOI 11.2% 7.2% $48.20 204.1% LQA EBITDA Multiple 10.6x 17.5x $54.32 242.7% Price / LQA Normalized FFO 5.9x 11.8x $31.72 100.1% Price / Square Foot $89 $175 $72.79 359.2% Dividend Yield @ Current $0.25 / Qtr 6.31% 3.30% $30.30 91.2% Stock Price (Current / Avg.) $15.85 $47.46 |
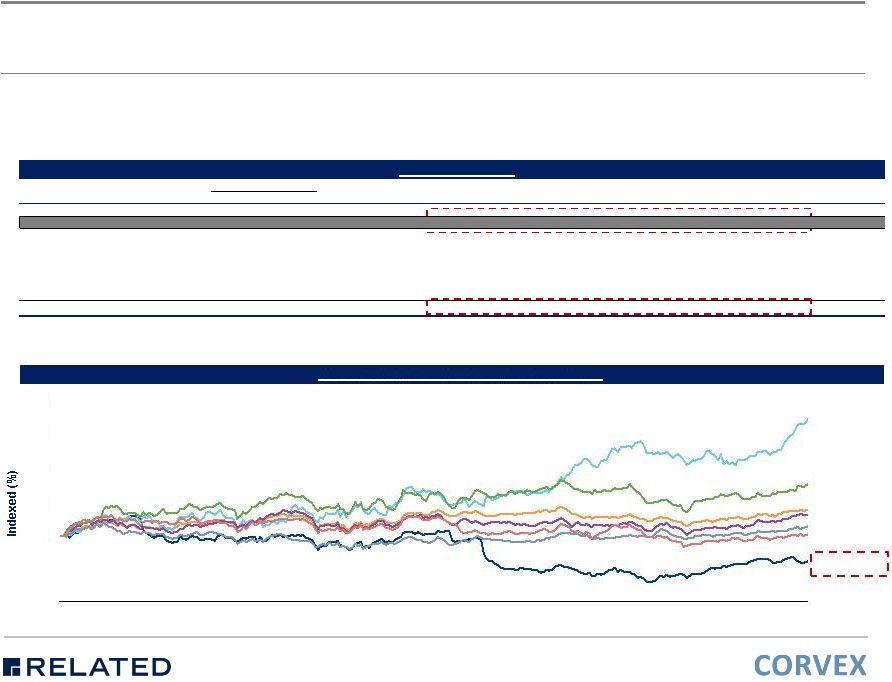 16 Executive Summary Summary Public Comparables (1) Reflects recurring FFO per share for the year ended, December 31, 2012. CWH trades at a significant discount to peers on all key measures BDN PKY HIW CWH CLI RMZ PDM (1) Market Comparables ($ in millions, except per share amounts) As of 1/15/13 Equity Enterprise Implied Ent. Value G&A / Equity Net Debt / Total Debt / LTM FFO LTM AFFO Credit Ratings Ticker Company Name Price Div. Yield Market Cap. Value Cap Rate / SF Market Cap. Ent. Value Gross Assets Multiple Multiple Moodys / S&P CWH CommonWealth REIT $15.85 6.3% $1,338 $4,914 9.9% $88.70 3.9% 76.3% 44.1% 4.7x 10.1x Baa3 / BBB- PDM Piedmont Office Realty Trust Inc. $18.70 4.3% $3,133 $4,538 6.5% $221.39 0.7% 30.9% 27.6% 13.9x 23.1x NR / BBB HIW Highwoods Properties Inc. 34.77 4.9% 2,933 4,869 7.3% 164.02 1.3% 39.2% 44.8% 12.7x NA NR / BBB CLI Mack-Cali Realty Corp. 26.51 6.8% 2,656 4,802 8.3% 151.54 1.8% 44.7% 36.4% 9.9x NA NR / BBB BDN Brandywine Realty Trust 12.76 4.7% 1,867 4,576 7.5% 192.81 1.6% 55.1% 47.3% 11.0x 16.0x NR / BBB PKY Parkway Properties Inc. 15.83 2.8% 889 1,750 6.7% 147.66 1.8% 41.5% 44.8% 11.4x 20.6x NR / NR Average $21.71 4.7% $2,296 $4,107 7.2% $174.83 1.4% 42.3% 40.2% 11.8x 19.9x Indexed Price Performance (LTM 1/15/13 Total Return) 1/15/12 3/28/12 6/8/12 8/21/12 11/2/12 1/15/13 60 80 100 120 140 160 180 (15.0%) 16.1% 71.7% 13.1% 32.1% 6.4% 0.8% - - |
 17 Executive Summary Work Completed to Date Valuation – Property-level valuation and due diligence of 384 CWH properties, representing approximately 90% of the Company’s wholly owned assets by square footage and historical cost basis Work included analysis of market rental, vacancy and cap rate trends, stabilization costs, capital expenditures, comparable transactions, meetings and calls with local brokers, and site visits – Analysis of historical operating performance, total shareholder return, valuation, and other metrics as compared to peers Corporate Governance – Retained Gibson Dunn as corporate counsel, Ober Kaler as Maryland counsel, Ice Miller as Indiana insurance counsel, and D.F. King as proxy advisor – Review of CWH Declaration of Trust, Bylaws, Proxy, and SEC filings Review of Maryland corporate law and Indiana insurance regulations as applicable – Review of CWH bond indentures and credit agreements – Review of ISS and Glass Lewis proxy advisory reports |
 18 History of Underperformance |
 19 History of Underperformance CWH has performed poorly in absolute terms and underperformed its peers on almost any metric over any relevant time period Valuation Stock price performance and total shareholder return NOI, EBITDA, FFO, and CAD / share growth Acquisitions and return on investment Cost structure Corporate governance |
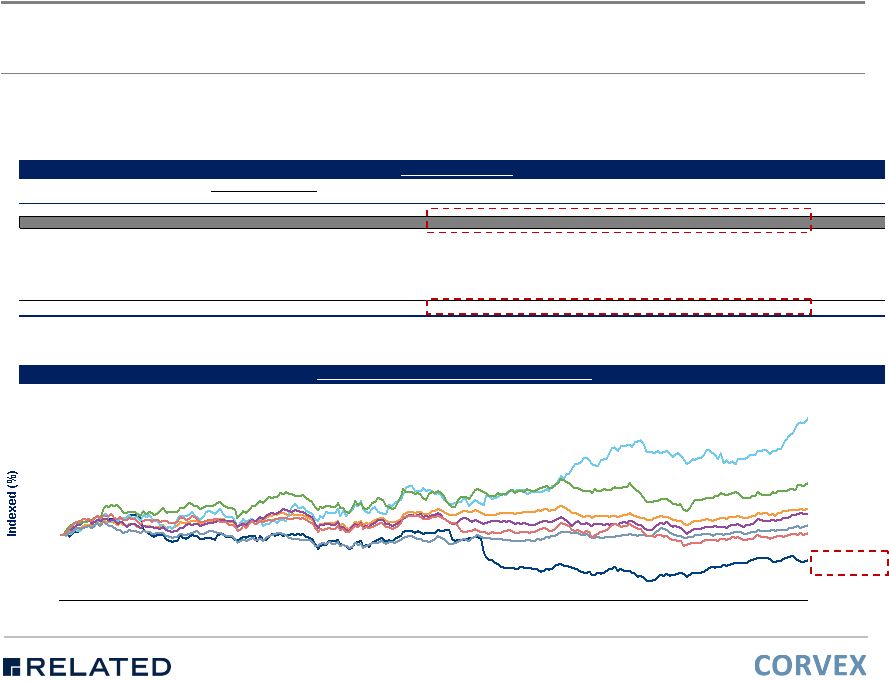 ($ in millions, except per share amounts) As of 1/15/13 Equity Enterprise Implied Ent. Value G&A / Equity Net Debt / Total Debt / LTM FFO LTM AFFO Credit Ratings Ticker Company Name Price Div. Yield Market Cap. Value Cap Rate / SF Market Cap. Ent. Value Gross Assets Multiple Multiple Moodys / S&P CWH CommonWealth REIT $15.85 6.3% $1,338 $4,914 9.9% $88.70 3.9% 76.3% 44.1% 4.7x 10.1x Baa3 / BBB- PDM Piedmont Office Realty Trust Inc. $18.70 4.3% $3,133 $4,538 6.5% $221.39 0.7% 30.9% 27.6% 13.9x 23.1x NR / BBB HIW Highwoods Properties Inc. 34.77 4.9% 2,933 4,869 7.3% 164.02 1.3% 39.2% 44.8% 12.7x NA NR / BBB- CLI Mack-Cali Realty Corp. 26.51 6.8% 2,656 4,802 8.3% 151.54 1.8% 44.7% 36.4% 9.9x NA NR / BBB BDN Brandywine Realty Trust 12.76 4.7% 1,867 4,576 7.5% 192.81 1.6% 55.1% 47.3% 11.0x 16.0x NR / BBB- PKY Parkway Properties Inc. 15.83 2.8% 889 1,750 6.7% 147.66 1.8% 41.5% 44.8% 11.4x 20.6x NR / NR Average $21.71 4.7% $2,296 $4,107 7.2% $174.83 1.4% 42.3% 40.2% 11.8x 19.9x 20 History of Underperformance Summary Public Comparables (1) Reflects recurring FFO per share for the year ended, December 31, 2012. CWH trades at a significant discount to peers on all key measures BDN PKY HIW CWH CLI RMZ PDM (1) 1/15/12 3/28/12 6/8/12 8/21/12 11/2/12 1/15/13 60 80 100 120 140 160 180 (15.0%) 16.1% 71.7% 13.1% 32.1% 6.4% 0.8% Market Comparables Indexed Price Performance (LTM 1/15/13 Total Return) |
 ($ in millions) For the Fiscal Year Ending December 31, 2010 2011 2012 Total Return (if held since) (1) (21.3%) (24.3%) 6.6% SF Owned per Share (% growth) (15.9%) (5.2%) (0.6%) NOI per Share (% growth) (19.1%) (4.2%) 16.1% EBITDA per Share (% growth) (22.1%) (4.7%) (27.2%) FFO per Share (% growth) (13.8%) (9.4%) 0.0% CAD per Share (% growth) (23.7%) (26.5%) (16.9%) Fees Paid to RMR $62.2 $69.5 $77.3 % growth 3.4% 11.7% 11.2% (1) Total return includes dividends paid. Total return assumes stock is held since January 1st of the specified year through January 15th, 2013. 21 History of Underperformance Operating Performance Value accruing to RMR, not shareholders Poor performance on key financial metrics, while fees paid to RMR continue to grow |
 22 History of Underperformance Cost Structure Comparison At a median peer operating expense level of 40.0% of rental income, CWH property operating expenses could be reduced by $32 million CWH’s cost structure is worse than peers despite greater scale (1) Analysis excludes PKY, which offers fee-based real estate services through wholly owned subsidiaries of the company, which in total manage and/or lease approximately 10.8 million square feet for third-party owners at January 1, 2013 (compared to a property portfolio of 11.9 million square feet). Peer : Peer CWH PDM HIW CLI BDN Median (1) less CWH LQA Rental Income / Revenue $1,047 $544 $536 $665 $570 LQA Operating Expenses $450 $220 $197 $269 $225 % of Rental Income 43.0% 40.5% 36.8% 40.4% 39.5% 40.0% (3.1%) GAAP NOI $596 $324 $339 $396 $345 % Margin 57.0% 59.5% 63.2% 59.6% 60.5% 60.0% 3.1% LQA G&A $58 $21 $36 $50 $29 % of Rental Income 5.6% 3.8% 6.8% 7.6% 5.1% 5.9% 0.3% % of Gross Real Estate Assets 0.8% 0.5% 1.0% 0.9% 0.6% 0.7% (0.1%) % of Market Cap 3.9% 0.6% 1.2% 1.8% 1.5% 1.3% (2.5%) GAAP EBITDA $538 $303 $302 $346 $316 % Margin 51.4% 55.7% 56.4% 52.0% 55.5% 55.6% 4.2% |
 23 History of Underperformance Acquisitions/CapEx and Return on Investment Management continues to pursue growth acquisitions / development despite poor returns and significantly undervalued CWH stock due to skewed incentives created by RMR’s external management of the Company CWH has spent $2.7 billion on net acquisitions and capex (over 2x CWH’s entire market cap) since 2007, while book value per share has grown 2.4% cumulatively and 0.5% on an annualized basis (1) Book value calculated using SIR and GOV market value. 2012 Book value uses stock market prices as of 2/25/13. (2) Metric shown includes SIR. '07-'12 '07-'12 2007 2008 2009 2010 2011 2012 CAGR Cumulative Book Value (1) $2,198 $2,217 $2,259 $2,702 $2,816 $3,097 7.1% 40.9% Book Value per Share $36.11 $34.68 $35.66 $37.53 $33.24 $36.96 0.5% 2.4% Memo: Shares Outstanding 60.9 63.9 63.4 72.0 84.7 83.8 6.6% 37.6% Gross Real Estate Assets (2) $6,156 $6,242 $6,324 $6,357 $7,244 $7,829 4.9% 27.2% Cumulative Real estate acquisitions and improvements $423 $416 $665 $973 $868 $763 $4,109 Proceeds from sale of properties, net 4 334 212 604 264 10 1,428 Net Acquisitions/CapEx $419 $83 $453 $369 $604 $753 $2,681 % of Recent Market Cap 31.0% 6.1% 33.5% 27.3% 44.6% 55.6% 198.1% Total RMR Management Fees $59.7 $63.2 $62.6 $62.2 $69.5 $77.3 $395 % of Recent Market Cap 4.4% 4.7% 4.6% 4.6% 5.1% 5.7% 29.2% |
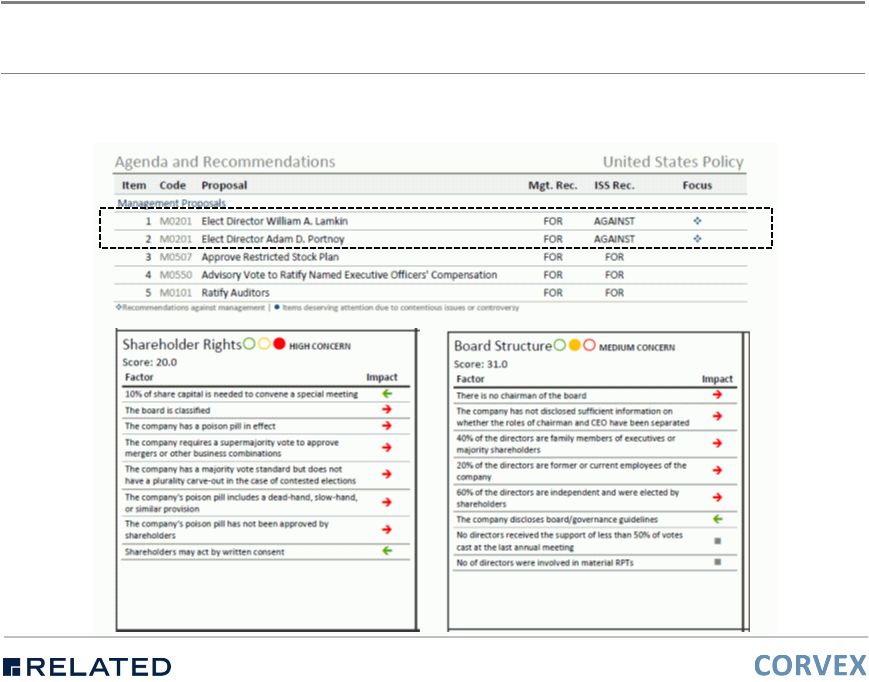 24 History of Underperformance Poor Corporate Governance ISS recommended voting against incumbent board members last year (per ISS Proxy Advisory Services report, April 25, 2012) |
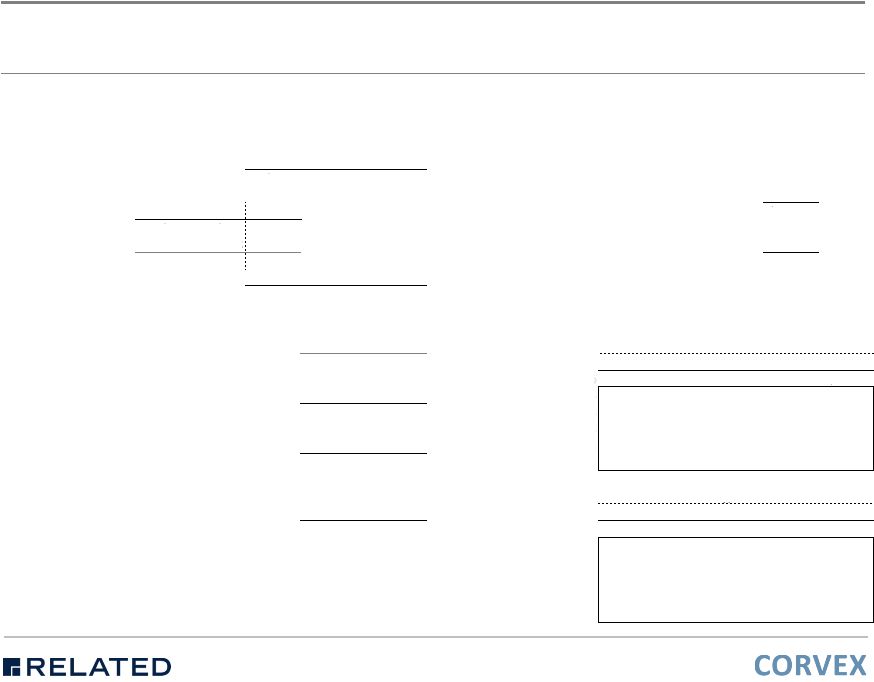
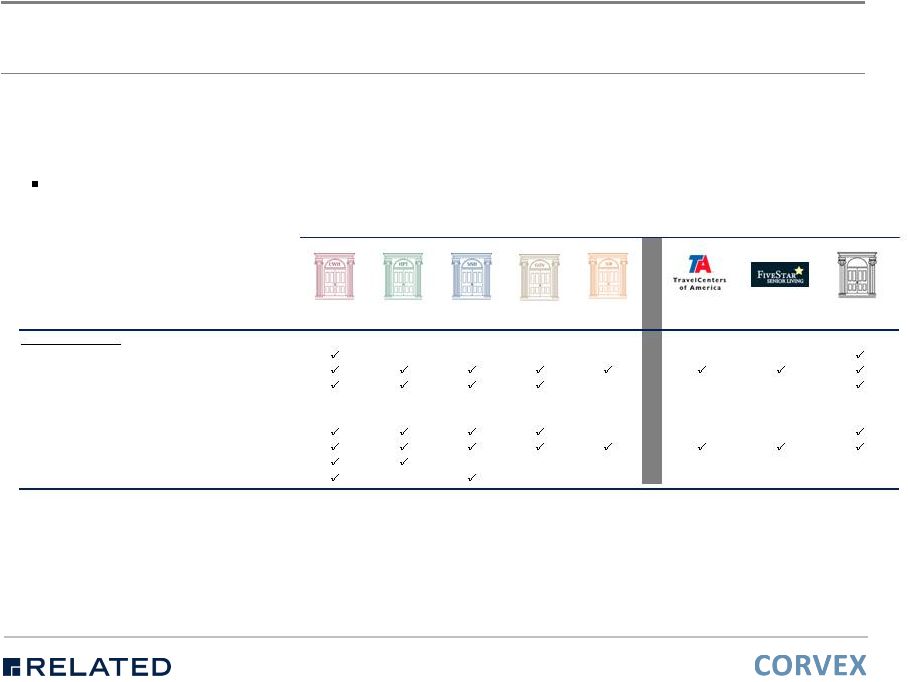 25 History of Underperformance Board of Trustees Significant overlap of board members across RMR entities, including “Independent” trustees Travel Centers Five Star RMR Real Estate Name Title CWH HPT SNH GOV SIR of America Senior Living Income Fund Senior Management: Adam D. Portnoy Vern D. Larkin Jennifer B. Clark Board of Directors: Adam D. Portnoy Barry D. Portnoy William A. Lamkin President & Managing Trustee Director of Internal Audit Secretary President & Managing Trustee Managing Trustee Partner at Ackrell Capital Founder & CEO of Turf Products Same Job, Different Company? “Independent” trustees appear to be far from independent Frederick N. Zeytoonjian |
 26 History of Underperformance Analyst Perspectives Management has lost the credibility of the analyst community Okay, okay. And then, Adam [Portnoy], we’re both fiduciaries to investors, so don’t take this personally and take it constructively please. But when I talk to investors about CommonWealth, the investment strategy, the balance sheet, the operations, there’s just zero investor confidence out there. The term that most people use is “uninvestable.” ” Stifel Nicholas: Q2 2012 Earnings Call, August 8, 2012 Well, Adam [Portnoy] I have to say this, you’ve spent a lot of time blaming the problems on others and I guess it worked well for someone yesterday who just got reelected, your leverage is up debt plus preferred is now over 80%, your G&A quarter over quarter went from $12.7 million to $14.6 million. You are on a $58 million run rate for G&A. You have concluded that greater than 50% of your assets are challenged and CommonWealth’s year-to-date performance is down 14.7% versus the RMZ which is up 11.2%. I don’t have any questions, thanks. ” Stifel Nicholas: Q3 2012 Earnings Call, November 7, 2012 CWH appears to have chosen to discontinue Q&A portion of its conference call as of 4Q12 earnings |
 27 History of Underperformance Analyst Perspectives (continued) Analysts explicitly discount CWH for its externally managed structure and track record of underperformance Citi Research: February 25, 2013 Comment from underwriter firm on same day as proposed equity offering We rate the shares of CWH Sell (3). We believe that CommonWealth REIT's track record of operational underperformance relative to the office REIT peer group stems from the company’s externally advised and managed structure, which results in uneconomic decisions and puts shareholders and management on an uneven playing field. We view the conflicts of interest inherent in the company’s structure as the primary factor for avoiding shares of CWH. Nor do we, however, view the current valuation as sufficiently compelling. |
 28 History of Underperformance Management Commentary Management commentary appears out of touch with business given a 50% cut in CWH dividend only one quarter later And then the last question, the obvious question, as you are bouncing around $18, $19 a share, high 10s on the dividend, clearly when you're at that level, people are either anticipating a diminution or a decline in share value and/or a dividend adjustment. And it seems to me that if the stocks price can't get back up into the low to mid 20's, a dividend cut would be the prudent thing to do. In fact, if you cut the dividend down to $1.20 you'd still have one of the highest dividends in the office industrial REIT space. So what's your thought process on all that? ” Stifel Nicholas: Q1 2012 Earnings Call, May 3, 2012 Yeah. I'm glad you asked that, John, because it's something that a lot of investors have asked us about, and it's the security of the dividend. Right now, we acknowledge that it certainly appears that the market is expecting a dividend cut. We disclosed our CAD payout ratio as a 104%. That is above 100%, it's not much above 100%. We think we can maintain this dividend for the foreseeable future. If the payout ratio were to balloon up, well above 104%, well above 100%, and be there for quite some time, I think we'd have to seriously consider reducing the dividend. But right now, there's no intention from management or the Board, to do anything with the dividend. Now that might change as circumstances change. But today, we have no intention of changing the dividend. And I have to tell you, it is – at times it is perplexing to us, because we look at our numbers and say we can afford the dividend, and the dividend doesn't look like it should be at risk. Yet the stock price seems to indicate that everybody else doesn't see that. They think that we're going to – that there should be a dividend cut. Maybe they are anticipating something years from now, or a long time from now. But I don't – it is – sometimes it's as perplexing to us as to maybe you, John, but that's our thoughts on it. ” Adam Portnoy: Q1 2012 Earnings Call, May 3, 2012 |
 29 Valuation Summary |
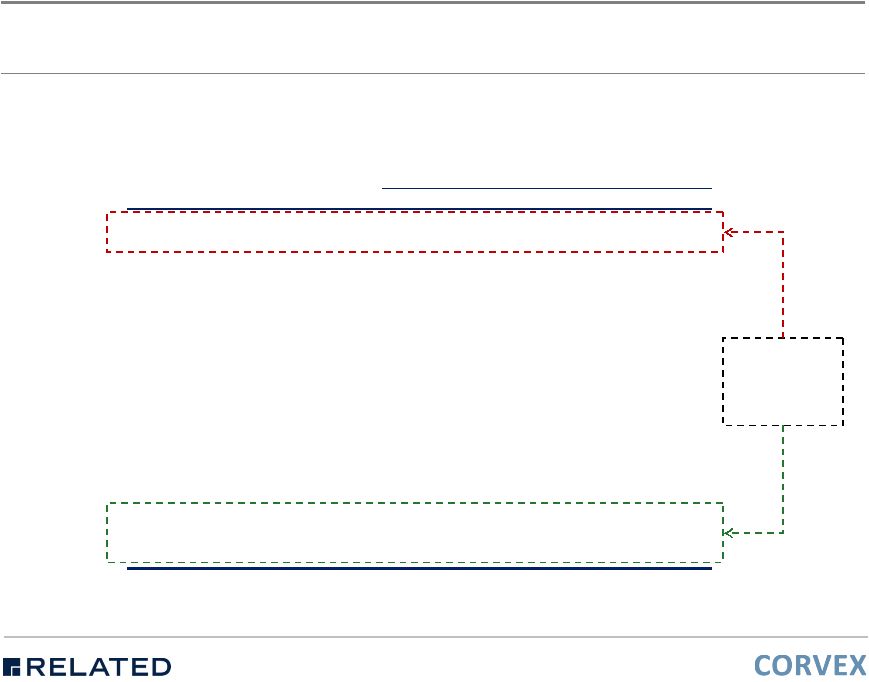
 Related did not rely on book value and instead, did a bottoms up real estate valuation on 90% of the portfolio 30 Valuation Summary Underwriting Methodology Related performed site visits, met with local brokers and had appropriate internal Related teams review underwriting assumptions Related used Gross Asset Value (“GAV”) and Cap Rate Valuation methodologies to determine NAV per share. Related analyzed market rental, vacancy and cap rate trends as well as market research reports Related and Corvex believe CWH’s wholly owned real estate is worth $7.0 billion today (compared to a cost basis of $7.0 billion and implied market value of $4.9 billion) based on property-by-property underwriting (1) CWH $4.9 billion enterprise value calculated using SIR and GOV market value as of 2/25/13. 1 2 3 4 |
 31 Valuation Summary Underwriting Methodology (continued) The most extensive property level detail that CWH provides is a Schedule 3 (accumulated depreciation schedule) produced at the end of every fiscal year. This report does not show the assets’ names or addresses and is merely a list of properties identified by an ID number. The following represents our underwriting methodology: 1. Associate each property ID in the Schedule 3 with an address, name and portfolio where appropriate 2. Remove any SIR spin-off properties (76 total) based on Schedule 1.1 of Form 8-K dated 3/31/12 3. Account for any acquisitions and dispositions during 2012 and 2013 4. Perform extended due diligence on 367 properties • Represents 90% of the portfolio’s total SF • Represents 90% of the portfolio’s total cost basis 5. Extrapolate results to the rest of the portfolio 6. Analyze market rental, vacancy and cap rate trends and meet with brokers, research comparable transactions and perform site visits to further improve property level assumptions 7. Determine CWH’s NAV per share based on gross asset value (“GAV”) and cap rate methodologies We believe GAV is a more appropriate indicator of valuation because of the nature of CWH’s portfolio |
 32 Valuation Summary Underwriting Summary ($ and SF in millions, except PSF) Total Portfolio Underwritten Portfolio Variance # of # of % of % of % of Property Type Properties Cost Basis (1) SF Properties Cost Basis SF Properties Cost Basis SF Office - CBD 47 $3,367 20.5 43 $3,067 19.5 91% 91% 95% Office - Suburban 198 2,543 19.6 162 2,360 17.3 82% 93% 88% Industrial 86 583 9.7 69 399 7.3 80% 68% 75% Hallwood portfolio 98 358 4.1 80 299 3.0 82% 83% 74% Flex - Suburban 7 79 0.4 7 79 0.4 100% 100% 100% Specialty 6 74 0.5 6 74 0.5 100% 100% 100% Portfolio 442 $7,004 54.8 367 $6,278 48.1 83% 90% 88% Remaining Properties 75 726 6.7 17% 10% 12% Total Portfolio 442 $7,004 54.8 442 $7,004 54.8 100% 100% 100% ($ and SF in millions, except PSF) Total Portfolio Underwritten Portfolio Variance # of # of % of % of % of Vintage Properties Cost Basis (1) SF Properties Cost Basis SF Properties Cost Basis SF Before 2000 80 $1,318 10.5 57 $1,014 7.3 71% 77% 70% 2000 - 2005 166 1,591 15.2 136 1,484 13.5 82% 93% 89% 2006 - 2008 128 1,065 11.6 124 1,043 11.5 97% 98% 99% 2009 - 2011 63 2,474 14.0 45 2,181 12.3 71% 88% 87% Since 2012 5 557 3.5 5 557 3.5 100% 100% 100% Portfolio 442 $7,004 54.8 367 $6,278 48.1 83% 90% 88% Remaining Properties 75 726 6.7 17% 10% 12% Total Portfolio 442 $7,004 54.8 442 $7,004 54.8 100% 100% 100% (1) Portfolio Summary - by Vintage Portfolio Summary - by Property Type Cost basis reflects CWH's purchase price accounting (land plus building and improvements) adjusted for actual transaction prices according to RealCapitalAnalytics and therefore might not be reflective of actual acquisiton prices. |
 33 Valuation Summary GAV Methodology We calculate an NAV of $40 per share for CWH. This represents a 132% premium to the Company’s stock price of $15.85 as of 2/25/13. 1. Stratify the portfolio into 5 vintages 2. Analyze the variances between current market value and original cost basis 3. Extrapolate to rest of portfolio to derive GAV of CWH’s real estate 4. Subtract CWH’s unsecured credit facilities, term loans, mortgage notes and preferred stock 5. Add CWH’s cash, and pro rata ownership of SIR and GOV shares Main Assumptions Output Range (NAV per Share) Premium (Discount) to Share Price 8% $40.07 GAV Methodology Before 2000 2000 - 2005 2006 - 2008 2009 - 2011 Since 2012 (4)% (17)% 5% 9% 1 132% |
 34 Valuation Summary Cap Rate Methodology Based on a cap rate approach, we calculate an NAV of $35.88 - $46.85 per share for CWH. This is a 126% - 196% premium to the Company’s stock price of $15.85 as of 2/25/13. 1. Analyze the NOI generated from the 367 subset properties ($493 million) 2. Extrapolate results to remaining portfolio to derive a portfolio NOI ($550 million) 3. Assess average cap rate for the 367 subset properties 4. Establish a range of cap rates (7.25% - 8.25%) 5. Subtract CWH’s unsecured credit facilities, term loans, mortgage notes and preferred stock 6. Add CWH’s cash, and pro rata ownership of SIR and GOV shares Please note that while a cap rate valuation may be informative, we believe that GAV is a more appropriate method of measuring CWH’s real estate because of the potential for value creation if the portfolio is better managed Main Assumptions Output Range (NAV per Share) Premium (Discount) to Share Price Cap Rate Valuation Cash NOI ($ in millions) Cap Rate $550 7.25% – 8.25% 2 $35.88 – $46.85 126% – 196% |
 35 Valuation Summary Stabilized NOI Bridge Related has underwritten $550 million of NOI for the wholly owned portfolio through better property management and investment in challenged properties NOI Bridge ($ in millions) LTM 12/31/12 Portfolio NOI $593.4 Wholly-Owned NOI 513.7 Wholly-Owned % of Portfolio 86.6% Portfolio Straight Line Rent $39.0 Wholly-Owned % of Portfolio 86.6% Wholly-Owned Straight Line Rent $33.8 Wholly-Owned NOI $513.7 Wholly-Owned Straight Line Rent 33.8 Wholly-Owned Cash NOI $479.9 Wholly-Owned Cash NOI $479.9 LTM Property Management Savings 11.0 Stabilization Value 59.1 Underwritten NOI $550.0 |
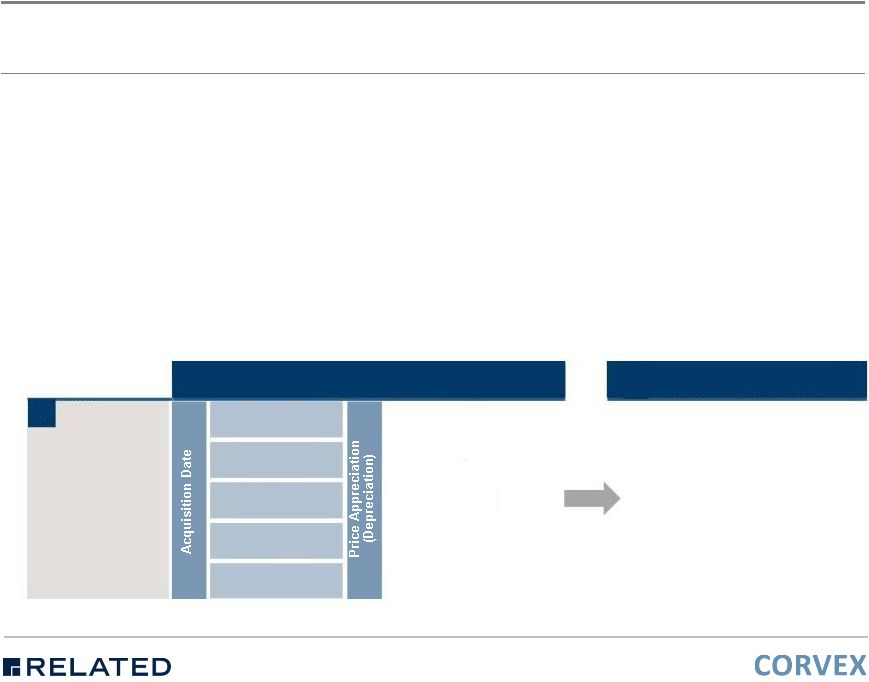
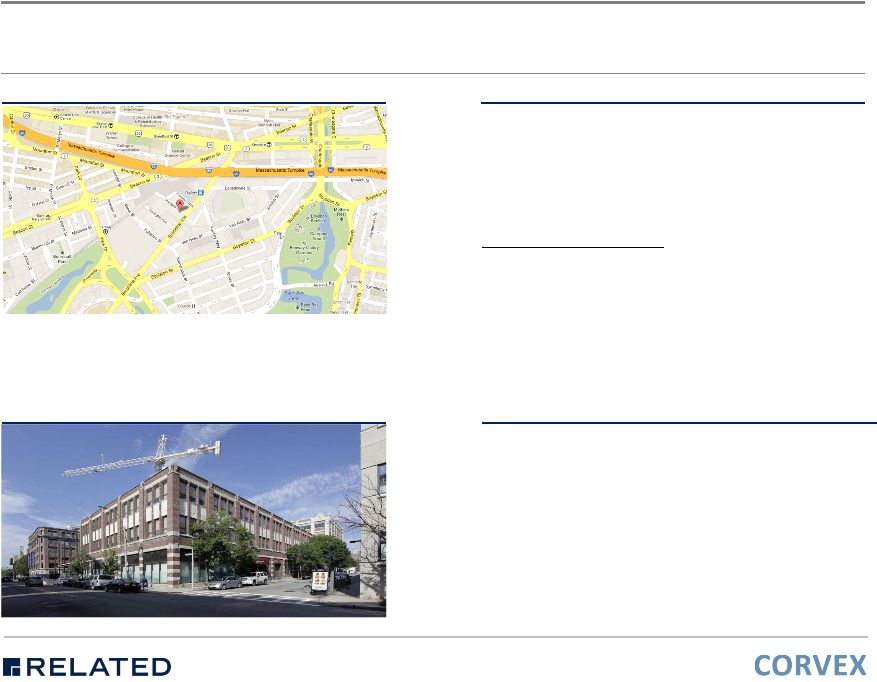 36 Valuation Summary Accretive Case Study – 109 Brookline Avenue (Boston, MA) Location Property Description Property Type: Office - CBD Asset Class: B Estimated Occupancy: 100.0% Net Rentable Square Feet: 287,946 Date Acquired: 9/1/95 Cost Basis: $34 million Cost Basis PSF: $117.30 Mark-to-Market Assumptions Rental Income: $36.00 PSF Recoveries: $0.55 PSF Vacancy & CL: 5.0% Total Operating Expenses: $11.00 PSF NOI: $7 million Cap Rate: 6.00% Stabilization Costs: NA Concluded Value: $114 million Concluded Value PSF: $395.83 Commentary Site The Property is a 3-story, Class-B office building located in the Brighton/Allston/Fenway submarket of Boston, MA. More specifically, the Property is a half block from Fenway, approximately one half mile northeast of Boston's Longwood Medical and Academic Area. The building was constructed in 1875 and underwent a complete renovation in 2000. It is situated on approximately 2.6 acres with an average floorplate of 96,000 SF. There are 112 surface parking spaces with subway access to the Green line available within a half block. The Property benefits from a biomedical research concentration to the north and the Longwood Medical and Academic Center to the south with the nearby Beth Israel Deaconess Medical Center. |
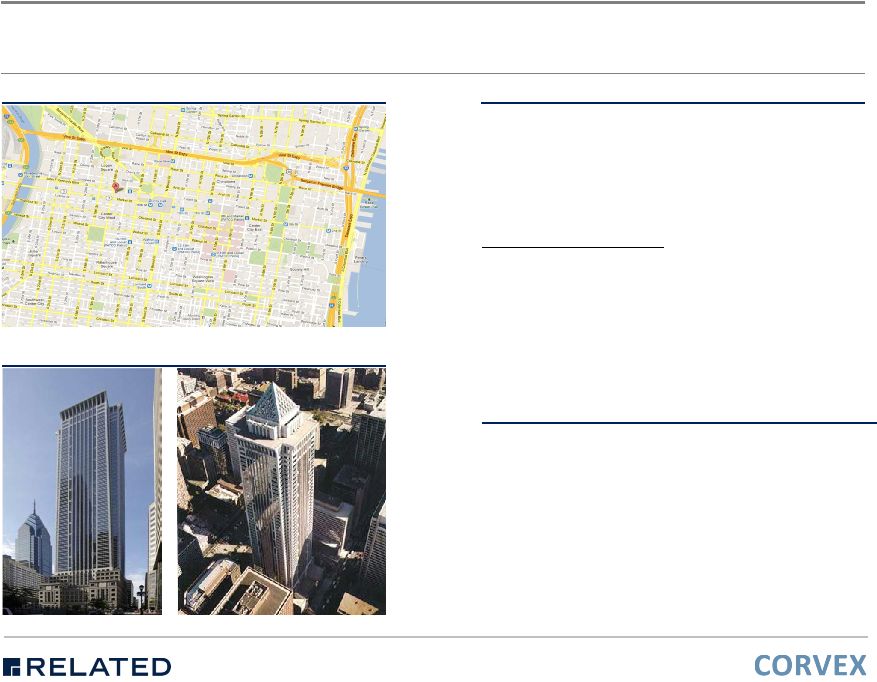 37 Valuation Summary Neutral Case Study – 1735 Market Street (Philadelphia, PA) Location Property Description Property Type: Office - CBD Asset Class: A Estimated Occupancy: 98.2% Net Rentable Square Feet: 1.2 million Date Acquired: 6/1/98 Cost Basis: $226 million Cost Basis PSF: $182.43 Mark-to-Market Assumptions Rental Income: $25.00 PSF Recoveries: $1.35 PSF Vacancy & CL: 7.0% Total Operating Expenses: $11.50 PSF NOI: $16 million Cap Rate: 6.75% Stabilization Costs: NA Concluded Value: $240 million Concluded Value PSF: $194.09 Commentary Site The Property, also known as One Mellon Bank, is a 55-story office building located in the Downtown submarket of Philadelphia. The building was constructed in 1990 on a one-acre parcel of land and contains an additional 46,406 SF of storage space. Typical floor size is 22,400 SF. Parking is provided by 180 underground spaces and nearby, 3rd party parking garages. The building is located three blocks west of Philadelphia's City Hall, in the heart of the financial district. Based on published information, approximately 40 tenants occupy the building, many of them in the financial sector including Barclay's, Deutsche Securities, and BNY Mellon. |
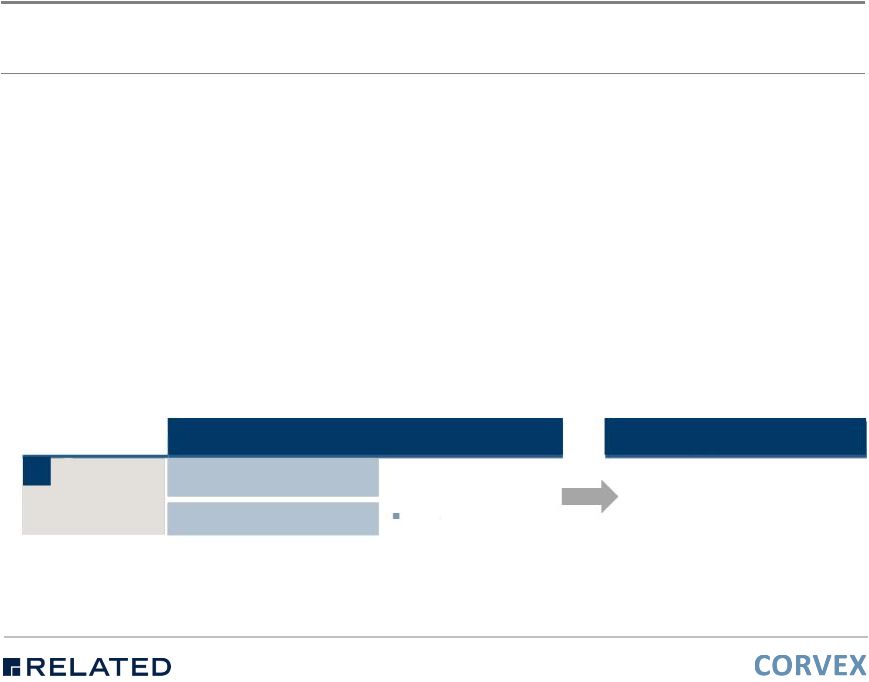
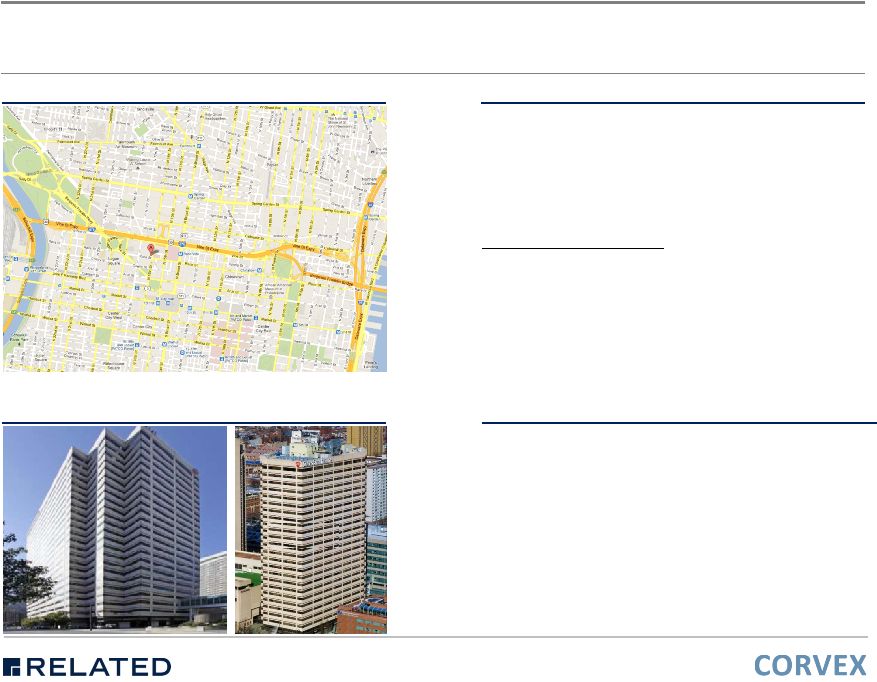 38 Valuation Summary Dilutive Case Study – One Franklin Plaza (Philadelphia, PA) Property Type: Office - CBD Asset Class: A Estimated Occupancy: 0.0% Net Rentable Square Feet: 624,000 Date Acquired: 12/1/97 Cost Basis: $76 million Cost Basis PSF: $120.99 Mark-to-Market Assumptions Rental Income: $20.50 PSF Recoveries: $0.81 PSF Vacancy & CL: 12.0% Total Operating Expenses: $11.50 PSF NOI: $5 million Cap Rate: 7.25% Stabilization Costs: $48 million Concluded Value: $15 million Concluded Value PSF: $23.96 The Property is a 24-story, Class A, office building located in the Downtown submarket of Philadelphia. The building was constructed in 1980 on a 0.91-acre parcel with typical floor plates of 26,000 SF. There are approximately 187 on-site underground parking spaces. GlaxoSmithKline is expected to vacate the building in Q1 2013 in favor of a new campus in Navy Yard. In early 2011, CWH said that it attempted to retain GSK by offering a $110MM overhaul of the building, including new skin, floor-to- ceiling glass, raised ceiling heights, and a state-of-the art HVAC system. These improvements would have equated to a value $176/SF, well in excess of the 1997 acquisition price. Notably, neither CoStar nor Loopnet currently show any availability or asking rates for the property despite the pending vacancy. Location Property Description Commentary Site |
 39 Related / Corvex Recommendations |
 40 Related/Corvex Recommendations RMR Overview RMR was founded in 1986 and now has approximately $22 billion of gross assets under management through publicly traded REITs and closed-end funds Headquartered in Newton, MA and founded by Barry Portnoy, who remains Chairman and majority owner of RMR today and is a Managing Trustee of CWH – Adam Portnoy, son of Barry Portnoy, is President and Chief Executive Officer of RMR, and President and a Managing Trustee of CWH – Barry Portnoy’s son-in-law is also an officer of RMR – All executive officers of CWH are also officers of RMR CWH predecessor HRPT was listed on NYSE in 1986 – HRPT has spun off four subsidiary companies since 1995: Hospitality Properties Trust (HPT), Senior Housing Properties Trust (SNH), Government Properties Income Trust (GOV), and Select Income REIT (SIR) – HRPT changed its name to Commonwealth REIT in July 2010 – All HRPT successor companies remain externally managed by RMR Each company generally has non-compete agreements and ROFR arrangements with one another (based on their respective property types) through their various management agreements with RMR Other RMR entities include RMR Real Estate Income Fund (RIF), Five Star Quality Care (FVE), and Travel Centers of America |
 41 Related/Corvex Recommendations How RMR is Paid Business management agreement – Requires CWH to pay RMR at annual rate of 0.7% of the historical cost basis of U.S., Canadian, and Puerto Rican investments for the first $250,000 of such investments and 0.5% thereafter 1.0% fee level for investments outside the U.S., Canada, and Puerto Rico – Additionally, RMR is entitled to an incentive fee equal to 15% of the product of (i) weighted average fully diluted shares outstanding and (ii) the excess of FFO per share over FFO per share in the preceding fiscal year No incentive paid in recent years given continued FFO per share declines Property management agreement – Provides for fees equal to 3.0% of gross collected rents, and construction supervision fees equal to 5.0% of construction costs CWH is managed under two agreements with RMR, which generate steady fees based on gross historical cost basis and gross rents '07-'12 2007 2008 2009 2010 2011 2012 Cumulative Business Management Fees $31.0 $33.4 $33.6 $34.7 $39.2 $43.6 $215.6 Property Management Fees 28.7 29.8 29.0 $27.5 $30.3 $33.7 $179.0 RMR Management Fees $59.7 $63.2 $62.6 $62.2 $69.5 $77.3 $394.6 % of Recent Market Cap 4.4% 4.7% 4.6% 4.6% 5.1% 5.7% 29.2% % of Rental Income 7.1% 8.4% 7.4% 7.3% 7.6% 7.5% |
 42 Related / Corvex Recommendations Recommendation #1: Internalize Manager CWH should internalize management, resulting in immediate value creation through cost savings and multiple expansion, and significant long term benefits through improved capital allocation and alignment of management incentives We believe majority of CWH’s valuation discount is due to external management structure – Despite challenges, asset fundamentals are solid in aggregate and operations have material upside opportunities – As shown on next page, we believe fee savings alone could represent over 15% upside to CWH stock, and multiple expansion could generate an additional 100%+ upside – Internalization will also save CWH shareholders from paying 15% incentive fees when FFO begins to grow again RMR fees are primarily based on historical cost basis and distort management incentives – Management fees have grown despite track record of extended underperformance – CWH continues to acquire new assets and issue equity rather than repurchasing its dislocated stock, despite re-affirming book value each time fees are paid out to RMR Management fees are excessive and out of step with times – Extraction of nearly 30% of CWH’s market cap since 2007 Additionally, CWH assets have been used repeatedly to seed new platforms for RMR, thereby generating new income streams for RMR without compensation for CWH shareholders External management structure is indefensible, and terminable by independent trustees |
 43 Related / Corvex Recommendations Management Fee / Cap Rate Sensitivity We estimate some portion of RMR fees could be immediately eliminated through internalization, resulting in significant equity value creation for CWH Value creation results from capitalization of fee savings and improvement in overall cap rate Only property management fees are deducted from NOI; however, business management fees in G&A impact equity multiples and cash flow (analysis below capitalizes these savings as well) 4Q12 LQA Business Management Fees $11.6 $46.2 Property Management Fees 9.2 36.8 Total RMR Fees $20.8 $83.1 Estimated Run-Rate Fee Savings $20.0 Current Cap Rate (GAAP) 9.92% CWH Equity Value Creation $201.7 Equity Value Creation per Share $2.41 Current CWH Price $15.85 % Change from Fee Savings 15.2% LQA GAAP NOI (before Fee Savings) $487.3 Cap Rate 7.25% Implied TEV $6,721.9 Value Creation from Fee Savings 201.7 Value from Improved Cap Rate on Fees 74.2 TEV $6,997.7 Net Debt & Preferred 3,585.8 Equity Value $3,411.9 Implied CWH Share Price $40.71 % Change 156.9% % Change from Multiple Improvement 141.7% Implied CWH Share Price Management Fee Savings $40.71 $10.0 $15.0 $20.0 $25.0 $30.0 $35.0 6.75% $45.13 $46.01 $46.90 $47.78 $48.67 $49.55 7.00% 41.99 42.84 43.70 44.55 45.40 46.25 Cap 7.25% 39.07 39.89 40.71 41.54 42.36 43.18 Rate 7.50% 36.34 37.13 37.93 38.73 39.52 40.32 7.75% 33.79 34.56 35.33 36.10 36.87 37.64 8.00% 31.39 32.14 32.88 33.63 34.38 35.12 % Change to Current Management Fee Savings $0.00 $10.0 $15.0 $20.0 $25.0 $30.0 $35.0 6.75% 184.7% 190.3% 195.9% 201.5% 207.0% 212.6% 7.00% 164.9% 170.3% 175.7% 181.1% 186.4% 191.8% Cap 7.25% 146.5% 151.7% 156.9% 162.1% 167.2% 172.4% Rate 7.50% 129.3% 134.3% 139.3% 144.3% 149.3% 154.4% 7.75% 113.2% 118.0% 122.9% 127.7% 132.6% 137.4% 8.00% 98.1% 102.8% 107.5% 112.2% 116.9% 121.6% |
 44 Related / Corvex Recommendations Recommendation #2: Replace Declaration and Bylaws CWH should replace its existing Declaration of Trust and Bylaws with new ones which conform to ISS and Glass Lewis best practices in order to restore investor confidence in the corporate governance of the Company Poorly constructed corporate governance documents have insulated management and further misaligned the interests of management and shareholders Governance issues include: – Classified board – “Poison pill” triggered by the acquisition of only 10% of CWH’s outstanding shares, with a “slow hand” provision – Ineffective independent trustees ISS has taken notice, recommending against CWH’s incumbent board members last year Existing documents and governance practices appear indefensible |
 45 Related / Corvex Recommendations Recommendation #3: Appoint Three Additional Trustees CWH should appoint three new independent trustees to its Board as soon as possible to assuage governance concerns, give CWH shareholders a real voice, and increase the proportion of truly independent Board trustees “Independent” Trustees appear conflicted by common sense definition – Association with multiple RMR entities for long periods of time – Over $2 billion of CWH related party transactions in the last 5 years – Insufficient checks against self dealing Poor ISS and Glass Lewis corporate governance scores on key topics such as board structure and shareholder rights – These issues have emerged under the supervision of current Board members Extended track record of CWH underperformance suggests Independent Trustees are not protecting shareholder interests Management and Board have lost the credibility of the investment and analyst community Status quo appears indefensible: new trustees are needed to restore the reputation and direction of CWH |
 46 Related / Corvex Recommendations Recommendation #4: Cease All Related Party Asset Sales CWH should cease all related party asset sales immediately given the conflicts of interest inherent in its externally managed structure and track record of poor capital allocation decisions Fair and transparent related party transactions are complicated under the best of circumstances – We do not understand how CWH can properly execute related party asset sales given the conflicts of interest between RMR and CWH shareholders, and the Company’s apparent lack of “Independent” Board members – The many challenges of fair and transparent related party deals stand in contrast to CWH’s level of activity, with over $2 billion of deals we could identify done in the last 5 years alone We question whether historical related party asset sales have been in the best interest of CWH shareholders – CWH’s assets have been used historically to seed new business platforms for RMR – These schemes generate new income streams for RMR (often at higher initial fee levels), without appropriate compensation for CWH shareholders CWH shareholders have no confidence in management’s ability to execute related party transactions |
 47 Related / Corvex Recommendations Recommendation #5: Improve Capital Allocation Management’s current capital allocation strategy could be described as ‘buy high, sell low.’ Current strategy: sell challenged suburban properties at a discount and use proceeds to acquire fully occupied, premium CBD properties (i.e. buy high, sell low) – Proposed equity offering serves as example of poor capital allocation decisions, with management planning to sell equity at 57% discount to book value to buy back investment grade debt trading above par New strategy: stabilize challenged properties, and use excess cash flow and asset sale proceeds to repurchase undervalued CWH stock – No justification for asset acquisitions (or new construction) given superior returns and low risk of share repurchases Results in significant value creation for CWH shareholders (see next page) – Stop all acquisition and development activity until CWH stock price exceeds NAV – No more dilutive equity offerings – Establish an ongoing commitment to buy back stock when it trades below book value Additionally, Company should establish and maintain an appropriate leverage target or leverage range |
 48 Related / Corvex Recommendations Share Repurchase Analysis CWH can close the disconnect between its stock price and NAV by using excess cash flow and asset sale proceeds to buy back stock 2012 2013E 2014E CAD $131.4 Stabilized Cash NOI (after Asset Sales) $527.0 Cap Rate 7.50% Run-Rate Target Savings TEV $7,026.7 Business Mgmt. Fees $46.2 $35.0 $11.2 CWH Net Debt 2,930.8 Property Mgmt Fees 36.8 25.8 11.0 Preferred 655.0 Incremental CAD $83.1 $60.8 $22.3 $22.3 $22.3 Equity Value $3,440.8 CWH Share Price $53.95 Adjusted CAD $153.6 $153.6 $161.3 % Change to Current 240.4% Memo: Shares Outstanding 63.8 Current Quarterly Dividend $0.25 $0.25 Avg. Shares Outstanding 78.3 68.3 Implied CWH Share Price Annual Dividends Paid $78.3 $68.3 Asset Sales $53.95 $0.0 $75.0 $150.0 $225.0 $300.0 2013E 2014E 7.00% $55.44 $58.51 $62.22 $66.79 $72.56 CAD after Dividends $75.3 $93.0 Cap 7.25% 51.92 54.65 57.95 62.00 67.11 Asset Sales 150.0 150.0 Rate 7.50% 48.64 51.05 53.95 57.53 62.03 Divested NOI (5.6) (16.9) 7.75% 45.56 47.68 50.22 53.35 57.29 Share Repurchases $219.7 $226.1 8.00% 42.68 44.52 46.73 49.44 52.85 Buyback Price Assumed $20.00 $25.00 % Premium to Current Price 26.2% 57.7% % Change to Current Asset Sales Shares Repurchased 11.0 9.0 $0.0 $75.0 $150.0 $225.0 $300.0 % of Shares Outstanding (Current) 13.1% 10.8% 7.00% 249.8% 269.2% 292.6% 321.4% 357.8% Cap 7.25% 227.6% 244.8% 265.6% 291.2% 323.4% Beginning Shares 83.8 72.8 Rate 7.50% 206.9% 222.1% 240.4% 263.0% 291.4% Ending Shares 72.8 63.8 7.75% 187.5% 200.8% 216.9% 236.6% 261.4% Avg. Shares Outstanding 78.3 68.3 8.00% 169.3% 180.9% 194.8% 211.9% 233.4% |
 49 Related / Corvex Recommendations Action by Written Consent If CWH disagrees with our proposal or fails to respond within 30 days, we plan to seek to remove the Board and replace it with 5 independent trustees Removing the Board would require action by written consent – Declaration of Trust authorizes removal of Board at any time without cause by a 2/3 vote – We believe a 2/3 vote is achievable, as we believe shareholders will overwhelmingly support our recommendations to CWH If all of the Trustees are removed, according to the Declaration of Trust the officers of CWH must promptly call a special meeting where successor Trustees would be appointed by a majority vote New independent board would then pursue the same strategies we have recommended on the previous pages |
 50 Conclusion 153%+ upside to Related/Corvex estimate of $40 NAV per share 247%+ upside to Related/Corvex target stock price of $55+ at 12/31/14 Externally managed structure skews incentives, reduces CWH cash flow through excessive fees, destroys investor confidence, and impairs valuation multiple (off depressed earnings) – However, diversified asset base with highly saleable properties We believe CWH must take immediate steps to close the massive discount between its public market value and underlying intrinsic value – Internalize management structure – Replace its existing Charter and Bylaws and appoint three independent trustees – Use excess cash flow and proceeds from asset sales to buy back stock or delever until the Company’s stock price exceeds its NAV If CWH is unable or unwilling to manage the business in ways which maximize long- term shareholder value, the board should be removed and replaced with leaders who can and will make the necessary changes CWH represents a collection of hard assets which are massively undervalued today due to the Company’s externally advised management structure and track record of underperformance |
 Appendix |
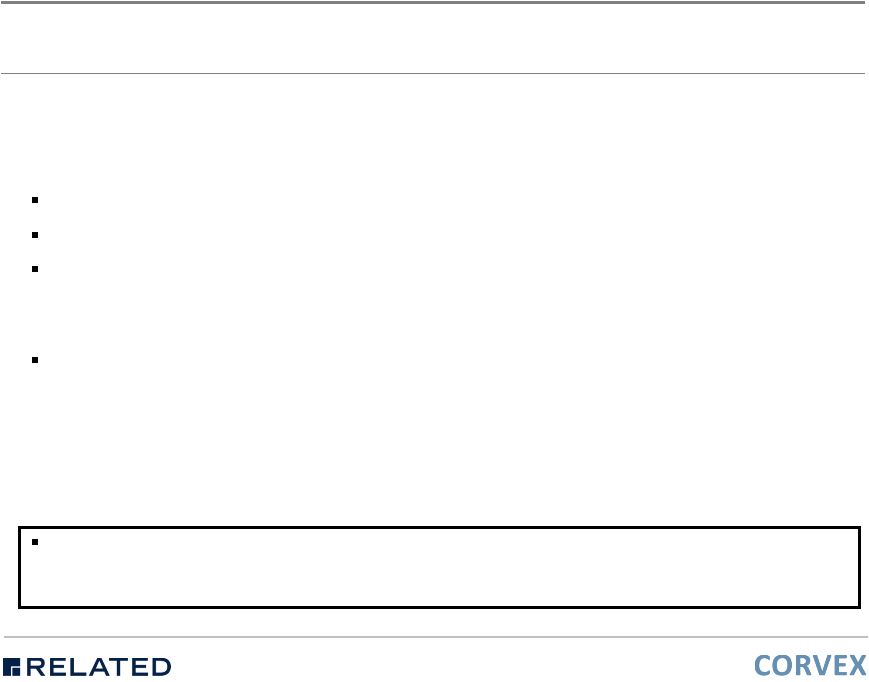
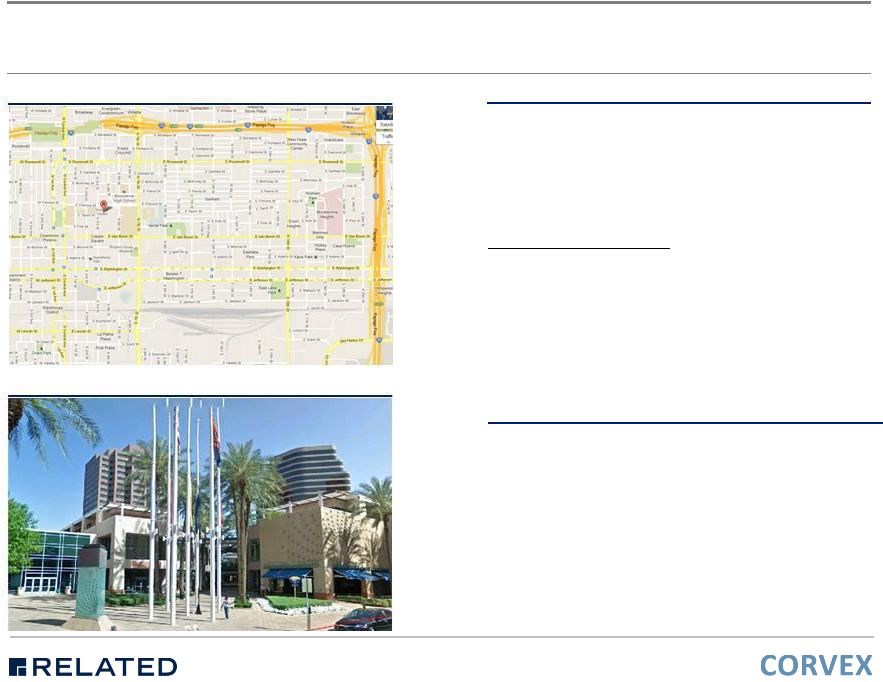 Appendix Arizona Center (Phoenix, AZ) Property Type: Office - CBD Asset Class: A Estimated Occupancy: 93.0% Net Rentable Square Feet: 1.1 million Date Acquired: 3/9/11 Cost Basis: $137 million Cost Basis PSF: $129.34 Mark-to-Market Assumptions Rental Income: $20.26 PSF Recoveries: $1.94 PSF Vacancy & CL: 10.0% Total Operating Expenses: $8.97 PSF NOI: $12 million Cap Rate: 8.00% Stabilization Costs: NA Concluded Value: $148 million Concluded Value PSF: $140.05 The Property, is located at the northeast corner of 3rd and Van Buren streets in Phoenix, AZ, and is situated on 16.1 acres. The property includes roughly 2,500 parking spaces, open space, retail shops and restaurants, a movie theater, a garden office building and two office towers. The Property also includes three undeveloped pads of roughly 1.0 acre at the southwest corner of Fillmore & 5th St., 1.1 acres between the parking deck & Two Arizona Center, and 1.3 acres at NWC Van Buren & 5th St. The two office towers include the 20-story Arizona Center Two which is 100% leased by Arizona Public Services for the next 33 years and Arizona Center One, a 19-story tower which is 88% leased to several tenants including the Snell & Wilmer law firm (206,421 SF leased to 2022) and Pinnacle West Capital (8,779 SF). Location Property Description Commentary Site Note: Acquisition data and SF sourced from LoopNet, CoStar, RealCapitalAnalytics and SNL Financial. |
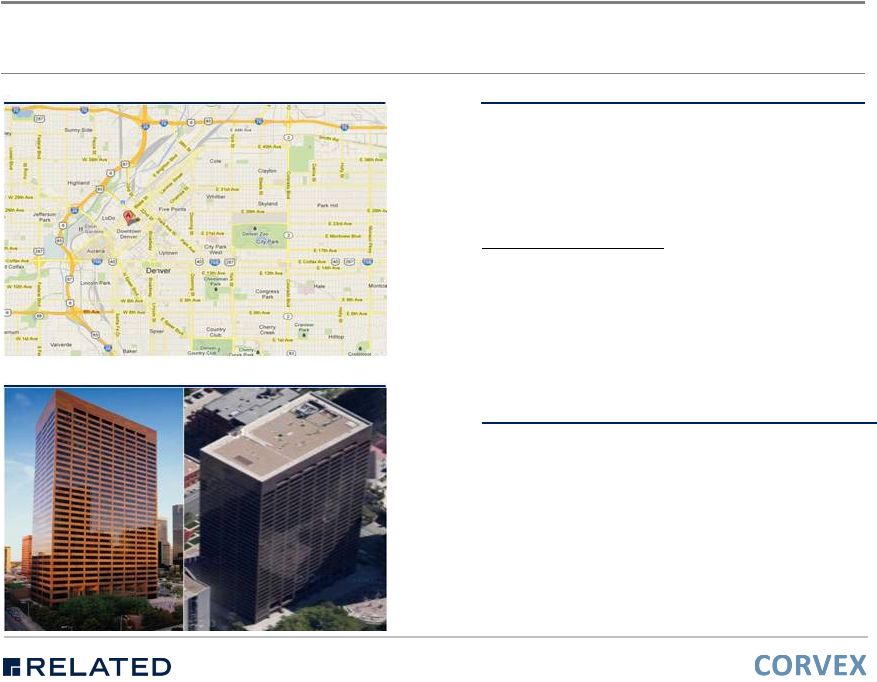 Appendix 1225 17 Street (Denver, CO) Property Type: Office - CBD Asset Class: A- Estimated Occupancy: 83.8% Net Rentable Square Feet: 672,465 Date Acquired: 6/24/09 Cost Basis: $134 million Cost Basis PSF: $199.64 Mark-to-Market Assumptions Rental Income: $25.00 PSF Recoveries: $1.49 PSF Vacancy & CL: 14.0% Total Operating Expenses: $9.00 PSF NOI: $9 million Cap Rate: 6.25% Stabilization Costs: $11 million Concluded Value: $140 million Concluded Value PSF: $207.82 The Property is a 32 story, Class-A- office building located in the downtown submarket of Denver. The building was constructed in 1982 and is situated on a 2.45 acre parcel of land with a landscaped plaza on both the north and south sides of the property. Location Property Description Commentary Site Note: Acquisition data and SF sourced from LoopNet, CoStar, RealCapitalAnalytics and SNL Financial. th |
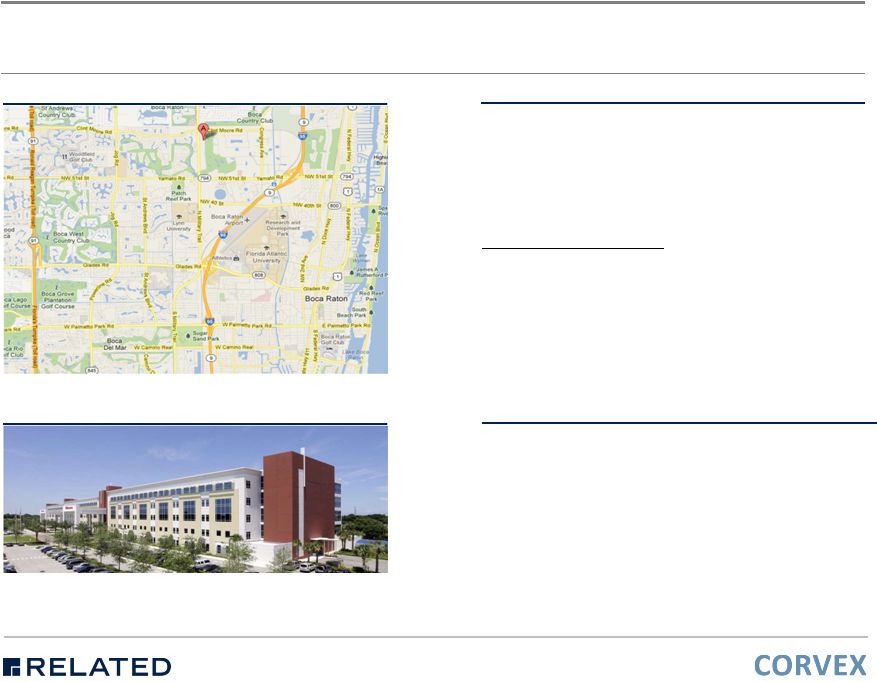 Appendix 6600 North Military Trail (Boca Raton, FL) Property Type: Office - Suburban Asset Class: A Estimated Occupancy: 100.0% Net Rentable Square Feet: 625,000 Date Acquired: 1/31/11 Cost Basis: $171 million Cost Basis PSF: $273.60 Mark-to-Market Assumptions Rental Income: $23.00 PSF Recoveries: $0.00 PSF Vacancy & CL: 5.0% Total Operating Expenses: $0.10 PSF NOI: $14 million Cap Rate: 7.75% Stabilization Costs: NA Concluded Value: $175 million Concluded Value PSF: $280.65 The Property is a 5-story, Class-A office building located in Boca Raton, FL, two miles west of I-95 off the Yamato Rd. exit. Parking is available on-site by an unknown number of surface and covered parking stalls. The building is situated on 4.5 acres. It was constructed in 2008 and is 100% occupied by Office Depot. Office Depot‘s lease terms have been reported to include 15 years with multiple extension options. Location Property Description Commentary Site Note: Acquisition data and SF sourced from LoopNet, CoStar, RealCapitalAnalytics and SNL Financial. |
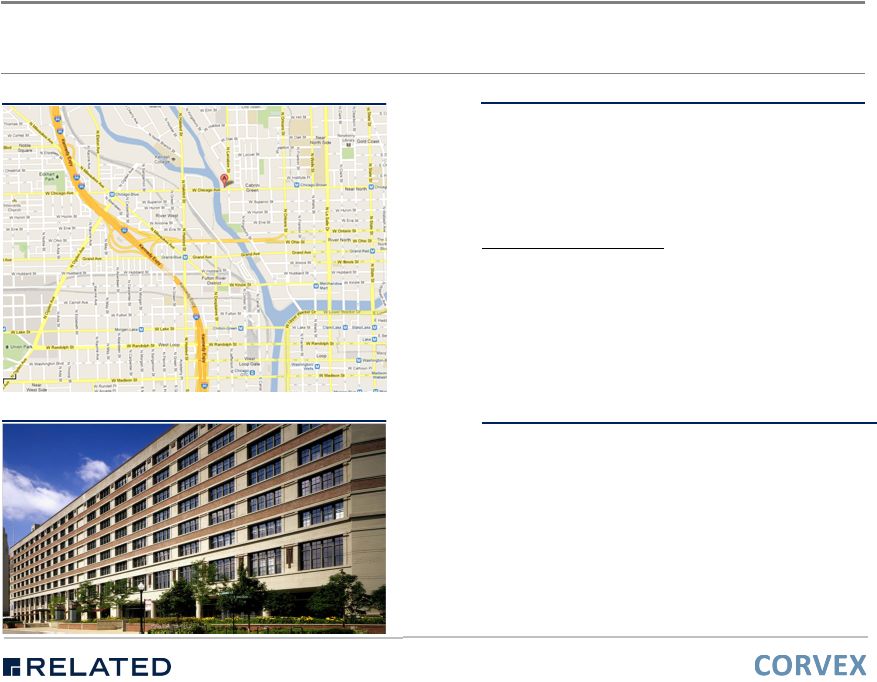 Appendix 600 West Chicago (Chicago, IL) Property Type: Office - CBD Asset Class: A Estimated Occupancy: 98.6% Net Rentable Square Feet: 1.6 million Date Acquired: 8/10/11 Cost Basis: $390 million Cost Basis PSF: $248.19 Mark-to-Market Assumptions Rental Income: $20.00 PSF Recoveries: $8.10 PSF Vacancy & CL: 5.0% Total Operating Expenses: $9.00 PSF NOI: $28 million Cap Rate: 7.00% Stabilization Costs: NA Concluded Value: $406 million Concluded Value PSF: $258.57 The Property, also known as the Montgomery Ward Building, is located in Chicago's River North neighborhood along the Chicago River. The Property is an eight story building that was originally built as part of Montgomery Ward's office and warehouse headquarters in 1908. In 2001, the Property and several adjacent buildings that were also part of the Montgomery Ward Complex were converted into office, retail, and condominium uses. The majority of the building is office, but several restaurants and a gym occupy the lower level. The Property offers complimentary shuttle service, but suffers from a lack of public transportation. Major tenants include Groupon, Wrigley, Infinium Capital Management and Level 3 Communications. Location Property Description Commentary Site Note: Acquisition data and SF sourced from LoopNet, CoStar, RealCapitalAnalytics and SNL Financial. |
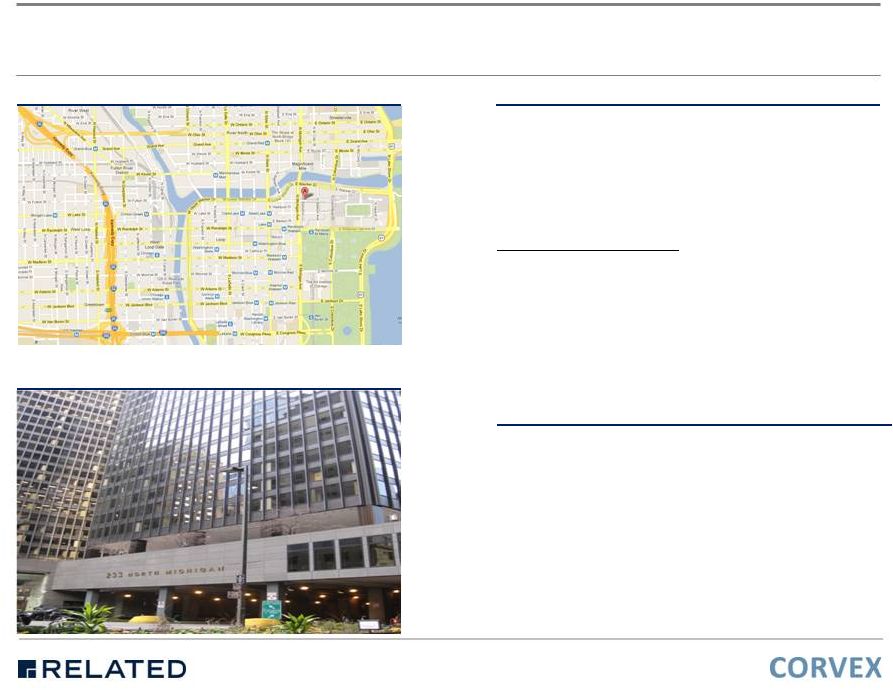 Appendix 233 North Michigan Avenue (Chicago, IL) Property Type: Office - CBD Asset Class: B+ Estimated Occupancy: 73.8% Net Rentable Square Feet: 980,362 Date Acquired: 5/15/11 Cost Basis: $162 million Cost Basis PSF: $165.45 Mark-to-Market Assumptions Rental Income: $17.00 PSF Recoveries: $9.00 PSF Vacancy & CL: 13.0% Total Operating Expenses: $10.00 PSF NOI: $14 million Cap Rate: 7.75% Stabilization Costs: $4 million Concluded Value: $170 million Concluded Value PSF: $173.54 The Property is a 32 story building located in the East Loop submarket of the Chicago CBD. The building was constructed in 1972 and renovated in 1998. The Property is located on 1.35 acres of land. The Property is part of the planned Illinois Center development, which includes numerous amenities including indoor access to restaurants, hotels, and the Chicago Transit Authority. Location Property Description Commentary Site Note: Acquisition data and SF sourced from LoopNet, CoStar, RealCapitalAnalytics and SNL Financial. |
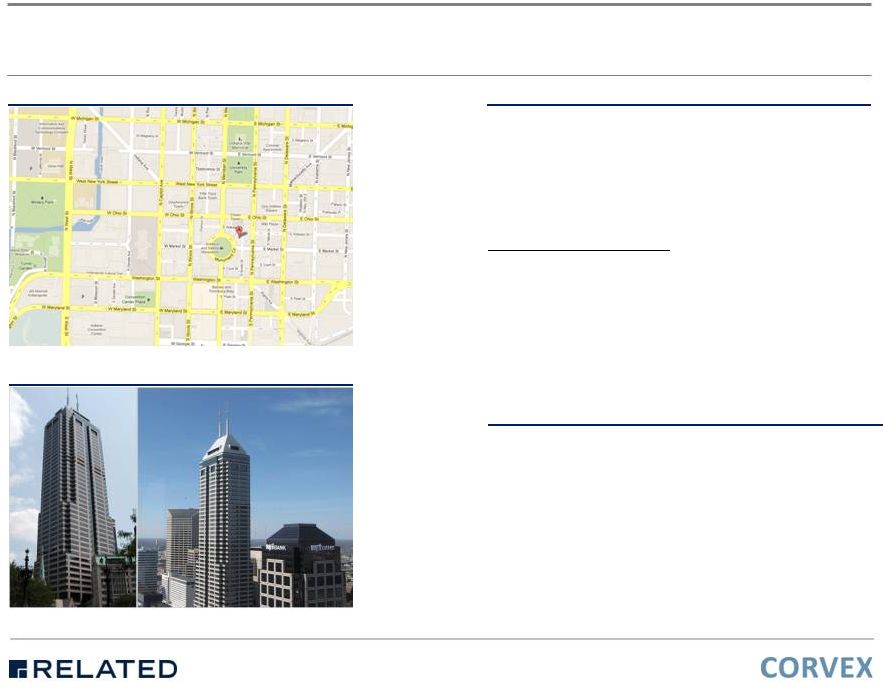 Appendix 111 Monument Circle (Indianapolis, IN) Property Type: Office - Suburban Asset Class: A Estimated Occupancy: 93.7% Net Rentable Square Feet: 1.1 million Date Acquired: 10/1/12 Cost Basis: $196 million Cost Basis PSF: $184.73 Mark-to-Market Assumptions Rental Income: $24.26 PSF Recoveries: $1.90 PSF Vacancy & CL: 7.0% Total Operating Expenses: $10.00 PSF NOI: $16 million Cap Rate: 8.00% Stabilization Costs: NA Concluded Value: $196 million Concluded Value PSF: $184.73 The Property, also known as Chase Tower, consists of two office buildings that share the same address on the historic Monument Circle in downtown Indianapolis, IN. The tower consists of 901,831 SF and the companion building is the Circle building consisting of 156,487 SF. Chase Tower is a 48- story, Class-A office building built in 1989, on 2.3 acres. The building serves as a regional headquarters for JP Morgan Chase, which is one of several credit tenants in the building including Merrill Lynch (BofA), Morgan Stanley, and Ernst & Young. Two major tenants, JP Morgan Chase (204,000 SF) and the law firm Woodard, Emhart, et al. (45,000 SF) executed renewals in 2012. Location Property Description Commentary Site Note: Acquisition data and SF sourced from LoopNet, CoStar, RealCapitalAnalytics and SNL Financial. |
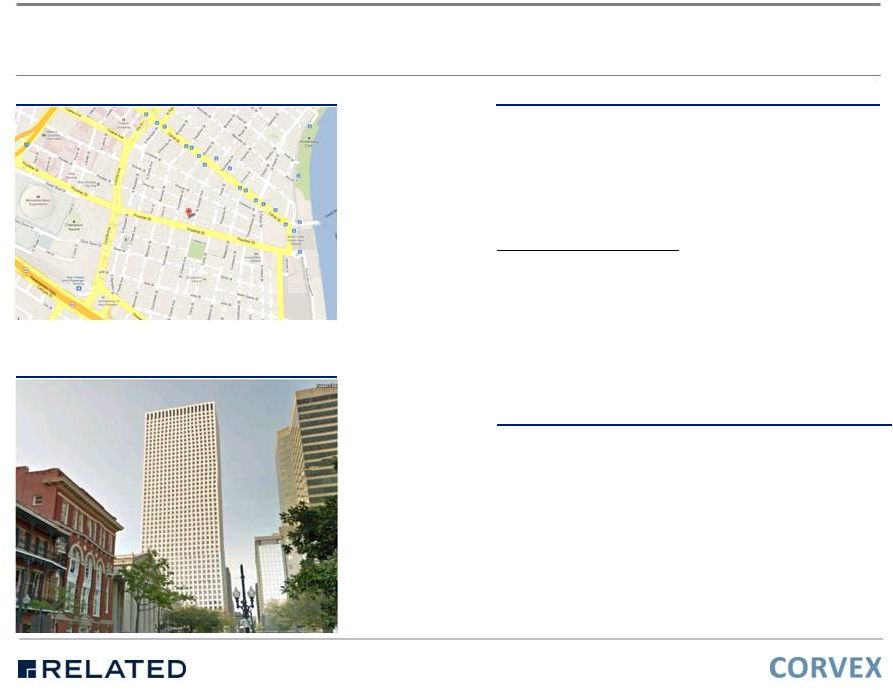 Appendix 701 Poydras Street (New Orleans, LA) Property Type: Office - CBD Asset Class: A Estimated Occupancy: 98.0% Net Rentable Square Feet: 1.3 million Date Acquired: 8/15/11 Cost Basis: $102 million Cost Basis PSF: $81.15 Mark-to-Market Assumptions Rental Income: $17.62 PSF Recoveries: $0.80 PSF Vacancy & CL: 12.0% Total Operating Expenses: $8.00 PSF NOI: $10 million Cap Rate: 9.50% Stabilization Costs: NA Concluded Value: $110 million Concluded Value PSF: $87.43 The Property, also known as One Shell Square, is a 51-story, Class-A office building located at the corner of Poydras St. and St. Charles Street. Reported occupancy for the property is 98% with Shell Oil’s gulf coast headquarters occupying 50% of the building through December 2016. The building is situated on three acres and was constructed in 1972 by Hines. Location Property Description Commentary Site Note: Acquisition data and SF sourced from LoopNet, CoStar, RealCapitalAnalytics and SNL Financial. |
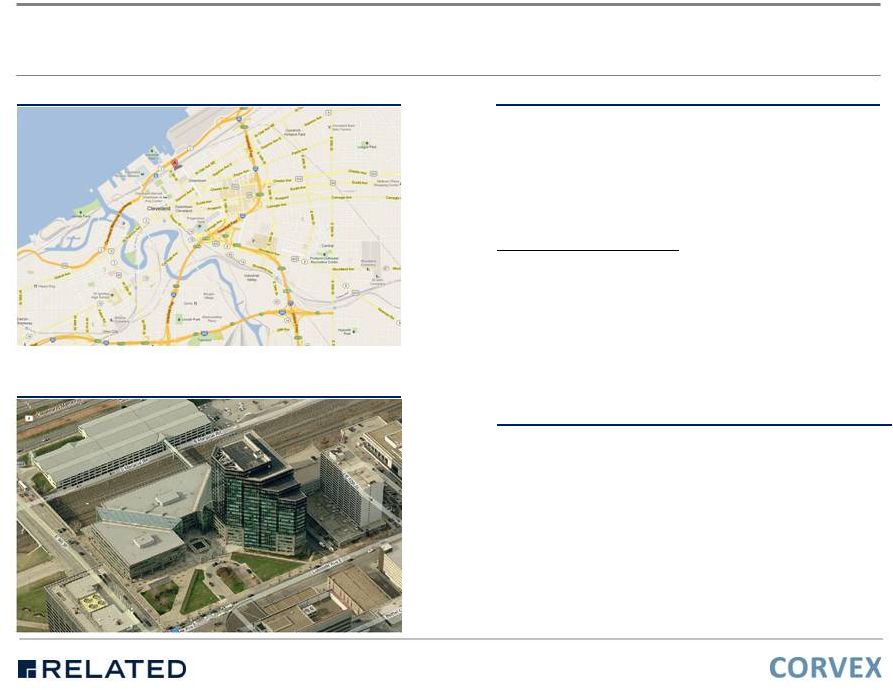 Appendix 901 – 1001 Lakeside Avenue (Cleveland, OH) Property Type: Office - CBD Asset Class: A Estimated Occupancy: 90.4% Net Rentable Square Feet: 820,795 Date Acquired: 2/12/08 Cost Basis: $123 million Cost Basis PSF: $149.85 Mark-to-Market Assumptions Rental Income: $21.00 PSF Recoveries: $1.00 PSF Vacancy & CL: 10.0% Total Operating Expenses: $8.00 PSF NOI: $10 million Cap Rate: 8.25% Stabilization Costs: NA Concluded Value: $118 million Concluded Value PSF: $144.24 The Property consists of two office buildings located in downtown Cleveland, OH. The buildings were constructed in 1980 and 1990, and are situated on a 3.32 acre site. Building #1 (230,000 SF) is 100% occupied by Jones Day a global law firm with over 2,400 attorneys. Building #2 (590,795 SF) is 86.6% occupied with major tenants including Kaiser Permanente of Ohio (66,482 SF), Towers Watson & Company (44,444 SF) and U.S. General Services administration (31,409 SF). Location Property Description Commentary Site Note: Acquisition data and SF sourced from LoopNet, CoStar, RealCapitalAnalytics and SNL Financial. |
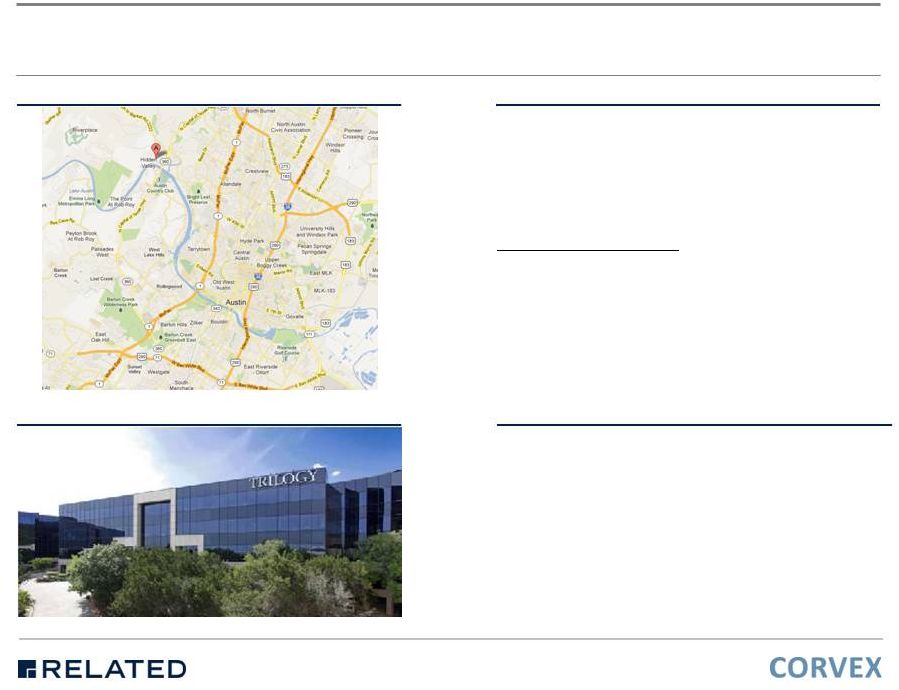 Appendix Bridgepoint Square (Austin, TX) Property Type: Office - Suburban Asset Class: A Estimated Occupancy: 95.0% Net Rentable Square Feet: 439,656 Date Acquired: 12/5/97 Cost Basis: $78 million Cost Basis PSF: $177.41 Mark-to-Market Assumptions Rental Income: $16.00 PSF Recoveries: $0.00 PSF Vacancy & CL: 5.0% Total Operating Expenses: $1.05 PSF NOI: $6 million Cap Rate: 7.00% Stabilization Costs: NA Concluded Value: $89 million Concluded Value PSF: $202.20 The Property, also known as Bridgepoint Square, consists of a portfolio of five buildings as part of a campus-like business park. Bridgepoint Square consists of 5-story, Class A constructed suburban office buildings located on the north side of Lake Austin. Each building has between 75,000 to 110,000 SF for a total of 439,656 SF. The assets are located in the Northwest submarket of Austin, TX, approximately 20 minutes drive from downtown Austin and were either built or renovated in 1996- 1997. Based on published information, all of the buildings are multi-tenanted with local or regional firms. The average tenant size is typically 5,000 to 15,000 SF indicating industry diversification, but also inferior corporate credit. Location Site Note: Acquisition data and SF sourced from LoopNet, CoStar, RealCapitalAnalytics and SNL Financial. Property Description Commentary |
 Appendix 333 108 Avenue NE (Bellevue, WA) Property Type: Office - CBD Asset Class: A Estimated Occupancy: 100.0% Net Rentable Square Feet: 414,964 Date Acquired: 11/12/09 Cost Basis: $165 million Cost Basis PSF: $397.62 Mark-to-Market Assumptions Rental Income: $34.00 PSF Recoveries: $2.41 PSF Vacancy & CL: 5.0% Total Operating Expenses: $10.00 PSF NOI: $10 million Cap Rate: 6.00% Stabilization Costs: NA Concluded Value: $171 million Concluded Value PSF: $411.83 The Property consists of a 20-story, Class A office tower located in the Bellevue CBD, an affluent market just east of downtown Seattle. The building was constructed in 2008, and is situated on a 1.3 acre site. Current occupancy at the property is reported to be 100% with a majority of the space (355K SF - 85% of NRA) occupied by Expedia Inc. The Expedia lease term was reported to be 10 years, with multiple extension options. With the occupation of the tower, Expedia consolidated space occupied in three different buildings within the Bellevue market. According to published sources the company has already outgrown its headquarters. Location Property Description Commentary Site Note: Acquisition data and SF sourced from LoopNet, CoStar, RealCapitalAnalytics and SNL Financial. th |