K2 Alternative Strategies Fund
Franklin Alternative Strategies Funds
Financial Statements and Other Important Information
Annual | | May 31, 2024 | ||
 | |||
UNITED STATES
SECURITIES AND EXCHANGE COMMISSION
Washington, DC 20549
FORM N-CSR
CERTIFIED SHAREHOLDER REPORT OF REGISTERED
MANAGEMENT INVESTMENT COMPANIES
Investment Company Act file number number
811-22641
Franklin Alternative Strategies Funds
(Exact name of registrant as specified in charter)
One Franklin Parkway, San Mateo, CA 94403-1906
(Address of principal executive offices) (Zip code)
Alison Baur,
One Franklin Parkway,
San Mateo,
CA 94403-1906
(Name and address of agent for service)
Registrant’s telephone number, including area code:
650 312-2000
Date of fiscal year end: 5/31
Date of reporting period: 5/31/24
| ITEM 1. | REPORT TO STOCKHOLDERS. |
The Annual Report to Stockholders is filed herewith.
K2 Alternative Strategies Fund |  | |
| Class A [FAAAX] | ||
| Annual Shareholder Report | May 31, 2024 | ||
 | ||
Class Name | Costs of $10,000 investment | Costs paid as a percentage of a $10,000 investment* |
| Class A | $269 | 2.57% |
| * | Reflects fee waivers and/or expense reimbursements, without which expenses would have been higher. |
Top contributors to performance: | |
| ↑ | At the asset class level, long positioning in equities drove gains, led by the industrials, utilities and health care sectors. Long fixed income positioning and currency hedges also aided performance, led by emerging market sovereign bonds and short positioning against the Swiss franc. |
| ↑ | Long short equity was the largest strategy contributor, with gains driven by long equity positioning in the industrials, utilities and health care sectors. |
| ↑ | Long short equity sub-advisor Electron Capital Partners was the leading contributor, driven by long positioning in the industrials sector, especially the capital goods industry, and in utilities. |
Top detractors from performance: | |
| ↓ | Among asset classes, commodity positioning weighed the most on returns, due to short positions in agricultural and metal commodities held by sub-advisor Capital Fund Management (CFM). Credit positioning also detracted, due to credit default swaps by RBC Global Asset Management (UK) (formerly, BlueBay Asset Management) in emerging market sovereign bonds. |
| ↓ | The Strategic Overlay strategy, activated at the end of the first quarter of 2024, was a modest detractor as its long exposure to S&P 500® Index futures weighed slightly on returns. |
| ↓ | Three of the sub-advisors modestly detracted. One River Asset Management, a relative value sub-advisor (exited in March 2024) weighed the most on returns. |
| K2 Alternative Strategies Fund | ||
| NOT FDIC INSURED | MAY LOSE VALUE | NO BANK GUARANTEE | PAGE 1 | 068-ATSR-0724 |
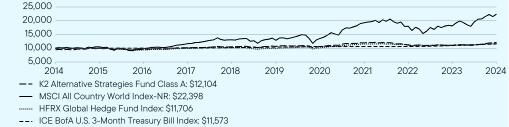
1 Year | 5 Year | 10 Year | |
Class A (without sales charge) | 9.57 | 2.55 | 2.51 |
Class A (with sales charge) | 3.56 | 1.39 | 1.93 |
MSCI All Country World Index-NR | 23.56 | 11.67 | 8.40 |
HFRX Global Hedge Fund Index | 5.89 | 3.46 | 1.59 |
ICE BofA U.S. 3-Month Treasury Bill Index | 5.45 | 2.12 | 1.47 |
Total Net Assets | $634,669,943 |
Total Number of Portfolio Holdings* | 721 |
Total Management Fee Paid | $11,431,760 |
Portfolio Turnover Rate | 257.70% |
| * | Does not include derivatives, except purchased option contracts, if any. |
| K2 Alternative Strategies Fund | ||
| NOT FDIC INSURED | MAY LOSE VALUE | NO BANK GUARANTEE | PAGE 2 | 068-ATSR-0724 |
Long Positions | Short Positions | |
Long Short Equity | 43.2 | -32.4 |
Relative Value | 51.6 | -26.1 |
Event Driven | 2.3 | -2.0 |
Global Macro | 95.0 | -136.3 |
Strategic Overlay | 3.0 | -- |
Total | 195.1 | -196.8 |
| Figures include the effect of gross notional exposure of derivatives. |
 | WHERE CAN I FIND ADDITIONAL INFORMATION ABOUT THE FUND? |
Additional information is available on https://www.franklintempleton.com/regulatory-fund-documents, including its: | |
| • prospectus • proxy voting information • financial information • holdings • tax information |
| K2 Alternative Strategies Fund | ||
| NOT FDIC INSURED | MAY LOSE VALUE | NO BANK GUARANTEE | PAGE 3 | 068-ATSR-0724 |
K2 Alternative Strategies Fund |  | |
| Class C [FASCX] | ||
| Annual Shareholder Report | May 31, 2024 | ||
 | ||
Class Name | Costs of $10,000 investment | Costs paid as a percentage of a $10,000 investment* |
| Class C | $347 | 3.33% |
| * | Reflects fee waivers and/or expense reimbursements, without which expenses would have been higher. |
Top contributors to performance: | |
| ↑ | At the asset class level, long positioning in equities drove gains, led by the industrials, utilities and health care sectors. Long fixed income positioning and currency hedges also aided performance, led by emerging market sovereign bonds and short positioning against the Swiss franc. |
| ↑ | Long short equity was the largest strategy contributor, with gains driven by long equity positioning in the industrials, utilities and health care sectors. |
| ↑ | Long short equity sub-advisor Electron Capital Partners was the leading contributor, driven by long positioning in the industrials sector, especially the capital goods industry, and in utilities. |
Top detractors from performance: | |
| ↓ | Among asset classes, commodity positioning weighed the most on returns, due to short positions in agricultural and metal commodities held by sub-advisor Capital Fund Management (CFM). Credit positioning also detracted, due to credit default swaps by RBC Global Asset Management (UK) (formerly, BlueBay Asset Management) in emerging market sovereign bonds. |
| ↓ | The Strategic Overlay strategy, activated at the end of the first quarter of 2024, was a modest detractor as its long exposure to S&P 500® Index futures weighed slightly on returns. |
| ↓ | Three of the sub-advisors modestly detracted. One River Asset Management, a relative value sub-advisor (exited in March 2024) weighed the most on returns. |
| K2 Alternative Strategies Fund | ||
| NOT FDIC INSURED | MAY LOSE VALUE | NO BANK GUARANTEE | PAGE 1 | 520-ATSR-0724 |
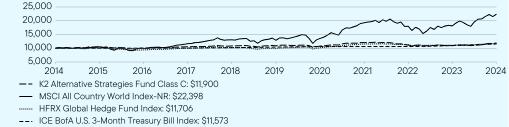
1 Year | 5 Year | 10 Year | |
Class C (without sales charge) | 8.69 | 1.79 | 1.75 |
Class C (with sales charge) | 7.69 | 1.79 | 1.75 |
MSCI All Country World Index-NR | 23.56 | 11.67 | 8.40 |
HFRX Global Hedge Fund Index | 5.89 | 3.46 | 1.59 |
ICE BofA U.S. 3-Month Treasury Bill Index | 5.45 | 2.12 | 1.47 |
Total Net Assets | $634,669,943 |
Total Number of Portfolio Holdings* | 721 |
Total Management Fee Paid | $11,431,760 |
Portfolio Turnover Rate | 257.70% |
| * | Does not include derivatives, except purchased option contracts, if any. |
Long Positions | Short Positions | |
Long Short Equity | 43.2 | -32.4 |
Relative Value | 51.6 | -26.1 |
Event Driven | 2.3 | -2.0 |
Global Macro | 95.0 | -136.3 |
Strategic Overlay | 3.0 | -- |
Total | 195.1 | -196.8 |
| Figures include the effect of gross notional exposure of derivatives. |
| K2 Alternative Strategies Fund | ||
| NOT FDIC INSURED | MAY LOSE VALUE | NO BANK GUARANTEE | PAGE 2 | 520-ATSR-0724 |
 | WHERE CAN I FIND ADDITIONAL INFORMATION ABOUT THE FUND? |
Additional information is available on https://www.franklintempleton.com/regulatory-fund-documents, including its: | |
| • prospectus • proxy voting information • financial information • holdings • tax information |
| K2 Alternative Strategies Fund | ||
| NOT FDIC INSURED | MAY LOSE VALUE | NO BANK GUARANTEE | PAGE 3 | 520-ATSR-0724 |
K2 Alternative Strategies Fund |  | |
| Class R [FSKKX] | ||
| Annual Shareholder Report | May 31, 2024 | ||
 | ||
Class Name | Costs of $10,000 investment | Costs paid as a percentage of a $10,000 investment* |
| Class R | $295 | 2.82% |
| * | Reflects fee waivers and/or expense reimbursements, without which expenses would have been higher. |
Top contributors to performance: | |
| ↑ | At the asset class level, long positioning in equities drove gains, led by the industrials, utilities and health care sectors. Long fixed income positioning and currency hedges also aided performance, led by emerging market sovereign bonds and short positioning against the Swiss franc. |
| ↑ | Long short equity was the largest strategy contributor, with gains driven by long equity positioning in the industrials, utilities and health care sectors. |
| ↑ | Long short equity sub-advisor Electron Capital Partners was the leading contributor, driven by long positioning in the industrials sector, especially the capital goods industry, and in utilities. |
Top detractors from performance: | |
| ↓ | Among asset classes, commodity positioning weighed the most on returns, due to short positions in agricultural and metal commodities held by sub-advisor Capital Fund Management (CFM). Credit positioning also detracted, due to credit default swaps by RBC Global Asset Management (UK) (formerly, BlueBay Asset Management) in emerging market sovereign bonds. |
| ↓ | The Strategic Overlay strategy, activated at the end of the first quarter of 2024, was a modest detractor as its long exposure to S&P 500® Index futures weighed slightly on returns. |
| ↓ | Three of the sub-advisors modestly detracted. One River Asset Management, a relative value sub-advisor (exited in March 2024) weighed the most on returns. |
| K2 Alternative Strategies Fund | ||
| NOT FDIC INSURED | MAY LOSE VALUE | NO BANK GUARANTEE | PAGE 1 | 820-ATSR-0724 |
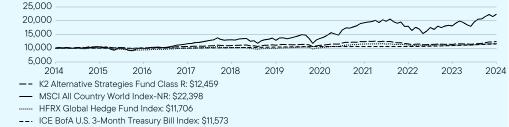
1 Year | 5 Year | 10 Year | |
Class R (without sales charge) | 9.30 | 2.31 | 2.22 |
Class R (with sales charge) | 9.30 | 2.31 | 2.22 |
MSCI All Country World Index-NR | 23.56 | 11.67 | 8.40 |
HFRX Global Hedge Fund Index | 5.89 | 3.46 | 1.59 |
ICE BofA U.S. 3-Month Treasury Bill Index | 5.45 | 2.12 | 1.47 |
Total Net Assets | $634,669,943 |
Total Number of Portfolio Holdings* | 721 |
Total Management Fee Paid | $11,431,760 |
Portfolio Turnover Rate | 257.70% |
| * | Does not include derivatives, except purchased option contracts, if any. |
Long Positions | Short Positions | |
Long Short Equity | 43.2 | -32.4 |
Relative Value | 51.6 | -26.1 |
Event Driven | 2.3 | -2.0 |
Global Macro | 95.0 | -136.3 |
Strategic Overlay | 3.0 | -- |
Total | 195.1 | -196.8 |
| Figures include the effect of gross notional exposure of derivatives. |
| K2 Alternative Strategies Fund | ||
| NOT FDIC INSURED | MAY LOSE VALUE | NO BANK GUARANTEE | PAGE 2 | 820-ATSR-0724 |
 | WHERE CAN I FIND ADDITIONAL INFORMATION ABOUT THE FUND? |
Additional information is available on https://www.franklintempleton.com/regulatory-fund-documents, including its: | |
| • prospectus • proxy voting information • financial information • holdings • tax information |
| K2 Alternative Strategies Fund | ||
| NOT FDIC INSURED | MAY LOSE VALUE | NO BANK GUARANTEE | PAGE 3 | 820-ATSR-0724 |
K2 Alternative Strategies Fund |  | |
| Class R6 [FASRX] | ||
| Annual Shareholder Report | May 31, 2024 | ||
 | ||
Class Name | Costs of $10,000 investment | Costs paid as a percentage of a $10,000 investment* |
| Class R6 | $237 | 2.26% |
| * | Reflects fee waivers and/or expense reimbursements, without which expenses would have been higher. |
Top contributors to performance: | |
| ↑ | At the asset class level, long positioning in equities drove gains, led by the industrials, utilities and health care sectors. Long fixed income positioning and currency hedges also aided performance, led by emerging market sovereign bonds and short positioning against the Swiss franc. |
| ↑ | Long short equity was the largest strategy contributor, with gains driven by long equity positioning in the industrials, utilities and health care sectors. |
| ↑ | Long short equity sub-advisor Electron Capital Partners was the leading contributor, driven by long positioning in the industrials sector, especially the capital goods industry, and in utilities. |
Top detractors from performance: | |
| ↓ | Among asset classes, commodity positioning weighed the most on returns, due to short positions in agricultural and metal commodities held by sub-advisor Capital Fund Management (CFM). Credit positioning also detracted, due to credit default swaps by RBC Global Asset Management (UK) (formerly, BlueBay Asset Management) in emerging market sovereign bonds. |
| ↓ | The Strategic Overlay strategy, activated at the end of the first quarter of 2024, was a modest detractor as its long exposure to S&P 500® Index futures weighed slightly on returns. |
| ↓ | Three of the sub-advisors modestly detracted. One River Asset Management, a relative value sub-advisor (exited in March 2024) weighed the most on returns. |
| K2 Alternative Strategies Fund | ||
| NOT FDIC INSURED | MAY LOSE VALUE | NO BANK GUARANTEE | PAGE 1 | 830-ATSR-0724 |
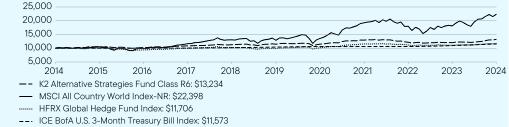
1 Year | 5 Year | 10 Year | |
Class R6 (without sales charge) | 10.03 | 2.89 | 2.84 |
Class R6 (with sales charge) | 10.03 | 2.89 | 2.84 |
MSCI All Country World Index-NR | 23.56 | 11.67 | 8.40 |
HFRX Global Hedge Fund Index | 5.89 | 3.46 | 1.59 |
ICE BofA U.S. 3-Month Treasury Bill Index | 5.45 | 2.12 | 1.47 |
Total Net Assets | $634,669,943 |
Total Number of Portfolio Holdings* | 721 |
Total Management Fee Paid | $11,431,760 |
Portfolio Turnover Rate | 257.70% |
| * | Does not include derivatives, except purchased option contracts, if any. |
Long Positions | Short Positions | |
Long Short Equity | 43.2 | -32.4 |
Relative Value | 51.6 | -26.1 |
Event Driven | 2.3 | -2.0 |
Global Macro | 95.0 | -136.3 |
Strategic Overlay | 3.0 | -- |
Total | 195.1 | -196.8 |
| Figures include the effect of gross notional exposure of derivatives. |
| K2 Alternative Strategies Fund | ||
| NOT FDIC INSURED | MAY LOSE VALUE | NO BANK GUARANTEE | PAGE 2 | 830-ATSR-0724 |
 | WHERE CAN I FIND ADDITIONAL INFORMATION ABOUT THE FUND? |
Additional information is available on https://www.franklintempleton.com/regulatory-fund-documents, including its: | |
| • prospectus • proxy voting information • financial information • holdings • tax information |
| K2 Alternative Strategies Fund | ||
| NOT FDIC INSURED | MAY LOSE VALUE | NO BANK GUARANTEE | PAGE 3 | 830-ATSR-0724 |
K2 Alternative Strategies Fund |  | |
| Advisor Class [FABZX] | ||
| Annual Shareholder Report | May 31, 2024 | ||
 | ||
Class Name | Costs of $10,000 investment | Costs paid as a percentage of a $10,000 investment* |
| Advisor Class | $244 | 2.33% |
| * | Reflects fee waivers and/or expense reimbursements, without which expenses would have been higher. |
Top contributors to performance: | |
| ↑ | At the asset class level, long positioning in equities drove gains, led by the industrials, utilities and health care sectors. Long fixed income positioning and currency hedges also aided performance, led by emerging market sovereign bonds and short positioning against the Swiss franc. |
| ↑ | Long short equity was the largest strategy contributor, with gains driven by long equity positioning in the industrials, utilities and health care sectors. |
| ↑ | Long short equity sub-advisor Electron Capital Partners was the leading contributor, driven by long positioning in the industrials sector, especially the capital goods industry, and in utilities. |
Top detractors from performance: | |
| ↓ | Among asset classes, commodity positioning weighed the most on returns, due to short positions in agricultural and metal commodities held by sub-advisor Capital Fund Management (CFM). Credit positioning also detracted, due to credit default swaps by RBC Global Asset Management (UK) (formerly, BlueBay Asset Management) in emerging market sovereign bonds. |
| ↓ | The Strategic Overlay strategy, activated at the end of the first quarter of 2024, was a modest detractor as its long exposure to S&P 500® Index futures weighed slightly on returns. |
| ↓ | Three of the sub-advisors modestly detracted. One River Asset Management, a relative value sub-advisor (exited in March 2024) weighed the most on returns. |
| K2 Alternative Strategies Fund | ||
| NOT FDIC INSURED | MAY LOSE VALUE | NO BANK GUARANTEE | PAGE 1 | 10-ATSR-0724 |
1 Year | 5 Year | 10 Year | |
Advisor Class (without sales charge) | 9.87 | 2.83 | 2.78 |
Advisor Class (with sales charge) | 9.87 | 2.83 | 2.78 |
MSCI All Country World Index-NR | 23.56 | 11.67 | 8.40 |
HFRX Global Hedge Fund Index | 5.89 | 3.46 | 1.59 |
ICE BofA U.S. 3-Month Treasury Bill Index | 5.45 | 2.12 | 1.47 |
Total Net Assets | $634,669,943 |
Total Number of Portfolio Holdings* | 721 |
Total Management Fee Paid | $11,431,760 |
Portfolio Turnover Rate | 257.70% |
| * | Does not include derivatives, except purchased option contracts, if any. |
Long Positions | Short Positions | |
Long Short Equity | 43.2 | -32.4 |
Relative Value | 51.6 | -26.1 |
Event Driven | 2.3 | -2.0 |
Global Macro | 95.0 | -136.3 |
Strategic Overlay | 3.0 | -- |
Total | 195.1 | -196.8 |
| Figures include the effect of gross notional exposure of derivatives. |
| K2 Alternative Strategies Fund | ||
| NOT FDIC INSURED | MAY LOSE VALUE | NO BANK GUARANTEE | PAGE 2 | 10-ATSR-0724 |
 | WHERE CAN I FIND ADDITIONAL INFORMATION ABOUT THE FUND? |
Additional information is available on https://www.franklintempleton.com/regulatory-fund-documents, including its: | |
| • prospectus • proxy voting information • financial information • holdings • tax information |
| K2 Alternative Strategies Fund | ||
| NOT FDIC INSURED | MAY LOSE VALUE | NO BANK GUARANTEE | PAGE 3 | 10-ATSR-0724 |
ITEM 2. CODE OF ETHICS.
(a) The Registrant has adopted a code of ethics that applies to its principal executive officers and principal financial and accounting officer.
(c) N/A
(d) N/A
(f) Pursuant to Item 19(a)(1), the Registrant is attaching as an exhibit a copy of its code of ethics that applies to its principal executive officers and principal financial and accounting officer.
ITEM 3. AUDIT COMMITTEE FINANCIAL EXPERT.
(a) (1) The Registrant has an audit committee financial expert serving on its audit committee.
(2) The audit committee financial experts are Ann Torre Bates, David W. Niemiec and Valerie M. Williams and they are “independent” as defined under the relevant Securities and Exchange Commission Rules and Releases.
ITEM 4. PRINCIPAL ACCOUNTANT FEES AND SERVICES.
(a) Audit Fees
The aggregate fees paid to the principal accountant for professional services rendered by the principal accountant for the audit of the registrant’s annual financial statements or for services that are normally provided by the principal accountant in connection with statutory and regulatory filings or engagements were $174,873 for the fiscal year ended May 31, 2024 and $189,474 for the fiscal year ended May 31, 2023.
(b) Audit-Related Fees
There were no fees paid to the principal accountant for assurance and related services rendered by the principal accountant to the registrant that are reasonably related to the performance of the audit of the registrant's financial statements and are not reported under paragraph (a) of Item 4.
There were no fees paid to the principal accountant for assurance and related services rendered by the principal accountant to the registrant's investment adviser and any entity controlling, controlled by or under common control with the investment adviser that provides ongoing services to the registrant that are reasonably related to the performance of the audit of their financial statements.
(c) Tax Fees
There were no fees paid to the principal accountant for professional services rendered by the principal accountant to the registrant for tax compliance, tax advice and tax planning.
There were no fees paid to the principal accountant for professional services rendered by the principal accountant to the registrant’s investment adviser and any entity controlling, controlled by or under common control with the investment adviser that provides ongoing services to the registrant for tax compliance, tax advice and tax planning.
(d) All Other Fees
There were no fees paid to the principal accountant for products and services rendered by the principal accountant to the registrant other than the services reported in paragraphs (a)-(c) of Item 4.
There were no fees paid to the principal accountant for products and services rendered by the principal accountant to the registrant’s investment adviser and any entity controlling, controlled by or under common control with the investment adviser that provides ongoing services to the registrant other than the services reported in paragraphs (a)-(c) of Item 4.
(e) (1) The registrant’s audit committee is directly responsible for approving the services to be provided by the auditors, including:
(i) pre-approval of all audit and audit related services;
(ii) pre-approval of all non-audit related services to be provided to the Fund by the auditors;
(iii) pre-approval of all non-audit related services to be provided to the registrant by the auditors to the registrant’s investment adviser or to any entity that controls, is controlled by or is under common control with the registrant’s investment adviser and that provides ongoing services to the registrant where the non-audit services relate directly to the operations or financial reporting of the registrant; and
(iv) establishment by the audit committee, if deemed necessary or appropriate, as an alternative to committee pre-approval of services to be provided by the auditors, as required by paragraphs (ii) and (iii) above, of policies and procedures to permit such services to be pre-approved by other means, such as through establishment of guidelines or by action of a designated member or members of the committee; provided the policies and procedures are detailed as to the particular service and the committee is informed of each service and such policies and procedures do not include delegation of audit committee responsibilities, as contemplated under the Securities Exchange Act of 1934, to management; subject, in the case of (ii) through (iv), to any waivers, exceptions or exemptions that may be available under applicable law or rules.
(e) (2) None of the services provided to the registrant described in paragraphs (b)-(d) of Item 4 were approved by the audit committee pursuant to paragraph (c)(7)(i)(C) of Rule 2-01 of regulation S-X.
(f) No disclosures are required by this Item 4(f).
(g) There were no fees paid to the principal accountant for services rendered by the principal accountant to the registrant and the registrant’s investment adviser and any entity controlling, controlled by or under common control with the investment adviser that provides ongoing services to the registrant.
(h) The registrant’s audit committee of the board has considered whether the provision of non-audit services that were rendered to the registrant’s investment adviser (not including any sub-adviser whose role is primarily portfolio management and is subcontracted with or overseen by another investment adviser), and any entity controlling, controlled by, or under common control with the investment adviser that provides ongoing services to the registrant that were not pre-approved pursuant to paragraph (c)(7)(ii) of Rule 2-01 of Regulation S-X is compatible with maintaining the principal accountant’s independence.
(i) Not Applicable
(j) Not Applicable
| ITEM 5. AUDIT COMMITTEE OF LISTED REGISTRANTS. |
Not applicable
| ITEM 6. | SCHEDULE OF INVESTMENTS. |
| a) | Please see schedule of investments contained in the Financial Statements and Financial Highlights included under Item 7 of this Form N-CSR. |
| b) | Not applicable. |
| ITEM 7. | FINANCIAL STATEMENTS AND FINANCIAL HIGHLIGHTS FOR OPEN-END MANAGEMENT INVESTMENT COMPANIES. |
Annual | | May 31, 2024 | ||
| |||
2 | Annual Report | franklintempleton.com | ||||
Year Ended May 31, | |||||||||||||||||
2024 | 2023 | 2022 | 2021 | 2020 | |||||||||||||
Class A | |||||||||||||||||
Per share operating performance (for a share outstanding throughout the year) | |||||||||||||||||
Net asset value, beginning of year | $10.69 | $11.16 | $12.46 | $11.19 | $11.28 | ||||||||||||
Income from investment operationsa: | |||||||||||||||||
Net investment income (loss)b | 0.24 | 0.15 | (0.06) | (0.08) | (0.03) | ||||||||||||
Net realized and unrealized gains (losses) | 0.79 | (0.32) | (0.68) | 1.45 | 0.02 | ||||||||||||
Total from investment operations | 1.03 | (0.17) | (0.74) | 1.37 | (0.01) | ||||||||||||
Less distributions from: | |||||||||||||||||
Net investment income | (0.05) | (0.21) | (0.06) | — | (0.07) | ||||||||||||
Net realized gains | — | (0.09) | (0.50) | (0.10) | (0.01) | ||||||||||||
Total distributions | (0.05) | (0.30) | (0.56) | (0.10) | (0.08) | ||||||||||||
Net asset value, end of year | $11.67 | $10.69 | $11.16 | $12.46 | $11.19 | ||||||||||||
Total returnc | 9.57% | (1.48)% | (6.25)% | 12.25% | (0.15)% | ||||||||||||
Ratios to average net assets | |||||||||||||||||
Expenses before waiver, payments by affiliates and expense reductiond | 2.83% | 2.82% | 2.75% | 2.82% | 2.58% | ||||||||||||
Expenses net of waiver, payments by affiliates and expense reductiond | 2.57% | 2.64% | 2.60%e | 2.64% | 2.40% | ||||||||||||
Expenses incurred in connection with securities sold short | 0.47% | 0.45% | 0.40% | 0.44% | 0.20% | ||||||||||||
Net investment income (loss) | 2.22% | 1.31% | (0.49)% | (0.67)% | (0.25)% | ||||||||||||
Supplemental data | |||||||||||||||||
Net assets, end of year (000’s) | $63,320 | $76,464 | $94,580 | $102,138 | $90,205 | ||||||||||||
Portfolio turnover rate | 257.70% | 225.53% | 177.61% | 236.64% | 271.51% | ||||||||||||
franklintempleton.com | The accompanying notes are an integral part of these consolidated financial statements. | Annual Report | 3 | ||||
Year Ended May 31, | |||||||||||||||||
2024 | 2023 | 2022 | 2021 | 2020 | |||||||||||||
Class C | |||||||||||||||||
Per share operating performance (for a share outstanding throughout the year) | |||||||||||||||||
Net asset value, beginning of year | $10.35 | $10.80 | $12.11 | $10.95 | $11.05 | ||||||||||||
Income from investment operationsa: | |||||||||||||||||
Net investment income (loss)b | 0.15 | 0.06 | (0.15) | (0.15) | (0.11) | ||||||||||||
Net realized and unrealized gains (losses) | 0.77 | (0.31) | (0.66) | 1.41 | 0.02 | ||||||||||||
Total from investment operations | 0.92 | (0.25) | (0.81) | 1.26 | (0.09) | ||||||||||||
Less distributions from: | |||||||||||||||||
Net investment income | — | (0.11) | — | — | — | ||||||||||||
Net realized gains | — | (0.09) | (0.50) | (0.10) | (0.01) | ||||||||||||
Total distributions | — | (0.20) | (0.50) | (0.10) | (0.01) | ||||||||||||
Net asset value, end of year | $11.27 | $10.35 | $10.80 | $12.11 | $10.95 | ||||||||||||
Total returnc | 8.69% | (2.12)% | (7.06)% | 11.51% | (0.85)% | ||||||||||||
Ratios to average net assets | |||||||||||||||||
Expenses before waiver, payments by affiliates and expense reductiond | 3.60% | 3.57% | 3.50% | 3.54% | 3.33% | ||||||||||||
Expenses net of waiver, payments by affiliates and expense reductiond | 3.33% | 3.39% | 3.35%e | 3.36% | 3.15% | ||||||||||||
Expenses incurred in connection with securities sold short | 0.47% | 0.45% | 0.40% | 0.44% | 0.20% | ||||||||||||
Net investment income (loss) | 1.46% | 0.55% | (1.24)% | (1.39)% | (1.00)% | ||||||||||||
Supplemental data | |||||||||||||||||
Net assets, end of year (000’s) | $7,957 | $15,720 | $24,486 | $31,541 | $36,043 | ||||||||||||
Portfolio turnover rate | 257.70% | 225.53% | 177.61% | 236.64% | 271.51% | ||||||||||||
4 | Annual Report | The accompanying notes are an integral part of these consolidated financial statements. | franklintempleton.com | ||||
Year Ended May 31, | |||||||||||||||||
2024 | 2023 | 2022 | 2021 | 2020 | |||||||||||||
Class R | |||||||||||||||||
Per share operating performance (for a share outstanding throughout the year) | |||||||||||||||||
Net asset value, beginning of year | $10.73 | $11.13 | $12.44 | $11.20 | $11.28 | ||||||||||||
Income from investment operationsa: | |||||||||||||||||
Net investment income (loss)b | 0.22 | 0.10 | (0.08) | (0.11) | (0.06) | ||||||||||||
Net realized and unrealized gains (losses) | 0.80 | (0.31) | (0.68) | 1.45 | 0.02 | ||||||||||||
Total from investment operations | 1.02 | (0.21) | (0.76) | 1.34 | (0.04) | ||||||||||||
Less distributions from: | |||||||||||||||||
Net investment income | (0.02) | (0.10) | (0.05) | — | (0.03) | ||||||||||||
Net realized gains | — | (0.09) | (0.50) | (0.10) | (0.01) | ||||||||||||
Total distributions | (0.02) | (0.19) | (0.55) | (0.10) | (0.04) | ||||||||||||
Net asset value, end of year | $11.73 | $10.73 | $11.13 | $12.44 | $11.20 | ||||||||||||
Total return | 9.30% | (1.65)% | (6.50)% | 11.97% | (0.39)% | ||||||||||||
Ratios to average net assets | |||||||||||||||||
Expenses before waiver, payments by affiliates and expense reductionc | 3.07% | 3.07% | 3.04% | 3.06% | 2.83% | ||||||||||||
Expenses net of waiver, payments by affiliates and expense reductionc | 2.82% | 2.89% | 2.85%d | 2.88% | 2.65% | ||||||||||||
Expenses incurred in connection with securities sold short | 0.47% | 0.45% | 0.40% | 0.44% | 0.20% | ||||||||||||
Net investment income (loss) | 1.97% | 1.05% | (0.78)% | (0.91)% | (0.50)% | ||||||||||||
Supplemental data | |||||||||||||||||
Net assets, end of year (000’s) | $348 | $351 | $811 | $840 | $884 | ||||||||||||
Portfolio turnover rate | 257.70% | 225.53% | 177.61% | 236.64% | 271.51% | ||||||||||||
franklintempleton.com | The accompanying notes are an integral part of these consolidated financial statements. | Annual Report | 5 | ||||
Year Ended May 31, | |||||||||||||||||
2024 | 2023 | 2022 | 2021 | 2020 | |||||||||||||
Class R6 | |||||||||||||||||
Per share operating performance (for a share outstanding throughout the year) | |||||||||||||||||
Net asset value, beginning of year | $10.78 | $11.27 | $12.58 | $11.25 | $11.34 | ||||||||||||
Income from investment operationsa: | |||||||||||||||||
Net investment income (loss)b | 0.29 | 0.18 | (0.02) | (0.04) | 0.01 | ||||||||||||
Net realized and unrealized gains (losses) | 0.79 | (0.33) | (0.69) | 1.47 | 0.02 | ||||||||||||
Total from investment operations | 1.08 | (0.15) | (0.71) | 1.43 | 0.03 | ||||||||||||
Less distributions from: | |||||||||||||||||
Net investment income | (0.09) | (0.25) | (0.10) | — | (0.11) | ||||||||||||
Net realized gains | — | (0.09) | (0.50) | (0.10) | (0.01) | ||||||||||||
Total distributions | (0.09) | (0.34) | (0.60) | (0.10) | (0.12) | ||||||||||||
Net asset value, end of year | $11.77 | $10.78 | $11.27 | $12.58 | $11.25 | ||||||||||||
Total return | 10.03% | (1.20)% | (6.05)% | 12.61% | 0.27% | ||||||||||||
Ratios to average net assets | |||||||||||||||||
Expenses before waiver, payments by affiliates and expense reductionc | 2.47% | 2.48% | 2.44% | 2.50% | 2.26% | ||||||||||||
Expenses net of waiver, payments by affiliates and expense reductionc | 2.26% | 2.36% | 2.32%d | 2.32% | 2.07% | ||||||||||||
Expenses incurred in connection with securities sold short | 0.47% | 0.45% | 0.40% | 0.44% | 0.20% | ||||||||||||
Net investment income (loss) | 2.54% | 1.64% | (0.18)% | (0.35)% | 0.08% | ||||||||||||
Supplemental data | |||||||||||||||||
Net assets, end of year (000’s) | $124,279 | $44,192 | $47,851 | $27,471 | $15,537 | ||||||||||||
Portfolio turnover rate | 257.70% | 225.53% | 177.61% | 236.64% | 271.51% | ||||||||||||
6 | Annual Report | The accompanying notes are an integral part of these consolidated financial statements. | franklintempleton.com | ||||
Year Ended May 31, | |||||||||||||||||
2024 | 2023 | 2022 | 2021 | 2020 | |||||||||||||
Advisor Class | |||||||||||||||||
Per share operating performance (for a share outstanding throughout the year) | |||||||||||||||||
Net asset value, beginning of year | $10.76 | $11.24 | $12.55 | $11.23 | $11.33 | ||||||||||||
Income from investment operationsa: | |||||||||||||||||
Net investment income (loss)b | 0.27 | 0.17 | (0.03) | (0.05) | —c | ||||||||||||
Net realized and unrealized gains (losses) | 0.81 | (0.32) | (0.69) | 1.47 | 0.01 | ||||||||||||
Total from investment operations | 1.08 | (0.15) | (0.72) | 1.42 | 0.01 | ||||||||||||
Less distributions from: | |||||||||||||||||
Net investment income | (0.08) | (0.24) | (0.09) | — | (0.10) | ||||||||||||
Net realized gains | — | (0.09) | (0.50) | (0.10) | (0.01) | ||||||||||||
Total distributions | (0.08) | (0.33) | (0.59) | (0.10) | (0.11) | ||||||||||||
Net asset value, end of year | $11.76 | $10.76 | $11.24 | $12.55 | $11.23 | ||||||||||||
Total return | 9.87% | (1.21)% | (6.05)% | 12.55% | 0.19% | ||||||||||||
Ratios to average net assets | |||||||||||||||||
Expenses before waiver, payments by affiliates and expense reductiond | 2.60% | 2.57% | 2.50% | 2.57% | 2.33% | ||||||||||||
Expenses net of waiver, payments by affiliates and expense reductiond | 2.33% | 2.39% | 2.35%e | 2.39% | 2.15% | ||||||||||||
Expenses incurred in connection with securities sold short | 0.47% | 0.45% | 0.40% | 0.44% | 0.20% | ||||||||||||
Net investment income (loss) | 2.46% | 1.55% | (0.24)% | (0.42)% | —f | ||||||||||||
Supplemental data | |||||||||||||||||
Net assets, end of year (000’s) | $438,766 | $710,974 | $1,099,387 | $1,152,105 | $977,094 | ||||||||||||
Portfolio turnover rate | 257.70% | 225.53% | 177.61% | 236.64% | 271.51% | ||||||||||||
franklintempleton.com | The accompanying notes are an integral part of these consolidated financial statements. | Annual Report | 7 | ||||
Country | Shares/ Warrants/ Rights | Value | |||||||||||||
Common Stocks and Other Equity Interests 20.2% | |||||||||||||||
Aerospace & Defense 0.0%† | |||||||||||||||
a | Astroscale Holdings Inc. | Japan | 1,600 | $8,648 | |||||||||||
a | Satellogic Inc., 1/25/27, wts. | United States | 2,058 | 243 | |||||||||||
8,891 | |||||||||||||||
Biotechnology 3.5% | |||||||||||||||
Amgen Inc. | United States | 6,973 | 2,132,692 | ||||||||||||
a | Apellis Pharmaceuticals Inc. | United States | 41,412 | 1,625,421 | |||||||||||
a | Apogee Therapeutics Inc. | United States | 19,447 | 887,561 | |||||||||||
a | Argenx SE, ADR | Netherlands | 3,267 | 1,212,122 | |||||||||||
a | Celldex Therapeutics Inc. | United States | 26,796 | 892,307 | |||||||||||
a,b | Crinetics Pharmaceuticals Inc. | United States | 46,969 | 2,085,893 | |||||||||||
a | Dyne Therapeutics Inc. | United States | 54,392 | 1,734,017 | |||||||||||
a | Ideaya Biosciences Inc. | United States | 16,994 | 621,131 | |||||||||||
a | Insmed Inc. | United States | 19,283 | 1,061,529 | |||||||||||
a,c | Krystal Biotech Inc. | United States | 5,727 | 916,606 | |||||||||||
a,b,c | Kymera Therapeutics Inc. | United States | 15,753 | 505,829 | |||||||||||
a,b | Neurocrine Biosciences Inc. | United States | 11,578 | 1,567,777 | |||||||||||
a | Regeneron Pharmaceuticals Inc. | United States | 2,171 | 2,127,927 | |||||||||||
a | Vaxcyte Inc. | United States | 20,312 | 1,427,324 | |||||||||||
a | Vera Therapeutics Inc., A | United States | 16,144 | 613,311 | |||||||||||
a,b | Vertex Pharmaceuticals Inc. | United States | 5,391 | 2,454,738 | |||||||||||
a | Xenon Pharmaceuticals Inc. | Canada | 16,099 | 612,889 | |||||||||||
22,479,074 | |||||||||||||||
Building Products 0.3% | |||||||||||||||
a | Johnson Controls International PLC | United States | 23,449 | 1,686,218 | |||||||||||
Capital Markets 0.0%† | |||||||||||||||
b | Palmer Square Capital BDC Inc. | United States | 3,910 | 64,280 | |||||||||||
Chemicals 0.0%† | |||||||||||||||
a,d | Covestro AG, 144A | Germany | 3,162 | 170,366 | |||||||||||
Communications Equipment 0.0%† | |||||||||||||||
a,b | Commscope Holding Co. Inc. | United States | 13,626 | 19,622 | |||||||||||
a,e | Riverbed Technology, Inc. | United States | 1,499 | — | |||||||||||
Spirent Communications PLC | United Kingdom | 44,520 | 104,718 | ||||||||||||
124,340 | |||||||||||||||
Construction & Engineering 1.3% | |||||||||||||||
a | Centuri Holdings Inc. | United States | 3,120 | 85,644 | |||||||||||
a | Mastec Inc. | United States | 42,735 | 4,797,004 | |||||||||||
Quanta Services Inc. | United States | 13,339 | 3,680,763 | ||||||||||||
8,563,411 | |||||||||||||||
Construction Materials 0.4% | |||||||||||||||
a | CRH PLC | United States | 27,347 | 2,235,891 | |||||||||||
Consumer Staples Distribution & Retail 0.0%† | |||||||||||||||
b,f | Albertsons Cos. Inc., A | United States | 12,882 | 265,884 | |||||||||||
Containers & Packaging 0.0%† | |||||||||||||||
DS Smith PLC | United Kingdom | 31,031 | 152,190 | ||||||||||||
8 | Annual Report | franklintempleton.com | ||||
Country | Shares/ Warrants/ Rights | Value | |||||||||||||
Common Stocks and Other Equity Interests (continued)20.2% | |||||||||||||||
Diversified Financial Services 0.0%† | |||||||||||||||
a | Conx Corp., A, 10/30/27, wts. | United States | 14,679 | $2,238 | |||||||||||
a | Nabors Energy Transition Corp. II, 9/05/28, wts. | United States | 2,168 | 280 | |||||||||||
a,e | Pegasus Acquisition Co. Europe BV, A | Netherlands | 30,999 | — | |||||||||||
a,e | Pershing Square Tontine Holdings Ltd., A | United States | 42,829 | — | |||||||||||
e | Pershing Square Tontine Holdings Ltd., Contingent Value, rts., 12/31/33, A | United States | 10,707 | — | |||||||||||
a | Southport Acquisition Corp., 5/24/28, wts. | United States | 4,946 | 256 | |||||||||||
a,e | Spree Acquisition Corp. 1 Ltd., 12/22/28, wts. | Israel | 3,069 | 77 | |||||||||||
a | Target Global Acquisition I Corp., A, 12/31/27, wts. | Israel | 3,516 | 308 | |||||||||||
a | Teract SA, 11/16/25, wts. | France | 3,920 | 2 | |||||||||||
3,161 | |||||||||||||||
Diversified Telecommunication Services 0.0%† | |||||||||||||||
a | Telecom Italia SpA | Italy | 433,740 | 114,337 | |||||||||||
Electric Utilities 2.9% | |||||||||||||||
Constellation Energy Corp. | United States | 31,268 | 6,792,973 | ||||||||||||
b | Edison International | United States | 34,556 | 2,655,629 | |||||||||||
Entergy Corp. | United States | 17,039 | 1,916,717 | ||||||||||||
Eversource Energy | United States | 16,318 | 966,515 | ||||||||||||
NextEra Energy Inc. | United States | 20,238 | 1,619,445 | ||||||||||||
b | PG&E Corp. | United States | 125,719 | 2,330,830 | |||||||||||
PPL Corp. | United States | 76,425 | 2,241,545 | ||||||||||||
18,523,654 | |||||||||||||||
Electrical Equipment 2.4% | |||||||||||||||
a | Array Technologies Inc. | United States | 103,718 | 1,470,721 | |||||||||||
a | Bloom Energy Corp., A | United States | 37,457 | 611,298 | |||||||||||
a,b | Enovix Corp. | United States | 161,898 | 1,719,357 | |||||||||||
a | Fluence Energy Inc., A | United States | 48,034 | 1,207,094 | |||||||||||
a | GE Vernova Inc. | United States | 22,273 | 3,917,821 | |||||||||||
a | Nextracker Inc., A | United States | 9,304 | 513,302 | |||||||||||
b,f | Vertiv Holdings Co., A | United States | 56,195 | 5,511,044 | |||||||||||
14,950,637 | |||||||||||||||
Energy Equipment & Services 0.1% | |||||||||||||||
a | Nabors Industries Ltd. | United States | 6,899 | 515,769 | |||||||||||
a | US Silica Holdings Inc. | United States | 1,142 | 17,690 | |||||||||||
533,459 | |||||||||||||||
Entertainment 0.1% | |||||||||||||||
Endeavor Group Holdings Inc., A | United States | 17,071 | 458,015 | ||||||||||||
Financial Services 0.1% | |||||||||||||||
a,d | Network International Holdings PLC, 144A | United Arab Emirates | 42,169 | 211,174 | |||||||||||
a,d | Nexi SpA, 144A | Italy | 18,289 | 121,742 | |||||||||||
332,916 | |||||||||||||||
Ground Transportation 0.1% | |||||||||||||||
ALPS Logistics Co. Ltd. | Japan | 979 | 35,289 | ||||||||||||
a,b | Uber Technologies Inc. | United States | 12,151 | 784,468 | |||||||||||
819,757 | |||||||||||||||
Health Care Equipment & Supplies 2.1% | |||||||||||||||
a | Axonics Inc. | United States | 1,772 | 118,884 | |||||||||||
a | Bausch + Lomb Corp. | United States | 654 | 10,032 | |||||||||||
b | Becton Dickinson & Co. | United States | 10,023 | 2,325,035 | |||||||||||
franklintempleton.com | Annual Report | 9 | ||||
Country | Shares/ Warrants/ Rights | Value | |||||||||||||
Common Stocks and Other Equity Interests (continued)20.2% | |||||||||||||||
Health Care Equipment & Supplies (continued)2.1% | |||||||||||||||
a,b | Boston Scientific Corp. | United States | 15,123 | $ 1,142,845 | |||||||||||
The Cooper Cos. Inc. | United States | 12,578 | 1,186,231 | ||||||||||||
b | GE Healthcare Technologies Inc. | United States | 6,093 | 475,254 | |||||||||||
a,b | Hologic Inc. | United States | 22,186 | 1,636,883 | |||||||||||
a | Inari Medical Inc. | United States | 41,731 | 2,086,550 | |||||||||||
a,b | Intuitive Surgical Inc. | United States | 4,416 | 1,775,762 | |||||||||||
a,e | Shockwave Medical Inc. | United States | 364 | 121,940 | |||||||||||
a | Solventum Corp. | United States | 14,960 | 887,726 | |||||||||||
a,c | Tandem Diabetes Care Inc. | United States | 34,276 | 1,755,960 | |||||||||||
13,523,102 | |||||||||||||||
Health Care Providers & Services 0.7% | |||||||||||||||
a,b | Amedisys Inc. | United States | 1,370 | 124,875 | |||||||||||
b | The Cigna Group | United States | 2,746 | 946,326 | |||||||||||
a,b | Community Health Systems Inc. | United States | 38,154 | 151,090 | |||||||||||
Humana Inc. | United States | 7,600 | 2,721,712 | ||||||||||||
a,c | OPKO Health Inc. | United States | 3,781 | 5,180 | |||||||||||
a | R1 Rcm Inc. | United States | 8,858 | 113,914 | |||||||||||
b | UnitedHealth Group Inc. | United States | 1,088 | 538,963 | |||||||||||
4,602,060 | |||||||||||||||
Hotels, Restaurants & Leisure 0.0%† | |||||||||||||||
a | HomeToGo SE, 12/31/25, wts. | Luxembourg | 716 | 1 | |||||||||||
a | Norwegian Cruise Line Holdings Ltd. | United States | 9,018 | 149,699 | |||||||||||
149,700 | |||||||||||||||
Independent Power & Renewable Electricity Producers 1.3% | |||||||||||||||
b | The AES Corp. | United States | 105,556 | 2,278,954 | |||||||||||
Clearway Energy Inc., C | United States | 19,002 | 532,056 | ||||||||||||
d | Neoen SA, 144A | France | 852 | 35,142 | |||||||||||
a,b | Sunnova Energy International Inc. | United States | 82,446 | 430,368 | |||||||||||
b | Vistra Corp. | United States | 46,993 | 4,656,067 | |||||||||||
7,932,587 | |||||||||||||||
Industrial Conglomerates 1.1% | |||||||||||||||
3M Co. | United States | 14,310 | 1,433,003 | ||||||||||||
General Electric Co. | United States | 23,911 | 3,948,663 | ||||||||||||
Hitachi Ltd. | Japan | 18,359 | 1,890,751 | ||||||||||||
7,272,417 | |||||||||||||||
Interactive Media & Services 0.0%† | |||||||||||||||
a | Karnov Group AB, B | Sweden | 4,395 | 36,228 | |||||||||||
IT Services 0.0%† | |||||||||||||||
a | Brand Engagement Network Inc., A, 3/14/29, wts. | United States | 241 | 36 | |||||||||||
a | Perficient Inc. | United States | 950 | 70,443 | |||||||||||
a | Squarespace Inc., A | United States | 816 | 35,904 | |||||||||||
106,383 | |||||||||||||||
Life Sciences Tools & Services 1.1% | |||||||||||||||
Agilent Technologies Inc. | United States | 8,666 | 1,130,133 | ||||||||||||
a | Avantor Inc. | United States | 69,300 | 1,668,744 | |||||||||||
a | Inotiv Inc. | United States | 2,165 | 4,049 | |||||||||||
Lonza Group AG | Switzerland | 1,613 | 875,618 | ||||||||||||
a | Maravai Lifesciences Holdings Inc., A | United States | 159,985 | 1,387,070 | |||||||||||
a | QIAGEN NV | United States | 43,481 | 1,880,988 | |||||||||||
6,946,602 | |||||||||||||||
10 | Annual Report | franklintempleton.com | ||||
Country | Shares/ Warrants/ Rights | Value | |||||||||||||
Common Stocks and Other Equity Interests (continued)20.2% | |||||||||||||||
Machinery 0.0%† | |||||||||||||||
a,c | Desktop Metal Inc., A | United States | 46,548 | $26,239 | |||||||||||
Media 0.1% | |||||||||||||||
a | Adtheorent Holding Co. Inc. | United States | 9,802 | 31,268 | |||||||||||
a,b | Altice USA Inc., A | United States | 116,237 | 288,268 | |||||||||||
Ascential PLC | United Kingdom | 8,823 | 36,767 | ||||||||||||
a,b | Clear Channel Outdoor Holdings Inc., A | United States | 3,780 | 5,443 | |||||||||||
a,b | Iheartmedia Inc., A | United States | 25,061 | 23,197 | |||||||||||
a,b,f | Liberty Media Corp. | United States | 10,204 | 231,223 | |||||||||||
616,166 | |||||||||||||||
Metals & Mining 0.0%† | |||||||||||||||
a | Samarco Mineracao SA Escrow | Brazil | 384,000 | 317,261 | |||||||||||
Oil, Gas & Consumable Fuels 0.2% | |||||||||||||||
a,e,g | Gazprom PJSC | Russia | 615,160 | — | |||||||||||
f | Golar LNG Ltd. | Bermuda | 4,770 | 125,403 | |||||||||||
Hess Corp. | United States | 1,361 | 209,730 | ||||||||||||
b | New Fortress Energy Inc., A | United States | 31,538 | 799,488 | |||||||||||
b | Targa Resources Corp. | United States | 2,284 | 270,038 | |||||||||||
1,404,659 | |||||||||||||||
Passenger Airlines 0.0%† | |||||||||||||||
a | Jetblue Airways Corp. | United States | 139 | 777 | |||||||||||
Pharmaceuticals 1.4% | |||||||||||||||
AstraZeneca PLC, ADR | United Kingdom | 26,217 | 2,045,450 | ||||||||||||
b | Eli Lilly & Co. | United States | 1,946 | 1,596,382 | |||||||||||
b | Merck & Co. Inc. | United States | 20,001 | 2,510,925 | |||||||||||
b | Novo Nordisk AS, ADR | Denmark | 18,943 | 2,562,609 | |||||||||||
8,715,366 | |||||||||||||||
Professional Services 0.1% | |||||||||||||||
Applus Services SA | Spain | 25,279 | 348,897 | ||||||||||||
a | Falcon's Beyond Global Inc., A, 9/01/27, wts. | United States | 180 | 270 | |||||||||||
349,167 | |||||||||||||||
Semiconductors & Semiconductor Equipment 0.2% | |||||||||||||||
a | Arm Holdings PLC, ADR | United States | 1,682 | 202,715 | |||||||||||
a | Enphase Energy Inc. | United States | 6,818 | 872,022 | |||||||||||
a | Sequans Communications SA, ADR | France | 109,092 | 85,092 | |||||||||||
1,159,829 | |||||||||||||||
Software 0.1% | |||||||||||||||
Altium Ltd. | Australia | 12,131 | 543,590 | ||||||||||||
Specialized REITs 0.3% | |||||||||||||||
Digital Realty Trust Inc. | United States | 5,559 | 807,945 | ||||||||||||
Equinix Inc. | United States | 922 | 703,467 | ||||||||||||
b | VICI Properties Inc., A | United States | 16,615 | 477,017 | |||||||||||
1,988,429 | |||||||||||||||
Textiles Apparel & Luxury Goods 0.0%† | |||||||||||||||
Gildan Activewear Inc., A | Canada | 335 | 12,820 | ||||||||||||
Trading Companies & Distributors 0.3% | |||||||||||||||
b | Herc Holdings Inc. | United States | 10,809 | 1,568,062 | |||||||||||
Total Common Stocks and Other Equity Interests (Cost $99,892,991) | 128,757,925 | ||||||||||||||
franklintempleton.com | Annual Report | 11 | ||||
Country | Shares/ Warrants/ Rights | Value | |||||||||||||
Investment Companies (Cost $51,150) 0.0%† | |||||||||||||||
Closed End Funds 0.0%† | |||||||||||||||
The Hipgnosis Songs Fund Ltd. Fund | United Kingdom | 39,587 | $ 50,685 | ||||||||||||
Total Investment Companies (Cost $51,150) | 50,685 | ||||||||||||||
Preferred Stocks 0.0%† | |||||||||||||||
Financial Services 0.0%† | |||||||||||||||
FHLMC, 8.375%, pfd., Z | United States | 31,347 | 153,287 | ||||||||||||
FNMA, 8.25%, pfd., S | United States | 28,676 | 148,541 | ||||||||||||
301,828 | |||||||||||||||
Total Preferred Stocks (Cost $226,082) | 301,828 | ||||||||||||||
Principal Amount* | |||||||||||||||
Convertible Bonds 11.9% | |||||||||||||||
Aerospace & Defense 0.1% | |||||||||||||||
Parsons Corp., senior note, 0.25%, 8/15/25 | United States | 269,000 | 454,920 | ||||||||||||
d | Rocket Lab USA Inc., senior note, 144A, 4.25%, 2/01/29 | United States | 24,000 | 26,280 | |||||||||||
481,200 | |||||||||||||||
Airlines 0.1% | |||||||||||||||
American Airlines Group Inc., senior note, 6.50%, 7/01/25 | United States | 12,000 | 12,430 | ||||||||||||
d | Cathay Pacific Finance III Ltd., senior note, Reg S, 2.75%, 2/05/26 | Hong Kong | 4,000,000 | HKD | 544,218 | ||||||||||
556,648 | |||||||||||||||
Automobile Components 0.1% | |||||||||||||||
LCI Industries, senior note, 1.125%, 5/15/26 | United States | 635,000 | 606,584 | ||||||||||||
Automobiles 0.0%† | |||||||||||||||
b,d | Rivian Automotive Inc., senior note, 144A, 3.625%, 10/15/30 | United States | 355,000 | 242,147 | |||||||||||
d | Winnebago Industries Inc., senior note, 144A, 3.25%, 1/15/30 | United States | 10,000 | 9,863 | |||||||||||
252,010 | |||||||||||||||
Biotechnology 1.0% | |||||||||||||||
Apellis Pharmaceuticals Inc., senior note, 3.50%, 9/15/26 | United States | 186,000 | 239,567 | ||||||||||||
b | BioMarin Pharmaceutical Inc., senior sub. note, 0.599%, 8/01/24 | United States | 724,000 | 717,846 | |||||||||||
d | Cerevel Therapeutics Holdings Inc., senior note, 144A, 2.50%, 8/15/27 | United States | 251,000 | 276,351 | |||||||||||
b | Coherus Biosciences Inc., senior sub. note, 1.50%, 4/15/26 | United States | 653,000 | 419,192 | |||||||||||
Cytokinetics Inc., senior note, 3.50%, 7/01/27 | United States | 289,000 | 354,459 | ||||||||||||
b | Dynavax Technologies Corp., senior note, 2.50%, 5/15/26 | United States | 1,111,000 | 1,431,412 | |||||||||||
Halozyme Therapeutics Inc., senior note, 0.25%, 3/01/27 | United States | 182,000 | 164,801 | ||||||||||||
Ironwood Pharmaceuticals Inc., senior note, | |||||||||||||||
0.75%, 6/15/24 | United States | 457,000 | 453,924 | ||||||||||||
1.50%, 6/15/26 | United States | 19,000 | 17,700 | ||||||||||||
Karyopharm Therapeutics Inc., senior note, 3.00%, 10/15/25 | United States | 85,000 | 54,502 | ||||||||||||
Mannkind Corp., senior note, 2.50%, 3/01/26 | United States | 672,000 | 770,784 | ||||||||||||
c | Mirum Pharmaceuticals Inc., senior note, 4.00%, 5/01/29 | United States | 22,000 | 24,324 | |||||||||||
Natera Inc., senior note, 2.25%, 5/01/27 | United States | 399,000 | 1,124,864 | ||||||||||||
b | Travere Therapeutics Inc., senior note, 2.25%, 3/01/29 | United States | 572,000 | 352,495 | |||||||||||
6,402,221 | |||||||||||||||
Broadline Retail 0.4% | |||||||||||||||
d | Alibaba Group Holding Ltd., senior note, 144A, 0.50%, 6/01/31 | China | 2,095,000 | 2,079,980 | |||||||||||
Etsy Inc., senior note, 0.125%, 10/01/26 | United States | 241,000 | 245,368 | ||||||||||||
d | JD.Com Inc., senior note, 144A, 0.25%, 6/01/29 | China | 9,000 | 8,874 | |||||||||||
2,334,222 | |||||||||||||||
Capital Markets 0.1% | |||||||||||||||
Coinbase Global Inc., senior note, 0.50%, 6/01/26 | United States | 384,000 | 396,672 | ||||||||||||
12 | Annual Report | franklintempleton.com | ||||
Country | Principal Amount* | Value | |||||||||||||
Convertible Bonds (continued) | |||||||||||||||
Chemicals 0.1% | |||||||||||||||
d | Danimer Scientific Inc., senior note, 144A, 3.25%, 12/15/26 | United States | 189,000 | $29,843 | |||||||||||
Livent Corp., senior note, 4.125%, 7/15/25 | United States | 478,000 | 660,535 | ||||||||||||
d | Purecycle Technologies Inc., senior note, 144A, 7.25%, 8/15/30 | United States | 24,000 | 13,102 | |||||||||||
703,480 | |||||||||||||||
Communications Equipment 0.0%† | |||||||||||||||
Viavi Solutions Inc., senior note, 1.625%, 3/15/26 | United States | 214,000 | 201,695 | ||||||||||||
Construction & Engineering 0.0%† | |||||||||||||||
Granite Construction Inc., senior note, 3.75%, 5/15/28 | United States | 25,000 | 36,525 | ||||||||||||
Consumer Finance 0.3% | |||||||||||||||
Encore Capital Group Inc., senior note, | |||||||||||||||
3.25%, 10/01/25 | United States | 279,000 | 342,612 | ||||||||||||
4.00%, 3/15/29 | United States | 459,000 | 435,820 | ||||||||||||
EZCORP Inc., senior note, | |||||||||||||||
2.875%, 7/01/24 | United States | 618,000 | 672,075 | ||||||||||||
d | 144A, 3.75%, 12/15/29 | United States | 188,000 | 217,046 | |||||||||||
d | Sofi Technologies Inc., senior note, 144A, 1.25%, 3/15/29 | United States | 289,000 | 274,695 | |||||||||||
d | SoFi Technologies Inc., senior note, 144A, zero cpn., 10/15/26 | United States | 212,000 | 183,380 | |||||||||||
2,125,628 | |||||||||||||||
Diversified Consumer Services 0.0%† | |||||||||||||||
Chegg Inc., senior note, 0.125%, 3/15/25 | United States | 336,000 | 315,841 | ||||||||||||
Diversified Financial Services 0.1% | |||||||||||||||
d | Bread Financial Holdings Inc., senior note, 144A, 4.25%, 6/15/28 | United States | 425,000 | 541,875 | |||||||||||
Lendingtree Inc., senior note, 0.50%, 7/15/25 | United States | 117,000 | 108,956 | ||||||||||||
Wisdomtree Inc., senior note, 5.75%, 8/15/28 | United States | 148,000 | 183,127 | ||||||||||||
833,958 | |||||||||||||||
Diversified Telecommunication Services 0.2% | |||||||||||||||
b,d | Match Group Financeco 2 Inc., senior note, 144A, 0.875%, 6/15/26 | United States | 1,195,000 | 1,083,984 | |||||||||||
Electrical Equipment 0.0%† | |||||||||||||||
d | Plug Power Inc., senior note, 144A, 7.00%, 6/01/26 | United States | 23,000 | 24,646 | |||||||||||
Electronic Equipment, Instruments & Components 0.1% | |||||||||||||||
PAR Technology Corp., senior note, 2.875%, 4/15/26 | United States | 239,000 | 294,901 | ||||||||||||
d | Vishay Intertechnology Inc., senior note, 144A, 2.25%, 9/15/30 | United States | 59,000 | 57,466 | |||||||||||
352,367 | |||||||||||||||
Energy Equipment & Services 0.2% | |||||||||||||||
b | Transocean Inc., senior note, 4.625%, 9/30/29 | United States | 564,000 | 1,140,408 | |||||||||||
Entertainment 0.3% | |||||||||||||||
c | Live Nation Entertainment Inc., senior note, 3.125%, 1/15/29 | United States | 68,000 | 75,500 | |||||||||||
b | The Marcus Corp., senior note, 5.00%, 9/15/25 | United States | 328,000 | 368,016 | |||||||||||
Sea Ltd., senior note, | |||||||||||||||
b | 2.375%, 12/01/25 | Singapore | 1,056,000 | 1,122,528 | |||||||||||
0.25%, 9/15/26 | Singapore | 58,000 | 50,373 | ||||||||||||
d | Sphere Entertainment Co., senior note, 144A, 3.50%, 12/01/28 | United States | 49,000 | 61,117 | |||||||||||
1,677,534 | |||||||||||||||
Financial Services 0.3% | |||||||||||||||
Block Inc., senior note, | |||||||||||||||
0.125%, 3/01/25 | United States | 813,000 | 782,065 | ||||||||||||
zero cpn., 5/01/26 | United States | 81,000 | 72,287 | ||||||||||||
d | Repay Holdings Corp., senior note, 144A, zero cpn., 2/01/26 | United States | 816,000 | 747,162 | |||||||||||
1,601,514 | |||||||||||||||
Food & Staples Retailing 0.1% | |||||||||||||||
The Chefs’ Warehouse Inc., senior note, 2.375%, 12/15/28 | United States | 305,000 | 341,752 | ||||||||||||
franklintempleton.com | Annual Report | 13 | ||||
Country | Principal Amount* | Value | |||||||||||||
Convertible Bonds (continued)(continued) | |||||||||||||||
Ground Transportation 0.1% | |||||||||||||||
Lyft Inc., senior note, | |||||||||||||||
1.50%, 5/15/25 | United States | 294,000 | $282,240 | ||||||||||||
d | 144A, 0.625%, 3/01/29 | United States | 19,000 | 19,589 | |||||||||||
Uber Technologies Inc., senior note, | |||||||||||||||
d | 144A, 0.875%, 12/01/28 | United States | 58,000 | 64,053 | |||||||||||
zero cpn., 12/15/25 | United States | 12,000 | 12,302 | ||||||||||||
378,184 | |||||||||||||||
Health Care Equipment & Supplies 0.7% | |||||||||||||||
CONMED Corp., senior note, 2.25%, 6/15/27 | United States | 380,000 | 342,608 | ||||||||||||
Glaukos Corp., senior note, 2.75%, 6/15/27 | United States | 634,000 | 1,339,008 | ||||||||||||
Haemonetics Corp., senior note, | |||||||||||||||
d | 144A, 2.50%, 6/01/29 | United States | 19,000 | 18,667 | |||||||||||
zero cpn., 3/01/26 | United States | 192,000 | 174,336 | ||||||||||||
Insulet Corp., senior note, 0.375%, 9/01/26 | United States | 501,000 | 520,847 | ||||||||||||
d | iRhythm Technologies Inc., senior note, 144A, 1.50%, 9/01/29 | United States | 67,000 | 61,058 | |||||||||||
Lantheus Holdings Inc., senior note, 2.625%, 12/15/27 | United States | 189,000 | 238,849 | ||||||||||||
Mesa Laboratories Inc., senior note, 1.375%, 8/15/25 | United States | 244,000 | 229,628 | ||||||||||||
c,d | Tandem Diabetes Care Inc., 2024, senior note, 144A, 1.50%, 3/15/29 | United States | 480,000 | 798,960 | |||||||||||
b | Varex Imaging Corp., senior note, 4.00%, 6/01/25 | United States | 720,000 | 736,200 | |||||||||||
4,460,161 | |||||||||||||||
Health Care Providers & Services 0.2% | |||||||||||||||
NeoGenomics Inc., senior note, 1.25%, 5/01/25 | United States | 787,000 | 753,552 | ||||||||||||
d | OPKO Health Inc., senior note, 144A, 3.75%, 1/15/29 | United States | 197,000 | 244,241 | |||||||||||
PetIQ Inc., senior note, 4.00%, 6/01/26 | United States | 268,000 | 279,980 | ||||||||||||
1,277,773 | |||||||||||||||
Health Care Technology 0.4% | |||||||||||||||
Bill Holdings Inc., senior note, zero cpn., | |||||||||||||||
12/01/25 | United States | 123,000 | 113,957 | ||||||||||||
4/01/27 | United States | 241,000 | 205,332 | ||||||||||||
Evolent Health Inc., senior note, | |||||||||||||||
1.50%, 10/15/25 | United States | 513,000 | 504,664 | ||||||||||||
c,d | 144A, 3.50%, 12/01/29 | United States | 47,000 | 43,557 | |||||||||||
Health Catalyst Inc., senior note, 2.50%, 4/15/25 | United States | 380,000 | 368,600 | ||||||||||||
c | Integra Lifesciences Holdings Corp., senior note, 0.50%, 8/15/25 | United States | 787,000 | 739,977 | |||||||||||
b | Unity Software Inc., senior note, zero cpn., 11/15/26 | United States | 384,000 | 330,048 | |||||||||||
2,306,135 | |||||||||||||||
Hotel & Resort REITs 0.2% | |||||||||||||||
b | Pebblebrook Hotel Trust, senior note, 1.75%, 12/15/26 | United States | 865,000 | 764,487 | |||||||||||
c | Summit Hotel Properties Inc., senior note, 1.50%, 2/15/26 | United States | 325,000 | 290,225 | |||||||||||
1,054,712 | |||||||||||||||
Hotels, Restaurants & Leisure 0.6% | |||||||||||||||
b | Carnival Corp., senior note, 5.75%, 10/01/24 | United States | 557,000 | 850,616 | |||||||||||
Cracker Barrel Old Country Store Inc., senior note, 0.625%, 6/15/26 | United States | 377,000 | 331,948 | ||||||||||||
Draftkings Holdings Inc., senior note, zero cpn., 3/15/28 | United States | 193,000 | 156,137 | ||||||||||||
Expedia Group Inc., senior note, zero cpn., 2/15/26 | United States | 669,000 | 608,754 | ||||||||||||
Marriott Vacations Worldwide Corp., senior note, | |||||||||||||||
3.25%, 12/15/27 | United States | 48,000 | 43,704 | ||||||||||||
zero cpn., 1/15/26 | United States | 815,000 | 751,104 | ||||||||||||
Penn Entertainment Inc., senior note, 2.75%, 5/15/26 | United States | 625,000 | 663,144 | ||||||||||||
Royal Caribbean Cruises Ltd., senior note, 6.00%, 8/15/25 | United States | 145,000 | 435,707 | ||||||||||||
3,841,114 | |||||||||||||||
14 | Annual Report | franklintempleton.com | ||||
Country | Principal Amount* | Value | |||||||||||||
Convertible Bonds (continued)(continued) | |||||||||||||||
Independent Power & Renewable Electricity Producers 0.1% | |||||||||||||||
b,d | Nextera Energy Partners LP, senior note, 144A, zero cpn., 11/15/25 | United States | 512,000 | $461,952 | |||||||||||
Interactive Media & Services 0.1% | |||||||||||||||
Snap Inc., senior note, | |||||||||||||||
0.75%, 8/01/26 | United States | 67,000 | 69,404 | ||||||||||||
zero cpn., 5/01/27 | United States | 96,000 | 78,991 | ||||||||||||
0.125%, 3/01/28 | United States | 675,000 | 531,469 | ||||||||||||
d | 144A, 0.50%, 5/01/30 | United States | 67,000 | 64,901 | |||||||||||
744,765 | |||||||||||||||
Internet & Direct Marketing Retail 0.6% | |||||||||||||||
Airbnb Inc., senior note, zero cpn., 3/15/26 | United States | 288,000 | 262,368 | ||||||||||||
d | Delivery Hero SE, senior note, Reg S, 3.25%, 2/21/30 | South Korea | 2,000,000 | EUR | 2,041,450 | ||||||||||
d | Just Eat Takeaway.com NV, senior note, Reg S, 1.25%, 4/30/26 | United Kingdom | 600,000 | EUR | 596,051 | ||||||||||
b | The Realreal Inc., senior note, 1.00%, 3/01/28 | United States | 619,000 | 301,701 | |||||||||||
b | Spotify USA Inc., senior note, zero cpn., 3/15/26 | United States | 336,000 | 315,674 | |||||||||||
3,517,244 | |||||||||||||||
IT Services 0.8% | |||||||||||||||
Cloudflare Inc., senior note, zero cpn., 8/15/26 | United States | 912,000 | 815,556 | ||||||||||||
Digitalocean Holdings Inc., senior note, zero cpn., 12/01/26 | United States | 1,012,000 | 855,140 | ||||||||||||
b | MongoDB Inc., senior note, 0.25%, 1/15/26 | United States | 928,000 | 1,174,152 | |||||||||||
Okta Inc., senior note, | |||||||||||||||
c | 0.125%, 9/01/25 | United States | 528,000 | 498,432 | |||||||||||
0.375%, 6/15/26 | United States | 607,000 | 552,006 | ||||||||||||
Rapid7 Inc., senior note, | |||||||||||||||
0.25%, 3/15/27 | United States | 48,000 | 42,240 | ||||||||||||
d | 144A, 1.25%, 3/15/29 | United States | 12,000 | 10,659 | |||||||||||
Shift4 Payments Inc., senior note, | |||||||||||||||
c | 0.50%, 8/01/27 | United States | 178,000 | 164,561 | |||||||||||
b | zero cpn., 12/15/25 | United States | 480,000 | 527,856 | |||||||||||
b | Shopify Inc., senior note, 0.125%, 11/01/25 | Canada | 721,000 | 671,251 | |||||||||||
5,311,853 | |||||||||||||||
Leisure Products 0.4% | |||||||||||||||
NCL Corp. Ltd., senior note, | |||||||||||||||
5.375%, 8/01/25 | United States | 672,000 | 777,712 | ||||||||||||
b | 1.125%, 2/15/27 | United States | 772,000 | 691,770 | |||||||||||
2.50%, 2/15/27 | United States | 326,000 | 302,324 | ||||||||||||
d | Peloton Interactive Inc., senior note, 144A, 5.50%, 12/01/29 | United States | 242,000 | 250,654 | |||||||||||
b | Topgolf Callaway Brands Corp., senior note, 2.75%, 5/01/26 | United States | 558,000 | 626,355 | |||||||||||
2,648,815 | |||||||||||||||
Life Sciences Tools & Services 0.0%† | |||||||||||||||
e | Inotiv Inc., senior note, 3.25%, 10/15/27 | United States | 239,000 | 94,384 | |||||||||||
d | Repligen Corp., senior note, 144A, 1.00%, 12/15/28 | United States | 12,000 | 11,928 | |||||||||||
106,312 | |||||||||||||||
Machinery 0.4% | |||||||||||||||
Bloom Energy Corp., senior note, | |||||||||||||||
2.50%, 8/15/25 | United States | 522,000 | 639,398 | ||||||||||||
d | 144A, 3.00%, 6/01/28 | United States | 187,000 | 208,982 | |||||||||||
d | 144A, 3.00%, 6/01/29 | United States | 19,000 | 19,637 | |||||||||||
b | Chart Industries Inc., senior sub. note, 1.00%, 11/15/24 | United States | 265,000 | 710,763 | |||||||||||
d | Desktop Metal Inc., senior note, 144A, 6.00%, 5/15/27 | United States | 297,000 | 188,611 | |||||||||||
b | The Greenbrier Cos. Inc., senior note, 2.875%, 4/15/28 | United States | 567,000 | 646,238 | |||||||||||
2,413,629 | |||||||||||||||
franklintempleton.com | Annual Report | 15 | ||||
Country | Principal Amount* | Value | |||||||||||||
Convertible Bonds (continued)(continued) | |||||||||||||||
Media 0.3% | |||||||||||||||
d | Cardlytics Inc., senior note, 144A, 4.25%, 4/01/29 | United States | 103,000 | $87,730 | |||||||||||
Liberty Interactive LLC, | |||||||||||||||
senior bond, 4.00%, 11/15/29 | United States | 424,203 | 146,350 | ||||||||||||
senior note, 3.75%, 2/15/30 | United States | 1,267,000 | 484,627 | ||||||||||||
d | Liberty Media Corp., senior bond, 144A, | ||||||||||||||
b | 2.75%, 12/01/49 | United States | 662,000 | 624,266 | |||||||||||
2.375%, 9/30/53 | United States | 578,000 | 620,483 | ||||||||||||
1,963,456 | |||||||||||||||
Metals & Mining 0.2% | |||||||||||||||
b | ATI Inc., senior note, 3.50%, 6/15/25 | United States | 284,000 | 1,128,048 | |||||||||||
Century Aluminum Co., senior note, 2.75%, 5/01/28 | United States | 135,000 | 158,288 | ||||||||||||
b | Ivanhoe Mines Ltd., senior note, 2.50%, 4/15/26 | Canada | 118,000 | 236,517 | |||||||||||
SSR Mining Inc., senior bond, 2.50%, 4/01/39 | Canada | 29,000 | 25,991 | ||||||||||||
1,548,844 | |||||||||||||||
Oil, Gas & Consumable Fuels 0.1% | |||||||||||||||
Enphase Energy Inc., senior note, zero cpn., | |||||||||||||||
3/01/26 | United States | 413,000 | 382,541 | ||||||||||||
3/01/28 | United States | 96,000 | 83,386 | ||||||||||||
Green Plains Inc., senior note, 2.25%, 3/15/27 | United States | 326,000 | 295,095 | ||||||||||||
d | Kosmos Energy Ltd., senior note, 144A, 3.125%, 3/15/30 | Ghana | 190,000 | 209,808 | |||||||||||
970,830 | |||||||||||||||
Personal Products 0.0%† | |||||||||||||||
c,d | The Beauty Health Co., senior note, 144A, 1.25%, 10/01/26 | United States | 12,000 | 9,994 | |||||||||||
Pharmaceuticals 0.3% | |||||||||||||||
Collegium Pharmaceutical Inc., senior note, 2.875%, 2/15/29 | United States | 298,000 | 335,548 | ||||||||||||
Innoviva Inc., senior note, 2.125%, 3/15/28 | United States | 588,000 | 523,939 | ||||||||||||
Jazz Investments I Ltd., senior note, 1.50%, 8/15/24 | United States | 911,000 | 902,346 | ||||||||||||
Pacira Biosciences Inc., senior note, 0.75%, 8/01/25 | United States | 326,000 | 305,592 | ||||||||||||
c,d | 144A, 2.125%, 5/15/29 | United States | 48,000 | 49,224 | |||||||||||
2,116,649 | |||||||||||||||
Professional Services 0.1% | |||||||||||||||
d | CSG Systems International Inc., senior note, 144A, 3.875%, 9/15/28 | United States | 317,000 | 294,334 | |||||||||||
Dayforce Inc., senior note, 0.25%, 3/15/26 | United States | 193,000 | 176,209 | ||||||||||||
470,543 | |||||||||||||||
Real Estate Management & Development 0.1% | |||||||||||||||
Realogy Group LLC / Realogy Co.-Issuer Corp., senior note, 0.25%, 6/15/26 | United States | 12,000 | 10,013 | ||||||||||||
Redfin Corp., senior note, 0.50%, 4/01/27 | United States | 234,000 | 131,040 | ||||||||||||
d | Storagevault Canada Inc., senior note, 144A, 5.00%, 3/31/28 | Canada | 78,000 | CAD | 52,078 | ||||||||||
Zillow Group Inc., senior note, 1.375%, 9/01/26 | United States | 125,000 | 142,491 | ||||||||||||
335,622 | |||||||||||||||
Semiconductors & Semiconductor Equipment 0.3% | |||||||||||||||
d | ams-OSRAM AG, ., senior note, Reg S, 2.125%, 11/03/27 | Austria | 200,000 | EUR | 171,981 | ||||||||||
Maxeon Solar Technologies Ltd., senior note, 6.50%, 7/15/25 | United States | 655,000 | 295,077 | ||||||||||||
d | Microchip Technology Inc., senior note, 144A, 0.75%, 6/01/30 | United States | 144,000 | 147,477 | |||||||||||
d | MKS Instruments Inc., senior note, 144A, 1.25%, 6/01/30 | United States | 19,000 | 19,551 | |||||||||||
SMART Global Holdings Inc., senior note, 2.00%, 2/01/29 | United States | 235,000 | 271,334 | ||||||||||||
Veeco Instruments Inc., senior note, | |||||||||||||||
3.50%, 1/15/25 | United States | 75,000 | 128,129 | ||||||||||||
3.75%, 6/01/27 | United States | 198,000 | 579,947 | ||||||||||||
16 | Annual Report | franklintempleton.com | ||||
Country | Principal Amount* | Value | |||||||||||||
Convertible Bonds (continued)(continued) | |||||||||||||||
Semiconductors & Semiconductor Equipment (continued) 0.3% | |||||||||||||||
2.875%, 6/01/29 | United States | 12,000 | $18,624 | ||||||||||||
1,632,120 | |||||||||||||||
Software 1.5% | |||||||||||||||
d | Alarm.Com Holdings Inc., senior note, 144A, 2.25%, 6/01/29 | United States | 48,000 | 47,573 | |||||||||||
d | Blackline Inc., senior note, 144A, 1.00%, 6/01/29 | United States | 19,000 | 18,212 | |||||||||||
Confluent Inc., senior note, zero cpn., 1/15/27 | United States | 241,000 | 204,127 | ||||||||||||
Datadog Inc., senior note, 0.125%, 6/15/25 | United States | 840,000 | 1,082,340 | ||||||||||||
Dropbox Inc., senior note, zero cpn., | |||||||||||||||
3/01/26 | United States | 232,000 | 217,152 | ||||||||||||
3/01/28 | United States | 96,000 | 87,480 | ||||||||||||
Envestnet Inc., senior note, | |||||||||||||||
0.75%, 8/15/25 | United States | 480,000 | 462,240 | ||||||||||||
2.625%, 12/01/27 | United States | 192,000 | 211,680 | ||||||||||||
Five9 Inc., senior note, | |||||||||||||||
0.50%, 6/01/25 | United States | 664,000 | 629,472 | ||||||||||||
d | 144A, 1.00%, 3/15/29 | United States | 48,000 | 43,283 | |||||||||||
b,c | Guidewire Software Inc., senior note, 1.25%, 3/15/25 | United States | 892,000 | 991,904 | |||||||||||
Hubspot Inc., senior note, 0.375%, 6/01/25 | United States | 574,000 | 1,243,284 | ||||||||||||
Jamf Holding Corp., senior note, 0.125%, 9/01/26 | United States | 364,000 | 319,519 | ||||||||||||
Microstrategy Inc., senior note, | |||||||||||||||
d | 144A, 0.625%, 3/15/30 | United States | 25,000 | 30,424 | |||||||||||
c,d | 144A, 0.875%, 3/15/31 | United States | 24,000 | 22,356 | |||||||||||
zero cpn., 2/15/27 | United States | 19,000 | 24,425 | ||||||||||||
Mitek Systems Inc., senior note, 0.75%, 2/01/26 | United States | 384,000 | 372,250 | ||||||||||||
d | Pagerduty Inc., senior note, 144A, 1.50%, 10/15/28 | United States | 48,000 | 46,858 | |||||||||||
Pegasystems Inc., senior note, 0.75%, 3/01/25 | United States | 1,184,000 | 1,141,968 | ||||||||||||
d | Porch Group Inc., senior note, 144A, 0.75%, 9/15/26 | United States | 350,000 | 198,625 | |||||||||||
d | Progress Software Corp., senior note, 144A, 3.50%, 3/01/30 | United States | 48,000 | 47,059 | |||||||||||
Q2 Holdings Inc., senior note, | |||||||||||||||
0.125%, 11/15/25 | United States | 336,000 | 313,992 | ||||||||||||
c | 0.75%, 6/01/26 | United States | 612,000 | 611,082 | |||||||||||
Ringcentral Inc., senior note, zero cpn., 3/15/26 | United States | 309,000 | 281,499 | ||||||||||||
Verint Systems Inc., senior note, 0.25%, 4/15/26 | United States | 276,000 | 251,436 | ||||||||||||
Zscaler Inc., senior note, 0.125%, 7/01/25 | United States | 478,000 | 592,481 | ||||||||||||
9,492,721 | |||||||||||||||
Specialty Retail 0.3% | |||||||||||||||
The Cheesecake Factory Inc., senior note, 0.375%, 6/15/26 | United States | 526,000 | 476,819 | ||||||||||||
National Vision Holdings Inc., senior note, 2.50%, 5/15/25 | United States | 179,000 | 175,420 | ||||||||||||
Wayfair Inc., senior note, | |||||||||||||||
1.00%, 8/15/26 | United States | 627,000 | 572,859 | ||||||||||||
A, 0.625%, 10/01/25 | United States | 868,000 | 815,920 | ||||||||||||
2,041,018 | |||||||||||||||
Technology Hardware, Storage & Peripherals 0.1% | |||||||||||||||
d | Seagate HDD Cayman, senior note, 144A, 3.50%, 6/01/28 | United States | 193,000 | 244,049 | |||||||||||
d | Super Micro Computer Inc., senior note, 144A, zero cpn., 3/01/29 | United States | 288,000 | 281,520 | |||||||||||
d | Western Digital Corp., senior note, 144A, 3.00%, 11/15/28 | United States | 24,000 | 38,028 | |||||||||||
563,597 | |||||||||||||||
Transportation Infrastructure 0.5% | |||||||||||||||
b | Eagle Bulk Shipping Inc., senior note, 5.00%, 8/01/24 | United States | 1,311,000 | 2,990,391 | |||||||||||
Total Convertible Bonds (Cost $74,270,966) | 74,127,323 | ||||||||||||||
franklintempleton.com | Annual Report | 17 | ||||
Country | Principal Amount* | Value | |||||||||||||
Convertible Bonds in Reorganization 0.0%† | |||||||||||||||
Airlines 0.0%† | |||||||||||||||
d,h | GOL Equity Finance SA, senior note, 144A, 3.75%, 7/15/24 | Brazil | 348,000 | $60,900 | |||||||||||
Automobiles 0.0%† | |||||||||||||||
d,e,h | Fisker Inc., senior note, 144A, 2.50%, 9/15/26 | United States | 951,000 | 4,850 | |||||||||||
Chemicals 0.0%† | |||||||||||||||
h | Amyris Inc., senior note, zero cpn., 11/15/26 | United States | 1,108,000 | 38,780 | |||||||||||
Specialty Retail 0.0%† | |||||||||||||||
d,e,h | Shift Technologies Inc., senior note, 144A, 4.75%, 5/15/26 | United States | 1,014,000 | 3,803 | |||||||||||
Total Convertible Bonds in Reorganization (Cost $2,913,186) | 108,333 | ||||||||||||||
Corporate Bonds and Notes 5.1% | |||||||||||||||
Automobiles 0.0%† | |||||||||||||||
b,d | Aston Martin Capital Holdings Ltd., senior secured note, 144A, 10.00%, 3/31/29 | United Kingdom | 166,000 | 160,793 | |||||||||||
Banks 0.3% | |||||||||||||||
d,i | Akbank TAS, junior sub. note, 144A, 9.369%, Perpetual | Turkey | 536,000 | 533,192 | |||||||||||
d | Banco de Credito del Peru SA, senior note, 144A, 7.85%, 1/11/29 | Peru | 1,518,000 | PEN | 413,424 | ||||||||||
d,i | Standard Chartered PLC, junior sub. note, 144A, 7.875%, Perpetual | United Kingdom | 427,000 | 424,782 | |||||||||||
d,i | Turkiye Vakiflar Bankasi Tao, junior sub. note, 144A, 10.117%, Perpetual | Turkey | 679,000 | 689,239 | |||||||||||
2,060,637 | |||||||||||||||
Biotechnology 0.0%† | |||||||||||||||
d | Cidron Aida Finco Sarl, senior secured note, Reg S, 6.25%, 4/01/28 | Luxembourg | 234,000 | GBP | 286,020 | ||||||||||
Capital Markets 0.0%† | |||||||||||||||
d | Blackstone Private Credit Fund, senior note, 144A, 5.95%, 7/16/29 | United States | 93,000 | 91,548 | |||||||||||
Construction & Engineering 0.0%† | |||||||||||||||
d | Infrastrutture Wireless Italiane SpA, E, senior bond, Reg S, 1.75%, 4/19/31 | Italy | 110,000 | EUR | 105,212 | ||||||||||
Diversified Consumer Services 0.0%† | |||||||||||||||
d | Allied Universal Holdco LLC / Allied Universal Finance Corp., senior secured note, 144A, 6.625%, 7/15/26 | United States | 78,000 | 78,018 | |||||||||||
Diversified Financial Services 0.0%† | |||||||||||||||
BlackRock TCP Capital Corp., senior note, 6.95%, 5/30/29 | United States | 30,000 | 29,562 | ||||||||||||
d | Tesco Corporate Treasury Services PLC, E, senior note, Reg S, 0.375%, 7/27/29 | United Kingdom | 248,000 | EUR | 228,829 | ||||||||||
258,391 | |||||||||||||||
Electric Utilities 0.4% | |||||||||||||||
b | Edison International, junior sub. bond, | ||||||||||||||
8.125%, 6/15/53 | United States | 1,088,000 | 1,128,125 | ||||||||||||
7.875%, 6/15/54 | United States | 1,540,000 | 1,577,652 | ||||||||||||
2,705,777 | |||||||||||||||
Energy Equipment & Services 0.2% | |||||||||||||||
b,d | Nabors Industries Ltd., senior note, 144A, 7.25%, 1/15/26 | United States | 976,000 | 979,132 | |||||||||||
Equity Real Estate Investment Trusts (REITs) 0.3% | |||||||||||||||
b,d | Uniti Group LP / Uniti Group Finance Inc. / CSL Capital LLC, senior secured note, 144A, 10.50%, 2/15/28 | United States | 1,452,000 | 1,453,622 | |||||||||||
d | Uniti Group LP / Uniti Group Finance Inc. / CSL Capital LLC, MAY, senior secured note, 144A, 10.50%, 2/15/28 | United States | 165,000 | 165,184 | |||||||||||
1,618,806 | |||||||||||||||
18 | Annual Report | franklintempleton.com | ||||
Country | Principal Amount* | Value | |||||||||||||
Corporate Bonds and Notes (continued) 5.1% | |||||||||||||||
Health Care Providers & Services 0.4% | |||||||||||||||
d | Community Health Systems Inc., senior secured note, 144A, | ||||||||||||||
b | 5.625%, 3/15/27 | United States | 2,009,000 | $1,904,444 | |||||||||||
10.875%, 1/15/32 | United States | 320,000 | 331,038 | ||||||||||||
2,235,482 | |||||||||||||||
Health Care Technology 0.3% | |||||||||||||||
d | Cloud Software Group Inc., senior secured note, 144A, 8.25%, 6/30/32 | United States | 605,000 | 611,487 | |||||||||||
b,d | Open Text Corp., senior secured note, 144A, 6.90%, 12/01/27 | Canada | 976,000 | 1,002,124 | |||||||||||
1,613,611 | |||||||||||||||
Hotels, Restaurants & Leisure 0.1% | |||||||||||||||
d | Carnival Corp., senior secured note, 144A, 4.00%, 8/01/28 | United States | 926,000 | 855,289 | |||||||||||
Household Durables 0.3% | |||||||||||||||
b,d | K. Hovnanian Enterprises Inc., senior secured note, 144A, | ||||||||||||||
8.00%, 9/30/28 | United States | 500,000 | 503,750 | ||||||||||||
11.75%, 9/30/29 | United States | 975,000 | 1,083,430 | ||||||||||||
1,587,180 | |||||||||||||||
Internet & Direct Marketing Retail 0.3% | |||||||||||||||
d | Prosus NV, senior bond, Reg S, 2.778%, 1/19/34 | China | 785,000 | EUR | 700,331 | ||||||||||
b,d | Rakuten Group Inc., senior note, 144A, 11.25%, 2/15/27 | Japan | 890,000 | 939,751 | |||||||||||
1,640,082 | |||||||||||||||
Leisure Products 0.3% | |||||||||||||||
b,d | Life Time Inc., senior secured note, 144A, 5.75%, 1/15/26 | United States | 2,000,000 | 1,989,736 | |||||||||||
Media 0.4% | |||||||||||||||
b,d | Advantage Sales & Marketing Inc., senior secured note, 144A, 6.50%, 11/15/28 | United States | 165,000 | 148,636 | |||||||||||
b | Charter Communications Operating LLC / Charter Communications Operating Capital, senior secured bond, | ||||||||||||||
3.70%, 4/01/51 | United States | 351,000 | 215,038 | ||||||||||||
4.40%, 12/01/61 | United States | 669,000 | 435,815 | ||||||||||||
3.95%, 6/30/62 | United States | 562,000 | 334,416 | ||||||||||||
b,d | Clear Channel Outdoor Holdings Inc., senior note, 144A, | ||||||||||||||
7.75%, 4/15/28 | United States | 352,000 | 303,964 | ||||||||||||
7.50%, 6/01/29 | United States | 302,000 | 248,244 | ||||||||||||
d | CSC Holdings LLC, 144A, | ||||||||||||||
senior bond, 5.75%, 1/15/30 | United States | 66,000 | 28,585 | ||||||||||||
b | senior note, 11.75%, 1/31/29 | United States | 345,000 | 274,390 | |||||||||||
b,d | Gannett Holdings LLC, senior secured note, 144A, 6.00%, 11/01/26 | United States | 168,000 | 159,239 | |||||||||||
b,d | iHeartCommunications Inc., senior secured note, 144A, | ||||||||||||||
5.25%, 8/15/27 | United States | 124,000 | 68,626 | ||||||||||||
4.75%, 1/15/28 | United States | 171,000 | 90,561 | ||||||||||||
d,k | Univision Communications Inc., senior secured note, 144A, 8.50%, 7/31/31 | United States | 104,000 | 102,356 | |||||||||||
2,409,870 | |||||||||||||||
Metals & Mining 0.0%† | | ||||||||||||||
d | We Soda Investments Holding PLC, senior secured note, 144A, 9.50%, 10/06/28 | Turkey | 252,000 | 259,096 | |||||||||||
Oil, Gas & Consumable Fuels 0.7% | |||||||||||||||
Ecopetrol SA, senior bond, 8.375%, 1/19/36 | Colombia | 1,059,000 | 1,035,527 | ||||||||||||
b | Energy Transfer LP, junior sub. bond, 8.00%, 5/15/54 | United States | 472,000 | 491,736 | |||||||||||
b,d | Moss Creek Resources Holdings Inc., senior note, 144A, 10.50%, 5/15/27 | United States | 843,000 | 863,324 | |||||||||||
franklintempleton.com | Annual Report | 19 | ||||
Country | Principal Amount* | Value | |||||||||||||
Corporate Bonds and Notes (continued) 5.1% | |||||||||||||||
Oil, Gas & Consumable Fuels (continued) 0.7% | |||||||||||||||
Petroleos Mexicanos, senior bond, 6.35%, 2/12/48 | Mexico | 1,502,000 | $972,932 | ||||||||||||
b,d | Vital Energy Inc., senior note, 144A, 7.875%, 4/15/32 | United States | 498,000 | 505,986 | |||||||||||
d | Yinson Boronia Production BV, senior secured bond, 144A, 8.947%, 7/31/42 | Brazil | 379,000 | 382,790 | |||||||||||
d | YPF Sociedad Anonima, | ||||||||||||||
senior note, Reg S, 8.50%, 3/23/25 | Argentina | 79,000 | 78,985 | ||||||||||||
senior secured note, 144A, 9.50%, 1/17/31 | Argentina | 379,000 | 383,372 | ||||||||||||
4,714,652 | |||||||||||||||
Pharmaceuticals 0.3% | |||||||||||||||
d | Bausch Health Cos. Inc., 144A, | ||||||||||||||
senior bond, 7.25%, 5/30/29 | United States | 163,000 | 90,707 | ||||||||||||
senior bond, 5.25%, 1/30/30 | United States | 33,000 | 16,873 | ||||||||||||
senior bond, 5.25%, 2/15/31 | United States | 54,000 | 27,210 | ||||||||||||
senior note, 6.25%, 2/15/29 | United States | 344,000 | 184,470 | ||||||||||||
b | senior secured note, 5.50%, 11/01/25 | United States | 1,299,000 | 1,226,314 | |||||||||||
senior secured note, 6.125%, 2/01/27 | United States | 54,000 | 44,894 | ||||||||||||
senior secured note, 11.00%, 9/30/28 | United States | 77,000 | 67,375 | ||||||||||||
1,657,843 | |||||||||||||||
Software 0.1% | |||||||||||||||
b,d | Alteryx Inc., senior note, 144A, 8.75%, 3/15/28 | United States | 410,000 | 420,995 | |||||||||||
Specialty Retail 0.2% | |||||||||||||||
b,d,j | Carvana Co., senior secured note, 144A, PIK, 14.00%, 6/01/31 | United States | 384,507 | 405,571 | |||||||||||
b,d | Guitar Center Inc., senior secured note, 144A, 8.50%, 1/15/26 | United States | 598,000 | 539,408 | |||||||||||
d | Mitchells & Butlers Finance PLC, B2, senior secured bond, Reg S, 6.013%, 12/15/28 | United Kingdom | 422,672 | GBP | 520,700 | ||||||||||
1,465,679 | |||||||||||||||
Telecommunications 0.3% | |||||||||||||||
America Movil SAB de CV, senior note, | |||||||||||||||
10.125%, 1/22/29 | Mexico | 10,830,000l | MXN | 623,157 | |||||||||||
9.50%, 1/27/31 | Mexico | 18,830,000l | MXN | 1,046,018 | |||||||||||
1,669,175 | |||||||||||||||
Transportation 0.1% | |||||||||||||||
b | Canadian Pacific Railway Co., senior bond, 2.45%, 12/02/31 | Canada | 982,000 | 887,450 | |||||||||||
Total Corporate Bonds and Notes (Cost $31,082,215) | 31,750,474 | ||||||||||||||
Corporate Bonds and Notes in Reorganization 0.1% | | ||||||||||||||
Diversified Telecommunication Services 0.0%† | |||||||||||||||
d,h,j | Ligado Networks LLC, senior secured note, 144A, PIK, 15.50%, 7/07/24 | United States | 1,339,350 | 200,903 | |||||||||||
Metals & Mining 0.1% | |||||||||||||||
a,d,h,j | Samarco Mineracao SA, senior note, 144A, PIK, 9.50%, 6/30/31 | Brazil | 572,913 | 536,075 | |||||||||||
Real Estate Management & Development 0.0%† | |||||||||||||||
d,h | Kaisa Group Holdings Ltd., Reg S, | ||||||||||||||
senior note, 11.95%, 10/22/22 | China | 399,000 | 13,466 | ||||||||||||
senior secured note, 8.50%, 6/30/22 | China | 420,000 | 14,175 | ||||||||||||
senior secured note, 11.25%, 4/16/25 | China | 537,000 | 18,124 | ||||||||||||
h | Zhenro Properties Group Ltd., senior note, | ||||||||||||||
8.00%, 3/06/23 | China | 981,000 | 6,131 | ||||||||||||
d | Reg S, 6.63%, 1/07/26 | China | 203,000 | 1,827 | |||||||||||
53,723 | |||||||||||||||
Total Corporate Bonds and Notes in Reorganization (Cost $1,491,409) | 790,701 | ||||||||||||||
20 | Annual Report | franklintempleton.com | ||||
Country | Principal Amount* | Value | |||||||||||||
m,n | Senior Floating Rate Interests 1.5% | ||||||||||||||
Chemicals 0.2% | |||||||||||||||
ASP Unifrax Holdings Inc., First Lien Term Loan, 9.202%, (1-Month USD LIBOR + 3.75%), 12/12/25 | United States | 700,073 | $681,696 | ||||||||||||
o | Curia Global Inc., Term Loan RC, 9.177%, (1-Month USD LIBOR + 3.85%), 8/30/26 | United States | 369,778 | 349,511 | |||||||||||
1,031,207 | |||||||||||||||
Communications Equipment 0.2% | |||||||||||||||
o | Commscope Holding Co. Inc., Initial Term Loan, 8.694%, (1-Month USD LIBOR + 3.25%), 4/06/26 | United States | 1,735,756 | 1,563,048 | |||||||||||
j | Riverbed Technology Inc., Exit Term Loan, PIK, 9.809%, (1-Month SOFR + 4.50%), 7/01/28 | United States | 56,775 | 34,987 | |||||||||||
1,598,035 | |||||||||||||||
Construction Materials 0.0%† | |||||||||||||||
o | Oldcastle BuildingEnvelope Inc., Term Loan RC, 8.407%, (1-Month SOFR + 3.75%), 4/29/27 | United States | 27,687 | 25,472 | |||||||||||
Diversified Telecommunication Services 0.0%† | |||||||||||||||
e | Ligado Networks LLC, Bank Debt Term Loan, 17.50%, 7/07/24 | United States | 35,197 | 28,686 | |||||||||||
Energy - Alternate Sources 0.1% | |||||||||||||||
Enviva Inc., Term Loan RC, 12.25%, (SOFR + 2.25%), 6/30/27 | United States | 431,000 | 439,620 | ||||||||||||
Food & Staples Retailing 0.4% | |||||||||||||||
o | H-Food Holdings LLC, | ||||||||||||||
Initial Term Loan, 9.296%, (1-Month SOFR + 3.95%), 5/23/25 | United States | 324,743 | 229,638 | ||||||||||||
Incremental Term Loan B-3, 10.609%, (1-Month USD LIBOR + 5.58%), 5/23/25 | United States | 16,860 | 11,923 | ||||||||||||
o | Upfield Group BV, Term Loan RC, 8.098%, (3-Month EURIBOR + 3.00%), 10/02/27 | Netherlands | 87,446 | 94,242 | |||||||||||
Wm Morrison Supermarkets Ltd., Facility Term Loan B2, 10.817%, (5-Day SONIA + 5.61%), 11/04/27 | United Kingdom | 1,550,000 | 1,947,230 | ||||||||||||
2,283,033 | |||||||||||||||
Leisure Products 0.0%† | |||||||||||||||
o | Hercules Achievement Inc., Initial Term Loan, 10.444%, (1-Month SOFR + 5.11%), 12/15/26 | United States | 134,750 | 135,986 | |||||||||||
Media 0.3% | |||||||||||||||
o | CSC Holdings LLC, Term Loan B, 9.817%, (1-Month SOFR + 4.50%), 1/18/28 | United States | 1,456,062 | 1,404,845 | |||||||||||
o | Radiate Holdco LLC, Amendment No. 6 New Term Loan, 8.694%, (1-Month USD LIBOR + 3.25%), 9/25/26 | United States | 742,103 | 588,002 | |||||||||||
1,992,847 | |||||||||||||||
Pharmaceuticals 0.1% | |||||||||||||||
o | Bausch Health Cos. Inc., Term Loan B, 10.675%, (1-Month SOFR + 5.35%), 2/01/27 | United States | 1,008,628 | 915,960 | |||||||||||
Software 0.2% | |||||||||||||||
Polaris Newco LLC, First Lien Dollar Term Loan, 9.591%, (1-Month USD LIBOR + 4.00%), 6/02/28 | United States | 1,014,790 | 1,016,601 | ||||||||||||
Total Senior Floating Rate Interests (Cost $9,195,059) | 9,467,447 | ||||||||||||||
Foreign Government and Agency Securities 2.0% | |||||||||||||||
d | Government of Angola, senior bond, Reg S, | ||||||||||||||
8.75%, 4/14/32 | Angola | 435,000 | 391,135 | ||||||||||||
9.375%, 5/08/48 | Angola | 537,000 | 460,050 | ||||||||||||
Government of Argentina, senior bond, 3.625%, 7/09/46 | Argentina | 1,341,000 | 611,017 | ||||||||||||
franklintempleton.com | Annual Report | 21 | ||||
Country | Principal Amount* | Value | |||||||||||||
Foreign Government and Agency Securities (continued) 2.0% | |||||||||||||||
Government of Colombia, senior bond, | |||||||||||||||
B, 7.00%, 6/30/32 | Colombia | 3,525,100,000 | COP | $733,363 | |||||||||||
B, 13.25%, 2/09/33 | Colombia | 2,527,700,000 | COP | 738,977 | |||||||||||
8.00%, 11/14/35 | Colombia | 200,000 | 204,408 | ||||||||||||
B, 7.25%, 10/26/50 | Colombia | 2,539,400,000 | COP | 424,881 | |||||||||||
d | Government of Dominican Republic, senior bond, 144A, 11.25%, 9/15/35 | Dominican Republic | 11,150,000 | DOP | 199,323 | ||||||||||
e | Government of Egypt, senior note, zero cpn., 12/10/24 | Egypt | 67,100,000 | EGP | 1,154,496 | ||||||||||
d | Government of El Salvador, senior note, 144A, 9.25%, 4/17/30 | El Salvador | 310,000 | 272,073 | |||||||||||
d | Government of Germany, senior bond, Reg S,2/15/32 | Germany | 155,660 | EUR | 138,748 | ||||||||||
1.70%, 8/15/32 | Germany | 547,200 | EUR | 554,922 | |||||||||||
Government of Indonesia, senior bond, 7.125%, 6/15/38 | Indonesia | 14,646,000,000 | IDR | 914,636 | |||||||||||
b | Government of Italy, senior note, 2.375%, 10/17/24 | Italy | 350,000 | 345,624 | |||||||||||
d | Government of Ivory Coast, senior bond, 144A, 8.25%, 1/30/37 | Ivory Coast | 648,000 | 632,753 | |||||||||||
d | Government of Pakistan, senior note, Reg S, 6.00%, 4/08/26 | Pakistan | 618,000 | 562,077 | |||||||||||
d | Government of Paraguay, senior note, 144A, 7.90%, 2/09/31 | Paraguay | 928,000,000 | PYG | 127,776 | ||||||||||
d | Government of Peru, senior bond, Reg S, 7.30%, 8/12/33 | Peru | 2,393,000 | PEN | 653,599 | ||||||||||
d | Government of Romania, senior note, Reg S, 6.625%, 9/27/29 | Romania | 216,000 | EUR | 253,907 | ||||||||||
Government of South Africa, 2037, senior bond, 8.50%, 1/31/37 | South Africa | 9,609,496 | ZAR | 380,518 | |||||||||||
d | Government of Tunisian Republic, senior note, Reg S, 6.375%, 7/15/26 | Tunisia | 850,000 | EUR | 780,609 | ||||||||||
Government of Turkey, senior note, | |||||||||||||||
31.08%, 11/08/28 | Turkey | 5,371,000 | TRY | 170,848 | |||||||||||
26.20%, 10/05/33 | Turkey | 8,624,000 | TRY | 266,027 | |||||||||||
Government of Uruguay, senior bond, 9.75%, 7/20/33 | Uruguay | 9,758,140 | UYU | 260,799 | |||||||||||
d | Government of Uzbekistan, senior note, 144A, 6.90%, 2/28/32 | Uzbekistan | 310,000 | 303,112 | |||||||||||
d | Istanbul Metropolitan Municipality, senior note, 144A, 10.50%, 12/06/28 | Turkey | 259,000 | 278,776 | |||||||||||
d | Provincia de Buenos Aires, senior bond, Reg S, 6.375%, 9/01/37 | Argentina | 2,469,736 | 1,095,946 | |||||||||||
Total Foreign Government and Agency Securities (Cost $11,868,947) | 12,910,400 | ||||||||||||||
n | Foreign Government and Agency Securities in Reorganization 0.6% | ||||||||||||||
h,p | Government of Argentina, senior bond, FRN, zero cpn., 12/15/35 | Argentina | 7,422,000 | 273,000 | |||||||||||
d,h | Government of Ghana, Reg S, | ||||||||||||||
senior bond, 10.75%, 10/14/30 | Ghana | 207,000 | 141,838 | ||||||||||||
senior bond, 8.95%, 3/26/51 | Ghana | 200,000 | 103,286 | ||||||||||||
senior bond, 8.75%, 3/11/61 | Ghana | 648,000 | 335,165 | ||||||||||||
senior note, 6.375%, 2/11/27 | Ghana | 281,000 | 144,376 | ||||||||||||
d,h | Government of Sri Lanka, senior bond, Reg S, 7.55%, 3/28/30 | Sri Lanka | 680,000 | 396,106 | |||||||||||
d,h | Government of Ukraine, | ||||||||||||||
senior bond, Reg S, 7.75%, 9/01/26 | Ukraine | 704,000 | 213,970 | ||||||||||||
p | senior bond, FRN, Reg S, 7.75%, 8/01/41 | Ukraine | 3,212,000 | 1,673,693 | |||||||||||
senior note, Reg S, 8.994%, 2/01/26 | Ukraine | 440,000 | 141,161 | ||||||||||||
h | Government of Venezuela, senior bond, 9.25%, 9/15/27 | Venezuela | 624,000 | 122,013 | |||||||||||
d,h | Government of Venezuela, senior bond, Reg S, 9.25%, 5/07/28 | Venezuela | 684,000 | 117,378 | |||||||||||
Total Foreign Government and Agency Securities in Reorganization (Cost $2,730,435) | 3,661,986 | ||||||||||||||
U.S. Government and Agency Securities 1.5% | |||||||||||||||
U.S. Treasury Bond, | |||||||||||||||
4.50%, 2/15/44 | United States | 206,000 | 199,965 | ||||||||||||
4.75%, 11/15/53 | United States | 118,500 | 120,759 | ||||||||||||
4.25%, 2/15/54 | United States | 43,000 | 40,343 | ||||||||||||
U.S. Treasury Note, | |||||||||||||||
4.625%, 2/28/26 | United States | 561,000 | 558,020 | ||||||||||||
4.125%, 3/31/29 | United States | 187,000 | 183,866 | ||||||||||||
22 | Annual Report | franklintempleton.com | ||||
Country | Principal Amount* | Value | |||||||||||||
U.S. Government and Agency Securities (continued) 1.5% | |||||||||||||||
4.625%, 4/30/29 | United States | 1,234,200 | $ 1,240,371 | ||||||||||||
4.00%, 2/15/34 | United States | 6,399,000 | 6,153,538 | ||||||||||||
4.375%, 5/15/34 | United States | 1,172,000 | 1,161,653 | ||||||||||||
Total U.S. Government and Agency Securities (Cost $9,745,511) | 9,658,515 | ||||||||||||||
Number of Contracts | Notional Amount# | ||||||||||||||
Options Purchased 0.1% | |||||||||||||||
Calls - Exchange-Traded 0.0%† | |||||||||||||||
Albertsons Cos Inc., January Strike Price $22.00, Expires 1/17/25 | 249 | 513,936 | 37,350 | ||||||||||||
Arcadium Lithium PLC, June Strike Price $5.00, Expires 6/21/24 | 12 | 5,316 | 60 | ||||||||||||
Arcadium Lithium PLC, July Strike Price $5.00, Expires 7/19/24 | 19 | 8,417 | 380 | ||||||||||||
Capri Holdings Ltd., October Strike Price $55.00, Expires 10/18/24 | 98 | 338,590 | 980 | ||||||||||||
Coherus Biosciences Inc., November Strike Price $3.00, Expires 11/15/24 | 28 | 5,096 | 700 | ||||||||||||
CommScope Holding Co Inc., January Strike Price $1.50, Expires 1/17/25 | 293 | 42,192 | 15,236 | ||||||||||||
Constellation Energy Corp., January Strike Price $260.00, Expires 1/17/25 | 38 | 825,550 | 49,704 | ||||||||||||
Enphase Energy Inc., June Strike Price $120.00, Expires 6/21/24 | 1 | 12,790 | 1,100 | ||||||||||||
Expedia Group Inc., July Strike Price $150.00, Expires 7/19/24 | 2 | 22,572 | 10 | ||||||||||||
Gildan Activewear Inc., June Strike Price $40.00, Expires 6/21/24 | 90 | 344,430 | 2,925 | ||||||||||||
Global X Uranium ETF, January Strike Price $45.00, Expires 1/17/25 | 277 | 893,048 | 33,240 | ||||||||||||
Golar LNG Ltd., January Strike Price $25.00, Expires 1/17/25 | 37 | 97,273 | 12,580 | ||||||||||||
Ironwood Pharmaceuticals Inc., August Strike Price $7.50, Expires 8/16/24 | 10 | 6,300 | 200 | ||||||||||||
Match Group Inc., June Strike Price $32.00, Expires 6/28/24 | 17 | 52,071 | 544 | ||||||||||||
Maxeon Solar Technologies Ltd., June Strike Price $3.50, Expires 6/21/24 | 58 | 10,904 | 812 | ||||||||||||
Maxeon Solar Technologies Ltd., June Strike Price $4.00, Expires 6/21/24 | 77 | 14,476 | 1,155 | ||||||||||||
Maxeon Solar Technologies Ltd., June Strike Price $4.50, Expires 6/21/24 | 58 | 10,904 | 3,045 | ||||||||||||
Norwegian Cruise Line Holdings Ltd., June Strike Price $18.00, Expires 6/21/24 | 19 | 214,434 | 285 | ||||||||||||
Norwegian Cruise Line Holdings Ltd., July Strike Price $24.00, Expires 7/19/24 | 12 | 19,920 | 36 | ||||||||||||
OPKO Health Inc., June Strike Price $1.00, Expires 6/21/24 | 58 | 7,946 | 2,320 | ||||||||||||
Shift4 Payments Inc., June Strike Price $75.00, Expires 6/21/24 | 16 | 107,648 | 1,160 | ||||||||||||
Shift4 Payments Inc., June Strike Price $90.00, Expires 6/21/24 | 4 | 26,912 | 290 | ||||||||||||
Shift4 Payments Inc., July Strike Price $90.00, Expires 7/19/24 | 17 | 114,376 | 357 | ||||||||||||
United States Steel Corp., January Strike Price $57.50, Expires 1/17/25 | 10 | 38,350 | 80 | ||||||||||||
164,549 | |||||||||||||||
Puts - Exchange-Traded 0.1% | |||||||||||||||
Bloom Energy Corp., June Strike Price $11.00, Expires 6/21/24 | 19 | 31,008 | 171 | ||||||||||||
Bloom Energy Corp., June Strike Price $12.00, Expires 6/21/24 | 29 | 47,328 | 290 | ||||||||||||
Bloom Energy Corp., June Strike Price $13.00, Expires 6/21/24 | 19 | 31,008 | 237 | ||||||||||||
Golar LNG Ltd., June Strike Price $24.00, Expires 6/21/24 | 47 | 123,563 | 588 | ||||||||||||
Hess Corp., June Strike Price $100.00, Expires 6/21/24 | 13 | 200,330 | 65 | ||||||||||||
Hollysys Automation Technologies Ltd., July Strike Price $20.00, Expires 7/19/24 | 5 | 10,585 | 875 | ||||||||||||
Inotiv Inc., July Strike Price $5.00, Expires 7/19/24 | 21 | 3,927 | 6,457 | ||||||||||||
Liberty Media Corp., August Strike Price $22.00, Expires 8/16/24 | 102 | 231,132 | 10,710 | ||||||||||||
Lincoln National Corp., January Strike Price $17.50, Expires 1/17/25 | 256 | 844,544 | 6,400 | ||||||||||||
franklintempleton.com | Annual Report | 23 | ||||
Number of Contracts | Notional Amount# | Value | |||||||||||||
Options Purchased (continued) | |||||||||||||||
Puts - Exchange-Traded (continued) | |||||||||||||||
Maxeon Solar Technologies Ltd., June Strike Price $3.00, Expires 6/21/24 | 64 | 12,032 | $9,600 | ||||||||||||
Maxeon Solar Technologies Ltd., July Strike Price $1.50, Expires 7/19/24 | 45 | 8,460 | 4,725 | ||||||||||||
Maxeon Solar Technologies Ltd., July Strike Price $2.50, Expires 7/19/24 | 576 | 108,288 | 118,080 | ||||||||||||
OPKO Health Inc., June Strike Price $1.00, Expires 6/21/24 | 116 | 15,892 | 580 | ||||||||||||
Sirius XM Holdings Inc., September Strike Price $5.00, Expires 9/20/24 | 319 | 89,958 | 63,641 | ||||||||||||
Snap Inc., June Strike Price $14.00, Expires 6/21/24 | 19 | 28,538 | 361 | ||||||||||||
SPDR S&P 500 ETF Trust, June Strike Price $521.00, Expires 6/21/24 | 157 | 8,279,709 | 51,653 | ||||||||||||
Spirit Airlines Inc., September Strike Price $3.00, Expires 9/20/24 | 120 | 43,800 | 6,120 | ||||||||||||
Spirit Airlines Inc., September Strike Price $3.50, Expires 9/20/24 | 180 | 65,700 | 13,950 | ||||||||||||
United Rentals Inc., June Strike Price $600.00, Expires 6/21/24 | 18 | 1,204,938 | 9,486 | ||||||||||||
United Rentals Inc., September Strike Price $550.00, Expires 9/20/24 | 6 | 401,646 | 7,410 | ||||||||||||
United States Steel Corp., June Strike Price $32.00, Expires 6/21/24 | 80 | 306,800 | 2,240 | ||||||||||||
US Global Jets ETF, September Strike Price $18.00, Expires 9/20/24 | 337 | 675,011 | 14,154 | ||||||||||||
327,793 | |||||||||||||||
Total Options Purchased (Cost $541,927) | 492,342 | ||||||||||||||
Total Investments before Short Term Investments (Cost $244,009,878) | 272,077,958 | ||||||||||||||
Country | Shares | ||||||||||||||
Short Term Investments 45.2% | |||||||||||||||
Money Market Funds 34.6% | |||||||||||||||
q,r | Dreyfus Government Cash Management, Institutional, 5.20% | United States | 121,818,128 | 121,818,128 | |||||||||||
q | Fidelity Investments Money Market Government Portfolio, Institutional, 5.21% | United States | 97,874,468 | 97,874,468 | |||||||||||
Total Money Market Funds (Cost $219,692,596) | 219,692,596 | ||||||||||||||
s | Investments from Cash Collateral Received for Loaned Securities (Cost $882,000) 0.2% | ||||||||||||||
q,t | Institutional Fiduciary Trust Money Market Portfolio, 5.00% | United States | 882,000 | 882,000 | |||||||||||
Principal Amount* | |||||||||||||||
U.S. Government and Agency Securities 10.4% | |||||||||||||||
u | U.S. Treasury Bill, zero cpn., | ||||||||||||||
6/04/24 | United States | 29,000,000 | 28,995,778 | ||||||||||||
6/06/24 | United States | 3,000,000 | 2,998,689 | ||||||||||||
11/14/24 | United States | 35,000,000 | 34,176,988 | ||||||||||||
Total U.S. Government and Agency Securities (Cost $66,151,151) | 66,171,455 | ||||||||||||||
Total Short Term Investments (Cost $286,725,747) | 286,746,051 | ||||||||||||||
Total Investments (Cost $530,735,625) 88.1% | 558,824,010 | ||||||||||||||
Options Written (0.1)% | (653,981) | ||||||||||||||
Securities Sold Short (16.6)% | (105,141,373) | ||||||||||||||
Other Assets, less Liabilities 28.6% | 181,641,287 | ||||||||||||||
Net Assets 100.0% | $634,669,943 | ||||||||||||||
24 | Annual Report | franklintempleton.com | ||||
Number of Contracts | Notional Amount# | Value | |||||||||||||
v | Options Written (0.1)% | ||||||||||||||
Calls - Exchange-Traded (0.1)% | |||||||||||||||
Albertsons Cos Inc., A, January Strike Price $27.00, Expires 1/17/25 | 249 | 513,936 | $(4,980) | ||||||||||||
Capri Holdings Ltd., October Strike Price $57.50, Expires 10/18/24 | 98 | 338,590 | (490) | ||||||||||||
Golar LNG Ltd., January Strike Price $30.00, Expires 1/17/25 | 37 | 97,273 | (5,180) | ||||||||||||
Liberty Media Corp., June Strike Price $26.00, Expires 6/21/24 | 64 | 145,024 | (960) | ||||||||||||
Shift4 Payments Inc., July Strike Price $100.00, Expires 7/19/24 | 17 | 114,376 | (680) | ||||||||||||
United States Steel Corp., January Strike Price $52.50, Expires 1/17/25 | 10 | 38,350 | (600) | ||||||||||||
Vertiv Holdings Co., July Strike Price $50.00, Expires 7/19/24 | 135 | 1,323,945 | (607,500) | ||||||||||||
(620,390) | |||||||||||||||
Puts - Exchange-Traded (0.0)%† | |||||||||||||||
Coherus Biosciences Inc., November Strike Price $2.00, Expires 11/15/24 | 32 | 5,824 | (2,480) | ||||||||||||
Okta Inc., July Strike Price $16.00, Expires 7/19/24 | 12 | 106,416 | (708) | ||||||||||||
Shift4 Payments Inc., June Strike Price $60.00, Expires 6/21/24 | 13 | 87,464 | (871) | ||||||||||||
Sirius XM Holdings Inc., September Strike Price $3.00, Expires 9/20/24 | 319 | 89,958 | (15,153) | ||||||||||||
SPDR S&P 500 ETF Trust, June Strike Price $504.00, Expires 6/21/24 | 157 | 8,279,709 | (13,659) | ||||||||||||
United States Steel Corp., July Strike Price $25.00, Expires 7/19/24 | 45 | 172,575 | (720) | ||||||||||||
(33,591) | |||||||||||||||
Total Options Written (Premiums Received $166,953) | (653,981) | ||||||||||||||
Country | Shares/ Warrants | ||||||||||||||
w | Securities Sold Short (16.6)% | ||||||||||||||
Exchange Traded Funds (5.6)% | |||||||||||||||
ARK Innovation ETF | United States | 9,006 | (382,305) | ||||||||||||
Health Care Select Sector SPDR Fund | United States | 57,572 | (8,273,096) | ||||||||||||
iShares PHLX Semiconductor ETF | United States | 4,341 | (1,015,838) | ||||||||||||
iShares U.S. Healthcare Providers ETF | United States | 90,087 | (4,744,882) | ||||||||||||
iShares U.S. Medical Devices ETF | United States | 141,442 | (7,854,274) | ||||||||||||
iShares U.S. Pharmaceuticals ETF | United States | 95,662 | (6,288,820) | ||||||||||||
SPDR S&P Biotech ETF | United States | 78,380 | (6,986,009) | ||||||||||||
Total Exchange Traded Funds (Proceeds $35,261,925) | (35,545,224) | ||||||||||||||
Common Stocks (6.3)% | |||||||||||||||
Aerospace & Defense (0.1)% | |||||||||||||||
Parsons Corp. | United States | 5,997 | (456,672) | ||||||||||||
Rocket Lab USA Inc. | United States | 3,835 | (16,759) | ||||||||||||
(473,431) | |||||||||||||||
Automobile Components (0.0)%† | |||||||||||||||
LCI Industries | United States | 1,243 | (136,581) | ||||||||||||
Mobileye Global Inc., A | Israel | 6,918 | (177,516) | ||||||||||||
(314,097) | |||||||||||||||
Automobiles (0.0)%† | |||||||||||||||
Rivian Automotive Inc., A | United States | 13,214 | (144,297) | ||||||||||||
Tesla Inc. | United States | 752 | (133,916) | ||||||||||||
Winnebago Industries Inc. | United States | 69 | (4,281) | ||||||||||||
(282,494) | |||||||||||||||
Biotechnology (0.5)% | |||||||||||||||
Apellis Pharmaceuticals Inc. | United States | 3,418 | (134,156) | ||||||||||||
Cerevel Therapeutics Holdings Inc. | United States | 4,959 | (202,030) | ||||||||||||
Coherus Biosciences Inc. | United States | 16,953 | (30,854) | ||||||||||||
Cytokinetics Inc. | United States | 4,066 | (197,242) | ||||||||||||
Dynavax Technologies Corp. | United States | 81,937 | (982,425) | ||||||||||||
franklintempleton.com | Annual Report | 25 | ||||
Country | Shares/ Warrants | Value | |||||||||||||
Securities Sold Short (continued) | |||||||||||||||
Common Stocks (continued) | |||||||||||||||
Biotechnology (continued) | |||||||||||||||
Halozyme Therapeutics Inc. | United States | 916 | $(40,570) | ||||||||||||
Ironwood Pharmaceuticals Inc., A | United States | 437 | (2,753) | ||||||||||||
Karyopharm Therapeutics Inc. | United States | 4,289 | (4,156) | ||||||||||||
Mannkind Corp. | United States | 74,760 | (349,129) | ||||||||||||
Mirum Pharmaceuticals Inc. | United States | 526 | (12,640) | ||||||||||||
Natera Inc. | United States | 9,901 | (1,054,754) | ||||||||||||
Travere Therapeutics Inc. | United States | 8,076 | (59,924) | ||||||||||||
(3,070,633) | |||||||||||||||
Broadline Retail (0.1)% | |||||||||||||||
Alibaba Group Holding Ltd., ADR | China | 5,943 | (465,575) | ||||||||||||
Etsy Inc. | United States | 1,454 | (92,285) | ||||||||||||
JD.Com Inc., ADR | China | 101 | (2,992) | ||||||||||||
(560,852) | |||||||||||||||
Building Products (0.1)% | |||||||||||||||
Carrier Global Corp. | United States | 9,967 | (629,815) | ||||||||||||
Capital Markets (0.2)% | |||||||||||||||
Ares Capital Corp. | United States | 25,318 | (546,109) | ||||||||||||
Blue Owl Capital Corp. | United States | 19,138 | (322,667) | ||||||||||||
Coinbase Global Inc., A | United States | 492 | (111,153) | ||||||||||||
Oaktree Specialty Lending Corp. | United States | 11,473 | (223,953) | ||||||||||||
Wisdomtree Inc. | United States | 11,828 | (117,925) | ||||||||||||
(1,321,807) | |||||||||||||||
Chemicals (0.2)% | |||||||||||||||
Air Products & Chemicals Inc. | United States | 1,951 | (520,332) | ||||||||||||
Albemarle Corp. | United States | 4,762 | (583,773) | ||||||||||||
Arcadium Lithium PLC | United Kingdom | 95,305 | (422,201) | ||||||||||||
Danimer Scientific Inc. | United States | 17,596 | (13,720) | ||||||||||||
e | Danimer Scientific Inc., 7/15/25, wts. | United States | 5,865 | — | |||||||||||
Purecycle Technologies Inc. | United States | 1,619 | (8,403) | ||||||||||||
(1,548,429) | |||||||||||||||
Communications Equipment (0.0)%† | |||||||||||||||
Viavi Solutions Inc. | United States | 3,433 | (25,816) | ||||||||||||
Construction & Engineering (0.0)%† | |||||||||||||||
Centuri Holdings Inc. | United States | 3,120 | (85,644) | ||||||||||||
Granite Construction Inc. | United States | 468 | (29,152) | ||||||||||||
(114,796) | |||||||||||||||
Consumer Finance (0.2)% | |||||||||||||||
Encore Capital Group Inc. | United States | 10,040 | (444,169) | ||||||||||||
EZCORP Inc., A | United States | 40,140 | (421,069) | ||||||||||||
SoFi Technologies Inc. | United States | 24,699 | (170,423) | ||||||||||||
(1,035,661) | |||||||||||||||
Consumer Staples Distribution & Retail (0.0)%† | |||||||||||||||
The Chefs’ Warehouse Inc. | United States | 5,161 | (203,447) | ||||||||||||
Diversified Financial Services (0.1)% | |||||||||||||||
Bread Financial Holdings Inc. | United States | 8,742 | (365,066) | ||||||||||||
Electric Utilities (0.1)% | |||||||||||||||
Avangrid Inc. | United States | 3,570 | (128,556) | ||||||||||||
NRG Energy Inc. | United States | 6,147 | (497,907) | ||||||||||||
(626,463) | |||||||||||||||
26 | Annual Report | franklintempleton.com | ||||
Country | Shares/ Warrants | Value | |||||||||||||
Securities Sold Short (continued) | |||||||||||||||
Common Stocks (continued) | |||||||||||||||
Electrical Equipment (0.1)% | |||||||||||||||
Bloom Energy Corp., A | United States | 28,010 | $(457,123) | ||||||||||||
Plug Power Inc. | United States | 57,716 | (192,194) | ||||||||||||
(649,317) | |||||||||||||||
Electronic Equipment, Instruments & Components (0.0)%† | |||||||||||||||
Hollysys Automation Technologies Ltd. | China | 1,604 | (33,957) | ||||||||||||
PAR Technology Corp. | United States | 3,888 | (173,483) | ||||||||||||
Vishay Intertechnology Inc. | United States | 1,245 | (29,419) | ||||||||||||
(236,859) | |||||||||||||||
Energy Equipment & Services (0.1)% | |||||||||||||||
Transocean Ltd. | United States | 150,436 | (932,703) | ||||||||||||
Entertainment (0.2)% | |||||||||||||||
Live Nation Entertainment Inc. | United States | 4,335 | (406,363) | ||||||||||||
The Marcus Corp. | United States | 17,290 | (184,139) | ||||||||||||
Sea Ltd., ADR | Singapore | 5,525 | (373,048) | ||||||||||||
Sphere Entertainment Co. | United States | 1,242 | (45,333) | ||||||||||||
Spotify Technology SA | United States | 176 | (52,233) | ||||||||||||
(1,061,116) | |||||||||||||||
Financial Services (0.0)%† | |||||||||||||||
Block Inc., A | United States | 625 | (40,050) | ||||||||||||
Repay Holdings Corp., A | United States | 1,395 | (13,587) | ||||||||||||
Shift4 Payments Inc., A | United States | 3,532 | (237,633) | ||||||||||||
(291,270) | |||||||||||||||
Ground Transportation (0.0)%† | |||||||||||||||
Lyft Inc., A | United States | 1,724 | (26,912) | ||||||||||||
Uber Technologies Inc. | United States | 576 | (37,186) | ||||||||||||
(64,098) | |||||||||||||||
Health Care Equipment & Supplies (0.4)% | |||||||||||||||
CONMED Corp. | United States | 878 | (67,114) | ||||||||||||
Glaukos Corp. | United States | 10,595 | (1,194,268) | ||||||||||||
Haemonetics Corp. | United States | 172 | (14,462) | ||||||||||||
Insulet Corp. | United States | 1,220 | (216,172) | ||||||||||||
iRhythm Technologies Inc. | United States | 287 | (25,316) | ||||||||||||
Lantheus Holdings Inc. | United States | 1,768 | (144,676) | ||||||||||||
Tandem Diabetes Care Inc. | United States | 12,201 | (625,057) | ||||||||||||
Varex Imaging Corp. | United States | 8,187 | (126,489) | ||||||||||||
(2,413,554) | |||||||||||||||
Health Care Providers & Services (0.0)%† | |||||||||||||||
NeoGenomics Inc. | United States | 1,349 | (18,495) | ||||||||||||
OPKO Health Inc. | United States | 142,382 | (195,063) | ||||||||||||
PetIQ Inc., A | United States | 4,355 | (90,410) | ||||||||||||
(303,968) | |||||||||||||||
Health Care Technology (0.0)%† | |||||||||||||||
Evolent Health Inc., A | United States | 4,482 | (94,973) | ||||||||||||
Health Catalyst Inc. | United States | 717 | (4,754) | ||||||||||||
(99,727) | |||||||||||||||
Hotel & Resort REITs (0.0)%† | |||||||||||||||
Pebblebrook Hotel Trust | United States | 12,124 | (171,554) | ||||||||||||
Summit Hotel Properties Inc. | United States | 8,014 | (49,046) | ||||||||||||
(220,600) | |||||||||||||||
Hotels, Restaurants & Leisure (0.4)% | |||||||||||||||
Airbnb Inc., A | United States | 179 | (25,942) | ||||||||||||
franklintempleton.com | Annual Report | 27 | ||||
Country | Shares/ Warrants | Value | |||||||||||||
Securities Sold Short (continued) | |||||||||||||||
Common Stocks (continued) | |||||||||||||||
Hotels, Restaurants & Leisure (continued) | |||||||||||||||
Carnival Corp. | United States | 54,907 | $(827,998) | ||||||||||||
The Cheesecake Factory Inc. | United States | 1,238 | (47,638) | ||||||||||||
Draftkings Inc., A | United States | 707 | (24,837) | ||||||||||||
Expedia Group Inc. | United States | 190 | (21,443) | ||||||||||||
Marriott Vacations Worldwide Corp. | United States | 960 | (86,659) | ||||||||||||
Norwegian Cruise Line Holdings Ltd. | United States | 40,841 | (677,961) | ||||||||||||
Penn National Gaming Inc. | United States | 13,194 | (230,895) | ||||||||||||
Royal Caribbean Cruises Ltd. | United States | 2,866 | (423,251) | ||||||||||||
(2,366,624) | |||||||||||||||
Industrial Conglomerates (0.2)% | |||||||||||||||
Honeywell International Inc. | United States | 6,719 | (1,358,515) | ||||||||||||
Interactive Media & Services (0.0)%† | |||||||||||||||
Match Group Inc. | United States | 504 | (15,437) | ||||||||||||
Snap Inc., A | United States | 7,499 | (112,635) | ||||||||||||
(128,072) | |||||||||||||||
IT Services (0.1)% | |||||||||||||||
Cloudflare Inc., A | United States | 951 | (64,373) | ||||||||||||
Digitalocean Holdings Inc. | United States | 317 | (11,745) | ||||||||||||
MongoDB Inc., A | United States | 3,189 | (752,795) | ||||||||||||
Okta Inc., A | United States | 434 | (38,487) | ||||||||||||
Shopify Inc., A | Canada | 270 | (15,971) | ||||||||||||
(883,371) | |||||||||||||||
Leisure Products (0.1)% | |||||||||||||||
Topgolf Callaway Brands Corp. | United States | 19,768 | (309,369) | ||||||||||||
Life Sciences Tools & Services (0.0)%† | |||||||||||||||
Inotiv Inc. | United States | 2,892 | (5,408) | ||||||||||||
Repligen Corp. | United States | 38 | (5,665) | ||||||||||||
(11,073) | |||||||||||||||
Machinery (0.3)% | |||||||||||||||
Chart Industries Inc. | United States | 4,496 | (706,007) | ||||||||||||
Desktop Metal Inc., A | United States | 161,776 | (91,193) | ||||||||||||
The Greenbrier Cos. Inc. | United States | 7,737 | (427,469) | ||||||||||||
Illinois Tool Works Inc. | United States | 1,736 | (421,414) | ||||||||||||
(1,646,083) | |||||||||||||||
Marine Transportation (0.5)% | |||||||||||||||
Star Bulk Carriers Corp. | Greece | 109,143 | (2,955,592) | ||||||||||||
Media (0.0)%† | |||||||||||||||
Cardlytics Inc. | United States | 4,755 | (41,654) | ||||||||||||
Metals & Mining (0.2)% | |||||||||||||||
ATI Inc. | United States | 18,268 | (1,120,559) | ||||||||||||
Century Aluminum Co. | United States | 6,724 | (123,251) | ||||||||||||
Ivanhoe Mines Ltd., A | Canada | 16,364 | (236,284) | ||||||||||||
SSR Mining Inc. | Canada | 365 | (1,949) | ||||||||||||
(1,482,043) | |||||||||||||||
Multi-Utilities (0.4)% | |||||||||||||||
DTE Energy Co. | United States | 8,048 | (937,833) | ||||||||||||
Public Service Enterprise Group Inc. | United States | 13,702 | (1,038,064) | ||||||||||||
WEC Energy Group Inc. | United States | 9,390 | (760,872) | ||||||||||||
(2,736,769) | |||||||||||||||
Oil, Gas & Consumable Fuels (0.3)% | |||||||||||||||
Chevron Corp. | United States | 1,397 | (226,733) | ||||||||||||
Green Plains Inc. | United States | 4,842 | (83,137) | ||||||||||||
28 | Annual Report | franklintempleton.com | ||||
Country | Shares/ Warrants | Value | |||||||||||||
Securities Sold Short (continued) | |||||||||||||||
Common Stocks (continued) | |||||||||||||||
Oil, Gas & Consumable Fuels (continued) | |||||||||||||||
Kinder Morgan Inc. | United States | 16,881 | $(329,011) | ||||||||||||
Kosmos Energy Ltd. | Ghana | 20,920 | (127,612) | ||||||||||||
TC Energy Corp. | Canada | 14,071 | (542,626) | ||||||||||||
The Williams Cos. Inc. | United States | 9,394 | (389,945) | ||||||||||||
(1,699,064) | |||||||||||||||
Passenger Airlines (0.1)% | |||||||||||||||
American Airlines Group Inc. | United States | 198 | (2,277) | ||||||||||||
Cathay Pacific Airways Ltd. | Hong Kong | 333,000 | (349,281) | ||||||||||||
(351,558) | |||||||||||||||
Pharmaceuticals (0.1)% | |||||||||||||||
Collegium Pharmaceutical Inc. | United States | 6,407 | (212,328) | ||||||||||||
Innoviva Inc. | United States | 10,629 | (167,832) | ||||||||||||
Pacira Biosciences Inc. | United States | 1,074 | (32,574) | ||||||||||||
(412,734) | |||||||||||||||
Professional Services (0.0)%† | |||||||||||||||
CSG Systems International Inc. | United States | 1,887 | (81,424) | ||||||||||||
Dayforce Inc. | United States | 67 | (3,314) | ||||||||||||
(84,738) | |||||||||||||||
Real Estate Management & Development (0.0)%† | |||||||||||||||
Anywhere Real Estate Inc. | United States | 84 | (342) | ||||||||||||
Redfin Corp. | United States | 1,242 | (7,999) | ||||||||||||
Storagevault Canada Inc. | Canada | 3,105 | (10,274) | ||||||||||||
Zillow Group Inc., C | United States | 1,666 | (68,223) | ||||||||||||
(86,838) | |||||||||||||||
Semiconductors & Semiconductor Equipment (0.2)% | |||||||||||||||
Enphase Energy Inc. | United States | 493 | (63,055) | ||||||||||||
Maxeon Solar Technologies Ltd. | United States | 36,004 | (67,687) | ||||||||||||
Microchip Technology Inc. | United States | 564 | (54,838) | ||||||||||||
MKS Instruments Inc. | United States | 87 | (11,013) | ||||||||||||
SMART Global Holdings Inc. | United States | 8,670 | (178,429) | ||||||||||||
Veeco Instruments Inc. | United States | 16,948 | (688,936) | ||||||||||||
(1,063,958) | |||||||||||||||
Software (0.6)% | |||||||||||||||
Alarm.Com Holdings Inc. | United States | 334 | (21,847) | ||||||||||||
Blackline Inc. | United States | 92 | (4,390) | ||||||||||||
Confluent Inc., A | United States | 386 | (10,024) | ||||||||||||
Datadog Inc., A | United States | 7,141 | (786,795) | ||||||||||||
Dropbox Inc., A | United States | 1,217 | (27,419) | ||||||||||||
Envestnet Inc. | United States | 2,102 | (137,702) | ||||||||||||
Five9 Inc. | United States | 369 | (17,255) | ||||||||||||
Guidewire Software Inc. | United States | 4,952 | (564,132) | ||||||||||||
HubSpot Inc. | United States | 1,990 | (1,215,990) | ||||||||||||
Jamf Holding Corp. | United States | 566 | (9,011) | ||||||||||||
Microstrategy Inc., A | United States | 33 | (50,308) | ||||||||||||
Mitek Systems Inc. | United States | 6,511 | (81,713) | ||||||||||||
Pagerduty Inc. | United States | 1,052 | (19,957) | ||||||||||||
Porch Group Inc. | United States | 9,055 | (19,016) | ||||||||||||
Progress Software Corp. | United States | 339 | (17,170) | ||||||||||||
Q2 Holdings Inc. | United States | 3,487 | (212,079) | ||||||||||||
Rapid7 Inc. | United States | 160 | (5,782) | ||||||||||||
Verint Systems Inc. | United States | 696 | (20,643) | ||||||||||||
franklintempleton.com | Annual Report | 29 | ||||
Country | Shares/ Warrants | Value | |||||||||||||
Securities Sold Short (continued) | |||||||||||||||
Common Stocks (continued) | |||||||||||||||
Software (continued) | |||||||||||||||
Zscaler Inc. | United States | 2,218 | $(376,971) | ||||||||||||
(3,598,204) | |||||||||||||||
Specialty Retail (0.0)%† | |||||||||||||||
National Vision Holdings Inc. | United States | 325 | (4,904) | ||||||||||||
Wayfair Inc., A | United States | 1,371 | (81,561) | ||||||||||||
(86,465) | |||||||||||||||
Technology Hardware, Storage & Peripherals (0.1)% | |||||||||||||||
Seagate Technology Holdings PLC | United States | 1,741 | (162,331) | ||||||||||||
Super Micro Computer Inc. | United States | 153 | (120,030) | ||||||||||||
Western Digital Corp. | United States | 410 | (30,869) | ||||||||||||
(313,230) | |||||||||||||||
Textiles, Apparel & Luxury Goods (0.0)%† | |||||||||||||||
Capri Holdings Ltd. | United States | 2,008 | (69,376) | ||||||||||||
Water Utilities (0.2)% | |||||||||||||||
American Water Works Co. Inc. | United States | 7,590 | (992,544) | ||||||||||||
Total Common Stocks (Proceeds $43,093,341) | (39,523,893) | ||||||||||||||
Preferred Stocks (Proceeds $216,578) (0.0)%† | |||||||||||||||
Automobiles (0.0)%† | |||||||||||||||
Volkswagen AG, pfd., 2.08% | Germany | 1,634 | (205,331) | ||||||||||||
Principal Amount* | |||||||||||||||
Convertible Bonds (Proceeds $56,790) (0.0)%† | |||||||||||||||
Passenger Airlines (0.0)%† | |||||||||||||||
Jetblue Airways Corp., senior note, 0.50%, 4/01/26 | United States | 66,000 | (58,190) | ||||||||||||
Corporate Bonds and Notes (3.2)% | |||||||||||||||
Aerospace & Defense (0.2)% | |||||||||||||||
The Boeing Co., senior bond, | |||||||||||||||
3.60%, 5/01/34 | United States | 698,000 | (556,244) | ||||||||||||
3.25%, 2/01/35 | United States | 623,000 | (470,917) | ||||||||||||
(1,027,161) | |||||||||||||||
Automobile Components (0.1)% | |||||||||||||||
d | Adient Global Holdings Ltd., senior note, 144A, 8.25%, 4/15/31 | United States | 622,000 | (648,443) | |||||||||||
Automobiles (0.1)% | |||||||||||||||
d,p | Rivian Automotive Inc., senior secured note, 144A, FRN, 11.31%, (6-Month SOFR + 6.03%), 10/15/26 | United States | 374,000 | (369,549) | |||||||||||
Banks (0.4)% | |||||||||||||||
First Horizon Bank, junior sub. bond, 5.75%, 5/01/30 | United States | 767,000 | (728,612) | ||||||||||||
d,i | Industrial & Commercial Bank of China Ltd., junior sub. note, Reg S, 3.2% to 9/24/26, FRN thereafter, Perpetual | China | 761,000 | (721,961) | |||||||||||
KeyBank NA, senior note, 4.90%, 8/08/32 | United States | 1,298,000 | (1,149,165) | ||||||||||||
(2,599,738) | |||||||||||||||
Building Products (0.2)% | |||||||||||||||
d | Ameritex Holdco Intermediate LLC, senior secured note, 144A, 10.25%, 10/15/28 | United States | 969,000 | (1,016,794) | |||||||||||
d | Oscar AcquisitionCo LLC / Oscar Finance Inc., senior note, 144A, 9.50%, 4/15/30 | United States | 96,000 | (91,655) | |||||||||||
(1,108,449) | |||||||||||||||
Commercial Services & Supplies (0.0)%† | |||||||||||||||
d | Sotheby's, senior secured note, 144A, 7.375%, 10/15/27 | United States | 171,000 | (149,005) | |||||||||||
30 | Annual Report | franklintempleton.com | ||||
Country | Principal Amount* | Value | |||||||||||||
Securities Sold Short (continued) | |||||||||||||||
Corporate Bonds and Notes (continued) | |||||||||||||||
Communications Equipment (0.2)% | |||||||||||||||
d | Equipmentshare.Com Inc., senior secured note, 144A, 9.00%, 5/15/28 | United States | 1,414,000 | $(1,460,573) | |||||||||||
Construction Materials (0.2)% | |||||||||||||||
d | Camelot Return Merger Sub Inc., senior secured note, 144A, 8.75%, 8/01/28 | United States | 989,000 | (979,488) | |||||||||||
Consumer Finance (0.1)% | |||||||||||||||
Ally Financial Inc., junior sub. bond, 5.75%, 11/20/25 | United States | 517,000 | (514,867) | ||||||||||||
OneMain Finance Corp., senior note, 7.125%, 3/15/26 | United States | 216,000 | (219,306) | ||||||||||||
(734,173) | |||||||||||||||
Diversified Financial Services (0.3)% | |||||||||||||||
d | Kronos Acquisition Holdings Inc. / KIK Custom Products Inc., senior note, 144A, 7.00%, 12/31/27 | Canada | 626,000 | (617,561) | |||||||||||
Lincoln National Corp., senior bond, | |||||||||||||||
3.35%, 3/09/25 | United States | 198,000 | (194,251) | ||||||||||||
3.625%, 12/12/26 | United States | 300,000 | (286,655) | ||||||||||||
d | Wash Multifamily Acquisition Inc., senior secured note, 144A, 5.75%, 4/15/26 | United States | 1,121,000 | (1,090,707) | |||||||||||
(2,189,174) | |||||||||||||||
Entertainment (0.2)% | |||||||||||||||
Warnermedia Holdings Inc., | |||||||||||||||
senior bond, 5.141%, 3/15/52 | United States | 688,000 | (543,468) | ||||||||||||
senior note, 4.279%, 3/15/32 | United States | 985,000 | (862,472) | ||||||||||||
(1,405,940) | |||||||||||||||
Equity Real Estate Investment Trusts (REITs) (0.1)% | |||||||||||||||
d | Hat Holdings I LLC / Hat Holdings II LLC, senior note, 144A, 3.375%, 6/15/26 | United States | 510,000 | (479,669) | |||||||||||
Food Products (0.1)% | |||||||||||||||
B&G Foods Inc., senior note, | |||||||||||||||
5.25%, 4/01/25 | United States | 164,000 | (161,482) | ||||||||||||
5.25%, 9/15/27 | United States | 673,000 | (618,273) | ||||||||||||
(779,755) | |||||||||||||||
Health Care Technology (0.1)% | |||||||||||||||
d | Cloud Software Group Inc., senior secured note, 144A, 9.00%, 9/30/29 | United States | 617,000 | (597,535) | |||||||||||
Industrial Conglomerates (0.1)% | |||||||||||||||
3M Co., senior note, | |||||||||||||||
2.00%, 2/14/25 | United States | 408,000 | (397,814) | ||||||||||||
2.65%, 4/15/25 | United States | 150,000 | (146,271) | ||||||||||||
(544,085) | |||||||||||||||
Insurance (0.2)% | |||||||||||||||
MetLife Inc., senior bond, | |||||||||||||||
6.50%, 12/15/32 | United States | 596,000 | (649,189) | ||||||||||||
6.375%, 6/15/34 | United States | 591,000 | (633,857) | ||||||||||||
(1,283,046) | |||||||||||||||
Media (0.2)% | |||||||||||||||
Grupo Televisa Sab, senior bond, 6.125%, 1/31/46 | Mexico | 254,000 | (245,687) | ||||||||||||
iHeartCommunications Inc., senior note, 8.375%, 5/01/27 | United States | 267,842 | (97,038) | ||||||||||||
d | Univision Communications Inc., senior secured note, 144A, 7.375%, 6/30/30 | United States | 933,000 | (884,984) | |||||||||||
(1,227,709) | |||||||||||||||
Pharmaceuticals (0.2)% | |||||||||||||||
d | Organon & Co. / Organon Foreign Debt Co.-Issuer BV, senior bond, 144A, 5.125%, 4/30/31 | United States | 1,380,000 | (1,220,668) | |||||||||||
franklintempleton.com | Annual Report | 31 | ||||
Country | Principal Amount* | Value | |||||||||||||
Securities Sold Short (continued) | |||||||||||||||
Corporate Bonds and Notes (continued) | |||||||||||||||
Semiconductors & Semiconductor Equipment (0.1)% | |||||||||||||||
Intel Corp., | |||||||||||||||
senior bond, 3.90%, 3/25/30 | United States | 258,000 | $(241,121) | ||||||||||||
senior note, 2.45%, 11/15/29 | United States | 240,000 | (209,564) | ||||||||||||
senior note, 5.125%, 2/10/30 | United States | 388,000 | (387,644) | ||||||||||||
(838,329) | |||||||||||||||
Software (0.1)% | |||||||||||||||
Concentrix Corp., | |||||||||||||||
senior bond, 6.85%, 8/02/33 | United States | 467,000 | (458,127) | ||||||||||||
senior note, 6.60%, 8/02/28 | United States | 450,000 | (453,720) | ||||||||||||
(911,847) | |||||||||||||||
Specialty Retail (0.0)%† | |||||||||||||||
d | Upbound Group Inc., senior note, 144A, 6.375%, 2/15/29 | United States | 15,000 | (14,480) | |||||||||||
Total Corporate Bonds and Notes (Proceeds $20,240,862) | (20,568,816) | ||||||||||||||
Foreign Government and Agency Securities (0.4)% | |||||||||||||||
d | Government of Italy, senior bond, Reg S, | ||||||||||||||
10Y, 0.95%, 6/01/32 | Italy | 467,000 | EUR | (411,393) | |||||||||||
10Y, 2.50%, 12/01/32 | Italy | 833,000 | EUR | (822,809) | |||||||||||
Government of Turkey, senior bond, 7.375%, 2/05/25 | Turkey | 1,224,000 | (1,232,109) | ||||||||||||
Total Foreign Government and Agency Securities (Proceeds $2,457,806) | (2,466,311) | ||||||||||||||
U.S. Government and Agency Securities (0.1)% | |||||||||||||||
U.S. Treasury Note, | |||||||||||||||
4.625%, 4/30/29 | United States | 46,000 | (46,230) | ||||||||||||
4.375%, 5/15/34 | United States | 751,000 | (744,370) | ||||||||||||
Total U.S. Government and Agency Securities (Proceeds $793,884) | (790,600) | ||||||||||||||
p | Senior Floating Rate Interests (1.0)% | ||||||||||||||
Automobile Components (0.4)% | |||||||||||||||
| First Brands Group LLC, First Lien Term Loan, 10.59%, (3-Month SOFR + 5.00%), 3/30/27 | United States | 2,770,541 | (2,749,206) | |||||||||||
Commercial Services & Supplies (0.0)%† | |||||||||||||||
Sotheby's, 10.06%, (3-Month SOFR + 4.50%), 1/15/27 | United States | 118,069 | (111,379) | ||||||||||||
Diversified Telecommunication Services (0.1)% | |||||||||||||||
Consolidated Communications, Term Loan B, 8.941%, (1-Month SOFR + 3.61%), 10/02/27 | United States | 376,257 | (359,225) | ||||||||||||
Health Care Providers & Services (0.1)% | |||||||||||||||
o | Petco Health & Wellness Co. Inc., First Lien Term Loan, 8.821%, (3-Month SOFR + 3.51%), 3/03/28 | United States | 450,437 | (409,215) | |||||||||||
Professional Services (0.2)% | |||||||||||||||
CoreLogic Inc., Term Loan B, 4.00%, (1-Month USD LIBOR + 3.50%), 6/02/28 | United States | 1,288,657 | (1,274,965) | ||||||||||||
Transportation & Logistics (0.2)% | |||||||||||||||
o | Forward Air Corp., Term Loan B, 9.826%, (1-Month SOFR + 4.50%), 12/19/30 | United States | 1,170,194 | (1,079,018) | |||||||||||
Total Senior Floating Rate Interests (Proceeds $5,943,552) | (5,983,008) | ||||||||||||||
Total Securities Sold Short (Proceeds $108,064,738) | $(105,141,373) | ||||||||||||||
32 | Annual Report | franklintempleton.com | ||||
franklintempleton.com | Annual Report | 33 | ||||
Description | Type | Number of Contracts | Notional Amount* | Expiration Date | Value/Unrealized Appreciation (Depreciation) | ||||||||||||
Commodity Contractsa | |||||||||||||||||
Aluminum | Long | 27 | $1,769,269 | 6/17/24 | $165,483 | ||||||||||||
Aluminum | Short | 27 | 1,769,269 | 6/17/24 | (165,186) | ||||||||||||
Aluminum | Long | 12 | 799,491 | 9/16/24 | 30,916 | ||||||||||||
Brent Crude Oil | Long | 76 | 6,164,360 | 6/28/24 | (143,900) | ||||||||||||
Brent Crude Oil | Long | 3 | 242,610 | 7/31/24 | (5,180) | ||||||||||||
Canola | Long | 15 | 145,493 | 7/12/24 | 3,936 | ||||||||||||
Canola | Long | 14 | 140,354 | 11/14/24 | 4,528 | ||||||||||||
Cocoa | Short | 2 | 189,710 | 7/16/24 | (31,766) | ||||||||||||
Cocoa | Long | 3 | 264,152 | 9/13/24 | 2,173 | ||||||||||||
Cocoa | Short | 7 | 603,211 | 9/13/24 | (101,846) | ||||||||||||
Cocoa | Short | 2 | 154,260 | 12/13/24 | (32,190) | ||||||||||||
Coffee | Long | 18 | 1,500,863 | 7/19/24 | 100,438 | ||||||||||||
Coffee | Long | 1 | 82,969 | 9/18/24 | (2,588) | ||||||||||||
Copper | Long | 19 | 4,724,055 | 6/17/24 | 463,170 | ||||||||||||
Copper | Short | 19 | 4,724,055 | 6/17/24 | (384,195) | ||||||||||||
Copper | Long | 4 | 460,200 | 7/29/24 | (5,125) | ||||||||||||
Copper | Long | 11 | 2,768,947 | 9/16/24 | 11,877 | ||||||||||||
Copper | Short | 1 | 251,723 | 9/16/24 | 6,774 | ||||||||||||
Copper | Long | 1 | 115,263 | 9/26/24 | (587) | ||||||||||||
Corn | Short | 136 | 3,034,500 | 7/12/24 | 2,621 | ||||||||||||
Corn | Short | 14 | 317,800 | 9/13/24 | 4,600 | ||||||||||||
Corn | Short | 42 | 980,700 | 12/13/24 | 12,163 | ||||||||||||
Corn | Short | 3 | 71,925 | 3/14/25 | 1,963 | ||||||||||||
Corn | Short | 1 | 24,350 | 5/14/25 | (350) | ||||||||||||
Corn | Short | 1 | 24,600 | 7/14/25 | 138 | ||||||||||||
Cotton | Long | 5 | 190,375 | 7/09/24 | (22,075) | ||||||||||||
Cotton | Short | 6 | 228,450 | 7/09/24 | 7,797 | ||||||||||||
Cotton | Long | 3 | 112,665 | 12/06/24 | (5,700) | ||||||||||||
Gasoline | Long | 15 | 1,522,962 | 6/28/24 | (61,347) | ||||||||||||
Gasoline | Long | 1 | 100,762 | 7/31/24 | (1,718) | ||||||||||||
Gold 100 Oz | Long | 17 | 3,987,860 | 8/28/24 | (43,639) | ||||||||||||
Gold 100 Oz | Short | 12 | 2,814,960 | 8/28/24 | 30,820 | ||||||||||||
Hard Red Winter Wheat | Short | 50 | 1,771,875 | 7/12/24 | (295,120) | ||||||||||||
Hard Red Winter Wheat | Short | 13 | 470,113 | 9/13/24 | (59,213) | ||||||||||||
Hard Red Winter Wheat | Short | 10 | 370,875 | 12/13/24 | (48,000) | ||||||||||||
Hard Red Winter Wheat | Short | 1 | 37,738 | 3/14/25 | (3,975) | ||||||||||||
Lean Hogs | Short | 6 | 226,440 | 6/14/24 | 21,950 | ||||||||||||
Lean Hogs | Short | 22 | 854,700 | 7/15/24 | 39,470 | ||||||||||||
Lean Hogs | Short | 15 | 579,000 | 8/14/24 | 27,120 | ||||||||||||
Lean Hogs | Short | 3 | 99,480 | 10/14/24 | 2,870 | ||||||||||||
Live Cattle | Short | 6 | 435,720 | 6/28/24 | (10,530) | ||||||||||||
Live Cattle | Short | 23 | 1,641,740 | 8/30/24 | 2,630 | ||||||||||||
Live Cattle | Short | 7 | 506,240 | 10/31/24 | (5,650) | ||||||||||||
Live Cattle | Short | 5 | 369,300 | 12/31/24 | (4,680) | ||||||||||||
Low Sulphur Gas Oil | Long | 5 | 365,875 | 6/12/24 | (9,975) | ||||||||||||
Low Sulphur Gas Oil | Long | 46 | 3,378,700 | 7/11/24 | (114,552) | ||||||||||||
Low Sulphur Gas Oil | Long | 4 | 295,000 | 8/12/24 | (13,575) | ||||||||||||
Low Sulphur Gas Oil | Long | 1 | 74,050 | 9/12/24 | (1,375) | ||||||||||||
Milling Wheat | Short | 15 | 210,975 | 9/10/24 | (26,316) | ||||||||||||
Milling Wheat | Short | 27 | 387,811 | 12/10/24 | (41,306) | ||||||||||||
Milling Wheat | Short | 3 | 43,334 | 3/10/25 | (3,447) | ||||||||||||
Milling Wheat | Short | 1 | 14,445 | 5/12/25 | (462) | ||||||||||||
Natural Gas | Long | 10 | 258,700 | 6/26/24 | (9,980) | ||||||||||||
Natural Gas | Short | 19 | 491,530 | 6/26/24 | 19,058 | ||||||||||||
34 | Annual Report | franklintempleton.com | ||||
Description | Type | Number of Contracts | Notional Amount* | Expiration Date | Value/Unrealized Appreciation (Depreciation) | ||||||||||||
Commodity Contracts (continued)a | |||||||||||||||||
Natural Gas | Long | 2 | $53,240 | 7/29/24 | $(2,590) | ||||||||||||
Natural Gas | Long | 1 | 26,510 | 8/28/24 | 1,320 | ||||||||||||
Natural Gas | Long | 2 | 54,880 | 9/26/24 | (280) | ||||||||||||
Natural Gas | Long | 1 | 31,090 | 10/29/24 | (740) | ||||||||||||
NY Harbor Ultra Low Sulfur Diesel | Long | 7 | 700,955 | 6/28/24 | (40,740) | ||||||||||||
NY Harbor Ultra Low Sulfur Diesel | Long | 2 | 201,902 | 7/31/24 | (7,396) | ||||||||||||
NY Harbor Ultra Low Sulfur Diesel | Long | 2 | 203,448 | 8/30/24 | (5,309) | ||||||||||||
Palladium | Long | 5 | 456,450 | 9/26/24 | (40,280) | ||||||||||||
Platinum | Long | 24 | 1,250,400 | 7/29/24 | 147,960 | ||||||||||||
Platinum | Long | 1 | 52,695 | 10/29/24 | 545 | ||||||||||||
Rapeseed | Short | 1 | 26,448 | 7/31/24 | (1,601) | ||||||||||||
Rapeseed | Short | 1 | 26,882 | 10/31/24 | (1,614) | ||||||||||||
Robusta Coffee | Long | 6 | 247,200 | 7/25/24 | 11,860 | ||||||||||||
Robusta Coffee | Long | 15 | 598,050 | 9/24/24 | 11,930 | ||||||||||||
Robusta Coffee | Long | 4 | 154,160 | 11/25/24 | (3,150) | ||||||||||||
Silver | Long | 19 | 2,891,800 | 7/29/24 | 137,326 | ||||||||||||
Silver | Short | 18 | 2,739,600 | 7/29/24 | (241,885) | ||||||||||||
Silver | Short | 2 | 307,670 | 9/26/24 | 16,605 | ||||||||||||
Soybean Meal | Long | 18 | 656,460 | 7/12/24 | (20,771) | ||||||||||||
Soybean Meal | Short | 18 | 656,460 | 7/12/24 | (39,450) | ||||||||||||
Soybean Meal | Short | 4 | 143,200 | 8/14/24 | (2,930) | ||||||||||||
Soybean Meal | Short | 2 | 71,180 | 9/13/24 | (3,110) | ||||||||||||
Soybean Meal | Short | 1 | 35,570 | 10/14/24 | (1,950) | ||||||||||||
Soybean Meal | Short | 11 | 395,340 | 12/13/24 | (6,700) | ||||||||||||
Soybean Meal | Short | 1 | 36,020 | 1/14/25 | 1,260 | ||||||||||||
Soybean Oil | Short | 37 | 1,010,544 | 7/12/24 | (282) | ||||||||||||
Soybean Oil | Short | 2 | 54,936 | 8/14/24 | (510) | ||||||||||||
Soybean Oil | Short | 1 | 27,522 | 9/13/24 | (282) | ||||||||||||
Soybean Oil | Short | 1 | 27,516 | 10/14/24 | (180) | ||||||||||||
Soybean Oil | Short | 6 | 165,816 | 12/13/24 | (2,124) | ||||||||||||
Soybeans | Short | 42 | 2,530,500 | 7/12/24 | (51,440) | ||||||||||||
Soybeans | Short | 3 | 180,525 | 8/14/24 | (1,350) | ||||||||||||
Soybeans | Short | 1 | 59,225 | 9/13/24 | (988) | ||||||||||||
Soybeans | Short | 24 | 1,421,400 | 11/14/24 | 7,700 | ||||||||||||
Soybeans | Short | 2 | 119,750 | 1/14/25 | 1,550 | ||||||||||||
Sugar | Long | 36 | 737,856 | 6/28/24 | (127,088) | ||||||||||||
Sugar | Short | 51 | 1,045,296 | 6/28/24 | 112,358 | ||||||||||||
Sugar | Short | 14 | 286,787 | 9/30/24 | 21,504 | ||||||||||||
Sugar | Short | 3 | 62,362 | 2/28/25 | 3,192 | ||||||||||||
UK Natural Gas | Short | 45 | 1,454,593 | 6/27/24 | (31,403) | ||||||||||||
UK Natural Gas | Short | 5 | 164,110 | 7/30/24 | 1,560 | ||||||||||||
Wheat | Short | 44 | 1,492,700 | 7/12/24 | (234,333) | ||||||||||||
Wheat | Short | 10 | 349,750 | 9/13/24 | (49,050) | ||||||||||||
Wheat | Short | 8 | 289,400 | 12/13/24 | (37,925) | ||||||||||||
Wheat | Short | 1 | 37,013 | 3/14/25 | (4,663) | ||||||||||||
White Sugar | Short | 11 | 297,935 | 7/16/24 | 38,840 | ||||||||||||
White Sugar | Short | 4 | 103,740 | 9/13/24 | 10,310 | ||||||||||||
White Sugar | Short | 1 | 25,440 | 11/15/24 | 1,660 | ||||||||||||
WTI Crude Oil | Long | 45 | 3,464,550 | 6/20/24 | (54,739) | ||||||||||||
Zinc | Long | 10 | 732,320 | 6/17/24 | 139,760 | ||||||||||||
Zinc | Short | 10 | 732,320 | 6/17/24 | (42,750) | ||||||||||||
Zinc | Long | 7 | 521,071 | 9/16/24 | 8,221 | ||||||||||||
(1,077,195) | |||||||||||||||||
Currency Contractsa | |||||||||||||||||
Australian Dollar Index | Short | 16 | 1,063,440 | 6/17/24 | (20,715) | ||||||||||||
British Pound Index | Long | 8 | 636,600 | 6/17/24 | (225) | ||||||||||||
franklintempleton.com | Annual Report | 35 | ||||
Description | Type | Number of Contracts | Notional Amount* | Expiration Date | Value/Unrealized Appreciation (Depreciation) | ||||||||||||
Currency Contracts (continued)a | |||||||||||||||||
Canadian Dollar Index | Short | 178 | $13,063,420 | 6/18/24 | $94,974 | ||||||||||||
EUR/CZK | Long | 3 | 527,074 | 6/17/24 | 7,992 | ||||||||||||
EUR/HUF | Long | 13 | 1,085,007 | 6/17/24 | 5,996 | ||||||||||||
EUR/NOK | Long | 34 | 4,612,268 | 6/17/24 | (153,770) | ||||||||||||
EUR/PLN | Long | 16 | 2,030,694 | 6/17/24 | 21,309 | ||||||||||||
EUR/SEK | Long | 2 | 271,227 | 6/17/24 | (5,181) | ||||||||||||
Euro Index | Long | 145 | 19,665,625 | 6/17/24 | (167,495) | ||||||||||||
Japanese Yen Index | Long | 54 | 4,302,112 | 6/17/24 | (87,190) | ||||||||||||
Mexican Peso Index | Long | 420 | 12,343,800 | 6/17/24 | (55,170) | ||||||||||||
New Israeli Shekel Index | Short | 5 | 1,348,450 | 6/17/24 | (19,214) | ||||||||||||
New Zealand Dollar Index | Short | 52 | 3,192,280 | 6/17/24 | 2,910 | ||||||||||||
South African Rand Index | Short | 121 | 3,212,550 | 6/17/24 | (29,728) | ||||||||||||
Swiss Franc Index | Short | 86 | 11,927,663 | 6/17/24 | 368,094 | ||||||||||||
U.S. Dollar Index | Long | 260 | 3,640,807 | 6/17/24 | 85,614 | ||||||||||||
48,201 | |||||||||||||||||
Equity Contracts | |||||||||||||||||
CAC 40 10 Euro Indexa | Long | 33 | 2,862,385 | 6/21/24 | (67,085) | ||||||||||||
CAC 40 10 Euro Indexa | Short | 2 | 173,478 | 6/21/24 | 3,902 | ||||||||||||
CBOE Volatility Indexa | Long | 56 | 772,218 | 6/18/24 | (61,532) | ||||||||||||
CBOE Volatility Indexa | Long | 27 | 393,695 | 7/17/24 | (24,655) | ||||||||||||
CBOE Volatility Indexa | Long | 7 | 105,712 | 8/21/24 | (3,338) | ||||||||||||
CBOE Volatility Indexa | Long | 1 | 15,600 | 9/18/24 | (150) | ||||||||||||
DAX Indexa | Long | 19 | 9,550,860 | 6/21/24 | (15,291) | ||||||||||||
DJ EURO STOXX 50 Indexa | Long | 330 | 17,846,043 | 6/21/24 | 38,195 | ||||||||||||
DJ EURO STOXX 50 Index | Short | 8 | 432,631 | 6/21/24 | (1,473) | ||||||||||||
DJIA Mini E-CBOT Indexa | Long | 20 | 3,879,100 | 6/21/24 | (66,299) | ||||||||||||
E-Mini Russell 2000a | Long | 9 | 934,110 | 6/21/24 | (7,579) | ||||||||||||
E-Mini Russell 2000a | Short | 112 | 11,624,480 | 6/21/24 | 97,585 | ||||||||||||
E-mini S&P MidCap 400 Indexa | Short | 6 | 1,795,140 | 6/21/24 | 1,760 | ||||||||||||
FTSE 100 Indexa | Long | 70 | 7,390,908 | 6/21/24 | 160,761 | ||||||||||||
FTSE China A50 Indexa | Long | 264 | 3,263,568 | 6/27/24 | (61,795) | ||||||||||||
FTSE Taiwan Indexa | Short | 8 | 575,200 | 6/27/24 | 18,600 | ||||||||||||
FTSE/JSE Top 40 Indexa | Short | 25 | 941,735 | 6/20/24 | (45,761) | ||||||||||||
FTSE/MIB Indexa | Long | 3 | 562,702 | 6/21/24 | (2,794) | ||||||||||||
Hang Seng China Enterprises Indexa | Long | 5 | 203,187 | 6/27/24 | (9,032) | ||||||||||||
Hang Seng Indexa | Long | 12 | 1,381,694 | 6/27/24 | (48,932) | ||||||||||||
IBEX 35 Indexa | Short | 23 | 2,825,762 | 6/21/24 | (7,115) | ||||||||||||
KOSPI 200 Indexa | Short | 53 | 3,445,641 | 6/13/24 | 19,939 | ||||||||||||
MSCI Emerging Markets Indexa | Long | 7 | 369,775 | 6/21/24 | (3,505) | ||||||||||||
MSCI Singapore Indexa | Long | 22 | 502,946 | 6/27/24 | (4,873) | ||||||||||||
NASDAQ 100 E-Mini Indexa | Long | 7 | 2,602,740 | 6/21/24 | 28,689 | ||||||||||||
Nikkei 225 Indexa | Long | 161 | 10,034,018 | 6/13/24 | (282,733) | ||||||||||||
NSE IFSC Nifty 50 Indexa | Short | 1 | 45,376 | 6/27/24 | 811 | ||||||||||||
S&P 500 E-Mini Indexa | Long | 161 | 42,628,775 | 6/21/24 | 721,690 | ||||||||||||
S&P 500 E-Mini Index | Short | 5 | 1,323,875 | 6/21/24 | 3,909 | ||||||||||||
S&P/TSX 60 Indexa | Long | 19 | 3,720,401 | 6/20/24 | 43,857 | ||||||||||||
SPI 200 Indexa | Short | 9 | 1,155,564 | 6/20/24 | 481 | ||||||||||||
TOPIX Indexa | Long | 44 | 7,755,572 | 6/13/24 | 185,313 | ||||||||||||
611,550 | |||||||||||||||||
Interest Rate Contractsa | |||||||||||||||||
3 Month EURIBOR | Long | 31 | 8,108,936 | 9/16/24 | (19,445) | ||||||||||||
3 Month EURIBOR | Long | 32 | 8,385,271 | 12/16/24 | (25,244) | ||||||||||||
3 Month EURIBOR | Long | 25 | 6,561,166 | 3/17/25 | (27,331) | ||||||||||||
3 Month EURIBOR | Long | 26 | 6,833,133 | 6/16/25 | (31,024) | ||||||||||||
3 Month EURIBOR | Short | 146 | 38,370,672 | 6/16/25 | 200,805 | ||||||||||||
3 Month EURIBOR | Long | 18 | 4,736,734 | 9/15/25 | (21,978) | ||||||||||||
36 | Annual Report | franklintempleton.com | ||||
Description | Type | Number of Contracts | Notional Amount* | Expiration Date | Value/Unrealized Appreciation (Depreciation) | ||||||||||||
Interest Rate Contracts (continued)a | |||||||||||||||||
3 Month EURIBOR | Long | 20 | $5,268,463 | 12/15/25 | $(22,314) | ||||||||||||
3 Month EURIBOR | Long | 12 | 3,163,519 | 3/16/26 | (11,019) | ||||||||||||
3 Month EURIBOR | Long | 6 | 1,582,736 | 6/15/26 | (5,465) | ||||||||||||
3 Month SOFR | Short | 12 | 2,844,600 | 12/17/24 | 313 | ||||||||||||
3 Month SOFR | Short | 14 | 3,326,050 | 3/18/25 | (100) | ||||||||||||
3 Month SOFR | Short | 10 | 2,381,125 | 6/17/25 | (513) | ||||||||||||
3 Month SOFR | Short | 302 | 72,064,750 | 9/16/25 | 113,099 | ||||||||||||
3 Month SOFR | Short | 8 | 1,912,700 | 12/16/25 | (563) | ||||||||||||
3 Month SOFR | Short | 7 | 1,676,238 | 3/17/26 | 163 | ||||||||||||
3 Month SOFR | Short | 5 | 1,198,688 | 6/16/26 | (225) | ||||||||||||
3 Month SOFR | Short | 4 | 959,700 | 9/15/26 | (638) | ||||||||||||
3 Month SONIA | Short | 12 | 3,630,850 | 12/17/24 | 8,215 | ||||||||||||
3 Month SONIA | Short | 14 | 4,243,796 | 3/18/25 | 11,000 | ||||||||||||
3 Month SONIA | Short | 12 | 3,643,847 | 6/17/25 | 23,967 | ||||||||||||
3 Month SONIA | Short | 34 | 10,342,105 | 9/16/25 | 12,411 | ||||||||||||
ASX 90 Day Bank Accepted Bill | Long | 10 | 6,581,930 | 9/12/24 | (3,649) | ||||||||||||
ASX 90 Day Bank Accepted Bill | Long | 8 | 5,265,544 | 12/12/24 | (4,609) | ||||||||||||
ASX 90 Day Bank Accepted Bill | Long | 6 | 3,949,832 | 3/13/25 | (3,828) | ||||||||||||
ASX 90 Day Bank Accepted Bill | Long | 4 | 254,829 | 6/12/25 | (1,143) | ||||||||||||
ASX 90 Day Bank Accepted Bill | Long | 2 | 1,275,210 | 9/11/25 | (5,854) | ||||||||||||
Australian 3 Yr. Bond | Long | 89 | 6,244,747 | 6/17/24 | (76,472) | ||||||||||||
Australian 10 Yr. Bond | Long | 33 | 2,473,617 | 6/17/24 | (21,257) | ||||||||||||
Australian 10 Yr. Bond | Short | 64 | 4,797,319 | 6/17/24 | 91,429 | ||||||||||||
Canadian 10 Yr. Bond | Long | 42 | 3,663,348 | 9/18/24 | (8,391) | ||||||||||||
Euro-BOBL | Long | 22 | 2,767,617 | 6/06/24 | (33,645) | ||||||||||||
Euro-BOBL | Long | 11 | 1,377,244 | 9/06/24 | 3,223 | ||||||||||||
Euro-BOBL | Short | 22 | 2,754,488 | 9/06/24 | (2,527) | ||||||||||||
Euro-Bund | Long | 108 | 15,156,768 | 6/06/24 | (360,991) | ||||||||||||
Euro-Bund | Long | 62 | 8,744,162 | 9/06/24 | 33,391 | ||||||||||||
Euro-Buxl | Short | 13 | 1,783,237 | 6/06/24 | 96,178 | ||||||||||||
Euro-OAT | Long | 25 | 3,383,730 | 6/06/24 | (71,206) | ||||||||||||
Euro-SCHATZ | Long | 22 | 2,505,631 | 6/06/24 | (3,997) | ||||||||||||
Euro-SCHATZ | Long | 22 | 2,512,196 | 9/06/24 | 1,611 | ||||||||||||
Euro-SCHATZ | Short | 219 | 25,007,769 | 9/06/24 | (10,295) | ||||||||||||
Japanese 10 Yr. Bond | Long | 3 | 2,727,689 | 6/13/24 | (47,026) | ||||||||||||
Korean 3 Yr. Bond | Long | 16 | 1,204,955 | 6/18/24 | (4,586) | ||||||||||||
Korean 10 Yr. Bond | Short | 21 | 1,695,410 | 6/18/24 | (1,873) | ||||||||||||
Long Gilt | Long | 16 | 1,963,773 | 9/26/24 | (11,747) | ||||||||||||
Long Gilt | Short | 50 | 6,136,791 | 9/26/24 | 47,202 | ||||||||||||
U.S. Treasury 2 Yr. Note | Long | 269 | 54,796,141 | 9/30/24 | (45,921) | ||||||||||||
U.S. Treasury 2 Yr. Note | Short | 159 | 32,388,797 | 9/30/24 | (13,145) | ||||||||||||
U.S. Treasury 5 Yr. Note | Short | 130 | 13,753,593 | 9/30/24 | 4,573 | ||||||||||||
U.S. Treasury 10 Yr. Note | Short | 266 | 28,939,968 | 9/19/24 | 19,522 | ||||||||||||
U.S. Treasury 10 Yr. Ultra | Short | 35 | 3,921,094 | 9/19/24 | 2,523 | ||||||||||||
U.S. Treasury Long Bond | Long | 8 | 928,500 | 9/19/24 | (7,200) | ||||||||||||
U.S. Treasury Long Bond | Short | 40 | 4,642,500 | 9/19/24 | 16,648 | ||||||||||||
U.S. Treasury Ultra Bond | Short | 30 | 3,673,125 | 9/19/24 | 24,258 | ||||||||||||
(194,690) | |||||||||||||||||
Total Futures Contracts | $(612,134) | ||||||||||||||||
franklintempleton.com | Annual Report | 37 | ||||
Currency | Counterpartya | Type | Quantity | Contract Amount* | Settlement Date | Unrealized Appreciation | Unrealized Depreciation | |||||||||||||||||||
OTC Forward Exchange Contracts | ||||||||||||||||||||||||||
Australian Dollar | BZWS | Buy | 2,272,000 | 1,481,773 | 6/20/24 | $30,814 | $— | |||||||||||||||||||
Australian Dollar | BZWS | Sell | 3,103,000 | 2,042,290 | 6/20/24 | 520 | (24,054) | |||||||||||||||||||
British Pound | BZWS | Buy | 1,834,000 | 2,304,585 | 6/20/24 | 32,632 | (4) | |||||||||||||||||||
British Pound | BZWS | Sell | 2,133,000 | 2,714,361 | 6/20/24 | — | (3,892) | |||||||||||||||||||
British Pound | JPHQ | Sell | 768,000 | 978,658 | 6/20/24 | — | (68) | |||||||||||||||||||
Euro | BZWS | Buy | 1,559,000 | 1,689,084 | 6/20/24 | 7,020 | (2,972) | |||||||||||||||||||
Euro | BZWS | Sell | 2,072,000 | 2,261,960 | 6/20/24 | 12,487 | (796) | |||||||||||||||||||
Euro | JPHQ | Buy | 160,000 | 172,261 | 6/20/24 | 1,505 | — | |||||||||||||||||||
Euro | JPHQ | Sell | 1,104,000 | 1,206,692 | 6/20/24 | 7,706 | — | |||||||||||||||||||
Japanese Yen | BZWS | Sell | 5,653,000 | 36,523 | 6/20/24 | 464 | — | |||||||||||||||||||
Norwegian Krone | BZWS | Buy | 17,743,000 | 1,681,855 | 6/20/24 | 9,416 | — | |||||||||||||||||||
Norwegian Krone | BZWS | Sell | 17,743,000 | 1,673,717 | 6/20/24 | — | (17,554) | |||||||||||||||||||
Swedish Krona | BZWS | Buy | 11,101,000 | 1,050,329 | 6/20/24 | 5,581 | — | |||||||||||||||||||
Swedish Krona | BZWS | Sell | 11,483,000 | 1,088,458 | 6/20/24 | 4,781 | (8,567) | |||||||||||||||||||
Australian Dollarb | MSCO | Buy | 11,597,000 | 7,593,533 | 6/21/24 | 127,417 | (5) | |||||||||||||||||||
Australian Dollarb | MSCO | Sell | 17,077,000 | 11,288,096 | 6/21/24 | 1,474 | (82,745) | |||||||||||||||||||
British Poundb | MSCO | Buy | 2,326,000 | 2,956,764 | 6/21/24 | 15,244 | (7,779) | |||||||||||||||||||
British Poundb | MSCO | Sell | 4,393,000 | 5,528,186 | 6/21/24 | 1,038 | (71,238) | |||||||||||||||||||
Canadian Dollarb | MSCO | Buy | 5,661,000 | 4,163,190 | 6/21/24 | 7,439 | (15,397) | |||||||||||||||||||
Canadian Dollarb | MSCO | Sell | 18,787,000 | 13,902,709 | 6/21/24 | 132,336 | (19,478) | |||||||||||||||||||
Eurob | MSCO | Buy | 5,805,000 | 6,252,714 | 6/21/24 | 58,987 | (6,961) | |||||||||||||||||||
Eurob | MSCO | Sell | 19,784,000 | 21,527,611 | 6/21/24 | 109,053 | (68,607) | |||||||||||||||||||
Japanese Yenb | MSCO | Buy | 222,851,000 | 1,455,804 | 6/21/24 | 20 | (34,092) | |||||||||||||||||||
Japanese Yenb | MSCO | Sell | 1,248,324,000 | 8,476,890 | 6/21/24 | 512,912 | — | |||||||||||||||||||
Mexican Pesob | MSCO | Buy | 57,386,000 | 3,376,889 | 6/21/24 | 28 | (6,172) | |||||||||||||||||||
Mexican Pesob | MSCO | Sell | 2,694,000 | 157,775 | 6/21/24 | 160 | (626) | |||||||||||||||||||
New Zealand Dollarb | MSCO | Buy | 4,857,000 | 2,985,780 | 6/21/24 | 6,550 | (6,728) | |||||||||||||||||||
New Zealand Dollarb | MSCO | Sell | 10,210,000 | 6,158,082 | 6/21/24 | 945 | (118,964) | |||||||||||||||||||
Swiss Francb | MSCO | Buy | 422,000 | 467,926 | 6/21/24 | 1,880 | (981) | |||||||||||||||||||
Swiss Francb | MSCO | Sell | 7,248,000 | 8,276,741 | 6/21/24 | 227,290 | (2,774) | |||||||||||||||||||
Canadian Dollar | BNYM | Buy | 917,000 | 675,970 | 6/26/24 | — | (2,815) | |||||||||||||||||||
Canadian Dollar | BNYM | Sell | 1,109,000 | 818,301 | 6/26/24 | 4,202 | — | |||||||||||||||||||
Euro | BNYM | Buy | 700,000 | 758,774 | 6/26/24 | 2,374 | (713) | |||||||||||||||||||
Euro | BNYM | Sell | 1,793,000 | 1,947,748 | 6/26/24 | — | (51) | |||||||||||||||||||
Hong Kong Dollar | BNYM | Buy | 5,583,000 | 714,988 | 6/26/24 | — | (546) | |||||||||||||||||||
Hong Kong Dollar | BNYM | Sell | 9,897,000 | 1,268,308 | 6/26/24 | 1,815 | — | |||||||||||||||||||
Euro | BZWS | Sell | 439,180 | 51,651,983 | RSD | 7/03/24 | 2,345 | (963) | ||||||||||||||||||
Serbian Dinar | BZWS | Sell | 51,651,983 | 439,666 | EUR | 7/03/24 | 4,826 | (5,680) | ||||||||||||||||||
Chinese Yuan | BZWS | Sell | 19,659,750 | 2,757,715 | 7/17/24 | 30,084 | — | |||||||||||||||||||
Chinese Yuan | HSBC | Buy | 19,633,516 | 2,765,114 | 7/17/24 | — | (41,123) | |||||||||||||||||||
Colombian Peso | BZWS | Buy | 5,497,206,461 | 1,391,515 | 7/17/24 | 19,893 | — | |||||||||||||||||||
Colombian Peso | BZWS | Sell | 857,759,635 | 216,718 | 7/17/24 | — | (3,512) | |||||||||||||||||||
Colombian Peso | CITI | Buy | 2,880,670,721 | 728,362 | 7/17/24 | 11,250 | — | |||||||||||||||||||
Colombian Peso | GSCO | Sell | 2,140,954,728 | 539,353 | 7/17/24 | — | (10,337) | |||||||||||||||||||
Colombian Peso | JPHQ | Buy | 3,607,907,843 | 913,517 | 7/17/24 | 12,813 | — | |||||||||||||||||||
Colombian Peso | UBSW | Sell | 10,145,167,600 | 2,619,054 | 7/17/24 | 14,282 | — | |||||||||||||||||||
Colombian Peso | JPHQ | Buy | 2,807,768,715 | 711,638 | 7/17/24 | 9,257 | — | |||||||||||||||||||
Colombian Peso | JPHQ | Sell | 7,205,935,000 | 1,850,000 | 7/17/24 | — | (124) | |||||||||||||||||||
Czech Koruna | BOFA | Buy | 26,987,444 | 1,135,501 | 7/17/24 | 51,168 | — | |||||||||||||||||||
Czech Koruna | BZWS | Sell | 27,448,000 | 1,176,993 | 7/17/24 | — | (29,927) | |||||||||||||||||||
Euro | JPHQ | Sell | 85,000 | 91,126 | 7/17/24 | — | (1,305) | |||||||||||||||||||
Euro | BNPP | Buy | 885,000 | 956,701 | 7/17/24 | 5,664 | — | |||||||||||||||||||
38 | Annual Report | franklintempleton.com | ||||
Currency | Counterpartya | Type | Quantity | Contract Amount* | Settlement Date | Unrealized Appreciation | Unrealized Depreciation | |||||||||||||||||||
OTC Forward Exchange Contracts (continued) | ||||||||||||||||||||||||||
Euro | BZWS | Buy | 3,073,650 | 3,280,000 | 7/17/24 | $62,344 | $— | |||||||||||||||||||
Euro | CITI | Buy | 1,085,000 | 1,169,577 | 7/17/24 | 10,272 | — | |||||||||||||||||||
Hungarian Forint | GSCO | Sell | 28,756,785 | 73,124 | EUR | 7/17/24 | — | (420) | ||||||||||||||||||
Euro | MLCO | Sell | 1,969,505 | 2,130,000 | 7/17/24 | — | (11,676) | |||||||||||||||||||
Polish Zloty | MSCO | Sell | 679,667 | 157,779 | EUR | 7/17/24 | — | (859) | ||||||||||||||||||
Euro | MSCO | Buy | 1,133,000 | 1,215,151 | 7/17/24 | 16,894 | — | |||||||||||||||||||
Euro | MSCO | Sell | 910,377 | 979,878 | 7/17/24 | �� | 1,022 | (11,105) | ||||||||||||||||||
Euro | JPHQ | Sell | 2,707,953 | 2,951,907 | 7/17/24 | 7,230 | — | |||||||||||||||||||
Euro | SSBT | Sell | 240,000 | 260,411 | 7/17/24 | — | (569) | |||||||||||||||||||
Euro | JPHQ | Sell | 114,794 | 124,074 | 7/17/24 | — | (755) | |||||||||||||||||||
Indonesian Rupiah | BZWS | Buy | 500,000,000 | 30,702 | 7/17/24 | 44 | — | |||||||||||||||||||
Indonesian Rupiah | MSCO | Buy | 21,201,459,961 | 1,316,812 | 7/17/24 | — | (13,113) | |||||||||||||||||||
Indonesian Rupiah | MSCO | Sell | 1,608,652,487 | 100,821 | 7/17/24 | 1,903 | — | |||||||||||||||||||
Indonesian Rupiah | JPHQ | Sell | 1,608,652,488 | 100,832 | 7/17/24 | 1,914 | — | |||||||||||||||||||
Indonesian Rupiah | SSBT | Sell | 22,084,230,858 | 1,366,289 | 7/17/24 | 8,308 | — | |||||||||||||||||||
Indonesian Rupiah | UBSW | Buy | 45,081,750,000 | 2,770,000 | 7/17/24 | 2,122 | — | |||||||||||||||||||
Indonesian Rupiah | UBSW | Sell | 34,859,290,000 | 2,180,000 | 7/17/24 | 36,467 | — | |||||||||||||||||||
Japanese Yen | UBSW | Buy | 32,891,464 | 219,814 | 7/17/24 | — | (9,123) | |||||||||||||||||||
Kazakhstan Tenge | CITI | Sell | 284,392,039 | 630,595 | 7/17/24 | 1,547 | — | |||||||||||||||||||
Kazakhstan Tenge | JPHQ | Buy | 281,445,408 | 615,720 | 7/17/24 | 6,810 | — | |||||||||||||||||||
Mexican Peso | BNPP | Sell | 45,064,602 | 2,659,937 | 7/17/24 | 27,613 | (3,592) | |||||||||||||||||||
Mexican Peso | BZWS | Buy | 30,603,300 | 1,770,000 | 7/17/24 | 20,047 | — | |||||||||||||||||||
Mexican Peso | BZWS | Sell | 23,502,997 | 1,397,723 | 7/17/24 | 22,987 | — | |||||||||||||||||||
Mexican Peso | CITI | Buy | 27,559,000 | 1,609,184 | 7/17/24 | 2,796 | — | |||||||||||||||||||
Mexican Peso | JPHQ | Buy | 18,623,520 | 1,080,000 | 7/17/24 | 9,326 | — | |||||||||||||||||||
Mexican Peso | UBSW | Sell | 639,000 | 36,603 | 7/17/24 | — | (773) | |||||||||||||||||||
Peruvian Nuevo Sol | JPHQ | Sell | 2,261,866 | 602,923 | 7/17/24 | — | (4,207) | |||||||||||||||||||
Peruvian Nuevo Sol | CITI | Sell | 5,796,691 | 1,559,321 | 7/17/24 | 3,373 | — | |||||||||||||||||||
Peruvian Nuevo Sol | GSCO | Buy | 7,507,953 | 2,003,239 | 7/17/24 | 12,517 | (471) | |||||||||||||||||||
Peruvian Nuevo Sol | JPHQ | Buy | 1,541,813 | 415,471 | 7/17/24 | — | (1,618) | |||||||||||||||||||
Peruvian Nuevo Sol | UBSW | Sell | 3,830,108 | 1,017,077 | 7/17/24 | — | (11,001) | |||||||||||||||||||
Peruvian Nuevo Sol | JPHQ | Buy | 1,539,229 | 414,529 | 7/17/24 | — | (1,369) | |||||||||||||||||||
Peruvian Nuevo Sol | JPHQ | Sell | 3,047,866 | 819,737 | 7/17/24 | 1,629 | — | |||||||||||||||||||
Philippine Peso | CITI | Buy | 33,284,284 | 578,985 | 7/17/24 | — | (10,746) | |||||||||||||||||||
Philippine Peso | JPHQ | Buy | 13,271,119 | 231,015 | 7/17/24 | — | (4,447) | |||||||||||||||||||
Romanian Leu | BNPP | Sell | 4,972,342 | 1,083,980 | 7/17/24 | 2,143 | (1,521) | |||||||||||||||||||
Romanian Leu | BZWS | Buy | 3,061,552 | 657,127 | 7/17/24 | 9,914 | — | |||||||||||||||||||
Romanian Leu | HSBC | Buy | 4,096,979 | 877,621 | 7/17/24 | 15,016 | — | |||||||||||||||||||
Romanian Leu | UBSW | Sell | 2,158,473 | 471,391 | 7/17/24 | 1,110 | — | |||||||||||||||||||
South African Rand | BNPP | Sell | 5,692,442 | 299,256 | 7/17/24 | — | (2,565) | |||||||||||||||||||
South African Rand | BZWS | Sell | 7,699,860 | 405,358 | 7/17/24 | — | (2,899) | |||||||||||||||||||
South African Rand | HSBC | Sell | 36,902,676 | 1,955,386 | 7/17/24 | 1,386 | (2,627) | |||||||||||||||||||
South African Rand | MLCO | Buy | 12,972,765 | 710,000 | 7/17/24 | — | (22,167) | |||||||||||||||||||
South African Rand | MSCO | Sell | 20,362,139 | 1,089,861 | 7/17/24 | 10,234 | — | |||||||||||||||||||
South African Rand | SSBT | Buy | 15,646,000 | 840,620 | 7/17/24 | — | (11,049) | |||||||||||||||||||
South African Rand | JPHQ | Buy | 26,084,242 | 1,392,564 | 7/17/24 | — | (9,544) | |||||||||||||||||||
Turkish Lira | BNPP | Buy | 1,956,848 | 56,072 | 7/17/24 | 2,005 | — | |||||||||||||||||||
Turkish Lira | BZWS | Buy | 48,606,400 | 1,360,000 | 7/17/24 | 82,573 | — | |||||||||||||||||||
Turkish Lira | BZWS | Sell | 38,743,312 | 1,130,532 | 7/17/24 | — | (19,318) | |||||||||||||||||||
Turkish Lira | CITI | Sell | 8,849,361 | 262,147 | 7/17/24 | — | (490) | |||||||||||||||||||
Turkish Lira | HSBC | Sell | 11,819,937 | 340,567 | 7/17/24 | — | (10,233) | |||||||||||||||||||
Brazilian Real | BNPP | Buy | 4,688,459 | 899,087 | 8/02/24 | — | (11,694) | |||||||||||||||||||
Brazilian Real | BNPP | Sell | 8,677,128 | 1,681,587 | 8/02/24 | 39,252 | — | |||||||||||||||||||
Brazilian Real | JPHQ | Buy | 5,860,574 | 1,133,365 | 8/02/24 | — | (24,124) | |||||||||||||||||||
franklintempleton.com | Annual Report | 39 | ||||
Currency | Counterpartya | Type | Quantity | Contract Amount* | Settlement Date | Unrealized Appreciation | Unrealized Depreciation | |||||||||||||||||||
OTC Forward Exchange Contracts (continued) | ||||||||||||||||||||||||||
Brazilian Real | HSBC | Buy | 5,880,709 | 1,127,177 | 8/02/24 | $— | $(14,125) | |||||||||||||||||||
Chinese Yuan | MSCO | Sell | 2,828,471 | 397,658 | 8/15/24 | 3,979 | — | |||||||||||||||||||
South Korean Won | MSCO | Buy | 530,163,970 | 390,166 | 8/20/24 | — | (5,517) | |||||||||||||||||||
British Pound | MSCO | Sell | 2,250,000 | 2,873,866 | 8/30/24 | 5,419 | — | |||||||||||||||||||
Danish Krone | MSCO | Sell | 3,300,000 | 483,359 | 8/30/24 | 837 | — | |||||||||||||||||||
Euro | MSCO | Sell | 4,350,000 | 4,749,970 | 8/30/24 | 9,970 | — | |||||||||||||||||||
Norwegian Krone | MSCO | Sell | 1,500,000 | 143,031 | 8/30/24 | — | (202) | |||||||||||||||||||
Polish Zloty | MSCO | Sell | 100,000 | 25,487 | 8/30/24 | 131 | — | |||||||||||||||||||
Swedish Krona | MSCO | Sell | 5,200,000 | 494,538 | 8/30/24 | — | (1,899) | |||||||||||||||||||
Swiss Franc | MSCO | Buy | 400,000 | 443,378 | 8/30/24 | 4,628 | — | |||||||||||||||||||
Turkish Lira | BZWS | Buy | 31,324,290 | 790,000 | 11/04/24 | 47,563 | — | |||||||||||||||||||
Turkish Lira | BZWS | Sell | 15,693,533 | 394,122 | 11/04/24 | — | (25,499) | |||||||||||||||||||
Euro | CITI | Sell | 388,213 | 45,964,441 | RSD | 11/07/24 | 4,160 | (2,470) | ||||||||||||||||||
Georgian Lari | CITI | Sell | 1,133,400 | 404,064 | 11/08/24 | — | (1,736) | |||||||||||||||||||
Turkish Lira | BZWS | Buy | 38,743,312 | 1,003,038 | 11/12/24 | 24,789 | — | |||||||||||||||||||
Euro | BNPP | Sell | 439,180 | 52,262,444 | RSD | 1/17/25 | 9,056 | (6,342) | ||||||||||||||||||
Serbian Dinar | BNPP | Sell | 52,262,444 | 438,370 | EUR | 1/17/25 | 4,625 | (8,228) | ||||||||||||||||||
Euro | CITI | Sell | 204,462 | 24,398,396 | RSD | 3/28/25 | 1,154 | — | ||||||||||||||||||
Euro | JPHQ | Sell | 2,900,000 | 3,396,074 | 3/31/25 | 203,691 | — | |||||||||||||||||||
Euro | GSCO | Sell | 178,965 | 21,359,458 | RSD | 5/05/25 | 1,078 | (358) | ||||||||||||||||||
Total Forward Exchange Contracts | $2,227,550 | $(868,001) | ||||||||||||||||||||||||
Net unrealized appreciation (depreciation) | $1,359,549 | |||||||||||||||||||||||||
40 | Annual Report | franklintempleton.com | ||||
Description | Annual Payment Rate Received (Paid) | Payment Frequency | Maturity Date | Notional Amounta | Value | Upfront Payments (Receipts) | Unrealized Appreciation (Depreciation) | Ratingb | |||||||||||||||||||||||||
Centrally Cleared Swap Contracts | |||||||||||||||||||||||||||||||||
Contracts to Buy Protectionc | |||||||||||||||||||||||||||||||||
Single Name | |||||||||||||||||||||||||||||||||
Air France-KLM | (5.00)% | Quarterly | 12/20/27 | 27,000 | EUR | $(3,540) | $1,968 | $(5,508) | |||||||||||||||||||||||||
Air France-KLM | (5.00)% | Quarterly | 12/20/27 | 38,000 | EUR | (4,982) | 2,710 | (7,692) | |||||||||||||||||||||||||
Air France-KLM | (5.00)% | Quarterly | 12/20/27 | 70,000 | EUR | (9,177) | 3,700 | (12,877) | |||||||||||||||||||||||||
Air France-KLM | (5.00)% | Quarterly | 12/20/27 | 80,000 | EUR | (14,496) | 5,459 | (19,955) | |||||||||||||||||||||||||
Air France-KLM | (5.00)% | Quarterly | 12/20/27 | 132,000 | EUR | (17,305) | 7,298 | (24,603) | |||||||||||||||||||||||||
Air France-KLM | (5.00)% | Quarterly | 6/20/24 | 200,000 | EUR | (556) | (56) | (500) | |||||||||||||||||||||||||
Air France-KLM | (5.00)% | Quarterly | 6/20/24 | 100,000 | EUR | (278) | (123) | (155) | |||||||||||||||||||||||||
American Airlines Inc. | (5.00)% | Quarterly | 6/20/24 | 143,000 | (299) | 155 | (454) | ||||||||||||||||||||||||||
American Airlines Inc. | (5.00)% | Quarterly | 6/20/24 | 286,000 | (598) | 623 | (1,221) | ||||||||||||||||||||||||||
American Airlines Inc. | (5.00)% | Quarterly | 6/20/24 | 178,000 | (372) | 661 | (1,033) | ||||||||||||||||||||||||||
American Airlines Inc. | (5.00)% | Quarterly | 6/20/25 | 72,000 | (2,145) | 3,648 | (5,793) | ||||||||||||||||||||||||||
American Airlines Inc. | (5.00)% | Quarterly | 6/20/26 | 145,000 | (4,092) | (6,385) | 2,293 | ||||||||||||||||||||||||||
American Airlines Inc. | (5.00)% | Quarterly | 6/20/26 | 73,000 | (2,060) | (3,000) | 940 | ||||||||||||||||||||||||||
American Airlines Inc. | (5.00)% | Quarterly | 6/20/26 | 107,000 | (3,019) | (4,556) | 1,537 | ||||||||||||||||||||||||||
American Airlines Inc. | (5.00)% | Quarterly | 6/20/24 | 41,000 | (86) | 112 | (198) | ||||||||||||||||||||||||||
American Airlines Inc. | (5.00)% | Quarterly | 6/20/24 | 189,000 | (395) | 566 | (961) | ||||||||||||||||||||||||||
American Airlines Inc. | (5.00)% | Quarterly | 12/20/25 | 275,000 | (7,968) | (11,907) | 3,939 | ||||||||||||||||||||||||||
American Airlines Inc. | (5.00)% | Quarterly | 6/20/26 | 145,000 | (4,092) | (4,565) | 473 | ||||||||||||||||||||||||||
American Airlines Inc. | (5.00)% | Quarterly | 6/20/25 | 59,000 | (1,758) | 292 | (2,050) | ||||||||||||||||||||||||||
American Airlines Inc. | (5.00)% | Quarterly | 6/20/25 | 72,000 | (2,145) | 474 | (2,619) | ||||||||||||||||||||||||||
American Airlines Inc. | (5.00)% | Quarterly | 6/20/25 | 216,000 | (6,435) | 715 | (7,150) | ||||||||||||||||||||||||||
American Airlines Inc. | (5.00)% | Quarterly | 6/20/25 | 72,000 | (2,145) | 1,104 | (3,249) | ||||||||||||||||||||||||||
American Airlines Inc. | (5.00)% | Quarterly | 6/20/25 | 144,000 | (4,290) | 2,437 | (6,727) | ||||||||||||||||||||||||||
American Airlines Inc. | (5.00)% | Quarterly | 6/20/25 | 144,000 | (4,290) | 2,552 | (6,842) | ||||||||||||||||||||||||||
American Airlines Inc. | (5.00)% | Quarterly | 12/20/25 | 110,000 | (3,187) | (4,780) | 1,593 | ||||||||||||||||||||||||||
American Airlines Inc. | (5.00)% | Quarterly | 12/20/25 | 55,000 | (1,593) | (2,389) | 796 | ||||||||||||||||||||||||||
American Airlines Inc. | (5.00)% | Quarterly | 6/20/26 | 145,000 | (4,092) | (5,259) | 1,167 | ||||||||||||||||||||||||||
American Airlines Inc. | (5.00)% | Quarterly | 6/20/26 | 145,000 | (4,092) | (4,562) | 470 | ||||||||||||||||||||||||||
American Airlines Inc. | (5.00)% | Quarterly | 6/20/26 | 40,000 | (1,129) | (1,278) | 149 | ||||||||||||||||||||||||||
American Axle & Manufacturing Inc. | (5.00)% | Quarterly | 6/20/29 | 144,000 | (10,747) | (11,010) | 263 | ||||||||||||||||||||||||||
American Axle & Manufacturing Inc. | (5.00)% | Quarterly | 6/20/27 | 72,000 | (6,161) | (3,068) | (3,093) | ||||||||||||||||||||||||||
American Axle & Manufacturing Inc. | (5.00)% | Quarterly | 6/20/27 | 72,000 | (6,161) | (1,875) | (4,286) | ||||||||||||||||||||||||||
American Axle & Manufacturing Inc. | (5.00)% | Quarterly | 6/20/27 | 72,000 | (6,161) | (1,875) | (4,286) | ||||||||||||||||||||||||||
American Axle & Manufacturing Inc. | (5.00)% | Quarterly | 6/20/27 | 72,000 | (6,161) | (1,743) | (4,418) | ||||||||||||||||||||||||||
American Axle & Manufacturing Inc. | (5.00)% | Quarterly | 6/20/27 | 73,000 | (6,247) | (2,243) | (4,004) | ||||||||||||||||||||||||||
American Axle & Manufacturing Inc. | (5.00)% | Quarterly | 6/20/27 | 134,000 | (11,466) | (1,455) | (10,011) | ||||||||||||||||||||||||||
American Axle & Manufacturing Inc. | (5.00)% | Quarterly | 6/20/27 | 11,000 | (941) | (233) | (708) | ||||||||||||||||||||||||||
American Axle & Manufacturing Inc. | (5.00)% | Quarterly | 6/20/27 | 62,000 | (5,305) | 435 | (5,740) | ||||||||||||||||||||||||||
Bayer AG | (1.00)% | Quarterly | 6/20/29 | 292,000 | EUR | (329) | 2,998 | (3,327) | |||||||||||||||||||||||||
Bayer AG | (1.00)% | Quarterly | 6/20/29 | 146,000 | EUR | (165) | 1,901 | (2,066) | |||||||||||||||||||||||||
BMW AG | (1.00)% | Quarterly | 6/20/29 | 851,000 | EUR | (22,784) | (21,347) | (1,437) | |||||||||||||||||||||||||
Boparan Finance PLC | (5.00)% | Quarterly | 6/20/24 | 72,000 | EUR | 29 | 645 | (616) | |||||||||||||||||||||||||
Carnival Corp. | (1.00)% | Quarterly | 6/20/29 | 884,000 | 57,994 | 57,369 | 625 | ||||||||||||||||||||||||||
Continental AG | (1.00)% | Quarterly | 12/20/28 | 3,000 | EUR | (27) | 57 | (84) | |||||||||||||||||||||||||
Continental AG | (1.00)% | Quarterly | 12/20/28 | 711,000 | EUR | (6,505) | 13,401 | (19,906) | |||||||||||||||||||||||||
Daimler Truck Holding AG | (1.00)% | Quarterly | 6/20/29 | 858,000 | EUR | (23,432) | (21,545) | (1,887) | |||||||||||||||||||||||||
Ford Motor Co. | (5.00)% | Quarterly | 6/20/29 | 1,386,000 | (209,892) | (202,543) | (7,349) | ||||||||||||||||||||||||||
Ford Motor Co. | (5.00)% | Quarterly | 6/20/29 | 335,000 | (50,731) | (50,833) | 102 | ||||||||||||||||||||||||||
franklintempleton.com | Annual Report | 41 | ||||
Description | Annual Payment Rate Received (Paid) | Payment Frequency | Maturity Date | Notional Amounta | Value | Upfront Payments (Receipts) | Unrealized Appreciation (Depreciation) | Ratingb | |||||||||||||||||||||||||
Centrally Cleared Swap Contracts (continued) | |||||||||||||||||||||||||||||||||
Contracts to Buy Protectionc (continued) | |||||||||||||||||||||||||||||||||
Single Name (continued) | |||||||||||||||||||||||||||||||||
Ford Motor Co. | (5.00)% | Quarterly | 6/20/29 | 290,000 | $(43,917) | $(44,023) | $106 | ||||||||||||||||||||||||||
Government of Egypt | (1.00)% | Quarterly | 6/20/26 | 365,000 | 17,577 | 137,788 | (120,211) | ||||||||||||||||||||||||||
Government of Italy | (1.00)% | Quarterly | 6/20/24 | 132,000 | (66) | 32 | (98) | ||||||||||||||||||||||||||
Government of Italy | (1.00)% | Quarterly | 6/20/24 | 218,000 | (110) | 25 | (135) | ||||||||||||||||||||||||||
Iceland Bondco | (5.00)% | Quarterly | 6/20/29 | 23,000 | EUR | 1,151 | 1,381 | (230) | |||||||||||||||||||||||||
Iceland Bondco | (5.00)% | Quarterly | 6/20/29 | 218,000 | EUR | 10,910 | 6,709 | 4,201 | |||||||||||||||||||||||||
K. Hovnanian Enterprises Inc. | (5.00)% | Quarterly | 6/20/28 | 36,000 | (3,303) | 2,325 | (5,628) | ||||||||||||||||||||||||||
K. Hovnanian Enterprises Inc. | (5.00)% | Quarterly | 6/20/28 | 93,000 | (8,532) | 6,383 | (14,915) | ||||||||||||||||||||||||||
K. Hovnanian Enterprises Inc. | (5.00)% | Quarterly | 6/20/28 | 115,000 | (10,550) | 8,172 | (18,722) | ||||||||||||||||||||||||||
Kohl’s Corp | (1.00)% | Quarterly | 12/20/24 | 171,000 | (200) | 1,746 | (1,946) | ||||||||||||||||||||||||||
Kohl’s Corp | (1.00)% | Quarterly | 6/20/29 | 43,000 | 7,053 | 5,874 | 1,179 | ||||||||||||||||||||||||||
Kohl’s Corp | (1.00)% | Quarterly | 6/20/29 | 144,000 | 23,619 | 19,816 | 3,803 | ||||||||||||||||||||||||||
Kohl’s Corp | (1.00)% | Quarterly | 6/20/29 | 43,000 | 7,053 | 5,874 | 1,179 | ||||||||||||||||||||||||||
Kohl’s Corp | (1.00)% | Quarterly | 6/20/29 | 58,000 | 9,513 | 7,826 | 1,687 | ||||||||||||||||||||||||||
Kohl’s Corp | (1.00)% | Quarterly | 6/20/29 | 144,000 | 23,619 | 19,848 | 3,771 | ||||||||||||||||||||||||||
Kohl’s Corp | (1.00)% | Quarterly | 6/20/29 | 144,000 | 23,619 | 20,605 | 3,014 | ||||||||||||||||||||||||||
Lanxess AG | (1.00)% | Quarterly | 6/20/29 | 1,856,000 | EUR | 59,777 | 80,327 | (20,550) | |||||||||||||||||||||||||
Lincoln National Corp. | (1.00)% | Quarterly | 6/20/25 | 5,000 | (31) | 46 | (77) | ||||||||||||||||||||||||||
Lincoln National Corp. | (1.00)% | Quarterly | 6/20/25 | 71,000 | (445) | 594 | (1,039) | ||||||||||||||||||||||||||
Lincoln National Corp. | (1.00)% | Quarterly | 6/20/25 | 135,000 | (846) | 1,168 | (2,014) | ||||||||||||||||||||||||||
Lincoln National Corp. | (1.00)% | Quarterly | 6/20/25 | 141,000 | (883) | 1,234 | (2,117) | ||||||||||||||||||||||||||
Lincoln National Corp. | (1.00)% | Quarterly | 6/20/25 | 360,000 | (2,256) | 3,219 | (5,475) | ||||||||||||||||||||||||||
Lincoln National Corp. | (1.00)% | Quarterly | 6/20/26 | 362,000 | (2,834) | (349) | (2,485) | ||||||||||||||||||||||||||
Lincoln National Corp. | (1.00)% | Quarterly | 6/20/27 | 362,000 | (2,340) | 1,506 | (3,846) | ||||||||||||||||||||||||||
Lincoln National Corp. | (1.00)% | Quarterly | 6/20/25 | 147,000 | (921) | 1,092 | (2,013) | ||||||||||||||||||||||||||
Lincoln National Corp. | (1.00)% | Quarterly | 12/20/25 | 43,000 | (304) | 645 | (949) | ||||||||||||||||||||||||||
Lincoln National Corp. | (1.00)% | Quarterly | 12/20/25 | 73,000 | (515) | 1,050 | (1,565) | ||||||||||||||||||||||||||
Lincoln National Corp. | (1.00)% | Quarterly | 12/20/25 | 144,000 | (1,017) | 1,757 | (2,774) | ||||||||||||||||||||||||||
Lincoln National Corp. | (1.00)% | Quarterly | 12/20/25 | 211,000 | (1,489) | 3,182 | (4,671) | ||||||||||||||||||||||||||
MetLife Inc. | (1.00)% | Quarterly | 6/20/29 | 363,000 | (7,487) | (4,969) | (2,518) | ||||||||||||||||||||||||||
MetLife Inc. | (1.00)% | Quarterly | 6/20/29 | 1,453,000 | (29,970) | (19,494) | (10,476) | ||||||||||||||||||||||||||
MetLife Inc. | (1.00)% | Quarterly | 6/20/29 | 1,008,000 | (20,792) | (15,261) | (5,531) | ||||||||||||||||||||||||||
Novafives SAS | (5.00)% | Quarterly | 6/20/29 | 29,000 | EUR | (4,829) | (1,504) | (3,325) | |||||||||||||||||||||||||
Novafives SAS | (5.00)% | Quarterly | 6/20/29 | 43,000 | EUR | (7,161) | (2,426) | (4,735) | |||||||||||||||||||||||||
Saint-Gobain SA | (1.00)% | Quarterly | 6/20/29 | 853,000 | EUR | (25,109) | (22,111) | (2,998) | |||||||||||||||||||||||||
SES S.A. | (1.00)% | Quarterly | 6/20/29 | 1,024,000 | EUR | 9,897 | 5,449 | 4,448 | |||||||||||||||||||||||||
Stellantis NV | (5.00)% | Quarterly | 6/20/29 | 803,000 | EUR | (160,010) | (157,408) | (2,602) | |||||||||||||||||||||||||
Stena AB | (5.00)% | Quarterly | 6/20/29 | 290,000 | EUR | (43,218) | (35,906) | (7,312) | |||||||||||||||||||||||||
TDC A/S. | (1.00)% | Quarterly | 6/20/27 | 212,000 | EUR | (4,920) | 7,458 | (12,378) | |||||||||||||||||||||||||
Telecom Italia SpA | (1.00)% | Quarterly | 6/20/29 | 392,000 | EUR | 24,101 | 22,810 | 1,291 | |||||||||||||||||||||||||
Unibail-Rodamco-Westfield SE | (1.00)% | Quarterly | 6/20/29 | 724,000 | EUR | 359 | 13,053 | (12,694) | |||||||||||||||||||||||||
UPC Holding | (5.00)% | Quarterly | 6/20/29 | 263,000 | EUR | (32,986) | (40,295) | 7,309 | |||||||||||||||||||||||||
UPC Holding | (5.00)% | Quarterly | 6/20/29 | 15,000 | EUR | (1,881) | (1,745) | (136) | |||||||||||||||||||||||||
Virgin Media | (5.00)% | Quarterly | 6/20/29 | 29,000 | EUR | (1,286) | (1,391) | 105 | |||||||||||||||||||||||||
Virgin Media | (5.00)% | Quarterly | 6/20/29 | 288,000 | EUR | (12,769) | (9,007) | (3,762) | |||||||||||||||||||||||||
Virgin Media | (5.00)% | Quarterly | 6/20/29 | 72,000 | EUR | (3,192) | (2,159) | (1,033) | |||||||||||||||||||||||||
Virgin Media | (5.00)% | Quarterly | 6/20/29 | 43,000 | EUR | (1,906) | (1,856) | (50) | |||||||||||||||||||||||||
Vodafone Group PLC | (1.00)% | Quarterly | 6/20/29 | 1,003,000 | EUR | (20,825) | (17,981) | (2,844) | |||||||||||||||||||||||||
Volkswagen AG | (1.00)% | Quarterly | 6/20/29 | 1,174,000 | EUR | (10,449) | (4,761) | (5,688) | |||||||||||||||||||||||||
Whirlpool Corp. | (1.00)% | Quarterly | 6/20/29 | 217,000 | 4,296 | 2,724 | 1,572 | ||||||||||||||||||||||||||
Whirlpool Corp. | (1.00)% | Quarterly | 6/20/29 | 42,000 | 832 | 528 | 304 | ||||||||||||||||||||||||||
Whirlpool Corp. | (1.00)% | Quarterly | 6/20/29 | 72,000 | 1,425 | 1,204 | 221 | ||||||||||||||||||||||||||
Whirlpool Corp. | (1.00)% | Quarterly | 6/20/29 | 145,000 | 2,871 | 1,698 | 1,173 | ||||||||||||||||||||||||||
Whirlpool Corp. | (1.00)% | Quarterly | 6/20/29 | 217,000 | 4,296 | 3,006 | 1,290 | ||||||||||||||||||||||||||
42 | Annual Report | franklintempleton.com | ||||
Description | Annual Payment Rate Received (Paid) | Payment Frequency | Maturity Date | Notional Amounta | Value | Upfront Payments (Receipts) | Unrealized Appreciation (Depreciation) | Ratingb | |||||||||||||||||||||||||
Centrally Cleared Swap Contracts (continued) | |||||||||||||||||||||||||||||||||
Contracts to Buy Protectionc (continued) | |||||||||||||||||||||||||||||||||
Single Name (continued) | |||||||||||||||||||||||||||||||||
Whirlpool Corp. | (1.00)% | Quarterly | 6/20/29 | 72,000 | $1,425 | $1,082 | $343 | ||||||||||||||||||||||||||
Whirlpool Corp. | (1.00)% | Quarterly | 6/20/29 | 363,000 | 7,187 | 4,408 | 2,779 | ||||||||||||||||||||||||||
Ziggo | (5.00)% | Quarterly | 6/20/29 | 422,000 | EUR | (24,109) | (17,297) | (6,812) | |||||||||||||||||||||||||
Contracts to Sell Protectionc,d | |||||||||||||||||||||||||||||||||
Single Name | |||||||||||||||||||||||||||||||||
Virgin Media | 5.00% | Quarterly | 6/20/27 | 115,000 | EUR | 9,002 | 8,451 | 551 | B+ | ||||||||||||||||||||||||
Traded Index | |||||||||||||||||||||||||||||||||
| CDX.EM.41e | 1.00% | Quarterly | 6/20/29 | 1,000,000 | (27,123) | (30,550) | 3,427 | Investment Grade | ||||||||||||||||||||||||
| CDX.NA.HY.42e | 5.00% | Quarterly | 6/20/29 | 3,000,000 | 203,265 | 216,550 | (13,285) | Non-Investment Grade | ||||||||||||||||||||||||
| CDX.NA.IG.42e | 1.00% | Quarterly | 6/20/29 | 26,000,000 | 583,071 | 597,507 | (14,436) | Investment Grade | ||||||||||||||||||||||||
| ITRX.EURe | 1.00% | Quarterly | 6/20/29 | 30,000,000 | EUR | 716,262 | 734,715 | (18,453) | Investment Grade | |||||||||||||||||||||||
| ITRX.EUR.XOVERe | 5.00% | Quarterly | 6/20/29 | 12,000,000 | EUR | 1,117,097 | 1,223,110 | (106,013) | Sub-Investment Grade | |||||||||||||||||||||||
Total Centrally Cleared Swap Contracts | $1,922,888 | $2,496,134 | $(573,246) | ||||||||||||||||||||||||||||||
Counterparty | | ||||||||||||||||||||||||||||||||
OTC Swap Contracts | |||||||||||||||||||||||||||||||||
Contracts to Buy Protectionc | |||||||||||||||||||||||||||||||||
Single Name | |||||||||||||||||||||||||||||||||
American Airlines Inc. | (5.00)% | Quarterly | GSCO | 12/20/24 | 14,000 | $(427) | $551 | $(978) | |||||||||||||||||||||||||
American Airlines Inc. | (5.00)% | Quarterly | GSCO | 12/20/24 | 339,000 | (10,348) | 7,373 | (17,721) | |||||||||||||||||||||||||
Bank of China | (1.00)% | Quarterly | GSCO | 6/20/26 | 288,000 | (4,190) | (2,921) | (1,269) | |||||||||||||||||||||||||
Bank of China | (1.00)% | Quarterly | GSCO | 6/20/29 | 940,000 | (15,358) | (6,221) | (9,137) | |||||||||||||||||||||||||
Bank of China | (1.00)% | Quarterly | JPHQ | 6/20/26 | 144,000 | (2,095) | (769) | (1,326) | |||||||||||||||||||||||||
Bank of China | (1.00)% | Quarterly | JPHQ | 6/20/26 | 144,000 | (2,095) | (742) | (1,353) | |||||||||||||||||||||||||
Bank of China | (1.00)% | Quarterly | JPHQ | 6/20/29 | 362,000 | (5,914) | (2,557) | (3,357) | |||||||||||||||||||||||||
Bank of China | (1.00)% | Quarterly | MSCS | 6/20/26 | 72,000 | (1,047) | (480) | (567) | |||||||||||||||||||||||||
Bank of China | (1.00)% | Quarterly | MSCS | 6/20/26 | 72,000 | (1,047) | (439) | (608) | |||||||||||||||||||||||||
Bayerische | (1.00)% | Quarterly | MSCO | 12/20/25 | 146,000 | EUR | (2,271) | (951) | (1,320) | ||||||||||||||||||||||||
China Construction | (1.00)% | Quarterly | GSCO | 6/20/29 | 651,000 | (11,160) | (4,308) | (6,852) | |||||||||||||||||||||||||
China Construction | (1.00)% | Quarterly | JPHQ | 6/20/26 | 288,000 | (4,466) | (2,921) | (1,545) | |||||||||||||||||||||||||
China Construction | (1.00)% | Quarterly | JPHQ | 6/20/26 | 216,000 | (3,349) | (1,113) | (2,236) | |||||||||||||||||||||||||
China Construction | (1.00)% | Quarterly | JPHQ | 6/20/26 | 216,000 | (3,349) | (1,112) | (2,237) | |||||||||||||||||||||||||
China Construction | (1.00)% | Quarterly | JPHQ | 6/20/29 | 796,000 | (13,646) | (5,621) | (8,025) | |||||||||||||||||||||||||
Government of Argentina | (5.00)% | Quarterly | CITI | 12/20/26 | 195,000 | 61,119 | 88,264 | (27,145) | |||||||||||||||||||||||||
Government of Argentina | (5.00)% | Quarterly | GSCO | 12/20/26 | 778,000 | 243,848 | 216,471 | 27,377 | |||||||||||||||||||||||||
Government of Egypt | (1.00)% | Quarterly | BZWS | 12/20/24 | 152,000 | 1,375 | 4,980 | (3,605) | |||||||||||||||||||||||||
Government of Egypt | (1.00)% | Quarterly | CITI | 12/20/24 | 375,000 | 3,391 | 25,619 | (22,228) | |||||||||||||||||||||||||
Government of Egypt | (1.00)% | Quarterly | CITI | 6/20/26 | 197,000 | 9,087 | 45,183 | (36,096) | |||||||||||||||||||||||||
Government of Korea | (1.00)% | Quarterly | BZWS | 6/20/29 | 1,056,000 | (25,760) | (22,295) | (3,465) | |||||||||||||||||||||||||
Government of Korea | (1.00)% | Quarterly | GSCO | 6/20/29 | 2,843,000 | (88,410) | (82,944) | (5,466) | |||||||||||||||||||||||||
Government of Mexico | (1.00)% | Quarterly | CITI | 6/20/29 | 1,332,000 | (5,901) | (585) | (5,316) | |||||||||||||||||||||||||
Government of South Africa | (1.00)% | Quarterly | GSCO | 6/20/29 | 400,000 | 22,941 | 20,432 | 2,509 | |||||||||||||||||||||||||
Government of Turkey | (1.00)% | Quarterly | GSCO | 6/20/27 | 794,000 | 15,487 | 27,953 | (12,466) | |||||||||||||||||||||||||
Industrial and Commercial Bank of China | (1.00)% | Quarterly | GSCO | 6/20/29 | 1,306,000 | (22,672) | (8,643) | (14,029) | |||||||||||||||||||||||||
Industrial and Commercial Bank of China | (1.00)% | Quarterly | JPHQ | 6/20/26 | 144,000 | (2,124) | (714) | (1,410) | |||||||||||||||||||||||||
Industrial and Commercial Bank of China | (1.00)% | Quarterly | JPHQ | 6/20/29 | 145,000 | (2,517) | (1,024) | (1,493) | |||||||||||||||||||||||||
franklintempleton.com | Annual Report | 43 | ||||
Description | Annual Payment Rate Received (Paid) | Payment Frequency | Counterparty | Maturity Date | Notional Amounta | Value | Upfront Payments (Receipts) | Unrealized Appreciation (Depreciation) | Ratingb | ||||||||||||||||||||||||
OTC Swap Contracts (continued) | |||||||||||||||||||||||||||||||||
Contracts to Buy Protectionc (continued) | |||||||||||||||||||||||||||||||||
Single Name (continued) | |||||||||||||||||||||||||||||||||
Industrial and Commercial Bank of China | (1.00)% | Quarterly | MSCS | 6/20/26 | 144,000 | $(2,124) | $(822) | $(1,302) | |||||||||||||||||||||||||
JFE Holdings Inc. | (1.00)% | Quarterly | GSCO | 6/20/29 | 187,961,000 | JPY | (36,374) | (37,138) | 764 | ||||||||||||||||||||||||
JFE Holdings Inc. | (1.00)% | Quarterly | MSCO | 6/20/29 | 42,882,000 | JPY | (8,299) | (8,626) | 327 | ||||||||||||||||||||||||
Kawasaki Heavy Industries Ltd. | (1.00)% | Quarterly | MSCO | 6/20/29 | 198,470,000 | JPY | (40,557) | (39,251) | (1,306) | ||||||||||||||||||||||||
Kobe Steel Ltd. | (1.00)% | Quarterly | MSCO | 6/20/29 | 181,198,000 | JPY | (25,993) | (26,714) | 721 | ||||||||||||||||||||||||
Lincoln National Corp | (1.00)% | Quarterly | BZWS | 6/20/25 | 72,000 | (597) | 608 | (1,205) | |||||||||||||||||||||||||
Lincoln National Corp | (1.00)% | Quarterly | BZWS | 6/20/25 | 72,000 | (597) | 608 | (1,205) | |||||||||||||||||||||||||
Mitsui O.S.K. Lines Ltd. | (1.00)% | Quarterly | GSCO | 6/20/29 | 137,356,000 | JPY | (20,009) | (19,774) | (235) | ||||||||||||||||||||||||
Mitsui O.S.K. Lines Ltd. | (1.00)% | Quarterly | MSCO | 6/20/29 | 57,834,000 | JPY | (8,425) | (7,948) | (477) | ||||||||||||||||||||||||
Nippon Paper Industries Co. | (1.00)% | Quarterly | JPHQ | 12/20/25 | 7,366,000 | JPY | (279) | (38) | (241) | ||||||||||||||||||||||||
Nippon Paper Industries Co. | (1.00)% | Quarterly | MSCO | 12/20/25 | 21,750,000 | JPY | (823) | 340 | (1,163) | ||||||||||||||||||||||||
Nippon Paper Industries Co. | (1.00)% | Quarterly | MSCO | 12/20/25 | 33,598,000 | JPY | (1,271) | 525 | (1,796) | ||||||||||||||||||||||||
Nippon Paper Industries Co. | (1.00)% | Quarterly | MSCO | 6/20/29 | 29,759,000 | JPY | 6,543 | 6,552 | (9) | ||||||||||||||||||||||||
Nippon Paper Industries Co. | (1.00)% | Quarterly | MSCO | 6/20/29 | 113,236,000 | JPY | 24,895 | 14,341 | 10,554 | ||||||||||||||||||||||||
Rakuten Group Inc. | (1.00)% | Quarterly | BOFA | 6/20/27 | 11,711,000 | JPY | 4,326 | 3,375 | 951 | ||||||||||||||||||||||||
Rakuten Group Inc. | (1.00)% | Quarterly | BZWS | 6/20/24 | 43,477,000 | JPY | (623) | 1,123 | (1,746) | ||||||||||||||||||||||||
Rakuten Group Inc. | (1.00)% | Quarterly | BZWS | 6/20/25 | 6,895,000 | JPY | (96) | 1,339 | (1,435) | ||||||||||||||||||||||||
Rakuten Group Inc. | (1.00)% | Quarterly | BZWS | 6/20/25 | 20,947,000 | JPY | (293) | 4,465 | (4,758) | ||||||||||||||||||||||||
Rakuten Group Inc. | (1.00)% | Quarterly | CITI | 6/20/25 | 14,667,000 | JPY | (205) | 1,374 | (1,579) | ||||||||||||||||||||||||
Rakuten Group Inc. | (1.00)% | Quarterly | CITI | 6/20/27 | 11,711,000 | JPY | 4,325 | 3,483 | 842 | ||||||||||||||||||||||||
Rakuten Group Inc. | (1.00)% | Quarterly | JPHQ | 6/20/25 | 16,041,000 | JPY | (224) | 1,274 | (1,498) | ||||||||||||||||||||||||
Rakuten Group Inc. | (1.00)% | Quarterly | JPHQ | 6/20/25 | 14,053,000 | JPY | (196) | 2,834 | (3,030) | ||||||||||||||||||||||||
Rakuten Group Inc. | (1.00)% | Quarterly | MSCO | 6/20/25 | 3,000,000 | JPY | (42) | 276 | (318) | ||||||||||||||||||||||||
Rakuten Group Inc. | (1.00)% | Quarterly | MSCO | 6/20/25 | 6,444,000 | JPY | (90) | 435 | (525) | ||||||||||||||||||||||||
Rakuten Group Inc. | (1.00)% | Quarterly | MSCO | 6/20/25 | 7,271,000 | JPY | (102) | 890 | (992) | ||||||||||||||||||||||||
Rakuten Group Inc. | (1.00)% | Quarterly | MSCO | 6/20/25 | 7,549,000 | JPY | (105) | 908 | (1,013) | ||||||||||||||||||||||||
Rakuten Group Inc. | (1.00)% | Quarterly | MSCO | 6/20/25 | 12,200,000 | JPY | (170) | 1,081 | (1,251) | ||||||||||||||||||||||||
Rakuten Group Inc. | (1.00)% | Quarterly | MSCO | 6/20/25 | 14,482,000 | JPY | (202) | 1,141 | (1,343) | ||||||||||||||||||||||||
Rakuten Group Inc. | (1.00)% | Quarterly | MSCO | 6/20/25 | 14,542,000 | JPY | (203) | 1,811 | (2,014) | ||||||||||||||||||||||||
Softbank Group Corp. | (1.00)% | Quarterly | BZWS | 6/20/28 | 29,008,000 | JPY | 3,674 | 15,941 | (12,267) | ||||||||||||||||||||||||
Softbank Group Corp. | (1.00)% | Quarterly | GSCO | 6/20/28 | 62,367,000 | JPY | 7,899 | 32,991 | (25,092) | ||||||||||||||||||||||||
Univision Communications Inc. | (5.00)% | Quarterly | GSCO | 6/20/29 | 72,000 | (7,969) | (6,902) | (1,067) | |||||||||||||||||||||||||
Univision Communications Inc. | (5.00)% | Quarterly | GSCO | 6/20/29 | 58,000 | (6,419) | (5,716) | (703) | |||||||||||||||||||||||||
Univision Communications Inc. | (5.00)% | Quarterly | GSCO | 6/20/29 | 29,000 | (3,210) | (3,063) | (147) | |||||||||||||||||||||||||
Univision Communications Inc. | (5.00)% | Quarterly | GSCO | 6/20/29 | 29,000 | (3,210) | (3,000) | (210) | |||||||||||||||||||||||||
Univision Communications Inc. | (5.00)% | Quarterly | GSCO | 6/20/29 | 29,000 | (3,210) | (2,986) | (224) | |||||||||||||||||||||||||
Univision Communications Inc. | (5.00)% | Quarterly | GSCO | 6/20/29 | 29,000 | (3,210) | (2,867) | (343) | |||||||||||||||||||||||||
Univision Communications Inc. | (5.00)% | Quarterly | GSCO | 6/20/29 | 29,000 | (3,210) | (2,866) | (344) | |||||||||||||||||||||||||
Univision Communications Inc. | (5.00)% | Quarterly | GSCO | 6/20/29 | 22,000 | (2,435) | (2,268) | (167) | |||||||||||||||||||||||||
Contracts to Sell Protectionc,d | |||||||||||||||||||||||||||||||||
Single Name | |||||||||||||||||||||||||||||||||
Government of Egypt | 1.00% | Quarterly | GSCO | 6/20/29 | 2,059,000 | $(369,891) | $(342,101) | $(27,790) | B− | ||||||||||||||||||||||||
Total OTC Swap Contracts | $(369,899) | $(123,899) | $(246,000) | ||||||||||||||||||||||||||||||
Total Credit Default Swap Contracts | $1,552,989 | $2,372,235 | $(819,246) | ||||||||||||||||||||||||||||||
44 | Annual Report | franklintempleton.com | ||||
Description | Payment Frequency | Maturity Date | Notional Amount* | Value/Unrealized Appreciation (Depreciation) | |||||||||||||
Centrally Cleared Swap Contracts | |||||||||||||||||
Receive Fixed 10.42% Pay Floating BRLCDI | Annually | 1/04/27 | 6,000,000 | BRL | $(26,809) | ||||||||||||
Receive Fixed 10.81% Pay Floating BRLCDI | Annually | 1/04/27 | 8,000,000 | BRL | (7,856) | ||||||||||||
Receive Fixed 10.90% Pay Floating BRLCDI | Annually | 1/04/27 | 8,711,957 | BRL | (5,645) | ||||||||||||
Receive Fixed 13.29% Pay Floating BRLCDI | Annually | 1/04/27 | 2,980,054 | BRL | 26,158 | ||||||||||||
Receive Fixed 13.41% Pay Floating BRLCDI | Annually | 1/04/27 | 5,875,629 | BRL | 55,113 | ||||||||||||
Receive Fixed 13.47% Pay Floating BRLCDI | Annually | 1/04/27 | 4,395,970 | BRL | 42,646 | ||||||||||||
Receive Fixed 8.78% Pay Floating Banxico Mexico 1 Month Rate | Monthly | 10/19/27 | 72,800,000 | MXN | 120,796 | ||||||||||||
Receive Fixed 4.15% Pay Floating rate Overnight SOFR | Annually | 11/22/28 | 5,700,000 | (43,381) | |||||||||||||
Receive Fixed 3.753% Pay Floating rate Overnight SOFR | Annually | 1/19/29 | 582,800 | (13,860) | |||||||||||||
Receive Fixed 4.0082% Pay Floating rate Overnight SOFR | Annually | 2/15/29 | 1,740,000 | (22,765) | |||||||||||||
Receive Fixed 4.0698% Pay Floating rate Overnight SOFR | Annually | 2/21/29 | 1,740,000 | (18,191) | |||||||||||||
Receive Fixed 3.93% Pay Floating rate Overnight SOFR | Annually | 3/15/29 | 5,469,600 | (88,874) | |||||||||||||
Receive Fixed 4.09% Pay Floating rate Overnight SOFR | Annually | 4/03/29 | 3,480,000 | (31,829) | |||||||||||||
Receive Fixed 4.29% Pay Floating rate Overnight SOFR | Annually | 4/12/29 | 2,175,000 | (1,205) | |||||||||||||
Receive Fixed 4.40% Pay Floating rate Overnight SOFR | Annually | 4/17/29 | 2,103 | 8 | |||||||||||||
Receive Fixed 4.40% Pay Floating rate Overnight SOFR | Annually | 4/17/29 | 2,100,398 | 8,851 | |||||||||||||
Receive Fixed 4.28% Pay Floating rate Overnight SOFR | Annually | 5/14/29 | 2,750,000 | (2,246) | |||||||||||||
Receive Fixed 4.27% Pay Floating rate Overnight SOFR | Annually | 5/15/29 | 3,300,000 | (4,062) | |||||||||||||
Receive Fixed 8.47% Pay Floating Banxico Mexico 1 Month Rate | Monthly | 10/12/32 | 19,000,000 | MXN | (56,186) | ||||||||||||
Receive Fixed 8.72% Pay Floating Banxico Mexico 1 Month Rate | Monthly | 10/12/32 | 21,700,000 | MXN | (44,994) | ||||||||||||
Receive Fixed 7.97% Pay Floating Banxico Mexico 1 Month Rate | Monthly | 10/06/33 | 26,200,000 | MXN | (131,159) | ||||||||||||
Receive Fixed 10.14% Pay Floating rate 3-Month-JIBAR | Quarterly | 6/19/34 | 17,000,000 | ZAR | 13,791 | ||||||||||||
franklintempleton.com | Annual Report | 45 | ||||
Description | Payment Frequency | Maturity Date | Notional Amount* | Value/Unrealized Appreciation (Depreciation) | |||||||||||||
Centrally Cleared Swap Contracts (continued) | |||||||||||||||||
Receive Fixed 6.96% Pay Floating rate 6-Month-BUBOR | Annually | 6/19/34 | 315,038,277 | HUF | $19,262 | ||||||||||||
Receive Fixed 6.96% Pay Floating rate 6-Month-BUBOR | Annually | 6/19/34 | 92,605,164 | HUF | 5,754 | ||||||||||||
Total Interest Rate Swap Contracts | $(206,683) | ||||||||||||||||
Underlying Instrument | Financing Rate | Payment Frequency | Counterparty | Maturity Date | Notional Value* | Value/Unrealized Appreciation (Depreciation) | |||||||||||||||||
OTC Swap Contracts | |||||||||||||||||||||||
Currency Contracts - Longa | |||||||||||||||||||||||
FX G10 Carry | Fixed 0.00% | Monthly | CITI | 6/28/24 | 3,685,801 | $18,962 | |||||||||||||||||
FX G10 Carry | Fixed 0.00% | Monthly | CITI | 6/28/24 | 2,728,654 | 14,037 | |||||||||||||||||
FX G10 Carry | Fixed 0.00% | Monthly | CITI | 6/28/24 | 470,246 | 2,420 | |||||||||||||||||
FX G10 Carry | Fixed 0.00% | Monthly | CITI | 6/28/24 | 7,415,818 | 85,533 | |||||||||||||||||
FX G10 Value | Fixed 0.03% | Monthly | CITI | 6/28/24 | 13,634,351 | 50,691 | |||||||||||||||||
FX G10 Value | Fixed 0.03% | Monthly | CITI | 6/28/24 | 10,093,571 | 37,527 | |||||||||||||||||
FX G10 Value | Fixed 0.03% | Monthly | CITI | 6/28/24 | 1,726,189 | 6,552 | |||||||||||||||||
FX G10 Value | Fixed 0.03% | Monthly | CITI | 6/28/24 | 27,681,198 | 15,484 | |||||||||||||||||
231,206 | |||||||||||||||||||||||
Equity Contracts - Longa | |||||||||||||||||||||||
3i Group PLC | 1-Day SONIA + 0.35% | Monthly | MSCS | 7/17/24 | 279,040 | GBP | 133,898 | ||||||||||||||||
4imprint Group PLC | 1-Day SONIA + 0.35% | Monthly | MSCS | 6/03/25 | 259,114 | GBP | 129,204 | ||||||||||||||||
A1 Telekom Austria AG | Euro STR + 0.35% | Monthly | JPHQ | 7/17/24 | 13,566 | EUR | 1,575 | ||||||||||||||||
A2A SpA | Euro STR + 0.35% | Monthly | JPHQ | 8/12/24 | 232,776 | EUR | 21,186 | ||||||||||||||||
AbitareIn | Euro STR + 0.35% | Monthly | JPHQ | 1/08/25 | 56,713 | EUR | (1,391) | ||||||||||||||||
AcadeMedia AB | 1-Week STIBOR + 0.28% | Monthly | SEBA | 7/17/24 | 1,647,385 | SEK | 16,437 | ||||||||||||||||
AddLife AB | 1-Week STIBOR + 0.28% | Monthly | SEBA | 8/02/24 | 5,157,301 | SEK | 119,005 | ||||||||||||||||
ADvTECH Ltd. | 1-Day SABOR + 0.30% | Monthly | MSCS | 7/17/24 | 1,765,587 | ZAR | 36,429 | ||||||||||||||||
Adyen | Euro STR + 0.35% | Monthly | JPHQ | 7/17/24 | 167,543 | EUR | (7,251) | ||||||||||||||||
Aeci Limited | 1-Day SABOR + 0.70% | Monthly | MSCS | 7/17/24 | 7,530,053 | ZAR | (34,773) | ||||||||||||||||
AFRY AB | 1-Week STIBOR + 0.28% | Monthly | SEBA | 3/13/25 | 2,187,161 | SEK | 20,639 | ||||||||||||||||
Ageas | Euro STR + 0.35% | Monthly | JPHQ | 5/01/25 | 173,164 | EUR | 29,076 | ||||||||||||||||
Airtel Africa PLC | 1-Day SONIA + 0.35% | Monthly | MSCS | 7/17/24 | 107,495 | GBP | 4,350 | ||||||||||||||||
Aker Solutions ASA | 1-Week NIBOR + 0.28% | Monthly | SEBA | 7/17/24 | 5,223,936 | NOK | 54,182 | ||||||||||||||||
AkzoNobel | Euro STR + 0.35% | Monthly | JPHQ | 4/25/25 | 227,469 | EUR | 7,555 | ||||||||||||||||
Alfa Financial Software | 1-Day SONIA + 0.35% | Monthly | MSCS | 11/18/24 | 61,683 | GBP | 16,995 | ||||||||||||||||
Alior Bank SA | 1-Day FEDEF + 1.25% | Monthly | MSCO | 1/06/25 | 234,851 | (8,351) | |||||||||||||||||
Alleima AB | 1-Week STIBOR + 0.275% | Monthly | SEBA | 12/06/24 | 2,485,177 | SEK | (12,617) | ||||||||||||||||
Alligo AB | 1-Week STIBOR + 0.275% | Monthly | SEBA | 5/15/25 | 996,721 | SEK | 1,626 | ||||||||||||||||
ALSO Holding AG | 1-Day SARON + 0.35% | Monthly | JPHQ | 7/15/24 | 507,333 | CHF | 112,407 | ||||||||||||||||
Alzchem Group AG | Euro STR + 0.35% | Monthly | JPHQ | 11/22/24 | 22,358 | EUR | 18,004 | ||||||||||||||||
Amadeus Fire AG | Euro STR + 0.35% | Monthly | JPHQ | 1/31/25 | 200,810 | EUR | (19,007) | ||||||||||||||||
Ambea AB | 1-Week STIBOR + 0.28% | Monthly | SEBA | 7/17/24 | 2,384,079 | SEK | 206,205 | ||||||||||||||||
46 | Annual Report | franklintempleton.com | ||||
Underlying Instrument | Financing Rate | Payment Frequency | Counterparty | Maturity Date | Notional Value* | Value/Unrealized Appreciation (Depreciation) | |||||||||||||||||
OTC Swap Contracts (continued) | |||||||||||||||||||||||
Equity Contracts - Longa (continued) | |||||||||||||||||||||||
Amedeo Air Four Plus Ltd. | 1-Day SONIA + 0.35% | Monthly | MSCO | 4/09/25 | 40,693 | GBP | $5,734 | ||||||||||||||||
Anadolu Efes | 1-Day FEDEF + 1.25% | Monthly | MSCS | 1/22/25 | 46,969 | 19,891 | |||||||||||||||||
Andritz AG | Euro STR + 0.35% | Monthly | JPHQ | 7/15/24 | 273,194 | EUR | 419 | ||||||||||||||||
Anora Group PLC | Euro STR + 0.275% | Monthly | SEBA | 12/23/24 | 73,713 | EUR | 3,582 | ||||||||||||||||
AO World PLC | 1-Day SONIA + 0.35% | Monthly | MSCS | 12/02/24 | 202,586 | GBP | 120,338 | ||||||||||||||||
Arcadis | Euro STR + 0.35% | Monthly | JPHQ | 9/22/24 | 174,353 | EUR | 1,344 | ||||||||||||||||
Arcelormittal SA | Euro STR + 0.25% | Monthly | JPHQ | 2/28/25 | 269,560 | EUR | (24,487) | ||||||||||||||||
Arctic | 1-Day FEDEF + 0.30% | Monthly | MSCS | 11/27/24 | 85,581 | 18,111 | |||||||||||||||||
Arjo AB | 1-Week STIBOR + 0.28% | Monthly | SEBA | 7/17/24 | 5,773,646 | SEK | 29,227 | ||||||||||||||||
ARYZTA | 1-Day SARON + 0.35% | Monthly | JPHQ | 4/26/25 | 587,450 | CHF | 101,828 | ||||||||||||||||
ASBIS Kypros Ltd. | 1-Day FEDEF + 0.30% | Monthly | MSCS | 7/12/24 | 20,740 | 241 | |||||||||||||||||
Ascencio | Euro STR + 0.35% | Monthly | JPHQ | 7/17/24 | 95,311 | EUR | (1,182) | ||||||||||||||||
Ascom Holding AG | Euro STR + 0.35% | Monthly | JPHQ | 7/17/24 | 191,200 | CHF | (19,123) | ||||||||||||||||
ASML Holding NV | Euro STR + 0.35% | Monthly | JPHQ | 7/17/24 | 127,296 | EUR | 10,917 | ||||||||||||||||
Asseco Poland SA | 1-Day FEDEF + 0.30% | Monthly | MSCS | 7/17/24 | 237,632 | 32,569 | |||||||||||||||||
Associated British Foods PLC | 1-Day SONIA + 0.35% | Monthly | MSCS | 8/23/24 | 215,146 | GBP | 26,561 | ||||||||||||||||
Atea ASA | 1-Week NIBOR + 0.275% | Monthly | SEBA | 3/18/25 | 1,367,891 | NOK | 9,504 | ||||||||||||||||
Atoss Software AG | Euro STR + 0.35% | Monthly | JPHQ | 8/01/24 | 232,754 | EUR | 31,031 | ||||||||||||||||
Atresmedia Corporacion de Medios de Comunicacion SA | 1-Day EONIA + 0.35% | Monthly | MSCS | 7/17/24 | 262,615 | EUR | 124,112 | ||||||||||||||||
Attendo AB | 1-Week STIBOR + 0.28% | Monthly | SEBA | 1/08/25 | 2,765,774 | SEK | 79,695 | ||||||||||||||||
Audax Renovables SA | 1-Day EONIA + 0.35% | Monthly | MSCS | 4/24/25 | 107,872 | EUR | 65,212 | ||||||||||||||||
Aumann AG | Euro STR + 0.35% | Monthly | JPHQ | 1/22/25 | 80,532 | EUR | 8,836 | ||||||||||||||||
Austevoll Seafood ASA | 1-Week NIBOR + 0.28% | Monthly | SEBA | 7/12/24 | 1,267,928 | NOK | (4,560) | ||||||||||||||||
Autoneum | 1-Day SARON + 0.35% | Monthly | JPHQ | 11/27/24 | 252,438 | CHF | (22,737) | ||||||||||||||||
AVI Ltd. | 1-Day SABOR + 0.70% | Monthly | MSCS | 10/03/24 | 8,922,378 | ZAR | (29,186) | ||||||||||||||||
B&M European Value Retail SA | 1-Day SONIA + 0.35% | Monthly | MSCO | 1/16/25 | 134,339 | GBP | 7,376 | ||||||||||||||||
B&S Group SA | Euro STR + 0.35% | Monthly | JPHQ | 1/16/25 | 73,013 | EUR | 23,557 | ||||||||||||||||
B2 Impact ASA | 1-Week NIBOR + 0.28% | Monthly | SEBA | 7/17/24 | 1,371,786 | NOK | 23,471 | ||||||||||||||||
Bakkavor Group PLC | 1-Day SONIA + 0.35% | Monthly | MSCO | 5/15/25 | 22,138 | GBP | 1,767 | ||||||||||||||||
Balfour Beatty | 1-Day SONIA + 0.35% | Monthly | MSCS | 9/18/24 | 378,898 | GBP | 48,943 | ||||||||||||||||
Banca Ifis SpA | Euro STR + 0.35% | Monthly | JPHQ | 7/17/24 | 468,058 | EUR | 152,703 | ||||||||||||||||
Bank of Georgia Group PLC | 1-Day SONIA + 0.35% | Monthly | MSCS | 7/31/24 | 289,600 | GBP | 13,665 | ||||||||||||||||
Barclays PLC | 1-Day SONIA + 0.44% | Monthly | MSCS | 7/17/24 | 176,450 | GBP | 93,880 | ||||||||||||||||
Barr AG | 1-Day SONIA + 0.35% | Monthly | MSCO | 5/22/25 | 64,335 | GBP | 2,068 | ||||||||||||||||
Basilea Pharmaceutica AG | Euro STR + 6.75% | Monthly | JPHQ | 5/08/25 | 372,424 | CHF | 8,477 | ||||||||||||||||
Bausch Health Co. | 3-Month SOFR + 0.51% | Quarterly | GSCO | 5/23/25 | 67,547 | 2,794 | |||||||||||||||||
Bavarian Nordic A/S | 1-Week CIBOR + 0.28% | Monthly | SEBA | 11/27/24 | 2,040,228 | DKK | 52,629 | ||||||||||||||||
BAWAG Group AG | Euro STR + 0.35% | Monthly | JPHQ | 4/03/25 | 213,502 | EUR | 4,485 | ||||||||||||||||
BB Biotech AG | 1-Day SARON + 0.35% | Monthly | JPHQ | 4/11/25 | 250,978 | CHF | (15,549) | ||||||||||||||||
BE Group AB | 1-Week STIBOR + 0.28% | Monthly | SEBA | 7/17/24 | 1,166,148 | SEK | (51,392) | ||||||||||||||||
Bechtle AG | Euro STR + 0.35% | Monthly | JPHQ | 11/06/24 | 265,936 | EUR | (2,592) | ||||||||||||||||
Bekaert SA | Euro STR + 0.35% | Monthly | JPHQ | 7/17/24 | 288,562 | EUR | (3,729) | ||||||||||||||||
Bell Food Group AG | 1-Day SARON + 0.35% | Monthly | JPHQ | 7/17/24 | 60,958 | CHF | 4,591 | ||||||||||||||||
Benefit | 1-Day FEDEF + 1.25% | Monthly | MSCS | 9/26/24 | 14,731 | 68 | |||||||||||||||||
Betsson AB | 1-Week STIBOR + 0.275% | Monthly | SEBA | 7/17/24 | 7,154,493 | SEK | 81,254 | ||||||||||||||||
franklintempleton.com | Annual Report | 47 | ||||
Underlying Instrument | Financing Rate | Payment Frequency | Counterparty | Maturity Date | Notional Value* | Value/Unrealized Appreciation (Depreciation) | |||||||||||||||||
OTC Swap Contracts (continued) | |||||||||||||||||||||||
Equity Contracts - Longa (continued) | |||||||||||||||||||||||
Betsson AB | 1-Week STIBOR + 0.275% | Monthly | SEBA | 7/17/24 | 66,525 | SEK | $23,721 | ||||||||||||||||
BHG Group AB | 1-Week STIBOR + 0.28% | Monthly | SEBA | 11/27/24 | 2,115,809 | SEK | 49,392 | ||||||||||||||||
BIC | 1-Day EONIA + 0.30% | Monthly | MSCS | 4/17/25 | 404,564 | EUR | 56,347 | ||||||||||||||||
Bico Group | 1-Week STIBOR + 0.28% | Monthly | SEBA | 11/27/24 | 1,272,684 | SEK | 1,857 | ||||||||||||||||
Bilfinger SE | Euro STR + 0.35% | Monthly | JPHQ | 12/06/24 | 385,606 | EUR | 70,135 | ||||||||||||||||
BioGaia AB | 1-Week STIBOR + 0.28% | Monthly | SEBA | 7/17/24 | 3,261,723 | SEK | 84,931 | ||||||||||||||||
BKW AG | 1-Day SARON + 0.35% | Monthly | JPHQ | 12/12/24 | 321,789 | CHF | (15,350) | ||||||||||||||||
Bodycote PLC | 1-Day SONIA + 0.35% | Monthly | MSCS | 7/05/24 | 258,148 | GBP | 65,903 | ||||||||||||||||
Bogdanka SA | 1-Day FEDEF + 0.30% | Monthly | MSCS | 8/19/24 | 108,690 | (15,456) | |||||||||||||||||
Bonheur ASA | 1-Week NIBOR + 0.28% | Monthly | SEBA | 8/28/24 | 654,321 | NOK | 4,079 | ||||||||||||||||
Boozt AB | 1-Week STIBOR + 0.275% | Monthly | SEBA | 9/19/24 | 2,283,832 | SEK | 41,908 | ||||||||||||||||
Borregaard | 1-Week NIBOR + 0.28% | Monthly | SEBA | 7/05/24 | 836,217 | NOK | 301 | ||||||||||||||||
Bouygues | 1-Day EONIA + 0.30% | Monthly | MSCO | 3/14/25 | 351,634 | EUR | (16,792) | ||||||||||||||||
BPER Banca SpA | Euro STR + 0.35% | Monthly | JPHQ | 9/25/24 | 167,426 | EUR | 86,281 | ||||||||||||||||
Bpost | Euro STR + 0.35% | Monthly | JPHQ | 11/07/24 | 208,174 | EUR | (17,412) | ||||||||||||||||
Brederode | Euro STR + 0.35% | Monthly | JPHQ | 11/21/24 | 20,116 | EUR | 649 | ||||||||||||||||
Breedon Group PLC | 1-Day SONIA + 0.35% | Monthly | MSCS | 7/17/24 | 292,134 | GBP | 41,958 | ||||||||||||||||
British Land Co. PLC | 1-Day SONIA + 0.35% | Monthly | MSCS | 7/07/25 | 397,782 | GBP | 107,380 | ||||||||||||||||
Bulten AB | 1-Week STIBOR + 0.275% | Monthly | SEBA | 10/18/24 | 43,563 | SEK | 1,330 | ||||||||||||||||
Buzzi Unicem SpA | Euro STR + 0.35% | Monthly | JPHQ | 8/12/24 | 276,117 | EUR | 90,523 | ||||||||||||||||
BW LPG Ltd. | 1-Week NIBOR + 0.275% | Monthly | SEBA | 4/15/25 | 2,041,155 | NOK | 90,649 | ||||||||||||||||
Cairn Homes PLC | 1-Day SONIA + 0.35% | Monthly | MSCS | 7/17/24 | 145,391 | GBP | 88,644 | ||||||||||||||||
CaixaBank SA | 1-Day EONIA + 0.35% | Monthly | MSCS | 8/21/24 | 128,664 | EUR | 43,198 | ||||||||||||||||
Card Factory PLC | 1-Day SONIA + 0.35% | Monthly | MSCS | 7/17/24 | 191,502 | GBP | 10,598 | ||||||||||||||||
Care Property Invest | Euro STR + 0.35% | Monthly | JPHQ | 12/16/24 | 20,064 | EUR | 4 | ||||||||||||||||
Cargotec OYJ | Euro STR + 0.28% | Monthly | SEBA | 8/23/24 | 209,064 | EUR | 173,814 | ||||||||||||||||
Carlsberg Group | 1-Week CIBOR + 0.28% | Monthly | SEBA | 9/12/24 | 1,239,000 | DKK | (10,755) | ||||||||||||||||
Carmila | 1-Day EONIA + 0.30% | Monthly | MSCS | 8/07/24 | 152,172 | EUR | 34,068 | ||||||||||||||||
Carrefour | 1-Day EONIA + 0.30% | Monthly | MSCS | 7/17/24 | 299,581 | EUR | (22,392) | ||||||||||||||||
Catana Group | 1-Day EONIA + 0.30% | Monthly | MSCS | 12/02/24 | 92,983 | EUR | (3,924) | ||||||||||||||||
Cbrain A/S | 1-Week CIBOR + 0.28% | Monthly | SEBA | 7/17/24 | 1,994,295 | DKK | (35,629) | ||||||||||||||||
CCC | 1-Day FEDEF + 1.25% | Monthly | MSCO | 4/03/25 | 87,646 | 73,017 | |||||||||||||||||
Ceconomy AG | Euro STR + 0.35% | Monthly | JPHQ | 7/05/24 | 276,862 | EUR | 103,157 | ||||||||||||||||
Cementir Holding NV | Euro STR + 0.35% | Monthly | JPHQ | 7/17/24 | 189,331 | EUR | 61,144 | ||||||||||||||||
Centrica PLC ORD | 1-Day SONIA + 0.35% | Monthly | MSCS | 7/17/24 | 446,255 | GBP | 72,948 | ||||||||||||||||
CEWE Stiftung & Co. KGaA | Euro STR + 0.35% | Monthly | JPHQ | 3/18/25 | 85,362 | EUR | 5,157 | ||||||||||||||||
Clarkson PLC | 1-Day SONIA + 0.35% | Monthly | MSCS | 5/06/25 | 181,383 | GBP | 78,998 | ||||||||||||||||
Clas Ohlson AB | 1-Week STIBOR + 0.28% | Monthly | SEBA | 7/17/24 | 2,903,777 | SEK | 214,930 | ||||||||||||||||
Cliq Digital AG | Euro STR + 0.35% | Monthly | JPHQ | 7/17/24 | 188,887 | EUR | (134,430) | ||||||||||||||||
Cloetta AB | 1-Week STIBOR + 0.28% | Monthly | SEBA | 7/17/24 | 432,657 | SEK | 2,313 | ||||||||||||||||
Coca-Cola Europacific Partners PLC | 1-Day SONIA + 0.30% | Monthly | JPHQ | 10/11/24 | 137,233 | EUR | 20,021 | ||||||||||||||||
Coca-Cola HBC AG-DI | 1-Day SONIA + 0.35% | Monthly | MSCS | 12/04/24 | 242,057 | GBP | 41,677 | ||||||||||||||||
Colruyt Group NV | Euro STR + 0.35% | Monthly | JPHQ | 12/23/24 | 349,683 | EUR | 47,050 | ||||||||||||||||
Commerzbank AG | Euro STR + 0.35% | Monthly | JPHQ | 12/18/24 | 196,048 | EUR | 86,766 | ||||||||||||||||
Computacenter PLC ORD | 1-Day SONIA + 0.35% | Monthly | MSCS | 7/15/24 | 476,700 | GBP | 48,640 | ||||||||||||||||
48 | Annual Report | franklintempleton.com | ||||
Underlying Instrument | Financing Rate | Payment Frequency | Counterparty | Maturity Date | Notional Value* | Value/Unrealized Appreciation (Depreciation) | |||||||||||||||||
OTC Swap Contracts (continued) | |||||||||||||||||||||||
Equity Contracts - Longa (continued) | |||||||||||||||||||||||
Conduit Holdings Ltd. | 1-Day SONIA + 0.35% | Monthly | MSCS | 10/17/24 | 453,064 | GBP | $61,530 | ||||||||||||||||
Construcciones y Auxiliar de Ferrocarriles | 1-Day EONIA + 0.35% | Monthly | MSCS | 7/17/24 | 253,041 | EUR | 8,083 | ||||||||||||||||
Coor Service Management Holding AB | 1-Week STIBOR + 0.28% | Monthly | SEBA | 7/17/24 | 487,339 | SEK | 4,186 | ||||||||||||||||
Corem Property Group | 1-Week STIBOR + 0.28% | Monthly | SEBA | 11/27/24 | 3,402,896 | SEK | 74,130 | ||||||||||||||||
Costain Group | 1-Day SONIA + 0.35% | Monthly | MSCS | 11/15/24 | 46,563 | GBP | 18,840 | ||||||||||||||||
Costain Group | 1-Day SONIA + 0.35% | Monthly | MSCS | 11/27/24 | 568 | GBP | 368 | ||||||||||||||||
Cranswick PLC | 1-Day SONIA + 0.35% | Monthly | MSCS | 7/29/24 | 22,658 | GBP | 533 | ||||||||||||||||
Currys PLC | 1-Day SONIA + 0.35% | Monthly | MSCS | 11/27/24 | 104,135 | GBP | 41,026 | ||||||||||||||||
Dampskibsselskabet Norden A/S | 1-Week CIBOR + 0.28% | Monthly | SEBA | 7/17/24 | 1,144,755 | DKK | (13,821) | ||||||||||||||||
Danieli & C Officine Meccaniche SpA | Euro STR + 0.35% | Monthly | JPHQ | 7/17/24 | 415,069 | EUR | 217,361 | ||||||||||||||||
Danske Bank A/S | 1-Week CIBOR + 0.275% | Monthly | SEBA | 11/13/24 | 1,616,416 | DKK | 37,260 | ||||||||||||||||
Darktrace PLC | 1-Day SONIA + 0.35% | Monthly | MSCS | 12/04/24 | 92,769 | GBP | 35,686 | ||||||||||||||||
Datatec Ltd. | 1-Day SABOR + 0.70% | Monthly | MSCS | 11/27/24 | 272,707 | ZAR | 22 | ||||||||||||||||
DCC PLC | 1-Day SONIA + 0.35% | Monthly | MSCS | 7/17/24 | 227,457 | GBP | 62,726 | ||||||||||||||||
Deceuninck | Euro STR + 0.35% | Monthly | JPHQ | 11/07/24 | 50,537 | EUR | 6,579 | ||||||||||||||||
Dedicare AB | 1-Week STIBOR + 0.275% | Monthly | SEBA | 5/27/25 | 1,033,895 | SEK | (42,945) | ||||||||||||||||
Derichebourg SA | 1-Day EONIA + 0.30% | Monthly | MSCS | 7/17/24 | 95,339 | EUR | 13,523 | ||||||||||||||||
Deutsche Bank AG | Euro STR + 0.35% | Monthly | JPHQ | 7/17/24 | 270,634 | EUR | 114,437 | ||||||||||||||||
Deutsche Beteiligungs AG | Euro STR + 0.35% | Monthly | JPHQ | 12/19/24 | 124,629 | EUR | (3,212) | ||||||||||||||||
Deutsche Lufthansa AG | Euro STR + 0.35% | Monthly | JPHQ | 9/06/24 | 25,606 | EUR | (2,531) | ||||||||||||||||
Deutz AG | Euro STR + 0.35% | Monthly | JPHQ | 7/13/24 | 211,946 | EUR | (10,106) | ||||||||||||||||
Develia SA | 1-Day FEDEF + 1.25% | Monthly | MSCO | 12/19/24 | 48,842 | 13,479 | |||||||||||||||||
Digital Value SpA | Euro STR + 0.35% | Monthly | JPHQ | 7/17/24 | 122,561 | EUR | 13,554 | ||||||||||||||||
Diys Fastigheter AB | 1-Week STIBOR + 0.28% | Monthly | SEBA | 7/12/24 | 737,015 | SEK | 4,257 | ||||||||||||||||
D’leteren Group | Euro STR + 0.35% | Monthly | JPHQ | 5/30/25 | 101,265 | EUR | (940) | ||||||||||||||||
DO & CO AG | Euro STR + 0.35% | Monthly | JPHQ | 9/06/24 | 80,281 | EUR | 26,007 | ||||||||||||||||
DOF Group ASA | 1-Week NIBOR + 0.275% | Monthly | SEBA | 3/06/25 | 1,620,192 | NOK | 56,605 | ||||||||||||||||
Dom Development | 1-Day FEDEF + 1.25% | Monthly | MSCS | 11/28/24 | 42,158 | 6,467 | |||||||||||||||||
Dormakaba | 1-Day SARON + 0.35% | Monthly | JPHQ | 3/04/25 | 149,985 | CHF | 6,022 | ||||||||||||||||
Drax Group PLC | 1-Day SONIA + 0.35% | Monthly | MSCS | 7/17/24 | 468,228 | GBP | (29,567) | ||||||||||||||||
Duerr AG | Euro STR + 0.35% | Monthly | JPHQ | 2/17/25 | 118,150 | EUR | 13,174 | ||||||||||||||||
Dunelm Group PLC | 1-Day SONIA + 0.35% | Monthly | MSCS | 4/03/25 | 90,273 | GBP | 1,324 | ||||||||||||||||
Duni AB | 1-Week STIBOR + 0.275% | Monthly | SEBA | 1/16/25 | 1,211,163 | SEK | 5,661 | ||||||||||||||||
E.ON SE | Euro STR + 0.35% | Monthly | JPHQ | 8/19/24 | 237,935 | EUR | 10,679 | ||||||||||||||||
Easyjet PLC | 1-Day SONIA + 0.35% | Monthly | MSCO | 7/17/24 | 480,655 | GBP | (66,061) | ||||||||||||||||
Ebro Foods | 1-Day EONIA + 0.35% | Monthly | MSCO | 12/04/24 | 233,759 | EUR | 14,136 | ||||||||||||||||
Econocom Group SE | Euro STR + 0.35% | Monthly | JPHQ | 1/08/25 | 7,222 | EUR | (485) | ||||||||||||||||
Econocom Group SE | Euro STR + 0.35% | Monthly | JPHQ | 7/17/24 | 69,817 | EUR | (7,014) | ||||||||||||||||
EFG International AG | 1-Day SARON + 0.35% | Monthly | JPHQ | 7/17/24 | 447,458 | CHF | 114,964 | ||||||||||||||||
Elecnor SA | 1-Day EONIA + 0.35% | Monthly | MSCS | 7/17/24 | 48,952 | EUR | 3,754 | ||||||||||||||||
Electrolux Professional AB | 1-Week STIBOR + 0.275% | Monthly | SEBA | 5/08/25 | 2,339,923 | SEK | 18,212 | ||||||||||||||||
Elektrotim | 1-Day FEDEF + 1.25% | Monthly | MSCS | 11/28/24 | 29,213 | 7,255 | |||||||||||||||||
Elementis PLC | 1-Day SONIA + 0.35% | Monthly | MSCS | 9/30/24 | 260,601 | GBP | 13,290 | ||||||||||||||||
franklintempleton.com | Annual Report | 49 | ||||
Underlying Instrument | Financing Rate | Payment Frequency | Counterparty | Maturity Date | Notional Value* | Value/Unrealized Appreciation (Depreciation) | |||||||||||||||||
OTC Swap Contracts (continued) | |||||||||||||||||||||||
Equity Contracts - Longa (continued) | |||||||||||||||||||||||
Elis SA | 1-Day EONIA + 0.30% | Monthly | MSCS | 2/26/25 | 139,726 | EUR | $45,192 | ||||||||||||||||
Elmera Group ASA | 1-Week NIBOR + 0.275% | Monthly | SEBA | 1/27/25 | 922,042 | NOK | 2,825 | ||||||||||||||||
Elmos Semiconductor SE | Euro STR + 0.35% | Monthly | JPHQ | 7/18/24 | 321,361 | EUR | 63,587 | ||||||||||||||||
Elopak ASA | 1-Week NIBOR + 0.275% | Monthly | SEBA | 5/08/25 | 763,280 | NOK | 839 | ||||||||||||||||
Enad Global 7 AB | 1-Week STIBOR + 0.28% | Monthly | SEBA | 11/27/24 | 1,851,372 | SEK | (85,685) | ||||||||||||||||
Endesa SA | 1-Day EONIA + 0.35% | Monthly | MSCS | 1/13/25 | 410,626 | EUR | (2,035) | ||||||||||||||||
Enea AB | 1-Day FEDEF + 0.30% | Monthly | MSCS | 7/17/24 | 241,581 | 33,675 | |||||||||||||||||
Enel Group | Euro STR + 0.35% | Monthly | JPHQ | 10/28/24 | 214,979 | EUR | 22,136 | ||||||||||||||||
Engie SA | 1-Day EONIA + 0.30% | Monthly | MSCS | 8/30/24 | 272,225 | EUR | 12,428 | ||||||||||||||||
Engie SA | 1-Day EONIA + 0.40% | Monthly | MSCO | 9/25/24 | 1,681,341 | EUR | (41,732) | ||||||||||||||||
EnQuest PLC | 1-Day SONIA + 0.35% | Monthly | MSCS | 11/27/24 | 327,487 | GBP | (17,303) | ||||||||||||||||
Equity Flows | Fixed 0.10% | Monthly | JPHQ | 6/28/24 | 930,470 | 19,917 | |||||||||||||||||
Equity Flows | Fixed 0.10% | Monthly | JPHQ | 6/28/24 | 1,254,887 | 26,862 | |||||||||||||||||
Equity Flows | Fixed 0.10% | Monthly | JPHQ | 6/28/24 | 167,556 | 3,600 | |||||||||||||||||
Equity Flows | Fixed 0.10% | Monthly | JPHQ | 6/28/24 | 2,540,960 | 62,791 | |||||||||||||||||
Equity Low Beta | Fixed (0.19)% | Monthly | DBAB | 6/28/24 | 1,957,726 | 11,937 | |||||||||||||||||
Equity Low Beta | Fixed (0.19)% | Monthly | DBAB | 6/28/24 | 1,449,627 | 8,840 | |||||||||||||||||
Equity Low Beta | Fixed (0.19)% | Monthly | DBAB | 6/28/24 | 259,512 | 1,457 | |||||||||||||||||
Equity Low Beta | Fixed (0.19)% | Monthly | DBAB | 6/28/24 | 3,982,773 | 14,170 | |||||||||||||||||
Equity Momentum | Fixed (0.19)% | Monthly | DBAB | 6/28/24 | 3,235,715 | 47,693 | |||||||||||||||||
Equity Momentum | Fixed (0.19)% | Monthly | DBAB | 6/28/24 | 553,478 | 7,889 | |||||||||||||||||
Equity Momentum | Fixed (0.19)% | Monthly | DBAB | 6/28/24 | 4,371,801 | 64,438 | |||||||||||||||||
Equity Momentum | Fixed (0.19)% | Monthly | DBAB | 6/28/24 | 8,827,388 | 145,390 | |||||||||||||||||
Equity Value | Fixed (0.19)% | Monthly | DBAB | 6/28/24 | 15,195,820 | 209,832 | |||||||||||||||||
Equity Value | Fixed (0.19)% | Monthly | DBAB | 6/28/24 | 7,533,865 | 81,885 | |||||||||||||||||
Equity Value | Fixed (0.19)% | Monthly | DBAB | 6/28/24 | 5,576,478 | 63,319 | |||||||||||||||||
Equity Value | Fixed (0.19)% | Monthly | DBAB | 6/28/24 | 948,148 | 10,305 | |||||||||||||||||
Ericsson | 1-Week STIBOR + 0.28% | Monthly | SEBA | 7/17/24 | 550,592 | SEK | 3,285 | ||||||||||||||||
Eurazeo SE | 1-Day EONIA + 0.30% | Monthly | MSCO | 5/20/25 | 201,624 | EUR | (672) | ||||||||||||||||
Eurobio Scientific SA | 1-Day EONIA + 0.30% | Monthly | MSCS | 7/17/24 | 60,463 | EUR | (17,681) | ||||||||||||||||
Eurocash | 1-Day FEDEF + 1.25% | Monthly | MSCS | 1/06/25 | 126,289 | (20,062) | |||||||||||||||||
Eurocommercial Properties NV | Euro STR + 0.35% | Monthly | JPHQ | 7/17/24 | 258,332 | EUR | 40,185 | ||||||||||||||||
EVS Broadcast Equipment SA | Euro STR + 0.35% | Monthly | JPHQ | 7/17/24 | 69,694 | EUR | 6,159 | ||||||||||||||||
Fagron NV | Euro STR | Monthly | JPHQ | 8/19/24 | 213,732 | EUR | 28,350 | ||||||||||||||||
Finnair OYJ | Euro STR + 0.275% | Monthly | SEBA | 4/15/25 | 101,280 | EUR | (6,852) | ||||||||||||||||
FirstGroup PLC | 1-Day SONIA + 0.35% | Monthly | MSCS | 8/24/24 | 255,333 | GBP | 1,985 | ||||||||||||||||
ForFarmers | Euro STR + 0.35% | Monthly | JPHQ | 7/17/24 | 104,022 | EUR | (9,360) | ||||||||||||||||
Fortress REIT Ltd. | 1-Day SABOR + 0.50% | Monthly | MSCS | 11/27/24 | 7,466,311 | ZAR | 9,226 | ||||||||||||||||
Forvia | 1-Day EONIA + 0.30% | Monthly | MSCS | 12/02/24 | 149,554 | EUR | (1,491) | ||||||||||||||||
Foxtons Group PLC | 1-Day SONIA + 0.35% | Monthly | MSCS | 9/18/24 | 47,164 | GBP | 64,056 | ||||||||||||||||
freenet AG | Euro STR + 0.35% | Monthly | JPHQ | 8/08/24 | 150,453 | EUR | 7,476 | ||||||||||||||||
Fuchs Petrolub SE | Euro STR + 0.35% | Monthly | JPHQ | 4/25/25 | 238,035 | EUR | 28,140 | ||||||||||||||||
Fugro NV | Euro STR + 0.35% | Monthly | JPHQ | 5/27/25 | 372,437 | EUR | 195,744 | ||||||||||||||||
Galliford Try Holdings PLC | 1-Day SONIA + 0.35% | Monthly | MSCS | 7/17/24 | 69,330 | GBP | 35,159 | ||||||||||||||||
Games Workshop Group PLC | 1-Day SONIA + 0.35% | Monthly | MSCO | 1/16/25 | 301,837 | GBP | 7,210 | ||||||||||||||||
b,cGazprom PJSC ADR | 1-Day FEDEF | Monthly | MSCS | 1/31/25 | 173,903 | — | |||||||||||||||||
50 | Annual Report | franklintempleton.com | ||||
Underlying Instrument | Financing Rate | Payment Frequency | Counterparty | Maturity Date | Notional Value* | Value/Unrealized Appreciation (Depreciation) | |||||||||||||||||
OTC Swap Contracts (continued) | |||||||||||||||||||||||
Equity Contracts - Longa (continued) | |||||||||||||||||||||||
Genmab A/S | 1-Week CIBOR + 0.28% | Monthly | SEBA | 7/17/24 | 4,002,182 | DKK | $(96,575) | ||||||||||||||||
Gerresheimer AG | Euro STR + 0.35% | Monthly | JPHQ | 7/17/24 | 410,028 | EUR | 14,989 | ||||||||||||||||
Gestamp Automocion SA | 1-Day EONIA + 0.35% | Monthly | MSCS | 7/17/24 | 530,855 | EUR | (149,099) | ||||||||||||||||
Gimv | Euro STR + 0.35% | Monthly | JPHQ | 4/14/25 | 89,958 | EUR | 3,006 | ||||||||||||||||
Granges AB | 1-Week STIBOR + 0.28% | Monthly | SEBA | 9/02/24 | 2,918,913 | SEK | 73,460 | ||||||||||||||||
Greencore Group PLC | 1-Day SONIA + 0.35% | Monthly | MSCS | 9/12/24 | 242,804 | GBP | 353,743 | ||||||||||||||||
Grifols SA | 1-Day EONIA + 0.35% | Monthly | MSCO | 3/25/25 | 124,805 | EUR | 9,134 | ||||||||||||||||
Groupe SEB | 1-Day EONIA + 0.30% | Monthly | MSCS | 8/12/24 | 218,538 | EUR | 36,988 | ||||||||||||||||
Gurit | 1-Day SARON + 0.35% | Monthly | JPHQ | 11/06/24 | 84,421 | CHF | (7,801) | ||||||||||||||||
H&M Hennes & Mauritz AB | 1-Week STIBOR + 0.28% | Monthly | SEBA | 8/15/24 | 2,688,404 | SEK | 33,547 | ||||||||||||||||
H. Lundbeck A/S | 1-Week CIBOR + 0.28% | Monthly | SEBA | 11/27/24 | 4,315,733 | DKK | 60,342 | ||||||||||||||||
Hafnia Ltd. | 1-Week NIBOR + 0.275% | Monthly | SEBA | 4/15/25 | 2,812,541 | NOK | 34,054 | ||||||||||||||||
Hal Trust | Euro STR + 0.35% | Monthly | JPHQ | 4/16/25 | 207,115 | EUR | (16,549) | ||||||||||||||||
Hammerson PLC | 1-Day SABOR + 0.70% | Monthly | MSCS | 11/27/24 | 348,169 | GBP | 36,076 | ||||||||||||||||
HANZA AB | 1-Week STIBOR + 0.28% | Monthly | SEBA | 6/14/24 | 1,165,612 | SEK | (14,137) | ||||||||||||||||
Harmony Gold Mining Co. Ltd. | 1-Day SABOR + 0.70% | Monthly | MSCO | 3/06/25 | 3,301,664 | ZAR | 46,022 | ||||||||||||||||
HeidelbergCement AG | 1-Month EURIBOR + 0.40% | Monthly | JPHQ | 7/17/24 | 343,185 | EUR | 103,852 | ||||||||||||||||
Heijmans NV | Euro STR + 0.35% | Monthly | JPHQ | 7/17/24 | 185,107 | EUR | 167,347 | ||||||||||||||||
Hemnet Group AB | 1-Week STIBOR + 0.28% | Monthly | SEBA | 8/02/24 | 1,750,762 | SEK | (918) | ||||||||||||||||
Hera | Euro STR + 0.35% | Monthly | JPHQ | 1/10/25 | 332,136 | EUR | 38,037 | ||||||||||||||||
Hikma Pharmaceuticals PLC | 1-Day SONIA + 0.35% | Monthly | MSCO | 1/08/25 | 323,089 | GBP | 2,237 | ||||||||||||||||
Hilton Food Group PLC | 1-Day SONIA + 0.35% | Monthly | MSCS | 10/18/24 | 184,227 | GBP | 46,733 | ||||||||||||||||
Hochtief AG | Euro STR + 0.35% | Monthly | JPHQ | 3/18/25 | 399,191 | EUR | 17,392 | ||||||||||||||||
Hoegh Autoliners AS | 1-Week NIBOR + 0.275% | Monthly | SEBA | 4/26/25 | 2,492,962 | NOK | 131,477 | ||||||||||||||||
Hoist Finance AB | 1-Week STIBOR + 0.28% | Monthly | SEBA | 11/27/24 | 1,025,317 | SEK | 71,682 | ||||||||||||||||
Holcim Ltd. | 1-Day SARON + 0.35% | Monthly | JPHQ | 5/09/25 | 377,138 | CHF | 113,390 | ||||||||||||||||
HORNBACH Holding AG & Co. KGaA | Euro STR + 0.35% | Monthly | JPHQ | 7/17/24 | 377,688 | EUR | 31,024 | ||||||||||||||||
Huhtamaki OYJ | Euro STR + 0.275% | Monthly | SEBA | 1/30/25 | 429,622 | EUR | 3,755 | ||||||||||||||||
Humble Group AB | 1-Week STIBOR + 0.28% | Monthly | SEBA | 11/27/24 | 1,205,794 | SEK | (7,831) | ||||||||||||||||
Husqvarna AB | 1-Week STIBOR + 0.275% | Monthly | SEBA | 9/25/24 | 4,033,366 | SEK | 22,450 | ||||||||||||||||
HUUUGE Inc. | 1-Day FEDEF + 1.25% | Monthly | MSCS | 7/01/24 | 96,865 | (10,222) | |||||||||||||||||
hVIVO PLC | 1-Day SONIA + 0.35% | Monthly | MSCS | 5/27/25 | 55,600 | GBP | 36,349 | ||||||||||||||||
Hyundai Motor Co. | 1-Day FEDEF + 0.30% | Monthly | MSCS | 2/05/25 | 307,652 | 941 | |||||||||||||||||
Imperial Brands PLC | 1-Day SONIA + 0.35% | Monthly | MSCO | 5/22/25 | 86,337 | GBP | 275 | ||||||||||||||||
Indra Sistemas SA | 1-Day EONIA + 0.35% | Monthly | MSCS | 7/17/24 | 469,402 | EUR | 267,874 | ||||||||||||||||
Indus-Holding AG | Euro STR + 0.35% | Monthly | JPHQ | 10/11/24 | 47,495 | EUR | 17,128 | ||||||||||||||||
Industrivarden AB | 1-Week STIBOR + 0.28% | Monthly | SEBA | 8/15/24 | 4,808,880 | SEK | 102,824 | ||||||||||||||||
Inficon | 1-Day SARON + 0.35% | Monthly | JPHQ | 3/25/25 | 57,837 | CHF | 5,685 | ||||||||||||||||
Instone Real Estate Group SE | Euro STR + 0.35% | Monthly | JPHQ | 12/12/24 | 75,072 | EUR | 21,414 | ||||||||||||||||
Intermediate Capital Group | 1-Day SONIA + 0.35% | Monthly | MSCO | 1/06/25 | 180,213 | GBP | 95,915 | ||||||||||||||||
International Consolidated Airlines Group SA | 1-Day SONIA + 0.30% | Monthly | MSCS | 5/27/25 | 364,149 | GBP | 46,152 | ||||||||||||||||
Intesa Sanpaolo SpA | Euro STR + 0.35% | Monthly | JPHQ | 4/22/25 | 309,652 | EUR | 83,045 | ||||||||||||||||
Investec | 1-Day SONIA + 0.35% | Monthly | MSCS | 7/05/24 | 408,417 | GBP | 45,126 | ||||||||||||||||
Ionos Group SE | Euro STR + 0.35% | Monthly | JPHQ | 11/06/24 | 266,958 | EUR | 93,086 | ||||||||||||||||
franklintempleton.com | Annual Report | 51 | ||||
Underlying Instrument | Financing Rate | Payment Frequency | Counterparty | Maturity Date | Notional Value* | Value/Unrealized Appreciation (Depreciation) | |||||||||||||||||
OTC Swap Contracts (continued) | |||||||||||||||||||||||
Equity Contracts - Longa (continued) | |||||||||||||||||||||||
IP Group PLC | 1-Day SONIA + 0.35% | Monthly | MSCS | 7/17/24 | 56,302 | GBP | $2,889 | ||||||||||||||||
Ipsen Pharma SAS | 1-Day EONIA + 0.30% | Monthly | MSCS | 7/17/24 | 281,402 | EUR | 27,361 | ||||||||||||||||
IQE PLC | 1-Day SONIA + 0.35% | Monthly | MSCO | 5/22/25 | 27,940 | GBP | (1,437) | ||||||||||||||||
Italian Sea Group (The) | Euro STR + 0.35% | Monthly | JPHQ | 6/17/24 | 242,924 | EUR | 53,169 | ||||||||||||||||
Iveco | Euro STR + 0.35% | Monthly | JPHQ | 11/28/24 | 250,757 | EUR | 53,321 | ||||||||||||||||
IWG PLC | 1-Day SONIA + 0.35% | Monthly | MSCS | 4/03/25 | 396,712 | GBP | 37,383 | ||||||||||||||||
J D Wetherspoon PLC | 1-Day SONIA + 0.35% | Monthly | MSCS | 5/12/25 | 437,815 | GBP | 32,803 | ||||||||||||||||
JCDecaux SE | 1-Day EONIA + 0.30% | Monthly | MSCS | 11/07/24 | 262,857 | EUR | 70,605 | ||||||||||||||||
JD Sports Fashion PLC | 1-Day SONIA + 0.35% | Monthly | MSCS | 7/17/24 | 225,491 | GBP | 23,138 | ||||||||||||||||
Jet2 PLC | 1-Day SONIA + 0.35% | Monthly | MSCS | 7/18/24 | 345,441 | GBP | 44,946 | ||||||||||||||||
Johnson Service Group PLC | 1-Day SONIA + 0.35% | Monthly | MSCS | 6/07/24 | 239,230 | GBP | 119,862 | ||||||||||||||||
JOST Werke SE | Euro STR + 0.35% | Monthly | JPHQ | 7/05/24 | 154,124 | EUR | (5,181) | ||||||||||||||||
JSW | 1-Day FEDEF + 1.25% | Monthly | MSCO | 1/27/25 | 141,475 | (40,537) | |||||||||||||||||
Just Group PLC | 1-Day SONIA + 0.35% | Monthly | MSCS | 11/27/24 | 452,415 | GBP | 121,371 | ||||||||||||||||
Kap Industrial Holdings Ltd. | 1-Day SABOR + 0.30% | Monthly | MSCS | 7/17/24 | 3,773,341 | ZAR | (50,722) | ||||||||||||||||
Kaufman ET Broad | 1-Day EONIA + 0.30% | Monthly | MSCS | 12/02/24 | 81,283 | EUR | 11,715 | ||||||||||||||||
Kemira OYJ | 1-Week Euro STR + 0.275% | Monthly | SEBA | 7/17/24 | 404,079 | EUR | 145,266 | ||||||||||||||||
Kenmare Resources PLC | 1-Day SONIA + 0.35% | Monthly | MSCS | 7/17/24 | 114,031 | GBP | (24,423) | ||||||||||||||||
Kernel Holding SA | 1-Day FEDEF + 0.30% | Monthly | MSCS | 7/17/24 | 9,590 | 7,152 | |||||||||||||||||
Kinepolis | Euro STR + 0.35% | Monthly | JPHQ | 2/26/25 | 51,986 | EUR | (4,959) | ||||||||||||||||
Kitron ASA | 1-Week NIBOR + 0.28% | Monthly | SEBA | 7/19/24 | 2,668,638 | NOK | 4,022 | ||||||||||||||||
Klepierre SA | 1-Day EONIA + 0.30% | Monthly | MSCS | 8/08/24 | 95,735 | EUR | 13,158 | ||||||||||||||||
Knights Group Holdings PLC | 1-Day SONIA + 0.35% | Monthly | MSCS | 11/18/24 | 23,150 | GBP | 8,202 | ||||||||||||||||
Koc Holding AS | 1-Day FEDEF + 0.30% | Monthly | MSCS | 7/17/24 | 208,270 | 139,080 | |||||||||||||||||
Konecranes OYJ | Euro STR + 0.28% | Monthly | SEBA | 11/22/24 | 419,578 | EUR | 222,162 | ||||||||||||||||
Koninklijke BAM Groep NV | Euro STR + 0.35% | Monthly | JPHQ | 8/14/24 | 90,568 | EUR | 812 | ||||||||||||||||
Koninklijke KPN NV | Euro STR + 0.35% | Monthly | JPHQ | 10/11/24 | 190,029 | EUR | 13,209 | ||||||||||||||||
Koninklijke Philips NV | Euro STR + 0.35% | Monthly | JPHQ | 8/26/24 | 223,751 | EUR | 72,195 | ||||||||||||||||
Kontron AG | Euro STR + 0.35% | Monthly | JPHQ | 4/11/25 | 211,129 | EUR | 30,137 | ||||||||||||||||
La Francaise Des Jeux SA | 1-Day EONIA + 0.30% | Monthly | MSCS | 7/17/24 | 459,687 | EUR | (40,520) | ||||||||||||||||
Lagercrantz Group AB | 1-Week STIBOR + 0.275% | Monthly | SEBA | 3/13/25 | 2,176,577 | SEK | 28,488 | ||||||||||||||||
Lancashire Holdings Ltd. | 1-Day SONIA + 0.35% | Monthly | MSCS | 2/19/25 | 501,279 | GBP | 30,983 | ||||||||||||||||
Lar Espana Real Estate SOCIMI SA | 1-Day EONIA + 0.35% | Monthly | MSCS | 7/17/24 | 106,958 | EUR | 37,871 | ||||||||||||||||
Lassila & Tikanoja PLC | Euro STR + 0.275% | Monthly | SEBA | 1/27/25 | 38,496 | EUR | (4,230) | ||||||||||||||||
Learning Technologies Group PLC | 1-Day SONIA + 0.35% | Monthly | MSCS | 7/01/24 | 152,037 | GBP | 22,344 | ||||||||||||||||
Link Mobility Group Holding ASA | 1-Week NIBOR + 0.28% | Monthly | SEBA | 11/27/24 | 3,586,551 | NOK | 52,097 | ||||||||||||||||
LiveChat Software SA | 1-Day FEDEF + 0.30% | Monthly | MSCS | 7/17/24 | 172,414 | (34,680) | |||||||||||||||||
Logitech International | 1-Day + 0.35% | Monthly | JPHQ | 2/17/25 | 290,806 | CHF | 53,273 | ||||||||||||||||
LondonMetric Property PLC | 1-Day SONIA + 0.35% | Monthly | MSCO | 4/01/25 | 342,996 | GBP | 13,101 | ||||||||||||||||
Lonza Group AG | 1-Day SARON + 0.35% | Monthly | JPHQ | 3/20/25 | 230,547 | CHF | (20,632) | ||||||||||||||||
Loomis AB | 1-Week STIBOR + 0.28% | Monthly | SEBA | 7/15/24 | 6,842,662 | SEK | (39,779) | ||||||||||||||||
LPP | 1-Day FEDEF + 1.25% | Monthly | MSCS | 10/10/24 | 400,246 | 47,597 | |||||||||||||||||
Lundbergs AB | 1-Week STIBOR + 0.275% | Monthly | SEBA | 9/19/24 | 840,069 | SEK | 1,682 | ||||||||||||||||
Lundin Gold Inc. | 1-Week STIBOR + 0.28% | Monthly | SEBA | 7/17/24 | 1,585,411 | SEK | 15,219 | ||||||||||||||||
Maire Tecnimont SpA | Euro STR + 0.35% | Monthly | JPHQ | 8/14/24 | 331,715 | EUR | 283,748 | ||||||||||||||||
Man Group PLC | 1-Day SONIA + 0.35% | Monthly | MSCS | 7/15/24 | 280,590 | GBP | 54,062 | ||||||||||||||||
52 | Annual Report | franklintempleton.com | ||||
Underlying Instrument | Financing Rate | Payment Frequency | Counterparty | Maturity Date | Notional Value* | Value/Unrealized Appreciation (Depreciation) | |||||||||||||||||
OTC Swap Contracts (continued) | |||||||||||||||||||||||
Equity Contracts - Longa (continued) | |||||||||||||||||||||||
Map Aktif Adiperkasa PT | 1-Day EONIA + 0.35% | Monthly | MSCS | 2/26/25 | 98,150 | EUR | $12,894 | ||||||||||||||||
Marks & Spencer Group PLC | 1-Day SONIA + 0.35% | Monthly | MSCS | 7/17/24 | 413,367 | GBP | 183,463 | ||||||||||||||||
Maurel & Prom | 1-Day EONIA + 0.30% | Monthly | MSCS | 5/16/25 | 18,975 | EUR | 5,594 | ||||||||||||||||
Mavi Giyim Sanayi Ve Ticaret AS | 1-Day FEDEF + 0.30% | Monthly | MSCS | 7/17/24 | 6,663 | 5,406 | |||||||||||||||||
MediaForEurope | 1-Day EONIA + 0.35% | Monthly | JPHQ | 5/31/25 | 239,028 | EUR | 130,975 | ||||||||||||||||
MediaForEurope | 1-Day EONIA + 0.35% | Monthly | MSCO | 5/31/25 | 103,324 | EUR | 36,559 | ||||||||||||||||
Medios AG | Euro STR + 0.35% | Monthly | JPHQ | 11/01/24 | 120,534 | EUR | (9,389) | ||||||||||||||||
Meier Tobler Group AG | 1-Day SARON + 0.35% | Monthly | JPHQ | 5/09/25 | 159,232 | CHF | (30,087) | ||||||||||||||||
Melia Hotels International | 1-Day EONIA + 0.35% | Monthly | MSCO | 5/20/25 | 230,933 | EUR | 4,275 | ||||||||||||||||
Mensch und Maschine Software SE | Euro STR + 0.35% | Monthly | JPHQ | 7/17/24 | 41,613 | EUR | 6,802 | ||||||||||||||||
Mersen | 1-Day EONIA + 0.30% | Monthly | MSCS | 7/17/24 | 361,705 | EUR | 26,760 | ||||||||||||||||
Metropole TV | 1-Day EONIA + 0.30% | Monthly | MSCS | 12/02/24 | 136,735 | EUR | 14,078 | ||||||||||||||||
Migros Ticaret | 1-Day FEDEF + 0.30% | Monthly | MSCS | 9/09/24 | 45,369 | 3,264 | |||||||||||||||||
Mitchells & Butlers PLC | 1-Day SONIA + 0.35% | Monthly | MSCS | 11/27/24 | 248,395 | GBP | 119,742 | ||||||||||||||||
Mitie Group PLC | 1-Day SONIA + 0.35% | Monthly | MSCS | 7/17/24 | 366,658 | GBP | 138,764 | ||||||||||||||||
Modern Times Group MTG AB | 1-Week STIBOR + 0.275% | Monthly | SEBA | 5/08/25 | 5,402,470 | SEK | 117,078 | ||||||||||||||||
Momentum Metropolitan Holdings Ltd. | 1-Day SABOR + 0.70% | Monthly | MSCS | 6/12/24 | 1,593,146 | ZAR | 3,341 | ||||||||||||||||
Mondadori Group | Euro STR + 0.35% | Monthly | JPHQ | 4/25/25 | 82,089 | EUR | 3,631 | ||||||||||||||||
Moneysupermarket.com | 1-Day SONIA + 0.35% | Monthly | MSCS | 2/27/25 | 366,273 | GBP | (55,611) | ||||||||||||||||
Montana | 1-Day SARON + 0.35% | Monthly | JPHQ | 11/27/24 | 109,032 | CHF | 11,423 | ||||||||||||||||
Montea NV | Euro STR + 0.35% | Monthly | JPHQ | 6/05/24 | 54,897 | EUR | 893 | ||||||||||||||||
Morgan Sindall Group PLC | 1-Day SONIA + 0.35% | Monthly | MSCS | 7/17/24 | 369,890 | GBP | 139,555 | ||||||||||||||||
Mowi ASA | 1-Week NIBOR + 0.28% | Monthly | SEBA | 7/17/24 | 2,579,773 | NOK | (1,666) | ||||||||||||||||
MPC Container Ships ASA | 1-Week NIBOR + 0.28% | Monthly | SEBA | 7/17/24 | 1,686,588 | NOK | 42,639 | ||||||||||||||||
Mr Price Group Ltd. | 1-Day SABOR + 0.70% | Monthly | MSCO | 3/14/25 | 8,359,286 | ZAR | 7,709 | ||||||||||||||||
MTN Group Ltd. | 1-Day SABOR + 0.32% | Monthly | MSCS | 7/15/24 | 2,961,039 | ZAR | (31,769) | ||||||||||||||||
Nabors Industries Ltd. | 3-Month SOFR + 0.51% | Quarterly | GSCO | 4/18/25 | 7,446 | (465) | |||||||||||||||||
NCC AB | 1-Week STIBOR + 0.28% | Monthly | SEBA | 7/17/24 | 3,259,425 | SEK | 59,928 | ||||||||||||||||
Netcare Ltd. | 1-Day SABOR + 0.70% | Monthly | MSCS | 10/02/24 | 12,069,897 | ZAR | (124,198) | ||||||||||||||||
Newlat Food | Euro STR + 0.35% | Monthly | JPHQ | 5/22/25 | 27,668 | EUR | 7,834 | ||||||||||||||||
Nexans | 1-Day EONIA + 0.30% | Monthly | MSCS | 7/17/24 | 340,376 | EUR | 152,620 | ||||||||||||||||
Nilfisk Holding A/S | 1-Week CIBOR + 0.28% | Monthly | SEBA | 7/12/24 | 920,858 | DKK | 20,191 | ||||||||||||||||
Niox Group PLC | 1-Day SONIA + 0.35% | Monthly | MSCO | 1/06/25 | 25,424 | GBP | 5,136 | ||||||||||||||||
NKT A/S | 1-Week CIBOR + 0.28% | Monthly | SEBA | 11/27/24 | 1,900,996 | DKK | 136,649 | ||||||||||||||||
NN Group NV | Euro STR + 0.35% | Monthly | JPHQ | 7/15/24 | 470,766 | EUR | 149,505 | ||||||||||||||||
NNIT A/S | 1-Week CIBOR + 0.275% | Monthly | SEBA | 6/02/25 | 26,002 | DKK | 4 | ||||||||||||||||
Nokia Corp. | Euro STR + 0.28% | Monthly | SEBA | 7/17/24 | 379,112 | EUR | 15,025 | ||||||||||||||||
Norbit ASA | 1-Week NIBOR + 0.275% | Monthly | SEBA | 12/20/24 | 652,390 | NOK | 6,414 | ||||||||||||||||
Nordea Bank ABP | 1-Week STIBOR + 0.28% | Monthly | SEBA | 7/17/24 | 1,879,134 | SEK | 11,956 | ||||||||||||||||
Nordic Paper Holding AB | 1-Week STIBOR + 0.28% | Monthly | SEBA | 8/15/24 | 1,311,148 | SEK | 63,027 | ||||||||||||||||
Norion Bank AB | 1-Week STIBOR + 0.275% | Monthly | SEBA | 3/07/25 | 882,207 | SEK | (4,689) | ||||||||||||||||
Norwegian Air Shuttle ASA | 1-Week NIBOR + 0.28% | Monthly | SEBA | 7/19/24 | 3,026,291 | NOK | 64,241 | ||||||||||||||||
Novartis AG | 1-Day SARON + 0.35% | Monthly | JPHQ | 4/22/25 | 481,811 | CHF | 21,602 | ||||||||||||||||
Novo Nordisk AS | 1-Week CIBOR + 0.275% | Monthly | SEBA | 7/17/24 | 990,988 | DKK | 73,859 | ||||||||||||||||
Odfjell SE | 1-Week NIBOR + 0.28% | Monthly | SEBA | 7/18/24 | 1,429,031 | NOK | 31,682 | ||||||||||||||||
franklintempleton.com | Annual Report | 53 | ||||
Underlying Instrument | Financing Rate | Payment Frequency | �� | Counterparty | Maturity Date | Notional Value* | Value/Unrealized Appreciation (Depreciation) | ||||||||||||||||
OTC Swap Contracts (continued) | |||||||||||||||||||||||
Equity Contracts - Longa (continued) | |||||||||||||||||||||||
Odfjell SE | 1-Week NIBOR + 0.275% | Monthly | SEBA | 1/08/25 | 226,517 | NOK | $1,224 | ||||||||||||||||
Odfjell Technology Ltd. | 1-Week NIBOR + 0.275% | Monthly | SEBA | 4/15/25 | 78,369 | NOK | (75) | ||||||||||||||||
Odfjell Technology Ltd. | 1-Week NIBOR + 0.275% | Monthly | SEBA | 4/15/25 | 604,252 | NOK | 4,826 | ||||||||||||||||
Okea ASA | 1-Week NIBOR + 0.28% | Monthly | SEBA | 7/17/24 | 3,938,422 | NOK | (77,890) | ||||||||||||||||
Okeanis Eco Tankers Corp. | 1-Week NIBOR + 0.28% | Monthly | SEBA | 7/17/24 | 2,000,993 | NOK | 19,440 | ||||||||||||||||
Old Mutual Ltd. | 1-Day SABOR + 0.70% | Monthly | MSCO | 4/30/25 | 7,298,446 | ZAR | (14,525) | ||||||||||||||||
Oma Saastopankki OYJ | Euro STR + 0.275% | Monthly | SEBA | 12/16/24 | 45,319 | EUR | (12,658) | ||||||||||||||||
Omnia Holdings Ltd. | 1-Day SABOR + 0.31% | Monthly | MSCS | 7/17/24 | 2,601,764 | ZAR | (10,612) | ||||||||||||||||
On The Beach Group PLC | 1-Day SONIA + 0.35% | Monthly | MSCS | 7/17/24 | 246,760 | GBP | (1,881) | ||||||||||||||||
Ontex Group NV | Euro STR + 0.35% | Monthly | JPHQ | 11/27/24 | 163,734 | EUR | 38,348 | ||||||||||||||||
Orange Polska SA | 1-Day FEDEF + 0.30% | Monthly | MSCS | 7/17/24 | 109,363 | 136 | |||||||||||||||||
Oriola Corp. | Euro STR + 0.28% | Monthly | SEBA | 7/17/24 | 77,787 | EUR | (21,986) | ||||||||||||||||
ORIOR AG | Euro STR + 0.35% | Monthly | JPHQ | 7/17/24 | 160,872 | CHF | (31,198) | ||||||||||||||||
ORSERO | Euro STR + 0.35% | Monthly | JPHQ | 7/17/24 | 105,367 | EUR | (22,175) | ||||||||||||||||
OSB Group | 1-Day SONIA + 0.35% | Monthly | MSCS | 9/12/24 | 237,399 | GBP | 42,496 | ||||||||||||||||
Osram Licht AG | 1-Day SARON + 0.35% | Monthly | JPHQ | 11/27/24 | 395,784 | CHF | (62,346) | ||||||||||||||||
OVS SpA | Euro STR + 0.35% | Monthly | JPHQ | 7/26/24 | 347,024 | EUR | 97,021 | ||||||||||||||||
Pagegroup PLC | 1-Day SONIA + 0.35% | Monthly | MSCS | 7/17/24 | 71,933 | GBP | 7,321 | ||||||||||||||||
Pandora A/S | 1-Week CIBOR + 0.28% | Monthly | SEBA | 7/15/24 | 2,423,567 | DKK | 87,771 | ||||||||||||||||
Pandox AB | 1-Week STIBOR + 0.28% | Monthly | SEBA | 11/01/24 | 3,103,352 | SEK | 86,827 | ||||||||||||||||
Panoro Energy ASA | 1-Week NIBOR + 0.275% | Monthly | SEBA | 10/30/24 | 2,725,405 | NOK | 75,183 | ||||||||||||||||
Pantheon Infrastructure | 1-Day SONIA + 0.35% | Monthly | MSCO | 4/15/25 | 19,343 | GBP | 378 | ||||||||||||||||
Paypoint | 1-Day SONIA + 0.35% | Monthly | MSCS | 9/23/24 | 195,590 | GBP | 8,510 | ||||||||||||||||
Per Aarsleff Holding A/S | 1-Week CIBOR + 0.28% | Monthly | SEBA | 7/17/24 | 1,171,715 | DKK | 32,830 | ||||||||||||||||
Petershill Partners PLC | 1-Day SONIA + 0.35% | Monthly | MSCO | 1/23/25 | 159,076 | GBP | 48,234 | ||||||||||||||||
Pexip Holding | 1-Week NIBOR + 0.28% | Monthly | SEBA | 11/27/24 | 1,057,623 | NOK | 17,423 | ||||||||||||||||
PGE Polska Grupa Energetyczna SA | 1-Day FEDEF + 0.30% | Monthly | MSCS | 7/15/24 | 362,626 | (28,085) | |||||||||||||||||
Plastic Omnium | 1-Day EONIA + 0.30% | Monthly | MSCO | 3/14/25 | 294,515 | EUR | (20,612) | ||||||||||||||||
Playtech PLC | 1-Day SONIA + 0.35% | Monthly | MSCS | 5/12/25 | 333,044 | GBP | (17,641) | ||||||||||||||||
PORR AG | Euro STR + 0.35% | Monthly | JPHQ | 7/17/24 | 171,762 | EUR | 19,275 | ||||||||||||||||
Poste Italiane SpA | Euro STR + 0.35% | Monthly | JPHQ | 7/17/24 | 408,271 | EUR | 91,901 | ||||||||||||||||
PPC Ltd. | 1-Day SABOR + 0.32% | Monthly | MSCS | 7/17/24 | 829,500 | ZAR | 5,977 | ||||||||||||||||
Prevas AB | 1-Week STIBOR + 0.275% | Monthly | SEBA | 10/03/24 | 418,976 | SEK | 12,899 | ||||||||||||||||
Prosegur | 1-Day EONIA + 0.35% | Monthly | MSCS | 9/26/24 | 144,191 | EUR | 5,211 | ||||||||||||||||
Publicis Groupe SA | 1-Day EONIA + 0.30% | Monthly | MSCS | 8/30/24 | 170,206 | EUR | 56,716 | ||||||||||||||||
Puuilo PLC | 1-Week Euro STR + 0.275% | Monthly | SEBA | 4/22/25 | 87,784 | EUR | 17,722 | ||||||||||||||||
PVA TePla AG | Euro STR + 0.35% | Monthly | JPHQ | 7/17/24 | 444,087 | EUR | (37,367) | ||||||||||||||||
PZU | 1-Day FEDEF + 1.25% | Monthly | MSCO | 4/03/25 | 91,919 | 1,013 | |||||||||||||||||
Quadient | 1-Day EONIA + 0.30% | Monthly | MSCS | 11/27/24 | 132,167 | EUR | 34,801 | ||||||||||||||||
Rai Way SpA | Euro STR + 0.35% | Monthly | JPHQ | 8/12/24 | 173,321 | EUR | 4,011 | ||||||||||||||||
Raiffeisen Bank International AG | Euro STR + 0.35% | Monthly | JPHQ | 11/28/24 | 294,695 | EUR | 13,632 | ||||||||||||||||
Rainbow | 1-Day FEDEF + 1.25% | Monthly | MSCS | 11/28/24 | 72,203 | 62,520 | |||||||||||||||||
Randstad NV | Euro STR + 0.35% | Monthly | JPHQ | 7/17/24 | 254,348 | EUR | (8,286) | ||||||||||||||||
Raysearch Laboratories AB | 1-Week STIBOR + 0.275% | Monthly | SEBA | 12/04/24 | 1,062,159 | SEK | 59,303 | ||||||||||||||||
Regional Reit Ltd | 1-Day SONIA + 0.35% | Monthly | MSCO | 12/05/24 | 101,230 | GBP | (4,276) | ||||||||||||||||
54 | Annual Report | franklintempleton.com | ||||
Underlying Instrument | Financing Rate | Payment Frequency | Counterparty | Maturity Date | Notional Value* | Value/Unrealized Appreciation (Depreciation) | |||||||||||||||||
OTC Swap Contracts (continued) | |||||||||||||||||||||||
Equity Contracts - Longa (continued) | |||||||||||||||||||||||
Repsol SA | 1-Day EONIA + 0.35% | Monthly | MSCS | 7/12/24 | 214,226 | EUR | $9,744 | ||||||||||||||||
Retail Estates NV | Euro STR + 0.35% | Monthly | JPHQ | 7/17/24 | 278,326 | EUR | 38,020 | ||||||||||||||||
Reunert Ltd. | 1-Day SABOR + 0.70% | Monthly | MSCS | 8/15/24 | 3,392,607 | ZAR | 23,225 | ||||||||||||||||
Roche | Euro STR + 0.35% | Monthly | JPHQ | 7/17/24 | 508,225 | CHF | (74,108) | ||||||||||||||||
Rockwool A/S | 1-Week CIBOR + 0.28% | Monthly | SEBA | 7/17/24 | 3,421,540 | DKK | 260,319 | ||||||||||||||||
Rolls-Royce Holdings PLC | 1-Day SONIA + 0.35% | Monthly | MSCO | 2/17/25 | 249,650 | GBP | 99,204 | ||||||||||||||||
Rubis | 1-Day EONIA + 0.30% | Monthly | MSCS | 8/12/24 | 295,925 | EUR | 143,973 | ||||||||||||||||
Sainsbury J PLC | 1-Day SONIA + 0.35% | Monthly | MSCO | 12/04/24 | 244,561 | GBP | (4,779) | ||||||||||||||||
Saint-Gobain SA | 1-Day EONIA + 0.30% | Monthly | MSCS | 7/17/24 | 192,414 | EUR | 68,115 | ||||||||||||||||
SalMar ASA | 1-Week NIBOR + 0.275% | Monthly | SEBA | 4/15/25 | 2,471,819 | NOK | (10,176) | ||||||||||||||||
Salzgitter AG | Euro STR + 0.35% | Monthly | JPHQ | 12/13/24 | 302,582 | EUR | (32,412) | ||||||||||||||||
Sanlorenzo | Euro STR + 0.35% | Monthly | JPHQ | 8/26/24 | 316,076 | EUR | 18,440 | ||||||||||||||||
Sany Heavy Industrial Co. Ltd | 1-Day FEDEF + 0.30% | Monthly | MSCS | 1/02/25 | 432,608 | (18,415) | |||||||||||||||||
Sappi Ltd. | 1-Day SABOR + 0.70% | Monthly | MSCS | 11/27/24 | 8,849,937 | ZAR | 117,124 | ||||||||||||||||
Sasol Ltd. | 1-Day SABOR + 0.33% | Monthly | MSCS | 7/17/24 | 8,875,843 | ZAR | (180,222) | ||||||||||||||||
SATS ASA | 1-Week NIBOR + 0.275% | Monthly | SEBA | 2/17/25 | 610,975 | NOK | (476) | ||||||||||||||||
Scandi Standard AB | 1-Week STIBOR + 0.28% | Monthly | SEBA | 7/17/24 | 1,967,550 | SEK | 81,857 | ||||||||||||||||
Scanfil PLC | Euro STR + 0.275% | Monthly | SEBA | 10/17/24 | 52,855 | EUR | 997 | ||||||||||||||||
Schindler | 1-Day SARON + 0.35% | Monthly | JPHQ | 11/29/24 | 452,872 | CHF | 80,413 | ||||||||||||||||
Schouw & Co. | 1-Week NIBOR + 0.275% | Monthly | SEBA | 5/22/25 | 734,828 | DKK | (1,035) | ||||||||||||||||
SCOR SE | 1-Day EONIA + 0.30% | Monthly | MSCS | 8/12/24 | 509,159 | EUR | (35,745) | ||||||||||||||||
Securitas AB | 1-Week STIBOR + 0.28% | Monthly | SEBA | 7/17/24 | 3,678,530 | SEK | 22,631 | ||||||||||||||||
Serco Group | 1-Day SONIA + 0.35% | Monthly | MSCS | 9/30/24 | 382,451 | GBP | 84,272 | ||||||||||||||||
Severfield PLC | 1-Day SONIA + 0.35% | Monthly | MSCS | 9/27/24 | 45,654 | GBP | 5,636 | ||||||||||||||||
SHELL PLC | 1-Day SONIA + 0.40% | Monthly | MSCS | 5/03/25 | 1,339,192 | GBP | (22,424) | ||||||||||||||||
Siegfried | 1-Day SARON + 0.35% | Monthly | JPHQ | 11/11/24 | 459,019 | CHF | 94,668 | ||||||||||||||||
Siemens Energy AG | Euro STR + 0.35% | Monthly | MSCS | 3/03/25 | 3,295,893 | EUR | (131,217) | ||||||||||||||||
Signify NV | Euro STR + 0.35% | Monthly | JPHQ | 7/17/24 | 456,189 | EUR | (22,180) | ||||||||||||||||
Sinch | 1-Week STIBOR + 0.28% | Monthly | SEBA | 11/27/24 | 2,734,181 | SEK | (25,644) | ||||||||||||||||
Sirius Real Estate Ltd. | 1-Day SONIA + 0.35% | Monthly | MSCS | 7/22/24 | 105,237 | GBP | 16,935 | ||||||||||||||||
SKF AB | 1-Week STIBOR + 0.275% | Monthly | SEBA | 3/25/25 | 5,216,990 | SEK | 79,815 | ||||||||||||||||
SMA Solar Technology AG | Euro STR + 0.35% | Monthly | JPHQ | 9/12/24 | 158,981 | EUR | (3,586) | ||||||||||||||||
Smurfit Kappa Group PLC | 1-Day SONIA + 0.35% | Monthly | MSCS | 7/17/24 | 99,230 | GBP | 41,214 | ||||||||||||||||
Societe Generale SA | 1-Day EONIA + 0.30% | Monthly | MSCS | 7/17/24 | 368,628 | EUR | 48,765 | ||||||||||||||||
Sodexo | 1-Day EONIA + 0.30% | Monthly | MSCS | 5/16/25 | 211,935 | EUR | 20,910 | ||||||||||||||||
Sogefi | Euro STR + 0.35% | Monthly | JPHQ | 11/14/24 | 98,689 | EUR | 60,744 | ||||||||||||||||
Sogefi | Euro STR + 0.35% | Monthly | JPHQ | 11/27/24 | 5,483 | EUR | 4,864 | ||||||||||||||||
Solar A/S | 1-Week CIBOR + 0.28% | Monthly | SEBA | 7/15/24 | 668,178 | DKK | (25,207) | ||||||||||||||||
Solstad Offshore | 1-Week NIBOR + 0.28% | Monthly | SEBA | 11/27/24 | 2,401,715 | NOK | (12,233) | ||||||||||||||||
Solvay | Euro STR + 0.35% | Monthly | JPHQ | 10/10/24 | 396,179 | EUR | 132,843 | ||||||||||||||||
Sopra Steria Group SA | 1-Day EONIA + 0.30% | Monthly | MSCS | 7/17/24 | 314,958 | EUR | 46,895 | ||||||||||||||||
Spar Nord Bank A/S | 1-Week CIBOR + 0.275% | Monthly | SEBA | 4/22/25 | 2,004,180 | DKK | 43,365 | ||||||||||||||||
Sparekassen Sjaelland | 1-Week CIBOR + 0.275% | Monthly | SEBA | 3/14/25 | 488,791 | DKK | (71) | ||||||||||||||||
Speedy Hire PLC | 1-Day SONIA + 0.35% | Monthly | MSCS | 7/17/24 | 106,044 | GBP | (38,486) | ||||||||||||||||
SSAB AB | 1-Week STIBOR + 0.28% | Monthly | SEBA | 7/17/24 | 3,773,217 | SEK | (52,715) | ||||||||||||||||
Stadler Rail AG | Euro STR + 0.35% | Monthly | JPHQ | 7/31/24 | 287,895 | CHF | (35,600) | ||||||||||||||||
franklintempleton.com | Annual Report | 55 | ||||
Underlying Instrument | Financing Rate | Payment Frequency | Counterparty | Maturity Date | Notional Value* | Value/Unrealized Appreciation (Depreciation) | |||||||||||||||||
OTC Swap Contracts (continued) | |||||||||||||||||||||||
Equity Contracts - Longa (continued) | |||||||||||||||||||||||
Standard Chartered PLC | 1-Day SONIA + 0.35% | Monthly | MSCS | 7/17/24 | 246,695 | GBP | $59,884 | ||||||||||||||||
STEF | 1-Day EONIA + 0.30% | Monthly | MSCS | 7/17/24 | 28,223 | EUR | 9,463 | ||||||||||||||||
Stellantis NV | Euro STR + 0.35% | Monthly | JPHQ | 7/12/24 | 390,924 | EUR | 67,500 | ||||||||||||||||
SThree PLC | 1-Day SONIA + 0.35% | Monthly | MSCS | 7/12/24 | 292,780 | GBP | 56,324 | ||||||||||||||||
Stolt-Nielsen Ltd. | 1-Week NIBOR + 0.28% | Monthly | SEBA | 7/17/24 | 2,208,988 | NOK | 109,274 | ||||||||||||||||
Storytel AB | 1-Week STIBOR + 0.275% | Monthly | SEBA | 5/08/25 | 849,862 | SEK | (908) | ||||||||||||||||
STRABAG SE | Euro STR + 0.35% | Monthly | JPHQ | 7/12/24 | 231,366 | EUR | 7,028 | ||||||||||||||||
Sulzer Ltd. | 1-Day SARON + 0.35% | Monthly | JPHQ | 11/11/24 | 517,590 | CHF | 228,266 | ||||||||||||||||
Sun International Hotels Ltd. | 1-Day SABOR + 0.70% | Monthly | MSCS | 5/20/25 | 2,257,628 | ZAR | (6,667) | ||||||||||||||||
Swedencare AB | 1-Week STIBOR + 0.275% | Monthly | SEBA | 5/20/25 | 372,532 | SEK | 1,644 | ||||||||||||||||
Swiss Re AG | 1-Day SARON + 0.35% | Monthly | JPHQ | 7/17/24 | 346,020 | CHF | 87,821 | ||||||||||||||||
Sydbank A/S | 1-Week CIBOR + 0.28% | Monthly | SEBA | 7/17/24 | 1,936,596 | DKK | 52,826 | ||||||||||||||||
Synektik | 1-Day FEDEF + 1.25% | Monthly | MSCS | 9/05/24 | 121,737 | 87,678 | |||||||||||||||||
Synsam AB | 1-Week STIBOR + 0.275% | Monthly | SEBA | 4/25/25 | 776,259 | SEK | 9,316 | ||||||||||||||||
Synthomer PLC | 1-Day SONIA + 0.35% | Monthly | MSCO | 3/28/25 | 209,732 | GBP | 22,980 | ||||||||||||||||
Tag Immobilien AG | Euro STR + 0.35% | Monthly | JPHQ | 12/09/24 | 254,275 | EUR | 51,193 | ||||||||||||||||
Talanx AG | Euro STR + 0.35% | Monthly | JPHQ | 7/17/24 | 274,248 | EUR | 26,119 | ||||||||||||||||
Tauron Polska Energia SA | 1-Day FEDEF + 0.30% | Monthly | MSCS | 7/17/24 | 243,603 | 21,494 | |||||||||||||||||
TBC Bank Group PLC | 1-Day SONIA + 0.35% | Monthly | MSCS | 7/17/24 | 241,000 | GBP | 1,132 | ||||||||||||||||
Team Internet Group PLC | 1-Day SONIA + 0.35% | Monthly | MSCS | 7/17/24 | 293,915 | GBP | 197,874 | ||||||||||||||||
TeamViewer AG | Euro STR + 0.35% | Monthly | JPHQ | 8/01/24 | 666,701 | EUR | (120,534) | ||||||||||||||||
Technogym SpA | Euro STR + 0.35% | Monthly | JPHQ | 8/12/24 | 190,005 | EUR | 37,343 | ||||||||||||||||
Tecnicas Reunidas SA | 1-Day EONIA + 0.35% | Monthly | MSCO | 2/28/25 | 144,335 | EUR | 98,818 | ||||||||||||||||
Teknosa Ic Ve Dis Ticaret | 1-Day FEDEF + 1.25% | Monthly | MSCO | 5/15/25 | 38,224 | (5,447) | |||||||||||||||||
Telkom SA SOC Ltd. | 1-Day SABOR + 0.70% | Monthly | MSCS | 7/17/24 | 6,392,951 | ZAR | (16,488) | ||||||||||||||||
Ten Square Games | 1-Day FEDEF + 1.25% | Monthly | MSCS | 1/06/25 | 85,138 | 10,918 | |||||||||||||||||
Terveystalo PLC | Euro STR + 0.28% | Monthly | SEBA | 7/17/24 | 130,277 | EUR | 14,917 | ||||||||||||||||
TF1 Group | 1-Day EONIA + 0.30% | Monthly | MSCS | 7/12/24 | 509,861 | EUR | 103,962 | ||||||||||||||||
Tharisa PLC | 1-Day SONIA + 0.35% | Monthly | MSCS | 7/17/24 | 46,677 | GBP | (12,799) | ||||||||||||||||
THG PLC | 1-Day SONIA + 0.35% | Monthly | MSCS | 11/27/24 | 201,014 | GBP | 20,125 | ||||||||||||||||
Thungela Resources Ltd. | 1-Day SABOR + 0.70% | Monthly | MSCS | 8/23/24 | 4,545,108 | ZAR | (97,143) | ||||||||||||||||
ThyssenKrupp AG | Euro STR + 0.35% | Monthly | JPHQ | 11/27/24 | 416,911 | EUR | (140,836) | ||||||||||||||||
TI Fluid Systems PLC | 1-Day SONIA + 0.35% | Monthly | MSCO | 2/12/25 | 251,509 | GBP | (34,862) | ||||||||||||||||
Tinc Comm VA | Euro STR + 0.35% | Monthly | JPHQ | 4/14/25 | 49,068 | EUR | (1,116) | ||||||||||||||||
Titan Cement | Euro STR + 0.35% | Monthly | JPHQ | 9/05/24 | 91,920 | EUR | 74,285 | ||||||||||||||||
Torpol SA | 1-Day FEDEF + 1.25% | Monthly | MSCO | 1/30/25 | 29,380 | 3,882 | |||||||||||||||||
Torunlar GYO | 1-Day FEDEF + 1.25% | Monthly | MSCS | 7/12/24 | 232,809 | 122,913 | |||||||||||||||||
Traton SE INH O.N. | Euro STR + 0.35% | Monthly | JPHQ | 9/12/24 | 67,221 | EUR | 46,158 | ||||||||||||||||
Traton SE INH O.N. | 1-Week STIBOR + 0.275% | Monthly | SEBA | 3/13/25 | 147,066 | SEK | 556 | ||||||||||||||||
Traton SE INH O.N. | 1-Week STIBOR + 0.275% | Monthly | SEBA | 3/14/25 | 1,848,232 | SEK | (5,828) | ||||||||||||||||
Traton SE INH O.N. | 1-Week STIBOR + 0.275% | Monthly | SEBA | 3/14/25 | 302,766 | SEK | (675) | ||||||||||||||||
Trigano | 1-Day EONIA + 0.30% | Monthly | MSCS | 9/23/24 | 196,063 | EUR | (9,676) | ||||||||||||||||
Triple Point Social Housing | 1-Day SONIA + 0.35% | Monthly | MSCO | 1/06/25 | 17,625 | GBP | (573) | ||||||||||||||||
Tristel PLC | 1-Day SONIA + 0.35% | Monthly | MSCO | 1/27/25 | 34,408 | GBP | (4,071) | ||||||||||||||||
Tubacex SA | 1-Day EONIA + 0.35% | Monthly | MSCS | 8/26/24 | 151,973 | EUR | 5,072 | ||||||||||||||||
56 | Annual Report | franklintempleton.com | ||||
Underlying Instrument | Financing Rate | Payment Frequency | Counterparty | Maturity Date | Notional Value* | Value/Unrealized Appreciation (Depreciation) | |||||||||||||||||
OTC Swap Contracts (continued) | |||||||||||||||||||||||
Equity Contracts - Longa (continued) | |||||||||||||||||||||||
TUI AG | Euro STR + 0.35% | Monthly | JPHQ | 4/30/25 | 452,311 | EUR | $(31,665) | ||||||||||||||||
u-blox AG | 1-Day SARON + 0.35% | Monthly | JPHQ | 7/17/24 | 491,626 | CHF | (20,298) | ||||||||||||||||
UBS Group AG | 1-Day SARON + 0.35% | Monthly | JPHQ | 7/17/24 | 83,171 | CHF | 16,244 | ||||||||||||||||
UniCredit SpA | Euro STR + 0.35% | Monthly | JPHQ | 9/25/24 | 241,985 | EUR | 121,803 | ||||||||||||||||
Unipol Gruppo SpA | Euro STR + 0.35% | Monthly | JPHQ | 7/15/24 | 157,407 | EUR | 136,928 | ||||||||||||||||
UPM-Kymmene Corp. | Euro STR + 0.275% | Monthly | SEBA | 12/18/24 | 174,171 | EUR | 11,188 | ||||||||||||||||
Vaisala Corp. | Euro STR + 0.28% | Monthly | SEBA | 7/17/24 | 47,848 | EUR | 3,950 | ||||||||||||||||
Valeo | 1-Day EONIA + 0.30% | Monthly | MSCS | 10/09/24 | 380,769 | EUR | (40,441) | ||||||||||||||||
Valiant | Euro STR + 0.35% | Monthly | JPHQ | 7/12/24 | 20,480 | CHF | 19 | ||||||||||||||||
Var Energi ASA | 1-Week NIBOR + 0.28% | Monthly | SEBA | 10/23/24 | 3,312,869 | NOK | 79,368 | ||||||||||||||||
VBG Group AB | 1-Week STIBOR + 0.275% | Monthly | SEBA | 1/16/25 | 1,496,372 | SEK | 105,421 | ||||||||||||||||
Veidekke | 1-Week NIBOR + 0.28% | Monthly | SEBA | 8/26/24 | 2,140,448 | NOK | 9,959 | ||||||||||||||||
Veolia Environnement SA | 1-Day EONIA + 0.30% | Monthly | MSCS | 8/26/24 | 260,818 | EUR | 21,520 | ||||||||||||||||
Veolia Environnement SA | 1-Day EONIA + 0.40% | Monthly | MSCS | 6/03/25 | 4,101,980 | EUR | 14,084 | ||||||||||||||||
Verallia | 1-Day EONIA + 0.30% | Monthly | MSCS | 7/17/24 | 167,882 | EUR | 17,009 | ||||||||||||||||
Vertu Motors PLC | 1-Day SONIA + 0.35% | Monthly | MSCS | 7/17/24 | 61,663 | GBP | 11,532 | ||||||||||||||||
Vesuvius PLC | 1-Day SONIA + 0.35% | Monthly | MSCS | 4/26/25 | 347,519 | GBP | 61,707 | ||||||||||||||||
Vetropack | Euro STR + 0.35% | Monthly | JPHQ | 7/17/24 | 80,841 | CHF | (12,931) | ||||||||||||||||
VGP | Euro STR + 0.35% | Monthly | JPHQ | 3/28/25 | 164,805 | EUR | 7,423 | ||||||||||||||||
Vicat SA | 1-Day EONIA + 0.30% | Monthly | MSCS | 8/30/24 | 215,676 | EUR | 26,735 | ||||||||||||||||
Vienna Insurance Group AG | Euro STR + 0.35% | Monthly | JPHQ | 12/18/24 | 220,907 | EUR | 11,847 | ||||||||||||||||
Virbac | 1-Day EONIA + 0.30% | Monthly | MSCO | 5/20/25 | 126,129 | EUR | 654 | ||||||||||||||||
Vitrolife AB | 1-Week STIBOR + 0.275% | Monthly | SEBA | 3/10/25 | 2,455,295 | SEK | 23,178 | ||||||||||||||||
Vodafone Group PLC | 1-Day SONIA + 0.35% | Monthly | MSCO | 1/20/25 | 128,215 | GBP | 17,404 | ||||||||||||||||
Voestalpine AG | Euro STR + 0.35% | Monthly | JPHQ | 12/18/24 | 150,556 | EUR | (4,166) | ||||||||||||||||
Volvo Car AB | 1-Week STIBOR + 0.275% | Monthly | SEBA | 3/07/25 | 5,628,330 | SEK | (35,784) | ||||||||||||||||
Wallenius Wilhelmsen ASA | 1-Week NIBOR + 0.28% | Monthly | SEBA | 7/17/24 | 2,708,101 | NOK | 30,002 | ||||||||||||||||
Warehouses De Pauw SA | Euro STR + 0.35% | Monthly | JPHQ | 5/16/25 | 387,705 | EUR | 21,932 | ||||||||||||||||
Wartsila Corp. | Euro STR + 0.275% | Monthly | SEBA | 10/17/24 | 308,655 | EUR | 185,080 | ||||||||||||||||
Watkin Jones PLC | 1-Day SONIA + 0.35% | Monthly | MSCS | 7/17/24 | 341,546 | GBP | (260,938) | ||||||||||||||||
WBHO Ltd. | 1-Day SABOR + 0.70% | Monthly | MSCO | 12/04/24 | 2,038,461 | ZAR | 15,932 | ||||||||||||||||
Webuild SpA | Euro STR | Monthly | JPHQ | 7/17/24 | 412,005 | EUR | 75,586 | ||||||||||||||||
Wereldhave NV | Euro STR + 0.35% | Monthly | JPHQ | 7/17/24 | 201,430 | EUR | (6,923) | ||||||||||||||||
Wickes Group PLC | 1-Day SONIA + 0.35% | Monthly | MSCS | 7/17/24 | 316,986 | GBP | (2,438) | ||||||||||||||||
Wolters Kluwer NV | Euro STR + 0.35% | Monthly | JPHQ | 4/17/25 | 193,789 | EUR | 4,094 | ||||||||||||||||
Workspace Group PLC | 1-Day SONIA + 0.35% | Monthly | MSCS | 10/28/24 | 305,255 | GBP | 23,798 | ||||||||||||||||
X Fab Silicon Foundries EV | 1-Day EONIA + 0.30% | Monthly | MSCS | 7/17/24 | 319,556 | EUR | (110,597) | ||||||||||||||||
YU Group PLC | 1-Day SONIA + 0.35% | Monthly | MSCO | 2/17/25 | 68,263 | GBP | 35,398 | ||||||||||||||||
Zalando SE | Euro STR | Monthly | JPHQ | 3/03/25 | 481,031 | EUR | 69,434 | ||||||||||||||||
Zehnder | Euro STR + 0.35% | Monthly | JPHQ | 7/17/24 | 356,441 | CHF | 6,173 | ||||||||||||||||
Zumtobel Group AG | Euro STR + 0.35% | Monthly | JPHQ | 7/17/24 | 49,427 | EUR | (3,991) | ||||||||||||||||
14,147,982 | |||||||||||||||||||||||
franklintempleton.com | Annual Report | 57 | ||||
Underlying Instrument | Financing Rate | Payment Frequency | Counterparty | Maturity Date | Notional Value* | Value/Unrealized Appreciation (Depreciation) | |||||||||||||||||
OTC Swap Contracts (continued) | |||||||||||||||||||||||
Interest Rate Contracts - Longa | |||||||||||||||||||||||
Cross Asset Trend | Fixed (0.50)% | Monthly | DBAB | 6/28/24 | 4,636,088 | $ 1,404 | |||||||||||||||||
Cross Asset Trend | Fixed (0.50)% | Monthly | DBAB | 6/28/24 | 12,646,513 | 19,655 | |||||||||||||||||
Cross Asset Trend | Fixed (0.50)% | Monthly | DBAB | 6/28/24 | 788,532 | (145) | |||||||||||||||||
Cross Asset Trend | Fixed (0.50)% | Monthly | DBAB | 6/28/24 | 6,262,342 | 6,943 | |||||||||||||||||
Nigeria Government Bond | 1-Day FEDEF | Quarterly | CITI | 2/21/34 | 134,492 | (17,887) | |||||||||||||||||
Nigeria Treasury Bills | 1-Day FEDEF | Quarterly | CITI | 4/02/25 | 544,871 | (59,549) | |||||||||||||||||
(49,579) | |||||||||||||||||||||||
Equity Contracts - Shortd | |||||||||||||||||||||||
888 Holdings PLC | 1-Day SONIA - 0.30% | Monthly | MSCS | 10/21/24 | 151,491 | GBP | (20,159) | ||||||||||||||||
AB Dynamics PLC | 1-Day SONIA - 1.25% | Monthly | MSCS | 7/18/24 | 141,564 | GBP | (87,582) | ||||||||||||||||
abrdn European Logistics Income PLC | 1-Day SONIA - 0.30% | Monthly | MSCS | 7/17/24 | 147,038 | GBP | 37,029 | ||||||||||||||||
ABSA Group Ltd | 1-Day SABOR - 0.50% | Monthly | MSCO | 12/13/24 | 2,017,736 | ZAR | 2,750 | ||||||||||||||||
Accesso Technology Group | 1-Day SONIA - 2.75% | Monthly | MSCS | 9/27/24 | 54,347 | GBP | (20,042) | ||||||||||||||||
Acciones Fomento De Construcciones | 1-Day EONIA - 1.75% | Monthly | MSCS | 1/13/25 | 58,051 | EUR | (13,188) | ||||||||||||||||
ACEA | Euro STR - 0.30% | Monthly | JPHQ | 10/14/24 | 111,911 | EUR | (35,536) | ||||||||||||||||
Ackermans & van Haaren | Euro STR - 0.30% | Monthly | JPHQ | 3/18/25 | 535,875 | EUR | (82,369) | ||||||||||||||||
Addnode Group AB | 1-Week STIBOR - 0.275% | Monthly | SEBA | 7/17/24 | 2,624,956 | SEK | (113,750) | ||||||||||||||||
adesso SE | Euro STR - 0.30% | Monthly | JPHQ | 7/17/24 | 91,175 | EUR | 2,759 | ||||||||||||||||
adesso SE | Euro STR - 0.30% | Monthly | JPHQ | 1/08/25 | 18,854 | EUR | 1,132 | ||||||||||||||||
Admiral Group PLC | 1-Day SONIA - 0.30% | Monthly | MSCS | 7/17/24 | 243,465 | GBP | (57,311) | ||||||||||||||||
Afrimat Ltd. | 1-Day SABOR - 0.50% | Monthly | MSCO | 5/20/25 | 1,443,754 | ZAR | (16,649) | ||||||||||||||||
Agilyx | 1-Week NIBOR - 4.25% | Monthly | SEBA | 8/07/24 | 311,758 | NOK | 2,231 | ||||||||||||||||
Air France-KLM | 1-Day EONIA - 1.875% | Monthly | MSCO | 3/20/25 | 125,518 | EUR | (8,324) | ||||||||||||||||
Air Liquide | 1-Day EONIA - 0.30% | Monthly | MSCS | 7/17/24 | 127,049 | EUR | (5,867) | ||||||||||||||||
Aixtron SE | Euro STR - 0.30% | Monthly | JPHQ | 3/20/25 | 141,111 | EUR | 27,533 | ||||||||||||||||
Aker BP ASA | 1-Week NIBOR - 0.28% | Monthly | SEBA | 7/17/24 | 1,682,719 | NOK | (1,637) | ||||||||||||||||
Aker Carbon Capture ASA | 1-Week NIBOR - 0.28% | Monthly | SEBA | 7/14/24 | 2,389,232 | NOK | 79,907 | ||||||||||||||||
Aker Horizons | 1-Week NIBOR - 4.25% | Monthly | SEBA | 11/22/24 | 599,625 | NOK | 22,512 | ||||||||||||||||
ALD | 1-Day EONIA - 0.30% | Monthly | MSCS | 5/15/25 | 336,419 | EUR | 21,825 | ||||||||||||||||
Alfen NV | Euro STR - 0.80% | Monthly | JPHQ | 3/07/25 | 394,854 | EUR | 112,066 | ||||||||||||||||
Allegro | 1-Day FEDEF - 2.13% | Monthly | MSCS | 7/12/24 | 212,101 | (57,931) | |||||||||||||||||
Allfunds Group PLC | Euro STR - 0.30% | Monthly | JPHQ | 7/17/24 | 134,029 | EUR | 20,720 | ||||||||||||||||
Allreal Holding AG | 1-Day SARON - 0.35% | Monthly | JPHQ | 7/17/24 | 331,481 | CHF | 407 | ||||||||||||||||
Alm. Brand A/S | 1-Week CIBOR - 0.75% | Monthly | SEBA | 7/26/24 | 3,344,168 | DKK | (68,003) | ||||||||||||||||
Almirall SA | 1-Day EONIA - 0.35% | Monthly | MSCO | 10/11/24 | 25,970 | EUR | (8,735) | ||||||||||||||||
Almirall SA | 1-Day EONIA - 0.35% | Monthly | MSCS | 10/11/24 | 222,242 | EUR | (33,966) | ||||||||||||||||
Alpha Financial Markets | 1-Day SONIA - 0.30% | Monthly | MSCO | 2/17/25 | 159,937 | GBP | (38,724) | ||||||||||||||||
Alpha FX Group PLC | 1-Day SONIA - 0.30% | Monthly | MSCS | 7/17/24 | 118,746 | GBP | (52,155) | ||||||||||||||||
Alphawave IP Group PLC | 1-Day SONIA - 0.30% | Monthly | MSCS | 3/24/25 | 202,607 | GBP | (30,924) | ||||||||||||||||
Alstom SA | 1-Day EONIA - 0.30% | Monthly | MSCS | 7/13/24 | 119,301 | EUR | (60,113) | ||||||||||||||||
AMG Advanced Metallurgical Group NV | Euro STR - 0.30% | Monthly | JPHQ | 7/17/24 | 137,236 | EUR | 6,329 | ||||||||||||||||
AmRest | 1-Day FEDEF -1.50% | Monthly | MSCS | 7/17/24 | 26,790 | 209 | |||||||||||||||||
Anglo American Platinum Ltd. | 1-Day SABOR - 0.50% | Monthly | MSCS | 8/15/24 | 2,298,625 | ZAR | 18,531 | ||||||||||||||||
Anheuser-Busch InBev SA/NV | Euro STR - 0.30% | Monthly | JPHQ | 7/13/24 | 393,807 | EUR | (22,198) | ||||||||||||||||
58 | Annual Report | franklintempleton.com | ||||
Underlying Instrument | Financing Rate | Payment Frequency | Counterparty | Maturity Date | Notional Value* | Value/Unrealized Appreciation (Depreciation) | |||||||||||||||||
OTC Swap Contracts (continued) | |||||||||||||||||||||||
Equity Contracts - Shortd (continued) | |||||||||||||||||||||||
Antares Vision | Euro STR - 2.65% | Monthly | JPHQ | 8/07/24 | 53,363 | EUR | $(41,072) | ||||||||||||||||
Antofagasta PLC | 1-Day SONIA - 0.30% | Monthly | MSCS | 2/17/25 | 146,945 | GBP | (82,492) | ||||||||||||||||
Arbonia AG | 1-Day SARON - 0.35% | Monthly | JPHQ | 11/08/24 | 216,693 | CHF | (70,309) | ||||||||||||||||
Arcelik | 1-Day FEDEF - 5.00% | Monthly | MSCS | 7/17/24 | 133,760 | (66,254) | |||||||||||||||||
argenx SE | Euro STR - 0.30% | Monthly | JPHQ | 7/01/24 | 82,739 | EUR | 1,065 | ||||||||||||||||
Ariston Holding | Euro STR - 0.30% | Monthly | JPHQ | 9/11/24 | 263,765 | EUR | 54,635 | ||||||||||||||||
Ascential PLC | 1-Day SONIA - 0.875% | Monthly | MSCO | 7/17/24 | 310,631 | GBP | 68,530 | ||||||||||||||||
Ascopiave SpA | Euro STR - 0.30% | Monthly | JPHQ | 7/17/24 | 90,383 | EUR | 5,084 | ||||||||||||||||
Aselsan AS | 1-Day FEDEF - 7.50% | Monthly | MSCS | 7/17/24 | 18,998 | (35,720) | |||||||||||||||||
Ashtead Group PLC | 1-Day SONIA - 0.30% | Monthly | MSCO | 12/16/24 | 293,636 | GBP | (24,858) | ||||||||||||||||
Aspen Pharmacare Holdings Ltd. | 1-Day SABOR - 0.50% | Monthly | MSCS | 7/17/24 | 5,095,034 | ZAR | (50,030) | ||||||||||||||||
Assa Abloy AB | 1-Week STIBOR - 0.28% | Monthly | SEBA | 11/27/24 | 2,623,635 | SEK | (56,459) | ||||||||||||||||
Aston Martin Lagonda Global Holdings PLC | 1-Day SONIA - 8.75% | Monthly | MSCS | 7/17/24 | 287,765 | GBP | 70,295 | ||||||||||||||||
Astral Foods Ltd. | 1-Day SABOR - 0.50% | Monthly | MSCS | 8/12/24 | 5,237,948 | ZAR | 31,813 | ||||||||||||||||
Atrium Ljungberg AB | 1-Week STIBOR - 0.45% | Monthly | SEBA | 4/04/25 | 2,298,534 | SEK | (969) | ||||||||||||||||
Auction Technology Group | 1-Day SONIA - 0.30% | Monthly | MSCS | 11/01/24 | 230,345 | GBP | 23,375 | ||||||||||||||||
Aurubis AG | Euro STR - 0.30% | Monthly | JPHQ | 3/20/25 | 71,869 | EUR | (13,475) | ||||||||||||||||
AUTO1 Group SE | Euro STR - 0.75% | Monthly | JPHQ | 7/14/24 | 239,297 | EUR | (93,432) | ||||||||||||||||
AutoStore Holdings Ltd. | 1-Week NIBOR - 0.75% | Monthly | SEBA | 4/04/25 | 1,770,731 | NOK | 34,285 | ||||||||||||||||
Avanza Bank Holding AB | 1-Week STIBOR - 0.75% | Monthly | SEBA | 7/17/24 | 3,579,045 | SEK | (75,359) | ||||||||||||||||
Avon Protection PLC | 1-Day SONIA - 0.30% | Monthly | MSCS | 7/17/24 | 105,410 | GBP | (69,432) | ||||||||||||||||
Azelis Holding SA | Euro STR - 0.30% | Monthly | JPHQ | 7/17/24 | 213,771 | EUR | (2,200) | ||||||||||||||||
Bachem AG | Euro STR - 0.35% | Monthly | JPHQ | 7/17/24 | 243,832 | CHF | (47,726) | ||||||||||||||||
Baloise Holdings SA | 1-Day SARON - 0.35% | Monthly | JPHQ | 12/09/24 | 344,491 | CHF | (49,987) | ||||||||||||||||
Banco BPM SpA | Euro STR - 0.30% | Monthly | JPHQ | 3/12/25 | 33,678 | EUR | (5,919) | ||||||||||||||||
Bank Handlowy | 1-Day FEDEF - 0.50% | Monthly | MSCO | 4/03/25 | 39,500 | 596 | |||||||||||||||||
Bank of America MLEIAPRE Index | 1-Day EONIA - 0.30% | Monthly | BOFA | 3/21/25 | 165,771 | EUR | (13,598) | ||||||||||||||||
Bankinter SA | 1-Day EONIA - 0.35% | Monthly | MSCO | 3/06/25 | 237,401 | EUR | (74,106) | ||||||||||||||||
Banque Cantonale Vaudoise | Euro STR - 0.35% | Monthly | JPHQ | 7/12/24 | 526,814 | CHF | 4,810 | ||||||||||||||||
Barco | Euro STR - 0.30% | Monthly | JPHQ | 4/14/25 | 61,361 | EUR | (496) | ||||||||||||||||
Barloworld Ltd. | 1-Day SABOR - 0.50% | Monthly | MSCS | 10/03/25 | 1,804,867 | ZAR | (3,839) | ||||||||||||||||
Barry Callebaut | 1-Day SARON - 0.35% | Monthly | JPHQ | 11/13/24 | 299,130 | CHF | (43,208) | ||||||||||||||||
Basler AG | Euro STR - 1.20% | Monthly | JPHQ | 7/17/24 | 90,646 | EUR | (30,242) | ||||||||||||||||
Bayer AG | Euro STR - 0.30% | Monthly | JPHQ | 8/28/24 | 170,669 | EUR | (1,622) | ||||||||||||||||
BayWa AG | Euro STR - 0.30% | Monthly | JPHQ | 7/17/24 | 239,365 | EUR | 102,531 | ||||||||||||||||
Befesa SA | Euro STR - 0.30% | Monthly | JPHQ | 7/17/24 | 426,485 | EUR | 23,533 | ||||||||||||||||
Beijer Ref AB | 1-Week STIBOR - 0.28% | Monthly | SEBA | 7/17/24 | 3,788,906 | SEK | (143,397) | ||||||||||||||||
Belimo Holding AG | Euro STR - 0.35% | Monthly | JPHQ | 7/17/24 | 341,462 | CHF | 2,092 | ||||||||||||||||
Bellevue Group AG | 1-Day SARON - 1.10% | Monthly | JPHQ | 12/12/24 | 78,866 | CHF | 15,098 | ||||||||||||||||
Beneteau | 1-Day EONIA - 0.30% | Monthly | MSCO | 5/06/25 | 34,360 | EUR | (15) | ||||||||||||||||
BEWi ASA | 1-Week NIBOR - 1.00% | Monthly | SEBA | 4/15/25 | 299,937 | NOK | 2,268 | ||||||||||||||||
BFF Bank SpA | Euro STR - 0.30% | Monthly | JPHQ | 10/16/24 | 222,813 | EUR | 55,934 | ||||||||||||||||
BHP Group Ltd | 1-Day SONIA - 1.52% | Monthly | MSCO | 12/02/24 | 148,472 | GBP | 1,033 | ||||||||||||||||
Bioarctic AB | 1-Week STIBOR - 0.275% | Monthly | SEBA | 7/17/25 | 1,392,465 | SEK | (17,974) | ||||||||||||||||
Biomerieux | 1-Day EONIA - 0.30% | Monthly | MSCS | 9/16/24 | 111,596 | EUR | (1,439) | ||||||||||||||||
franklintempleton.com | Annual Report | 59 | ||||
Underlying Instrument | Financing Rate | Payment Frequency | Counterparty | Maturity Date | Notional Value* | Value/Unrealized Appreciation (Depreciation) | |||||||||||||||||
OTC Swap Contracts (continued) | |||||||||||||||||||||||
Equity Contracts - Shortd (continued) | |||||||||||||||||||||||
BMW Group | Euro STR - 0.30% | Monthly | JPHQ | 5/15/25 | 159,840 | EUR | $10,353 | ||||||||||||||||
Boliden AB | 1-Week STIBOR - 0.28% | Monthly | SEBA | 8/07/24 | 4,172,249 | SEK | (99,397) | ||||||||||||||||
Bollore SE | 1-Day EONIA - 0.30% | Monthly | MSCS | 7/17/24 | 486,501 | EUR | (67,767) | ||||||||||||||||
BoneSupport AB | 1-Week STIBOR - 0.275% | Monthly | SEBA | 3/27/25 | 1,040,064 | SEK | (12,485) | ||||||||||||||||
Borr Drilling Limited | 1-Week NIBOR - 0.75% | Monthly | SEBA | 9/09/24 | 2,731,339 | NOK | (6,996) | ||||||||||||||||
Borussia Dortmund | Euro STR - 0.95% | Monthly | JPHQ | 7/17/24 | 135,298 | EUR | (14,156) | ||||||||||||||||
Bossard AG | 1-Day SARON - 0.35% | Monthly | JPHQ | 7/17/24 | 117,671 | CHF | (13,044) | ||||||||||||||||
British American Tobacco | 1-Day SONIA - 0.30% | Monthly | MSCS | 9/27/24 | 124,739 | GBP | 4,705 | ||||||||||||||||
Budimex | 1-Day FEDEF - 0.50% | Monthly | MSCO | 5/07/25 | 74,959 | (3,596) | |||||||||||||||||
BW Energy Ltd. | 1-Week NIBOR - 0.45% | Monthly | SEBA | 7/17/24 | 1,626,164 | NOK | (36,546) | ||||||||||||||||
BW Offshore Ltd. | 1-Week NIBOR - 0.28% | Monthly | SEBA | 7/19/24 | 674,794 | NOK | (15,540) | ||||||||||||||||
CA Immobilien Anlagen AG | Euro STR - 0.30% | Monthly | JPHQ | 7/17/24 | 581,490 | EUR | (17,255) | ||||||||||||||||
Cadeler AS | 1-Week NIBOR - 6.50% | Monthly | SEBA | 7/17/24 | 2,992,011 | NOK | (143,803) | ||||||||||||||||
Campari | Euro STR - 0.30% | Monthly | JPHQ | 7/31/24 | 330,066 | EUR | 58,520 | ||||||||||||||||
Cancom SE | 1-Month EURIBOR - 0.25% | Monthly | JPHQ | 7/17/24 | 168,537 | EUR | (41,522) | ||||||||||||||||
Capgemini | 1-Day EONIA - 0.30% | Monthly | MSCS | 9/23/24 | 202,835 | EUR | 24,029 | ||||||||||||||||
Capita PLC | 1-Day SONIA - 0.30% | Monthly | MSCO | 5/06/25 | 19,790 | GBP | (1,010) | ||||||||||||||||
Capitec Bank Holdings Ltd. | 1-Day SABOR - 0.50% | Monthly | MSCS | 7/14/24 | 7,282,618 | ZAR | (78,102) | ||||||||||||||||
Capricorn Energy PLC | 1-Day SONIA - 0.30% | Monthly | MSCO | 12/23/24 | 63,564 | GBP | (13,082) | ||||||||||||||||
Carel Industries | Euro STR - 0.30% | Monthly | JPHQ | 9/23/24 | 354,708 | EUR | 62,287 | ||||||||||||||||
Carl Zeiss Meditec AG | Euro STR - 0.30% | Monthly | JPHQ | 8/21/24 | 144,397 | EUR | 5,079 | ||||||||||||||||
Catena AB | 1-Day EONIA + 0.30% | Monthly | SEBA | 5/08/25 | 1,359,106 | SEK | (6,152) | ||||||||||||||||
CD Projekt SA | 1-Day FEDEF - 1.25% | Monthly | MSCS | 7/17/24 | 258,162 | (40,068) | |||||||||||||||||
Cellnex Telecom SA | 1-Day EONIA - 0.35% | Monthly | MSCS | 7/14/24 | 614,062 | EUR | 18,657 | ||||||||||||||||
Celon Pharma SA | 1-Day FEDEF - 12.75% | Monthly | MSCS | 10/28/24 | 11,213 | (1,260) | |||||||||||||||||
Ceres Power Holdings PLC | 1-Day SONIA - 1.38% | Monthly | MSCS | 7/17/24 | 28,271 | GBP | (8,533) | ||||||||||||||||
Chesnara PLC | 1-Day SONIA - 0.30% | Monthly | MSCS | 12/26/24 | 72,100 | GBP | 6,455 | ||||||||||||||||
Cint Group AB | 1-Week STIBOR - 0.45% | Monthly | SEBA | 7/17/24 | 1,262,615 | SEK | (38,994) | ||||||||||||||||
CIR SpA | Euro STR - 0.30% | Monthly | JPHQ | 7/17/24 | 52,768 | EUR | (2,257) | ||||||||||||||||
Citycon OYJ | Euro STR - 0.275% | Monthly | SEBA | 5/08/25 | 38,655 | EUR | (2,564) | ||||||||||||||||
Cloudberry Clean Energy ASA | ��� | 1-Week NIBOR - 1.00% | Monthly | SEBA | 7/17/24 | 294,039 | NOK | (3,207) | |||||||||||||||
CMC Markets PLC | 1-Day SONIA - 0.30% | Monthly | MSCS | 8/19/24 | 132,835 | GBP | (270,061) | ||||||||||||||||
CNH Industrial | Euro STR - 0.30% | Monthly | JPHQ | 3/24/25 | 549,107 | EUR | 95,549 | ||||||||||||||||
Coats Group PLC | SONIA - 0.30% | Monthly | MSCS | 6/03/25 | 75,169 | GBP | (25,456) | ||||||||||||||||
Cognor Holding SA | 1-Day FEDEF - 0.75% | Monthly | MSCS | 7/17/24 | 57,628 | (13,799) | |||||||||||||||||
Coloplast A/S | 1-Week CIBOR - 0.28% | Monthly | SEBA | 7/17/24 | 2,789,426 | DKK | (14,099) | ||||||||||||||||
Comet | 1-Day SARON - 0.35% | Monthly | JPHQ | 9/30/24 | 292,021 | CHF | (185,468) | ||||||||||||||||
Corporacion Acciona Energias Renovables SA | 1-Day EONIA - 0.35% | Monthly | MSCS | 8/05/24 | 206,119 | EUR | 15,108 | ||||||||||||||||
Corporacion Financiera Alba SA | 1-Day EONIA - 0.75% | Monthly | MSCS | 3/13/25 | 23,737 | EUR | (1,869) | ||||||||||||||||
COSMO Pharmaceuticals NV | 1-Day SARON - 0.35% | Monthly | JPHQ | 7/17/24 | 105,670 | CHF | (68,225) | ||||||||||||||||
Crest Nicholson Holdings PLC | 1-Day SONIA - 0.30% | Monthly | MSCS | 8/21/24 | 380,958 | GBP | (137,947) | ||||||||||||||||
Croda International PLC | 1-Day SONIA - 0.44% | Monthly | MSCS | 11/27/24 | 351,834 | GBP | 23,154 | ||||||||||||||||
Curro Holdings | 1-Day SABOR - 1.50% | Monthly | MSCS | 1/08/25 | 799,791 | ZAR | (15,840) | ||||||||||||||||
Cy4gate SpA | Euro STR - 0.85% | Monthly | JPHQ | 2/10/25 | 44,052 | EUR | (4,588) | ||||||||||||||||
Cyfrowy Polsat SA | 1-Day FEDEF - 0.50% | Monthly | MSCS | 7/17/24 | 532,372 | (15,777) | |||||||||||||||||
60 | Annual Report | franklintempleton.com | ||||
Underlying Instrument | Financing Rate | Payment Frequency | Counterparty | Maturity Date | Notional Value* | Value/Unrealized Appreciation (Depreciation) | |||||||||||||||||
OTC Swap Contracts (continued) | |||||||||||||||||||||||
Equity Contracts - Shortd (continued) | |||||||||||||||||||||||
Daetwyler | Euro STR - 0.35% | Monthly | JPHQ | 7/17/24 | 408,579 | CHF | $(6,394) | ||||||||||||||||
Daikin Industries Ltd. | 1-Day MUTSCALM - 0.40% | Monthly | MSCS | 9/30/24 | 67,374,400 | JPY | 31,496 | ||||||||||||||||
Delivery Hero SE | Euro STR - 0.30% | Monthly | JPHQ | 7/17/24 | 188,971 | EUR | (21,171) | ||||||||||||||||
Dermapharm Holding SE | Euro STR - 0.30% | Monthly | JPHQ | 5/15/25 | 34,777 | EUR | (639) | ||||||||||||||||
Deutsche Boerse | Euro STR - 0.30% | Monthly | JPHQ | 11/27/24 | 135,363 | EUR | (968) | ||||||||||||||||
Deutsche Wohnen SE | Euro STR - 0.30% | Monthly | JPHQ | 7/17/24 | 33,541 | EUR | 4,449 | ||||||||||||||||
Diageo PLC | 1-Day SONIA - 0.30% | Monthly | MSCS | 11/27/24 | 477,626 | GBP | 125,286 | ||||||||||||||||
DiaSorin | Euro STR - 0.30% | Monthly | JPHQ | 4/25/25 | 199,893 | EUR | (23,779) | ||||||||||||||||
Dino Polska SA | 1-Day FEDEF - 0.50% | Monthly | MSCS | 7/14/24 | 444,450 | (68,157) | |||||||||||||||||
Dis-Chem Pharmacies | 1-Day SABOR - 0.50% | Monthly | MSCS | 12/26/24 | 4,559,385 | ZAR | (62,044) | ||||||||||||||||
DiscoverIE Group PLC | 1-Day SONIA - 0.30% | Monthly | MSCO | 3/28/25 | 173,591 | GBP | 1,500 | ||||||||||||||||
Discovery Ltd. | 1-Day SABOR - 0.50% | Monthly | MSCS | 7/17/24 | 12,626,552 | ZAR | 108,156 | ||||||||||||||||
DNB Bank ASA | 1-Week NIBOR - 0.275% | Monthly | SEBA | 7/17/24 | 2,534,353 | NOK | 7,977 | ||||||||||||||||
Dotdigital Group | 1-Day SONIA - 0.30% | Monthly | MSCO | 3/14/25 | 57,128 | GBP | (5,865) | ||||||||||||||||
Dottikon ES Holding AG | 1-Day SARON - 1.40% | Monthly | JPHQ | 7/17/24 | 212,596 | CHF | (44,767) | ||||||||||||||||
doValue SpA | Euro STR - 0.30% | Monthly | JPHQ | 8/14/24 | 173,574 | EUR | 52,694 | ||||||||||||||||
Dr. Martens PLC | 1-Day SONIA - 0.30% | Monthly | MSCS | 4/24/25 | 305,179 | GBP | 46,341 | ||||||||||||||||
DRDGOLD Ltd. | 1-Day SABOR - 1.00% | Monthly | MSCS | 7/17/24 | 1,367,274 | ZAR | (2,677) | ||||||||||||||||
DSM Firmenich AG | Euro STR - 0.30% | Monthly | JPHQ | 4/16/25 | 276,547 | EUR | (7,867) | ||||||||||||||||
DSV A/S | 1-Week CIBOR - 0.28% | Monthly | SEBA | 7/14/24 | 2,863,521 | DKK | 33,420 | ||||||||||||||||
DT Capital Ltd. | 1-Month HIBOR - 0.30% | Monthly | JPHQ | 1/30/25 | 118,646 | EUR | 23,899 | ||||||||||||||||
DWS Group SE | Euro STR - 0.75% | Monthly | JPHQ | 3/20/25 | 175,145 | EUR | (11,792) | ||||||||||||||||
Eckert & Ziegler AG | Euro STR - 0.30% | Monthly | JPHQ | 8/21/24 | 107,343 | EUR | (25,764) | ||||||||||||||||
Ecopro BM | 1-Day FEDEF - 10.875% | Monthly | MSCS | 5/13/25 | 203,287 | 22,287 | |||||||||||||||||
Ecopro BM | 1-Day FEDEF - 7.75% | Monthly | MSCS | 5/13/25 | 155,170 | 8,345 | |||||||||||||||||
Ecora Resources PLC | 1-Day SONIA - 0.30% | Monthly | MSCS | 7/17/24 | 6,549 | GBP | 86 | ||||||||||||||||
Edenred | 1-Day EONIA - 0.30% | Monthly | MSCO | 3/27/25 | 310,845 | EUR | 41,948 | ||||||||||||||||
Edreams Odigeo SA | 1-Day EONIA - 0.35% | Monthly | MSCS | 7/17/24 | 158,295 | EUR | (50,224) | ||||||||||||||||
Elia Group | Euro STR - 0.30% | Monthly | JPHQ | 5/16/25 | 410,373 | EUR | 13,760 | ||||||||||||||||
Elior Group SA | 1-Day EONIA - 0.30% | Monthly | MSCS | 7/15/24 | 242,124 | EUR | (205,034) | ||||||||||||||||
Elisa Oyj | Euro STR - 0.28% | Monthly | SEBA | 11/15/24 | 337,813 | EUR | (3,979) | ||||||||||||||||
Embracer Group AB | 1-Week STIBOR - 2.50% | Monthly | SEBA | 3/04/25 | 775,896 | SEK | (25,543) | ||||||||||||||||
Ems-Chemie AG | 1-Day SARON - 0.35% | Monthly | JPHQ | 7/17/24 | 388,704 | CHF | (61,268) | ||||||||||||||||
ENAV SpA | Euro STR - 0.30% | Monthly | JPHQ | 9/23/24 | 31,278 | EUR | (612) | ||||||||||||||||
Ence Energia Y Celulosa SA | 1-Day EONIA - 0.35% | Monthly | MSCO | 2/10/25 | 380,893 | EUR | (74,712) | ||||||||||||||||
Endeavour Mining PLC | 1-Day SONIA - 0.30% | Monthly | MSCO | 9/01/25 | 149,038 | GBP | 968 | ||||||||||||||||
Enel SpA | 1-Day EONIA - 0.50% | Monthly | MSCS | 12/23/24 | 419,962 | EUR | 13,140 | ||||||||||||||||
Enento Group OYJ | Euro STR - 0.28% | Monthly | SEBA | 7/17/24 | 140,810 | EUR | 14,429 | ||||||||||||||||
Energean PLC | 1-Day SONIA - 0.30% | Monthly | MSCS | 7/17/24 | 197,870 | GBP | (40,440) | ||||||||||||||||
Engcon AB | 1-Week STIBOR - 3.50% | Monthly | SEBA | 10/04/24 | 755,435 | SEK | (14,477) | ||||||||||||||||
Eni SpA | Euro STR - 0.30% | Monthly | JPHQ | 1/13/25 | 241,433 | EUR | 7,359 | ||||||||||||||||
Entain PLC | 1-Day SONIA - 0.30% | Monthly | MSCO | 2/17/25 | 460,460 | GBP | 118,470 | ||||||||||||||||
Epiroc AB | 1-Week STIBOR - 0.28% | Monthly | SEBA | 11/27/24 | 5,626,111 | SEK | (51,613) | ||||||||||||||||
EQT AB | 1-Week STIBOR - 0.28% | Monthly | SEBA | 7/17/24 | 3,797,431 | SEK | (144,435) | ||||||||||||||||
Equites Property Fund Ltd. | 1-Day SABOR - 0.50% | Monthly | MSCS | 7/17/24 | 3,490,099 | ZAR | (6,065) | ||||||||||||||||
Eramet SA | 1-Day EONIA - 0.30% | Monthly | MSCS | 8/30/24 | 213,352 | EUR | (118,709) | ||||||||||||||||
franklintempleton.com | Annual Report | 61 | ||||
Underlying Instrument | Financing Rate | Payment Frequency | Counterparty | Maturity Date | Notional Value* | Value/Unrealized Appreciation (Depreciation) | |||||||||||||||||
OTC Swap Contracts (continued) | |||||||||||||||||||||||
Equity Contracts - Shortd (continued) | |||||||||||||||||||||||
ERG SpA | Euro STR - 0.30% | Monthly | JPHQ | 7/17/24 | 56,610 | EUR | $4,052 | ||||||||||||||||
Erste Group Bank AG | Euro STR - 0.30% | Monthly | JPHQ | 10/14/24 | 183,302 | EUR | (33,956) | ||||||||||||||||
Esker SA | 1-Day EONIA - 0.30% | Monthly | MSCS | 5/20/25 | 143,431 | EUR | (51,299) | ||||||||||||||||
Essentra PLC | 1-Day SONIA - 0.30% | Monthly | MSCS | 9/01/24 | 158,525 | GBP | 19,729 | ||||||||||||||||
Essity AB | 1-Week STIBOR - 0.28% | Monthly | SEBA | 7/17/24 | 3,188,729 | SEK | (37,927) | ||||||||||||||||
EuroAPI | 1-Day EONIA - 0.30% | Monthly | MSCS | 12/23/24 | 176,061 | EUR | 45,109 | ||||||||||||||||
EuroGroup Laminations SpA | Euro STR - 0.30% | Monthly | JPHQ | 8/12/24 | 434,065 | EUR | (23,225) | ||||||||||||||||
Euronext | 1-Day EONIA - 0.30% | Monthly | MSCS | 7/17/24 | 160,526 | EUR | (67,037) | ||||||||||||||||
Europris ASA | 1-Week NIBOR - 0.275% | Monthly | SEBA | 3/12/25 | 1,749,701 | NOK | 10,971 | ||||||||||||||||
Evotec SE | Euro STR - 0.30% | Monthly | JPHQ | 7/17/24 | 118,967 | EUR | 15,919 | ||||||||||||||||
Exail Technologies | 1-Day EONIA - 6.875% | Monthly | MSCS | 9/23/24 | 60,863 | EUR | (5,938) | ||||||||||||||||
Experian PLC | 1-Day SONIA - 0.30% | Monthly | MSCS | 11/27/24 | 119,051 | GBP | (40,050) | ||||||||||||||||
FD Technologies PLC | 1-Day SONIA - 0.30% | Monthly | MSCS | 8/12/24 | 257,865 | GBP | (36,972) | ||||||||||||||||
Ferrari SpA | Euro STR - 0.30% | Monthly | JPHQ | 7/17/24 | 62,831 | EUR | (17,698) | ||||||||||||||||
Ferrovial SA | 1-Day EONIA - 0.35% | Monthly | MSCS | 7/17/24 | 466,273 | EUR | (170,785) | ||||||||||||||||
Fevertree Drinks PLC | 1-Day SONIA - 0.30% | Monthly | MSCS | 7/25/24 | 282,364 | GBP | 7,004 | ||||||||||||||||
Fielmann AG | Euro STR - 0.30% | Monthly | JPHQ | 7/17/24 | 284,126 | EUR | (12,065) | ||||||||||||||||
FinecoBank SpA | Euro STR - 0.30% | Monthly | JPHQ | 7/17/24 | 530,515 | EUR | (98,932) | ||||||||||||||||
Fiskars Group OYJ | Euro STR - 0.45% | Monthly | SEBA | 8/23/24 | 68,705 | EUR | (176) | ||||||||||||||||
flatexDEGIRO AG | 1-Month EURIBOR - 0.70% | Monthly | JPHQ | 12/06/24 | 149,312 | EUR | (11,366) | ||||||||||||||||
Flex LNG Ltd. | 1-Week NIBOR - 3.50% | Monthly | SEBA | 4/04/25 | 3,287,567 | NOK | 17,520 | ||||||||||||||||
Flow Traders | Euro STR - 0.30% | Monthly | JPHQ | 8/26/24 | 337,536 | EUR | (40,274) | ||||||||||||||||
Fluidra SA | 1-Day EONIA - 0.35% | Monthly | MSCS | 9/30/24 | 347,386 | EUR | (130,797) | ||||||||||||||||
Flutter Entertainment PLC | 1-Day SONIA - 0.30% | Monthly | MSCS | 8/30/24 | 194,373 | GBP | (7,413) | ||||||||||||||||
Focusrite PLC | 1-Day SONIA - 0.30% | Monthly | MSCS | 6/03/25 | 48,326 | GBP | 9,863 | ||||||||||||||||
Formycon AG | Euro STR - 23.00% | Monthly | JPHQ | 3/31/25 | 42,165 | EUR | 15,119 | ||||||||||||||||
Forterra PLC | 1-Day SONIA - 0.30% | Monthly | MSCS | 8/08/24 | 215,922 | GBP | (33,135) | ||||||||||||||||
Francaise Energie | 1-Day EONIA - 0.30% | Monthly | MSCS | 7/17/24 | 85,074 | EUR | 12,222 | ||||||||||||||||
Franchise Brands PLC | 1-Day SONIA - 18.50% | Monthly | MSCS | 9/27/24 | 8,698 | GBP | (1,757) | ||||||||||||||||
Fraport AG | Euro STR - 0.30% | Monthly | JPHQ | 7/17/24 | 286,785 | EUR | (40,638) | ||||||||||||||||
Fresnillo PLC | 1-Day SONIA - 0.30% | Monthly | MSCS | 7/17/24 | 225,461 | GBP | (36,274) | ||||||||||||||||
F-Secure OYJ | Euro STR - 0.275% | Monthly | SEBA | 9/09/24 | 34,255 | EUR | (6,141) | ||||||||||||||||
Geberit AG | 1-Day SARON - 0.35% | Monthly | JPHQ | 7/17/24 | 383,403 | CHF | (84,218) | ||||||||||||||||
Genuit Group PLC | 1-Day SONIA - 0.30% | Monthly | MSCS | 7/17/24 | 171,403 | GBP | (107,810) | ||||||||||||||||
Getlink SE | 1-Day EONIA - 0.30% | Monthly | MSCS | 7/17/24 | 396,892 | EUR | (33,479) | ||||||||||||||||
GFT Technologies SE | Euro STR - 0.30% | Monthly | JPHQ | 4/24/25 | 178,264 | EUR | 10,197 | ||||||||||||||||
Givaudan SA | 1-Day SARON - 0.35% | Monthly | JPHQ | 7/17/24 | 241,890 | CHF | (102,731) | ||||||||||||||||
Gjensidige Forsikring ASA | 1-Week NIBOR - 0.28% | Monthly | SEBA | 7/17/24 | 4,955,198 | NOK | (38,303) | ||||||||||||||||
Golden Ocean Group Ltd. | 1-Week NIBOR - 0.28% | Monthly | SEBA | 1/10/25 | 2,621,717 | NOK | (175,923) | ||||||||||||||||
GPW | 1-Day FEDEF - 1.125% | Monthly | MSCS | 12/23/24 | 31,124 | 473 | |||||||||||||||||
Grainger PLC | 1-Day SONIA - 0.30% | Monthly | MSCS | 7/17/24 | 80,840 | GBP | (409) | ||||||||||||||||
Grand City Properties | Euro STR - 0.30% | Monthly | JPHQ | 1/30/25 | 286,670 | EUR | (101,333) | ||||||||||||||||
Great Portland Estates PLC | 1-Day SONIA - 0.30% | Monthly | MSCS | 7/17/24 | 535,944 | GBP | 165,652 | ||||||||||||||||
Greatland Gold PLC | 1-Day SONIA - 0.30% | Monthly | MSCS | 7/17/24 | 223,098 | GBP | (21,828) | ||||||||||||||||
Grenergy Renovables SA | 1-Day EONIA - 2.38% | Monthly | MSCS | 12/02/24 | 204,353 | EUR | (25,975) | ||||||||||||||||
Grieg Seafood | 1-Week NIBOR - 0.45% | Monthly | SEBA | 4/16/25 | 1,405,214 | NOK | (11,979) | ||||||||||||||||
62 | Annual Report | franklintempleton.com | ||||
Underlying Instrument | Financing Rate | Payment Frequency | Counterparty | Maturity Date | Notional Value* | Value/Unrealized Appreciation (Depreciation) | |||||||||||||||||
OTC Swap Contracts (continued) | |||||||||||||||||||||||
Equity Contracts - Shortd (continued) | |||||||||||||||||||||||
Groupe ADP | 1-Day EONIA - 0.30% | Monthly | MSCS | 11/27/24 | 321,077 | EUR | $(23,954) | ||||||||||||||||
Groupe Bruxelles Lambert NV | Euro STR - 0.30% | Monthly | JPHQ | 7/12/24 | 345,020 | EUR | (171) | ||||||||||||||||
Gruppo MutuiOnline SpA | Euro STR - 0.30% | Monthly | JPHQ | 7/17/24 | 131,294 | EUR | (37,106) | ||||||||||||||||
GVS | Euro STR - 0.30% | Monthly | JPHQ | 7/13/24 | 87,968 | EUR | (17,719) | ||||||||||||||||
H+H International A/S | 1-Week CIBOR - 0.275% | Monthly | SEBA | 10/17/24 | 524,159 | DKK | (27,813) | ||||||||||||||||
Haleon PLC | 1-Day SONIA - 0.30% | Monthly | MSCS | 3/13/25 | 352,558 | GBP | 446 | ||||||||||||||||
Halma PLC | 1-Day SONIA - 0.30% | Monthly | MSCS | 10/28/24 | 142,557 | GBP | (6,151) | ||||||||||||||||
Hamborner REIT AG | Euro STR - 0.30% | Monthly | JPHQ | 9/27/24 | 106,021 | EUR | 3,313 | ||||||||||||||||
Hansa Biopharma AB | 1-Week STIBOR - 1.00% | Monthly | SEBA | 7/17/24 | 570,276 | SEK | (17,088) | ||||||||||||||||
Heineken Holding | Euro STR - 0.30% | Monthly | JPHQ | 11/01/24 | 159,316 | EUR | (3,301) | ||||||||||||||||
Heineken | Euro STR - 0.35% | Monthly | JPHQ | 11/27/24 | 527,113 | EUR | (31,636) | ||||||||||||||||
Hektas | 1-Day FEDEF - 15.00% | Monthly | MSCS | 7/17/24 | 5,591 | (41,696) | |||||||||||||||||
Helios Towers PLC | 1-Day SONIA - 0.30% | Monthly | MSCS | 7/17/24 | 206,630 | GBP | (119,053) | ||||||||||||||||
HELLA GmbH & Co. KGaA | Euro STR - 0.30% | Monthly | JPHQ | 7/17/24 | 325,740 | EUR | (54,252) | ||||||||||||||||
Helvetia Holding AG | 1-Day SARON - 0.35% | Monthly | JPHQ | 4/18/25 | 402,259 | CHF | (8,360) | ||||||||||||||||
Henry Boot PLC | 1-Day SONIA - 0.30% | Monthly | MSCS | 7/17/24 | 19,188 | GBP | 4,229 | ||||||||||||||||
Hensoldt AG | Euro STR - 0.30% | Monthly | JPHQ | 3/20/25 | 229,268 | EUR | (2,596) | ||||||||||||||||
Hexagon AB | 1-Week STIBOR - 0.275% | Monthly | SEBA | 4/01/25 | 1,436,428 | SEK | (22,263) | ||||||||||||||||
Hexagon Purus ASA | 1-Week NIBOR - 3.00% | Monthly | SEBA | 8/28/24 | 413,889 | NOK | (5,694) | ||||||||||||||||
Hexatronic Group AB | 1-Week STIBOR - 0.275% | Monthly | SEBA | 1/10/25 | 2,117,265 | SEK | (110,607) | ||||||||||||||||
HMS Networks AB | 1-Week STIBOR - 0.275% | Monthly | SEBA | 9/13/24 | 2,728,912 | SEK | (22,702) | ||||||||||||||||
Hufvudstaden AB | 1-Week STIBOR - 0.28% | Monthly | SEBA | 7/12/24 | 4,168,759 | SEK | (20,542) | ||||||||||||||||
Hypoport SE | 1-Day SABOR - 0.75% | Monthly | JPHQ | 9/27/24 | 164,409 | EUR | (197,844) | ||||||||||||||||
Iberdrola ORD | 1-Day EONIA - 0.50% | Monthly | MSCO | 12/02/24 | 428,484 | EUR | 10,363 | ||||||||||||||||
Ibstock PLC | 1-Day SONIA - 0.30% | Monthly | MSCS | 11/07/24 | 263,088 | GBP | (43,525) | ||||||||||||||||
ID Logistics Group | 1-Day EONIA - 0.30% | Monthly | MSCS | 5/22/25 | 248,032 | EUR | (132,209) | ||||||||||||||||
Idox PLC | 1-Day SONIA - 6.125% | Monthly | MSCO | 3/24/25 | 17,324 | GBP | (1,075) | ||||||||||||||||
IMCD Group NV | Euro STR - 0.30% | Monthly | JPHQ | 7/17/24 | 143,629 | EUR | 4,648 | ||||||||||||||||
Immobel | Euro STR - 3.25% | Monthly | JPHQ | 10/17/24 | 20,450 | EUR | (951) | ||||||||||||||||
Immofinanz AG | Euro STR - 6.80% | Monthly | JPHQ | 11/08/24 | 321,198 | EUR | (31,843) | ||||||||||||||||
Impact Healthcare Reit ORD | 1-Day SONIA - 1.10% | Monthly | MSCO | 2/17/25 | 56,779 | GBP | (5,442) | ||||||||||||||||
Industrial Select Sector | 1-Day FEDEF - 0.30% | Monthly | MSCS | 3/24/25 | 4,679,049 | 90,282 | |||||||||||||||||
Industrie De Nora | Euro STR - 0.30% | Monthly | JPHQ | 3/07/25 | 325,979 | EUR | 31,435 | ||||||||||||||||
Indutrade AB | 1-Week STIBOR - 0.275% | Monthly | SEBA | 6/03/25 | 315,518 | SEK | (312) | ||||||||||||||||
Infrastrutture Wireless Italiane SpA | Euro STR - 0.30% | Monthly | JPHQ | 7/17/24 | 416,240 | EUR | 32,787 | ||||||||||||||||
Inmobiliaria Colonial SOCIMI SA | 1-Day EONIA - 0.35% | Monthly | MSCS | 4/22/25 | 122,012 | EUR | (26,027) | ||||||||||||||||
Instalco AB | 1-Week STIBOR - 0.45% | Monthly | SEBA | 6/27/24 | 1,384,791 | SEK | 4,902 | ||||||||||||||||
IntegraFin Holdings PLC | 1-Day SONIA - 0.30% | Monthly | MSCS | 7/17/24 | 173,491 | GBP | (44,756) | ||||||||||||||||
International Petroleum Corp. | 1-Week STIBOR - 0.275% | Monthly | SEBA | 12/06/24 | 1,972,528 | SEK | (57,863) | ||||||||||||||||
Interpump Group | Euro STR - 0.30% | Monthly | JPHQ | 5/20/25 | 234,604 | EUR | 6,597 | ||||||||||||||||
Interroll Group | 1-Day SARON - 0.35% | Monthly | JPHQ | 10/28/24 | 322,688 | CHF | (7,544) | ||||||||||||||||
Investis Holdings SA | 1-Day SARON - 0.35% | Monthly | JPHQ | 9/12/24 | 14,404 | CHF | (122) | ||||||||||||||||
IREN SPA | Euro STR | Monthly | JPHQ | 11/11/24 | 27,463 | EUR | (77) | ||||||||||||||||
Italgas | Euro STR - 0.30% | Monthly | JPHQ | 9/06/24 | 317,464 | EUR | 10,740 | ||||||||||||||||
Italmobiliare | Euro STR - 0.30% | Monthly | JPHQ | 9/27/24 | 79,072 | EUR | (18,366) | ||||||||||||||||
James Halstead PLC | 1-Day SONIA - 0.30% | Monthly | MSCS | 7/17/24 | 33,906 | GBP | 1,721 | ||||||||||||||||
franklintempleton.com | Annual Report | 63 | ||||
Underlying Instrument | Financing Rate | Payment Frequency | Counterparty | Maturity Date | Notional Value* | Value/Unrealized Appreciation (Depreciation) | |||||||||||||||||
OTC Swap Contracts (continued) | |||||||||||||||||||||||
Equity Contracts - Shortd (continued) | |||||||||||||||||||||||
JDE Peet's NV | Euro STR - 0.30% | Monthly | JPHQ | 6/06/24 | 472,455 | EUR | $74,806 | ||||||||||||||||
John Wood Group PLC | 1-Day SONIA - 0.30% | Monthly | MSCS | 7/17/24 | 240,970 | GBP | (68,364) | ||||||||||||||||
JTC PLC | 1-Day SONIA - 0.30% | Monthly | MSCS | 7/17/24 | 299,865 | GBP | (87,819) | ||||||||||||||||
Judges Scientific PLC | 1-Day SONIA - 0.30% | Monthly | MSCS | 7/05/24 | 103,717 | GBP | (17,166) | ||||||||||||||||
Juventus FC | Euro STR - 17.30% | Monthly | JPHQ | 9/02/24 | 147,342 | EUR | 41,199 | ||||||||||||||||
Kainos Group PLC | 1-Day SONIA - 0.30% | Monthly | MSCS | 7/17/24 | 315,430 | GBP | (40,470) | ||||||||||||||||
KBC Groep NV | Euro STR - 0.30% | Monthly | JPHQ | 7/17/24 | 323,885 | EUR | (45,921) | ||||||||||||||||
Kempower OYJ | Euro STR - 3.75% | Monthly | SEBA | 7/17/24 | 78,592 | EUR | 16,564 | ||||||||||||||||
Kering SA | 1-Month EURIBOR - 0.40% | Monthly | MSCS | 11/27/24 | 390,863 | EUR | 107,738 | ||||||||||||||||
Kerry Group PLC | 1-Day EONIA - 0.30% | Monthly | MSCS | 7/17/24 | 321,138 | EUR | 35,366 | ||||||||||||||||
Kesko Corp. | Euro STR - 0.275% | Monthly | SEBA | 10/17/24 | 275,566 | EUR | (6,073) | ||||||||||||||||
K-Fast Holding AB | 1-Week STIBOR - 0.275% | Monthly | SEBA | 7/17/24 | 376,166 | SEK | 1,730 | ||||||||||||||||
KGHM Polska Miedz SA | 1-Day FEDEF - 0.50% | Monthly | MSCS | 8/19/24 | 137,731 | (55,579) | |||||||||||||||||
Kinnevik AB | 1-Week STIBOR - 0.28% | Monthly | SEBA | 7/17/24 | 1,734,394 | SEK | (892) | ||||||||||||||||
Knorr-Bremse AG | Euro STR - 0.30% | Monthly | JPHQ | 7/17/24 | 64,723 | EUR | (2,060) | ||||||||||||||||
Koenig & Bauer AG | Euro STR - 0.80% | Monthly | JPHQ | 1/22/25 | 60,152 | EUR | (12,204) | ||||||||||||||||
Komax | 1-Day SARON - 0.35% | Monthly | JPHQ | 7/25/24 | 396,537 | CHF | 98,714 | ||||||||||||||||
Kruk | 1-Day FEDEF - 0.50% | Monthly | MSCO | 7/17/24 | 145,829 | (6,208) | |||||||||||||||||
Kuehne+Nagel | 1-Day SARON - 0.35% | Monthly | JPHQ | 3/13/25 | 303,102 | CHF | (16,494) | ||||||||||||||||
Lanxess AG | Euro STR - 0.30% | Monthly | JPHQ | 7/17/24 | 255,327 | EUR | 17,608 | ||||||||||||||||
Lastminute.com N.V. | 1-Day SARON - 0.35% | Monthly | JPHQ | 11/11/24 | 34,784 | CHF | 5,655 | ||||||||||||||||
LEG Immobilien AG | Euro STR - 0.30% | Monthly | JPHQ | 8/21/24 | 83,688 | EUR | (25,843) | ||||||||||||||||
Legal & General Group | 1-Day SONIA - 0.30% | Monthly | MSCS | 9/23/24 | 272,203 | GBP | (54,928) | ||||||||||||||||
Lenzing AG | Euro STR - 0.30% | Monthly | JPHQ | 7/14/24 | 230,593 | EUR | (19,944) | ||||||||||||||||
LG Energy Solutions | 1-Day FEDEF - 1.875% | Monthly | MSCS | 10/07/24 | 329,094 | 52,906 | |||||||||||||||||
Lifco | 1-Week STIBOR - 0.28% | Monthly | SEBA | 11/27/24 | 1,085,467 | SEK | (4,936) | ||||||||||||||||
Linde PLC | Euro STR - 0.30% | Monthly | JPHQ | 5/15/25 | 203,099 | EUR | 2,187 | ||||||||||||||||
Linea Directa Aseguradora SA | 1-Day EONIA - 0.35% | Monthly | MSCS | 7/17/24 | 250,381 | EUR | (77,329) | ||||||||||||||||
Liontrust Asset Management PLC | 1-Day SONIA - 0.30% | Monthly | MSCO | 4/25/25 | 89,898 | GBP | (23,509) | ||||||||||||||||
London Stock Exchange Group PLC | 1-Day SONIA - 0.30% | Monthly | MSCS | 7/17/24 | 462,626 | GBP | (66,334) | ||||||||||||||||
L'Oreal SA | 1-Day EONIA - 0.30% | Monthly | MSCS | 8/09/24 | 208,381 | EUR | (7,565) | ||||||||||||||||
Lottomatica Group | Euro STR - 0.30% | Monthly | JPHQ | 4/16/25 | 274,908 | EUR | (15,451) | ||||||||||||||||
Lotus Bakeries NV | Euro STR - 0.30% | Monthly | JPHQ | 7/17/24 | 303,063 | EUR | (169,207) | ||||||||||||||||
LVMH Moet Hennessy Louis Vuitton SE | 1-Day EONIA - 0.30% | Monthly | MSCS | 7/03/24 | 255,600 | EUR | (10,127) | ||||||||||||||||
Mandatum OYJ | Euro STR - 0.275% | Monthly | SEBA | 7/17/24 | 197,047 | EUR | 6,423 | ||||||||||||||||
Marlowe PLC | 1-Day SONIA - 0.30% | Monthly | MSCS | 9/02/24 | 265,803 | GBP | (87,947) | ||||||||||||||||
Marr | Euro STR - 0.30% | Monthly | JPHQ | 12/11/24 | 450,681 | EUR | (6,712) | ||||||||||||||||
Marshalls PLC | 1-Day SONIA - 0.30% | Monthly | MSCS | 5/27/25 | 121,731 | GBP | 3,011 | ||||||||||||||||
Mas Real Estate | 1-Day SABOR - 0.50% | Monthly | MSCO | 12/13/24 | 3,950,114 | ZAR | (360) | ||||||||||||||||
Matas A/S | 1-Week CIBOR - 0.275% | Monthly | SEBA | 4/17/25 | 1,268,493 | DKK | (10,359) | ||||||||||||||||
Mayr-Melnhof Karton AG | Euro STR - 0.30% | Monthly | JPHQ | 7/17/24 | 198,316 | EUR | 19,227 | ||||||||||||||||
mBank SA | 1-Day FEDEF - 0.50% | Monthly | MSCS | 7/14/24 | 324,648 | (250,149) | |||||||||||||||||
Medacta Group SA | Euro STR - 0.35% | Monthly | JPHQ | 7/17/24 | 140,770 | CHF | (17,441) | ||||||||||||||||
Medartis AG | 1-Day SARON - 0.85% | Monthly | JPHQ | 7/17/24 | 29,267 | CHF | (1,333) | ||||||||||||||||
Melexis | Euro STR - 0.30% | Monthly | JPHQ | 4/03/25 | 52,301 | EUR | (5,309) | ||||||||||||||||
64 | Annual Report | franklintempleton.com | ||||
Underlying Instrument | Financing Rate | Payment Frequency | Counterparty | Maturity Date | Notional Value* | Value/Unrealized Appreciation (Depreciation) | |||||||||||||||||
OTC Swap Contracts (continued) | |||||||||||||||||||||||
Equity Contracts - Shortd (continued) | |||||||||||||||||||||||
Mercedes-Benz Group AG | Euro STR - 0.30% | Monthly | JPHQ | 1/13/25 | 211,994 | EUR | $(13,012) | ||||||||||||||||
Merlin Properties Socimi SA | 1-Day EONIA - 0.30% | Monthly | MSCO | 3/12/25 | 318,879 | EUR | (62,160) | ||||||||||||||||
Metso Outotec OYJ | Euro STR - 0.28% | Monthly | SEBA | 7/17/24 | 139,808 | EUR | (19,108) | ||||||||||||||||
Meyer Burger AG | 1-Day SARON - 0.95% | Monthly | JPHQ | 7/14/24 | 73,473 | CHF | 1,485 | ||||||||||||||||
Millennium | 1-Day FEDEF - 0.50% | Monthly | MSCS | 7/17/24 | 291,328 | (228,864) | |||||||||||||||||
Mips AB | 1-Week STIBOR - 0.28% | Monthly | SEBA | 9/20/24 | 6,068,789 | SEK | (48,252) | ||||||||||||||||
Mirbud | 1-Day FEDEF - 13.00% | Monthly | MSCO | 5/07/25 | 7,676 | (927) | |||||||||||||||||
MJ Gleeson PLC | 1-Day FEDEF - 0.30% | Monthly | MSCS | 11/04/24 | 55,793 | GBP | (15,113) | ||||||||||||||||
Mobilezone Holding AG | 1-Day SARON - 0.35% | Monthly | JPHQ | 3/04/25 | 138,337 | CHF | 836 | ||||||||||||||||
Mo-Bruk SA | 1-Day FEDEF - 2.375% | Monthly | MSCO | 5/28/25 | 5,574 | 39 | |||||||||||||||||
Momentum Group AB | 1-Week STIBOR - 0.275% | Monthly | SEBA | 3/27/25 | 348,615 | SEK | (13,589) | ||||||||||||||||
Morgan Advanced Materials | 1-Day SONIA - 0.30% | Monthly | MSCS | 8/12/24 | 305,627 | GBP | (78,692) | ||||||||||||||||
Motus Holdings Ltd. | 1-Day SABOR - 0.50% | Monthly | MSCS | 11/04/24 | 4,129,313 | ZAR | 27,291 | ||||||||||||||||
National Grid PLC | 1-Day SONIA | Monthly | MSCO | 7/17/24 | 1,126 | GBP | (2,813) | ||||||||||||||||
National Grid PLC | 1-Day SONIA - 0.35% | Monthly | MSCS | 12/23/24 | 383,001 | GBP | 110,219 | ||||||||||||||||
National Grid PLC | 1-Day SONIA | Monthly | MSCS | 12/23/24 | — | GBP | (24,555) | ||||||||||||||||
NCAB Group AB | 1-Week STIBOR - 0.275% | Monthly | SEBA | 2/24/25 | 2,066,741 | SEK | (21,517) | ||||||||||||||||
NCC Group PLC | 1-Day SONIA - 0.30% | Monthly | MSCS | 7/15/24 | 212,107 | GBP | (87,251) | ||||||||||||||||
Neoen | 1-Day EONIA - 0.30% | Monthly | MSCS | 7/17/24 | 312,915 | EUR | (109,577) | ||||||||||||||||
Neste Corp. | Euro STR - 0.28% | Monthly | SEBA | 7/17/24 | 286,351 | EUR | 95,479 | ||||||||||||||||
Nestle SA | 1-Day SARON - 0.35% | Monthly | JPHQ | 11/27/24 | 163,161 | CHF | 12,395 | ||||||||||||||||
Nexi SpA | Euro STR - 0.30% | Monthly | JPHQ | 10/14/24 | 432,833 | EUR | 49,149 | ||||||||||||||||
Nibe Industrier AB | 1-Week STIBOR - 0.28% | Monthly | SEBA | 8/12/24 | 4,215,223 | SEK | 58,389 | ||||||||||||||||
Nobia AB | 1-Week STIBOR - 0.275% | Monthly | SEBA | 11/11/24 | 940,335 | SEK | 18,593 | ||||||||||||||||
Nobia AB | 1-Week STIBOR - 0.275% | Monthly | SEBA | 11/11/24 | 56,322 | SEK | (29,114) | ||||||||||||||||
Noble Corp. PLC | 1-Week CIBOR - 0.34% | Monthly | SEBA | 8/05/24 | 1,104,619 | DKK | 14,753 | ||||||||||||||||
Nokian Tyres PLC | Euro STR - 0.28% | Monthly | SEBA | 8/23/24 | 448,017 | EUR | (9,076) | ||||||||||||||||
Nolato AB | 1-Week STIBOR - 0.28% | Monthly | SEBA | 9/26/24 | 1,689,120 | SEK | (54,643) | ||||||||||||||||
Nordic Semiconductor ASA | 1-Week STIBOR - 0.275% | Monthly | SEBA | 4/04/25 | 1,741,211 | NOK | (50,536) | ||||||||||||||||
Nordnet AB | 1-Week STIBOR - 0.28% | Monthly | SEBA | 7/17/25 | 2,656,626 | SEK | (36,802) | ||||||||||||||||
Norsk Hydro ASA | 1-Week NIBOR - 0.275% | Monthly | SEBA | 5/08/25 | 1,583,668 | NOK | (7,835) | ||||||||||||||||
Novozymes A/S | 1-Week CIBOR - 0.28% | Monthly | SEBA | 7/17/24 | 615,676 | DKK | (5,712) | ||||||||||||||||
NTG Nordic Transport Group | 1-Week CIBOR - 0.275% | Monthly | SEBA | 4/17/25 | 1,089,371 | DKK | (7,911) | ||||||||||||||||
NX Filtration NV | Euro STR - 2.65% | Monthly | JPHQ | 8/07/24 | 65,345 | EUR | 13,454 | ||||||||||||||||
OC Oerlikon | 1-Day SARON - 0.35% | Monthly | JPHQ | 10/07/24 | 365,762 | CHF | (143,976) | ||||||||||||||||
Ocado Group PLC | 1-Day SONIA - 0.30% | Monthly | MSCS | 7/17/24 | 189,118 | GBP | 70,709 | ||||||||||||||||
OCI N.V. | Euro STR - 0.30% | Monthly | JPHQ | 9/09/24 | 360,365 | EUR | 20,385 | ||||||||||||||||
Oesterreichische Post AG | Euro STR - 3.80% | Monthly | JPHQ | 8/23/24 | 193,151 | EUR | 11,794 | ||||||||||||||||
Orange Belgium | Euro STR - 0.30% | Monthly | JPHQ | 1/27/25 | 19,331 | EUR | (2,824) | ||||||||||||||||
Orlen | 1-Day FEDEF - 0.96% | Monthly | MSCO | 5/07/25 | 109,935 | 5,595 | |||||||||||||||||
Outsurance Group Limited | 1-Day SABOR - 0.50% | Monthly | MSCS | 10/03/24 | 7,603,348 | ZAR | (675) | ||||||||||||||||
Oxford BioMedica PLC | 1-Day SONIA - 0.30% | Monthly | MSCS | 9/26/24 | 39,590 | GBP | (35,032) | ||||||||||||||||
Oxford Instruments PLC | 1-Day SONIA - 0.30% | Monthly | MSCO | 4/25/25 | 92,940 | GBP | (14,637) | ||||||||||||||||
Oxford Nanopore Technologies PLC | 1-Day SONIA - 0.30% | Monthly | MSCS | 5/13/25 | 89,241 | GBP | 33,036 | ||||||||||||||||
P/F Bakkafrost | 1-Week NIBOR - 0.28% | Monthly | SEBA | 7/19/24 | 1,378,537 | NOK | 13,991 | ||||||||||||||||
Palfinger AG | Euro STR - 0.30% | Monthly | JPHQ | 7/12/24 | 38,226 | EUR | (4,910) | ||||||||||||||||
franklintempleton.com | Annual Report | 65 | ||||
Underlying Instrument | Financing Rate | Payment Frequency | Counterparty | Maturity Date | Notional Value* | Value/Unrealized Appreciation (Depreciation) | |||||||||||||||||
OTC Swap Contracts (continued) | |||||||||||||||||||||||
Equity Contracts - Shortd (continued) | |||||||||||||||||||||||
Partners Group Holding AG | 1-Day SARON - 0.35% | Monthly | JPHQ | 8/08/24 | 68,792 | CHF | $(15,945) | ||||||||||||||||
Patrizia AG | Euro STR | Monthly | JPHQ | 7/17/24 | 78,205 | EUR | 1,188 | ||||||||||||||||
Pennon Group PLC | 1-Day SONIA - 0.30% | Monthly | MSCS | 7/17/24 | 308,271 | GBP | 49,859 | ||||||||||||||||
Pepco | 1-Day FEDEF - 5.25% | Monthly | MSCS | 4/14/25 | 71,783 | 19,158 | |||||||||||||||||
Pepkor | 1-Day SABOR - 0.50% | Monthly | MSCS | 10/10/24 | 5,773,421 | ZAR | (12,327) | ||||||||||||||||
Pernod Ricard | 1-Day EONIA - 0.30% | Monthly | MSCS | 11/27/24 | 525,369 | EUR | 108,149 | ||||||||||||||||
Persimmon PLC | 1-Day SONIA - 0.30% | Monthly | MSCS | 8/19/24 | 219,659 | GBP | (27,423) | ||||||||||||||||
Petrofac Ltd. | 1-Day SONIA - 0.30% | Monthly | MSCS | 9/02/24 | 48,190 | GBP | 50,169 | ||||||||||||||||
Pets at Home Group PLC | 1-Day SONIA - 0.30% | Monthly | MSCO | 3/04/25 | 261,971 | GBP | (33,798) | ||||||||||||||||
Pfeiffer Vacuum | Euro STR - 0.30% | Monthly | JPHQ | 3/07/25 | 255,192 | EUR | (19,203) | ||||||||||||||||
PGS ASA | 1-Week NIBOR - 0.275% | Monthly | SEBA | 5/08/25 | 800,415 | NOK | (10,737) | ||||||||||||||||
Pharma Mar SA | 1-Day EONIA - 0.35% | Monthly | MSCO | 1/22/25 | 150,921 | EUR | (8,902) | ||||||||||||||||
Pharmanutra SpA | Euro STR - 0.30% | Monthly | JPHQ | 1/10/25 | 81,045 | EUR | 8,587 | ||||||||||||||||
Phoenix Group Holdings PLC | 1-Day SONIA - 0.30% | Monthly | MSCS | 7/17/24 | 446,368 | GBP | 33,744 | ||||||||||||||||
Pick n Pay Group (The) | 1-Day SABOR - 0.50% | Monthly | MSCS | 12/23/24 | 718,637 | ZAR | (3,860) | ||||||||||||||||
Pierer Mobility AG | 1-Day SARON - 0.35% | Monthly | JPHQ | 9/12/24 | 126,187 | CHF | 49,434 | ||||||||||||||||
Pierre & Vacances | 1-Day EONIA - 2.13% | Monthly | MSCS | 8/15/24 | 6,751 | EUR | (45) | ||||||||||||||||
PNE AG | Euro STR - 0.70% | Monthly | JPHQ | 7/13/24 | 319,474 | EUR | (47,534) | ||||||||||||||||
Polypeptide | 1-Day SARON - 0.35% | Monthly | JPHQ | 9/18/24 | 112,888 | CHF | (110,253) | ||||||||||||||||
Prosus NV | Euro STR - 0.30% | Monthly | JPHQ | 9/20/24 | 69,331 | EUR | (4,810) | ||||||||||||||||
PRS REIT PLC (The) | 1-Day SONIA - 0.30% | Monthly | MSCS | 7/17/24 | 229,745 | GBP | 22,667 | ||||||||||||||||
Prudential PLC | 1-Day SONIA - 0.30% | Monthly | MSCS | 7/14/24 | 323,153 | GBP | 65,746 | ||||||||||||||||
PSG Konsult Ltd. | 1-Day SABOR - 0.875% | Monthly | MSCS | 5/20/25 | 2,384,886 | ZAR | (36,872) | ||||||||||||||||
Qintetiq Group PLC | 1-Day SONIA - 0.30% | Monthly | MSCO | 3/03/25 | 196,751 | GBP | (54,692) | ||||||||||||||||
Qt Group OYJ | Euro STR - 4.16% | Monthly | SEBA | 7/17/24 | 109,756 | EUR | (28,213) | ||||||||||||||||
Rathbones Group PLC | 1-Day SONIA - 0.30% | Monthly | MSCS | 8/30/24 | 104,957 | GBP | 11,524 | ||||||||||||||||
Ratos AB | 1-Week STIBOR - 0.28% | Monthly | SEBA | 7/17/24 | 2,195,450 | SEK | (35,632) | ||||||||||||||||
Reckitt Benckiser Group PLC | 1-Day SONIA - 0.30% | Monthly | MSCS | 7/17/24 | 207,828 | GBP | 53,784 | ||||||||||||||||
Redeia Corporacion SA | 1-Day EONIA - 0.35% | Monthly | MSCS | 8/05/24 | 120,314 | EUR | (13,722) | ||||||||||||||||
Reinet Investments S.C.A | 1-Day SABOR - 0.50% | Monthly | MSCS | 5/20/25 | 4,060,152 | ZAR | (28,717) | ||||||||||||||||
Remgro Ltd. | 1-Day SABOR - 0.50% | Monthly | MSCO | 10/16/24 | 7,207,225 | ZAR | 2,269 | ||||||||||||||||
Remy Cointreau | 1-Day EONIA - 0.30% | Monthly | MSCS | 12/11/24 | 591,089 | EUR | 173,061 | ||||||||||||||||
Renishaw PLC | 1-Day SONIA - 0.30% | Monthly | MSCS | 2/13/25 | 227,165 | GBP | (34,062) | ||||||||||||||||
Rentokil Initial PLC | 1-Day FEDEF - 0.65% | Monthly | MSCS | 11/27/24 | 408,549 | GBP | 97,087 | ||||||||||||||||
Rentokil Initial PLC | 1-Day SONIA - 0.30% | Monthly | MSCO | 1/08/25 | 26,316 | GBP | (179) | ||||||||||||||||
Reply SpA | Euro STR - 0.30% | Monthly | JPHQ | 7/18/24 | 180,788 | EUR | (60,506) | ||||||||||||||||
Resilient REIT Ltd. | 1-Day SABOR - 0.50% | Monthly | MSCO | 3/14/25 | 5,967,963 | ZAR | 15,416 | ||||||||||||||||
Revenio Group Corp. | Euro STR - 0.28% | Monthly | SEBA | 7/17/24 | 116,050 | EUR | (11,560) | ||||||||||||||||
Ringkjoebing Landbobank A/S | 1-Week CIBOR - 0.28% | Monthly | SEBA | 7/17/24 | 2,473,449 | DKK | (86,409) | ||||||||||||||||
Rotork PLC | 1-Day SONIA - 0.30% | Monthly | MSCS | 7/17/24 | 224,259 | GBP | (10,054) | ||||||||||||||||
Royal Unibrew | 1-Week CIBOR - 0.28% | Monthly | SEBA | 11/27/24 | 2,995,946 | DKK | (54,783) | ||||||||||||||||
RS Group PLC | 1-Day SONIA - 0.30% | Monthly | MSCS | 9/20/24 | 330,256 | GBP | 17,729 | ||||||||||||||||
RTL Group | Euro STR - 0.30% | Monthly | JPHQ | 1/30/25 | 556,819 | EUR | 102,504 | ||||||||||||||||
RWE AG | Euro STR - 0.30% | Monthly | JPHQ | 5/15/25 | 338,597 | EUR | 335 | ||||||||||||||||
S4 Capital PLC | 1-Day SONIA - 0.30% | Monthly | MSCS | 8/24/24 | 109,852 | GBP | (1,721) | ||||||||||||||||
Sacyr SA | 1-Day EONIA - 0.35% | Monthly | MSCS | 7/17/24 | 421,299 | EUR | (126,491) | ||||||||||||||||
66 | Annual Report | franklintempleton.com | ||||
Underlying Instrument | Financing Rate | Payment Frequency | Counterparty | Maturity Date | Notional Value* | Value/Unrealized Appreciation (Depreciation) | |||||||||||||||||
OTC Swap Contracts (continued) | |||||||||||||||||||||||
Equity Contracts - Shortd (continued) | |||||||||||||||||||||||
Saes Getters | Euro STR - 1.95% | Monthly | JPHQ | 10/11/24 | 269,850 | EUR | $64,235 | ||||||||||||||||
Safestore Holdings PLC | 1-Day SONIA - 0.30% | Monthly | MSCS | 10/21/24 | 341,191 | GBP | (96,568) | ||||||||||||||||
Saga PLC | 1-Day SONIA - 0.30% | Monthly | MSCS | 7/17/24 | 172,249 | GBP | (5,940) | ||||||||||||||||
Sagax AB | 1-Week STIBOR - 0.275% | Monthly | SEBA | 12/06/24 | 2,798,381 | SEK | (21,437) | ||||||||||||||||
Saipem SpA | 1-Month EURIBOR - 6.65% | Monthly | JPHQ | 2/26/25 | 198,588 | EUR | (100,958) | ||||||||||||||||
Salmon Evolution ASA | 1-Week NIBOR - 8.50% | Monthly | SEBA | 7/12/24 | 1,831,529 | NOK | (8,297) | ||||||||||||||||
Salvatore Ferragamo SpA | Euro STR - 0.30% | Monthly | JPHQ | 7/17/24 | 418,285 | EUR | 121,474 | ||||||||||||||||
Sampo PLC | Euro STR - 0.275% | Monthly | SEBA | 7/17/24 | 220,448 | EUR | 12,629 | ||||||||||||||||
Sanlam Ltd. | 1-Day SABOR - 0.50% | Monthly | MSCS | 7/17/24 | 2,691,333 | ZAR | (10,338) | ||||||||||||||||
Santander Bank Polska SA | 1-Day FEDEF - 0.50% | Monthly | MSCS | 7/17/24 | 83,154 | (49,465) | |||||||||||||||||
Sartorius AG | Euro STR - 3.55% | Monthly | JPHQ | 11/28/24 | 164,943 | EUR | 42,096 | ||||||||||||||||
Sartorius Stedim Biotech | 1-Day EONIA - 0.30% | Monthly | MSCS | 6/21/24 | 128,902 | EUR | 29,680 | ||||||||||||||||
SBM Offshore NV | Euro STR - 0.30% | Monthly | JPHQ | 7/17/24 | 527,426 | EUR | (66,484) | ||||||||||||||||
Schibsted ASA | 1-Week NIBOR - 0.28% | Monthly | SEBA | 7/17/24 | 3,021,875 | NOK | (96,451) | ||||||||||||||||
Schoeller-Bleckmann Oilfield Equipment AG | Euro STR - 0.30% | Monthly | JPHQ | 7/13/24 | 231,615 | EUR | 53,946 | ||||||||||||||||
Schroders PLC | 1-Day SONIA - 0.30% | Monthly | MSCO | 2/20/25 | 211,908 | GBP | 1,102 | ||||||||||||||||
Sdiptech AB | 1-Week STIBOR - 1.00% | Monthly | SEBA | 7/17/24 | 2,405,117 | SEK | (78,635) | ||||||||||||||||
Seadrill Ltd. | 1-Week NIBOR - 0.275% | Monthly | SEBA | 5/08/25 | 1,038,688 | NOK | 4,068 | ||||||||||||||||
Sectra AB | 1-Week STIBOR - 0.275% | Monthly | SEBA | 3/27/25 | 2,230,746 | SEK | (35,657) | ||||||||||||||||
secunet Security Networks AG | Euro STR - 0.30% | Monthly | JPHQ | 7/17/24 | 99,263 | EUR | (3,747) | ||||||||||||||||
Sedana Medical AB | 1-Week STIBOR - 0.275% | Monthly | SEBA | 11/14/24 | 689,912 | SEK | (22,446) | ||||||||||||||||
Seeing Machines Ltd. | 1-Day SONIA - 5.75% | Monthly | MSCS | 8/05/24 | 50,757 | GBP | 8,324 | ||||||||||||||||
Segro PLC | 1-Day SONIA - 0.30% | Monthly | MSCS | 7/17/24 | 182,004 | GBP | (44,897) | ||||||||||||||||
Senior PLC | 1-Day SONIA - 0.30% | Monthly | MSCO | 3/20/25 | 31,952 | GBP | 3,460 | ||||||||||||||||
Sensirion AG | 1-Day SARON - 0.35% | Monthly | JPHQ | 4/22/25 | 383,346 | CHF | 27,270 | ||||||||||||||||
Severn Trent PLC | 1-Day SONIA - 0.30% | Monthly | MSCS | 11/27/24 | 303,322 | GBP | 15,056 | ||||||||||||||||
Severn Trent PLC | 1-Day SONIA - 0.30% | Monthly | MSCO | 1/08/25 | 14,199 | GBP | 817 | ||||||||||||||||
Shaftesbury Capital PLC | 1-Day SONIA - 0.30% | Monthly | MSCS | 9/26/24 | 297,058 | GBP | (80,193) | ||||||||||||||||
Shop Apotheke Europe NV | Euro STR - 0.85% | Monthly | JPHQ | 7/17/24 | 137,631 | EUR | (2,796) | ||||||||||||||||
Shurgard | Euro STR - 0.30% | Monthly | JPHQ | 4/14/25 | 47,599 | EUR | (600) | ||||||||||||||||
Siemens Healthineers AG | Euro STR - 0.30% | Monthly | JPHQ | 8/21/24 | 152,388 | EUR | (8,980) | ||||||||||||||||
SIG Group AG | Euro STR - 0.35% | Monthly | JPHQ | 7/17/24 | 213,771 | CHF | 28,818 | ||||||||||||||||
Sika | 1-Day SARON - 0.35% | Monthly | JPHQ | 11/08/24 | 264,817 | CHF | (43,903) | ||||||||||||||||
Siltronic AG | Euro STR - 1.05% | Monthly | JPHQ | 5/13/25 | 299,427 | EUR | 21,700 | ||||||||||||||||
Sixt SE | Euro STR - 0.30% | Monthly | JPHQ | 4/17/25 | 614,618 | EUR | 161,600 | ||||||||||||||||
Skanska AB | 1-Week STIBOR - 0.28% | Monthly | SEBA | 8/07/24 | 770,822 | SEK | 2,520 | ||||||||||||||||
Softcat PLC | 1-Day SONIA - 0.30% | Monthly | MSCO | 3/28/25 | 115,156 | GBP | (6,005) | ||||||||||||||||
SoftwareONE | Euro STR - 0.35% | Monthly | JPHQ | 7/15/24 | 125,696 | CHF | (9,511) | ||||||||||||||||
Soitec SA | 1-Day EONIA - 0.30% | Monthly | MSCS | 8/12/24 | 68,710 | EUR | (5,794) | ||||||||||||||||
Solaria Energia y Medio Ambiente SA | 1-Day EONIA - 0.35% | Monthly | MSCS | 7/17/24 | 105,288 | EUR | 21,454 | ||||||||||||||||
SolGold PLC | 1-Day SONIA - 0.56% | Monthly | MSCS | 7/17/24 | 111,744 | GBP | 41,285 | ||||||||||||||||
Soltec Power Holdings SA | 1-Day EONIA - 0.73% | Monthly | MSCS | 7/17/24 | 48,613 | EUR | 9,066 | ||||||||||||||||
South32 Ltd. | 1-Day SABOR - 2.125% | Monthly | MSCS | 10/10/24 | 4,447,623 | ZAR | (56,038) | ||||||||||||||||
SpareBank 1 SMN | 1-Week NIBOR - 1.50% | Monthly | SEBA | 10/23/24 | 4,580,038 | NOK | (71,220) | ||||||||||||||||
franklintempleton.com | Annual Report | 67 | ||||
Underlying Instrument | Financing Rate | Payment Frequency | Counterparty | Maturity Date | Notional Value* | Value/Unrealized Appreciation (Depreciation) | |||||||||||||||||
OTC Swap Contracts (continued) | |||||||||||||||||||||||
Equity Contracts - Shortd (continued) | |||||||||||||||||||||||
Sparebank 1 Oestlandet | 1-Week NIBOR - 0.28% | Monthly | SEBA | 12/23/24 | 1,015,965 | NOK | $(5,308) | ||||||||||||||||
SpareBank 1 SR Bank ASA | 1-Week NIBOR - 0.28% | Monthly | SEBA | 7/22/24 | 1,933,758 | NOK | (9,692) | ||||||||||||||||
Spirax-Sarco Engineering PLC | 1-Day SONIA - 0.30% | Monthly | MSCS | 11/27/24 | 442,232 | GBP | 40,495 | ||||||||||||||||
St Galler Kantonalbank AG | 1-Day SARON - 0.35% | Monthly | JPHQ | 11/06/24 | 222,920 | CHF | 14,347 | ||||||||||||||||
St James’s Place PLC | 1-Day SONIA - 0.30% | Monthly | MSCO | 5/06/25 | 112,825 | GBP | (6,320) | ||||||||||||||||
Steico SE | Euro STR - 0.95% | Monthly | JPHQ | 2/10/25 | 58,858 | EUR | 8,731 | ||||||||||||||||
Stora Enso OYJ | Euro STR - 0.28% | Monthly | SEBA | 8/05/24 | 344,654 | EUR | (43,184) | ||||||||||||||||
Storskogen Group AB | 1-Week STIBOR - 0.75% | Monthly | SEBA | 7/17/24 | 1,512,972 | SEK | (19,239) | ||||||||||||||||
STOXX Europe 600 Utilities Index | 1-Day EONIA - 0.45% | Monthly | MSCS | 9/13/24 | 3,546,397 | EUR | 186,443 | ||||||||||||||||
STOXX Europe 600 Utilities Index | 1-Day EONIA - 0.45% | Monthly | MSCS | 3/25/25 | 2,227,378 | EUR | 34,455 | ||||||||||||||||
STRATEC SE | Euro STR - 0.35% | Monthly | JPHQ | 4/21/25 | 160,849 | EUR | 6,975 | ||||||||||||||||
Straumann Group | 1-Day SARON - 0.35% | Monthly | JPHQ | 10/18/24 | 47,014 | CHF | 7,799 | ||||||||||||||||
Straumann Group | 1-Day SARON - 0.35% | Monthly | JPHQ | 1/09/25 | 57,131 | CHF | 6,004 | ||||||||||||||||
Strix Group PLC | 1-Day SONIA - 2.00% | Monthly | MSCS | 7/17/24 | 23,318 | GBP | (5,125) | ||||||||||||||||
Sudzucker AG | Euro STR - 0.30% | Monthly | JPHQ | 8/19/24 | 159,815 | EUR | (6,356) | ||||||||||||||||
Super Group Ltd. | 1-Day SABOR - 0.50% | Monthly | MSCS | 7/19/24 | 1,764,899 | ZAR | 435 | ||||||||||||||||
Supermarket Income REIT | 1-Day SONIA - 0.28% | Monthly | MSCS | 9/16/24 | 85,020 | GBP | 2,853 | ||||||||||||||||
Svenska Cellulosa AB | 1-Week STIBOR - 0.28% | Monthly | SEBA | 7/17/24 | 5,359,343 | SEK | (66,452) | ||||||||||||||||
Svenska Handelsbanken | 1-Week STIBOR - 0.275% | Monthly | SEBA | 5/08/25 | 2,386,427 | SEK | (3,033) | ||||||||||||||||
Sweco AB | 1-Week STIBOR - 0.275% | Monthly | SEBA | 3/20/25 | 3,977,713 | SEK | (84,064) | ||||||||||||||||
Swisscom AG | 1-Day SARON - 0.35% | Monthly | JPHQ | 2/03/25 | 120,197 | CHF | 5,717 | ||||||||||||||||
Sword Group SE | 1-Day EONIA - 4.00% | Monthly | MSCS | 7/17/24 | 6,845 | EUR | (215) | ||||||||||||||||
Symrise AG | Euro STR - 0.30% | Monthly | JPHQ | 9/27/24 | 282,840 | EUR | (42,414) | ||||||||||||||||
Talenom OYJ | Euro STR - 2.50% | Monthly | SEBA | 7/17/24 | 15,270 | EUR | 6,140 | ||||||||||||||||
Talgo SA | 1-Day EONIA - 0.35% | Monthly | MSCS | 7/17/24 | 224,891 | EUR | (80,615) | ||||||||||||||||
Tamburi | Euro STR - 0.30% | Monthly | JPHQ | 7/17/24 | 296,765 | EUR | (31,179) | ||||||||||||||||
Tate & Lyle PLC | 1-Day SONIA - 0.30% | Monthly | MSCS | 7/17/24 | 293,034 | GBP | (9,938) | ||||||||||||||||
Technoprobe | Euro STR - 0.30% | Monthly | JPHQ | 10/16/24 | 414,477 | EUR | (95,335) | ||||||||||||||||
Telecom Italia SpA | Euro STR - 0.75% | Monthly | JPHQ | 7/14/24 | 422,704 | EUR | 32,016 | ||||||||||||||||
Teleperformance | 1-Day EONIA - 0.30% | Monthly | MSCO | 3/27/25 | 32,690 | EUR | (5,487) | ||||||||||||||||
Telia Company AB | 1-Week STIBOR - 0.275% | Monthly | SEBA | 5/06/25 | 2,717,699 | SEK | (14,437) | ||||||||||||||||
Tessenderlo Group | Euro STR - 0.30% | Monthly | JPHQ | 10/10/24 | 149,757 | EUR | (9,830) | ||||||||||||||||
TGS ASA | 1-Week NIBOR - 1.50% | Monthly | SEBA | 4/16/25 | 1,190,780 | NOK | (3,121) | ||||||||||||||||
Thermador Groupe SA | 1-Day EONIA - 2.25% | Monthly | MSCS | 8/16/24 | 38,850 | EUR | (4,538) | ||||||||||||||||
ThyssenKrupp Nucera AG | Euro STR - 0.34% | Monthly | JPHQ | 3/28/25 | 230,771 | EUR | 18,187 | ||||||||||||||||
Tietoevry Corp. | Euro STR - 0.275% | Monthly | SEBA | 11/29/24 | 357,319 | EUR | 30,261 | ||||||||||||||||
Tikehau Capital SCA | 1-Day EONIA - 4.00% | Monthly | MSCS | 7/17/24 | 94,348 | EUR | (2,652) | ||||||||||||||||
Tinexta SpA | Euro STR - 0.30% | Monthly | JPHQ | 7/17/24 | 308,741 | EUR | 3,143 | ||||||||||||||||
Tomra Systems ASA | 1-Week NIBOR - 0.28% | Monthly | SEBA | 1/08/25 | 1,741,022 | NOK | (13,574) | ||||||||||||||||
Topdanmark A/S | 1-Week CIBOR - 0.28% | Monthly | SEBA | 7/26/24 | 3,231,414 | DKK | 34,898 | ||||||||||||||||
Tracsis PLC | 1-Day SONIA - 9.00% | Monthly | MSCO | 3/06/25 | 11,090 | GBP | (376) | ||||||||||||||||
Trainline PLC | 1-Day SONIA - 0.30% | Monthly | MSCS | 8/21/24 | 148,862 | GBP | (10,457) | ||||||||||||||||
Transaction Capital Ltd. | 1-Day SABOR - 0.50% | Monthly | MSCS | 7/17/24 | 786,913 | ZAR | 20,183 | ||||||||||||||||
Tritax EuroBox PLC | 1-Day SONIA - 0.30% | Monthly | MSCS | 7/17/24 | 78,470 | GBP | (4,129) | ||||||||||||||||
Troax Group AB | 1-Week STIBOR - 0.28% | Monthly | SEBA | 8/02/24 | 1,079,538 | SEK | (9,184) | ||||||||||||||||
Tryg A/S | 1-Week CIBOR - 0.28% | Monthly | SEBA | 7/13/24 | 2,662,692 | DKK | 3,400 | ||||||||||||||||
68 | Annual Report | franklintempleton.com | ||||
Underlying Instrument | Financing Rate | Payment Frequency | Counterparty | Maturity Date | Notional Value* | Value/Unrealized Appreciation (Depreciation) | |||||||||||||||||
OTC Swap Contracts (continued) | |||||||||||||||||||||||
Equity Contracts - Shortd (continued) | |||||||||||||||||||||||
Ubisoft Entertainment SA | 1-Day EONIA - 0.30% | Monthly | MSCS | 7/17/24 | 286,814 | EUR | $12,823 | ||||||||||||||||
Umicore NV | Euro STR - 0.30% | Monthly | JPHQ | 8/05/24 | 373,723 | EUR | 48,864 | ||||||||||||||||
Unilever | 1-Day SONIA - 0.30% | Monthly | MSCS | 10/16/24 | 205,630 | GBP | (28,182) | ||||||||||||||||
UNIQA Insurance Group AG | Euro STR - 0.30% | Monthly | JPHQ | 3/18/25 | 202,313 | EUR | (7,201) | ||||||||||||||||
Unite Group PLC (The) | 1-Day SONIA - 0.30% | Monthly | MSCS | 7/05/24 | 287,699 | GBP | (2,485) | ||||||||||||||||
United Internet AG | Euro STR - 0.30% | Monthly | JPHQ | 3/20/25 | 360,825 | EUR | (10,616) | ||||||||||||||||
United Utilities | 1-Day SONIA - 0.30% | Monthly | MSCS | 11/27/24 | 92,628 | GBP | 4,040 | ||||||||||||||||
Urban Logistics REIT PLC | 1-Day SONIA - 0.30% | Monthly | MSCS | 7/17/24 | 323,708 | GBP | 12,478 | ||||||||||||||||
Utilities Select Sector | 1-Day FEDEF - 0.30% | Monthly | MSCS | 3/24/25 | 4,731,930 | (12,396) | |||||||||||||||||
Valmet OYJ | Euro STR - 0.28% | Monthly | SEBA | 11/22/24 | 164,690 | EUR | 5,211 | ||||||||||||||||
Valneva SE | 1-Day EONIA - 4.50% | Monthly | MSCS | 5/16/25 | 137,377 | EUR | 13,300 | ||||||||||||||||
VAT Group AG | 1-Day SARON - 0.35% | Monthly | JPHQ | 4/22/25 | 250,357 | CHF | (105,810) | ||||||||||||||||
VERBIO Vereinigte BioEnergie AG | Euro STR - 1.00% | Monthly | JPHQ | 7/01/24 | 337,727 | EUR | 45,855 | ||||||||||||||||
Vestas Wind Systems A/S | 1-Week CIBOR - 0.28% | Monthly | SEBA | 7/12/24 | 2,209,835 | DKK | (20,132) | ||||||||||||||||
Vestel | 1-Day FEDEF - 7.63% | Monthly | MSCS | 9/09/24 | 88,881 | (36,666) | |||||||||||||||||
Victrex PLC | 1-Day SONIA - 0.30% | Monthly | MSCS | 7/17/24 | 402,275 | GBP | 48,156 | ||||||||||||||||
Vidrala SA | 1-Day EONIA - 0.35% | Monthly | MSCS | 9/30/24 | 146,478 | EUR | (40,389) | ||||||||||||||||
Viscofan SA | 1-Day EONIA - 0.35% | Monthly | MSCS | 8/05/24 | 319,559 | EUR | (15,482) | ||||||||||||||||
Vitec Software Group AB | 1-Week STIBOR - 0.275% | Monthly | SEBA | 5/22/25 | 2,747,253 | SEK | 1,946 | ||||||||||||||||
VNV Global AB | 1-Week STIBOR - 0.275% | Monthly | SEBA | 2/17/25 | 142,589 | SEK | (3,032) | ||||||||||||||||
Voltalia SA | 1-Day EONIA - 0.30% | Monthly | MSCS | 7/17/24 | 140,383 | EUR | 8,670 | ||||||||||||||||
Volue ASA | 1-Week NIBOR - 0.75% | Monthly | SEBA | 4/15/25 | 445,415 | NOK | (11,386) | ||||||||||||||||
Vopak | Euro STR - 0.30% | Monthly | JPHQ | 7/17/24 | 104,683 | EUR | (2,137) | ||||||||||||||||
Wacker Chemie AG | Euro STR - 0.30% | Monthly | JPHQ | 3/20/25 | 296,226 | EUR | 17,458 | ||||||||||||||||
Wacker Neuson SE | Euro STR - 0.30% | Monthly | JPHQ | 4/01/25 | 122,054 | EUR | 5,386 | ||||||||||||||||
Waga Energy SA | 1-Day EONIA - 0.75% | Monthly | MSCS | 7/17/24 | 35,615 | EUR | 14,151 | ||||||||||||||||
Wallenstam AB Series B | 1-Week STIBOR - 0.275% | Monthly | SEBA | 7/17/24 | 2,612,083 | SEK | (54,003) | ||||||||||||||||
Warteck | 1-Day SARON - 6.50% | Monthly | JPHQ | 2/03/25 | 16,543 | CHF | 38 | ||||||||||||||||
WeBuyCars Pty Ltd. | 1-Day SABOR - 2.75% | Monthly | MSCO | 7/17/24 | 31,103 | ZAR | (39,556) | ||||||||||||||||
Wendel Group | 1-Day EONIA - 0.30% | Monthly | MSCS | 5/27/25 | 468,931 | EUR | (31,346) | ||||||||||||||||
Whitbread PLC | 1-Day SONIA - 0.30% | Monthly | MSCS | 4/14/25 | 94,126 | GBP | 9,104 | ||||||||||||||||
WithSecure Corp. | 1-Week Euro STR - 0.275% | Monthly | SEBA | 4/22/25 | 75,517 | EUR | 12,332 | ||||||||||||||||
Wizz Air Holdings PLC | 1-Day SONIA - 0.30% | Monthly | MSCS | 12/19/24 | 288,310 | GBP | (47,770) | ||||||||||||||||
WPP PLC | 1-Day SONIA - 0.30% | Monthly | MSCS | 9/30/24 | 178,045 | GBP | (26,535) | ||||||||||||||||
Xvivo Perfusion AB | 1-Week STIBOR - 0.28% | Monthly | SEBA | 7/17/24 | 731,183 | SEK | (39,965) | ||||||||||||||||
YIT Corp. | Euro STR - 0.275% | Monthly | SEBA | 11/08/24 | 154,947 | EUR | (51,768) | ||||||||||||||||
YouGov ORD | 1-Day SONIA - 0.30% | Monthly | MSCO | 5/08/25 | 124,588 | GBP | (9,571) | ||||||||||||||||
Yubico AB | 1-Week STIBOR - 1.25% | Monthly | SEBA | 4/03/25 | 1,182,145 | SEK | (35,109) | ||||||||||||||||
Zealand Pharma A/S | 1-Week CIBOR - 0.45% | Monthly | SEBA | 7/17/25 | 744,342 | DKK | (2,289) | ||||||||||||||||
Zignago Vetro SpA | Euro STR - 0.30% | Monthly | JPHQ | 7/17/24 | 149,287 | EUR | (3,262) | ||||||||||||||||
Zur Rose Group AG | 1-Day SARON - 2.10% | Monthly | JPHQ | 7/17/24 | 228,955 | CHF | (87,628) | ||||||||||||||||
(6,953,535) | |||||||||||||||||||||||
Total - Total Return Swap Contracts | $7,376,074 | ||||||||||||||||||||||
franklintempleton.com | Annual Report | 69 | ||||
70 | Annual Report | franklintempleton.com | ||||
Assets: | |||||
Investments in securities: | |||||
Cost – Unaffiliated issuers | $529,853,625 | ||||
Cost – Non-controlled affiliates (Note 3f) | 882,000 | ||||
Value – Unaffiliated issuers† | $557,942,010 | ||||
Value – Non-controlled affiliates (Note 3f) | 882,000 | ||||
Cash | 145,512 | ||||
Foreign currency, at value (cost $16,422,200) | 16,452,011 | ||||
Receivables: | |||||
Investment securities sold | 14,409,444 | ||||
Capital shares sold | 868,556 | ||||
Dividends and interest | 2,895,307 | ||||
Deposits with brokers for: | |||||
Securities sold short | 95,853,076 | ||||
OTC derivative contracts | 45,326,513 | ||||
Futures contracts | 15,740,992 | ||||
Centrally cleared swap contracts | 4,309,860 | ||||
Due from brokers | 228,442 | ||||
Variation margin on centrally cleared swap contracts | 100,704 | ||||
OTC swap contracts (upfront payments $907,067) | 534,541 | ||||
Unrealized appreciation on OTC forward exchange contracts | 2,227,550 | ||||
Unrealized appreciation on OTC swap contracts | 23,979,248 | ||||
Other assets | 3,271 | ||||
Total assets | 781,899,037 | ||||
Liabilities: | |||||
Payables: | |||||
Investment securities purchased | 5,471,673 | ||||
Capital shares redeemed | 318,332 | ||||
Management fees | 810,573 | ||||
Distribution fees | 20,385 | ||||
Trustees’ fees and expenses | 8,707 | ||||
Transfer agent fees | 208,832 | ||||
Due to brokers | 14,257,263 | ||||
Variation margin on futures contracts | 532,365 | ||||
OTC swap contracts (upfront receipts $672,426) | 658,440 | ||||
Options written, at value (premiums received $166,953) | 653,981 | ||||
Securities sold short, at value (proceeds $108,064,738) | 105,141,373 | ||||
Payable upon return of securities loaned (Note 1f) | 882,000 | ||||
Unrealized depreciation on OTC forward exchange contracts | 868,001 | ||||
Unrealized depreciation on OTC swap contracts | 16,849,174 | ||||
Unrealized depreciation on unfunded loan commitments (Note 10) | 35,553 | ||||
Accrued expenses and other liabilities | 512,442 | ||||
Total liabilities | 147,229,094 | ||||
Net assets, at value | $634,669,943 | ||||
Net assets consist of: | |||||
Paid-in capital | $608,096,555 | ||||
Total distributable earnings (loss) | 26,573,388 | ||||
Net assets, at value | $634,669,943 | ||||
†Includes securities loaned | $2,504,609 | ||||
franklintempleton.com | The accompanying notes are an integral part of these consolidated financial statements. | Annual Report | 71 | ||||
Class A: | |||||
Net assets, at value | $63,319,597 | ||||
Shares outstanding | 5,425,258 | ||||
Net asset value per sharea,b | $11.67 | ||||
Maximum offering price per share (net asset value per share ÷ 94.50%)a | $12.35 | ||||
Class C: | |||||
Net assets, at value | $7,957,041 | ||||
Shares outstanding | 706,135 | ||||
Net asset value and maximum offering price per sharea,b | $11.27 | ||||
Class R: | |||||
Net assets, at value | $347,786 | ||||
Shares outstanding | 29,657 | ||||
Net asset value and maximum offering price per sharea | $11.73 | ||||
Class R6: | |||||
Net assets, at value | $124,279,030 | ||||
Shares outstanding | 10,560,828 | ||||
Net asset value and maximum offering price per sharea | $11.77 | ||||
Advisor Class: | |||||
Net assets, at value | $438,766,489 | ||||
Shares outstanding | 37,325,094 | ||||
Net asset value and maximum offering price per sharea | $11.76 | ||||
72 | Annual Report | The accompanying notes are an integral part of these consolidated financial statements. | franklintempleton.com | ||||
Investment income: | |||||
Dividends: (net of foreign taxes)* | |||||
Unaffiliated issuers | $13,541,238 | ||||
Interest: (net of foreign taxes)~ | |||||
Unaffiliated issuers | 20,795,361 | ||||
Income from securities loaned: | |||||
Unaffiliated entities (net of fees and rebates) | (28,360) | ||||
Non-controlled affiliates (Note 3f) | 71,975 | ||||
Total investment income | 34,380,214 | ||||
Expenses: | |||||
Management fees (Note 3a) | 13,308,902 | ||||
Distribution fees: (Note 3c) | |||||
Class A | 170,084 | ||||
Class C | 112,951 | ||||
Class R | 1,631 | ||||
Transfer agent fees: (Note 3e) | |||||
Class A | 62,985 | ||||
Class C | 11,432 | ||||
Class R | 284 | ||||
Class R6 | 12,264 | ||||
Advisor Class | 569,868 | ||||
Custodian fees (Note 4) . | 321,632 | ||||
Reports to shareholders fees | 60,424 | ||||
Registration and filing fees | 112,620 | ||||
Professional fees | 591,763 | ||||
Trustees’ fees and expenses | 326,777 | ||||
Dividends on securities sold short | 1,446,285 | ||||
Interest on securities sold short | 1,898,427 | ||||
Other | 142,935 | ||||
Total expenses | 19,151,264 | ||||
Expense reductions (Note 4) | (322,500) | ||||
Expenses waived/paid by affiliates (Note 3f and 3g) | (1,877,142) | ||||
Net expenses | 16,951,622 | ||||
Net investment income | 17,428,592 | ||||
Realized and unrealized gains (losses): | |||||
Net realized gain (loss) from: | |||||
Investments: | |||||
Unaffiliated issuers | 36,463,944 | ||||
Written options | 1,155,633 | ||||
Foreign currency transactions | 373,626 | ||||
Forward exchange contracts | (5,152,376) | ||||
Futures contracts | 1,308,768 | ||||
Securities sold short | 881,027 | ||||
Swap contracts | (324,844) | ||||
Net realized gain (loss) | 34,705,778 | ||||
Net change in unrealized appreciation (depreciation) on: | |||||
Investments: | |||||
Unaffiliated issuers | 12,915,793 | ||||
Written options | (729,288) | ||||
Translation of other assets and liabilities denominated in foreign currencies | (33,923) | ||||
Forward exchange contracts | 2,994,307 | ||||
Futures contracts | (819,287) | ||||
Securities sold short | (11,798,506) | ||||
Swap contracts | 9,912,497 | ||||
Net change in unrealized appreciation (depreciation) | 12,441,593 | ||||
Net realized and unrealized gain (loss) | 47,147,371 | ||||
Net increase (decrease) in net assets resulting from operations | $64,575,963 | ||||
*Foreign taxes withheld on dividends | $27,214 | ||||
~Foreign taxes withheld on interest | $21,291 | ||||
franklintempleton.com | The accompanying notes are an integral part of these consolidated financial statements. | Annual Report | 73 | ||||
Year Ended May 31, | ||||||||
2024 | 2023 | |||||||
Increase (decrease) in net assets: | ||||||||
Operations: | ||||||||
Net investment income | $17,428,592 | $15,741,185 | ||||||
Net realized gain (loss) | 34,705,778 | (11,553,755) | ||||||
Net change in unrealized appreciation (depreciation) | 12,441,593 | (20,733,832) | ||||||
Net increase (decrease) in net assets resulting from operations | 64,575,963 | (16,546,402) | ||||||
Distributions to shareholders: | ||||||||
Class A | (293,245) | (2,298,782) | ||||||
Class C | — | (366,579) | ||||||
Class R | (477) | (6,760) | ||||||
Class R6 | (452,983) | (1,623,691) | ||||||
Advisor Class | (3,755,928) | (25,006,493) | ||||||
Total distributions to shareholders | (4,502,633) | (29,302,305) | ||||||
Capital share transactions: (Note 2) | ||||||||
Class A | (19,014,149) | (14,390,545) | ||||||
Class C | (8,605,211) | (7,897,223) | ||||||
Class R | (32,623) | (443,340) | ||||||
Class R6 | 73,646,565 | (1,408,481) | ||||||
Advisor Class | (319,099,003) | (349,425,448) | ||||||
Total capital share transactions | (273,104,421) | (373,565,037) | ||||||
Net increase (decrease) in net assets | (213,031,091) | (419,413,744) | ||||||
Net assets: | ||||||||
Beginning of year | 847,701,034 | 1,267,114,778 | ||||||
End of year | $634,669,943 | $847,701,034 | ||||||
74 | Annual Report | The accompanying notes are an integral part of these consolidated financial statements. | franklintempleton.com | ||||
franklintempleton.com | Annual Report | 75 | ||||
76 | Annual Report | franklintempleton.com | ||||
franklintempleton.com | Annual Report | 77 | ||||
78 | Annual Report | franklintempleton.com | ||||
franklintempleton.com | Annual Report | 79 | ||||
Year Ended May 31, | ||||||||||||||
2024 | 2023 | |||||||||||||
Shares | Amount | Shares | Amount | |||||||||||
Class A Shares: | ||||||||||||||
Shares solda | 901,608 | $9,940,863 | 1,184,496 | $12,884,556 | ||||||||||
Shares issued in reinvestment of distributions | 24,442 | 267,146 | 197,144 | 2,107,467 | ||||||||||
Shares redeemed | (2,655,907) | (29,222,158) | (2,702,826) | (29,382,568) | ||||||||||
Net increase (decrease) | (1,729,857) | $(19,014,149) | (1,321,186) | $(14,390,545) | ||||||||||
Class C Shares: | ||||||||||||||
Shares sold | 31,350 | $335,902 | 112,939 | $1,186,468 | ||||||||||
Shares issued in reinvestment of distributions | — | — | 30,061 | 312,336 | ||||||||||
Shares redeemeda | (843,526) | (8,941,113) | (892,790) | (9,396,027) | ||||||||||
Net increase (decrease) | (812,176) | $(8,605,211) | (749,790) | $(7,897,223) | ||||||||||
Class R Shares: | ||||||||||||||
Shares sold | 5,288 | $59,744 | 5,131 | $55,176 | ||||||||||
Shares issued in reinvestment of distributions | 44 | 477 | 629 | 6,760 | ||||||||||
Shares redeemed | (8,352) | (92,844) | (45,962) | (505,276) | ||||||||||
Net increase (decrease) | (3,020) | $(32,623) | (40,202) | $(443,340) | ||||||||||
Class R6 Shares: | ||||||||||||||
Shares sold | 9,340,788 | $105,720,673 | 1,973,905 | $21,789,501 | ||||||||||
Shares issued in reinvestment of distributions | 36,852 | 405,743 | 127,748 | 1,375,848 | ||||||||||
Shares redeemed | (2,916,319) | (32,479,851) | (2,249,882) | (24,573,830) | ||||||||||
Net increase (decrease) | 6,461,321 | $73,646,565 | (148,229) | $(1,408,481) | ||||||||||
Advisor Class Shares: | ||||||||||||||
Shares sold | 5,211,753 | $57,591,690 | 13,145,615 | $144,459,116 | ||||||||||
Shares issued in reinvestment of distributions | 240,415 | 2,644,566 | 1,667,367 | 17,940,869 | ||||||||||
Shares redeemed | (34,178,446) | (379,335,259) | (46,582,302) | (511,825,433) | ||||||||||
Net increase (decrease) | (28,726,278) | $(319,099,003) | (31,769,320) | $(349,425,448) | ||||||||||
Subsidiary | Affiliation | ||||
K2/D&S Management Co., L.L.C. (K2 Advisors) | Investment manager | ||||
Franklin Templeton Services, LLC (FT Services) | Administrative manager | ||||
Franklin Distributors, LLC (Distributors) | Principal underwriter | ||||
Franklin Templeton Investor Services, LLC (Investor Services) | Transfer agent | ||||
Annualized Fee Rate | Net Assets | ||||
1.70% | Up to and including $1 billion | ||||
1.65% | Over $1 billion, up to and including $1.5 billion | ||||
1.60% | Over $1.5 billion, up to and including $3 billion | ||||
1.55% | In excess of $3 billion | ||||
80 | Annual Report | franklintempleton.com | ||||
Annualized Fee Rate | Net Assets | ||||
1.90% | Up to and including $1 billion | ||||
1.85% | Over $1 billion, up to and including $1.5 billion | ||||
1.80% | Over $1.5 billion, up to and including $3 billion | ||||
1.75% | In excess of $3 billion | ||||
Subadvisors | ||
ActusRayPartners Limited | ||
Apollo Credit Management LLC | ||
Bardin Hill Arbitrage IC Management LP | ||
Capital Fund Management S.A. | ||
Electron Capital Partners, LLC | ||
Franklin Advisers, Inc. * | ||
Graham Capital Management, L.P. | ||
Jennison Associates, LLC | ||
Lazard Asset Management, LLC | ||
RBC Global Asset Management (UK) Limited (formerly, BlueBay Asset Management LLP) | ||
Class A | 0.30% | ||||
Class C | 1.00% | ||||
Class R | 0.50% | ||||
franklintempleton.com | Annual Report | 81 | ||||
Sales charges retained net of commissions paid to unaffiliated brokers/dealers | $1,755 | ||||
CDSC retained | $1,498 | ||||
Value at Beginning of Year | Purchases | Sales | Realized Gain (Loss) | Net Change in Unrealized Appreciation (Depreciation) | Value at End of Year | Number of Shares Held at End of Year | Income From Securities Loaned | |||||||||||||||||||
Non-Controlled Affiliates Institutional Fiduciary Trust Money Market Portfolio, 5.00% . | $3,348,000 | $27,035,000 | $(29,501,000) | $ — | $ — | $882,000 | 882,000 | $71,975 | ||||||||||||||||||
82 | Annual Report | franklintempleton.com | ||||
2024 | 2023 | |||||||
Distributions paid from: | ||||||||
Ordinary income. . . . . . . . . . . . . . . . . . | $4,502,633 | $ 21,007,267 | ||||||
Long term capital gain. . . . . . . . . . . . . . | — | 8,295,038 | ||||||
Total distributions paid. . . . . . . . . . . . . . . | $4,502,633 | $29,302,305 | ||||||
Cost of investments . . . . . . . . . . . . . . . . . . . . . . | $461,263,345 | ||||
Unrealized appreciation. . . . . . . . . . . . . . . . . . . . | $47,400,951 | ||||
Unrealized depreciation. . . . . . . . . . . . . . . . . . . . | (50,378,350) | ||||
Net unrealized appreciation (depreciation) . . . . . . . | $(2,977,399) | ||||
Distributable earnings | |||||
Undistributed ordinary income | $30,314,745 | ||||
Undistributed long term capital gain | — | ||||
Total distributable earnings | $30,314,745 | ||||
franklintempleton.com | Annual Report | 83 | ||||
Borrower | Unfunded Commitment | ||||
Altice USA Inc., Term Loan B | $119,689 | ||||
Bausch Health Cos. Inc., Term Loan B | 241,757 | ||||
CommScope Holding Company Inc., Initial Term Loan | 50,205 | ||||
CSC Holdings LLC, Term Loan B | 1,264,737 | ||||
Curia Global Inc., First Lien Term Loan | 215,284 | ||||
First Brands Group LLC, First Lien Term Loan | 111,347 | ||||
First Brands Group LLC, First Lien Term Loan | 357,843 | ||||
Forward Air Corp., Term Loan B | 575,336 | ||||
Hercules Achievement Inc., Initial Term Loan | 10,191 | ||||
H-Food Holdings LLC, Incremental Term Loan B-3 | 33,240 | ||||
H-Food Holdings LLC, Initial Term Loan | 135,464 | ||||
H-Food Holdings LLC, Initial Term Loan | 341,177 | ||||
H-Food Holdings LLC, Initial Term Loan | 740,827 | ||||
K. Hovnanian Enterprises Inc., Term Loan RC | 500,000 | ||||
Oldcastle BuildingEnvelope Inc., Term Loan RC | 247,158 | ||||
Peloton Interactive Inc., Initial Term Loan | 500,000 | ||||
Petco Health & Wellness Co. Inc., First Lien Term Loan | 29,453 | ||||
Radiate Holdco LLC, Amendment No. 6 New Term Loan | 396,000 | ||||
Steinhoff International Holdings NV, Facility B1 | 163,495 | ||||
Upfield Group BV, Term Loan RC | 341,246 | ||||
$6,374,450 | |||||
84 | Annual Report | franklintempleton.com | ||||
Derivative Contracts Not Accounted for as Hedging Instruments | Asset Derivatives | Liability Derivatives | ||||||||||||
Consolidated Statement of Assets and Liabilities Location | Fair Value | Consolidated Statement of Assets and Liabilities Location | Fair Value | |||||||||||
Interest rate contracts | Variation margin on futures contracts | $719,243a | Variation margin on futures contracts | $913,933a | ||||||||||
Unrealized appreciation on OTC swap contracts | 28,002 | Unrealized depreciation on OTC swap contracts | 77,581 | |||||||||||
Variation margin on centrally cleared swap contracts | 292,379a | Variation margin on centrally cleared swap contracts | 499,062a | |||||||||||
Foreign exchange contracts | Variation margin on futures contracts | 586,888a | Variation margin on futures contracts | 538,687a | ||||||||||
Unrealized appreciation on OTC swap contracts | 231,206 | |||||||||||||
Unrealized appreciation on OTC forward exchange contracts | 2,227,550 | Unrealized depreciation on OTC forward exchange contracts | 868,001 | |||||||||||
Credit contracts | Variation margin on centrally cleared swap contracts | 58,100a | Variation margin on centrally cleared swap contracts | 631,346a | ||||||||||
OTC swap contracts (upfront payments) | 534,541 | OTC swap contracts (upfront receipts) | 658,440 | |||||||||||
Unrealized appreciation on OTC swap contracts | 44,045 | Unrealized depreciation on OTC swap contracts | 290,045 | |||||||||||
Equity contracts | Investments in securities, at value | 492,342b | Options written, at value | 653,981 | ||||||||||
Variation margin on futures contracts | 1,390,024a | Variation margin on futures contracts | 778,474a | |||||||||||
Unrealized appreciation on OTC swap contracts | 23,675,995 | Unrealized depreciation on OTC swap contracts | 16,481,548 | |||||||||||
Commodity contracts | Variation margin on futures contracts | 1,643,001a | Variation margin on futures contracts | 2,720,196a | ||||||||||
Totals | $31,923,316 | $25,111,294 | ||||||||||||
Derivative Contracts Not Accounted for as Hedging Instruments | Consolidated Statement of Operations Location | Net Realized Gain (Loss) for the Year | Consolidated Statement of Operations Location | Net Change in Unrealized Appreciation (Depreciation) for the Year | ||||||||||
Net realized gain (loss) from: | Net change in unrealized appreciation (depreciation) on: | |||||||||||||
Interest rate contracts | Investments | $291,361a | Investments | $(108,550)a | ||||||||||
Written options- | (177,676) | Written options | 114,123 | |||||||||||
Futures contracts | 1,708,493 | Futures contracts | 400,262 | |||||||||||
Swap contracts | 5,056,486 | Swap contracts | (762,070) | |||||||||||
franklintempleton.com | Annual Report | 85 | ||||
Derivative Contracts Not Accounted for as Hedging Instruments | Consolidated Statement of Operations Location | Net Realized Gain (Loss) for the Year | Consolidated Statement of Operations Location | Net Change in Unrealized Appreciation (Depreciation) for the Year | ||||||||||
Foreign exchange contracts | Investments | $(196,217)a | Investments | $125,031a | ||||||||||
Written options | 10,334 | Written options | (7,640) | |||||||||||
Forward exchange contracts | (5,152,376) | Forward exchange contracts | 2,994,307 | |||||||||||
Futures contracts | 210,838 | Futures contracts | (78,500) | |||||||||||
Swap contracts | (54,629) | Swap contracts | 231,206 | |||||||||||
Credit contracts | Swap contracts | (1,211,333) | Swap contracts | (1,117,784) | ||||||||||
Equity contracts | Investments | (5,541,161)a | Investments | 746,688a | ||||||||||
Written options | 1,322,975 | Written options | (835,771) | |||||||||||
Futures contracts | 1,560,408 | Futures contracts | 1,138,393 | |||||||||||
Swap contracts | (4,115,368) | Swap contracts | 11,561,145 | |||||||||||
Commodity contracts | Futures contracts | (1,948,058) | Futures contracts | (2,279,442) | ||||||||||
Totals | $(8,235,923) | $12,121,399 | ||||||||||||
Gross Amounts of Assets and Liabilities Presented in the Consolidated Statement of Assets and Liabilities | ||||||||
Assetsa | Liabilitiesa | |||||||
Forward Exchange Contracts | $2,227,550 | $868,001 | ||||||
Swap Contracts | 24,513,789 | 17,507,614 | ||||||
Total | $26,741,339 | $18,375,615 | ||||||
Gross Amounts of Assets Presented in the Consolidated Statement of Assets and Liabilities | Amounts Not Offset in the Consolidated Statement of Assets and Liabilities | Net Amount (Not less than zero) | |||||||||||||||
Financial Instruments Available for Offset | Financial Instruments Collateral Receiveda | Cash Collateral Received | |||||||||||||||
Counterparty | |||||||||||||||||
BNPP | $90,358 | $(33,942) | $— | $ — | $56,416 | ||||||||||||
BNYM | 8,391 | (4,125) | — | — | 4,266 | ||||||||||||
BOFA | 55,494 | (13,598) | — | — | 41,896 | ||||||||||||
BZWS | 460,188 | (197,618) | — | — | 262,570 | ||||||||||||
CITI | 430,523 | (185,827) | — | — | 244,696 | ||||||||||||
DBAB | 695,157 | (145) | — | — | 695,012 | ||||||||||||
GSCO | 352,810 | (352,810) | — | — | — | ||||||||||||
HSBC | 16,402 | (16,402) | — | — | — | ||||||||||||
86 | Annual Report | franklintempleton.com | ||||
Gross Amounts of Assets Presented in the Consolidated Statement of Assets and Liabilities | Amounts Not Offset in the Consolidated Statement of Assets and Liabilities | Net Amount (Not less than zero) | |||||||||||||||
Financial Instruments Available for Offset | Financial Instruments Collateral Receiveda | Cash Collateral Received | |||||||||||||||
JPHQ | $7,923,997 | $(4,597,924) | $(60,661) | $— | $3,265,412 | ||||||||||||
JPHQb | 48,979 | — | — | — | 48,979 | ||||||||||||
MLCO | — | — | — | — | — | ||||||||||||
MSCO | 1,054,843 | (940,615) | — | — | 114,228 | ||||||||||||
MSCOb | 3,979 | — | — | — | 3,979 | ||||||||||||
MSCOc | 1,202,773 | (442,547) | — | — | 760,226 | ||||||||||||
MSCS | 8,985,135 | (7,354,832) | — | — | 1,630,303 | ||||||||||||
SEBA | 5,350,021 | (3,746,957) | — | — | 1,603,064 | ||||||||||||
SSBT | 8,308 | (8,308) | — | — | — | ||||||||||||
UBSW | 53,981 | (20,897) | — | — | 33,084 | ||||||||||||
Total | $ 26,741,339 | $(17,916,547) | $(60,661) | $— | $8,764,131 | ||||||||||||
Gross Amounts of Liabilities Presented in the Consolidated Statement of Assets and Liabilities | Amounts Not Offset in the Consolidated Statement of Assets and Liabilities | Net Amount (Not less than zero) | |||||||||||||||
Financial Instruments Available for Offset | Financial Instruments Collateral Pledgeda | Cash Collateral Pledgeda | |||||||||||||||
Counterparty | |||||||||||||||||
BNPP | $33,942 | $(33,942) | $ — | $— | $— | ||||||||||||
BNYM | 4,125 | (4,125) | — | — | — | ||||||||||||
BOFA | 13,598 | (13,598) | — | — | — | ||||||||||||
BZWS | 197,618 | (197,618) | — | — | — | ||||||||||||
CITI | 185,827 | (185,827) | — | — | — | ||||||||||||
DBAB | 145 | (145) | — | — | — | ||||||||||||
GSCO | 670,009 | (352,810) | — | (317,199) | — | ||||||||||||
HSBC | 68,108 | (16,402) | — | — | 51,706 | ||||||||||||
JPHQ | 4,597,924 | (4,597,924) | — | — | — | ||||||||||||
JPHQb | 47,493 | — | — | — | 47,493 | ||||||||||||
MLCO | 33,843 | — | — | — | 33,843 | ||||||||||||
MSCO | 940,615 | 940,615 | — | — | — | ||||||||||||
MSCOb | 5,517 | — | — | — | 5,517 | ||||||||||||
MSCOc | 442,547 | (442,547) | — | — | — | ||||||||||||
MSCS | 7,354,832 | (7,354,832) | — | — | — | ||||||||||||
SEBA | 3,746,957 | (3,746,957) | — | — | — | ||||||||||||
SSBT | 11,618 | (8,308) | — | — | 3,310 | ||||||||||||
UBSW | 20,897 | (20,897) | — | — | — | ||||||||||||
Total | $ 18,375,615 | $(17,916,547) | $— | $(317,199) | $141,869 | ||||||||||||
franklintempleton.com | Annual Report | 87 | ||||
| • | Level 1 – quoted prices in active markets for identical financial instruments |
| • | Level 2 – other significant observable inputs (including quoted prices for similar financial instruments, interest rates, prepayment speed, credit risk, etc.) |
| • | Level 3 – significant unobservable inputs (including the Fund’s own assumptions in determining the fair value of financial instruments) |
Level 1 | Level 2 | Level 3 | Total | |||||||||||
Assets: | ||||||||||||||
Investments in Securities:a | ||||||||||||||
Equity Investmentsb | $124,495,087 | $4,493,334 | $122,017e | $129,110,438 | ||||||||||
Convertible Bonds | — | 74,032,939 | 94,384 | 74,127,323 | ||||||||||
Convertible Bonds in Reorganization | — | 99,680 | 8,653 | 108,333 | ||||||||||
Corporate Bonds and Notes | — | 32,029,250 | 1,154,496 | 33,183,746 | ||||||||||
Corporate Bonds and Notes in Reorganization | — | 587,971 | 202,730 | 790,701 | ||||||||||
Senior Floating Rate Interests | — | 9,438,761 | 28,686 | 9,467,447 | ||||||||||
Foreign Government and Agency Securities | — | 11,477,128 | — | 11,477,128 | ||||||||||
Foreign Government and Agency Securities in Reorganization | — | 3,661,986 | — | 3,661,986 | ||||||||||
U.S. Government and Agency Securities | — | 9,658,515 | — | 9,658,515 | ||||||||||
Options Purchased | 492,342 | — | — | 492,342 | ||||||||||
Short Term Investments | 220,574,596 | 66,171,455 | — | 286,746,051 | ||||||||||
Total Investments in Securities | $345,562,025 | $211,651,019c | $1,610,966 | $558,824,010 | ||||||||||
Other Financial Instruments: | ||||||||||||||
Futures Contracts | $4,260,868 | $— | $— | $4,260,868 | ||||||||||
Forward Exchange Contracts | — | 2,227,550 | — | 2,227,550 | ||||||||||
Swap Contracts | — | 24,329,727 | — | 24,329,727 | ||||||||||
Unfunded Loan Commitments | — | — | 7,708f | 7,708 | ||||||||||
Total Other Financial Instruments | $4,260,868 | $26,557,277 | $7,708 | $30,825,853 | ||||||||||
Liabilities: | ||||||||||||||
Other Financial Instruments: | ||||||||||||||
Options Written | $653,981 | $— | $— | $653,981 | ||||||||||
Securities Sold Shorta | 74,719,836 | 30,421,537d | —e | 105,141,373 | ||||||||||
Futures Contracts | 4,873,002 | — | — | 4,873,002 | ||||||||||
Forward Exchange Contracts | — | 868,001 | — | 868,001 | ||||||||||
Swap Contracts | — | 17,979,582 | —e | 17,979,582 | ||||||||||
Unfunded Loan Commitments | — | 43,261 | — | 43,261 | ||||||||||
Total Other Financial Instruments | $80,246,819 | $49,312,381 | $— | $129,559,200 | ||||||||||
88 | Annual Report | franklintempleton.com | ||||
franklintempleton.com | Annual Report | 89 | ||||
Counterparty | Currency | Selected Portfolio | ||||||||||||||||||
BNPP | BNP Paribas | BRL | Brazilian Real | ADR | American Depositary Receipt | |||||||||||||||
BNYM | The Bank of New York Mellon Corp. | CAD | Canadian Dollar | ASX | Australian Securities Exchange | |||||||||||||||
BOFA | Bank of America, NA | CHF | Swiss Franc | BRLCDI | Brazil Cetip Di Interbank Deposit Rate | |||||||||||||||
BZWS | Barclays Bank PLC | COP | Colombian Peso | BUBOR | Budapest Interbank Offered Rate | |||||||||||||||
CITI | Citigroup, NA | CZK | Czech Koruna | CAC | Cotation Assistee en Continu | |||||||||||||||
DBAB | Deutsche Bank, AG | DKK | Danish Krone | CBOE | Chicago Board Options Exchange | |||||||||||||||
GSCO | Goldman Sachs International | DOP | Dominican Peso | CIBOR | Copenhagen Interbank Offered Rate | |||||||||||||||
HSBC | HSBC Bank PLC | EGP | Egyptian Pound | DAX | Deutscher Aktienindex | |||||||||||||||
JPHQ | JP Morgan Chase Bank, NA | EUR | Euro | DJIA | Dow Jones Industrial Average | |||||||||||||||
MLCO | Merrill Lynch & Co., Inc. | GBP | British Pound | EONIA | Euro OverNight Index Average | |||||||||||||||
MSCO | Morgan Stanley & Co. LLC | HKD | Hong Kong Dollar | ETF | Exchange Traded Fund | |||||||||||||||
MSCS | Morgan Stanley Capital Services LLC | HUF | Hungarian Forint | EURIBOR | Euro Interbank Offered Rate | |||||||||||||||
SEBA | Skandinaviska Enskilda Banken AB | IDR | Indonesian Rupiah | FEDEF | Federal Funds Effective Rate | |||||||||||||||
SSBT | State Street Bank and Trust Company | JPY | Japanese Yen | FHLMC | Federal Home Loan Mortgage Corp. | |||||||||||||||
UBSW | UBS AG | MXN | Mexican Peso | FNMA | Federal National Mortgage Association | |||||||||||||||
| | NOK | Norwegian Krone | FRN | Floating Rate Note | |||||||||||||||
| | PEN | Peruvian Nuevo Sol | FTSE | Financial Times Stock Exchange | |||||||||||||||
| | PLN | Polish Zloty | HIBOR | Hong Kong Interbank Offered Rate | |||||||||||||||
| | PYG | Paraguay Guarani | IBEX | Iberian Index | |||||||||||||||
| | RSD | Serbian Dinar | JIBAR | Johannesburg Interbank Agreed Rate | |||||||||||||||
| | SEK | Swedish Krona | JSE | Johannesburg Stock Exchange Index | |||||||||||||||
| | TRY | Turkish Lira | KOSPI | Korean Composite Stock Price Index | |||||||||||||||
USD | United States Dollar | LIBOR | London InterBank Offered Rate | |||||||||||||||||
UYU | Uruguayan Peso | MIB | Milano Italia Borsa | |||||||||||||||||
ZAR | South African Rand | MUTSCALM | Japan Unsecured Overnight Call Rate | |||||||||||||||||
Index | NIBOR | Norwegian Interbank Offered Rate | ||||||||||||||||||
CDX.EM | CDX Emerging Markets Index | OAT | Obligation Assumable by the Treasurer | |||||||||||||||||
CDX.NA.HY | CDX North America High Yield Index | PIK | Payment In-Kind | |||||||||||||||||
CDX.NA.IG | CDX North America Investment | RC | Revolving Loan Commitment | |||||||||||||||||
Grade Index | REIT | Real Estate Investment Trust | ||||||||||||||||||
ITRX.EUR | iTraxx Europe Index | | SABOR | South African Benchmark Overnight Rate | ||||||||||||||||
ITRX.EUR.XOVER | iTraxx Europe Crossover Index | | SARON | Swiss Average Rate Overnight | ||||||||||||||||
| SOFR | Secured Overnight Financing Rate | ||||||||||||||||||
SONIA | Sterling Overnight Index Average | |||||||||||||||||||
SPDR | Standard & Poor's Depositary Receipt | |||||||||||||||||||
SPI | Swiss Performance Index | |||||||||||||||||||
STIBOR | Stockholm Interbank Offered Rate | |||||||||||||||||||
STR | Short Term Rate | |||||||||||||||||||
TOPIX | Tokyo Price Index | |||||||||||||||||||
TSX | Toronto Stock Exchange | |||||||||||||||||||
Reference Index | Reference Rate | ||||
11-Day EONIA | 4.00% | ||||
1-Day FEDEF | 5.33 | ||||
1-Day MUTSCALM | 0.08 | ||||
1-Day SABOR | 8.21 | ||||
1-Day SARON | 1.45 | ||||
1-Day SONIA | 5.20 | ||||
1-Month EURIBOR | 3.72 | ||||
1-Month HIBOR | 4.47 | ||||
1-Week CIBOR | 3.67 | ||||
1-Week NIBOR | 4.54 | ||||
1-Week STIBOR | 3.76 | ||||
3-Month JIBAR | 8.34 | ||||
6 month BUBOR | 6.95 | ||||
Banxico Mexico 1 Month Rate | 11.25 | ||||
BRLCDI | 10.40 | ||||
Euro STR | 3.89 | ||||
SOFR | 5.34 | ||||
90 | Annual Report | franklintempleton.com | ||||

franklintempleton.com | Annual Report | 91 | ||||
Pursuant to: | Amount Reported | |||||||
Dividends Received Deduction (DRD) | §854(b)(1)(A) | $1,398,678 | ||||||
Qualified Dividend Income (QDI) | §854(b)(1)(B) | $1,817,669 | ||||||
92 | Annual Report | franklintempleton.com | ||||
franklintempleton.com | Annual Report | 93 | ||||
94 | Annual Report | franklintempleton.com | ||||
franklintempleton.com | Annual Report | 95 | ||||
96 | Annual Report | franklintempleton.com | ||||
franklintempleton.com | Annual Report | 97 | ||||
98 | Annual Report | franklintempleton.com | ||||
© 2024 Franklin Templeton Investments. All rights reserved. | 18120-AFSOI 07/24 |
| ITEM 8. | CHANGES IN AND DISAGREEMENTS WITH ACCOUNTANTS FOR OPEN-END MANAGEMENT INVESTMENT COMPANIES. |
The information is disclosed as part of the Financial Statements included in Item 7 of this Form N-CSR.
| ITEM 9. | PROXY DISCLOSURES FOR OPEN-END MANAGEMENT INVESTMENT COMPANIES. |
The information is disclosed as part of the Financial Statements included in Item 7 of this Form N-CSR.
| ITEM 10. | REMUNERATION PAID TO DIRECTORS, OFFICERS, AND OTHERS OF OPEN-END MANAGEMENT INVESTMENT COMPANIES. |
The information is disclosed as part of the Financial Statements included in Item 7 of this Form N-CSR.
| ITEM 11. | STATEMENT REGARDING BASIS FOR APPROVAL OF INVESTMENT ADVISORY CONTRACT. |
The information is disclosed as part of the Financial Statements included in Item 7 of this Form N-CSR.
| ITEM 12. | DISCLOSURE OF PROXY VOTING POLICIES AND PROCEDURES FOR CLOSED-END MANAGEMENT INVESTMENT COMPANIES. |
Not applicable.
| ITEM 13. PORTFOLIO MANAGERS OF CLOSED-END MANAGEMENT INVESTMENT COMPANIES. |
Not applicable.
| ITEM 14. PURCHASES OF EQUITY SECURITIES BY CLOSED-END MANAGEMENT INVESTMENT COMPANY AND AFFILIATED PURCHASERS. |
Not applicable.
| ITEM 15. SUBMISSION OF MATTERS TO A VOTE OF SECURITY HOLDERS. |
There have been no changes to the procedures by which shareholders may recommend nominees to the Registrant’s Board of Trustees that would require disclosure herein.
ITEM 16. CONTROLS AND PROCEDURES.
| (a) | The registrant’s principal executive and principal financial officers, or persons performing similar functions, have concluded that the registrant’s disclosure controls and procedures (as defined in Rule 30a-3(c) under the Investment Company Act of 1940, as amended (the “1940 Act”) (17 CFR 270.30a-3(c))) are effective, as of a date within 90 days of the filing date of the report that includes the disclosure required by this paragraph, based on their evaluation of these controls and procedures required by Rule 30a-3(b) under the 1940 Act (17 CFR 270.30a-3(b)) and Rules 13a-15(b) or 15d-15(b) under the Securities Exchange Act of 1934, as amended (17 CFR 240.13a-15(b) or 240.15d-15(b)). |
| (b) | There were no changes in the registrant’s internal control over financial reporting (as defined in Rule 30a-3(d) under the 1940 Act (17 CFR 270.30a-3(d))) that occurred during the period covered by this report that has materially affected, or is reasonably likely to materially affect, the registrant’s internal control over financial reporting. |
| ITEM 17. DISCLOSURE OF SECURITIES LENDING ACTIVITIES FOR CLOSED-END MANAGEMENT INVESTMENT COMPANY. |
Not applicable.
ITEM 18. RECOVERY OF ERRONEOUSLY AWARDED COMPENSATION.
Responses to both (a) and (b) are N/A
ITEM 19. EXHIBITS.
SIGNATURES
Pursuant to the requirements of the Securities Exchange Act of 1934 and the Investment Company Act of 1940, the registrant has duly caused this report to be signed on its behalf by the undersigned, thereunto duly authorized.
| (Registrant) Franklin Alternative Strategies Funds | ||||||
| By (Signature and Title) | /s/ Christopher Kings | |||||
| Christopher Kings, Chief Executive Officer – Finance and | ||||||
| Administration | ||||||
Date July 30, 2024
Pursuant to the requirements of the Securities Exchange Act of 1934 and the Investment Company Act of 1940, this report has been signed below by the following persons on behalf of the registrant and in the capacities and on the dates indicated.
| By (Signature and Title) | /s/ Christopher Kings | |||||
| Christopher Kings, Chief Executive Officer – Finance and | ||||||
| Administration | ||||||
Date July 30, 2024
| By (Signature and Title) | /s/ Jeffrey White | |
| Jeffrey White, Treasurer, Chief Financial Officer, and Chief | ||
| Accounting Officer |
Date July 30, 2024