UNITED STATES
SECURITIES AND EXCHANGE COMMISSION
Washington, D.C. 20549
FORM N-CSR
CERTIFIED SHAREHOLDER REPORT OF REGISTERED
MANAGEMENT INVESTMENT COMPANIES
Investment Company Act file number 811-22641
Franklin Alternative Strategies Funds
(Exact name of registrant as specified in charter)
One Franklin Parkway
San Mateo, CA 94403-1906
(Address of principal executive offices) (Zip code)
Alison Baur
One Franklin Parkway
San Mateo, CA 94403-1906
(Name and address of agent for service)
Registrant’s telephone number, including area code: 650-312-2000
Date of fiscal year end: May 31
Date of reporting period: May 31, 2022
Item 1. Reports to Stockholders.
The Report to Shareholders is attached herewith.
ANNUAL REPORT AND SHAREHOLDER LETTER
FRANKLIN K2 ALTERNATIVE STRATEGIES FUND
A Series of Franklin Alternative Strategies Funds
May 31, 2022


Sign up for electronic delivery at franklintempleton.com/edelivery
SHAREHOLDER LETTER
Dear Fellow Shareholder:
During the 12 months ended May 31, 2022, the global economy was pressured by geopolitical instability, tightening monetary policies and renewed COVID-19 outbreaks. Although global equities benefited from ongoing vaccination programs and easing restrictions in certain regions, this was outweighed by the spread of COVID-19 variants, Russia’s invasion of Ukraine in February 2022 and interest rate hikes from the U.S. Federal Reserve. The Chinese government’s imposition of new restrictions on some businesses also pressured Asian and global emerging market stocks. Additionally, an environment of persistent supply chain disruptions stoked mounting inflationary pressures.
In this environment, global developed market stocks, as measured by the MSCI World Index (USD), posted a -4.38% total return for the period.1 Global emerging market stocks, as measured by the MSCI Emerging Markets Index (USD), posted a -19.56% total return.1 Global government bonds, as measured by the FTSE World Government Bond Index (USD), posted a -14.97% total return.1
We are committed to our long-term perspective and disciplined investment approach as we continue to conduct a rigorous analysis of Fund subadvisors and markets with a strong emphasis on investment risk management.
We believe active, professional investment management serves investors well. We also recognize the important role of financial professionals in today’s markets and encourage investors to continue to seek their advice. Amid changing markets and economic conditions, we are confident investors with a well-diversified portfolio and a patient, long-term outlook should be well-positioned for the years ahead.
1. Source: Morningstar.
See www.franklintempletondatasources.com for additional data provider information.
On the following pages, the Fund’s portfolio management team reviews investment decisions that pertain to performance during the past 12 months in light of the economic environment and other factors. Please remember all securities markets fluctuate, as do mutual fund share prices.
We thank you for investing with Franklin Templeton, welcome your questions and comments, and look forward to continuing to serve your investment needs in the future.
Sincerely,

Brooks Ritchey
President and Chief Executive Officer –
Investment Management
Franklin Alternative Strategies Funds
This letter reflects our analysis and opinions as of May 31, 2022, unless otherwise indicated. The information is not a complete analysis of every aspect of any market, country, industry, security or fund. Statements of fact are from sources considered reliable.
| Not FDIC Insured | | | May Lose Value | | | No Bank Guarantee |
| franklintempleton.com | Annual Report | 1 | ||||||||
| 2 | Annual Report | franklintempleton.com | ||||||||
Visit franklintempleton.com for fund updates, to access your account, or to find helpful financial planning tools.
ANNUAL REPORT
Franklin K2 Alternative Strategies Fund
This annual report for Franklin K2 Alternative Strategies Fund covers the fiscal year ended May 31, 2022.
Your Fund’s Goal and Main Investments
The Fund seeks capital appreciation with lower volatility relative to the broad equity markets by allocating its assets across multiple non-traditional or alternative strategies, including, but not limited to, some or all of the following strategies: long short equity, relative value, event driven and global macro. The Fund may invest in a wide range of securities and other investments including, but not limited to: equity securities including common stocks, preferred stocks, convertible securities, rights and warrants, private and registered investment vehicles and exchange-traded funds (ETFs); debt securities including bonds, notes, debentures, banker’s acceptances and commercial paper; loans and loan participations; and mortgage-backed or asset-backed securities, including collateralized debt obligations; as well as derivatives, commodities and currencies.
Performance Overview
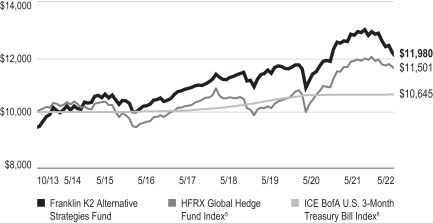
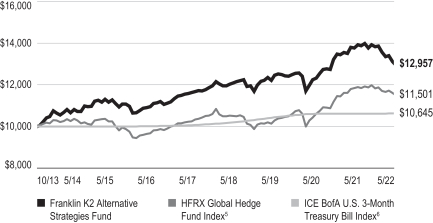
The Fund’s Class A shares posted a -6.25% cumulative total return for the 12 months under review. For comparison, the Fund’s primary benchmark, the HFRX Global Hedge Fund Index, which is designed to be representative of the overall composition of the hedge fund universe, posted a -3.01% cumulative total return for the same period.1 Also for comparison, the Fund’s secondary benchmark, the ICE BofA U.S. 3-Month Treasury Bill Index, which tracks the performance of short-term U.S. government securities with a remaining term to final maturity of less than three months, posted a +0.14% cumulative total return for the same period.2 You can find more of the Fund’s performance data in the Performance Summary beginning on page 7.
Performance data represent past performance, which does not guarantee future results. Investment return and principal value will fluctuate, and you may have a gain or loss when you sell your shares. Current performance may differ from figures shown. For most recent month-end performance, go to franklintempleton.com or call (800) 342-5236.
Economic and Market Overview
Global developed and emerging market equities, as measured by the MSCI All Country World Index-NR (USD, net of tax withholding when dividends are paid), posted a -6.78% total return for the 12 months ended May 31, 2022.2 Although global equities benefited from ongoing COVID-19 vaccination programs and easing restrictions in certain regions, the spread of the Delta and Omicron variants hindered markets at certain points during the 12-month period. The Chinese government’s imposition of additional restrictions on some businesses pressured Asian and global emerging market stocks. Additionally, an environment of persistent supply chain disruptions stoked mounting inflationary pressures. Russia’s invasion of Ukraine late in February 2022 injected further uncertainty into financial markets, provoking significant volatility in commodity and equity prices. Rising interest rates also pressured stocks, as borrowing costs began to increase from historically low levels.
In the U.S., gross domestic product (GDP) growth was robust throughout the period until the first quarter of 2022, when the economy contracted. The spread of Omicron variants, weakening fixed investments and a widening trade gap contributed to the weaker first quarter. Rising prices precipitated a notable decline in consumer confidence, despite high spending levels. In an effort to control inflation, the U.S. Federal Reserve (Fed) raised the federal funds target rate to a range of 0.25%–0.50%, the first such increase since 2018. In May 2022, the Fed raised interest rates by another half percentage point. The Fed noted in its May 2022 meeting that strength in the U.S. job market and continued inflationary pressure, exacerbated by the war in Ukraine, meant it anticipated making further increases to the federal funds target rate.
GDP growth resumed in the eurozone in 2021’s second quarter following a brief recession, but slowed beginning in the fourth quarter as the spread of the Omicron variant disrupted labor markets and led to renewed restrictions. Late in the reporting period, the war in Ukraine disrupted supply chains, sent commodity prices higher and further weakened the economic outlook. The European Central Bank struck a less
1. Source: FactSet. Hedge Fund Research, Inc. – www.hedgefundresearch.com. The HFRX Global Hedge Fund Index is being used under license from Hedge Fund Research, Inc., which does not endorse or approve of any of the contents of this report.
2. Source: Morningstar. Treasuries, if held to maturity, offer a fixed rate of return and a fixed principal value; their interest payments and principal are guaranteed.
The indexes are unmanaged and include reinvestment of any income or distributions. They do not reflect any fees, expenses or sales charges. One cannot invest directly in an index, and an index is not representative of the Fund’s portfolio. Unlike most asset class indexes, HFR Index returns reflect fees and expenses.
See www.franklintempletondatasources.com for additional data provider information.
The dollar value, number of shares or principal amount, and names of all portfolio holdings are listed in the Fund’s Consolidated Schedule of Investments (SOI). The Consolidated SOI begins on page 16.
| franklintempleton.com | Annual Report | 3 | ||||||||
FRANKLIN K2 ALTERNATIVE STRATEGIES FUND
accommodative tone at its March 2022 meeting as it set a schedule to wind down its asset purchases and established preconditions for possible interest-rate increases later in 2022. Stocks of companies with exposure to Russia, particularly banks, endured further declines late in the period. In this environment, European developed market equities, as measured by the MSCI Europe Index-NR (USD), posted a -9.75% total return for the 12 months under review.2
Asian developed and emerging market equities, as measured by the MSCI All Country Asia Index-NR (USD), posted a -18.75% total return for the 12-month period.2 While many Asian countries experienced improving economic conditions, Japan’s quarterly GDP was erratic, contracting in the third quarter of 2021 and the first quarter of 2022. Although China’s economy continued to grow, it was pressured by COVID-19 restrictions and government measures to limit real estate speculation. Unexpected regulatory changes by the Chinese government, which negatively impacted education- and technology-related businesses, and investor concerns about the solvency of several large Chinese property developers further pressured Asian stocks during the 12-month period.
Global emerging market stocks, as measured by the MSCI Emerging Markets Index-NR (USD), posted a -19.83% total return for the 12 months under review.2 Rising prices for food and energy, following Russia’s invasion of Ukraine, increased inflationary pressures and raised concerns about possible government debt defaults in some countries. In contrast, some countries, particularly South Africa, Saudi Arabia and Brazil, as well as other countries in Latin America, benefited from the rising commodity prices.
Investment Strategy
We manage the Fund using a multi-manager approach. While we have overall responsibility for the Fund’s investments, we principally allocate assets to multiple subadvisors, each of whom independently manages a separate portion of the Fund’s portfolio in accordance with some or all of the following strategies: long short equity, relative value, event driven and global macro. We allocate the Fund’s assets among these strategies utilizing a top-down approach, generating the Fund’s strategy weightings by taking into account market conditions, risk factors, diversification, liquidity, transparency, and availability of various subadvisors and other investment options, among other things. We allocate the Fund’s assets to specific subadvisors utilizing a bottom-up approach, selecting subadvisors and their weighting within the Fund’s portfolio by taking into account their correlations to various markets and to each other, their risk profiles and their return expectations. Long short equity strategies
generally seek to produce returns from investments in the equity markets by taking long and short positions in stocks and stock indexes (through the use of derivatives or through a position in an ETF). Relative value strategies encompass a wide range of investment techniques that are intended to profit from pricing inefficiencies. Event driven strategies generally invest in securities of companies undergoing significant corporate events. Global macro strategies generally focus on macroeconomic opportunities across numerous markets and investments. In addition, the debt securities in which the Fund may invest may have variable or fixed interest rates, may be of any maturity or credit rating, and may include sovereign debt, high yield (“junk”) bonds and distressed debt securities (securities of companies that are, or are about to be, involved in reorganizations, financial restructurings, or bankruptcy) and securities that are in default.
The Fund may take long and/or short positions in a wide range of asset classes, including equities, fixed income, commodities and currencies, among others. Long positions benefit from an increase in the price of the underlying instrument or asset class, while short positions benefit from a decrease in that price. The Fund may use derivatives for hedging and non-hedging (investment) purposes, although no subadvisor is required to hedge any of the Fund’s positions or to use derivatives. Such derivative investments may include futures contracts, swaps, options and currency forward contracts. As a result of the Fund’s use of derivatives, the Fund may have economic leverage, which means the sum of the Fund’s investment exposures through its use of
derivatives may significantly exceed the amount of assets invested in the Fund, although these exposures may vary over time. The Fund may engage in active and frequent trading as part of its investment strategies.
| 4 | Annual Report | franklintempleton.com | ||||||||
FRANKLIN K2 ALTERNATIVE STRATEGIES FUND
Strategy Allocation* | ||||||||
| Based on Total Net Assets as of 5/31/22 | ||||||||
| Strategy | Long | Short | ||||||
Long Short Equity | 36.5% | -23.0% | ||||||
Relative Value | 52.0% | -18.9% | ||||||
Event Driven | 17.1% | -7.2% | ||||||
Global Macro | 98.2% | -172.0% | ||||||
| Total | 203.8% | -221.1% | ||||||
*Figures include the effect of gross notional exposure of derivatives.
| Subadvisors | ||||
| 5/31/22 | ||||
| Long Short Equity | ||||
Chilton Investment Company, Inc. | ||||
Electron Capital Partners, LLC | ||||
Jennison Associates, LLC | ||||
Portland Hill Asset Management Limited | ||||
Wellington Management Company, LLP | ||||
| Relative Value | ||||
Apollo Credit Management LLC | ||||
Benefit Street Partners, L.L.C. | ||||
Ellington Global Asset Management, LLC | ||||
Lazard Asset Management, LLC | ||||
Loomis Sayles & Company, L.P. | ||||
One River Asset Management, LLC | ||||
| Event Driven | ||||
Bardin Hill Arbitrage IC Management LP | ||||
P. Schoenfeld Asset Management L.P. | ||||
| Global Macro | ||||
BlueBay Asset Management LLP | ||||
Emso Asset Management Limited | ||||
Graham Capital Management, L.P. | ||||
RV Capital Management Private Ltd | ||||
Manager’s Discussion
During the 12 months under review, three of the four underlying strategies in which we allocated assets weighed on absolute returns, with the long short equity strategy as the largest detractor, by far. The global macro and relative value strategies also detracted, though more modestly. Event driven was the lone contributing strategy during the period. From an asset class perspective, long exposure to both equities and fixed income were the key drivers of performance, partially offset by gains from currency exposure, which was short overall. The conditional risk overlay (CRO) was not activated during the period. The allocation percentages for each strategy are listed in the Strategy Allocation table on this page.
The Fund’s long short equity strategy subadvisors were Chilton Investment, Electron Capital Partners, Jennison
Associates, Portland Hill Asset Management and Wellington Management. All five subadvisors delivered negative returns during the period, with Portland Hill, Wellington, Electron and Jennison as the largest overall individual detractors, along with slight detraction from Chilton. Equity exposure drove the strategy’s decline, especially net long positions in the information technology, consumer discretionary and communications services sectors. Equity index hedges were a significant contributor, while long exposure to consumer staples and utilities stocks provided a more modest boost. Currency exposure also helped offset the strategy’s overall decline.
The Fund’s global macro subadvisors were BlueBay Asset Management, Emso Asset Management, Graham Capital Management and RV Capital Management. Two of the four subadvisors—Emso and BlueBay—weakened fund performance during the period. In contrast, Graham was the largest overall contributing subadvisor during the period, driven by its exposure to commodities, while subadvisor RV’s contribution was negligible. By asset class, credit exposure was the leading driver of losses, partially offset by commodity and currency positioning. In terms of aggregate sector exposures, government bonds were key detractors, largely due to long positioning in Ukrainian bonds, while real estate positioning also weighed on returns. Conversely, long commodities positioning (subadvisor Graham’s long energy and agricultural futures) was a key contributor, along with currency positioning.
The Fund implemented a position in a new relative value subadvisor, Benefit Street Partners, or BSP, in September 2021. The manager pursues an active high-yield bond trading strategy with an opportunistic hedge and fits with our overall favorable outlook for more active strategies in the current environment. BSP joined existing relative value subadvisors Apollo Credit Management, Ellington Global Asset Management, Lazard Asset Management, Loomis Sayles & Company and One River Asset Management.
Three of the six relative value subadvisors detracted from performance for the 12-month period: Loomis Sayles, BSP and One River. Subadvisors Lazard, Ellington and Apollo were each modest contributors. Long credit exposure was the primary driver of the strategy’s decline, though significant contribution from short equity positioning helped offset the losses. Currency exposure was a modest contributor. In terms of aggregate sector exposures, communication services, consumer discretionary and financials detracted the most from the Fund’s performance. Conversely, currency exposure (short overall) and short positioning in U.S. and other developed market sovereign bonds and asset-backed securities contributed to returns.
| franklintempleton.com | Annual Report | 5 | ||||||||
FRANKLIN K2 ALTERNATIVE STRATEGIES FUND
The Fund’s event driven strategy subadvisors were Bardin Hill Arbitrage IC Management and P. Schoenfeld Asset Management, and both contributed during the period. The strategy’s overall contribution was bolstered by the continued tightening of merger arbitrage spreads on a range of strategic acquisitions. By asset class, equity and currency positioning drove contribution, while fixed income detracted overall. In terms of aggregate sector exposures, the top performance drivers were utilities, industrials and currency hedges. Communication services and financials were notable detractors.
During the period, in addition to adding BSP as a new subadvisor within the relative value strategy, the team increased allocations to global macro subadvisor BlueBay, long short equity managers Chilton and Electron, relative value subadvisors Apollo and Lazard, and event driven manager P. Schoenfeld Asset Management. Exposure was reduced to global macro subadvisors Graham, Emso and BlueBay.
Thank you for your participation in Franklin K2 Alternative Strategies Fund. We look forward to continuing to serve your investment needs.
Brooks Ritchey
Co-Lead Portfolio Manager
Robert Christian
Co-Lead Portfolio Manager
Anthony Zanolla, CFA
Portfolio Manager
The foregoing information reflects our analysis, opinions and portfolio holdings as of May 31, 2022, the end of the reporting period. The way we implement our main investment strategies and the resulting portfolio holdings may change depending on factors such as market and economic conditions. These opinions may not be relied upon as investment advice or an offer for a particular security. The information is not a complete analysis of every aspect of any market, country, industry, security or the Fund. Statements of fact are from sources considered reliable, but the investment manager makes no representation or warranty as to their completeness or accuracy. Although historical performance is no guarantee of future results, these insights may help you understand our investment management philosophy.
CFA® is a trademark owned by CFA Institute.
| 6 | Annual Report | franklintempleton.com | ||||||||
FRANKLIN K2 ALTERNATIVE STRATEGIES FUND
Performance Summary as of May 31, 2022
The performance table and graphs do not reflect any taxes that a shareholder would pay on Fund dividends, capital gain distributions, if any, or any realized gains on the sale of Fund shares. Total return reflects reinvestment of the Fund’s dividends and capital gain distributions, if any, and any unrealized gains or losses. Your dividend income will vary depending on dividends or interest paid by securities in the Fund’s portfolio, adjusted for operating expenses of each class. Capital gain distributions are net profits realized from the sale of portfolio securities.
Performance as of 5/31/221
Cumulative total return excludes sales charges. Average annual total return includes maximum sales charges. Sales charges will vary depending on the size of the investment and the class of share purchased. The maximum is 5.50% and the minimum is 0%. Class A: 5.50% maximum initial sales charge; Advisor Class: no sales charges. For other share classes, visit franklintempleton.com.
| Share Class | Cumulative Total Return2 | Average Annual Total Return3 | ||||||
| A4 | ||||||||
1-Year | -6.25% | -11.44% | ||||||
5-Year | +10.30% | +0.83% | ||||||
Since Inception (10/11/13) | +26.75% | +2.11% | ||||||
| Advisor | ||||||||
1-Year | -6.05% | -6.05% | ||||||
5-Year | +11.68% | +2.23% | ||||||
Since Inception (10/11/13) | +29.57% | +3.05% | ||||||
Performance data represent past performance, which does not guarantee future results. Investment return and principal value will fluctuate, and you may have a gain or loss when you sell your shares. Current performance may differ from figures shown. For most recent month-end performance, go to franklintempleton.com or call (800) 342-5236.
See page 9 for Performance Summary footnotes.
| franklintempleton.com | Annual Report | 7 | ||||||||
FRANKLIN K2 ALTERNATIVE STRATEGIES FUND
PERFORMANCE SUMMARY
Total Return Index Comparison for a Hypothetical $10,000 Investment1
Total return represents the change in value of an investment over the periods shown. It includes any applicable maximum sales charge, Fund expenses, account fees and reinvested distributions. The unmanaged indexes include reinvestment of any income or distributions. These differ from the Fund in composition and do not pay management fees or expenses. One cannot invest directly in an index.
Class A (10/11/13–5/31/22)
Advisor Class (10/11/13–5/31/22)
Please see page 9 for Performance Summary footnotes.
| 8 | Annual Report | franklintempleton.com | ||||||||
FRANKLIN K2 ALTERNATIVE STRATEGIES FUND
PERFORMANCE SUMMARY
| Distributions (6/1/21–5/31/22) |
| Share Class | Net Investment Income | Short-Term Capital Gain | Long-Term Capital Gain | Total | ||||||||||||
| A | $0.0597 | $0.0776 | $0.4227 | $0.5600 | ||||||||||||
| C | — | $0.0776 | $0.4227 | $0.5003 | ||||||||||||
| R | $0.0496 | $0.0776 | $0.4227 | $0.5499 | ||||||||||||
| R6 | $0.0990 | $0.0776 | $0.4227 | $0.5993 | ||||||||||||
| Advisor | $0.0901 | $0.0776 | $0.4227 | $0.5904 | ||||||||||||
Total Annual Operating Expenses7
| Share Class | With Fee Waiver | Without Fee Waiver | ||||||
| A | 2.66% | 2.87% | ||||||
| Advisor | 2.41% | 2.62% | ||||||
Each class of shares is available to certain eligible investors and has different annual fees and expenses, as described in the prospectus.
All investments involve risks, including possible loss of principal. The market values of securities owned by the Fund will go up or down, sometimes rapidly or unpredictably. The Fund’s performance depends on the manager’s skill in selecting, overseeing and allocating Fund assets to the subadvisors. The Fund is actively managed and could experience losses if the investment manager’s and subadvisors’ judgment about particular investments made for the Fund’s portfolio prove to be incorrect. Some subadvisors may have little or no experience managing the assets of a registered investment company. Foreign investments are subject to greater investment risk such as political, economic, credit and information risks as well as risk of currency fluctuations. Investments in derivatives involve costs and create economic leverage, which may result in significant volatility and cause the Fund to participate in losses (as well as gains) that significantly exceed the Fund’s initial investment. Lower-rated or high-yield debt securities involve greater credit risk, including the possibility of default or bankruptcy. Currency management strategies could result in losses to the Fund if currencies do not perform as the investment manager or subadvisor expects. The Fund may make short sales of securities, which involves the risk that losses may exceed the original amount invested. Merger arbitrage investments risk loss if a proposed reorganization in which the Fund invests is renegotiated or terminated. Liquidity risk exists when securities have become more difficult to sell, or are unable to be sold, at the price at which they have been valued. Events such as the spread of deadly diseases, disasters, and financial, political or social disruptions, may heighten risks and adversely affect performance. The Fund’s prospectus also includes a description of the main investment risks.
Russia’s military invasion of Ukraine in February 2022, the resulting responses by the United States and other countries, and the potential for wider conflict could increase volatility and uncertainty in the financial markets and adversely affect regional and global economies. The United States and other countries have imposed broad-ranging economic sanctions on Russia and certain Russian individuals, banking entities and corporations as a response to its invasion of Ukraine. The United States and other countries have also imposed economic sanctions on Belarus and may impose sanctions on other countries that support Russia’s military invasion. These sanctions, as well as any other economic consequences related to the invasion, such as additional sanctions, boycotts or changes in consumer or purchaser preferences or cyberattacks on governments, companies or individuals, may further decrease the value and liquidity of certain Russian securities and securities of issuers in other countries that are subject to economic sanctions related to the invasion. To the extent that the Fund has exposure to Russian investments or investments in countries affected by the invasion, the Fund’s ability to price, buy, sell, receive or deliver such investments may be impaired. The Fund could determine at any time that certain of the most affected securities have zero value. In addition, any exposure that the Fund may have to counterparties in Russia or in countries affected by the invasion could negatively impact the Fund’s portfolio. The extent and duration of Russia’s military actions and the repercussions of such actions (including any retaliatory actions or countermeasures that may be taken by those subject to sanctions) are impossible to predict, but could result in significant market disruptions, including in the oil and natural gas markets, and may negatively affect global supply chains, inflation and global growth. These and any related events could significantly impact the Fund’s performance and the value of an investment in the Fund, even beyond any direct exposure the Fund may have to Russian issuers or issuers in other countries affected by the invasion.
1. The Fund has an expense reduction contractually guaranteed through 9/30/22 and a fee waiver related to the management fee paid by a subsidiary. Fund investment results reflect the expense reduction and fee waiver; without these reductions, the results would have been lower.
2. Cumulative total return represents the change in value of an investment over the periods indicated.
3. Average annual total return represents the average annual change in value of an investment over the periods indicated. Return for less than one year, if any, has not been annualized.
4. Prior to 9/10/18, these shares were offered at a higher initial sales charge of 5.75%, thus actual returns (with sales charges) would have differed. Average annual total returns (with sales charges) have been restated to reflect the current maximum initial sales charge of 5.50%.
5. Source: FactSet. Hedge Fund Research, Inc. – www.hedgefundresearch.com. The HFRX Global Hedge Fund Index is being used under license from Hedge Fund Research, Inc., which does not endorse or approve of any of the contents of this report. The HFRX Global Hedge Fund Index is designed to be representative of the overall composition of the hedge fund universe. It is composed of all eligible hedge fund strategies, including but not limited to convertible arbitrage, distressed securities, equity hedge, equity market neutral, event driven, macro, merger arbitrage and relative value arbitrage. The strategies are asset weighted based on the distribution of assets in the hedge fund industry.
6. Source: Morningstar. The ICE BofA U.S. 3-Month Treasury Bill Index tracks the performance of short-term U.S. government securities with a remaining term to final maturity of less than three months. Treasuries, if held to maturity, offer a fixed rate of return and a fixed principal value; their interest payments and principal are guaranteed.
7. Figures are as stated in the Fund’s current prospectus and may differ from the expense ratios disclosed in the Your Fund’s Expenses and Consolidated Financial Highlights sections in this report. In periods of market volatility, assets may decline significantly, causing total annual Fund operating expenses to become higher than the figures shown.
See www.franklintempletondatasources.com for additional data provider information.
| franklintempleton.com | Annual Report | 9 | ||||||||
FRANKLIN K2 ALTERNATIVE STRATEGIES FUND
As a Fund shareholder, you can incur two types of costs: (1) transaction costs, including sales charges (loads) on Fund purchases and redemptions; and (2) ongoing Fund costs, including management fees, distribution and service (12b-1) fees, and other Fund expenses. All mutual funds have ongoing costs, sometimes referred to as operating expenses. The table below shows ongoing costs of investing in the Fund and can help you understand these costs and compare them with those of other mutual funds. The table assumes a $1,000 investment held for the six months indicated.
Actual Fund Expenses
The table below provides information about actual account values and actual expenses in the columns under the heading “Actual.” In these columns the Fund’s actual return, which includes the effect of Fund expenses, is used to calculate the “Ending Account Value” for each class of shares. You can estimate the expenses you paid during the period by following these steps (of course, your account value and expenses will differ from those in this illustration): Divide your account value by $1,000 (if your account had an $8,600 value, then $8,600 ÷ $1,000 = 8.6). Then multiply the result by the number in the row for your class of shares under the headings “Actual” and “Expenses Paid During Period” (if Actual Expenses Paid During Period were $7.50, then 8.6 x $7.50 = $64.50). In this illustration, the actual expenses paid this period are $64.50.
Hypothetical Example for Comparison with Other Funds
Under the heading “Hypothetical” in the table, information is provided about hypothetical account values and hypothetical expenses based on the Fund’s actual expense ratio and an assumed rate of return of 5% per year before expenses, which is not the Fund’s actual return. This information may not be used to estimate the actual ending account balance or expenses you paid for the period, but it can help you compare ongoing costs of investing in the Fund with those of other funds. To do so, compare this 5% hypothetical example for the class of shares you hold with the 5% hypothetical examples that appear in the shareholder reports of other funds. Please note that expenses shown in the table are meant to highlight ongoing costs and do not reflect any transactional costs. Therefore, information under the heading “Hypothetical” is useful in comparing ongoing costs only, and will not help you compare total costs of owning different funds. In addition, if transactional costs were included, your total costs would have been higher.
| Actual (actual return after expenses) | Hypothetical (5% annual return before expenses) | |||||||||||||||||||||||
Share Class | Beginning Account Value 12/01/21 | Ending Account Value 5/31/22 | Expenses Paid During Period 12/01/21–5/31/221,2 | Ending Account Value 5/31/22 | Expenses Paid During Period 12/01/21–5/31/221,2 | Net Annualized Expense Ratio2 | ||||||||||||||||||
| A | $ | 1,000 | $ | 934.50 | $ | 12.78 | $ | 1,011.72 | $ | 13.29 | 2.65 | % | ||||||||||||
| C | $ | 1,000 | $ | 930.10 | $ | 16.36 | $ | 1,007.98 | $ | 17.02 | 3.40 | % | ||||||||||||
| R | $ | 1,000 | $ | 932.80 | $ | 13.88 | $ | 1,010.57 | $ | 14.44 | 2.88 | % | ||||||||||||
| R6 | $ | 1,000 | $ | 935.00 | $ | 11.48 | $ | 1,013.06 | $ | 11.94 | 2.38 | % | ||||||||||||
| Advisor | $ | 1,000 | $ | 935.80 | $ | 11.58 | $ | 1,012.96 | $ | 12.04 | 2.40 | % | ||||||||||||
1. Expenses are equal to the annualized expense ratio for the six-month period as indicated above—in the far right column—multiplied by the simple average account value over the period indicated, and then multiplied by 182/365 to reflect the one-half year period.
2. Reflects expenses after fee waivers and expense reimbursements. Does not include acquired fund fees and expenses.
| 10 | Annual Report | franklintempleton.com | ||||||||
FRANKLIN ALTERNATIVE STRATEGIES FUNDS
Consolidated Financial Highlights
Franklin K2 Alternative Strategies Fund
| Year Ended May 31, | ||||||||||||||||||||
| 2022 | 2021 | 2020 | 2019 | 2018 | ||||||||||||||||
| Class A | ||||||||||||||||||||
| Per share operating performance (for a share outstanding throughout the year) | ||||||||||||||||||||
Net asset value, beginning of year | $ | 12.46 | $ | 11.19 | $ | 11.28 | $ | 11.38 | $ | 11.14 | ||||||||||
|
| |||||||||||||||||||
| Income from investment operationsa: | ||||||||||||||||||||
Net investment income (loss)b | (0.06 | ) | (0.08 | ) | (0.03 | ) | 0.04 | 0.01 | ||||||||||||
Net realized and unrealized gains (losses) | (0.68 | ) | 1.45 | 0.02 | 0.11 | 0.38 | ||||||||||||||
|
| |||||||||||||||||||
Total from investment operations | (0.74 | ) | 1.37 | (0.01 | ) | 0.15 | 0.39 | |||||||||||||
|
| |||||||||||||||||||
| Less distributions from: | ||||||||||||||||||||
Net investment income | (0.06 | ) | — | (0.07 | ) | — | (0.15 | ) | ||||||||||||
Net realized gains | (0.50 | ) | (0.10 | ) | (0.01 | ) | (0.25 | ) | — | |||||||||||
|
| |||||||||||||||||||
Total distributions | (0.56 | ) | (0.10 | ) | (0.08 | ) | (0.25 | ) | (0.15 | ) | ||||||||||
|
| |||||||||||||||||||
Net asset value, end of year | $ | 11.16 | $ | 12.46 | $ | 11.19 | $ | 11.28 | $ | 11.38 | ||||||||||
|
| |||||||||||||||||||
Total returnc | (6.25)% | 12.25% | (0.15)% | 1.35% | 3.57% | |||||||||||||||
| Ratios to average net assets | ||||||||||||||||||||
Expenses before waiver, payments by affiliates and expense reductiond | 2.75% | 2.82% | 2.58% | 2.73% | 2.81% | |||||||||||||||
Expenses net of waiver, payments by affiliates and expense reductiond | 2.60% | e | 2.64% | 2.40% | 2.56% | 2.59% | ||||||||||||||
Expenses incurred in connection with securities sold short | 0.40% | 0.44% | 0.20% | 0.36% | 0.39% | |||||||||||||||
Net investment income (loss) | (0.49)% | (0.67)% | (0.25)% | 0.36% | 0.06% | |||||||||||||||
| Supplemental data | ||||||||||||||||||||
Net assets, end of year (000’s) | $94,580 | $102,138 | $90,205 | $104,452 | $119,214 | |||||||||||||||
Portfolio turnover rate | 177.61% | 236.64% | 271.51% | 235.47% | 234.77% | |||||||||||||||
aThe amount shown for a share outstanding throughout the period may not correlate with the Consolidated Statement of Operations for the period due to the timing of sales and repurchases of the Fund’s shares in relation to income earned and/or fluctuating fair value of the investments of the Fund.
bBased on average daily shares outstanding.
cTotal return does not reflect sales commissions or contingent deferred sales charges, if applicable.
dIncludes dividend and/or interest expense on securities sold short and security borrowing fees, if any. See below for the ratios of such expenses to average net assets for the periods presented. See Note 1(f).
eBenefit of expense reduction rounds to less than 0.01%.
| franklintempleton.com | The accompanying notes are an integral part of these consolidated financial statements. | Annual Report | 11 | ||||||||
FRANKLIN ALTERNATIVE STRATEGIES FUNDS
CONSOLIDATED FINANCIAL HIGHLIGHTS
Franklin K2 Alternative Strategies Fund (continued)
| Year Ended May 31, | ||||||||||||||||||||
| 2022 | 2021 | 2020 | 2019 | 2018 | ||||||||||||||||
| Class C | ||||||||||||||||||||
| Per share operating performance (for a share outstanding throughout the year) | ||||||||||||||||||||
Net asset value, beginning of year | $ | 12.11 | $ | 10.95 | $ | 11.05 | $ | 11.25 | $ | 11.00 | ||||||||||
|
| |||||||||||||||||||
| Income from investment operationsa: | ||||||||||||||||||||
Net investment income (loss)b | (0.15 | ) | (0.15 | ) | (0.11 | ) | (0.05 | ) | (0.08 | ) | ||||||||||
Net realized and unrealized gains (losses) | (0.66 | ) | 1.41 | 0.02 | 0.10 | 0.39 | ||||||||||||||
|
| |||||||||||||||||||
Total from investment operations | (0.81 | ) | 1.26 | (0.09 | ) | 0.05 | 0.31 | |||||||||||||
|
| |||||||||||||||||||
| Less distributions from: | ||||||||||||||||||||
Net investment income | — | — | — | — | (0.06 | ) | ||||||||||||||
Net realized gains | (0.50 | ) | (0.10 | ) | (0.01 | ) | (0.25 | ) | — | |||||||||||
|
| |||||||||||||||||||
Total distributions | (0.50 | ) | (0.10 | ) | (0.01 | ) | (0.25 | ) | (0.06 | ) | ||||||||||
|
| |||||||||||||||||||
Net asset value, end of year | $ | 10.80 | $ | 12.11 | $ | 10.95 | $ | 11.05 | $ | 11.25 | ||||||||||
|
| |||||||||||||||||||
Total returnc | (7.06)% | 11.51% | (0.85)% | 0.56% | 2.82% | |||||||||||||||
| Ratios to average net assets | ||||||||||||||||||||
Expenses before waiver, payments by affiliates and expense reductiond | 3.50% | 3.54% | 3.33% | 3.48% | 3.56% | |||||||||||||||
Expenses net of waiver, payments by affiliates and expense reductiond | 3.35% | e | 3.36% | 3.15% | 3.31% | 3.34% | ||||||||||||||
Expenses incurred in connection with securities sold short | 0.40% | 0.44% | 0.20% | 0.36% | 0.39% | |||||||||||||||
Net investment income (loss) | (1.24)% | (1.39)% | (1.00)% | (0.39)% | (0.69)% | |||||||||||||||
| Supplemental data | ||||||||||||||||||||
Net assets, end of year (000’s) | $24,486 | $31,541 | $36,043 | $44,897 | $53,196 | |||||||||||||||
Portfolio turnover rate | 177.61% | 236.64% | 271.51% | 235.47% | 234.77% | |||||||||||||||
aThe amount shown for a share outstanding throughout the period may not correlate with the Consolidated Statement of Operations for the period due to the timing of sales and repurchases of the Fund’s shares in relation to income earned and/or fluctuating fair value of the investments of the Fund.
bBased on average daily shares outstanding.
cTotal return does not reflect sales commissions or contingent deferred sales charges, if applicable.
dIncludes dividend and/or interest expense on securities sold short and security borrowing fees, if any. See below for the ratios of such expenses to average net assets for the periods presented. See Note 1(f).
eBenefit of expense reduction rounds to less than 0.01%.
| 12 | Annual Report | The accompanying notes are an integral part of these consolidated financial statements. | franklintempleton.com | ||||||||
FRANKLIN ALTERNATIVE STRATEGIES FUNDS
CONSOLIDATED FINANCIAL HIGHLIGHTS
Franklin K2 Alternative Strategies Fund (continued)
| Year Ended May 31, | ||||||||||||||||||||
| 2022 | 2021 | 2020 | 2019 | 2018 | ||||||||||||||||
| Class R | ||||||||||||||||||||
| Per share operating performance (for a share outstanding throughout the year) | ||||||||||||||||||||
Net asset value, beginning of year | $ | 12.44 | $ | 11.20 | $ | 11.28 | $ | 11.42 | $ | 11.17 | ||||||||||
|
| |||||||||||||||||||
| Income from investment operationsa: | ||||||||||||||||||||
Net investment income (loss)b | (0.08 | ) | (0.11 | ) | (0.06 | ) | 0.02 | (0.02 | ) | |||||||||||
Net realized and unrealized gains (losses) | (0.68 | ) | 1.45 | 0.02 | 0.09 | 0.39 | ||||||||||||||
|
| |||||||||||||||||||
Total from investment operations | (0.76 | ) | 1.34 | (0.04 | ) | 0.11 | 0.37 | |||||||||||||
|
| |||||||||||||||||||
| Less distributions from: | ||||||||||||||||||||
Net investment income | (0.05 | ) | — | (0.03 | ) | — | (0.12 | ) | ||||||||||||
Net realized gains | (0.50 | ) | (0.10 | ) | (0.01 | ) | (0.25 | ) | — | |||||||||||
|
| |||||||||||||||||||
Total distributions | (0.55 | ) | (0.10 | ) | (0.04 | ) | (0.25 | ) | (0.12 | ) | ||||||||||
|
| |||||||||||||||||||
Net asset value, end of year | $ | 11.13 | $ | 12.44 | $ | 11.20 | $ | 11.28 | $ | 11.42 | ||||||||||
|
| |||||||||||||||||||
Total return | (6.50)% | 11.97% | (0.39)% | 1.08% | 3.28% | |||||||||||||||
| Ratios to average net assets | ||||||||||||||||||||
Expenses before waiver, payments by affiliates and expense reductionc | 3.04% | 3.06% | 2.83% | 2.98% | 3.06% | |||||||||||||||
Expenses net of waiver, payments by affiliates and expense reductionc | 2.85% | d | 2.88% | 2.65% | 2.81% | 2.84% | ||||||||||||||
Expenses incurred in connection with securities sold short | 0.40% | 0.44% | 0.20% | 0.36% | 0.39% | |||||||||||||||
Net investment income (loss) | (0.78)% | (0.91)% | (0.50)% | 0.11% | (0.19)% | |||||||||||||||
| Supplemental data | ||||||||||||||||||||
Net assets, end of year (000’s) | $811 | $840 | $884 | $844 | $648 | |||||||||||||||
Portfolio turnover rate | 177.61% | 236.64% | 271.51% | 235.47% | 234.77% | |||||||||||||||
aThe amount shown for a share outstanding throughout the period may not correlate with the Consolidated Statement of Operations for the period due to the timing of sales and repurchases of the Fund’s shares in relation to income earned and/or fluctuating fair value of the investments of the Fund.
bBased on average daily shares outstanding.
cIncludes dividend and/or interest expense on securities sold short and security borrowing fees, if any. See below for the ratios of such expenses to average net assets for the periods presented. See Note 1(f).
dBenefit of expense reduction rounds to less than 0.01%.
| franklintempleton.com | The accompanying notes are an integral part of these consolidated financial statements. | Annual Report | 13 | ||||||||
FRANKLIN ALTERNATIVE STRATEGIES FUNDS
CONSOLIDATED FINANCIAL HIGHLIGHTS
Franklin K2 Alternative Strategies Fund (continued)
| Year Ended May 31, | ||||||||||||||||||||
| 2022 | 2021 | 2020 | 2019 | 2018 | ||||||||||||||||
| Class R6 | ||||||||||||||||||||
| Per share operating performance (for a share outstanding throughout the year) | ||||||||||||||||||||
Net asset value, beginning of year | $ | 12.58 | $ | 11.25 | $ | 11.34 | $ | 11.41 | $ | 11.17 | ||||||||||
|
| |||||||||||||||||||
| Income from investment operationsa: | ||||||||||||||||||||
Net investment income (loss)b | (0.02 | ) | (0.04 | ) | 0.01 | 0.08 | 0.03 | |||||||||||||
Net realized and unrealized gains (losses) | (0.69 | ) | 1.47 | 0.02 | 0.10 | 0.40 | ||||||||||||||
|
| |||||||||||||||||||
Total from investment operations | (0.71 | ) | 1.43 | 0.03 | 0.18 | 0.43 | ||||||||||||||
|
| |||||||||||||||||||
| Less distributions from: | ||||||||||||||||||||
Net investment income | (0.10 | ) | — | (0.11 | ) | — | (0.19 | ) | ||||||||||||
Net realized gains | (0.50 | ) | (0.10 | ) | (0.01 | ) | (0.25 | ) | — | |||||||||||
|
| |||||||||||||||||||
Total distributions | (0.60 | ) | (0.10 | ) | (0.12 | ) | (0.25 | ) | (0.19 | ) | ||||||||||
|
| |||||||||||||||||||
Net asset value, end of year | $ | 11.27 | $ | 12.58 | $ | 11.25 | $ | 11.34 | $ | 11.41 | ||||||||||
|
| |||||||||||||||||||
Total return | (6.05)% | 12.61% | 0.27% | 1.70% | 3.83% | |||||||||||||||
| Ratios to average net assets | ||||||||||||||||||||
Expenses before waiver, payments by affiliates and expense reductionc | 2.44% | 2.50% | 2.26% | 2.41% | 2.46% | |||||||||||||||
Expenses net of waiver, payments by affiliates and expense reductionc | 2.32% | d | 2.32% | 2.07% | 2.23% | 2.24% | ||||||||||||||
Expenses incurred in connection with securities sold short | 0.40% | 0.44% | 0.20% | 0.36% | 0.39% | |||||||||||||||
Net investment income (loss) | (0.18)% | (0.35)% | 0.08% | 0.69% | 0.41% | |||||||||||||||
| Supplemental data | ||||||||||||||||||||
Net assets, end of year (000’s) | $47,851 | $27,471 | $15,537 | $42,842 | $31,805 | |||||||||||||||
Portfolio turnover rate | 177.61% | 236.64% | 271.51% | 235.47% | 234.77% | |||||||||||||||
aThe amount shown for a share outstanding throughout the period may not correlate with the Consolidated Statement of Operations for the period due to the timing of sales and repurchases of the Fund’s shares in relation to income earned and/or fluctuating fair value of the investments of the Fund.
bBased on average daily shares outstanding.
cIncludes dividend and/or interest expense on securities sold short and security borrowing fees, if any. See below for the ratios of such expenses to average net assets for the periods presented. See Note 1(f).
dBenefit of expense reduction rounds to less than 0.01%.
| 14 | Annual Report | The accompanying notes are an integral part of these consolidated financial statements. | franklintempleton.com | ||||||||
FRANKLIN ALTERNATIVE STRATEGIES FUNDS
CONSOLIDATED FINANCIAL HIGHLIGHTS
Franklin K2 Alternative Strategies Fund (continued)
| Year Ended May 31, | ||||||||||||||||||||
| 2022 | 2021 | 2020 | 2019 | 2018 | ||||||||||||||||
| Advisor Class | ||||||||||||||||||||
| Per share operating performance (for a share outstanding throughout the year) | ||||||||||||||||||||
Net asset value, beginning of year | $ | 12.55 | $ | 11.23 | $ | 11.33 | $ | 11.40 | $ | 11.16 | ||||||||||
|
| |||||||||||||||||||
| Income from investment operationsa: | ||||||||||||||||||||
Net investment income (loss)b | (0.03 | ) | (0.05 | ) | — | c | 0.07 | 0.04 | ||||||||||||
Net realized and unrealized gains (losses) | (0.69 | ) | 1.47 | 0.01 | 0.11 | 0.38 | ||||||||||||||
|
| |||||||||||||||||||
Total from investment operations | (0.72 | ) | 1.42 | 0.01 | 0.18 | 0.42 | ||||||||||||||
|
| |||||||||||||||||||
| Less distributions from: | ||||||||||||||||||||
Net investment income | (0.09 | ) | — | (0.10 | ) | — | (0.18 | ) | ||||||||||||
Net realized gains | (0.50 | ) | (0.10 | ) | (0.01 | ) | (0.25 | ) | — | |||||||||||
|
| |||||||||||||||||||
Total distributions | (0.59 | ) | (0.10 | ) | (0.11 | ) | (0.25 | ) | (0.18 | ) | ||||||||||
|
| |||||||||||||||||||
Net asset value, end of year | $ | 11.24 | $ | 12.55 | $ | 11.23 | $ | 11.33 | $ | 11.40 | ||||||||||
|
| |||||||||||||||||||
Total return | (6.05)% | 12.55% | 0.19% | 1.61% | 3.75% | |||||||||||||||
| Ratios to average net assets | ||||||||||||||||||||
Expenses before waiver, payments by affiliates and expense reductiond | 2.50% | 2.57% | 2.33% | 2.48% | 2.56% | |||||||||||||||
Expenses net of waiver, payments by affiliates and expense reductiond | 2.35% | e | 2.39% | 2.15% | 2.31% | 2.34% | ||||||||||||||
Expenses incurred in connection with securities sold short | 0.40% | 0.44% | 0.20% | 0.36% | 0.39% | |||||||||||||||
Net investment income (loss) | (0.24)% | (0.42)% | — | f | 0.61% | 0.31% | ||||||||||||||
| Supplemental data | ||||||||||||||||||||
Net assets, end of year (000’s) | $1,099,387 | $1,152,105 | $977,094 | $1,046,252 | $896,278 | |||||||||||||||
Portfolio turnover rate | 177.61% | 236.64% | 271.51% | 235.47% | 234.77% | |||||||||||||||
aThe amount shown for a share outstanding throughout the period may not correlate with the Consolidated Statement of Operations for the period due to the timing of sales and repurchases of the Fund’s shares in relation to income earned and/or fluctuating fair value of the investments of the Fund.
bBased on average daily shares outstanding.
cAmount rounds to less than $0.01.
dIncludes dividend and/or interest expense on securities sold short and security borrowing fees, if any. See below for the ratios of such expenses to average net assets for the periods presented. See Note 1(f).
eBenefit of expense reduction rounds to less than 0.01%.
fAmount rounds to less than 0.01%.
| franklintempleton.com | The accompanying notes are an integral part of these consolidated financial statements. | Annual Report | 15 | ||||||||
FRANKLIN ALTERNATIVE STRATEGIES FUNDS
Consolidated Schedule of Investments, May 31, 2022
Franklin K2 Alternative Strategies Fund
| Country | Shares/ Warrants/ Rights | Value | ||||||||||||||||
| Common Stocks and Other Equity Interests 37.7% | ||||||||||||||||||
| Aerospace & Defense 0.1% | ||||||||||||||||||
| a | Bombardier Inc., A | Canada | 61,213 | $ | 67,270 | |||||||||||||
| a | Bombardier Inc., B | Canada | 564,370 | 530,972 | ||||||||||||||
L3harris Technologies Inc. | United States | 64 | 15,418 | |||||||||||||||
| b | Lockheed Martin Corp. | United States | 265 | 116,629 | ||||||||||||||
| a | Satellogic Inc., 1/25/27, wts. | United States | 2,058 | 1,559 | ||||||||||||||
| a | Vertical Aerospace Ltd., 12/16/26, wts. | United States | 1,366 | 995 | ||||||||||||||
|
| |||||||||||||||||
| 732,843 | ||||||||||||||||||
|
| |||||||||||||||||
| Air Freight & Logistics 0.0%† | ||||||||||||||||||
Expeditors International of Washington Inc. | United States | 1,059 | 115,262 | |||||||||||||||
| a | GXO Logistics Inc. | United States | 6,905 | 374,734 | ||||||||||||||
United Parcel Service Inc., B | United States | 481 | 87,662 | |||||||||||||||
|
| |||||||||||||||||
| 577,658 | ||||||||||||||||||
|
| |||||||||||||||||
| Airlines 0.0%† | ||||||||||||||||||
| a | Controladora Vuela Cia de Aviacion SAB de CV, ADR | Mexico | 4,428 | 68,988 | ||||||||||||||
|
| |||||||||||||||||
| Auto Components 0.0%† | ||||||||||||||||||
| a,c | Luminar Technologies Inc., A | United States | 12,104 | 125,155 | ||||||||||||||
|
| |||||||||||||||||
| Automobiles 0.0%† | ||||||||||||||||||
| a,c | Lucid Group Inc. | United States | 1,930 | 38,947 | ||||||||||||||
|
| |||||||||||||||||
| Banks 0.3% | ||||||||||||||||||
Barclays PLC | United Kingdom | 78,773 | 167,912 | |||||||||||||||
| d | First Citizens Bancshares Inc., A | United States | 2,630 | 1,842,052 | ||||||||||||||
First Horizon Corp. | United States | 70,514 | 1,609,835 | |||||||||||||||
|
| |||||||||||||||||
| 3,619,799 | ||||||||||||||||||
|
| |||||||||||||||||
| Beverages 0.3% | ||||||||||||||||||
| b | The Coca-Cola Co. | United States | 4,361 | 276,400 | ||||||||||||||
Davide Campari-Milano NV | Italy | 279,710 | 2,991,069 | |||||||||||||||
|
| |||||||||||||||||
| 3,267,469 | ||||||||||||||||||
|
| |||||||||||||||||
| Biotechnology 0.9% | ||||||||||||||||||
| b,d | AbbVie Inc. | United States | 11,905 | 1,754,440 | ||||||||||||||
| a,d | Apellis Pharmaceuticals Inc. | United States | 24,005 | 995,007 | ||||||||||||||
| a | Arcutis Biotherapeutics Inc. | United States | 8,338 | 174,098 | ||||||||||||||
| a | Argenx SE, ADR | Netherlands | 3,151 | 974,604 | ||||||||||||||
| a | Biohaven Pharmaceutical Holding Company Ltd. | United States | 13,629 | 1,958,896 | ||||||||||||||
| a,d | BioMarin Pharmaceutical Inc. | United States | 14,497 | 1,089,160 | ||||||||||||||
| a | Galapagos NV, ADR | Belgium | 6,069 | 333,856 | ||||||||||||||
| a | Horizon Therapeutics PLC | United States | 8,241 | 739,135 | ||||||||||||||
| a,c | Karyopharm Therapeutics Inc. | United States | 1,000 | 6,280 | ||||||||||||||
| a | Neurocrine Biosciences Inc. | United States | 1,033 | 96,575 | ||||||||||||||
| a | Seagen Inc. | United States | 7,158 | 971,197 | ||||||||||||||
| a,d | Vertex Pharmaceuticals Inc. | United States | 6,547 | 1,758,852 | ||||||||||||||
|
| |||||||||||||||||
| 10,852,100 | ||||||||||||||||||
|
| |||||||||||||||||
| Building Products 0.1% | ||||||||||||||||||
| a | Cornerstone Building Brands Inc. | United States | 50,860 | 1,248,613 | ||||||||||||||
|
| |||||||||||||||||
| Capital Markets 0.7% | ||||||||||||||||||
| e | Amundi SA, 144A | France | 26,558 | 1,546,841 | ||||||||||||||
| e | Anima Holding SpA, 144A | Italy | 102,616 | 494,719 | ||||||||||||||
BlackRock Inc., A | United States | 168 | 112,405 | |||||||||||||||
The Blackstone Group Inc., A | United States | 21,075 | 2,482,424 | |||||||||||||||
| d | Moody’s Corp. | United States | 6,862 | 2,069,373 | ||||||||||||||
| 16 | Annual Report | franklintempleton.com | ||||||||
FRANKLIN ALTERNATIVE STRATEGIES FUNDS
CONSOLIDATED SCHEDULE OF INVESTMENTS
Franklin K2 Alternative Strategies Fund (continued)
| Country | Shares/ Warrants/ Rights | Value | ||||||||||||||||
| Common Stocks and Other Equity Interests (continued) | ||||||||||||||||||
| Capital Markets (continued) | ||||||||||||||||||
Morgan Stanley | United States | 990 | $ | 85,279 | ||||||||||||||
S&P Global Inc. | United States | 6,451 | 2,254,496 | |||||||||||||||
| a | SCVX Corp., A | United States | 34 | 339 | ||||||||||||||
|
| |||||||||||||||||
| 9,045,876 | ||||||||||||||||||
|
| |||||||||||||||||
| Chemicals 0.8% | ||||||||||||||||||
| a | Amyris Inc. | United States | 3,000 | 7,650 | ||||||||||||||
The Sherwin-Williams Co. | United States | 32,164 | 8,621,239 | |||||||||||||||
Sociedad Quimica y Minera de Chile SA, ADR | Chile | 583 | 61,897 | |||||||||||||||
| a | Tronox Holdings PLC, A | United States | 24,406 | 439,552 | ||||||||||||||
Valvoline Inc. | United States | 24,867 | 832,050 | |||||||||||||||
|
| |||||||||||||||||
| 9,962,388 | ||||||||||||||||||
|
| |||||||||||||||||
| Commercial Services & Supplies 0.8% | ||||||||||||||||||
Cintas Corp. | United States | 11,128 | 4,432,616 | |||||||||||||||
| a | Digital Transformation Opportunities Corp., A | United States | 39,182 | 383,396 | ||||||||||||||
| a | Digital Transformation Opportunities Corp., A, 3/31/28, wts. | United States | 9,795 | 2,047 | ||||||||||||||
| d | Republic Services Inc., A | United States | 40,305 | 5,394,421 | ||||||||||||||
| a | Shapeways Holdings Inc., 10/31/26, wts. | United States | 13,286 | 2,259 | ||||||||||||||
|
| |||||||||||||||||
| 10,214,739 | ||||||||||||||||||
|
| |||||||||||||||||
| Communications Equipment 0.3% | ||||||||||||||||||
| a | Adva Optical Networking SE | Germany | 165,632 | 2,596,701 | ||||||||||||||
| a,d | Arista Networks Inc. | United States | 15,098 | 1,544,223 | ||||||||||||||
Cisco Systems Inc. | United States | 1,891 | 85,190 | |||||||||||||||
| a | Riverbed Technology Inc. | United States | 5,404 | 15,312 | ||||||||||||||
|
| |||||||||||||||||
| 4,241,426 | ||||||||||||||||||
|
| |||||||||||||||||
| Construction & Engineering 0.7% | ||||||||||||||||||
| d | AECOM | United States | 15,880 | 1,109,218 | ||||||||||||||
Boskalis Westminster | Netherlands | 25,882 | 901,551 | |||||||||||||||
| a,d | Mastec Inc. | United States | 28,972 | 2,421,769 | ||||||||||||||
| d | Quanta Services Inc. | United States | 31,920 | 3,798,480 | ||||||||||||||
|
| |||||||||||||||||
| 8,231,018 | ||||||||||||||||||
|
| |||||||||||||||||
| Construction Materials 0.3% | ||||||||||||||||||
| a | Cemex SAB de CV, ADR | Mexico | 65,996 | 308,202 | ||||||||||||||
LafargeHolcim Ltd., B | Switzerland | 66,680 | 3,306,110 | |||||||||||||||
|
| |||||||||||||||||
| 3,614,312 | ||||||||||||||||||
|
| |||||||||||||||||
| Containers & Packaging 0.8% | ||||||||||||||||||
Ball Corp. | United States | 118,073 | 8,370,195 | |||||||||||||||
Intertape Polymer Group Inc. | Canada | 37,201 | 1,159,397 | |||||||||||||||
|
| |||||||||||||||||
| 9,529,592 | ||||||||||||||||||
|
| |||||||||||||||||
| Distributors 0.3% | ||||||||||||||||||
Pool Corp. | United States | 9,119 | 3,635,016 | |||||||||||||||
|
| |||||||||||||||||
| Diversified Consumer Services 0.1% | ||||||||||||||||||
| a,c | Mister Car Wash Inc. | United States | 62,777 | 762,113 | ||||||||||||||
| a | Terminix Global Holdings Inc. | United States | 18,340 | 796,139 | ||||||||||||||
|
| |||||||||||||||||
| 1,558,252 | ||||||||||||||||||
|
| |||||||||||||||||
| Diversified Financial Services 2.5% | ||||||||||||||||||
| a | 2MX Organic SA, 11/16/25, wts. | France | 3,920 | 726 | ||||||||||||||
| a | 7GC & Co. Holdings Inc., A, 12/31/26, wts. | United States | 3,244 | 454 | ||||||||||||||
| a | Acropolis Infrastructure Acquisition Corp., A, 3/31/26, wts. | United States | 14 | 4 | ||||||||||||||
| franklintempleton.com | Annual Report | 17 | ||||||||
FRANKLIN ALTERNATIVE STRATEGIES FUNDS
CONSOLIDATED SCHEDULE OF INVESTMENTS
Franklin K2 Alternative Strategies Fund (continued)
| Country | Shares/ Warrants/ Rights | Value | ||||||||||||||||
| Common Stocks and Other Equity Interests (continued) | ||||||||||||||||||
| Diversified Financial Services (continued) | ||||||||||||||||||
| a | AEA-Bridges Impact Corp., A | Cayman Islands | 28,592 | $ | 283,347 | |||||||||||||
| a | Aequi Acquisition Corp., A | United States | 13,355 | 131,547 | ||||||||||||||
| a | Aequi Acquisition Corp., A, 11/30/27, wts. | United States | 490 | 71 | ||||||||||||||
| a | African Gold Acquisition Corp., A | United States | 6,518 | 63,681 | ||||||||||||||
| a | African Gold Acquisition Corp., A, 3/13/28, wts. | United States | 4,750 | 523 | ||||||||||||||
| a | Agile Growth Corp., A | United States | 3,910 | 38,162 | ||||||||||||||
| a | Agile Growth Corp., A, 12/31/27, wts. | United States | 1,303 | 274 | ||||||||||||||
| a | Ahren Acquisition Corp. | Cayman Islands | 51,168 | 507,587 | ||||||||||||||
| a | Ahren Acquisition Corp., 6/17/28, wts. | Cayman Islands | 8,568 | 1,600 | ||||||||||||||
| a | Altimeter Growth Corp. 2, A | United States | 6,603 | 64,907 | ||||||||||||||
| a | Angel Pond Holdings Corp., A | United States | 7,260 | 71,438 | ||||||||||||||
| a | Anthemis Digital Acquisitions I Corp. | United States | 17,623 | 175,261 | ||||||||||||||
| a | Apollo Strategic Growth Capital II, A | United States | 8,845 | 86,492 | ||||||||||||||
| a | Apollo Strategic Growth Capital II, A, 12/31/27, wts. | United States | 5,294 | 2,063 | ||||||||||||||
| a | APx Acquisition Corp. I | Mexico | 13,835 | 138,073 | ||||||||||||||
| a | Ares Acquisition Corp., A | United States | 13,000 | 127,530 | ||||||||||||||
| a | Ares Acquisition Corp., A, 12/31/27, wts. | United States | 11,095 | 2,664 | ||||||||||||||
| a | Ascendant Digital Acquisition Corp. III, A | United States | 4,732 | 47,344 | ||||||||||||||
| a | Athena Consumer Acquisition Corp., A | United States | 26,389 | 264,286 | ||||||||||||||
| a | Athena Consumer Acquisition Corp., A, 7/20/23, wts. | United States | 13,194 | 2,176 | ||||||||||||||
| a,d | Athena Technology Acquisition Corp. II, A | United States | 61,944 | 605,193 | ||||||||||||||
| a,d | Athena Technology Acquisition Corp. II, A, 10/17/28, wts. | United States | 30,972 | 4,590 | ||||||||||||||
| a,d | Atlantic Avenue Acquisition Corp., A | United States | 8,680 | 85,845 | ||||||||||||||
| a,d | Atlantic Coastal Acquisition Corp., A | United States | 16,329 | 159,371 | ||||||||||||||
| a | Atlantic Coastal Acquisition Corp., A, 12/31/27, wts. | United States | 5,443 | 762 | ||||||||||||||
| a,d | Atlas Crest Investment Corp. II, A | United States | 20,011 | 196,108 | ||||||||||||||
| a | Atlas Crest Investment Corp. II, A, 2/28/26, wts. | United States | 8,969 | 1,771 | ||||||||||||||
| a | Austerlitz Acquisition Corp. I, A | United States | 45,624 | 446,203 | ||||||||||||||
| a | Austerlitz Acquisition Corp. I, A, 2/19/26, wts. | United States | 9,532 | 3,091 | ||||||||||||||
| a | Austerlitz Acquisition Corp. II, A | United States | 57,148 | 558,907 | ||||||||||||||
| a | Austerlitz Acquisition Corp. II, A, 12/31/27, wts. | United States | 30,317 | 11,824 | ||||||||||||||
| a | B Riley Principal 250 Merger Corp., A, 12/31/27, wts. | United States | 2,651 | 665 | ||||||||||||||
| a | Blue Whale Acquisition Corp. I, A | United Arab Emirates | 12,829 | 123,672 | ||||||||||||||
| a | Blue Whale Acquisition Corp. I, A, 7/09/23, wts. | United Arab Emirates | 1,005 | 327 | ||||||||||||||
| a | Bridgetown Holdings Ltd., A | Hong Kong | 3,261 | 32,284 | ||||||||||||||
| a,d | Broadscale Acquisition Corp., A | United States | 12,221 | 119,521 | ||||||||||||||
| a | Broadscale Acquisition Corp., A, 2/02/26, wts. | United States | 8,569 | 4,458 | ||||||||||||||
| a | Capitalworks Emerging Markets Acquisition Corp., 4/27/28, wts. | United States | 7,737 | 696 | ||||||||||||||
| a | Capitalworks Emerging Markets Acquisition Corp., A | United States | 15,474 | 154,276 | ||||||||||||||
| a,d | Carney Technology Acquisition Corp. II, A | United States | 12,636 | 124,212 | ||||||||||||||
| a | Carney Technology Acquisition Corp. II, A, 11/30/27, wts. | United States | 5,876 | 1,058 | ||||||||||||||
| a | Cartesian Growth Corp., 12/31/27, wts. | United States | 13,908 | 9,876 | ||||||||||||||
| a | CC Neuberger Principal Holdings II, 7/29/25, wts. | United States | 11,692 | 7,813 | ||||||||||||||
| a | CC Neuberger Principal Holdings II, A | United States | 12,116 | 120,554 | ||||||||||||||
| a | CC Neuberger Principal Holdings III | United States | 558 | 5,541 | ||||||||||||||
| a | CC Neuberger Principal Holdings III, 12/31/27, wts. | United States | 6,916 | 2,558 | ||||||||||||||
| a,d | Churchill Capital Corp. V, A | United States | 6,430 | 63,014 | ||||||||||||||
| a | Churchill Capital Corp. VI, A | United States | 1,080 | 10,541 | ||||||||||||||
| a | Churchill Capital Corp. VII, A | United States | 9,560 | 93,497 | ||||||||||||||
| a,d | CIIG Capital Partners II Inc., A | United States | 10,448 | 103,487 | ||||||||||||||
| a,d | CIIG Capital Partners II Inc., A, 2/28/28, wts. | United States | 5,224 | 731 | ||||||||||||||
| a | Clarim Acquisition Corp., A | United States | 50,724 | 497,095 | ||||||||||||||
| a | Clarim Acquisition Corp., A, 12/31/27, wts. | United States | 13,108 | 1,835 | ||||||||||||||
| a,d | Class Acceleration Corp., A | United States | 13,473 | 132,035 | ||||||||||||||
| a | Climate Real Impact Solutions II Acquisition Corp., A | United States | 563 | 5,534 | ||||||||||||||
| 18 | Annual Report | franklintempleton.com | ||||||||
FRANKLIN ALTERNATIVE STRATEGIES FUNDS
CONSOLIDATED SCHEDULE OF INVESTMENTS
Franklin K2 Alternative Strategies Fund (continued)
| Country | Shares/ Warrants/ Rights | Value | ||||||||||||||||
| Common Stocks and Other Equity Interests (continued) | ||||||||||||||||||
| Diversified Financial Services (continued) | ||||||||||||||||||
| a | Climate Real Impact Solutions II Acquisition Corp., A, 12/31/27, wts. | United States | 112 | $ | 29 | |||||||||||||
| a | Colicity Inc., A | United States | 37,960 | 372,594 | ||||||||||||||
| a | Colonnade Acquisition Corp. II, 12/31/27, wts. | United States | 13,654 | 2,191 | ||||||||||||||
| a,d | Concord Acquisition Corp. II, A | United States | 79,080 | 762,331 | ||||||||||||||
| a,d | Concord Acquisition Corp. II, A, 12/31/28, wts. | United States | 26,360 | 10,014 | ||||||||||||||
| a | Concord Acquisition Corp. III, A | United States | 9,774 | 96,763 | ||||||||||||||
| a | Concord Acquisition Corp. III, A, 12/31/28, wts. | United States | 4,887 | 1,368 | ||||||||||||||
| a,d | Conyers Park III Acquisition Corp., A | United States | 8,071 | 78,047 | ||||||||||||||
| a | Conyers Park III Acquisition Corp., A, 8/12/28, wts. | United States | 2,812 | 975 | ||||||||||||||
| a | Corner Growth Acquisition Corp., A | United States | 40,029 | 396,980 | ||||||||||||||
| a | Corner Growth Acquisition Corp., A, 3/01/23, wts. | United States | 5,737 | 516 | ||||||||||||||
| a | Corner Growth Acquisition Corp., A, 12/31/27, wts. | United States | 7,606 | 728 | ||||||||||||||
| a | Corsair Partnering Corp., A | United States | 3,898 | 37,947 | ||||||||||||||
| a | Crown PropTech Acquisitions, 12/31/27, wts. | United States | 12,844 | 2,312 | ||||||||||||||
| a,d | Crucible Acquisition Corp., A | United States | 4,437 | 43,571 | ||||||||||||||
| a,d | Crucible Acquisition Corp., A, 12/26/25, wts. | United States | 1,479 | 237 | ||||||||||||||
| a | Crypto 1 Acquisition Corp., A | United States | 7,736 | 76,586 | ||||||||||||||
| a | Crystal Peak Acquisition, 6/22/26, wts. | Netherlands | 2,725 | — | ||||||||||||||
| a | Crystal Peak Acquisition, A | Netherlands | 6,767 | 66,317 | ||||||||||||||
| a | DHC Acquisition Corp., A | United States | 6,265 | 61,146 | ||||||||||||||
| a | DHC Acquisition Corp., A, 12/31/27, wts. | United States | 241 | 32 | ||||||||||||||
| a | Disruptive Acquisition Corp. I, A | United States | 6,844 | 66,797 | ||||||||||||||
| a,d | dMY Technology Group Inc. VI | United States | 26,930 | 262,837 | ||||||||||||||
| a,d | dMY Technology Group Inc. VI, 6/25/23, wts. | United States | 13,465 | 5,521 | ||||||||||||||
| a | Dragoneer Growth Opportunities Corp. III, A | United States | 26,406 | 257,194 | ||||||||||||||
| a,c | EJF Acquisition Corp., A | United States | 63,265 | 629,487 | ||||||||||||||
| a | Elliott Opportunity II Corp., A | United States | 60,876 | 590,497 | ||||||||||||||
| a | Elliott Opportunity II Corp., A, 2/19/23, wts. | United States | 9,039 | 3,182 | ||||||||||||||
| a | Energy Transition Partners BV | Netherlands | 3,372 | 35,386 | ||||||||||||||
| a | Energy Transition Partners BV, 7/16/26, wts. | Netherlands | 1,124 | 504 | ||||||||||||||
| a | Enterprise 4.0 Technology Acquisition Corp. | United States | 16,406 | 162,583 | ||||||||||||||
| a | Enterprise 4.0 Technology Acquisition Corp., 9/24/23, wts. | United States | 8,203 | 1,591 | ||||||||||||||
| d | Equitable Holdings Inc. | United States | 37,887 | 1,152,144 | ||||||||||||||
| a | ESM Acquisition Corp., A | United States | 8,367 | 81,787 | ||||||||||||||
| a | European Biotech Acquisition Corp., A | Netherlands | 1,230 | 12,036 | ||||||||||||||
| a | Executive Network Partnering Corp., A | United States | 19,832 | 198,122 | ||||||||||||||
| a | Executive Network Partnering Corp., A, 9/25/28, wts. | United States | 2,901 | 2,669 | ||||||||||||||
| a,d | Far Peak Acquisition Corp., A | United States | 25,821 | 253,562 | ||||||||||||||
| a,d | Fast Acquisition Corp., A | United States | 20,525 | 206,892 | ||||||||||||||
| a,d | Fast Acquisition Corp. II, A | United States | 14,427 | 140,952 | ||||||||||||||
| a,d | Fast Acquisition Corp. II, A, 3/16/26, wts. | United States | 3,606 | 503 | ||||||||||||||
| a | Fifth Wall Acquisition Corp. III, A | United States | 5,283 | 51,351 | ||||||||||||||
| a | Figure Acquisition Corp. I, A | United States | 1,393 | 13,631 | ||||||||||||||
| a | Figure Acquisition Corp. I, A, 12/31/27, wts. | United States | 1,176 | 335 | ||||||||||||||
| a,d | Fintech Acquisition Corp. VI, A | United States | 39,608 | 389,347 | ||||||||||||||
| a,d | Fintech Acquisition Corp. VI, A, 12/31/27, wts. | United States | 9,902 | 1,497 | ||||||||||||||
| a | Fintech Evolution Acquisition Group, 3/31/28, wts. | United States | 5,865 | 879 | ||||||||||||||
| a | Fintech Evolution Acquisition Group, A | United States | 17,597 | 172,011 | ||||||||||||||
| a | First Reserve Sustainable Growth Corp., A | United States | 32,362 | 315,853 | ||||||||||||||
| a | First Reserve Sustainable Growth Corp., A, 12/31/27, wts. | United States | 8,090 | 1,134 | ||||||||||||||
| a | Focus Impact Acquisition Corp., A | United States | 13,236 | 131,632 | ||||||||||||||
| a | Focus Impact Acquisition Corp., A, 4/23/23, wts. | United States | 6,618 | 993 | ||||||||||||||
| a | Fortress Capital Acquisition Corp., A | United States | 9,805 | 96,187 | ||||||||||||||
| a | Fortress Capital Acquisition Corp., A, 12/31/27, wts. | United States | 12,102 | 2,783 | ||||||||||||||
| a,d | Fortress Value Acquisition Corp. III, A | United States | 10,335 | 101,696 | ||||||||||||||
| franklintempleton.com | Annual Report | 19 | ||||||||
FRANKLIN ALTERNATIVE STRATEGIES FUNDS
CONSOLIDATED SCHEDULE OF INVESTMENTS
Franklin K2 Alternative Strategies Fund (continued)
| Country | Shares/ Warrants/ Rights | Value | ||||||||||||||||
| Common Stocks and Other Equity Interests (continued) | ||||||||||||||||||
| Diversified Financial Services (continued) | ||||||||||||||||||
| a | Fortress Value Acquisition Corp. IV, A | United States | 8,256 | $ | 80,826 | |||||||||||||
| a,d | Fortress Value Acquisition Corp. IV, A, 3/18/28, wts. | United States | 10,687 | 3,149 | ||||||||||||||
| a | Forum Merger IV Corp., A | United States | 8,175 | 79,870 | ||||||||||||||
| a | Forum Merger IV Corp., A, 12/31/27, wts. | United States | 704 | 190 | ||||||||||||||
| a | Freedom Acquisition I Corp., A | United States | 1,955 | 19,159 | ||||||||||||||
| a | FTAC Athena Acquisition Corp., A | United States | 28,460 | 278,623 | ||||||||||||||
| a | FTAC Hera Acquisition Corp., A | United States | 41,936 | 410,134 | ||||||||||||||
| a,d | FTAC Parnassus Acquisition Corp., A | United States | 49,016 | 480,112 | ||||||||||||||
| a | FTAC Parnassus Acquisition Corp., A, 3/10/26, wts. | United States | 12,254 | 2,929 | ||||||||||||||
| a | FTAC Zeus Acquisition Corp., A | United States | 6,342 | 62,500 | ||||||||||||||
| a | FTAC Zeus Acquisition Corp., A, 12/31/27, wts. | United States | 3,171 | 666 | ||||||||||||||
| a,d | Fusion Acquisition Corp. II, A | United States | 15,892 | 155,264 | ||||||||||||||
| a,d | Fusion Acquisition Corp. II, A, 12/31/27, wts. | United States | 5,297 | 688 | ||||||||||||||
| a | G Squared Ascend I Inc., A | United States | 5,572 | 54,884 | ||||||||||||||
| a | G Squared Ascend I Inc., A, 12/31/27, wts. | United States | 1,114 | 353 | ||||||||||||||
| a | Glenfarne Merger Corp., A | United States | 1,231 | 12,027 | ||||||||||||||
| a | Glenfarne Merger Corp., A, 12/31/27, wts. | United States | 323 | 56 | ||||||||||||||
| a | Global Partner Acquisition Corp. II, A | United States | 17,700 | 173,814 | ||||||||||||||
| a | Global Partner Acquisition Corp. II, A, 12/31/27, wts. | United States | 2,950 | 595 | ||||||||||||||
| a | Gores Holdings VII Inc., A | United States | 42,125 | 413,278 | ||||||||||||||
| a | Gores Holdings VII Inc., A, 12/31/27, wts. | United States | 2,103 | 1,054 | ||||||||||||||
| a,d | Gores Holdings VIII Inc., A | United States | 10,517 | 103,803 | ||||||||||||||
| a,d | Gores Holdings VIII Inc., A, 12/31/27, wts. | United States | 1,116 | 770 | ||||||||||||||
| a,d | Gores Technology Partners II Inc., A | United States | 15,940 | 155,946 | ||||||||||||||
| a,d | Gores Technology Partners II Inc., A, 12/31/27, wts. | United States | 2,192 | 986 | ||||||||||||||
| a,d | Gores Technology Partners Inc., A | United States | 11,237 | 109,754 | ||||||||||||||
| a,d | Gores Technology Partners Inc., A, 12/31/27, wts. | United States | 1,971 | 1,084 | ||||||||||||||
| a | Group Nine Acquisition Corp., A | United States | 22,173 | 217,295 | ||||||||||||||
| a | Growth For Good Acquisition Corp. | United States | 5,935 | 57,688 | ||||||||||||||
| a | Growth For Good Acquisition Corp., Contingent Value, rts., 6/14/23 | United States | 5,118 | 563 | ||||||||||||||
| a | HCM Acquisition Corp. | United States | 13,460 | 133,389 | ||||||||||||||
| a | Healthcare AI Acquisition Corp. | Cayman Islands | 1,582 | 15,820 | ||||||||||||||
| a,d | Healthcare Services Acquisition Corp., A | United States | 3,074 | 30,156 | ||||||||||||||
| a | Healthcare Services Acquisition Corp., A, 12/31/27, wts. | United States | 4,019 | 562 | ||||||||||||||
| a | Heartland Media Acquisition Corp. | United States | 13,462 | 134,755 | ||||||||||||||
| a | Hedosophia European Growth | United Kingdom | 35,835 | 378,401 | ||||||||||||||
| a | Hedosophia European Growth, 5/13/27, wts. | United Kingdom | 11,638 | 2,618 | ||||||||||||||
| a | Innovative International Acquisition Corp., A | United States | 13,172 | 131,588 | ||||||||||||||
| a | Investcorp Europe Acquistion Corp. I, A | United States | 40,934 | 407,703 | ||||||||||||||
| a | Investcorp Europe Acqusition Corp. I, 11/23/28, wts. | United States | 9,717 | 1,948 | ||||||||||||||
| a | ION Acquisition Corp. III Ltd., A | Israel | 11,154 | 109,197 | ||||||||||||||
Iron Spark I Inc., A | United States | 5,353 | 52,888 | |||||||||||||||
| a | Jackson Acquisition Co., A | United States | 5,933 | 57,995 | ||||||||||||||
| a | Jackson Acquisition Co., A, 12/31/28, wts. | United States | 2,966 | 630 | ||||||||||||||
| a | Jaws Hurricane Acquisition Corp., A, 2/23/23, wts. | United States | 3,747 | 1,573 | ||||||||||||||
| a | Jaws Juggernaut Acquisition Corp., A | United States | 6,381 | 61,896 | ||||||||||||||
| a | Jaws Juggernaut Acquisition Corp., A, 2/12/26, wts. | United States | 4,284 | 1,970 | ||||||||||||||
| a | Jaws Mustang Acquisition Corp., A | United States | 13,995 | 137,642 | ||||||||||||||
| a | Jaws Mustang Acquisition Corp., A, 1/30/26, wts. | United States | 6,663 | 2,349 | ||||||||||||||
| a | JOFF Fintech Acquisition Corp., A | United States | 5,277 | 51,609 | ||||||||||||||
| a | Juniper II Corp., A | United States | 11,402 | 112,994 | ||||||||||||||
| a | Juniper II Corp., A, 12/31/28, wts. | United States | 5,701 | 2,115 | ||||||||||||||
| a | Kensington Capital Acquisition Corp. V, A | United States | 6,125 | 60,638 | ||||||||||||||
| a | Kensington Capital Acquisition Corp. V, A, 7/19/23, wts. | United States | 6,184 | 2,010 | ||||||||||||||
| a,d | Khosla Ventures Acquisition Co., A | United States | 27,304 | 266,214 | ||||||||||||||
| 20 | Annual Report | franklintempleton.com | ||||||||
FRANKLIN ALTERNATIVE STRATEGIES FUNDS
CONSOLIDATED SCHEDULE OF INVESTMENTS
Franklin K2 Alternative Strategies Fund (continued)
| Country | Shares/ Warrants/ Rights | Value | ||||||||||||||||
| Common Stocks and Other Equity Interests (continued) | ||||||||||||||||||
| Diversified Financial Services (continued) | ||||||||||||||||||
| a,d | Khosla Ventures Acquisition Co. III, A | United States | 28,830 | $ | 280,804 | |||||||||||||
| a,d | KKR Acquisition Holdings I Corp., A | United States | 10,052 | 98,510 | ||||||||||||||
| a,d | KKR Acquisition Holdings I Corp., A, 12/31/27, wts. | United States | 2,513 | 1,012 | ||||||||||||||
| a | Knightswan Acquisition Corp. | United States | 15,647 | 156,157 | ||||||||||||||
| a | L Catterton Asia Acquisition Corp., A | Singapore | 2,279 | 22,311 | ||||||||||||||
| a | Landcadia Holdings IV Inc., A | United States | 4,686 | 45,642 | ||||||||||||||
| a | Landcadia Holdings IV Inc., A, 12/31/28, wts. | United States | 1,171 | 445 | ||||||||||||||
| a | Lazard Growth Acquisition Corp. I | United States | 6,383 | 62,490 | ||||||||||||||
| a | LDH Growth Corp. I, A | United States | 615 | 6,009 | ||||||||||||||
| a | LDH Growth Corp. I, A, 12/31/28, wts. | United States | 97 | 24 | ||||||||||||||
| a | Lead Edge Growth Opportunities Ltd., A | United States | 4,701 | 45,929 | ||||||||||||||
| a | Lead Edge Growth Opportunities Ltd., A, 12/31/28, wts. | United States | 1,175 | 168 | ||||||||||||||
| a | Learn CW Investment Corp., A | United States | 19,726 | 195,189 | ||||||||||||||
| a | Learn CW Investment Corp., A, 12/31/28, wts. | United States | 9,863 | 2,041 | ||||||||||||||
| a | Legato Merger Corp. II | United States | 3,958 | 39,303 | ||||||||||||||
| a | Lerer Hippeau Acquisition Corp., A | United States | 20,644 | 201,279 | ||||||||||||||
| a | LF Capital Acquisition Corp. II, A | United States | 13,246 | 132,460 | ||||||||||||||
| a | Live Oak Crestview Climate Acquisition Corp., A, 3/12/26, wts. | United States | 452 | 205 | ||||||||||||||
| a | Live Oak Mobility Acquisition Corp., A | United States | 3,947 | 38,720 | ||||||||||||||
| a | Live Oak Mobility Acquisition Corp., A, 3/04/28, wts. | United States | 6,090 | 2,220 | ||||||||||||||
| a,d | Longview Acquisition Corp. II, A | United States | 14,811 | 144,555 | ||||||||||||||
| a | Longview Acquisition Corp. II, A, 5/10/26, wts. | United States | 12,250 | 2,193 | ||||||||||||||
| a | M3-Brigade Acquisition II Corp., A, 12/31/27, wts. | United States | 7,608 | 1,531 | ||||||||||||||
| a | Marlin Technology Corp., A | United States | 9,915 | 97,365 | ||||||||||||||
| a | MDH Acquisition Corp., A | United States | 4,587 | 44,998 | ||||||||||||||
| a | MDH Acquisition Corp., A, 2/02/28, wts. | United States | 1,198 | 115 | ||||||||||||||
| a | Motive Capital Corp. II, A | United States | 17,352 | 171,872 | ||||||||||||||
| a | Motive Capital Corp. II, A, 5/15/28, wts. | United States | 5,384 | 1,347 | ||||||||||||||
| a | The Music Acquisition Corp., A | United States | 5,363 | 52,665 | ||||||||||||||
| a | The Music Acquisition Corp., A, 2/05/28, wts. | United States | 2,681 | 402 | ||||||||||||||
| a | Nightdragon Acquisition Corp., A | United States | 23,249 | 226,910 | ||||||||||||||
| a | Nightdragon Acquisition Corp., A, 12/31/27, wts. | United States | 4,399 | 1,276 | ||||||||||||||
| a,c | North Atlantic Acquisition Corp., A | United States | 6,495 | 57,221 | ||||||||||||||
| a | Northern Star Investment Corp. II, A, 1/31/28, wts. | United States | 3,083 | 616 | ||||||||||||||
| a | Oaktree Acquisition Corp. II, A | United States | 17,512 | 174,420 | ||||||||||||||
| a | Obotech Acquisition SE, A | Luxembourg | 4,205 | 43,563 | ||||||||||||||
| a | Obotech Acquisition SE, A, 4/30/26, wts. | Luxembourg | 1,401 | 226 | ||||||||||||||
| a | One Equity Partners Open Water I Corp., A | United States | 2,269 | 22,236 | ||||||||||||||
| a | One Equity Partners Open Water I Corp., A, 12/31/27, wts. | United States | 756 | 113 | ||||||||||||||
| a | Orion Biotech Opportunities Corp., A | United States | 16,960 | 165,190 | ||||||||||||||
| a | Orion Biotech Opportunities Corp., A, 12/31/27, wts. | United States | 3,392 | 643 | ||||||||||||||
| a | Pathfinder Acquisition Corp., A | United States | 27,835 | 272,226 | ||||||||||||||
| a | Pathfinder Acquisition Corp., A, 12/31/27, wts. | United States | 5,567 | 802 | ||||||||||||||
| a | Pegasus Acquisition Co. Europe BV, A | Netherlands | 119,812 | 1,253,367 | ||||||||||||||
| a | Pegasus Acquisition Co. Europe BV, A, 4/27/26, wts. | Netherlands | 29,604 | 21,452 | ||||||||||||||
| a | Peridot Acquisition Corp. II, A | United States | 2,506 | 24,509 | ||||||||||||||
| a,d | Periphas Capital Partnering Corp., A | United States | 10,736 | 263,086 | ||||||||||||||
| a | Pershing Square Tontine Holdings Ltd., A | United States | 47,502 | 943,390 | ||||||||||||||
| a | Pine Technology Acquisition Corp., A, 3/31/28, wts. | United States | 3,876 | 390 | ||||||||||||||
| a | Pioneer Merger Corp., A | United States | 2,043 | 20,062 | ||||||||||||||
| a | Pioneer Merger Corp., A, 12/31/27, wts. | United States | 16,710 | 3,572 | ||||||||||||||
| a | Pontem Corp., 12/31/27, wts. | United States | 4,749 | 855 | ||||||||||||||
| a | Pontem Corp., A | United States | 16,446 | 161,500 | ||||||||||||||
| a | Population Health Investment Co. Inc., A | United States | 1,144 | 11,291 | ||||||||||||||
| a,d | Post Holdings Partnering Corp., A | United States | 12,717 | 123,101 | ||||||||||||||
| franklintempleton.com | Annual Report | 21 | ||||||||
FRANKLIN ALTERNATIVE STRATEGIES FUNDS
CONSOLIDATED SCHEDULE OF INVESTMENTS
Franklin K2 Alternative Strategies Fund (continued)
| Country | Shares/ Warrants/ Rights | Value | ||||||||||||||||
| Common Stocks and Other Equity Interests (continued) | ||||||||||||||||||
| Diversified Financial Services (continued) | ||||||||||||||||||
| a | Post Holdings Partnering Corp., A, 2/09/23, wts. | United States | 12,973 | $ | 5,449 | |||||||||||||
| a | Power & Digital Infrastructure Acquisition II Corp., A | United States | 27,088 | 265,733 | ||||||||||||||
| a | Power & Digital Infrastructure Acquisition II Corp., A, 12/14/28, wts. | United States | 13,544 | 4,401 | ||||||||||||||
| a | Powered Brands, A | United States | 3,648 | 35,860 | ||||||||||||||
| a | Primavera Capital Acquisition Corp., A | Hong Kong | 3,048 | 29,870 | ||||||||||||||
| a | Primavera Capital Acquisition Corp., A, 1/19/26, wts. | Hong Kong | 1,524 | 366 | ||||||||||||||
| a | PWP Forward Acquisition Corp. I, A | United States | 6,157 | 60,092 | ||||||||||||||
| a | RCF Acquisition Corp., 4/25/23, wts. | United States | 6,308 | 1,545 | ||||||||||||||
| a | RCF Acquisition Corp., A | United States | 12,616 | 125,529 | ||||||||||||||
| a | RedBall Acquisition Corp., A | United States | 3,852 | 36,132 | ||||||||||||||
| a | Rice Acquisition Corp. II, A | United States | 13,176 | 128,993 | ||||||||||||||
| a | Rice Acquisition Corp. II, A, 3/12/26, wts. | United States | 3,294 | 1,478 | ||||||||||||||
| a | Rigel Resource Acquisition Corp., A | United States | 8,142 | 80,687 | ||||||||||||||
| a | Rigel Resource Acquisition Corp., A, 4/19/23, wts. | United States | 4,071 | 845 | ||||||||||||||
| a | RMG Acquisition Corp. III, A | United States | 37,968 | 371,846 | ||||||||||||||
| a | Rosecliff Acquisition Corp. I, A | United States | 59,628 | 583,162 | ||||||||||||||
| a,d | Rosecliff Acquisition Corp. I, A, 12/31/27, wts. | United States | 19,875 | 3,408 | ||||||||||||||
| a,d | RXR Acquisition Corp., A | United States | 9,640 | 94,376 | ||||||||||||||
| a | Sarissa Capital Acquisition Corp., A | United States | 13,243 | 130,973 | ||||||||||||||
| a | Science Strategic Acquisition Corp. Alpha, A | United States | 5,442 | 53,277 | ||||||||||||||
| a | ScION Tech Growth I, A | United Kingdom | 3,306 | 32,564 | ||||||||||||||
| a | ScION Tech Growth II, A | United Kingdom | 2,073 | 20,315 | ||||||||||||||
| a | SCP & Co. Healthcare Acquisition Co., A, 1/27/28, wts. | United States | 1,482 | 170 | ||||||||||||||
| a | Screaming Eagle Acquisition Corp., A | United States | 96,744 | 930,677 | ||||||||||||||
| a | Screaming Eagle Acquisition Corp., A, 12/15/27, wts. | United States | 20,384 | 7,338 | ||||||||||||||
| a | Sculptor Acquisition Corp. I | United States | 1 | 10 | ||||||||||||||
| a | Sculptor Acquisition Corp. I, A | United States | 14,028 | 139,298 | ||||||||||||||
| a | Sculptor Acquistion Corp. I, 4/15/28, wts. | United States | 7,014 | 1,754 | ||||||||||||||
| a | Silver Crest Acquisition Corp., A | United States | 2,931 | 28,753 | ||||||||||||||
| a,d | Simon Property Group Acquisition Holdings Inc., A | United States | 31,634 | 309,380 | ||||||||||||||
| a | Slam Corp., A | United States | 24,487 | 239,728 | ||||||||||||||
| a | Slam Corp., A, 12/31/27, wts. | United States | 7,928 | 1,672 | ||||||||||||||
| a | Social Capital Hedosophia Holdings Corp., A | United States | 1,592 | 15,872 | ||||||||||||||
| a | Social Capital Hedosophia Holdings Corp. VI, A | United States | 8,600 | 85,914 | ||||||||||||||
| a | Social Capital Suvretta Holdings Corp. I, A | United States | 6,651 | 65,512 | ||||||||||||||
| a | Social Capital Suvretta Holdings Corp. II, A | United States | 14,142 | 136,895 | ||||||||||||||
| a,c | Social Capital Suvretta Holdings Corp. III, A | United States | 27,104 | 267,516 | ||||||||||||||
| a | Social Capital Suvretta Holdings Corp. IV, A | United States | 27,104 | 262,367 | ||||||||||||||
| a,d | Social Leverage Acquisition Corp. I, A | United States | 49,003 | 479,943 | ||||||||||||||
| a | Southport Acquisition Corp. | United States | 9,892 | 98,524 | ||||||||||||||
| a | Southport Acquisition Corp., 5/24/28, wts. | United States | 4,946 | 837 | ||||||||||||||
| a | Spindletop Health Acquisition Corp., A | United States | 11,406 | 113,832 | ||||||||||||||
| a | Spindletop Health Acquisition Corp., A, 12/31/28, wts. | United States | 5,703 | 691 | ||||||||||||||
| a | Spree Acquisition Corp. 1 Ltd. | Israel | 6,138 | 61,073 | ||||||||||||||
| a | Spree Acquisition Corp. 1 Ltd., 12/22/28, wts. | Israel | 3,069 | 498 | ||||||||||||||
| a | StoneBridge Acquisition Corp. | United States | 3,244 | 32,359 | ||||||||||||||
| a | Supernova Partners Acquisition Co. III Ltd., A | United States | 8,623 | 84,333 | ||||||||||||||
| a | Supernova Partners Acquisition Co. III Ltd., A, 3/31/27, wts. | United States | 6,587 | 1,482 | ||||||||||||||
| a | Sustainable Development Acquisition I Corp. | United States | 8,363 | 82,376 | ||||||||||||||
| a | SVF Investment Corp., A | United States | 16,643 | 163,434 | ||||||||||||||
| a | SVF Investment Corp. 2, A | United States | 10,063 | 98,315 | ||||||||||||||
| a,c | SVF Investment Corp. 3, A | United States | 40,562 | 384,933 | ||||||||||||||
| a | Target Global Acquisition I Corp., A | Israel | 10,548 | 104,214 | ||||||||||||||
| a | Target Global Acquisition I Corp., A, 12/31/27, wts. | Israel | 3,516 | 961 | ||||||||||||||
| a | TB SA Acquisition Corp., A | United States | 22,005 | 215,209 | ||||||||||||||
| 22 | Annual Report | franklintempleton.com | ||||||||
FRANKLIN ALTERNATIVE STRATEGIES FUNDS
CONSOLIDATED SCHEDULE OF INVESTMENTS
Franklin K2 Alternative Strategies Fund (continued)
| Country | Shares/ Warrants/ Rights | Value | ||||||||||||||||
| Common Stocks and Other Equity Interests (continued) | ||||||||||||||||||
| Diversified Financial Services (continued) | ||||||||||||||||||
| a | TB SA Acquisition Corp., A, 3/25/28, wts. | United States | 7,335 | $ | 902 | |||||||||||||
| a | TCV Acquisition Corp., A | United States | 1,698 | 16,488 | ||||||||||||||
| a | TCW Special Purpose Acquisition Corp., A | United States | 6,265 | 61,084 | ||||||||||||||
| a | TCW Special Purpose Acquisition Corp., A, 12/31/28, wts. | United States | 2,088 | 376 | ||||||||||||||
| a | Tech And Energy Transition Corp., A | United States | 8,501 | 83,395 | ||||||||||||||
| a | Tekkorp Digital Acquisition Corp., 10/26/27, wts. | United States | 1,328 | 206 | ||||||||||||||
| a,d | Thunder Bridge Capital Partners IV Inc., A | United States | 12,385 | 121,125 | ||||||||||||||
| a | Tishman Speyer Innovation Corp. II, A | United States | 2,043 | 19,980 | ||||||||||||||
| a | TLG Acquisition One Corp., A | United States | 9,876 | 96,696 | ||||||||||||||
| a | TPG Pace Beneficial II Corp., A | United States | 17,023 | 166,144 | ||||||||||||||
| a,d | Twelve Seas Investment Co. II, A | United States | 15,317 | 149,494 | ||||||||||||||
| a | Twelve Seas Investment Co. II, A, 3/02/28, wts. | United States | 1,629 | 222 | ||||||||||||||
| a | Twin Ridge Capital Acquisition Corp., A | United States | 7,511 | 73,608 | ||||||||||||||
| a | two, A | United States | 9,851 | 96,047 | ||||||||||||||
| a | USHG Acquisition Corp., A | United States | 28,448 | 283,058 | ||||||||||||||
| a | Vahanna Tech Edge Acquisition I Corp., A | United States | 7,916 | 78,645 | ||||||||||||||
| a | Vahanna Tech Edge Acquisition I Corp., A, 11/30/28, wts. | United States | 3,958 | 633 | ||||||||||||||
| a | Valor Latitude Acquisition Corp., A | United States | 16,723 | 162,631 | ||||||||||||||
| a | Valor Latitude Acquisition Corp., A, 12/31/28, wts. | United States | 5,574 | 685 | ||||||||||||||
| a | Vector Acquisition Corp. II, A | United States | 8,707 | 85,067 | ||||||||||||||
| a | Velocity Acquisition Corp., A | United States | 6,445 | 62,968 | ||||||||||||||
| a | Virgin Group Acquistion Corp. II | United States | 10,835 | 107,808 | ||||||||||||||
| a | VMG Consumer Acquisition Corp., A | United States | 2,210 | 21,967 | ||||||||||||||
| a | VMG Consumer Acquisition Corp., A, 7/03/23, wts. | United States | 1,105 | 238 | ||||||||||||||
| a | VPC Impact Acquisition Holdings II Inc., A | United States | 6,544 | 64,000 | ||||||||||||||
| a | Vy Global Growth, A | Cayman Islands | 13,775 | 136,235 | ||||||||||||||
| a | Waldencast Acquisition Corp., A | United States | 279 | 2,745 | ||||||||||||||
| a | Warburg Pincus Capital Corp. I-A, 12/31/27, wts. | Cayman Islands | 249 | 80 | ||||||||||||||
| a | Zimmer Energy Transition Acquisition Corp., A | United States | 7,144 | 69,547 | ||||||||||||||
| a | Zimmer Energy Transition Acquisition Corp., A, 5/14/23, wts. | United States | 2,381 | 595 | ||||||||||||||
|
| |||||||||||||||||
| 32,175,552 | ||||||||||||||||||
|
| |||||||||||||||||
| Diversified Telecommunication Services 0.0%† | ||||||||||||||||||
BT Group PLC, A | United Kingdom | 1,079 | 2,543 | |||||||||||||||
| a | IHS Holding Ltd. | Nigeria | 83 | 972 | ||||||||||||||
Telecom Italia SpA | Italy | 276,000 | 88,267 | |||||||||||||||
|
| |||||||||||||||||
| 91,782 | ||||||||||||||||||
|
| |||||||||||||||||
| Electric Utilities 2.3% | ||||||||||||||||||
Constellation Energy Corp. | United States | 85,382 | 5,300,515 | |||||||||||||||
| b | Duke Energy Corp. | United States | 2,783 | 313,143 | ||||||||||||||
Edison International | United States | 36,901 | 2,579,749 | |||||||||||||||
| a | Energy Harbor Corp. | United States | 80,237 | 5,099,061 | ||||||||||||||
| d | Exelon Corp. | United States | 98,778 | 4,854,939 | ||||||||||||||
| d | FirstEnergy Corp. | United States | 40,157 | 1,725,145 | ||||||||||||||
| d | NextEra Energy Inc. | United States | 102,802 | 7,781,083 | ||||||||||||||
| a,d | PG&E Corp. | United States | 126,961 | 1,548,924 | ||||||||||||||
|
| |||||||||||||||||
| 29,202,559 | ||||||||||||||||||
|
| |||||||||||||||||
| Electrical Equipment 0.9% | ||||||||||||||||||
| a | Array Technologies Inc. | United States | 194,742 | 2,157,741 | ||||||||||||||
| d | Emerson Electric Co. | United States | 16,479 | 1,461,028 | ||||||||||||||
| a,d | Enovix Corp. | United States | 137,078 | 1,649,048 | ||||||||||||||
| a | Fluence Energy Inc., A | United States | 72,388 | 709,403 | ||||||||||||||
| a | Plug Power Inc. | United States | 42,537 | 786,084 | ||||||||||||||
| a | Shoals Technologies Group Inc., A | United States | 32,875 | 512,850 | ||||||||||||||
| franklintempleton.com | Annual Report | 23 | ||||||||
FRANKLIN ALTERNATIVE STRATEGIES FUNDS
CONSOLIDATED SCHEDULE OF INVESTMENTS
Franklin K2 Alternative Strategies Fund (continued)
| Country | Shares/ Warrants/ Rights | Value | ||||||||||||||||
| Common Stocks and Other Equity Interests (continued) | ||||||||||||||||||
| Electrical Equipment (continued) | ||||||||||||||||||
| a,d | Stem Inc. | United States | 139,136 | $ | 1,202,135 | |||||||||||||
| a | Sunrun Inc. | United States | 68,531 | 1,790,030 | ||||||||||||||
Vestas Wind Systems A/S | Denmark | 25,647 | 655,082 | |||||||||||||||
|
| |||||||||||||||||
| 10,923,401 | ||||||||||||||||||
|
| |||||||||||||||||
| Electronic Equipment, Instruments & Components 0.2% | ||||||||||||||||||
| a,d | Coherent Inc. | United States | 5,777 | 1,565,336 | ||||||||||||||
Hollysys Automation Technologies Ltd. | China | 70,884 | 1,080,272 | |||||||||||||||
|
| |||||||||||||||||
| 2,645,608 | ||||||||||||||||||
|
| |||||||||||||||||
| Entertainment 0.1% | ||||||||||||||||||
| b | Activision Blizzard Inc. | United States | 11,523 | 897,411 | ||||||||||||||
| a | SciPlay Corp., A | United States | 35,572 | 507,257 | ||||||||||||||
| a | Warner Bros Discovery Inc. | United States | 20,276 | 374,092 | ||||||||||||||
|
| |||||||||||||||||
| 1,778,760 | ||||||||||||||||||
|
| |||||||||||||||||
| Equity Real Estate Investment Trusts (REITs) 0.2% | ||||||||||||||||||
American Campus Communities Inc. | United States | 13,733 | 892,645 | |||||||||||||||
| b | American Tower Corp. | United States | 404 | 103,476 | ||||||||||||||
| a | Braemar Hotels & Resorts Inc. | United States | 47 | 273 | ||||||||||||||
iStar Inc. | United States | 12,505 | 217,587 | |||||||||||||||
Preferred Apartment Communities Inc. | United States | 41,200 | 1,027,528 | |||||||||||||||
|
| |||||||||||||||||
| 2,241,509 | ||||||||||||||||||
|
| |||||||||||||||||
| Food & Staples Retailing 0.5% | ||||||||||||||||||
| d | Costco Wholesale Corp. | United States | 13,367 | 6,231,963 | ||||||||||||||
| b | Walmart Inc. | United States | 1,518 | 195,260 | ||||||||||||||
|
| |||||||||||||||||
| 6,427,223 | ||||||||||||||||||
|
| |||||||||||||||||
| Food Products 0.3% | ||||||||||||||||||
| a | Benson Hill Inc., 12/24/25, wts. | United States | 5,669 | 2,438 | ||||||||||||||
Nestle SA | Switzerland | 33,790 | 4,133,099 | |||||||||||||||
|
| |||||||||||||||||
| 4,135,537 | ||||||||||||||||||
|
| |||||||||||||||||
| Gas Utilities 0.0%† | ||||||||||||||||||
Southwest Gas Holdings Inc. | United States | 2,987 | 278,179 | |||||||||||||||
|
| |||||||||||||||||
| Health Care Equipment & Supplies 0.7% | ||||||||||||||||||
Abbott Laboratories | United States | 20,931 | 2,458,555 | |||||||||||||||
| a | Axonics Inc. | United States | 6,027 | 301,350 | ||||||||||||||
| c | CONMED Corp. | United States | 5,904 | 686,576 | ||||||||||||||
| a | Cutera Inc. | United States | 8,797 | 395,777 | ||||||||||||||
DENTSPLY SIRONA Inc. | United States | 5,958 | 235,698 | |||||||||||||||
| a,d | DexCom Inc. | United States | 1,821 | 542,549 | ||||||||||||||
| a | Envista Holdings Corp. | United States | 17,246 | 742,268 | ||||||||||||||
| a | Hologic Inc. | United States | 8,295 | 624,365 | ||||||||||||||
| a | Intuitive Surgical Inc. | United States | 3,791 | 862,983 | ||||||||||||||
| a | NuVasive Inc. | United States | 1,400 | 80,374 | ||||||||||||||
| a | Shockwave Medical Inc. | United States | 3,142 | 515,948 | ||||||||||||||
| d | Stryker Corp. | United States | 5,801 | 1,360,335 | ||||||||||||||
|
| |||||||||||||||||
| 8,806,778 | ||||||||||||||||||
|
| |||||||||||||||||
| Health Care Providers & Services 0.9% | ||||||||||||||||||
Anthem Inc. | United States | 136 | 69,307 | |||||||||||||||
| a,d | Centene Corp. | United States | 18,972 | 1,545,080 | ||||||||||||||
| a | Covetrus Inc. | United States | 45,164 | 940,314 | ||||||||||||||
| d | CVS Health Corp. | United States | 11,776 | 1,139,328 | ||||||||||||||
Humana Inc. | United States | 3,614 | 1,641,587 | |||||||||||||||
| 24 | Annual Report | franklintempleton.com | ||||||||
FRANKLIN ALTERNATIVE STRATEGIES FUNDS
CONSOLIDATED SCHEDULE OF INVESTMENTS
Franklin K2 Alternative Strategies Fund (continued)
| Country | Shares/ Warrants/ Rights | Value | ||||||||||||||||
| Common Stocks and Other Equity Interests (continued) | ||||||||||||||||||
| Health Care Providers & Services (continued) | ||||||||||||||||||
| a | R1 RCM Inc. | United States | 14,913 | $ | 320,182 | |||||||||||||
| a | Tivity Health Inc. | United States | 44,039 | 1,426,864 | ||||||||||||||
UnitedHealth Group Inc. | United States | 9,511 | 4,724,875 | |||||||||||||||
|
| |||||||||||||||||
| 11,807,537 | ||||||||||||||||||
|
| |||||||||||||||||
| Health Care Technology 0.2% | ||||||||||||||||||
| d | Cerner Corp. | United States | 27,357 | 2,594,812 | ||||||||||||||
| a | Inspire Medical Systems Inc. | United States | 553 | 97,787 | ||||||||||||||
| a | Phreesia Inc. | United States | 7,337 | 133,093 | ||||||||||||||
|
| |||||||||||||||||
| 2,825,692 | ||||||||||||||||||
|
| |||||||||||||||||
| Hotels, Restaurants & Leisure 0.6% | ||||||||||||||||||
| a | Airbnb Inc., A | United States | 16,667 | 2,014,540 | ||||||||||||||
| a,e | Aspire Global PLC, 144A | Malta | 66,879 | 732,756 | ||||||||||||||
| a | Booking Holdings Inc. | United States | 47 | 105,447 | ||||||||||||||
| a,c | Carnival Corp. | United States | 1,335 | 18,530 | ||||||||||||||
| a | Crown Resorts Ltd. | Australia | 250,151 | 2,303,113 | ||||||||||||||
Domino’s Pizza Inc. | United States | 2,081 | 755,757 | |||||||||||||||
| a | HomeToGo SE, 12/31/25, wts. | Luxembourg | 716 | 154 | ||||||||||||||
McDonald’s Corp. | United States | 530 | 133,671 | |||||||||||||||
| a | MGM Holdings Inc., A | United States | 6,722 | 957,885 | ||||||||||||||
| a,c | Norwegian Cruise Line Holdings Ltd. | United States | 1,246 | 19,949 | ||||||||||||||
| a | Royal Caribbean Cruises Ltd. | United States | 848 | 49,244 | ||||||||||||||
| a | Sonder Holdings Inc., 1/31/28, wts. | United States | 3,948 | 1,599 | ||||||||||||||
| b | Starbucks Corp. | United States | 2,312 | 181,492 | ||||||||||||||
| a,c | Wynn Resorts Ltd. | United States | 573 | 37,875 | ||||||||||||||
|
| |||||||||||||||||
| 7,312,012 | ||||||||||||||||||
|
| |||||||||||||||||
| Household Durables 0.2% | ||||||||||||||||||
| a | Skyline Champion Corp. | United States | 40,704 | 2,162,604 | ||||||||||||||
|
| |||||||||||||||||
| Household Products 0.0%† | ||||||||||||||||||
| b | The Procter & Gamble Co. | United States | 2,064 | 305,224 | ||||||||||||||
|
| |||||||||||||||||
| Independent Power & Renewable Electricity Producers 0.8% | ||||||||||||||||||
| d | The AES Corp. | United States | 217,355 | 4,790,504 | ||||||||||||||
Clearway Energy Inc., A | United States | 7,906 | 257,419 | |||||||||||||||
Clearway Energy Inc., C | United States | 29,768 | 1,043,369 | |||||||||||||||
| d | NextEra Energy Partners LP | United States | 34,257 | 2,454,514 | ||||||||||||||
| a | Sunnova Energy International Inc. | United States | 89,898 | 1,797,960 | ||||||||||||||
|
| |||||||||||||||||
| 10,343,766 | ||||||||||||||||||
|
| |||||||||||||||||
| Industrial Conglomerates 0.1% | ||||||||||||||||||
Smiths Group PLC | United Kingdom | 14,026 | 274,917 | |||||||||||||||
Toshiba Corp. | Japan | 9,747 | 435,807 | |||||||||||||||
|
| |||||||||||||||||
| 710,724 | ||||||||||||||||||
|
| |||||||||||||||||
| Insurance 0.3% | ||||||||||||||||||
| a,d | Alleghany Corp. | United States | 2,229 | 1,858,496 | ||||||||||||||
Ping An Insurance Group Co. of China Ltd., H | China | 21,700 | 138,941 | |||||||||||||||
| a | Trupanion Inc. | United States | 21,407 | 1,431,700 | ||||||||||||||
|
| |||||||||||||||||
| 3,429,137 | ||||||||||||||||||
|
| |||||||||||||||||
| Interactive Media & Services 1.4% | ||||||||||||||||||
| a,d | Alphabet Inc., A | United States | 3,744 | 8,518,499 | ||||||||||||||
| a | Alphabet Inc., C | United States | 616 | 1,404,960 | ||||||||||||||
| a,c | Bumble Inc., A | United States | 26,278 | 748,923 | ||||||||||||||
| a,d | Meta Platforms Inc., A | United States | 20,829 | 4,033,328 | ||||||||||||||
| franklintempleton.com | Annual Report | 25 | ||||||||
FRANKLIN ALTERNATIVE STRATEGIES FUNDS
CONSOLIDATED SCHEDULE OF INVESTMENTS
Franklin K2 Alternative Strategies Fund (continued)
| Country | Shares/ Warrants/ Rights | Value | ||||||||||||||||
| Common Stocks and Other Equity Interests (continued) | ||||||||||||||||||
| Interactive Media & Services (continued) | ||||||||||||||||||
Tencent Holdings Ltd. | China | 53,872 | $ | 2,462,940 | ||||||||||||||
| a | Wejo Group Ltd., 11/18/26, wts. | United States | 3,488 | 1,014 | ||||||||||||||
|
| |||||||||||||||||
| 17,169,664 | ||||||||||||||||||
|
| |||||||||||||||||
| Internet & Direct Marketing Retail 0.7% | ||||||||||||||||||
| a,d | Alibaba Group Holding Ltd., ADR | China | 21,267 | 2,042,695 | ||||||||||||||
| a,d | Amazon.com Inc. | United States | 1,501 | 3,608,690 | ||||||||||||||
| a | Cazoo Group Ltd., 8/26/26, wts. | Cayman Islands | 19,178 | 3,231 | ||||||||||||||
| a,e | Deliveroo PLC, A, 144A | United Kingdom | 144,586 | 171,529 | ||||||||||||||
| a,e | Delivery Hero SE, 144A | Saudi Arabia | 6,800 | 262,264 | ||||||||||||||
| d | eBay Inc. | United States | 36,598 | 1,781,225 | ||||||||||||||
| a | Etsy Inc. | United States | 11,431 | 927,283 | ||||||||||||||
JD.Com Inc., A | China | 2,583 | 72,557 | |||||||||||||||
| a | Lands’ End Inc. | United States | 15,255 | 176,958 | ||||||||||||||
| a | MercadoLibre Inc. | Argentina | 102 | 80,160 | ||||||||||||||
| a | THG PLC, B | United Kingdom | 79,933 | 148,047 | ||||||||||||||
|
| |||||||||||||||||
| 9,274,639 | ||||||||||||||||||
|
| |||||||||||||||||
| IT Services 1.9% | ||||||||||||||||||
Accenture PLC, A | United States | 285 | 85,061 | |||||||||||||||
| a | Block Inc., A | United States | 17,806 | 1,558,203 | ||||||||||||||
| a | Core Scientific Inc., 1/19/27, wts. | United States | 1,383 | 1,480 | ||||||||||||||
| a | FleetCor Technologies Inc. | United States | 6,438 | 1,601,839 | ||||||||||||||
Genpact Ltd. | United States | 23,545 | 1,044,692 | |||||||||||||||
| d | Global Payments Inc. | United States | 25,257 | 3,309,677 | ||||||||||||||
MasterCard Inc., A | United States | 17,645 | 6,314,615 | |||||||||||||||
| a | MongoDB Inc., A | United States | 5,845 | 1,386,142 | ||||||||||||||
| a,e | Nuvei Corp., 144A | Canada | 8,565 | 440,584 | ||||||||||||||
| a,d | PayPal Holdings Inc. | United States | 15,418 | 1,313,768 | ||||||||||||||
| a | Snowflake Inc., A | United States | 8,456 | 1,079,408 | ||||||||||||||
Switch Inc., A | United States | 128,249 | 4,328,404 | |||||||||||||||
| a | Twilio Inc., A | United States | 15,026 | 1,580,284 | ||||||||||||||
| c | Visa Inc., A | United States | 670 | 142,154 | ||||||||||||||
|
| |||||||||||||||||
| 24,186,311 | ||||||||||||||||||
|
| |||||||||||||||||
| Leisure Products 0.0%† | ||||||||||||||||||
| a | Tonies SE, A, 4/30/26, wts. | Germany | 41,605 | 15,633 | ||||||||||||||
|
| |||||||||||||||||
| Life Sciences Tools & Services 1.8% | ||||||||||||||||||
Agilent Technologies Inc. | United States | 5,442 | 694,182 | |||||||||||||||
| a,d | BIO-RAD Laboratories Inc., A | United States | 1,132 | 608,778 | ||||||||||||||
Danaher Corp., W | United States | 20,857 | 5,502,494 | |||||||||||||||
Eurofins Scientific SE | Luxembourg | 28,085 | 2,621,605 | |||||||||||||||
Gerresheimer AG | Germany | 29,619 | 2,220,418 | |||||||||||||||
| a | IQVIA Holdings Inc. | United States | 1,623 | 349,351 | ||||||||||||||
Lonza Group AG | Switzerland | 391 | 235,736 | |||||||||||||||
| a | Mettler-Toledo International Inc. | United States | 5,046 | 6,489,761 | ||||||||||||||
| a | QIAGEN NV | United States | 5,002 | 229,842 | ||||||||||||||
| a | Repligen Corp. | United States | 1,737 | 285,684 | ||||||||||||||
| d | Thermo Fisher Scientific Inc. | United States | 6,906 | 3,919,639 | ||||||||||||||
|
| |||||||||||||||||
| 23,157,490 | ||||||||||||||||||
|
| |||||||||||||||||
| Machinery 0.4% | ||||||||||||||||||
| a | Berkshire Grey Inc., 7/21/26, wts. | United States | 23,782 | 6,183 | ||||||||||||||
| a | CNH Industrial NV | United Kingdom | 23,862 | 356,260 | ||||||||||||||
| b | Cummins Inc. | United States | 327 | 68,382 | ||||||||||||||
| b | Deere & Co. | United States | 7,542 | 2,698,377 | ||||||||||||||
| 26 | Annual Report | franklintempleton.com | ||||||||
FRANKLIN ALTERNATIVE STRATEGIES FUNDS
CONSOLIDATED SCHEDULE OF INVESTMENTS
Franklin K2 Alternative Strategies Fund (continued)
| Country | Shares/ Warrants/ Rights | Value | ||||||||||||||||
| Common Stocks and Other Equity Interests (continued) | ||||||||||||||||||
| Machinery (continued) | ||||||||||||||||||
| a | Fast Radius Inc., 2/11/28, wts. | United States | 2,678 | $ | 213 | |||||||||||||
| a | Iveco Group NV | Italy | 4,712 | 30,018 | ||||||||||||||
| a,c | Nikola Corp. | United States | 30,163 | 212,951 | ||||||||||||||
| a,d | Welbilt Inc. | United States | 89,349 | 2,114,891 | ||||||||||||||
|
| |||||||||||||||||
| 5,487,275 | ||||||||||||||||||
|
| |||||||||||||||||
| Media 0.7% | ||||||||||||||||||
| a | Altice USA Inc., A | United States | 19,579 | 222,809 | ||||||||||||||
| a,c | Cardlytics Inc. | United States | 15,408 | 399,221 | ||||||||||||||
| a | Clear Channel Outdoor Holdings Inc., A | United States | 90,349 | 142,751 | ||||||||||||||
Comcast Corp., A | United States | 2,890 | 127,969 | |||||||||||||||
| a | Cumulus Media Inc., A | United States | 15,940 | 192,077 | ||||||||||||||
| a | Innovid Corp., A, 12/31/27, wts. | Israel | 69 | 38 | ||||||||||||||
ITV PLC | United Kingdom | 217,805 | 193,050 | |||||||||||||||
Shaw Communications Inc., B | Canada | 121,239 | 3,435,353 | |||||||||||||||
Stroeer SE & Co. KGaA | Germany | 54,286 | 3,033,577 | |||||||||||||||
Tegna Inc. | United States | 36,031 | 789,079 | |||||||||||||||
|
| |||||||||||||||||
| 8,535,924 | ||||||||||||||||||
|
| |||||||||||||||||
| Metals & Mining 0.1% | ||||||||||||||||||
| a | Iamgold Corp. | Burkina Faso | 252,050 | 554,510 | ||||||||||||||
| b | Newmont Corp. | United States | 1,315 | 89,223 | ||||||||||||||
| a | Western Areas Ltd. | Australia | 349,605 | 965,589 | ||||||||||||||
|
| |||||||||||||||||
| 1,609,322 | ||||||||||||||||||
|
| |||||||||||||||||
| Multiline Retail 0.1% | ||||||||||||||||||
| b,d | Kohl’s Corp. | United States | 37,462 | 1,510,468 | ||||||||||||||
|
| |||||||||||||||||
| Multi-Utilities 0.0%† | ||||||||||||||||||
| d | NiSource Inc. | United States | 16,648 | 523,580 | ||||||||||||||
|
| |||||||||||||||||
| Oil, Gas & Consumable Fuels 0.2% | ||||||||||||||||||
| a | Archaea Energy Inc., A | United States | 19,876 | 396,327 | ||||||||||||||
| a | Battalion Oil Corp. | United States | 3,790 | 60,754 | ||||||||||||||
California Resources Corp. | United States | 5,609 | 244,945 | |||||||||||||||
Chesapeake Energy Corp. | United States | 14,099 | 1,372,961 | |||||||||||||||
| a,f,g | Gazprom PJSC, ADR | Russia | 307,580 | — | ||||||||||||||
Pioneer Natural Resources Co. | United States | 371 | 103,116 | |||||||||||||||
| a | Renewable Energy Group Inc. | United States | 5,368 | 329,112 | ||||||||||||||
The Williams Cos. Inc. | United States | 2,192 | 81,235 | |||||||||||||||
|
| |||||||||||||||||
| 2,588,450 | ||||||||||||||||||
|
| |||||||||||||||||
| Personal Products 0.5% | ||||||||||||||||||
The Estee Lauder Cos. Inc., A | United States | 386 | 98,295 | |||||||||||||||
L’Oreal SA | France | 7,173 | 2,533,587 | |||||||||||||||
| a | Unilever PLC | United Kingdom | 66,215 | 3,187,169 | ||||||||||||||
|
| |||||||||||||||||
| 5,819,051 | ||||||||||||||||||
|
| |||||||||||||||||
| Pharmaceuticals 1.8% | ||||||||||||||||||
| d | AstraZeneca PLC, ADR | United Kingdom | 16,485 | 1,095,923 | ||||||||||||||
| b | Bristol-Myers Squibb Co. | United States | 30,491 | 2,300,546 | ||||||||||||||
| a | Catalent Inc. | United States | 2,430 | 250,436 | ||||||||||||||
Eli Lilly & Co., W | United States | 7,387 | 2,315,381 | |||||||||||||||
Hikma Pharmaceuticals PLC | Jordan | 18,006 | 385,191 | |||||||||||||||
| b | Johnson & Johnson | United States | 1,873 | 336,260 | ||||||||||||||
| b | Merck & Co. Inc. | United States | 31,103 | 2,862,409 | ||||||||||||||
| d | Novo Nordisk AS, ADR | Denmark | 18,741 | 2,069,007 | ||||||||||||||
| a,c | Revance Therapeutics Inc. | United States | 6,496 | 88,865 | ||||||||||||||
| franklintempleton.com | Annual Report | 27 | ||||||||
FRANKLIN ALTERNATIVE STRATEGIES FUNDS
CONSOLIDATED SCHEDULE OF INVESTMENTS
Franklin K2 Alternative Strategies Fund (continued)
| Country | Shares/ Warrants/ Rights | Value | ||||||||||||||||
| Common Stocks and Other Equity Interests (continued) | ||||||||||||||||||
| Pharmaceuticals (continued) | ||||||||||||||||||
Roche Holding AG | Switzerland | 13,251 | $ | 4,515,823 | ||||||||||||||
| a | Vifor Pharma AG | Switzerland | 30,185 | 5,266,326 | ||||||||||||||
Zoetis Inc., A | United States | 4,887 | 835,335 | |||||||||||||||
| a,f | Zogenix Inc., Contingent Value, rts., 12/31/23 | United States | 38,902 | 26,453 | ||||||||||||||
|
| |||||||||||||||||
| 22,347,955 | ||||||||||||||||||
|
| |||||||||||||||||
| Professional Services 0.8% | ||||||||||||||||||
| a,e | Intertrust NV, 144A | Netherlands | 260,353 | 5,411,161 | ||||||||||||||
ManTech International Corp., A | United States | 25,075 | 2,398,424 | |||||||||||||||
Nielsen Holdings PLC | United States | 47,565 | 1,215,761 | |||||||||||||||
SGS SA | Switzerland | 199 | 494,817 | |||||||||||||||
|
| |||||||||||||||||
| 9,520,163 | ||||||||||||||||||
|
| |||||||||||||||||
| Real Estate Management & Development 0.1% | ||||||||||||||||||
Immofinanz AG | Austria | 36,970 | 808,071 | |||||||||||||||
|
| |||||||||||||||||
| Road & Rail 1.8% | ||||||||||||||||||
Canadian Pacific Railway Ltd. | Canada | 115,217 | 8,231,103 | |||||||||||||||
CSX Corp. | United States | 83,893 | 2,666,958 | |||||||||||||||
| a,b,d | Hertz Global Holdings Inc. | United States | 20,156 | 404,531 | ||||||||||||||
Knight-Swift Transportation Holdings Inc., A | United States | 33,428 | 1,625,938 | |||||||||||||||
| a | Uber Technologies Inc. | United States | 81,927 | 1,900,706 | ||||||||||||||
| d | Union Pacific Corp. | United States | 30,113 | 6,618,235 | ||||||||||||||
| a | XPO Logistics Inc. | United States | 20,124 | 1,075,427 | ||||||||||||||
|
| |||||||||||||||||
| 22,522,898 | ||||||||||||||||||
|
| |||||||||||||||||
| Semiconductors & Semiconductor Equipment 1.2% | ||||||||||||||||||
| a,d | Advanced Micro Devices Inc. | United States | 22,386 | 2,280,238 | ||||||||||||||
Applied Materials Inc. | United States | 699 | 81,986 | |||||||||||||||
ASML Holding NV, G | Netherlands | 2,972 | 1,712,734 | |||||||||||||||
Broadcom Inc. | United States | 109 | 63,234 | |||||||||||||||
KLA Corp. | United States | 4,447 | 1,622,488 | |||||||||||||||
| a | MagnaChip Semiconductor Corp. | South Korea | 13,430 | 261,885 | ||||||||||||||
| d | Marvell Technology Inc. | United States | 50,362 | 2,978,912 | ||||||||||||||
| b | Microchip Technology Inc. | United States | 1,075 | 78,099 | ||||||||||||||
| d | Micron Technology Inc. | United States | 34,745 | 2,565,571 | ||||||||||||||
NVIDIA Corp. | United States | 11,397 | 2,128,048 | |||||||||||||||
QUALCOMM Inc. | United States | 1,252 | 179,311 | |||||||||||||||
| a | SolarEdge Technologies Inc. | United States | 3,681 | 1,004,140 | ||||||||||||||
| a | Sunpower Corp., A | United States | 24,524 | 433,339 | ||||||||||||||
|
| |||||||||||||||||
| 15,389,985 | ||||||||||||||||||
|
| |||||||||||||||||
| Software 4.3% | ||||||||||||||||||
| a | Adobe Inc. | United States | 1,672 | 696,355 | ||||||||||||||
| a,d | Anaplan Inc. | United States | 95,998 | 6,297,468 | ||||||||||||||
| a | Atlassian Corp. PLC, A | United States | 7,875 | 1,396,395 | ||||||||||||||
| a | Autodesk Inc. | United States | 258 | 53,600 | ||||||||||||||
| d | CDK Global Inc. | United States | 80,581 | 4,388,441 | ||||||||||||||
| a | Ceridian HCM Holding Inc. | United States | 27,838 | 1,567,279 | ||||||||||||||
| a | Dynatrace Inc. | United States | 87,153 | 3,283,054 | ||||||||||||||
| a,d | Five9 Inc. | United States | 34,089 | 3,296,747 | ||||||||||||||
| a,d | HubSpot Inc. | United States | 7,962 | 2,688,688 | ||||||||||||||
Infomedia Ltd. | Australia | 369,432 | 451,681 | |||||||||||||||
| d | Intuit Inc. | United States | 9,217 | 3,820,077 | ||||||||||||||
| a | Lightspeed Commerce Inc. | Canada | 65,750 | 1,708,842 | ||||||||||||||
| a | Livevox Holdings Inc., 6/18/26, wts. | United States | 23,891 | 5,256 | ||||||||||||||
| a | Mandiant Inc. | United States | 51,062 | 1,125,917 | ||||||||||||||
| 28 | Annual Report | franklintempleton.com | ||||||||
FRANKLIN ALTERNATIVE STRATEGIES FUNDS
CONSOLIDATED SCHEDULE OF INVESTMENTS
Franklin K2 Alternative Strategies Fund (continued)
| Country | Shares/ Warrants/ Rights | Value | ||||||||||||||||
| Common Stocks and Other Equity Interests (continued) | ||||||||||||||||||
| Software (continued) | ||||||||||||||||||
| a | Marathon Digital Holdings Inc. | United States | 17,703 | $ | 181,102 | |||||||||||||
| d | Microsoft Corp. | United States | 25,874 | 7,034,365 | ||||||||||||||
| a | Momentive Global Inc. | United States | 1,984 | 24,165 | ||||||||||||||
| a | Palo Alto Networks Inc. | United States | 4,002 | 2,012,126 | ||||||||||||||
| a | RingCentral Inc., A | United States | 85 | 5,367 | ||||||||||||||
| a | SailPoint Technologies Holding Inc. | United States | 58,144 | 3,688,655 | ||||||||||||||
| a | Salesforce.com Inc. | United States | 340 | 54,482 | ||||||||||||||
| a,c | Samsara Inc., A | United States | 57,564 | 647,595 | ||||||||||||||
SAP SE | Germany | 62,441 | 6,259,527 | |||||||||||||||
| a | ServiceNow Inc. | United States | 2,701 | 1,262,636 | ||||||||||||||
| a | Tufin Software Technologies Ltd. | Israel | 55,251 | 700,030 | ||||||||||||||
| a,d | Vonage Holdings Corp. | United States | 111,125 | 2,152,491 | ||||||||||||||
| a,b | Zendesk Inc. | United States | 3,037 | 277,734 | ||||||||||||||
|
| |||||||||||||||||
| 55,080,075 | ||||||||||||||||||
|
| |||||||||||||||||
| Specialty Retail 1.2% | ||||||||||||||||||
| a | Floor & Decor Holdings Inc., A | United States | 28,951 | 2,184,063 | ||||||||||||||
| a | Frasers Group PLC | United Kingdom | 180,900 | 1,575,103 | ||||||||||||||
| b | The Home Depot Inc. | United States | 20,283 | 6,140,678 | ||||||||||||||
Lowe’s Cos. Inc. | United States | 5,418 | 1,058,135 | |||||||||||||||
| d | Tractor Supply Co. | United States | 9,838 | 1,843,248 | ||||||||||||||
| a,e | Watches of Switzerland Group PLC, 144A | United Kingdom | 186,791 | 2,214,894 | ||||||||||||||
|
| |||||||||||||||||
| 15,016,121 | ||||||||||||||||||
|
| |||||||||||||||||
| Technology Hardware, Storage & Peripherals 0.0%† | ||||||||||||||||||
Apple Inc. | United States | 1,665 | 247,819 | |||||||||||||||
|
| |||||||||||||||||
| Textiles, Apparel & Luxury Goods 0.6% | ||||||||||||||||||
Adidas AG | Germany | 14,457 | 2,872,140 | |||||||||||||||
| a | Capri Holdings Ltd. | United States | 44,875 | 2,187,208 | ||||||||||||||
| a | Ermenegildo Zegna Holditalia SpA, 10/30/27, wts. | Italy | 2,150 | 3,784 | ||||||||||||||
Hermes International | France | 1,205 | 1,440,772 | |||||||||||||||
LVMH Moet Hennessy Louis Vuitton SE | France | 165 | 106,528 | |||||||||||||||
Nike Inc., B | United States | 781 | 92,822 | |||||||||||||||
| d | Tapestry Inc. | United States | 41,766 | 1,440,927 | ||||||||||||||
|
| |||||||||||||||||
| 8,144,181 | ||||||||||||||||||
|
| |||||||||||||||||
| Trading Companies & Distributors 0.4% | ||||||||||||||||||
Brenntag SE | Germany | 40,211 | 3,111,391 | |||||||||||||||
| d | Herc Holdings Inc. | United States | 16,657 | 1,952,534 | ||||||||||||||
IMCD Group NV | Netherlands | 2,995 | 447,908 | |||||||||||||||
|
| |||||||||||||||||
| 5,511,833 | ||||||||||||||||||
|
| |||||||||||||||||
| Water Utilities 0.3% | ||||||||||||||||||
| d | Essential Utilities Inc. | United States | 34,911 | 1,614,983 | ||||||||||||||
Guangdong Investment Ltd. | China | 1,272,652 | 1,604,672 | |||||||||||||||
|
| |||||||||||||||||
| 3,219,655 | ||||||||||||||||||
|
| |||||||||||||||||
| Wireless Telecommunication Services 0.1% | ||||||||||||||||||
| a | T-Mobile USA Inc. | United States | 5,373 | 716,167 | ||||||||||||||
Vodafone Group PLC, ADR | United Kingdom | 59,014 | 981,993 | |||||||||||||||
|
| |||||||||||||||||
| 1,698,160 | ||||||||||||||||||
|
| |||||||||||||||||
Total Common Stocks and Other Equity Interests | 477,552,498 | |||||||||||||||||
|
| |||||||||||||||||
| franklintempleton.com | Annual Report | 29 | ||||||||
FRANKLIN ALTERNATIVE STRATEGIES FUNDS
CONSOLIDATED SCHEDULE OF INVESTMENTS
Franklin K2 Alternative Strategies Fund (continued)
| Country | Shares/ Warrants/ Rights | Value | ||||||||||||||||
| Exchange Traded Funds (Cost $2,373,717) 0.2% | ||||||||||||||||||
iShares China Large-Capital ETF | China | 75,038 | $ | 2,390,711 | ||||||||||||||
|
| |||||||||||||||||
| Convertible Preferred Stocks 0.0%† | ||||||||||||||||||
| Diversified Telecommunication Services 0.0%† | ||||||||||||||||||
| e | 2020 Cash Mandatory Exchangeable Trust, 5.25%, cvt. pfd., 144A | United States | 250 | 285,989 | ||||||||||||||
|
| |||||||||||||||||
| Gas Utilities 0.0%† | ||||||||||||||||||
El Paso Energy Capital Trust I, 4.75%, cvt. pfd. | United States | 114 | 5,610 | |||||||||||||||
|
| |||||||||||||||||
Total Convertible Preferred Stocks (Cost $310,244) | 291,599 | |||||||||||||||||
|
| |||||||||||||||||
| Preferred Stocks 0.0%† | ||||||||||||||||||
| Communications Equipment 0.0%† | ||||||||||||||||||
| a | Riverbed Technology Inc., pfd., A | United States | 3,699 | 32,736 | ||||||||||||||
|
| |||||||||||||||||
| Professional Services 0.0%† | ||||||||||||||||||
Clarivate PLC, 5.25%, pfd. | United Kingdom | 2,289 | 137,890 | |||||||||||||||
|
| |||||||||||||||||
| Thrifts & Mortgage Finance 0.0%† | ||||||||||||||||||
FHLMC, pfd., | United States | 17,150 | 89,437 | |||||||||||||||
Z, 8.375% | United States | 8,177 | 27,965 | |||||||||||||||
FNMA, pfd., | ||||||||||||||||||
a O | United States | 16,250 | 96,688 | |||||||||||||||
S, 8.25% | United States | 15,150 | 55,449 | |||||||||||||||
|
| |||||||||||||||||
| 269,539 | ||||||||||||||||||
|
| |||||||||||||||||
Total Preferred Stocks (Cost $566,633) | 440,165 | |||||||||||||||||
|
| |||||||||||||||||
| Principal Amount* | ||||||||||||||||||
| Convertible Bonds 12.1% | ||||||||||||||||||
| Aerospace & Defense 0.2% | ||||||||||||||||||
Kaman Corp., senior note, 3.25%, 5/01/24 | United States | 2,743,000 | 2,633,280 | |||||||||||||||
| d | Parsons Corp., senior note, 0.25%, 8/15/25 | United States | 119,000 | 122,320 | ||||||||||||||
| e | Virgin Galactic Holdings Inc., senior note, 144A, 2.50%, 2/01/27 | United States | 426,000 | 308,850 | ||||||||||||||
|
| |||||||||||||||||
| 3,064,450 | ||||||||||||||||||
|
| |||||||||||||||||
| Airlines 0.5% | ||||||||||||||||||
| e | Air France-KLM, senior note, Reg S, 0.125%, 3/25/26 | France | 32,034 | EUR | 565,864 | |||||||||||||
American Airlines Group Inc., senior note, 6.50%, 7/01/25 | United States | 770,000 | 1,034,312 | |||||||||||||||
| e | Cathay Pacific Finance III Ltd., senior note, Reg S, 2.75%, 2/05/26 | Hong Kong | 8,000,000 | HKD | 1,075,288 | |||||||||||||
Copa Holdings SA, senior note, 4.50%, 4/15/25 | Panama | 870,000 | 1,349,370 | |||||||||||||||
| e | GOL Equity Finance SA, senior note, 144A, 3.75%, 7/15/24 | Brazil | 1,277,000 | 1,008,032 | ||||||||||||||
Jetblue Airways Corp., senior note, 0.50%, 4/01/26 | United States | 311,000 | 247,245 | |||||||||||||||
Southwest Airlines Co., senior note, 1.25%, 5/01/25 | United States | 310,000 | 424,623 | |||||||||||||||
|
| |||||||||||||||||
| 5,704,734 | ||||||||||||||||||
|
| |||||||||||||||||
| Auto Components 0.1% | ||||||||||||||||||
| e | Luminar Technologies Inc., senior note, 144A, 1.25%, 12/15/26 | United States | 563,000 | 434,355 | ||||||||||||||
Patrick Industries Inc., senior note, 1.00%, 2/01/23 | United States | 626,000 | 633,825 | |||||||||||||||
|
| |||||||||||||||||
| 1,068,180 | ||||||||||||||||||
|
| |||||||||||||||||
| Automobiles 0.5% | ||||||||||||||||||
| e | Fisker Inc., senior note, 144A, 2.50%, 9/15/26 | United States | 1,626,000 | 1,099,323 | ||||||||||||||
Li Auto Inc., senior note, 0.25%, 5/01/28 | China | 946,000 | 1,035,397 | |||||||||||||||
| e | Lucid Group Inc., senior note, 144A, 1.25%, 12/15/26 | United States | 2,764,000 | 1,871,016 | ||||||||||||||
| 30 | Annual Report | franklintempleton.com | ||||||||
FRANKLIN ALTERNATIVE STRATEGIES FUNDS
CONSOLIDATED SCHEDULE OF INVESTMENTS
Franklin K2 Alternative Strategies Fund (continued)
| Country | Principal Amount* | Value | ||||||||||||||||
| Convertible Bonds (continued) | ||||||||||||||||||
| Automobiles (continued) | ||||||||||||||||||
NFI Group Inc., 5.00%, 1/15/27 | Canada | 252,000 | CAD | $ | 169,348 | |||||||||||||
NIO Inc., senior note, zero cpn., 2/01/26 | China | 1,750,000 | 1,460,562 | |||||||||||||||
|
| |||||||||||||||||
| 5,635,646 | ||||||||||||||||||
|
| |||||||||||||||||
| Banks 0.2% | ||||||||||||||||||
| d | Hope Bancorp Inc., senior bond, 2.00%, 5/15/38 | United States | 2,034,000 | 2,003,716 | ||||||||||||||
| e | JPMorgan Chase Bank NA, senior note, Reg S, zero cpn., 12/28/23 | United States | 900,000 | 861,300 | ||||||||||||||
|
| |||||||||||||||||
| 2,865,016 | ||||||||||||||||||
|
| |||||||||||||||||
| Biotechnology 0.8% | ||||||||||||||||||
| e | Avid SPV LLC, senior note, 144A, 1.25%, 3/15/26 | United States | 967,000 | 922,149 | ||||||||||||||
| c | BioMarin Pharmaceutical Inc., senior sub. note, 1.25%, 5/15/27 | United States | 685,000 | 701,252 | ||||||||||||||
Coherus Biosciences Inc., senior sub. note, 1.50%, 4/15/26 | United States | 1,300,000 | 912,612 | |||||||||||||||
| d | Dynavax Technologies Corp., senior note, 2.50%, 5/15/26 | United States | 1,530,000 | 2,185,031 | ||||||||||||||
| e | Global Blood Therapeutics Inc., senior note, 144A, 1.875%, 12/15/28 | United States | 98,000 | 99,960 | ||||||||||||||
Gossamer Bio Inc., senior note, 5.00%, 6/01/27 | United States | 572,000 | 409,293 | |||||||||||||||
Insmed Inc., senior note, 0.75%, 6/01/28 | United States | 1,299,000 | 1,084,016 | |||||||||||||||
| e | Intercept Pharmaceuticals Inc., senior secured note, 144A, 3.50%, 2/15/26 | United States | 1,252,000 | 1,410,398 | ||||||||||||||
Ionis Pharmaceuticals Inc., senior note, zero cpn., 4/01/26 | United States | 356,000 | 328,731 | |||||||||||||||
Karyopharm Therapeutics Inc., senior note, 3.00%, 10/15/25 | United States | 751,000 | 587,466 | |||||||||||||||
| e | Pharming Group NV, senior note, Reg S, 3.00%, 1/21/25 | Netherlands | 600,000 | EUR | 572,885 | |||||||||||||
Travere Therapeutics Inc., senior note, 2.25%, 3/01/29 | United States | 815,000 | 811,740 | |||||||||||||||
|
| |||||||||||||||||
| 10,025,533 | ||||||||||||||||||
|
| |||||||||||||||||
| Chemicals 0.1% | ||||||||||||||||||
| e | Amyris Inc., senior note, 144A, 1.50%, 11/15/26 | United States | 1,652,000 | 845,267 | ||||||||||||||
| e | Danimer Scientific Inc., senior note, 144A, 3.25%, 12/15/26 | United States | 594,000 | 416,394 | ||||||||||||||
|
| |||||||||||||||||
| 1,261,661 | ||||||||||||||||||
|
| |||||||||||||||||
| Construction & Engineering 0.1% | ||||||||||||||||||
Granite Construction Inc., senior note, 2.75%, 11/01/24 | United States | 632,000 | 742,758 | |||||||||||||||
|
| |||||||||||||||||
| Consumer Finance 0.3% | ||||||||||||||||||
EZCORP Inc., senior note, 2.875%, 7/01/24 | United States | 1,003,000 | 1,052,147 | |||||||||||||||
| d | PRA Group Inc., senior note, 3.50%, 6/01/23 | United States | 2,265,000 | 2,294,728 | ||||||||||||||
| e | Upstart Holdings Inc., senior note, 144A, 0.25%, 8/15/26 | United States | 972,000 | 616,613 | ||||||||||||||
| e | Zip Co. Ltd., senior note, Reg S, zero cpn., 4/23/28 | Australia | 800,000 | AUD | 269,836 | |||||||||||||
|
| |||||||||||||||||
| 4,233,324 | ||||||||||||||||||
|
| |||||||||||||||||
| Diversified Consumer Services 0.1% | ||||||||||||||||||
Chegg Inc., senior note, zero cpn., 9/01/26 | United States | 2,250,000 | 1,755,000 | |||||||||||||||
|
| |||||||||||||||||
| Diversified Financial Services 0.1% | ||||||||||||||||||
Lendingtree Inc., senior note, 0.50%, 7/15/25 | United States | 1,441,000 | 1,073,545 | |||||||||||||||
|
| |||||||||||||||||
| Diversified Telecommunication Services 0.1% | ||||||||||||||||||
| e | Radius Global Infrastructure Inc., senior note, 144A, 2.50%, 9/15/26 | United States | 1,194,000 | 1,149,971 | ||||||||||||||
|
| |||||||||||||||||
| Electrical Equipment 0.1% | ||||||||||||||||||
| e | Array Technologies Inc., senior note, 144A, 1.00%, 12/01/28 | United States | 831,000 | 589,655 | ||||||||||||||
|
| |||||||||||||||||
| Electronic Equipment, Instruments & Components 0.2% | ||||||||||||||||||
OSI Systems Inc., senior note, 1.25%, 9/01/22 | United States | 1,256,000 | 1,262,580 | |||||||||||||||
PAR Technology Corp., senior note, 1.50%, 10/15/27 | United States | 906,000 | 765,570 | |||||||||||||||
Vishay Intertechnology Inc., senior note, 2.25%, 6/15/25 | United States | 989,000 | 971,854 | |||||||||||||||
|
| |||||||||||||||||
| 3,000,004 | ||||||||||||||||||
|
| |||||||||||||||||
| Energy Equipment & Services 0.1% | ||||||||||||||||||
| d | Helix Energy Solutions Group Inc., senior note, 6.75%, 2/15/26 | United States | 1,463,000 | 1,594,377 | ||||||||||||||
|
| |||||||||||||||||
| franklintempleton.com | Annual Report | 31 | ||||||||
FRANKLIN ALTERNATIVE STRATEGIES FUNDS
CONSOLIDATED SCHEDULE OF INVESTMENTS
Franklin K2 Alternative Strategies Fund (continued)
| Country | Principal Amount* | Value | ||||||||||||||||
| Convertible Bonds (continued) | ||||||||||||||||||
| Entertainment 0.4% | ||||||||||||||||||
Cinemark Holdings Inc., senior note, 4.50%, 8/15/25 | United States | 1,185,000 | $ | 1,681,959 | ||||||||||||||
| e | The Marcus Corp., senior note, 144A, 5.00%, 9/15/25 | United States | 750,000 | 1,248,750 | ||||||||||||||
Sea Ltd., senior note, 0.25%, 9/15/26 | Taiwan | 2,450,000 | 1,864,461 | |||||||||||||||
Zynga Inc., A, senior note, zero cpn., 12/15/26 | United States | 290,000 | 290,745 | |||||||||||||||
|
| |||||||||||||||||
| 5,085,915 | ||||||||||||||||||
|
| |||||||||||||||||
| Equity Real Estate Investment Trusts (REITs) 0.2% | ||||||||||||||||||
Braemar Hotels & Resorts Inc., senior note, 4.50%, 6/01/26 | United States | 536,000 | 614,792 | |||||||||||||||
| e | Hat Holdings I LLC / Hat Holdings II LLC, senior note, 144A, zero cpn., 5/01/25 | United States | 503,000 | 491,310 | ||||||||||||||
| d | Pebblebrook Hotel Trust, senior note, 1.75%, 12/15/26 | United States | 1,226,000 | 1,314,885 | ||||||||||||||
Summit Hotel Properties Inc., senior note, 1.50%, 2/15/26 | United States | 376,000 | 353,816 | |||||||||||||||
|
| |||||||||||||||||
| 2,774,803 | ||||||||||||||||||
|
| |||||||||||||||||
| Food & Staples Retailing 0.2% | ||||||||||||||||||
The Chefs’ Warehouse Inc., senior note, 1.875%, 12/01/24 | United States | 2,593,000 | 2,835,968 | |||||||||||||||
|
| |||||||||||||||||
| Health Care Equipment & Supplies 0.6% | ||||||||||||||||||
Cutera Inc., senior note, | ||||||||||||||||||
2.25%, 3/15/26 | United States | 305,000 | 473,372 | |||||||||||||||
e 144A, 2.25%, 6/01/28 | United States | 546,000 | 580,671 | |||||||||||||||
Haemonetics Corp., senior note, zero cpn., 3/01/26 | United States | 86,000 | 69,230 | |||||||||||||||
Mesa Laboratories Inc., senior note, 1.375%, 8/15/25 | United States | 435,000 | 418,010 | |||||||||||||||
NuVasive Inc., senior note, |
| |||||||||||||||||
d 1.00%, 6/01/23 | United States | 2,276,000 | 2,248,972 | |||||||||||||||
0.375%, 3/15/25 | United States | 669,000 | 623,424 | |||||||||||||||
| e | SmileDirectClub Inc., A, senior note, 144A, zero cpn., 2/01/26 | United States | 682,000 | 138,105 | ||||||||||||||
| e | Tandem Diabetes Care Inc., senior note, 144A, 1.50%, 5/01/25 | United States | 594,000 | 574,101 | ||||||||||||||
Varex Imaging Corp., senior note, 4.00%, 6/01/25 | United States | 1,310,000 | 1,707,894 | |||||||||||||||
|
| |||||||||||||||||
| 6,833,779 | ||||||||||||||||||
|
| |||||||||||||||||
| Health Care Providers & Services 0.1% | ||||||||||||||||||
Guardant Health Inc., senior note, zero cpn., 11/15/27 | United States | 70,000 | 46,550 | |||||||||||||||
PetIQ Inc., A, senior note, 4.00%, 6/01/26 | United States | 678,000 | 662,284 | |||||||||||||||
|
| |||||||||||||||||
| 708,834 | ||||||||||||||||||
|
| |||||||||||||||||
| Health Care Technology 0.2% | ||||||||||||||||||
Bandwidth Inc., senior note, 0.50%, 4/01/28 | United States | 1,256,000 | 782,177 | |||||||||||||||
| e | Bilibili Inc., Z, senior note, 144A, 0.50%, 12/01/26 | China | 95,000 | 62,652 | ||||||||||||||
Blackline Inc., senior note, zero cpn., 3/15/26 | United States | 626,000 | 517,702 | |||||||||||||||
Coupa Software Inc., senior note, | United States | 372,000 | 322,524 | |||||||||||||||
0.375%, 6/15/26 | United States | 440,000 | 348,498 | |||||||||||||||
Evolent Health Inc., senior note, 3.50%, 12/01/24 | United States | 260,000 | 430,853 | |||||||||||||||
Livongo Health Inc., senior note, 0.875%, 6/01/25 | United States | 175,000 | 150,238 | |||||||||||||||
Teladoc Health Inc., senior note, 1.25%, 6/01/27 | United States | 595,000 | 461,125 | |||||||||||||||
|
| |||||||||||||||||
| 3,075,769 | ||||||||||||||||||
|
| |||||||||||||||||
| Hotels, Restaurants & Leisure 0.2% | ||||||||||||||||||
Penn National Gaming Inc., senior note, 2.75%, 5/15/26 | United States | 45,000 | 70,852 | |||||||||||||||
| d | Royal Caribbean Cruises Ltd., senior note, 2.875%, 11/15/23 | United States | 1,776,000 | 1,801,752 | ||||||||||||||
Shake Shack Inc., senior note, zero cpn., 3/01/28 | United States | 173,000 | 120,062 | |||||||||||||||
|
| |||||||||||||||||
| 1,992,666 | ||||||||||||||||||
|
| |||||||||||||||||
| Insurance 0.0%† | ||||||||||||||||||
| e | HCI Group Inc., senior bond, 144A, 4.75%, 6/01/42 | United States | 532,000 | 546,364 | ||||||||||||||
|
| |||||||||||||||||
| 32 | Annual Report | franklintempleton.com | ||||||||
FRANKLIN ALTERNATIVE STRATEGIES FUNDS
CONSOLIDATED SCHEDULE OF INVESTMENTS
Franklin K2 Alternative Strategies Fund (continued)
| Country | Principal Amount* | Value | ||||||||||||||||
| Convertible Bonds (continued) | ||||||||||||||||||
| Interactive Media & Services 0.2% | ||||||||||||||||||
Snap Inc., senior note, |
| |||||||||||||||||
zero cpn., 5/01/27 | United States | 655,000 | $ | 483,312 | ||||||||||||||
e 144A, 0.125%, 3/01/28 | United States | 2,046,000 | 1,503,810 | |||||||||||||||
|
| |||||||||||||||||
| 1,987,122 | ||||||||||||||||||
|
| |||||||||||||||||
| Internet & Direct Marketing Retail 0.9% | ||||||||||||||||||
Airbnb Inc., senior note, zero cpn., 3/15/26 | United States | 122,000 | 108,336 | |||||||||||||||
| e | Cornwall Jersey Ltd., senior note, Reg S, 0.75%, 4/16/26 | United Kingdom | 200,000 | GBP | 188,319 | |||||||||||||
| e | Delivery Hero AG, senior note, Reg S, |
| ||||||||||||||||
1.50%, 1/15/28 | Saudi Arabia | 1,400,000 | EUR | 950,071 | ||||||||||||||
A, 1.00%, 4/30/26 | Saudi Arabia | 600,000 | EUR | 442,923 | ||||||||||||||
B, 2.125%, 3/10/29 | Saudi Arabia | 400,000 | EUR | 258,219 | ||||||||||||||
| e | Delivery Hero SE, senior note, Reg S, 0.25%, 1/23/24 | South Korea | 100,000 | EUR | 94,082 | |||||||||||||
| c | Fiverr International Ltd., senior note, zero cpn., 11/01/25 | United States | 1,763,000 | 1,361,918 | ||||||||||||||
| d | Fubotv Inc., senior note, 3.25%, 2/15/26 | United States | 1,270,000 | 393,700 | ||||||||||||||
Groupon Inc., senior note, 1.125%, 3/15/26 | United States | 1,264,000 | 811,370 | |||||||||||||||
| e | Just Eat Takeaway.Com NV, senior note, Reg S, |
| ||||||||||||||||
2.25%, 1/25/24 | United Kingdom | 400,000 | EUR | 393,757 | ||||||||||||||
1.25%, 4/30/26 | United Kingdom | 800,000 | EUR | 635,688 | ||||||||||||||
0.625%, 2/09/28 | United Kingdom | 1,000,000 | EUR | 692,606 | ||||||||||||||
zero cpn., 8/09/25 | United Kingdom | 100,000 | EUR | 79,748 | ||||||||||||||
| d | Magnite Inc., senior note, 0.25%, 3/15/26 | United States | 502,000 | 377,740 | ||||||||||||||
| e | Meituan, senior note, Reg S, zero cpn., 4/27/27 | China | 200,000 | 172,300 | ||||||||||||||
| e | Porch Group Inc., senior note, 144A, 0.75%, 9/15/26 | United States | 1,646,000 | 949,536 | ||||||||||||||
The Realreal Inc., senior note, 1.00%, 3/01/28 | United States | 304,000 | 169,856 | |||||||||||||||
Spotify USA Inc., senior note, zero cpn., 3/15/26 | United States | �� | 1,144,000 | 932,360 | ||||||||||||||
Twitter Inc., senior note, zero cpn., 3/15/26 | United States | 35,000 | 31,763 | |||||||||||||||
| c | Wayfair Inc., A, senior note, 0.625%, 10/01/25 | United States | 1,987,000 | 1,431,634 | ||||||||||||||
| e | Xometry Inc., A, senior note, 144A, 1.00%, 2/01/27 | United States | 760,000 | 658,965 | ||||||||||||||
Zillow Group Inc., senior note, 1.375%, 9/01/26 | United States | 25,000 | 28,813 | |||||||||||||||
|
| |||||||||||||||||
| 11,163,704 | ||||||||||||||||||
|
| |||||||||||||||||
| IT Services 0.3% | ||||||||||||||||||
| e | Affirm Holdings Inc., senior note, 144A, zero cpn., 11/15/26 | United States | 1,008,000 | 633,024 | ||||||||||||||
| e | Digitalocean Holdings Inc., senior note, 144A, zero cpn., 12/01/26 | United States | 1,696,000 | 1,326,272 | ||||||||||||||
Mitek Systems Inc., senior note, 0.75%, 2/01/26 | United States | 735,000 | 608,580 | |||||||||||||||
| e | Repay Holdings Corp., A, senior note, 144A, zero cpn., 2/01/26 | United States | 1,181,000 | 921,180 | ||||||||||||||
|
| |||||||||||||||||
| 3,489,056 | ||||||||||||||||||
|
| |||||||||||||||||
| Leisure Products 0.2% | ||||||||||||||||||
| e | NCL Corp. Ltd., senior noe, 144A, | United States | 2,112,000 | 1,624,128 | ||||||||||||||
2.50%, 2/15/27 | United States | 691,000 | 557,983 | |||||||||||||||
Peloton Interactive Inc., senior note, zero cpn., 2/15/26 | United States | 520,000 | 354,881 | |||||||||||||||
|
| |||||||||||||||||
| 2,536,992 | ||||||||||||||||||
|
| |||||||||||||||||
| Life Sciences Tools & Services 0.0%† | ||||||||||||||||||
| e | Inotiv Inc., senior note, 144A, 3.25%, 10/15/27 | United States | 587,000 | 415,655 | ||||||||||||||
|
| |||||||||||||||||
| Machinery 0.1% | ||||||||||||||||||
Bloom Energy Corp., senior note, 2.50%, 8/15/25 | United States | 596,000 | 765,741 | |||||||||||||||
The Greenbrier Cos. Inc., senior note, 2.875%, 4/15/28 | United States | 810,000 | 812,025 | |||||||||||||||
|
| |||||||||||||||||
| 1,577,766 | ||||||||||||||||||
|
| |||||||||||||||||
| Media 1.0% | ||||||||||||||||||
Cable One Inc., senior note, zero cpn., 3/15/26 | United States | 5,000 | 4,243 | |||||||||||||||
Dish Network Corp., |
| |||||||||||||||||
senior bond, 3.375%, 8/15/26 | United States | 2,167,000 | 1,638,978 | |||||||||||||||
senior note, zero cpn., 12/15/25 | United States | 742,000 | 594,155 | |||||||||||||||
| franklintempleton.com | Annual Report | 33 | ||||||||
FRANKLIN ALTERNATIVE STRATEGIES FUNDS
CONSOLIDATED SCHEDULE OF INVESTMENTS
Franklin K2 Alternative Strategies Fund (continued)
| Country | Principal Amount* | Value | ||||||||||||||||
| Convertible Bonds (continued) | ||||||||||||||||||
| Media (continued) | ||||||||||||||||||
| e | Liberty Broadband Corp., senior bond, 144A, | |||||||||||||||||
1.25%, 9/30/50 | United States | 1,938,000 | $ | 1,836,598 | ||||||||||||||
2.75%, 9/30/50 | United States | 1,525,000 | 1,483,412 | |||||||||||||||
Liberty Interactive LLC, |
| |||||||||||||||||
senior bond, 4.00%, 11/15/29 | United States | 1,448,000 | 991,880 | |||||||||||||||
senior note, 3.75%, 2/15/30 | United States | 1,969,000 | 1,351,226 | |||||||||||||||
| e | Liberty Media Corp., senior bond, 144A, |
| ||||||||||||||||
d 2.125%, 3/31/48 | United States | 2,017,000 | 1,978,677 | |||||||||||||||
2.75%, 12/01/49 | United States | 1,683,000 | 1,608,107 | |||||||||||||||
| e | Techtarget Inc., senior note, 144A, zero cpn., 12/15/26 | United States | 1,068,000 | 893,382 | ||||||||||||||
|
| |||||||||||||||||
| 12,380,658 | ||||||||||||||||||
|
| |||||||||||||||||
| Metals & Mining 0.5% | ||||||||||||||||||
Century Aluminum Co., senior note, 2.75%, 5/01/28 | United States | 514,000 | 491,898 | |||||||||||||||
| d,e | Ivanhoe Mines Ltd., senior note, 144A, 2.50%, 4/15/26 | Canada | 730,000 | 917,610 | ||||||||||||||
| e | Lithium Americas Corp., senior note, 144A, 1.75%, 1/15/27 | Canada | 817,000 | 734,891 | ||||||||||||||
| e | MP Materials Corp., senior note, 144A, 0.25%, 4/01/26 | United States | 747,000 | 833,279 | ||||||||||||||
Osisko Gold Royalties Ltd., senior note, 4.00%, 12/31/22 | Canada | 383,000 | CAD | 302,651 | ||||||||||||||
U.S. Steel Corp., senior note, 5.00%, 11/01/26 | United States | 1,608,000 | 3,241,728 | |||||||||||||||
|
| |||||||||||||||||
| 6,522,057 | ||||||||||||||||||
|
| |||||||||||||||||
| Mortgage Real Estate Investment Trusts (REITs) 0.7% | ||||||||||||||||||
Arbor Realty Trust Inc., senior note, 4.75%, 11/01/22 | United States | 1,841,000 | 1,862,171 | |||||||||||||||
| d | KKR Real Estate Finance Trust Inc., senior note, 6.125%, 5/15/23 | United States | 745,000 | 761,763 | ||||||||||||||
PennyMac Corp., senior note, |
| |||||||||||||||||
5.50%, 11/01/24 | United States | 911,000 | 897,335 | |||||||||||||||
5.50%, 3/15/26 | United States | 1,671,000 | 1,527,344 | |||||||||||||||
Redwood Trust Inc., senior note, 4.75%, 8/15/23 | United States | 2,286,000 | 2,242,402 | |||||||||||||||
Starwood Property Trust Inc., senior note, 4.375%, 4/01/23 | United States | 956,000 | 970,938 | |||||||||||||||
Two Harbors Investment Corp., senior note, 6.25%, 1/15/26 | United States | 1,225,000 | 1,156,859 | |||||||||||||||
|
| |||||||||||||||||
| 9,418,812 | ||||||||||||||||||
|
| |||||||||||||||||
| Oil, Gas & Consumable Fuels 0.0%† | ||||||||||||||||||
CNX Resources Corp., senior note, 2.25%, 5/01/26 | United States | 96,000 | 173,808 | |||||||||||||||
|
| |||||||||||||||||
| Personal Products 0.3% | ||||||||||||||||||
| e | The Beauty Health Co., senior note, 144A, 1.25%, 10/01/26 | United States | 1,622,000 | 1,360,047 | ||||||||||||||
Herbalife Nutrition Ltd., senior note, 2.625%, 3/15/24 | United States | 2,131,000 | 1,899,786 | |||||||||||||||
|
| |||||||||||||||||
| 3,259,833 | ||||||||||||||||||
|
| |||||||||||||||||
| Pharmaceuticals 0.7% | ||||||||||||||||||
Aerie Pharmaceuticals Inc., senior note, 1.50%, 10/01/24 | United States | 594,000 | 493,713 | |||||||||||||||
| e | Ascendis Pharma A/S, senior note, 144A, 2.25%, 4/01/28 | Denmark | 323,000 | 279,718 | ||||||||||||||
Aurora Cannabis Inc., senior note, 5.50%, 2/28/24 | Canada | 722,000 | 678,680 | |||||||||||||||
Avadel Finance Cayman Ltd., senior note, |
| |||||||||||||||||
4.50%, 2/01/23 | United States | 788,000 | 704,147 | |||||||||||||||
4.50%, 10/02/23 | United States | 597,000 | 450,377 | |||||||||||||||
| e | Canopy Growth Corp., senior note, 144A, 4.25%, 7/15/23 | Canada | 1,058,000 | CAD | 742,361 | |||||||||||||
Collegium Pharmaceutical Inc., senior note, 2.625%, 2/15/26 | United States | 1,021,000 | 864,787 | |||||||||||||||
Innoviva Inc., |
| |||||||||||||||||
e senior note, 144A, 2.125%, 3/15/28 | United States | 938,000 | 831,889 | |||||||||||||||
sub. note, 2.125%, 1/15/23 | United States | 642,000 | 649,223 | |||||||||||||||
Mannkind Corp., senior note, 2.50%, 3/01/26 | United States | 1,547,000 | 1,591,089 | |||||||||||||||
| d | Omeros Corp., senior note, 5.25%, 2/15/26 | United States | 691,000 | 405,032 | ||||||||||||||
Pacira Biosciences Inc., senior note, 0.75%, 8/01/25 | United States | 618,000 | 671,689 | |||||||||||||||
| d | Revance Therapeutics Inc., senior note, 1.75%, 2/15/27 | United States | 1,067,000 | 872,939 | ||||||||||||||
|
| |||||||||||||||||
| 9,235,644 | ||||||||||||||||||
|
| |||||||||||||||||
| 34 | Annual Report | franklintempleton.com | ||||||||
FRANKLIN ALTERNATIVE STRATEGIES FUNDS
CONSOLIDATED SCHEDULE OF INVESTMENTS
Franklin K2 Alternative Strategies Fund (continued)
| Country | Principal Amount* | Value | ||||||||||||||||
| Convertible Bonds (continued) | ||||||||||||||||||
| Professional Services 0.0%† | ||||||||||||||||||
| e | Upwork Inc., senior note, 144A, 0.25%, 8/15/26 | United States | 376,000 | $ | 286,328 | |||||||||||||
|
| |||||||||||||||||
| Real Estate Management & Development 0.2% | ||||||||||||||||||
| c,e | Opendoor Technologies Inc., senior note, 144A, 0.25%, 8/15/26 | United States | 1,827,000 | 1,229,571 | ||||||||||||||
| e | Realogy Group LLC / Realogy Co.-Issuer Corp., senior note, 144A, 0.25%, 6/15/26 | United States | 1,143,000 | 925,144 | ||||||||||||||
| d | Redfin Corp., senior note, 0.50%, 4/01/27 | United States | 1,307,000 | 734,534 | ||||||||||||||
|
| |||||||||||||||||
| 2,889,249 | ||||||||||||||||||
|
| |||||||||||||||||
| Road & Rail 0.0%† | ||||||||||||||||||
| c | Uber Technologies Inc., senior note, zero cpn., 12/15/25 | United States | 255,000 | 217,642 | ||||||||||||||
|
| |||||||||||||||||
| Semiconductors & Semiconductor Equipment 0.2% | ||||||||||||||||||
| e | ams AG, senior note, Reg S, 2.125%, 11/03/27 | Austria | 1,300,000 | EUR | 1,115,097 | |||||||||||||
Sunpower Corp., A, senior note, 4.00%, 1/15/23 | United States | 858,000 | 909,051 | |||||||||||||||
Veeco Instruments Inc., senior note, 3.75%, 6/01/27 | United States | 594,000 | 1,053,756 | |||||||||||||||
|
| |||||||||||||||||
| 3,077,904 | ||||||||||||||||||
|
| |||||||||||||||||
| Software 0.9% | ||||||||||||||||||
Alteryx Inc., senior note, 0.50%, 8/01/24 | United States | 1,395,000 | 1,250,269 | |||||||||||||||
Avaya Holdings Corp., senior note, 2.25%, 6/15/23 | United States | 1,384,000 | 1,134,188 | |||||||||||||||
| e | Bentley Systems Inc., senior note, 144A, 0.375%, 7/01/27 | United States | 881,000 | 702,598 | ||||||||||||||
| e | Dye & Durham Ltd., senior note, 144A, 3.75%, 3/01/26 | Canada | 1,384,000 | CAD | 927,335 | |||||||||||||
| e | Envestnet Inc., senior note, 144A, 0.75%, 8/15/25 | United States | 376,000 | 350,620 | ||||||||||||||
Everbridge Inc., senior note, 0.125%, 12/15/24 | United States | 1,237,000 | 1,097,941 | |||||||||||||||
| d | i3 Verticals LLC, senior note, 1.00%, 2/15/25 | United States | 788,000 | 732,840 | ||||||||||||||
| e | Nutanix Inc., senior note, 144A, 0.25%, 10/01/27 | United States | 854,000 | 630,425 | ||||||||||||||
Palo Alto Networks Inc., senior note, 0.75%, 7/01/23 | United States | 1,034,000 | 1,977,177 | |||||||||||||||
Ringcentral Inc., senior note, zero cpn., | United States | 5,000 | 3,890 | |||||||||||||||
A, 3/01/25 | United States | 1,595,000 | 1,371,700 | |||||||||||||||
Splunk Inc., senior note, 1.125%, 6/15/27 | United States | 230,000 | 197,340 | |||||||||||||||
| e | Unity Software Inc., senior note, 144A, zero cpn., 11/15/26 | United States | 5,000 | 3,796 | ||||||||||||||
| e | Veritone Inc., senior note, 144A, 1.75%, 11/15/26 | United States | 800,000 | 533,600 | ||||||||||||||
|
| |||||||||||||||||
| 10,913,719 | ||||||||||||||||||
|
| |||||||||||||||||
| Specialty Retail 0.3% | ||||||||||||||||||
| e | Dufry One BV, senior note, Reg S, 0.75%, 3/30/26 | Switzerland | 1,400,000 | CHF | 1,259,978 | |||||||||||||
| d | Guess? Inc., senior note, 2.00%, 4/15/24 | United States | 1,813,000 | 1,922,913 | ||||||||||||||
| e | Shift Technologies Inc., senior note, 144A, 4.75%, 5/15/26 | United States | 1,014,000 | 412,191 | ||||||||||||||
|
| |||||||||||||||||
| 3,595,082 | ||||||||||||||||||
|
| |||||||||||||||||
| Transportation Infrastructure 0.2% | ||||||||||||||||||
Eagle Bulk Shipping Inc., senior note, 5.00%, 8/01/24 | United States | 980,000 | 2,135,439 | |||||||||||||||
|
| |||||||||||||||||
Total Convertible Bonds (Cost $170,737,972) | 152,894,422 | |||||||||||||||||
|
| |||||||||||||||||
| Corporate Bonds and Notes 11.9% | ||||||||||||||||||
| Aerospace & Defense 0.3% | ||||||||||||||||||
The Boeing Co., | ||||||||||||||||||
senior bond, 2.25%, 6/15/26 | United States | 115,000 | 105,440 | |||||||||||||||
senior bond, 3.375%, 6/15/46 | United States | 90,000 | 62,851 | |||||||||||||||
senior bond, 3.625%, 3/01/48 | United States | 25,000 | 17,842 | |||||||||||||||
senior bond, 3.90%, 5/01/49 | United States | 100,000 | 75,494 | |||||||||||||||
senior bond, 3.75%, 2/01/50 | United States | 115,000 | 85,311 | |||||||||||||||
senior bond, 5.805%, 5/01/50 | United States | 125,000 | 123,234 | |||||||||||||||
senior bond, 3.825%, 3/01/59 | United States | 25,000 | 17,363 | |||||||||||||||
senior bond, 3.95%, 8/01/59 | United States | 30,000 | 21,851 | |||||||||||||||
senior note, 2.196%, 2/04/26 | United States | 435,000 | 398,810 | |||||||||||||||
senior note, 5.15%, 5/01/30 | United States | 155,000 | 154,261 | |||||||||||||||
| franklintempleton.com | Annual Report | 35 | ||||||||
FRANKLIN ALTERNATIVE STRATEGIES FUNDS
CONSOLIDATED SCHEDULE OF INVESTMENTS
Franklin K2 Alternative Strategies Fund (continued)
| Country | Principal Amount* | Value | ||||||||||||||||
| Corporate Bonds and Notes (continued) | ||||||||||||||||||
| Aerospace & Defense (continued) | ||||||||||||||||||
| e | Bombardier Inc., senior note, 144A, |
| ||||||||||||||||
d 7.50%, 12/01/24 | Canada | 1,306,000 | $ | 1,269,106 | ||||||||||||||
7.125%, 6/15/26 | Canada | 274,000 | 250,792 | |||||||||||||||
Embraer Netherlands Finance BV, senior bond, 5.05%, 6/15/25 | Brazil | 55,000 | 55,579 | |||||||||||||||
| e | Leonardo US Holdings Inc., senior bond, 144A, 6.25%, 1/15/40 | Italy | 236,000 | 248,718 | ||||||||||||||
Spirit Aerosystems Inc., |
| |||||||||||||||||
c senior bond, 4.60%, 6/15/28 | United States | 20,000 | 16,343 | |||||||||||||||
senior note, 3.95%, 6/15/23 | United States | 185,000 | 178,939 | |||||||||||||||
| e | ST Engineering Urban Solutions USA Inc., Reg S, 3.75%, 5/05/32 | Singapore | 600,000 | 586,005 | ||||||||||||||
| e | TransDigm Inc., senior secured note, 144A, 8.00%, 12/15/25 | United States | 205,000 | 214,090 | ||||||||||||||
|
| |||||||||||||||||
| 3,882,029 | ||||||||||||||||||
|
| |||||||||||||||||
| Airlines 0.2% | ||||||||||||||||||
American Airlines 2015-2 Class Aa Pass-Through Trust, 3.60%, 9/22/27 | United States | 931,239 | 882,888 | |||||||||||||||
American Airlines 2016-1 Class Aa Pass-Through Trust, AA, 3.575%, 1/15/28 | United States | 649,550 | 612,729 | |||||||||||||||
| e | American Airlines Group Inc., senior note, 144A, 3.75%, 3/01/25 | United States | 700,000 | 626,664 | ||||||||||||||
| e | Deutsche Lufthansa AG, E, senior note, Reg S, 2.875%, 5/16/27 | Germany | 100,000 | EUR | 95,028 | |||||||||||||
United Airlines Pass-Through Trust, | United States | 41,500 | 40,246 | |||||||||||||||
B, 3.50%, 5/01/28 | United States | 317,908 | 288,325 | |||||||||||||||
|
| |||||||||||||||||
| 2,545,880 | ||||||||||||||||||
|
| |||||||||||||||||
| Auto Components 0.1% | ||||||||||||||||||
| e | Tenneco Inc., senior secured note, 144A, 5.125%, 4/15/29 | United States | 1,748,000 | 1,715,225 | ||||||||||||||
|
| |||||||||||||||||
| Automobiles 0.4% | ||||||||||||||||||
American Honda Finance Corp., senior note, 1.50%, 1/13/25 | United States | 925,000 | 887,410 | |||||||||||||||
| e | Aston Martin Capital Holdings Ltd., senior secured note, 144A, 10.50%, 11/30/25 | United Kingdom | 700,000 | 689,710 | ||||||||||||||
Ford Motor Co., senior note, 9.00%, 4/22/25 | United States | 345,000 | 387,047 | |||||||||||||||
Ford Motor Credit Co. LLC, senior note, 5.125%, 6/16/25 | United States | 531,000 | 532,327 | |||||||||||||||
| d,e | Frontier Communications Holdings LLC, senior secured note, 144A, 8.75%, 5/15/30 | United States | 718,000 | 758,190 | ||||||||||||||
General Motors Co., senior bond, | United States | 30,000 | 27,286 | |||||||||||||||
5.40%, 4/01/48 | United States | 140,000 | 129,881 | |||||||||||||||
5.95%, 4/01/49 | United States | 190,000 | 188,321 | |||||||||||||||
General Motors Financial Co. Inc., | ||||||||||||||||||
h junior sub. note, A, 5.75% to 9/30/27, FRN thereafter, Perpetual | United States | 100,000 | 87,587 | |||||||||||||||
h junior sub. note, B, 6.50% to 9/30/28, FRN thereafter, Perpetual | United States | 75,000 | 69,140 | |||||||||||||||
h junior sub. note, C, 5.70% to 9/30/30, FRN thereafter, Perpetual | United States | 35,000 | 32,856 | |||||||||||||||
senior note, 1.20%, 10/15/24 | United States | 85,000 | 80,313 | |||||||||||||||
| c | Toyota Motor Credit Corp., senior note, 1.45%, 1/13/25 | United States | 925,000 | 888,404 | ||||||||||||||
|
| |||||||||||||||||
| 4,758,472 | ||||||||||||||||||
|
| |||||||||||||||||
| Banks 0.9% | ||||||||||||||||||
| e | Axis Bank Ltd., senior note, Reg S, 3.00%, 8/08/22 | India | 1,200,000 | 1,200,114 | ||||||||||||||
| e,i | Banco Hipotecario SA, senior note, 144A, FRN, 48.50%, (ARS BADLAR + 4.00%), 11/07/22 | Argentina | 2,107,720 | ARS | 10,083 | |||||||||||||
Bank of America Corp., senior note, 1.843% to 8/04/22, FRN thereafter, 2/04/25 | United States | 460,000 | 447,993 | |||||||||||||||
| i | The Bank of New York Mellon Corp., senior note, FRN, 1.335%, (SOFR + 0.62%), 4/25/25 | United States | 220,000 | 220,066 | ||||||||||||||
| 36 | Annual Report | franklintempleton.com | ||||||||
FRANKLIN ALTERNATIVE STRATEGIES FUNDS
CONSOLIDATED SCHEDULE OF INVESTMENTS
Franklin K2 Alternative Strategies Fund (continued)
| Country | Principal Amount* | Value | ||||||||||||||||
| Corporate Bonds and Notes (continued) | ||||||||||||||||||
| Banks (continued) | ||||||||||||||||||
| e | Bank Rakyat Indonesia Persero TBK PT, senior note, Reg S, 4.625%, 7/20/23 | Indonesia | 200,000 | $ | 202,760 | |||||||||||||
Barclays PLC, | United Kingdom | 325,000 | 281,989 | |||||||||||||||
h junior sub. note, 4.375% to 3/15/28, FRN thereafter, Perpetual | United Kingdom | 210,000 | 176,983 | |||||||||||||||
| e | Canara Bank, E, senior note, Reg S, 3.875%, 3/28/24 | India | 466,000 | 466,682 | ||||||||||||||
Citigroup Inc., senior note, | United States | 450,000 | 424,143 | |||||||||||||||
2.014% to 1/25/25, FRN thereafter, 1/25/26 | United States | 460,000 | 438,089 | |||||||||||||||
Deutsche Bank AG, sub. bond, 3.729% to 10/14/30, FRN thereafter, 1/14/32 | Germany | 400,000 | 333,963 | |||||||||||||||
| e,h | HDFC Bank Ltd., Reg S, 3.7% to 8/25/26, FRN thereafter, Perpetual | India | 200,000 | 176,522 | ||||||||||||||
| h | HSBC Holdings PLC, junior sub. note, 6.25% to 3/23/23, FRN thereafter, Perpetual | United Kingdom | 3,400,000 | 3,429,128 | ||||||||||||||
| i | Morgan Stanley, senior note, FRN, 1.868%, (SOFR + 1.17%), 4/17/25 | United States | 440,000 | 440,318 | ||||||||||||||
| e | Societe Generale SA, sub. bond, 144A, 3.653% to 7/08/30, FRN thereafter, 7/08/35 | France | 200,000 | 173,846 | ||||||||||||||
| e | Standard Chartered PLC, | |||||||||||||||||
h senior bond, Reg S, 7.75% to 4/02/23, FRN thereafter, Perpetual | United Kingdom | 200,000 | 205,091 | |||||||||||||||
sub. bond, 144A, 3.265% to 11/18/30, FRN thereafter, 2/18/36 | United Kingdom | 255,000 | 215,032 | |||||||||||||||
| e | State Bank of India, E, senior note, Reg S, 4.50%, 9/28/23 | India | 1,400,000 | 1,421,917 | ||||||||||||||
| e,h | TMB Bank PCL, E, junior sub. note, Reg S, 4.90% to 12/02/24, FRN thereafter, Perpetual | Thailand | 400,000 | 383,279 | ||||||||||||||
| i | Wells Fargo & Co., senior note, FRN, 2.03%, (SOFR + 1.32%), 4/25/26 | United States | 440,000 | 440,219 | ||||||||||||||
|
| |||||||||||||||||
| 11,088,217 | ||||||||||||||||||
|
| |||||||||||||||||
| Beverages 0.0%† | ||||||||||||||||||
Constellation Brands Inc., senior note, 3.60%, 5/09/24 | United States | 435,000 | 438,758 | |||||||||||||||
|
| |||||||||||||||||
| Capital Markets 0.5% | ||||||||||||||||||
Ares Capital Corp., | United States | 205,000 | 159,740 | |||||||||||||||
senior note, 2.875%, 6/15/28 | United States | 150,000 | 127,022 | |||||||||||||||
| e | Barings BDC Inc., senior note, 144A, 3.30%, 11/23/26 | United States | 125,000 | 112,420 | ||||||||||||||
| e | Coinbase Global Inc., 144A, | United States | 447,000 | 302,655 | ||||||||||||||
senior note, 3.375%, 10/01/28 | United States | 353,000 | 258,747 | |||||||||||||||
FS KKR Capital Corp., senior note, | United States | 360,000 | 336,348 | |||||||||||||||
3.125%, 10/12/28 | United States | 155,000 | 132,712 | |||||||||||||||
The Goldman Sachs Group Inc., senior note, | United States | 465,000 | 449,260 | |||||||||||||||
1.757% to 1/24/24, FRN thereafter, 1/24/25 | United States | 460,000 | 447,538 | |||||||||||||||
| e | Huarong Finance 2017 Co. Ltd., Reg S, | China | 200,000 | 191,250 | ||||||||||||||
h senior note, E, 4.00% to 11/07/22, FRN thereafter, Perpetual | China | 600,000 | 598,500 | |||||||||||||||
| e | Huarong Finance 2019 Co. Ltd., Reg S, | China | 1,000,000 | 908,750 | ||||||||||||||
senior bond, E, 3.875%, 11/13/29 | China | 200,000 | 172,250 | |||||||||||||||
senior bond, E, 3.625%, 9/30/30 | China | 200,000 | 165,000 | |||||||||||||||
h senior note, G, 4.25% to 9/30/25, FRN thereafter, Perpetual | China | 200,000 | 184,000 | |||||||||||||||
senior note, E, 2.125%, 9/30/23 | China | 200,000 | 195,500 | |||||||||||||||
senior note, E, 3.25%, 11/13/24 | China | 200,000 | 191,250 | |||||||||||||||
| franklintempleton.com | Annual Report | 37 | ||||||||
FRANKLIN ALTERNATIVE STRATEGIES FUNDS
CONSOLIDATED SCHEDULE OF INVESTMENTS
Franklin K2 Alternative Strategies Fund (continued)
| Country | Principal Amount* | Value | ||||||||||||||||
| Corporate Bonds and Notes (continued) | ||||||||||||||||||
| Capital Markets (continued) | ||||||||||||||||||
| e | Huarong Finance II Co. Ltd., senior bond, Reg S, | China | 500,000 | $ | 493,125 | |||||||||||||
4.875%, 11/22/26 | China | 200,000 | 192,750 | |||||||||||||||
Oaktree Specialty Lending Corp., senior note, 2.70%, 1/15/27 | United States | 75,000 | 66,717 | |||||||||||||||
Owl Rock Capital Corp., senior note, | United States | 220,000 | 203,068 | |||||||||||||||
2.875%, 6/11/28 | United States | 155,000 | 130,981 | |||||||||||||||
| e | Owl Rock Core Income Corp., senior note, 144A, 5.50%, 3/21/25 | United States | 182,000 | 178,533 | ||||||||||||||
Owl Rock Technology Finance Corp., senior note, 2.50%, 1/15/27 | United States | 90,000 | 78,494 | |||||||||||||||
|
| |||||||||||||||||
| 6,276,610 | ||||||||||||||||||
|
| |||||||||||||||||
| Chemicals 0.2% | ||||||||||||||||||
| e | Ashland LLC, senior bond, 144A, 3.375%, 9/01/31 | United States | 140,000 | 120,404 | ||||||||||||||
| e,h | Bluestar Finance Holdings Ltd., senior note, Reg S, | China | 200,000 | 194,460 | ||||||||||||||
3.875% to 6/24/23, FRN thereafter, Perpetual | China | 200,000 | 201,306 | |||||||||||||||
| e | Braskem Idesa SAPI, senior bond, Reg S, 6.99%, 2/20/32 | Mexico | 886,000 | 783,853 | ||||||||||||||
| e | Braskem Netherlands Finance BV, senior bond, 144A, 4.50%, 1/31/30 | Brazil | 200,000 | 187,577 | ||||||||||||||
| e | CNAC HK Finbridge Co. Ltd., senior note, Reg S, | China | 600,000 | 595,681 | ||||||||||||||
3.125%, 6/19/22 | China | 200,000 | 200,049 | |||||||||||||||
3.50%, 7/19/22 | China | 200,000 | 200,228 | |||||||||||||||
| e | Orbia Advance Corp. SAB de CV, senior bond, 144A, 2.875%, 5/11/31 | Mexico | 200,000 | 165,005 | ||||||||||||||
|
| |||||||||||||||||
| 2,648,563 | ||||||||||||||||||
|
| |||||||||||||||||
| Commercial Services & Supplies 0.0%† | ||||||||||||||||||
United Rentals North America Inc., senior bond, 4.875%, 1/15/28 | United States | 210,000 | 209,741 | |||||||||||||||
| e | Verscend Escrow Corp., senior note, 144A, 9.75%, 8/15/26 | United States | 296,000 | 305,282 | ||||||||||||||
|
| |||||||||||||||||
| 515,023 | ||||||||||||||||||
|
| |||||||||||||||||
| Communications Equipment 0.1% | ||||||||||||||||||
| e | Audacy Capital Corp., secured note, 144A, 6.75%, 3/31/29 | United States | 998,000 | 624,344 | ||||||||||||||
| e | CommScope Inc., 144A, | United States | 430,000 | 364,380 | ||||||||||||||
senior secured note, 4.75%, 9/01/29 | United States | 60,000 | 53,226 | |||||||||||||||
| e | CommScope Technologies LLC, senior bond, 144A, 5.00%, 3/15/27 | United States | 180,000 | 150,522 | ||||||||||||||
| e | HTA Group Ltd., senior note, 144A, 7.00%, 12/18/25 | Democratic Rep of the Congo | 435,000 | 423,166 | ||||||||||||||
|
| |||||||||||||||||
| 1,615,638 | ||||||||||||||||||
|
| |||||||||||||||||
| Construction & Engineering 0.1% | ||||||||||||||||||
| e | Artera Services LLC, senior secured note, 144A, 9.033%, 12/04/25 | United States | 800,000 | 633,404 | ||||||||||||||
| e | GMR Hyderabad International Airport Ltd., | India | 200,000 | 178,650 | ||||||||||||||
senior secured note, Reg S, 5.375%, 4/10/24 | India | 200,000 | 198,750 | |||||||||||||||
senior secured note, 144A, 4.75%, 2/02/26 | India | 200,000 | 190,500 | |||||||||||||||
| e | India Airport Infra, senior secured note, Reg S, 6.25%, 10/25/25 | India | 200,000 | 188,669 | ||||||||||||||
|
| |||||||||||||||||
| 1,389,973 | ||||||||||||||||||
|
| |||||||||||||||||
| 38 | Annual Report | franklintempleton.com | ||||||||
FRANKLIN ALTERNATIVE STRATEGIES FUNDS
CONSOLIDATED SCHEDULE OF INVESTMENTS
Franklin K2 Alternative Strategies Fund (continued)
| Country | Principal Amount* | Value | ||||||||||||||||
| Corporate Bonds and Notes (continued) | ||||||||||||||||||
| Construction Materials 0.1% | ||||||||||||||||||
| e | Cemex SAB de CV, senior secured bond, 144A, | Mexico | 200,000 | $ | 192,860 | |||||||||||||
5.20%, 9/17/30 | Mexico | 245,000 | 230,447 | |||||||||||||||
3.875%, 7/11/31 | Mexico | 200,000 | 169,782 | |||||||||||||||
| e | SRM Escrow Issuer LLC, senior secured note, 144A, 6.00%, 11/01/28 | United States | 784,000 | 733,314 | ||||||||||||||
|
| |||||||||||||||||
| 1,326,403 | ||||||||||||||||||
|
| |||||||||||||||||
| Consumer Finance 0.2% | ||||||||||||||||||
| h | Ally Financial Inc., C, junior sub. note, 4.70% to 5/15/28, FRN thereafter, Perpetual | United States | 305,000 | 244,357 | ||||||||||||||
| e | Manappuram Finance Ltd., E, senior secured note, Reg S, 5.90%, 1/13/23 | India | 239,000 | 239,227 | ||||||||||||||
| e | Muthoot Finance Ltd., senior secured note, Reg S, 6.125%, 10/31/22 | India | 1,800,000 | 1,805,202 | ||||||||||||||
| e | Shriram Transport Finance Co. Ltd., senior note, Reg S, 5.95%, 10/24/22 | India | 400,000 | 399,142 | ||||||||||||||
|
| |||||||||||||||||
| 2,687,928 | ||||||||||||||||||
|
| |||||||||||||||||
| Diversified Consumer Services 0.2% | ||||||||||||||||||
| e | Adtalem Global Education Inc., senior secured note, 144A, 5.50%, 3/01/28 | United States | 450,000 | 418,226 | ||||||||||||||
| e,h | CMHI Finance BVI Co. Ltd., senior note, Reg S, 3.50% to 10/09/23, FRN thereafter, Perpetual | China | 200,000 | 200,328 | ||||||||||||||
| d,e | The Hertz Corp., senior note, 144A, 5.00%, 12/01/29 | United States | 320,000 | 281,405 | ||||||||||||||
| e | MoneyGram International Inc., senior secured note, 144A, 5.375%, 8/01/26 | United States | 722,000 | 725,375 | ||||||||||||||
| e | Paysafe Finance PLC / Paysafe Holdings US Corp., senior secured note, 144A, 4.00%, 6/15/29 | United States | 441,000 | 344,948 | ||||||||||||||
| e | Sotheby’s/Bidfair Holdings Inc., senior secured note, 144A, 5.875%, 6/01/29 | United States | 700,000 | 617,281 | ||||||||||||||
| e | Verisure Midholding AB, senior note, Reg S, 5.25%, 2/15/29 | Sweden | 207,000 | EUR | 187,817 | |||||||||||||
|
| |||||||||||||||||
| 2,775,380 | ||||||||||||||||||
|
| |||||||||||||||||
| Diversified Financial Services 1.1% | ||||||||||||||||||
AerCap Ireland Capital DAC / AerCap Global Aviation Trust, senior note, 6.50%, 7/15/25 | Ireland | 150,000 | 156,715 | |||||||||||||||
| e | AG Issuer LLC, senior secured note, 144A, 6.25%, 3/01/28 | United States | 154,000 | 144,473 | ||||||||||||||
| e | Antares Holdings LP, senior note, 144A, 3.75%, 7/15/27 | Canada | 375,000 | 335,868 | ||||||||||||||
| e | Azure Orbit IV International Finance Ltd., E, senior note, Reg S, 3.75%, 1/25/23 | China | 700,000 | 702,284 | ||||||||||||||
| e | Blackstone Secured Lending Fund, senior note, 144A, 2.125%, 2/15/27 | United States | 405,000 | 348,292 | ||||||||||||||
| e | Bocom Leasing Management Hong Kong Co. Ltd., senior note, Reg S, | Hong Kong | 200,000 | 196,664 | ||||||||||||||
E, 1.125%, 6/18/24 | Hong Kong | 600,000 | 573,025 | |||||||||||||||
| i | Capital One Financial Corp., senior note, FRN, 2.139%, (SOFR + 1.35%), 5/09/25 | United States | 435,000 | 435,373 | ||||||||||||||
| e | CDBL Funding 2, senior note, Reg S, | China | 200,000 | 200,017 | ||||||||||||||
E, 1.375%, 3/04/24 | China | 800,000 | 770,740 | |||||||||||||||
| e | CICC Hong Kong Finance 2016 MTN Ltd., senior note, Reg S, | China | 400,000 | 393,798 | ||||||||||||||
E, 1.625%, 1/26/24 | China | 300,000 | 292,158 | |||||||||||||||
| e | Condor Merger Sub Inc., senior note, 144A, 7.375%, 2/15/30 | United States | 900,000 | 789,534 | ||||||||||||||
| e | Finance of America Funding LLC, senior note, 144A, 7.875%, 11/15/25 | United States | 700,000 | 605,023 | ||||||||||||||
| franklintempleton.com | Annual Report | 39 | ||||||||
FRANKLIN ALTERNATIVE STRATEGIES FUNDS
CONSOLIDATED SCHEDULE OF INVESTMENTS
Franklin K2 Alternative Strategies Fund (continued)
| Country | Principal Amount* | Value | ||||||||||||||||
| Corporate Bonds and Notes (continued) | ||||||||||||||||||
| Diversified Financial Services (continued) | ||||||||||||||||||
| e | Financiera de Desarrollo Territorial SA Findeter, senior bond, 144A, 7.875%, 8/12/24 | Colombia | 393,000,000 | COP | $ | 98,855 | ||||||||||||
| e | Jane Street Group / JSG Finance Inc., senior secured note, 144A, 4.50%, 11/15/29 | United States | 1,103,000 | 1,033,759 | ||||||||||||||
| d,e | Mozart Debt Merger Sub Inc., senior secured note, 144A, 3.875%, 4/01/29 | United States | 572,000 | 517,117 | ||||||||||||||
| e | MPH Acquisition Holdings LLC, senior note, 144A, 5.75%, 11/01/28 | United States | 700,000 | 624,204 | ||||||||||||||
OneMain Finance Corp., senior note, 3.50%, 1/15/27 | United States | 190,000 | 170,490 | |||||||||||||||
ORIX Corp., senior bond, 4.00%, 4/13/32 | Japan | 300,000 | 295,613 | |||||||||||||||
| e | Rec Ltd., senior note, Reg S, | India | 1,000,000 | 1,009,460 | ||||||||||||||
5.25%, 11/13/23 | India | 400,000 | 408,087 | |||||||||||||||
G, 3.375%, 7/25/24 | India | 300,000 | 296,664 | |||||||||||||||
| e | Rocket Mortgage LLC / Rocket Mortgage Co.-Issuer Inc., 144A, | United States | 350,000 | 287,543 | ||||||||||||||
senior note, 2.875%, 10/15/26 | United States | 1,010,000 | 904,854 | |||||||||||||||
senior note, 3.625%, 3/01/29 | United States | 405,000 | 351,717 | |||||||||||||||
| e | Vistajet Malta Finance PLC / XO Management Holding Inc., senior note, 144A, 6.375%, 2/01/30 | Switzerland | 691,000 | 588,525 | ||||||||||||||
| e | WMG Acquisition Corp., senior secured bond, 144A, 3.00%, 2/15/31 | United States | 1,106,000 | 949,501 | ||||||||||||||
|
| |||||||||||||||||
| 13,480,353 | ||||||||||||||||||
|
| |||||||||||||||||
| Diversified Telecommunication Services 0.2% | ||||||||||||||||||
| e | Altice France SA, senior secured note, Reg S, 3.375%, 1/15/28 | France | 663,000 | EUR | 599,177 | |||||||||||||
| e | IHS Holding Ltd., senior note, | Nigeria | 200,000 | 183,480 | ||||||||||||||
144A, 6.25%, 11/29/28 | Nigeria | 200,000 | 182,850 | |||||||||||||||
Reg S, 6.25%, 11/29/28 | Nigeria | 560,000 | 511,980 | |||||||||||||||
| e | Iliad SA, senior note, Reg S, 1.875%, 2/11/28 | France | 100,000 | EUR | 91,959 | |||||||||||||
| e | Kaixo Bondco Telecom SA, senior note, Reg S, 5.125%, 9/30/29 | Spain | 100,000 | EUR | 90,730 | |||||||||||||
| e | Kenbourne Invest SA, senior note, 144A, 6.875%, 11/26/24 | Chile | 200,000 | 192,077 | ||||||||||||||
| e | VMED O2 UK Financing I PLC, Reg S, | United Kingdom | 248,000 | GBP | 271,050 | |||||||||||||
senior secured note, 4.00%, 1/31/29 | United Kingdom | 100,000 | GBP | 108,507 | ||||||||||||||
|
| |||||||||||||||||
| 2,231,810 | ||||||||||||||||||
|
| |||||||||||||||||
| Electric Utilities 0.5% | ||||||||||||||||||
| d,f | Bruce Mansfield Escrow, senior bond, zero cpn., 6/01/34 | United States | 6,394,000 | 23,978 | ||||||||||||||
| e,h | China Huaneng Group Hong Kong Treasury Management Holding Ltd., senior note, Reg S, | China | 200,000 | 198,250 | ||||||||||||||
3.08% to 12/09/25, FRN thereafter, Perpetual | China | 400,000 | 387,000 | |||||||||||||||
| e | Comision Federal de Electricidad, senior note, Reg S, 4.688%, 5/15/29 | Mexico | 630,000 | 581,616 | ||||||||||||||
| h | Edison International, A, junior sub. note, 5.375% to 3/15/26, FRN thereafter, Perpetual | United States | 100,000 | 88,600 | ||||||||||||||
| e | EP Infrastructure AS, Reg S, | Czech Republic | 100,000 | EUR | 74,479 | |||||||||||||
senior note, 1.659%, 4/26/24 | Czech Republic | 147,000 | EUR | 140,749 | ||||||||||||||
senior note, 1.698%, 7/30/26 | Czech Republic | 396,000 | EUR | 331,850 | ||||||||||||||
| e | Eskom Holdings SOC Ltd., senior bond, Reg S, | South Africa | 245,000 | 234,389 | ||||||||||||||
8.45%, 8/10/28 | South Africa | 1,823,000 | 1,749,169 | |||||||||||||||
FirstEnergy Corp., C, senior bond, 3.40%, 3/01/50 | United States | 163,000 | 121,223 | |||||||||||||||
| e | Greenko Investment Co., senior secured note, Reg S, 4.875%, 8/16/23 | India | 200,000 | 197,550 | ||||||||||||||
| 40 | Annual Report | franklintempleton.com | ||||||||
FRANKLIN ALTERNATIVE STRATEGIES FUNDS
CONSOLIDATED SCHEDULE OF INVESTMENTS
Franklin K2 Alternative Strategies Fund (continued)
| Country | Principal Amount* | Value | ||||||||||||||||
| Corporate Bonds and Notes (continued) | ||||||||||||||||||
| Electric Utilities (continued) | ||||||||||||||||||
| e | Greenko Wind Projects Mauritius Ltd., senior note, Reg S, 5.50%, 4/06/25 | India | 200,000 | $ | 195,600 | |||||||||||||
| e | Oryx Funding Ltd., senior bond, 144A, 5.80%, 2/03/31 | Oman | 283,000 | 274,545 | ||||||||||||||
Pacific Gas and Electric Co., | United States | 452,000 | 368,910 | |||||||||||||||
secured bond, 4.95%, 7/01/50 | United States | 10,000 | 8,364 | |||||||||||||||
secured bond, 3.50%, 8/01/50 | United States | 185,000 | 130,129 | |||||||||||||||
senior bond, 4.30%, 3/15/45 | United States | 95,000 | 71,881 | |||||||||||||||
PG&E Corp., senior secured bond, 5.25%, 7/01/30 | United States | 700,000 | 647,059 | |||||||||||||||
|
| |||||||||||||||||
| 5,825,341 | ||||||||||||||||||
|
| |||||||||||||||||
| Energy Equipment & Services 0.2% | ||||||||||||||||||
| e | Solaris Midstream Holdings LLC, senior note, 144A, 7.625%, 4/01/26 | United States | 557,000 | 558,028 | ||||||||||||||
Transocean Inc., | United States | 189,000 | 114,239 | |||||||||||||||
e senior note, 144A, 7.50%, 1/15/26 | United States | 420,000 | 345,188 | |||||||||||||||
e senior note, 144A, 11.50%, 1/30/27 | United States | 911,000 | 914,885 | |||||||||||||||
e senior note, 144A, 8.00%, 2/01/27 | United States | 286,000 | 226,026 | |||||||||||||||
|
| |||||||||||||||||
| 2,158,366 | ||||||||||||||||||
|
| |||||||||||||||||
| Entertainment 0.1% | ||||||||||||||||||
| e,j | AMC Entertainment Holdings Inc., secured note, 144A, PIK, 10.00% (cash), 6/15/26 | United States | 519,000 | 398,610 | ||||||||||||||
Netflix Inc., senior bond, | United States | 80,000 | 79,419 | |||||||||||||||
5.875%, 11/15/28 | United States | 115,000 | 119,391 | |||||||||||||||
6.375%, 5/15/29 | United States | 170,000 | 180,891 | |||||||||||||||
e 144A, 5.375%, 11/15/29 | United States | 30,000 | 30,264 | |||||||||||||||
e 144A, 4.875%, 6/15/30 | United States | 175,000 | 172,277 | |||||||||||||||
|
| |||||||||||||||||
| 980,852 | ||||||||||||||||||
|
| |||||||||||||||||
| Equity Real Estate Investment Trusts (REITs) 0.2% | ||||||||||||||||||
| e | Brookfield Property REIT Inc. / BPR Cumulus LLC / BPR Nimbus LLC / GGSI Sellco LL, senior secured note, 144A, 4.50%, 4/01/27 | United States | 372,000 | 347,816 | ||||||||||||||
National Health Investors Inc., senior bond, 3.00%, 2/01/31 | United States | 30,000 | 23,934 | |||||||||||||||
SBA Communications Corp., senior note, | United States | 20,000 | 19,581 | |||||||||||||||
3.125%, 2/01/29 | United States | 700,000 | 623,665 | |||||||||||||||
Service Properties Trust, senior bond, 4.50%, 6/15/23 | United States | 265,000 | 257,563 | |||||||||||||||
| e | Uniti Group LP / Uniti Fiber Holdings Inc. / CSL Capital LLC, senior note, 144A, 6.00%, 1/15/30 | United States | 516,000 | 413,125 | ||||||||||||||
Vici Properties LP, senior bond, | United States | 219,000 | 217,431 | |||||||||||||||
d 5.625%, 5/15/52 | United States | 166,000 | 162,777 | |||||||||||||||
| e | Vici Properties LP / Vici Note Co. Inc., senior note, 144A, | United States | 85,000 | 86,035 | ||||||||||||||
4.625%, 6/15/25 | United States | 75,000 | 73,304 | |||||||||||||||
4.50%, 9/01/26 | United States | 125,000 | 119,571 | |||||||||||||||
4.25%, 12/01/26 | United States | 65,000 | 61,818 | |||||||||||||||
|
| |||||||||||||||||
| 2,406,620 | ||||||||||||||||||
|
| |||||||||||||||||
| Food & Staples Retailing 0.1% | ||||||||||||||||||
| e | JBS USA Lux SA / JBS USA Food Co. / JBS USA Finance Inc., senior note, 144A, 3.00%, 2/02/29 | United States | 70,000 | 62,043 | ||||||||||||||
| e | Marb Bondco PLC, senior bond, 144A, 3.95%, 1/29/31 | Brazil | 215,000 | 180,014 | ||||||||||||||
| e | Market Bidco Finco PLC, senior note, 144A, 5.50%, 11/04/27 | United Kingdom | 1,000,000 | 1,089,988 | ||||||||||||||
| franklintempleton.com | Annual Report | 41 | ||||||||
FRANKLIN ALTERNATIVE STRATEGIES FUNDS
CONSOLIDATED SCHEDULE OF INVESTMENTS
Franklin K2 Alternative Strategies Fund (continued)
| Country | Principal Amount* | Value | ||||||||||||||||
| Corporate Bonds and Notes (continued) | ||||||||||||||||||
| Food & Staples Retailing (continued) | ||||||||||||||||||
| e | Pilgrim’s Pride Corp., senior bond, 144A, 5.875%, 9/30/27 | United States | 195,000 | $ | 199,869 | |||||||||||||
|
| |||||||||||||||||
| 1,531,914 | ||||||||||||||||||
|
| |||||||||||||||||
| Food Products 0.0%† | ||||||||||||||||||
| e | Darling Ingredients Inc., senior note, 144A, 6.00%, 6/15/30 | United States | 140,000 | 140,000 | ||||||||||||||
| e | Post Holdings Inc., senior bond, 144A, 5.75%, 3/01/27 | United States | 165,000 | 168,546 | ||||||||||||||
| e | Wens Foodstuffs Group Co. Ltd., senior note, Reg S, 2.349%, 10/29/25 | China | 200,000 | 166,000 | ||||||||||||||
|
| |||||||||||||||||
| 474,546 | ||||||||||||||||||
|
| |||||||||||||||||
| Gas Utilities 0.0%† | ||||||||||||||||||
| e | Eustream AS, senior note, Reg S, 1.625%, 6/25/27 | Slovak Republic | 356,000 | EUR | 298,402 | |||||||||||||
| e | Spp Infrastructure Financing BV, senior bond, Reg S, 2.625%, 2/12/25 | Slovak Republic | 118,000 | EUR | 105,432 | |||||||||||||
|
| |||||||||||||||||
| 403,834 | ||||||||||||||||||
|
| |||||||||||||||||
| Health Care Equipment & Supplies 0.0%† | ||||||||||||||||||
| e | Avantor Funding Inc., senior note, 144A, 3.875%, 11/01/29 | United States | 130,000 | 120,860 | ||||||||||||||
|
| |||||||||||||||||
| Health Care Providers & Services 0.3% | ||||||||||||||||||
Centene Corp., senior note, 4.25%, 12/15/27 | United States | 415,000 | 413,554 | |||||||||||||||
| d | Encompass Health Corp., senior bond, 4.625%, 4/01/31 | United States | 719,000 | 638,573 | ||||||||||||||
| e | Global Medical Response Inc., senior secured note, 144A, 6.50%, 10/01/25 | United States | 522,000 | 502,101 | ||||||||||||||
HCA Inc., | United States | 115,000 | 119,025 | |||||||||||||||
senior bond, 5.875%, 2/15/26 | United States | 305,000 | 320,633 | |||||||||||||||
senior secured bond, 3.50%, 7/15/51 | United States | 284,000 | 212,772 | |||||||||||||||
| e | LifePoint Health Inc., senior note, 144A, 5.375%, 1/15/29 | United States | 749,000 | 632,485 | ||||||||||||||
| e | Molina Healthcare Inc., senior note, 144A, 4.375%, 6/15/28 | United States | 75,000 | 72,499 | ||||||||||||||
| e | RP Escrow Issuer LLC, senior secured note, 144A, 5.25%, 12/15/25 | United States | 579,000 | 528,766 | ||||||||||||||
| e | Tenet Healthcare Corp., senior secured note, 144A, 4.875%, 1/01/26 | United States | 779,000 | 778,244 | ||||||||||||||
|
| |||||||||||||||||
| 4,218,652 | ||||||||||||||||||
|
| |||||||||||||||||
| Health Care Technology 0.0%† | ||||||||||||||||||
Citrix Systems Inc., senior bond, 3.30%, 3/01/30 | United States | 36,000 | 35,626 | |||||||||||||||
|
| |||||||||||||||||
| Hotels, Restaurants & Leisure 0.3% | ||||||||||||||||||
| e | 1011778 BC ULC / New Red Finance Inc., secured note, 144A, 4.375%, 1/15/28 | Canada | 225,000 | 212,032 | ||||||||||||||
| e | Caesars Entertainment Inc., senior secured note, 144A, 6.25%, 7/01/25 | United States | 296,000 | 300,209 | ||||||||||||||
| e | Carnival Corp., senior note, 144A, | United States | 295,000 | 262,246 | ||||||||||||||
6.00%, 5/01/29 | United States | 25,000 | 21,168 | |||||||||||||||
| e | GENM Capital Labuan Ltd., senior bond, 144A, 3.882%, 4/19/31 | Malaysia | 200,000 | 166,400 | ||||||||||||||
| e | Haidilao International Holding Ltd., senior note, Reg S, 2.15%, 1/14/26 | China | 420,000 | 342,165 | ||||||||||||||
| e | Hilton Grand Vacations Borrower Escrow LLC, 144A, | United States | 50,000 | 44,161 | ||||||||||||||
senior note, 5.00%, 6/01/29 | United States | 90,000 | 83,812 | |||||||||||||||
Hyatt Hotels Corp., senior note, 5.625%, 4/23/25 | United States | 50,000 | 51,679 | |||||||||||||||
| e | International Game Technology PLC, senior bond, 144A, 6.50%, 2/15/25 | United States | 519,000 | 533,906 | ||||||||||||||
| e | Magallanes Inc., 144A, | United States | 90,000 | 84,203 | ||||||||||||||
senior note, 4.054%, 3/15/29 | United States | 60,000 | 57,525 | |||||||||||||||
| 42 | Annual Report | franklintempleton.com | ||||||||
FRANKLIN ALTERNATIVE STRATEGIES FUNDS
CONSOLIDATED SCHEDULE OF INVESTMENTS
Franklin K2 Alternative Strategies Fund (continued)
| Country | Principal Amount* | Value | ||||||||||||||||
| Corporate Bonds and Notes (continued) | ||||||||||||||||||
| Hotels, Restaurants & Leisure (continued) | ||||||||||||||||||
| e | Marriott Ownership Resorts Inc., senior note, 144A, 4.50%, 6/15/29 | United States | 70,000 | $ | 62,321 | |||||||||||||
| e | Penn National Gaming Inc., senior note, 144A, 4.125%, 7/01/29 | United States | 55,000 | 45,133 | ||||||||||||||
| e | Royal Caribbean Cruises Ltd., senior note, 144A, | United States | 45,000 | 38,514 | ||||||||||||||
5.50%, 4/01/28 | United States | 310,000 | 262,169 | |||||||||||||||
| e | Scientific Games International Inc., senior note, 144A, | United States | 200,000 | 198,478 | ||||||||||||||
c 7.25%, 11/15/29 | United States | 70,000 | 69,678 | |||||||||||||||
| e | Station Casinos LLC, senior bond, 144A, 4.625%, 12/01/31 | United States | 956,000 | 811,575 | ||||||||||||||
Travel + Leisure Co., | United States | 10,000 | 9,924 | |||||||||||||||
e senior secured bond, 144A, 4.625%, 3/01/30 | United States | 45,000 | 39,125 | |||||||||||||||
e senior secured note, 144A, 6.625%, 7/31/26 | United States | 125,000 | 128,632 | |||||||||||||||
e senior secured note, 144A, 4.50%, 12/01/29 | United States | 215,000 | 190,196 | |||||||||||||||
|
| |||||||||||||||||
| 4,015,251 | ||||||||||||||||||
|
| |||||||||||||||||
| Household Durables 0.2% | ||||||||||||||||||
| d,e | K. Hovnanian Enterprises Inc., senior secured note, 144A, | United States | 1,164,000 | 1,174,298 | ||||||||||||||
10.50%, 2/15/26 | United States | 850,000 | 862,482 | |||||||||||||||
|
| |||||||||||||||||
| 2,036,780 | ||||||||||||||||||
|
| |||||||||||||||||
| Household Products 0.1% | ||||||||||||||||||
| e | Spectrum Brands Inc., senior bond, 144A, 3.875%, 3/15/31 | United States | 840,000 | 720,334 | ||||||||||||||
|
| |||||||||||||||||
| Independent Power & Renewable Electricity Producers 0.0%† | ||||||||||||||||||
NRG Energy Inc., senior note, 5.75%, 1/15/28 | United States | 165,000 | 165,633 | |||||||||||||||
| e | NTPC Ltd., E, senior bond, Reg S, 4.75%, 10/03/22 | India | 200,000 | 201,136 | ||||||||||||||
|
| |||||||||||||||||
| 366,769 | ||||||||||||||||||
|
| |||||||||||||||||
| Industrial Conglomerates 0.1% | ||||||||||||||||||
| e | Citic Ltd., E, senior bond, Reg S, 3.50%, 2/17/32 | China | 400,000 | 363,993 | ||||||||||||||
Icahn Enterprises LP / Icahn Enterprises Finance Corp., senior note, | United States | 55,000 | 55,147 | |||||||||||||||
6.25%, 5/15/26 | United States | 95,000 | 95,609 | |||||||||||||||
5.25%, 5/15/27 | United States | 225,000 | 217,608 | |||||||||||||||
4.375%, 2/01/29 | United States | 195,000 | 177,341 | |||||||||||||||
|
| |||||||||||||||||
| 909,698 | ||||||||||||||||||
|
| |||||||||||||||||
| Insurance 0.1% | ||||||||||||||||||
| e,h | Asahi Mutual Life Insurance Co., sub. note, Reg S, 6.50% to 9/05/23, FRN thereafter, Perpetual | Japan | 200,000 | 203,500 | ||||||||||||||
| e | Athene Global Funding, secured note, 144A, 1.716%, 1/07/25 | United States | 380,000 | 357,921 | ||||||||||||||
| i | Genworth Holdings Inc., senior bond, FRN, 3.414%, (3-Month USD LIBOR + 2.00%), 11/15/36 | United States | 342,000 | 173,604 | ||||||||||||||
| e | Global Atlantic Finance Co., senior bond, 144A, 4.40%, 10/15/29 | United States | 165,000 | 154,620 | ||||||||||||||
| e,h | KDB Life Insurance Co. Ltd., sub. note, Reg S, 7.50% to 5/21/23, FRN thereafter, Perpetual | South Korea | 200,000 | 196,000 | ||||||||||||||
| e | QBE Insurance Group Ltd., sub. bond, Reg S, 7.50% to 11/24/23, FRN thereafter, 11/24/43 | Australia | 250,000 | 257,834 | ||||||||||||||
|
| |||||||||||||||||
| 1,343,479 | ||||||||||||||||||
|
| |||||||||||||||||
| Interactive Media & Services 0.1% | ||||||||||||||||||
| e | Tencent Holdings Ltd., senior bond, Reg S, | China | 250,000 | 195,169 | ||||||||||||||
3.94%, 4/22/61 | China | 500,000 | 386,824 | |||||||||||||||
| e | Twitter Inc., senior note, 144A, 3.875%, 12/15/27 | United States | 265,000 | 255,693 | ||||||||||||||
|
| |||||||||||||||||
| 837,686 | ||||||||||||||||||
|
| |||||||||||||||||
| franklintempleton.com | Annual Report | 43 | ||||||||
FRANKLIN ALTERNATIVE STRATEGIES FUNDS
CONSOLIDATED SCHEDULE OF INVESTMENTS
Franklin K2 Alternative Strategies Fund (continued)
| Country | Principal Amount* | Value | ||||||||||||||||
| Corporate Bonds and Notes (continued) | ||||||||||||||||||
| Internet & Direct Marketing Retail 0.2% | ||||||||||||||||||
Alibaba Group Holding Ltd., senior bond, 3.15%, 2/09/51 | China | 200,000 | $ | 139,661 | ||||||||||||||
Amazon.com Inc., senior bond, | United States | 1,158,000 | 864,962 | |||||||||||||||
2.70%, 6/03/60 | United States | 61,000 | 44,217 | |||||||||||||||
| e | Arches Buyer Inc., senior note, 144A, 6.125%, 12/01/28 | United States | 700,000 | 589,032 | ||||||||||||||
| e | Meituan, senior bond, Reg S, 3.05%, 10/28/30 | China | 600,000 | 455,317 | ||||||||||||||
| e | Prosus NV, Reg S, | China | 100,000 | EUR | 77,930 | |||||||||||||
senior bond, 2.778%, 1/19/34 | China | 289,000 | EUR | 237,492 | ||||||||||||||
senior note, 1.288%, 7/13/29 | China | 100,000 | EUR | 84,594 | ||||||||||||||
|
| |||||||||||||||||
| 2,493,205 | ||||||||||||||||||
|
| |||||||||||||||||
| IT Services 0.1% | ||||||||||||||||||
| e | CA Magnum Holdings, senior secured note, 144A, 5.375%, 10/31/26 | India | 143,000 | 132,275 | ||||||||||||||
| e | Hurricane Finance PLC, senior secured note, Reg S, 8.00%, 10/15/25 | United Kingdom | 358,000 | GBP | 451,161 | |||||||||||||
| e | Virtusa Corp., senior note, 144A, 7.125%, 12/15/28 | United States | 700,000 | 590,541 | ||||||||||||||
|
| |||||||||||||||||
| 1,173,977 | ||||||||||||||||||
|
| |||||||||||||||||
| Leisure Products 0.1% | ||||||||||||||||||
| e | Mattel Inc., senior note, 144A, 3.375%, 4/01/26 | United States | 590,000 | 573,716 | ||||||||||||||
| e | NCL Corp. Ltd., 144A, | United States | 195,000 | 176,027 | ||||||||||||||
senior secured note, 5.875%, 2/15/27 | United States | 148,000 | 138,129 | |||||||||||||||
| e | NCL Finance Ltd., senior note, 144A, 6.125%, 3/15/28 | United States | 65,000 | 54,768 | ||||||||||||||
|
| |||||||||||||||||
| 942,640 | ||||||||||||||||||
|
| |||||||||||||||||
| Machinery 0.1% | ||||||||||||||||||
Caterpillar Financial Services Corp., senior note, 0.95%, 1/10/24 | United States | 345,000 | 335,930 | |||||||||||||||
John Deere Capital Corp., senior note, | United States | 85,000 | 82,649 | |||||||||||||||
1.25%, 1/10/25 | United States | 130,000 | 124,369 | |||||||||||||||
| e | TK Elevator US Newco Inc., senior secured note, 144A, 5.25%, 7/15/27 | Germany | 371,000 | 362,233 | ||||||||||||||
|
| |||||||||||||||||
| 905,181 | ||||||||||||||||||
|
| |||||||||||||||||
| Marine 0.0%† | ||||||||||||||||||
| d,e | Stena International SA, senior secured bond, 144A, 5.75%, 3/01/24 | Sweden | 299,000 | 290,063 | ||||||||||||||
|
| |||||||||||||||||
| Media 0.7% | ||||||||||||||||||
| e | Advantage Sales & Marketing Inc., senior secured note, 144A, 6.50%, 11/15/28 | United States | 132,000 | 117,799 | ||||||||||||||
| e | CCO Holdings LLC / CCO Holdings Capital Corp., senior bond, 144A, | United States | 40,000 | 40,133 | ||||||||||||||
5.125%, 5/01/27 | United States | 1,335,000 | 1,317,598 | |||||||||||||||
Charter Communications Operating LLC / Charter Communications Operating Capital, senior secured bond, | United States | 20,000 | 16,741 | |||||||||||||||
4.40%, 12/01/61 | United States | 860,000 | 668,637 | |||||||||||||||
d 3.95%, 6/30/62 | United States | 1,439,000 | 1,036,836 | |||||||||||||||
CSC Holdings LLC, senior bond, | United States | 371,000 | 367,116 | |||||||||||||||
e 144A, 4.125%, 12/01/30 | United States | 20,000 | 17,201 | |||||||||||||||
e 144A, 3.375%, 2/15/31 | United States | 63,000 | 51,203 | |||||||||||||||
e 144A, 4.50%, 11/15/31 | United States | 234,000 | 201,098 | |||||||||||||||
e 144A, 4.625%, 12/01/30 | United States | 1,010,000 | 794,840 | |||||||||||||||
| 44 | Annual Report | franklintempleton.com | ||||||||
FRANKLIN ALTERNATIVE STRATEGIES FUNDS
CONSOLIDATED SCHEDULE OF INVESTMENTS
Franklin K2 Alternative Strategies Fund (continued)
| Country | Principal Amount* | Value | ||||||||||||||||
| Corporate Bonds and Notes (continued) | ||||||||||||||||||
| Media (continued) | ||||||||||||||||||
| e | DIRECTV Holdings LLC / DIRECTV Financing Co. Inc., senior secured note, 144A, 5.875%, 8/15/27 | United States | 60,000 | $ | 56,684 | |||||||||||||
DISH DBS Corp., | United States | 61,000 | 59,890 | |||||||||||||||
senior note, 5.125%, 6/01/29 | United States | 375,000 | 265,305 | |||||||||||||||
e senior secured note, 144A, 5.25%, 12/01/26 | United States | 410,000 | 347,649 | |||||||||||||||
| e | iHeartCommunications Inc., senior secured note, 144A, | United States | 90,000 | 84,844 | ||||||||||||||
4.75%, 1/15/28 | United States | 510,000 | 460,563 | |||||||||||||||
Liberty Interactive LLC, senior bond, 8.25%, 2/01/30 | United States | 840,000 | 608,047 | |||||||||||||||
| e | Outfront Media Capital LLC / Outfront Media Capital Corp., senior note, 144A, 5.00%, 8/15/27 | United States | 60,000 | 56,253 | ||||||||||||||
| e | Spanish Broadcasting System Inc., senior secured note, 144A, 9.75%, 3/01/26 | United States | 700,000 | 651,662 | ||||||||||||||
| e | Urban One Inc., senior secured note, 144A, 7.375%, 2/01/28 | United States | 800,000 | 756,636 | ||||||||||||||
| e | Virgin Media Secured Finance PLC, senior secured bond, Reg S, 4.25%, 1/15/30 | United Kingdom | 258,000 | GBP | 283,148 | |||||||||||||
| e | VZ Secured Financing BV, senior secured note, Reg S, 3.50%, 1/15/32 | Netherlands | 357,000 | EUR | 323,674 | |||||||||||||
| e | Wolverine Escrow LLC, senior secured note, 144A, 8.50%, 11/15/24 | United States | 654,000 | 323,730 | ||||||||||||||
|
| |||||||||||||||||
| 8,907,287 | ||||||||||||||||||
|
| |||||||||||||||||
| Metals & Mining 0.3% | ||||||||||||||||||
| e | Abja Investment Co. Pte. Ltd., senior note, Reg S, 4.45%, 7/24/23 | India | 200,000 | 201,597 | ||||||||||||||
| e | First Quantum Minerals Ltd., senior note, 144A, | Zambia | 200,000 | 201,000 | ||||||||||||||
6.875%, 10/15/27 | Zambia | 620,000 | 619,758 | |||||||||||||||
Freeport-McMoRan Inc., | United States | 95,000 | 92,023 | |||||||||||||||
senior note, 4.25%, 3/01/30 | United States | 95,000 | 89,961 | |||||||||||||||
| e | Glencore Funding LLC, senior bond, 144A, 2.85%, 4/27/31 | Australia | 305,000 | 262,373 | ||||||||||||||
| e | Indonesia Asahan Aluminium Persero PT, senior bond, Reg S, 5.80%, 5/15/50 | Indonesia | 400,000 | 359,840 | ||||||||||||||
| e,h | MCC Holding Hong Kong Corp. Ltd., senior note, Reg S, 3.50% to 1/16/23, FRN thereafter, Perpetual | China | 200,000 | 200,100 | ||||||||||||||
| e | Taseko Mines Ltd., senior secured note, 144A, 7.00%, 2/15/26 | Canada | 672,000 | 646,656 | ||||||||||||||
| e | Vedanta Resources Finance II PLC, senior note, Reg S, 13.875%, 1/21/24 | India | 200,000 | 203,142 | ||||||||||||||
| e | Vedanta Resources Ltd., senior note, Reg S, 6.375%, 7/30/22 | India | 700,000 | 698,694 | ||||||||||||||
| e | Volcan Cia Minera SAA, senior note, 144A, 4.375%, 2/11/26 | Peru | 30,000 | 27,488 | ||||||||||||||
|
| |||||||||||||||||
| 3,602,632 | ||||||||||||||||||
|
| |||||||||||||||||
| Mining 0.0%† | ||||||||||||||||||
| e | FMG Resources August 2006 Pty Ltd., senior note, 144A, 4.50%, 9/15/27 | Australia | 105,000 | 101,509 | ||||||||||||||
|
| |||||||||||||||||
| Mortgage Real Estate Investment Trusts (REITs) 0.1% | ||||||||||||||||||
| e | Apollo Commercial Real Estate Finance Inc., senior secured note, 144A, 4.625%, 6/15/29 | United States | 690,000 | 586,051 | ||||||||||||||
| e | New Residential Investment Corp., senior note, 144A, 6.25%, 10/15/25 | United States | 700,000 | 659,292 | ||||||||||||||
|
| |||||||||||||||||
| 1,245,343 | ||||||||||||||||||
|
| |||||||||||||||||
| Multiline Retail 0.0%† | ||||||||||||||||||
| d | Kohl’s Corp., senior bond, 5.55%, 7/17/45 | United States | 424,000 | 388,142 | ||||||||||||||
|
| |||||||||||||||||
| Oil, Gas & Consumable Fuels 1.7% | ||||||||||||||||||
| e | Aker BP ASA, senior bond, 144A, 4.00%, 1/15/31 | Norway | 150,000 | 140,902 | ||||||||||||||
| e | Continental Resources Inc., senior bond, 144A, 5.75%, 1/15/31 | United States | 195,000 | 200,703 | ||||||||||||||
| franklintempleton.com | Annual Report | 45 | ||||||||
FRANKLIN ALTERNATIVE STRATEGIES FUNDS
CONSOLIDATED SCHEDULE OF INVESTMENTS
Franklin K2 Alternative Strategies Fund (continued)
| Country | Principal Amount* | Value | ||||||||||||||||
| Corporate Bonds and Notes (continued) | ||||||||||||||||||
| Oil, Gas & Consumable Fuels (continued) | ||||||||||||||||||
Dcp Midstream Operating LP, senior note, 5.375%, 7/15/25 | United States | 205,000 | $ | 210,374 | ||||||||||||||
| e | Energean Israel Finance Ltd., senior secured note, 144A, Reg S, 5.375%, 3/30/28 | Israel | 105,000 | 97,650 | ||||||||||||||
Energy Transfer LP, | United States | 453,000 | 453,902 | |||||||||||||||
senior bond, 6.00%, 6/15/48 | United States | 229,000 | 226,942 | |||||||||||||||
senior bond, 6.25%, 4/15/49 | United States | 362,000 | 370,229 | |||||||||||||||
h junior sub. note, H, 6.50% to 11/15/26, FRN thereafter, Perpetual | United States | 207,000 | 193,779 | |||||||||||||||
| e | EQM Midstream Partners LP, senior note, 144A, | United States | 125,000 | 125,000 | ||||||||||||||
7.50%, 6/01/30 | United States | 125,000 | 125,000 | |||||||||||||||
Equities Corp., senior note, | United States | 75,000 | 72,398 | |||||||||||||||
5.00%, 1/15/29 | United States | 35,000 | 34,806 | |||||||||||||||
e 144A, 3.125%, 5/15/26 | United States | 40,000 | 37,811 | |||||||||||||||
e 144A, 3.625%, 5/15/31 | United States | 135,000 | 121,623 | |||||||||||||||
| e | Hess Midstream Operations LP, senior note, 144A, 5.625%, 2/15/26 | United States | 60,000 | 61,334 | ||||||||||||||
| e | Indian Oil Corp. Ltd., senior bond, Reg S, 5.75%, 8/01/23 | India | 300,000 | 307,126 | ||||||||||||||
| e | Laredo Petroleum Inc., senior note, 144A, 7.75%, 7/31/29 | United States | 700,000 | 690,781 | ||||||||||||||
| e | Leviathan Bond Ltd., senior note, 144A, Reg S, 6.50%, 6/30/27 | Israel | 100,000 | 99,867 | ||||||||||||||
| e | MC Brazil Downstream Trading SARL, senior secured note, Reg S, 7.25%, 6/30/31 | Brazil | 612,000 | 546,504 | ||||||||||||||
| e | Moss Creek Resources Holdings Inc., senior note, 144A, | United States | 239,000 | 216,203 | ||||||||||||||
d 10.50%, 5/15/27 | United States | 761,000 | 740,556 | |||||||||||||||
| e | New Fortress Energy Inc., senior secured note, 144A, 6.75%, 9/15/25 | United States | 797,000 | 785,595 | ||||||||||||||
| e | NGL Energy Operating LLC / NGL Energy Finance Corp., senior secured note, 144A, 7.50%, 2/01/26 | United States | 783,000 | 735,041 | ||||||||||||||
| e | Northern Oil And Gas Inc., senior note, 144A, 8.125%, 3/01/28 | United States | 608,000 | 623,075 | ||||||||||||||
Occidental Petroleum Corp., | United States | 15,000 | 18,753 | |||||||||||||||
senior bond, 6.125%, 1/01/31 | United States | 10,000 | 10,863 | |||||||||||||||
senior bond, 7.875%, 9/15/31 | United States | 15,000 | 18,197 | |||||||||||||||
senior note, 5.55%, 3/15/26 | United States | 385,000 | 401,478 | |||||||||||||||
| e | Ongc Videsh Ltd., senior bond, Reg S, 3.75%, 5/07/23 | India | 363,000 | 364,480 | ||||||||||||||
Ovintiv Inc., senior bond, | United States | 25,000 | 29,416 | |||||||||||||||
7.20%, 11/01/31 | United States | 5,000 | 5,677 | |||||||||||||||
7.375%, 11/01/31 | United States | 5,000 | 5,736 | |||||||||||||||
6.50%, 8/15/34 | United States | 20,000 | 21,893 | |||||||||||||||
6.625%, 8/15/37 | United States | 45,000 | 49,500 | |||||||||||||||
6.50%, 2/01/38 | United States | 10,000 | 10,865 | |||||||||||||||
Petroleos Mexicanos, senior bond, | Mexico | 565,000 | 473,874 | |||||||||||||||
6.625%, 6/15/35 | Mexico | 380,000 | 307,709 | |||||||||||||||
6.75%, 9/21/47 | Mexico | 1,912,000 | 1,378,657 | |||||||||||||||
7.69%, 1/23/50 | Mexico | 2,794,000 | 2,177,127 | |||||||||||||||
6.95%, 1/28/60 | Mexico | 2,295,000 | 1,634,533 | |||||||||||||||
| e | Renewable Energy Group Inc., senior secured note, 144A, 5.875%, 6/01/28 | United States | 300,000 | 319,359 | ||||||||||||||
Southwestern Energy Co., senior bond, 4.75%, 2/01/32 | United States | 25,000 | 24,466 | |||||||||||||||
| d | Talos Production Inc., secured note, 12.00%, 1/15/26 | United States | 602,000 | 651,283 | ||||||||||||||
Targa Resources Partners LP / Targa Resources Partners Finance Corp., senior bond, 4.875%, 2/01/31 | United States | 591,000 | 567,322 | |||||||||||||||
| e | Thai Oil PCL, senior bond, Reg S, 3.625%, 1/23/23 | Thailand | 200,000 | 200,027 | ||||||||||||||
| e | Thaioil Treasury Center Co. Ltd., senior note, Reg S, 3.625%, 1/23/23 | Thailand | 400,000 | 400,014 | ||||||||||||||
| 46 | Annual Report | franklintempleton.com | ||||||||
FRANKLIN ALTERNATIVE STRATEGIES FUNDS
CONSOLIDATED SCHEDULE OF INVESTMENTS
Franklin K2 Alternative Strategies Fund (continued)
| Country | Principal Amount* | Value | ||||||||||||||||
| Corporate Bonds and Notes (continued) | ||||||||||||||||||
| Oil, Gas & Consumable Fuels (continued) | ||||||||||||||||||
| e | Transocean Guardian Ltd., senior secured note, 144A, 5.875%, 1/15/24 | United States | 412,350 | $ | 395,079 | |||||||||||||
| e | Tullow Oil PLC, senior note, Reg S, 10.25%, 5/15/26 | Ghana | 1,785,000 | 1,737,715 | ||||||||||||||
| e | Venture Global Calcasieu Pass LLC, senior secured bond, 144A, 3.875%, 11/01/33 | United States | 775,000 | 704,514 | ||||||||||||||
Western Midstream Operating LP, senior note, 3.60%, 2/01/25 | United States | 160,000 | 156,660 | |||||||||||||||
| e | YPF Sociedad Anonima, | Argentina | 421,000 | 323,856 | ||||||||||||||
senior bond, 144A, 6.95%, 7/21/27 | Argentina | 105,000 | 70,609 | |||||||||||||||
senior note, Reg S, 8.75%, 4/04/24 | Argentina | 886,900 | 793,266 | |||||||||||||||
senior note, Reg S, 8.50%, 3/23/25 | Argentina | 961,500 | 829,885 | |||||||||||||||
|
| |||||||||||||||||
| 21,300,014 | ||||||||||||||||||
|
| |||||||||||||||||
| Pharmaceuticals 0.3% | ||||||||||||||||||
| e | Bausch Health Cos. Inc., 144A, | United States | 120,000 | 70,417 | ||||||||||||||
senior bond, 5.25%, 2/15/31 | United States | 215,000 | 126,435 | |||||||||||||||
senior note, 7.00%, 1/15/28 | United States | 70,000 | 47,939 | |||||||||||||||
senior note, 5.00%, 1/30/28 | United States | 410,000 | 262,400 | |||||||||||||||
senior note, 5.00%, 2/15/29 | United States | 20,000 | 11,987 | |||||||||||||||
senior note, 6.25%, 2/15/29 | United States | 20,000 | 12,465 | |||||||||||||||
| e | Organon & Co. / Organon Foreign Debt Co.-Issuer BV, senior bond, 144A, 5.125%, 4/30/31 | United States | 691,000 | 665,278 | ||||||||||||||
| d,e | Par Pharmaceutical Inc., senior secured note, 144A, 7.50%, 4/01/27 | United States | 1,673,000 | 1,312,050 | ||||||||||||||
| c | Teva Pharmaceutical Finance Co. LLC, senior bond, 6.15%, 2/01/36 | Israel | 10,000 | 9,250 | ||||||||||||||
Teva Pharmaceutical Finance Netherlands II BV, senior note, 6.00%, 1/31/25 | Israel | 335,000 | EUR | 370,309 | ||||||||||||||
Teva Pharmaceutical Finance Netherlands III BV, | Israel | 225,000 | 199,931 | |||||||||||||||
senior bond, 4.10%, 10/01/46 | Israel | 1,180,000 | 842,238 | |||||||||||||||
senior note, 2.80%, 7/21/23 | Israel | 170,000 | 169,515 | |||||||||||||||
|
| |||||||||||||||||
| 4,100,214 | ||||||||||||||||||
|
| |||||||||||||||||
| Professional Services 0.0%† | ||||||||||||||||||
| e | Corelogic Inc., senior secured note, 144A, 4.50%, 5/01/28 | United States | 452,000 | 389,240 | ||||||||||||||
|
| |||||||||||||||||
| Real Estate Management & Development 0.3% | ||||||||||||||||||
| e | Agile Group Holdings Ltd., Reg S, | China | 200,000 | 48,929 | ||||||||||||||
senior secured note, 4.85%, 8/31/22 | China | 330,000 | 263,175 | |||||||||||||||
senior secured note, 6.05%, 10/13/25 | China | 200,000 | 75,462 | |||||||||||||||
| e | Central China Real Estate Ltd., senior secured note, Reg S, 7.25%, 8/13/24 | China | 200,000 | 53,600 | ||||||||||||||
| e | CFLD Cayman Investment Ltd., senior note, Reg S, 8.60%, 4/08/24 | China | 200,000 | 27,530 | ||||||||||||||
| e | China Aoyuan Group Ltd., senior secured note, Reg S, 5.98%, 8/18/25 | China | 200,000 | 41,564 | ||||||||||||||
| e | China Evergrande Group, senior note, Reg S, 8.75%, 6/28/25 | China | 200,000 | 21,000 | ||||||||||||||
| e | China South City Holdings Ltd., Reg S, | China | 200,000 | 162,084 | ||||||||||||||
senior secured note, 7.25%, 11/20/22 | China | 200,000 | 166,000 | |||||||||||||||
| e | Country Garden Holdings Co. Ltd., senior secured note, Reg S, 2.70%, 7/12/26 | China | 400,000 | 231,000 | ||||||||||||||
| e | Easy Tactic Ltd., senior secured note, Reg S, 8.125%, 2/27/23 | China | 200,000 | 45,000 | ||||||||||||||
| e | Hunt Cos. Inc., senior secured note, 144A, 5.25%, 4/15/29 | United States | 431,000 | 407,181 | ||||||||||||||
| e | Kaisa Group Holdings Ltd., senior secured note, Reg S, | China | 692,000 | 122,830 | ||||||||||||||
11.25%, 4/16/25 | China | 994,000 | 170,968 | |||||||||||||||
11.65%, 6/01/26 | China | 200,000 | 33,500 | |||||||||||||||
| franklintempleton.com | Annual Report | 47 | ||||||||
FRANKLIN ALTERNATIVE STRATEGIES FUNDS
CONSOLIDATED SCHEDULE OF INVESTMENTS
Franklin K2 Alternative Strategies Fund (continued)
| Country | Principal Amount* | Value | ||||||||||||||||
| Corporate Bonds and Notes (continued) | ||||||||||||||||||
| Real Estate Management & Development (continued) | ||||||||||||||||||
| e | Logan Group Co. Ltd., senior note, Reg S, 5.25%, 10/19/25 | China | 200,000 | $ | 47,000 | |||||||||||||
| e | New Metro Global Ltd., senior note, Reg S, 4.625%, 10/15/25 | China | 200,000 | 109,000 | ||||||||||||||
| e | Perfect Point Ventures Ltd., senior note, Reg S, 5.20%, 9/20/25 | Hong Kong | 400,000 | 386,000 | ||||||||||||||
| e | Ronshine China Holdings Ltd., senior secured note, Reg S, 8.10%, 6/09/23 | China | 200,000 | 32,000 | ||||||||||||||
| e | Shimao Group Holdings Ltd., Reg S, | China | 200,000 | 27,000 | ||||||||||||||
senior secured note, 4.75%, 7/03/22 | China | 200,000 | 43,500 | |||||||||||||||
senior secured note, 6.125%, 2/21/24 | China | 200,000 | 29,700 | |||||||||||||||
| e,h | Sino-Ocean Land Treasure III Ltd., senior note, Reg S, 4.90% to 9/21/22, FRN thereafter, Perpetual | China | 330,000 | 219,310 | ||||||||||||||
| e | Sino-Ocean Land Treasure IV Ltd., senior bond, Reg S, 4.75%, 1/14/30 | China | 200,000 | 137,923 | ||||||||||||||
| e | Times China Holdings Ltd., senior secured note, Reg S, 5.55%, 6/04/24 | China | 200,000 | 76,528 | ||||||||||||||
Zhenro Properties Group Ltd., senior note, | China | 981,000 | 107,910 | |||||||||||||||
e Reg S, 6.63%, 1/07/26 | China | 403,000 | 40,584 | |||||||||||||||
|
| |||||||||||||||||
| 3,126,278 | ||||||||||||||||||
|
| |||||||||||||||||
| Road & Rail 0.2% | ||||||||||||||||||
| e | SF Holding Investment Ltd., senior bond, Reg S, 3.125%, 11/17/31 | China | 400,000 | 344,394 | ||||||||||||||
| e | Uber Technologies Inc., senior note, 144A, | United States | 10,000 | 10,353 | ||||||||||||||
7.50%, 9/15/27 | United States | 530,000 | 548,455 | |||||||||||||||
c 6.25%, 1/15/28 | United States | 200,000 | 199,585 | |||||||||||||||
4.50%, 8/15/29 | United States | 1,145,000 | 1,037,713 | |||||||||||||||
|
| |||||||||||||||||
| 2,140,500 | ||||||||||||||||||
|
| |||||||||||||||||
| Semiconductors & Semiconductor Equipment 0.1% | ||||||||||||||||||
Broadcom Inc., senior bond, 4.15%, 11/15/30 | United States | 135,000 | 128,260 | |||||||||||||||
Tsmc Arizona Corp., senior bond, 4.50%, 4/22/52 | Taiwan | 500,000 | 500,311 | |||||||||||||||
|
| |||||||||||||||||
| 628,571 | ||||||||||||||||||
|
| |||||||||||||||||
| Software 0.0%† | ||||||||||||||||||
Microsoft Corp., senior bond, 2.675%, 6/01/60 | United States | 61,000 | 46,842 | |||||||||||||||
Oracle Corp., senior bond, | United States | 270,000 | 195,660 | |||||||||||||||
3.95%, 3/25/51 | United States | 230,000 | 175,858 | |||||||||||||||
3.85%, 4/01/60 | United States | 85,000 | 61,169 | |||||||||||||||
|
| |||||||||||||||||
| 479,529 | ||||||||||||||||||
|
| |||||||||||||||||
| Specialty Retail 0.6% | ||||||||||||||||||
| e | Abercrombie & Fitch Management Co., senior secured note, 144A, 8.75%, 7/15/25 | United States | 265,000 | 271,992 | ||||||||||||||
| e | Carvana Co., senior note, 144A, | United States | 912,000 | 805,114 | ||||||||||||||
10.25%, 5/01/30 | United States | 2,396,000 | 2,142,575 | |||||||||||||||
| e | China Grand Automotive Services Ltd., E, senior note, Reg S, 9.125%, 1/30/24 | China | 333,000 | 203,130 | ||||||||||||||
| e | Douglas GMBH, senior secured note, Reg S, 6.00%, 4/08/26 | Germany | 2,393,000 | EUR | 2,191,013 | |||||||||||||
| e | Fertitta Entertainment LLC / Fertitta Entertainment Finance Co. Inc., 144A, | United States | 59,000 | 51,231 | ||||||||||||||
senior secured note, 4.625%, 1/15/29 | United States | 89,000 | 81,143 | |||||||||||||||
| d,e | Guitar Center Inc., senior secured note, 144A, 8.50%, 1/15/26 | United States | 534,000 | 488,358 | ||||||||||||||
| e | LS Finance 2017 Ltd., senior note, Reg S, | Hong Kong | 200,000 | 176,500 | ||||||||||||||
E, 4.875%, 7/15/24 | Hong Kong | 200,000 | 188,500 | |||||||||||||||
| 48 | Annual Report | franklintempleton.com | ||||||||
FRANKLIN ALTERNATIVE STRATEGIES FUNDS
CONSOLIDATED SCHEDULE OF INVESTMENTS
Franklin K2 Alternative Strategies Fund (continued)
| Country | Principal Amount* | Value | ||||||||||||||||
| Corporate Bonds and Notes (continued) | ||||||||||||||||||
| Specialty Retail (continued) | ||||||||||||||||||
| e | Staples Inc., 144A, | United States | 300,000 | $ | 246,536 | |||||||||||||
senior secured note, 7.50%, 4/15/26 | United States | 300,000 | 277,605 | |||||||||||||||
|
| |||||||||||||||||
| 7,123,697 | ||||||||||||||||||
|
| |||||||||||||||||
| Technology Hardware, Storage & Peripherals 0.0%† | ||||||||||||||||||
Apple Inc., senior bond, 2.55%, 8/20/60 | United States | 61,000 | 44,197 | |||||||||||||||
CDW LLC / CDW Finance Corp., senior note, | United States | 25,000 | 23,912 | |||||||||||||||
3.25%, 2/15/29 | United States | 145,000 | 128,158 | |||||||||||||||
Western Digital Corp., senior note, | United States | 120,000 | 120,136 | |||||||||||||||
2.85%, 2/01/29 | United States | 75,000 | 64,409 | |||||||||||||||
|
| |||||||||||||||||
| 380,812 | ||||||||||||||||||
|
| |||||||||||||||||
| Thrifts & Mortgage Finance 0.0%† | ||||||||||||||||||
| e | IIFL Finance Ltd., E, senior secured note, Reg S, 5.875%, 4/20/23 | India | 400,000 | 393,900 | ||||||||||||||
| e | Nationstar Mortgage Holdings Inc., senior bond, 144A, 5.75%, 11/15/31 | United States | 140,000 | 128,716 | ||||||||||||||
|
| |||||||||||||||||
| 522,616 | ||||||||||||||||||
|
| |||||||||||||||||
| Tobacco 0.1% | ||||||||||||||||||
| d,e | Vector Group Ltd., senior note, 144A, 10.50%, 11/01/26 | United States | 1,566,000 | 1,562,696 | ||||||||||||||
|
| |||||||||||||||||
| Trading Companies & Distributors 0.0%† | ||||||||||||||||||
Aircastle Ltd., | ||||||||||||||||||
e,h junior sub. note, 144A, 5.25% to 6/15/26, FRN thereafter, Perpetual | United States | 55,000 | 47,281 | |||||||||||||||
senior note, 4.25%, 6/15/26 | United States | 310,000 | 295,890 | |||||||||||||||
|
| |||||||||||||||||
| 343,171 | ||||||||||||||||||
|
| |||||||||||||||||
| Transportation Infrastructure 0.0%† | ||||||||||||||||||
| e | Adani Ports & Special Economic Zone Ltd., senior note, 144A, 4.20%, 8/04/27 | India | 200,000 | 189,408 | ||||||||||||||
|
| |||||||||||||||||
| Wireless Telecommunication Services 0.1% | ||||||||||||||||||
| e | Bharti Airtel Ltd., senior bond, Reg S, 4.375%, 6/10/25 | India | 700,000 | 705,084 | ||||||||||||||
| e | Softbank Group Corp., Reg S, | Japan | 200,000 | 170,500 | ||||||||||||||
h sub. note, 6.00% to 7/19/23, FRN thereafter, Perpetual | Japan | 200,000 | 188,500 | |||||||||||||||
|
| |||||||||||||||||
| 1,064,084 | ||||||||||||||||||
|
| |||||||||||||||||
Total Corporate Bonds and Notes | 151,163,679 | |||||||||||||||||
|
| |||||||||||||||||
| Corporate Bonds and Notes in Reorganization 0.4% | ||||||||||||||||||
| Airlines 0.1% | ||||||||||||||||||
| e,k | LATAM Finance Ltd., senior note, 144A, | Chile | 200,000 | 188,486 | ||||||||||||||
7.00%, 3/01/26 | Chile | 1,400,000 | 1,324,729 | |||||||||||||||
|
| |||||||||||||||||
| 1,513,215 | ||||||||||||||||||
|
| |||||||||||||||||
| Electric Utilities 0.2% | ||||||||||||||||||
| k | Talen Energy Supply LLC, | United States | 1,520,000 | 1,478,078 | ||||||||||||||
senior note, 6.625%, 1/15/28 | United States | 596,000 | 567,520 | |||||||||||||||
e senior secured note, 144A, 7.625%, 6/01/28 | United States | 436,000 | 423,886 | |||||||||||||||
|
| |||||||||||||||||
| 2,469,484 | ||||||||||||||||||
|
| |||||||||||||||||
| franklintempleton.com | Annual Report | 49 | ||||||||
FRANKLIN ALTERNATIVE STRATEGIES FUNDS
CONSOLIDATED SCHEDULE OF INVESTMENTS
Franklin K2 Alternative Strategies Fund (continued)
| Country | Principal Amount* | Value | ||||||||||||||||
| Corporate Bonds and Notes in Reorganization (continued) | ||||||||||||||||||
| Metals & Mining 0.1% | ||||||||||||||||||
| e,k | Samarco Mineracao SA, senior bond, Reg S, | Brazil | 925,000 | $ | 584,078 | |||||||||||||
5.75%, 10/24/23 | Brazil | 184,000 | 131,376 | |||||||||||||||
|
| |||||||||||||||||
| 715,454 | ||||||||||||||||||
|
| |||||||||||||||||
| Real Estate Management & Development 0.0%† | ||||||||||||||||||
| e,k | Kaisa Group Holdings Ltd., senior secured note, Reg S, | China | 200,000 | 34,400 | ||||||||||||||
9.375%, 6/30/24 | China | 205,000 | 34,338 | |||||||||||||||
11.70%, 11/11/25 | China | 200,000 | 33,500 | |||||||||||||||
| e,k | Sunac China Holdings Ltd., Reg S, | China | 300,000 | 50,250 | ||||||||||||||
senior secured note, 8.35%, 4/19/23 | China | 200,000 | 35,500 | |||||||||||||||
senior secured note, 6.65%, 8/03/24 | China | 200,000 | 33,540 | |||||||||||||||
senior secured note, 6.50%, 1/26/26 | China | 400,000 | 69,000 | |||||||||||||||
| e,k | Yuzhou Group Holdings Co. Ltd., senior secured note, Reg S, | China | 200,000 | 24,000 | ||||||||||||||
7.70%, 2/20/25 | China | 200,000 | 22,500 | |||||||||||||||
7.85%, 8/12/26 | China | 205,000 | 24,087 | |||||||||||||||
6.35%, 1/13/27 | China | 400,000 | 44,000 | |||||||||||||||
|
| |||||||||||||||||
| 405,115 | ||||||||||||||||||
|
| |||||||||||||||||
| Road & Rail 0.0%† | ||||||||||||||||||
d,f | Hertz Corp. Escrow, senior note, zero cpn., 1/15/28 | United States | 1,584,000 | — | ||||||||||||||
|
| |||||||||||||||||
Total Corporate Bonds and Notes in Reorganization | 5,103,268 | |||||||||||||||||
|
| |||||||||||||||||
| l,o | Senior Floating Rate Interests 0.3% | |||||||||||||||||
| Communications Equipment 0.0%† | ||||||||||||||||||
| j | Riverbed Technology Inc., Exit Term Loan, PIK, 7.00% (cash), (1-Month USD LIBOR + 6.00%), 12/08/26 | United States | 135,574 | 97,303 | ||||||||||||||
|
| |||||||||||||||||
| Construction Materials 0.1% | ||||||||||||||||||
Oldcastle BuildingEnvelope Inc., Term Loan B, 6.109%, (1-Month SOFR + 4.50%), 4/30/29 | United States | 1,500,000 | 1,377,195 | |||||||||||||||
|
| |||||||||||||||||
| Consumer Discretionary Services 0.1% | ||||||||||||||||||
Travel Leaders Group LLC, Term Loan B, 5.06%, (1-Month USD LIBOR + 4.00%), 1/25/24 | United States | 479,691 | 434,121 | |||||||||||||||
|
| |||||||||||||||||
| Diversified Financial Services 0.0%† | ||||||||||||||||||
Ziggo BV, Term Loan H, 3.00%, (3-Month EURIBOR + 3.00%), 1/31/29 | United States | 115,000 | 115,552 | |||||||||||||||
|
| |||||||||||||||||
| Entertainment 0.0%† | ||||||||||||||||||
Playtika Holding Corp., Term Loan B, 3.81%, (1-Month USD LIBOR + 2.75%), 3/13/28 | United States | 151,966 | 146,110 | |||||||||||||||
|
| |||||||||||||||||
| Equity Real Estate Investment Trusts (REITs) 0.1% | ||||||||||||||||||
The GEO Group Inc., Term Loan B, 3.06%, (3-Month USD LIBOR + 2.00%), 3/22/24 | United States | 266,515 | 252,961 | |||||||||||||||
McCarthy & Stone PLC, Term Loan B, 7.00%, (1-Month USD LIBOR + 7.00%), 12/16/25 | United Kingdom | 170,938 | GBP | 207,322 | ||||||||||||||
|
| |||||||||||||||||
| 460,283 | ||||||||||||||||||
|
| |||||||||||||||||
| Food & Staples Retailing 0.0%† | ||||||||||||||||||
| m | Upfield Group BV, Term Loan RC, 3.445%, (3-Month EURIBOR + 3.00%), 1/02/25 | Netherlands | 325,991 | 290,431 | ||||||||||||||
|
| |||||||||||||||||
| 50 | Annual Report | franklintempleton.com | ||||||||
FRANKLIN ALTERNATIVE STRATEGIES FUNDS
CONSOLIDATED SCHEDULE OF INVESTMENTS
Franklin K2 Alternative Strategies Fund (continued)
| Country | Principal Amount* | Value | ||||||||||||||||
| l,o | Senior Floating Rate Interests (continued) | |||||||||||||||||
| Machinery 0.0%† | ||||||||||||||||||
SPX Flow Inc., Term Loan B, 5.634%, (1-Month SOFR + 4.60%), 4/05/29 | United States | 431,239 | $ | 407,253 | ||||||||||||||
|
| |||||||||||||||||
| Media 0.0%† | ||||||||||||||||||
Advantage Sales & Marketing Inc., Term Loan B1, 5.264%, (3-Month USD LIBOR + 4.50%), 10/28/27 | United States | 440,712 | 412,011 | |||||||||||||||
|
| |||||||||||||||||
| Pharmaceuticals 0.0%† | ||||||||||||||||||
Bausch Health Cos. Inc., Term Loan B, 5.75%, (1-Month SOFR + 5.25%), 1/27/27 | United States | 287,660 | 264,152 | |||||||||||||||
|
| |||||||||||||||||
Total Senior Floating Rate Interests | 4,004,411 | |||||||||||||||||
|
| |||||||||||||||||
| Foreign Government and Agency Securities 5.7% | ||||||||||||||||||
| e | CBB International Sukuk Programme Co. Wll, senior note, 144A, 3.875%, 5/18/29 | Bahrain | 2,303,000 | 2,130,828 | ||||||||||||||
| e | Export-Import Bank of India, senior bond, Reg S, | India | 500,000 | 502,565 | ||||||||||||||
2.25%, 1/13/31 | India | 500,000 | 410,380 | |||||||||||||||
| e | Government of Angola, senior bond, | Angola | 349,000 | 330,648 | ||||||||||||||
Reg S, 8.00%, 11/26/29 | Angola | 3,319,000 | 3,105,090 | |||||||||||||||
Reg S, 8.25%, 5/09/28 | Angola | 1,015,000 | 979,780 | |||||||||||||||
Reg S, 9.375%, 5/08/48 | Angola | 1,624,000 | 1,458,402 | |||||||||||||||
Government of Argentina, senior bond, | Argentina | 6,961,545 | 2,448,306 | |||||||||||||||
1.125%, 7/09/35 | Argentina | 7,039,418 | 1,919,720 | |||||||||||||||
2.50%, 7/09/41 | Argentina | 2,368,360 | 769,634 | |||||||||||||||
| e | Government of Bahrain, senior bond, Reg S, | Bahrain | 467,000 | 495,559 | ||||||||||||||
6.75%, 9/20/29 | Bahrain | 968,000 | 981,860 | |||||||||||||||
Government of Brazil, senior bond, | Brazil | 2,657,000 | BRL | 529,013 | ||||||||||||||
6.00%, 8/15/30 | Brazil | 2,960,000 | BRL | 2,572,702 | ||||||||||||||
Government of Colombia, senior bond, 2.25%, 4/18/29 | Colombia | 8,374,467,892 | COP | 1,957,770 | ||||||||||||||
| e | Government of Dominican Republic, Reg S, | Dominican Republic | 434,000 | 339,638 | ||||||||||||||
senior note, 5.50%, 2/22/29 | Dominican Republic | 1,095,000 | 1,038,818 | |||||||||||||||
| e | Government of Ecuador, Reg S, | Ecuador | 4,688,040 | 3,006,481 | ||||||||||||||
senior note, 5.00%, 7/31/30 | Ecuador | 1,900,000 | 1,581,632 | |||||||||||||||
| e | Government of Egypt, senior bond, | Egypt | 487,000 | 368,898 | ||||||||||||||
Reg S, 7.50%, 2/16/61 | Egypt | 2,043,000 | 1,384,766 | |||||||||||||||
Reg S, 7.60%, 3/01/29 | Egypt | 789,000 | 685,767 | |||||||||||||||
| e | Government of El Salvador, senior bond, Reg S, | El Salvador | 1,000,000 | 736,398 | ||||||||||||||
8.25%, 4/10/32 | El Salvador | 1,031,000 | 432,938 | |||||||||||||||
| e | Government of Germany, senior bond, Reg S, | Germany | 100,111 | EUR | 105,148 | |||||||||||||
zero cpn., 2/15/32 | Germany | 503,000 | EUR | 484,440 | ||||||||||||||
| e | Government of Ghana, | Ghana | 1,048,000 | 958,249 | ||||||||||||||
senior bond, Reg S, 8.875%, 5/07/42 | Ghana | 363,000 | 187,793 | |||||||||||||||
senior note, 144A, zero cpn., 4/07/25 | Ghana | 278,000 | 157,088 | |||||||||||||||
senior note, 144A, 7.75%, 4/07/29 | Ghana | 372,000 | 203,651 | |||||||||||||||
senior note, Reg S, 7.75%, 4/07/29 | Ghana | 400,000 | 218,980 | |||||||||||||||
| e | Government of Iraq, senior bond, Reg S, 5.80%, 1/15/28 | Iraq | 1,736,250 | 1,652,841 | ||||||||||||||
| d | Government of Italy, senior note, 2.375%, 10/17/24 | Italy | 350,000 | 341,960 | ||||||||||||||
| franklintempleton.com | Annual Report | 51 | ||||||||
FRANKLIN ALTERNATIVE STRATEGIES FUNDS
CONSOLIDATED SCHEDULE OF INVESTMENTS
Franklin K2 Alternative Strategies Fund (continued)
| Country | Principal Amount* | Value | ||||||||||||||||
| Foreign Government and Agency Securities (continued) | ||||||||||||||||||
| e | Government of Jordan, 144A, | Jordan | 386,000 | $ | 343,540 | |||||||||||||
senior note, 4.95%, 7/07/25 | Jordan | 578,000 | 552,123 | |||||||||||||||
Government of Mexico, | Mexico | 44,471,700 | n | MXN | 2,223,739 | |||||||||||||
senior bond, M, 7.75%, 5/29/31 | Mexico | 12,230,000 | n | MXN | 590,915 | |||||||||||||
senior bond, S, 2.75%, 11/27/31 | Mexico | 33,050,337 | n | MXN | 1,527,343 | |||||||||||||
senior note, M, 6.75%, 3/09/23 | Mexico | 4,577,900 | n | MXN | 229,085 | |||||||||||||
| e | Government of Nigeria, | Nigeria | 368,000 | 291,857 | ||||||||||||||
senior bond, Reg S, 7.696%, 2/23/38 | Nigeria | 1,144,000 | 863,285 | |||||||||||||||
senior bond, Reg S, 7.625%, 11/28/47 | Nigeria | 1,418,000 | 1,026,278 | |||||||||||||||
senior note, Reg S, 6.125%, 9/28/28 | Nigeria | 4,949,000 | 4,053,973 | |||||||||||||||
senior note, Reg S, 8.375%, 3/24/29 | Nigeria | 1,060,000 | 949,230 | |||||||||||||||
senior note, 144A, 8.375%, 3/24/29 | Nigeria | 442,000 | 395,811 | |||||||||||||||
| e | Government of Oman, | Oman | 2,995,000 | 3,022,434 | ||||||||||||||
senior bond, Reg S, 6.25%, 1/25/31 | Oman | 830,000 | 855,942 | |||||||||||||||
senior bond, Reg S, 6.75%, 1/17/48 | Oman | 1,894,000 | 1,775,625 | |||||||||||||||
senior bond, Reg S, 7.00%, 1/25/51 | Oman | 286,000 | 274,211 | |||||||||||||||
senior note, 144A, 4.875%, 6/15/30 | Oman | 221,000 | 220,192 | |||||||||||||||
| e | Government of Saudi Arabia, senior bond, | Saudi Arabia | 910,000 | 850,906 | ||||||||||||||
144A, 3.75%, 1/21/55 | Saudi Arabia | 354,000 | 310,173 | |||||||||||||||
Reg S, 2.75%, 2/03/32 | Saudi Arabia | 302,000 | 282,389 | |||||||||||||||
Government of South Africa, senior bond, | South Africa | 28,136,320 | ZAR | 1,948,387 | ||||||||||||||
8.25%, 3/31/32 | South Africa | 10,706,466 | ZAR | 599,973 | ||||||||||||||
8.50%, 1/31/37 | South Africa | 33,491,055 | ZAR | 1,769,955 | ||||||||||||||
8.75%, 2/28/48 | South Africa | 20,004,119 | ZAR | 1,034,939 | ||||||||||||||
| e | Government of Sri Lanka, Reg S, | Sri Lanka | 366,000 | 143,651 | ||||||||||||||
senior note, 6.85%, 11/03/25 | Sri Lanka | 1,695,000 | 683,356 | |||||||||||||||
| e | Government of Tunisian Republic, Reg S, | Tunisia | 446,000 | 268,280 | ||||||||||||||
senior note, 6.75%, 10/31/23 | Tunisia | 469,000 | EUR | 358,262 | ||||||||||||||
senior note, 5.625%, 2/17/24 | Tunisia | 946,000 | EUR | 634,800 | ||||||||||||||
Government of Turkey, senior bond, 5.75%, 5/11/47 | Turkey | 3,381,000 | 2,330,422 | |||||||||||||||
| e | Government of Ukraine, | Ukraine | 1,400,000 | 551,404 | ||||||||||||||
senior bond, Reg S, 7.375%, 9/25/32 | Ukraine | 1,805,000 | 657,146 | |||||||||||||||
senior bond, Reg S, 7.253%, 3/15/33 | Ukraine | 722,000 | 263,101 | |||||||||||||||
senior bond, Reg S, 1.258%, 5/31/40 | Ukraine | 4,008,000 | 1,514,843 | |||||||||||||||
senior note, Reg S, 7.75%, 9/01/25 | Ukraine | 410,000 | 158,063 | |||||||||||||||
senior note, 144A, 6.876%, 5/21/29 | Ukraine | 302,000 | 110,236 | |||||||||||||||
senior note, Reg S, 6.876%, 5/21/29 | Ukraine | 580,000 | 211,712 | |||||||||||||||
| e | Government of Zambia, senior bond, Reg S, | Zambia | 1,563,000 | 1,101,790 | ||||||||||||||
8.97%, 7/30/27 | Zambia | 1,582,000 | 1,103,072 | |||||||||||||||
| e | Provincia de Buenos Aires, 144A, | Argentina | 3,670,000 | ARS | 16,429 | |||||||||||||
senior bond, Reg S, 3.90%, 9/01/37 | Argentina | 2,510,000 | ARS | 963,213 | ||||||||||||||
senior bond, 144A, 3.90%, 9/01/37 | Argentina | 1,160,000 | ARS | 445,150 | ||||||||||||||
|
| |||||||||||||||||
Total Foreign Government and Agency Securities | 71,984,978 | |||||||||||||||||
|
| |||||||||||||||||
| 52 | Annual Report | franklintempleton.com | ||||||||
FRANKLIN ALTERNATIVE STRATEGIES FUNDS
CONSOLIDATED SCHEDULE OF INVESTMENTS
Franklin K2 Alternative Strategies Fund (continued)
| Country | Principal Amount* | Value | ||||||||||||||||
| U.S. Government and Agency Securities 0.4% | ||||||||||||||||||
U.S. Treasury Bond, 2.25%, 2/15/52 | United States | 196,200 | $ | 164,164 | ||||||||||||||
U.S. Treasury Note, | United States | 865,000 | 853,509 | |||||||||||||||
0.50%, 3/15/23 | United States | 900,000 | 889,980 | |||||||||||||||
0.125%, 3/31/23 | United States | 1,235,000 | 1,216,139 | |||||||||||||||
2.625%, 4/15/25 | United States | 332,000 | 331,144 | |||||||||||||||
2.75%, 4/30/27 | United States | 145,000 | 144,485 | |||||||||||||||
1.875%, 2/15/32 | United States | 358,000 | 328,185 | |||||||||||||||
2.875%, 5/15/32 | United States | 920,000 | 921,294 | |||||||||||||||
|
| |||||||||||||||||
Total U.S. Government and Agency Securities | 4,848,900 | |||||||||||||||||
|
| |||||||||||||||||
| Asset-Backed Securities and Commercial Mortgage- Backed Securities 7.0% | ||||||||||||||||||
| Diversified Financial Services 4.9% | ||||||||||||||||||
| e | AASET Trust, 144A, | United States | 235,341 | 199,586 | ||||||||||||||
2021-1A, B, 3.80%, 11/16/41 | United States | 1,219,989 | 892,526 | |||||||||||||||
| e | Accelerated Assets LLC, 2018-1, B, 144A, 4.51%, 12/02/33 | United States | 39,084 | 38,328 | ||||||||||||||
| o | ACE Securities Corp. Home Equity Loan Trust, 2003-FM1, M1, FRN, 2.296%, (1-Month USD LIBOR + 1.29%), 11/25/32 | United States | 1,065,565 | 1,082,654 | ||||||||||||||
| e | Adams Outdoor Advertising LP, 2018-1, A, 144A, 4.81%, 11/15/48 | United States | 170,614 | 169,985 | ||||||||||||||
| e,o | AGL CLO 3 Ltd., 2020-3A, C, 144A, FRN, 3.194%, (3-Month USD LIBOR + 2.15%), 1/15/33 | United States | 285,000 | 273,821 | ||||||||||||||
| e | AIM Aviation Finance Ltd., 2015-1A, B1, 144A, 7.072%, 2/15/40 | United States | 170,624 | 52,386 | ||||||||||||||
| e,o | Allegro CLO VI Ltd., 2018-2A, D, 144A, FRN, 3.794%, (3-Month USD LIBOR + 2.75%), 1/17/31 | United States | 250,000 | 232,859 | ||||||||||||||
| e | American Credit Acceptance Receivables Trust, 144A, | United States | 200,000 | 197,080 | ||||||||||||||
2020-4, D, 1.77%, 12/14/26 | United States | 185,000 | 178,670 | |||||||||||||||
| e,o | Arbor Realty Commercial Real Estate Notes Ltd., 144A, FRN, | United States | 1,000,000 | 983,306 | ||||||||||||||
2022-FL1, D, 3.399%, (SOFR + 3.00%), 1/15/37 | United States | 1,000,000 | 949,325 | |||||||||||||||
| o | Argent Securities Inc., 2004-W3, M4, FRN, 3.638%, (1-Month USD LIBOR + 4.58%), 2/25/34 | United States | 145,829 | 163,807 | ||||||||||||||
| e | Avis Budget Rental Car Funding AESOP LLC, 144A, | United States | 100,000 | 94,894 | ||||||||||||||
2020-2A, C, 4.25%, 2/20/27 | United States | 100,000 | 97,233 | |||||||||||||||
| e,o | Barings CLO Ltd., 2019-4A, C, 144A, FRN, 3.844%, (3-Month USD LIBOR + 2.80%), 1/15/33 | United States | 400,000 | 386,802 | ||||||||||||||
| e,o | Battalion CLO VIII Ltd., 2020-8A, D1R2, 144A, FRN, 7.794%, (3-Month USD LIBOR + 6.75%), 7/18/30 | United States | 1,500,000 | 1,405,488 | ||||||||||||||
| p | Bear Stearns ALT-A Trust, 2006-3, 21A1, FRN, 2.801%, 5/25/36 | United States | 1,065,296 | 871,675 | ||||||||||||||
| e,p | Binom Securitization Trust, 2022-RPL1, M1, 144A, FRN, 3.00%, 2/25/61 | United States | 160,000 | 149,221 | ||||||||||||||
| e | Black Diamond CLO Designated Activity Co., 2015-1, ER, Reg S, 5.13%, 10/03/29 | Ireland | 1,330,000 | EUR | 1,386,626 | |||||||||||||
| e | Blackbird Capital Aircraft Lease Securitization Ltd., 2016-1A, A, 144A, 4.213%, 12/16/41 | United States | 171,696 | 153,994 | ||||||||||||||
| e,o | BSPRT Issuer Ltd., 2019-FL5, E, 144A, FRN, 3.725%, (1-Month USD LIBOR + 2.85%), 5/15/29 | United States | 1,000,000 | 992,709 | ||||||||||||||
| e,o | BX Commercial Mortgage Trust, 2019-XL, E, 144A, FRN, 2.675%, (1-Month USD LIBOR + 1.80%), 10/15/36 | United States | 340,000 | 331,169 | ||||||||||||||
California Republic Auto Receivables Trust, 2018-1, D, 4.33%, 4/15/25 | United States | 115,000 | 115,427 | |||||||||||||||
| e,o | Carlyle US CLO Ltd., 2017-4A, C, 144A, FRN, 3.844%, (3-Month USD LIBOR + 2.80%), 1/15/30 | United States | 250,000 | 229,082 | ||||||||||||||
Carvana Auto Receivables Trust, 2021-N4, D, 2.30%, 9/11/28 | United States | 100,000 | 94,173 | |||||||||||||||
| franklintempleton.com | Annual Report | 53 | ||||||||
FRANKLIN ALTERNATIVE STRATEGIES FUNDS
CONSOLIDATED SCHEDULE OF INVESTMENTS
Franklin K2 Alternative Strategies Fund (continued)
| Country | Principal Amount* | Value | ||||||||||||||||
| Asset-Backed Securities and Commercial Mortgage-Backed Securities (continued) | ||||||||||||||||||
| Diversified Financial Services (continued) | ||||||||||||||||||
| e | Castlelake Aircraft Structured Trust, 2021-1A, A, 144A, 3.474%, 1/15/46 | United States | 329,516 | $ | 296,649 | |||||||||||||
| e,o | Catamaran CLO Ltd., 144A, FRN, | United States | 2,030,000 | 2,038,223 | ||||||||||||||
2014-2A, D, 5.894%, (3-Month USD LIBOR + 4.85%), 10/18/26 | United States | 1,001,187 | 959,598 | |||||||||||||||
| e,o | CHCP Ltd., 2021-FL1, C, 144A, FRN, 2.996%, (SOFR + 2.21%), 2/15/38 | United States | 1,000,000 | 967,954 | ||||||||||||||
CHL Mortgage Pass-Through Trust, | United States | 714,851 | 423,301 | |||||||||||||||
2006-21, A8, 5.75%, 2/25/37 | United States | 304,221 | 176,273 | |||||||||||||||
p 2006-HYB1, 2A2C, FRN, 2.671%, 3/20/36 | United States | 1,145,605 | 1,076,758 | |||||||||||||||
p 2006-HYB4, 3B, FRN, 3.511%, 6/20/36 | United States | 1,585,718 | 1,268,213 | |||||||||||||||
| e,o | CIFC Funding Ltd., 2021-7A, D, 144A, FRN, 4.184%, (3-Month USD LIBOR + 3.00%), 1/23/35 | United States | 315,000 | 290,373 | ||||||||||||||
| e | CLI Funding VIII LLC, 2021-1A, A, 144A, 1.64%, 2/18/46 | United States | 350,086 | 314,228 | ||||||||||||||
| e,o | Connecticut Avenue Securities Trust, 144A, FRN, | United States | 1,910,000 | 1,911,242 | ||||||||||||||
2020-R01, 1M2, 3.056%, (1-Month USD LIBOR + 2.05%), 1/25/40 | United States | 30,954 | 30,712 | |||||||||||||||
2021-R01, 1B1, 3.685%, (SOFR + 3.10%), 10/25/41 | United States | 100,000 | 87,422 | |||||||||||||||
| e | CoreVest American Finance Trust, 144A, | United States | 100,000 | 92,719 | ||||||||||||||
2020-4, C, 2.25%, 12/15/52 | United States | 100,000 | 84,611 | |||||||||||||||
| e | CSMC Trust, 144A, | United States | 127,982 | 126,630 | ||||||||||||||
p 2020-RPL3, A1, FRN, 2.691%, 3/25/60 | United States | 98,222 | 96,100 | |||||||||||||||
2021-RPL1, A2, 3.937%, 9/27/60 | United States | 155,000 | 147,856 | |||||||||||||||
| e,o | Cutwater Ltd., 2017-1A, CR, 144A, FRN, 4.644%, (3-Month USD LIBOR + 3.60%), 7/15/26 | United States | 1,000,000 | 992,548 | ||||||||||||||
| e | DB Master Finance LLC, 144A, | United States | 145,875 | 144,176 | ||||||||||||||
2021-1A, A2II, 2.493%, 11/20/51 | United States | 54,725 | 47,874 | |||||||||||||||
| e,p | DBUBS Mortgage Trust, 2017-BRBK, D, 144A, FRN, 3.53%, 10/10/34 | United States | 100,000 | 95,202 | ||||||||||||||
| e | Domino’s Pizza Master Issuer LLC, 144A, | United States | 162,775 | 159,157 | ||||||||||||||
2018-1A, A2II, 4.328%, 7/25/48 | United States | 173,700 | 172,309 | |||||||||||||||
2019-1A, A2, 3.668%, 10/25/49 | United States | 166,175 | 154,124 | |||||||||||||||
2021-1A, A2I, 2.662%, 4/25/51 | United States | 222,750 | 199,383 | |||||||||||||||
Drive Auto Receivables Trust, 2018-3, D, 4.30%, 9/16/24 | United States | 5,406 | 5,429 | |||||||||||||||
| e | DT Auto Owner Trust, 144A, | United States | 80,000 | 76,976 | ||||||||||||||
2021-4A, D, 1.99%, 9/15/27 | United States | 105,000 | 96,842 | |||||||||||||||
2022-2A, D, 5.46%, 3/15/28 | United States | 170,000 | 169,463 | |||||||||||||||
| e | Education Funding Trust Trust, 2020-A, A, 144A, 2.79%, 7/25/41 | United States | 84,833 | 81,521 | ||||||||||||||
Exeter Automobile Receivables Trust, | United States | 90,000 | 91,079 | |||||||||||||||
2020-3A, C, 1.32%, 7/15/25 | United States | 145,000 | 143,926 | |||||||||||||||
| p | Fannie Mae Grantor Trust, 2004-T5, AB7, FRN, 1.168%, 5/28/35 | United States | 287,002 | 266,440 | ||||||||||||||
| e | First Investors Auto Owner Trust, 2019-2A, D, 144A, 2.80%, 12/15/25 | United States | 40,000 | 39,570 | ||||||||||||||
| e | FirstKey Homes Trust, 144A, | United States | 225,000 | 211,071 | ||||||||||||||
2020-SFR2, F1, 3.017%, 10/19/37 | United States | 320,000 | 294,922 | |||||||||||||||
| e | Flagship Credit Auto Trust, 144A, | United States | 90,000 | 88,586 | ||||||||||||||
2022-1, D, 3.64%, 3/15/28 | United States | 225,000 | 214,267 | |||||||||||||||
| 54 | Annual Report | franklintempleton.com | ||||||||
FRANKLIN ALTERNATIVE STRATEGIES FUNDS
CONSOLIDATED SCHEDULE OF INVESTMENTS
Franklin K2 Alternative Strategies Fund (continued)
| Country | Principal Amount* | Value | ||||||||||||||||
| Asset-Backed Securities and Commercial Mortgage-Backed Securities (continued) | ||||||||||||||||||
| Diversified Financial Services (continued) | ||||||||||||||||||
| e,o | Galaxy XXVI CLO Ltd., 2018-26A, E, 144A, FRN, 7.355%, (3-Month USD LIBOR + 5.85%), 11/22/31 | United States | 260,000 | $ | 227,374 | |||||||||||||
| e,o | Gilbert Park CLO Ltd., 2017-1A, D, 144A, FRN, 3.994%, (3-Month USD LIBOR + 2.95%), 10/15/30 | United States | 250,000 | 237,061 | ||||||||||||||
| e | GLS Auto Receivables Trust, 144A, | United States | 150,000 | 148,680 | ||||||||||||||
2020-3A, C, 1.92%, 5/15/25 | United States | 330,000 | 327,045 | |||||||||||||||
| e,o | Grand Avenue CRE, 2019-FL1, D, 144A, FRN, 3.654%, (1-Month USD LIBOR + 2.80%), 6/15/37 | United States | 1,250,000 | 1,250,681 | ||||||||||||||
| e,o | Greystone CRE Notes Ltd., 2021-HC2, A, 144A, FRN, 2.675%, (1-Month USD LIBOR + 1.80%), 12/15/39 | United States | 105,000 | 101,852 | ||||||||||||||
| e,o | GSRPM Mortgage Loan Trust, 2002-1A, M1, 144A, FRN, 2.956%, (1-Month USD LIBOR + 1.95%), 11/25/31 | United States | 770,794 | 751,003 | ||||||||||||||
| e | HPEFS Equipment Trust, 2020-2A, D, 144A, 2.79%, 7/22/30 | United States | 325,000 | 322,946 | ||||||||||||||
| e | Kestrel Aircraft Funding Ltd., 2018-1A, A, 144A, 4.25%, 12/15/38 | United States | 199,675 | 178,372 | ||||||||||||||
| e | Legacy Mortgage Asset Trust, 144A, | United States | 1,600,000 | 1,584,863 | ||||||||||||||
2020-GS1, A1, 2.882%, 10/25/59 | United States | 198,905 | 197,919 | |||||||||||||||
| e,o | Loancore Issuer Ltd., 2021-KF112, D, 144A, FRN, 3.825%, (1-Month USD LIBOR + 2.95%), 5/15/28 | United States | 1,600,000 | 1,599,832 | ||||||||||||||
| e,o | Madison Park Funding XXXI Ltd., 2018-31A, D, 144A, FRN, 4.184%, (3-Month USD LIBOR + 3.00%), 1/23/31 | United States | 335,000 | 315,735 | ||||||||||||||
| e,o | Marathon CLO V Ltd., 2017-5A, CR, 144A, FRN, 4.255%, (3-Month USD LIBOR + 2.75%), 11/21/27 | United States | 2,200,000 | 2,162,288 | ||||||||||||||
| e,o | Marathon CLO VI Ltd., 2018-6A, CR2, 144A, FRN, 4.922%, (3-Month USD LIBOR + 3.50%), 5/13/28 | United States | 1,000,000 | 963,095 | ||||||||||||||
| e | Marlette Funding Trust, 144A, | United States | 65,401 | 65,423 | ||||||||||||||
2022-1A, D, 3.39%, 4/15/32 | United States | 320,000 | 292,257 | |||||||||||||||
| o | Merrill Lynch Mortgage Investors Trust Series, 2007-MLN1, A2D, FRN, 1.326%, (1-Month USD LIBOR + 0.32%), 3/25/37 | United States | 782,646 | 710,215 | ||||||||||||||
| e,o | MF1 Ltd., 2022-FL8, D, 144A, FRN, 3.132%, (SOFR + 2.65%), 2/19/37 | United States | 500,000 | 467,139 | ||||||||||||||
| e,p | Mill City Mortgage Loan Trust, 2021-NMR1, M3, 144A, FRN, 2.50%, 11/25/60 | United States | 100,000 | 85,167 | ||||||||||||||
| o | MortgageIT Mortgage Loan Trust, 2006-1, 2A1B, FRN, 1.566%, (1-Month USD LIBOR + 0.56%), 4/25/36 | United States | 583,930 | 234,927 | ||||||||||||||
| e,o | Mountain View CLO Ltd., 2018-1A, DRR, 144A, FRN, 4.694%, (3-Month USD LIBOR + 3.65%), 10/15/26 | United States | 2,000,000 | 2,000,590 | ||||||||||||||
| e | MVW LLC, 2020-1A, C, 144A, 4.21%, 10/20/37 | United States | 149,438 | 146,134 | ||||||||||||||
| e | MVW Owner Trust, 2019-1A, C, 144A, 3.33%, 11/20/36 | United States | 44,335 | 42,797 | ||||||||||||||
| e | Navient Private Education Refi Loan Trust, 144A, | United States | 210,000 | 198,397 | ||||||||||||||
2019-GA, B, 3.08%, 10/15/68 | United States | 140,000 | 132,024 | |||||||||||||||
| e,o | Neuberger Berman CLO XIV Ltd., 2020-14A, CR2, 144A, FRN, 3.138%, (3-Month USD LIBOR + 1.90%), 1/28/30 | United States | 410,000 | 400,921 | ||||||||||||||
| e,o | Neuberger Berman Loan Advisers CLO Ltd., 2018-27A, E, 144A, FRN, 6.244%, (3-Month USD LIBOR + 5.20%), 1/15/30 | United States | 350,000 | 298,374 | ||||||||||||||
| o | Nomura Asset Acceptance Corp. Alternative Loan Trust Series, 2004-AR4, M2, FRN, 2.506%, (1-Month USD LIBOR + 1.50%), 12/25/34 | United States | 750,674 | 701,565 | ||||||||||||||
| o | Nomura Home Equity Loan Inc. Home Equity Loan Trust Series, 2006-WF1, M4, FRN, 1.561%, (1-Month USD LIBOR + 0.56%), 3/25/36 | United States | 1,336,045 | 1,240,060 | ||||||||||||||
| e,o | OCP CLO Ltd., 2021-21A, D, 144A, FRN, 4.013%, (3-Month USD LIBOR + 2.95%), 7/20/34 | United States | 330,000 | 298,881 | ||||||||||||||
| franklintempleton.com | Annual Report | 55 | ||||||||
FRANKLIN ALTERNATIVE STRATEGIES FUNDS
CONSOLIDATED SCHEDULE OF INVESTMENTS
Franklin K2 Alternative Strategies Fund (continued)
| Country | Principal Amount* | Value | ||||||||||||||||
| Asset-Backed Securities and Commercial Mortgage-Backed Securities (continued) | ||||||||||||||||||
| Diversified Financial Services (continued) | ||||||||||||||||||
| e,o | Octagon Investment Partners XXII Ltd., 2018-1A, CRR, 144A, FRN, 3.036%, (3-Month USD LIBOR + 1.90%), 1/22/30 | United States | 250,000 | $ | 239,685 | |||||||||||||
| e,o | OHA Credit Funding 2 Ltd., 2021-2A, DR, 144A, FRN, 4.398%, (3-Month USD LIBOR + 3.30%), 4/21/34 | United States | 335,000 | 316,898 | ||||||||||||||
| e,o | OHA Credit Funding 4 Ltd., 2021-4A, ER, 144A, FRN, 7.536%, (3-Month USD LIBOR + 6.40%), 10/22/36 | United States | 310,000 | 281,541 | ||||||||||||||
| e | OneMain Financial Issuance Trust, 2020-2A, C, 144A, 2.76%, 9/14/35 | United States | 100,000 | 89,849 | ||||||||||||||
| e,o | Pikes Peak CLO, 2021-4A, ER, 144A, FRN, 7.654%, (3-Month USD LIBOR + 6.61%), 7/15/34 | United States | 250,000 | 227,618 | ||||||||||||||
| e | Planet Fitness Master Issuer LLC, 2019-1A, A2, 144A, 3.858%, 12/05/49 | United States | 146,625 | 132,204 | ||||||||||||||
| e | Prestige Auto Receivables Trust, 144A, | United States | 100,000 | 99,244 | ||||||||||||||
2020-1A, E, 3.67%, 2/15/28 | United States | 100,000 | 98,072 | |||||||||||||||
| e | Progress Residential Trust, 144A, | United States | 100,000 | 91,113 | ||||||||||||||
2021-SFR2, E2, 2.647%, 4/19/38 | United States | 100,000 | 88,277 | |||||||||||||||
2021-SFR4, F, 3.407%, 5/17/38 | United States | 230,000 | 209,745 | |||||||||||||||
2021-SFR7, F, 3.834%, 8/17/40 | United States | 260,000 | 218,646 | |||||||||||||||
| e,o | RAAC Series Trust, 2006-RP1, M3, 144A, FRN, 2.856%, (1-Month USD LIBOR + 1.85%), 10/25/45 | United States | 1,010,000 | 1,001,448 | ||||||||||||||
| o | Ramp Series Trust, 2003-RS9, MII3, FRN, 4.231%, (1-Month USD LIBOR + 2.15%), 10/25/33 | United States | 1,140,907 | 1,053,869 | ||||||||||||||
Santander Drive Auto Receivables Trust, | United States | 240,000 | 244,871 | |||||||||||||||
2020-2, D, 2.22%, 9/15/26 | United States | 100,000 | 98,301 | |||||||||||||||
| o | Saxon Asset Securities Trust, 2002-3, M2, FRN, 3.593%, (1-Month USD LIBOR + 2.59%), 12/25/32 | United States | 1,133,472 | 1,081,339 | ||||||||||||||
| e | SCF Equipment Leasing LLC, 2021-1A, E, 144A, 3.56%, 8/20/32 | United States | 100,000 | 94,511 | ||||||||||||||
| e,p | Security National Mortgage Loan Trust, 2004-1A, AF3, 144A, FRN, 6.42%, 6/25/32 | United States | 1,577,662 | 1,256,818 | ||||||||||||||
| e | Sierra Timeshare Receivables Funding LLC, 2021-1A, C, 144A, 1.79%, 11/20/37 | United States | 144,613 | 136,750 | ||||||||||||||
| e | S-Jets Ltd., 2017-1, A, 144A, 3.967%, 8/15/42 | Bermuda | 351,417 | 314,362 | ||||||||||||||
| o | SLM Private Credit Student Loan Trust, 2003-B, A3, FRN, 2.806%, (28-Day T-Bill + 1.00%), 3/15/33 | United States | 150,000 | 146,512 | ||||||||||||||
| e,o | SMB Private Education Loan Trust, 2017-B, A2B, 144A, FRN, 1.625%, (1-Month USD LIBOR + 0.75%), 10/15/35 | United States | 44,746 | 44,259 | ||||||||||||||
| e | SoFi Consumer Loan Program Trust, 2019-4, C, 144A, 2.84%, 8/25/28 | United States | 122,142 | 121,704 | ||||||||||||||
| o | Soundview Home Loan Trust, 2006-WF2, M3, FRN, 1.681%, (1-Month USD LIBOR + 0.68%), 12/25/36 | United States | 1,748,361 | 2,339,789 | ||||||||||||||
| e | SpringCastle America Funding LLC, 2020-AA, A, 144A, 1.97%, 9/25/37 | United States | 163,058 | 155,356 | ||||||||||||||
| e | Stack Infrastructure Issuer LLC, 2019-1A, A2, 144A, 4.54%, 2/25/44 | United States | 120,938 | 121,029 | ||||||||||||||
| e,o | Staniford Street CLO Ltd., 2014-1A, D, 144A, FRN, 4.326%, (3-Month USD LIBOR + 3.50%), 6/15/25 | United States | 531,521 | 535,420 | ||||||||||||||
| e,o | Starwood Retail Property Trust, 2014-STAR, E, 144A, FRN, 5.275%, (1-Month USD LIBOR + 4.40%), 11/15/27 | United States | 200,000 | 875 | ||||||||||||||
| e | Textainer Marine Containers VII Ltd., 2021-1A, A, 144A, 1.68%, 2/20/46 | Bermuda | 171,000 | 151,335 | ||||||||||||||
| e,p | Towd Point Mortgage Trust, 144A, FRN, | United States | 100,000 | 88,027 | ||||||||||||||
2019-2, M1, 3.75%, 12/25/58 | United States | 200,000 | 180,667 | |||||||||||||||
2019-4, A1, 2.90%, 10/25/59 | United States | 254,702 | 247,081 | |||||||||||||||
| 56 | Annual Report | franklintempleton.com | ||||||||
FRANKLIN ALTERNATIVE STRATEGIES FUNDS
CONSOLIDATED SCHEDULE OF INVESTMENTS
Franklin K2 Alternative Strategies Fund (continued)
| Country | Principal Amount* | Value | ||||||||||||||||
| Asset-Backed Securities and Commercial Mortgage-Backed Securities (continued) | ||||||||||||||||||
| Diversified Financial Services (continued) | ||||||||||||||||||
| e | Tricon American Homes Trust, 2020-SFR2, E1, 144A, 2.73%, 11/17/39 | United States | 100,000 | $ | 86,325 | |||||||||||||
| e,o | TRTX Issuer Ltd., 2022-FL5, AS, 144A, FRN, 2.565%, (SOFR + 2.15%), 2/15/39 | United States | 1,000,000 | 967,875 | ||||||||||||||
| e | VCAT LLC, 144A, | United States | 59,762 | 58,043 | ||||||||||||||
2021-NPL5, A1, 1.868%, 8/25/51 | United States | 89,075 | 84,780 | |||||||||||||||
| e,o | VMC Finance LLC, 144A, FRN, | United States | 880,961 | 850,403 | ||||||||||||||
2019-FL3, D, 3.537%, (1-Month USD LIBOR + 2.65%), 9/15/36 | United States | 880,961 | 877,481 | |||||||||||||||
2021-FL4, C, 3.186%, (1-Month USD LIBOR + 2.25%), 6/16/36 | United States | 1,000,000 | 973,914 | |||||||||||||||
| e,p | WaMu Commercial Mortgage Securities Trust, 2007-SL2, G, 144A, FRN, 2.356%, 12/27/49 | United States | 2,866,082 | 2,358,407 | ||||||||||||||
| e | Wave Trust, 2017-1A, A, 144A, 3.844%, 11/15/42 | United States | 173,720 | 158,603 | ||||||||||||||
| p | Wells Fargo Mortgage Backed Securities Trust, 2007-AR6, A2, FRN, 2.622%, 10/25/37 | United States | 118,780 | 114,289 | ||||||||||||||
| e | Wendy’s Funding LLC, 2018-1A, A2II, 144A, 3.884%, 3/15/48 | United States | 210,650 | 202,253 | ||||||||||||||
| e | Westlake Automobile Receivables Trust, 2020-3A, D, 144A, 1.65%, 2/17/26 | United States | 120,000 | 115,859 | ||||||||||||||
|
| |||||||||||||||||
| 61,895,617 | ||||||||||||||||||
|
| |||||||||||||||||
| Equity Real Estate Investment Trusts (REITs) 0.0%† | ||||||||||||||||||
| e | American Homes 4 Rent, 144A, | United States | 250,000 | 253,977 | ||||||||||||||
2014-SFR3, E, 6.418%, 12/17/36 | United States | 100,000 | 102,085 | |||||||||||||||
2015-SFR1, E, 5.639%, 4/17/52 | United States | 210,000 | 210,247 | |||||||||||||||
| e | Diamond Resorts Owner Trust, 144A, | United States | 31,619 | 31,556 | ||||||||||||||
2019-1A, B, 3.53%, 2/20/32 | United States | 29,416 | 28,997 | |||||||||||||||
|
| |||||||||||||||||
| 626,862 | ||||||||||||||||||
|
| |||||||||||||||||
| Mortgage Real Estate Investment Trusts (REITs) 2.1% | ||||||||||||||||||
| e | 510 Asset Backed Trust, 2021-NPL1, A1, 144A, 2.24%, 6/25/61 | United States | 123,677 | 117,875 | ||||||||||||||
| o | American Home Mortgage Investment Trust, 2006-1, 11A1, FRN, 1.286%, (1-Month USD LIBOR + 0.28%), 3/25/46 | United States | 130,595 | 121,535 | ||||||||||||||
Banc of America Alternative Loan Trust, 2003-8, 1CB1, 5.50%, 10/25/33 | United States | 3,232 | 3,178 | |||||||||||||||
Banc of America Funding Trust, | United States | 170,304 | 103,040 | |||||||||||||||
2005-8, 1A1, 5.50%, 1/25/36 | United States | 288,893 | 253,305 | |||||||||||||||
2007-4, 5A1, 5.50%, 11/25/34 | United States | 31,217 | 29,642 | |||||||||||||||
| p | Banc of America Mortgage Trust, 2005-A, 2A1, FRN, 2.581%, 2/25/35 | United States | 2,229 | 2,253 | ||||||||||||||
| e,o | BBCMS Mortgage Trust, 2020-BID, B, 144A, FRN, 3.415%, (1-Month USD LIBOR + 2.54%), 10/15/37 | United States | 210,000 | 207,144 | ||||||||||||||
| e,o | BCAP LLC Trust, 2012-RR4, 9A7, 144A, FRN, 0.828%, (1-Month USD LIBOR + 0.08%), 11/26/36 | United States | 352,906 | 356,252 | ||||||||||||||
| e,o | BDS Ltd., 2020-FL6, D, 144A, FRN, 3.33%, (SOFR + 2.86%), 9/15/35 | United States | 1,100,000 | 1,077,718 | ||||||||||||||
| p | Bear Stearns ARM Trust, 2007-4, 12A1, FRN, 3.132%, 5/25/37 | United States | 1,180,076 | 1,132,820 | ||||||||||||||
| e,o | BPR Trust, 2021-NRD, F, 144A, FRN, 7.666%, (SOFR + 6.87%), 12/15/23 | United States | 140,000 | 134,494 | ||||||||||||||
| e,o | BXMT Ltd., 144A, FRN, | United States | 1,350,000 | 1,311,188 | ||||||||||||||
2021-FL4, C, 2.625%, (1-Month USD LIBOR + 1.75%), 5/15/38 | United States | 2,500,000 | 2,419,013 | |||||||||||||||
| e | CIM Trust, 2021-NR2, A1, 144A, 2.568%, 7/25/59 | United States | 150,539 | 144,984 | ||||||||||||||
| franklintempleton.com | Annual Report | 57 | ||||||||
FRANKLIN ALTERNATIVE STRATEGIES FUNDS
CONSOLIDATED SCHEDULE OF INVESTMENTS
Franklin K2 Alternative Strategies Fund (continued)
| Country | Principal Amount* | Value | ||||||||||||||||
| Asset-Backed Securities and Commercial Mortgage-Backed Securities (continued) | ||||||||||||||||||
| Mortgage Real Estate Investment Trusts (REITs) (continued) | ||||||||||||||||||
| e,p | Citigroup Commercial Mortgage Trust, 2014-GC21, D, 144A, FRN, 4.944%, 5/10/47 | United States | 330,000 | $ | 306,405 | |||||||||||||
Citigroup Mortgage Loan Trust, | United States | 460,487 | 247,441 | |||||||||||||||
e,p 2009-10, 6A2, 144A, FRN, 2.165%, 9/25/34 | United States | 19,124 | 19,454 | |||||||||||||||
e 2019-E, A1, 144A, 3.228%, 11/25/70 | United States | 187,903 | 187,875 | |||||||||||||||
Countrywide Alternative Loan Trust, | United States | 25,792 | 25,192 | |||||||||||||||
2004-16CB, 1A1, 5.50%, 7/25/34 | United States | 12,061 | 11,888 | |||||||||||||||
2004-16CB, 3A1, 5.50%, 8/25/34 | United States | 11,700 | 11,580 | |||||||||||||||
2004-28CB, 3A1, 6.00%, 1/25/35 | United States | 183,448 | 173,989 | |||||||||||||||
2004-3T1, M, 6.00%, 5/25/34 | United States | 187,645 | 138,152 | |||||||||||||||
2004-J10, 2CB1, 6.00%, 9/25/34 | United States | 33,518 | 33,122 | |||||||||||||||
2005-J1, 2A1, 5.50%, 2/25/25 | United States | 1,136 | 1,119 | |||||||||||||||
2006-25CB, A1, 6.00%, 10/25/36 | United States | 1,647,569 | 1,034,345 | |||||||||||||||
2007-6, A4, 5.75%, 4/25/47 | United States | 1,092,562 | 774,728 | |||||||||||||||
| p | Countrywide Home Loans Mortgage Pass-Through Trust, 2004-HYB4, 2A1, FRN, 2.767%, 9/20/34 | United States | 34,621 | 33,177 | ||||||||||||||
Credit Suisse First Boston Mortgage Securities Corp., | United States | 149,864 | 119,567 | |||||||||||||||
2003-27, 4A4, 5.75%, 11/25/33 | United States | 11,800 | 11,885 | |||||||||||||||
2005-8, 1A3, 5.25%, 9/25/35 | United States | 81,428 | 72,831 | |||||||||||||||
| e | CSMC OA LLC, 144A, | United States | 150,000 | 143,710 | ||||||||||||||
2014-USA, E, 4.373%, 9/15/37 | United States | 400,000 | 324,570 | |||||||||||||||
| o | DSLA Mortgage Loan Trust, 2005-AR5, 2A1A, FRN, 1.588%, (1-Month USD LIBOR + 0.66%), 9/19/45 | United States | 29,140 | 20,223 | ||||||||||||||
| o | Federal Home Loan Mortgage Corp., | |||||||||||||||||
2017-DNA1, B1, FRN, 5.956%, (1-Month USD LIBOR + 4.95%), 7/25/29 | United States | 1,210,000 | 1,268,644 | |||||||||||||||
e 2021-DNA7, M2, 144A, FRN, 2.385%, (SOFR + 1.80%), 11/25/41 | United States | 100,000 | 93,667 | |||||||||||||||
e 2022-DNA4, M1A, 144A, FRN, 2.551%, (SOFR + 2.20%), 5/25/42 | United States | 100,000 | 99,741 | |||||||||||||||
| o | FHLMC Structured Agency Credit Risk Debt Notes, 2015-DNA1, M3, FRN, 4.306%, (1-Month USD LIBOR + 3.30%), 10/25/27 | United States | 58,213 | 58,786 | ||||||||||||||
| p | GS Mortgage Securities Trust, FRN, | United States | 100,000 | 83,850 | ||||||||||||||
e 2011-GC5, D, 144A, 5.159%, 8/10/44 | United States | 195,000 | 87,360 | |||||||||||||||
e 2013-G1, B, 144A, 3.60%, 4/10/31 | United States | 110,000 | 106,162 | |||||||||||||||
2014-GC18, B, 4.885%, 1/10/47 | United States | 100,000 | 92,558 | |||||||||||||||
GSR Mortgage Loan Trust, | United States | 7,418 | 7,185 | |||||||||||||||
p 2005-AR6, 4A5, FRN, 2.645%, 9/25/35 | United States | 21,426 | 20,998 | |||||||||||||||
| o | Harborview Mortgage Loan Trust, 2004-11, 2A2A, FRN, 1.568%, (1-Month USD LIBOR + 0.64%), 1/19/35 | United States | 59,447 | 51,883 | ||||||||||||||
IndyMac INDX Mortgage Loan Trust, FRN, | United States | 1,443,544 | 1,191,388 | |||||||||||||||
o 2004-AR7, A5, 2.226%, (1-Month USD LIBOR + 1.22%), 9/25/34 | United States | 32,659 | 30,101 | |||||||||||||||
p 2005-AR11, A3, 2.949%, 8/25/35 | United States | 35,722 | 30,401 | |||||||||||||||
o 2006-AR2, 2A1, 1.426%, (1-Month USD LIBOR + 0.42%), 2/25/46 | United States | 159,854 | 124,703 | |||||||||||||||
p 2006-AR3, 3A1A, 3.077%, 4/25/36 | United States | 1,648,828 | 1,591,966 | |||||||||||||||
| e,p | Jefferies Resecuritization Trust, 2009-R12, 2A2, 144A, FRN, 2.561%, 1/26/35 | United States | 135,614 | 134,612 | ||||||||||||||
| p | JPMorgan Alternative Loan Trust, 2006-A2, 2A2, FRN, 3.119%, 5/25/36 | United States | 1,209,450 | 882,688 | ||||||||||||||
| e,p | JPMorgan Chase Commercial Mortgage Securities Trust, 144A, FRN, | United States | 100,000 | 99,786 | ||||||||||||||
2012-LC9, C, 4.363%, 12/15/47 | United States | 100,000 | 99,123 | |||||||||||||||
2012-LC9, D, 4.363%, 12/15/47 | United States | 120,000 | 118,204 | |||||||||||||||
| 58 | Annual Report | franklintempleton.com | ||||||||
FRANKLIN ALTERNATIVE STRATEGIES FUNDS
CONSOLIDATED SCHEDULE OF INVESTMENTS
Franklin K2 Alternative Strategies Fund (continued)
| Country | Principal Amount* | Value | ||||||||||||||||
| Asset-Backed Securities and Commercial Mortgage-Backed Securities (continued) | ||||||||||||||||||
| Mortgage Real Estate Investment Trusts (REITs) (continued) | ||||||||||||||||||
JPMorgan Mortgage Trust, | United States | 54,404 | $ | 54,197 | ||||||||||||||
p 2006-A3, 2B1, FRN, 2.773%, 4/25/35 | United States | 1,834,208 | 1,220,663 | |||||||||||||||
p 2007-A1, 4A2, FRN, 2.329%, 7/25/35 | United States | 867 | 861 | |||||||||||||||
e,p 2020-2, B4, 144A, FRN, 3.844%, 7/25/50 | United States | 974,597 | 875,493 | |||||||||||||||
| o | Lehman XS Trust, 2006-2N, 1A1, FRN, 1.526%, (1-Month USD LIBOR + 0.52%), 2/25/46 | United States | 26,916 | 23,378 | ||||||||||||||
MASTR Alternative Loan Trust, | United States | 108,088 | 100,310 | |||||||||||||||
2004-8, 2A1, 6.00%, 9/25/34 | United States | 23,149 | 22,757 | |||||||||||||||
| p | Merrill Lynch Mortgage Backed Securities Trust Series, 2007-3, 3A1, FRN, 3.066%, 6/25/37 | United States | 2,205,521 | 1,527,920 | ||||||||||||||
| p | Merrill Lynch Mortgage Investors MLCC, 2006-2, 2A, FRN, 2.348%, 5/25/36 | United States | 1,310 | 1,292 | ||||||||||||||
| p | Morgan Stanley Bank of America Merrill Lynch Trust, 2013-C11, B, FRN, 4.351%, 8/15/46 | United States | 200,000 | 148,021 | ||||||||||||||
| e,p | Morgan Stanley Capital I Trust, 2011-C2, E, 144A, FRN, 5.211%, 6/15/44 | United States | 150,000 | 121,500 | ||||||||||||||
| e,p | MSBAM Commercial Mortgage Securities Trust, 2012-CKSV, C, 144A, FRN, 4.281%, 10/15/30 | United States | 340,000 | 308,124 | ||||||||||||||
| e | PRPM LLC, 144A, | United States | 130,000 | 123,230 | ||||||||||||||
2021-3, A1, 1.867%, 4/25/26 | United States | 160,057 | 152,792 | |||||||||||||||
2021-9, A1, 2.363%, 10/25/26 | United States | 122,029 | 116,093 | |||||||||||||||
| p | RFMSI Trust, 2005-SA1, 1A1, FRN, 3.611%, 3/25/35 | United States | 78,990 | 45,889 | ||||||||||||||
| p | Structured Adjustable Rate Mortgage Loan Trust Series, 2006-8, 1A2, FRN, 3.094%, 9/25/36 | United States | 174,736 | 145,864 | ||||||||||||||
| o | Structured ARM Loan Trust, 2005-14, A1, FRN, 1.316%, (1-Month USD LIBOR + 0.31%), 7/25/35 | United States | 158,648 | 109,306 | ||||||||||||||
| e | Toorak Mortgage Corp. Ltd., 2021-1, A1, 144A, 2.24%, 6/25/24 | United States | 190,000 | 179,827 | ||||||||||||||
| e | VOLT XCII LLC, 2021-NPL1, A1, 144A, 1.893%, 2/27/51 | United States | 91,106 | 87,811 | ||||||||||||||
| e | VOLT XCII LLC, 2021-NPL2, A1, 144A, 1.893%, 2/27/51 | United States | 214,625 | 206,935 | ||||||||||||||
| e | VOLT XCIV LLC, 2021-NPL3, A2, 144A, 4.949%, 2/27/51 | United States | 215,000 | 206,532 | ||||||||||||||
| o | WaMu Mortgage Pass-Through Certificates Series Trust, 2005-AR11, B1, FRN, 1.921%, (1-Month USD LIBOR + 0.92%), 8/25/45 | United States | 2,214,939 | 1,930,691 | ||||||||||||||
Wells Fargo Commercial Mortgage Trust, | United States | 190,000 | 179,730 | |||||||||||||||
2014-LC16, C, 4.458%, 8/15/50 | United States | 215,000 | 136,934 | |||||||||||||||
p 2016-C36, B, FRN, 3.671%, 11/15/59 | United States | 100,000 | 89,389 | |||||||||||||||
p 2016-C36, C, FRN, 4.166%, 11/15/59 | United States | 100,000 | 82,742 | |||||||||||||||
e,p 2019-JWDR, C, 144A, FRN, 3.038%, 9/15/31 | United States | 290,000 | 262,384 | |||||||||||||||
WFRBS Commercial Mortgage Trust, | United States | 200,677 | 83,281 | |||||||||||||||
e,p 2011-C4, E, 144A, FRN, 4.888%, 6/15/44 | United States | 120,000 | 94,216 | |||||||||||||||
p 2012-C10, C, FRN, 4.341%, 12/15/45 | United States | 320,000 | 296,525 | |||||||||||||||
p 2012-C7, C, FRN, 4.631%, 6/15/45 | United States | 25,000 | 17,875 | |||||||||||||||
e,p 2012-C7, D, 144A, FRN, 4.631%, 6/15/45 | United States | 130,000 | 45,500 | |||||||||||||||
e,p 2012-C7, E, 144A, FRN, 4.631%, 6/15/45 | United States | 75,000 | 7,087 | |||||||||||||||
2014-C20, B, 4.378%, 5/15/47 | United States | 100,000 | 96,405 | |||||||||||||||
p 2014-C24, B, FRN, 4.204%, 11/15/47 | United States | 100,000 | 94,239 | |||||||||||||||
|
| |||||||||||||||||
| 26,575,293 | ||||||||||||||||||
|
| |||||||||||||||||
Total Asset-Backed Securities and Commercial Mortgage-Backed Securities (Cost $92,365,126) | 89,097,772 | |||||||||||||||||
|
| |||||||||||||||||
| franklintempleton.com | Annual Report | 59 | ||||||||
FRANKLIN ALTERNATIVE STRATEGIES FUNDS
CONSOLIDATED SCHEDULE OF INVESTMENTS
Franklin K2 Alternative Strategies Fund (continued)
| Number of Contracts | Notional Amount# | Value | ||||||||||||||||
| Options Purchased 0.5% | ||||||||||||||||||
| Calls – Exchange-Traded 0.0%† | ||||||||||||||||||
3 Month EURIBOR, December Strike Price 99.88 EUR, Expires 12/19/22 | 80 | 200,000 | $ | 3,757 | ||||||||||||||
Activision Blizzard Inc., June Strike Price $90.00, Expires 6/17/22 | 158 | 15,800 | 316 | |||||||||||||||
Avaya Holdings Corp., June Strike Price $4.00, Expires 6/17/22 | 88 | 8,800 | 4,840 | |||||||||||||||
Avaya Holdings Corp., June Strike Price $5.00, Expires 6/17/22 | 157 | 15,700 | 4,553 | |||||||||||||||
Bloom Energy Corp., June Strike Price $23.00, Expires 6/17/22 | 782 | 78,200 | 7,820 | |||||||||||||||
CBOE Volatility Index, June Strike Price $28.00, Expires 6/15/22 | 85 | 8,500 | 13,005 | |||||||||||||||
CBOE Volatility Index, June Strike Price $35.00, Expires 6/15/22 | 142 | 14,200 | 7,242 | |||||||||||||||
CBOE Volatility Index, July Strike Price $30.00, Expires 7/20/22 | 143 | 14,300 | 40,755 | |||||||||||||||
CBOE Volatility Index, July Strike Price $32.50, Expires 7/20/22 | 59 | 5,900 | 14,160 | |||||||||||||||
CBOE Volatility Index, July Strike Price $35.00, Expires 7/20/22 | 121 | 12,100 | 23,232 | |||||||||||||||
CBOE Volatility Index, August Strike Price $30.00, Expires 8/17/22 | 60 | 6,000 | 22,200 | |||||||||||||||
CBOE Volatility Index, August Strike Price $32.50, Expires 8/17/22 | 54 | 5,400 | 17,280 | |||||||||||||||
Chegg Inc., July Strike Price $35.00, Expires 7/15/22 | 73 | 7,300 | 438 | |||||||||||||||
Chewy Inc., June Strike Price $35.00, Expires 6/17/22 | 71 | 7,100 | 3,124 | |||||||||||||||
Chewy Inc., January Strike Price $30.00, Expires 1/20/23 | 142 | 14,200 | 71,000 | |||||||||||||||
CME 3-Month SOFR Futures, December Strike Price $98.19, Expires 12/16/22 | 89 | 222,500 | 9,456 | |||||||||||||||
Desktop Metal Inc., June Strike Price $2.50, Expires 6/17/22 | 73 | 7,300 | 365 | |||||||||||||||
E-mini S&P 500, June Strike Price $4,150.00, Expires 6/17/22 | 3 | 150 | 11,662 | |||||||||||||||
E-mini S&P 500, July Strike Price $4,400.00, Expires 7/29/22 | 3 | 150 | 6,488 | |||||||||||||||
E-mini S&P 500, July Strike Price $4,700.00, Expires 7/29/22 | 40 | 2,000 | 8,900 | |||||||||||||||
Enphase Energy Inc., June Strike Price $200.00, Expires 6/17/22 | 150 | 15,000 | 85,350 | |||||||||||||||
Hertz Global Holdings Inc., June Strike Price $22.50, Expires 6/17/22 | 61 | 6,100 | 1,952 | |||||||||||||||
iShares 20+ Year Treasury Bond ETF, September Strike Price $140.00, Expires 9/16/22 | 229 | 22,900 | 10,992 | |||||||||||||||
Kohl’s Corp., July Strike Price $62.50, Expires 7/15/22 | 90 | 9,000 | 1,350 | |||||||||||||||
Kohl’s Corp., July Strike Price $65.00, Expires 7/15/22 | 19 | 1,900 | 380 | |||||||||||||||
Kohl’s Corp., October Strike Price $42.50, Expires 10/21/22 | 38 | 3,800 | 20,900 | |||||||||||||||
Kohl’s Corp., October Strike Price $50.00, Expires 10/21/22 | 154 | 15,400 | 51,590 | |||||||||||||||
Momentive Global Inc., July Strike Price $15.00, Expires 7/15/22 | 93 | 9,300 | 4,417 | |||||||||||||||
Momentive Global Inc., July Strike Price $17.50, Expires 7/15/22 | 437 | 43,700 | 10,925 | |||||||||||||||
NCR Corp., July Strike Price $35.00, Expires 7/15/22 | 38 | 3,800 | 15,200 | |||||||||||||||
Nikola Corp., July Strike Price $11.00, Expires 7/15/22 | 233 | 23,300 | 7,223 | |||||||||||||||
Plug Power Inc., June Strike Price $27.50, Expires 6/17/22 | 710 | 71,000 | 2,840 | |||||||||||||||
SolarEdge Technologies Inc., June Strike Price $310.00, Expires 6/17/22 | 104 | 10,400 | 29,640 | |||||||||||||||
SPDR Gold Shares, September Strike Price $180.00, Expires 9/16/22 | 64 | 6,400 | 21,760 | |||||||||||||||
Stem Inc., July Strike Price $10.00, Expires 7/15/22 | 1,629 | 162,900 | 138,465 | |||||||||||||||
STOXX Europe 600 Telecommunications Price Index, June Strike Price 240.00 EUR, Expires 6/17/22 | 77 | 3,850 | 8,680 | |||||||||||||||
Sunnova Energy International PLC, July Strike Price $20.00, Expires 7/15/22 | 674 | 67,400 | 168,500 | |||||||||||||||
SunPower Corp., June Strike Price $22.00, Expires 6/17/22 | 1,267 | 126,700 | 15,204 | |||||||||||||||
Sunrun Inc., June Strike Price $25.00, Expires 6/17/22 | 814 | 81,400 | 214,896 | |||||||||||||||
Take-Two Interactive Software Inc., June Strike Price $170.00, Expires 6/17/22 | 8 | 800 | 40 | |||||||||||||||
Take-Two Interactive Software Inc., June Strike Price $195.00, Expires 6/17/22 | 18 | 1,800 | 540 | |||||||||||||||
Tronox Holdings PLC, August Strike Price $20.00, Expires 8/19/22 | 39 | 3,900 | 3,510 | |||||||||||||||
Twitter Inc., June Strike Price $55.00, Expires 6/17/22 | 108 | 10,800 | 540 | |||||||||||||||
Twitter Inc., October Strike Price $55.00, Expires 10/21/22 | 108 | 10,800 | 2,268 | |||||||||||||||
Vodafone Group PLC, June Strike Price 1.30 GBP, Expires 6/17/22 | 81 | 81,000 | 1,786 | |||||||||||||||
Vodafone Group PLC, July Strike Price $18.00, Expires 7/15/22 | 15 | 1,500 | 210 | |||||||||||||||
Vodafone Group PLC, July Strike Price $19.00, Expires 7/15/22 | 5 | 500 | 22 | |||||||||||||||
Warner Bros Discovery Inc., June Strike Price $25.00, Expires 6/17/22 | 235 | 23,500 | 470 | |||||||||||||||
| 60 | Annual Report | franklintempleton.com | ||||||||
FRANKLIN ALTERNATIVE STRATEGIES FUNDS
CONSOLIDATED SCHEDULE OF INVESTMENTS
Franklin K2 Alternative Strategies Fund (continued)
| Number of Contracts | Notional Amount# | Value | ||||||||||||||||
| Options Purchased (continued) | ||||||||||||||||||
| Calls – Exchange-Traded (continued)† | ||||||||||||||||||
The Wendy’s Co., August Strike Price $20.00, Expires 8/19/22 | 33 | 3,300 | $ | 2,640 | ||||||||||||||
Zendesk Inc., July Strike Price $125.00, Expires 7/15/22 | 47 | 4,700 | 7,191 | |||||||||||||||
|
| |||||||||||||||||
| 1,100,074 | ||||||||||||||||||
|
| |||||||||||||||||
| Calls – Over-the-Counter 0.0%† | ||||||||||||||||||
Healthcare Realty Trust Inc., Counterparty BZWS, August Strike Price $30.00, Expires 8/19/22 | 196 | 19,600 | 23,520 | |||||||||||||||
|
| |||||||||||||||||
| Currency Options 0.0%† | ||||||||||||||||||
GBP/USD, Counterparty BZWS, May Strike Price 1.50 GBP, Expires 5/08/23 | 1 | 7,500,000 | GBP | 6,185 | ||||||||||||||
USD/PHP, Counterparty JPHQ, November Strike Price $55.50, Expires 11/14/22 | 1 | 1,350,000 | 8,153 | |||||||||||||||
|
| |||||||||||||||||
| 14,338 | ||||||||||||||||||
|
| |||||||||||||||||
| Puts – Exchange-Traded 0.4% | ||||||||||||||||||
3 Month EURIBOR, December Strike Price 98.88 EUR, Expires 12/19/22 | 40 | 100,000 | 12,614 | |||||||||||||||
3 Month EURIBOR, December Strike Price 99.00 EUR, Expires 12/19/22 | 30 | 75,000 | 12,279 | |||||||||||||||
3 Month EURIBOR, December Strike Price 100.00 EUR, Expires 12/19/22 | 20 | 50,000 | 45,760 | |||||||||||||||
3 Month EURIBOR, December Strike Price 100.13 EUR, Expires 12/19/22 | 40 | 100,000 | 104,403 | |||||||||||||||
3 Month SOFR, August Strike Price $97.19, Expires 8/12/22 | 166 | 415,000 | 8,300 | |||||||||||||||
3 Month SOFR, August Strike Price $97.63, Expires 8/12/22 | 83 | 207,500 | 21,788 | |||||||||||||||
Ally Financial Inc., June Strike Price $35.00, Expires 6/17/22 | 177 | 17,700 | 2,655 | |||||||||||||||
Ally Financial Inc., September Strike Price $30.00, Expires 9/16/22 | 117 | 11,700 | 8,775 | |||||||||||||||
American Airlines Group Inc., January Strike Price $10.00, Expires 1/20/23 | 40 | 4,000 | 2,720 | |||||||||||||||
ARK Innovation ETF, June Strike Price $61.22, Expires 6/17/22 | 614 | 61,400 | 1,059,150 | |||||||||||||||
Callaway Golf Co., July Strike Price $18.00, Expires 7/15/22 | 260 | 26,000 | 11,050 | |||||||||||||||
Callaway Golf Co., July Strike Price $21.00, Expires 7/15/22 | 77 | 7,700 | 8,662 | |||||||||||||||
Capital One Financial Corp., September Strike Price $100.00, Expires 9/16/22 | 60 | 6,000 | 16,500 | |||||||||||||||
CarMax Inc., July Strike Price $75.00, Expires 7/15/22 | 193 | 19,300 | 24,125 | |||||||||||||||
CBOE Volatility Index, June Strike Price $28.00, Expires 6/15/22 | 165 | 16,500 | 50,325 | |||||||||||||||
CBOE Volatility Index, July Strike Price $30.00, Expires 7/20/22 | 124 | 12,400 | 62,000 | |||||||||||||||
CBOE Volatility Index, July Strike Price $32.50, Expires 7/20/22 | 102 | 10,200 | 71,400 | |||||||||||||||
Dollar Tree Inc., August Strike Price $110.00, Expires 8/19/22 | 32 | 3,200 | 2,496 | |||||||||||||||
E-mini S&P 500, June Strike Price $3,650.00, Expires 6/30/22 | 3 | 150 | 2,063 | |||||||||||||||
E-mini S&P 500, June Strike Price $3,850.00, Expires 6/30/22 | 3 | 150 | 5,288 | |||||||||||||||
Energy Select Sector SPDR Fund, June Strike Price $80.00, Expires 6/17/22 | 12 | 1,200 | 804 | |||||||||||||||
Eurodollar 1 Yr., June Strike Price $96.38, Expires 6/10/22 | 60 | 150,000 | 1,500 | |||||||||||||||
FTSE 100 Index, June Strike Price 7,100.00 GBP, Expires 6/17/22 | 19 | 190 | 4,190 | |||||||||||||||
The Home Depot Inc., August Strike Price $260.00, Expires 8/19/22 | 14 | 1,400 | 6,930 | |||||||||||||||
IMM Eurodollar, December Strike Price $96.00, Expires 12/19/22 | 89 | 222,500 | 13,350 | |||||||||||||||
IMM Eurodollar, December Strike Price $97.50, Expires 12/19/22 | 89 | 222,500 | 153,525 | |||||||||||||||
Invesco QQQ Trust Series 1, June Strike Price $295.00, Expires 6/17/22 | 88 | 8,800 | 35,904 | |||||||||||||||
Invesco QQQ Trust Series 1, June Strike Price $297.00, Expires 6/17/22 | 167 | 16,700 | 75,985 | |||||||||||||||
iShares Expanded Tech-Software Sector ETF, June Strike Price $280.00, Expires 6/17/22 | 45 | 4,500 | 32,670 | |||||||||||||||
iShares Russell 2000 ETF, June Strike Price $179.00, Expires 6/17/22 | 167 | 16,700 | 45,758 | |||||||||||||||
iShares Russell 2000 Value ETF, November Strike Price $150.00, Expires 11/18/22 | 882 | 88,200 | 904,050 | |||||||||||||||
| franklintempleton.com | Annual Report | 61 | ||||||||
FRANKLIN ALTERNATIVE STRATEGIES FUNDS
CONSOLIDATED SCHEDULE OF INVESTMENTS
Franklin K2 Alternative Strategies Fund (continued)
| Number of Contracts | Notional Amount# | Value | ||||||||||||||||
| Options Purchased (continued) | ||||||||||||||||||
| Puts – Exchange-Traded (continued) | ||||||||||||||||||
JB Hunt Transport Services Inc., January Strike Price $165.00, Expires 1/20/23 | 65 | 6,500 | $ | 88,075 | ||||||||||||||
Kohl’s Corp., July Strike Price $42.50, Expires 7/15/22 | 366 | 36,600 | 250,710 | |||||||||||||||
Lowe’s Cos. Inc., August Strike Price $170.00, Expires 8/19/22 | 25 | 2,500 | 10,875 | |||||||||||||||
Medical Properties Trust Inc., July Strike Price $15.00, Expires 7/15/22 | 356 | 35,600 | 4,272 | |||||||||||||||
New Residential Investment Corp., August Strike Price $9.00, Expires 8/19/22 | 527 | 52,700 | 7,905 | |||||||||||||||
Norfolk Southern Corp., January Strike Price $250.00, Expires 1/20/23 | 91 | 9,100 | 242,970 | |||||||||||||||
S&P 500 Index, June Strike Price $3,700.00, Expires 6/17/22 | 33 | 3,300 | 21,945 | |||||||||||||||
Safehold Inc., June Strike Price $45.00, Expires 6/17/22 | 58 | 5,800 | 14,935 | |||||||||||||||
SPDR S&P 500 ETF Trust, August Strike Price $380.00, Expires 8/19/22 | 175 | 17,500 | 148,750 | |||||||||||||||
SPDR S&P 500 ETF Trust, November Strike Price $350.00, Expires 11/18/22 | 680 | 68,000 | 623,560 | |||||||||||||||
SPDR S&P Regional Banking ETF, June Strike Price $55.00, Expires 6/17/22 | 182 | 18,200 | 2,002 | |||||||||||||||
Synchrony Financial, June Strike Price $32.00, Expires 6/17/22 | 177 | 17,700 | 4,425 | |||||||||||||||
Synchrony Financial, September Strike Price $30.00, Expires 9/16/22 | 93 | 9,300 | 11,811 | |||||||||||||||
Take-Two Interactive Software Inc., June Strike Price $8.00, Expires 6/17/22 | 257 | 25,700 | 771 | |||||||||||||||
Tenneco Inc., January Strike Price $12.00, Expires 1/20/23 | 455 | 45,500 | 36,400 | |||||||||||||||
Toll Brothers Inc., September Strike Price $40.00, Expires 9/16/22 | 54 | 5,400 | 7,830 | |||||||||||||||
Twitter Inc., October Strike Price $42.00, Expires 10/21/22 | 72 | 7,200 | 48,780 | |||||||||||||||
Twitter Inc., January Strike Price $42.00, Expires 1/20/23 | 31 | 3,100 | 22,630 | |||||||||||||||
U.S. Treasury 10 Yr. Note, June Strike Price $115.00, Expires 6/24/22 | 80 | 80,000 | 3,750 | |||||||||||||||
U.S. Treasury 10 Yr. Note, June Strike Price $118.50, Expires 6/24/22 | 40 | 40,000 | 20,000 | |||||||||||||||
Utilities Select Sector SPDR Fund, June Strike Price $74.00, Expires 6/17/22 | 1,471 | 147,100 | 148,571 | |||||||||||||||
VanEck Semiconductor ETF, August Strike Price $200.00, Expires 8/19/22 | 30 | 3,000 | 13,050 | |||||||||||||||
Vodafone Group PLC, August Strike Price 1.15 GBP, Expires 8/19/22 | 1,689 | 1,689,000 | 53,208 | |||||||||||||||
|
| |||||||||||||||||
| 4,594,244 | ||||||||||||||||||
|
| |||||||||||||||||
| Puts – Over-the-Counter 0.0%† | ||||||||||||||||||
B&G Foods Inc., Counterparty CITI, August Strike Price $20.00, Expires 8/19/22 | 118 | 11,800 | 11,800 | |||||||||||||||
B&G Foods Inc., Counterparty CITI, November Strike Price $17.50, Expires 11/18/22 | 97 | 9,700 | 11,155 | |||||||||||||||
B&G Foods Inc., Counterparty CITI, November Strike Price $20.00, Expires 11/18/22 | 162 | 16,200 | 29,970 | |||||||||||||||
Casino Guichard Perrachon SA, Counterparty CITI, September Strike Price 10.00 EUR, Expires 9/16/22 | 26 | 2,600 | 726 | |||||||||||||||
DAX Index, Counterparty CITI, June Strike Price 12,500.00 EUR, Expires 6/17/22 | 28 | 140 | 1,310 | |||||||||||||||
H & M Hennes & Mauritz AB, Counterparty CITI, June Strike Price 105.00 SEK, Expires 6/17/22 | 222 | 22,200 | 795 | |||||||||||||||
HP Inc., Counterparty BOFA, August Strike Price $34.00, Expires 8/19/22 | 193 | 19,300 | 25,476 | |||||||||||||||
|
| |||||||||||||||||
| 81,232 | ||||||||||||||||||
|
| |||||||||||||||||
| Currency Options 0.0%† | ||||||||||||||||||
EUR/USD, Counterparty JPHQ, September Strike Price 1.05 EUR, Expires 9/30/22 | 1 | 81,450 | EUR | 18,650 | ||||||||||||||
|
| |||||||||||||||||
Total Options Purchased (Cost $6,591,004) | 5,832,058 | |||||||||||||||||
|
| |||||||||||||||||
Total Investments before Short Term Investments | 965,604,461 | |||||||||||||||||
|
| |||||||||||||||||
| 62 | Annual Report | franklintempleton.com | ||||||||
FRANKLIN ALTERNATIVE STRATEGIES FUNDS
CONSOLIDATED SCHEDULE OF INVESTMENTS
Franklin K2 Alternative Strategies Fund (continued)
| Country | Shares | Value | ||||||||||||||||
| Short Term Investments 17.8% | ||||||||||||||||||
| Money Market Funds 15.7% | ||||||||||||||||||
| q,r | Dreyfus Government Cash Management, Institutional, 0.70% | United States | 35,667,931 | $ | 35,667,931 | |||||||||||||
| q | Fidelity Investments Money Market Government Portfolio, Institutional, 0.62% | United States | 163,558,455 | 163,558,455 | ||||||||||||||
|
| |||||||||||||||||
Total Money Market Funds (Cost $199,226,386) | 199,226,386 | |||||||||||||||||
|
| |||||||||||||||||
| s | Investments from Cash Collateral Received for Loaned Securities 0.5% | |||||||||||||||||
| Money Market Funds 0.4% | ||||||||||||||||||
| q,t | Institutional Fiduciary Trust Money Market Portfolio, 0.437% | United States | 4,937,000 | 4,937,000 | ||||||||||||||
|
| |||||||||||||||||
| Principal Amount* | ||||||||||||||||||
| Repurchase Agreements 0.1% | ||||||||||||||||||
| u | Joint Repurchase Agreement, 0.77%, 6/01/22 (Maturity Value $1,058,194) | United States | 1,058,171 | 1,058,171 | ||||||||||||||
J.P. Morgan Securities LLC | ||||||||||||||||||
|
| |||||||||||||||||
Total Investments from Cash Collateral Received for Loaned Securities (Cost $5,995,171) | 5,995,171 | |||||||||||||||||
|
| |||||||||||||||||
U.S. Government and Agency Securities 1.6% |
| |||||||||||||||||
| v | Federal Home Loan Bank Discount Notes, 6/01/22 | United States | 7,900,000 | 7,900,000 | ||||||||||||||
| v | U.S. Treasury Bill, 10/13/22 | United States | 12,000,000 | 11,942,082 | ||||||||||||||
|
| |||||||||||||||||
Total U.S. Government and Agency Securities | 19,842,082 | |||||||||||||||||
|
| |||||||||||||||||
Total Investments (Cost $1,178,951,956) 93.9% | 1,190,668,100 | |||||||||||||||||
Options Written (0.1)% | (1,966,832 | ) | ||||||||||||||||
Securities Sold Short (17.7)% | (224,344,875 | ) | ||||||||||||||||
Other Assets, less Liabilities 23.9% | 302,758,385 | |||||||||||||||||
|
| |||||||||||||||||
Net Assets 100.0% | $ | 1,267,114,778 | ||||||||||||||||
|
| |||||||||||||||||
| Number of Contracts | Notional Amount# | |||||||||||||||||
| w | Options Written (0.1)% | |||||||||||||||||
| Calls – Exchange-Traded (0.0)%† | ||||||||||||||||||
3 Month EURIBOR, December Strike Price 99.63 EUR, Expires 12/19/22 | 40 | 100,000 | (5,099 | ) | ||||||||||||||
3 Month EURIBOR, December Strike Price 100.13 EUR, Expires 12/19/22 | 40 | 100,000 | (805 | ) | ||||||||||||||
AbbVie Inc., June Strike Price $165.00, Expires 6/17/22 | 6 | 600 | (54 | ) | ||||||||||||||
Activision Blizzard Inc., August Strike Price $85.00, Expires 8/19/22 | 115 | 11,500 | (8,625 | ) | ||||||||||||||
American Tower Corp., June Strike Price $270.00, Expires 6/17/22 | 2 | 200 | (250 | ) | ||||||||||||||
Bristol-Myers Squibb Co., June Strike Price $80.00, Expires 6/17/22 | 7 | 700 | (168 | ) | ||||||||||||||
Callaway Golf Co., July Strike Price $27.00, Expires 7/15/22 | 260 | 26,000 | (4,550 | ) | ||||||||||||||
CME 3-Month SOFR Futures, December Strike Price $98.50, Expires 12/16/22 | 89 | 222,500 | (5,563 | ) | ||||||||||||||
CME 3-Month SOFR Futures, December Strike Price $98.88, Expires 12/16/22 | 89 | 222,500 | (2,781 | ) | ||||||||||||||
The Coca-Cola Co., June Strike Price $67.50, Expires 6/17/22 | 17 | 1,700 | (119 | ) | ||||||||||||||
Cummins Inc., June Strike Price $210.00, Expires 6/17/22 | 1 | 100 | (550 | ) | ||||||||||||||
Deere & Co., June Strike Price $420.00, Expires 6/17/22 | 1 | 100 | (26 | ) | ||||||||||||||
Duke Energy Corp., June Strike Price $115.00, Expires 6/17/22 | 5 | 500 | (375 | ) | ||||||||||||||
E-mini S&P 500, June Strike Price $4,245.00, Expires 6/17/22 | 3 | 150 | (5,550 | ) | ||||||||||||||
| franklintempleton.com | Annual Report | 63 | ||||||||
FRANKLIN ALTERNATIVE STRATEGIES FUNDS
CONSOLIDATED SCHEDULE OF INVESTMENTS
Franklin K2 Alternative Strategies Fund (continued)
| Number of Contracts | Notional Amount# | Value | ||||||||||||||||
| w | Options Written (continued) | |||||||||||||||||
| Calls – Exchange-Traded (continued)† | ||||||||||||||||||
E-mini S&P 500, July Strike Price $4,500.00, Expires 7/29/22 | 2 | 100 | $ | (2,200 | ) | |||||||||||||
E-mini S&P 500, July Strike Price $4,800.00, Expires 7/29/22 | 29 | 1,450 | (3,045 | ) | ||||||||||||||
Hertz Global Holdings Inc., June Strike Price $32.50, Expires 6/17/22 | 55 | 5,500 | (110 | ) | ||||||||||||||
The Home Depot Inc., June Strike Price $300.00, Expires 6/17/22 | 1 | 100 | (950 | ) | ||||||||||||||
Invesco QQQ Trust Series 1, June Strike Price $325.00, Expires 6/17/22 | 40 | 4,000 | (8,800 | ) | ||||||||||||||
iShares Expanded Tech-Software Sector ETF, June Strike Price $295.00, Expires 6/17/22 | 45 | 4,500 | (28,485 | ) | ||||||||||||||
Johnson & Johnson, June Strike Price $185.00, Expires 6/17/22 | 7 | 700 | (630 | ) | ||||||||||||||
Kohl’s Corp., July Strike Price $42.50, Expires 7/15/22 | 154 | 15,400 | (65,450 | ) | ||||||||||||||
Kohl’s Corp., July Strike Price $70.00, Expires 7/15/22 | 90 | 9,000 | (540 | ) | ||||||||||||||
Lockheed Martin Corp., June Strike Price $470.00, Expires 6/17/22 | 1 | 100 | (115 | ) | ||||||||||||||
Merck & Co. Inc., June Strike Price $92.50, Expires 6/17/22 | 12 | 1,200 | (1,764 | ) | ||||||||||||||
Microchip Technology Inc., June Strike Price $75.00, Expires 6/17/22 | 7 | 700 | (805 | ) | ||||||||||||||
Momentive Global Inc., July Strike Price $22.50, Expires 7/15/22 | 530 | 53,000 | (2,650 | ) | ||||||||||||||
Newmont Corp., June Strike Price $77.50, Expires 6/17/22 | 8 | 800 | (80 | ) | ||||||||||||||
The Procter & Gamble Co., June Strike Price $165.00, Expires 6/17/22 | 7 | 700 | (77 | ) | ||||||||||||||
Safehold Inc., July Strike Price $75.00, Expires 7/15/22 | 116 | 11,600 | (12,180 | ) | ||||||||||||||
Starbucks Corp., June Strike Price $80.00, Expires 6/17/22 | 9 | 900 | (1,566 | ) | ||||||||||||||
Take-Two Interactive Software Inc., June Strike Price $11.00, Expires 6/17/22 | 652 | 65,200 | (652 | ) | ||||||||||||||
Take-Two Interactive Software Inc., June Strike Price $190.00, Expires 6/17/22 | 8 | 800 | (24 | ) | ||||||||||||||
Twitter Inc., June Strike Price $46.00, Expires 6/17/22 | 69 | 6,900 | (2,484 | ) | ||||||||||||||
Vodafone Group PLC, August Strike Price 1.40 GBP, Expires 8/19/22 | 622 | 622,000 | (15,676 | ) | ||||||||||||||
Walmart Inc., June Strike Price $160.00, Expires 6/17/22 | 7 | 700 | (7 | ) | ||||||||||||||
The Wendy’s Co., August Strike Price $23.00, Expires 8/19/22 | 33 | 3,300 | (825 | ) | ||||||||||||||
Zendesk Inc., July Strike Price $145.00, Expires 7/15/22 | 47 | 4,700 | (893 | ) | ||||||||||||||
|
| |||||||||||||||||
| (184,523 | ) | |||||||||||||||||
|
| |||||||||||||||||
| Calls – Over-the-Counter (0.0)%† | ||||||||||||||||||
Preferred Apartment Communities Inc., Counterparty BZWS, July Strike Price $25.00, Expires 7/15/22 | 18 | 1,800 | (54 | ) | ||||||||||||||
|
| |||||||||||||||||
| Currency Options (0.0)%† | ||||||||||||||||||
GBP/USD, Counterparty BZWS, May Strike Price 0.75 GBP, Expires 5/08/23 | 1 | 7,500,000 | GBP | (1,697 | ) | |||||||||||||
|
| |||||||||||||||||
| Puts – Exchange-Traded (0.1)% | ||||||||||||||||||
3 Month EURIBOR, December Strike Price 99.13 EUR, Expires 12/19/22 | 40 | 100,000 | (21,471 | ) | ||||||||||||||
3 Month EURIBOR, December Strike Price 99.25 EUR, Expires 12/19/22 | 20 | 50,000 | (13,822 | ) | ||||||||||||||
3 Month EURIBOR, December Strike Price 99.50 EUR, Expires 12/19/22 | 30 | 75,000 | (33,414 | ) | ||||||||||||||
3 Month EURIBOR, December Strike Price 99.88 EUR, Expires 12/19/22 | 40 | 100,000 | (78,638 | ) | ||||||||||||||
3 Month SOFR, August Strike Price $97.38, Expires 8/12/22 | 166 | 415,000 | (15,563 | ) | ||||||||||||||
3 Month SOFR, August Strike Price $97.50, Expires 8/12/22 | 83 | 207,500 | (12,450 | ) | ||||||||||||||
Activision Blizzard Inc., August Strike Price $75.00, Expires 8/19/22 | 244 | 24,400 | (47,580 | ) | ||||||||||||||
ARK Innovation ETF, June Strike Price $52.22, Expires 6/17/22 | 614 | 61,400 | (564,880 | ) | ||||||||||||||
CarMax Inc., July Strike Price $65.00, Expires 7/15/22 | 193 | 19,300 | (8,685 | ) | ||||||||||||||
E-mini S&P 500, June Strike Price $3,750.00, Expires 6/30/22 | 6 | 300 | (6,675 | ) | ||||||||||||||
Energy Select Sector SPDR Fund, June Strike Price $70.00, Expires 6/17/22 | 12 | 1,200 | (120 | ) | ||||||||||||||
Eurodollar 1 Yr., June Strike Price $96.25, Expires 6/10/22 | 60 | 150,000 | (375 | ) | ||||||||||||||
FTSE 100 Index, June Strike Price 6,800.00 GBP, Expires 6/17/22 | 19 | 190 | (1,915 | ) | ||||||||||||||
| 64 | Annual Report | franklintempleton.com | ||||||||
FRANKLIN ALTERNATIVE STRATEGIES FUNDS
CONSOLIDATED SCHEDULE OF INVESTMENTS
Franklin K2 Alternative Strategies Fund (continued)
| Number of Contracts | Notional Amount# | Value | ||||||||||||||||
| w | Options Written (continued) | |||||||||||||||||
| Puts – Exchange-Traded (continued) | ||||||||||||||||||
IMM Eurodollar, December Strike Price $96.50, Expires 12/19/22 | 178 | 445,000 | $ | (65,637 | ) | |||||||||||||
Invesco QQQ Trust Series 1, June Strike Price $287.00, Expires 6/17/22 | 125 | 12,500 | (31,375 | ) | ||||||||||||||
iShares iBoxx $ Investment Grade Corporate Bond ETF, November Strike Price $109.00, Expires 11/18/22 | 680 | 68,000 | (140,420 | ) | ||||||||||||||
iShares iBoxx High Yield Corporate Bond ETF, November Strike Price $74.00, Expires 11/18/22 | 680 | 68,000 | (109,140 | ) | ||||||||||||||
iShares Russell 2000 ETF, June Strike Price $169.00, Expires 6/17/22 | 167 | 16,700 | (14,362 | ) | ||||||||||||||
Kohl’s Corp., July Strike Price $30.00, Expires 7/15/22 | 385 | 38,500 | (54,285 | ) | ||||||||||||||
Kohl’s Corp., July Strike Price $47.50, Expires 7/15/22 | 90 | 9,000 | (86,850 | ) | ||||||||||||||
Kohl’s Corp., October Strike Price $30.00, Expires 10/21/22 | 38 | 3,800 | (10,450 | ) | ||||||||||||||
Safehold Inc., June Strike Price $35.00, Expires 6/17/22 | 58 | 5,800 | (1,740 | ) | ||||||||||||||
SPDR S&P 500 ETF Trust, November Strike Price $320.00, Expires 11/18/22 | 680 | 68,000 | (379,440 | ) | ||||||||||||||
Tronox Holdings PLC, August Strike Price $16.00, Expires 8/19/22 | 39 | 3,900 | (3,510 | ) | ||||||||||||||
Twitter Inc., October Strike Price $33.00, Expires 10/21/22 | 72 | 7,200 | (21,924 | ) | ||||||||||||||
Twitter Inc., January Strike Price $33.00, Expires 1/20/23 | 31 | 3,100 | (12,555 | ) | ||||||||||||||
U.S. Treasury 10 Yr. Note, June Strike Price $116.50, Expires 6/24/22 | 120 | 120,000 | (15,000 | ) | ||||||||||||||
Utilities Select Sector SPDR Fund, June Strike Price $68.00, Expires 6/17/22 | 1,471 | 147,100 | (14,710 | ) | ||||||||||||||
Vodafone Group PLC, August Strike Price 1.00 GBP, Expires 8/19/22 | 216 | 216,000 | (1,361 | ) | ||||||||||||||
Vodafone Group PLC, August Strike Price 1.10 GBP, Expires 8/19/22 | 381 | 381,000 | (7,201 | ) | ||||||||||||||
|
| |||||||||||||||||
| (1,775,548 | ) | |||||||||||||||||
|
| |||||||||||||||||
| Puts – Over-the-Counter (0.0)%† | ||||||||||||||||||
DAX Index, Counterparty CITI, June Strike Price $11,900.00, Expires 6/17/22 | 28 | 2,800 | (518 | ) | ||||||||||||||
|
| |||||||||||||||||
| Currency Options (0.0)%† | ||||||||||||||||||
EUR/USD, Counterparty JPHQ, September Strike Price 1.00 EUR, Expires 9/30/22 | 1 | 81,450 | EUR | (4,492 | ) | |||||||||||||
|
| |||||||||||||||||
Total Options Written (Premiums Received $2,077,957) | (1,966,832 | ) | ||||||||||||||||
|
| |||||||||||||||||
| Country | Shares | |||||||||||||||||
| x | Securities Sold Short (17.7)% | |||||||||||||||||
| Common Stocks (5.9)% | ||||||||||||||||||
| Aerospace & Defense (0.0)%† | ||||||||||||||||||
Kaman Corp. | United States | 5,880 | (212,915 | ) | ||||||||||||||
Parsons Corp. | United States | 591 | (23,073 | ) | ||||||||||||||
Virgin Galactic Holdings Inc. | United States | 29,354 | (205,771 | ) | ||||||||||||||
|
| |||||||||||||||||
| (441,759 | ) | |||||||||||||||||
|
| |||||||||||||||||
| Air Freight & Logistics (0.1)% | ||||||||||||||||||
GXO Logistics Inc. | United States | 735 | (39,889 | ) | ||||||||||||||
United Parcel Service Inc., B | United States | 4,805 | (875,711 | ) | ||||||||||||||
|
| |||||||||||||||||
| (915,600 | ) | |||||||||||||||||
|
| |||||||||||||||||
| Airlines (0.2)% | ||||||||||||||||||
American Airlines Group Inc. | United States | 38,876 | (694,714 | ) | ||||||||||||||
Cathay Pacific Airways Ltd. | Hong Kong | 698,700 | (730,426 | ) | ||||||||||||||
Copa Holdings SA, A | Panama | 14,202 | (1,004,081 | ) | ||||||||||||||
| franklintempleton.com | Annual Report | 65 | ||||||||
FRANKLIN ALTERNATIVE STRATEGIES FUNDS
CONSOLIDATED SCHEDULE OF INVESTMENTS
Franklin K2 Alternative Strategies Fund (continued)
| Country | Shares | Value | ||||||||||||||||
| x | Securities Sold Short (continued) | |||||||||||||||||
| Common Stocks (continued) | ||||||||||||||||||
| Airlines (continued) | ||||||||||||||||||
GOL Linhas Aereas Inteligentes SA, ADR | Brazil | 13,987 | $ | (85,181 | ) | |||||||||||||
Jetblue Airways Corp. | United States | 1,982 | (21,287 | ) | ||||||||||||||
|
| |||||||||||||||||
| (2,535,689 | ) | |||||||||||||||||
|
| |||||||||||||||||
| Auto Components (0.1)% | ||||||||||||||||||
Luminar Technologies Inc., A | United States | 32,250 | (333,465 | ) | ||||||||||||||
Patrick Industries Inc. | United States | 1,242 | (74,656 | ) | ||||||||||||||
Quantumscape Corp., A | United States | 17,167 | (219,566 | ) | ||||||||||||||
|
| |||||||||||||||||
| (627,687 | ) | |||||||||||||||||
|
| |||||||||||||||||
| Automobiles (0.2)% | ||||||||||||||||||
Fisker Inc. | United States | 54,222 | (562,824 | ) | ||||||||||||||
Li Auto Inc., ADR | China | 23,886 | (598,822 | ) | ||||||||||||||
Lucid Group Inc. | United States | 29,504 | (595,391 | ) | ||||||||||||||
NIO Inc., ADR | China | 3,200 | (55,648 | ) | ||||||||||||||
Tesla Inc. | United States | 498 | (377,614 | ) | ||||||||||||||
|
| |||||||||||||||||
| (2,190,299 | ) | |||||||||||||||||
|
| |||||||||||||||||
| Banks (0.0)%† | ||||||||||||||||||
Hope Bancorp Inc. | United States | 9,255 | (134,938 | ) | ||||||||||||||
|
| |||||||||||||||||
| Biotechnology (0.4)% | ||||||||||||||||||
Ascendis Pharma A/S, ADR | Denmark | 1,175 | (99,299 | ) | ||||||||||||||
Avid Bioservices Inc. | United States | 28,841 | (385,604 | ) | ||||||||||||||
Coherus Biosciences Inc. | United States | 33,746 | (247,696 | ) | ||||||||||||||
Dynavax Technologies Corp. | United States | 118,394 | (1,404,153 | ) | ||||||||||||||
Global Blood Therapeutics Inc. | United States | 2,530 | (63,098 | ) | ||||||||||||||
Gossamer Bio Inc. | United States | 33,305 | (234,800 | ) | ||||||||||||||
Insmed Inc. | United States | 29,213 | (549,789 | ) | ||||||||||||||
Intercept Pharmaceuticals Inc. | United States | 49,868 | (902,611 | ) | ||||||||||||||
Ionis Pharmaceuticals Inc. | United States | 3,061 | (111,788 | ) | ||||||||||||||
Karyopharm Therapeutics Inc. | United States | 26,674 | (167,513 | ) | ||||||||||||||
Mannkind Corp. | United States | 216,430 | (904,677 | ) | ||||||||||||||
Pharming Group NV | Netherlands | 37,962 | (31,234 | ) | ||||||||||||||
Travere Therapeutics Inc. | United States | 20,805 | (484,964 | ) | ||||||||||||||
|
| |||||||||||||||||
| (5,587,226 | ) | |||||||||||||||||
|
| |||||||||||||||||
| Capital Markets (0.2)% | ||||||||||||||||||
Ares Capital Corp. | United States | 74,136 | (1,436,756 | ) | ||||||||||||||
Owl Rock Capital Corp. | United States | 54,359 | (737,108 | ) | ||||||||||||||
|
| |||||||||||||||||
| (2,173,864 | ) | |||||||||||||||||
|
| |||||||||||||||||
| Chemicals (0.2)% | ||||||||||||||||||
Albemarle Corp. | United States | 2,553 | (664,852 | ) | ||||||||||||||
Amyris Inc. | United States | 102,935 | (262,484 | ) | ||||||||||||||
Danimer Scientific Inc. | United States | 41,311 | (181,355 | ) | ||||||||||||||
Livent Corp. | United States | 6,915 | (219,828 | ) | ||||||||||||||
The Sherwin-Williams Co. | United States | 3,412 | (914,553 | ) | ||||||||||||||
|
| |||||||||||||||||
| (2,243,072 | ) | |||||||||||||||||
|
| |||||||||||||||||
| Communications Equipment (0.2)% | ||||||||||||||||||
Adtran Inc. | United States | 103,819 | (1,923,766 | ) | ||||||||||||||
|
| |||||||||||||||||
| Construction & Engineering (0.0)%† | ||||||||||||||||||
Granite Construction Inc. | United States | 13,489 | (440,416 | ) | ||||||||||||||
|
| |||||||||||||||||
| Consumer Finance (0.1)% | ||||||||||||||||||
EZCORP Inc., A | United States | 53,938 | (408,850 | ) | ||||||||||||||
LendingTree Inc. | United States | 259 | (16,345 | ) | ||||||||||||||
| 66 | Annual Report | franklintempleton.com | ||||||||
FRANKLIN ALTERNATIVE STRATEGIES FUNDS
CONSOLIDATED SCHEDULE OF INVESTMENTS
Franklin K2 Alternative Strategies Fund (continued)
| Country | Shares | Value | ||||||||||||||||
| x | Securities Sold Short (continued) | |||||||||||||||||
| Common Stocks (continued) | ||||||||||||||||||
| Consumer Finance (continued) | ||||||||||||||||||
PRA Group Inc. | United States | 17,553 | $ | (649,461 | ) | |||||||||||||
Upstart Holdings Inc. | United States | 599 | (30,190 | ) | ||||||||||||||
Zip Co. Ltd. | Australia | 23,000 | (15,018 | ) | ||||||||||||||
|
| |||||||||||||||||
| (1,119,864 | ) | |||||||||||||||||
|
| |||||||||||||||||
| Diversified Consumer Services (0.0)%† | ||||||||||||||||||
Chegg Inc. | United States | 1,670 | (32,498 | ) | ||||||||||||||
|
| |||||||||||||||||
| Diversified Telecommunication Services (0.0)%† | ||||||||||||||||||
Bandwidth Inc., A | United States | 2,200 | (46,288 | ) | ||||||||||||||
Radius Global Infrastructure Inc., A | United States | 36,423 | (542,703 | ) | ||||||||||||||
|
| |||||||||||||||||
| (588,991 | ) | |||||||||||||||||
|
| |||||||||||||||||
| Electric Utilities (0.4)% | ||||||||||||||||||
American Electric Power Co. Inc. | United States | 8,635 | (881,029 | ) | ||||||||||||||
NRG Energy Inc. | United States | 23,651 | (1,088,892 | ) | ||||||||||||||
The Southern Co. | United States | 47,417 | (3,587,570 | ) | ||||||||||||||
|
| |||||||||||||||||
| (5,557,491 | ) | |||||||||||||||||
|
| |||||||||||||||||
| Electrical Equipment (0.3)% | ||||||||||||||||||
Array Technologies Inc. | United States | 26,156 | (289,808 | ) | ||||||||||||||
Blink Charging Co. | United States | 11,845 | (188,691 | ) | ||||||||||||||
Bloom Energy Corp., A | United States | 29,191 | (511,426 | ) | ||||||||||||||
Chargepoint Holdings Inc. | United States | 34,094 | (436,062 | ) | ||||||||||||||
Rockwell Automation Inc. | United States | 8,653 | (1,844,820 | ) | ||||||||||||||
|
| |||||||||||||||||
| (3,270,807 | ) | |||||||||||||||||
|
| |||||||||||||||||
| Electronic Equipment, Instruments & Components (0.1)% | ||||||||||||||||||
II-VI Inc. | United States | 5,256 | (328,500 | ) | ||||||||||||||
Itron Inc. | United States | 12,389 | (639,396 | ) | ||||||||||||||
OSI Systems Inc. | United States | 77 | (6,462 | ) | ||||||||||||||
PAR Technology Corp. | United States | 8,340 | (313,417 | ) | ||||||||||||||
Vishay Intertechnology Inc. | United States | 10,759 | (219,914 | ) | ||||||||||||||
|
| |||||||||||||||||
| (1,507,689 | ) | |||||||||||||||||
|
| |||||||||||||||||
| Energy Equipment & Services (0.1)% | ||||||||||||||||||
Helix Energy Solutions Group Inc. | United States | 150,058 | (696,269 | ) | ||||||||||||||
|
| |||||||||||||||||
| Entertainment (0.2)% | ||||||||||||||||||
Cinemark Holdings Inc. | United States | 67,002 | (1,137,694 | ) | ||||||||||||||
The Marcus Corp. | United States | 60,949 | (955,071 | ) | ||||||||||||||
Sea Ltd., ADR | Taiwan | 1,955 | (161,600 | ) | ||||||||||||||
Spotify Technology SA | United States | 419 | (47,251 | ) | ||||||||||||||
|
| |||||||||||||||||
| (2,301,616 | ) | |||||||||||||||||
|
| |||||||||||||||||
| Equity Real Estate Investment Trusts (REITs) (0.1)% | ||||||||||||||||||
Braemar Hotels & Resorts Inc. | United States | 59,633 | (345,871 | ) | ||||||||||||||
Pebblebrook Hotel Trust | United States | 33,493 | (753,928 | ) | ||||||||||||||
Summit Hotel Properties Inc. | United States | 22,458 | (196,283 | ) | ||||||||||||||
|
| |||||||||||||||||
| (1,296,082 | ) | |||||||||||||||||
|
| |||||||||||||||||
| Food & Staples Retailing (0.1)% | ||||||||||||||||||
The Chefs’ Warehouse Inc. | United States | 37,931 | (1,355,275 | ) | ||||||||||||||
|
| |||||||||||||||||
| Gas Utilities (0.2)% | ||||||||||||||||||
Atmos Energy Corp. | United States | 22,749 | (2,645,936 | ) | ||||||||||||||
|
| |||||||||||||||||
| Health Care Equipment & Supplies (0.3)% | ||||||||||||||||||
Cutera Inc. | United States | 24,574 | (1,105,584 | ) | ||||||||||||||
Mesa Laboratories Inc. | United States | 831 | (173,887 | ) | ||||||||||||||
| franklintempleton.com | Annual Report | 67 | ||||||||
FRANKLIN ALTERNATIVE STRATEGIES FUNDS
CONSOLIDATED SCHEDULE OF INVESTMENTS
Franklin K2 Alternative Strategies Fund (continued)
| Country | Shares | Value | ||||||||||||||||
| x | Securities Sold Short (continued) | |||||||||||||||||
| Common Stocks (continued) | ||||||||||||||||||
| Health Care Equipment & Supplies (continued) | ||||||||||||||||||
NuVasive Inc. | United States | 11,292 | $ | (648,274 | ) | |||||||||||||
Tandem Diabetes Care Inc. | United States | 2,650 | (180,650 | ) | ||||||||||||||
Varex Imaging Corp. | United States | 49,695 | (1,144,973 | ) | ||||||||||||||
|
| |||||||||||||||||
| (3,253,368 | ) | |||||||||||||||||
|
| |||||||||||||||||
| Health Care Providers & Services (0.0)%† | ||||||||||||||||||
PetIQ Inc., A | United States | 12,940 | (222,050 | ) | ||||||||||||||
|
| |||||||||||||||||
| Health Care Technology (0.0)%† | ||||||||||||||||||
Evolent Health Inc., A | United States | 12,695 | (357,110 | ) | ||||||||||||||
|
| |||||||||||||||||
| Hotels, Restaurants & Leisure (0.1)% | ||||||||||||||||||
Airbnb Inc., A | United States | 180 | (21,757 | ) | ||||||||||||||
Light & Wonder Inc. | United States | 2,262 | (119,434 | ) | ||||||||||||||
Norwegian Cruise Line Holdings Ltd. | United States | 39,122 | (626,343 | ) | ||||||||||||||
Royal Caribbean Cruises Ltd. | United States | 9,621 | (558,691 | ) | ||||||||||||||
|
| |||||||||||||||||
| (1,326,225 | ) | |||||||||||||||||
|
| |||||||||||||||||
| Insurance (0.0)%† | ||||||||||||||||||
HCI Group Inc. | United States | 3,971 | (269,909 | ) | ||||||||||||||
|
| |||||||||||||||||
| Interactive Media & Services (0.0)%† | ||||||||||||||||||
fuboTV Inc. | United States | 2,802 | (9,219 | ) | ||||||||||||||
Snap Inc., A | United States | 20,677 | (291,752 | ) | ||||||||||||||
|
| |||||||||||||||||
| (300,971 | ) | |||||||||||||||||
|
| |||||||||||||||||
| Internet & Direct Marketing Retail (0.1)% | ||||||||||||||||||
| e | Delivery Hero SE, 144A | Saudi Arabia | 2,949 | (113,738 | ) | |||||||||||||
Fiverr International Ltd. | Israel | 1,865 | (78,908 | ) | ||||||||||||||
Groupon Inc., A | United States | 6,854 | (105,894 | ) | ||||||||||||||
| e | Just Eat Takeaway.Com NV, 144A | United Kingdom | 589 | (13,108 | ) | |||||||||||||
Porch Group Inc. | United States | 36,208 | (149,177 | ) | ||||||||||||||
Wayfair Inc., A | United States | 594 | (35,278 | ) | ||||||||||||||
Xometry Inc., A | United States | 9,996 | (339,964 | ) | ||||||||||||||
|
| |||||||||||||||||
| (836,067 | ) | |||||||||||||||||
|
| |||||||||||||||||
| IT Services (0.1)% | ||||||||||||||||||
Affirm Holdings Inc., A | United States | 1,820 | (51,870 | ) | ||||||||||||||
Digitalocean Holdings Inc. | United States | 6,225 | (304,091 | ) | ||||||||||||||
i3 Verticals Inc., A | United States | 9,812 | (228,816 | ) | ||||||||||||||
Repay Holdings Corp., A | United States | 13,846 | (172,383 | ) | ||||||||||||||
|
| |||||||||||||||||
| (757,160 | ) | |||||||||||||||||
|
| |||||||||||||||||
| Life Sciences Tools & Services (0.0)%† | ||||||||||||||||||
Inotiv Inc. | United States | 5,099 | (78,015 | ) | ||||||||||||||
|
| |||||||||||||||||
| Machinery (0.1)% | ||||||||||||||||||
Caterpillar Inc. | United States | 4,081 | (880,884 | ) | ||||||||||||||
The Greenbrier Cos. Inc. | United States | 9,254 | (385,059 | ) | ||||||||||||||
NFI Group Inc. | Canada | 2,961 | (28,326 | ) | ||||||||||||||
|
| |||||||||||||||||
| (1,294,269 | ) | |||||||||||||||||
|
| |||||||||||||||||
| Marine (0.4)% | ||||||||||||||||||
A.P. Moeller-Maersk AS, B | Denmark | 708 | (2,074,711 | ) | ||||||||||||||
Eagle Bulk Shipping Inc. | United States | 27,089 | (1,984,540 | ) | ||||||||||||||
ZIM Integrated Shipping Services Ltd. | Israel | 17,503 | (1,114,416 | ) | ||||||||||||||
|
| |||||||||||||||||
| (5,173,667 | ) | |||||||||||||||||
|
| |||||||||||||||||
| 68 | Annual Report | franklintempleton.com | ||||||||
FRANKLIN ALTERNATIVE STRATEGIES FUNDS
CONSOLIDATED SCHEDULE OF INVESTMENTS
Franklin K2 Alternative Strategies Fund (continued)
| Country | Shares | Value | ||||||||||||||||
| x | Securities Sold Short (continued) | |||||||||||||||||
| Common Stocks (continued) | ||||||||||||||||||
| Media (0.1)% | ||||||||||||||||||
Dish Network Corp., A | United States | 6,909 | $ | (157,733 | ) | |||||||||||||
Magnite Inc. | United States | 2,628 | (28,882 | ) | ||||||||||||||
Paramount Global, B | United States | 3,700 | (127,021 | ) | ||||||||||||||
Sirius XM Holdings Inc. | United States | 139,795 | (894,688 | ) | ||||||||||||||
Techtarget Inc. | United States | 4,627 | (328,933 | ) | ||||||||||||||
|
| |||||||||||||||||
| (1,537,257 | ) | |||||||||||||||||
|
| |||||||||||||||||
| Metals & Mining (0.3)% | ||||||||||||||||||
Century Aluminum Co. | United States | 21,312 | (251,482 | ) | ||||||||||||||
Ivanhoe Mines Ltd., A | Canada | 76,175 | (580,565 | ) | ||||||||||||||
Lithium Americas Corp. | Canada | 11,612 | (284,842 | ) | ||||||||||||||
MP Materials Corp. | United States | 13,708 | (540,506 | ) | ||||||||||||||
United States Steel Corp. | United States | 108,663 | (2,724,181 | ) | ||||||||||||||
|
| |||||||||||||||||
| (4,381,576 | ) | |||||||||||||||||
|
| |||||||||||||||||
| Mortgage Real Estate Investment Trusts (REITs) (0.2)% | ||||||||||||||||||
Arbor Realty Trust Inc. | United States | 41,684 | (684,451 | ) | ||||||||||||||
Hannon Armstrong Sustainable Infrastructure Capital Inc. | United States | 3,688 | (140,402 | ) | ||||||||||||||
KKR Real Estate Finance Trust Inc. | United States | 10,614 | (216,738 | ) | ||||||||||||||
PennyMac Mortgage Investment Trust | United States | 31,245 | (505,544 | ) | ||||||||||||||
Redwood Trust Inc. | United States | 2,270 | (23,154 | ) | ||||||||||||||
Starwood Property Trust Inc. | United States | 9,698 | (231,685 | ) | ||||||||||||||
Two Harbors Investment Corp. | United States | 52,276 | (279,154 | ) | ||||||||||||||
|
| |||||||||||||||||
| (2,081,128 | ) | |||||||||||||||||
|
| |||||||||||||||||
| Multiline Retail (0.0)%† | ||||||||||||||||||
Kohl’s Corp. | United States | 5,726 | (230,872 | ) | ||||||||||||||
|
| |||||||||||||||||
| Oil, Gas & Consumable Fuels (0.1)% | ||||||||||||||||||
CNX Resources Corp. | United States | 6,718 | (145,915 | ) | ||||||||||||||
Kinder Morgan Inc. | United States | 69,350 | (1,365,501 | ) | ||||||||||||||
|
| |||||||||||||||||
| (1,511,416 | ) | |||||||||||||||||
|
| |||||||||||||||||
| Personal Products (0.0)%† | ||||||||||||||||||
The Beauty Health Co. | United States | 16,830 | (240,164 | ) | ||||||||||||||
Herbalife Nutrition Ltd. | United States | 770 | (16,778 | ) | ||||||||||||||
|
| |||||||||||||||||
| (256,942 | ) | |||||||||||||||||
|
| |||||||||||||||||
| Pharmaceuticals (0.1)% | ||||||||||||||||||
Aerie Pharmaceuticals Inc. | United States | 4,131 | (21,399 | ) | ||||||||||||||
Avadel Pharmaceuticals PLC, ADR | United States | 69,587 | (153,787 | ) | ||||||||||||||
Canopy Growth Corp. | Canada | 1,317 | (6,591 | ) | ||||||||||||||
Collegium Pharmaceutical Inc. | United States | 20,856 | (325,771 | ) | ||||||||||||||
Innoviva Inc. | United States | 31,913 | (484,120 | ) | ||||||||||||||
Omeros Corp. | United States | 28,762 | (71,330 | ) | ||||||||||||||
Pacira Biosciences Inc. | United States | 5,621 | (355,528 | ) | ||||||||||||||
Revance Therapeutics Inc. | United States | 21,253 | (290,741 | ) | ||||||||||||||
|
| |||||||||||||||||
| (1,709,267 | ) | |||||||||||||||||
|
| |||||||||||||||||
| Professional Services (0.0)%† | ||||||||||||||||||
Upwork Inc. | United States | 1,365 | (24,911 | ) | ||||||||||||||
|
| |||||||||||||||||
| Real Estate Management & Development (0.0)%† | ||||||||||||||||||
Opendoor Technologies Inc. | United States | 38,822 | (280,683 | ) | ||||||||||||||
Realogy Holdings Corp. | United States | 13,985 | (173,134 | ) | ||||||||||||||
Redfin Corp. | United States | 4,823 | (47,266 | ) | ||||||||||||||
|
| |||||||||||||||||
| (501,083 | ) | |||||||||||||||||
|
| |||||||||||||||||
| franklintempleton.com | Annual Report | 69 | ||||||||
FRANKLIN ALTERNATIVE STRATEGIES FUNDS
CONSOLIDATED SCHEDULE OF INVESTMENTS
Franklin K2 Alternative Strategies Fund (continued)
| Country | Shares | Value | ||||||||||||||||
| x | Securities Sold Short (continued) | |||||||||||||||||
| Common Stocks (continued) | ||||||||||||||||||
| Road & Rail (0.2)% | ||||||||||||||||||
J.B. Hunt Transport Services Inc. | United States | 5,108 | $ | (881,539 | ) | |||||||||||||
Old Dominion Freight Line Inc. | United States | 5,338 | (1,378,485 | ) | ||||||||||||||
|
| |||||||||||||||||
| (2,260,024 | ) | |||||||||||||||||
|
| |||||||||||||||||
| Semiconductors & Semiconductor Equipment (0.1)% | ||||||||||||||||||
ams AG | Austria | 10,167 | (124,917 | ) | ||||||||||||||
Sunpower Corp., A | United States | 13,966 | (246,779 | ) | ||||||||||||||
Veeco Instruments Inc. | United States | 38,638 | (828,013 | ) | ||||||||||||||
|
| |||||||||||||||||
| (1,199,709 | ) | |||||||||||||||||
|
| |||||||||||||||||
| Software (0.2)% | ||||||||||||||||||
Alteryx Inc., A | United States | 956 | (53,201 | ) | ||||||||||||||
Avaya Holdings Corp. | United States | 21,665 | (79,944 | ) | ||||||||||||||
Bentley Systems Inc., B | United States | 4,854 | (166,880 | ) | ||||||||||||||
Blackline Inc. | United States | 1,492 | (109,244 | ) | ||||||||||||||
Coupa Software Inc. | United States | 1,115 | (76,701 | ) | ||||||||||||||
Dye & Durham Ltd. | Canada | 6,129 | (112,758 | ) | ||||||||||||||
Envestnet Inc. | United States | 1,469 | (97,865 | ) | ||||||||||||||
Everbridge Inc. | United States | 2,041 | (84,314 | ) | ||||||||||||||
Mitek Systems Inc. | United States | 14,953 | (134,876 | ) | ||||||||||||||
NortonLifeLock Inc. | United States | 6,862 | (167,021 | ) | ||||||||||||||
Nutanix Inc., A | United States | 1,198 | (19,408 | ) | ||||||||||||||
Palo Alto Networks Inc. | United States | 3,730 | (1,875,369 | ) | ||||||||||||||
RingCentral Inc., A | United States | 529 | (33,401 | ) | ||||||||||||||
Veritone Inc. | United States | 13,279 | (103,311 | ) | ||||||||||||||
|
| |||||||||||||||||
| (3,114,293 | ) | |||||||||||||||||
|
| |||||||||||||||||
| Specialty Retail (0.1)% | ||||||||||||||||||
Guess? Inc. | United States | 40,605 | (847,020 | ) | ||||||||||||||
Shift Technologies Inc. | United States | 120,317 | (125,130 | ) | ||||||||||||||
|
| |||||||||||||||||
| (972,150 | ) | |||||||||||||||||
|
| |||||||||||||||||
| Trading Companies & Distributors (0.1)% | ||||||||||||||||||
United Rentals Inc. | United States | 2,822 | (841,464 | ) | ||||||||||||||
|
| |||||||||||||||||
| Water Utilities (0.1)% | ||||||||||||||||||
American Water Works Co. Inc. | United States | 5,703 | (862,579 | ) | ||||||||||||||
|
| |||||||||||||||||
Total Common Stocks (Proceeds $90,020,090) | (74,940,316 | ) | ||||||||||||||||
|
| |||||||||||||||||
| Exchange Traded Funds (9.8)% | ||||||||||||||||||
ARK Innovation ETF | United States | 19,356 | (853,406 | ) | ||||||||||||||
Health Care Select Sector SPDR Fund | United States | 36,980 | (4,889,865 | ) | ||||||||||||||
Invesco QQQ Series 1 ETF | United States | 12,898 | (3,976,195 | ) | ||||||||||||||
Invesco Solar ETF | United States | 15,456 | (1,098,922 | ) | ||||||||||||||
iShares Iboxx $ High Yield Corporate Bond ETF | United States | 121,194 | (9,634,923 | ) | ||||||||||||||
iShares Nasdaq Biotechnology ETF | United States | 18,591 | (2,169,012 | ) | ||||||||||||||
iShares PHLX Semiconductor ETF | United States | 11,732 | (4,999,474 | ) | ||||||||||||||
iShares Russell 1000 ETF | United States | 245,418 | (55,805,599 | ) | ||||||||||||||
iShares Russell 2000 Growth ETF | United States | 47,608 | (10,496,136 | ) | ||||||||||||||
iShares Russell 2000 Value ETF | United States | 5,494 | (833,385 | ) | ||||||||||||||
iShares Russell Mid-Cap Growth ETF | United States | 303,377 | (26,014,578 | ) | ||||||||||||||
SPDR Bloomberg High Yield Bond ETF | United States | 23,563 | (2,323,783 | ) | ||||||||||||||
SPDR S&P 500 ETF Trust | United States | 3,797 | (1,567,895 | ) | ||||||||||||||
|
| |||||||||||||||||
Total Exchange Traded Funds (Proceeds $137,763,825) | (124,663,173 | ) | ||||||||||||||||
|
| |||||||||||||||||
| 70 | Annual Report | franklintempleton.com | ||||||||
FRANKLIN ALTERNATIVE STRATEGIES FUNDS
CONSOLIDATED SCHEDULE OF INVESTMENTS
Franklin K2 Alternative Strategies Fund (continued)
| Country | Principal Amount* | Value | ||||||||||||||||
| x | Securities Sold Short (continued) | |||||||||||||||||
| Corporate Bonds and Notes (0.8)% | ||||||||||||||||||
| Airlines (0.0)%† | ||||||||||||||||||
| e | Air France-KLM, senior note, Reg S, 3.00%, 7/01/24 | France | 200,000 | EUR | $ | (211,484 | ) | |||||||||||
|
| |||||||||||||||||
| Auto Components (0.0)%† | ||||||||||||||||||
| e | Wheel Pros Inc., senior note, 144A, 6.50%, 5/15/29 | United States | 258,000 | (184,401 | ) | |||||||||||||
|
| |||||||||||||||||
| Automobiles (0.1)% | ||||||||||||||||||
Ford Motor Credit Co. LLC, senior note, 4.95%, 5/28/27 | United States | 906,000 | (902,885 | ) | ||||||||||||||
General Motors Co., senior bond, 4.20%, 10/01/27 | United States | 146,000 | (141,634 | ) | ||||||||||||||
|
| |||||||||||||||||
| (1,044,519 | ) | |||||||||||||||||
|
| |||||||||||||||||
| Banks (0.1)% | ||||||||||||||||||
| e,h | Industrial & Commercial Bank of China Ltd., junior sub. note, Reg S, 3.20% to 9/24/26, FRN thereafter, Perpetual | China | 761,000 | (737,092 | ) | |||||||||||||
|
| |||||||||||||||||
| Construction & Engineering (0.1)% | ||||||||||||||||||
| e | Bouygues SA, senior note, Reg S, 1.125%, 7/24/28 | France | 100,000 | EUR | (101,433 | ) | ||||||||||||
Fluor Corp., senior bond, 4.25%, 9/15/28 | United States | 914,000 | (871,773 | ) | ||||||||||||||
| e | Tutor Perini Corp., senior note, 144A, 6.875%, 5/01/25 | United States | 525,000 | (489,240 | ) | |||||||||||||
|
| |||||||||||||||||
| (1,462,446 | ) | |||||||||||||||||
|
| |||||||||||||||||
| Consumer Finance (0.1)% | ||||||||||||||||||
Onemain Finance Corp., senior note, | United States | 510,000 | (523,132 | ) | ||||||||||||||
3.875%, 9/15/28 | United States | 402,000 | (348,107 | ) | ||||||||||||||
|
| |||||||||||||||||
| (871,239 | ) | |||||||||||||||||
|
| |||||||||||||||||
| Diversified Consumer Services (0.0)%† | ||||||||||||||||||
| e | Paysafe Finance PLC / Paysafe Holdings US Corp., senior secured note, Reg S, 3.00%, 6/15/29 | United States | 144,000 | EUR | (129,586 | ) | ||||||||||||
|
| |||||||||||||||||
| Diversified Financial Services (0.1)% | ||||||||||||||||||
| e | Kronos Acquisition Holdings Inc. / KIK Custom Products Inc., senior note, 144A, 7.00%, 12/31/27 | Canada | 549,000 | (441,635 | ) | |||||||||||||
| e | MPH Acquisition Holdings LLC, senior note, 144A, 5.75%, 11/01/28 | United States | 495,000 | (441,401 | ) | |||||||||||||
|
| |||||||||||||||||
| (883,036 | ) | |||||||||||||||||
|
| |||||||||||||||||
| Diversified Telecommunication Services (0.0)%† | ||||||||||||||||||
| e | Iliad Holding SASU, senior secured note, Reg S, 5.625%, 10/15/28 | France | 338,000 | EUR | (344,222 | ) | ||||||||||||
|
| |||||||||||||||||
| Food & Staples Retailing (0.1)% | ||||||||||||||||||
| e | Chobani LLC / Chobani Finance Corp. Inc., senior note, 144A, 7.50%, 4/15/25 | United States | 519,000 | (491,716 | ) | |||||||||||||
Koninklijke Ahold Delhaize NV, senior bond, 5.70%, 10/01/40 | Netherlands | 603,000 | (655,376 | ) | ||||||||||||||
| e | Sigma Holdco BV, senior note, 144A, 7.875%, 5/15/26 | Netherlands | 86,000 | (59,047 | ) | |||||||||||||
|
| |||||||||||||||||
| (1,206,139 | ) | |||||||||||||||||
|
| |||||||||||||||||
| Health Care Providers & Services (0.0)%† | ||||||||||||||||||
| e | Air Methods Corp., senior note, 144A, 8.00%, 5/15/25 | United States | 235,000 | (162,968 | ) | |||||||||||||
|
| |||||||||||||||||
| Hotels, Restaurants & Leisure (0.0)%† | ||||||||||||||||||
| e | Royal Caribbean Cruises Ltd., senior note, 144A, 5.50%, 4/01/28 | United States | 287,000 | (242,717 | ) | |||||||||||||
|
| |||||||||||||||||
| Leisure Products (0.0)%† | ||||||||||||||||||
Brunswick Corp., senior bond, 4.40%, 9/15/32 | United States | 452,000 | (407,779 | ) | ||||||||||||||
|
| |||||||||||||||||
| Media (0.1)% | ||||||||||||||||||
iHeartCommunications Inc., senior note, 8.375%, 5/01/27 | United States | 407,000 | (382,478 | ) | ||||||||||||||
| e | Scripps Escrow II Inc., senior bond, 144A, 5.375%, 1/15/31 | United States | 145,000 | (127,310 | ) | |||||||||||||
|
| |||||||||||||||||
| (509,788 | ) | |||||||||||||||||
|
| |||||||||||||||||
| franklintempleton.com | Annual Report | 71 | ||||||||
FRANKLIN ALTERNATIVE STRATEGIES FUNDS
CONSOLIDATED SCHEDULE OF INVESTMENTS
Franklin K2 Alternative Strategies Fund (continued)
| Country | Principal Amount* | Value | ||||||||||||||||
| x | Securities Sold Short (continued) | |||||||||||||||||
| Corporate Bonds and Notes (continued) | ||||||||||||||||||
| Oil, Gas & Consumable Fuels (0.0)%† | ||||||||||||||||||
Apache Corp., senior bond, 4.375%, 10/15/28 | United States | 24,000 | $ | (22,982 | ) | |||||||||||||
|
| |||||||||||||||||
| Pharmaceuticals (0.0)%† | ||||||||||||||||||
| e | Bausch Health Cos. Inc., senior secured note, 144A, 6.125%, 2/01/27 | United States | 300,000 | (274,200 | ) | |||||||||||||
Teva Pharmaceutical Finance Netherlands III BV, senior bond, 3.15%, 10/01/26 | Israel | 80,000 | (71,086 | ) | ||||||||||||||
|
| |||||||||||||||||
| (345,286 | ) | |||||||||||||||||
|
| |||||||||||||||||
| Road & Rail (0.0)%† | ||||||||||||||||||
| e | The Go-Ahead Group PLC, senior note, Reg S, 2.50%, 7/06/24 | United Kingdom | 155,000 | GBP | (188,747 | ) | ||||||||||||
|
| |||||||||||||||||
| Specialty Retail (0.1)% | ||||||||||||||||||
| e | At Home Group Inc., senior note, 144A, 7.125%, 7/15/29 | United States | 107,000 | (72,564 | ) | |||||||||||||
| e | Matalan Finance PLC, senior secured note, Reg S, 6.75%, 1/31/23 | United Kingdom | 128,000 | GBP | (138,157 | ) | ||||||||||||
QVC Inc., senior secured note, 4.75%, 2/15/27 | United States | 162,000 | (140,262 | ) | ||||||||||||||
| e | Rent-A-Center Inc., senior note, 144A, 6.375%, 2/15/29 | United States | 519,000 | (455,762 | ) | |||||||||||||
|
| |||||||||||||||||
| (806,745 | ) | |||||||||||||||||
|
| |||||||||||||||||
Total Corporate Bonds and Notes | (9,761,176 | ) | ||||||||||||||||
|
| |||||||||||||||||
| Foreign Government and Agency Securities (0.1)% | ||||||||||||||||||
| e | Government of Italy, senior bond, Reg S, 0.95%, 6/01/32 | Italy | 482,000 | EUR | (422,132 | ) | ||||||||||||
Government of Turkey, | Turkey | 573,000 | (551,750 | ) | ||||||||||||||
senior bond, 7.375%, 2/05/25 | Turkey | 369,000 | (359,975 | ) | ||||||||||||||
senior note, 7.25%, 12/23/23 | Turkey | 437,000 | (438,385 | ) | ||||||||||||||
|
| |||||||||||||||||
Total Foreign Government and Agency Securities | (1,772,242 | ) | ||||||||||||||||
|
| |||||||||||||||||
U.S. Government and Agency Securities (1.1)% | ||||||||||||||||||
U.S. Treasury Bond, | United States | 397,600 | (344,359 | ) | ||||||||||||||
1.875%, 11/15/51 | United States | 1,366,300 | (1,041,377 | ) | ||||||||||||||
2.25%, 2/15/52 | United States | 242,200 | (202,653 | ) | ||||||||||||||
U.S. Treasury Note, | United States | 9,289,000 | (9,286,823 | ) | ||||||||||||||
2.75%, 4/30/27 | United States | 1,866,000 | (1,859,367 | ) | ||||||||||||||
1.875%, 2/15/32 | United States | 358,000 | (328,185 | ) | ||||||||||||||
2.875%, 5/15/32 | United States | 145,000 | (145,204 | ) | ||||||||||||||
|
| |||||||||||||||||
Total U.S. Government and Agency Securities | (13,207,968 | ) | ||||||||||||||||
|
| |||||||||||||||||
Total Securities Sold Short | $ | (224,344,875 | ) | |||||||||||||||
|
| |||||||||||||||||
†Rounds to less than 0.1% of net assets.
*The principal amount is stated in U.S. dollars unless otherwise indicated.
#Notional amount is the number of units specified in the contract, and can include currency units, bushels, shares, pounds, barrels or other units. Currency units are stated in U.S. dollars unless otherwise indicated.
aNon-income producing.
bA portion or all of the security is held in connection with written option contracts open at period end.
cA portion or all of the security is on loan at May 31, 2022. See Note 1(g).
| 72 | Annual Report | franklintempleton.com | ||||||||
FRANKLIN ALTERNATIVE STRATEGIES FUNDS
CONSOLIDATED SCHEDULE OF INVESTMENTS
Franklin K2 Alternative Strategies Fund (continued)
dA portion or all of the security has been segregated as collateral for securities sold short, open swap contracts, open forward exchange contracts, open futures contracts and/or open written option contracts. At May 31, 2022, the aggregate value of these securities and/or cash pledged amounted to $214,955,608, representing 17.0% of net assets.
eSecurity was purchased pursuant to Rule 144A or Regulation S under the Securities Act of 1933. 144A securities may be sold in transactions exempt from registration only to qualified institutional buyers or in public offering registered under the Securities Act of 1933. Regulation S securities cannot be sold in the United States without either an effective registration statement filed pursuant to the Securities Act of 1933, or pursuant to an exemption from registration. At May 31, 2022, the net value of these securities was $279,392,689, representing 22.0% of net assets.
fFair valued using significant unobservable inputs. See Note 14 regarding fair value measurements.
gSee Note 9 regarding investments in Russian securities.
hPerpetual security with no stated maturity date.
iThe coupon rate shown represents the rate at period end.
jIncome may be received in additional securities and/or cash.
kSee Note 7 regarding defaulted securities.
lSee Note 1(i) regarding senior floating rate interests.
mSee Note 11 regarding unfunded loan commitments.
nPrincipal amount is stated in 100 Mexican Peso Units.
oThe coupon rate shown represents the rate inclusive of any caps or floors, if applicable, in effect at period end.
pAdjustable rate security with an interest rate that is not based on a published reference index and spread. The rate is based on the structure of the agreement and current market conditions. The coupon rate shown represents the rate at period end.
qThe rate shown is the annualized seven-day effective yield at period end.
rA portion or all of the security is owned by K2 Holdings Investment Corp., a wholly-owned subsidiary of the Fund. See Note 1(h).
sSee Note 1(g) regarding securities on loan.
tSee Note 3(f) regarding investments in affiliated management investment companies.
uSee Note 1(c) regarding joint repurchase agreement.
vThe security was issued on a discount basis with no stated coupon rate.
wSee Note 1(d) regarding written options.
xSee Note 1(f) regarding securities sold short.
At May 31, 2022, the Fund had the following futures contracts outstanding. See Note 1(d).
| Futures Contracts | ||||||||||||||||||||
| Description | Type | Number of Contracts | Notional Amount* | Expiration Date | Value/Unrealized Appreciation (Depreciation) | |||||||||||||||
| Commodity Contractsa | ||||||||||||||||||||
Aluminum | Long | 11 | $ | 760,031 | 6/13/22 | $ | (93,888 | ) | ||||||||||||
Aluminum | Short | 11 | 760,031 | 6/13/22 | 217,610 | |||||||||||||||
Aluminum | Long | 6 | 418,650 | 9/19/22 | (18,981 | ) | ||||||||||||||
Brent Crude Oil | Long | 9 | 1,040,400 | 6/30/22 | 68,506 | |||||||||||||||
Cocoa | Short | 10 | 219,762 | 7/14/22 | 4,182 | |||||||||||||||
Coffee | Long | 5 | 433,594 | 7/19/22 | 17,442 | |||||||||||||||
Copper | Long | 6 | 1,417,725 | 6/13/22 | (51,972 | ) | ||||||||||||||
Copper | Short | 6 | 1,417,725 | 6/13/22 | 126,969 | |||||||||||||||
Copper | Long | 2 | 214,800 | 7/27/22 | (16,304 | ) | ||||||||||||||
Corn | Long | 34 | 1,280,950 | 7/14/22 | 2,843 | |||||||||||||||
Cotton | Long | 10 | 694,900 | 7/07/22 | 11,682 | |||||||||||||||
Gasoline | Long | 8 | 1,315,843 | 6/30/22 | 114,038 | |||||||||||||||
Gold 100 Oz | Long | 3 | 554,520 | 8/29/22 | (3,527 | ) | ||||||||||||||
Hard Red Winter Wheat | Long | 11 | 641,025 | 7/14/22 | (21,618 | ) | ||||||||||||||
Low Sulphur Gas Oil | Long | 7 | 839,300 | 7/12/22 | 102,014 | |||||||||||||||
Natural Gas | Long | 11 | 895,950 | 6/28/22 | 43,465 | |||||||||||||||
NY Harbor | Long | 5 | 826,350 | 6/30/22 | 52,846 | |||||||||||||||
Silver | Short | 4 | 433,760 | 7/27/22 | 65,896 | |||||||||||||||
Soybean Meal | Long | 14 | 580,720 | 7/14/22 | (52,789 | ) | ||||||||||||||
Soybean Oil | Long | 12 | 561,024 | 7/14/22 | 40,227 | |||||||||||||||
Soybeans | Long | 24 | 2,019,900 | 7/14/22 | 42,145 | |||||||||||||||
Sugar | Long | 30 | 651,840 | 6/30/22 | (12,013 | ) | ||||||||||||||
Wheat | Long | 8 | 435,000 | 7/14/22 | (56,410 | ) | ||||||||||||||
WTI Crude Oil | Long | 9 | 1,032,030 | 6/21/22 | 74,610 | |||||||||||||||
Zinc | Long | 10 | 982,250 | 6/13/22 | 81,313 | |||||||||||||||
| franklintempleton.com | Annual Report | 73 | ||||||||
FRANKLIN ALTERNATIVE STRATEGIES FUNDS
CONSOLIDATED SCHEDULE OF INVESTMENTS
Franklin K2 Alternative Strategies Fund (continued)
| Futures Contracts (continued) | ||||||||||||||||||||
| Description | Type | Number of Contracts | Notional Amount* | Expiration Date | Value/Unrealized Appreciation (Depreciation) | |||||||||||||||
| Commodity Contractsa (continued) | ||||||||||||||||||||
Zinc | Short | 10 | $ | 982,250 | 6/13/22 | $ | (14,431 | ) | ||||||||||||
Zinc | Long | 6 | 587,250 | 9/19/22 | 39,587 | |||||||||||||||
|
| |||||||||||||||||||
| 763,442 | ||||||||||||||||||||
|
| |||||||||||||||||||
| Currency Contractsa | ||||||||||||||||||||
U.S. Dollar Index | Long | 9 | 915,894 | 6/13/22 | 27,805 | |||||||||||||||
|
| |||||||||||||||||||
| Equity Contracts | ||||||||||||||||||||
CAC 40 10 Euro Indexa | Short | 7 | 485,196 | 6/17/22 | (9,046 | ) | ||||||||||||||
CBOE Volatility Index | Long | 10 | 264,123 | 6/15/22 | (20,252 | ) | ||||||||||||||
CBOE Volatility Index | Long | 15 | 416,862 | 7/20/22 | 38,676 | |||||||||||||||
CBOE Volatility Index | Long | 16 | 457,973 | 9/21/22 | 35,054 | |||||||||||||||
CBOE Volatility Index | Long | 21 | 605,900 | 10/19/22 | (18,934 | ) | ||||||||||||||
DAX Indexa | Short | 3 | 1,157,583 | 6/17/22 | (6,059 | ) | ||||||||||||||
DJ EURO STOXX 50 Indexa | Short | 713 | 28,964,308 | 6/17/22 | (1,228,655 | ) | ||||||||||||||
DJIA Mini E-CBOT Indexa | Short | 4 | 659,420 | 6/17/22 | 7,647 | |||||||||||||||
E-Mini Russell 2000a | Short | 36 | 3,351,420 | 6/17/22 | 170,323 | |||||||||||||||
FTSE 100 Indexa | Long | 11 | 1,051,435 | 6/17/22 | 71,533 | |||||||||||||||
FTSE 100 Index | Short | 84 | 8,029,139 | 6/17/22 | (632,742 | ) | ||||||||||||||
FTSE/MIB Index | Short | 3 | 394,659 | 6/17/22 | (26,241 | ) | ||||||||||||||
Hang Seng Indexa | Short | 7 | 954,213 | 6/29/22 | (68,813 | ) | ||||||||||||||
NASDAQ 100 E-Mini Indexa | Short | 4 | 1,011,720 | 6/17/22 | (7,383 | ) | ||||||||||||||
Nikkei 225 Indexa | Long | 2 | 423,506 | 6/09/22 | 22,359 | |||||||||||||||
Nikkei 225 Index | Short | 2 | 423,506 | 6/09/22 | (19,436 | ) | ||||||||||||||
S&P 500 E-Mini Index | Long | 80 | 16,525,000 | 6/17/22 | 687,530 | |||||||||||||||
S&P 500 E-Mini Indexa | Short | 49 | 10,121,562 | 6/17/22 | 62,402 | |||||||||||||||
SGX Nifty 50 | Short | 2 | 66,240 | 6/30/22 | (1,359 | ) | ||||||||||||||
STOXX 600 Banks Index | Short | 118 | 876,618 | 6/17/22 | (64,475 | ) | ||||||||||||||
TOPIX Indexa | Short | 4 | 593,156 | 6/09/22 | (28,519 | ) | ||||||||||||||
VSTOXX | Long | 2 | 5,550 | 6/15/22 | (418 | ) | ||||||||||||||
VSTOXX | Long | 8 | 23,275 | 7/20/22 | (2,672 | ) | ||||||||||||||
VSTOXX | Long | 6 | 17,714 | 8/17/22 | (680 | ) | ||||||||||||||
|
| |||||||||||||||||||
| (1,040,160 | ) | |||||||||||||||||||
|
| |||||||||||||||||||
| Interest Rate Contracts | ||||||||||||||||||||
3 Month EURIBOR | Short | 14 | 3,742,961 | 9/19/22 | 15,753 | |||||||||||||||
3 Month EURIBORa | Short | 77 | 20,354,827 | 6/19/23 | 301,037 | |||||||||||||||
3 Month EURIBOR | Short | 400 | 105,519,284 | 12/18/23 | 149,571 | |||||||||||||||
3 Month SOFR | Long | 20 | 4,862,250 | 3/14/23 | (4,042 | ) | ||||||||||||||
3 Month SOFR | Short | 20 | 4,860,000 | 3/19/24 | 2,458 | |||||||||||||||
10 Yr. Mini JGBa | Short | 10 | 1,162,621 | 6/10/22 | 1,132 | |||||||||||||||
30 Day Federal Funds | Long | 8 | 3,286,930 | 7/29/22 | (5,181 | ) | ||||||||||||||
30 Day Federal Funds | Long | 15 | 6,136,428 | 8/31/22 | (10,605 | ) | ||||||||||||||
30 Day Federal Funds | Short | 22 | 8,964,342 | 10/31/22 | 9,736 | |||||||||||||||
30 Day Federal Funds | Short | 4 | 1,625,713 | 11/30/22 | 4,660 | |||||||||||||||
30 Day Federal Funds | Long | 6 | 2,434,820 | 12/30/22 | (20,886 | ) | ||||||||||||||
30 Day Federal Funds | Short | 41 | 16,619,996 | 1/31/23 | 15,125 | |||||||||||||||
30 Day Federal Funds | Long | 18 | 7,277,082 | 4/28/23 | 4,450 | |||||||||||||||
30 Day Federal Funds | Short | 42 | 16,971,983 | 7/31/23 | (8,578 | ) | ||||||||||||||
90 Day Eurodollar | Long | 272 | 65,800,200 | 3/13/23 | (966,833 | ) | ||||||||||||||
90 Day Eurodollara | Short | 62 | 14,995,475 | 6/19/23 | 120,287 | |||||||||||||||
90 Day Sterlinga | Short | 12 | 3,678,425 | 9/19/23 | 15,363 | |||||||||||||||
Australian 3 Yr. Bond | Short | 221 | 17,248,717 | 6/15/22 | (3,063 | ) | ||||||||||||||
Australian 10 Yr. Bond | Long | 55 | 4,824,034 | 6/15/22 | (13,241 | ) | ||||||||||||||
Australian 10 Yr. Bonda | Short | 33 | 2,894,421 | 6/15/22 | 104,292 | |||||||||||||||
Canadian 10 Yr. Bonda | Short | 42 | 4,217,433 | 9/20/22 | 43,030 | |||||||||||||||
Euro-BOBLa | Short | 38 | 5,160,150 | 6/08/22 | 158,417 | |||||||||||||||
| 74 | Annual Report | franklintempleton.com | ||||||||
FRANKLIN ALTERNATIVE STRATEGIES FUNDS
CONSOLIDATED SCHEDULE OF INVESTMENTS
Franklin K2 Alternative Strategies Fund (continued)
| Futures Contracts (continued) | ||||||||||||||||||||
| Description | Type | Number of Contracts | Notional Amount* | Expiration Date | Value/Unrealized Appreciation (Depreciation) | |||||||||||||||
| Interest Rate Contracts (continued) | ||||||||||||||||||||
Euro-BOBLa | Short | 13 | $ | 1,747,590 | 9/08/22 | $ | (891 | ) | ||||||||||||
Euro-Bunda | Short | 19 | 3,091,643 | 6/08/22 | 88,996 | |||||||||||||||
Euro-SCHATZa | Short | 104 | 12,294,816 | 6/08/22 | 40,794 | |||||||||||||||
Euro-SCHATZa | Short | 34 | 3,992,996 | 9/08/22 | (158 | ) | ||||||||||||||
Japanese 10 Yr. Bonda | Short | 16 | 18,599,448 | 6/13/22 | (1,370 | ) | ||||||||||||||
Korean 3 Yr. Bond | Short | 38 | 3,238,232 | 6/21/22 | 65,647 | |||||||||||||||
Long Gilta | Short | 26 | 3,799,483 | 9/28/22 | 61,638 | |||||||||||||||
U.S. Treasury 2 Yr. Notea | Short | 41 | 8,655,164 | 9/30/22 | (6,439 | ) | ||||||||||||||
U.S. Treasury 5 Yr. Notea | Short | 270 | 30,497,344 | 9/30/22 | 76,884 | |||||||||||||||
U.S. Treasury 10 Yr. Notea | Short | 34 | 4,061,406 | 9/21/22 | 7,026 | |||||||||||||||
U.S. Treasury 10 Yr. Ultra | Short | 146 | 18,758,719 | 9/21/22 | 167,399 | |||||||||||||||
U.S. Treasury Long Bond | Long | 6 | 836,625 | 9/21/22 | (10,840 | ) | ||||||||||||||
U.S. Treasury Long Bonda | Short | 21 | 2,928,188 | 9/21/22 | 16,553 | |||||||||||||||
U.S. Treasury Ultra Bond | Short | 25 | 3,893,750 | 9/21/22 | 71,246 | |||||||||||||||
|
| |||||||||||||||||||
| 489,367 | ||||||||||||||||||||
|
| |||||||||||||||||||
Total Futures Contracts |
| $ | 240,454 | |||||||||||||||||
|
| |||||||||||||||||||
*As of period end.
aA portion or all of the contracts are owned by K2 Holdings Investment Corp., a wholly-owned subsidiary of the Fund. See Note 1(h).
At May 31, 2022, the Fund had the following forward exchange contracts outstanding. See Note 1(d).
| Forward Exchange Contracts | ||||||||||||||||||||||||||||||||
| Currency | Counterpartya | Type | Quantity | Contract Amount* | Settlement Date | Unrealized Appreciation | Unrealized Depreciation | |||||||||||||||||||||||||
| OTC Forward Exchange Contracts | ||||||||||||||||||||||||||||||||
Indian Rupee | JPHQ | Buy | 52,411,658 | 675,000 | 6/02/22 | $ | 93 | $ | — | |||||||||||||||||||||||
Indian Rupee | JPHQ | Sell | 51,831,360 | 675,000 | 6/02/22 | 7,382 | — | |||||||||||||||||||||||||
Indian Rupee | CITI | Sell | 19,196,500 | 250,000 | 6/06/22 | 2,897 | — | |||||||||||||||||||||||||
Indian Rupee | JPHQ | Buy | 19,280,750 | 250,000 | 6/06/22 | — | (1,812 | ) | ||||||||||||||||||||||||
Romanian Leu | JPHQ | Sell | 5,860,925 | 1,164,098 | EUR | 6/07/22 | 20,646 | (42,080 | ) | |||||||||||||||||||||||
Romanian Leu | JPHQ | Sell | 1,189,324 | 235,902 | EUR | 6/08/22 | 885 | (5,526 | ) | |||||||||||||||||||||||
Serbian Dinar | JPHQ | Sell | 31,267,062 | 261,277 | EUR | 6/10/22 | 254 | (5,389 | ) | |||||||||||||||||||||||
Japanese Yen | GSCO | Sell | 45,079,335 | 450,000 | CAD | 6/13/22 | 10,270 | (4,887 | ) | |||||||||||||||||||||||
Serbian Dinar | JPHQ | Sell | 31,204,355 | 261,277 | EUR | 6/13/22 | 4,992 | (9,528 | ) | |||||||||||||||||||||||
Canadian Dollar | CITI | Sell | 450,000 | 45,439,740 | JPY | 6/13/22 | 3,801 | (6,383 | ) | |||||||||||||||||||||||
Japanese Yen | JPHQ | Sell | 360,405 | 2,787 | 6/13/22 | — | (14 | ) | ||||||||||||||||||||||||
Australian Dollar | CITI | Buy | 250,000 | 189,727 | 6/15/22 | — | (10,268 | ) | ||||||||||||||||||||||||
Singapore Dollar | DBAB | Sell | 394,645 | 400,000 | AUD | 6/15/22 | — | (904 | ) | |||||||||||||||||||||||
Japanese Yen | DBAB | Sell | 143,468,448 | 1,600,000 | AUD | 6/15/22 | 33,377 | — | ||||||||||||||||||||||||
Australian Dollar | HSBC | Buy | 800,000 | 568,146 | 6/15/22 | 6,124 | — | |||||||||||||||||||||||||
Australian Dollar | HSBC | Sell | 500,000 | 365,838 | 6/15/22 | 8,771 | (1,851 | ) | ||||||||||||||||||||||||
Australian Dollar | JPHQ | Sell | 400,000 | 284,047 | 6/15/22 | — | (3,088 | ) | ||||||||||||||||||||||||
Singapore Dollar | SCBL | Sell | 394,453 | 400,000 | AUD | 6/15/22 | 2,014 | (2,778 | ) | |||||||||||||||||||||||
Australian Dollar | UBSW | Buy | 250,000 | 187,326 | 6/15/22 | — | (7,867 | ) | ||||||||||||||||||||||||
British Pound | BNYM | Buy | 641,022 | 810,893 | 6/15/22 | 6,583 | (9,660 | ) | ||||||||||||||||||||||||
British Pound | BNYM | Sell | 2,279,181 | 2,967,010 | 6/15/22 | 96,256 | (1,472 | ) | ||||||||||||||||||||||||
Euro | CITI | Sell | 500,000 | 3,530,369 | CNY | 6/15/22 | 3,823 | (12,454 | ) | |||||||||||||||||||||||
Chinese Yuan | CITI | Buy | 5,901,610 | 900,000 | 6/15/22 | 418 | (16,784 | ) | ||||||||||||||||||||||||
Euro | DBAB | Sell | 250,000 | 1,781,125 | CNY | 6/15/22 | 10,202 | (12,131 | ) | |||||||||||||||||||||||
Chinese Yuan | HSBC | Buy | 2,647,568 | 400,000 | 6/15/22 | — | (3,586 | ) | ||||||||||||||||||||||||
Chinese Yuan | HSBC | Sell | 6,659,916 | 1,000,000 | 6/15/22 | 2,827 | — | |||||||||||||||||||||||||
Chinese Yuan | JPHQ | Buy | 17,158,430 | 2,550,000 | 6/15/22 | 25,329 | (6,239 | ) | ||||||||||||||||||||||||
| franklintempleton.com | Annual Report | 75 | ||||||||
FRANKLIN ALTERNATIVE STRATEGIES FUNDS
CONSOLIDATED SCHEDULE OF INVESTMENTS
Franklin K2 Alternative Strategies Fund (continued)
| Forward Exchange Contracts (continued) | ||||||||||||||||||||||||||||||||
| Currency | Counterpartya | Type | Quantity | Contract Amount* | Settlement Date | Unrealized Appreciation | Unrealized Depreciation | |||||||||||||||||||||||||
| OTC Forward Exchange Contracts (continued) | ||||||||||||||||||||||||||||||||
Chinese Yuan | JPHQ | Sell | 15,430,347 | 2,323,180 | 6/15/22 | $ | 21,308 | $ | (8,474 | ) | ||||||||||||||||||||||
Chinese Yuan | MSCO | Buy | 6,505,905 | 1,014,537 | 6/15/22 | — | (37,572 | ) | ||||||||||||||||||||||||
Chinese Yuan | MSCO | Sell | 26,609,948 | 4,166,399 | 6/15/22 | 172,487 | (185 | ) | ||||||||||||||||||||||||
Chinese Yuan | SCBL | Buy | 9,060,088 | 1,350,000 | 6/15/22 | 6,544 | — | |||||||||||||||||||||||||
Chinese Yuan | SCBL | Sell | 2,659,040 | 400,000 | 6/15/22 | 1,868 | — | |||||||||||||||||||||||||
Chinese Yuan | UBSW | Sell | 5,900,384 | 900,000 | 6/15/22 | 16,550 | — | |||||||||||||||||||||||||
Euro | BNYM | Buy | 1,251,869 | 1,342,678 | 6/15/22 | 11,136 | (8,746 | ) | ||||||||||||||||||||||||
Euro | BNYM | Sell | 7,522,175 | 8,252,627 | 6/15/22 | 180,834 | (10,398 | ) | ||||||||||||||||||||||||
Chinese Yuan | GSCO | Sell | 1,454,734 | 200,000 | EUR | 6/15/22 | 25 | (2,949 | ) | |||||||||||||||||||||||
Chinese Yuan | HSBC | Sell | 1,746,732 | 250,000 | EUR | 6/15/22 | 11,766 | (4,688 | ) | |||||||||||||||||||||||
Euro | MSCO | Buy | 1,400,000 | 1,525,436 | 6/15/22 | — | (21,208 | ) | ||||||||||||||||||||||||
Euro | MSCO | Sell | 2,762,764 | 2,972,957 | 6/15/22 | 42,679 | (38,170 | ) | ||||||||||||||||||||||||
Chinese Yuan | SCBL | Sell | 1,753,880 | 250,000 | EUR | 6/15/22 | 9,010 | (3,002 | ) | |||||||||||||||||||||||
Chinese Yuan | UBSW | Sell | 1,741,210 | 250,000 | EUR | 6/15/22 | 17,021 | (9,115 | ) | |||||||||||||||||||||||
Norwegian Krone | UBSW | Sell | 13,513,488 | 1,350,000 | EUR | 6/15/22 | 23,932 | (15,432 | ) | |||||||||||||||||||||||
Indian Rupee | BNPP | Buy | 19,224,225 | 250,000 | 6/15/22 | — | (2,778 | ) | ||||||||||||||||||||||||
Indian Rupee | BNPP | Sell | 19,108,075 | 250,000 | 6/15/22 | 4,272 | — | |||||||||||||||||||||||||
Indian Rupee | HSBC | Buy | 77,872,500 | 1,000,000 | 6/15/22 | 1,433 | — | |||||||||||||||||||||||||
Indian Rupee | JPHQ | Sell | 31,202,800 | 400,000 | 6/15/22 | — | (1,265 | ) | ||||||||||||||||||||||||
Indian Rupee | MSCO | Sell | 77,499,000 | 1,000,000 | 6/15/22 | 3,370 | — | |||||||||||||||||||||||||
Indonesian Rupiah | BNPP | Sell | 10,132,469,500 | 700,000 | 6/15/22 | 5,227 | — | |||||||||||||||||||||||||
Indonesian Rupiah | CITI | Sell | 12,346,895,000 | 850,000 | 6/15/22 | 3,386 | — | |||||||||||||||||||||||||
Indonesian Rupiah | HSBC | Buy | 13,059,396,000 | 900,000 | 6/15/22 | — | (4,530 | ) | ||||||||||||||||||||||||
Indonesian Rupiah | HSBC | Sell | 13,063,392,000 | 900,000 | 6/15/22 | 4,256 | — | |||||||||||||||||||||||||
Indonesian Rupiah | JPHQ | Buy | 9,512,600,000 | 650,000 | 6/15/22 | 2,269 | — | |||||||||||||||||||||||||
Indonesian Rupiah | SCBL | Buy | 13,055,400,000 | 900,000 | 6/15/22 | — | (4,804 | ) | ||||||||||||||||||||||||
Japanese Yen | CITI | Buy | 64,097,248 | 500,000 | 6/15/22 | 2,824 | (4,604 | ) | ||||||||||||||||||||||||
Japanese Yen | CITI | Sell | 350,685 | 2,747 | 6/15/22 | 21 | — | |||||||||||||||||||||||||
Japanese Yen | DBAB | Sell | 32,428,900 | 250,000 | 6/15/22 | — | (2,066 | ) | ||||||||||||||||||||||||
Japanese Yen | HSBC | Buy | 30,357,915 | 250,000 | 6/15/22 | — | (14,032 | ) | ||||||||||||||||||||||||
South Korean Won | JPHQ | Sell | 731,780,000 | 75,000,000 | JPY | 6/15/22 | 4,650 | (13,129 | ) | |||||||||||||||||||||||
Japanese Yen | JPHQ | Sell | 31,360,650 | 250,000 | 6/15/22 | 6,238 | — | |||||||||||||||||||||||||
Australian Dollar | UBSW | Sell | 1,600,000 | 144,644,160 | JPY | 6/15/22 | — | (24,239 | ) | |||||||||||||||||||||||
Japanese Yen | UBSW | Sell | 30,217,350 | 250,000 | 6/15/22 | 15,124 | — | |||||||||||||||||||||||||
Mexican Peso | JPHQ | Buy | 14,377,204 | 682,026 | 6/15/22 | 46,197 | — | |||||||||||||||||||||||||
Mexican Peso | JPHQ | Sell | 73,635,445 | 3,513,336 | 6/15/22 | — | (216,390 | ) | ||||||||||||||||||||||||
Norwegian Krone | BNPP | Buy | 1,882,953 | 200,000 | 6/15/22 | 927 | — | |||||||||||||||||||||||||
Norwegian Krone | DBAB | Buy | 161,043 | 16,536 | 6/15/22 | 649 | — | |||||||||||||||||||||||||
Norwegian Krone | GSCO | Buy | 3,849,482 | 400,000 | 6/15/22 | 10,773 | — | |||||||||||||||||||||||||
Euro | HSBC | Sell | 900,000 | 8,832,652 | NOK | 6/15/22 | 33,845 | (58,329 | ) | |||||||||||||||||||||||
Norwegian Krone | HSBC | Sell | 3,805,480 | 400,000 | 6/15/22 | — | (6,077 | ) | ||||||||||||||||||||||||
Euro | JPHQ | Sell | 450,000 | 4,519,793 | NOK | 6/15/22 | 28,703 | (29,904 | ) | |||||||||||||||||||||||
Norwegian Krone | JPHQ | Sell | 2,165,160 | 250,000 | 6/15/22 | 18,959 | — | |||||||||||||||||||||||||
Norwegian Krone | SCBL | Buy | 2,177,510 | 250,000 | 6/15/22 | — | (17,641 | ) | ||||||||||||||||||||||||
Norwegian Krone | UBSW | Buy | 2,187,535 | 250,000 | 6/15/22 | — | (16,571 | ) | ||||||||||||||||||||||||
Philippine Peso | DBAB | Sell | 21,208,400 | 400,000 | 6/15/22 | — | (4,737 | ) | ||||||||||||||||||||||||
Polish Zloty | JPHQ | Buy | 9,090,509 | 2,104,647 | 6/15/22 | 19,948 | — | |||||||||||||||||||||||||
Polish Zloty | JPHQ | Sell | 6,078,220 | 1,350,655 | 6/15/22 | — | (69,921 | ) | ||||||||||||||||||||||||
Australian Dollar | CITI | Sell | 400,000 | 395,574 | SGD | 6/15/22 | 2,254 | (672 | ) | |||||||||||||||||||||||
Singapore Dollar | GSCO | Buy | 543,948 | 400,000 | 6/15/22 | — | (2,989 | ) | ||||||||||||||||||||||||
Singapore Dollar | JPHQ | Buy | 954,743 | 700,000 | 6/15/22 | — | (3,162 | ) | ||||||||||||||||||||||||
Singapore Dollar | SCBL | Sell | 881,000 | 650,000 | 6/15/22 | 6,985 | — | |||||||||||||||||||||||||
Australian Dollar | UBSW | Sell | 400,000 | 396,892 | SGD | 6/15/22 | 2,544 | — | ||||||||||||||||||||||||
South African Rand | DBAB | Buy | 4,948,965 | 310,642 | 6/15/22 | 5,068 | — | |||||||||||||||||||||||||
South African Rand | GSCO | Sell | 102,379,107 | 6,556,879 | 6/15/22 | 25,797 | — | |||||||||||||||||||||||||
South African Rand | HSBC | Sell | 16,564,153 | 1,039,352 | 6/15/22 | — | (17,327 | ) | ||||||||||||||||||||||||
South African Rand | JPHQ | Buy | 73,695,098 | 4,682,312 | 6/15/22 | 62,263 | (43,335 | ) | ||||||||||||||||||||||||
| 76 | Annual Report | franklintempleton.com | ||||||||
FRANKLIN ALTERNATIVE STRATEGIES FUNDS
CONSOLIDATED SCHEDULE OF INVESTMENTS
Franklin K2 Alternative Strategies Fund (continued)
| Forward Exchange Contracts (continued) | ||||||||||||||||||||||||||||||||
| Currency | Counterpartya | Type | Quantity | Contract Amount* | Settlement Date | Unrealized Appreciation | Unrealized Depreciation | |||||||||||||||||||||||||
| OTC Forward Exchange Contracts (continued) | ||||||||||||||||||||||||||||||||
South African Rand | JPHQ | Sell | 8,067,043 | 499,498 | 6/15/22 | $ | — | $ | (15,124 | ) | ||||||||||||||||||||||
South Korean Won | BOFA | Sell | 308,565,000 | 250,000 | 6/15/22 | 609 | — | |||||||||||||||||||||||||
South Korean Won | CITI | Buy | 318,150,000 | 250,000 | 6/15/22 | 7,138 | — | |||||||||||||||||||||||||
South Korean Won | CITI | Sell | 1,077,595,500 | 850,000 | 6/15/22 | 4,422 | (25,365 | ) | ||||||||||||||||||||||||
South Korean Won | DBAB | Sell | 313,885,000 | 250,000 | 6/15/22 | — | (3,691 | ) | ||||||||||||||||||||||||
South Korean Won | GSCO | Buy | 308,087,000 | 250,000 | 6/15/22 | — | (995 | ) | ||||||||||||||||||||||||
South Korean Won | GSCO | Sell | 302,940,000 | 250,000 | 6/15/22 | 5,155 | — | |||||||||||||||||||||||||
South Korean Won | HSBC | Buy | 300,675,000 | 250,000 | 6/15/22 | — | (6,986 | ) | ||||||||||||||||||||||||
Japanese Yen | JPHQ | Sell | 75,000,000 | 739,915,000 | KRW | 6/15/22 | 17,450 | (2,396 | ) | |||||||||||||||||||||||
South Korean Won | JPHQ | Buy | 626,317,500 | 500,000 | 6/15/22 | 10,051 | �� | (3,844 | ) | |||||||||||||||||||||||
South Korean Won | JPHQ | Sell | 1,050,768,000 | 856,371 | 6/15/22 | 9,098 | (1,987 | ) | ||||||||||||||||||||||||
South Korean Won | MSCO | Sell | 329,153,965 | 261,128 | 6/15/22 | — | (4,903 | ) | ||||||||||||||||||||||||
South Korean Won | SCBL | Buy | 1,045,950,500 | 850,000 | 6/15/22 | — | (4,634 | ) | ||||||||||||||||||||||||
South Korean Won | SCBL | Sell | 512,464,000 | 400,000 | 6/15/22 | — | (14,188 | ) | ||||||||||||||||||||||||
South Korean Won | UBSW | Buy | 2,468,497,165 | 1,950,000 | 6/15/22 | 50,247 | (5,139 | ) | ||||||||||||||||||||||||
South Korean Won | UBSW | Sell | 322,400,150 | 250,000 | 6/15/22 | — | (10,573 | ) | ||||||||||||||||||||||||
Taiwan Dollar | BNPP | Buy | 32,387,400 | 1,100,000 | 6/15/22 | 23,058 | (6,944 | ) | ||||||||||||||||||||||||
Taiwan Dollar | BNPP | Sell | 29,811,000 | 1,000,000 | 6/15/22 | — | (27,328 | ) | ||||||||||||||||||||||||
Taiwan Dollar | CITI | Sell | 23,956,825 | 850,000 | 6/15/22 | 24,415 | — | |||||||||||||||||||||||||
Taiwan Dollar | JPHQ | Buy | 13,855,274 | 489,222 | 6/15/22 | 857 | (12,608 | ) | ||||||||||||||||||||||||
Taiwan Dollar | JPHQ | Sell | 7,440,250 | 250,000 | 6/15/22 | — | (6,401 | ) | ||||||||||||||||||||||||
Taiwan Dollar | SCBL | Buy | 11,909,080 | 400,000 | 6/15/22 | 10,403 | — | |||||||||||||||||||||||||
Taiwan Dollar | SCBL | Sell | 26,574,390 | 900,000 | 6/15/22 | — | (15,790 | ) | ||||||||||||||||||||||||
Taiwan Dollar | UBSW | Buy | 12,719,116 | 450,000 | 6/15/22 | — | (11,682 | ) | ||||||||||||||||||||||||
Thai Baht | CITI | Buy | 29,916,045 | 900,000 | 6/15/22 | — | (25,389 | ) | ||||||||||||||||||||||||
Thai Baht | CITI | Sell | 8,545,025 | 250,000 | 6/15/22 | 182 | — | |||||||||||||||||||||||||
Thai Baht | HSBC | Sell | 31,032,900 | 900,000 | 6/15/22 | — | (7,262 | ) | ||||||||||||||||||||||||
Thai Baht | JPHQ | Buy | 1,841,550 | 53,149 | 6/15/22 | 690 | — | |||||||||||||||||||||||||
Thai Baht | SCBL | Sell | 13,756,680 | 400,000 | 6/15/22 | — | (2,183 | ) | ||||||||||||||||||||||||
Thai Baht | UBSW | Buy | 21,577,010 | 650,000 | 6/15/22 | — | (19,185 | ) | ||||||||||||||||||||||||
Australian Dollar | BZWS | Buy | 23,498,000 | 17,382,749 | 6/17/22 | 80,850 | (595,274 | ) | ||||||||||||||||||||||||
Australian Dollar | BZWS | Sell | 28,803,000 | 20,889,479 | 6/17/22 | 255,750 | (42,852 | ) | ||||||||||||||||||||||||
Australian Dollarb | MSCO | Buy | 8,842,000 | 6,344,660 | 6/17/22 | 89,363 | (86,687 | ) | ||||||||||||||||||||||||
Australian Dollarb | MSCO | Sell | 10,026,000 | 7,416,104 | 6/17/22 | 222,858 | (4,041 | ) | ||||||||||||||||||||||||
British Pound | BNYM | Buy | 150,000 | 187,556 | 6/17/22 | 1,476 | — | |||||||||||||||||||||||||
British Pound | BNYM | Sell | 2,765,679 | 3,423,717 | 6/17/22 | — | (61,629 | ) | ||||||||||||||||||||||||
British Pound | BZWS | Buy | 2,510,000 | 3,240,828 | 6/17/22 | 13,516 | (91,213 | ) | ||||||||||||||||||||||||
British Pound | BZWS | Sell | 1,904,000 | 2,443,432 | 6/17/22 | 59,790 | (15,800 | ) | ||||||||||||||||||||||||
British Poundb | MSCO | Buy | 6,587,000 | 8,415,120 | 6/17/22 | 54,136 | (168,229 | ) | ||||||||||||||||||||||||
British Poundb | MSCO | Sell | 10,552,000 | 13,703,030 | 6/17/22 | 415,551 | (10,292 | ) | ||||||||||||||||||||||||
Canadian Dollar | BZWS | Buy | 520,000 | 400,458 | 6/17/22 | 10,621 | (1 | ) | ||||||||||||||||||||||||
Canadian Dollar | BZWS | Sell | 4,869,000 | 3,824,659 | 6/17/22 | 70 | (24,532 | ) | ||||||||||||||||||||||||
Canadian Dollarb | MSCO | Buy | 9,628,000 | 7,602,939 | 6/17/22 | 30,295 | (21,952 | ) | ||||||||||||||||||||||||
Canadian Dollarb | MSCO | Sell | 10,282,000 | 8,000,617 | 6/17/22 | 295 | (127,971 | ) | ||||||||||||||||||||||||
Euro | BNYM | Buy | 1,660,246 | 1,780,268 | 6/17/22 | 3,780 | — | |||||||||||||||||||||||||
Euro | BNYM | Sell | 29,073,099 | 30,531,754 | 6/17/22 | — | (709,281 | ) | ||||||||||||||||||||||||
Euro | BZWS | Buy | 1,648,000 | 1,746,892 | 6/17/22 | 24,460 | (460 | ) | ||||||||||||||||||||||||
Euro | BZWS | Sell | 6,544,000 | 7,196,106 | 6/17/22 | 171,442 | (7,314 | ) | ||||||||||||||||||||||||
Eurob | MSCO | Buy | 5,241,000 | 5,627,357 | 6/17/22 | 58,086 | (53,627 | ) | ||||||||||||||||||||||||
Eurob | MSCO | Sell | 9,078,000 | 9,949,966 | 6/17/22 | 212,039 | (17,004 | ) | ||||||||||||||||||||||||
Hong Kong Dollar | BNYM | Buy | 2,665,566 | 339,740 | 6/17/22 | 111 | — | |||||||||||||||||||||||||
Hong Kong Dollar | BNYM | Sell | 21,219,472 | 2,705,392 | 6/17/22 | — | (19 | ) | ||||||||||||||||||||||||
Japanese Yenb | MSCO | Buy | 830,331,000 | 6,585,366 | 6/17/22 | 15,372 | (146,126 | ) | ||||||||||||||||||||||||
Japanese Yenb | MSCO | Sell | 1,413,425,000 | 11,729,688 | 6/17/22 | 744,037 | (1,667 | ) | ||||||||||||||||||||||||
Mexican Pesob | MSCO | Buy | 46,974,000 | 2,212,447 | 6/17/22 | 165,838 | — | |||||||||||||||||||||||||
Mexican Pesob | MSCO | Sell | 2,186,000 | 108,055 | 6/17/22 | 212 | (2,833 | ) | ||||||||||||||||||||||||
New Zealand Dollar | BZWS | Buy | 4,382,000 | 2,740,512 | 6/17/22 | 114,064 | — | |||||||||||||||||||||||||
| franklintempleton.com | Annual Report | 77 | ||||||||
FRANKLIN ALTERNATIVE STRATEGIES FUNDS
CONSOLIDATED SCHEDULE OF INVESTMENTS
Franklin K2 Alternative Strategies Fund (continued)
| Forward Exchange Contracts (continued) | ||||||||||||||||||||||||||||||||
| Currency | Counterpartya | Type | Quantity | Contract Amount* | Settlement Date | Unrealized Appreciation | Unrealized Depreciation | |||||||||||||||||||||||||
| OTC Forward Exchange Contracts (continued) | ||||||||||||||||||||||||||||||||
New Zealand Dollar | BZWS | Sell | 4,382,000 | 2,986,379 | 6/17/22 | $ | 132,396 | $ | (593 | ) | ||||||||||||||||||||||
New Zealand Dollarb | MSCO | Buy | 3,018,000 | 2,031,155 | 6/17/22 | 859 | (65,992 | ) | ||||||||||||||||||||||||
New Zealand Dollarb | MSCO | Sell | 5,409,000 | 3,549,695 | 6/17/22 | 49,039 | (22,939 | ) | ||||||||||||||||||||||||
South African Rand | BZWS | Buy | 2,971,000 | 198,201 | �� | 6/17/22 | 504 | (9,226 | ) | |||||||||||||||||||||||
South African Rand | BZWS | Sell | 2,937,000 | 183,425 | 6/17/22 | — | (3,884 | ) | ||||||||||||||||||||||||
Swedish Krona | BZWS | Buy | 3,711,000 | 392,140 | 6/17/22 | — | (11,916 | ) | ||||||||||||||||||||||||
Swedish Krona | BZWS | Sell | 11,135,000 | 1,178,610 | 6/17/22 | 37,736 | — | |||||||||||||||||||||||||
Swiss Franc | BNYM | Buy | 600,000 | 624,558 | 6/17/22 | 1,592 | — | |||||||||||||||||||||||||
Swiss Franc | BNYM | Sell | 12,618,083 | 12,922,273 | 6/17/22 | — | (245,745 | ) | ||||||||||||||||||||||||
Swiss Francb | MSCO | Buy | 827,000 | 887,920 | 6/17/22 | 1,999 | (26,874 | ) | ||||||||||||||||||||||||
Swiss Francb | MSCO | Sell | 6,417,000 | 6,889,216 | 6/17/22 | 196,437 | (3,894 | ) | ||||||||||||||||||||||||
Indian Rupee | CITI | Buy | 77,800,000 | 1,000,000 | 6/21/22 | — | (142 | ) | ||||||||||||||||||||||||
Indian Rupee | SCBL | Buy | 77,797,500 | 1,000,000 | 6/21/22 | — | (175 | ) | ||||||||||||||||||||||||
Indian Rupee | UBSW | Sell | 62,161,520 | 800,000 | 6/21/22 | 1,123 | — | |||||||||||||||||||||||||
Singapore Dollar | MSCO | Sell | 230,000 | 169,183 | 6/24/22 | 1,317 | — | |||||||||||||||||||||||||
Australian Dollar | BNYM | Sell | 989,000 | 736,854 | 6/29/22 | 26,740 | — | |||||||||||||||||||||||||
Canadian Dollar | BNYM | Sell | 3,204,000 | 2,547,495 | 6/29/22 | 14,779 | — | |||||||||||||||||||||||||
Euro | BNYM | Buy | 2,672,000 | 2,841,093 | 6/29/22 | 32,074 | — | |||||||||||||||||||||||||
Euro | BNYM | Sell | 6,537,000 | 7,236,034 | 6/29/22 | 206,883 | — | |||||||||||||||||||||||||
Hong Kong Dollar | BNYM | Sell | 9,897,000 | 1,265,925 | 6/29/22 | 3,653 | — | |||||||||||||||||||||||||
British Pound | JPHQ | Buy | 640,000 | 788,111 | 6/30/22 | 18,480 | — | |||||||||||||||||||||||||
British Pound | JPHQ | Sell | 1,690,000 | 2,160,874 | 6/30/22 | 49,565 | (18,596 | ) | ||||||||||||||||||||||||
Canadian Dollar | BNYM | Buy | 700,000 | 539,040 | 6/30/22 | 14,297 | — | |||||||||||||||||||||||||
Canadian Dollar | BNYM | Sell | 4,660,000 | 3,722,491 | 6/30/22 | 38,848 | — | |||||||||||||||||||||||||
Euro | BNYM | Sell | 690,000 | 767,142 | 6/30/22 | 25,153 | — | |||||||||||||||||||||||||
Euro | JPHQ | Sell | 1,090,000 | 1,191,380 | 6/30/22 | 19,252 | — | |||||||||||||||||||||||||
Hong Kong Dollar | JPHQ | Sell | 600,000 | 76,727 | 6/30/22 | 200 | — | |||||||||||||||||||||||||
Japanese Yen | BNYM | Sell | 44,540,000 | 363,889 | 6/30/22 | 17,463 | — | |||||||||||||||||||||||||
Swiss Franc | JPHQ | Sell | 320,000 | 343,954 | 6/30/22 | 9,751 | — | |||||||||||||||||||||||||
Colombian Peso | MSCS | Sell | 424,857,000 | 113,404 | 7/11/22 | 1,323 | — | |||||||||||||||||||||||||
Euro | BOFA | Sell | 370,000 | 401,447 | 7/26/22 | 3,025 | — | |||||||||||||||||||||||||
Euro | BZWS | Sell | 115,000 | 124,821 | 7/26/22 | 987 | — | |||||||||||||||||||||||||
Colombian Peso | JPHQ | Sell | 7,990,058,674 | 2,107,111 | 7/27/22 | 4,231 | — | |||||||||||||||||||||||||
Euro | JPHQ | Sell | 1,530,000 | 38,625,756 | CZK | 7/27/22 | 52,433 | (34,850 | ) | |||||||||||||||||||||||
Czech Koruna | JPHQ | Sell | 89,401,648 | 3,530,000 | EUR | 7/27/22 | 53,554 | (106,393 | ) | |||||||||||||||||||||||
Polish Zloty | JPHQ | Sell | 7,156,134 | 1,500,000 | EUR | 7/27/22 | 23,008 | (70,466 | ) | |||||||||||||||||||||||
Euro | JPHQ | Buy | 306,175 | 324,553 | 7/27/22 | 5,158 | — | |||||||||||||||||||||||||
Euro | JPHQ | Sell | 3,528,589 | 3,794,917 | 7/27/22 | 8,917 | (13,836 | ) | ||||||||||||||||||||||||
Euro | JPHQ | Sell | 206,799 | 79,227,660 | HUF | 7/27/22 | 2,086 | (12,117 | ) | |||||||||||||||||||||||
Hungarian Forint | JPHQ | Sell | 60,719,317 | 173,738 | 7/27/22 | 10,754 | — | |||||||||||||||||||||||||
Indonesian Rupiah | JPHQ | Buy | 37,755,720,000 | 2,580,000 | 7/27/22 | 6,871 | — | |||||||||||||||||||||||||
Indonesian Rupiah | JPHQ | Sell | 38,501,760,000 | 2,640,000 | 7/27/22 | 2,013 | — | |||||||||||||||||||||||||
Japanese Yen | JPHQ | Buy | 323,731,382 | 2,540,000 | 7/27/22 | — | (19,040 | ) | ||||||||||||||||||||||||
Mexican Peso | JPHQ | Buy | 99,246,455 | 4,820,000 | 7/27/22 | 165,918 | — | |||||||||||||||||||||||||
Mexican Peso | JPHQ | Sell | 185,231,715 | 9,077,536 | 7/27/22 | — | (228,087 | ) | ||||||||||||||||||||||||
Euro | JPHQ | Sell | 1,450,000 | 14,942,115 | NOK | 7/27/22 | 36,418 | (2,761 | ) | |||||||||||||||||||||||
Peruvian Nuevo Sol | JPHQ | Buy | 7,960,734 | 2,080,000 | 7/27/22 | 50,124 | — | |||||||||||||||||||||||||
Peruvian Nuevo Sol | JPHQ | Sell | 13,973,899 | 3,743,102 | 7/27/22 | 27,329 | (23,346 | ) | ||||||||||||||||||||||||
Philippine Peso | JPHQ | Sell | 81,307,315 | 1,540,001 | 7/27/22 | — | (10,028 | ) | ||||||||||||||||||||||||
Euro | JPHQ | Sell | 1,470,000 | 6,927,608 | PLN | 7/27/22 | 32,766 | (6,103 | ) | |||||||||||||||||||||||
Polish Zloty | JPHQ | Buy | 11,386,076 | 2,550,000 | 7/27/22 | 95,610 | — | |||||||||||||||||||||||||
Polish Zloty | JPHQ | Sell | 2,178,812 | 504,480 | 7/27/22 | — | (1,777 | ) | ||||||||||||||||||||||||
South African Rand | JPHQ | Buy | 92,090,026 | 5,740,000 | 7/27/22 | 106,206 | (122 | ) | ||||||||||||||||||||||||
South African Rand | JPHQ | Sell | 112,937,615 | 7,225,213 | 7/27/22 | 161,083 | (105,406 | ) | ||||||||||||||||||||||||
Thai Baht | JPHQ | Buy | 231,755,050 | 6,775,780 | 7/27/22 | 35,098 | (26,628 | ) | ||||||||||||||||||||||||
Thai Baht | JPHQ | Sell | 232,167,480 | 6,800,000 | 7/27/22 | 4,613 | (936 | ) | ||||||||||||||||||||||||
Turkish Lira | JPHQ | Sell | 29,353,253 | 1,825,760 | 7/27/22 | 158,586 | — | |||||||||||||||||||||||||
| 78 | Annual Report | franklintempleton.com | ||||||||
FRANKLIN ALTERNATIVE STRATEGIES FUNDS
CONSOLIDATED SCHEDULE OF INVESTMENTS
Franklin K2 Alternative Strategies Fund (continued)
| Forward Exchange Contracts (continued) | ||||||||||||||||||||||||||||||||
| Currency | Counterpartya | Type | Quantity | Contract Amount* | Settlement Date | Unrealized Appreciation | Unrealized Depreciation | |||||||||||||||||||||||||
| OTC Forward Exchange Contracts (continued) | ||||||||||||||||||||||||||||||||
British Pound | MSCO | Buy | 131,000 | 165,108 | 7/28/22 | $ | 35 | $ | — | |||||||||||||||||||||||
British Pound | MSCO | Sell | 921,000 | 1,244,641 | 7/28/22 | 83,594 | — | |||||||||||||||||||||||||
Brazilian Real | JPHQ | Buy | 16,770,437 | 3,224,403 | 8/02/22 | 241,164 | — | |||||||||||||||||||||||||
Brazilian Real | JPHQ | Sell | 20,473,157 | 4,065,197 | 8/02/22 | — | (165,527 | ) | ||||||||||||||||||||||||
South Korean Won | MSCO | Buy | 1,092,632,790 | 862,339 | 8/09/22 | 20,870 | — | |||||||||||||||||||||||||
Euro | HSBC | Buy | 29,000 | 30,762 | 8/17/22 | 507 | — | |||||||||||||||||||||||||
Euro | HSBC | Sell | 125,000 | 130,389 | 8/17/22 | — | (4,393 | ) | ||||||||||||||||||||||||
Indonesian Rupiah | GSCO | Buy | 25,956,000,000 | 1,800,000 | 8/22/22 | — | (23,571 | ) | ||||||||||||||||||||||||
Indonesian Rupiah | JPHQ | Buy | 28,678,571,429 | 1,964,286 | 8/22/22 | — | (1,525 | ) | ||||||||||||||||||||||||
Indonesian Rupiah | JPHQ | Sell | 86,591,771,429 | 6,013,188 | 8/22/22 | 86,847 | — | |||||||||||||||||||||||||
Indonesian Rupiah | SCBL | Buy | 31,957,200,000 | 2,200,000 | 8/22/22 | — | (12,849 | ) | ||||||||||||||||||||||||
South Korean Won | JPHQ | Sell | 387,908,000 | 40,000,000 | JPY | 9/21/22 | — | (4,926 | ) | |||||||||||||||||||||||
Singapore Dollar | HSBC | Sell | 1,594,275 | 1,079,000 | EUR | 11/14/22 | 15,165 | (10,263 | ) | |||||||||||||||||||||||
Singapore Dollar | JPHQ | Sell | 365,552 | 248,000 | EUR | 11/14/22 | 4,181 | (2,411 | ) | |||||||||||||||||||||||
Euro | CITI | Sell | 560,000 | 826,205 | SGD | 11/14/22 | 6,126 | (9,563 | ) | |||||||||||||||||||||||
Euro | HSBC | Sell | 560,000 | 826,491 | SGD | 11/14/22 | 6,129 | (9,357 | ) | |||||||||||||||||||||||
Euro | JPHQ | Sell | 207,000 | 306,878 | SGD | 11/14/22 | 422 | (613 | ) | |||||||||||||||||||||||
Philippine Peso | CITI | Sell | 14,479,560 | 270,000 | 11/15/22 | — | (4,892 | ) | ||||||||||||||||||||||||
Philippine Peso | MSCO | Buy | 14,458,500 | 270,000 | 11/15/22 | 4,492 | — | |||||||||||||||||||||||||
Indonesian Rupiah | FBCO | Sell | 5,362,444,800 | 360,000 | 11/16/22 | — | (6,121 | ) | ||||||||||||||||||||||||
Indonesian Rupiah | GSCO | Sell | 26,370,000,000 | 1,800,000 | 2/22/23 | 6,128 | — | |||||||||||||||||||||||||
Indonesian Rupiah | JPHQ | Buy | 88,041,028,571 | 6,025,064 | 2/22/23 | — | (35,897 | ) | ||||||||||||||||||||||||
Indonesian Rupiah | JPHQ | Sell | 29,181,428,571 | 1,964,286 | 2/22/23 | — | (20,839 | ) | ||||||||||||||||||||||||
Indonesian Rupiah | SCBL | Sell | 32,489,600,000 | 2,200,000 | 2/22/23 | — | (10,170 | ) | ||||||||||||||||||||||||
Euro | JPHQ | Sell | 2,300,000 | 2,585,108 | 3/31/23 | 67,959 | — | |||||||||||||||||||||||||
Indian Rupee | CITI | Sell | 80,545,000 | 1,000,000 | 5/22/23 | — | (504 | ) | ||||||||||||||||||||||||
Indian Rupee | SCBL | Sell | 80,547,500 | 1,000,000 | 5/22/23 | — | (535 | ) | ||||||||||||||||||||||||
Indian Rupee | UBSW | Buy | 64,401,200 | 800,000 | 5/22/23 | — | (29 | ) | ||||||||||||||||||||||||
Australian Dollar | DBAB | Buy | 3,941,622 | 2,835,044 | 5/31/23 | — | (6,810 | ) | ||||||||||||||||||||||||
Australian Dollar | HSBC | Sell | 3,941,622 | 2,833,749 | 5/31/23 | 5,515 | — | |||||||||||||||||||||||||
Euro | JPHQ | Sell | 2,900,000 | 3,396,074 | 3/31/25 | 119,014 | — | |||||||||||||||||||||||||
|
| |||||||||||||||||||||||||||||||
Total Forward Exchange Contracts |
| $ | 6,604,272 | $ | (4,709,210 | ) | ||||||||||||||||||||||||||
|
| |||||||||||||||||||||||||||||||
Net unrealized appreciation (depreciation) |
| $ | 1,895,062 | |||||||||||||||||||||||||||||
|
| |||||||||||||||||||||||||||||||
*In U.S. dollars unless otherwise indicated.
aMay be comprised of multiple contracts with the same counterparty, currency and settlement date.
bA portion or all of the contracts are owned by K2 Holdings Investment Corp., a wholly-owned subsidiary of the Fund. See Note 1(h).
At May 31, 2022, the Fund had the following credit default swap contracts outstanding. See Note 1(d).
| Credit Default Swap Contracts | ||||||||||||||||||||||||||||||||||||||||
| Description | Annual Payment Rate Received (Paid) | Payment Frequency | Maturity Date | Notional Amounta | Value | Unamortized Upfront Payments (Receipts) | Unrealized Appreciation (Depreciation) | Ratingb | ||||||||||||||||||||||||||||||||
| Centrally Cleared Swap Contracts | ||||||||||||||||||||||||||||||||||||||||
| Contracts to Buy Protectionc | ||||||||||||||||||||||||||||||||||||||||
| Single Name | ||||||||||||||||||||||||||||||||||||||||
Government of China | (1.00)% | Quarterly | 6/20/27 | 500,000 | $ | (7,013 | ) | $ | (9,769 | ) | $ | 2,756 | ||||||||||||||||||||||||||||
Government of Indonesia | (1.00)% | Quarterly | 6/20/27 | 400,000 | 18 | 1,494 | (1,476 | ) | ||||||||||||||||||||||||||||||||
| Traded Index | ||||||||||||||||||||||||||||||||||||||||
CDX.NA.HY.37 | (5.00)% | Quarterly | 12/20/26 | 1,907,000 | (51,020 | ) | (180,658 | ) | 129,638 | |||||||||||||||||||||||||||||||
| franklintempleton.com | Annual Report | 79 | ||||||||
FRANKLIN ALTERNATIVE STRATEGIES FUNDS
CONSOLIDATED SCHEDULE OF INVESTMENTS
Franklin K2 Alternative Strategies Fund (continued)
| Credit Default Swap Contracts (continued) | ||||||||||||||||||||||||||||||||||||||||
| Description | Annual Payment Rate Received (Paid) | Payment Frequency | Maturity Date | Notional Amounta | Value | Unamortized Upfront Payments (Receipts) | Unrealized Appreciation (Depreciation) | Ratingb | ||||||||||||||||||||||||||||||||
| Centrally Cleared Swap Contracts (continued) | ||||||||||||||||||||||||||||||||||||||||
| Contracts to Sell Protectionc,d | ||||||||||||||||||||||||||||||||||||||||
| Single Name | ||||||||||||||||||||||||||||||||||||||||
Government of Turkey | 1.00 | % | Quarterly | 6/20/27 | 811,000 | $ | (189,641 | ) | $ | (162,517 | ) | $ | (27,124 | ) | B+ | |||||||||||||||||||||||||
|
| |||||||||||||||||||||||||||||||||||||||
Total Centrally Cleared Swap Contracts |
| $ | (247,656 | ) | $ | (351,450 | ) | $ | 103,794 | |||||||||||||||||||||||||||||||
|
| |||||||||||||||||||||||||||||||||||||||
| OTC Swap Contracts | ||||||||||||||||||||||||||||||||||||||||
| Contracts to Buy Protectionc | ||||||||||||||||||||||||||||||||||||||||
| Single Name | Counterparty | |||||||||||||||||||||||||||||||||||||||
Air France-KLM | (5.00)% | Quarterly | GSCO | 12/20/22 | 100,000 | EUR | (1,952 | ) | (974 | ) | (978 | ) | ||||||||||||||||||||||||||||
Air France-KLM | (5.00)% | Quarterly | JPHQ | 6/20/22 | 73,000 | EUR | (852 | ) | (81 | ) | (771 | ) | ||||||||||||||||||||||||||||
Air France-KLM | (5.00)% | Quarterly | JPHQ | 6/20/22 | 23,000 | EUR | (268 | ) | (53 | ) | (215 | ) | ||||||||||||||||||||||||||||
Air France-KLM | (5.00)% | Quarterly | JPHQ | 6/20/22 | 44,000 | EUR | (514 | ) | (51 | ) | (463 | ) | ||||||||||||||||||||||||||||
Air France-KLM | (5.00)% | Quarterly | JPHQ | 6/20/22 | 44,000 | EUR | (514 | ) | (51 | ) | (463 | ) | ||||||||||||||||||||||||||||
AkzoNobel | (1.00)% | Quarterly | CITI | 6/20/27 | 100,000 | EUR | (1,619 | ) | (2,058 | ) | 439 | |||||||||||||||||||||||||||||
Ally Financial Inc. | (5.00)% | Quarterly | BZWS | 6/20/27 | 107,000 | (14,667 | ) | (14,004 | ) | (663 | ) | |||||||||||||||||||||||||||||
Ally Financial Inc. | (5.00)% | Quarterly | GSCO | 6/20/27 | 355,000 | (48,660 | ) | (46,879 | ) | (1,781 | ) | |||||||||||||||||||||||||||||
Ally Financial Inc. | (5.00)% | Quarterly | GSCO | 6/20/27 | 142,000 | (19,464 | ) | (17,251 | ) | (2,213 | ) | |||||||||||||||||||||||||||||
Ally Financial Inc. | (5.00)% | Quarterly | GSCO | 6/20/27 | 142,000 | (19,464 | ) | (16,413 | ) | (3,051 | ) | |||||||||||||||||||||||||||||
American Airlines Inc. | (5.00)% | Quarterly | BZWS | 6/20/23 | 216,000 | 3,802 | 7,661 | (3,859 | ) | |||||||||||||||||||||||||||||||
American Airlines Inc. | (5.00)% | Quarterly | BZWS | 12/20/23 | 111,000 | 4,908 | 4,422 | 486 | ||||||||||||||||||||||||||||||||
American Airlines Inc. | (5.00)% | Quarterly | BZWS | 12/20/23 | 332,000 | 14,679 | 11,295 | 3,384 | ||||||||||||||||||||||||||||||||
American Airlines Inc. | (5.00)% | Quarterly | BZWS | 6/20/24 | 143,000 | 9,718 | 6,129 | 3,589 | ||||||||||||||||||||||||||||||||
American Airlines Inc. | (5.00)% | Quarterly | BZWS | 6/20/24 | 286,000 | 19,435 | 24,599 | (5,164 | ) | |||||||||||||||||||||||||||||||
American Airlines Inc. | (5.00)% | Quarterly | BZWS | 6/20/25 | 72,000 | 8,827 | 10,591 | (1,764 | ) | |||||||||||||||||||||||||||||||
American Airlines Inc. | (5.00)% | Quarterly | BZWS | 6/20/25 | 288,000 | 35,346 | 40,211 | (4,865 | ) | |||||||||||||||||||||||||||||||
American Airlines Inc. | (5.00)% | Quarterly | BZWS | 12/20/26 | 116,000 | 20,275 | 8,971 | 11,304 | ||||||||||||||||||||||||||||||||
American Airlines Inc. | (5.00)% | Quarterly | BZWS | 12/20/26 | 186,000 | 32,509 | 26,817 | 5,692 | ||||||||||||||||||||||||||||||||
American Airlines Inc. | (5.00)% | Quarterly | CITI | 6/20/26 | 103,000 | 16,597 | 8,063 | 8,534 | ||||||||||||||||||||||||||||||||
American Airlines Inc. | (5.00)% | Quarterly | CITI | 6/20/26 | 96,000 | 15,469 | 8,113 | 7,356 | ||||||||||||||||||||||||||||||||
American Airlines Inc. | (5.00)% | Quarterly | FBCO | 12/20/23 | 93,000 | 4,112 | 5,170 | (1,058 | ) | |||||||||||||||||||||||||||||||
American Airlines Inc. | (5.00)% | Quarterly | FBCO | 12/20/26 | 155,000 | 27,091 | 11,987 | 15,104 | ||||||||||||||||||||||||||||||||
American Airlines Inc. | (5.00)% | Quarterly | GSCO | 12/20/23 | 155,000 | 6,853 | 10,399 | (3,546 | ) | |||||||||||||||||||||||||||||||
American Airlines Inc. | (5.00)% | Quarterly | GSCO | 12/20/23 | 772,000 | 34,133 | 18,016 | 16,117 | ||||||||||||||||||||||||||||||||
American Airlines Inc. | (5.00)% | Quarterly | GSCO | 12/20/23 | 355,000 | 15,696 | 32,515 | (16,819 | ) | |||||||||||||||||||||||||||||||
American Airlines Inc. | (5.00)% | Quarterly | GSCO | 6/20/24 | 72,000 | 4,893 | 6,016 | (1,123 | ) | |||||||||||||||||||||||||||||||
American Airlines Inc. | (5.00)% | Quarterly | JPHQ | 12/20/25 | 241,000 | 34,495 | 34,928 | (433 | ) | |||||||||||||||||||||||||||||||
American Axle & Manufacturing Inc. | (5.00)% | Quarterly | BZWS | 6/20/27 | 1,013,000 | 31,780 | 1,982 | 29,798 | ||||||||||||||||||||||||||||||||
Anglo American PLC | (5.00)% | Quarterly | CITI | 6/20/27 | 142,000 | EUR | (26,845 | ) | (23,031 | ) | (3,814 | ) | ||||||||||||||||||||||||||||
ArcelorMittal SA | (5.00)% | Quarterly | CITI | 6/20/27 | 140,000 | EUR | (21,886 | ) | (17,950 | ) | (3,936 | ) | ||||||||||||||||||||||||||||
ArcelorMittal SA | (5.00)% | Quarterly | CITI | 6/20/27 | 42,000 | EUR | (6,566 | ) | (5,629 | ) | (937 | ) | ||||||||||||||||||||||||||||
ArcelorMittal SA | (5.00)% | Quarterly | CITI | 6/20/27 | 42,000 | EUR | (6,566 | ) | (5,388 | ) | (1,178 | ) | ||||||||||||||||||||||||||||
Boeing Co. (The) | (1.00)% | Quarterly | BZWS | 6/20/27 | 90,000 | 4,729 | 3,760 | 969 | ||||||||||||||||||||||||||||||||
Boeing Co. (The) | (1.00)% | Quarterly | CITI | 6/20/27 | 49,000 | 2,575 | 2,027 | 548 | ||||||||||||||||||||||||||||||||
Boeing Co. (The) | (1.00)% | Quarterly | CITI | 6/20/27 | 313,000 | 16,448 | 9,394 | 7,054 | ||||||||||||||||||||||||||||||||
Campbell’s Soup Co. | (1.00)% | Quarterly | BZWS | 6/20/27 | 423,000 | (5,891 | ) | (4,545 | ) | (1,346 | ) | |||||||||||||||||||||||||||||
Campbell’s Soup Co. | (1.00)% | Quarterly | BZWS | 6/20/27 | 282,000 | (3,927 | ) | (2,884 | ) | (1,043 | ) | |||||||||||||||||||||||||||||
Clariant AG | (1.00)% | Quarterly | BOFA | 12/20/23 | 100,000 | EUR | (995 | ) | (515 | ) | (480 | ) | ||||||||||||||||||||||||||||
Clariant AG | (1.00)% | Quarterly | BOFA | 12/20/23 | 100,000 | EUR | (995 | ) | (515 | ) | (480 | ) | ||||||||||||||||||||||||||||
Compagnie de Saint-Gobain SA | (1.00)% | Quarterly | CITI | 6/20/27 | 222,000 | EUR | (2,813 | ) | (3,926 | ) | 1,113 | |||||||||||||||||||||||||||||
Compagnie de Saint-Gobain SA | (1.00)% | Quarterly | CITI | 6/20/27 | 300,000 | EUR | (3,801 | ) | (3,289 | ) | (512 | ) | ||||||||||||||||||||||||||||
| 80 | Annual Report | franklintempleton.com | ||||||||
FRANKLIN ALTERNATIVE STRATEGIES FUNDS
CONSOLIDATED SCHEDULE OF INVESTMENTS
Franklin K2 Alternative Strategies Fund (continued)
| Credit Default Swap Contracts (continued) | ||||||||||||||||||||||||||||||||||||||||
| Description | Annual Payment Rate Received (Paid) | Payment Frequency | Counterparty | Maturity Date | Notional Amounta | Value | Unamortized Upfront Payments (Receipts) | Unrealized Appreciation (Depreciation) | Ratingb | |||||||||||||||||||||||||||||||
| OTC Swap Contracts (continued) | ||||||||||||||||||||||||||||||||||||||||
| Contracts to Buy Protectionc (continued) | ||||||||||||||||||||||||||||||||||||||||
| Single Name (continued) | ||||||||||||||||||||||||||||||||||||||||
Compagnie de Saint-Gobain SA | (1.00)% | Quarterly | CITI | 6/20/27 | 210,000 | EUR | $ | (2,660 | ) | $ | (2,381 | ) | $ | (279 | ) | |||||||||||||||||||||||||
Compagnie de Saint-Gobain SA | (1.00)% | Quarterly | CITI | 6/20/27 | 200,000 | EUR | (2,534 | ) | (2,355 | ) | (179 | ) | ||||||||||||||||||||||||||||
Compagnie de Saint-Gobain SA | (1.00)% | Quarterly | CITI | 6/20/27 | 142,000 | EUR | (1,799 | ) | (2,061 | ) | 262 | |||||||||||||||||||||||||||||
Compagnie de Saint-Gobain SA | (1.00)% | Quarterly | CITI | 6/20/27 | 118,000 | EUR | (1,495 | ) | (1,708 | ) | 213 | |||||||||||||||||||||||||||||
Compagnie de Saint-Gobain SA | (1.00)% | Quarterly | CITI | 6/20/27 | 29,000 | EUR | (367 | ) | (281 | ) | (86 | ) | ||||||||||||||||||||||||||||
Conagra Brands | (1.00)% | Quarterly | BZWS | 6/20/27 | 494,000 | (1,437 | ) | 228 | (1,665 | ) | ||||||||||||||||||||||||||||||
Conagra Brands | (1.00)% | Quarterly | GSCO | 6/20/27 | 291,000 | (847 | ) | 242 | (1,089 | ) | ||||||||||||||||||||||||||||||
D.R. Horton Inc. | (1.00)% | Quarterly | JPHQ | 6/20/27 | 87,000 | 1,062 | (807 | ) | 1,869 | |||||||||||||||||||||||||||||||
Danone SA | (1.00)% | Quarterly | CITI | 6/20/27 | 140,000 | EUR | (4,053 | ) | (4,445 | ) | 392 | |||||||||||||||||||||||||||||
Danone SA | (1.00)% | Quarterly | CITI | 6/20/27 | 117,000 | EUR | (3,387 | ) | (3,565 | ) | 178 | |||||||||||||||||||||||||||||
Danone SA | (1.00)% | Quarterly | CITI | 6/20/27 | 70,000 | EUR | (2,026 | ) | (2,222 | ) | 196 | |||||||||||||||||||||||||||||
Danone SA | (1.00)% | Quarterly | CITI | 6/20/27 | 70,000 | EUR | (2,026 | ) | (2,173 | ) | 147 | |||||||||||||||||||||||||||||
Deutsche Lufthansa AG | (1.00)% | Quarterly | MSCS | 6/20/27 | 72,000 | EUR | 8,700 | 8,506 | 194 | |||||||||||||||||||||||||||||||
Deutsche Lufthansa AG | (1.00)% | Quarterly | MSCS | 6/20/27 | 180,000 | EUR | 21,751 | 21,195 | 556 | |||||||||||||||||||||||||||||||
Dow Inc. | (1.00)% | Quarterly | BZWS | 6/20/27 | 141,000 | (806 | ) | (392 | ) | (414 | ) | |||||||||||||||||||||||||||||
Dow Inc. | (1.00)% | Quarterly | JPHQ | 6/20/27 | 579,000 | (3,311 | ) | (1,073 | ) | (2,238 | ) | |||||||||||||||||||||||||||||
EnBW AG | (1.00)% | Quarterly | BZWS | 6/20/27 | 279,000 | EUR | (4,111 | ) | (5,692 | ) | 1,581 | |||||||||||||||||||||||||||||
FedEx Corp. | (1.00)% | Quarterly | BNPP | 6/20/27 | 117,000 | (1,472 | ) | (1,412 | ) | (60 | ) | |||||||||||||||||||||||||||||
FedEx Corp. | (1.00)% | Quarterly | BZWS | 6/20/27 | 280,000 | (3,523 | ) | (3,918 | ) | 395 | ||||||||||||||||||||||||||||||
FedEx Corp. | (1.00)% | Quarterly | BZWS | 6/20/27 | 140,000 | (1,762 | ) | (1,968 | ) | 206 | ||||||||||||||||||||||||||||||
FedEx Corp. | (1.00)% | Quarterly | BZWS | 6/20/27 | 140,000 | (1,762 | ) | (1,480 | ) | (282 | ) | |||||||||||||||||||||||||||||
FedEx Corp. | (1.00)% | Quarterly | GSCO | 6/20/27 | 140,000 | (1,762 | ) | (1,839 | ) | 77 | ||||||||||||||||||||||||||||||
FedEx Corp. | (1.00)% | Quarterly | JPHQ | 6/20/27 | 140,000 | (1,762 | ) | (1,690 | ) | (72 | ) | |||||||||||||||||||||||||||||
FedEx Corp. | (1.00)% | Quarterly | JPHQ | 6/20/27 | 140,000 | (1,762 | ) | (1,448 | ) | (314 | ) | |||||||||||||||||||||||||||||
Ford Motor Co. | (5.00)% | Quarterly | BNPP | 6/20/27 | 82,000 | (7,472 | ) | (7,417 | ) | (55 | ) | |||||||||||||||||||||||||||||
Ford Motor Co. | (5.00)% | Quarterly | CITI | 6/20/27 | 55,000 | (5,012 | ) | (6,177 | ) | 1,165 | ||||||||||||||||||||||||||||||
Ford Motor Co. | (5.00)% | Quarterly | CITI | 6/20/27 | 55,000 | (5,012 | ) | (5,996 | ) | 984 | ||||||||||||||||||||||||||||||
Ford Motor Co. | (5.00)% | Quarterly | CITI | 6/20/27 | 36,000 | (3,281 | ) | (3,980 | ) | 699 | ||||||||||||||||||||||||||||||
Ford Motor Co. | (5.00)% | Quarterly | CITI | 6/20/27 | 42,000 | (3,827 | ) | (3,681 | ) | (146 | ) | |||||||||||||||||||||||||||||
Ford Motor Co. | (5.00)% | Quarterly | CITI | 6/20/27 | 42,000 | (3,827 | ) | (3,541 | ) | (286 | ) | |||||||||||||||||||||||||||||
Ford Motor Co. | (5.00)% | Quarterly | CITI | 6/20/27 | 42,000 | (3,827 | ) | (3,159 | ) | (668 | ) | |||||||||||||||||||||||||||||
Ford Motor Co. | (5.00)% | Quarterly | CITI | 6/20/27 | 42,000 | (3,827 | ) | (2,611 | ) | (1,216 | ) | |||||||||||||||||||||||||||||
Ford Motor Co. | (5.00)% | Quarterly | GSCO | 6/20/27 | 84,000 | (7,655 | ) | (7,576 | ) | (79 | ) | |||||||||||||||||||||||||||||
Ford Motor Co. | (5.00)% | Quarterly | GSCO | 6/20/27 | 84,000 | (7,655 | ) | (7,567 | ) | (88 | ) | |||||||||||||||||||||||||||||
Ford Motor Co. | (5.00)% | Quarterly | GSCO | 6/20/27 | 84,000 | (7,655 | ) | (7,381 | ) | (274 | ) | |||||||||||||||||||||||||||||
Ford Motor Co. | (5.00)% | Quarterly | GSCO | 6/20/27 | 42,000 | (3,827 | ) | (3,822 | ) | (5 | ) | |||||||||||||||||||||||||||||
Ford Motor Credit Co. LLC | (5.00)% | Quarterly | CITI | 6/20/27 | 227,000 | (20,863 | ) | (11,375 | ) | (9,488 | ) | |||||||||||||||||||||||||||||
Ford Motor Credit Co. LLC | (5.00)% | Quarterly | CITI | 6/20/27 | 142,000 | (13,051 | ) | (8,560 | ) | (4,491 | ) | |||||||||||||||||||||||||||||
Ford Motor Credit Co. LLC | (5.00)% | Quarterly | CITI | 6/20/27 | 71,000 | (6,525 | ) | (4,883 | ) | (1,642 | ) | |||||||||||||||||||||||||||||
Ford Motor Credit Co. LLC | (5.00)% | Quarterly | CITI | 6/20/27 | 71,000 | (6,525 | ) | (4,415 | ) | (2,110 | ) | |||||||||||||||||||||||||||||
| franklintempleton.com | Annual Report | 81 | ||||||||
FRANKLIN ALTERNATIVE STRATEGIES FUNDS
CONSOLIDATED SCHEDULE OF INVESTMENTS
Franklin K2 Alternative Strategies Fund (continued)
| Credit Default Swap Contracts (continued) | ||||||||||||||||||||||||||||||||||||||||
| Description | Annual Payment Rate Received (Paid) | Payment Frequency | Counterparty | Maturity Date | Notional Amounta | Value | Unamortized Upfront Payments (Receipts) | Unrealized Appreciation (Depreciation) | Ratingb | |||||||||||||||||||||||||||||||
| OTC Swap Contracts (continued) | ||||||||||||||||||||||||||||||||||||||||
| Contracts to Buy Protectionc (continued) | ||||||||||||||||||||||||||||||||||||||||
| Single Name (continued) | ||||||||||||||||||||||||||||||||||||||||
GE Capital Funding LLC | (1.00)% | Quarterly | JPHQ | 12/20/26 | 296,000 | $ | 2,386 | $ | (2,591 | ) | $ | 4,977 | ||||||||||||||||||||||||||||
General Motors Co. | (5.00)% | Quarterly | BNPP | 6/20/27 | 245,000 | (32,400 | ) | (31,447 | ) | (953 | ) | |||||||||||||||||||||||||||||
General Motors Co. | (5.00)% | Quarterly | BNPP | 6/20/27 | 159,000 | (21,027 | ) | (18,898 | ) | (2,129 | ) | |||||||||||||||||||||||||||||
General Motors Co. | (5.00)% | Quarterly | BNPP | 6/20/27 | 114,000 | (15,076 | ) | (13,200 | ) | (1,876 | ) | |||||||||||||||||||||||||||||
General Motors Co. | (5.00)% | Quarterly | BNPP | 6/20/27 | 55,000 | (7,274 | ) | (7,213 | ) | (61 | ) | |||||||||||||||||||||||||||||
General Motors Co. | (5.00)% | Quarterly | BOFA | 6/20/27 | 110,000 | (14,547 | ) | (14,239 | ) | (308 | ) | |||||||||||||||||||||||||||||
General Motors Co. | (5.00)% | Quarterly | BZWS | 6/20/27 | 222,000 | (29,359 | ) | (26,881 | ) | (2,478 | ) | |||||||||||||||||||||||||||||
General Motors Co. | (5.00)% | Quarterly | BZWS | 6/20/27 | 138,000 | (18,250 | ) | (17,492 | ) | (758 | ) | |||||||||||||||||||||||||||||
General Motors Co. | (5.00)% | Quarterly | BZWS | 6/20/27 | 55,000 | (7,274 | ) | (6,671 | ) | (603 | ) | |||||||||||||||||||||||||||||
General Motors Co. | (5.00)% | Quarterly | BZWS | 6/20/27 | 42,000 | (5,554 | ) | (5,365 | ) | (189 | ) | |||||||||||||||||||||||||||||
General Motors Co. | (5.00)% | Quarterly | GSCO | 6/20/27 | 91,000 | (12,034 | ) | (10,512 | ) | (1,522 | ) | |||||||||||||||||||||||||||||
General Motors Co. | (5.00)% | Quarterly | JPHQ | 6/20/27 | 547,000 | (72,338 | ) | (76,599 | ) | 4,261 | ||||||||||||||||||||||||||||||
General Motors Co. | (5.00)% | Quarterly | JPHQ | 6/20/27 | 109,000 | (14,415 | ) | (15,462 | ) | 1,047 | ||||||||||||||||||||||||||||||
Glencore Funding LLC | (5.00)% | Quarterly | CITI | 6/20/27 | 70,000 | EUR | (12,356 | ) | (12,459 | ) | 103 | |||||||||||||||||||||||||||||
Government of Argentina | (5.00)% | Quarterly | BZWS | 12/20/26 | 696,000 | 395,871 | 351,475 | 44,396 | ||||||||||||||||||||||||||||||||
Government of Argentina | (5.00)% | Quarterly | GSCO | 12/20/26 | 253,000 | 143,901 | 125,726 | 18,175 | ||||||||||||||||||||||||||||||||
Government of Argentina | (5.00)% | Quarterly | GSCO | 12/20/26 | 842,000 | 478,913 | 418,031 | 60,882 | ||||||||||||||||||||||||||||||||
Government of Argentina | (5.00)% | Quarterly | JPHQ | 12/20/26 | 253,000 | 143,901 | 125,608 | 18,293 | ||||||||||||||||||||||||||||||||
Government of Colombia | (1.00)% | Quarterly | GSCO | 6/20/25 | 2,600,000 | 25,559 | 42,763 | (17,204 | ) | |||||||||||||||||||||||||||||||
Government of Egypt | (1.00)% | Quarterly | BZWS | 6/20/24 | 695,000 | 74,561 | 58,527 | 16,034 | ||||||||||||||||||||||||||||||||
Government of Italy | (1.00)% | Quarterly | BOFA | 6/20/24 | 132,000 | (1,354 | ) | 1,277 | (2,631 | ) | ||||||||||||||||||||||||||||||
Government of Italy | (1.00)% | Quarterly | JPHQ | 6/20/24 | 218,000 | (2,236 | ) | 981 | (3,217 | ) | ||||||||||||||||||||||||||||||
Government of Mexico | (1.00)% | Quarterly | BZWS | 6/20/26 | 1,510,000 | (1,334 | ) | 4,705 | (6,039 | ) | ||||||||||||||||||||||||||||||
Government of Mexico | (1.00)% | Quarterly | CITI | 12/20/26 | 345,000 | 1,579 | (150 | ) | 1,729 | |||||||||||||||||||||||||||||||
Government of Turkey | (1.00)% | Quarterly | BZWS | �� | 6/20/24 | 1,175,000 | 131,864 | 131,533 | 331 | |||||||||||||||||||||||||||||||
Government of Turkey | (1.00)% | Quarterly | GSCO | 12/20/23 | 1,220,000 | 104,967 | 80,602 | 24,365 | ||||||||||||||||||||||||||||||||
Government of Turkey | (1.00)% | Quarterly | GSCO | 6/20/24 | 1,300,000 | 145,892 | 154,990 | (9,098 | ) | |||||||||||||||||||||||||||||||
Government of Ukraine | (1.00)% | Quarterly | HSBC | 12/20/26 | 606,000 | 391,962 | 363,451 | 28,511 | ||||||||||||||||||||||||||||||||
Hochtief AG | (5.00)% | Quarterly | CITI | 6/20/27 | 109,000 | EUR | (18,455 | ) | (21,834 | ) | 3,379 | |||||||||||||||||||||||||||||
Hochtief AG | (5.00)% | Quarterly | JPHQ | 6/20/27 | 139,000 | EUR | (23,534 | ) | (26,637 | ) | 3,103 | |||||||||||||||||||||||||||||
Hochtief AG | (5.00)% | Quarterly | JPHQ | 6/20/27 | 69,000 | EUR | (11,683 | ) | (13,222 | ) | 1,539 | |||||||||||||||||||||||||||||
HP Inc. | (1.00)% | Quarterly | BNPP | 6/20/27 | 125,000 | (2 | ) | (520 | ) | 518 | ||||||||||||||||||||||||||||||
HP Inc. | (1.00)% | Quarterly | BNPP | 6/20/27 | 313,000 | (6 | ) | (288 | ) | 282 | ||||||||||||||||||||||||||||||
HP Inc. | (1.00)% | Quarterly | BNPP | 6/20/27 | 61,000 | (1 | ) | — | (1 | ) | ||||||||||||||||||||||||||||||
HP Inc. | (1.00)% | Quarterly | BNPP | 6/20/27 | 125,000 | (2 | ) | 172 | (174 | ) | ||||||||||||||||||||||||||||||
HP Inc. | (1.00)% | Quarterly | GSCO | 6/20/27 | 270,000 | (5 | ) | 1,230 | (1,235 | ) | ||||||||||||||||||||||||||||||
HP Inc. | (1.00)% | Quarterly | JPHQ | 6/20/27 | 118,000 | (2 | ) | 108 | (110 | ) | ||||||||||||||||||||||||||||||
Iceland Bondco | (5.00)% | Quarterly | JPHQ | 6/20/25 | 24,000 | EUR | 2,181 | 996 | 1,185 | |||||||||||||||||||||||||||||||
Intrum Justitia | (5.00)% | Quarterly | MSCS | 6/20/27 | 309,000 | EUR | (1,772 | ) | (12,349 | ) | 10,577 | |||||||||||||||||||||||||||||
Intrum Justitia | (5.00)% | Quarterly | MSCS | 6/20/27 | 190,000 | EUR | (1,090 | ) | (2,798 | ) | 1,708 | |||||||||||||||||||||||||||||
Kohl’s Corp. | (1.00)% | Quarterly | GSCO | 6/20/26 | 139,000 | 10,557 | 2,301 | 8,256 | ||||||||||||||||||||||||||||||||
Lanxess | (1.00)% | Quarterly | BZWS | 6/20/27 | 163,000 | EUR | 2,651 | 1,297 | 1,354 | |||||||||||||||||||||||||||||||
Lanxess | (1.00)% | Quarterly | JPHQ | 6/20/27 | 72,000 | EUR | 1,171 | 2,472 | (1,301 | ) | ||||||||||||||||||||||||||||||
Lanxess | (1.00)% | Quarterly | JPHQ | 6/20/27 | 270,000 | EUR | 4,391 | 9,272 | (4,881 | ) | ||||||||||||||||||||||||||||||
Lloyds Bank | (1.00)% | Quarterly | BZWS | 6/20/27 | 143,000 | EUR | 3,045 | 4,597 | (1,552 | ) | ||||||||||||||||||||||||||||||
| 82 | Annual Report | franklintempleton.com | ||||||||
FRANKLIN ALTERNATIVE STRATEGIES FUNDS
CONSOLIDATED SCHEDULE OF INVESTMENTS
Franklin K2 Alternative Strategies Fund (continued)
| Credit Default Swap Contracts (continued) | ||||||||||||||||||||||||||||||||||||||||
| Description | Annual Payment Rate Received (Paid) | Payment Frequency | Counterparty | Maturity Date | Notional Amounta | Value | Unamortized Upfront Payments (Receipts) | Unrealized Appreciation (Depreciation) | Ratingb | |||||||||||||||||||||||||||||||
| OTC Swap Contracts (continued) | ||||||||||||||||||||||||||||||||||||||||
| Contracts to Buy Protectionc (continued) | ||||||||||||||||||||||||||||||||||||||||
| Single Name (continued) | ||||||||||||||||||||||||||||||||||||||||
Lloyds Bank | (1.00)% | Quarterly | CITI | 6/20/27 | 71,000 | EUR | $ | 1,664 | $ | 1,852 | $ | (188 | ) | |||||||||||||||||||||||||||
Lloyds Bank | (1.00)% | Quarterly | CITI | 6/20/27 | 356,000 | EUR | 7,580 | 10,881 | (3,301 | ) | ||||||||||||||||||||||||||||||
Louis Dreyfus Co. | (5.00)% | Quarterly | JPHQ | 6/20/27 | 133,000 | EUR | (18,647 | ) | (13,671 | ) | (4,976 | ) | ||||||||||||||||||||||||||||
MBIA Inc. | (5.00)% | Quarterly | BZWS | 6/20/22 | 24,000 | (286 | ) | (15 | ) | (271 | ) | |||||||||||||||||||||||||||||
MBIA Inc. | (5.00)% | Quarterly | CITI | 6/20/22 | 40,000 | (477 | ) | (68 | ) | (409 | ) | |||||||||||||||||||||||||||||
MBIA Inc. | (5.00)% | Quarterly | GSCO | 6/20/22 | 25,000 | (298 | ) | (34 | ) | (264 | ) | |||||||||||||||||||||||||||||
Michelin | (1.00)% | Quarterly | GSCO | 6/20/27 | 200,000 | EUR | (5,080 | ) | (4,565 | ) | (515 | ) | ||||||||||||||||||||||||||||
Next PLC | (1.00)% | Quarterly | BOFA | 6/20/27 | 68,000 | EUR | 2,499 | 1,899 | 600 | |||||||||||||||||||||||||||||||
Next PLC | (1.00)% | Quarterly | CITI | 6/20/27 | 73,000 | EUR | 2,683 | 751 | 1,932 | |||||||||||||||||||||||||||||||
Next PLC | (1.00)% | Quarterly | CITI | 6/20/27 | 73,000 | EUR | 2,683 | 788 | 1,895 | |||||||||||||||||||||||||||||||
Next PLC | (1.00)% | Quarterly | CITI | 6/20/27 | 41,000 | EUR | 1,507 | 1,174 | 333 | |||||||||||||||||||||||||||||||
Next PLC | (1.00)% | Quarterly | CITI | 6/20/27 | 43,000 | EUR | 1,580 | 1,566 | 14 | |||||||||||||||||||||||||||||||
Next PLC | (1.00)% | Quarterly | CITI | 6/20/27 | 145,000 | EUR | 5,329 | 4,425 | 904 | |||||||||||||||||||||||||||||||
Novafives SAS | (5.00)% | Quarterly | JPHQ | 12/20/24 | 28,000 | EUR | 4,298 | 5,792 | (1,494 | ) | ||||||||||||||||||||||||||||||
Novafives SAS | (5.00)% | Quarterly | JPHQ | 12/20/24 | 71,000 | EUR | 10,898 | 14,475 | (3,577 | ) | ||||||||||||||||||||||||||||||
Picard Groupe SAS | (5.00)% | Quarterly | BNPP | 6/20/27 | 169,000 | EUR | 5,965 | (4,191 | ) | 10,156 | ||||||||||||||||||||||||||||||
Picard Groupe SAS | (5.00)% | Quarterly | MSCO | 6/20/27 | 82,000 | EUR | 2,894 | (731 | ) | 3,625 | ||||||||||||||||||||||||||||||
Sherwin-Williams Co. (The) | (1.00)% | Quarterly | CITI | 6/20/27 | 700,000 | (5,776 | ) | (1,453 | ) | (4,323 | ) | |||||||||||||||||||||||||||||
Sherwin-Williams Co. (The) | (1.00)% | Quarterly | JPHQ | 6/20/27 | 140,000 | (1,155 | ) | (845 | ) | (310 | ) | |||||||||||||||||||||||||||||
Simon Property Group LP | (1.00)% | Quarterly | BZWS | 6/20/27 | 520,000 | 2,650 | (1,205 | ) | 3,855 | |||||||||||||||||||||||||||||||
Societe Generale SA | (1.00)% | Quarterly | BZWS | 12/20/23 | 700,000 | EUR | (7,047 | ) | 4,717 | (11,764 | ) | |||||||||||||||||||||||||||||
Softbank Group Corp. | (1.00)% | Quarterly | BZWS | 6/20/27 | 17,780,000 | JPY | 18,027 | 19,233 | (1,206 | ) | ||||||||||||||||||||||||||||||
Softbank Group Corp. | (1.00)% | Quarterly | BZWS | 6/20/27 | 27,440,000 | JPY | 27,821 | 28,168 | (347 | ) | ||||||||||||||||||||||||||||||
Solvay SA | (1.00)% | Quarterly | GSCO | 6/20/27 | 140,000 | EUR | (578 | ) | (1,280 | ) | 702 | |||||||||||||||||||||||||||||
Solvay SA | (1.00)% | Quarterly | GSCO | 6/20/27 | 119,000 | EUR | (491 | ) | (1,146 | ) | 655 | |||||||||||||||||||||||||||||
Solvay SA | (1.00)% | Quarterly | GSCO | 6/20/27 | 138,000 | EUR | (570 | ) | (958 | ) | 388 | |||||||||||||||||||||||||||||
Standard Chartered PLC | (1.00)% | Quarterly | GSCO | 6/20/27 | 25,000 | EUR | 841 | 980 | (139 | ) | ||||||||||||||||||||||||||||||
Standard Chartered PLC | (1.00)% | Quarterly | GSCO | 6/20/27 | 44,000 | EUR | 1,481 | 2,116 | (635 | ) | ||||||||||||||||||||||||||||||
Standard Chartered PLC | (1.00)% | Quarterly | JPHQ | 6/20/27 | 35,000 | EUR | 1,178 | 1,603 | (425 | ) | ||||||||||||||||||||||||||||||
Stena AB | (5.00)% | Quarterly | BZWS | 6/20/24 | 71,000 | EUR | (3,747 | ) | (2,155 | ) | (1,592 | ) | ||||||||||||||||||||||||||||
Stena AB | (5.00)% | Quarterly | GSCO | 12/20/24 | 273,000 | EUR | (14,213 | ) | (13,795 | ) | (418 | ) | ||||||||||||||||||||||||||||
Stena AB | (5.00)% | Quarterly | GSCO | 6/20/27 | 14,000 | EUR | (216 | ) | (30 | ) | (186 | ) | ||||||||||||||||||||||||||||
Stena AB | (5.00)% | Quarterly | JPHQ | 6/20/27 | 29,000 | EUR | (452 | ) | 308 | (760 | ) | |||||||||||||||||||||||||||||
Stena AB | (5.00)% | Quarterly | JPHQ | 6/20/27 | 29,000 | EUR | (452 | ) | 369 | (821 | ) | |||||||||||||||||||||||||||||
Stena AB | (5.00)% | Quarterly | JPHQ | 6/20/27 | 28,000 | EUR | (433 | ) | 684 | (1,117 | ) | |||||||||||||||||||||||||||||
Stena AB | (5.00)% | Quarterly | JPHQ | 6/20/27 | 142,000 | EUR | (2,194 | ) | 928 | (3,122 | ) | |||||||||||||||||||||||||||||
Stena AB | (5.00)% | Quarterly | JPHQ | 6/20/27 | 157,000 | EUR | (2,425 | ) | 1,335 | (3,760 | ) | |||||||||||||||||||||||||||||
TDC A/S | (1.00)% | Quarterly | BNPP | 6/20/27 | 212,000 | EUR | 11,900 | 12,075 | (175 | ) | ||||||||||||||||||||||||||||||
U.S. Steel Corp. | (5.00)% | Quarterly | JPHQ | 6/20/27 | 144,000 | (1,781 | ) | (3,562 | ) | 1,781 | ||||||||||||||||||||||||||||||
Whirlpool Corp. | (1.00)% | Quarterly | JPHQ | 6/20/27 | 110,000 | 1,486 | 555 | 931 | ||||||||||||||||||||||||||||||||
Whirlpool Corp. | (1.00)% | Quarterly | JPHQ | 6/20/27 | 140,000 | 1,892 | 706 | 1,186 | ||||||||||||||||||||||||||||||||
Whirlpool Corp. | (1.00)% | Quarterly | JPHQ | 6/20/27 | 63,000 | 851 | 941 | (90 | ) | |||||||||||||||||||||||||||||||
Whirlpool Corp. | (1.00)% | Quarterly | JPHQ | 6/20/27 | 63,000 | 851 | 996 | (145 | ) | |||||||||||||||||||||||||||||||
| franklintempleton.com | Annual Report | 83 | ||||||||
FRANKLIN ALTERNATIVE STRATEGIES FUNDS
CONSOLIDATED SCHEDULE OF INVESTMENTS
Franklin K2 Alternative Strategies Fund (continued)
| Credit Default Swap Contracts (continued) | ||||||||||||||||||||||||||||||||||||||||
| Description | Annual Payment Rate Received (Paid) | Payment Frequency | Counterparty | Maturity Date | Notional Amounta | Value | Unamortized Upfront Payments (Receipts) | Unrealized Appreciation (Depreciation) | Ratingb | |||||||||||||||||||||||||||||||
| OTC Swap Contracts (continued) | ||||||||||||||||||||||||||||||||||||||||
| Contracts to Buy Protectionc (continued) | ||||||||||||||||||||||||||||||||||||||||
| Single Name (continued) | ||||||||||||||||||||||||||||||||||||||||
Whirlpool Corp. | (1.00)% | Quarterly | JPHQ | 6/20/27 | 63,000 | $ | 851 | $ | 1,109 | $ | (258 | ) | ||||||||||||||||||||||||||||
Whirlpool Corp. | (1.00)% | Quarterly | JPHQ | 6/20/27 | 63,000 | 851 | 1,136 | (285 | ) | |||||||||||||||||||||||||||||||
Whirlpool Corp. | (1.00)% | Quarterly | JPHQ | 6/20/27 | 63,000 | 851 | 1,162 | (311 | ) | |||||||||||||||||||||||||||||||
Whirlpool Corp. | (1.00)% | Quarterly | JPHQ | 6/20/27 | 63,000 | 851 | 1,190 | (339 | ) | |||||||||||||||||||||||||||||||
WPP PLC | (1.00)% | Quarterly | CITI | 6/20/27 | 143,000 | EUR | 615 | — | 615 | |||||||||||||||||||||||||||||||
WPP PLC | (1.00)% | Quarterly | CITI | 6/20/27 | 142,000 | EUR | 611 | — | 611 | |||||||||||||||||||||||||||||||
WPP PLC | (1.00)% | Quarterly | CITI | 6/20/27 | 72,000 | EUR | 310 | 55 | 255 | |||||||||||||||||||||||||||||||
WPP PLC | (1.00)% | Quarterly | CITI | 6/20/27 | 144,000 | EUR | 620 | 145 | 475 | |||||||||||||||||||||||||||||||
WPP PLC | (1.00)% | Quarterly | GSCO | 6/20/27 | 141,000 | EUR | 607 | 362 | 245 | |||||||||||||||||||||||||||||||
| Contracts to Sell Protectionc,d | ||||||||||||||||||||||||||||||||||||||||
| Single Name | ||||||||||||||||||||||||||||||||||||||||
American Axle & Manufacturing Inc. | 5.00% | Quarterly | BZWS | 6/20/25 | 147,000 | 4,848 | 4,755 | 93 | BB- | |||||||||||||||||||||||||||||||
Euro Garages Ltd. | 5.00% | Quarterly | GSCO | 6/20/27 | 50,000 | EUR | 2,048 | 988 | 1,060 | B- | ||||||||||||||||||||||||||||||
Kohl’s Corp. | 1.00% | Quarterly | BOFA | 6/20/26 | 141,000 | (10,709 | ) | (10,322 | ) | (387 | ) | BBB- | ||||||||||||||||||||||||||||
|
| |||||||||||||||||||||||||||||||||||||||
Total OTC Swap Contracts |
| $ | 1,849,685 | $ | 1,638,179 | $ | 211,506 | |||||||||||||||||||||||||||||||||
|
| |||||||||||||||||||||||||||||||||||||||
Total Credit Default Swap Contracts |
| $ | 1,602,029 | $ | 1,286,729 | $ | 315,300 | |||||||||||||||||||||||||||||||||
|
| |||||||||||||||||||||||||||||||||||||||
aIn U.S. dollars unless otherwise indicated. For contracts to sell protection, the notional amount is equal to the maximum potential amount of the future payments and no recourse provisions have been entered into in association with the contracts.
bBased on Standard and Poor’s (S&P) Rating for single name swaps.
cPerformance triggers for settlement of contract include default, bankruptcy or restructuring for single name swaps and failure to pay or bankruptcy of the underlying securities for traded index swaps.
dThe Fund enters contracts to sell protection to create a long credit position.
At May 31, 2022, the Fund had the following cross-currency swap contracts outstanding. See Note 1(d).
| Cross-Currency Swap Contracts | ||||||||||||||||||||
| Description | Payment Frequency | Counterparty | Maturity Date | Notional Amount | Value/Unrealized Appreciation (Depreciation) | |||||||||||||||
| OTC Swap Contracts | ||||||||||||||||||||
Receive Floating rate Euro STR – 0.30% | Quarterly | GSCO | 6/21/24 | 11,600,000 | EUR | $ | 196,815 | |||||||||||||
Pay Floating rate Overnight SOFR | $ | 12,064,000 | ||||||||||||||||||
|
| |||||||||||||||||||
Total Cross-Currency Swap Contracts |
| $ | 196,815 | |||||||||||||||||
|
| |||||||||||||||||||
At May 31, 2022, the Fund had the following interest rate swap contracts outstanding. See Note 1(d).
| Interest Rate Swap Contracts | ||||||||||||||||
| Description | Payment Frequency | Maturity Date | Notional Amount* | Value/Unrealized Appreciation (Depreciation) | ||||||||||||
| Centrally Cleared Swap Contracts | ||||||||||||||||
Receive Floating rate FEDEF | Annually | 6/15/22 | 85,800,000 | $ | 3,445 | |||||||||||
Receive Floating rate Overnight SOFR | Annually | 6/15/22 | 85,800,000 | 5,297 | ||||||||||||
Receive Floating rate Overnight SOFR | Annually | 6/15/22 | 85,800,000 | 5,046 | ||||||||||||
| 84 | Annual Report | franklintempleton.com | ||||||||
FRANKLIN ALTERNATIVE STRATEGIES FUNDS
CONSOLIDATED SCHEDULE OF INVESTMENTS
Franklin K2 Alternative Strategies Fund (continued)
| Interest Rate Swap Contracts (continued) | ||||||||||||||||
| Description | Payment Frequency | Maturity Date | Notional Amount* | Value/Unrealized Appreciation (Depreciation) | ||||||||||||
| Centrally Cleared Swap Contracts (continued) | ||||||||||||||||
Receive Floating rate Overnight SOFR | Annually | 6/15/22 | 86,000,000 | $ | 2,250 | |||||||||||
Receive Fixed 4.13% | Annually | 9/15/22 | 1,000,000,000 | INR | (49,115 | ) | ||||||||||
Receive Fixed 1.62% | Quarterly | 9/23/22 | 8,640,000,000 | KRW | (6,873 | ) | ||||||||||
Receive Fixed 5.38% | Annually | 11/18/22 | 460,000,000 | INR | 543 | |||||||||||
Receive Fixed 5.41% | Annually | 11/18/22 | 314,000,000 | INR | 967 | |||||||||||
Receive Fixed 5.43% | Annually | 11/18/22 | 160,000,000 | INR | 695 | |||||||||||
Receive Fixed 5.41% | Annually | 11/23/22 | 476,000,000 | INR | 558 | |||||||||||
Receive Fixed 5.39% | Annually | 11/25/22 | 316,000,000 | INR | (368 | ) | ||||||||||
Receive Fixed 4.23% | Annually | 12/02/22 | 1,550,000,000 | INR | (82,411 | ) | ||||||||||
Receive Fixed 1.34% | Quarterly | 12/15/22 | 46,000,000,000 | KRW | (192,862 | ) | ||||||||||
Receive Fixed 1.39% | Quarterly | 12/15/22 | 9,600,000,000 | KRW | (30,536 | ) | ||||||||||
Receive Fixed 4.53% | Annually | 3/15/23 | 600,000,000 | INR | (84,002 | ) | ||||||||||
Receive Floating MIBOR | Annually | 4/11/23 | 720,000,000 | INR | 89,213 | |||||||||||
Receive Floating MIBOR | Annually | 5/05/23 | 360,000,000 | INR | 13,654 | |||||||||||
Receive Fixed 4.92% | Annually | 5/10/23 | 384,000,000 | INR | 2,163 | |||||||||||
Receive Fixed 6.10% | Annually | 5/10/23 | 372,000,000 | INR | 2,242 | |||||||||||
Receive Fixed 6.16% | Annually | 5/17/23 | 330,000,000 | INR | 2,025 | |||||||||||
Receive Fixed 1.74% | Semi-Annually | 6/15/23 | 4,680,000 | SGD | (4,171 | ) | ||||||||||
Receive Fixed 1.79% | Semi-Annually | 6/15/23 | 24,733,333 | SGD | (13,851 | ) | ||||||||||
Receive Fixed 2.13% | Quarterly | 6/15/23 | 40,000,000 | CNY | 4,378 | |||||||||||
Receive Fixed 2.14% | Quarterly | 6/15/23 | 30,000,000 | CNY | 3,393 | |||||||||||
Receive Fixed 2.19% | Quarterly | 6/15/23 | 88,000,000 | CNY | 16,449 | |||||||||||
Receive Fixed 2.20% | Quarterly | 6/15/23 | 31,000,000 | CNY | 6,595 | |||||||||||
Receive Fixed 2.42% | Annually | 6/15/23 | 6,476,000 | 595 | ||||||||||||
Receive Fixed 6.34% | Annually | 6/15/23 | 540,000,000 | INR | 3,502 | |||||||||||
Receive Floating rate 3-Month-BBSW | Quarterly | 6/15/23 | 28,400,000 | AUD | 11,245 | |||||||||||
Receive Floating rate 3-Month-HIBOR | Quarterly | 6/15/23 | 51,000,000 | HKD | (22,694 | ) | ||||||||||
Receive Floating rate Overnight SOFR | Annually | 6/15/23 | 17,701,600 | (2,853 | ) | |||||||||||
| franklintempleton.com | Annual Report | 85 | ||||||||
FRANKLIN ALTERNATIVE STRATEGIES FUNDS
CONSOLIDATED SCHEDULE OF INVESTMENTS
Franklin K2 Alternative Strategies Fund (continued)
| Interest Rate Swap Contracts (continued) | ||||||||||||||||
| Description | Payment Frequency | Maturity Date | Notional Amount* | Value/Unrealized Appreciation (Depreciation) | ||||||||||||
| Centrally Cleared Swap Contracts (continued) | ||||||||||||||||
Receive Floating rate Overnight SOFR | Annually | 6/15/23 | 3,411,000 | $ | (280 | ) | ||||||||||
Receive Floating rate 3-Month-BBSW | Quarterly | 6/16/23 | 14,300,000 | AUD | 5,686 | |||||||||||
Receive Floating rate 3-Month-BBSW | Quarterly | 9/21/23 | 6,400,000 | AUD | 97 | |||||||||||
Receive Floating rate 3-Month-BBSW | Quarterly | 9/21/23 | 9,400,000 | AUD | (5,227 | ) | ||||||||||
Receive Fixed 2.74% | Semi-Annually | 3/02/24 | 2,000,000 | NZD | (24,888 | ) | ||||||||||
Receive Fixed 2.74% | Semi-Annually | 3/02/24 | 3,000,000 | NZD | (37,478 | ) | ||||||||||
Receive Floating rate 1 Year-SOFR | Annually | 3/08/24 | 4,000,000 | 84,703 | ||||||||||||
Receive Fixed 6.63% | Annually | 3/15/24 | 292,500,000 | INR | (23,869 | ) | ||||||||||
Receive Fixed 6.65% | Annually | 3/15/24 | 585,000,000 | INR | (45,997 | ) | ||||||||||
Receive Fixed 7.36% | Annually | 3/15/24 | 624,000,000 | INR | 2,577 | |||||||||||
Receive Floating MIBOR | Semi-Annually | 4/11/24 | 391,680,000 | INR | (7,485 | ) | ||||||||||
Receive Fixed 6.84% | Annually | 4/19/24 | 630,000,000 | INR | (36,618 | ) | ||||||||||
Receive Fixed 1.58% | Semi-Annually | 6/15/24 | 9,225,000 | SGD | (79,375 | ) | ||||||||||
Receive Fixed 2.26% | Quarterly | 6/15/24 | 22,000,000 | CNY | 7,060 | |||||||||||
Receive Fixed 2.28% | Quarterly | 6/15/24 | 29,700,000 | CNY | 10,960 | |||||||||||
Receive Fixed 2.73% | Quarterly | 6/15/24 | 11,070,000,000 | KRW | (59,613 | ) | ||||||||||
Receive Fixed 3.27% | Semi-Annually | 6/15/24 | 2,000,000 | NZD | (17,113 | ) | ||||||||||
Receive Floating MIBOR | Semi-Annually | 6/15/24 | 240,000,000 | INR | (9,722 | ) | ||||||||||
Receive Floating rate 6 Month-PRIBOR | Semi-Annually | 6/15/24 | 4,549,713 | CZK | 1,207 | |||||||||||
Receive Floating rate 6 Month-PRIBOR | Semi-Annually | 6/15/24 | 67,326,856 | CZK | 10,659 | |||||||||||
Receive Floating rate Overnight SOFR | Annually | 6/15/24 | 9,000,000 | 150,621 | ||||||||||||
Receive Floating rate Overnight SOFR | Annually | 6/15/24 | 6,750,000 | 113,032 | ||||||||||||
Receive Floating rate Overnight SOFR | Annually | 6/15/24 | 3,066,000 | (2,071 | ) | |||||||||||
Receive Fixed 6.47% | Quarterly | 7/27/24 | 49,768,689 | ZAR | 18,046 | |||||||||||
Receive Fixed 2.34% | Semi-Annually | 9/21/24 | 3,640,000 | SGD | 313 | |||||||||||
Receive Fixed 2.34% | Semi-Annually | 9/21/24 | 1,400,000 | SGD | 120 | |||||||||||
Receive Fixed 3.79% | Semi-Annually | 9/21/24 | 4,600,000 | NZD | (20,168 | ) | ||||||||||
Receive Floating rate Overnight SOFR | Monthly | 9/21/24 | 2,690,000 | 588 | ||||||||||||
| 86 | Annual Report | franklintempleton.com | ||||||||
FRANKLIN ALTERNATIVE STRATEGIES FUNDS
CONSOLIDATED SCHEDULE OF INVESTMENTS
Franklin K2 Alternative Strategies Fund (continued)
| Interest Rate Swap Contracts (continued) | ||||||||||||||||
| Description | �� | Payment Frequency | Maturity Date | Notional Amount* | Value/Unrealized Appreciation (Depreciation) | |||||||||||
| Centrally Cleared Swap Contracts (continued) | ||||||||||||||||
Receive Floating rate Overnight SOFR | Annually | 9/21/24 | 1,030,000 | $ | (275 | ) | ||||||||||
Receive Floating rate Overnight SOFR | Annually | 12/20/24 | 42,400,000 | (6,561 | ) | |||||||||||
Receive Fixed 8.44% | Annually | 1/02/25 | 12,000,000 | BRL | (180,513 | ) | ||||||||||
Receive Floating MIBOR | Semi-Annually | 6/15/25 | 180,000,000 | INR | 18,006 | |||||||||||
Receive Fixed 6.30% | Quarterly | 7/31/25 | 53,795,745 | ZAR | (78,313 | ) | ||||||||||
Receive Fixed 7.57% | Quarterly | 11/04/25 | 39,000,000 | ZAR | (6,040 | ) | ||||||||||
Receive Fixed 3.31% | Quarterly | 12/17/25 | 4,360,000,000 | KRW | (1,293 | ) | ||||||||||
Receive Fixed 3.31% | Quarterly | 12/20/25 | 15,136,000,000 | KRW | (4,459 | ) | ||||||||||
Receive Floating 3-Month-KDR | Quarterly | 6/11/26 | 3,520,000,000 | KRW | 1,523 | |||||||||||
Receive Floating rate 3-Month USD LIBOR | Quarterly | 6/16/26 | 1,400,000 | 91,834 | ||||||||||||
Receive Floating rate 3-Month USD LIBOR | Quarterly | 6/16/26 | 1,150,000 | 76,850 | ||||||||||||
Receive Fixed 1.25% | Semi-Annually | 12/15/26 | 1,300,000 | (84,875 | ) | |||||||||||
Receive Fixed 11.94% | Annually | 1/04/27 | 6,174,599 | BRL | (2,238 | ) | ||||||||||
Receive Fixed 12.07% | Annually | 1/04/27 | 5,300,000 | BRL | 1,854 | |||||||||||
Receive Floating rate 1 Year-SOFR | Annually | 3/08/27 | 4,000,000 | 208,598 | ||||||||||||
Receive Floating MIBOR | Semi-Annually | 3/23/27 | 120,000,000 | INR | 59,873 | |||||||||||
Receive Floating MIBOR | Semi-Annually | 4/11/27 | 126,000,000 | INR | 52,135 | |||||||||||
Receive Floating MIBOR | Semi-Annually | 4/19/27 | 130,500,000 | INR | 28,217 | |||||||||||
Receive Floating MIBOR | Semi-Annually | 5/05/27 | 222,000,000 | INR | (13,020 | ) | ||||||||||
Receive Floating Banxico Mexico 1 Month rate | Monthly | 6/09/27 | 34,480,701 | MXN | (28,146 | ) | ||||||||||
Receive Floating MIBOR | Semi-Annually | 6/15/27 | 100,000,000 | INR | 55,590 | |||||||||||
Receive Floating MIBOR | Semi-Annually | 6/15/27 | 63,000,000 | INR | 15,239 | |||||||||||
Receive Floating MIBOR | Semi-Annually | 6/15/27 | 126,000,000 | INR | 29,063 | |||||||||||
Receive Floating MIBOR | Semi-Annually | 6/15/27 | 72,000,000 | INR | (148 | ) | ||||||||||
Receive Floating rate 3-Month-BBSW | Quarterly | 6/15/27 | 3,140,000 | AUD | 1,189 | |||||||||||
Receive Floating rate 3-Month-BBSW | Quarterly | 6/15/27 | 3,140,000 | AUD | 1,085 | |||||||||||
Receive Floating rate 3-Month-TAIBOR | Quarterly | 6/15/27 | 60,000,000 | TWD | (21,708 | ) | ||||||||||
Receive Floating rate 3-Month-TAIBOR | Quarterly | 6/15/27 | 60,000,000 | TWD | (22,753 | ) | ||||||||||
| franklintempleton.com | Annual Report | 87 | ||||||||
FRANKLIN ALTERNATIVE STRATEGIES FUNDS
CONSOLIDATED SCHEDULE OF INVESTMENTS
Franklin K2 Alternative Strategies Fund (continued)
| Interest Rate Swap Contracts (continued) | ||||||||||||||||
| Description | Payment Frequency | Maturity Date | Notional Amount* | Value/Unrealized Appreciation (Depreciation) | ||||||||||||
| Centrally Cleared Swap Contracts (continued) | ||||||||||||||||
Receive Floating rate 3-Month-TAIBOR | Quarterly | 6/15/27 | 43,650,000 | TWD | $ | (26,429 | ) | |||||||||
Receive Floating rate Overnight SOFR | Annually | 6/15/27 | 2,140,000 | 2,698 | ||||||||||||
Receive Floating rate Overnight SOFR | Annually | 6/15/27 | 1,374,000 | (14,939 | ) | |||||||||||
Receive Floating MIBOR | Semi-Annually | 7/18/27 | 515,520,000 | INR | (19,856 | ) | ||||||||||
Receive Floating MIBOR | Semi-Annually | 7/18/27 | 349,440,000 | INR | (35,130 | ) | ||||||||||
Receive Fixed 3.05% | Quarterly | 9/21/27 | 1,740,000,000 | KRW | (11,055 | ) | ||||||||||
Receive Fixed 3.21% | Quarterly | 9/21/27 | 1,400,000,000 | KRW | — | |||||||||||
Receive Floating MIBOR | Semi-Annually | 9/21/27 | 126,000,000 | INR | 9,639 | |||||||||||
Receive Floating MIBOR | Semi-Annually | 9/21/27 | 37,700,000 | INR | 560 | |||||||||||
Receive Floating MIBOR | Monthly | 9/21/27 | 50,000,000 | INR | (1,289 | ) | ||||||||||
Receive Floating MIBOR | Monthly | 9/21/27 | 49,000,000 | INR | (2,009 | ) | ||||||||||
Receive Floating rate 3-Month-BBSW | Quarterly | 9/21/27 | 3,000,000 | AUD | 2,402 | |||||||||||
Receive Floating rate 3-Month-BBSW | Quarterly | 9/21/27 | 3,000,000 | AUD | 1,789 | |||||||||||
Receive Floating rate 3-Month-TAIBOR | Quarterly | 9/21/27 | 19,440,000 | TWD | (169 | ) | ||||||||||
Receive Floating 3-Month-KDR | Quarterly | 12/17/27 | 15,452,400,000 | KRW | 16,773 | |||||||||||
Receive Floating MIBOR | Semi-Annually | 12/21/27 | 124,000,000 | INR | (2,489 | ) | ||||||||||
Receive Floating 3-Month-KDR | Quarterly | 12/16/28 | 5,583,600,000 | KRW | 10,450 | |||||||||||
Receive Fixed 2.98% | Quarterly | 7/23/31 | 2,640,000,000 | KRW | (22,309 | ) | ||||||||||
Receive Floating 3-Month-KDR | Quarterly | 7/23/31 | 2,640,000,000 | KRW | 13,335 | |||||||||||
Receive Floating rate 1 Year-SOFR | Annually | 3/08/32 | 4,000,000 | 384,566 | ||||||||||||
Receive Fixed 0.77% | Annually | 3/17/32 | 3,092,000 | EUR | (209,594 | ) | ||||||||||
Receive Fixed 0.98% | Annually | 3/17/32 | 2,085,780 | EUR | (120,183 | ) | ||||||||||
Receive Fixed 2.57% | Semi-Annually | 3/17/32 | 20,000,000 | SGD | (45,366 | ) | ||||||||||
Receive Fixed 2.45% | Annually | 6/15/32 | 677,800 | (11,812 | ) | |||||||||||
Receive Fixed 2.46% | Annually | 6/15/32 | 2,260,000 | (38,291 | ) | |||||||||||
Receive Fixed 8.28% | Quarterly | 7/27/32 | 19,017,434 | ZAR | (19,837 | ) | ||||||||||
Receive Floating Overnight MUTSCALM | Annually | 2/10/37 | 288,000,000 | JPY | (6,462 | ) | ||||||||||
Receive Floating Overnight MUTSCALM | Annually | 2/18/37 | 150,000,000 | JPY | 16,784 | |||||||||||
| 88 | Annual Report | franklintempleton.com | ||||||||
FRANKLIN ALTERNATIVE STRATEGIES FUNDS
CONSOLIDATED SCHEDULE OF INVESTMENTS
Franklin K2 Alternative Strategies Fund (continued)
| Interest Rate Swap Contracts (continued) | ||||||||||||||||
| Description | Payment Frequency | Maturity Date | Notional Amount* | Value/Unrealized Appreciation (Depreciation) | ||||||||||||
| Centrally Cleared Swap Contracts (continued) | ||||||||||||||||
Receive Floating rate 6 Month-EURIBOR | Semi-Annually | 3/17/42 | 2,445,000 | EUR | $ | 269,323 | ||||||||||
Receive Floating rate 6 Month-EURIBOR | Semi-Annually | 3/17/42 | 1,116,460 | EUR | 104,789 | |||||||||||
Receive Fixed 2.48% | Annually | 6/15/52 | 308,000 | (5,001 | ) | |||||||||||
Receive Floating rate Overnight SOFR | Annually | 6/15/52 | 462,000 | 33,425 | ||||||||||||
|
| |||||||||||||||
Total Interest Rate Swap Contracts |
| $ | 185,311 | |||||||||||||
|
| |||||||||||||||
*In U.S. dollars unless otherwise indicated.
At May 31, 2022, the Fund had the following total return swap contracts outstanding. See Note 1(d).
| Total Return Swap Contracts | ||||||||||||||||||||||
| Underlying Instrument | Financing Rate | Payment Frequency | Counterparty | Maturity Date | Notional Value* | Value/Unrealized Appreciation (Depreciation) | ||||||||||||||||
| OTC Swap Contracts | ||||||||||||||||||||||
| Equity Contracts – Longa | ||||||||||||||||||||||
American Campus Communities Inc. | 1-Day OBFR + 0.45% | Monthly | BZWS | 4/20/23 | $ | 5,196,019 | $ | 19,073 | ||||||||||||||
Amundi SA | 1-Month EURIBOR + 0.40% | Monthly | MSCS | 11/14/22 | 824,042 | EUR | (9,620 | ) | ||||||||||||||
Amundi SA | 1-Day EONIA + 0.40% | Monthly | GSCO | 3/14/25 | 266,038 | EUR | 37,671 | |||||||||||||||
Anima Holding SpA | 1-Month EURIBOR + 0.40% | Monthly | MSCS | 11/14/22 | 1,830,712 | EUR | 60,682 | |||||||||||||||
Atlantia SpA | 1-Day EONIA + 0.65% | Monthly | MSCO | 4/18/23 | 372,090 | EUR | (5,549 | ) | ||||||||||||||
Atlantia SpA | 1-Month EURIBOR + 0.40% | Monthly | BZWS | 4/20/23 | 1,880,627 | EUR | (4,455 | ) | ||||||||||||||
Avast PLC | 1-Day SONIA + 0.40% | Monthly | BZWS | 7/27/22 | 1,091,032 | GBP | 15,986 | |||||||||||||||
Avast PLC | 1-Day FEDEF + 0.65% | Monthly | MSCO | 9/23/22 | 861,701 | (134,528 | ) | |||||||||||||||
Barclays PLC | 1-Day SONIA + 0.44% | Monthly | MSCS | 11/14/22 | 788,900 | GBP | 175,173 | |||||||||||||||
BNP Paribas SA | 1-Month LIBOR + 0.40% | Monthly | GSCO | 3/14/25 | 1,313,178 | EUR | 733,475 | |||||||||||||||
Boskalis Westminster | 1-Day EONIA + 0.65% | Monthly | MSCO | 5/18/23 | 30,882 | EUR | (396 | ) | ||||||||||||||
Brewin Dolphin Holdings PLC | 1-Day SONIA + 0.55% | Monthly | BZWS | 4/03/23 | 718,019 | GBP | (37 | ) | ||||||||||||||
Bureau Veritas SA | 1-Month EURIBOR + 0.40% | Monthly | MSCS | 11/14/22 | 113,728 | EUR | 8,101 | |||||||||||||||
Bureau Veritas SA | 1-Month EURIBOR + 0.40% | Monthly | GSCO | 3/14/25 | 1,082,490 | EUR | 441,544 | |||||||||||||||
Callaway Golf Co. | 1-Day FEDEF + 0.40% | Monthly | MSCO | 11/22/22 | 1,217,822 | (494,640 | ) | |||||||||||||||
Clipper Logistics PLC | 1-Day SONIA + 0.40% | Monthly | BZWS | 3/08/23 | 314,444 | GBP | 3,582 | |||||||||||||||
Croda International PLC | 1-Day SONIA + 0.44% | Monthly | MSCS | 11/14/22 | 898,210 | GBP | 34,857 | |||||||||||||||
Danone SA | 1-Month EURIBOR + 0.40% | Monthly | MSCS | 11/14/22 | 1,644,432 | EUR | (3,391 | ) | ||||||||||||||
Danone SA | 1-Month LIBOR + 0.40% | Monthly | GSCO | 3/14/25 | 3,791,588 | EUR | 31,858 | |||||||||||||||
Electricite de France SA | 1-Day EONIA + 0.40% | Monthly | MSCS | 9/23/22 | 1,797,180 | EUR | (12,172 | ) | ||||||||||||||
Eletrobras | 1-Day FEDEF + 1.00% | Monthly | MSCO | 1/16/24 | 479,860 | 31,744 | ||||||||||||||||
Elis SA | 1-Month EURIBOR + 0.40% | Monthly | MSCS | 11/14/22 | 225,556 | EUR | 22,177 | |||||||||||||||
Elis SA | 1-Month EURIBOR + 0.40% | Monthly | GSCO | 3/14/25 | 444,640 | EUR | 104,636 | |||||||||||||||
Energy Transfer LP | 1-Month LIBOR + 0.90% | Monthly | GSCO | 10/03/22 | 37,312 | 24 | ||||||||||||||||
Energy Transfer LP | 1-Month LIBOR + 0.50% | Monthly | CITI | 10/18/22 | 115,578 | 17,419 | ||||||||||||||||
Energy Transfer LP | 1-Month LIBOR + 0.90% | Monthly | BZWS | 2/14/23 | 239,246 | 1,696 | ||||||||||||||||
Entain PLC | 1-Day SONIA + 0.65% | Monthly | MSCO | 2/08/23 | 531,285 | GBP | (118,874 | ) | ||||||||||||||
ESG Core Investments BV | 1-Day EONIA + 0.65% | Monthly | MSCO | 9/06/22 | 41,835 | EUR | (3,244 | ) | ||||||||||||||
Frasers Group PLC | 1-Day SONIA + 0.44% | Monthly | MSCS | 11/14/22 | 780,702 | GBP | 61,309 | |||||||||||||||
b,c Gazprom PJSC ADR | 1-Day FEDEF | Monthly | MSCS | 1/31/24 | — | — | ||||||||||||||||
Healthcare Trust of America Inc. | 1-Day OBFR + 0.45% | Monthly | BZWS | 1/27/23 | 579,488 | 11,184 | ||||||||||||||||
HeidelbergCement AG | 1-Month EURIBOR + 0.40% | Monthly | MSCS | 11/14/22 | 1,684,404 | EUR | (1,183 | ) | ||||||||||||||
Hermes International | 1-Month EURIBOR + 0.40% | Monthly | MSCS | 11/14/22 | 468,607 | EUR | 46,317 | |||||||||||||||
| franklintempleton.com | Annual Report | 89 | ||||||||
FRANKLIN ALTERNATIVE STRATEGIES FUNDS
CONSOLIDATED SCHEDULE OF INVESTMENTS
Franklin K2 Alternative Strategies Fund (continued)
| Total Return Swap Contracts (continued) | ||||||||||||||||||||||
| Underlying Instrument | Financing Rate | Payment Frequency | Counterparty | Maturity Date | Notional Value* | Value/Unrealized Appreciation (Depreciation) | ||||||||||||||||
| OTC Swap Contracts (continued) | ||||||||||||||||||||||
| Equity Contracts – Longa (continued) | ||||||||||||||||||||||
Hibernia REIT PLC | 1-Month EURIBOR + 0.85% | Monthly | BZWS | 3/28/23 | $ | 1,695,954 | EUR | $ | 45,731 | |||||||||||||
Hikma Pharmaceuticals PLC | 1-Day SONIA + 0.44% | Monthly | MSCS | 11/14/22 | 81,044 | GBP | (2,570 | ) | ||||||||||||||
Hitachi Transport System Ltd. | 1-Day MUTSCALM + 0.50% | Monthly | MSCO | 5/19/23 | 70,576,186 | JPY | 1,592 | |||||||||||||||
HomeServe | 1-Day SONIA + 0.40% | Monthly | BZWS | 4/25/23 | 2,113,624 | GBP | (6,897 | ) | ||||||||||||||
Irongate Group | 1-Month BBSW + 0.40% | Monthly | BZWS | 3/22/23 | 2,552,087 | AUD | 58,110 | |||||||||||||||
iStar Inc. | 1-Day FEDEF + 0.40% | Monthly | MSCO | 11/22/22 | 622,007 | (137,125 | ) | |||||||||||||||
ITV PLC | 1-Day SONIA + 0.44% | Monthly | MSCS | 11/14/22 | 926,096 | GBP | 55,152 | |||||||||||||||
John Menzies PLC | 1-Day SONIA + 0.40% | Monthly | BZWS | 3/08/23 | 1,556,305 | GBP | 6,505 | |||||||||||||||
Kering SA | 1-Month EURIBOR + 0.40% | Monthly | MSCS | 11/14/22 | 472,574 | EUR | 76,561 | |||||||||||||||
Kering SA | 1-Month EURIBOR + 0.40% | Monthly | GSCO | 3/14/25 | 1,461,221 | EUR | 126,500 | |||||||||||||||
LONGi Green Energy Technology Co. Ltd. | 1-Day FEDEF + 0.30% | Monthly | MSCS | 9/28/22 | 697,070 | 133,026 | ||||||||||||||||
LVMH Moet Hennessy Louis Vuitton SE | 1-Day EONIA + 0.40% | Monthly | GSCO | 3/14/25 | 335,572 | EUR | 239,837 | |||||||||||||||
Meggitt PLC | 1-Day SONIA + 0.65% | Monthly | BZWS | 8/17/22 | 2,774,363 | GBP | (4,635 | ) | ||||||||||||||
Meggitt PLC | 1-Day SONIA + 0.65% | Monthly | MSCO | 2/08/23 | 831,519 | GBP | 8,928 | |||||||||||||||
Nestle SA | 1-Day SARON + 0.34% | Monthly | MSCS | 1/20/23 | 1,738,580 | CHF | (44,353 | ) | ||||||||||||||
Orpea SA | 1-Month EURIBOR + 0.40% | Monthly | MSCS | 11/14/22 | 663,701 | EUR | (145,861 | ) | ||||||||||||||
Petroleo Brasileiro SA | 1-Day FEDEF + 1.00% | Monthly | MSCS | 5/16/23 | 1,500,761 | (118,483 | ) | |||||||||||||||
Preferred Apartment Communities Inc. | 1-Day OBFR + 0.45% | Monthly | BZWS | 2/17/23 | 2,082,477 | (908 | ) | |||||||||||||||
PS Business Parks Inc. | 1-Day OBFR + 0.45% | Monthly | BZWS | 4/27/23 | 970,934 | 2,456 | ||||||||||||||||
Ramsay Health Care Ltd. | 1-Month BBSW + 0.40% | Monthly | BZWS | 4/21/23 | 1,244,680 | AUD | (2,756 | ) | ||||||||||||||
Ramsay Health Care Ltd. | 1-Month BBSW + 0.55% | Monthly | MSCO | 5/25/23 | 273,662 | AUD | 2,309 | |||||||||||||||
Ryanair Holdings PLC | 1-Month EURIBOR + 0.40% | Monthly | MSCS | 11/14/22 | 598,272 | EUR | 45,072 | |||||||||||||||
Sanne Group PLC | 1-Day SONIA + 0.40% | Monthly | BZWS | 6/24/22 | 3,526,175 | GBP | 4,780 | |||||||||||||||
Schroders PLC | 1-Day SONIA + 0.65% | Monthly | BZWS | 4/27/23 | 630,135 | GBP | 14,437 | |||||||||||||||
Shell Midstream Partners LP | 1-Day FEDEF + 1.00% | Monthly | MSCO | 5/18/23 | 51,699 | 477 | ||||||||||||||||
Siltronic AG | 1-Day EONIA + 0.65% | Monthly | MSCO | 11/03/22 | 489,119 | EUR | (176,888 | ) | ||||||||||||||
Smith & Nephew PLC | 1-Day SONIA + 0.44% | Monthly | MSCS | 11/14/22 | 3,537,986 | GBP | 192,814 | |||||||||||||||
Smiths Group PLC | 1-Day SONIA + 0.44% | Monthly | MSCS | 11/14/22 | 985,337 | GBP | 86,223 | |||||||||||||||
Societe Generale SA | 1-Month LIBOR + 0.40% | Monthly | GSCO | 3/14/25 | 817,731 | EUR | 429,243 | |||||||||||||||
SSE PLC | 1-Day SONIA + 0.40% | Monthly | MSCS | 9/26/22 | 1,166,966 | GBP | (77,073 | ) | ||||||||||||||
Stroeer SE & Co. KGaA | 1-Month EURIBOR + 0.40% | Monthly | MSCS | 11/14/22 | 691,394 | EUR | 32,419 | |||||||||||||||
Toshiba Corp. | 1-Day MUTSCALM + 0.55% | Monthly | MSCO | 8/25/23 | 16,267,193 | JPY | 32,921 | |||||||||||||||
Ultra Electronics Holdings PLC | 1-Day SONIA + 0.40% | Monthly | BZWS | 2/20/23 | 1,408,369 | GBP | (52,176 | ) | ||||||||||||||
Uniti Group Ltd. | 1-Month BBSW + 0.40% | Monthly | BZWS | 4/18/23 | 4,079,401 | AUD | 11,925 | |||||||||||||||
Uniti Group Ltd. | 1-Month BBSW + 0.55% | Monthly | MSCO | 4/18/23 | 1,029,682 | AUD | 1,077 | |||||||||||||||
Vifor Pharma AG | 1-Day FEDEF + 0.65% | Monthly | MSCS | 9/23/22 | 950,709 | 6,384 | ||||||||||||||||
Vodafone Group PLC | 1-Day SONIA + 0.65% | Monthly | MSCO | 2/08/23 | 1,884,973 | GBP | 196,586 | |||||||||||||||
|
| |||||||||||||||||||||
| 2,111,759 | ||||||||||||||||||||||
|
| |||||||||||||||||||||
| Equity Contracts – Shortd | ||||||||||||||||||||||
Citrix Systems Inc. | 1-Day FEDEF - 0.35% | Monthly | MSCO | 5/18/23 | 63,644 | (596 | ) | |||||||||||||||
Colruyt SA | 1-Day EONIA - 0.40% | Monthly | GSCO | 3/14/25 | 1,343,611 | EUR | 377,740 | |||||||||||||||
DJ EURO STOXX 50 Index | 1-Day EONIA - 0.45% | Monthly | MSCO | 3/22/23 | 307,887 | EUR | (182,024 | ) | ||||||||||||||
Elisa OYJ | 1-Day EONIA - 0.40% | Monthly | GSCO | 3/14/25 | 373,093 | EUR | (65,890 | ) | ||||||||||||||
Hannover Rueck SE | 1-Day EONIA - 0.35% | Monthly | GSCO | 3/14/25 | 534,486 | EUR | (97,944 | ) | ||||||||||||||
Healthcare Realty Trust Inc. | 1-Day OBFR - 0.30% | Monthly | BZWS | 5/12/23 | 569,660 | (1,761 | ) | |||||||||||||||
Hennes & Mauritz AB | 1-Week STIBOR - 0.40% | Monthly | GSCO | 3/14/25 | 5,540,301 | SEK | 41,394 | |||||||||||||||
HMM Co. Ltd. | 1-Day FEDEF - 3.50% | Monthly | MSCS | 8/10/23 | 347,920 | (40,262 | ) | |||||||||||||||
Industrial Select Sector Index | 1-Day FEDEF - 0.12% | Monthly | MSCS | 8/22/23 | 2,361,246 | (43,643 | ) | |||||||||||||||
| 90 | Annual Report | franklintempleton.com | ||||||||
FRANKLIN ALTERNATIVE STRATEGIES FUNDS
CONSOLIDATED SCHEDULE OF INVESTMENTS
Franklin K2 Alternative Strategies Fund (continued)
| Total Return Swap Contracts (continued) | ||||||||||||||||||||||
| Underlying Instrument | Financing Rate | Payment Frequency | Counterparty | Maturity Date | Notional Value* | Value/Unrealized Appreciation (Depreciation) | ||||||||||||||||
| OTC Swap Contracts (continued) | ||||||||||||||||||||||
| Equity Contracts – Shortd (continued) | ||||||||||||||||||||||
Korea Electric Power Corp. | 1-Day FEDEF - 2.75% | Monthly | MSCS | 8/10/23 | $ | 503,050 | $ | (37,379 | ) | |||||||||||||
Marks & Spencer Group PLC | 1-Day SONIA - 0.30% | Monthly | MSCS | 11/14/22 | 190,089 | GBP | (27,551 | ) | ||||||||||||||
MoneyGram International Inc. | 1-Day FEDEF - 0.35% | Monthly | MSCO | 5/02/23 | 314,798 | (7,631 | ) | |||||||||||||||
Morgan Stanley MSPSAVS2 Index | 1-Day SONIA - 0.45% | Monthly | MSCO | 5/15/23 | 108,016 | GBP | (8,371 | ) | ||||||||||||||
Morgan Stanley MSPSCEGH Index | 1-Day FEDEF - 0.35% | Monthly | MSCO | 5/15/23 | 450,467 | (51,780 | ) | |||||||||||||||
Morgan Stanley MSPSEGRL Index | 1-Day SONIA - 1.50% | Monthly | MSCO | 11/01/23 | 198,710 | GBP | 8,117 | |||||||||||||||
Morgan Stanley MSPSENTH Index | 1-Day SONIA - 0.45% | Monthly | MSCO | 11/01/23 | 290,781 | GBP | 31,547 | |||||||||||||||
Morgan Stanley MSPSHRTZ Index | 1-Day FEDEF - 0.35% | Monthly | MSCO | 9/21/22 | 318,193 | 46,781 | ||||||||||||||||
Morgan Stanley MSPSKRE Index | 1-Day FEDEF - 0.35% | Monthly | MSCO | 9/21/22 | 1,420,145 | 72,062 | ||||||||||||||||
Morgan Stanley MSPSKSS Index | 1-Day FEDEF - 0.40% | Monthly | MSCO | 9/21/22 | 337,234 | 47,928 | ||||||||||||||||
Morgan Stanley MSPSSXKP Index | 1-Day EONIA - 0.48% | Monthly | MSCO | 12/27/23 | 1,386,542 | EUR | (67,982 | ) | ||||||||||||||
Morgan Stanley MSPSVLRS Index | 1-Day FEDEF - 0.35% | Monthly | MSCO | 9/21/22 | 96,314 | 9,395 | ||||||||||||||||
Morgan Stanley MSPSWBD Index | 1-Day FEDEF - 0.35% | Monthly | MSCO | 4/25/23 | 304,188 | 9,706 | ||||||||||||||||
Morgan Stanley MSPSXLB Index | 1-Day FEDEF - 0.35% | Monthly | MSCO | 5/03/23 | 20,334 | (1,050 | ) | |||||||||||||||
Morgan Stanley MSPSXLE Index | 1-Day FEDEF - 0.35% | Monthly | MSCO | 5/15/23 | 14,089 | (1,812 | ) | |||||||||||||||
Morgan Stanley MSPSXLI Index | 1-Day FEDEF - 0.35% | Monthly | MSCO | 5/03/23 | 45,646 | 142 | ||||||||||||||||
Morgan Stanley MSPSXLU Index | 1-Day FEDEF - 0.35% | Monthly | MSCO | 9/21/22 | 2,137,267 | (39,760 | ) | |||||||||||||||
Morgan Stanley MSPSXME Index | 1-Day FEDEF - 0.35% | Monthly | MSCO | 5/03/23 | 33,915 | (2,185 | ) | |||||||||||||||
Morgan Stanley MSWDSGBP Index | 1-Day SONIA | Monthly | MSCO | 5/26/23 | — | GBP | (297 | ) | ||||||||||||||
Next PLC | 1-Day SONIA - 0.30% | Monthly | MSCS | 11/14/22 | 483,071 | GBP | (42,635 | ) | ||||||||||||||
Nippon Yusen | 1-Day MUTSCALM - 0.40% | Monthly | MSCS | 10/03/23 | 73,854,260 | JPY | (132,444 | ) | ||||||||||||||
NortonLifeLock Inc. | 1-Day FEDEF - 0.35% | Monthly | MSCO | 2/06/23 | 95,200 | 7,040 | ||||||||||||||||
Paramount Global | 1-Day FEDEF - 0.35% | Monthly | MSCO | 5/18/23 | 39,939 | (4,244 | ) | |||||||||||||||
Philadelphia SE Utility Index | 1-Day FEDEF - 0.05% | Monthly | MSCO | 8/22/23 | 3,823,794 | (138,330 | ) | |||||||||||||||
Renewable Energy Group Inc. | 1-Day FEDEF - 0.35% | Monthly | MSCO | 5/10/23 | 63,845 | (347 | ) | |||||||||||||||
Rentokil Initial | 1-Day FEDEF - 0.35% | Monthly | MSCO | 9/23/22 | 611,673 | (9,459 | ) | |||||||||||||||
Rivian Automotive Inc. | 1-Day FEDEF - 0.35% | Monthly | MSCO | 5/31/23 | 13,110 | (141 | ) | |||||||||||||||
Safehold Inc. | 1-Day FEDEF - 0.35% | Monthly | MSCO | 2/06/23 | 760,480 | 126,480 | ||||||||||||||||
Schroders PLC | 1-Day SONIA - 0.30% | Monthly | BZWS | 4/27/23 | 637,618 | GBP | (18,626 | ) | ||||||||||||||
STOXX Europe 600 Utilities Index | 1-Day EONIA - 0.45% | Monthly | MSCS | 9/13/23 | 1,195,539 | EUR | (1,457 | ) | ||||||||||||||
Swisscom AG | 1-Day SARON - 0.35% | Monthly | GSCO | 3/14/25 | 716,144 | CHF | (143,919 | ) | ||||||||||||||
Tenneco Inc. | 1-Day FEDEF - 0.35% | Monthly | MSCO | 5/09/23 | 358,060 | (44,398 | ) | |||||||||||||||
Tesla Inc. | 1-Day FEDEF - 0.35% | Monthly | MSCO | 12/31/25 | 76,139 | (3,478 | ) | |||||||||||||||
WAF GY Hedge Basket | 1-Day EONIA - 0.45% | Monthly | MSCO | 12/27/23 | 328,049 | EUR | 770 | |||||||||||||||
|
| |||||||||||||||||||||
| (438,294 | ) | |||||||||||||||||||||
|
| |||||||||||||||||||||
Total – Total Return Swap Contracts |
| $ | 1,673,465 | |||||||||||||||||||
| �� |
|
| ||||||||||||||||||||
*In U.S. dollars unless otherwise indicated.
aThe Fund receives the total return on the underlying instrument and pays a variable financing rate.
bFair valued using significant unobservable inputs. See Note 14 regarding fair value measurements.
cSee Note 9 regarding investments in Russian securities.
dThe Fund receives the variable financing rate and pays the total return on the underlying instrument.
See Note 12 regarding other derivative information.
See Abbreviations on page 114.
| franklintempleton.com | Annual Report | 91 | ||||||||
FRANKLIN ALTERNATIVE STRATEGIES FUNDS
CONSOLIDATED FINANCIAL STATEMENTS
Consolidated Statement of Assets and Liabilities
May 31, 2022
Franklin K2 Alternative Strategies Fund
Assets: | ||||
Investments in securities: | ||||
Cost – Unaffiliated issuers | $ | 1,172,956,785 | ||
Cost – Non-controlled affiliates (Note 3f) | 4,937,000 | |||
Cost – Unaffiliated repurchase agreements | 1,058,171 | |||
|
| |||
Value – Unaffiliated issuers† | $ | 1,184,672,929 | ||
Value – Non-controlled affiliates (Note 3f) | 4,937,000 | |||
Value – Unaffiliated repurchase agreements | 1,058,171 | |||
Cash | 33,233,022 | |||
Restricted cash for OTC derivatives (Note 1e) | 3,140,000 | |||
Foreign currency, at value (cost $6,304,018) | 6,558,044 | |||
Receivables: | ||||
Investment securities sold | 35,858,230 | |||
Capital shares sold | 1,890,065 | |||
Dividends and interest | 5,431,825 | |||
Deposits with brokers for: | ||||
Exchange traded options written | 133,903 | |||
Securities sold short | 212,091,494 | |||
OTC derivative contracts | 24,358,354 | |||
Futures contracts | 9,205,328 | |||
Centrally cleared swap contracts | 2,504,553 | |||
Due from brokers | 19,985,001 | |||
Variation margin on centrally cleared swap contracts | 194,223 | |||
Variation margin on futures contracts | 842,201 | |||
OTC swap contracts (upfront payments $2,495,195) | 2,335,570 | |||
Unrealized appreciation on OTC forward exchange contracts | 6,604,272 | |||
Unrealized appreciation on OTC swap contracts | 5,053,407 | |||
Other assets | 7,623 | |||
|
| |||
Total assets | 1,560,095,215 | |||
|
| |||
Liabilities: | ||||
Payables: | ||||
Investment securities purchased | 22,664,446 | |||
Capital shares redeemed | 2,601,473 | |||
Management fees | 1,971,173 | |||
Distribution fees | 42,004 | |||
Trustees’ fees and expenses | 9,007 | |||
Transfer agent fees | 294,402 | |||
Deposits from brokers for: | ||||
OTC derivative contracts | 3,140,000 | |||
Due to brokers | 20,863,224 | |||
OTC swap contracts (upfront receipts $723,377) | 697,391 | |||
Options written, at value (premiums received $2,077,957) | 1,966,832 | |||
Securities sold short, at value (proceeds $253,520,775) | 224,344,875 | |||
Payable upon return of securities loaned (Note 1g) | 5,995,171 | |||
Unrealized depreciation on OTC forward exchange contracts | 4,709,210 | |||
Unrealized depreciation on OTC swap contracts | 2,971,621 | |||
Unrealized depreciation on unfunded loan commitments (Note 11) | 94,370 | |||
Accrued expenses and other liabilities | 615,238 | |||
|
| |||
Total liabilities | 292,980,437 | |||
|
| |||
Net assets, at value | $ | 1,267,114,778 | ||
|
| |||
Net assets consist of: | ||||
Paid-in capital | $ | 1,247,865,003 | ||
Total distributable earnings (loss) | 19,249,775 | |||
|
| |||
Net assets, at value | $ | 1,267,114,778 | ||
|
| |||
†Includes securities loaned | $ | 7,984,577 | ||
| 92 | Annual Report| The accompanying notes are an integral part of these financial statements. | franklintempleton.com | ||||||||
FRANKLIN ALTERNATIVE STRATEGIES FUNDS
CONSOLIDATED FINANCIAL STATEMENTS
Consolidated Statement of Assets and Liabilities (continued)
May 31, 2022
Franklin K2 Alternative Strategies Fund
| Class A: | ||||
Net assets, at value | $ | 94,580,122 | ||
|
| |||
Shares outstanding | 8,476,302 | |||
|
| |||
Net asset value per sharea | $ | 11.16 | ||
|
| |||
Maximum offering price per share (net asset value per share ÷ 94.50%) | $ | 11.81 | ||
|
| |||
| Class C: | ||||
Net assets, at value | $ | 24,485,533 | ||
|
| |||
Shares outstanding | 2,268,101 | |||
|
| |||
Net asset value and maximum offering price per sharea | $ | 10.80 | ||
|
| |||
| Class R: | ||||
Net assets, at value | $ | 810,811 | ||
|
| |||
Shares outstanding | 72,879 | |||
|
| |||
Net asset value and maximum offering price per share | $ | 11.13 | ||
|
| |||
| Class R6: | ||||
Net assets, at value | $ | 47,850,850 | ||
|
| |||
Shares outstanding | 4,247,736 | |||
|
| |||
Net asset value and maximum offering price per share | $ | 11.27 | ||
|
| |||
| Advisor Class: | ||||
Net assets, at value | $ | 1,099,387,462 | ||
|
| |||
Shares outstanding | 97,820,692 | |||
|
| |||
Net asset value and maximum offering price per share | $ | 11.24 | ||
|
| |||
aRedemption price is equal to net asset value less contingent deferred sales charges, if applicable.
| franklintempleton.com | The accompanying notes are an integral part of these financial statements. | Annual Report | 93 | ||||||||
FRANKLIN ALTERNATIVE STRATEGIES FUNDS
CONSOLIDATED FINANCIAL STATEMENTS
Consolidated Statement of Operations
for the year ended May 31, 2022
Franklin K2 Alternative Strategies Fund
Investment income: | ||||
Dividends: (net of foreign taxes)* | ||||
Unaffiliated issuers | $ | 5,284,053 | ||
Interest: (net of foreign taxes)~ | ||||
Unaffiliated issuers | 23,467,042 | |||
Income from securities loaned: | ||||
Unaffiliated entities (net of fees and rebates) | 99,960 | |||
Non-controlled affiliates (Note 3f) | 2,117 | |||
|
| |||
Total investment income | 28,853,172 | |||
|
| |||
Expenses: | ||||
Management fees (Note 3a) | 25,831,040 | |||
Distribution fees: (Note 3c) | ||||
Class A | 255,230 | |||
Class C | 290,054 | |||
Class R | 5,290 | |||
Transfer agent fees: (Note 3e) | ||||
Class A | 106,379 | |||
Class C | 30,067 | |||
Class R | 1,507 | |||
Class R6 | 12,797 | |||
Advisor Class | 1,242,873 | |||
Custodian fees (Note 4) | 267,040 | |||
Reports to shareholders fees | 99,170 | |||
Registration and filing fees | 108,715 | |||
Professional fees | 549,721 | |||
Trustees’ fees and expenses | 388,212 | |||
Dividends and interest on securities sold short | 3,232,413 | |||
Security borrowing fees | 2,204,873 | |||
Other | 148,818 | |||
|
| |||
Total expenses | 34,774,199 | |||
|
| |||
Expense reductions (Note 4) | (15,605 | ) | ||
Expenses waived/paid by affiliates (Note 3f and 3g) | (2,089,530 | ) | ||
|
| |||
Net expenses | 32,669,064 | |||
|
| |||
Net investment income (loss) | (3,815,892 | ) | ||
|
| |||
Realized and unrealized gains (losses): | ||||
Net realized gain (loss) from: | ||||
Investments: | ||||
Unaffiliated issuers | 38,062,763 | |||
Written options | 1,656,283 | |||
Foreign currency transactions | (893,350 | ) | ||
Forward exchange contracts | 10,181,183 | |||
Futures contracts | 2,708,894 | |||
Securities sold short | (9,711,569 | ) | ||
Swap contracts | (635,732 | ) | ||
|
| |||
Net realized gain (loss) | 41,368,472 | |||
|
| |||
Net change in unrealized appreciation (depreciation) on: | ||||
Investments: | ||||
Unaffiliated issuers | (166,549,301 | ) | ||
Written options | (58,517 | ) | ||
Translation of other assets and liabilities denominated in foreign currencies | 38,603 | |||
Forward exchange contracts | 3,870,801 | |||
Futures contracts | 1,332,571 | |||
Securities sold short | 38,982,644 | |||
Swap contracts | (984,002 | ) | ||
|
| |||
Net change in unrealized appreciation (depreciation) | (123,367,201 | ) | ||
|
| |||
Net realized and unrealized gain (loss) | (81,998,729 | ) | ||
|
| |||
Net increase (decrease) in net assets resulting from operations | $ | (85,814,621 | ) | |
|
| |||
* Foreign taxes withheld on dividends | $ | 243,166 | ||
~ Foreign taxes withheld on interest | $ | 18,545 | ||
| 94 | Annual Report| The accompanying notes are an integral part of these financial statements. | franklintempleton.com | ||||||||
FRANKLIN ALTERNATIVE STRATEGIES FUNDS
CONSOLIDATED FINANCIAL STATEMENTS
Consolidated Statements of Changes in Net Assets
Franklin K2 Alternative Strategies Fund
| Year Ended May 31, | ||||||||
| 2022 | 2021 | |||||||
Increase (decrease) in net assets: | ||||||||
Operations: | ||||||||
Net investment income (loss) | $ | (3,815,892 | ) | $ | (5,706,292 | ) | ||
Net realized gain (loss) | 41,368,472 | 82,760,682 | ||||||
Net change in unrealized appreciation (depreciation) | (123,367,201 | ) | 64,678,301 | |||||
|
| |||||||
Net increase (decrease) in net assets resulting from operations | (85,814,621 | ) | 141,732,691 | |||||
|
| |||||||
Distributions to shareholders: | ||||||||
Class A | (4,718,508 | ) | (770,421 | ) | ||||
Class C | (1,181,591 | ) | (270,063 | ) | ||||
Class R | (56,639 | ) | (6,563 | ) | ||||
Class R6 | (2,581,950 | ) | (218,294 | ) | ||||
Advisor Class | (58,285,888 | ) | (8,558,261 | ) | ||||
|
| |||||||
Total distributions to shareholders | (66,824,576 | ) | (9,823,602 | ) | ||||
|
| |||||||
Capital share transactions: (Note 2) | ||||||||
Class A | 3,686,486 | 1,751,000 | ||||||
Class C | (3,895,079 | ) | (7,911,374 | ) | ||||
Class R | 115,566 | (133,193 | ) | |||||
Class R6 | 26,424,523 | 9,227,168 | ||||||
Advisor Class | 79,327,812 | 59,488,692 | ||||||
|
| |||||||
Total capital share transactions | 105,659,308 | 62,422,293 | ||||||
|
| |||||||
Net increase (decrease) in net assets | (46,979,889 | ) | 194,331,382 | |||||
Net assets: | ||||||||
Beginning of year | 1,314,094,667 | 1,119,763,285 | ||||||
|
| |||||||
End of year | $ | 1,267,114,778 | $ | 1,314,094,667 | ||||
|
| |||||||
| franklintempleton.com | The accompanying notes are an integral part of these financial statements. | Annual Report | 95 | ||||||||
FRANKLIN ALTERNATIVE STRATEGIES FUNDS
Notes to Consolidated Financial Statements
Franklin K2 Alternative Strategies Fund
1. Organization and Significant Accounting Policies
Franklin Alternative Strategies Funds (Trust) is registered under the Investment Company Act of 1940 (1940 Act) as an open-end management investment company, consisting of two separate funds and applies the specialized accounting and reporting guidance in U.S. Generally Accepted Accounting Principles (U.S. GAAP). Franklin K2 Alternative Strategies Fund (Fund) is included in this report. The Fund offers five classes of shares: Class A, Class C, Class R, Class R6 and Advisor Class. Effective August 2, 2021, Class C shares automatically convert to Class A shares on a monthly basis, after they have been held for 8 years. Prior to August 2, 2021, Class C shares converted to Class A shares after a 10-year holding period. Each class of shares may differ by its initial sales load, contingent deferred sales charges, voting rights on matters affecting a single class, its exchange privilege and fees due to differing arrangements for distribution and transfer agent fees.
The following summarizes the Fund’s significant accounting policies.
a. Financial Instrument Valuation
The Fund’s investments in financial instruments are carried at fair value daily. Fair value is the price that would be received to sell an asset or paid to transfer a liability in an orderly transaction between market participants on the measurement date. The Fund calculates the net asset value
(NAV) per share each business day as of 4 p.m. Eastern time or the regularly scheduled close of the New York Stock Exchange (NYSE), whichever is earlier. Under compliance policies and procedures approved by the Trust’s Board of Trustees (the Board), the Fund’s administrator has responsibility for oversight of valuation, including leading the cross-functional Valuation Committee (VC). The Fund may utilize independent pricing services, quotations from securities and financial instrument dealers, and other market sources to determine fair value.
Equity securities, exchange traded funds and derivative financial instruments listed on an exchange or on the NASDAQ National Market System are valued at the last quoted sale price or the official closing price of the day, respectively. Foreign equity securities are valued as of the close of trading on the foreign stock exchange on which the security is primarily traded or as of 4 p.m. Eastern time. The value is then converted into its U.S. dollar equivalent at the foreign exchange rate in effect at 4 p.m. Eastern time on the day that the value
of the security is determined. Over-the-counter (OTC) securities are valued within the range of the most recent quoted bid and ask prices. Securities that trade in multiple markets or on multiple exchanges are valued according to the broadest and most representative market. Certain equity securities are valued based upon fundamental characteristics or relationships to similar securities.
Debt securities generally trade in the OTC market rather than on a securities exchange. The Fund’s pricing services use multiple valuation techniques to determine fair value. In instances where sufficient market activity exists, the pricing services may utilize a market-based approach through which quotes from market makers are used to determine fair value. In instances where sufficient market activity may not exist or is limited, the pricing services also utilize proprietary valuation models which may consider market characteristics such as benchmark yield curves, credit spreads, estimated default rates, anticipated market interest rate volatility, coupon rates, anticipated timing of principal repayments, underlying collateral, and other unique security features in order to estimate the relevant cash flows, which are then discounted to calculate the fair value. Securities denominated in a foreign currency are converted into their U.S. dollar equivalent at the foreign exchange rate in effect at 4 p.m. Eastern time on the date that the values of the foreign debt securities are determined.
Investments in open-end mutual funds are valued at the closing NAV. Investments in repurchase agreements are valued at cost, which approximates fair value.
Certain derivative financial instruments are centrally cleared or trade in the OTC market. The Fund’s pricing services use various techniques including industry standard option pricing models and proprietary discounted cash flow models to determine the fair value of those instruments. The Fund’s net benefit or obligation under the derivative contract, as measured by the fair value of the contract, is included in net assets.
The Fund has procedures to determine the fair value of financial instruments for which market prices are not reliable or readily available. Under these procedures, the Fund primarily employs a market-based approach which may use related or comparable assets or liabilities, recent transactions, market multiples, book values, and other relevant information for the investment to determine the fair value of the investment. An income-based valuation approach may also be used in which the anticipated future cash flows of the investment are
| 96 | Annual Report | franklintempleton.com | ||||||||
FRANKLIN ALTERNATIVE STRATEGIES FUNDS
NOTES TO CONSOLIDATED FINANCIAL STATEMENTS
Franklin K2 Alternative Strategies Fund (continued)
discounted to calculate fair value. Discounts may also be applied due to the nature or duration of any restrictions on the disposition of the investments. Due to the inherent uncertainty of valuations of such investments, the fair values may differ significantly from the values that would have been used had an active market existed.
Trading in securities on foreign securities stock exchanges and OTC markets may be completed before 4 p.m. Eastern time. In addition, trading in certain foreign markets may not take place on every Fund’s business day. Events can occur between the time at which trading in a foreign security is completed and 4 p.m. Eastern time that might call into question the reliability of the value of a portfolio security held by the Fund. As a result, differences may arise between the value of the Fund’s portfolio securities as determined at the foreign market close and the latest indications of value at 4 p.m. Eastern time. In order to minimize the potential for these differences, an independent pricing service may be used to adjust the value of the Funds’ portfolio securities to the latest indications of fair value at 4 p.m. Eastern time. At May 31, 2022, certain securities may have been fair valued using these procedures, in which case the securities were categorized as Level 2 inputs within the fair value hierarchy (referred to as “market level fair value”). See the Fair Value Measurements note for more information.
When the last day of the reporting period is a non-business day, certain foreign markets may be open on those days that the Fund’s NAV is not calculated, which could result in differences between the value of the Fund’s portfolio securities on the last business day and the last calendar day of the reporting period. Any significant security valuation changes due to an open foreign market are adjusted and reflected by the Fund for financial reporting purposes.
b. Foreign Currency Translation
Portfolio securities and other assets and liabilities denominated in foreign currencies are translated into U.S. dollars based on the exchange rate of such currencies against U.S. dollars on the date of valuation. The Fund may enter into foreign currency exchange contracts to facilitate transactions denominated in a foreign currency. Purchases and sales of securities, income and expense items denominated in foreign currencies are translated into U.S. dollars at the exchange rate in effect on the transaction date. Portfolio securities and assets and liabilities denominated in foreign currencies contain risks that those currencies will decline in value relative to
the U.S. dollar. Occasionally, events may impact the availability or reliability of foreign exchange rates used to convert the U.S. dollar equivalent value. If such an event occurs, the foreign exchange rate will be valued at fair value using procedures established and approved by the Board.
The Fund does not separately report the effect of changes in foreign exchange rates from changes in market prices on securities held. Such changes are included in net realized and unrealized gain or loss from investments in the Consolidated Statement of Operations.
Realized foreign exchange gains or losses arise from sales of foreign currencies, currency gains or losses realized between the trade and settlement dates on securities transactions and the difference between the recorded amounts of dividends, interest, and foreign withholding taxes and the
U.S. dollar equivalent of the amounts actually received or paid. Net unrealized foreign exchange gains and losses arise from changes in foreign exchange rates on foreign denominated assets and liabilities other than investments in securities held at the end of the reporting period.
c. Joint Repurchase Agreement
The Fund enters into a joint repurchase agreement whereby its uninvested cash balance is deposited into a joint cash account with other funds managed by the investment manager or an affiliate of the investment manager and is used to invest in one or more repurchase agreements. The value and face amount of the joint repurchase agreement are allocated to the funds based on their pro-rata interest. A repurchase agreement is accounted for as a loan by the Fund to the seller, collateralized by securities which are delivered to the Fund’s custodian. The fair value, including accrued interest, of the initial collateralization is required to be at least 102% of the dollar amount invested by the funds, with the value of the underlying securities marked to market daily to maintain coverage of at least 100%. Repurchase agreements are subject to the terms of Master Repurchase Agreements (MRAs) with approved counterparties (sellers). The MRAs contain various provisions, including but not limited to events of default and maintenance of collateral for repurchase agreements. In the event of default by either the seller or the Fund, certain MRAs may permit the non-defaulting party to net and close-out all transactions, if any, traded under such agreements. The Fund may sell securities it holds as collateral and apply the proceeds towards the repurchase price and any other amounts owed by the seller to the Fund in the event of
| franklintempleton.com | Annual Report | 97 | ||||||||
FRANKLIN ALTERNATIVE STRATEGIES FUNDS
NOTES TO CONSOLIDATED FINANCIAL STATEMENTS
Franklin K2 Alternative Strategies Fund (continued)
1. Organization and Significant Accounting Policies (continued)
c. Joint Repurchase Agreement (continued)
default by the seller. This could involve costs or delays in addition to a loss on the securities if their value falls below the repurchase price owed by the seller. The joint repurchase agreement held by the Fund at year end, as indicated in the Consolidated Schedule of Investments, had been entered into on May 31, 2022.
d. Derivative Financial Instruments
The Fund invested in derivative financial instruments in order to manage risk or gain exposure to various other investments or markets. Derivatives are financial contracts based on an underlying or notional amount, require no initial investment or an initial net investment that is smaller than would normally be required to have a similar response to changes in market factors, and require or permit net settlement. Derivatives contain various risks including the potential inability of the counterparty to fulfill their obligations under the terms of the contract, the potential for an illiquid secondary market, and/or the potential for market movements which expose the Fund to gains or losses in excess of the amounts shown in the Consolidated Statement of Assets and Liabilities. Realized gain and loss and unrealized appreciation and depreciation on these contracts for the period are included in the Consolidated Statement of Operations.
Derivative counterparty credit risk is managed through a formal evaluation of the creditworthiness of all potential counterparties. The Fund attempts to reduce its exposure to counterparty credit risk on OTC derivatives, whenever possible, by entering into International Swaps and Derivatives Association (ISDA) master agreements with certain counterparties. These agreements contain various provisions, including but not limited to collateral requirements, events of default, or early termination. Termination events applicable to the counterparty include certain deteriorations in the credit quality of the counterparty. Termination events applicable to the Fund include failure of the Fund to maintain certain net asset levels and/or limit the decline in net assets over various periods of time. In the event of default or early termination, the ISDA master agreement gives the non-defaulting party the right to net and close-out all transactions traded, whether or not arising under the ISDA agreement, to one net amount payable by one counterparty to the other. However, absent an event of default or early termination, OTC derivative
assets and liabilities are presented gross and not offset in the Consolidated Statement of Assets and Liabilities. Early termination by the counterparty may result in an immediate payment by the Fund of any net liability owed to that counterparty under the ISDA agreement.
Collateral requirements differ by type of derivative. Collateral or initial margin requirements are set by the broker or exchange clearing house for exchange traded and centrally cleared derivatives. Initial margin deposited is held at the exchange and can be in the form of cash and/or securities. For OTC derivatives traded under an ISDA master agreement, posting of collateral is required by either the Fund or the applicable counterparty if the total net exposure of all OTC derivatives with the applicable counterparty exceeds the minimum transfer amount, which typically ranges from $100,000 to $250,000, and can vary depending on the counterparty and the type of agreement. Generally, collateral is determined at the close of Fund business each day and any additional collateral required due to changes in derivative values may be delivered by the Fund or the counterparty the next business day, or within a few business days. Collateral pledged and/or received by the Fund for OTC derivatives, if any, is held in segregated accounts with the Fund’s custodian/counterparty broker and can be in the form of cash and/or securities. Unrestricted cash may be invested according to the Fund’s investment objectives. To the extent that the amounts due to the Fund from its counterparties are not subject to collateralization or are not fully collateralized, the Fund bears the risk of loss from counterparty non-performance.
The Fund entered into exchange traded futures contracts primarily to manage and/or gain exposure to commodity price, interest rate, equity price and foreign exchange rate risk. A futures contract is an agreement between the Fund and a counterparty to buy or sell an asset at a specified price on a future date. Required initial margins are pledged by the Fund, and the daily change in fair value is accounted for as a variation margin payable or receivable in the Consolidated Statement of Assets and Liabilities.
The Fund entered into OTC forward exchange contracts primarily to manage and/or gain exposure to certain foreign currencies. A forward exchange contract is an agreement between the Fund and a counterparty to buy or sell a foreign currency at a specific exchange rate on a future date.
The Fund entered into credit default swap contracts primarily to manage and/or gain exposure to credit risk. A credit
| 98 | Annual Report | franklintempleton.com | ||||||||
FRANKLIN ALTERNATIVE STRATEGIES FUNDS
NOTES TO CONSOLIDATED FINANCIAL STATEMENTS
Franklin K2 Alternative Strategies Fund (continued)
default swap is an agreement between the Fund and a counterparty whereby the buyer of the contract receives credit protection and the seller of the contract guarantees the credit worthiness of a referenced debt obligation. These agreements may be privately negotiated in the over-the-counter market (OTC credit default swaps) or may be executed in a multilateral trade facility platform, such as a registered exchange (centrally cleared credit default swaps). The underlying referenced debt obligation may be a single issuer of corporate or sovereign debt, a credit index, a basket of issuers or indices, or a tranche of a credit index or basket of issuers or indices. In the event of a default of the underlying referenced debt obligation, the buyer is entitled to receive the notional amount of the credit default swap contract from the seller in exchange for the referenced debt obligation, a net settlement amount equal to the notional amount of the credit default swap less the recovery value of the referenced debt obligation, or other agreed upon amount. For centrally cleared credit default swaps, required initial margins are pledged by the Fund, and the daily change in fair value is accounted for as a variation margin payable or receivable in the Consolidated Statement of Assets and Liabilities. Over the term of the contract, the buyer pays the seller a periodic stream of payments, provided that no event of default has occurred. Such periodic payments are accrued daily as an unrealized appreciation or depreciation until the payments are made, at which time they are realized. Upfront payments and receipts are reflected in the Consolidated Statement of Assets and Liabilities and represent compensating factors between stated terms of the credit default swap agreement and prevailing market conditions (credit spreads and other relevant factors). These upfront payments and receipts are amortized over the term of the contract as a realized gain or loss in the Consolidated Statement of Operations.
The Fund entered into OTC cross currency swap contracts primarily to manage and/or gain exposure to certain foreign currencies. A cross currency swap is an agreement between the Fund and a counterparty to exchange cash flows (determined using either a fixed or floating rate) based on the notional amounts of two different currencies. The notional amounts are typically determined based on the spot exchange rates at the opening of the contract. Cross currency swaps may require the exchange of notional amounts at the opening and/or closing of the contract. Over the term of the contract, contractually required payments to be paid and to be received are accrued daily and recorded as unrealized depreciation and appreciation until the payments are
made, at which time they are realized. Any upfront payments and receipts are reflected in the Consolidated Statement of Assets and Liabilities and represent compensating factors between stated terms of the cross currency swap contract and prevailing market conditions (interest rate spreads and other relevant factors). These upfront payments and receipts are amortized over the term of the contract as a realized gain or loss in the Consolidated Statement of Operations, if any.
The Fund entered into interest rate swap contracts primarily to manage and/or gain exposure to interest rate risk. An interest rate swap is an agreement between the Fund and a counterparty to exchange cash flows based on the difference between two interest rates, applied to a notional amount. These agreements may be privately negotiated in the over-the-counter market (OTC interest rate swaps) or may be executed on a registered exchange (centrally cleared interest rate swaps). For centrally cleared interest rate swaps, required initial margins are pledged by the Fund, and the daily change in fair value is accounted for as a variation margin payable or receivable in the Consolidated Statement of Assets and Liabilities. Over the term of the contract, contractually required payments to be paid and to be received are accrued daily and recorded as unrealized depreciation and appreciation until the payments are made, at which time they are realized.
The Fund entered into OTC total return swap contracts primarily to manage and/or gain exposure to equity price of an underlying instrument such as a stock, bond, index or basket of securities or indices. A total return swap is an agreement between the Fund and a counterparty to exchange a return linked to an underlying instrument for a floating or fixed rate payment, both based upon a notional amount. Over the term of the contract, contractually required payments to be paid or received are accrued daily and recorded as unrealized appreciation or depreciation until the payments are made, at which time they are recognized as realized gain or loss.
The Fund purchased or wrote exchange traded and/or OTC option contracts primarily to manage and/or gain exposure to equity price, interest rate and foreign exchange rate risk. An option is a contract entitling the holder to purchase or sell a specific amount of shares or units of an asset or notional amount of a swap (swaption), at a specified price. When an option is purchased or written, an amount equal to the premium paid or received is recorded as an asset or liability, respectively.
| franklintempleton.com | Annual Report | 99 | ||||||||
FRANKLIN ALTERNATIVE STRATEGIES FUNDS
NOTES TO CONSOLIDATED FINANCIAL STATEMENTS
Franklin K2 Alternative Strategies Fund (continued)
1. Organization and Significant Accounting Policies (continued)
d. Derivative Financial Instruments (continued)
Upon exercise of an option, the acquisition cost or sales proceeds of the underlying investment is adjusted by any premium received or paid. Upon expiration of an option, any premium received or paid is recorded as a realized gain or loss. Upon closing an option other than through expiration or exercise, the difference between the premium received or paid and the cost to close the position is recorded as a realized gain or loss.
See Notes 6 and 12 regarding investment transactions and other derivative information, respectively.
e. Restricted Cash
At May 31, 2022, the Fund held restricted cash in connection with investments in certain derivative securities. Restricted cash is held in a segregated account with the Fund’s custodian/counterparty broker and is reflected in the Consolidated Statement of Assets and Liabilities.
f. Securities Sold Short
The Fund is engaged in selling securities short, which obligates the Fund to replace a borrowed security with the same security at current fair value. The Fund incurs a loss if the price of the security increases between the date of the short sale and the date on which the Fund replaces the borrowed security. The Fund realizes a gain if the price of the security declines between those dates. Gains are limited to the price at which the Fund sold the security short, while losses are potentially unlimited in size.
The Fund is required to establish a margin account with the broker lending the security sold short. While the short sale is outstanding, the broker retains the proceeds of the short sale to the extent necessary to meet margin requirements until the short position is closed out. A deposit must also be maintained with the Fund’s custodian/counterparty broker consisting of cash and/or securities having a value equal to a specified percentage of the value of the securities sold short. The Fund is obligated to pay fees for borrowing the securities sold short and is required to pay the counterparty any dividends and/or interest due on securities sold short. Such dividends and/or interest and any security borrowing fees are recorded as an expense to the Fund.
g. Securities Lending
The Fund participates in an agency based securities lending program to earn additional income. The Fund receives collateral in the form of cash and/or U.S. Government and Agency Securities against the loaned securities in an amount equal to at least 102% of the fair value of the loaned securities. Collateral is maintained over the life of the loan in an amount not less than 100% of the fair value of loaned securities, as determined at the close of Fund business each day; any additional collateral required due to changes in security values is delivered to the Fund on the next business day. Any cash collateral received is deposited into a joint cash account with other funds and is used to invest in a money market fund managed by Franklin Advisers, Inc., an affiliate of the Fund, and/or a joint repurchase agreement. Additionally, the Fund received $2,241,410 in U.S. Government and Agency Securities as collateral. These securities received as collateral are held in segregated accounts with the Fund’s custodian. The Fund cannot repledge or resell these securities received as collateral. As such, the non-cash collateral is excluded from the Consolidated Statement of Assets and Liabilities. The Fund may receive income from the investment of cash collateral, in addition to lending fees and rebates paid by the borrower. Income from securities loaned, net of fees paid to the securities lending agent and/or third party vendor, is reported separately in the Consolidated Statement of Operations. The Fund bears the market risk with respect to any cash collateral investment, securities loaned, and the risk that the agent may default on its obligation to the Fund. If the borrower defaults on its obligations to return the securities loaned, the Fund has the right to repurchase the securities in the open market using the collateral received. The securities lending agent has agreed to indemnify the Fund in the event of default by a third party borrower.
h. Investments in K2 Holdings Investment Corp. (K2 Subsidiary)
The Fund invests in certain financial instruments and commodity-linked derivative investments through its investment in the K2 Subsidiary. The K2 Subsidiary is a Cayman Islands exempted company with limited liability, is a wholly-owned subsidiary of the Fund, and is able to invest in certain financial instruments and commodity-linked derivative investments consistent with the investment objective of the Fund. At May 31, 2022, the K2 Subsidiary’s investments, as well as any other assets and liabilities of the K2 Subsidiary, are reflected in the Fund’s Consolidated Schedule of Investments
| 100 | Annual Report | franklintempleton.com | ||||||||
FRANKLIN ALTERNATIVE STRATEGIES FUNDS
NOTES TO CONSOLIDATED FINANCIAL STATEMENTS
Franklin K2 Alternative Strategies Fund (continued)
and Consolidated Statement of Assets and Liabilities. All intercompany transactions and balances have been eliminated. For tax purposes, the Fund is required to increase its taxable income by its share of the K2 Subsidiary’s income. Net losses incurred by the K2 Subsidiary cannot offset income earned by the Fund and cannot be carried back or forward by the K2 Subsidiary to offset income from prior or future years. At May 31, 2022, the net assets of the K2 Subsidiary were $26,596,235 representing 2.1% of the Fund’s consolidated net assets. The Fund’s investment in the K2 Subsidiary is limited to 25% of consolidated assets.
i. Senior Floating Rate Interests
The Fund invests in senior secured corporate loans that pay interest at rates which are periodically reset by reference to a base lending rate plus a spread. These base lending rates are generally the prime rate offered by a designated U.S. bank or the London InterBank Offered Rate (LIBOR). Senior secured corporate loans often require prepayment of principal from excess cash flows or at the discretion of the borrower. As a result, actual maturity may be substantially less than the stated maturity. Senior secured corporate loans in which the Fund invests are generally readily marketable, but may be subject to certain restrictions on resale.
j. Income and Deferred Taxes
It is the Fund’s policy to qualify as a regulated investment company under the Internal Revenue Code. The Fund intends to distribute to shareholders substantially all of its taxable income and net realized gains to relieve it from federal income and excise taxes. As a result, no provision for U.S. federal income taxes is required.
The Fund may be subject to foreign taxation related to income received, capital gains on the sale of securities and certain foreign currency transactions in the foreign jurisdictions in which it invests. Foreign taxes, if any, are recorded based on the tax regulations and rates that exist in the foreign markets in which the Fund invests. When a capital gain tax is determined to apply, the Fund records an estimated deferred tax liability in an amount that would be payable if the securities were disposed of on the valuation date.
The Fund may recognize an income tax liability related to its uncertain tax positions under U.S. GAAP when the uncertain tax position has a less than 50% probability that it will be sustained upon examination by the tax authorities based on its
technical merits. As of May 31, 2022, the Fund has determined that no tax liability is required in its consolidated financial statements related to uncertain tax positions for any open tax years (or expected to be taken in future tax years). Open tax years are those that remain subject to examination and are based on the statute of limitations in each jurisdiction in which the Fund invests.
k. Security Transactions, Investment Income, Expenses and Distributions
Security transactions are accounted for on trade date. Realized gains and losses on security transactions are determined on a specific identification basis. Interest income and estimated expenses are accrued daily. Amortization of premium and accretion of discount on debt securities are included in interest income. Paydown gains and losses are recorded as an adjustment to interest income. Facility fees are recognized as income over the expected term of the loan. Dividend income and dividends declared on securities sold short are recorded on the ex-dividend date except for certain dividends from securities where the dividend rate is not available. In such cases, the dividend is recorded as soon as the information is received by the Fund. Distributions to shareholders are recorded on the ex-dividend date. Distributable earnings are determined according to income tax regulations (tax basis) and may differ from earnings recorded in accordance with U.S. GAAP. These differences may be permanent or temporary. Permanent differences are reclassified among capital accounts to reflect their tax character. These reclassifications have no impact on net assets or the results of operations. Temporary differences are not reclassified, as they may reverse in subsequent periods.
Common expenses incurred by the Trust are allocated among the Funds based on the ratio of net assets of each Fund to the combined net assets of the Trust or based on the ratio of number of shareholders of each Fund to the combined number of shareholders of the Trust. Fund specific expenses are charged directly to the Fund that incurred
the expense.
Realized and unrealized gains and losses and net investment income, excluding class specific expenses, are allocated daily to each class of shares based upon the relative proportion of net assets of each class. Differences in per share distributions by class are generally due to differences in class specific expenses.
| franklintempleton.com | Annual Report | 101 | ||||||||
FRANKLIN ALTERNATIVE STRATEGIES FUNDS
NOTES TO CONSOLIDATED FINANCIAL STATEMENTS
Franklin K2 Alternative Strategies Fund (continued)
1. Organization and Significant Accounting Policies (continued)
l. Accounting Estimates
The preparation of financial statements in accordance with U.S. GAAP requires management to make estimates and assumptions that affect the reported amounts of assets and liabilities at the date of the financial statements and the amounts of income and expenses during the reporting period. Actual results could differ from those estimates.
m. Guarantees and Indemnifications
Under the Trust’s organizational documents, its officers and trustees are indemnified by the Trust against certain liabilities arising out of the performance of their duties to the Trust. Additionally, in the normal course of business, the Trust, on behalf of the Fund, enters into contracts with service providers that contain general indemnification clauses. The Trust’s maximum exposure under these arrangements is unknown as this would involve future claims that may be made against the Trust that have not yet occurred. Currently, the Trust expects the risk of loss to be remote.
2. Shares of Beneficial Interest
At May 31, 2022, there were an unlimited number of shares authorized (without par value). Transactions in the Fund’s shares were as follows:
| Year Ended May 31, | ||||||||||||||||||||
| 2022 | 2021 | |||||||||||||||||||
| Shares | Amount | Shares | Amount | |||||||||||||||||
| Class A Shares: | ||||||||||||||||||||
Shares solda | 1,769,519 | $ | 21,332,819 | 1,951,153 | $ | 23,399,007 | ||||||||||||||
Shares issued in reinvestment of distributions | 360,033 | 4,313,199 | 57,588 | 702,572 | ||||||||||||||||
Shares redeemed | (1,847,856 | ) | (21,959,532 | ) | (1,878,747 | ) | (22,350,579 | ) | ||||||||||||
|
| |||||||||||||||||||
Net increase (decrease) | 281,696 | $ | 3,686,486 | 129,994 | $ | 1,751,000 | ||||||||||||||
|
| |||||||||||||||||||
| Class C Shares: | ||||||||||||||||||||
Shares sold | 480,168 | $ | 5,612,560 | 378,698 | $ | 4,426,844 | ||||||||||||||
Shares issued in reinvestment of distributions | 86,857 | 1,009,276 | 20,310 | 241,483 | ||||||||||||||||
Shares redeemeda | (904,193 | ) | (10,516,915 | ) | (1,086,696 | ) | (12,579,701 | ) | ||||||||||||
|
| |||||||||||||||||||
Net increase (decrease) | (337,168 | ) | $ | (3,895,079 | ) | (687,688 | ) | $ | (7,911,374 | ) | ||||||||||
|
| |||||||||||||||||||
| Class R Shares: | ||||||||||||||||||||
Shares sold | 44,316 | $ | 551,233 | 7,188 | $ | 83,786 | ||||||||||||||
Shares issued in reinvestment of distributions | 4,740 | 56,639 | 538 | 6,563 | ||||||||||||||||
Shares redeemed | (43,693 | ) | (492,306 | ) | (19,125 | ) | (223,542 | ) | ||||||||||||
|
| |||||||||||||||||||
Net increase (decrease) | 5,363 | $ | 115,566 | (11,399 | ) | $ | (133,193 | ) | ||||||||||||
|
| |||||||||||||||||||
| Class R6 Shares: | ||||||||||||||||||||
Shares sold | 2,732,753 | $ | 34,472,560 | 1,604,568 | $ | 19,048,050 | ||||||||||||||
Shares issued in reinvestment of distributions | 204,346 | 2,468,501 | 15,991 | 196,690 | ||||||||||||||||
Shares redeemed | (872,943 | ) | (10,516,538 | ) | (817,737 | ) | (10,017,572 | ) | ||||||||||||
|
| |||||||||||||||||||
Net increase (decrease) | 2,064,156 | $ | 26,424,523 | 802,822 | $ | 9,227,168 | ||||||||||||||
|
| |||||||||||||||||||
| Advisor Class Shares: | ||||||||||||||||||||
Shares sold | 31,381,005 | $ | 381,327,809 | 25,684,121 | $ | 308,883,780 | ||||||||||||||
Shares issued in reinvestment of distributions | 3,252,963 | 39,198,207 | 466,135 | 5,719,482 | ||||||||||||||||
Shares redeemed | (28,619,216 | ) | (341,198,204 | ) | (21,325,304 | ) | (255,114,570 | ) | ||||||||||||
|
| |||||||||||||||||||
Net increase (decrease) | 6,014,752 | $ | 79,327,812 | 4,824,952 | $ | 59,488,692 | ||||||||||||||
|
| |||||||||||||||||||
aMay include a portion of Class C shares that were automatically converted to Class A.
| 102 | Annual Report | franklintempleton.com | ||||||||
FRANKLIN ALTERNATIVE STRATEGIES FUNDS
NOTES TO CONSOLIDATED FINANCIAL STATEMENTS
Franklin K2 Alternative Strategies Fund (continued)
3. Transactions with Affiliates
Franklin Resources, Inc. is the holding company for various subsidiaries that together are referred to as Franklin Templeton. Certain officers and trustees of the Trust are also officers and/or directors of the following subsidiaries:
| Subsidiary | Affiliation | |
K2/D&S Management Co., L.L.C. (K2 Advisors) | Investment manager | |
Franklin Templeton Services, LLC (FT Services) | Administrative manager | |
Franklin Distributors, LLC (Distributors) | Principal underwriter | |
Franklin Templeton Investor Services, LLC (Investor Services) | Transfer agent | |
a. Management Fees
The Fund and K2 Subsidiary pay an investment management fee, calculated daily and paid monthly, to K2 Advisors based on the average daily net assets of the Fund and K2 Subsidiary as follows:
| Annualized Fee Rate | Net Assets | |
1.90% | Up to and including $1 billion | |
1.85% | Over $1 billion, up to and including $1.5 billion | |
1.80% | Over $1.5 billion, up to and including $3 billion | |
1.75% | In excess of $3 billion | |
For the year ended May 31, 2022, the gross effective management fee rate was 1.89% of the Fund’s average daily net assets.
Management fees paid by the Fund are reduced on assets invested in the K2 Subsidiary, in an amount equal to the management fees paid by the K2 Subsidiary.
Under each subadvisory agreement, the below entities provide subadvisory services to the Fund or K2 Subsidiary. The subadvisory fees are paid by K2 Advisors and are not an additional expense of the Fund or K2 Subsidiary. Each subadvisor is compensated for managing its respective portion of the average daily net assets of the Fund or K2 Subsidiary.
| Subadvisors |
Apollo Credit Management LLC |
Bardin Hill Arbitrage IC Management LP |
Benefit Street Partners L.L.C. * |
BlueBay Asset Management LLP |
Chilton Investment Company, Inc. |
Electron Capital Partners, LLC |
Ellington Global Asset Management, LLC |
Emso Asset Management Limited |
Graham Capital Management, L.P. |
Jennison Associates, LLC |
Lazard Asset Management, LLC |
Loomis Sayles & Company, L.P. |
One River Asset Management, LLC |
P. Schoenfeld Asset Management L.P. |
| franklintempleton.com | Annual Report | 103 | ||||||||
FRANKLIN ALTERNATIVE STRATEGIES FUNDS
NOTES TO CONSOLIDATED FINANCIAL STATEMENTS
Franklin K2 Alternative Strategies Fund (continued)
3. Transactions with Affiliates (continued)
a. Management Fees (continued)
| Subadvisors |
Portland Hill Asset Management Limited |
RV Capital Management Private, Ltd. |
Wellington Management Company, LLP |
*An affiliate of K2 Advisors.
b. Administrative Fees
Under an agreement with K2 Advisors, FT Services provides administrative services to the Fund and K2 Subsidiary. The fee is paid by K2 Advisors based on the Fund’s and K2 Subsidiary’s average daily net assets, and is not an additional expense of the Fund or K2 Subsidiary.
c. Distribution Fees
The Board has adopted distribution plans for each share class, with the exception of Class R6 and Advisor Class shares, pursuant to Rule 12b-1 under the 1940 Act. Under the Fund’s Class A reimbursement distribution plan, the Fund reimburses Distributors for costs incurred in connection with the servicing, sale and distribution of the Fund’s shares up to the maximum annual plan rate. Under the Class A reimbursement distribution plan, costs exceeding the maximum for the current plan year cannot be reimbursed in subsequent periods. In addition, under the Fund’s Class C and R compensation distribution plans, the Fund pays Distributors for costs incurred in connection with the servicing, sale and distribution of the Fund’s shares up to the maximum annual plan rate for each class. The plan year, for purposes of monitoring compliance with the maximum annual plan rates, is February 1 through January 31.
The maximum annual plan rates, based on the average daily net assets, for each class, are as follows:
Class A | 0.30% | |||
Class C | 1.00% | |||
Class R | 0.50% |
The Board has set the current rate at 0.25% per year for Class A shares until further notice and approval by the Board.
d. Sales Charges/Underwriting Agreements
Front-end sales charges and contingent deferred sales charges (CDSC) do not represent expenses of the Fund. These charges are deducted from the proceeds of sales of Fund shares prior to investment or from redemption proceeds prior to remittance, as applicable. Distributors has advised the Fund of the following commission transactions related to the sales and redemptions of the Fund’s shares for the year:
Sales charges retained net of commissions paid to unaffiliated brokers/dealers | $ | 10,984 | ||
CDSC retained | $ | 1,645 |
e. Transfer Agent Fees
Each class of shares pays transfer agent fees to Investor Services for its performance of shareholder servicing obligations. The fees are based on an annualized asset based fee of 0.02% plus a transaction based fee. In addition, each class reimburses Investor Services for out of pocket expenses incurred and, except for Class R6, reimburses shareholder servicing fees paid to third parties. These fees are allocated daily based upon their relative proportion of such classes’ aggregate net assets. Class R6 pays Investor Services transfer agent fees specific to that class.
| 104 | Annual Report | franklintempleton.com | ||||||||
FRANKLIN ALTERNATIVE STRATEGIES FUNDS
NOTES TO CONSOLIDATED FINANCIAL STATEMENTS
Franklin K2 Alternative Strategies Fund (continued)
For the year ended May 31, 2022, the Fund paid transfer agent fees of $1,393,623, of which $458,908 was retained by Investor Services.
f. Investments in Affiliated Management Investment Companies
The Fund invests in one or more affiliated management investment companies. As defined in the 1940 Act, an investment is deemed to be a “Controlled Affiliate” of a fund when a fund owns, either directly or indirectly, 25% or more of the affiliated fund’s outstanding shares or has the power to exercise control over management or policies of such fund. The Fund does not invest for purposes of exercising a controlling influence over the management or policies. Management fees paid by the Fund are waived on assets invested in the affiliated management investment companies, as noted in the Consolidated Statement of Operations, in an amount not to exceed the management and administrative fees paid directly or indirectly by each affiliate. During the year ended May 31, 2022, the Fund held investments in affiliated management investment companies as follows:
| Value at Beginning of Year | Purchases | Sales | Realized Gain (Loss) | Net Change in Unrealized Appreciation (Depreciation) | Value at End of Year | Number of Shares Held at End of Year | Income from Securities Loaned | |||||||||||||||||||||||||
| Non-Controlled Affiliates | ||||||||||||||||||||||||||||||||
Institutional Fiduciary Trust Money Market Portfolio, 0.437% | $ | 3,305,000 | $ | 69,875,000 | $ | (68,243,000 | ) | $ | — | $ | — | $ | 4,937,000 | 4,937,000 | $ | 2,117 | ||||||||||||||||
|
| |||||||||||||||||||||||||||||||
g. Waiver and Expense Reimbursements
K2 Advisors has contractually agreed in advance to waive or limit its fees and to assume as their own expense certain expenses otherwise payable by the Fund so that the operating expenses (excluding interest expense, distribution fees, acquired fund fees and expenses, expenses related to securities sold short and certain non-routine expenses or costs, including those relating to litigation, indemnification, reorganizations and liquidations) for each class of the Fund do not exceed 1.95% based on the average net assets of each class until September 30, 2022. Total expenses waived or paid are not subject to recapture subsequent to the Fund’s fiscal year end.
Investor Services has contractually agreed in advance to waive or limit its fees so that the Class R6 transfer agent fees do not exceed 0.03% based on the average net assets of the class until September 30, 2022.
4. Expense Offset Arrangement
The Fund has entered into an arrangement with its custodian whereby credits realized as a result of uninvested cash balances are used to reduce a portion of the Fund’s custodian expenses. During the year ended May 31, 2022, the custodian fees were reduced as noted in the Consolidated Statement of Operations.
5. Income Taxes
The tax character of distributions paid during the years ended May 31, 2022 and 2021, was as follows:
| 2022 | 2021 | |||||||
| Distributions paid from: | ||||||||
Ordinary income | $ | 18,664,819 | $ | — | ||||
Long term capital gain | 48,159,757 | 9,823,602 | ||||||
|
| |||||||
Total distributions paid | $ | 66,824,576 | $ | 9,823,602 | ||||
|
| |||||||
| franklintempleton.com | Annual Report | 105 | ||||||||
FRANKLIN ALTERNATIVE STRATEGIES FUNDS
NOTES TO CONSOLIDATED FINANCIAL STATEMENTS
Franklin K2 Alternative Strategies Fund (continued)
5. Income Taxes (continued)
At May 31, 2022, the cost of investments, net unrealized appreciation (depreciation), undistributed ordinary income and undistributed long term capital gain for income tax purposes were as follows:
Cost of investments | $ | 964,190,362 | ||
|
| |||
Unrealized appreciation | $ | 113,962,600 | ||
Unrealized depreciation | (113,621,804 | ) | ||
|
| |||
Net unrealized appreciation (depreciation) | $ | 340,796 | ||
|
| |||
Distributable earnings | ||||
Undistributed ordinary income | $ | 7,254,960 | ||
Undistributed long term capital gain | 8,295,038 | |||
|
| |||
Total distributable earnings | $ | 15,549,998 | ||
|
|
Differences between income and/or capital gains as determined on a book basis and a tax basis are primarily due to differing treatments of foreign currency transactions, wash sales and investments in the K2 Subsidiary.
The Fund utilized a tax accounting practice to treat a portion of the proceeds from the capital shares redeemed as a distribution from realized capital gains.
6. Investment Transactions
Purchases and sales of investments and securities sold short (excluding short term securities) for the year ended May 31, 2022, aggregated $2,366,093,228 and $2,295,477,743, respectively.
At May 31, 2022, in connection with securities lending transactions, the Fund loaned equity investments and corporate bonds and notes and received $5,995,171 of cash collateral. The gross amounts of recognized liability for such transactions are included in payable upon return of securities loaned in the Consolidated Statement of Assets and Liabilities. The agreements can be terminated at any time.
The Fund sold certain long positions held in the portfolio and simultaneously entered into total return swaps on the positions, retaining substantially all of the exposure to the economic return and the related risks on the long positions. At May 31, 2022, the transfers of financial assets accounted for as sales were as follows:
| At Original Transactions Dates | At Year Ended May 31, 2022 | |||||||||||||||||||
Cost Basis of Positions Sold | Gross Cash Received for Positions Sold | Fair Value of Transferred Assetsa | Gross Derivative Assets | Gross Derivative Liabilities | ||||||||||||||||
Sales and total return swaps | $ | 2,683,794 | $ | 3,344,284 | $ | 2,893,091 | $ | 2,893,117 | $ | (3,344,310 | ) | |||||||||
|
|
|
| |||||||||||||||||
a$(451,193) of fair value of transferred assets are included as unrealized appreciation and depreciation on OTC swap contracts in the Consolidated Statement of Assets and Liabilities.
bBalances are presented on a gross basis, based on each leg of the swap contract, before the application of counterparty and cash collateral offsetting.
See Notes 1(d) and 14 regarding derivative financial instruments and other derivative information, respectively.
7. Credit Risk and Defaulted Securities
At May 31, 2022, the Fund had 5.5% of its portfolio invested in high yield, senior secured floating rate loans, or other securities rated below investment grade as determined by Nationally Recognized Statistical Credit Ratings Organizations and/or internally, by investment management and unrated securities. These securities may be more sensitive to economic conditions causing greater price volatility and are potentially subject to a greater risk of loss due to default than higher rated securities.
| 106 | Annual Report | franklintempleton.com | ||||||||
FRANKLIN ALTERNATIVE STRATEGIES FUNDS
NOTES TO CONSOLIDATED FINANCIAL STATEMENTS
Franklin K2 Alternative Strategies Fund (continued)
The Fund may purchase the pre-default or defaulted debt of distressed companies. Distressed companies are financially troubled and could be or are already involved in financial restructuring or bankruptcy. Risks associated with purchasing these securities include the possibility that the bankruptcy or other restructuring process takes longer than expected, or that distributions in restructuring are less than anticipated, either or both of which may result in unfavorable consequences to the Fund. If it becomes probable that the income on debt securities, including those of distressed companies, will not be collected, the Fund discontinues accruing income and recognizes an adjustment for uncollectible interest.
At May 31, 2022, the aggregate long value of distressed company securities for which interest recognition has been discontinued was $5,103,268, representing 0.4% of the Fund’s net assets. For information as to specific securities, see the accompanying Consolidated Schedule of Investments.
8. Concentration of Risk
Investments in issuers domiciled or with significant operations in developing or emerging market countries may be subject to higher risks than investments in developed countries. These risks include fluctuating currency values, underdeveloped legal or business systems, and changing local and regional economic, political and social conditions, which may result in greater market volatility. In addition, certain foreign securities may not be as liquid as U.S. securities. Currencies of developing or emerging market countries may be subject to significantly greater risks than currencies of developed countries, including the potential inability to repatriate those currencies into U.S. dollars.
At May 31, 2022, the Fund had 0.1% of its net assets denominated in Argentine Pesos. Argentina has restricted currency repatriation since September 2019, and had restructured certain issues of its debt. Political and economic conditions in Argentina could continue to affect the value of the Fund’s holdings.
9. Investments in Russian Securities
Russia’s military invasion of Ukraine in February 2022, the resulting responses by the United States and other countries, and the potential for wider conflict could increase volatility and uncertainty in the financial markets and adversely affect regional and global economies. The United States and other countries have imposed broad-ranging economic sanctions on Russia and certain Russian individuals, banking entities and corporations as a response to its invasion of Ukraine. The United States and other countries have also imposed economic sanctions on Belarus and may impose sanctions on other countries that support Russia’s military invasion. These sanctions, as well as any other economic consequences related to the invasion, such as additional sanctions, boycotts or changes in consumer or purchaser preferences or cyberattacks on governments, companies or individuals, may further decrease the value and liquidity of certain Russian securities and securities of issuers in other countries that are subject to economic sanctions related to the invasion. To the extent that the Fund has exposure to Russian investments or investments in countries affected by the invasion, the Fund’s ability to price, buy, sell, receive or deliver such investments was impaired. The Fund could determine at any time that certain of the most affected securities have little or no value. In addition, any exposure that the Fund may have to counterparties in Russia or in countries affected by the invasion could negatively impact the Fund’s portfolio. The extent and duration of Russia’s military actions and the repercussions of such actions (including any retaliatory actions or countermeasures that may be taken by those subject to sanctions) are impossible to predict, but could result in significant market disruptions, including in the oil and natural gas markets, and may negatively affect global supply chains, inflation and global growth. These and any related events could significantly impact the Fund’s performance and the value of an investment in the Fund, even beyond any direct exposure the Fund may have to Russian issuers or issuers in other countries affected by the invasion. The Valuation Committee determined that based on their analysis of the market and access to market participants, the Russian financial instruments held by the Fund had little or no value at May 31, 2022.
| franklintempleton.com | Annual Report | 107 | ||||||||
FRANKLIN ALTERNATIVE STRATEGIES FUNDS
NOTES TO CONSOLIDATED FINANCIAL STATEMENTS
Franklin K2 Alternative Strategies Fund (continued)
10. Novel Coronavirus Pandemic
The global outbreak of the novel coronavirus disease, known as COVID-19, has caused adverse effects on many companies, sectors, nations, regions and the markets in general, and may continue for an unpredictable duration. The effects of this pandemic may materially impact the value and performance of the Fund, its ability to buy and sell fund investments at appropriate valuations and its ability to achieve its investment objectives.
11. Unfunded Loan Commitments
The Fund enters into certain credit agreements, all or a portion of which may be unfunded. The Fund is obligated to fund these loan commitments at the borrowers’ discretion. Unfunded loan commitments and funded portions of credit agreements are marked to market daily and any unrealized appreciation or depreciation is included in the Consolidated Statement of Assets and Liabilities and the Consolidated Statement of Operations. Funded portions of credit agreements are presented in the Consolidated Schedule of Investments.
At May 31, 2022, unfunded commitments were as follows:
| Borrower | Unfunded Commitment | |||
Delivery Hero SE, Term Loan B | $ | 687,750 | ||
Upfield Group BV, Term Loan RC | 400,050 | |||
|
| |||
| $ | 1,087,800 | |||
|
| |||
12. Other Derivative Information
At May 31, 2022, the investments in derivative contracts are reflected in the Consolidated Statement of Assets and Liabilities as follows:
Asset Derivatives | Liability Derivatives | |||||||||||
| Derivative Contracts Not Accounted for as Hedging Instruments | Consolidated Statement of Assets and Liabilities Location | Fair Value | Consolidated Statement of Assets and Liabilities Location | Fair Value | ||||||||
Interest rate contracts | Investments in securities, at value | $ | 421,474 | a | Options written, at value | $ | 520,178 | |||||
Variation margin on futures contracts | 1,541,494 | b | Variation margin on futures contracts | 1,052,127 | b | |||||||
Variation margin on centrally cleared swap contracts | 2,087,513 | b | Variation margin on centrally cleared swap contracts | 1,902,202 | b | |||||||
Foreign exchange contracts | Investments in securities, at value | 32,988 | a | Options written, at value | 6,189 | |||||||
Unrealized appreciation on OTC forward exchange contracts | 6,604,272 | Unrealized depreciation on OTC forward exchange contracts | 4,709,210 | |||||||||
Variation margin on futures contracts | 27,805 | b | ||||||||||
Unrealized appreciation on OTC swap contracts | 196,815 | |||||||||||
Credit contracts | Variation margin on centrally cleared swap contracts | 132,394 | b | Variation margin on centrally cleared swap contracts | 28,600 | b | ||||||
OTC swap contracts (upfront payments) | 2,335,570 | OTC swap contracts (upfront receipts) | 697,391 | |||||||||
Unrealized appreciation on OTC swap contracts | 407,917 | Unrealized depreciation on OTC swap contracts | 196,411 | |||||||||
| 108 | Annual Report | franklintempleton.com | ||||||||
FRANKLIN ALTERNATIVE STRATEGIES FUNDS
NOTES TO CONSOLIDATED FINANCIAL STATEMENTS
Franklin K2 Alternative Strategies Fund (continued)
Asset Derivatives | Liability Derivatives | |||||||||||
| Derivative Contracts Not Accounted for as Hedging Instruments | Consolidated Statement of Assets and Liabilities Location | Fair Value | Consolidated Statement of Assets and Liabilities Location | Fair Value | ||||||||
Equity contracts | Investments in securities, at value | $ | 5,377,596 | a | Options written, at value | $ | 1,440,465 | |||||
Variation margin on futures contracts | 1,095,524 | b | Variation margin on futures contracts | 2,135,684 | b | |||||||
Unrealized appreciation on OTC swap contracts | 4,448,675 | Unrealized depreciation on OTC swap contracts | 2,775,210 | |||||||||
Commodity contracts | Variation margin on futures contracts | 1,105,375 | b | Variation margin on futures contracts | 341,933 | b | ||||||
|
|
|
| |||||||||
Totals | $ | 25,815,412 | $ | 15,805,600 | ||||||||
|
|
|
| |||||||||
aPurchased option contracts are included in investments in securities, at value in the Consolidated Statement of Assets and Liabilities.
bThis amount reflects the cumulative appreciation (depreciation) of futures contracts and centrally cleared swap contracts as reported in the Consolidated Schedule of Investments. Only the variation margin receivable/payable at year end is separately reported within the Consolidated Statement of Assets and Liabilities. Prior variation margin movements were recorded to cash upon receipt or payment.
For the year ended May 31, 2022, the effect of derivative contracts in the Consolidated Statement of Operations was as follows:
| Derivative Contracts Not Accounted for as Hedging Instruments | Consolidated Statement of Operations Location | Net Realized Gain (Loss) for the Year | Consolidated Statement of Operations Location | Net Change in Unrealized Appreciation (Depreciation) for the Year | ||||||||
Net realized gain (loss) from: | Net change in unrealized appreciation (depreciation) on: | |||||||||||
Interest rate contracts | Investments | $ | 84,901 | a | Investments | $ | (95,205 | )a | ||||
Written options | (87,161 | ) | Written options | 158,117 | ||||||||
Futures contracts | (2,717,091 | ) | Futures contracts | 626,008 | ||||||||
Swap contracts | 2,686,631 | Swap contracts | 235,717 | |||||||||
Foreign exchange contracts | Investments | (14,571 | )a | Investments | 6,814 | a | ||||||
Written options | (185,049 | ) | Written options | (379 | ) | |||||||
Forward exchange contracts | 10,181,183 | Forward exchange contracts | 3,870,801 | |||||||||
Futures contracts | 40,828 | Futures contracts | 27,735 | |||||||||
Swap contracts | 196,815 | |||||||||||
Credit contracts | Swap contracts | 1,588,412 | Swap contracts | 909,644 | ||||||||
Equity contracts | Investments | (3,134,139 | )a | Investments | (12,467 | )a | ||||||
Written options | 1,928,493 | Written options | (216,255 | ) | ||||||||
Futures contracts | (2,691,571 | ) | Futures contracts | 1,237,335 | ||||||||
Swap contracts | (4,910,775 | ) | Swap contracts | (2,326,178 | ) | |||||||
Commodity contracts | Futures contracts | 8,076,728 | Futures contracts | (558,507 | ) | |||||||
|
|
|
| |||||||||
Totals | $ | 10,846,819 | $ | 4,059,995 | ||||||||
|
|
|
| |||||||||
aPurchased option contracts are included in net realized gain (loss) from investments and net change in unrealized appreciation (depreciation) on investments in the Consolidated Statement of Operations.
For the year ended May 31, 2022, the average month end notional amount of options, futures contracts and swap contracts represented 3,191,146 shares/units, $595,247,838 and $594,905,525, respectively. The average month end contract value of forward exchange contracts was $383,579,706.
| franklintempleton.com | Annual Report | 109 | ||||||||
FRANKLIN ALTERNATIVE STRATEGIES FUNDS
NOTES TO CONSOLIDATED FINANCIAL STATEMENTS
Franklin K2 Alternative Strategies Fund (continued)
12. Other Derivative Information (continued)
At May 31, 2022, OTC derivative assets and liabilities are as follows:
| Gross Amounts of Assets and Liabilities Presented in the Consolidated Statement of Assets and Liabilities | ||||||||
| Assetsa | Liabilitiesa | |||||||
| Derivatives | ||||||||
Forward Exchange Contracts | $ | 6,604,272 | $ | 4,709,210 | ||||
Options Purchased | 137,740 | — | ||||||
Options Written | — | 6,761 | ||||||
Swap Contracts | 7,388,977 | 3,669,012 | ||||||
|
| |||||||
Total | $ | 14,130,989 | $ | 8,384,983 | ||||
|
| |||||||
aAbsent an event of default or early termination, OTC derivative assets and liabilities are presented gross and not offset in the Consolidated Statement of Assets and Liabilities.
At May 31, 2022, OTC derivative assets, which may be offset against OTC derivative liabilities and collateral received from the counterparty, are as follows:
| Amounts Not Offset in the Consolidated Statement of Assets and Liabilities | ||||||||||||||||||||
| Gross Amounts of Assets Presented in the Consolidated Statement of Assets and Liabilities | Financial Instruments Available for Offset | Financial Instruments Collateral Receiveda | Cash Collateral Receiveda | Net Amount (Not less than zero) | ||||||||||||||||
| Counterparty | ||||||||||||||||||||
BNPP | $ | 56,687 | $ | (56,687 | ) | $ | — | $ | — | $ | — | |||||||||
BNYM | 681,658 | (681,658 | ) | — | — | — | ||||||||||||||
BOFA | 32,886 | (29,877 | ) | — | — | 3,009 | ||||||||||||||
BZWS | 2,006,496 | (1,039,598 | ) | — | — | 966,898 | ||||||||||||||
CITI | 225,641 | (225,641 | ) | — | — | — | ||||||||||||||
DBAB | 49,296 | (30,339 | ) | — | — | 18,957 | ||||||||||||||
FBCO | 32,261 | (7,179 | ) | — | — | 25,082 | ||||||||||||||
GSCO | 3,847,084 | (547,428 | ) | — | (2,280,000 | ) | 1,019,656 | |||||||||||||
HSBC | 488,300 | (148,681 | ) | — | (339,619 | ) | — | |||||||||||||
JPHQ | 558,850 | (217,199 | ) | — | — | 341,651 | ||||||||||||||
JPHQb | 1,683,652 | — | — | — | 1,683,652 | |||||||||||||||
MSCO | 627,954 | (311,730 | ) | — | — | 316,224 | ||||||||||||||
MSCOb | 610,242 | — | — | — | 610,242 | |||||||||||||||
MSCOc | 1,986,291 | (689,497 | ) | — | — | 1,296,794 | ||||||||||||||
MSCS | 1,080,326 | (755,224 | ) | — | — | 325,102 | ||||||||||||||
SCBL | 36,824 | (36,824 | ) | — | — | — | ||||||||||||||
UBSW | 126,541 | (119,832 | ) | — | — | 6,709 | ||||||||||||||
|
| |||||||||||||||||||
Total | $ | 14,130,989 | $ | (4,897,394 | ) | $ | — | $ | (2,619,619 | ) | $ | 6,613,976 | ||||||||
|
| |||||||||||||||||||
| 110 | Annual Report | franklintempleton.com | ||||||||
FRANKLIN ALTERNATIVE STRATEGIES FUNDS
NOTES TO CONSOLIDATED FINANCIAL STATEMENTS
Franklin K2 Alternative Strategies Fund (continued)
At May 31, 2022, OTC derivative liabilities, which may be offset against OTC derivative assets and collateral pledged to the counterparty, are as follows:
| Amounts Not Offset in the Consolidated Statement of Assets and Liabilities | ||||||||||||||||||||
| Gross Amounts of Liabilities Presented in the Consolidated Statement of Assets and Liabilities | Financial Instruments Available for Offset | Financial Instruments Collateral Pledged | Cash Collateral Pledgeda | Net Amount (Not less than zero) | ||||||||||||||||
| Counterparty | ||||||||||||||||||||
BNPP | $ | 127,120 | $ | (56,687 | ) | $ | — | $ | — | $ | 70,433 | |||||||||
BNYM | 1,046,950 | (681,658 | ) | — | (128,000 | ) | 237,292 | |||||||||||||
BOFA | 29,877 | (29,877 | ) | — | — | — | ||||||||||||||
BZWS | 1,039,598 | (1,039,598 | ) | — | — | — | ||||||||||||||
CITI | 333,531 | (225,641 | ) | — | (107,890 | ) | — | |||||||||||||
DBAB | 30,339 | (30,339 | ) | — | — | — | ||||||||||||||
FBCO | 7,179 | (7,179 | ) | — | — | — | ||||||||||||||
GSCO | 547,428 | (547,428 | ) | — | — | — | ||||||||||||||
HSBC | 148,681 | (148,681 | ) | — | — | — | ||||||||||||||
JPHQ | 217,199 | (217,199 | ) | — | — | — | ||||||||||||||
JPHQb | 1,395,250 | — | — | — | 1,395,250 | |||||||||||||||
MSCO | 311,730 | (311,730 | ) | — | — | — | ||||||||||||||
MSCOb | 1,496,799 | — | — | — | 1,496,799 | |||||||||||||||
MSCOc | 689,497 | (689,497 | ) | — | — | — | ||||||||||||||
MSCS | 755,224 | (755,224 | ) | — | — | — | ||||||||||||||
SCBL | 88,749 | (36,824 | ) | — | — | 51,925 | ||||||||||||||
UBSW | 119,832 | (119,832 | ) | — | — | — | ||||||||||||||
|
| |||||||||||||||||||
Total | $ | 8,384,983 | $ | (4,897,394 | ) | $ | — | $ | (235,890 | ) | $ | 3,251,699 | ||||||||
|
| |||||||||||||||||||
aIn some instances, the collateral amounts disclosed in the table above were adjusted due to the requirement to limit the collateral amounts to avoid the effect of over collateralization. Actual collateral received and/or pledged may be more than the amounts disclosed herein.
bRepresents derivatives not subject to an ISDA master agreement.
cRepresents derivatives owned by the K2 Holdings Investment Corp., a wholly-owned subsidiary of the Fund. See Note 1(h).
See Notes 1(d) and 6 regarding derivative financial instruments and investment transactions, respectively.
See Abbreviations on page 114.
13. Credit Facility
The Fund, together with other U.S. registered and foreign investment funds (collectively, Borrowers), managed by Franklin Templeton, are borrowers in a joint syndicated senior unsecured credit facility totaling $2.675 billion (Global Credit Facility) which matures on February 3, 2023. This Global Credit Facility provides a source of funds to the Borrowers for temporary and emergency purposes, including the ability to meet future unanticipated or unusually large redemption requests.
Under the terms of the Global Credit Facility, the Fund shall, in addition to interest charged on any borrowings made by the Fund and other costs incurred by the Fund, pay its share of fees and expenses incurred in connection with the implementation and maintenance of the Global Credit Facility, based upon its relative share of the aggregate net assets of all of the Borrowers, including an annual commitment fee of 0.15% based upon the unused portion of the Global Credit Facility. These fees are reflected in other expenses in the Consolidated Statement of Operations. During the year ended May 31, 2022, the Fund did not use the Global Credit Facility.
| franklintempleton.com | Annual Report | 111 | ||||||||
FRANKLIN ALTERNATIVE STRATEGIES FUNDS
NOTES TO CONSOLIDATED FINANCIAL STATEMENTS
Franklin K2 Alternative Strategies Fund (continued)
14. Fair Value Measurements
The Fund follows a fair value hierarchy that distinguishes between market data obtained from independent sources (observable inputs) and the Fund’s own market assumptions (unobservable inputs). These inputs are used in determining the value of the Fund’s financial instruments and are summarized in the following fair value hierarchy:
| • | Level 1 – quoted prices in active markets for identical financial instruments |
| • | Level 2 – other significant observable inputs (including quoted prices for similar financial instruments, interest rates, prepayment speed, credit risk, etc.) |
| • | Level 3 – significant unobservable inputs (including the Fund’s own assumptions in determining the fair value of financial instruments) |
The input levels are not necessarily an indication of the risk or liquidity associated with financial instruments at that level.
A summary of inputs used as of May 31, 2022, in valuing the Fund’s assets and liabilities carried at fair value, is as follows:
| Level 1 | Level 2 | Level 3 | Total | |||||||||||||
| Assets: | ||||||||||||||||
Investments in Securities:a | ||||||||||||||||
Equity Investmentsb | $ | 410,491,437 | $ | 70,157,083 | $ | 26,453 | $ | 480,674,973 | ||||||||
Convertible Bonds | — | 152,894,422 | — | 152,894,422 | ||||||||||||
Corporate Bonds and Notes | — | 151,139,701 | 23,978 | 151,163,679 | ||||||||||||
Corporate Bonds and Notes in Reorganization | — | 5,103,268 | — | c | 5,103,268 | |||||||||||
Senior Floating Rate Interests | — | 4,004,411 | — | 4,004,411 | ||||||||||||
Foreign Government and Agency Securities | — | 71,984,978 | — | 71,984,978 | ||||||||||||
U.S. Government and Agency Securities | — | 4,848,900 | — | 4,848,900 | ||||||||||||
Asset-Backed Securities and Commercial Mortgage-Backed Securities | — | 88,994,732 | 103,040 | 89,097,772 | ||||||||||||
Options Purchased | 5,797,760 | 34,298 | — | 5,832,058 | ||||||||||||
Short Term Investments | 204,163,386 | 20,900,253 | — | 225,063,639 | ||||||||||||
|
| |||||||||||||||
Total Investments in Securities | $ | 620,452,583 | $ | 570,062,046 | $ | 153,471 | $ | 1,190,668,100 | ||||||||
|
| |||||||||||||||
Other Financial Instruments: | ||||||||||||||||
Futures Contracts | $ | 3,770,198 | $ | — | $ | — | $ | 3,770,198 | ||||||||
Forward Exchange Contracts | — | 6,604,272 | — | 6,604,272 | ||||||||||||
Swap Contracts | — | 7,273,314 | — | c | 7,273,314 | |||||||||||
|
| |||||||||||||||
Total Other Financial Instruments | $ | 3,770,198 | $ | 13,877,586 | $ | — | $ | 17,647,784 | ||||||||
|
| |||||||||||||||
| Liabilities: |
| |||||||||||||||
Other Financial Instruments: |
| |||||||||||||||
Options Written | $ | 1,960,125 | $ | 6,707 | $ | — | $ | 1,966,832 | ||||||||
Securities Sold Shorta | 196,500,338 | 27,844,537 | e | — | 224,344,875 | |||||||||||
Futures Contracts | 3,529,744 | — | — | 3,529,744 | ||||||||||||
Forward Exchange Contracts | — | 4,709,210 | — | 4,709,210 | ||||||||||||
Swap Contracts | — | 4,902,423 | — | 4,902,423 | ||||||||||||
Unfunded Loan Commitments | — | 94,370 | — | 94,370 | ||||||||||||
|
| |||||||||||||||
Total Other Financial Instruments | $ | 201,990,207 | $ | 37,557,247 | $ | — | $ | 239,547,454 | ||||||||
|
| |||||||||||||||
aFor detailed categories, see the accompanying Consolidated Schedule of Investments.
bIncludes common stocks, exchange traded funds, preferred stocks and convertible preferred stocks as well as other equity interests.
cIncludes financial instruments determined to have no value at May 31, 2022.
dIncludes foreign securities valued at $63,655,205, which were categorized as Level 2 as a result of the application of market level fair value procedures. See the Financial Instrument Valuation note for more information.
eIncludes foreign securities valued at $3,103,152, which were categorized as Level 2 as a result of the application of market level fair value procedures. See the Financial Instrument Valuation note for more information.
| 112 | Annual Report | franklintempleton.com | ||||||||
FRANKLIN ALTERNATIVE STRATEGIES FUNDS
NOTES TO CONSOLIDATED FINANCIAL STATEMENTS
Franklin K2 Alternative Strategies Fund (continued)
A reconciliation in which Level 3 inputs are used in determining fair value is presented when there are significant Level 3 assets and/or liabilities at the beginning and/or end of the year.
15. New Accounting Pronouncements
In March 2020, the Financial Accounting Standards Board (FASB) issued Accounting Standards Update (ASU) No. 2020-04, Reference Rate Reform (Topic 848)—Facilitation of the Effects of Reference Rate Reform on Financial Reporting. In January 2021, the FASB issued ASU No. 2021-01, with further amendments to Topic 848. The amendments in the ASUs provide optional temporary accounting recognition and financial reporting relief from the effect of certain types of contract modifications due to the planned discontinuation of the LIBOR and other interbank-offered based reference rates as of the end of 2021 for certain LIBOR settings and 2023 for the remainder. The ASUs are effective for certain reference rate-related contract modifications that occur during the period March 12, 2020 through December 31, 2022. Management has reviewed the requirements and believes the adoption of these ASUs will not have a material impact on the financial statements.
16. Subsequent Events
The Fund has evaluated subsequent events through the issuance of the consolidated financial statements and determined that no events have occurred that require disclosure.
| franklintempleton.com | Annual Report | 113 | ||||||||
FRANKLIN ALTERNATIVE STRATEGIES FUNDS
NOTES TO CONSOLIDATED FINANCIAL STATEMENTS
Franklin K2 Alternative Strategies Fund (continued)
| Counterparty | Currency | Selected Portfolio | ||||||||
| BNPP | BNP Paribas | ARS | Argentine Peso | ADR | American Depositary Receipt | |||||
| BNYM | The Bank of New York Mellon Corp. | AUD | Australian Dollar | AONIA | Australian Interbank Offered Rate | |||||
| BOFA | Bank of America, NA | BRL | Brazilian Real | ARM | Adjustable Rate Mortgage | |||||
| BZWS | Barclays Bank PLC | CAD | Canadian Dollar | BADLAR | Argentina Deposit Rates BADLAR Private Banks ARS | |||||
| CITI | Citigroup, NA | CHF | Swiss Franc | |||||||
| DBAB | Deutsche Bank, AG | CNY | Chinese Yuan | BBSW | Bank Bill Swap Rate | |||||
| FBCO | Credit Suisse International | COP | Colombian Peso | BKBM | Bank Bill Benchmark Rate | |||||
| GSCO | Goldman Sachs International | CZK | Czech Koruna | BRLCDI | Brazil Cetip Di Interbank Deposit Rate | |||||
| HSBC | HSBC Bank PLC | EUR | Euro | BZDIOVRA | Brazil Interbank Deposit Rate | |||||
| JPHQ | JP Morgan Chase Bank, NA | GBP | British Pound | CAC | Cotation Assistee en Continu | |||||
| MSCO | Morgan Stanley & Co. LLC | HKD | Hong Kong Dollar | CLO | Collateralized Loan Obligation | |||||
| MSCS | Morgan Stanley Capital Services LLC | HUF | Hungarian Forint | CME | Chicago Mercantile Exchange | |||||
| SCBL | Standard Chartered Bank | INR | Indian Rupee | CNRR007 | China 7-Day Reverse Repo Rate | |||||
| UBSW | UBS AG | JPY | Japanese Yen | DAX | Deutscher Aktienindex | |||||
| KRW | South Korean Won | DJIA | Dow Jones Industrial Average | |||||||
| MXN | Mexican Peso | EONIA | Euro OverNight Index Average | |||||||
| NOK | Norwegian Krone | ETF | Exchange Traded Fund | |||||||
| NZD | New Zealand Dollar | EURIBOR | Euro Interbank Offered Rate | |||||||
| PHP | Philippine Peso | FEDEF | Federal Funds Effective Rate | |||||||
| PLN | Polish Zloty | FHLMC | Federal Home Loan Mortgage Corp. | |||||||
| SEK | Swedish Krona | FNMA | Federal National Mortgage Association | |||||||
| SGD | Singapore Dollar | FRN | Floating Rate Note | |||||||
| USD | United States Dollar | FTSE | Financial Times Stock Exchange | |||||||
| TWD | Taiwan Dollar | HIBOR | Hong Kong Interbank Offered Rate | |||||||
| ZAR | South African Rand | IMM | International Money Market | |||||||
| Index | JIBAR | Johannesburg Interbank Agreed Rate | ||||||||
| KDR | Korean Depositary Receipt | |||||||||
| CDX.NA.HY | CDX North America High Yield Index | LIBOR | London InterBank Offered Rate | |||||||
| MBIA | Municipal Bond Investors Assurance Corp. | |||||||||
| MIB | Milano Italia Borsa | |||||||||
| MIBOR | Mumbai Interbank Offered Rate | |||||||||
| MTN | Medium Term Note | |||||||||
| MUTSCALM | Japan Unsecured Overnight Call Rate | |||||||||
| OBFR | Overnight Bank Funding Rate | |||||||||
| PIK | Payment In-Kind | |||||||||
| PRIBOR | Prague Interbank Offered Rate | |||||||||
| RC | Revolving Loan Commitment | |||||||||
| REIT | Real Estate Investment Trust | |||||||||
| SARON | Swiss Average Rate Overnight | |||||||||
| SIBSCORA | Singapore Overnight Rate Average | |||||||||
| SOFR | Secured Overnight Financing Rate | |||||||||
| SONIA | Sterling Overnight Index Average | |||||||||
| SPDR | Standard & Poor’s Depositary Receipt | |||||||||
| STR | Short Term Rate | |||||||||
| STIBOR | Stockholm Interbank Offered Rate | |||||||||
| TAIBOR | Taiwan Interbank Offered Rate | |||||||||
| TOPIX | Tokyo Price Index | |||||||||
| 114 | Annual Report | franklintempleton.com | ||||||||
FRANKLIN ALTERNATIVE STRATEGIES FUNDS
Report of Independent Registered Public Accounting Firm
To the Board of Trustees of Franklin Alternative Strategies Funds
and Shareholders of Franklin K2 Alternative Strategies Fund:
Opinion on the Financial Statements
We have audited the accompanying consolidated statement of assets and liabilities of Franklin K2 Alternative Strategies Fund (the “Fund”) (one of the funds constituting the Franklin Alternative Strategies Funds), including the consolidated schedule of investments, as of May 31, 2022, and the related consolidated statement of operations for the year then ended, the consolidated statements of changes in net assets for each of the two years in the period then ended, the consolidated financial highlights for each of the five years in the period then ended, and the related notes (collectively referred to as the “financial statements”). In our opinion, the financial statements present fairly, in all material respects, the consolidated financial position of Franklin K2 Alternative Strategies Fund (one of the funds constituting the Franklin Alternative Strategies Funds) at May 31, 2022, the consolidated results of its operations for the year then ended, the consolidated changes in its net assets for each of the two years in the period then ended and its consolidated financial highlights for each of the five years in the period then ended, in conformity with U.S. generally accepted accounting principles.
Basis for Opinion
These financial statements are the responsibility of the Fund’s management. Our responsibility is to express an opinion on the Fund’s financial statements based on our audits. We are a public accounting firm registered with the Public Company Accounting Oversight Board (United States) (“PCAOB”) and are required to be independent with respect to the Fund in accordance with the U.S. federal securities laws and the applicable rules and regulations of the Securities and Exchange Commission and the PCAOB.
We conducted our audits in accordance with the standards of the PCAOB. Those standards require that we plan and perform the audit to obtain reasonable assurance about whether the financial statements are free of material misstatement, whether due to error or fraud. The Fund is not required to have, nor were we engaged to perform, an audit of the Fund’s internal control over financial reporting. As part of our audits, we are required to obtain an understanding of internal control over financial reporting, but not for the purpose of expressing an opinion on the effectiveness of the Fund’s internal control over financial reporting. Accordingly, we express no such opinion.
Our audits included performing procedures to assess the risks of material misstatement of the financial statements, whether due to error or fraud, and performing procedures that respond to those risks. Such procedures included examining, on a test basis, evidence regarding the amounts and disclosures in the financial statements. Our procedures included confirmation of securities owned as of May 31, 2022, by correspondence with the custodian and brokers, or by other appropriate auditing procedures where replies from brokers were not received. Our audits also included evaluating the accounting principles used and significant estimates made by management, as well as evaluating the overall presentation of the financial statements. We believe that our audits provide a reasonable basis for our opinion.

We have served as the auditor of one or more Franklin investment companies since 1987.
Boston, Massachusetts
July 28, 2022
| franklintempleton.com | Annual Report | 115 | ||||||||
FRANKLIN ALTERNATIVE STRATEGIES FUNDS
FRANKLIN K2 ALTERNATIVE STRATEGIES FUND
By mid-February, tax information related to a shareholder’s proportionate share of distributions paid during the preceding calendar year will be received, if applicable. Please also refer to www.franklintempleton.com for per share tax information related to any distributions paid during the preceding calendar year. Shareholders are advised to consult with their tax advisors for further information on the treatment of these amounts on their tax returns.
The following tax information for the Fund is required to be furnished to shareholders with respect to income earned and distributions paid during its fiscal year.
The Fund hereby reports the following amounts, or if subsequently determined to be different, the maximum allowable amounts, for the fiscal year ended May 31, 2022:
| Pursuant to: | Amount Reported | |||||
Long-Term Capital Gain Dividends | §852(b)(3)(C) | $ | 51,643,460 | |||
Dividends Received Deduction (DRD) | §854(b)(1)(A) | $ | 2,877,386 | |||
Qualified Dividend Income (QDI) | §854(b)(1)(B) | $ | 4,309,872 | |||
Short-Term Capital Gain Dividends | §871(k)(2)(C) | $ | 8,835,248 | |||
Note (1)—The Law varies in each state as to whether and what percentage of dividend income attributable to Federal obligations is exempt from state income tax. Shareholders are advised to consult with their tax advisors to determine if any portion of the dividends received is exempt from state income taxes.
| 116 | Annual Report | franklintempleton.com | ||||||||
FRANKLIN ALTERNATIVE STRATEGIES FUNDS
The name, year of birth and address of the officers and board members, as well as their affiliations, positions held with the Funds, principal occupations during at least the past five years and number of U.S. registered portfolios overseen in the Franklin Templeton/Legg Mason fund complex, are shown below. Generally, each board member serves until that person’s successor is elected and qualified.
Independent Board Members
| Name, Year of Birth and Address | Position | Length of Time Served | Number of Portfolios in Fund Complex Overseen by Board Member* | Other Directorships Held During at Least the Past 5 Years | ||||
| Edward I. Altman, Ph.D. (1941) One Franklin Parkway San Mateo, CA 94403-1906 | Trustee | Since 2011 | 11 | None | ||||
| Principal Occupation During at Least the Past 5 Years: | ||||||||
| Max L. Heine Professor of Finance, Emeritus and Director of The Credit and Debt Markets Research Program, Salomon Center, Stern School of Business, New York University; editor and author of numerous financial publications; financial consultant; an adviser to numerous financial and publishing organizations; and formerly, Vice Director, Salomon Center, Stern School of Business, New York University. | ||||||||
| Ann Torre Bates (1958) One Franklin Parkway San Mateo, CA 94403-1906 | Trustee and Chairperson | Trustee since 2011 and Chairperson since 2020 | 30 | Ares Capital Corporation (specialty finance company) (2010-present), United Natural Foods, Inc. (distributor of natural, organic and specialty foods) (2013-present), formerly, Allied Capital Corporation (financial services) (2003-2010), SLM Corporation (Sallie Mae) (1997-2014) and Navient Corporation (loan management, servicing and asset recovery) (2014-2016). | ||||
| Principal Occupation During at Least the Past 5 Years: | ||||||||
| Director of various companies; and formerly, Executive Vice President and Chief Financial Officer, NHP Incorporated (manager of multifamily housing) (1995-1997); and Vice President and Treasurer, US Airways, Inc. (until 1995). | ||||||||
| Jan Hopkins Trachtman (1947) One Franklin Parkway San Mateo, CA 94403-1906 | Trustee | Since 2011 | 11 | FTAC Parnassus Acquisition Corp. (special purpose fintech acquisition company) (2021-present); and formerly, FTAC Olympus Acquisition Corp. (special purpose fintech acquisition company) (2020-2022) and FinTech Acquisition Corp. III (special purpose fintech acquisition company) (2018-2021). | ||||
| Principal Occupation During at Least the Past 5 Years: | ||||||||
| President and Founder, The Jan Hopkins Group (communications consulting firm); serves on Alumni Advisory Board of Knight Bagehot Fellowship; and formerly, President, Economic Club of New York (2007-2015); Anchor/Correspondent, CNN Financial News (until 2003); Managing Director and Head of Client Communications, Citigroup Private Bank (until 2005); Off-Air Reporter, ABC News’ World News Tonight; and Editor, CBS Network News. | ||||||||
| Keith E. Mitchell (1954) One Franklin Parkway San Mateo, CA 94403-1906 | Trustee | Since 2011 | 11 | None | ||||
| Principal Occupation During at Least the Past 5 Years: | ||||||||
| Director of various boards of asset management firms; and formerly, Managing Member, Mitchell, Hartley & Bechtel Advisers, LLC (formerly, Mitchell Advisers, LLC) (advisory firm) (2003-2015) and Managing Director, Putman Lovell NBF. | ||||||||
| franklintempleton.com | Annual Report | 117 | ||||||||
FRANKLIN ALTERNATIVE STRATEGIES FUNDS
Independent Board Members (continued)
| Name, Year of Birth and Address | Position | Length of Time Served | Number of Portfolios in Fund Complex Overseen by Board Member* | Other Directorships Held During at Least the Past 5 Years | ||||
| David W. Niemiec (1949) One Franklin Parkway San Mateo, CA 94403-1906 | Trustee | Since 2015 | 30 | Hess Midstream LP (oil and gas midstream infrastructure) (2017-present). | ||||
| Principal Occupation During at Least the Past 5 Years: | ||||||||
| Advisor, Saratoga Partners (private equity fund); and formerly, Managing Director, Saratoga Partners (1998-2001) and SBC Warburg Dillon Read (investment banking) (1997-1998); Vice Chairman, Dillon, Read & Co. Inc. (investment banking) (1991-1997); and Chief Financial Officer, Dillon, Read & Co. Inc. (1982-1997). | ||||||||
| Robert E. Wade (1946) One Franklin Parkway San Mateo, CA 94403-1906 | Trustee | Since 2011 | 30 | El Oro Ltd (investments) (2003-2019). | ||||
| Principal Occupation During at Least the Past 5 Years: | ||||||||
| Attorney at law engaged in private practice as a sole practitioner (1972-2008) and member of various boards. | ||||||||
| Gregory H. Williams (1943) One Franklin Parkway San Mateo, CA 94403-1906 | Trustee | Since 2015 | 11 | None | ||||
| Principal Occupation During at Least the Past 5 Years: | ||||||||
| Private investor; Consultant; and formerly, President, University of Cincinnati (2009-2012); President, The City College of New York (2001-2009); Dean, College of Law, Ohio State University (1993-2001); and Associate Vice President, Academic Affairs and Professor of Law, University of Iowa (1977-1993). | ||||||||
Interested Board Members and Officers
| Name, Year of Birth and Address | Position | Length of Time Served | Number of Portfolios in Fund Complex Overseen by Board Member* | Other Directorships Held During at Least the Past 5 Years | ||||
| **Gregory E. Johnson (1961) One Franklin Parkway San Mateo, CA 94403-1906 | Trustee | Since 2011 | 131 | None | ||||
| Principal Occupation During at Least the Past 5 Years: | ||||||||
| Executive Chairman, Chairman of the Board and Director, Franklin Resources, Inc.; officer and/or director or trustee, as the case may be, of some of the other subsidiaries of Franklin Resources, Inc. and of certain funds in the Franklin Templeton/Legg Mason fund complex; Vice Chairman, Investment Company Institute; and formerly, Chief Executive Officer (2013-2020) and President (1994-2015) Franklin Resources, Inc | ||||||||
| **Jennifer M. Johnson (1964) One Franklin Parkway San Mateo, CA 94403-1906 | Trustee | Since 2015 | 72 | None | ||||
| Principal Occupation During at Least the Past 5 Years: | ||||||||
| Chief Executive Officer, President and Director, Franklin Resources, Inc.; officer and/or director or trustee, as the case may be, of some of the other subsidiaries of Franklin Resources, Inc. and of certain funds in the Franklin Templeton/Legg Mason fund complex; and formerly, Chief Operating Officer and Executive Vice President, Franklin Resources, Inc. (1994-2015); Executive Vice President of Operations and Technology, Franklin Resources, Inc. (2005-2010); and Senior Vice President, Franklin Resources, Inc. (2003-2005). | ||||||||
| Alison E. Baur (1964) One Franklin Parkway San Mateo, CA 94403-1906 | Vice President | Since 2012 | Not Applicable | Not Applicable | ||||
| Principal Occupation During at Least the Past 5 Years: | ||||||||
| Deputy General Counsel, Franklin Templeton; and officer of some of the other subsidiaries of Franklin Resources, Inc. and of certain funds in the Franklin Templeton/Legg Mason fund complex. | ||||||||
| 118 | Annual Report | franklintempleton.com | ||||||||
FRANKLIN ALTERNATIVE STRATEGIES FUNDS
Interested Board Members and Officers (continued)
| Name, Year of Birth and Address | Position | Length of Time Served | Number of Portfolios in Fund Complex Overseen by Board Member* | Other Directorships Held During at Least the Past 5 Years | ||||
Breda M. Beckerle (1958) 280 Park Avenue New York, NY 10017 | Chief Compliance Officer | Since 2020 | Not Applicable | Not Applicable | ||||
| Principal Occupation During at Least the Past 5 Years: | ||||||||
| Chief Compliance Officer, Fiduciary Investment Management International, Inc., Franklin Advisers, Inc., Franklin Mutual Advisers, LLC, Franklin Templeton Institutional, LLC; and officer of certain funds in the Franklin Templeton/Legg Mason fund complex. | ||||||||
| Steven J. Gray (1955) One Franklin Parkway San Mateo, CA 94403-1906 | Vice President and Secretary | Since 2011 | Not Applicable | Not Applicable | ||||
| Principal Occupation During at Least the Past 5 Years: | ||||||||
| Senior Associate General Counsel, Franklin Templeton; Assistant Secretary, Franklin Distributors, LLC; and officer of certain funds in the Franklin Templeton/Legg Mason fund complex. | ||||||||
| Matthew T. Hinkle (1971) One Franklin Parkway San Mateo, CA 94403-1906 | Chief Executive Officer – Finance and Administration | Since 2017 | Not Applicable | Not Applicable | ||||
| Principal Occupation During at Least the Past 5 Years: | ||||||||
| Senior Vice President, Franklin Templeton Services, LLC; officer of certain funds in the Franklin Templeton/Legg Mason fund complex; and formerly, Vice President, Global Tax (2012-April 2017) and Treasurer/Assistant Treasurer, Franklin Templeton (2009-2017). | ||||||||
Susan Kerr (1949) New York, NY 10018 | Vice President – AML Compliance | Since 2021 | Not Applicable | Not Applicable | ||||
| Principal Occupation During at Least the Past 5 Years: | ||||||||
| Senior Compliance Analyst, Franklin Templeton; Chief Anti-Money Laundering Compliance Officer, Legg Mason & Co., or its affiliates; Anti Money Laundering Compliance Officer; Senior Compliance Officer, LMIS; and officer of certain funds in the Franklin Templeton/Legg Mason fund complex. | ||||||||
Christopher Kings (1974) One Franklin Parkway San Mateo, CA 94403-1906 | Chief Financial Officer, Chief Accounting Officer and Treasurer | Since January 2022 | Not Applicable | Not Applicable | ||||
| Principal Occupation During at Least the Past 5 Years: | ||||||||
| Treasurer, U.S. Fund Administration & Reporting; and officer of certain funds in the Franklin Templeton/Legg Mason fund complex. | ||||||||
Brooks Ritchey (1959) Stamford, CT 06901 | President and Chief Executive Officer – Investment Management | Since 2020 | Not Applicable | Not Applicable | ||||
| Principal Occupation During at Least the Past 5 Years: | ||||||||
| Senior Managing Director and Co-Head of the Investment Research & Management, K2 Advisors; and officer of certain funds in the Franklin Templeton/Legg Mason fund complex. | ||||||||
| franklintempleton.com | Annual Report | 119 | ||||||||
FRANKLIN ALTERNATIVE STRATEGIES FUNDS
Interested Board Members and Officers (continued)
| Name, Year of Birth and Address | Position | Length of Time Served | Number of Portfolios in Fund Complex Overseen by Board Member* | Other Directorships Held During at Least the Past 5 Years | ||||
| Navid J. Tofigh (1972) One Franklin Parkway San Mateo, CA 94403-1906 | Vice President | Since 2015 | Not Applicable | Not Applicable | ||||
| Principal Occupation During at Least the Past 5 Years: | ||||||||
| Senior Associate General Counsel, Franklin Templeton; and officer of certain funds in the Franklin Templeton/Legg Mason fund complex. | ||||||||
| Lori A. Weber (1964) 300 S.E. 2nd Street Fort Lauderdale, FL 33301-1923 | Vice President | Since 2012 | Not Applicable | Not Applicable | ||||
| Principal Occupation During at Least the Past 5 Years: | ||||||||
| Senior Associate General Counsel, Franklin Templeton; Assistant Secretary, Franklin Resources, Inc.; Vice President and Secretary, Templeton Investment Counsel, LLC; and officer of certain funds in the Franklin Templeton/Legg Mason fund complex.. | ||||||||
*We base the number of portfolios on each separate series of the U.S. registered investment companies within the Franklin Templeton fund complex. These portfolios have a common investment manager or affiliated investment managers.
**Gregory E. Johnson is considered to be an interested person of the Fund under the federal securities laws due to his position as an officer and director of Franklin Resources, Inc. (Resources), which is the parent company of the Fund’s investment manager and distributor. Jennifer M. Johnson is considered to be an interested person of the Fund under the federal securities laws due to her position as an officer and director of Resources.
Note 1: Gregory E. Johnson and Jennifer M. Johnson are siblings
Note 2: Officer information is current as of the date of this report. It is possible that after this date, information about officers may change.
The Sarbanes-Oxley Act of 2002 and Rules adopted by the U.S. Securities and Exchange Commission require the Fund to disclose whether the Fund’s Audit Committee includes at least one member who is an audit committee financial expert within the meaning of such Act and Rules. The Fund’s Board has determined that there is at least one such financial expert on the Audit Committee and has designated each of Ann Torre Bates and David W. Niemiec as an audit committee financial expert. The Board believes that Ms. Bates and Mr. Niemiec qualify as such an expert in view of their extensive business background and experience. Ms. Bates has served as a member of the Fund Audit Committee since 2011. She currently serves as a director of Ares Capital Corporation (2010-present) and United Natural Foods, Inc. (2013-present) and was formerly a director of Navient Corporation from 2014 to 2016, SLM Corporation from 1997 to 2014 and Allied Capital Corporation from 2003 to 2010, Executive Vice President and Chief Financial Officer of NHP Incorporated from 1995 to 1997 and Vice President and Treasurer of US Airways, Inc. until 1995. Mr. Niemiec has served as a member of the Fund Audit Committee since 2015, currently serves as an Advisor to Saratoga Partners and was formerly its Managing Director from 1998 to 2001 and serves as a director of Hess Midstream Partners LP (2017-present). Mr. Niemiec was formerly a director of Emeritus Corporation from 1999 to 2010 and OSI Pharmaceuticals, Inc. from 2006 to 2010, Managing Director of SBC Warburg Dillon Read from 1997 to 1998, and was Vice Chairman from 1991 to 1997 and Chief Financial Officer from 1982 to 1997 of Dillon, Read & Co. Inc. As a result of such background and experience, the Board believes that Ms. Bates and Mr. Niemiec have each acquired an understanding of generally accepted accounting principles and financial statements, the general application of such principles in connection with the accounting estimates, accruals and reserves, and analyzing and evaluating financial statements that present a breadth and level of complexity of accounting issues generally comparable to those of the Fund, as well as an understanding of internal controls and procedures for financial reporting and an understanding of audit committee functions. Ms. Bates and Mr. Niemiec are independent Board members as that term is defined under the applicable U.S. Securities and Exchange Commission Rules and Releases.
The Statement of Additional Information (SAI) includes additional information about the board members and is available, without charge, upon request. Shareholders may call (800) DIAL BEN/342-5236 to request the SAI.
| 120 | Annual Report | franklintempleton.com | ||||||||
FRANKLIN ALTERNATIVE STRATEGIES FUNDS
Board Approval of Investment Management Agreements and Sub-Advisory Agreements
FRANKLIN ALTERNATIVE STRATEGIES FUNDS
Franklin K2 Alternative Strategies Fund
(Fund)
The Board of Trustees (Board) of Franklin Alternative Strategies Funds (the Trust), including a majority of trustees that are not “interested persons” as such term is defined in section 2(a)(19) of the Investment Company Act of 1940 (hereinafter referred to as “independent trustees”), at a meeting held on May 24, 2022, unanimously approved the renewal of the Fund’s investment management agreement with K2/D&S Management Co., L.L.C. (K2 Advisors), and of each sub-advisory agreement between K2 Advisors and each of following sub-advisors (the Sub-Advisors):
Apollo Credit Management LLC
Bardin Hill Arbitrage IC Management LP
BlueBay Asset Management LLP
Chilton Investment Company, LLC
Electron Capital Partners, LLC
Ellington Global Asset Management, L.L.C.
EMSO Asset Management Limited
Graham Capital Management, L.P.
Jennison Associates LLC
Lazard Asset Management, LLC
Loomis, Sayles & Company, L.P.
One River Asset Management, LLC
P. Schoenfeld Asset Management LP
Portland Hill Asset Management Limited
RV Capital Management Private, Ltd.
Wellington Management Company, LLP
Prior to a meeting of all of the trustees for the purpose of considering such renewal, the independent trustees participated in two other meetings held in connection with the renewal process. Throughout the process, the independent trustees received assistance and advice from and met separately with independent counsel. The independent trustees met with and interviewed officers of K2 Advisors and certain Sub-Advisors (including portfolio managers), the transfer agent and shareholder services group and the distributor. In approving the renewal of the investment management agreement and the sub-advisory agreements for the Fund, the Board, including the independent trustees, determined that the investment management fee structure was fair and reasonable and that continuance of the agreement was in the best interests of the Fund and its shareholders.
In making the foregoing approvals, the Board considered various materials related to the investment management agreement and the sub-advisory agreements including: (1) a copy of the investment management agreement and sub-advisory agreements; (2) information describing the nature, quality and extent of services that K2 Advisors and each Sub-Advisor provided, and are expected to provide, to the Fund, and the investment management fees and sub-advisory fees payable to K2 Advisors and each Sub-Advisor; (3) reports from K2 Advisors on the continued diligence conducted on each Sub-Advisor and the reasons for recommending renewal of each of the sub-advisory agreements, including, but not limited to, each Sub-Advisor’s background, experience, personnel, operations, policies, procedures and compliance functions; and (4) a report from the Trust’s Chief Compliance Officer regarding K2 Advisors’ and each Sub-Advisor’s compliance program and capabilities, including policies and procedures in place to address potential conflicts of interest, and the diligence undertaken by the Trust’s Chief Compliance Officer with respect thereto. The Board also reviewed and considered an annual report on payments made by Franklin Templeton (FT) or the Fund to financial intermediaries, as well as a memorandum relating to third-party servicing arrangements, which included discussion of the changing distribution landscape for the Fund.
The Board also took into account information furnished throughout the year at Board meetings, as well as information specifically requested and furnished for the renewal process, which culminated in the meetings referred to above for the specific purpose of considering such agreements. Information furnished throughout the year included, among others, reports on the Fund’s investment performance, expenses, portfolio composition, derivatives, asset segregation, portfolio turnover, Rule 12b-1 plan, distribution, shareholder servicing, legal and compliance matters, pricing of securities, sales and redemptions, and marketing support payments made to financial intermediaries, as well as a third-party survey of transfer agent fees charged to funds within the FT complex in comparison with those charged to other fund complexes deemed comparable. Also, related financial statements and other information about the scope and quality of services provided by K2 Advisors and its affiliates and enhancements to such services over the past year were provided. In addition, the trustees received periodic reports throughout the year and during the renewal process relating to compliance with the Fund’s investment policies and restrictions. During the renewal process, the independent trustees considered K2 Advisors’ methods of operation within the Franklin Templeton group and its activities on behalf of other clients.
| franklintempleton.com | Annual Report | 121 | ||||||||
FRANKLIN ALTERNATIVE STRATEGIES FUNDS
SHAREHOLDER INFORMATION
The information obtained by the trustees during the renewal process also included a special report prepared by Broadridge Financial Solutions, Inc., an independent third-party analyst that utilizes data from Lipper, Inc. (“Lipper”), comparing the Fund’s investment performance and expenses with those of other mutual funds deemed comparable to such Fund as selected by Lipper (Broadridge Section 15(c) Report). The trustees reviewed the Broadridge Section 15(c) Report and its usefulness in the renewal process with respect to matters such as comparative fees, expenses, expense ratios and performance. The Board considered K2 Advisors’ views that the peer group determined by Lipper for comparison purposes may not be an entirely appropriate representation of the Fund’s peer universe. K2 Advisors explained that the universe of funds that are managed using multi-manager, multistrategy structures, like the Fund, continues to evolve, and has presented challenges in identifying an appropriate set of peers for the Fund. It was noted by K2 Advisors that the peer group compiled by Lipper includes single-manager funds which, due to their nature and relative simplicity, have lower expense ratios and are not true peers for fee comparison purposes (“Base Expense Group”). Because some of the sponsors of funds with multi-manager strategies that K2 Advisors considers to be peers were excluded from the peer group determined by Lipper, K2 Advisors requested a second peer group including funds that K2 Advisors considers to be peer funds (“Alternate Expense Group”) for the Board’s consideration. While noting the limitations of the Broadridge Section 15(c) Report, the Board concluded that the Broadridge Section 15(c) Report was helpful in the performance of its duties and took into account the Alternate Expense Group as part of their considerations.
In addition, the trustees received a Profitability Study (Profitability Study) prepared by management discussing the profitability to FT from its overall U.S. fund operations, as well as on an individual fund-by-fund basis. Over the past year, the Board and counsel to the independent trustees continued to receive reports on management’s handling of recent regulatory inquiries and pending legal actions against K2 Advisors and its affiliates. The independent trustees were satisfied with the actions taken to date by management in response to such regulatory and legal matters. The independent trustees also received reports from the Trust’s Chief Compliance Officer on regulatory inquiries and pending legal actions against the Sub-Advisors applicable to the services provided by the Sub-Advisors to the Fund and noted that there were not any issues in this regard that should prevent the renewal of the sub-advisory agreements.
The trustees reviewed the personnel, operations, financial condition, and investment management capabilities, methodologies and resources of K2 Advisors and each Sub-Advisor, including each management team’s expertise in the management of other alternative strategies funds. As part of this review, particular attention was given to (1) the diligent risk management program of K2 Advisors and its parent, including those aspects of the program related to selecting and overseeing sub-advisors to the Fund and continual monitoring and management of cybersecurity, liquidity and counterparty credit risk, (2) each Sub-Advisor’s risk management program, and (3) derivatives and other complex instruments that are held and expected to be held by the Fund and how such instruments are used to carry out the Fund’s investment goal.
The Board also took into account, among other things, management’s efforts in establishing a global credit facility for the benefit of the Fund and other accounts managed by FT to provide a source of cash for temporary and emergency purposes or to meet unusual redemption requests as well as the strong financial position of K2 Advisors’ parent company and its commitment to the mutual fund business. The Board noted management’s continuing efforts and expenditures in establishing effective business continuity plans and developing strategies to address areas of heightened concern in the mutual fund industry, such as cybersecurity in the current work-from-home environment and liquidity risk management. The Board also recognized management’s commitment to facilitating Board oversight of particular areas, including derivatives and payments to intermediaries, by enhanced reporting. In addition, the Board received updates from management on the compliance of the investment manager with comprehensive rules and regulations promulgated by the SEC and the U.S. Commodity Futures Trading Commission.
In addition to the above and other matters considered by the trustees throughout the course of the year, the following discussion relates to certain primary factors relevant to the Board’s decision. This discussion of the information and factors considered by the Board (including the information and factors discussed above) is not intended to be exhaustive, but rather summarizes certain factors considered by the Board. In view of the wide variety of factors considered, the Board did not, unless otherwise noted, find it practicable to quantify or otherwise assign relative weights to the foregoing factors. In addition, individual trustees may have assigned different weights to various factors.
| 122 | Annual Report | franklintempleton.com | ||||||||
FRANKLIN ALTERNATIVE STRATEGIES FUNDS
SHAREHOLDER INFORMATION
NATURE, EXTENT AND QUALITY OF SERVICES. The trustees reviewed the nature, extent and quality of the services provided, and to be provided, by K2 Advisors and each Sub-Advisor. In this regard, they reviewed the Fund’s investment goal and K2 Advisors’ and each Sub-Advisor’s investment strategy and sub-strategy, and K2 Advisors’ and each Sub-Advisor’s ability to implement such investment strategy and/or sub-strategy, including, but not limited to, K2 Advisors’ and each Sub-Advisor’s trading practices, investment decision processes and reputation. The Board also considered the investment management services that the investment manager provides to the Cayman Islands-based company, which is wholly owned by the Fund (Cayman Subsidiary).
The Board noted that the Fund employs a “manager of managers” structure, whereby K2 Advisors is responsible for selecting sub-advisors (subject to Board approval), allocating the Fund’s assets among them, and overseeing the sub-advisors’ day-to-day management of the Fund’s assets. The Board noted the responsibilities that K2 Advisors has as the Fund’s investment manager, including (1) due diligence on the Sub-Advisors and any potential new sub-advisors to the Fund, their respective trading strategies, risk management, operations and businesses, (2) on-going oversight and monitoring of the day-to-day investment activities of Sub-Advisors and other service providers, including their respective compliance with the investment mandate and restrictions, compliance policies and procedures and federal securities laws, and K2 Advisors’ ongoing assessment of their performance, (3) portfolio construction with respect to the allocation of assets among Sub-Advisors, investment funds, cash and other investments, (4) risk management, (5) preparing quarterly reports to the Board, and (6) the implementation of Board directives as they relate to the Fund. The Trustees also considered the successful performance of K2 Advisors in managing the Fund and other investment products with similar investment strategies to the investment strategies of the Fund that are not subject to the Investment Company Act of 1940.
With respect to the sub-advisory services provided, and to be provided, by each Sub-Advisor, the Board noted the responsibilities that each Sub-Advisor has with respect to the portion of the Fund’s assets allocated to the Sub-Advisor by K2 Advisors (Sub-Advised Portion), including, among others, implementing the investment strategies with respect to the Sub-Advised Portion and ensuring compliance with the investment strategies, policies and limitations of the Sub-Advised Portion. The trustees considered the successful
performance of each Sub-Advisor in managing the Fund and other investment products with similar investment strategies to the investment strategies of its Sub-Advised Portion of the Fund, including, with respect to certain Sub-Advisors, mutual funds with similar investment strategies. The Board considered K2 Advisors’ rationale for recommending the continued retention of each Sub-Advisor.
The trustees reviewed the Fund’s portfolio management teams at K2 Advisors and each Sub-Advisor, including each such team’s performance, staffing, skills and compensation program. With respect to portfolio manager compensation, management assured the trustees that the Fund’s long-term performance is a significant component of incentive-based compensation for K2 Advisors’ portfolio management team and noted that a portion of a K2 Advisors’ portfolio manager’s incentive-based compensation is paid in shares of pre-designated funds from the portfolio manager’s fund management area. The trustees noted that the portfolio manager compensation program aligned the interests of the portfolio managers with that of Fund shareholders. During regular Board meetings and the aforementioned meetings of the independent trustees, the trustees considered periodic reports provided to them showing that K2 Advisors and the Sub-Advisors complied with the investment policies and restrictions of the Fund as well as other reports periodically furnished to the Board covering matters such as the compliance of portfolio managers and other management personnel with the code of ethics covering the investment management personnel, the adherence to fair value pricing procedures established by the Board and the accuracy of net asset value calculations. The Board noted the extent of the benefits provided to Fund shareholders from being part of the Franklin Templeton group of funds, including the right to exchange investments between funds (same class) without a sales charge, the ability to reinvest Fund dividends into other funds and the right to combine holdings of other funds to obtain reduced sales charges.
The trustees discussed with management various other products, portfolios and entities that are advised by K2 Advisors and each Sub-Advisor and the allocation of assets and expenses among and within them, as well as their relative fees and reasons for differences with respect thereto and any potential conflicts.
The Board also considered a report from the Trust’s Chief Compliance Officer regarding K2 Advisors’ and each Sub-Advisor’s compliance programs and capabilities as such programs and capabilities relate to the operations of the
| franklintempleton.com | Annual Report | 123 | ||||||||
FRANKLIN ALTERNATIVE STRATEGIES FUNDS
SHAREHOLDER INFORMATION
Fund and the monitoring and testing of such program undertaken by the Trust’s Chief Compliance Officer. The Board considered the selection and due diligence process employed by K2 Advisors in selecting and deciding to retain each Sub-Advisor as a sub-advisor to the Fund, including the due diligence undertaken with respect to the Sub-Advisor’s compliance and risk management capabilities. The trustees considered K2 Advisors’ significant efforts in developing and implementing compliance procedures established in accordance with SEC and other requirements.
The Board also considered the nature, extent and quality of the services to be provided under the Fund’s other service agreements to determine that, on an overall basis, Fund shareholders were well served. In this connection, the Board also took into account transfer agent and shareholder services provided to Fund shareholders by an affiliate of K2 Advisors, noting favorable periodic reports on shareholder services conducted by independent third parties. While such considerations directly affected the trustees’ decision in renewing the Fund’s transfer agent and shareholder services agreement, the Board also considered these commitments as incidental benefits to Fund shareholders deriving from the investment management relationship.
Based on their review, the trustees were satisfied with the nature and quality of the overall services provided, and to be provided, by K2 Advisors and its affiliates and each Sub Advisor to the Fund and its shareholders and were confident in the abilities of K2 Advisors and each Sub-Advisor to implement their respective investment strategy and/or sub-strategy and to provide quality services to the Fund and its shareholders.
INVESTMENT PERFORMANCE. As the Fund commenced operations in October 2013, the trustees reviewed the investment performance of the Fund for the one-, three-, and five-year and since inception periods ended December 31, 2021.
As part of their review, they inquired of management regarding benchmark and hedging activities. Consideration was also given to performance in the context of available levels of cash, including as affected by net flows, during the periods. The trustees had meetings during the year, including the meetings referred to above held in connection with the renewal process, with the Fund’s portfolio managers to discuss performance and the management of the Fund and each Sub-Advisor.
In addition, attention in assessing performance was given to the Broadridge Section 15(c) Report. That report showed the
investment performance of the Fund (Advisor Class shares) in comparison to other funds determined comparable by Lipper.
The comparable funds to the Fund, as chosen by Lipper, included all retail and institutional alternative multi-strategy funds. The Fund had total returns in the second-lowest performing quintile for the one-year period ended December 31, 2021, total returns in the second-best performing quintile for the three-year period ended December 31, 2021, total returns in the middle performing quintile for the five-year period ended December 31, 2021, and total returns in the best performing quintile for the since inception period ended December 31, 2021. The Board was satisfied with such performance.
The trustees also compared Fund performance to other industry benchmarks, including measures of risk-adjusted performance of a fund, as part of their evaluation of investment performance. Despite lower relative performance in the one-year period ended December 31, 2021, the trustees concluded that the Fund had continued to perform well in comparison to its various benchmarks and in the context of the Fund’s investment goal.
COMPARATIVE EXPENSES AND PROFITABILITY. The trustees considered the cost of the services provided, and to be provided, by K2 Advisors and each Sub-Advisor and the profits realized by K2 Advisors and its affiliates from their relationships with the Fund. As part of the renewal process, they explored with management the trends in expense ratios over the past three fiscal years and the reasons for any increases in the Fund’s expense ratios (or components thereof). In this regard, the trustees took into account the introduction in 2020 of breakpoints in the investment management fee schedule of the Fund, which were designed to better position the Fund for potential asset growth. In considering the appropriateness of the management fee and other expenses charged to the Fund, the Board took into account various factors including investment performance and matters relating to Fund operations, including, but not limited to, the quality and experience of K2 Advisors personnel. The Board also reviewed and considered the investment management fees in light of the nature, extent and quality of the investment management services provided, and to be provided, by K2 Advisors and each Sub-Advisor, as more fully discussed above. The Board also considered the reductions negotiated by K2 Advisors in the sub-advisory fees charged by the Sub-Advisers, including the addition of breakpoints in the sub-advisory fee schedules of certain Sub-Advisors in 2021. The Board noted that the sub-advisory fees are paid by
| 124 | Annual Report | franklintempleton.com | ||||||||
FRANKLIN ALTERNATIVE STRATEGIES FUNDS
SHAREHOLDER INFORMATION
K2 Advisors to each Sub-Advisor and are not additional fees borne by the Fund. The Board also noted that the sub-advisory fees paid, and to be paid, by K2 Advisors to each Sub-Advisor were the product of arms-length negotiations between K2 Advisors and each Sub-Advisor.
Furthermore, the Board took into account that information regarding Sub-Advisor profitability is not legally required to be provided. Accordingly, profitability information of the sub-advisors was given lesser weight than other factors. In addition, the Board considered the allocation of the investment management fee charged to the Fund between K2 Advisors and each Sub-Advisor in light of the nature, extent and quality of the investment management services provided, and to be provided, by K2 Advisors and each Sub-Advisor. As part of this discussion, the Board took into account the fee waiver and expense limitation arrangement in effect, and the amount of Fund expenses that were absorbed since inception of the Fund by K2 Advisors through such waivers and arrangements. The Board also considered the investment management services that the investment manager provides to the Cayman Subsidiary and the related fee waivers that were in place.
Consideration was also given to a comparative analysis in the Broadridge Section 15(c) Report of the investment management fee and total expense ratio of the Fund in comparison with those of a group of other funds selected by Lipper as its appropriate Lipper expense group.
Lipper expense data is based upon information taken from each fund’s most recent annual report, which reflects historical asset levels that may be quite different from those currently existing, particularly in a period of market volatility.
In reviewing comparative costs, emphasis was given to the Fund’s contractual management fee in comparison with the contractual management fee that would have been charged by other funds within its Lipper expense group assuming they were similar in size to the Fund, as well as the actual total expenses of the Fund in comparison with those of its Lipper expense group. The Lipper contractual management fee analysis includes administrative charges as being part of the management fee, and total expenses, for comparative consistency, are shown by Lipper for Fund Advisor Class shares. The Fund’s contractual management fee rate was in the most expensive quintile of its Base Expense Group and the second-most expensive quintile of its Alternate Expense Group. The Fund’s total expenses were in the most expensive quintile of its Base Expense Group and the middle quintile of its Alternate Expense Group.
Noting (i) that the Fund’s contractual management fee and total expenses were lower than the Fund’s primary competitor, (ii) the factors and limitations with respect to the Broadridge Section 15(c) Report (including the inclusion of single-manager funds in both peer groups), and (iii) factors relating to the Fund’s operations, such as the quality and experience of K2 Advisors and the Sub-Advisors and the nature and quality of the services provided and to be provided by K2 Advisors and the Sub-Advisors, the Board found such comparative fees and expenses to be acceptable.
The trustees also reviewed the Profitability Study addressing profitability of Franklin Resources, Inc., from its overall U.S. fund business, as well as profitability to K2 Advisors and its affiliates, from providing investment management and other services to the Fund during the 12-month period ended September 30, 2021, the most recent fiscal year-end of Franklin Resources, Inc. The trustees reviewed the basis on which such reports are prepared and the cost allocation methodology utilized in the Profitability Study, it being recognized that allocation methodologies may each be reasonable while producing different results. In this respect, the Board noted that the reasonableness of the cost allocation methodologies was reviewed by independent accountants on an every other year basis.
The independent trustees met with management to discuss the Profitability Study. This included, among other things, a comparison of investment management income with investment management expenses of the Fund; comparison of underwriting revenues and expenses; the relative relationship of investment management and underwriting expenses; shareholder servicing profitability; economies of scale; and the relative contribution of the Fund to the profitability of K2 Advisors and its parent. In discussing the Profitability Study with the Board, K2 Advisors stated its belief that the costs incurred in establishing the infrastructure necessary to operate the type of mutual fund operations conducted by it and its affiliates may not be fully reflected in the expenses allocated to the Fund in determining its profitability.
The Board also took into account management’s expenditures in improving shareholder services provided to the Fund, as well as the need to meet additional regulatory and compliance requirements. The trustees also considered the extent to which K2 Advisors and the Sub-Advisors may derive ancillary benefits from Fund operations, including those derived from the allocation of Fund brokerage and the use of commission dollars to pay for research and other similar services.
| franklintempleton.com | Annual Report | 125 | ||||||||
FRANKLIN ALTERNATIVE STRATEGIES FUNDS
SHAREHOLDER INFORMATION
Based upon their consideration of all these factors, the trustees determined that the level of profits realized by K2 Advisors and its affiliates in providing services to the Fund was not excessive in view of the nature, quality and extent of services provided. In addition, the Board noted that shareholders are able to redeem their Fund shares at any time if shareholders believe that Fund fees and expenses are too high or if they are dissatisfied with the performance of the Fund.
ECONOMIES OF SCALE. The Board considered economies of scale realized by K2 Advisors and its affiliates and the Sub-Advisors as the Fund grows larger and the extent to which they are shared with Fund shareholders, as for example, in the level of the investment management fees charged, in the quality and efficiency of services rendered and in increased capital commitments benefiting the Fund directly or indirectly. The trustees noted that benefits of economies of scale will, depending on the fee waiver and expense limitation arrangement in effect at the time, potentially be shared with Fund shareholders due to the decline in the effective investment management fee rate as breakpoints are achieved by the Fund. The Board also considered the fee waiver and expense limitation arrangement in effect, and the amount of Fund expenses that were absorbed since inception of the Fund by K2 Advisors through such waiver and arrangement. The Board concluded that economies of scale were deemed not to be a significant factor at that time in light of, among other matters, the fee waiver and expense limitation arrangement in effect.
Board Approval of Sub-Advisory Agreement
FRANKLIN K2 ALTERNATIVE STRATEGIES FUND (THE “FUND”)
The Board of Trustees (Board) of Franklin Alternative Strategies Funds (the Trust), including a majority of trustees that are not “interested persons” as such term is defined in section 2(a)(19) of the Investment Company Act of 1940 (hereinafter referred to as “independent trustees”), at a meeting held on May 24, 2022, unanimously approved the sub-advisory agreement (the “New Sub-Advisory Agreement”) with ActusRay Partners Limited (“Sub-Advisor”) with respect to the Fund.
In approving the New Sub-Advisory Agreement, the Board, including the independent trustees, determined that fees to be paid under the New Sub-Advisory Agreement were fair and reasonable and that approval of the New Sub-Advisory
Agreement was in the best interests of the Fund and its shareholders. As part of the approval process, the trustees considered the process undertaken and information provided during their consideration and approval also on May 24, 2022 of the investment management agreement between K2/D&S Management Co., L.L.C., the Fund’s investment manager (“K2 Advisors”), and the Trust, on behalf of the Fund, and the sub-advisory agreements between K2 Advisors and the Fund’s existing sub-advisors.
In making the foregoing approvals, the independent trustees received assistance and advice from their independent counsel and, in addition to the materials provided at prior meetings, considered various materials related to the New Sub-Advisory Agreement including: (1) a copy of the proposed form of New Sub-Advisory Agreement for the Sub-Advisor; (2) information describing the nature, quality and extent of services that the Sub-Advisor would provide to the Fund, and the proposed sub-advisory fees payable to the Sub-Adviser; (3) a report from K2 Advisors on the diligence conducted on the Sub-Advisor and the reasons for recommending the Sub-Advisor as a sub-advisor for the Fund, including, but not limited to, the Sub-Advisor’s background, experience, personnel, operations, policies, procedures and compliance functions and plans for the integration of such operations, policies, procedures and compliance functions with those of K2 Advisors; and (4) a report from the Fund’s Chief Compliance Officer regarding the Sub-Advisor’s compliance program and capabilities, including the Sub-Advisor’s policies and procedures in place to address potential conflicts of interest, and the diligence undertaken by the Fund’s Chief Compliance Officer with respect thereto. The Board noted that the terms of the New Sub-Advisory Agreement were substantially similar to the terms of the sub-advisory agreements with the Fund’s existing sub-advisors.
The Board’s consideration of whether to approve the New Sub-Advisory Agreement on behalf of the Fund took into account several factors including, but not limited to, the following: (1) the nature and quality of the services to be provided by the Sub-Advisor to the Fund under the New Sub-Advisory Agreement; (2) the Sub-Advisor’s experience as a manager of other accounts; (3) the Sub-Advisor’s strength and reputation within the industry; (4) the fairness of the compensation under the New Sub-Advisory Agreement; (5) the personnel, operations, financial condition, and investment management capabilities, methodologies and resources of the Sub-Advisor; (6) profitability matters; (7) reports from K2 Advisors on the diligence conducted on the Sub-Advisor and the reasons for recommending the
| 126 | Annual Report | franklintempleton.com | ||||||||
FRANKLIN ALTERNATIVE STRATEGIES FUNDS
SHAREHOLDER INFORMATION
Sub-Advisor as a sub-advisor for the Fund, including, but not limited to, the Sub-Advisor’s background, experience, personnel, operations, policies, procedures and compliance functions and plans for the integration of such operations, policies, procedures and compliance functions with those of K2 Advisors; and (8) a report from the Trust’s Chief Compliance Officer regarding the Sub-Advisor’s compliance program and capabilities, including the Sub-Advisor’s policies and procedures in place to address potential conflicts of interest, and the diligence undertaken by the Trust’s Chief Compliance Officer with respect thereto. Particular attention was given to the due diligence and risk management procedures of K2 Advisors with respect to selecting and overseeing sub-advisors of the Fund, as well as the Sub-Advisor’s risk management program and to derivatives and other complex instruments that are expected to be held by the Fund and how such instruments are expected to be used to pursue the Fund’s investment goal.
The following discussion relates to certain primary factors relevant to the Board’s decision to approve the New Sub-Advisory Agreement. This discussion of the information and factors considered by the Board (including the information and factors discussed above) is not intended to be exhaustive, but rather summarizes certain factors considered by the Board. In view of the wide variety of factors considered, the Board did not, unless otherwise noted, find it practicable to quantify or otherwise assign relative weights to the following factors. In addition, individual trustees may have assigned different weights to various factors.
NATURE, EXTENT AND QUALITY OF SERVICES. The trustees reviewed the nature, extent and quality of the services to be provided by the Sub-Advisor. In this regard, they reviewed the Fund’s investment goal and the Sub-Advisor’s proposed investment strategy, and the Sub-Advisor’s ability to implement such investment goal and/or investment strategy, including, but not limited to, the Sub-Advisor’s trading practices and investment decision processes.
With respect to the sub-advisory services to be provided by the Sub-Advisor, the Board noted the responsibilities that the Sub-Advisor would have with respect to the Fund’s assets to be allocated to it by K2-Advisors ( the “Sub-Advised Portion”), including, among others, implementing the investment strategies with respect to the Sub-Advised Portion and ensuring compliance with the investment strategies, policies, and limitations of the Sub-Advised Portion. The trustees considered the successful performance of the Sub-Advisor in
managing other investment products with investment strategies similar to the investment strategies of its Sub-Advised Portion.
The trustees reviewed the portfolio management team at the Sub-Advisor that would be responsible for managing the Sub-Advised Portion, including the team’s performance, staffing, skills and compensation program. The trustees considered various other products, portfolios and entities that are advised by the Sub-Advisor, their relative fees and reasons for differences with respect thereto and any potential conflicts. The Board also considered a report from the Trust’s Chief Compliance Officer regarding the Sub-Advisor’s compliance program as such policies relate to the operations of the Fund. The Board considered the selection and due diligence process employed by K2 Advisors in proposing the Sub-Advisor as a sub-advisor to the Fund, including the due diligence undertaken with respect to the Sub-Advisor’s compliance capabilities, and efforts to integrate the Sub-Advisor’s operations, policies, procedures and compliance functions with those of K2 Advisors.
Based on their review, the trustees were satisfied with the nature and quality of the overall services to be provided by the Sub-Advisor to the Fund and its shareholders and were confident in the abilities of the Sub-Advisor to implement its proposed investment strategies, and to provide quality services to the Fund and its shareholders.
INVESTMENT PERFORMANCE. The Board noted that, as the Sub-Advisor had not provided any services to the Fund, there was no investment performance of the Sub-Advisor with respect to the Fund. The Board considered the investment performance of the Sub-Advisor in managing other investment products with similar investment strategies to the investment strategies of the Sub-Advised Portion. The Board also considered the performance benchmarks for the Fund and how such benchmarks would be utilized to measure the performance of the Sub-Advisor in managing the Sub-Advised Portion.
COMPARATIVE EXPENSES AND PROFITABILITY. The Board considered the cost of the services to be provided by the Sub-Advisor. The Board also noted that it could not evaluate the Sub-Advisor’s profitability with respect to the Fund since no assets had yet been allocated to the Sub-Advisor.
The Board noted that the sub-advisory fees would be paid by K2 Advisors to the Sub-Advisor and would not be additional fees to be borne by the Fund. The Board also noted that the sub-advisory fees to be paid by K2 Advisors to the
| franklintempleton.com | Annual Report | 127 | ||||||||
FRANKLIN ALTERNATIVE STRATEGIES FUNDS
SHAREHOLDER INFORMATION
Sub-Advisor were the product of negotiations between K2 Advisors and the Sub-Advisor and the Board considered the allocation of the investment management fee charged to the Fund between K2 Advisors and the Sub-Advisor in light of the nature, extent and quality of the investment management services expected to be provided by K2 Advisors and the Sub-Advisor. The trustees considered various other products, portfolios and entities that are advised by the Sub-Advisor and the allocation of assets and expenses among and within them, as well as their relative fees and reasons for differences with respect thereto and any potential conflicts. The Board considered the extent to which the Sub-Advisor may derive ancillary benefits from the Fund’s operations.
With respect to the impact on K2 Advisors’ and its affiliates’ profitability as a result of hiring the Sub-Advisor as a sub-advisor to the Fund, the Board considered the following: (1) the fee waiver and expense limitation arrangements in effect, the amount of Fund expenses that were absorbed since the inception of the Fund by K2 Advisors through such arrangements, and the expected impact of the engagement of the Sub-Advisor on the amount of Fund expenses being waived by K2 Advisors (2) the level of sub-advisory fees to be paid to the Sub-Advisor, and (3) K2 Advisors’ belief that hiring of the Sub-Advisor will not have any material impact on K2 Advisors’ profitability.
Based upon its consideration of all these factors, the Board determined that the sub-advisory fee structure for the Sub-Advisor was fair and reasonable.
ECONOMIES OF SCALE. The Board considered economies of scale that may be realized by the Sub-Advisor as the Fund grows larger and the extent to which such economies of scale may be shared with Fund shareholders, as for example, in the level of the sub-advisory fees charged, in the quality and efficiency of services rendered and in increased capital commitments benefiting the Fund directly or indirectly. The Board concluded that economies of scale were deemed not to be a significant factor at that time in light of, among other matters, the fee waiver and expense limitation arrangement in effect.
Conclusion
After consideration of the foregoing factors, and such other matters as were deemed relevant, and with no single factor being determinative to their decision, the trustees—including a majority of the independent trustees—with the assistance of independent counsel approved the New Sub-Advisory Agreement, including the fees payable thereunder, with the Sub-Advisor for the Fund.
Liquidity Risk Management Program
Each Fund has adopted and implemented a written Liquidity Risk Management Program (the “LRMP”) as required by Rule 22e-4 under the Investment Company Act of 1940 (the “Liquidity Rule”). The LRMP is designed to assess and manage each Fund’s liquidity risk, which is defined as the risk that the Fund could not meet requests to redeem shares issued by the Fund without significant dilution of remaining investors’ interests in the Fund. In accordance with the Liquidity Rule, the LRMP includes policies and procedures that provide for: (1) assessment, management, and review (no less frequently than annually) of each Fund’s liquidity risk; (2) classification of each Fund’s portfolio holdings into one of four liquidity categories (Highly Liquid, Moderately Liquid, Less Liquid, and Illiquid); (3) for Funds that do not primarily hold assets that are Highly Liquid, establishing and maintaining a minimum percentage of the Fund’s net assets in Highly Liquid investments (called a “Highly Liquid Investment Minimum” or “HLIM”); and (4) prohibiting the Fund’s acquisition of Illiquid investments that would result in the Fund holding more than 15% of its net assets in Illiquid assets. The LRMP also requires reporting to the Securities and Exchange Commission (“SEC”) (on a non-public basis) and to the Board if the Fund’s holdings of Illiquid assets exceed 15% of the Fund’s net assets. Funds with HLIMs must have procedures for addressing HLIM shortfalls, including reporting to the Board and, with respect to HLIM shortfalls lasting more than seven consecutive calendar days, reporting to the SEC (on a non-public basis).
The Director of Liquidity Risk within the Investment Risk Management Group (the “IRMG”) is the appointed Administrator of the LRMP. The IRMG maintains the Investment Liquidity Committee (the “ILC”) to provide oversight and administration of policies and procedures governing liquidity risk management for Franklin Templeton and Legg Mason products and portfolios. The ILC includes representatives from Franklin Templeton’s Risk, Trading, Global Compliance, Legal, Investment Compliance, Investment Operations, Valuation Committee, Product Management and Global Product Strategy.
In assessing and managing each Fund’s liquidity risk, the ILC considers, as relevant, a variety of factors, including the Fund’s investment strategy and the liquidity of its portfolio investments during both normal and reasonably foreseeable stressed conditions; its short and long-term cash flow projections; and its cash holdings and access to other funding sources including the Funds’ interfund lending facility and line of credit. Classification of the Fund’s portfolio holdings in the
| 128 | Annual Report | franklintempleton.com | ||||||||
FRANKLIN ALTERNATIVE STRATEGIES FUNDS
SHAREHOLDER INFORMATION
four liquidity categories is based on the number of days it is reasonably expected to take to convert the investment to cash (for Highly Liquid and Moderately Liquid holdings) or sell or dispose of the investment (for Less Liquid and Illiquid investments), in current market conditions without significantly changing the investment’s market value.
Each Fund primarily holds liquid assets that are defined under the Liquidity Rule as “Highly Liquid Investments,” and therefore is not required to establish an HLIM. Highly Liquid Investments are defined as cash and any investment reasonably expected to be convertible to cash in current market conditions in three business days or less without the conversion to cash significantly changing the market value of the investment.
At meetings of the Funds’ Board of Trustees held in May 2022, the Program Administrator provided a written report to the Board addressing the adequacy and effectiveness of the program for the year ended December 31, 2021. The Program Administrator report concluded that (i.) the LRMP, as adopted and implemented, remains reasonably designed to assess and manage each Fund’s liquidity risk; (ii.) the LRMP, including the Highly Liquid Investment Minimum (“HLIM”) where applicable, was implemented and operated effectively to achieve the goal of assessing and managing each Fund’s liquidity risk; and (iii.) each Fund was able to meet requests for redemption without significant dilution of remaining investors’ interests in the Fund.
Proxy Voting Policies and Procedures
The Fund’s investment manager has established Proxy Voting Policies and Procedures (Policies) that the Fund uses to determine how to vote proxies relating to portfolio securities. Shareholders may view the Fund’s complete Policies online at franklintempleton.com. Alternatively, shareholders may request copies of the Policies free of charge by calling the Proxy Group collect at (954) 527-7678 or by sending a written request to: Franklin Templeton Companies, LLC, 300 S.E. 2nd Street, Fort Lauderdale, FL 33301, Attention: Proxy Group. Copies of the Fund’s proxy voting records are also made available online at franklintempleton.com and posted on the U.S. Securities and Exchange Commission’s website at sec.gov and reflect the most recent 12-month period ended June 30.
Quarterly Consolidated Schedule of Investments
The Trust, on behalf of the Fund, files a complete statement of investments with the U.S. Securities and Exchange Commission for the first and third quarters for each fiscal year as an exhibit to its report on Form N-PORT. Shareholders may view the filed Form N-PORT by visiting the Commission’s website at sec.gov. The filed form may also be viewed and copied at the Commission’s Public Reference Room in Washington, DC. Information regarding the operations of the Public Reference Room may be obtained by calling (800) SEC-0330.
Householding of Reports and Prospectuses
You will receive, or receive notice of the availability of, the Fund’s financial reports every six months. In addition, you will receive an annual updated summary prospectus (detail prospectus available upon request). To reduce Fund expenses, we try to identify related shareholders in a household and send only one copy of the financial reports (to the extent received by mail) and summary prospectus. This process, called “householding,” will continue indefinitely unless you instruct us otherwise. If you prefer not to have these documents householded, please call us at (800) 632-2301. At any time you may view current prospectuses/summary prospectuses and financial reports on our website. If you choose, you may receive these documents through electronic delivery.
| franklintempleton.com | Annual Report | 129 | ||||||||
FRANKLIN ALTERNATIVE STRATEGIES FUNDS
FRANKLIN K2 ALTERNATIVE STRATEGIES FUND
Important Notice to Shareholders
SECTION 19(A) NOTICE
On December 30, 2021, the Fund distributed $0.0597, $0.0000, $0.0496, $0.0990 and $0.0901 from net investment income for Class A, Class C, Class R, Class R6 and Advisor Class, respectively; $0.0776 from short-term capital gains; and $0.4227 from long-term capital gains, which are calculated on a tax basis in accordance with income tax regulations.
Estimated distribution sources are as follows: $0.0049, $0.0000, $0.0041, $0.0082 and $0.0075 represents net investment income for Class A, Class C, Class R, Class R6 and Advisor Class, respectively; $0.2362 represents gain from the sale of securities for each class; and $0.3189, $0.2641, $0.3096, $0.3549 and $0.3467 represents return of principal for Class A, Class C, Class R, Class R6 and Advisor Class, respectively. These estimates are calculated in accordance with U.S. Generally Accepted Accounting Principles that may significantly differ from the amounts calculated on a tax basis. This information is being provided pursuant to Section 19(a) of the Investment Company Act of 1940 and should not be used for tax reporting purposes.
| 130 | Annual Report | franklintempleton.com | ||||||||
Authorized for distribution only when accompanied or preceded by a summary prospectus and/or prospectus. Investors should carefully consider a fund’s investment goals, risks, charges and expenses before investing. A prospectus contains this and other information; please read it carefully before investing.
To help ensure we provide you with quality service, all calls to and from our service areas are monitored and/or recorded.
 | Annual Report and Shareholder Letter Franklin K2 Alternative Strategies Fund | |||||
| Investment Manager | Distributor | Shareholder Services | ||||
| K2/D&S Management Co., L.L.C. | Franklin Distributors, LLC (800) DIAL BEN®/342-5236 franklintempleton.com | (800) 632-2301 | ||||
| © 2022 Franklin Templeton Investments. All rights reserved. | 068 A 07/22 | |||||
ANNUAL REPORT AND SHAREHOLDER LETTER
FRANKLIN K2 LONG SHORT CREDIT FUND
A Series of Franklin Alternative Strategies Funds
May 31, 2022


Sign up for electronic delivery at franklintempleton.com/edelivery
SHAREHOLDER LETTER
Dear Fellow Shareholder:
During the 12 months ended May 31, 2022, the global economy was pressured by geopolitical instability, tightening monetary policies and renewed COVID-19 outbreaks. Although global equities benefited from ongoing vaccination programs and easing restrictions in certain regions, this was outweighed by the spread of COVID-19 variants, Russia’s invasion of Ukraine in February 2022 and interest rate hikes from the U.S. Federal Reserve. The Chinese government’s imposition of new restrictions on some businesses also pressured Asian and global emerging market stocks. Additionally, an environment of persistent supply chain disruptions stoked mounting inflationary pressures.
In this environment, global developed market stocks, as measured by the MSCI World Index (USD), posted a -4.38% total return for the period.1 Global emerging market stocks, as measured by the MSCI Emerging Markets Index (USD), posted a -19.56% total return.1 Global government bonds, as measured by the FTSE World Government Bond Index (USD), posted a -14.97% total return.1
We are committed to our long-term perspective and disciplined investment approach as we continue to conduct a rigorous analysis of Fund subadvisors and markets with a strong emphasis on investment risk management.
We believe active, professional investment management serves investors well. We also recognize the important role of financial professionals in today’s markets and encourage investors to continue to seek their advice. Amid changing markets and economic conditions, we are confident investors with a well-diversified portfolio and a patient, long-term outlook should be well-positioned for the years ahead.
1. Source: Morningstar.
See www.franklintempletondatasources.com for additional data provider information.
On the following pages, the Fund’s portfolio management team reviews investment decisions that pertain to performance during the past 12 months in light of the economic environment and other factors. Please remember all securities markets fluctuate, as do mutual fund share prices.
We thank you for investing with Franklin Templeton, welcome your questions and comments, and look forward to continuing to serve your investment needs in the future.
Sincerely,

Brooks Ritchey
President and Chief Executive Officer –
Investment Management
Franklin Alternative Strategies Funds
This letter reflects our analysis and opinions as of May 31, 2022, unless otherwise indicated. The information is not a complete analysis of every aspect of any market, country, industry, security or fund. Statements of fact are from sources considered reliable.
| Not FDIC Insured | | | May Lose Value | | | No Bank Guarantee |
| franklintempleton.com | Annual Report | 1 | ||||||||
Visit franklintempleton.com for fund
updates, to access your account, or to find helpful financial planning tools.
| 2 | Annual Report | franklintempleton.com | ||||||||
ANNUAL REPORT
Franklin K2 Long Short Credit Fund
This annual report for Franklin K2 Long Short Credit Fund covers the fiscal year ended May 31, 2022.
Your Fund’s Goal and Main Investments
The Fund seeks total return through a combination of current income, capital preservation and capital appreciation. The Fund seeks to achieve its investment goal by allocating its assets across multiple alternative strategies in the fixed income and credit areas, including, but not limited to, some or all of the following: credit long short, structured credit and emerging market fixed income. The Fund is structured as a multi-manager fund, meaning the Fund’s assets are managed by multiple subadvisors, and the Fund’s investment manager has overall responsibility for the Fund’s investments.
Under normal market conditions, the Fund invests at least 80% of its net assets, plus the amount of any borrowings for investment purposes, in credit-related investments. The Fund invests in a wide range of securities and other investments including, but not limited to: corporate bonds, mortgage-backed securities (MBS) and asset-backed securities (ABS), U.S. government and agency securities, collateralized debt and loan obligations, foreign government and supranational
debt securities, loans and loan participations and derivatives with similar economic characteristics. The Fund may also invest in repurchase agreements, reverse repurchase agreements, mortgage real estate investment trusts (REITs) and other similar transactions.
Performance Overview
The Fund’s Class A shares posted a -4.16% cumulative total return for the 12 months under review. For comparison, the Fund’s primary benchmark, the HFRX Fixed Income - Credit Index, which measures performance of strategies with exposure to credit across a broad continuum of credit substrategies, posted a -9.01% cumulative total return for the same period.1 Also for comparison, the Fund’s secondary benchmark, the ICE BofA U.S. 3-Month Treasury Bill Index, which is an index of short-term U.S. government securities with a remaining term to final maturity of less than three months, posted a +0.14% cumulative total return.2 You can
find more of the Fund’s performance data in the Performance Summary beginning on page 6.
Performance data represent past performance, which does not guarantee future results. Investment return and principal value will fluctuate, and you may have a gain or loss when you sell your shares. Current performance may differ from figures shown. For most recent month-end performance, go to franklintempleton.com or call (800) 342-5236.
| Portfolio Composition | ||
| 5/31/22 | ||
| % of Total Net Assets | ||
| Long Positions | 85.6% | |
Short Positions | -4.4% | |
Short-Term Investments | 13.3% | |
Other Assets, less Liabilities | 5.5% | |
Economic and Market Overview
Global developed and emerging market equities, as measured by the MSCI All Country World Index-NR (net of tax withholding when dividends are paid), posted a -6.78% total return for the 12 months ended May 31, 2022.2 Although global equities benefited from ongoing COVID-19 vaccination programs and easing restrictions in certain regions, the spread of the Delta and Omicron variants hindered markets at certain points during the 12-month period. The Chinese government’s imposition of additional restrictions on some businesses pressured Asian and global emerging market stocks. Additionally, an environment of persistent supply chain disruptions stoked mounting inflationary pressures. Russia’s invasion of Ukraine late in February 2022 injected further uncertainty into financial markets, provoking significant volatility in commodity and equity prices. Rising interest rates also pressured stocks, as borrowing costs began to increase from historically low levels.
In the U.S., gross domestic product (GDP) growth was robust throughout the period until the first quarter of 2022, when the economy contracted. The spread of Omicron variants, weakening fixed investments and a widening trade gap contributed
1. Source: FactSet. Hedge Fund Research, Inc. – www.hedgefundresearch.com. The HFRX Fixed Income - Credit Index is being used under license from Hedge Fund Research, Inc., which does not endorse or approve of any of the contents of this report.
2. Source: Morningstar.
The indexes are unmanaged and include reinvestment of any income or distributions. They do not reflect any fees, expenses or sales charges. One cannot invest directly in an index, and an index is not representative of the Fund’s portfolio. Unlike most asset class indexes, HFR Index returns reflect fees and expenses.
See www.franklintempletondatasources.com for additional data provider information.
The dollar value, number of shares or principal amount, and names of all portfolio holdings are listed in the Fund’s Schedule of Investments (SOI). The SOI begins on page 15.
| franklintempleton.com | Annual Report | 3 | ||||||||
FRANKLIN K2 LONG SHORT CREDIT FUND
to the weaker first quarter. Rising prices precipitated a notable decline in consumer confidence, despite high spending levels. In an effort to control inflation, the U.S. Federal Reserve (Fed) raised the federal funds target rate to a range of 0.25%–0.50%, the first such increase since 2018. In May 2022, the Fed raised interest rates by another half percentage point. The Fed noted in its May 2022 meeting that strength in the U.S. job market and continued inflationary pressure, exacerbated by the war in Ukraine, meant it anticipated making further increases to the federal funds target rate.
GDP growth resumed in the eurozone in 2021’s second quarter following a brief recession, but slowed beginning in the fourth quarter as the spread of the Omicron variant disrupted labor markets and led to renewed restrictions. Late in the reporting period, the war in Ukraine disrupted supply chains, sent commodity prices higher and further weakened the economic outlook. The European Central Bank struck a less accommodative tone at its March 2022 meeting as it set a schedule to wind down its asset purchases and established preconditions for possible interest-rate increases later in 2022. Stocks of companies with exposure to Russia, particularly banks, endured further declines late in the period. In this environment, European developed market equities, as measured by the MSCI Europe Index-NR, posted a -9.75% total return for the 12 months under review.2
Asian developed and emerging market equities, as measured by the MSCI All Country Asia Index-NR, posted a -18.75% total return for the 12-month period.2 While many Asian countries experienced improving economic conditions, Japan’s quarterly GDP was erratic, contracting in the third quarter of 2021 and the first quarter of 2022. Although China’s economy continued to grow, it was pressured by COVID-19 restrictions and government measures to limit real estate speculation. Unexpected regulatory changes by the Chinese government, which negatively impacted education- and technology-related businesses, and investor concerns about the solvency of several large Chinese property developers further pressured Asian stocks during the 12-month period.
Global emerging market stocks, as measured by the MSCI Emerging Markets Index-NR, posted a -19.83% total return for the 12 months under review.2 Rising prices for food and energy, following Russia’s invasion of Ukraine, increased inflationary pressures and raised concerns about possible government debt defaults in some countries. In contrast, some countries, particularly South Africa, Saudi Arabia and Brazil, as well as other countries in Latin America, benefited from the rising commodity prices.
Investment Strategy
We manage the Fund using a multi-manager approach. While we have overall responsibility for the Fund’s investments, we allocate the Fund’s assets to multiple subadvisors, each of whom independently manages a separate portion of the Fund’s portfolio in accordance with some or all of the following strategies: credit long short, structured credit and emerging market fixed income. We allocate the Fund’s assets among these strategies utilizing a top-down approach, generating the Fund’s strategy and subadvisor weightings by taking into account market conditions, risk factors, diversification, liquidity, transparency, and other investment options,
among other things. We allocate the Fund’s assets to specific subadvisors utilizing a bottom-up approach, selecting subadvisors and their weighting within the Fund’s portfolio by taking into account their correlation to various markets and to each other, risk profiles and their return expectations.
Credit long short strategies seek to isolate issuer-specific exposure, while limiting general market risks, by taking long and/or short positions in debt securities and other related instruments. Structured credit strategies aim to profit from trading in interest-rate sensitive securities such as residential and commercial MBS, REITs, credit default swaps on various indexes, collateralized loan obligations (CLOs) and ABS. Emerging market fixed income strategies invest in corporate
and/or sovereign securities in emerging markets countries with a focus on fixed income. The Fund may invest in debt securities of any credit quality or rating, including high-yield (“junk”) bonds, distressed debt securities (securities of companies that are, or are about to be, involved in reorganizations, financial restructurings, or bankruptcy) and securities that are in default. The Fund may engage in active and frequent trading as part of its investment strategies.
The Fund takes long and/or short positions in a wide range of asset classes, including credit, fixed income, equities and currencies, among others. The Fund may gain long or short exposure to select instruments by utilizing derivatives, engaging in short sales or entering into a series of purchase and sale contracts or repurchase agreements. Long positions benefit from an increase in the price of the underlying instrument, while short positions benefit from a decrease in that price. The Fund may also use derivatives for hedging and nonhedging (investment) purposes, although no subadvisor is required to hedge any of the Fund’s positions or to use derivatives. Such derivative investments may include currency forward contracts; futures contracts; put and call
options on currencies, securities, indexes and exchange-traded funds; and swaps.
| 4 | Annual Report | franklintempleton.com | ||||||||
FRANKLIN K2 LONG SHORT CREDIT FUND
| Subadvisors |
| 5/31/22 |
| Credit Long Short |
Apollo Credit Management LLC |
Benefit Street Partners L.L.C. |
| Structured Credit |
Ellington Global Asset Management, LLC |
Medalist Partners, LP |
| Emerging Market Fixed Income |
Emso Asset Management Limited |
Manager’s Discussion
The Fund’s subadvisors for the 12 months under review were Apollo Credit Management, Benefit Street Partners (BSP), Ellington Global Asset Management, Emso Asset Management and Medalist Partners. These subadvisors are also listed in the Subadvisors table on this page.
While Ellington generated a positive contribution to the Fund’s absolute performance for the fiscal year, the other four managers detracted from performance. The most significant detractor was Benefit Street Partners, followed by Emso, Medalist and Apollo.
In terms of strategy performance, only one of the Fund’s three underlying strategies, structured credit, contributed to the Fund’s absolute performance. The credit long short strategy and emerging market fixed income strategy detracted from results. The top contributors to the Fund’s aggregate returns on an asset class level were currency (net short positioning versus long the U.S. dollar) and equity exposures, while fixed income positioning detracted from Fund performance.
In terms of aggregate sector exposures, the top performance drivers for the Fund were currencies and interest rate derivatives. In contrast, consumer discretionary and government exposures weighed on returns.
In the structured credit strategy, key contributors included a short position in interest rate derivatives and a long position in mortgage securities. Conversely, a long position in asset-backed securities negatively affected performance.
In the credit long short strategy, a short position in currencies and long positioning in energy benefited performance. Conversely, net detractors included long positions in consumer discretionary and communication services exposure.
The emerging market fixed income strategy benefited primarily from a short position in interest rate derivatives. In contrast, a long position in government bonds was a key detractor from performance.
Over the 12-month reporting period, there were no significant changes to portfolio allocation.
Thank you for your participation in Franklin K2 Long Short Credit Fund. We look forward to continuing to serve your future investment needs.
| Robert Christian |
| Co-Lead Portfolio Manager |
| Brooks Ritchey |
| Co-Lead Portfolio Manager |
| Art Vinokur |
| Portfolio Manager |
The foregoing information reflects our analysis, opinions and portfolio holdings as of May 31, 2022, the end of the reporting period. The way we implement our main investment strategies and the resulting portfolio holdings may change depending on factors such as market and economic conditions. These opinions may not be relied upon as investment advice or an offer for a particular security. The information is not a complete analysis of every aspect of any market, country, industry, security or the Fund. Statements of fact are from sources considered reliable, but the investment manager makes no representation or warranty as to their completeness or accuracy. Although historical performance is no guarantee of future results, these insights may help you understand our investment management philosophy.
| franklintempleton.com | Annual Report | 5 | ||||||||
FRANKLIN K2 LONG SHORT CREDIT FUND
Performance Summary as of May 31, 2022
The performance table and graphs do not reflect any taxes that a shareholder would pay on Fund dividends, capital gain distributions, if any, or any realized gains on the sale of Fund shares. Total return reflects reinvestment of the Fund’s dividends and capital gain distributions, if any, and any unrealized gains or losses. Your dividend income will vary depending on dividends or interest paid by securities in the Fund’s portfolio, adjusted for operating expenses of each class. Capital gain distributions are net profits realized from the sale of portfolio securities.
Performance as of 5/31/221
Cumulative total return excludes sales charges. Average annual total return includes maximum sales charges. Sales charges will vary depending on the size of the investment and the class of share purchased. The maximum is 5.50% and the minimum is 0%. Class A: 5.50% maximum initial sales charge; Advisor Class: no sales charges. For other share classes, visit franklintempleton.com.
| Share Class | Cumulative Total Return2 | Average Annual Total Return3 | ||||||
| A4 | ||||||||
1-Year | -4.16% | -9.40% | ||||||
5-Year | +13.02% | +1.33% | ||||||
Since Inception (9/8/15) | +25.22% | +2.54% | ||||||
| Advisor | ||||||||
1-Year | -3.99% | -3.99% | ||||||
5-Year | +14.03% | +2.66% | ||||||
Since Inception (9/8/15) | +26.47% | +3.55% | ||||||
Performance data represent past performance, which does not guarantee future results. Investment return and principal value will fluctuate, and you may have a gain or loss when you sell your shares. Current performance may differ from figures shown. For most recent month-end performance, go to franklintempleton.com or call (800) 342-5236.
See page 8 for Performance Summary footnotes.
| 6 | Annual Report | franklintempleton.com | ||||||||
FRANKLIN K2 LONG SHORT CREDIT FUND
PERFORMANCE SUMMARY
Total Return Index Comparison for a Hypothetical $10,000 Investment1
Total return represents the change in value of an investment over the periods shown. It includes any applicable maximum sales charge, Fund expenses, account fees and reinvested distributions. The unmanaged indexes include reinvestment of any income or distributions. These differ from the Fund in composition and do not pay management fees or expenses. One cannot invest directly in an index.
Class A (9/8/15–5/31/22)
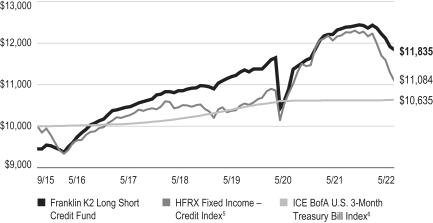
Advisor Class (9/8/15–5/31/22)
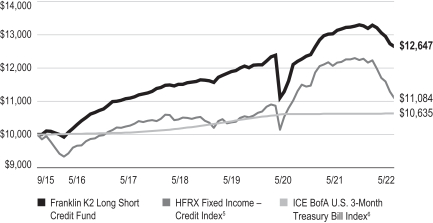
See page 8 for Performance Summary footnotes.
| franklintempleton.com | Annual Report | 7 | ||||||||
FRANKLIN K2 LONG SHORT CREDIT FUND
PERFORMANCE SUMMARY
Distributions (6/1/21–5/31/22)
| Share Class | Net Investment Income | Short-Term Capital Gain | Total | |||||||||
| A | $0.2289 | $0.1352 | $0.3641 | |||||||||
| C | $0.1444 | $0.1352 | $0.2796 | |||||||||
| R | $0.2049 | $0.1352 | $0.3401 | |||||||||
| R6 | $0.2658 | $0.1352 | $0.4010 | |||||||||
| Advisor | $0.2582 | $0.1352 | $0.3934 | |||||||||
Total Annual Operating Expenses7
| Share Class | With Fee Waiver | Without Fee Waiver | ||||||
| A | 2.23% | 2.82% | ||||||
| Advisor | 1.98% | 2.57% | ||||||
Each class of shares is available to certain eligible investors and has different annual fees and expenses, as described in the prospectus.
All investments involve risks, including possible loss of principal. The market values of securities owned by the Fund will go up or down, sometimes rapidly or unpredictably. The Fund’s performance depends on the manager’s skill in selecting, overseeing and allocating Fund assets to the subadvisors. The Fund is actively managed and could experience losses if the manager’s and subadvisors’ judgment about particular Fund portfolio investments prove to be incorrect. Some subadvisors may have little or no experience managing the assets of a registered investment company. Bond prices generally move in the opposite direction of interest rates. Changes in the financial strength of a bond issuer or in a bond’s credit rating may affect its value. Lower-rated or high-yield debt securities (junk bonds) involve greater credit risk, including the possibility of default or bankruptcy. Liquidity risk exists when securities become more difficult to sell, or are unable to be sold, at the price at which they have been valued. Investments in derivatives involve costs and create economic leverage, which may result in significant volatility and cause the Fund to participate in losses (as well as gains) that significantly exceed the Fund’s initial investment. The Fund may make short sales of securities, which involves the risk that losses may exceed the original amount invested. Events such as the spread of deadly diseases, disasters, and financial, political or social disruptions, may heighten risks and adversely affect performance. The Fund’s prospectus also includes a description of the main investment risks, including the risks of foreign investments.
Russia’s military invasion of Ukraine in February 2022, the resulting responses by the United States and other countries, and the potential for wider conflict could increase volatility and uncertainty in the financial markets and adversely affect regional and global economies. The United States and other countries have imposed broad-ranging economic sanctions on Russia and certain Russian individuals, banking entities and corporations as a response to its invasion of Ukraine. The United States and other countries have also imposed economic sanctions on Belarus and may impose sanctions on other countries that support Russia’s military invasion. These sanctions, as well as any other economic consequences related to the invasion, such as additional sanctions, boycotts or changes in consumer or purchaser preferences or cyberattacks on governments, companies or individuals, may further decrease the value and liquidity of certain Russian securities and securities of issuers in other countries that are subject to economic sanctions related to the invasion.
1. The Fund has an expense reduction contractually guaranteed through 9/30/23. Fund investment results reflect the expense reduction; without this reduction, the results would have been lower.
2. Cumulative total return represents the change in value of an investment over the periods indicated.
3. Average annual total return represents the average annual change in value of an investment over the periods indicated. Return for less than one year, if any, has not been annualized.
4. Prior to 9/10/18, these shares were offered at a higher initial sales charge of 5.75%, thus actual returns (with sales charges) would have differed. Average annual total returns (with sales charges) have been restated to reflect the current maximum initial sales charge of 5.50%.
5. Source: FactSet. Hedge Fund Research, Inc. – www.hedgefundresearch.com. The HFRX Fixed Income – Credit Index measures performance of strategies with exposure to credit across a broad continuum of credit substrategies, including corporate, sovereign, distressed, convertible, asset backed, capital structure arbitrage, multi-strategy and other relative value and event driven substrategies. Investment thesis across all strategies is predicated on realization of a valuation discrepancy between the related credit instruments. Strategies may also include and utilize equity securities, credit derivatives, government fixed income, commodities, currencies or other hybrid securities.
6. Source: Morningstar. The ICE BofA U.S. 3-Month Treasury Bill Index is an index of short-term U.S. government securities with a remaining term to final maturity of less than three months. Treasuries, if held to maturity, offer a fixed rate of return and a fixed principal value; their interest payments and principal are guaranteed.
7. Figures are as stated in the Fund’s current prospectus and may differ from the expense ratios disclosed in the Your Fund’s Expenses and Financial Highlights sections in this report. In periods of market volatility, assets may decline significantly, causing total annual Fund operating expenses to become higher than the figures shown.
See www.franklintempletondatasources.com for additional data provider information.
| 8 | Annual Report | franklintempleton.com | ||||||||
FRANKLIN K2 LONG SHORT CREDIT FUND
As a Fund shareholder, you can incur two types of costs: (1) transaction costs, including sales charges (loads) on Fund purchases and redemptions; and (2) ongoing Fund costs, including management fees, distribution and service (12b-1) fees, and other Fund expenses. All mutual funds have ongoing costs, sometimes referred to as operating expenses. The table below shows ongoing costs of investing in the Fund and can help you understand these costs and compare them with those of other mutual funds. The table assumes a $1,000 investment held for the six months indicated.
Actual Fund Expenses
The table below provides information about actual account values and actual expenses in the columns under the heading “Actual.” In these columns the Fund’s actual return, which includes the effect of Fund expenses, is used to calculate the “Ending Account Value” for each class of shares. You can estimate the expenses you paid during the period by following these steps (of course, your account value and expenses will differ from those in this illustration): Divide your account value by $1,000 (if your account had an $8,600 value, then $8,600 ÷ $1,000 = 8.6). Then multiply the result by the number in the row for your class of shares under the headings “Actual” and “Expenses Paid During Period” (if Actual Expenses Paid During Period were $7.50, then 8.6 x $7.50 = $64.50). In this illustration, the actual expenses paid this period are $64.50.
Hypothetical Example for Comparison with Other Funds
Under the heading “Hypothetical” in the table, information is provided about hypothetical account values and hypothetical expenses based on the Fund’s actual expense ratio and an assumed rate of return of 5% per year before expenses, which is not the Fund’s actual return. This information may not be used to estimate the actual ending account balance or expenses you paid for the period, but it can help you compare ongoing costs of investing in the Fund with those of other funds. To do so, compare this 5% hypothetical example for the class of shares you hold with the 5% hypothetical examples that appear in the shareholder reports of other funds. Please note that expenses shown in the table are meant to highlight ongoing costs and do not reflect any transactional costs. Therefore, information under the heading “Hypothetical” is useful in comparing ongoing costs only, and will not help you compare total costs of owning different funds. In addition, if transactional costs were included, your total costs would have been higher.
| Actual (actual return after expenses) | Hypothetical (5% annual return before expenses) | |||||||||||||||||||||||
Share Class | Beginning Account Value 12/01/21 | Ending Account Value 5/31/22 | Expenses Paid During Period 12/01/21–5/31/221,2,3 | Ending Account Value 5/31/22 | Expenses Paid During Period 12/01/21–5/31/221,2,3 | Net Annualized Expense Ratio2,3 | ||||||||||||||||||
| A | $ | 1,000 | $ | 957.50 | $ | 10.35 | $ | 1,014.36 | $ | 10.65 | 2.12 | % | ||||||||||||
| C | $ | 1,000 | $ | 953.60 | $ | 14.12 | $ | 1,010.47 | $ | 14.54 | 2.90 | % | ||||||||||||
| R | $ | 1,000 | $ | 956.70 | $ | 11.71 | $ | 1,012.96 | $ | 12.04 | 2.40 | % | ||||||||||||
| R6 | $ | 1,000 | $ | 958.20 | $ | 9.23 | $ | 1,015.51 | $ | 9.50 | 1.89 | % | ||||||||||||
| Advisor | $ | 1,000 | $ | 958.30 | $ | 9.33 | $ | 1,015.41 | $ | 9.60 | 1.91 | % | ||||||||||||
1. Expenses are equal to the annualized expense ratio for the six-month period as indicated above—in the far right column—multiplied by the simple average account value over the period indicated, and then multiplied by 182/365 to reflect the one-half year period.
2. Reflects expenses after fee waivers and expense reimbursements. Does not include acquired fund fees and expenses.
3. Effective March 1, 2022, the expense waivers for Classes A, C, R, R6 and Advisor changed and the new annualized net expense ratios for each class were: Class A 2.08%, Class C 2.83%, Class R 2.33%, Class R6 1.80% and Advisor Class 1.83%. Had such expense waivers been in effect for the full period, the Actual expenses paid for each share class would have been: A $10.15, C $13.78, R $11.37, R6 $8.79 and Advisor $8.93, and the Hypothetical expenses paid for each share class would have been: A $10.45, C $14.19, R $10.70, R6 $9.05 and Advisor $9.20.
| franklintempleton.com | Annual Report | 9 | ||||||||
FRANKLIN ALTERNATIVE STRATEGIES FUNDS
Franklin K2 Long Short Credit Fund
| Year Ended May 31, | ||||||||||||||||||||
| 2022 | 2021 | 2020 | 2019 | 2018 | ||||||||||||||||
| Class A | ||||||||||||||||||||
| Per share operating performance (for a share outstanding throughout the year) | ||||||||||||||||||||
Net asset value, beginning of year | $ | 10.90 | $ | 9.86 | $ | 10.45 | $ | 10.50 | $ | 10.49 | ||||||||||
|
| |||||||||||||||||||
| Income from investment operationsa: | ||||||||||||||||||||
Net investment incomeb | 0.25 | 0.28 | 0.23 | 0.37 | 0.29 | |||||||||||||||
Net realized and unrealized gains (losses) | (0.68 | ) | 1.03 | (0.53 | ) | (0.02 | ) | 0.08 | ||||||||||||
|
| |||||||||||||||||||
Total from investment operations | (0.43 | ) | 1.31 | (0.30 | ) | 0.35 | 0.37 | |||||||||||||
|
| |||||||||||||||||||
| Less distributions from: | ||||||||||||||||||||
Net investment income | (0.23 | ) | (0.26 | ) | (0.25 | ) | (0.31 | ) | (0.19 | ) | ||||||||||
Net realized gains | (0.14 | ) | (0.01 | ) | (0.04 | ) | (0.09 | ) | (0.17 | ) | ||||||||||
|
| |||||||||||||||||||
Total distributions | (0.37 | ) | (0.27 | ) | (0.29 | ) | (0.40 | ) | (0.36 | ) | ||||||||||
|
| |||||||||||||||||||
Net asset value, end of year | $ | 10.10 | $ | 10.90 | $ | 9.86 | $ | 10.45 | $ | 10.50 | ||||||||||
|
| |||||||||||||||||||
Total returnc | (4.16)% | 13.33% | (2.92)% | 3.42% | 3.63% | |||||||||||||||
| Ratios to average net assets | ||||||||||||||||||||
Expenses before waiver, payments by affiliates and expense reductiond | 2.65% | 2.85% | 3.24% | 3.15% | 3.51% | |||||||||||||||
Expenses net of waiver, payments by affiliates and expense reductiond | 2.14%e | 2.27%e | 2.74% | 2.69% | 2.98%e | |||||||||||||||
Expenses incurred in connection with securities sold short | 0.28% | 0.41% | 0.58% | 0.62% | 0.89% | |||||||||||||||
Net investment income | 2.38% | 2.61% | 2.24% | 3.49% | 2.71% | |||||||||||||||
| Supplemental data | ||||||||||||||||||||
Net assets, end of year (000’s) | $17,506 | $26,581 | $20,212 | $27,870 | $45,088 | |||||||||||||||
Portfolio turnover rate | 169.38% | 194.81% | 205.14% | 158.66% | 251.81% | |||||||||||||||
aThe amount shown for a share outstanding throughout the period may not correlate with the Statement of Operations for the period due to the timing of sales and repurchases of the Fund’s shares in relation to income earned and/or fluctuating fair value of the investments of the Fund.
bBased on average daily shares outstanding.
cTotal return does not reflect sales commissions or contingent deferred sales charges, if applicable.
dIncludes dividend and/or interest expense on securities sold short and security borrowing fees, if any. See below for the ratios of such expenses to average net assets for the periods presented. See Note 1(f).
eBenefit of expense reduction rounds to less than 0.01%.
| 10 | Annual Report | The accompanying notes are an integral part of these financial statements. | franklintempleton.com | ||||||||
FRANKLIN ALTERNATIVE STRATEGIES FUNDS
FINANCIAL HIGHLIGHTS
Franklin K2 Long Short Credit Fund (continued)
| Year Ended May 31, | ||||||||||||||||||||
| 2022 | 2021 | 2020 | 2019 | 2018 | ||||||||||||||||
| Class C | ||||||||||||||||||||
| Per share operating performance (for a share outstanding throughout the year) | ||||||||||||||||||||
Net asset value, beginning of year | $ | 10.70 | $ | 9.69 | $ | 10.26 | $ | 10.34 | $ | 10.35 | ||||||||||
|
| |||||||||||||||||||
| Income from investment operationsa: | ||||||||||||||||||||
Net investment incomeb | 0.17 | 0.19 | 0.15 | 0.27 | 0.19 | |||||||||||||||
Net realized and unrealized gains (losses) | (0.68 | ) | 1.01 | (0.52 | ) | (0.01 | ) | 0.07 | ||||||||||||
|
| |||||||||||||||||||
Total from investment operations | (0.51 | ) | 1.20 | (0.37 | ) | 0.26 | 0.26 | |||||||||||||
|
| |||||||||||||||||||
| Less distributions from: | ||||||||||||||||||||
Net investment income | (0.14 | ) | (0.18 | ) | (0.16 | ) | (0.25 | ) | (0.10 | ) | ||||||||||
Net realized gains | (0.14 | ) | (0.01 | ) | (0.04 | ) | (0.09 | ) | (0.17 | ) | ||||||||||
|
| |||||||||||||||||||
Total distributions | (0.28 | ) | (0.19 | ) | (0.20 | ) | (0.34 | ) | (0.27 | ) | ||||||||||
|
| |||||||||||||||||||
Net asset value, end of year | $ | 9.91 | $ | 10.70 | $ | 9.69 | $ | 10.26 | $ | 10.34 | ||||||||||
|
| |||||||||||||||||||
Total returnc | (4.91)% | 12.40% | (3.66)% | 2.61% | 2.70% | |||||||||||||||
| Ratios to average net assets | ||||||||||||||||||||
Expenses before waiver, payments by affiliates and expense reductiond | 3.42% | 3.64% | 3.96% | 4.03% | 4.37% | |||||||||||||||
Expenses net of waiver, payments by affiliates and expense reductiond | 2.91%e | 3.05%e | 3.46% | 3.57% | 3.84%e | |||||||||||||||
Expenses incurred in connection with securities sold short | 0.28% | 0.41% | 0.58% | 0.62% | 0.89% | |||||||||||||||
Net investment income | 1.61% | 1.82% | 1.52% | 2.61% | 1.85% | |||||||||||||||
| Supplemental data | ||||||||||||||||||||
Net assets, end of year (000’s) | $2,592 | $2,945 | $2,882 | $2,893 | $2,503 | |||||||||||||||
Portfolio turnover rate | 169.38% | 194.81% | 205.14% | 158.66% | 251.81% | |||||||||||||||
aThe amount shown for a share outstanding throughout the period may not correlate with the Statement of Operations for the period due to the timing of sales and repurchases of the Fund’s shares in relation to income earned and/or fluctuating fair value of the investments of the Fund.
bBased on average daily shares outstanding.
cTotal return does not reflect sales commissions or contingent deferred sales charges, if applicable.
dIncludes dividend and/or interest expense on securities sold short and security borrowing fees, if any. See below for the ratios of such expenses to average net assets for the periods presented. See Note 1(f).
eBenefit of expense reduction rounds to less than 0.01%.
| franklintempleton.com | The accompanying notes are an integral part of these financial statements. | Annual Report | 11 | ||||||||
FRANKLIN ALTERNATIVE STRATEGIES FUNDS
FINANCIAL HIGHLIGHTS
Franklin K2 Long Short Credit Fund (continued)
| Year Ended May 31, | ||||||||||||||||||||
| 2022 | 2021 | 2020 | 2019 | 2018 | ||||||||||||||||
| Class R | ||||||||||||||||||||
| Per share operating performance (for a share outstanding throughout the year) | ||||||||||||||||||||
Net asset value, beginning of year | $ | 10.79 | $ | 9.77 | $ | 10.36 | $ | 10.41 | $ | 10.41 | ||||||||||
|
| |||||||||||||||||||
| Income from investment operationsa: | ||||||||||||||||||||
Net investment incomeb | 0.23 | 0.25 | 0.21 | 0.33 | 0.25 | |||||||||||||||
Net realized and unrealized gains (losses) | (0.70 | ) | 1.01 | (0.53 | ) | (0.01 | ) | 0.09 | ||||||||||||
|
| |||||||||||||||||||
Total from investment operations | (0.47 | ) | 1.26 | (0.32 | ) | 0.32 | 0.34 | |||||||||||||
|
| |||||||||||||||||||
| Less distributions from: | ||||||||||||||||||||
Net investment income | (0.20 | ) | (0.23 | ) | (0.23 | ) | (0.28 | ) | (0.17 | ) | ||||||||||
Net realized gains | (0.14 | ) | (0.01 | ) | (0.04 | ) | (0.09 | ) | (0.17 | ) | ||||||||||
|
| |||||||||||||||||||
Total distributions | (0.34 | ) | (0.24 | ) | (0.27 | ) | (0.37 | ) | (0.34 | ) | ||||||||||
|
| |||||||||||||||||||
Net asset value, end of year | $ | 9.98 | $ | 10.79 | $ | 9.77 | $ | 10.36 | $ | 10.41 | ||||||||||
|
| |||||||||||||||||||
Total return | (4.42)% | 12.95% | (3.13)% | 3.12% | 3.29% | |||||||||||||||
| Ratios to average net assets | ||||||||||||||||||||
Expenses before waiver, payments by affiliates and expense reductionc | 2.92% | 3.15% | 3.46% | 3.50% | 3.82% | |||||||||||||||
Expenses net of waiver, payments by affiliates and expense reductionc | 2.41%d | 2.55%d | 2.96% | 3.04% | 3.29%d | |||||||||||||||
Expenses incurred in connection with securities sold short | 0.28% | 0.41% | 0.58% | 0.62% | 0.89% | |||||||||||||||
Net investment income | 2.11% | 2.31% | 2.02% | 3.14% | 2.40% | |||||||||||||||
| Supplemental data | ||||||||||||||||||||
Net assets, end of year (000’s) | $218 | $196 | $169 | $166 | $162 | |||||||||||||||
Portfolio turnover rate | 169.38% | 194.81% | 205.14% | 158.66% | 251.81% | |||||||||||||||
aThe amount shown for a share outstanding throughout the period may not correlate with the Statement of Operations for the period due to the timing of sales and repurchases of the Fund’s shares in relation to income earned and/or fluctuating fair value of the investments of the Fund.
bBased on average daily shares outstanding.
cIncludes dividend and/or interest expense on securities sold short and security borrowing fees, if any. See below for the ratios of such expenses to average net assets for the periods presented. See Note 1(f).
dBenefit of expense reduction rounds to less than 0.01%.
| 12 | Annual Report | The accompanying notes are an integral part of these financial statements. | franklintempleton.com | ||||||||
FRANKLIN ALTERNATIVE STRATEGIES FUNDS
FINANCIAL HIGHLIGHTS
Franklin K2 Long Short Credit Fund (continued)
| Year Ended May 31, | ||||||||||||||||||||
| 2022 | 2021 | 2020 | 2019 | 2018 | ||||||||||||||||
| Class R6 | ||||||||||||||||||||
| Per share operating performance (for a share outstanding throughout the year) | ||||||||||||||||||||
Net asset value, beginning of year | $ | 10.94 | $ | 9.87 | $ | 10.45 | $ | 10.51 | $ | 10.50 | ||||||||||
|
| |||||||||||||||||||
| Income from investment operationsa: | ||||||||||||||||||||
Net investment incomeb | 0.29 | 0.31 | 0.26 | 0.36 | 0.31 | |||||||||||||||
Net realized and unrealized gains (losses) | (0.69 | ) | 1.02 | (0.53 | ) | – | c | 0.08 | ||||||||||||
|
| |||||||||||||||||||
Total from investment operations | (0.40 | ) | 1.33 | (0.27 | ) | 0.36 | 0.39 | |||||||||||||
|
| |||||||||||||||||||
| Less distributions from: | ||||||||||||||||||||
Net investment income | (0.27 | ) | (0.25 | ) | (0.27 | ) | (0.33 | ) | (0.21 | ) | ||||||||||
Net realized gains | (0.14 | ) | (0.01 | ) | (0.04 | ) | (0.09 | ) | (0.17 | ) | ||||||||||
|
| |||||||||||||||||||
Total distributions | (0.41 | ) | (0.26 | ) | (0.31 | ) | (0.42 | ) | (0.38 | ) | ||||||||||
|
| |||||||||||||||||||
Net asset value, end of year | $ | 10.13 | $ | 10.94 | $ | 9.87 | $ | 10.45 | $ | 10.51 | ||||||||||
|
| |||||||||||||||||||
Total return | (4.00)% | 13.54% | (2.58)% | 3.53% | 3.76% | |||||||||||||||
| Ratios to average net assets | ||||||||||||||||||||
Expenses before waiver, payments by affiliates and expense reductiond | 3.98% | 2.58% | 2.95% | 3.10% | 3.35% | |||||||||||||||
Expenses net of waiver, payments by affiliates and expense reductiond | 1.86%e | 1.99%e | 2.41% | 2.55% | 2.83%e | |||||||||||||||
Expenses incurred in connection with securities sold short | 0.28% | 0.42% | 0.58% | 0.62% | 0.89% | |||||||||||||||
Net investment income | 2.60% | 2.88% | 2.57% | 3.63% | 2.86% | |||||||||||||||
| Supplemental data | ||||||||||||||||||||
Net assets, end of year (000’s) | $15 | $6 | $5 | $233 | $13 | |||||||||||||||
Portfolio turnover rate | 169.38% | 194.81% | 205.14% | 158.66% | 251.81% | |||||||||||||||
aThe amount shown for a share outstanding throughout the period may not correlate with the Statement of Operations for the period due to the timing of sales and repurchases of the Fund’s shares in relation to income earned and/or fluctuating fair value of the investments of the Fund.
bBased on average daily shares outstanding.
cAmount rounds to less than $0.01 per share.
dIncludes dividend and/or interest expense on securities sold short and security borrowing fees, if any. See below for the ratios of such expenses to average net assets for the periods presented. See Note 1(f).
eBenefit of expense reduction rounds to less than 0.01%.
| franklintempleton.com | The accompanying notes are an integral part of these financial statements. | Annual Report | 13 | ||||||||
FRANKLIN ALTERNATIVE STRATEGIES FUNDS
FINANCIAL HIGHLIGHTS
Franklin K2 Long Short Credit Fund (continued)
| Year Ended May 31, | ||||||||||||||||||||
| 2022 | 2021 | 2020 | 2019 | 2018 | ||||||||||||||||
| Advisor Class | ||||||||||||||||||||
| Per share operating performance (for a share outstanding throughout the year) | ||||||||||||||||||||
Net asset value, beginning of year | $ | 10.91 | $ | 9.88 | $ | 10.46 | $ | 10.51 | $ | 10.50 | ||||||||||
|
| |||||||||||||||||||
| Income from investment operationsa: | ||||||||||||||||||||
Net investment incomeb | 0.28 | 0.30 | 0.26 | 0.38 | 0.30 | |||||||||||||||
Net realized and unrealized gains (losses) | (0.69 | ) | 1.02 | (0.53 | ) | (0.01 | ) | 0.09 | ||||||||||||
|
| |||||||||||||||||||
Total from investment operations | (0.41 | ) | 1.32 | (0.27 | ) | 0.37 | 0.39 | |||||||||||||
|
| |||||||||||||||||||
| Less distributions from: | ||||||||||||||||||||
Net investment income | (0.26 | ) | (0.28 | ) | (0.27 | ) | (0.33 | ) | (0.21 | ) | ||||||||||
Net realized gains | (0.14 | ) | (0.01 | ) | (0.04 | ) | (0.09 | ) | (0.17 | ) | ||||||||||
|
| |||||||||||||||||||
Total distributions | (0.40 | ) | (0.29 | ) | (0.31 | ) | (0.42 | ) | (0.38 | ) | ||||||||||
|
| |||||||||||||||||||
Net asset value, end of year | $ | 10.10 | $ | 10.91 | $ | 9.88 | $ | 10.46 | $ | 10.51 | ||||||||||
|
| |||||||||||||||||||
Total return | (3.99)% | 13.45% | (2.61)% | 3.60% | 3.75% | |||||||||||||||
| Ratios to average net assets | ||||||||||||||||||||
Expenses before waiver, payments by affiliates and expense reductionc | 2.42% | 2.65% | 2.96% | 3.03% | 3.37% | |||||||||||||||
Expenses net of waiver, payments by affiliates and expense reductionc | 1.91%d | 2.06%d | 2.46% | 2.57% | 2.84%d | |||||||||||||||
Expenses incurred in connection with securities sold short | 0.28% | 0.41% | 0.58% | 0.62% | 0.89% | |||||||||||||||
Net investment income | 2.61% | 2.81% | 2.52% | 3.61% | 2.85% | |||||||||||||||
| Supplemental data | ||||||||||||||||||||
Net assets, end of year (000’s) | $66,727 | $76,637 | $73,047 | $86,868 | $45,514 | |||||||||||||||
Portfolio turnover rate | 169.38% | 194.81% | 205.14% | 158.66% | 251.81% | |||||||||||||||
aThe amount shown for a share outstanding throughout the period may not correlate with the Statement of Operations for the period due to the timing of sales and repurchases of the Fund’s shares in relation to income earned and/or fluctuating fair value of the investments of the Fund.
bBased on average daily shares outstanding.
cIncludes dividend and/or interest expense on securities sold short and security borrowing fees, if any. See below for the ratios of such expenses to average net assets for the periods presented. See Note 1(f).
dBenefit of expense reduction rounds to less than 0.01%.
| 14 | Annual Report | The accompanying notes are an integral part of these financial statements. | franklintempleton.com | ||||||||
FRANKLIN ALTERNATIVE STRATEGIES FUNDS
Schedule of Investments, May 31, 2022
Franklin K2 Long Short Credit Fund
| Country | Shares/ Warrants/ Rights | Value | ||||||||||||||||
| Common Stocks and Other Equity Interests 2.0% | ||||||||||||||||||
| Aerospace & Defense 0.0%† | ||||||||||||||||||
| a | Satellogic Inc., 1/25/27, wts. | United States | 603 | $ | 457 | |||||||||||||
|
| |||||||||||||||||
| Communications Equipment 0.0%† | ||||||||||||||||||
| a | Riverbed Technology Inc. | United States | 3,479 | 9,858 | ||||||||||||||
|
| |||||||||||||||||
| Diversified Financial Services 1.3% | ||||||||||||||||||
| a | 2MX Organic SA, 11/16/25, wts. | France | 1,165 | 216 | ||||||||||||||
| a | Aequi Acquisition Corp., A | United States | 3,993 | 39,331 | ||||||||||||||
| a | Aequi Acquisition Corp., A, 11/30/27, wts. | United States | 146 | 21 | ||||||||||||||
| a | African Gold Acquisition Corp., A | United States | 1,912 | 18,680 | ||||||||||||||
| a | African Gold Acquisition Corp., A, 3/13/28, wts. | United States | 1,393 | 153 | ||||||||||||||
| a | Agile Growth Corp., A | United States | 1,147 | 11,195 | ||||||||||||||
| a | Agile Growth Corp., A, 12/31/27, wts. | United States | 382 | 80 | ||||||||||||||
| a | Ares Acquisition Corp., A | United States | 2,110 | 20,699 | ||||||||||||||
| a | Ares Acquisition Corp., A, 12/31/27, wts. | United States | 566 | 136 | ||||||||||||||
| a | Blue Whale Acquisition Corp. I, A | United Arab Emirates | 3,792 | 36,555 | ||||||||||||||
| a | Blue Whale Acquisition Corp. I, A, 7/09/23, wts. | United Arab Emirates | 297 | 97 | ||||||||||||||
| a | Corsair Partnering Corp., A | United States | 1,149 | 11,186 | ||||||||||||||
| a | Crystal Peak Acquisition, 6/22/26, wts. | Netherlands | 802 | — | ||||||||||||||
| a | Crystal Peak Acquisition, A | Netherlands | 1,993 | 19,531 | ||||||||||||||
| a | DHC Acquisition Corp., A | United States | 1,838 | 17,939 | ||||||||||||||
| a | DHC Acquisition Corp., A, 12/31/27, wts. | United States | 71 | 9 | ||||||||||||||
| a | Disruptive Acquisition Corp. I, A | United States | 2,007 | 19,588 | ||||||||||||||
| a | Dragoneer Growth Opportunities Corp. III, A | United States | 3,050 | 29,707 | ||||||||||||||
| a | Elliott Opportunity II Corp., A | United States | 1,335 | 12,950 | ||||||||||||||
| a | Elliott Opportunity II Corp., A, 2/19/23, wts. | United States | 333 | 117 | ||||||||||||||
| a | European Biotech Acquisition Corp., A | Netherlands | 361 | 3,532 | ||||||||||||||
| a | Executive Network Partnering Corp., A | United States | 6,280 | 62,737 | ||||||||||||||
| a | Executive Network Partnering Corp., A, 9/25/28, wts. | United States | 925 | 851 | ||||||||||||||
| a | Far Peak Acquisition Corp., A | United States | 7,608 | 74,711 | ||||||||||||||
| a | Fast Acquisition Corp. II, A | United States | 213 | 2,081 | ||||||||||||||
| a | Fast Acquisition Corp. II, A, 3/16/26, wts. | United States | 53 | 7 | ||||||||||||||
| a | Figure Acquisition Corp. I, A | United States | 409 | 4,002 | ||||||||||||||
| a | Figure Acquisition Corp. I, A, 12/31/27, wts. | United States | 345 | 98 | ||||||||||||||
| a | Forum Merger IV Corp., A | United States | 849 | 8,295 | ||||||||||||||
| a | Forum Merger IV Corp., A, 12/31/27, wts. | United States | 206 | 56 | ||||||||||||||
| a | Freedom Acquisition I Corp., A | United States | 573 | 5,615 | ||||||||||||||
| a | FTAC Hera Acquisition Corp., A | United States | 1,805 | 17,653 | ||||||||||||||
| a | Fusion Acquisition Corp. II, A | United States | 956 | 9,340 | ||||||||||||||
| a | Fusion Acquisition Corp. II, A, 12/31/27, wts. | United States | 318 | 41 | ||||||||||||||
| a | Glenfarne Merger Corp., A | United States | 361 | 3,527 | ||||||||||||||
| a | Glenfarne Merger Corp., A, 12/31/27, wts. | United States | 95 | 17 | ||||||||||||||
| a | Gores Technology Partners II Inc., A | United States | 362 | 3,537 | ||||||||||||||
| a | Gores Technology Partners II Inc., A, 12/31/27, wts. | United States | 68 | 31 | ||||||||||||||
| a | Gores Technology Partners Inc., A | United States | 145 | 1,434 | ||||||||||||||
| a | Growth For Good Acquisition Corp. | United States | 1,760 | 17,107 | ||||||||||||||
| a | Growth For Good Acquisition Corp., Contingent Value, rts., 6/14/23 | United States | 1,518 | 167 | ||||||||||||||
| a | HCM Acquisition Corp. | United States | 3,990 | 39,541 | ||||||||||||||
| a | Healthcare AI Acquisition Corp. | Cayman Islands | 469 | 4,690 | ||||||||||||||
| a | Heartland Media Acquisition Corp. | United States | 3,991 | 39,950 | ||||||||||||||
| a | Hedosophia European Growth | United Kingdom | 1,142 | 11,414 | ||||||||||||||
| a | ION Acquisition Corp. III Ltd., A | Israel | 796 | 7,793 | ||||||||||||||
Iron Spark I Inc., A | United States | 1,578 | 15,591 | |||||||||||||||
| a | Jackson Acquisition Co., A | United States | 1,761 | 17,214 | ||||||||||||||
| a | Jackson Acquisition Co., A, 12/31/28, wts. | United States | 880 | 187 | ||||||||||||||
| a | JOFF Fintech Acquisition Corp., A | United States | 1,575 | 15,403 | ||||||||||||||
| a | Khosla Ventures Acquisition Co. III, A | United States | 3,158 | 30,759 | ||||||||||||||
| a | Knightswan Acquisition Corp. | United States | 4,639 | 46,297 | ||||||||||||||
| a | L Catterton Asia Acquisition Corp., A | Singapore | 668 | 6,540 | ||||||||||||||
| franklintempleton.com | Annual Report | 15 | ||||||||
FRANKLIN ALTERNATIVE STRATEGIES FUNDS
SCHEDULE OF INVESTMENTS
Franklin K2 Long Short Credit Fund (continued)
| Country | Shares/ Warrants/ Rights | Value | ||||||||||||||||
| Common Stocks and Other Equity Interests (continued) | ||||||||||||||||||
| Diversified Financial Services (continued) | ||||||||||||||||||
| a | Landcadia Holdings IV Inc., A | United States | 1,374 | $ | 13,383 | |||||||||||||
| a | Landcadia Holdings IV Inc., A, 12/31/28, wts. | United States | 343 | 130 | ||||||||||||||
| a | LDH Growth Corp. I, A | United States | 180 | 1,759 | ||||||||||||||
| a | LDH Growth Corp. I, A, 12/31/28, wts. | United States | 28 | 7 | ||||||||||||||
| a | Lead Edge Growth Opportunities Ltd., A | United States | 1,379 | 13,473 | ||||||||||||||
| a | Lead Edge Growth Opportunities Ltd., A, 12/31/28, wts. | United States | 344 | 49 | ||||||||||||||
| a | Lerer Hippeau Acquisition Corp., A | United States | 2,839 | 27,680 | ||||||||||||||
| a | Live Oak Mobility Acquisition Corp., A | United States | 757 | 7,426 | ||||||||||||||
| a | MDH Acquisition Corp., A | United States | 1,367 | 13,410 | ||||||||||||||
| a | MDH Acquisition Corp., A, 2/02/28, wts. | United States | 357 | 34 | ||||||||||||||
| a | The Music Acquisition Corp., A | United States | 1,590 | 15,614 | ||||||||||||||
| a | The Music Acquisition Corp., A, 2/05/28, wts. | United States | 795 | 119 | ||||||||||||||
| a | Nightdragon Acquisition Corp., A | United States | 367 | 3,582 | ||||||||||||||
| a | Obotech Acquisition SE, A | Luxembourg | 1,240 | 12,846 | ||||||||||||||
| a | Obotech Acquisition SE, A, 4/30/26, wts. | Luxembourg | 413 | 67 | ||||||||||||||
| a | Pegasus Acquisition Co. Europe BV, A | Netherlands | 1,768 | 18,601 | ||||||||||||||
| a | Peridot Acquisition Corp. II, A | United States | 735 | 7,188 | ||||||||||||||
| a | Pershing Square Tontine Holdings Ltd., A | United States | 1,378 | 27,367 | ||||||||||||||
| a | Pioneer Merger Corp., A | United States | 597 | 5,863 | ||||||||||||||
| a | Population Health Investment Co. Inc., A | United States | 342 | 3,376 | ||||||||||||||
| a | Powered Brands, A | United States | 1,065 | 10,469 | ||||||||||||||
| a | PWP Forward Acquisition Corp. I, A | United States | 1,807 | 17,636 | ||||||||||||||
| a | Silver Crest Acquisition Corp., A | United States | 857 | 8,407 | ||||||||||||||
| a | Southport Acquisition Corp. | United States | 2,933 | 29,213 | ||||||||||||||
| a | Southport Acquisition Corp., 5/24/28, wts. | United States | 1,466 | 248 | ||||||||||||||
| a | Spree Acquisition Corp. 1 Ltd. | Israel | 1,818 | 18,089 | ||||||||||||||
| a | Spree Acquisition Corp. 1 Ltd., 12/22/28, wts. | Israel | 909 | 147 | ||||||||||||||
| a | Supernova Partners Acquisition Co. III Ltd., A | United States | 2,530 | 24,743 | ||||||||||||||
| a | SVF Investment Corp. 2, A | United States | 72 | 703 | ||||||||||||||
| a | Target Global Acquisition I Corp., A | Israel | 3,131 | 30,934 | ||||||||||||||
| a | Target Global Acquisition I Corp., A, 12/31/27, wts. | Israel | 1,043 | 285 | ||||||||||||||
| a | TCV Acquisition Corp., A | United States | 500 | 4,855 | ||||||||||||||
| a | TCW Special Purpose Acquisition Corp., A | United States | 1,838 | 17,921 | ||||||||||||||
| a | TCW Special Purpose Acquisition Corp., A, 12/31/28, wts. | United States | 612 | 110 | ||||||||||||||
| a | Tech And Energy Transition Corp., A | United States | 2,499 | 24,515 | ||||||||||||||
| a | Tekkorp Digital Acquisition Corp., 10/26/27, wts. | United States | 433 | 67 | ||||||||||||||
| a | Tishman Speyer Innovation Corp. II, A | United States | 113 | 1,105 | ||||||||||||||
| a | TPG Pace Beneficial II Corp., A | United States | 83 | 810 | ||||||||||||||
| a | Twelve Seas Investment Co. II, A | United States | 3,059 | 29,856 | ||||||||||||||
| a | Twin Ridge Capital Acquisition Corp., A | United States | 2,202 | 21,580 | ||||||||||||||
| a | Waldencast Acquisition Corp., A | United States | 82 | 807 | ||||||||||||||
| a | Zimmer Energy Transition Acquisition Corp., A | United States | 2,110 | 20,541 | ||||||||||||||
| a | Zimmer Energy Transition Acquisition Corp., A, 5/14/23, wts. | United States | 703 | 176 | ||||||||||||||
|
| |||||||||||||||||
| 1,123,599 | ||||||||||||||||||
|
| |||||||||||||||||
| Diversified Telecommunication Services 0.1% | ||||||||||||||||||
BT Group PLC, A | United Kingdom | 314 | 740 | |||||||||||||||
| a | IHS Holding Ltd. | Nigeria | 18 | 211 | ||||||||||||||
| a | Liberty Global PLC, C | United Kingdom | 3,431 | 87,182 | ||||||||||||||
Telecom Italia SpA | Italy | 61,000 | 19,508 | |||||||||||||||
|
| |||||||||||||||||
| 107,641 | ||||||||||||||||||
|
| |||||||||||||||||
| Hotels, Restaurants & Leisure 0.0%† | ||||||||||||||||||
| a | HomeToGo SE, 12/31/25, wts. | Luxembourg | 210 | 45 | ||||||||||||||
|
| |||||||||||||||||
| Independent Power & Renewable Electricity Producers 0.5% | ||||||||||||||||||
| b | Clearway Energy Inc., A | United States | 12,396 | 403,614 | ||||||||||||||
|
| |||||||||||||||||
| 16 | Annual Report | franklintempleton.com | ||||||||
FRANKLIN ALTERNATIVE STRATEGIES FUNDS
SCHEDULE OF INVESTMENTS
Franklin K2 Long Short Credit Fund (continued)
| Country | Shares/ Warrants/ Rights | Value | ||||||||||||||||
| Common Stocks and Other Equity Interests (continued) | ||||||||||||||||||
| Internet & Direct Marketing Retail 0.1% | ||||||||||||||||||
| a | THG PLC, B | United Kingdom | 23,394 | $ | 43,329 | |||||||||||||
|
| |||||||||||||||||
| Oil, Gas & Consumable Fuels 0.0%† | ||||||||||||||||||
| a,c | Bighorn Permian Resources LLC, A, 2/01/24, wts. | United States | 1,346 | 34,334 | ||||||||||||||
|
| |||||||||||||||||
| Professional Services 0.0%† | ||||||||||||||||||
| a,c,d | Acosta Inc. | United States | 923 | 7,476 | ||||||||||||||
|
| |||||||||||||||||
| Textiles, Apparel & Luxury Goods 0.0%† | ||||||||||||||||||
| a | Ermenegildo Zegna Holditalia SpA, 10/30/27, wts. | Italy | 580 | 1,021 | ||||||||||||||
|
| |||||||||||||||||
Total Common Stocks and Other Equity Interests | 1,731,374 | |||||||||||||||||
|
| |||||||||||||||||
| Convertible Preferred Stocks (Cost $50,262) 0.0%† | ||||||||||||||||||
| Professional Services 0.0%† | ||||||||||||||||||
| c,d | Acosta Inc., cvt. pfd. | United States | 993 | 46,175 | ||||||||||||||
|
| |||||||||||||||||
| Preferred Stocks 0.2% | ||||||||||||||||||
| Communications Equipment 0.0%† | ||||||||||||||||||
| a | Riverbed Technology Inc., pfd., A | United States | 2,381 | 21,072 | ||||||||||||||
|
| |||||||||||||||||
| Thrifts & Mortgage Finance 0.2% | ||||||||||||||||||
FHLMC, pfd., | United States | 9,100 | 47,456 | |||||||||||||||
Z, 8.375% | United States | 2,420 | 8,276 | |||||||||||||||
FNMA, pfd., | United States | 8,600 | 51,170 | |||||||||||||||
S, 8.25% | United States | 4,475 | 16,379 | |||||||||||||||
|
| |||||||||||||||||
| 123,281 | ||||||||||||||||||
|
| |||||||||||||||||
Total Preferred Stocks (Cost $171,500) | 144,353 | |||||||||||||||||
|
| |||||||||||||||||
| Principal Amount* | ||||||||||||||||||
| Convertible Bonds 2.8% | ||||||||||||||||||
| Airlines 0.2% | ||||||||||||||||||
| e | Air France-KLM, senior note, Reg S, 0.125%, 3/25/26 | France | 9,222 | EUR | 162,902 | |||||||||||||
|
| |||||||||||||||||
| Diversified Consumer Services 0.4% | ||||||||||||||||||
Chegg Inc., senior note, zero cpn., 9/01/26 | United States | 401,000 | 312,780 | |||||||||||||||
|
| |||||||||||||||||
| Health Care Equipment & Supplies 0.0%† | ||||||||||||||||||
Haemonetics Corp., senior note, zero cpn., 3/01/26 | United States | 25,000 | 20,125 | |||||||||||||||
|
| |||||||||||||||||
| Hotels, Restaurants & Leisure 0.0%† | ||||||||||||||||||
Shake Shack Inc., senior note, zero cpn., 3/01/28 | United States | 51,000 | 35,394 | |||||||||||||||
|
| |||||||||||||||||
| Internet & Direct Marketing Retail 0.4% | ||||||||||||||||||
| e | Just Eat Takeaway.Com NV, B, senior note, Reg S, 0.625%, 2/09/28 | United Kingdom | 300,000 | EUR | 207,782 | |||||||||||||
The Realreal Inc., senior note, 1.00%, 3/01/28 | United States | 91,000 | 50,845 | |||||||||||||||
Wayfair Inc., A, senior note, 0.625%, 10/01/25 | United States | 85,000 | 61,242 | |||||||||||||||
|
| |||||||||||||||||
| 319,869 | ||||||||||||||||||
|
| |||||||||||||||||
| Leisure Products 0.1% | ||||||||||||||||||
Peloton Interactive Inc., senior note, zero cpn., 2/15/26 | United States | 144,000 | 98,275 | |||||||||||||||
|
| |||||||||||||||||
| Real Estate Management & Development 0.0%† | ||||||||||||||||||
| e | Realogy Group LLC / Realogy Co.-Issuer Corp., senior note, 144A, 0.25%, 6/15/26 | United States | 37,000 | 29,948 | ||||||||||||||
|
| |||||||||||||||||
| Specialty Retail 1.7% | ||||||||||||||||||
| e | Dufry One BV, senior note, Reg S, 0.75%, 3/30/26 | Switzerland | 1,600,000 | CHF | 1,439,974 | |||||||||||||
|
| |||||||||||||||||
Total Convertible Bonds (Cost $2,787,211) | 2,419,267 | |||||||||||||||||
|
| |||||||||||||||||
| franklintempleton.com | Annual Report | 17 | ||||||||
FRANKLIN ALTERNATIVE STRATEGIES FUNDS
SCHEDULE OF INVESTMENTS
Franklin K2 Long Short Credit Fund (continued)
| Country | Principal Amount* | Value | ||||||||||||||||
| Corporate Bonds and Notes 29.7% | ||||||||||||||||||
| Aerospace & Defense 0.1% | ||||||||||||||||||
Spirit Aerosystems Inc., senior note, 3.95%, 6/15/23 | United States | 91,000 | $ | 88,018 | ||||||||||||||
|
| |||||||||||||||||
| Airlines 0.5% | ||||||||||||||||||
| e | American Airlines Group Inc., senior note, 144A, 3.75%, 3/01/25 | United States | 499,000 | 446,722 | ||||||||||||||
|
| |||||||||||||||||
| Automobiles 0.9% | ||||||||||||||||||
| e | Aston Martin Capital Holdings Ltd., senior secured note, 144A, 10.50%, 11/30/25 | United Kingdom | 400,000 | 394,120 | ||||||||||||||
Ford Motor Credit Co. LLC, senior note, 5.125%, 6/16/25 | United States | 248,000 | 248,620 | |||||||||||||||
| e | Frontier Communications Holdings LLC, senior secured note, 144A, 8.75%, 5/15/30 | United States | 159,000 | 167,900 | ||||||||||||||
|
| |||||||||||||||||
| 810,640 | ||||||||||||||||||
|
| |||||||||||||||||
| Capital Markets 0.5% | ||||||||||||||||||
| e | Coinbase Global Inc., 144A, | |||||||||||||||||
senior bond, 3.625%, 10/01/31 | United States | 280,000 | 189,582 | |||||||||||||||
senior note, 3.375%, 10/01/28 | United States | 220,000 | 161,259 | |||||||||||||||
| e | Owl Rock Core Income Corp., senior note, 144A, 5.50%, 3/21/25 | United States | 47,000 | 46,105 | ||||||||||||||
|
| |||||||||||||||||
| 396,946 | ||||||||||||||||||
|
| |||||||||||||||||
| Chemicals 0.5% | ||||||||||||||||||
| e | Polar US Borrower LLC / Schenectady International Group Inc., senior note, 144A, 6.75%, 5/15/26 | United States | 500,000 | 402,266 | ||||||||||||||
|
| |||||||||||||||||
| Commercial Services & Supplies 0.2% | ||||||||||||||||||
| e | Verscend Escrow Corp., senior note, 144A, 9.75%, 8/15/26 | United States | 138,000 | 142,328 | ||||||||||||||
|
| |||||||||||||||||
| Communications Equipment 0.5% | ||||||||||||||||||
| e | Audacy Capital Corp., secured note, 144A, 6.75%, 3/31/29 | United States | 636,000 | 397,879 | ||||||||||||||
|
| |||||||||||||||||
| Construction & Engineering 0.4% | ||||||||||||||||||
| e | Artera Services LLC, senior secured note, 144A, 9.033%, 12/04/25 | United States | 448,000 | 354,706 | ||||||||||||||
|
| |||||||||||||||||
| Construction Materials 0.4% | ||||||||||||||||||
| e | SRM Escrow Issuer LLC, senior secured note, 144A, 6.00%, 11/01/28 | United States | 354,000 | 331,114 | ||||||||||||||
|
| |||||||||||||||||
| Diversified Consumer Services 0.8% | ||||||||||||||||||
| e | Adtalem Global Education Inc., senior secured note, 144A, 5.50%, 3/01/28 | United States | 232,000 | 215,619 | ||||||||||||||
| e | The Hertz Corp., senior note, 144A, 5.00%, 12/01/29 | United States | 95,000 | 83,542 | ||||||||||||||
| e | Paysafe Finance PLC / Paysafe Holdings US Corp., senior secured note, 144A, 4.00%, 6/15/29 | United States | 129,000 | 100,903 | ||||||||||||||
| e | Sotheby’s/Bidfair Holdings Inc., senior secured note, 144A, 5.875%, 6/01/29 | United States | 200,000 | 176,366 | ||||||||||||||
| e | Verisure Midholding AB, senior note, Reg S, 5.25%, 2/15/29 | Sweden | 103,000 | EUR | 93,455 | |||||||||||||
|
| |||||||||||||||||
| 669,885 | ||||||||||||||||||
|
| |||||||||||||||||
| Diversified Financial Services 3.0% | ||||||||||||||||||
| e | AG Issuer LLC, senior secured note, 144A, 6.25%, 3/01/28 | United States | 72,000 | 67,546 | ||||||||||||||
| e | Condor Merger Sub Inc., senior note, 144A, 7.375%, 2/15/30 | United States | 417,000 | 365,817 | ||||||||||||||
| e | Finance of America Funding LLC, senior note, 144A, 7.875%, 11/15/25 | United States | 500,000 | 432,159 | ||||||||||||||
| e | Jane Street Group / JSG Finance Inc., senior secured note, 144A, 4.50%, 11/15/29 | United States | 521,000 | 488,294 | ||||||||||||||
| e | Mozart Debt Merger Sub Inc., senior secured note, 144A, 3.875%, 4/01/29 | United States | 125,000 | 113,006 | ||||||||||||||
| e | MPH Acquisition Holdings LLC, senior note, 144A, 5.75%, 11/01/28 | United States | 400,000 | 356,688 | ||||||||||||||
| e | Vistajet Malta Finance PLC / XO Management Holding Inc., senior note, 144A, 6.375%, 2/01/30 | Switzerland | 355,000 | 302,354 | ||||||||||||||
| e | WMG Acquisition Corp., senior secured bond, 144A, 3.00%, 2/15/31 | United States | 543,000 | 466,166 | ||||||||||||||
|
| |||||||||||||||||
| 2,592,030 | ||||||||||||||||||
|
| |||||||||||||||||
| 18 | Annual Report | franklintempleton.com | ||||||||
FRANKLIN ALTERNATIVE STRATEGIES FUNDS
SCHEDULE OF INVESTMENTS
Franklin K2 Long Short Credit Fund (continued)
| Country | Principal Amount* | Value | ||||||||||||||||
| Corporate Bonds and Notes (continued) | ||||||||||||||||||
| Diversified Telecommunication Services 0.8% | ||||||||||||||||||
| e | Altice France SA, senior secured note, Reg S, 3.375%, 1/15/28 | France | 401,000 | EUR | $ | 362,398 | ||||||||||||
| e | Iliad SA, senior note, Reg S, 1.875%, 2/11/28 | France | 100,000 | EUR | 91,959 | |||||||||||||
| e | Kaixo Bondco Telecom SA, senior note, Reg S, 5.125%, 9/30/29 | Spain | 100,000 | EUR | 90,730 | |||||||||||||
| e | VMED O2 UK Financing I PLC, senior secured bond, Reg S, 4.50%, 7/15/31 | United Kingdom | 148,000 | GBP | 161,756 | |||||||||||||
|
| |||||||||||||||||
| 706,843 | ||||||||||||||||||
|
| |||||||||||||||||
| Electric Utilities 0.9% | ||||||||||||||||||
| e | EP Infrastructure AS, senior note, Reg S, 1.698%, 7/30/26 | Czech Republic | 100,000 | EUR | 83,800 | |||||||||||||
| e | Eskom Holdings SOC Ltd., senior bond, Reg S, 8.45%, 8/10/28 | South Africa | 600,000 | 575,700 | ||||||||||||||
FirstEnergy Corp., C, senior bond, 3.40%, 3/01/50 | United States | 36,000 | 26,773 | |||||||||||||||
Pacific Gas and Electric Co., secured bond, 4.50%, 7/01/40 | United States | 131,000 | 106,919 | |||||||||||||||
|
| |||||||||||||||||
| 793,192 | ||||||||||||||||||
|
| |||||||||||||||||
| Energy Equipment & Services 0.3% | ||||||||||||||||||
| e | Solaris Midstream Holdings LLC, senior note, 144A, 7.625%, 4/01/26 | United States | 264,000 | 264,487 | ||||||||||||||
|
| |||||||||||||||||
| Entertainment 0.2% | ||||||||||||||||||
| e,f | AMC Entertainment Holdings Inc., secured note, 144A, PIK, 10.00% (cash), 6/15/26 | United States | 242,000 | 185,865 | ||||||||||||||
|
| |||||||||||||||||
| Equity Real Estate Investment Trusts (REITs) 0.7% | ||||||||||||||||||
| e | Brookfield Property REIT Inc. / BPR Cumulus LLC / BPR Nimbus LLC / GGSI Sellco LL, senior secured note, 144A, 4.50%, 4/01/27 | United States | 266,000 | 248,707 | ||||||||||||||
Service Properties Trust, senior bond, 4.50%, 6/15/23 | United States | 124,000 | 120,520 | |||||||||||||||
| e | Uniti Group LP / Uniti Fiber Holdings Inc. / CSL Capital LLC, senior note, 144A, 6.00%, 1/15/30 | United States | 241,000 | 192,952 | ||||||||||||||
Vici Properties LP, senior bond, | United States | 49,000 | 48,649 | |||||||||||||||
5.625%, 5/15/52 | United States | 37,000 | 36,282 | |||||||||||||||
|
| |||||||||||||||||
| 647,110 | ||||||||||||||||||
|
| |||||||||||||||||
| Food Products 0.1% | ||||||||||||||||||
| e | Darling Ingredients Inc., senior note, 144A, 6.00%, 6/15/30 | United States | 62,000 | 62,000 | ||||||||||||||
|
| |||||||||||||||||
| Gas Utilities 0.1% | ||||||||||||||||||
| e | Eustream AS, senior note, Reg S, 1.625%, 6/25/27 | Slovak Republic | 100,000 | EUR | 83,821 | |||||||||||||
|
| |||||||||||||||||
| Health Care Providers & Services 1.4% | ||||||||||||||||||
Encompass Health Corp., senior bond, 4.625%, 4/01/31 | United States | 168,000 | 149,207 | |||||||||||||||
| e | Global Medical Response Inc., senior secured note, 144A, 6.50%, 10/01/25 | United States | 236,000 | 227,004 | ||||||||||||||
HCA Inc., senior secured bond, 3.50%, 7/15/51 | United States | 60,000 | 44,952 | |||||||||||||||
| e | LifePoint Health Inc., senior note, 144A, 5.375%, 1/15/29 | United States | 187,000 | 157,910 | ||||||||||||||
| e | RP Escrow Issuer LLC, senior secured note, 144A, 5.25%, 12/15/25 | United States | 283,000 | 258,447 | ||||||||||||||
| e | Tenet Healthcare Corp., senior secured note, 144A, 4.875%, 1/01/26 | United States | 365,000 | 364,646 | ||||||||||||||
|
| |||||||||||||||||
| 1,202,166 | ||||||||||||||||||
|
| |||||||||||||||||
| Hotels, Restaurants & Leisure 0.9% | ||||||||||||||||||
| e | Caesars Entertainment Inc., senior secured note, 144A, 6.25%, 7/01/25 | United States | 138,000 | 139,963 | ||||||||||||||
| e | International Game Technology PLC, senior bond, 144A, 6.50%, 2/15/25 | United States | 243,000 | 249,979 | ||||||||||||||
| e | Station Casinos LLC, senior bond, 144A, 4.625%, 12/01/31 | United States | 494,000 | 419,370 | ||||||||||||||
|
| |||||||||||||||||
| 809,312 | ||||||||||||||||||
|
| |||||||||||||||||
| Household Durables 0.8% | ||||||||||||||||||
| e | K. Hovnanian Enterprises Inc., 144A, | |||||||||||||||||
senior secured note, 7.75%, 2/15/26 | United States | 446,000 | 449,946 | |||||||||||||||
senior secured note, 10.50%, 2/15/26 | United States | 250,000 | 253,671 | |||||||||||||||
|
| |||||||||||||||||
| 703,617 | ||||||||||||||||||
|
| |||||||||||||||||
| franklintempleton.com | Annual Report | 19 | ||||||||
FRANKLIN ALTERNATIVE STRATEGIES FUNDS
SCHEDULE OF INVESTMENTS
Franklin K2 Long Short Credit Fund (continued)
| Country | Principal Amount* | Value | ||||||||||||||||
| Corporate Bonds and Notes (continued) | ||||||||||||||||||
| Household Products 0.4% | ||||||||||||||||||
| e | Spectrum Brands Inc., senior bond, 144A, 3.875%, 3/15/31 | United States | 430,000 | $ | 368,742 | |||||||||||||
|
| |||||||||||||||||
| Interactive Media & Services 0.6% | ||||||||||||||||||
| e | Twitter Inc., senior note, 144A, 3.875%, 12/15/27 | United States | 124,000 | 119,645 | ||||||||||||||
| e | ZipRecruiter Inc., senior note, 144A, 5.00%, 1/15/30 | United States | 464,000 | 438,582 | ||||||||||||||
|
| |||||||||||||||||
| 558,227 | ||||||||||||||||||
|
| |||||||||||||||||
| Internet & Direct Marketing Retail 1.0% | ||||||||||||||||||
Amazon.com Inc., senior bond, | United States | 258,000 | 192,712 | |||||||||||||||
2.70%, 6/03/60 | United States | 29,000 | 21,021 | |||||||||||||||
| e | Arches Buyer Inc., senior note, 144A, 6.125%, 12/01/28 | United States | 502,000 | 422,421 | ||||||||||||||
| e | Prosus NV, Reg S, | China | 127,000 | EUR | 98,971 | |||||||||||||
senior note, 3.257%, 1/19/27 | China | 100,000 | 89,208 | |||||||||||||||
|
| |||||||||||||||||
| 824,333 | ||||||||||||||||||
|
| |||||||||||||||||
| IT Services 0.7% | ||||||||||||||||||
| e | CA Magnum Holdings, senior secured note, 144A, 5.375%, 10/31/26 | India | 31,000 | 28,675 | ||||||||||||||
| e | Hurricane Finance PLC, senior secured note, Reg S, 8.00%, 10/15/25 | United Kingdom | 234,000 | GBP | 294,893 | |||||||||||||
| e | Virtusa Corp., senior note, 144A, 7.125%, 12/15/28 | United States | 286,000 | 241,278 | ||||||||||||||
|
| |||||||||||||||||
| 564,846 | ||||||||||||||||||
|
| |||||||||||||||||
| Leisure Products 0.0%† | ||||||||||||||||||
| e | NCL Corp. Ltd., senior secured note, 144A, 5.875%, 2/15/27 | United States | 27,000 | 25,199 | ||||||||||||||
|
| |||||||||||||||||
| Machinery 0.2% | ||||||||||||||||||
| e | TK Elevator US Newco Inc., senior secured note, 144A, 5.25%, 7/15/27 | Germany | 200,000 | 195,274 | ||||||||||||||
|
| |||||||||||||||||
| Marine 0.1% | ||||||||||||||||||
| e | Stena International SA, senior secured bond, 144A, 5.75%, 3/01/24 | Sweden | 100,000 | 97,011 | ||||||||||||||
|
| |||||||||||||||||
| Media 2.1% | ||||||||||||||||||
| e | Advantage Sales & Marketing Inc., senior secured note, 144A, 6.50%, 11/15/28 | United States | 39,000 | 34,804 | ||||||||||||||
Charter Communications Operating LLC / Charter Communications Operating Capital, senior secured bond, 3.95%, 6/30/62 | United States | 196,000 | 141,223 | |||||||||||||||
CSC Holdings LLC, senior bond, | United States | 4,000 | 3,440 | |||||||||||||||
e 144A, 3.375%, 2/15/31 | United States | 14,000 | 11,379 | |||||||||||||||
e 144A, 4.50%, 11/15/31 | United States | 52,000 | 44,689 | |||||||||||||||
5.25%, 6/01/24 | United States | 173,000 | 171,189 | |||||||||||||||
DISH DBS Corp., | United States | 29,000 | 28,472 | |||||||||||||||
e senior secured note, 144A, 5.75%, 12/01/28 | United States | 317,000 | 259,339 | |||||||||||||||
| e | iHeartCommunications Inc., senior secured note, 144A, 4.75%, 1/15/28 | United States | 74,000 | 66,827 | ||||||||||||||
Liberty Interactive LLC, senior bond, 8.25%, 2/01/30 | United States | 360,000 | 260,591 | |||||||||||||||
| e | Spanish Broadcasting System Inc., senior secured note, 144A, 9.75%, 3/01/26 | United States | 259,000 | 241,115 | ||||||||||||||
| e | Urban One Inc., senior secured note, 144A, 7.375%, 2/01/28 | United States | 506,000 | 478,572 | ||||||||||||||
| e | VZ Secured Financing BV, senior secured note, Reg S, 3.50%, 1/15/32 | Netherlands | 100,000 | EUR | 90,665 | |||||||||||||
|
| |||||||||||||||||
| 1,832,305 | ||||||||||||||||||
|
| |||||||||||||||||
| Metals & Mining 0.4% | ||||||||||||||||||
| e | Taseko Mines Ltd., senior secured note, 144A, 7.00%, 2/15/26 | Canada | 387,000 | 372,404 | ||||||||||||||
|
| |||||||||||||||||
| Mortgage Real Estate Investment Trusts (REITs) 0.8% | ||||||||||||||||||
| e | Apollo Commercial Real Estate Finance Inc., senior secured note, 144A, 4.625%, 6/15/29 | United States | 355,000 | 301,519 | ||||||||||||||
| e | New Residential Investment Corp., senior note, 144A, 6.25%, 10/15/25 | United States | 420,000 | 395,575 | ||||||||||||||
|
| |||||||||||||||||
| 697,094 | ||||||||||||||||||
|
| |||||||||||||||||
| 20 | Annual Report | franklintempleton.com | ||||||||
FRANKLIN ALTERNATIVE STRATEGIES FUNDS
SCHEDULE OF INVESTMENTS
Franklin K2 Long Short Credit Fund (continued)
| Country | Principal Amount* | Value | ||||||||||||||||
| Corporate Bonds and Notes (continued) | ||||||||||||||||||
| Multiline Retail 0.2% | ||||||||||||||||||
Kohl’s Corp., senior bond, 5.55%, 7/17/45 | United States | 156,000 | $ | 142,807 | ||||||||||||||
|
| |||||||||||||||||
| Oil, Gas & Consumable Fuels 5.2% | ||||||||||||||||||
Energy Transfer LP, | ||||||||||||||||||
senior bond, 6.125%, 12/15/45 | United States | 101,000 | 101,201 | |||||||||||||||
senior bond, 6.00%, 6/15/48 | United States | 51,000 | 50,542 | |||||||||||||||
senior bond, 6.25%, 4/15/49 | United States | 80,000 | 81,818 | |||||||||||||||
g junior sub. note, H, 6.50% to 11/15/26, FRN thereafter, Perpetual | United States | 62,000 | 58,040 | |||||||||||||||
| e | EQM Midstream Partners LP, senior note, 144A, | United States | 62,000 | 62,000 | ||||||||||||||
7.50%, 6/01/30 | United States | 62,000 | 62,000 | |||||||||||||||
| e | Laredo Petroleum Inc., senior note, 144A, 7.75%, 7/31/29 | United States | 500,000 | 493,415 | ||||||||||||||
| e | MC Brazil Downstream Trading SARL, senior secured note, Reg S, 7.25%, 6/30/31 | Brazil | 271,000 | 241,998 | ||||||||||||||
| e | Moss Creek Resources Holdings Inc., senior note, 144A, | United States | 379,000 | 342,849 | ||||||||||||||
10.50%, 5/15/27 | United States | 858,000 | 834,950 | |||||||||||||||
| e | New Fortress Energy Inc., senior secured note, 144A, 6.75%, 9/15/25 | United States | 373,000 | 367,662 | ||||||||||||||
| e | NGL Energy Operating LLC / NGL Energy Finance Corp., senior secured note, 144A, 7.50%, 2/01/26 | United States | 354,000 | 332,318 | ||||||||||||||
| e | Northern Oil And Gas Inc., senior note, 144A, 8.125%, 3/01/28 | United States | 356,000 | 364,827 | ||||||||||||||
Petroleos Mexicanos, senior bond, | Mexico | 573,000 | 413,165 | |||||||||||||||
6.95%, 1/28/60 | Mexico | 579,000 | 412,372 | |||||||||||||||
| e | Venture Global Calcasieu Pass LLC, senior secured bond, 144A, 3.875%, 11/01/33 | United States | 381,000 | 346,348 | ||||||||||||||
|
| |||||||||||||||||
| 4,565,505 | ||||||||||||||||||
|
| |||||||||||||||||
| Pharmaceuticals 0.6% | ||||||||||||||||||
| e | Organon & Co. / Organon Foreign Debt Co.-Issuer BV, senior bond, 144A, 5.125%, 4/30/31 | United States | 355,000 | 341,785 | ||||||||||||||
| e | Par Pharmaceutical Inc., senior secured note, 144A, 7.50%, 4/01/27 | United States | 209,000 | 163,908 | ||||||||||||||
|
| |||||||||||||||||
| 505,693 | ||||||||||||||||||
|
| |||||||||||||||||
| Professional Services 0.2% | ||||||||||||||||||
| e | Corelogic Inc., senior secured note, 144A, 4.50%, 5/01/28 | United States | 239,000 | 205,815 | ||||||||||||||
|
| |||||||||||||||||
| Real Estate Management & Development 0.3% | ||||||||||||||||||
| e | Hunt Cos. Inc., senior secured note, 144A, 5.25%, 4/15/29 | United States | 252,000 | 238,073 | ||||||||||||||
|
| |||||||||||||||||
| Software 0.1% | ||||||||||||||||||
Microsoft Corp., senior bond, 2.675%, 6/01/60 | United States | 29,000 | 22,269 | |||||||||||||||
Oracle Corp., senior bond, | United States | 57,000 | 41,306 | |||||||||||||||
3.85%, 4/01/60 | United States | 18,000 | 12,954 | |||||||||||||||
|
| |||||||||||||||||
| 76,529 | ||||||||||||||||||
|
| |||||||||||||||||
| Specialty Retail 2.8% | ||||||||||||||||||
| e | Abercrombie & Fitch Management Co., senior secured note, 144A, 8.75%, 7/15/25 | United States | 124,000 | 127,272 | ||||||||||||||
| e | Carvana Co., senior note, 144A, | United States | 283,000 | 249,832 | ||||||||||||||
b10.25%, 5/01/30 | United States | 757,000 | 676,932 | |||||||||||||||
| e | Douglas GMBH, senior secured note, Reg S, 6.00%, 4/08/26 | Germany | 731,000 | EUR | 669,298 | |||||||||||||
| e | Fertitta Entertainment LLC / Fertitta Entertainment Finance Co. Inc., 144A, | United States | 30,000 | 26,050 | ||||||||||||||
senior secured note, 4.625%, 1/15/29 | United States | 46,000 | 41,939 | |||||||||||||||
| e | Guitar Center Inc., senior secured note, 144A, 8.50%, 1/15/26 | United States | 157,000 | 143,581 | ||||||||||||||
| franklintempleton.com | Annual Report | 21 | ||||||||
FRANKLIN ALTERNATIVE STRATEGIES FUNDS
SCHEDULE OF INVESTMENTS
Franklin K2 Long Short Credit Fund (continued)
| Country | Principal Amount* | Value | ||||||||||||||||
| Corporate Bonds and Notes (continued) | ||||||||||||||||||
| Specialty Retail (continued) | ||||||||||||||||||
| e | Staples Inc., 144A, | United States | 400,000 | $ | 328,714 | |||||||||||||
senior secured note, 7.50%, 4/15/26 | United States | 200,000 | 185,070 | |||||||||||||||
|
| |||||||||||||||||
| 2,448,688 | ||||||||||||||||||
|
| |||||||||||||||||
| Technology Hardware, Storage & Peripherals 0.0%† | ||||||||||||||||||
Apple Inc., senior bond, 2.55%, 8/20/60 | United States | 29,000 | 21,012 | |||||||||||||||
|
| |||||||||||||||||
Total Corporate Bonds and Notes | 25,830,504 | |||||||||||||||||
|
| |||||||||||||||||
| i,m | Senior Floating Rate Interests 2.4% | |||||||||||||||||
| Communications Equipment 0.1% | ||||||||||||||||||
| f | Riverbed Technology Inc., Exit Term Loan, PIK, 7.00% (cash), (1-Month USD LIBOR + 6.00%), 12/08/26 | United States | 87,283 | 62,644 | ||||||||||||||
|
| |||||||||||||||||
| Construction Materials 1.6% | ||||||||||||||||||
Oldcastle BuildingEnvelope Inc., Term Loan B, 6.109%, (1-Month SOFR + 4.50%), 4/30/29 | United States | 1,500,000 | 1,377,195 | |||||||||||||||
|
| |||||||||||||||||
| Consumer Discretionary Services 0.1% | ||||||||||||||||||
Travel Leaders Group LLC, Term Loan B, 5.06%, (1-Month USD LIBOR + 4.00%), 1/25/24 | United States | 141,520 | 128,075 | |||||||||||||||
|
| |||||||||||||||||
| Equity Real Estate Investment Trusts (REITs) 0.2% | ||||||||||||||||||
The GEO Group Inc., Term Loan B, 3.06%, (3-Month USD LIBOR + 2.00%), 3/22/24 | United States | 79,066 | 75,045 | |||||||||||||||
McCarthy & Stone PLC, Term Loan B, 7.00%, (1-Month USD LIBOR + 7.00%), 12/16/25 | United Kingdom | 50,969 | GBP | 61,818 | ||||||||||||||
|
| |||||||||||||||||
| 136,863 | ||||||||||||||||||
|
| |||||||||||||||||
| Food & Staples Retailing 0.1% | ||||||||||||||||||
| j | Upfield Group BV, Term Loan RC, 3.445%, (3-Month EURIBOR + 3.00%), 1/02/25 | Netherlands | 96,324 | 85,817 | ||||||||||||||
|
| |||||||||||||||||
| Machinery 0.1% | ||||||||||||||||||
SPX Flow Inc., Term Loan B, 5.634%, (1-Month SOFR + 4.60%), 4/05/29 | United States | 110,976 | 104,804 | |||||||||||||||
|
| |||||||||||||||||
| Media 0.1% | ||||||||||||||||||
Advantage Sales & Marketing Inc., Term Loan B1, 5.264%, (3-Month USD LIBOR + 4.50%), 10/28/27 | United States | 129,926 | 121,465 | |||||||||||||||
|
| |||||||||||||||||
| Pharmaceuticals 0.1% | ||||||||||||||||||
Bausch Health Cos. Inc., Term Loan B, 5.75%, (1-Month SOFR + 5.25%), 1/27/27 | United States | 85,156 | 78,197 | |||||||||||||||
|
| |||||||||||||||||
Total Senior Floating Rate Interests | 2,095,060 | |||||||||||||||||
|
| |||||||||||||||||
| Foreign Government and Agency Securities 10.7% | ||||||||||||||||||
| e | CBB International Sukuk Programme Co. Wll, senior note, 144A, 3.875%, 5/18/29 | Bahrain | 667,000 | 617,135 | ||||||||||||||
| e | Government of Angola, senior bond, Reg S, | Angola | 474,000 | 443,451 | ||||||||||||||
9.375%, 5/08/48 | Angola | 400,000 | 359,212 | |||||||||||||||
Government of Argentina, senior bond, 1.125%, 7/09/35 | Argentina | 1,932,156 | 526,918 | |||||||||||||||
| e | Government of Bahrain, senior bond, Reg S, 7.00%, 1/26/26 | Bahrain | 200,000 | 212,231 | ||||||||||||||
| e | Government of Dominican Republic, senior bond, Reg S, 5.875%, 1/30/60 | Dominican Republic | 150,000 | 117,386 | ||||||||||||||
| e | Government of Ecuador, senior bond, Reg S, 1.00%, 7/31/35 | Ecuador | 1,281,662 | 821,941 | ||||||||||||||
| e | Government of Egypt, senior bond, Reg S, | Egypt | 200,000 | 173,832 | ||||||||||||||
7.50%, 2/16/61 | Egypt | 731,000 | 495,479 | |||||||||||||||
| 22 | Annual Report | franklintempleton.com | ||||||||
FRANKLIN ALTERNATIVE STRATEGIES FUNDS
SCHEDULE OF INVESTMENTS
Franklin K2 Long Short Credit Fund (continued)
| Country | Principal Amount* | Value | ||||||||||||||||
| Foreign Government and Agency Securities (continued) | ||||||||||||||||||
| e | Government of Germany, senior bond, Reg S, zero cpn., 2/15/32 | Germany | 157,000 | EUR | $ | 151,207 | ||||||||||||
| e | Government of Ghana, senior note, Reg S, 7.75%, 4/07/29 | Ghana | 213,000 | 116,607 | ||||||||||||||
| e | Government of Iraq, senior bond, Reg S, 5.80%, 1/15/28 | Iraq | 375,000 | 356,985 | ||||||||||||||
| b | Government of Italy, senior note, 2.375%, 10/17/24 | Italy | 373,000 | 364,432 | ||||||||||||||
| e | Government of Jordan, senior note, 144A, 4.95%, 7/07/25 | Jordan | 200,000 | 191,046 | ||||||||||||||
Government of Mexico, senior bond, 8.50%, 11/18/38 | Mexico | 9,400,000 | k | MXN | 470,033 | |||||||||||||
| e | Government of Nigeria, Reg S, | Nigeria | 320,000 | 241,478 | ||||||||||||||
senior bond, 7.625%, 11/28/47 | Nigeria | 477,000 | 345,229 | |||||||||||||||
senior note, 6.125%, 9/28/28 | Nigeria | 200,000 | 163,830 | |||||||||||||||
| e | Government of Oman, senior bond, Reg S, | Oman | 416,000 | 429,002 | ||||||||||||||
6.75%, 1/17/48 | Oman | 616,000 | 577,500 | |||||||||||||||
| e | Government of Saudi Arabia, senior bond, 144A, 2.75%, 2/03/32 | Saudi Arabia | 221,000 | 206,649 | ||||||||||||||
Government of South Africa, senior bond, | South Africa | 7,542,838 | ZAR | 522,327 | ||||||||||||||
8.75%, 2/28/48 | South Africa | 5,692,511 | ZAR | 294,510 | ||||||||||||||
Government of Turkey, senior bond, 5.75%, 5/11/47 | Turkey | 952,000 | 656,185 | |||||||||||||||
| e | Government of Ukraine, Reg S, | Ukraine | 400,000 | 145,628 | ||||||||||||||
senior bond, 7.253%, 3/15/33 | Ukraine | 200,000 | 72,881 | |||||||||||||||
senior bond, 1.258%, 5/31/40 | Ukraine | 272,000 | 102,804 | |||||||||||||||
senior note, 6.876%, 5/21/29 | Ukraine | 400,000 | 146,008 | |||||||||||||||
|
| |||||||||||||||||
Total Foreign Government and Agency Securities | 9,321,926 | |||||||||||||||||
|
| |||||||||||||||||
| U.S. Government and Agency Securities 0.5% | ||||||||||||||||||
U.S. Treasury Bond, 2.25%, 2/15/52 | United States | 44,000 | 36,816 | |||||||||||||||
U.S. Treasury Note, | United States | 95,000 | 94,755 | |||||||||||||||
2.75%, 4/30/27 | United States | 25,000 | 24,911 | |||||||||||||||
1.875%, 2/15/32 | United States | 79,800 | 73,154 | |||||||||||||||
2.875%, 5/15/32 | United States | 188,000 | 188,264 | |||||||||||||||
|
| |||||||||||||||||
Total U.S. Government and Agency Securities | 417,900 | |||||||||||||||||
|
| |||||||||||||||||
| Asset-Backed Securities and Commercial Mortgage-Backed Securities 36.9% | ||||||||||||||||||
| Diversified Financial Services 16.9% | ||||||||||||||||||
| e,l | AMSR Trust, 2021-SFR1, G, 144A, FRN, 4.612%, 6/17/38 | United States | 500,000 | 442,342 | ||||||||||||||
| e,m | Arbor Realty Commercial Real Estate Notes Ltd., 2022-FL2, E, 144A, FRN, 5.70%, (SOFR + 5.00%), 5/15/37 | United States | 1,000,000 | 992,555 | ||||||||||||||
| e,m | Catskill Park CLO Ltd., 2017-1A, C, 144A, FRN, 4.763%, (3-Month USD LIBOR + 3.70%), 4/20/29 | United States | 1,000,000 | 980,461 | ||||||||||||||
CitiMortgage Alternative Loan Trust, 2007-A1, 2A1, 5.50%, 1/25/22 | United States | 14,211 | 12,552 | |||||||||||||||
| e | FRTKL, 2021-SFR1, G, 144A, 4.105%, 9/17/38 | United States | 990,000 | 863,452 | ||||||||||||||
| e,m | GSMSC Pass-Through Trust, 2009-4R, 2A3, 144A, FRN, 1.118%, (1-Month USD LIBOR + 0.45%), 12/26/36 | United States | 625,062 | 395,265 | ||||||||||||||
| e,m | KREF Ltd., 2021-FL2, C, 144A, FRN, 2.887%, (1-Month USD LIBOR + 2.00%), 2/15/39 | United States | 500,000 | 486,337 | ||||||||||||||
| e,m | Marathon CLO VI Ltd., 2018-6A, CR2, 144A, FRN, 4.922%, (3-Month USD LIBOR + 3.50%), 5/13/28 | United States | 980,000 | 943,833 | ||||||||||||||
| e,m | Mountain View CLO Ltd., 2018-1A, DRR, 144A, FRN, 4.694%, (3-Month USD LIBOR + 3.65%), 10/15/26 | United States | 1,290,000 | 1,290,381 | ||||||||||||||
| e,m | OCP CLO Ltd., 2021-8RA, C, 144A, FRN, 4.794%, (3-Month USD LIBOR + 3.75%), 1/17/32 | United States | 1,000,000 | 968,203 | ||||||||||||||
| m | Ramp Series Trust, 2003-RS9, MII3, FRN, 4.231%, (1-Month USD LIBOR + 2.15%), 10/25/33 | United States | 1,156,753 | 1,068,506 | ||||||||||||||
| franklintempleton.com | Annual Report | 23 | ||||||||
FRANKLIN ALTERNATIVE STRATEGIES FUNDS
SCHEDULE OF INVESTMENTS
Franklin K2 Long Short Credit Fund (continued)
| Country | Principal Amount* | Value | ||||||||||||||||
| Asset-Backed Securities and Commercial Mortgage-Backed Securities (continued) | ||||||||||||||||||
| Diversified Financial Services (continued) | ||||||||||||||||||
| e | S-Jets Ltd., 2017-1, A, 144A, 3.967%, 8/15/42 | Bermuda | 2,141,343 | $ | 1,915,552 | |||||||||||||
| e,m | Staniford Street CLO Ltd., 2014-1A, D, 144A, FRN, 4.326%, (3-Month USD LIBOR + 3.50%), 6/15/25 | United States | 373,676 | 376,417 | ||||||||||||||
| l | STARM Mortgage Loan Trust, 2007-2, 4A1, FRN, 2.678%, 4/25/37 | United States | 43,449 | 26,073 | ||||||||||||||
| e | Stellar Jay Ireland DAC, 2021-1, B, 144A, 5.926%, 10/15/41 | Ireland | 946,940 | 849,288 | ||||||||||||||
| m | Suntrust Alternative Loan Trust, 2005-1F, 1A1, FRN, 1.656%, (1-Month USD LIBOR + 0.65%), 12/25/35 | United States | 93,282 | 80,547 | ||||||||||||||
| e | Thunderbolt II Aircraft Lease Ltd., 2018-A, A, 144A, 4.147%, 9/15/38 | United States | 2,410,196 | 2,109,904 | ||||||||||||||
| e,m | VMC Finance LLC, 2019-FL3, C, 144A, FRN, 2.937%, (1-Month USD LIBOR + 2.05%), 9/15/36 | United States | 880,961 | 850,403 | ||||||||||||||
Wells Fargo Alternative Loan Trust, 2007-PA3, 2A2, 6.00%, 7/25/37 | United States | 95,347 | 89,121 | |||||||||||||||
|
| |||||||||||||||||
| 14,741,192 | ||||||||||||||||||
|
| |||||||||||||||||
| Mortgage Real Estate Investment Trusts (REITs) 20.0% | ||||||||||||||||||
| l | American Home Mortgage Assets Trust, 2005-1, 1A1, FRN, 2.77%, 11/25/35 | United States | 102,687 | 86,949 | ||||||||||||||
| e,l | Avenue of The Americas Trust, 2015-1211, E, 144A, FRN, 4.142%, 8/10/35 | United States | 150,000 | 136,314 | ||||||||||||||
| l | Banc of America Mortgage Trust, FRN, | |||||||||||||||||
2005-K, 2A1, 2.478%, 12/25/35 | United States | 134,954 | 126,104 | |||||||||||||||
2005-L, 1A1, 2.952%, 1/25/36 | United States | 89,140 | 82,051 | |||||||||||||||
2005-L, 3A1, 3.218%, 1/25/36 | United States | 103,336 | 99,691 | |||||||||||||||
| e,m | BBCMS Mortgage Trust, 2019-BWAY, E, 144A, FRN, 3.725%, (1-Month USD LIBOR + 2.85%), 11/15/34 | United States | 2,000,000 | 1,866,402 | ||||||||||||||
| e,l | BCAP LLC Trust, 2010-RR1, 1A4, 144A, FRN, 3.206%, 3/26/37 | United States | 176,106 | 146,984 | ||||||||||||||
| l | Bear Stearns ARM Trust, FRN, | United States | 2,762 | 2,432 | ||||||||||||||
2006-2, 4A1, 3.23%, 7/25/36 | United States | 33,589 | 30,289 | |||||||||||||||
| e,m | BXMT Ltd., 2021-FL4, C, 144A, FRN, 2.625%, (1-Month USD LIBOR + 1.75%), 5/15/38 | United States | 500,000 | 483,803 | ||||||||||||||
| l | Citigroup Mortgage Loan Trust, 2007-AR5, 2A1A, FRN, 3.378%, 4/25/37 | United States | 78,851 | 74,718 | ||||||||||||||
| e,m | Connecticut Avenue Securities Trust, 2019-R04, 2B1, 144A, FRN, 6.256%, (1-Month USD LIBOR + 5.25%), 6/25/39 | United States | 962,594 | 971,122 | ||||||||||||||
Countrywide Alternative Loan Trust, | United States | 115,773 | 113,480 | |||||||||||||||
m 2005-IM1, A1, FRN, 1.606%, (1-Month USD LIBOR + 0.60%), 1/25/36 | United States | 107,980 | 100,915 | |||||||||||||||
2005-J10, 2A4, 6.00%, 10/25/35 | United States | 394,816 | 224,128 | |||||||||||||||
| l | Credit Suisse First Boston Mortgage Securities Corp., 2004-AR3, CB2, FRN, 2.539%, 4/25/34 | Switzerland | 105,792 | 93,612 | ||||||||||||||
CSMC Mortgage-Backed Trust, 2006-4, 9A1, 6.50%, 5/25/36 | United States | 735,080 | 341,493 | |||||||||||||||
| e,l | FARM Mortgage Trust, 2021-1, B, 144A, FRN, 3.237%, 7/25/51 | United States | 915,458 | 780,094 | ||||||||||||||
| e,m | FNMA, 2021-R02, 2B1, 144A, FRN, 3.885%, (SOFR + 3.30%), 11/25/41 | United States | 650,000 | 584,080 | ||||||||||||||
| m | FREMF Mortgage Trust, 2018-KF52, B, FRN, 2.753%, (1-Month USD LIBOR + 1.95%), 9/25/28 | United States | 617,220 | 611,143 | ||||||||||||||
GSR Mortgage Loan Trust, 2004-6F, 2A4, 5.50%, 5/25/34 | United States | 84,197 | 82,558 | |||||||||||||||
Impac CMB Trust, | United States | 126,438 | 130,678 | |||||||||||||||
m 2004-8, 3B, FRN, 3.631%, (1-Month USD LIBOR + 2.63%), 8/25/34 | United States | 94,202 | 92,378 | |||||||||||||||
m 2005-2, 2B, FRN, 3.481%, (1-Month USD LIBOR + 2.48%), 4/25/35 | United States | 80,889 | 76,698 | |||||||||||||||
m 2005-4, 2M1, FRN, 1.756%, (1-Month USD LIBOR + 0.50%), 5/25/35 | United States | 145,318 | 128,193 | |||||||||||||||
m 2005-8, 2B, FRN, 3.256%, (1-Month USD LIBOR + 2.25%), 2/25/36 | United States | 68,333 | 66,086 | |||||||||||||||
| m | IndyMac INDX Mortgage Loan Trust, FRN, | |||||||||||||||||
2006-AR12, A1, 1.386%, (1-Month USD LIBOR + 0.38%), 9/25/46 | United States | 142,013 | 129,655 | |||||||||||||||
2006-AR29, A2, 1.166%, (1-Month USD LIBOR + 0.16%), 11/25/36 | United States | 258,624 | 257,259 | |||||||||||||||
| l | JPMBB Commercial Mortgage Securities Trust, 2015-C31, D, FRN, 4.112%, 8/15/48 | United States | 702,000 | 618,289 | ||||||||||||||
| l | JPMorgan Mortgage Trust, FRN, | United States | 171,231 | 144,409 | ||||||||||||||
2006-A7, 2A3, 3.148%, 1/25/37 | United States | 74,401 | 67,412 | |||||||||||||||
2007-A2, 2A1, 2.921%, 4/25/37 | United States | 102,288 | 90,795 | |||||||||||||||
| 24 | Annual Report | franklintempleton.com | ||||||||
FRANKLIN ALTERNATIVE STRATEGIES FUNDS
SCHEDULE OF INVESTMENTS
Franklin K2 Long Short Credit Fund (continued)
| Country | Principal Amount* | Value | ||||||||||||||||
| Asset-Backed Securities and Commercial Mortgage-Backed Securities (continued) | ||||||||||||||||||
| Mortgage Real Estate Investment Trusts (REITs) (continued) | ||||||||||||||||||
Lehman Mortgage Trust, 2005-3, 2A3, 5.50%, 1/25/36 | United States | 56,609 | $ | 53,722 | ||||||||||||||
| l | MASTR Adjustable Rate Mortgages Trust, 2004-10, B1, FRN, 2.518%, 10/25/34 | United States | 432,347 | 379,426 | ||||||||||||||
| l | MASTR Alternative Loan Trust, 2007-HF1, 3A1, FRN, 2.212%, 10/25/47 | United States | 485,955 | 341,085 | ||||||||||||||
| l | MASTR Seasoned Securitization Trust, 2004-1, 4A1, FRN, 2.41%, 10/25/32 | United States | 63,948 | 64,192 | ||||||||||||||
| e,m | Morgan Stanley Capital I Trust, 2018-BOP, E, 144A, FRN, 2.825%, (1-Month USD LIBOR + 1.95%), 6/15/35 | United States | 1,213,374 | 1,179,543 | ||||||||||||||
| l | RFMSI Trust, 2007-SA2, 3A, FRN, 5.245%, 4/25/37 | United States | 707,234 | 202,558 | ||||||||||||||
| e,m | STACR Trust, 2018-HRP1, B2, 144A, FRN, 12.756%, (1-Month USD LIBOR + 11.75%), 5/25/43 | United States | 1,915,202 | 2,026,841 | ||||||||||||||
| l | Structured ARM Loan Trust, 2004-4, B1, FRN, 2.768%, 4/25/34 | United States | 459,348 | 407,778 | ||||||||||||||
WAMU Mortgage Pass-Through Certificates Series Trust, FRN, | ||||||||||||||||||
m2005-AR11, B1, 1.921%, (1-Month USD LIBOR + 0.92%), 8/25/45 | United States | 1,079,073 | 940,593 | |||||||||||||||
l2006-AR12, 1A1, 3.02%, 10/25/36 | United States | 872,048 | 846,673 | |||||||||||||||
| m | Washington Mutual Mortgage Pass-Through Certificates, 2006-4, 3A2B, FRN, 1.166%, (1-Month USD LIBOR + 0.16%), 5/25/36 | United States | 193,754 | 167,886 | ||||||||||||||
| l | Washington Mutual MSC Mortgage Pass-Through Certificates Series Trust, 2003-AR3, B1, FRN, 3.256%, 6/25/33 | United States | 199,221 | 188,216 | ||||||||||||||
| e,l | WFRBS Commercial Mortgage Trust, 2014-C22, D, 144A, FRN, 3.902%, 9/15/57 | United States | 2,000,000 | 1,759,015 | ||||||||||||||
|
| |||||||||||||||||
| 17,397,742 | ||||||||||||||||||
|
| |||||||||||||||||
Total Asset-Backed Securities and Commercial Mortgage-Backed Securities (Cost $33,627,256) | 32,138,934 | |||||||||||||||||
|
| |||||||||||||||||
| Number of Contracts | Notional Amount# | |||||||||||||||||
| Options Purchased 0.4% | ||||||||||||||||||
| Calls – Exchange-Traded 0.0%† | ||||||||||||||||||
Chegg Inc., July Strike Price $35.00, Expires 7/15/22 | 16 | 1,600 | 96 | |||||||||||||||
Chewy Inc., June Strike Price $35.00, Expires 6/17/22 | 15 | 1,500 | 660 | |||||||||||||||
Chewy Inc., January Strike Price $30.00, Expires 1/20/23 | 30 | 3,000 | 15,000 | |||||||||||||||
iShares 20+ Year Treasury Bond ETF, September Strike Price $140.00, Expires 9/16/22 | 60 | 6,000 | 2,880 | |||||||||||||||
SPDR Gold Shares, September Strike Price $180.00, Expires 9/16/22 | 14 | 1,400 | 4,760 | |||||||||||||||
Twitter Inc., June Strike Price $55.00, Expires 6/17/22 | 24 | 2,400 | 120 | |||||||||||||||
Twitter Inc., October Strike Price $55.00, Expires 10/21/22 | 24 | 2,400 | 504 | |||||||||||||||
|
| |||||||||||||||||
| 24,020 | ||||||||||||||||||
|
| |||||||||||||||||
| Calls – Over-the-Counter 0.0%† | ||||||||||||||||||
| Currency Options 0.0%† | ||||||||||||||||||
GBP/USD, Counterparty BZWS, May Strike Price 1.50 GBP, Expires 5/08/23 | 1 | 1,700,000 | GBP | 1,402 | ||||||||||||||
|
| |||||||||||||||||
| Puts – Exchange-Traded 0.4% | ||||||||||||||||||
Ally Financial Inc., June Strike Price $35.00, Expires 6/17/22 | 39 | 3,900 | 585 | |||||||||||||||
Ally Financial Inc., September Strike Price $30.00, Expires 9/16/22 | 26 | 2,600 | 1,950 | |||||||||||||||
Capital One Financial Corp., September Strike Price $100.00, Expires 9/16/22 | 13 | 1,300 | 3,575 | |||||||||||||||
CarMax Inc., July Strike Price $75.00, Expires 7/15/22 | 64 | 6,400 | 8,000 | |||||||||||||||
Dollar Tree Inc., August Strike Price $110.00, Expires 8/19/22 | 6 | 600 | 468 | |||||||||||||||
FTSE 100 Index, June Strike Price 7,100.00 GBP, Expires 6/17/22 | 3 | 30 | 661 | |||||||||||||||
The Home Depot Inc., August Strike Price $260.00, Expires 8/19/22 | 3 | 300 | 1,485 | |||||||||||||||
Lowe’s Cos. Inc., August Strike Price $170.00, Expires 8/19/22 | 5 | 500 | 2,175 | |||||||||||||||
Medical Properties Trust Inc., July Strike Price $15.00, Expires 7/15/22 | 78 | 7,800 | 936 | |||||||||||||||
| franklintempleton.com | Annual Report | 25 | ||||||||
FRANKLIN ALTERNATIVE STRATEGIES FUNDS
SCHEDULE OF INVESTMENTS
Franklin K2 Long Short Credit Fund (continued)
| Number of Contracts | Notional Amount# | Value | ||||||||||||||||
| Options Purchased (continued) | ||||||||||||||||||
| Puts – Exchange-Traded (continued) | ||||||||||||||||||
New Residential Investment Corp., August Strike Price $9.00, Expires 8/19/22 | 156 | 15,600 | $ | 2,340 | ||||||||||||||
SPDR S&P 500 ETF Trust, August Strike Price $380.00, Expires 8/19/22 | 30 | 3,000 | 25,500 | |||||||||||||||
SPDR S&P 500 ETF Trust, November Strike Price $350.00, Expires 11/18/22 | 320 | 32,000 | 293,440 | |||||||||||||||
SPDR S&P Regional Banking ETF, June Strike Price $55.00, Expires 6/17/22 | 40 | 4,000 | 440 | |||||||||||||||
Synchrony Financial, June Strike Price $32.00, Expires 6/17/22 | 39 | 3,900 | 975 | |||||||||||||||
Synchrony Financial, September Strike Price $30.00, Expires 9/16/22 | 20 | 2,000 | �� | 2,540 | ||||||||||||||
Toll Brothers Inc., September Strike Price $40.00, Expires 9/16/22 | 11 | 1,100 | 1,595 | |||||||||||||||
VanEck Semiconductor ETF, August Strike Price $200.00, Expires 8/19/22 | 5 | 500 | 2,175 | |||||||||||||||
|
| |||||||||||||||||
| 348,840 | ||||||||||||||||||
|
| |||||||||||||||||
| Puts – Over-the-Counter 0.0%† | ||||||||||||||||||
B&G Foods Inc., Counterparty CITI, August Strike Price $20.00, Expires 8/19/22 | 20 | 2,000 | 2,000 | |||||||||||||||
B&G Foods Inc., Counterparty CITI, November Strike Price $17.50, Expires 11/18/22 | 22 | 2,200 | 2,530 | |||||||||||||||
B&G Foods Inc., Counterparty CITI, November Strike Price $20.00, Expires 11/18/22 | 36 | 3,600 | 6,660 | |||||||||||||||
Casino Guichard Perrachon SA, Counterparty CITI, September Strike Price 10.00 EUR, Expires 9/16/22 | 5 | 500 | 139 | |||||||||||||||
DAX Index, Counterparty CITI, June Strike Price 12,500.00 EUR, Expires 6/17/22 | 6 | 30 | 281 | |||||||||||||||
H & M Hennes & Mauritz AB, Counterparty CITI, June Strike Price 105.00 SEK, Expires 6/17/22 | 49 | 4,900 | 176 | |||||||||||||||
HP Inc., Counterparty BOFA, August Strike Price $34.00, Expires 8/19/22 | 33 | 3,300 | 4,356 | |||||||||||||||
|
| |||||||||||||||||
| 16,142 | ||||||||||||||||||
|
| |||||||||||||||||
Total Options Purchased (Cost $649,300) | 390,404 | |||||||||||||||||
|
| |||||||||||||||||
Total Investments before Short Term Investments | 74,535,897 | |||||||||||||||||
|
| |||||||||||||||||
| Country | Shares | |||||||||||||||||
| Short Term Investments 13.3% | ||||||||||||||||||
| Money Market Funds (Cost $11,240,697) 12.9% | ||||||||||||||||||
| n | Fidelity Investments Money Market Government Portfolio, Institutional, 0.62% | United States | 11,240,697 | 11,240,697 | ||||||||||||||
|
| |||||||||||||||||
| Principal Amount* | ||||||||||||||||||
| Repurchase Agreements (Cost $356,386) 0.4% | ||||||||||||||||||
| o | Joint Repurchase Agreement, 0.691%, 6/01/22 (Maturity Value $356,393) | United States | 356,386 | 356,386 | ||||||||||||||
|
| |||||||||||||||||
BNP Paribas Securities Corp. (Maturity Value $254,925) | ||||||||||||||||||
Collateralized by U.S. Government Agency Securities, 3.00% - 4.50%, 1/20/30 - 8/20/51; U.S. Treasury Bonds, 3.38%, 11/15/48; and U.S. Treasury Notes, 0.25% - 2.13%, 11/30/24 - 11/15/31; (Valued at $364,056) | ||||||||||||||||||
Total Investments (Cost $91,503,494) 98.9% | 86,132,980 | |||||||||||||||||
Options Written (0.4)% | (299,678 | ) | ||||||||||||||||
Securities Sold Short (4.4)% | (3,861,981 | ) | ||||||||||||||||
Other Assets, less Liabilities 5.9% | 5,087,119 | |||||||||||||||||
|
|
|
| |||||||||||||||
Net Assets 100.0% | $ | 87,058,440 | ||||||||||||||||
|
| |||||||||||||||||
| 26 | Annual Report | franklintempleton.com | ||||||||
FRANKLIN ALTERNATIVE STRATEGIES FUNDS
SCHEDULE OF INVESTMENTS
Franklin K2 Long Short Credit Fund (continued)
| Number of Contracts | Notional Amount# | Value | ||||||||||||||||
| p | Options Written (0.4)% | |||||||||||||||||
| Calls – Over-the-Counter (0.0)%† | ||||||||||||||||||
| Currency Options (0.0)%† | ||||||||||||||||||
GBP/USD, Counterparty BZWS, May Strike Price 0.75 GBP, Expires 5/08/23 | 1 | 1,700,000 | GBP | $ | (385 | ) | ||||||||||||
|
| |||||||||||||||||
| Puts – Exchange-Traded (0.4)% | ||||||||||||||||||
CarMax Inc., July Strike Price $65.00, Expires 7/15/22 | 64 | 6,400 | (2,880 | ) | ||||||||||||||
FTSE 100 Index, June Strike Price 6,800.00 GBP, Expires 6/17/22 | 3 | 30 | (302 | ) | ||||||||||||||
HP Inc., November Strike Price $74.00, Expires 11/18/22 | 320 | 32,000 | (51,360 | ) | ||||||||||||||
iShares iBoxx $ Investment Grade Corporate Bond ETF, November Strike Price $109.00, Expires 11/18/22 | 320 | 32,000 | (66,080 | ) | ||||||||||||||
SPDR S&P 500 ETF Trust, November Strike Price $320.00, Expires 11/18/22 | 320 | 32,000 | (178,560 | ) | ||||||||||||||
|
| |||||||||||||||||
| (299,182 | ) | |||||||||||||||||
|
| |||||||||||||||||
| Puts – Over-the-Counter (0.0)%† | ||||||||||||||||||
DAX Index, Counterparty CITI, June Strike Price 11,900.00 EUR, Expires 6/17/22 | 6 | 30 | (111 | ) | ||||||||||||||
|
| |||||||||||||||||
Total Options Written (Premiums Received $454,741) | (299,678 | ) | ||||||||||||||||
|
| |||||||||||||||||
| Country | Shares | |||||||||||||||||
| q | Securities Sold Short (4.4)% | |||||||||||||||||
Common Stocks (0.6)% | ||||||||||||||||||
| Capital Markets (0.6)% | ||||||||||||||||||
Ares Capital Corp. | United States | 16,458 | (318,956 | ) | ||||||||||||||
Owl Rock Capital Corp. | United States | 12,015 | (162,923 | ) | ||||||||||||||
|
| |||||||||||||||||
| (481,879 | ) | |||||||||||||||||
|
| |||||||||||||||||
IT Services (0.0)%† | ||||||||||||||||||
Digitalocean Holdings Inc. | United States | 250 | (12,213 | ) | ||||||||||||||
|
| |||||||||||||||||
Total Common Stocks (Proceeds $490,867) | (494,092 | ) | ||||||||||||||||
|
| |||||||||||||||||
| Principal Amount* | ||||||||||||||||||
| Corporate Bonds and Notes (2.7)% | ||||||||||||||||||
| Auto Components (0.1)% | ||||||||||||||||||
| e | Wheel Pros Inc., senior note, 144A, 6.50%, 5/15/29 | United States | 71,000 | (50,746 | ) | |||||||||||||
|
| |||||||||||||||||
| Automobiles (0.3)% | ||||||||||||||||||
Ford Motor Credit Co. LLC, senior note, 4.95%, 5/28/27 | United States | 200,000 | (199,313 | ) | ||||||||||||||
General Motors Co., senior bond, 4.20%, 10/01/27 | United States | 25,000 | (24,252 | ) | ||||||||||||||
|
| |||||||||||||||||
| (223,565 | ) | |||||||||||||||||
|
| |||||||||||||||||
| Construction & Engineering (0.5)% | ||||||||||||||||||
Fluor Corp., senior bond, 4.25%, 9/15/28 | United States | 300,000 | (286,140 | ) | ||||||||||||||
| e | Tutor Perini Corp., senior note, 144A, 6.875%, 5/01/25 | United States | 161,000 | (150,034 | ) | |||||||||||||
|
| |||||||||||||||||
| (436,174 | ) | |||||||||||||||||
|
| |||||||||||||||||
| Consumer Finance (0.2)% | ||||||||||||||||||
Onemain Finance Corp., senior note, | United States | 113,000 | (115,910 | ) | ||||||||||||||
3.875%, 9/15/28 | United States | 88,000 | (76,202 | ) | ||||||||||||||
|
| |||||||||||||||||
| (192,112 | ) | |||||||||||||||||
|
| |||||||||||||||||
| Diversified Financial Services (0.3)% | ||||||||||||||||||
| e | Kronos Acquisition Holdings Inc. / KIK Custom Products Inc., senior note, 144A, 7.00%, 12/31/27 | Canada | 166,000 | (133,536 | ) | |||||||||||||
| e | MPH Acquisition Holdings LLC, senior note, 144A, 5.75%, 11/01/28 | United States | 146,000 | (130,191 | ) | |||||||||||||
|
| |||||||||||||||||
| (263,727 | ) | |||||||||||||||||
|
| |||||||||||||||||
| franklintempleton.com | Annual Report | 27 | ||||||||
FRANKLIN ALTERNATIVE STRATEGIES FUNDS
SCHEDULE OF INVESTMENTS
Franklin K2 Long Short Credit Fund (continued)
| Country | Principal Amount* | Value | ||||||||||||||||
| Securities Sold Short (continued) | ||||||||||||||||||
| Corporate Bonds and Notes (continued) | ||||||||||||||||||
| Diversified Telecommunication Services (0.3)% | ||||||||||||||||||
| e | Iliad Holding SASU, senior secured note, Reg S, 5.625%, 10/15/28 | France | 265,000 | EUR | $ | (269,878 | ) | |||||||||||
|
| |||||||||||||||||
| Food & Staples Retailing (0.4)% | ||||||||||||||||||
| e | Chobani LLC / Chobani Finance Corp. Inc., senior note, 144A, 7.50%, 4/15/25 | United States | 132,000 | (125,061 | ) | |||||||||||||
Koninklijke Ahold Delhaize NV, senior bond, 5.70%, 10/01/40 | Netherlands | 196,000 | (213,024 | ) | ||||||||||||||
| e | Sigma Holdco BV, senior note, 144A, 7.875%, 5/15/26 | Netherlands | 26,000 | (17,851 | ) | |||||||||||||
|
| |||||||||||||||||
| (355,936 | ) | |||||||||||||||||
|
| |||||||||||||||||
| Health Care Providers & Services (0.0)%† | ||||||||||||||||||
| e | Air Methods Corp., senior note, 144A, 8.00%, 5/15/25 | United States | 69,000 | (47,850 | ) | |||||||||||||
|
| |||||||||||||||||
| Hotels, Restaurants & Leisure (0.1)% | ||||||||||||||||||
| e | Royal Caribbean Cruises Ltd., senior note, 144A, 5.50%, 4/01/28 | United States | 85,000 | (71,885 | ) | |||||||||||||
|
| |||||||||||||||||
| Leisure Products (0.1)% | ||||||||||||||||||
Brunswick Corp., senior bond, 4.40%, 9/15/32 | United States | 116,000 | (104,651 | ) | ||||||||||||||
|
| |||||||||||||||||
| Media (0.1)% | ||||||||||||||||||
iHeartCommunications Inc., senior note, 8.375%, 5/01/27 | United States | 90,000 | (84,578 | ) | ||||||||||||||
| e | Scripps Escrow II Inc., senior bond, 144A, 5.375%, 1/15/31 | United States | 31,000 | (27,218 | ) | |||||||||||||
|
| |||||||||||||||||
| (111,796 | ) | |||||||||||||||||
|
| |||||||||||||||||
| Pharmaceuticals (0.1)% | ||||||||||||||||||
| e | Bausch Health Cos. Inc., senior secured note, 144A, 6.125%, 2/01/27 | United States | 69,000 | (63,066 | ) | |||||||||||||
|
| |||||||||||||||||
| Specialty Retail (0.2)% | ||||||||||||||||||
| e | At Home Group Inc., senior note, 144A, 7.125%, 7/15/29 | United States | 31,000 | (21,023 | ) | |||||||||||||
QVC Inc., senior secured note, 4.75%, 2/15/27 | United States | 36,000 | (31,169 | ) | ||||||||||||||
| e | Rent-A-Center Inc., senior note, 144A, 6.375%, 2/15/29 | United States | 153,000 | (134,358 | ) | |||||||||||||
|
| |||||||||||||||||
| (186,550 | ) | |||||||||||||||||
|
| |||||||||||||||||
Total Corporate Bonds and Notes (Proceeds $2,583,932) | (2,377,936 | ) | ||||||||||||||||
|
| |||||||||||||||||
| Foreign Government and Agency Securities (0.6)% | ||||||||||||||||||
| e | Government of Italy, senior bond, Reg S, 0.95%, 6/01/32 | Italy | 154,000 | EUR | (134,872 | ) | ||||||||||||
Government of Turkey, | Turkey | 170,000 | (163,696 | ) | ||||||||||||||
senior bond, 7.375%, 2/05/25 | Turkey | 82,000 | (79,994 | ) | ||||||||||||||
senior note, 7.25%, 12/23/23 | Turkey | 129,000 | (129,409 | ) | ||||||||||||||
|
| |||||||||||||||||
Total Foreign Government and Agency Securities (Proceeds $537,809) | (507,971 | ) | ||||||||||||||||
|
| |||||||||||||||||
| U.S. Government and Agency Securities (0.5)% | ||||||||||||||||||
U.S. Treasury Bond, | United States | 92,100 | (79,767 | ) | ||||||||||||||
1.875%, 11/15/51 | United States | 331,400 | (252,589 | ) | ||||||||||||||
2.25%, 2/15/52 | United States | 51,900 | (43,426 | ) | ||||||||||||||
U.S. Treasury Note, | United States | 79,800 | (73,154 | ) | ||||||||||||||
2.875%, 5/15/32 | United States | 33,000 | (33,046 | ) | ||||||||||||||
|
| |||||||||||||||||
Total U.S. Government and Agency Securities | (481,982 | ) | ||||||||||||||||
|
| |||||||||||||||||
Total Securities Sold Short (Proceeds $4,145,995) | $ | (3,861,981 | ) | |||||||||||||||
|
| |||||||||||||||||
†Rounds to less than 0.1% of net assets.
*The principal amount is stated in U.S. dollars unless otherwise indicated.
#Notional amount is the number of units specified in the contract, and can include currency units, bushels, shares, pounds, barrels or other units. Currency units are stated in U.S. dollars unless otherwise indicated.
| 28 | Annual Report | franklintempleton.com | ||||||||
FRANKLIN ALTERNATIVE STRATEGIES FUNDS
SCHEDULE OF INVESTMENTS
Franklin K2 Long Short Credit Fund (continued)
aNon-income producing.
bA portion or all of the security has been segregated as collateral for securities sold short, open swap contracts, open forward exchange contracts, open futures contracts and/or open written option contracts. At May 31, 2022, the aggregate value of these securities and/or cash pledged amounted to $1,927,764, representing 2.2% of net assets.
cFair valued using significant unobservable inputs. See Note 14 regarding fair value measurements.
dSee Note 10 regarding restricted securities.
eSecurity was purchased pursuant to Rule 144A or Regulation S under the Securities Act of 1933. 144A securities may be sold in transactions exempt from registration only to qualified institutional buyers or in public offering registered under the Securities Act of 1933. Regulation S securities cannot be sold in the United States without either an effective registration statement filed pursuant to the Securities Act of 1933, or pursuant to an exemption from registration. At May 31, 2022, the net value of these securities was $53,137,019, representing 61.0% of net assets.
fIncome may be received in additional securities and/or cash.
gPerpetual security with no stated maturity date.
hThe coupon rate shown represents the rate at period end.
iSee Note 1(g) regarding senior floating rate interests.
jSee Note 11 regarding unfunded loan commitments.
kPrincipal amount is stated in 100 Mexican Peso Units.
lAdjustable rate security with an interest rate that is not based on a published reference index and spread. The rate is based on the structure of the agreement and current market conditions. The coupon rate shown represents the rate at period end.
mThe coupon rate shown represents the rate inclusive of any caps or floors, if applicable, in effect at period end.
nThe rate shown is the annualized seven-day effective yield at period end.
oSee Note 1(c) regarding joint repurchase agreement.
pSee Note 1(d) regarding written options.
qSee Note 1(f) regarding securities sold short.
At May 31, 2022, the Fund had the following futures contracts outstanding. See Note 1(d).
| Futures Contracts | ||||||||||||||||||||
| Description | Type | Number of Contracts | Notional Amount* | Expiration Date | Value/Unrealized Appreciation (Depreciation) | |||||||||||||||
| Equity Contracts | ||||||||||||||||||||
DJ EURO STOXX 50 Index | Short | 2 | $ | 81,246 | 6/17/22 | $ | (2,158 | ) | ||||||||||||
E-Mini Russell 2000 | Short | 14 | 1,303,330 | 6/17/22 | 74,006 | |||||||||||||||
S&P 500 E-Mini Index | Short | 2 | 413,125 | 6/17/22 | (1,882 | ) | ||||||||||||||
|
| |||||||||||||||||||
| 69,966 | ||||||||||||||||||||
|
| |||||||||||||||||||
| Interest Rate Contracts | ||||||||||||||||||||
U.S. Treasury 5 Yr. Note | Short | 37 | 4,179,266 | 9/30/22 | 12,653 | |||||||||||||||
|
| |||||||||||||||||||
Total Futures Contracts |
| $ | 82,619 | |||||||||||||||||
|
| |||||||||||||||||||
*As of period end.
At May 31, 2022, the Fund had the following forward exchange contracts outstanding. See Note 1(d).
| Forward Exchange Contracts | ||||||||||||||||||||||||||||
| Currency | Counterpartya | Type | Quantity | Contract Amount | Settlement Date | Unrealized Appreciation | Unrealized Depreciation | |||||||||||||||||||||
| OTC Forward Exchange Contracts | ||||||||||||||||||||||||||||
Mexican Peso | JPHQ | Buy | 4,170,935 | $ | 198,243 | 6/15/22 | $ | 13,020 | $ | — | ||||||||||||||||||
Mexican Peso | JPHQ | Sell | 20,158,360 | 961,829 | 6/15/22 | — | (59,217 | ) | ||||||||||||||||||||
Polish Zloty | JPHQ | Buy | 2,451,310 | 567,503 | 6/15/22 | 5,407 | — | |||||||||||||||||||||
Polish Zloty | JPHQ | Sell | 1,646,302 | 365,743 | 6/15/22 | — | (19,024 | ) | ||||||||||||||||||||
South African Rand | DBAB | Buy | 1,358,375 | 85,264 | 6/15/22 | 1,391 | — | |||||||||||||||||||||
South African Rand | GSCO | Sell | 28,100,881 | 1,799,723 | 6/15/22 | 7,080 | — | |||||||||||||||||||||
South African Rand | HSBC | Sell | 4,713,610 | 295,765 | 6/15/22 | — | (4,931 | ) | ||||||||||||||||||||
South African Rand | JPHQ | Buy | 19,988,807 | 1,271,778 | 6/15/22 | 16,202 | (12,831 | ) | ||||||||||||||||||||
South African Rand | JPHQ | Sell | 1,774,234 | 109,858 | 6/15/22 | — | (3,326 | ) | ||||||||||||||||||||
British Pound | JPHQ | Buy | 140,000 | 172,399 | 6/30/22 | 4,043 | — | |||||||||||||||||||||
British Pound | JPHQ | Sell | 600,000 | 773,119 | 6/30/22 | 21,380 | (4,441 | ) | ||||||||||||||||||||
Euro | JPHQ | Buy | 90,000 | 96,350 | 6/30/22 | 431 | — | |||||||||||||||||||||
| franklintempleton.com | Annual Report | 29 | ||||||||
FRANKLIN ALTERNATIVE STRATEGIES FUNDS
SCHEDULE OF INVESTMENTS
Franklin K2 Long Short Credit Fund (continued)
| Forward Exchange Contracts (continued) | ||||||||||||||||||||||||||||
| Currency | Counterpartya | Type | Quantity | Contract Amount | Settlement Date | Unrealized Appreciation | Unrealized Depreciation | |||||||||||||||||||||
| OTC Forward Exchange Contracts (continued) | ||||||||||||||||||||||||||||
Euro | JPHQ | Sell | 1,300,000 | $ | 1,419,003 | 6/30/22 | $ | 21,192 | $ | (140 | ) | |||||||||||||||||
Hong Kong Dollar | JPHQ | Sell | 155,000 | 19,821 | 6/30/22 | 52 | — | |||||||||||||||||||||
Japanese Yen | JPHQ | Sell | 2,180,000 | 17,734 | 6/30/22 | 778 | — | |||||||||||||||||||||
Swiss Franc | JPHQ | Buy | 730,000 | 790,963 | 6/30/22 | — | (28,562 | ) | ||||||||||||||||||||
Swiss Franc | JPHQ | Sell | 2,210,000 | 2,373,075 | 6/30/22 | 64,986 | — | |||||||||||||||||||||
Euro | JPHQ | Sell | 770,000 | 865,449 | 3/31/23 | 22,751 | — | |||||||||||||||||||||
Euro | JPHQ | Sell | 970,000 | 1,135,928 | 3/31/25 | 39,808 | — | |||||||||||||||||||||
|
| |||||||||||||||||||||||||||
Total Forward Exchange Contracts |
| $ | 218,521 | $ | (132,472 | ) | ||||||||||||||||||||||
|
|
|
| |||||||||||||||||||||||||
Net unrealized appreciation (depreciation) |
| $ | 86,049 | |||||||||||||||||||||||||
|
| |||||||||||||||||||||||||||
aMay be comprised of multiple contracts with the same counterparty, currency and settlement date.
At May 31, 2022, the Fund had the following credit default swap contracts outstanding. See Note 1(d).
| Credit Default Swap Contracts | ||||||||||||||||||||||||||||||||||||||||
| Description | Annual Payment Rate Received (Paid) | Payment Frequency | Maturity Date | Notional Amounta | Value | Unamortized Upfront Payments (Receipts) | Unrealized Appreciation (Depreciation) | Ratingb | ||||||||||||||||||||||||||||||||
| Centrally Cleared Swap Contracts | ||||||||||||||||||||||||||||||||||||||||
| Contracts to Buy Protectionc | ||||||||||||||||||||||||||||||||||||||||
| Traded Index | ||||||||||||||||||||||||||||||||||||||||
CDX.NA.HY.34 | (5.00)% | Quarterly | 6/20/25 | 1,840,000 | $ | (55,676 | ) | $ | — | $ | (55,676 | ) | ||||||||||||||||||||||||||||
CDX.NA.HY.35 | (5.00)% | Quarterly | 12/22/25 | 1,030,000 | (31,665 | ) | (97,850 | ) | 66,185 | |||||||||||||||||||||||||||||||
| Contracts to Sell Protectionc,d | ||||||||||||||||||||||||||||||||||||||||
| Single Name | ||||||||||||||||||||||||||||||||||||||||
Government of Turkey | 1.00% | Quarterly | 6/20/27 | 217,000 | (50,743 | ) | (43,455 | ) | (7,288 | ) | B+ | |||||||||||||||||||||||||||||
|
| |||||||||||||||||||||||||||||||||||||||
Total Centrally Cleared Swap Contracts |
| $ | (138,084 | ) | $ | (141,305 | ) | $ | 3,221 | |||||||||||||||||||||||||||||||
|
| |||||||||||||||||||||||||||||||||||||||
| OTC Swap Contracts | ||||||||||||||||||||||||||||||||||||||||
| Contracts to Buy Protectionc | ||||||||||||||||||||||||||||||||||||||||
| Single Name | Counterparty | |||||||||||||||||||||||||||||||||||||||
Air France-KLM | (5.00)% | Quarterly | JPHQ | 6/20/22 | 21,000 | EUR | (245 | ) | (23 | ) | (222 | ) | ||||||||||||||||||||||||||||
Air France-KLM | (5.00)% | Quarterly | JPHQ | 6/20/22 | 7,000 | EUR | (82 | ) | (16 | ) | (66 | ) | ||||||||||||||||||||||||||||
Air France-KLM | (5.00)% | Quarterly | JPHQ | 6/20/22 | 13,000 | EUR | (152 | ) | (15 | ) | (137 | ) | ||||||||||||||||||||||||||||
Air France-KLM | (5.00)% | Quarterly | JPHQ | 6/20/22 | 13,000 | EUR | (152 | ) | (15 | ) | (137 | ) | ||||||||||||||||||||||||||||
Akzo Nobel N.V. | (1.00)% | Quarterly | CITI | 6/20/27 | 40,000 | EUR | (648 | ) | (824 | ) | 176 | |||||||||||||||||||||||||||||
Ally Financial Inc. | (5.00)% | Quarterly | BZWS | 6/20/27 | 24,000 | (3,290 | ) | (3,142 | ) | (148 | ) | |||||||||||||||||||||||||||||
Ally Financial Inc. | (5.00)% | Quarterly | GSCO | 6/20/27 | 79,000 | (10,829 | ) | (10,433 | ) | (396 | ) | |||||||||||||||||||||||||||||
Ally Financial Inc. | (5.00)% | Quarterly | GSCO | 6/20/27 | 32,000 | (4,386 | ) | (3,887 | ) | (499 | ) | |||||||||||||||||||||||||||||
Ally Financial Inc. | (5.00)% | Quarterly | GSCO | 6/20/27 | 32,000 | (4,386 | ) | (3,698 | ) | (688 | ) | |||||||||||||||||||||||||||||
American Airlines Group Inc. | (5.00)% | Quarterly | BZWS | 6/20/23 | 48,000 | 845 | 1,703 | (858 | ) | |||||||||||||||||||||||||||||||
American Airlines Group Inc. | (5.00)% | Quarterly | BZWS | 12/20/23 | 15,000 | 663 | 322 | 341 | ||||||||||||||||||||||||||||||||
American Airlines Group Inc. | (5.00)% | Quarterly | BZWS | 12/20/23 | 14,000 | 619 | 558 | 61 | ||||||||||||||||||||||||||||||||
American Airlines Group Inc. | (5.00)% | Quarterly | BZWS | 12/20/23 | 66,000 | 2,918 | 2,245 | 673 | ||||||||||||||||||||||||||||||||
American Airlines Group Inc. | (5.00)% | Quarterly | BZWS | 6/20/24 | 42,000 | 2,854 | 1,800 | 1,054 | ||||||||||||||||||||||||||||||||
American Airlines Group Inc. | (5.00)% | Quarterly | BZWS | 6/20/24 | 84,000 | 5,708 | 7,224 | (1,516 | ) | |||||||||||||||||||||||||||||||
American Airlines Group Inc. | (5.00)% | Quarterly | BZWS | 6/20/25 | 16,000 | 1,961 | 2,353 | (392 | ) | |||||||||||||||||||||||||||||||
American Airlines Group Inc. | (5.00)% | Quarterly | BZWS | 6/20/25 | 64,000 | 7,855 | 8,936 | (1,081 | ) | |||||||||||||||||||||||||||||||
American Airlines Group Inc. | (5.00)% | Quarterly | BZWS | 12/20/26 | 15,000 | 2,622 | 1,160 | 1,462 | ||||||||||||||||||||||||||||||||
American Airlines Group Inc. | (5.00)% | Quarterly | BZWS | 12/20/26 | 24,000 | 4,195 | 3,460 | 735 | ||||||||||||||||||||||||||||||||
American Airlines Group Inc. | (5.00)% | Quarterly | CITI | 6/20/26 | 28,000 | 4,512 | 2,366 | 2,146 | ||||||||||||||||||||||||||||||||
American Airlines Group Inc. | (5.00)% | Quarterly | CITI | 6/20/26 | 34,000 | 5,479 | 2,662 | 2,817 | ||||||||||||||||||||||||||||||||
American Airlines Group Inc. | (5.00)% | Quarterly | FBCO | 12/20/23 | 12,000 | 531 | 667 | (136 | ) | |||||||||||||||||||||||||||||||
| 30 | Annual Report | franklintempleton.com | ||||||||
FRANKLIN ALTERNATIVE STRATEGIES FUNDS
SCHEDULE OF INVESTMENTS
Franklin K2 Long Short Credit Fund (continued)
| Credit Default Swap Contracts (continued) | ||||||||||||||||||||||||||||||||||||||||
| Description | Annual Payment Rate Received (Paid) | Payment Frequency | Counterparty | Maturity Date | Notional Amounta | Value | Unamortized Upfront Payments (Receipts) | Unrealized Appreciation (Depreciation) | Ratingb | |||||||||||||||||||||||||||||||
| OTC Swap Contracts (continued) | ||||||||||||||||||||||||||||||||||||||||
| Contracts to Buy Protectionc (continued) | ||||||||||||||||||||||||||||||||||||||||
| Single Name (continued) |
| |||||||||||||||||||||||||||||||||||||||
American Airlines Group Inc. | (5.00)% | Quarterly | FBCO | 12/20/26 | 20,000 | $ | 3,496 | $ | 1,547 | $ | 1,949 | |||||||||||||||||||||||||||||
American Airlines Group Inc. | (5.00)% | Quarterly | GSCO | 12/20/23 | 17,000 | 752 | 395 | 357 | ||||||||||||||||||||||||||||||||
American Airlines Group Inc. | (5.00)% | Quarterly | GSCO | 12/20/23 | 46,000 | 2,034 | 1,073 | 961 | ||||||||||||||||||||||||||||||||
American Airlines Group Inc. | (5.00)% | Quarterly | GSCO | 12/20/23 | 20,000 | 884 | 1,341 | (457 | ) | |||||||||||||||||||||||||||||||
American Airlines Group Inc. | (5.00)% | Quarterly | GSCO | 12/20/23 | 66,000 | 2,918 | 6,045 | (3,127 | ) | |||||||||||||||||||||||||||||||
American Airlines Group Inc. | (5.00)% | Quarterly | GSCO | 6/20/24 | 21,000 | 1,427 | 1,754 | (327 | ) | |||||||||||||||||||||||||||||||
American Airlines Group Inc. | (5.00)% | Quarterly | JPHQ | 12/20/25 | 75,000 | 10,735 | 10,870 | (135 | ) | |||||||||||||||||||||||||||||||
American Axle & Manufacturing Inc. | (5.00)% | Quarterly | BZWS | 6/20/27 | 356,000 | 11,169 | 697 | 10,472 | ||||||||||||||||||||||||||||||||
Anglo American PLC | (5.00)% | Quarterly | CITI | 6/20/27 | 31,000 | EUR | (5,861 | ) | (5,028 | ) | (833 | ) | ||||||||||||||||||||||||||||
Arcelormittal SA | (5.00)% | Quarterly | CITI | 6/20/27 | 30,000 | EUR | (4,690 | ) | (3,846 | ) | (844 | ) | ||||||||||||||||||||||||||||
Arcelormittal SA | (5.00)% | Quarterly | CITI | 6/20/27 | 9,000 | EUR | (1,407 | ) | (1,206 | ) | (201 | ) | ||||||||||||||||||||||||||||
Arcelormittal SA | (5.00)% | Quarterly | CITI | 6/20/27 | 9,000 | EUR | (1,407 | ) | (1,155 | ) | (252 | ) | ||||||||||||||||||||||||||||
Campbell’s Soup Co. | (1.00)% | Quarterly | BZWS | 6/20/27 | 125,000 | (1,741 | ) | (1,343 | ) | (398 | ) | |||||||||||||||||||||||||||||
Campbell’s Soup Co. | (1.00)% | Quarterly | BZWS | 6/20/27 | 83,000 | (1,156 | ) | (849 | ) | (307 | ) | |||||||||||||||||||||||||||||
Conagra Brands | (1.00)% | Quarterly | BZWS | 6/20/27 | 144,000 | (419 | ) | 66 | (485 | ) | ||||||||||||||||||||||||||||||
Conagra Brands | (1.00)% | Quarterly | CITI | 6/20/27 | 86,000 | (250 | ) | 72 | (322 | ) | ||||||||||||||||||||||||||||||
D.R. Horton Inc. | (1.00)% | Quarterly | JPHQ | 6/20/27 | 22,000 | 269 | (204 | ) | 473 | |||||||||||||||||||||||||||||||
Danone SA | (1.00)% | Quarterly | CITI | 6/20/27 | 35,000 | EUR | (1,013 | ) | (1,111 | ) | 98 | |||||||||||||||||||||||||||||
Danone SA | (1.00)% | Quarterly | CITI | 6/20/27 | 18,000 | EUR | (521 | ) | (572 | ) | 51 | |||||||||||||||||||||||||||||
Danone SA | (1.00)% | Quarterly | CITI | 6/20/27 | 18,000 | EUR | (521 | ) | (559 | ) | 38 | |||||||||||||||||||||||||||||
Danone SA | (1.00)% | Quarterly | CITI | 6/20/27 | 17,000 | EUR | (492 | ) | (518 | ) | 26 | |||||||||||||||||||||||||||||
Deutsche Lufthansa AG | (1.00)% | Quarterly | MSCS | 6/20/27 | 85,000 | EUR | 10,271 | 10,008 | 263 | |||||||||||||||||||||||||||||||
Dow Inc. | (1.00)% | Quarterly | BZWS | 6/20/27 | 41,000 | (234 | ) | (114 | ) | (120 | ) | |||||||||||||||||||||||||||||
Dow Inc. | (1.00)% | Quarterly | JPHQ | 6/20/27 | 171,000 | (978 | ) | (317 | ) | (661 | ) | |||||||||||||||||||||||||||||
EnBW AG | (1.00)% | Quarterly | BZWS | 6/20/27 | 71,000 | EUR | (1,046 | ) | (1,448 | ) | 402 | |||||||||||||||||||||||||||||
FedEx Corp. | (1.00)% | Quarterly | BNPP | 6/20/27 | 31,000 | (390 | ) | (374 | ) | (16 | ) | |||||||||||||||||||||||||||||
FedEx Corp. | (1.00)% | Quarterly | BZWS | 6/20/27 | 74,000 | (931 | ) | (1,035 | ) | 104 | ||||||||||||||||||||||||||||||
FedEx Corp. | (1.00)% | Quarterly | BZWS | 6/20/27 | 37,000 | (466 | ) | (521 | ) | 55 | ||||||||||||||||||||||||||||||
FedEx Corp. | (1.00)% | Quarterly | BZWS | 6/20/27 | 37,000 | (466 | ) | (391 | ) | (75 | ) | |||||||||||||||||||||||||||||
FedEx Corp. | (1.00)% | Quarterly | GSCO | 6/20/27 | 37,000 | (466 | ) | (486 | ) | 20 | ||||||||||||||||||||||||||||||
FedEx Corp. | (1.00)% | Quarterly | JPHQ | 6/20/27 | 37,000 | (466 | ) | (447 | ) | (19 | ) | |||||||||||||||||||||||||||||
FedEx Corp. | (1.00)% | Quarterly | JPHQ | 6/20/27 | 37,000 | (466 | ) | (383 | ) | (83 | ) | |||||||||||||||||||||||||||||
Ford Motor Co. | (5.00)% | Quarterly | BNPP | 6/20/27 | 18,000 | (1,640 | ) | (1,628 | ) | (12 | ) | |||||||||||||||||||||||||||||
Ford Motor Co. | (5.00)% | Quarterly | CITI | 6/20/27 | 14,000 | (1,276 | ) | (1,527 | ) | 251 | ||||||||||||||||||||||||||||||
Ford Motor Co. | (5.00)% | Quarterly | CITI | 6/20/27 | 10,000 | (911 | ) | (876 | ) | (35 | ) | |||||||||||||||||||||||||||||
Ford Motor Co. | (5.00)% | Quarterly | CITI | 6/20/27 | 10,000 | (911 | ) | (843 | ) | (68 | ) | |||||||||||||||||||||||||||||
Ford Motor Co. | (5.00)% | Quarterly | CITI | 6/20/27 | 10,000 | (911 | ) | (752 | ) | (159 | ) | |||||||||||||||||||||||||||||
Ford Motor Co. | (5.00)% | Quarterly | CITI | 6/20/27 | 10,000 | (911 | ) | (622 | ) | (289 | ) | |||||||||||||||||||||||||||||
Ford Motor Co. | (5.00)% | Quarterly | GSCO | 6/20/27 | 21,000 | (1,914 | ) | (1,894 | ) | (20 | ) | |||||||||||||||||||||||||||||
Ford Motor Co. | (5.00)% | Quarterly | GSCO | 6/20/27 | 21,000 | (1,914 | ) | (1,892 | ) | (22 | ) | |||||||||||||||||||||||||||||
Ford Motor Co. | (5.00)% | Quarterly | GSCO | 6/20/27 | 21,000 | (1,914 | ) | (1,846 | ) | (68 | ) | |||||||||||||||||||||||||||||
Ford Motor Co. | (5.00)% | Quarterly | GSCO | 6/20/27 | 10,000 | (911 | ) | (910 | ) | (1 | ) | |||||||||||||||||||||||||||||
Ford Motor Credit Co. LLC | (5.00)% | Quarterly | CITI | 6/20/27 | 48,000 | (4,412 | ) | (2,405 | ) | (2,007 | ) | |||||||||||||||||||||||||||||
Ford Motor Credit Co. LLC | (5.00)% | Quarterly | CITI | 6/20/27 | 30,000 | (2,757 | ) | (1,808 | ) | (949 | ) | |||||||||||||||||||||||||||||
Ford Motor Credit Co. LLC | (5.00)% | Quarterly | CITI | 6/20/27 | 14,000 | (1,276 | ) | (1,573 | ) | 297 | ||||||||||||||||||||||||||||||
Ford Motor Credit Co. LLC | (5.00)% | Quarterly | CITI | 6/20/27 | 10,000 | (911 | ) | (1,105 | ) | 194 | ||||||||||||||||||||||||||||||
Ford Motor Credit Co. LLC | (5.00)% | Quarterly | CITI | 6/20/27 | 15,000 | (1,379 | ) | (1,032 | ) | (347 | ) | |||||||||||||||||||||||||||||
Ford Motor Credit Co. LLC | (5.00)% | Quarterly | CITI | 6/20/27 | 15,000 | (1,379 | ) | (933 | ) | (446 | ) | |||||||||||||||||||||||||||||
GE Capital Funding LLC | (1.00)% | Quarterly | JPHQ | 12/20/26 | 97,000 | 782 | (849 | ) | 1,631 | |||||||||||||||||||||||||||||||
General Motors Co. | (5.00)% | Quarterly | BNPP | 6/20/27 | 84,000 | (11,109 | ) | (10,782 | ) | (327 | ) | |||||||||||||||||||||||||||||
General Motors Co. | (5.00)% | Quarterly | BNPP | 6/20/27 | 14,000 | (1,851 | ) | (1,836 | ) | (15 | ) | |||||||||||||||||||||||||||||
General Motors Co. | (5.00)% | Quarterly | BNPP | 6/20/27 | 13,000 | (1,719 | ) | (1,652 | ) | (67 | ) | |||||||||||||||||||||||||||||
| franklintempleton.com | Annual Report | 31 | ||||||||
FRANKLIN ALTERNATIVE STRATEGIES FUNDS
SCHEDULE OF INVESTMENTS
Franklin K2 Long Short Credit Fund (continued)
| Credit Default Swap Contracts (continued) | ||||||||||||||||||||||||||||||||||||||||
| Description | Annual Payment Rate Received (Paid) | Payment Frequency | Counterparty | Maturity Date | Notional Amounta | Value | Unamortized Upfront Payments (Receipts) | Unrealized Appreciation (Depreciation) | Ratingb | |||||||||||||||||||||||||||||||
| OTC Swap Contracts (continued) | ||||||||||||||||||||||||||||||||||||||||
| Contracts to Buy Protectionc (continued) | ||||||||||||||||||||||||||||||||||||||||
| Single Name (continued) |
| |||||||||||||||||||||||||||||||||||||||
General Motors Co. | (5.00)% | Quarterly | BOFA | 6/20/27 | 28,000 | $ | (3,703 | ) | $ | (3,625 | ) | $ | (78 | ) | ||||||||||||||||||||||||||
General Motors Co. | (5.00)% | Quarterly | BZWS | 6/20/27 | 55,000 | (7,273 | ) | (6,659 | ) | (614 | ) | |||||||||||||||||||||||||||||
General Motors Co. | (5.00)% | Quarterly | BZWS | 6/20/27 | 35,000 | (4,629 | ) | (4,437 | ) | (192 | ) | |||||||||||||||||||||||||||||
General Motors Co. | (5.00)% | Quarterly | BZWS | 6/20/27 | 14,000 | (1,851 | ) | (1,698 | ) | (153 | ) | |||||||||||||||||||||||||||||
General Motors Co. | (5.00)% | Quarterly | BZWS | 6/20/27 | 3,000 | (397 | ) | (384 | ) | (13 | ) | |||||||||||||||||||||||||||||
General Motors Co. | (5.00)% | Quarterly | GSCO | 6/20/27 | 21,000 | (2,777 | ) | (2,426 | ) | (351 | ) | |||||||||||||||||||||||||||||
General Motors Co. | (5.00)% | Quarterly | JPHQ | 6/20/27 | 140,000 | (18,514 | ) | (19,604 | ) | 1,090 | ||||||||||||||||||||||||||||||
General Motors Co. | (5.00)% | Quarterly | JPHQ | 6/20/27 | 28,000 | (3,703 | ) | (3,972 | ) | 269 | ||||||||||||||||||||||||||||||
Glencore Funding LLC | (5.00)% | Quarterly | CITI | 6/20/27 | 80,000 | EUR | (14,122 | ) | (14,239 | ) | 117 | |||||||||||||||||||||||||||||
Government of Italy | (1.00)% | Quarterly | BOFA | 6/20/24 | 233,000 | (2,390 | ) | 1,004 | (3,394 | ) | ||||||||||||||||||||||||||||||
Government of Italy | (1.00)% | Quarterly | BOFA | 6/20/24 | 140,000 | (1,436 | ) | 1,354 | (2,790 | ) | ||||||||||||||||||||||||||||||
Hochtief AG | (5.00)% | Quarterly | CITI | 6/20/27 | 17,000 | EUR | (2,878 | ) | (3,405 | ) | 527 | |||||||||||||||||||||||||||||
Hochtief AG | (5.00)% | Quarterly | JPHQ | 6/20/27 | 36,000 | EUR | (6,095 | ) | (6,898 | ) | 803 | |||||||||||||||||||||||||||||
Hochtief AG | (5.00)% | Quarterly | JPHQ | 6/20/27 | 17,000 | EUR | (2,878 | ) | (3,257 | ) | 379 | |||||||||||||||||||||||||||||
HP Inc. | (1.00)% | Quarterly | BNPP | 6/20/27 | 28,000 | (1 | ) | (117 | ) | 116 | ||||||||||||||||||||||||||||||
HP Inc. | (1.00)% | Quarterly | BNPP | 6/20/27 | 69,000 | (1 | ) | (63 | ) | 62 | ||||||||||||||||||||||||||||||
HP Inc. | (1.00)% | Quarterly | BNPP | 6/20/27 | 14,000 | — | — | — | ||||||||||||||||||||||||||||||||
HP Inc. | (1.00)% | Quarterly | BNPP | 6/20/27 | 28,000 | (1 | ) | 38 | (39 | ) | ||||||||||||||||||||||||||||||
HP Inc. | (1.00)% | Quarterly | GSCO | 6/20/27 | 60,000 | (1 | ) | 273 | (274 | ) | ||||||||||||||||||||||||||||||
HP Inc. | (1.00)% | Quarterly | JPHQ | 6/20/27 | 26,000 | — | 24 | (24 | ) | |||||||||||||||||||||||||||||||
ICE Ltd. | (5.00)% | Quarterly | JPHQ | 6/20/25 | 10,000 | EUR | 909 | 415 | 494 | |||||||||||||||||||||||||||||||
Itochu Corp. | (1.00)% | Quarterly | GSCO | 6/20/22 | 12,107,000 | JPY | (239 | ) | (61 | ) | (178 | ) | ||||||||||||||||||||||||||||
JFE Holdings Inc. | (1.00)% | Quarterly | GSCO | 6/20/22 | 5,348,000 | JPY | (104 | ) | (28 | ) | (76 | ) | ||||||||||||||||||||||||||||
Kohl’s Corp. | (1.00)% | Quarterly | GSCO | 6/20/26 | 41,000 | 3,114 | 679 | 2,435 | ||||||||||||||||||||||||||||||||
Lanxess AG | (1.00)% | Quarterly | BZWS | 6/20/27 | 100,000 | EUR | 1,626 | 795 | 831 | |||||||||||||||||||||||||||||||
Lanxess AG | (1.00)% | Quarterly | JPHQ | 6/20/27 | 12,000 | EUR | 195 | 412 | (217 | ) | ||||||||||||||||||||||||||||||
Lloyds Bank PLC | (1.00)% | Quarterly | BZWS | 6/20/27 | 27,000 | EUR | 575 | 868 | (293 | ) | ||||||||||||||||||||||||||||||
Lloyds Bank PLC | (1.00)% | Quarterly | CITI | 6/20/27 | 15,000 | EUR | 352 | 392 | (40 | ) | ||||||||||||||||||||||||||||||
Lloyds Bank PLC | (1.00)% | Quarterly | CITI | 6/20/27 | 79,000 | EUR | 1,682 | 2,415 | (733 | ) | ||||||||||||||||||||||||||||||
Louis Dreyfus Co. | (5.00)% | Quarterly | JPHQ | 6/20/27 | 33,000 | EUR | (4,627 | ) | (3,392 | ) | (1,235 | ) | ||||||||||||||||||||||||||||
Marubeni Corp. | (1.00)% | Quarterly | CITI | 6/20/25 | 3,711,000 | JPY | (753 | ) | 671 | (1,424 | ) | |||||||||||||||||||||||||||||
Marubeni Corp. | (1.00)% | Quarterly | GSCO | 6/20/22 | 18,860,000 | JPY | (371 | ) | (78 | ) | (293 | ) | ||||||||||||||||||||||||||||
MBIA Inc. | (5.00)% | Quarterly | BZWS | 6/20/22 | 23,000 | (274 | ) | (14 | ) | (260 | ) | |||||||||||||||||||||||||||||
MBIA Inc. | (5.00)% | Quarterly | CITI | 6/20/22 | 36,000 | (429 | ) | (61 | ) | (368 | ) | |||||||||||||||||||||||||||||
MBIA Inc. | (5.00)% | Quarterly | GSCO | 6/20/22 | 21,000 | (250 | ) | (28 | ) | (222 | ) | |||||||||||||||||||||||||||||
Michelin | (1.00)% | Quarterly | GSCO | 6/20/27 | 80,000 | EUR | (2,032 | ) | (1,826 | ) | (206 | ) | ||||||||||||||||||||||||||||
Mitsui O.S.K. Lines Ltd. | (1.00)% | Quarterly | JPHQ | 6/20/22 | 3,618,000 | JPY | (70 | ) | (4 | ) | (66 | ) | ||||||||||||||||||||||||||||
Mitsui O.S.K. Lines Ltd. | (1.00)% | Quarterly | JPHQ | 6/20/22 | 3,878,000 | JPY | (75 | ) | (5 | ) | (70 | ) | ||||||||||||||||||||||||||||
Next PLC | (1.00)% | Quarterly | CITI | 6/20/27 | 3,000 | EUR | 110 | 109 | 1 | |||||||||||||||||||||||||||||||
Next PLC | (1.00)% | Quarterly | CITI | 6/20/27 | 16,000 | EUR | 588 | 165 | 423 | |||||||||||||||||||||||||||||||
Next PLC | (1.00)% | Quarterly | CITI | 6/20/27 | 16,000 | EUR | 588 | 173 | 415 | |||||||||||||||||||||||||||||||
Next PLC | (1.00)% | Quarterly | CITI | 6/20/27 | 9,000 | EUR | 331 | 258 | 73 | |||||||||||||||||||||||||||||||
Next PLC | (1.00)% | Quarterly | CITI | 6/20/27 | 32,000 | EUR | 1,176 | 976 | 200 | |||||||||||||||||||||||||||||||
Novafives SAS | (5.00)% | Quarterly | JPHQ | 12/20/24 | 5,000 | EUR | 768 | 1,035 | (267 | ) | ||||||||||||||||||||||||||||||
Novafives SAS | (5.00)% | Quarterly | JPHQ | 12/20/24 | 12,000 | EUR | 1,842 | 2,447 | (605 | ) | ||||||||||||||||||||||||||||||
Saint-Gobain | (1.00)% | Quarterly | CITI | 6/20/27 | 130,000 | EUR | (1,647 | ) | (1,531 | ) | (116 | ) | ||||||||||||||||||||||||||||
Saint-Gobain | (1.00)% | Quarterly | CITI | 6/20/27 | 54,000 | EUR | (684 | ) | (612 | ) | (72 | ) | ||||||||||||||||||||||||||||
Saint-Gobain | (1.00)% | Quarterly | CITI | 6/20/27 | 37,000 | EUR | (469 | ) | (537 | ) | 68 | |||||||||||||||||||||||||||||
Saint-Gobain | (1.00)% | Quarterly | CITI | 6/20/27 | 27,000 | EUR | (342 | ) | (391 | ) | 49 | |||||||||||||||||||||||||||||
Saint-Gobain | (1.00)% | Quarterly | CITI | 6/20/27 | 18,000 | EUR | (228 | ) | (318 | ) | 90 | |||||||||||||||||||||||||||||
Saint-Gobain | (1.00)% | Quarterly | CITI | 6/20/27 | 6,000 | EUR | (76 | ) | (58 | ) | (18 | ) | ||||||||||||||||||||||||||||
Sherwin-Williams Co. (The) | (1.00)% | Quarterly | CITI | 6/20/27 | 179,000 | (1,477 | ) | (372 | ) | (1,105 | ) | |||||||||||||||||||||||||||||
| 32 | Annual Report | franklintempleton.com | ||||||||
FRANKLIN ALTERNATIVE STRATEGIES FUNDS
SCHEDULE OF INVESTMENTS
Franklin K2 Long Short Credit Fund (continued)
| Credit Default Swap Contracts (continued) | ||||||||||||||||||||||||||||||||||||||||
| Description | Annual Payment Rate Received (Paid) | Payment Frequency | Counterparty | Maturity Date | Notional Amounta | Value | Unamortized Upfront Payments (Receipts) | Unrealized Appreciation (Depreciation) | Ratingb | |||||||||||||||||||||||||||||||
| OTC Swap Contracts (continued) | ||||||||||||||||||||||||||||||||||||||||
| Contracts to Buy Protectionc (continued) | ||||||||||||||||||||||||||||||||||||||||
| Single Name (continued) |
| |||||||||||||||||||||||||||||||||||||||
Sherwin-Williams Co. (The) | (1.00)% | Quarterly | JPHQ | 6/20/27 | 36,000 | $ | (297 | ) | $ | (217 | ) | $ | (80 | ) | ||||||||||||||||||||||||||
Simon Property Group Inc. | (1.00)% | Quarterly | BZWS | 6/20/27 | 91,000 | 464 | (211 | ) | 675 | |||||||||||||||||||||||||||||||
Societe Generale SA | (1.00)% | Quarterly | BZWS | 12/20/23 | 200,000 | EUR | (2,013 | ) | 1,348 | (3,361 | ) | |||||||||||||||||||||||||||||
Softbank Group Corp. | (1.00)% | Quarterly | BZWS | 12/20/26 | 16,800,000 | JPY | 14,926 | 9,418 | 5,508 | |||||||||||||||||||||||||||||||
Softbank Group Corp. | (1.00)% | Quarterly | BZWS | 6/20/27 | 3,810,000 | JPY | 3,863 | 4,121 | (258 | ) | ||||||||||||||||||||||||||||||
Softbank Group Corp. | (1.00)% | Quarterly | BZWS | 6/20/27 | 5,880,000 | JPY | 5,962 | 6,036 | (74 | ) | ||||||||||||||||||||||||||||||
Softbank Group Corp. | (1.00)% | Quarterly | BZWS | 6/20/27 | 16,800,000 | JPY | 17,291 | 17,597 | (306 | ) | ||||||||||||||||||||||||||||||
Solvay SA | (1.00)% | Quarterly | GSCO | 6/20/27 | 35,000 | EUR | (145 | ) | (320 | ) | 175 | |||||||||||||||||||||||||||||
Solvay SA | (1.00)% | Quarterly | GSCO | 6/20/27 | 36,000 | EUR | (149 | ) | (250 | ) | 101 | |||||||||||||||||||||||||||||
Solvay SA | (1.00)% | Quarterly | GSCO | 6/20/27 | 17,000 | EUR | (70 | ) | (163 | ) | 93 | |||||||||||||||||||||||||||||
Stena AB | (5.00)% | Quarterly | BZWS | 6/20/24 | 15,000 | EUR | (792 | ) | (455 | ) | (337 | ) | ||||||||||||||||||||||||||||
Stena AB | (5.00)% | Quarterly | GSCO | 12/20/24 | 92,000 | EUR | (4,790 | ) | (4,649 | ) | (141 | ) | ||||||||||||||||||||||||||||
Stena AB | (5.00)% | Quarterly | GSCO | 6/20/27 | 3,000 | EUR | (46 | ) | (6 | ) | (40 | ) | ||||||||||||||||||||||||||||
Stena AB | (5.00)% | Quarterly | JPHQ | 6/20/27 | 2,000 | EUR | (31 | ) | 21 | (52 | ) | |||||||||||||||||||||||||||||
Stena AB | (5.00)% | Quarterly | JPHQ | 6/20/27 | 6,000 | EUR | (94 | ) | 76 | (170 | ) | |||||||||||||||||||||||||||||
Stena AB | (5.00)% | Quarterly | JPHQ | 6/20/27 | 28,000 | EUR | (433 | ) | 183 | (616 | ) | |||||||||||||||||||||||||||||
Stena AB | (5.00)% | Quarterly | JPHQ | 6/20/27 | 10,000 | EUR | (154 | ) | 245 | (399 | ) | |||||||||||||||||||||||||||||
Stena AB | (5.00)% | Quarterly | JPHQ | 6/20/27 | 35,000 | EUR | (541 | ) | 297 | (838 | ) | |||||||||||||||||||||||||||||
TDC Holding | (1.00)% | Quarterly | BNPP | 6/20/27 | 60,000 | EUR | 3,368 | 3,418 | (50 | ) | ||||||||||||||||||||||||||||||
The Boeing Co. | (1.00)% | Quarterly | BZWS | 6/20/27 | 23,000 | 1,209 | 961 | 248 | ||||||||||||||||||||||||||||||||
The Boeing Co. | (1.00)% | Quarterly | CITI | 6/20/27 | 31,000 | 1,629 | 1,282 | 347 | ||||||||||||||||||||||||||||||||
The Boeing Co. | (1.00)% | Quarterly | CITI | 6/20/27 | 62,000 | 3,258 | 1,861 | 1,397 | ||||||||||||||||||||||||||||||||
U.S. Steel Corp. | (5.00)% | Quarterly | JPHQ | 6/20/27 | 32,000 | (396 | ) | (792 | ) | 396 | ||||||||||||||||||||||||||||||
Whirlpool Corp. | (1.00)% | Quarterly | JPHQ | 6/20/27 | 28,000 | 378 | 141 | 237 | ||||||||||||||||||||||||||||||||
Whirlpool Corp. | (1.00)% | Quarterly | JPHQ | 6/20/27 | 16,000 | 216 | 239 | (23 | ) | |||||||||||||||||||||||||||||||
Whirlpool Corp. | (1.00)% | Quarterly | JPHQ | 6/20/27 | 16,000 | 216 | 253 | (37 | ) | |||||||||||||||||||||||||||||||
Whirlpool Corp. | (1.00)% | Quarterly | JPHQ | 6/20/27 | 16,000 | 216 | 281 | (65 | ) | |||||||||||||||||||||||||||||||
Whirlpool Corp. | (1.00)% | Quarterly | JPHQ | 6/20/27 | 16,000 | 216 | 295 | (79 | ) | |||||||||||||||||||||||||||||||
Whirlpool Corp. | (1.00)% | Quarterly | JPHQ | 6/20/27 | 16,000 | 216 | 302 | (86 | ) | |||||||||||||||||||||||||||||||
Whirlpool Corp. | (1.00)% | Quarterly | JPHQ | 6/20/27 | 51,000 | 689 | 465 | 224 | ||||||||||||||||||||||||||||||||
WPP Finance SA | (1.00)% | Quarterly | CITI | 6/20/27 | 13,000 | EUR | 56 | — | 56 | |||||||||||||||||||||||||||||||
WPP Finance SA | (1.00)% | Quarterly | CITI | 6/20/27 | 24,000 | EUR | 103 | — | 103 | |||||||||||||||||||||||||||||||
WPP Finance SA | (1.00)% | Quarterly | CITI | 6/20/27 | 16,000 | EUR | 69 | 12 | 57 | |||||||||||||||||||||||||||||||
WPP Finance SA | (1.00)% | Quarterly | CITI | 6/20/27 | 32,000 | EUR | 138 | 32 | 106 | |||||||||||||||||||||||||||||||
WPP Finance SA | (1.00)% | Quarterly | GSCO | 6/20/27 | 51,000 | EUR | 219 | 131 | 88 | |||||||||||||||||||||||||||||||
| Contracts to Sell Protectionc,d | ||||||||||||||||||||||||||||||||||||||||
| Single Name |
| |||||||||||||||||||||||||||||||||||||||
American Axle & Manufacturing Inc. | 5.00% | Quarterly | BZWS | 6/20/25 | 32,000 | 1,055 | 1,035 | 20 | BB- | |||||||||||||||||||||||||||||||
Euro Garages Ltd. | 5.00% | Quarterly | GSCO | 6/20/27 | 16,000 | EUR | 655 | 316 | 339 | B- | ||||||||||||||||||||||||||||||
Kohl’s Corp. | 1.00% | Quarterly | JPHQ | 6/20/26 | 41,000 | (3,114 | ) | (3,001 | ) | (113 | ) | BBB- | ||||||||||||||||||||||||||||
|
| |||||||||||||||||||||||||||||||||||||||
Total OTC Swap Contracts |
| $ | (33,658 | ) | $ | (36,696 | ) | $ | 3,038 | |||||||||||||||||||||||||||||||
|
| |||||||||||||||||||||||||||||||||||||||
Total Credit Default Swap Contracts |
| $ | (171,742 | ) | $ | (178,001 | ) | $ | 6,259 | |||||||||||||||||||||||||||||||
|
| |||||||||||||||||||||||||||||||||||||||
aIn U.S. dollars unless otherwise indicated. For contracts to sell protection, the notional amount is equal to the maximum potential amount of the future payments and no recourse provisions have been entered into in association with the contracts.
bBased on Standard and Poor’s (S&P) Rating for single name swaps.
cPerformance triggers for settlement of contract include default, bankruptcy or restructuring for single name swaps and failure to pay or bankruptcy of the underlying securities for traded index swaps.
dThe Fund enters contracts to sell protection to create a long credit position.
| franklintempleton.com | Annual Report | 33 | ||||||||
FRANKLIN ALTERNATIVE STRATEGIES FUNDS
SCHEDULE OF INVESTMENTS
Franklin K2 Long Short Credit Fund (continued)
At May 31, 2022, the Fund had the following interest rate swap contracts outstanding. See Note 1(d).
| Interest Rate Swap Contracts | ||||||||||||||||
| Description | Payment Frequency | Maturity Date | Notional Amount* | Value/Unrealized Appreciation (Depreciation) | ||||||||||||
| Centrally Cleared Swap Contracts | ||||||||||||||||
Receive Floating rate 1 Year-SOFR | Annually | 3/08/24 | 1,000,000 | $ | 21,176 | |||||||||||
Receive Floating rate 6 Month-PRIBOR | Semi-Annually | 6/15/24 | 2,723,637 | CZK | 723 | |||||||||||
Receive Floating rate 6 Month-PRIBOR | Semi-Annually | 6/15/24 | 16,916,355 | CZK | 2,683 | |||||||||||
Receive Fixed 11.94% | Annually | 1/04/27 | 1,721,476 | BRL | (624 | ) | ||||||||||
Receive Floating Banxico Mexico 1 Month rate | Monthly | 6/09/27 | 9,213,212 | MXN | (7,521 | ) | ||||||||||
Receive Floating rate 3 Month USD-LIBOR | Quarterly | 6/20/28 | 1,100,000 | (38,097 | ) | |||||||||||
Receive Floating rate 1 Year-SOFR | Annually | 3/08/32 | 1,000,000 | 96,142 | ||||||||||||
|
| |||||||||||||||
Total Interest Rate Swap Contracts |
| $ | 74,482 | |||||||||||||
|
| |||||||||||||||
*In U.S. dollars unless otherwise indicated.
At May 31, 2022, the Fund had the following total return swap contracts outstanding. See Note 1(d).
| Total Return Swap Contracts | ||||||||||||||||||||||||
| Underlying Instrument | Financing Rate | Payment Frequency | Counterparty | Maturity Date | Notional Value | Value/ Unrealized Appreciation (Depreciation) | ||||||||||||||||||
| OTC Swap Contracts | ||||||||||||||||||||||||
| Equity Contracts – Longa | ||||||||||||||||||||||||
Clearway Energy Inc. | 1-Month LIBOR + 0.40 | % | Monthly | GSCO | 4/20/23 | $ | 133,322 | $ | 7,375 | |||||||||||||||
Energy Transfer LP | 1-Month LIBOR + 0.90 | % | Monthly | GSCO | 10/03/22 | 21,543 | 22 | |||||||||||||||||
Energy Transfer LP | 1-Month LIBOR + 0.50 | % | Monthly | CITI | 10/18/22 | 34,265 | 5,164 | |||||||||||||||||
Energy Transfer LP | 1-Month LIBOR + 0.90 | % | Monthly | GSCO | 2/14/23 | 70,932 | 503 | |||||||||||||||||
|
| |||||||||||||||||||||||
Total – Total Return Swap Contracts |
| $ | 13,064 | |||||||||||||||||||||
|
| |||||||||||||||||||||||
aThe Fund receives the total return on the underlying instrument and pays a variable financing rate.
See Note 12 regarding other derivative information.
See Abbreviations on page 54.
| 34 | Annual Report | franklintempleton.com | ||||||||
FRANKLIN ALTERNATIVE STRATEGIES FUNDS
FINANCIAL STATEMENTS
Statement of Assets and Liabilities
May 31, 2022
Franklin K2 Long Short Credit Fund
Assets: | ||||
Investments in securities: | ||||
Cost – Unaffiliated issuers | $ | 91,147,108 | ||
Cost – Unaffiliated repurchase agreements | 356,386 | |||
|
| |||
Value – Unaffiliated issuers | $ | 85,776,594 | ||
Value – Unaffiliated repurchase agreements | 356,386 | |||
Cash | 383,712 | |||
Restricted cash for OTC derivatives (Note 1e) | 160,000 | |||
Foreign currency, at value (cost $1,339,013) | 1,350,901 | |||
Receivables: | ||||
Investment securities sold | 1,703,152 | |||
Capital shares sold | 121,399 | |||
Dividends and interest | 703,691 | |||
Deposits with brokers for: | ||||
Securities sold short | 3,684,559 | |||
OTC derivative contracts | 390,000 | |||
Futures contracts | 143,800 | |||
Centrally cleared swap contracts | 356,665 | |||
Due from brokers | 263,487 | |||
Variation margin on futures contracts | 33,195 | |||
Variation margin on centrally cleared swap contracts | 17,685 | |||
OTC swap contracts (upfront payments $149,368) | 134,193 | |||
Unrealized appreciation on OTC forward exchange contracts | 218,521 | |||
Unrealized appreciation on OTC swap contracts | 58,783 | |||
|
| |||
Total assets | 95,856,723 | |||
|
| |||
Liabilities: | ||||
Payables: | ||||
Investment securities purchased | 3,139,615 | |||
Capital shares redeemed | 468,783 | |||
Management fees | 45,100 | |||
Distribution fees | 6,094 | |||
Trustees’ fees and expenses | 17 | |||
Transfer agent fees | 25,737 | |||
Deposits from brokers for: | ||||
OTC derivative contracts | 160,000 | |||
Due to brokers | 204,003 | |||
OTC swap contracts (upfront receipts $190,579) | 170,889 | |||
Options written, at value (premiums received $454,741) | 299,678 | |||
Securities sold short, at value (proceeds $4,145,995) | 3,861,981 | |||
Unrealized depreciation on OTC forward exchange contracts | 132,472 | |||
Unrealized depreciation on OTC swap contracts | 42,681 | |||
Unrealized depreciation on unfunded loan commitments (Note 11) | 35,304 | |||
Accrued expenses and other liabilities | 205,929 | |||
|
| |||
Total liabilities | 8,798,283 | |||
|
| |||
Net assets, at value | $ | 87,058,440 | ||
|
| |||
Net assets consist of: | ||||
Paid-in capital | $ | 91,410,912 | ||
Total distributable earnings (loss) | (4,352,472 | ) | ||
|
| |||
Net assets, at value | $ | 87,058,440 | ||
|
| |||
| franklintempleton.com | The accompanying notes are an integral part of these financial statements. | Annual Report | 35 | ||||||||
FRANKLIN ALTERNATIVE STRATEGIES FUNDS
FINANCIAL STATEMENTS
Statement of Assets and Liabilities (continued)
May 31, 2022
Franklin K2 Long Short Credit Fund
| Class A: | ||||
Net assets, at value | $17,505,880 | |||
|
| |||
Shares outstanding | 1,734,002 | |||
|
| |||
Net asset value per sharea | $10.10 | |||
|
| |||
Maximum offering price per share (net asset value per share ÷ 94.50%) | $10.69 | |||
|
| |||
| Class C: | ||||
Net assets, at value | $2,592,277 | |||
|
| |||
Shares outstanding | 261,609 | |||
|
| |||
Net asset value and maximum offering price per sharea | $9.91 | |||
|
| |||
| Class R: | ||||
Net assets, at value | $218,402 | |||
|
| |||
Shares outstanding | 21,876 | |||
|
| |||
Net asset value and maximum offering price per share | $9.98 | |||
|
| |||
| Class R6: | ||||
Net assets, at value | $14,910 | |||
|
| |||
Shares outstanding | 1,472 | |||
|
| |||
Net asset value and maximum offering price per share | $10.13 | |||
|
| |||
| Advisor Class: | ||||
Net assets, at value | $66,726,971 | |||
|
| |||
Shares outstanding | 6,604,955 | |||
|
| |||
Net asset value and maximum offering price per share | $10.10 | |||
|
| |||
aRedemption price is equal to net asset value less contingent deferred sales charges, if applicable.
| 36 | Annual Report | The accompanying notes are an integral part of these financial statements. | franklintempleton.com | ||||||||
FRANKLIN ALTERNATIVE STRATEGIES FUNDS
FINANCIAL STATEMENTS
Statement of Operations
for the year ended May 31, 2022
Franklin K2 Long Short Credit Fund
Investment income: | ||||
Dividends: | ||||
Unaffiliated issuers | $ | 72,630 | ||
Interest: (net of foreign taxes)~ | ||||
Unaffiliated issuers: | ||||
Paydown gain (loss) | 407,536 | |||
Paid in cash | 4,153,603 | |||
|
| |||
Total investment income | 4,633,769 | |||
|
| |||
Expenses: | ||||
Management fees (Note 3a) | 1,616,761 | |||
Distribution fees: (Note 3c) | ||||
Class A | 52,444 | |||
Class C | 27,656 | |||
Class R | 1,041 | |||
Transfer agent fees: (Note 3e) | ||||
Class A | 27,887 | |||
Class C | 3,470 | |||
Class R | 266 | |||
Class R6 | 154 | |||
Advisor Class | 95,921 | |||
Custodian fees (Note 4) . | 73,800 | |||
Reports to shareholders fees | 41,957 | |||
Registration and filing fees | 76,366 | |||
Professional fees | 181,040 | |||
Trustees’ fees and expenses | 27,729 | |||
Dividends and interest on securities sold short | 228,021 | |||
Security borrowing fees | 63,398 | |||
Other | 41,058 | |||
|
| |||
Total expenses | 2,558,969 | |||
Expense reductions (Note 4) | (73 | ) | ||
Expenses waived/paid by affiliates (Note 3f) | (519,024 | ) | ||
|
| |||
Net expenses | 2,039,872 | |||
|
| |||
Net investment income | 2,593,897 | |||
|
| |||
Realized and unrealized gains (losses): | ||||
Net realized gain (loss) from: | ||||
Investments: | ||||
Unaffiliated issuers | 104,826 | |||
Written options | (25,846 | ) | ||
Foreign currency transactions | (169,057 | ) | ||
Forward exchange contracts | 135,277 | |||
Futures contracts | (172,148 | ) | ||
Securities sold short | 265,456 | |||
Swap contracts | (17,488 | ) | ||
|
| |||
Net realized gain (loss) | 121,020 | |||
|
| |||
Net change in unrealized appreciation (depreciation) on: | ||||
Investments: | ||||
Unaffiliated issuers | (8,545,488 | ) | ||
Written options | 156,079 | |||
Translation of other assets and liabilities denominated in foreign currencies | (66,712 | ) | ||
Forward exchange contracts | 288,978 | |||
Futures contracts | 110,292 | |||
Securities sold short | 669,552 | |||
Swap contracts | 780,905 | |||
|
| |||
Net change in unrealized appreciation (depreciation) | (6,606,394 | ) | ||
|
| |||
Net realized and unrealized gain (loss) | (6,485,374 | ) | ||
|
| |||
Net increase (decrease) in net assets resulting from operations | $ | (3,891,477 | ) | |
|
| |||
~ Foreign taxes withheld on interest | $ | 5 | ||
| franklintempleton.com | The accompanying notes are an integral part of these financial statements. | Annual Report | 37 | ||||||||
FRANKLIN ALTERNATIVE STRATEGIES FUNDS
FINANCIAL STATEMENTS
Statements of Changes in Net Assets
Franklin K2 Long Short Credit Fund
| Year Ended May 31, | ||||||||
| 2022 | 2021 | |||||||
Increase (decrease) in net assets: | ||||||||
Operations: | ||||||||
Net investment income | $ | 2,593,897 | $ | 2,724,125 | ||||
Net realized gain (loss) | 121,020 | 1,198,529 | ||||||
Net change in unrealized appreciation (depreciation) | (6,606,394 | ) | 8,574,158 | |||||
|
| |||||||
Net increase (decrease) in net assets resulting from operations | (3,891,477 | ) | 12,496,812 | |||||
|
| |||||||
Distributions to shareholders: | ||||||||
Class A | (783,078 | ) | (567,339 | ) | ||||
Class C | (70,593 | ) | (51,591 | ) | ||||
Class R | (6,238 | ) | (4,161 | ) | ||||
Class R6 | (576 | ) | (138 | ) | ||||
Advisor Class | (2,881,103 | ) | (1,899,712 | ) | ||||
|
| |||||||
Total distributions to shareholders | (3,741,588 | ) | (2,522,941 | ) | ||||
|
| |||||||
Capital share transactions: (Note 2) | ||||||||
Class A | (7,496,625 | ) | 4,161,929 | |||||
Class C | (143,137 | ) | (226,267 | ) | ||||
Class R | 39,422 | 8,527 | ||||||
Class R6 | 10,364 | — | ||||||
Advisor Class | (4,083,126 | ) | (3,869,073 | ) | ||||
|
| |||||||
Total capital share transactions | (11,673,102 | ) | 75,116 | |||||
|
| |||||||
Net increase (decrease) in net assets | (19,306,167 | ) | 10,048,987 | |||||
Net assets: | ||||||||
Beginning of year | 106,364,607 | 96,315,620 | ||||||
|
| |||||||
End of year | $ | 87,058,440 | $ | 106,364,607 | ||||
|
| |||||||
| 38 | Annual Report | The accompanying notes are an integral part of these financial statements. | franklintempleton.com | ||||||||
FRANKLIN ALTERNATIVE STRATEGIES FUNDS
FRANKLIN K2 LONG SHORT CREDIT FUND
1. Organization and Significant Accounting Policies
Franklin Alternative Strategies Funds (Trust) is registered under the Investment Company Act of 1940 (1940 Act) as an open-end management investment company, consisting of two separate funds and applies the specialized accounting and reporting guidance in U.S. Generally Accepted Accounting Principles (U.S. GAAP). Franklin K2 Long Short Credit Fund (Fund) is included in this report. The Fund offers five classes of shares: Class A, Class C, Class R, Class R6 and Advisor Class. Effective August 2, 2021, Class C shares automatically convert to Class A shares on a monthly basis, after they have been held for 8 years. Prior to August 2, 2021, Class C shares converted to Class A shares after a 10-year holding period. Each class of shares may differ by its initial sales load, contingent deferred sales charges, voting rights on matters affecting a single class, its exchange privilege and fees due to differing arrangements for distribution and transfer agent fees.
The following summarizes the Fund’s significant accounting policies.
a. Financial Instrument Valuation
The Fund’s investments in financial instruments are carried at fair value daily. Fair value is the price that would be received to sell an asset or paid to transfer a liability in an orderly transaction between market participants on the measurement date. The Fund calculates the net asset value
(NAV) per share each business day as of 4 p.m. Eastern time or the regularly scheduled close of the New York Stock Exchange (NYSE), whichever is earlier. Under compliance policies and procedures approved by the Trust’s Board of Trustees (the Board), the Fund’s administrator has responsibility for oversight of valuation, including leading the cross-functional Valuation Committee (VC). The Fund may utilize independent pricing services, quotations from securities and financial instrument dealers, and other market sources to determine fair value.
Equity securities and derivative financial instruments listed on an exchange or on the NASDAQ National Market System are valued at the last quoted sale price or the official closing price of the day, respectively. Foreign equity securities are valued as of the close of trading on the foreign stock exchange on which the security is primarily traded or as of 4 p.m. Eastern time. The value is then converted into its U.S. dollar equivalent at the foreign exchange rate in effect at 4 p.m. Eastern time on the day that the value of the security
is determined. Over-the-counter (OTC) securities are valued within the range of the most recent quoted bid and ask prices. Securities that trade in multiple markets or on multiple exchanges are valued according to the broadest and most representative market. Certain equity securities are valued based upon fundamental characteristics or relationships to similar securities.
Debt securities generally trade in the OTC market rather than on a securities exchange. The Fund’s pricing services use multiple valuation techniques to determine fair value. In instances where sufficient market activity exists, the pricing services may utilize a market-based approach through which quotes from market makers are used to determine fair value. In instances where sufficient market activity may not exist or is limited, the pricing services also utilize proprietary valuation models which may consider market characteristics such as benchmark yield curves, credit spreads, estimated default rates, anticipated market interest rate volatility, coupon rates, anticipated timing of principal repayments, underlying collateral, and other unique security features in order to estimate the relevant cash flows, which are then discounted to calculate the fair value. Securities denominated in a foreign currency are converted into their U.S. dollar equivalent at the foreign exchange rate in effect at 4 p.m. Eastern time on the date that the values of the foreign debt securities are determined.
Investments in open-end mutual funds are valued at the closing NAV. Investments in repurchase agreements are valued at cost, which approximates fair value.
Certain derivative financial instruments are centrally cleared or trade in the OTC market. The Fund’s pricing services use various techniques including industry standard option pricing models and proprietary discounted cash flow models to determine the fair value of those instruments. The Fund’s net benefit or obligation under the derivative contract, as measured by the fair value of the contract, is included in net assets.
The Fund has procedures to determine the fair value of financial instruments for which market prices are not reliable or readily available. Under these procedures, the Fund primarily employs a market-based approach which may use related or comparable assets or liabilities, recent transactions, market multiples, book values, and other relevant information for the investment to determine the fair value of the investment. An income-based valuation approach may also be used in which the anticipated future cash flows of the investment are
| franklintempleton.com | Annual Report | 39 | ||||||||
FRANKLIN ALTERNATIVE STRATEGIES FUNDS
NOTES TO FINANCIAL STATEMENTS
Franklin K2 Long Short Credit Fund (continued)
1. Organization and Significant Accounting Policies (continued)
a. Financial Instrument Valuation (continued)
discounted to calculate fair value. Discounts may also be applied due to the nature or duration of any restrictions on the disposition of the investments. Due to the inherent uncertainty of valuations of such investments, the fair values may differ significantly from the values that would have been used had an active market existed.
Trading in securities on foreign securities stock exchanges and OTC markets may be completed before 4 p.m. Eastern time. In addition, trading in certain foreign markets may not take place on every Fund’s business day. Events can occur between the time at which trading in a foreign security is completed and 4 p.m. Eastern time that might call into question the reliability of the value of a portfolio security held by the Fund. As a result, differences may arise between the value of the Fund’s portfolio securities as determined at the foreign market close and the latest indications of value at 4 p.m. Eastern time. In order to minimize the potential for these differences, an independent pricing service may be used to adjust the value of the Funds’ portfolio securities to the latest indications of fair value at 4 p.m. Eastern time. At May 31, 2022, certain securities may have been fair valued using these procedures, in which case the securities were categorized as Level 2 inputs within the fair value hierarchy (referred to as “market level fair value”). See the Fair Value Measurements note for more information.
When the last day of the reporting period is a non-business day, certain foreign markets may be open on those days that the Fund’s NAV is not calculated, which could result in differences between the value of the Fund’s portfolio securities on the last business day and the last calendar day of the reporting period. Any significant security valuation changes due to an open foreign market are adjusted and reflected by the Fund for financial reporting purposes.
b. Foreign Currency Translation
Portfolio securities and other assets and liabilities denominated in foreign currencies are translated into U.S. dollars based on the exchange rate of such currencies against U.S. dollars on the date of valuation. The Fund may enter into foreign currency exchange contracts to facilitate transactions denominated in a foreign currency. Purchases and sales of securities, income and expense items denominated in foreign
currencies are translated into U.S. dollars at the exchange rate in effect on the transaction date. Portfolio securities and assets and liabilities denominated in foreign currencies contain risks that those currencies will decline in value relative to the U.S. dollar. Occasionally, events may impact the availability or reliability of foreign exchange rates used to convert the U.S. dollar equivalent value. If such an event occurs, the foreign exchange rate will be valued at fair value using procedures established and approved by the Board.
The Fund does not separately report the effect of changes in foreign exchange rates from changes in market prices on securities held. Such changes are included in net realized and unrealized gain or loss from investments in the Statement of Operations.
Realized foreign exchange gains or losses arise from sales of foreign currencies, currency gains or losses realized between the trade and settlement dates on securities transactions and the difference between the recorded amounts of dividends, interest, and foreign withholding taxes and the
U.S. dollar equivalent of the amounts actually received or paid. Net unrealized foreign exchange gains and losses arise from changes in foreign exchange rates on foreign denominated assets and liabilities other than investments in securities held at the end of the reporting period.
c. Joint Repurchase Agreement
The Fund enters into a joint repurchase agreement whereby its uninvested cash balance is deposited into a joint cash account with other funds managed by the investment manager or an affiliate of the investment manager and is used to invest in one or more repurchase agreements. The value and face amount of the joint repurchase agreement are allocated to the funds based on their pro-rata interest. A repurchase agreement is accounted for as a loan by the Fund to the seller, collateralized by securities which are delivered to the Fund’s custodian. The fair value, including accrued interest, of the initial collateralization is required to be at least 102% of the dollar amount invested by the funds, with the value of the underlying securities marked to market daily to maintain coverage of at least 100%. Repurchase agreements are subject to the terms of Master Repurchase Agreements (MRAs) with approved counterparties (sellers). The MRAs contain various provisions, including but not limited to events of default and maintenance of collateral for repurchase agreements. In the event of default by either the seller or the Fund, certain MRAs may permit the non-defaulting party to net and
| 40 | Annual Report | franklintempleton.com | ||||||||
FRANKLIN ALTERNATIVE STRATEGIES FUNDS
NOTES TO FINANCIAL STATEMENTS
Franklin K2 Long Short Credit Fund (continued)
close-out all transactions, if any, traded under such agreements. The Fund may sell securities it holds as collateral and apply the proceeds towards the repurchase price and any other amounts owed by the seller to the Fund in the event of default by the seller. This could involve costs or delays in addition to a loss on the securities if their value falls below the repurchase price owed by the seller. The joint repurchase agreement held by the Fund at year end, as indicated in the Schedule of Investments, had been entered into on May 31, 2022.
d. Derivative Financial Instruments
The Fund invested in derivative financial instruments in order to manage risk or gain exposure to various other investments or markets. Derivatives are financial contracts based on an underlying or notional amount, require no initial investment or an initial net investment that is smaller than would normally be required to have a similar response to changes in market factors, and require or permit net settlement. Derivatives contain various risks including the potential inability of the counterparty to fulfill their obligations under the terms of the contract, the potential for an illiquid secondary market, and/or the potential for market movements which expose the Fund to gains or losses in excess of the amounts shown in the Statement of Assets and Liabilities. Realized gain and loss and unrealized appreciation and depreciation on these contracts for the period are included in the Statement of Operations.
Derivative counterparty credit risk is managed through a formal evaluation of the creditworthiness of all potential counterparties. The Fund attempts to reduce its exposure to counterparty credit risk on OTC derivatives, whenever possible, by entering into International Swaps and Derivatives Association (ISDA) master agreements with certain counterparties. These agreements contain various provisions, including but not limited to collateral requirements, events of default, or early termination. Termination events applicable to the counterparty include certain deteriorations in the credit quality of the counterparty. Termination events applicable to the Fund include failure of the Fund to maintain certain net asset levels and/or limit the decline in net assets over various periods of time. In the event of default or early termination, the ISDA master agreement gives the non-defaulting party the right to net and close-out all transactions traded, whether or not arising under the ISDA agreement, to one net amount payable by one counterparty to the other. However, absent an event of default or early termination, OTC derivative assets and liabilities are presented gross and not offset in the
Statement of Assets and Liabilities. Early termination by the counterparty may result in an immediate payment by the Fund of any net liability owed to that counterparty under the ISDA agreement.
Collateral requirements differ by type of derivative. Collateral or initial margin requirements are set by the broker or exchange clearing house for exchange traded and centrally cleared derivatives. Initial margin deposited is held at the exchange and can be in the form of cash and/or securities. For OTC derivatives traded under an ISDA master agreement, posting of collateral is required by either the Fund or the applicable counterparty if the total net exposure of all OTC derivatives with the applicable counterparty exceeds the minimum transfer amount, which typically ranges from
$100,000 to $250,000, and can vary depending on the counterparty and the type of agreement. Generally, collateral is determined at the close of Fund business each day and any additional collateral required due to changes in derivative values may be delivered by the Fund or the counterparty the next business day, or within a few business days. Collateral pledged and/or received by the Fund for OTC derivatives, if any, is held in segregated accounts with the Fund’s custodian/counterparty broker and can be in the form of cash and/or securities. Unrestricted cash may be invested according to the Fund’s investment objectives. To the extent that the amounts due to the Fund from its counterparties are not subject to collateralization or are not fully collateralized, the Fund bears the risk of loss from counterparty non-performance.
The Fund entered into exchange traded futures contracts primarily to manage and/or gain exposure to interest rate and equity price risk. A futures contract is an agreement between the Fund and a counterparty to buy or sell an asset at a specified price on a future date. Required initial margins are pledged by the Fund, and the daily change in fair value is accounted for as a variation margin payable or receivable in the Statement of Assets and Liabilities.
The Fund entered into OTC forward exchange contracts primarily to manage and/or gain exposure to certain foreign currencies. A forward exchange contract is an agreement between the Fund and a counterparty to buy or sell a foreign currency at a specific exchange rate on a future date.
The Fund entered into credit default swap contracts primarily to manage and/or gain exposure to credit risk. A credit default swap is an agreement between the Fund and a counterparty whereby the buyer of the contract receives credit protection
| franklintempleton.com | Annual Report | 41 | ||||||||
FRANKLIN ALTERNATIVE STRATEGIES FUNDS
NOTES TO FINANCIAL STATEMENTS
Franklin K2 Long Short Credit Fund (continued)
1. Organization and Significant Accounting Policies (continued)
d. Derivative Financial Instruments (continued)
and the seller of the contract guarantees the credit worthiness of a referenced debt obligation. These agreements may be privately negotiated in the over-the-counter market (OTC credit default swaps) or may be executed in a multilateral trade facility platform, such as a registered exchange (centrally cleared credit default swaps). The underlying referenced debt obligation may be a single issuer of corporate or sovereign debt, a credit index, a basket of issuers or indices, or a tranche of a credit index or basket of issuers or indices. In the event of a default of the underlying referenced debt obligation, the buyer is entitled to receive the notional amount of the credit default swap contract from the seller in exchange for the referenced debt obligation, a net settlement amount equal to the notional amount of the credit default swap less the recovery value of the referenced debt obligation, or other agreed upon amount. For centrally cleared credit default swaps, required initial margins are pledged by the Fund, and the daily change in fair value is accounted for as a variation margin payable or receivable in the Statement of Assets and Liabilities. Over the term of the contract, the buyer pays the seller a periodic stream of payments, provided that no event of default has occurred. Such periodic payments are accrued daily as an unrealized appreciation or depreciation until the payments are made, at which time they are realized. Upfront payments and receipts are reflected in the Statement of Assets and Liabilities and represent compensating factors between stated terms of the credit default swap agreement and prevailing market conditions (credit spreads and other relevant factors). These upfront payments and receipts are amortized over the term of the contract as a realized gain or loss in the Statement of Operations.
The Fund entered into interest rate swap contracts primarily to manage and/or gain exposure to interest rate risk. An interest rate swap is an agreement between the Fund and a counterparty to exchange cash flows based on the difference between two interest rates, applied to a notional amount. These agreements may be privately negotiated in the over-the-counter market (OTC interest rate swaps) or may be executed on a registered exchange (centrally cleared interest rate swaps). For centrally cleared interest rate swaps, required initial margins are pledged by the Fund, and the daily change in fair value is accounted for as a variation margin payable or receivable in the Statement of Assets and
Liabilities. Over the term of the contract, contractually required payments to be paid and to be received are accrued daily and recorded as unrealized depreciation and appreciation until the payments are made, at which time they are realized.
The Fund entered into OTC total return swap contracts primarily to manage and/or gain exposure to equity price of an underlying instrument such as a stock, bond, index or basket of securities or indices. A total return swap is an agreement between the Fund and a counterparty to exchange a return linked to an underlying instrument for a floating or fixed rate payment, both based upon a notional amount. Over the term of the contract, contractually required payments to be paid or received are accrued daily and recorded as unrealized appreciation or depreciation until the payments are made, at which time they are recognized as realized gain or loss.
The Fund purchased or wrote exchange traded and/or OTC option contracts primarily to manage and/or gain exposure to equity price, interest rate and foreign exchange rate risk. An option is a contract entitling the holder to purchase or sell a specific amount of shares or units of an asset or notional amount of a swap (swaption), at a specified price. When an option is purchased or written, an amount equal to the premium paid or received is recorded as an asset or liability, respectively. Upon exercise of an option, the acquisition cost or sales proceeds of the underlying investment is adjusted by any premium received or paid. Upon expiration of an option, any premium received or paid is recorded as a realized gain or loss. Upon closing an option other than through expiration or exercise, the difference between the premium received or paid and the cost to close the position is recorded as a realized gain or loss.
See Note 12 regarding other derivative information.
e. Restricted Cash
At May 31, 2022, the Fund held restricted cash in connection with investments in certain derivative securities. Restricted cash is held in a segregated account with the Fund’s custodian/counterparty broker and is reflected in the Statement of Assets and Liabilities.
f. Securities Sold Short
The Fund is engaged in selling securities short, which obligates the Fund to replace a borrowed security with the same security at current fair value. The Fund incurs a loss if the
| 42 | Annual Report | franklintempleton.com | ||||||||
FRANKLIN ALTERNATIVE STRATEGIES FUNDS
NOTES TO FINANCIAL STATEMENTS
Franklin K2 Long Short Credit Fund (continued)
price of the security increases between the date of the short sale and the date on which the Fund replaces the borrowed security. The Fund realizes a gain if the price of the security declines between those dates. Gains are limited to the price at which the Fund sold the security short, while losses are potentially unlimited in size.
The Fund is required to establish a margin account with the broker lending the security sold short. While the short sale is outstanding, the broker retains the proceeds of the short sale to the extent necessary to meet margin requirements until the short position is closed out. A deposit must also be maintained with the Fund’s custodian/counterparty broker consisting of cash and/or securities having a value equal to a specified percentage of the value of the securities sold short. The Fund is obligated to pay fees for borrowing the securities sold short and is required to pay the counterparty any dividends and/or interest due on securities sold short. Such dividends and/or interest and any security borrowing fees are recorded as an expense to the Fund.
g. Senior Floating Rate Interests
The Fund invests in senior secured corporate loans that pay interest at rates which are periodically reset by reference to a base lending rate plus a spread. These base lending rates are generally the prime rate offered by a designated U.S. bank or the London InterBank Offered Rate (LIBOR). Senior secured corporate loans often require prepayment of principal from excess cash flows or at the discretion of the borrower. As a result, actual maturity may be substantially less than the stated maturity. Senior secured corporate loans in which the Fund invests are generally readily marketable, but may be subject to certain restrictions on resale.
h. Income and Deferred Taxes
It is the Fund’s policy to qualify as a regulated investment company under the Internal Revenue Code. The Fund intends to distribute to shareholders substantially all of its taxable income and net realized gains to relieve it from federal income and excise taxes. As a result, no provision for U.S. federal income taxes is required.
The Fund may be subject to foreign taxation related to income received, capital gains on the sale of securities and certain foreign currency transactions in the foreign jurisdictions in which it invests. Foreign taxes, if any, are recorded based on the tax regulations and rates that exist in the foreign markets in which the Fund invests. When a capital gain
tax is determined to apply, the Fund records an estimated deferred tax liability in an amount that would be payable if the securities were disposed of on the valuation date.
The Fund may recognize an income tax liability related to its uncertain tax positions under U.S. GAAP when the uncertain tax position has a less than 50% probability that it will be sustained upon examination by the tax authorities based on its technical merits. As of May 31, 2022, the Fund has determined that no tax liability is required in its financial statements related to uncertain tax positions for any open tax years (or expected to be taken in future tax years). Open tax years are those that remain subject to examination and are based on the statute of limitations in each jurisdiction in which the Fund invests.
i. Security Transactions, Investment Income, Expenses and Distributions
Security transactions are accounted for on trade date. Realized gains and losses on security transactions are determined on a specific identification basis. Interest income and estimated expenses are accrued daily. Amortization of premium and accretion of discount on debt securities are included in interest income. Paydown gains and losses are recorded separately in the Statement of Operations. Facility fees are recognized as income over the expected term of the loan. Dividend income and dividends declared on securities sold short are recorded on the ex-dividend date except for certain dividends from securities where the dividend rate is not available. In such cases, the dividend is recorded as soon as the information is received by the Fund. Distributions to shareholders are recorded on the ex-dividend date. Distributable earnings are determined according to income tax regulations (tax basis) and may differ from earnings recorded in accordance with U.S. GAAP. These differences may be permanent or temporary. Permanent differences are reclassified among capital accounts to reflect their tax character. These reclassifications have no impact on net assets or the results of operations. Temporary differences are not reclassified, as they may reverse in subsequent periods.
Common expenses incurred by the Trust are allocated among the Funds based on the ratio of net assets of each Fund to the combined net assets of the Trust or based on the ratio of number of shareholders of each Fund to the combined number of shareholders of the Trust. Fund specific expenses are charged directly to the Fund that incurred the expense.
| franklintempleton.com | Annual Report | 43 | ||||||||
FRANKLIN ALTERNATIVE STRATEGIES FUNDS
NOTES TO FINANCIAL STATEMENTS
Franklin K2 Long Short Credit Fund (continued)
1. Organization and Significant Accounting Policies (continued)
i. Security Transactions, Investment Income, Expenses and Distributions (continued)
Realized and unrealized gains and losses and net investment income, excluding class specific expenses, are allocated daily to each class of shares based upon the relative proportion of net assets of each class. Differences in per share distributions by class are generally due to differences in class specific expenses.
j. Accounting Estimates
The preparation of financial statements in accordance with U.S. GAAP requires management to make estimates and assumptions that affect the reported amounts of assets and
liabilities at the date of the financial statements and the amounts of income and expenses during the reporting period. Actual results could differ from those estimates.
k. Guarantees and Indemnifications
Under the Trust’s organizational documents, its officers and trustees are indemnified by the Trust against certain liabilities arising out of the performance of their duties to the Trust. Additionally, in the normal course of business, the Trust, on behalf of the Fund, enters into contracts with service providers that contain general indemnification clauses. The Trust’s maximum exposure under these arrangements is unknown as this would involve future claims that may be made against the Trust that have not yet occurred. Currently, the Trust expects the risk of loss to be remote.
2. Shares of Beneficial Interest
At May 31, 2022, there were an unlimited number of shares authorized (without par value). Transactions in the Fund’s shares were as follows:
| Year Ended May 31, | ||||||||||||||||||||
| 2022 | 2021 | |||||||||||||||||||
| Shares | Amount | Shares | Amount | |||||||||||||||||
| Class A Shares: |
| |||||||||||||||||||
Shares solda | 454,409 | $ | 4,908,749 | 822,527 | $ | 8,771,228 | ||||||||||||||
Shares issued in reinvestment of distributions | 55,963 | 593,769 | 28,242 | 300,782 | ||||||||||||||||
Shares redeemed | (1,214,627 | ) | (12,999,143 | ) | (461,890 | ) | (4,910,081 | ) | ||||||||||||
|
| |||||||||||||||||||
Net increase (decrease) | (704,255 | ) | $ | (7,496,625 | ) | 388,879 | $ | 4,161,929 | ||||||||||||
|
| |||||||||||||||||||
| Class C Shares: |
| |||||||||||||||||||
Shares sold | 64,353 | $ | 679,579 | 36,427 | $ | 380,419 | ||||||||||||||
Shares issued in reinvestment of distributions | 6,746 | 70,494 | 4,906 | 51,466 | ||||||||||||||||
Shares redeemeda | (84,628 | ) | (893,210 | ) | (63,557 | ) | (658,152 | ) | ||||||||||||
|
| |||||||||||||||||||
Net increase (decrease) | (13,529 | ) | $ | (143,137 | ) | (22,224 | ) | $ | (226,267 | ) | ||||||||||
|
| |||||||||||||||||||
| Class R Shares: |
| |||||||||||||||||||
Shares sold | 4,877 | $ | 51,606 | 466 | $ | 5,000 | ||||||||||||||
Shares issued in reinvestment of distributions | 543 | 5,698 | 337 | 3,557 | ||||||||||||||||
Shares redeemed | (1,669 | ) | (17,882 | ) | (3 | ) | (30 | ) | ||||||||||||
|
| |||||||||||||||||||
Net increase (decrease) | 3,751 | $ | 39,422 | 800 | $ | 8,527 | ||||||||||||||
|
| |||||||||||||||||||
| Class R6 Shares: |
| |||||||||||||||||||
Shares sold | 907 | $ | 10,000 | — | $ | — | ||||||||||||||
Shares issued in reinvestment of distributions | 34 | 364 | — | — | ||||||||||||||||
Shares redeemed | — | — | — | — | ||||||||||||||||
|
| |||||||||||||||||||
Net increase (decrease) | 941 | $ | 10,364 | — | $ | — | ||||||||||||||
|
| |||||||||||||||||||
| 44 | Annual Report | franklintempleton.com | ||||||||
FRANKLIN ALTERNATIVE STRATEGIES FUNDS
NOTES TO FINANCIAL STATEMENTS
Franklin K2 Long Short Credit Fund (continued)
| Year Ended May 31, | ||||||||||||||||||||
| 2022 | 2021 | |||||||||||||||||||
| Shares | Amount | Shares | Amount | |||||||||||||||||
| Advisor Class Shares: |
| |||||||||||||||||||
Shares sold | 4,721,077 | $ | 50,601,759 | 3,735,776 | $ | 39,446,888 | ||||||||||||||
Shares issued in reinvestment of distributions | 263,093 | 2,791,418 | 144,113 | 1,534,808 | ||||||||||||||||
Shares redeemed | (5,400,892 | ) | (57,476,303 | ) | (4,254,581 | ) | (44,850,769 | ) | ||||||||||||
|
| |||||||||||||||||||
Net increase (decrease) | (416,722 | ) | $ | (4,083,126 | ) | (374,692 | ) | $ | (3,869,073 | ) | ||||||||||
|
| |||||||||||||||||||
aMay include a portion of Class C shares that were automatically converted to Class A.
3. Transactions with Affiliates
Franklin Resources, Inc. is the holding company for various subsidiaries that together are referred to as Franklin Templeton. Certain officers and trustees of the Trust are also officers and/or directors of the following subsidiaries:
| Subsidiary | Affiliation | |
K2/D&S Management Co., L.L.C. (K2 Advisors) | Investment manager | |
Franklin Templeton Services, LLC (FT Services) | Administrative manager | |
Franklin Distributors, LLC (Distributors) | Principal underwriter | |
Franklin Templeton Investor Services, LLC (Investor Services) | Transfer agent | |
a. Management Fees
The Fund pays an investment management fee, calculated daily and paid monthly, to K2 Advisors of 1.50% per year of the average daily net assets of the Fund.
Prior to March 1, 2022, the Fund paid an investment management fee to K2 Advisors of 1.60% per year of the average daily net assets of the Fund.
Under each subadvisory agreement, the below entities provide subadvisory services to the Fund. The subadvisory fees are paid by K2 Advisors and are not an additional expense of the Fund. Each subadvisor is compensated for managing its respective portion of the average daily net assets of the Fund.
| Subadvisors |
Apollo Credit Management LLC |
Benefit Street Partners L.L.C.* |
Ellington Global Asset Management, LLC |
Emso Asset Management Limited |
Medalist Partners, LP |
* An affiliate of K2 Advisors.
b. Administrative Fees
Under an agreement with K2 Advisors, FT Services provides administrative services to the Fund. The fee is paid by K2 Advisors based on the Fund’s average daily net assets, and is not an additional expense of the Fund.
| franklintempleton.com | Annual Report | 45 | ||||||||
FRANKLIN ALTERNATIVE STRATEGIES FUNDS
NOTES TO FINANCIAL STATEMENTS
Franklin K2 Long Short Credit Fund (continued)
3. Transactions with Affiliates (continued)
c. Distribution Fees
The Board has adopted distribution plans for each share class, with the exception of Class R6 and Advisor Class shares, pursuant to Rule 12b-1 under the 1940 Act. Under the Fund’s Class A reimbursement distribution plan, the Fund reimburses Distributors for costs incurred in connection with the servicing, sale and distribution of the Fund’s shares up to the maximum annual plan rate. Under the Class A reimbursement distribution plan, costs exceeding the maximum for the current plan year cannot be reimbursed in subsequent periods. In addition, under the Fund’s Class C and R compensation distribution plans, the Fund pays Distributors for costs incurred in connection with the servicing, sale and distribution of the Fund’s shares up to the maximum annual plan rate for each class. The plan year, for purposes of monitoring compliance with the maximum annual plan rates, is February 1 through January 31.
The maximum annual plan rates, based on the average daily net assets, for each class, are as follows:
Class A | 0.25% | |||
Class C | 1.00% | |||
Class R | 0.50% |
d. Sales Charges/Underwriting Agreements
Front-end sales charges and contingent deferred sales charges (CDSC) do not represent expenses of the Fund. These charges are deducted from the proceeds of sales of Fund shares prior to investment or from redemption proceeds prior to remittance, as applicable. Distributors has advised the Fund of the following commission transactions related to the sales and redemptions of the Fund’s shares for the year:
Sales charges retained net of commissions paid to unaffiliated brokers/dealers | $ | 1,726 | ||
CDSC retained | $ | 7,466 |
e. Transfer Agent Fees
Each class of shares pays transfer agent fees to Investor Services for its performance of shareholder servicing obligations. The fees are based on an annualized asset based fee of 0.02% plus a transaction based fee. In addition, each class reimburses Investor Services for out of pocket expenses incurred and, except for Class R6, reimburses shareholder servicing fees paid to third parties. These fees are allocated daily based upon their relative proportion of such classes’ aggregate net assets. Class R6 pays Investor Services transfer agent fees specific to that class.
For the year ended May 31, 2022, the Fund paid transfer agent fees of $127,698, of which $43,420 was retained by Investor Services.
f. Waiver and Expense Reimbursements
K2 Advisors has contractually agreed in advance to waive or limit its fees and to assume as their own expense certain expenses otherwise payable by the Fund so that the operating expenses (excluding interest expense, distribution fees, acquired fund fees and expenses, expenses related to securities sold short, and certain non-routine expenses or costs, including those relating to litigation, indemnification, reorganizations and liquidations) for each class of the Fund do not exceed 1.55% based on the average net assets of each class until September 30, 2023. Total expenses waived or paid are not subject to recapture subsequent to the Fund’s fiscal year end.
Prior to March 1, 2022, expenses (excluding certain fees and expenses as previously disclosed) for each class of the Fund were limited to 1.65% based on the average net assets of each class.
Investor Services has contractually agreed in advance to waive or limit its fees so that the Class R6 transfer agent fees do not exceed 0.03% based on the average net assets of the class until September 30, 2023.
| 46 | Annual Report | franklintempleton.com | ||||||||
FRANKLIN ALTERNATIVE STRATEGIES FUNDS
NOTES TO FINANCIAL STATEMENTS
Franklin K2 Long Short Credit Fund (continued)
4. Expense Offset Arrangement
The Fund has entered into an arrangement with its custodian whereby credits realized as a result of uninvested cash balances are used to reduce a portion of the Fund’s custodian expenses. During the year ended May 31, 2022, the custodian fees were reduced as noted in the Statement of Operations.
5. Income Taxes
The tax character of distributions paid during the years ended May 31, 2022 and 2021, was as follows:
| 2022 | 2021 | |||||||
| Distributions paid from: | ||||||||
Ordinary income | $ | 3,741,588 | $ | 2,522,941 | ||||
Long term capital gain | — | — | ||||||
|
| |||||||
Total distributions paid | $ | 3,741,588 | $ | 2,522,941 | ||||
|
| |||||||
At May 31, 2022, the cost of investments, net unrealized appreciation (depreciation) and undistributed ordinary income for income tax purposes were as follows:
Cost of investments | $ | 86,937,711 | ||
|
| |||
Unrealized appreciation | $ | 1,696,012 | ||
Unrealized depreciation | (6,464,350 | ) | ||
|
| |||
Net unrealized appreciation (depreciation) | $ | (4,768,338 | ) | |
|
| |||
| Distributable earnings | ||||
Undistributed ordinary income | $ | 415,243 | ||
|
|
Differences between income and/or capital gains as determined on a book basis and a tax basis are primarily due to differing treatments of foreign currency transactions and wash sales.
The Fund utilized a tax accounting practice to treat a portion of the proceeds from the capital shares redeemed as a distribution from realized capital gains.
6. Investment Transactions
Purchases and sales of investments and securities sold short (excluding short term securities) for the year ended May 31, 2022, aggregated $145,607,697 and $141,786,788, respectively.
7. Credit Risk and Defaulted Securities
At May 31, 2022, the Fund had 27.6% of its portfolio invested in high yield, senior secured floating rate loans, or other securities rated below investment grade as determined by Nationally Recognized Statistical Credit Ratings Organizations and/or internally, by investment management and unrated securities. These securities may be more sensitive to economic conditions causing greater price volatility and are potentially subject to a greater risk of loss due to default than higher rated securities.
The Fund may purchase the pre-default or defaulted debt of distressed companies. Distressed companies are financially troubled and could be or are already involved in financial restructuring or bankruptcy. Risks associated with purchasing these securities include the possibility that the bankruptcy or other restructuring process takes longer than expected, or that distributions in restructuring are less than anticipated, either or both of which may result in unfavorable consequences to the Fund. If it becomes probable that the income on debt securities, including those of distressed companies, will not be collected, the Fund discontinues accruing income and recognizes an adjustment for uncollectible interest.
At May 31, 2022, the Fund did not hold any distressed company securities for which interest recognition has been discontinued.
| franklintempleton.com | Annual Report | 47 | ||||||||
FRANKLIN ALTERNATIVE STRATEGIES FUNDS
NOTES TO FINANCIAL STATEMENTS
Franklin K2 Long Short Credit Fund (continued)
8. Geopolitical Risk
On February 24, 2022, Russia engaged in military actions in the sovereign territory of Ukraine. The current political and financial uncertainty surrounding Russia and Ukraine may increase market volatility and the economic risk of investing in securities in these countries and may also cause uncertainty for the global economy and broader financial markets. The ultimate fallout and long-term impact from these events are not known. The Fund will continue to assess the impact on valuations and liquidity and will take any potential actions needed in accordance with procedures approved by the Board.
9. Novel Coronavirus Pandemic
The global outbreak of the novel coronavirus disease, known as COVID-19, has caused adverse effects on many companies, sectors, nations, regions and the markets in general, and may continue for an unpredictable duration. The effects of this pandemic may materially impact the value and performance of the Fund, its ability to buy and sell fund investments at appropriate valuations and its ability to achieve its investment objectives.
10. Restricted Securities
The Fund invests in securities that are restricted under the Securities Act of 1933 (1933 Act). Restricted securities are often purchased in private placement transactions and cannot be sold without prior registration unless the sale is pursuant to an exemption under the 1933 Act. Disposal of these securities may require greater effort and expense, and prompt sale at an acceptable price may be difficult. The Fund may have registration rights for restricted securities. The issuer generally incurs all registration costs.
At May 31, 2022, investments in restricted securities, excluding securities exempt from registration under the 1933 Act, were as follows:
| Shares | Issuer | Acquisition Date | Cost | Value | ||||||||||||
| 923 | Acosta Inc. | 12/31/19 | $ | 8,144 | $ | 7,476 | ||||||||||
| 993 | Acosta Inc., cvt. pfd. | 12/31/19-1/05/22 | 50,262 | 46,175 | ||||||||||||
|
| |||||||||||||||
Total Restricted Securities (Value is 0.1% of Net Assets) | $ | 58,406 | $ | 53,651 | ||||||||||||
|
| |||||||||||||||
11. Unfunded Loan Commitments
The Fund enters into certain credit agreements, all or a portion of which may be unfunded. The Fund is obligated to fund these loan commitments at the borrowers’ discretion. Unfunded loan commitments and funded portions of credit agreements are marked to market daily and any unrealized appreciation or depreciation is included in the Statement of Assets and Liabilities and the Statement of Operations. Funded portions of credit agreements are presented in the Schedule of Investments.
At May 31, 2022, unfunded commitments were as follows:
| Borrower | Unfunded Commitment | |||
Delivery Hero SE, Term Loan B | $ | 500,000 | ||
Upfield Group BV, Term Loan RC | 118,208 | |||
|
| |||
| $ | 618,208 | |||
|
| |||
| 48 | Annual Report | franklintempleton.com | ||||||||
FRANKLIN ALTERNATIVE STRATEGIES FUNDS
NOTES TO FINANCIAL STATEMENTS
Franklin K2 Long Short Credit Fund (continued)
12. Other Derivative Information
At May 31, 2022, the investments in derivative contracts are reflected in the Statement of Assets and Liabilities as follows:
Asset Derivatives | Liability Derivatives | |||||||||||
Derivative Contracts Not Accounted for as Hedging Instruments | Statement of Assets and Liabilities Location | Fair Value | Statement of Assets and Liabilities Location | Fair Value | ||||||||
Interest rate contracts | Investments in securities, at value | $ | 2,880 | a | Options written, at value | $ | 66,080 | |||||
Variation margin on centrally cleared swap contracts | 120,724 | b | Variation margin on centrally cleared swap contracts | 46,242 | b | |||||||
Variation margin on futures contracts | 12,653 | b | ||||||||||
Foreign exchange contracts | Unrealized appreciation on OTC forward exchange contracts | 218,521 | Unrealized depreciation on OTC forward exchange contracts | 132,472 | ||||||||
| Investments in securities, at value | 1,402 | a | Options written, at value | 385 | ||||||||
Credit contracts | Variation margin on centrally cleared swap contracts | 66,185 | b | Variation margin on centrally cleared swap contracts | 62,964 | b | ||||||
OTC swap contracts (upfront payments) | 134,193 | OTC swap contracts (upfront receipts) | 170,889 | |||||||||
Unrealized appreciation on OTC swap contracts | 45,719 | Unrealized depreciation on OTC swap contracts | 42,681 | |||||||||
Equity contracts | Investments in securities, at value | 386,122 | a | Options written, at value | 233,213 | |||||||
Variation margin on futures contracts | 74,006 | b | Variation margin on futures contracts | 4,040 | b | |||||||
Unrealized appreciation on OTC swap contracts | 13,064 | |||||||||||
|
|
|
| |||||||||
Totals | $ | 1,075,469 | $ | 758,966 | ||||||||
|
|
|
| |||||||||
aPurchased option contracts are included in investments in securities, at value in the Statement of Assets and Liabilities.
bThis amount reflects the cumulative appreciation (depreciation) of futures contracts and centrally cleared swap contracts as reported in the Schedule of Investments. Only the variation margin receivable/payable at year end is separately reported within the Statement of Assets and Liabilities. Prior variation margin movements were recorded to cash upon receipt or payment.
| franklintempleton.com | Annual Report | 49 | ||||||||
FRANKLIN ALTERNATIVE STRATEGIES FUNDS
NOTES TO FINANCIAL STATEMENTS
Franklin K2 Long Short Credit Fund (continued)
12. Other Derivative Information (continued)
For the year ended May 31, 2022, the effect of derivative contracts in the Statement of Operations was as follows:
Derivative Contracts Not Accounted for as Hedging Instruments | Statement of Operations Location | Net Realized Gain (Loss) for the Year | Statement of Operations Location | Net Change in Unrealized Appreciation (Depreciation) for the Year | ||||||||
Net realized gain (loss) from: | Net change in unrealized | |||||||||||
Interest rate contracts | Investments | $ | (19,442 | )a | ||||||||
Written options | 22,560 | |||||||||||
Swap contracts | $ | 149,347 | Swap contracts | 265,672 | ||||||||
Futures contracts | (30,989 | ) | Futures contracts | 13,387 | ||||||||
Foreign exchange contracts | Forward exchange contracts | 135,277 | Forward exchange contracts | 288,978 | ||||||||
Investments | 61,222 | a | Investments | 1,113 | a | |||||||
Written options | (58,795 | ) | Written options | (305 | ) | |||||||
Credit contracts | Swap contracts | (345,379 | ) | Swap contracts | 491,609 | |||||||
Equity contracts | Investments | 156,563 | a | Investments | (246,061 | )a | ||||||
Written options | 32,949 | Written options | 133,824 | |||||||||
Futures contracts | (141,159 | ) | Futures contracts | 96,905 | ||||||||
Swap contracts | 178,544 | Swap contracts | 23,624 | |||||||||
|
|
|
| |||||||||
Totals | $ | 137,580 | $ | 1,071,864 | ||||||||
|
|
|
| |||||||||
aPurchased option contracts are included in net realized gain (loss) from investments and net change in unrealized appreciation (depreciation) on investments in the Statement of Operations.
For the year ended May 31, 2022, the average month end notional amount of options, futures contracts and swap contracts represented 133,680 shares/units, $2,723,040 and $20,297,327, respectively. The average month end contract value of forward exchange contracts was $10,060,188.
At May 31, 2022, OTC derivative assets and liabilities are as follows:
| Gross Amounts of Assets and Liabilities Presented in the Statement of Assets and Liabilities | ||||||||
| Assetsa | Liabilitiesa | |||||||
| Derivatives | ||||||||
Forward Exchange Contracts | $ | 218,521 | $ | 132,472 | ||||
Options Purchased | 17,544 | — | ||||||
Options Written | — | 496 | ||||||
Swap Contracts | 192,976 | 213,570 | ||||||
|
| |||||||
Total | $ | 429,041 | $ | 346,538 | ||||
|
| |||||||
aAbsent an event of default or early termination, OTC derivative assets and liabilities are presented gross and not offset in the Statement of Assets and Liabilities.
| 50 | Annual Report | franklintempleton.com | ||||||||
FRANKLIN ALTERNATIVE STRATEGIES FUNDS
NOTES TO FINANCIAL STATEMENTS
Franklin K2 Long Short Credit Fund (continued)
At May 31, 2022, OTC derivative assets, which may be offset against OTC derivative liabilities and collateral received from the counterparty, are as follows:
| Amounts Not Offset in the Statement of Assets and Liabilities | ||||||||||||||||||||
| Gross Amounts of Assets Presented in the Statement of Assets and Liabilities | Financial Instruments Available for Offset | Financial Instruments Collateral Received | Cash Collateral Receiveda | Net Amount (Not less than zero) | ||||||||||||||||
| Counterparty | ||||||||||||||||||||
BNPP | $ | 3,634 | $ | (3,634 | ) | $ | — | $ | — | $ | — | |||||||||
BOFA | 6,714 | (6,714 | ) | — | — | — | ||||||||||||||
BZWS | 96,746 | (34,327 | ) | — | — | 62,419 | ||||||||||||||
CITI | 40,519 | (40,519 | ) | — | — | — | ||||||||||||||
DBAB | 1,391 | — | — | — | 1,391 | |||||||||||||||
FBCO | 4,163 | (136 | ) | — | (4,027 | ) | — | |||||||||||||
GSCO | 31,556 | (31,556 | ) | — | — | — | ||||||||||||||
HSBC | — | — | — | — | — | |||||||||||||||
JPHQ | 199,418 | (83,056 | ) | — | (116,362 | ) | — | |||||||||||||
JPHQb | 34,629 | — | — | — | 34,629 | |||||||||||||||
MSCS | 10,271 | — | — | — | 10,271 | |||||||||||||||
|
| |||||||||||||||||||
Total | $ | 429,041 | $ | (199,942 | ) | $ | — | $ | (120,389 | ) | $ | 108,710 | ||||||||
|
| |||||||||||||||||||
At May 31, 2022, OTC derivative liabilities, which may be offset against OTC derivative assets and collateral pledged to the counterparty, are as follows:
| Amounts Not Offset in the Statement of Assets and Liabilities | ||||||||||||||||||||
| Gross Amounts of Liabilities Presented in the Statement of Assets and Liabilities | Financial Instruments Available for Offset | Financial Instruments Collateral Pledged | Cash Collateral Pledgeda | Net Amount (Not less than zero) | ||||||||||||||||
| Counterparty | ||||||||||||||||||||
BNPP | $ | 16,978 | $ | (3,634 | ) | $ | — | $ | — | $ | 13,344 | |||||||||
BOFA | 9,887 | (6,714 | ) | — | — | 3,173 | ||||||||||||||
BZWS | 34,327 | (34,327 | ) | — | — | — | ||||||||||||||
CITI | 60,558 | (40,519 | ) | — | (20,039 | ) | — | |||||||||||||
DBAB | — | — | — | — | — | |||||||||||||||
FBCO | 136 | (136 | ) | — | — | — | ||||||||||||||
GSCO | 42,267 | (31,556 | ) | — | (10,711 | ) | — | |||||||||||||
HSBC | 4,931 | — | — | — | 4,931 | |||||||||||||||
JPHQ | 83,056 | (83,056 | ) | — | — | — | ||||||||||||||
JPHQb | 94,398 | — | — | — | 94,398 | |||||||||||||||
MSCS | — | — | — | — | — | |||||||||||||||
|
| |||||||||||||||||||
Total | $ | 346,538 | $ | (199,942 | ) | $ | — | $ | (30,750 | ) | $ | 115,846 | ||||||||
|
| |||||||||||||||||||
aIn some instances, the collateral amounts disclosed in the table above were adjusted due to the requirement to limit the collateral amounts to avoid the effect of over collateralization. Actual collateral received and/or pledged may be more than the amounts disclosed herein.
bRepresents derivatives not subject to an ISDA master agreement.
See Note 1(d) regarding derivative financial instruments.
See Abbreviations on page 54.
| franklintempleton.com | Annual Report | 51 | ||||||||
FRANKLIN ALTERNATIVE STRATEGIES FUNDS
NOTES TO FINANCIAL STATEMENTS
Franklin K2 Long Short Credit Fund (continued)
13. Credit Facility
The Fund, together with other U.S. registered and foreign investment funds (collectively, Borrowers), managed by Franklin Templeton, are borrowers in a joint syndicated senior unsecured credit facility totaling $2.675 billion (Global Credit Facility) which matures on February 3, 2023. This Global Credit Facility provides a source of funds to the Borrowers for temporary and emergency purposes, including the ability to meet future unanticipated or unusually large redemption requests.
Under the terms of the Global Credit Facility, the Fund shall, in addition to interest charged on any borrowings made by the Fund and other costs incurred by the Fund, pay its share of fees and expenses incurred in connection with the implementation and maintenance of the Global Credit Facility, based upon its relative share of the aggregate net assets of all of the Borrowers, including an annual commitment fee of 0.15% based upon the unused portion of the Global Credit Facility. These fees are reflected in other expenses in the Statement of Operations. During the year ended May 31, 2022, the Fund did not use the Global Credit Facility.
14. Fair Value Measurements
The Fund follows a fair value hierarchy that distinguishes between market data obtained from independent sources (observable inputs) and the Fund’s own market assumptions (unobservable inputs). These inputs are used in determining the value of the Fund’s financial instruments and are summarized in the following fair value hierarchy:
| • | Level 1 – quoted prices in active markets for identical financial instruments |
| • | Level 2 – other significant observable inputs (including quoted prices for similar financial instruments, interest rates, prepayment speed, credit risk, etc.) |
| • | Level 3 – significant unobservable inputs (including the Fund’s own assumptions in determining the fair value of financial instruments) |
The input levels are not necessarily an indication of the risk or liquidity associated with financial instruments at that level.
A summary of inputs used as of May 31, 2022, in valuing the Fund’s assets and liabilities carried at fair value, is as follows:
| Level 1 | Level 2 | Level 3 | Total | |||||||||||||
| Assets: | ||||||||||||||||
Investments in Securities:a | ||||||||||||||||
Equity Investmentsb | $ | 1,691,954 | $ | 141,963 | $ | 87,985 | $ | 1,921,902 | ||||||||
Convertible Bonds | — | 2,419,267 | — | 2,419,267 | ||||||||||||
Corporate Bonds and Notes | — | 25,830,504 | — | 25,830,504 | ||||||||||||
Senior Floating Rate Interests | — | 2,095,060 | — | 2,095,060 | ||||||||||||
Foreign Government and Agency Securities | — | 9,321,926 | — | 9,321,926 | ||||||||||||
U.S. Government and Agency Securities | — | 417,900 | — | 417,900 | ||||||||||||
Asset-Backed Securities and Commercial Mortgage-Backed Securities | — | 32,138,934 | — | 32,138,934 | ||||||||||||
Options Purchased | 388,721 | 1,683 | — | 390,404 | ||||||||||||
Short Term Investments | 11,240,697 | 356,386 | — | 11,597,083 | ||||||||||||
|
| |||||||||||||||
Total Investments in Securities | $ | 13,321,372 | $ | 72,723,623c | $ | 87,985 | $ | 86,132,980 | ||||||||
|
| |||||||||||||||
Other Financial Instruments: | ||||||||||||||||
Futures Contracts | $ | 86,659 | $ | — | $ | — | $ | 86,659 | ||||||||
Forward Exchange Contracts | — | 218,521 | — | 218,521 | ||||||||||||
Swap Contracts | — | 245,692 | — | 245,692 | ||||||||||||
|
| |||||||||||||||
Total Other Financial Instruments | $ | 86,659 | $ | 464,213 | $ | — | $ | 550,872 | ||||||||
|
| |||||||||||||||
| 52 | Annual Report | franklintempleton.com | ||||||||
FRANKLIN ALTERNATIVE STRATEGIES FUNDS
NOTES TO FINANCIAL STATEMENTS
Franklin K2 Long Short Credit Fund (continued)
| Level 1 | Level 2 | Level 3 | Total | |||||||||||||
| Liabilities: | ||||||||||||||||
Other Financial Instruments: | ||||||||||||||||
Options Written | $ | 299,182 | $ | 496 | $ | — | $ | 299,678 | ||||||||
Securities Sold Shorta | 494,092 | 3,367,889 | — | 3,861,981 | ||||||||||||
Futures Contracts | 4,040 | — | — | 4,040 | ||||||||||||
Forward Exchange Contracts | — | 132,472 | — | 132,472 | ||||||||||||
Swap Contracts | — | 151,887 | — | 151,887 | ||||||||||||
Unfunded Loan Commitments | — | 35,304 | — | 35,304 | ||||||||||||
|
| |||||||||||||||
Total Other Financial Instruments | $ | 797,314 | $ | 3,688,048 | $ | — | $ | 4,485,362 | ||||||||
|
| |||||||||||||||
aFor detailed categories, see the accompanying Schedule of Investments.
bIncludes common stocks, preferred stocks and convertible preferred stocks as well as other equity interests.
cIncludes foreign securities valued at $63,577, which were categorized as Level 2 as a result of the application of market level fair value procedures. See the Financial Instrument Valuation note for more information.
A reconciliation in which Level 3 inputs are used in determining fair value is presented when there are significant Level 3 assets and/or liabilities at the beginning and/or end of the year.
15. New Accounting Pronouncements
In March 2020, the Financial Accounting Standards Board (FASB) issued Accounting Standards Update (ASU) No. 2020-04, Reference Rate Reform (Topic 848) — Facilitation of the Effects of Reference Rate Reform on Financial Reporting. In January 2021, the FASB issued ASU No. 2021-01, with further amendments to Topic 848. The amendments in the ASUs provide optional temporary accounting recognition and financial reporting relief from the effect of certain types of contract modifications due to the planned discontinuation of the LIBOR and other interbank-offered based reference rates as of the end of 2021 for certain LIBOR settings and 2023 for the remainder. The ASUs are effective for certain reference rate-related contract modifications that occur during the period March 12, 2020 through December 31, 2022. Management has reviewed the requirements and believes the adoption of these ASUs will not have a material impact on the financial statements.
16. Subsequent Events
The Fund has evaluated subsequent events through the issuance of the financial statements and determined that no events have occurred that require disclosure.
| franklintempleton.com | Annual Report | 53 | ||||||||
FRANKLIN ALTERNATIVE STRATEGIES FUNDS
NOTES TO FINANCIAL STATEMENTS
Franklin K2 Long Short Credit Fund (continued)
| Counterparty | Currency | Selected Portfolio | ||||||||
| BNPP | BNP Paribas | BRL | Brazilian Real | ARM | Adjustable Rate Mortgage | |||||
| BOFA | Bank of America, NA | CHF | Swiss Franc | BZDIOVRA | Brazil Interbank Deposit Rate | |||||
| BZWS | Barclays Bank PLC | CZK | Czech Koruna | CLO | Collateralized Loan Obligation | |||||
| CITI | Citigroup, NA | EUR | Euro | ETF | Exchange Traded Fund | |||||
| DBAB | Deutsche Bank AG | GBP | British Pound | FHLMC | Federal Home Loan Mortgage Corp. | |||||
| FBCO | Credit Suisse International | JPY | Japanese Yen | FNMA | Federal National Mortgage Association | |||||
| GSCO | Goldman Sachs International | MXN | Mexican Peso | FRN | Floating Rate Note | |||||
| HSBC | HSBC Bank PLC | SEK | Swedish Krona | FTSE | Financial Times Stock Exchange | |||||
| JPHQ | JP Morgan Chase Bank, NA | USD | United States Dollar | LIBOR | London InterBank Offered Rate | |||||
| MSCS | Morgan Stanley Capital Services LLC | ZAR | South African Rand | PIK | Payment In-Kind | |||||
| PRIBOR | Prague Interbank Offered Rate | |||||||||
| RC | Revolving Loan Commitment | |||||||||
| REIT | Real Estate Investment Trust | |||||||||
| SFR | Single Family Revenue | |||||||||
| SOFR | Secured Overnight Financing Rate | |||||||||
| SPDR | Standard & Poor’s Depositary Receipt | |||||||||
| Index | ||||||||||
| CDX.NA.HY | CDX North America High Yield Index | |||||||||
| 54 | Annual Report | franklintempleton.com | ||||||||
FRANKLIN ALTERNATIVE STRATEGIES FUNDS
Report of Independent Registered Public Accounting Firm
To the Board of Trustees of Franklin Alternative Strategies Funds
and Shareholders of Franklin K2 Long Short Credit Fund:
Opinion on the Financial Statements
We have audited the accompanying statement of assets and liabilities of Franklin K2 Long Short Credit Fund (the “Fund”) (one of the funds constituting the Franklin Alternative Strategies Funds), including the schedule of investments, as of May 31, 2022, and the related statement of operations for the year then ended, the statements of changes in net assets for each of the two years in the period then ended, the financial highlights for each of the five years in the period then ended and the related notes (collectively referred to as the “financial statements”). In our opinion, the financial statements present fairly, in all material respects, the financial position of Franklin K2 Long Short Credit Fund (one of the funds constituting the Franklin Alternative Strategies Funds) at May 31, 2022, the results of its operations for the year then ended, the changes in its net assets for each of the two years in the period then ended and its financial highlights for each of the five years in the period then ended, in conformity with U.S. generally accepted accounting principles.
Basis for Opinion
These financial statements are the responsibility of the Fund’s management. Our responsibility is to express an opinion on the Fund’s financial statements based on our audits. We are a public accounting firm registered with the Public Company Accounting Oversight Board (United States) (“PCAOB”) and are required to be independent with respect to the Fund in accordance with the U.S. federal securities laws and the applicable rules and regulations of the Securities and Exchange Commission and the PCAOB.
We conducted our audits in accordance with the standards of the PCAOB. Those standards require that we plan and perform the audit to obtain reasonable assurance about whether the financial statements are free of material misstatement, whether due to error or fraud. The Fund is not required to have, nor were we engaged to perform, an audit of the Fund’s internal control over financial reporting. As part of our audits, we are required to obtain an understanding of internal control over financial reporting, but not for the purpose of expressing an opinion on the effectiveness of the Fund’s internal control over financial reporting. Accordingly, we express no such opinion.
Our audits included performing procedures to assess the risks of material misstatement of the financial statements, whether due to error or fraud, and performing procedures that respond to those risks. Such procedures included examining, on a test basis, evidence regarding the amounts and disclosures in the financial statements. Our procedures included confirmation of securities owned as of May 31, 2022, by correspondence with the custodian and brokers, or by other appropriate auditing procedures where replies from brokers were not received. Our audits also included evaluating the accounting principles used and significant estimates made by management, as well as evaluating the overall presentation of the financial statements. We believe that our audits provide a reasonable basis for our opinion.

We have served as the auditor of one or more Franklin investment companies since 1987.
Boston, Massachusetts
July 28, 2022
| franklintempleton.com | Annual Report | 55 | ||||||||
FRANKLIN ALTERNATIVE STRATEGIES FUNDS
FRANKLIN K2 LONG SHORT CREDIT FUND
By mid-February, tax information related to a shareholder’s proportionate share of distributions paid during the preceding calendar year will be received, if applicable. Please also refer to www.franklintempleton.com for per share tax information related to any distributions paid during the preceding calendar year. Shareholders are advised to consult with their tax advisors for further information on the treatment of these amounts on their tax returns.
The following tax information for the Fund is required to be furnished to shareholders with respect to income earned and distributions paid during its fiscal year.
The Fund hereby reports the following amounts, or if subsequently determined to be different, the maximum allowable amounts, for the fiscal year ended May 31, 2022:
| Pursuant to: | Amount Reported | |||||||
Long-Term Capital Gain Dividends | § | 852(b)(3)(C) | $ | 540,396 | ||||
Short-Term Capital Gain Dividends | § | 871(k)(2)(C) | $ | 1,050,181 | ||||
Note (1) – The Law varies in each state as to whether and what percentage of dividend income attributable to Federal obligations is exempt from state income tax. Shareholders are advised to consult with their tax advisors to determine if any portion of the dividends received is exempt from state income taxes.
| 56 | Annual Report | franklintempleton.com | ||||||||
FRANKLIN ALTERNATIVE STRATEGIES FUNDS
The name, year of birth and address of the officers and board members, as well as their affiliations, positions held with the Funds, principal occupations during at least the past five years and number of U.S. registered portfolios overseen in the Franklin Templeton/Legg Mason fund complex, are shown below. Generally, each board member serves until that person’s successor is elected and qualified.
Independent Board Members
| Name, Year of Birth and Address | Position | Length of Time Served | Number of Portfolios in Fund Complex Overseen by Board Member* | Other Directorships Held During at Least the Past 5 Years | ||||
| Edward I. Altman, Ph.D. (1941) One Franklin Parkway San Mateo, CA 94403-1906 | Trustee | Since 2011 | 11 | None | ||||
| Principal Occupation During at Least the Past 5 Years: | ||||||||
| Max L. Heine Professor of Finance, Emeritus and Director of The Credit and Debt Markets Research Program, Salomon Center, Stern School of Business, New York University; editor and author of numerous financial publications; financial consultant; an adviser to numerous financial and publishing organizations; and formerly, Vice Director, Salomon Center, Stern School of Business, New York University. | ||||||||
| Ann Torre Bates (1958) One Franklin Parkway San Mateo, CA 94403-1906 | Trustee and Chairperson | Trustee since 2011 and Chairperson since 2020 | 30 | Ares Capital Corporation (specialty finance company) (2010-present), United Natural Foods, Inc. (distributor of natural, organic and specialty foods) (2013-present), formerly, Allied Capital Corporation (financial services) (2003-2010), SLM Corporation (Sallie Mae) (1997-2014) and Navient Corporation (loan management, servicing and asset recovery) (2014-2016). | ||||
| Principal Occupation During at Least the Past 5 Years: | ||||||||
| Director of various companies; and formerly, Executive Vice President and Chief Financial Officer, NHP Incorporated (manager of multifamily housing) (1995-1997); and Vice President and Treasurer, US Airways, Inc. (until 1995). | ||||||||
| Jan Hopkins Trachtman (1947) One Franklin Parkway San Mateo, CA 94403-1906 | Trustee | Since 2011 | 11 | FTAC Parnassus Acquisition Corp. (special purpose fintech acquisition company) (2021-present); and formerly, FTAC Olympus Acquisition Corp. (special purpose fintech acquisition company) (2020-2022) and FinTech Acquisition Corp. III (special purpose fintech acquisition company) (2018-2021). | ||||
| Principal Occupation During at Least the Past 5 Years: | ||||||||
| President and Founder, The Jan Hopkins Group (communications consulting firm); serves on Alumni Advisory Board of Knight Bagehot Fellowship; and formerly, President, Economic Club of New York (2007-2015); Anchor/Correspondent, CNN Financial News (until 2003); Managing Director and Head of Client Communications, Citigroup Private Bank (until 2005); Off-Air Reporter, ABC News’ World News Tonight; and Editor, CBS Network News. | ||||||||
| Keith E. Mitchell (1954) One Franklin Parkway San Mateo, CA 94403-1906 | Trustee | Since 2011 | 11 | None | ||||
| Principal Occupation During at Least the Past 5 Years: | ||||||||
| Director of various boards of asset management firms; and formerly, Managing Member, Mitchell, Hartley & Bechtel Advisers, LLC (formerly, Mitchell Advisers, LLC) (advisory firm) (2003-2015) and Managing Director, Putman Lovell NBF. | ||||||||
| franklintempleton.com | Annual Report | 57 | ||||||||
FRANKLIN ALTERNATIVE STRATEGIES FUNDS
Independent Board Members (continued)
| Name, Year of Birth and Address | Position | Length of Time Served | Number of Portfolios in Fund Complex Overseen by Board Member* | Other Directorships Held During at Least the Past 5 Years | ||||
| David W. Niemiec (1949) One Franklin Parkway San Mateo, CA 94403-1906 | Trustee | Since 2015 | 30 | Hess Midstream LP (oil and gas midstream infrastructure) (2017-present). | ||||
| Principal Occupation During at Least the Past 5 Years: | ||||||||
| Advisor, Saratoga Partners (private equity fund); and formerly, Managing Director, Saratoga Partners (1998-2001) and SBC Warburg Dillon Read (investment banking) (1997-1998); Vice Chairman, Dillon, Read & Co. Inc. (investment banking) (1991-1997); and Chief Financial Officer, Dillon, Read & Co. Inc. (1982-1997). | ||||||||
| Robert E. Wade (1946) One Franklin Parkway San Mateo, CA 94403-1906 | Trustee | Since 2011 | 30 | El Oro Ltd (investments) (2003-2019). | ||||
| Principal Occupation During at Least the Past 5 Years: | ||||||||
| Attorney at law engaged in private practice as a sole practitioner (1972-2008) and member of various boards. | ||||||||
| Gregory H. Williams (1943) One Franklin Parkway San Mateo, CA 94403-1906 | Trustee | Since 2015 | 11 | None | ||||
| Principal Occupation During at Least the Past 5 Years: | ||||||||
| Private investor; Consultant; and formerly, President, University of Cincinnati (2009-2012); President, The City College of New York (2001-2009); Dean, College of Law, Ohio State University (1993-2001); and Associate Vice President, Academic Affairs and Professor of Law, University of Iowa (1977-1993). | ||||||||
Interested Board Members and Officers
| Name, Year of Birth and Address | Position | Length of Time Served | Number of Portfolios in Fund Complex Overseen by Board Member* | Other Directorships Held During at Least the Past 5 Years | ||||
| **Gregory E. Johnson (1961) One Franklin Parkway San Mateo, CA 94403-1906 | Trustee | Since 2011 | 131 | None | ||||
| Principal Occupation During at Least the Past 5 Years: | ||||||||
| Executive Chairman, Chairman of the Board and Director, Franklin Resources, Inc.; officer and/or director or trustee, as the case may be, of some of the other subsidiaries of Franklin Resources, Inc. and of certain funds in the Franklin Templeton/Legg Mason fund complex; Vice Chairman, Investment Company Institute; and formerly, Chief Executive Officer (2013-2020) and President (1994-2015) Franklin Resources, Inc | ||||||||
| **Jennifer M. Johnson (1964) One Franklin Parkway San Mateo, CA 94403-1906 | Trustee | Since 2015 | 72 | None | ||||
| Principal Occupation During at Least the Past 5 Years: | ||||||||
| Chief Executive Officer, President and Director, Franklin Resources, Inc.; officer and/or director or trustee, as the case may be, of some of the other subsidiaries of Franklin Resources, Inc. and of certain funds in the Franklin Templeton/Legg Mason fund complex; and formerly, Chief Operating Officer and Executive Vice President, Franklin Resources, Inc. (1994-2015); Executive Vice President of Operations and Technology, Franklin Resources, Inc. (2005-2010); and Senior Vice President, Franklin Resources, Inc. (2003-2005). | ||||||||
| Alison E. Baur (1964) One Franklin Parkway San Mateo, CA 94403-1906 | Vice President | Since 2012 | Not Applicable | Not Applicable | ||||
| Principal Occupation During at Least the Past 5 Years: | ||||||||
| Deputy General Counsel, Franklin Templeton; and officer of some of the other subsidiaries of Franklin Resources, Inc. and of certain funds in the Franklin Templeton/Legg Mason fund complex. | ||||||||
| 58 | Annual Report | franklintempleton.com | ||||||||
FRANKLIN ALTERNATIVE STRATEGIES FUNDS
Interested Board Members and Officers (continued)
| Name, Year of Birth and Address | Position | Length of Time Served | Number of Portfolios in Fund Complex Overseen by Board Member* | Other Directorships Held During at Least the Past 5 Years | ||||
Breda M. Beckerle (1958) 280 Park Avenue New York, NY 10017 | Chief Compliance Officer | Since 2020 | Not Applicable | Not Applicable | ||||
| Principal Occupation During at Least the Past 5 Years: | ||||||||
| Chief Compliance Officer, Fiduciary Investment Management International, Inc., Franklin Advisers, Inc., Franklin Mutual Advisers, LLC, Franklin Templeton Institutional, LLC; and officer of certain funds in the Franklin Templeton/Legg Mason fund complex. | ||||||||
| Steven J. Gray (1955) One Franklin Parkway San Mateo, CA 94403-1906 | Vice President and Secretary | Since 2011 | Not Applicable | Not Applicable | ||||
| Principal Occupation During at Least the Past 5 Years: | ||||||||
| Senior Associate General Counsel, Franklin Templeton; Assistant Secretary, Franklin Distributors, LLC; and officer of certain funds in the Franklin Templeton/Legg Mason fund complex. | ||||||||
| Matthew T. Hinkle (1971) One Franklin Parkway San Mateo, CA 94403-1906 | Chief Executive Officer – Finance and Administration | Since 2017 | Not Applicable | Not Applicable | ||||
| Principal Occupation During at Least the Past 5 Years: | ||||||||
| Senior Vice President, Franklin Templeton Services, LLC; officer of certain funds in the Franklin Templeton/Legg Mason fund complex; and formerly, Vice President, Global Tax (2012-April 2017) and Treasurer/Assistant Treasurer, Franklin Templeton (2009-2017). | ||||||||
Susan Kerr (1949) New York, NY 10018 | Vice President – AML Compliance | Since 2021 | Not Applicable | Not Applicable | ||||
| Principal Occupation During at Least the Past 5 Years: | ||||||||
| Senior Compliance Analyst, Franklin Templeton; Chief Anti-Money Laundering Compliance Officer, Legg Mason & Co., or its affiliates; Anti Money Laundering Compliance Officer; Senior Compliance Officer, LMIS; and officer of certain funds in the Franklin Templeton/Legg Mason fund complex. | ||||||||
Christopher Kings (1974) One Franklin Parkway San Mateo, CA 94403-1906 | Chief Financial Officer, Chief Accounting Officer and Treasurer | Since January 2022 | Not Applicable | Not Applicable | ||||
| Principal Occupation During at Least the Past 5 Years: | ||||||||
| Treasurer, U.S. Fund Administration & Reporting; and officer of certain funds in the Franklin Templeton/Legg Mason fund complex. | ||||||||
Brooks Ritchey (1959) Stamford, CT 06901 | President and Chief Executive Officer – Investment Management | Since 2020 | Not Applicable | Not Applicable | ||||
| Principal Occupation During at Least the Past 5 Years: | ||||||||
| Senior Managing Director and Co-Head of the Investment Research & Management, K2 Advisors; and officer of certain funds in the Franklin Templeton/Legg Mason fund complex. | ||||||||
| franklintempleton.com | Annual Report | 59 | ||||||||
FRANKLIN ALTERNATIVE STRATEGIES FUNDS
Interested Board Members and Officers (continued)
| Name, Year of Birth and Address | Position | Length of Time Served | Number of Portfolios in Fund Complex Overseen by Board Member* | Other Directorships Held During at Least the Past 5 Years | ||||
| Navid J. Tofigh (1972) One Franklin Parkway San Mateo, CA 94403-1906 | Vice President | Since 2015 | Not Applicable | Not Applicable | ||||
| Principal Occupation During at Least the Past 5 Years: | ||||||||
| Senior Associate General Counsel, Franklin Templeton; and officer of certain funds in the Franklin Templeton/Legg Mason fund complex. | ||||||||
| Lori A. Weber (1964) 300 S.E. 2nd Street Fort Lauderdale, FL 33301-1923 | Vice President | Since 2012 | Not Applicable | Not Applicable | ||||
| Principal Occupation During at Least the Past 5 Years: | ||||||||
| Senior Associate General Counsel, Franklin Templeton; Assistant Secretary, Franklin Resources, Inc.; Vice President and Secretary, Templeton Investment Counsel, LLC; and officer of certain funds in the Franklin Templeton/Legg Mason fund complex.. | ||||||||
*We base the number of portfolios on each separate series of the U.S. registered investment companies within the Franklin Templeton fund complex. These portfolios have a common investment manager or affiliated investment managers.
**Gregory E. Johnson is considered to be an interested person of the Fund under the federal securities laws due to his position as an officer and director of Franklin Resources, Inc. (Resources), which is the parent company of the Fund’s investment manager and distributor. Jennifer M. Johnson is considered to be an interested person of the Fund under the federal securities laws due to her position as an officer and director of Resources.
Note 1: Gregory E. Johnson and Jennifer M. Johnson are siblings
Note 2: Officer information is current as of the date of this report. It is possible that after this date, information about officers may change.
The Sarbanes-Oxley Act of 2002 and Rules adopted by the U.S. Securities and Exchange Commission require the Fund to disclose whether the Fund’s Audit Committee includes at least one member who is an audit committee financial expert within the meaning of such Act and Rules. The Fund’s Board has determined that there is at least one such financial expert on the Audit Committee and has designated each of Ann Torre Bates and David W. Niemiec as an audit committee financial expert. The Board believes that Ms. Bates and Mr. Niemiec qualify as such an expert in view of their extensive business background and experience. Ms. Bates has served as a member of the Fund Audit Committee since 2011. She currently serves as a director of Ares Capital Corporation (2010-present) and United Natural Foods, Inc. (2013-present) and was formerly a director of Navient Corporation from 2014 to 2016, SLM Corporation from 1997 to 2014 and Allied Capital Corporation from 2003 to 2010, Executive Vice President and Chief Financial Officer of NHP Incorporated from 1995 to 1997 and Vice President and Treasurer of US Airways, Inc. until 1995. Mr. Niemiec has served as a member of the Fund Audit Committee since 2015, currently serves as an Advisor to Saratoga Partners and was formerly its Managing Director from 1998 to 2001 and serves as a director of Hess Midstream Partners LP (2017-present). Mr. Niemiec was formerly a director of Emeritus Corporation from 1999 to 2010 and OSI Pharmaceuticals, Inc. from 2006 to 2010, Managing Director of SBC Warburg Dillon Read from 1997 to 1998, and was Vice Chairman from 1991 to 1997 and Chief Financial Officer from 1982 to 1997 of Dillon, Read & Co. Inc. As a result of such background and experience, the Board believes that Ms. Bates and Mr. Niemiec have each acquired an understanding of generally accepted accounting principles and financial statements, the general application of such principles in connection with the accounting estimates, accruals and reserves, and analyzing and evaluating financial statements that present a breadth and level of complexity of accounting issues generally comparable to those of the Fund, as well as an understanding of internal controls and procedures for financial reporting and an understanding of audit committee functions. Ms. Bates and Mr. Niemiec are independent Board members as that term is defined under the applicable U.S. Securities and Exchange Commission Rules and Releases.
The Statement of Additional Information (SAI) includes additional information about the board members and is available, without charge, upon request. Shareholders may call (800) DIAL BEN/342-5236 to request the SAI.
| 60 | Annual Report | franklintempleton.com | ||||||||
FRANKLIN ALTERNATIVE STRATEGIES FUNDS
Board Approval of Investment Management Agreements and Sub-Advisory Agreements
FRANKLIN ALTERNATIVE STRATEGIES FUNDS
Franklin K2 Long Short Credit Fund
(Fund)
The Board of Trustees (Board) of Franklin Alternative Strategies Funds (the Trust), including a majority of trustees that are not “interested persons” as such term is defined in section 2(a)(19) of the Investment Company Act of 1940 (hereinafter referred to as “independent trustees”), at a meeting held on May 19, 2021, unanimously approved the renewal of the Fund’s investment management agreement with K2/D&S Management Co., L.L.C. (K2 Advisors), and of each sub-advisory agreement between K2 Advisors and each of following sub-advisors (the Sub-Advisors):
Apollo Credit Management, LLC
Benefit Street Partners, L.L.C. (“Benefit Street”)
Ellington Global Asset Management, L.L.C.
EMSO Asset Management Limited
Medalist Partners, LP
It was noted that Benefit Street is an affiliate of K2 Advisors.
Prior to a meeting of all of the trustees for the purpose of considering such renewal, the independent trustees participated in two other meetings held in connection with the renewal process. Throughout the process, the independent trustees received assistance and advice from and met separately with independent counsel. The independent trustees met with and interviewed officers of K2 Advisors and certain Sub-Advisors (including portfolio managers), the transfer agent and shareholder services group and the distributor. In approving the renewal of the investment management agreement and the sub-advisory agreements for the Fund, the Board, including the independent trustees, determined that the investment management fee structure was fair and reasonable and that continuance of the agreement was in the best interests of the Fund and its shareholders. In doing so, the Board, including the independent trustees, found that the continued appointment of Benefit Street as a sub-advisor to the Fund does not involve a conflict of interest from which K2 Advisors or Benefit Street derives an inappropriate advantage.
In making the foregoing approvals, the Board considered various materials related to the investment management agreement and the sub-advisory agreements including: (1) a copy of the investment management agreement and
sub-advisory agreements; (2) information describing the nature, quality and extent of services that K2 Advisors and each Sub-Advisor provided, and are expected to provide, to the Fund, and the investment management fees and sub-advisory fees payable to K2 Advisors and each Sub-Advisor; (3) reports from K2 Advisors on the continued diligence conducted on each Sub-Advisor and the reasons for recommending renewal of each of the sub-advisory agreements, including, but not limited to, each Sub-Advisor’s background, experience, personnel, operations, policies, procedures and compliance functions; and (4) a report from the Trust’s Chief Compliance Officer regarding K2 Advisors’ and each Sub-Advisor’s compliance program and capabilities, including policies and procedures in place to address potential conflicts of interest, and the diligence undertaken by the Trust’s Chief Compliance Officer with respect thereto. The Board also reviewed and considered an annual report on payments made by Franklin Templeton (FT) or the Fund to financial intermediaries, as well as a memorandum relating to third-party servicing arrangements, which included discussion of the changing distribution landscape for the Fund.
The Board also took into account information furnished throughout the year at regular Board meetings, as well as information specifically requested and furnished for the renewal process, which culminated in the meetings referred to above for the specific purpose of considering such agreements. Information furnished throughout the year included, among others, reports on the Fund’s investment performance, expenses, portfolio composition, derivatives, asset segregation, portfolio turnover, Rule 12b-1 plan, distribution, shareholder servicing, legal and compliance matters, pricing of securities, sales and redemptions, and marketing support payments made to financial intermediaries, as well as a third-party survey of transfer agent fees charged to funds within the FT complex in comparison with those charged to other fund complexes deemed comparable. Also, related financial statements and other information about the scope and quality of services provided by K2 Advisors and its affiliates and enhancements to such services over the past year were provided. In addition, the trustees received periodic reports throughout the year and during the renewal process relating to compliance with the Fund’s investment policies and restrictions. During the renewal process, the independent trustees considered K2 Advisors’ methods of operation within the Franklin Templeton group and its activities on behalf of other clients.
The information obtained by the trustees during the renewal process also included a special report prepared by
| franklintempleton.com | Annual Report | 61 | ||||||||
FRANKLIN ALTERNATIVE STRATEGIES FUNDS
SHAREHOLDER INFORMATION
Broadridge Financial Solutions, Inc., an independent third-party analyst that utilizes data from Lipper, Inc. (“Lipper”), comparing the Fund’s investment performance and expenses with those of other mutual funds deemed comparable to such Fund as selected by Lipper (Broadridge Section 15(c) Report). The trustees reviewed the Broadridge Section 15(c) Report and its usefulness in the renewal process with respect to matters such as comparative fees, expenses, expense ratios and performance. The Board considered K2 Advisors’ views that the peer group determined by Lipper for comparison purposes may not be an entirely appropriate representation of the Fund’s peer universe. K2 Advisors explained that the universe of funds that are managed using multi-manager, multi-strategy structures, like the Fund, continues to evolve, and has presented challenges in identifying an appropriate set of peers for the Fund. It was noted by K2 Advisors that the peer group compiled by Lipper includes single-manager funds which, due to their nature and relative simplicity, have lower expense ratios and are not true peers for fee comparison purposes (“Expense Group”). While noting the limitations of the Broadridge Section 15(c) Report, the Board concluded that the Broadridge Section 15(c) Report was helpful in the performance of its duties.
In addition, the trustees received a Profitability Study (Profitability Study) prepared by management discussing the profitability to FT from its overall U.S. fund operations, as well as on an individual fund-by-fund basis. Over the past year, the Board and counsel to the independent trustees continued to receive reports on management’s handling of recent regulatory inquiries and pending legal actions against K2 Advisors and its affiliates. The independent trustees were satisfied with the actions taken to date by management in response to such regulatory and legal matters. The independent trustees also received reports from the Trust’s Chief Compliance Officer on regulatory inquiries and pending legal actions against the Sub-Advisors applicable to the services provided by the Sub-Advisors to the Fund and noted that there were not any issues in this regard that should prevent the renewal of the sub-advisory agreements.
The trustees reviewed the personnel, operations, financial condition, and investment management capabilities, methodologies and resources of K2 Advisors and each Sub-Advisor, including each management team’s expertise in the management of other alternative strategies funds. As part of this review, particular attention was given to (1) the diligent risk management program of K2 Advisors and its parent, including those aspects of the program related to selecting and overseeing sub-advisors to the Fund and continual
monitoring and management of cybersecurity, liquidity and counterparty credit risk, (2) each Sub-Advisor’s risk management program, and (3) derivatives and other complex instruments that are held and expected to be held by the Fund and how such instruments are used to carry out the Fund’s investment goal.
The Board also took into account, among other things, management’s efforts in establishing a global credit facility for the benefit of the Fund and other accounts managed by FT to provide a source of cash for temporary and emergency purposes or to meet unusual redemption requests as well as the strong financial position of K2 Advisors’ parent company and its commitment to the mutual fund business. The Board noted management’s continuing efforts and expenditures in establishing effective business continuity plans and developing strategies to address areas of heightened concern in the mutual fund industry, such as cybersecurity in the current work-from-home environment and liquidity risk management. The Board also recognized management’s commitment to facilitating Board oversight of particular areas, including derivatives and payments to intermediaries, by enhanced reporting. In addition, the Board received updates from management on the compliance of the investment manager with comprehensive rules and regulations promulgated by the SEC and the U.S. Commodity Futures Trading Commission.
In addition to the above and other matters considered by the trustees throughout the course of the year, the following discussion relates to certain primary factors relevant to the Board’s decision. This discussion of the information and factors considered by the Board (including the information and factors discussed above) is not intended to be exhaustive, but rather summarizes certain factors considered by the Board. In view of the wide variety of factors considered, the Board did not, unless otherwise noted, find it practicable to quantify or otherwise assign relative weights to the foregoing factors. In addition, individual trustees may have assigned different weights to various factors.
NATURE, EXTENT AND QUALITY OF SERVICES. The trustees reviewed the nature, extent and quality of the services provided, and to be provided, by K2 Advisors and each Sub-Advisor. In this regard, they reviewed the Fund’s investment goal and K2 Advisors’ and each Sub-Advisor’s investment strategy and sub-strategy, and K2 Advisors’ and each Sub-Advisor’s ability to implement such investment strategy and/or sub-strategy, including, but not limited to, K2 Advisors’ and each Sub-Advisor’s trading practices, investment decision processes and reputation.
| 62 | Annual Report | franklintempleton.com | ||||||||
FRANKLIN ALTERNATIVE STRATEGIES FUNDS
SHAREHOLDER INFORMATION
The Board noted that the Fund employs a “manager of managers” structure, whereby K2 Advisors is responsible for selecting sub-advisors (subject to Board approval), allocating the Fund’s assets among them, and overseeing the sub-advisors’ day-to-day management of the Fund’s assets. The Board noted the responsibilities that K2 Advisors has as the Fund’s investment manager, including (1) due diligence on the Sub-Advisors and any potential new sub-advisors to the Fund, their respective trading strategies, risk management, operations and businesses, (2) on-going oversight and monitoring of the day-to-day investment activities of Sub-Advisors and other service providers, including their respective compliance with the investment mandate and restrictions, compliance policies and procedures and federal securities laws, and K2 Advisors’ ongoing assessment of their performance, (3) portfolio construction with respect to the allocation of assets among Sub-Advisors, investment funds, cash and other investments, (4) risk management, (5) preparing quarterly reports to the Board, and (6) the implementation of Board directives as they relate to the Fund. The Trustees also considered the successful performance of K2 Advisors in managing the Fund and other investment products with similar investment strategies to the investment strategies of the Fund that are not subject to the Investment Company Act of 1940.
With respect to the sub-advisory services provided, and to be provided, by each Sub-Advisor, the Board noted the responsibilities that each Sub-Advisor has with respect to the portion of the Fund’s assets allocated to the Sub-Advisor by K2 Advisors (Sub-Advised Portion), including, among others, implementing the investment strategies with respect to the Sub-Advised Portion and ensuring compliance with the investment strategies, policies and limitations of the Sub-Advised Portion. The trustees considered the successful performance of each Sub-Advisor in managing the Fund and other investment products with similar investment strategies to the investment strategies of its Sub-Advised Portion of the Fund, including, with respect to certain Sub-Advisors, mutual funds with similar investment strategies. The Board considered K2 Advisors’ rationale for recommending the continued retention of each Sub-Advisor.
The trustees reviewed the Fund’s portfolio management teams at K2 Advisors and each Sub-Advisor, including each such team’s performance, staffing, skills and compensation program. With respect to portfolio manager compensation, management assured the trustees that the Fund’s long-term performance is a significant component of incentive-based compensation for K2 Advisors’ portfolio management team and noted that a portion of a K2 Advisors’ portfolio manager’s
incentive-based compensation is paid in shares of pre-designated funds from the portfolio manager’s fund management area. The trustees noted that the portfolio manager compensation program aligned the interests of the portfolio managers with that of Fund shareholders. During regular Board meetings and the aforementioned meetings of the independent trustees, the trustees considered periodic reports provided to them showing that K2 Advisors and the Sub-Advisors complied with the investment policies and restrictions of the Fund as well as other reports periodically furnished to the Board covering matters such as the compliance of portfolio managers and other management personnel with the code of ethics covering the investment management personnel, the adherence to fair value pricing procedures established by the Board and the accuracy of net asset value calculations. The Board noted the extent of the benefits provided to Fund shareholders from being part of the Franklin Templeton group of funds, including the right to exchange investments between funds (same class) without a sales charge, the ability to reinvest Fund dividends into other funds and the right to combine holdings of other funds to obtain reduced sales charges.
The trustees discussed with management various other products, portfolios and entities that are advised by K2 Advisors and each Sub-Advisor and the allocation of assets and expenses among and within them, as well as their relative fees and reasons for differences with respect thereto and any potential conflicts.
The Board also considered a report from the Trust’s Chief Compliance Officer regarding K2 Advisors’ and each Sub-Advisor’s compliance programs and capabilities as such programs and capabilities relate to the operations of the Fund and the monitoring and testing of such program undertaken by the Trust’s Chief Compliance Officer. The Board considered the selection and due diligence process employed by K2 Advisors in selecting and deciding to retain each Sub-Advisor as a sub-advisor to the Fund, including the due diligence undertaken with respect to the Sub-Advisor’s compliance and risk management capabilities. The trustees considered K2 Advisors’ significant efforts in developing and implementing compliance procedures established in accordance with SEC and other requirements. The Board also considered the nature, extent and quality of the services to be provided under the Fund’s other service agreements to determine that, on an overall basis, Fund shareholders were well served. In this connection, the Board also took into account transfer agent and shareholder services provided to Fund shareholders by an affiliate of K2 Advisors, noting favorable periodic reports on shareholder services conducted
| franklintempleton.com | Annual Report | 63 | ||||||||
FRANKLIN ALTERNATIVE STRATEGIES FUNDS
SHAREHOLDER INFORMATION
by independent third parties. While such considerations directly affected the trustees’ decision in renewing the Fund’s transfer agent and shareholder services agreement, the Board also considered these commitments as incidental benefits to Fund shareholders deriving from the investment management relationship.
Based on their review, the trustees were satisfied with the nature and quality of the overall services provided, and to be provided, by K2 Advisors and its affiliates and each Sub Advisor to the Fund and its shareholders and were confident in the abilities of K2 Advisors and each Sub-Advisor to implement their respective investment strategy and/or sub-strategy and to provide quality services to the Fund and its shareholders.
INVESTMENT PERFORMANCE. As the Fund commenced operations in September 2015, the trustees reviewed the investment performance of the Fund for the one-, three- and five-year periods ended December 31, 2021.
As part of their review, they inquired of management regarding benchmark and hedging activities. Consideration was also given to performance in the context of available levels of cash, including as affected by net flows, during the periods. The trustees had meetings during the year, including the meetings referred to above held in connection with the renewal process, with the Fund’s portfolio managers to discuss performance and the management of the Fund and each Sub-Advisor.
In addition, attention in assessing performance was given to the Broadridge Section 15(c) Report. That report showed the investment performance of the Fund (Advisor Class shares) in comparison to other funds determined comparable by Lipper.
The comparable funds to the Fund, as chosen by Lipper, included all retail and institutional specialty fixed income funds. The Fund had total returns in the second-best performing quintile for the one-year period ended December 31, 2021 and total returns also in the second-best performing quintile for the three- and five-year periods ended December 31, 2021. The Board was satisfied with such performance.
The trustees also compared Fund performance to other industry benchmarks, including measures of risk-adjusted performance of a fund, as part of their evaluation of investment performance. The trustees concluded that the Fund had continued to perform well in comparison to its various benchmarks and in the context of the Fund’s investment goal.
COMPARATIVE EXPENSES AND PROFITABILITY. The trustees considered the cost of the services provided, and to be provided, by K2 Advisors and each Sub-Advisor and the losses realized by K2 Advisors and its affiliates from their relationships with the Fund. As part of the renewal process, they explored with management the trends in expense ratios over the past three fiscal years and the reasons for any increases in the Fund’s expense ratios (or components thereof). In this regard, the trustees took into account the reduction of the investment management fee as part of the 2021 renewal process from 1.90% to 1.60% and the further reduction in February 2022 from 1.60% to 1.50%, as well as the reduction in the cap in the fee waiver and expense limitation arrangement from 1.95% to 1.65% in 2021 and from 1.65% to 1.50% in February 2022. In considering the appropriateness of the management fee and other expenses charged to the Fund, the Board took into account various factors including investment performance and matters relating to Fund operations, including, but not limited to, the quality and experience of K2 Advisors personnel. The Board also reviewed and considered the investment management fees in light of the nature, extent and quality of the investment management services provided, and to be provided, by K2 Advisors and each Sub-Advisor, as more fully discussed above. The Board also considered the reductions negotiated by K2 Advisors in the sub-advisory fees charged by the Sub-Advisers, including the addition of breakpoints in the sub-advisory fee schedules of certain Sub-Advisors in 2021. The Board noted that the sub-advisory fees are paid by K2 Advisors to each Sub-Advisor and are not additional fees borne by the Fund. The Board also noted that the sub-advisory fees paid, and to be paid, by K2 Advisors to each Sub-Advisor (other than Benefit Street) were the product of arms-length negotiations between K2 Advisors and each Sub-Advisor.
Furthermore, the Board took into account that information regarding Sub-Advisor profitability is not legally required to be provided. Accordingly, profitability information of the sub-advisors was given lesser weight than other factors. In addition, the Board considered the allocation of the investment management fee charged to the Fund between K2 Advisors and each Sub-Advisor in light of the nature, extent and quality of the investment management services provided, and to be provided, by K2 Advisors and each Sub-Advisor. As part of this discussion, the Board took into account the fee waiver and expense limitation arrangement in effect and the amount of Fund expenses that were absorbed since inception of the Fund by K2 Advisors through such waivers and arrangements.
| 64 | Annual Report | franklintempleton.com | ||||||||
FRANKLIN ALTERNATIVE STRATEGIES FUNDS
SHAREHOLDER INFORMATION
Consideration was also given to a comparative analysis in the Broadridge Section 15(c) Report of the investment management fee and total expense ratio of the Fund in comparison with those of a group of other funds selected by Lipper as its appropriate Lipper expense group.
Lipper expense data is based upon information taken from each fund’s most recent annual report, which preceded the date of the new fee structure noted above and which reflects historical asset levels that may be quite different from those currently existing, particularly in a period of market volatility.
In reviewing comparative costs, emphasis was given to the Fund’s contractual management fee in comparison with the contractual management fee that would have been charged by other funds within its Lipper expense group assuming they were similar in size to the Fund, as well as the actual total expenses of the Fund in comparison with those of its Lipper expense group. The Lipper contractual management fee analysis includes administrative charges as being part of the management fee, and total expenses, for comparative consistency, are shown by Lipper for Fund Advisor Class shares. The Fund’s contractual management fee rate was in the most expensive quintile of its Expense Group. The Fund’s total expenses were also in the most expensive quintile of its Expense Group.
Noting (i) the factors and limitations with respect to the Broadridge Section 15(c) Report (including the inclusion of single-manager funds in the peer group), and (ii) factors relating to the Fund’s operations, such as the quality and experience of K2 Advisors and the Sub-Advisors and the nature and quality of the services provided and to be provided by K2 Advisors and the Sub-Advisors, the Board found such comparative fees and expenses to be acceptable.
The trustees also reviewed the Profitability Study addressing profitability of Franklin Resources, Inc., from its overall U.S. fund business, as well as profitability to K2 Advisors and its affiliates, from providing investment management and other services to the Fund during the 12-month period ended September 30, 2021, the most recent fiscal year-end of Franklin Resources, Inc. The trustees reviewed the basis on which such reports are prepared and the cost allocation methodology utilized in the Profitability Study, it being recognized that allocation methodologies may each be reasonable while producing different results. In this respect, the Board noted that the reasonableness of the cost allocation methodologies was reviewed by independent accountants on an every other year basis.
The independent trustees met with management to discuss the Profitability Study. This included, among other things, a comparison of investment management income with investment management expenses of the Fund; comparison of underwriting revenues and expenses; the relative relationship of investment management and underwriting expenses; shareholder servicing profitability; economies of scale; and the relative contribution of the Fund to the profitability of K2 Advisors and its parent. In discussing the Profitability Study with the Board, K2 Advisors stated its belief that the costs incurred in establishing the infrastructure necessary to operate the type of mutual fund operations conducted by it and its affiliates may not be fully reflected in the expenses allocated to the Fund in determining its profitability.
The Board also took into account management’s expenditures in improving shareholder services provided to the Fund, as well as the need to meet additional regulatory and compliance requirements. The trustees also considered the extent to which K2 Advisors and the Sub-Advisors may derive ancillary benefits from Fund operations, including those derived from the allocation of Fund brokerage and the use of commission dollars to pay for research and other similar services.
The Board noted that shareholders are able to redeem their Fund shares at any time if shareholders believe that Fund fees and expenses are too high or if they are dissatisfied with the performance of the Fund.
ECONOMIES OF SCALE. The Board considered economies of scale realized by K2 Advisors and its affiliates and the Sub-Advisors as the Fund grows larger and the extent to which they are shared with Fund shareholders, as for example, in the level of the investment management fees charged, in the quality and efficiency of services rendered and in increased capital commitments benefiting the Fund directly or indirectly. The Board also considered the fee waiver and expense limitation arrangement in effect, and the amount of Fund expenses that were absorbed since inception of the Fund by K2 Advisors through such waiver and arrangement. The Board concluded that economies of scale were deemed not to be a significant factor at that time in light of, among other matters, the fee waiver and expense limitation arrangement in effect.
Liquidity Risk Management Program
Each Fund has adopted and implemented a written Liquidity Risk Management Program (the “LRMP”) as required by Rule 22e-4 under the Investment Company Act of 1940 (the “Liquidity Rule”). The LRMP is designed to assess and
| franklintempleton.com | Annual Report | 65 | ||||||||
FRANKLIN ALTERNATIVE STRATEGIES FUNDS
SHAREHOLDER INFORMATION
manage each Fund’s liquidity risk, which is defined as the risk that the Fund could not meet requests to redeem shares issued by the Fund without significant dilution of remaining investors’ interests in the Fund. In accordance with the Liquidity Rule, the LRMP includes policies and procedures that provide for: (1) assessment, management, and review (no less frequently than annually) of each Fund’s liquidity risk; (2) classification of each Fund’s portfolio holdings into one of four liquidity categories (Highly Liquid, Moderately Liquid, Less Liquid, and Illiquid); (3) for Funds that do not primarily hold assets that are Highly Liquid, establishing and maintaining a minimum percentage of the Fund’s net assets in Highly Liquid investments (called a “Highly Liquid Investment Minimum” or “HLIM”); and (4) prohibiting the Fund’s acquisition of Illiquid investments that would result in the Fund holding more than 15% of its net assets in Illiquid assets. The LRMP also requires reporting to the Securities and Exchange Commission (“SEC”) (on a non-public basis) and to the Board if the Fund’s holdings of Illiquid assets exceed 15% of the Fund’s net assets. Funds with HLIMs must have procedures for addressing HLIM shortfalls, including reporting to the Board and, with respect to HLIM shortfalls lasting more than seven consecutive calendar days, reporting to the SEC (on a non-public basis).
The Director of Liquidity Risk within the Investment Risk Management Group (the “IRMG”) is the appointed Administrator of the LRMP. The IRMG maintains the Investment Liquidity Committee (the “ILC”) to provide oversight and administration of policies and procedures governing liquidity risk management for Franklin Templeton and Legg Mason products and portfolios. The ILC includes representatives from Franklin Templeton’s Risk, Trading, Global Compliance, Legal, Investment Compliance, Investment Operations, Valuation Committee, Product Management and Global Product Strategy.
In assessing and managing each Fund’s liquidity risk, the ILC considers, as relevant, a variety of factors, including the Fund’s investment strategy and the liquidity of its portfolio investments during both normal and reasonably foreseeable stressed conditions; its short and long-term cash flow projections; and its cash holdings and access to other funding sources including the Funds’ interfund lending facility and line of credit. Classification of the Fund’s portfolio holdings in the four liquidity categories is based on the number of days it is reasonably expected to take to convert the investment to cash (for Highly Liquid and Moderately Liquid holdings) or sell or dispose of the investment (for Less Liquid and Illiquid investments), in current market conditions without significantly changing the investment’s market value.
Each Fund primarily holds liquid assets that are defined under the Liquidity Rule as “Highly Liquid Investments,” and therefore is not required to establish an HLIM. Highly Liquid Investments are defined as cash and any investment reasonably expected to be convertible to cash in current market conditions in three business days or less without the conversion to cash significantly changing the market value of the investment.
At meetings of the Funds’ Board of Trustees held in May 2022, the Program Administrator provided a written report to the Board addressing the adequacy and effectiveness of the program for the year ended December 31, 2021. The Program Administrator report concluded that (i.) the LRMP, as adopted and implemented, remains reasonably designed to assess and manage each Fund’s liquidity risk; (ii.) the LRMP, including the Highly Liquid Investment Minimum (“HLIM”) where applicable, was implemented and operated effectively to achieve the goal of assessing and managing each Fund’s liquidity risk; and (iii.) each Fund was able to meet requests for redemption without significant dilution of remaining investors’ interests in the Fund.
Proxy Voting Policies and Procedures
The Fund’s investment manager has established Proxy Voting Policies and Procedures (Policies) that the Fund uses to determine how to vote proxies relating to portfolio securities. Shareholders may view the Fund’s complete Policies online at franklintempleton.com. Alternatively, shareholders may request copies of the Policies free of charge by calling the Proxy Group collect at (954) 527-7678 or by sending a written request to: Franklin Templeton Companies, LLC, 300 S.E. 2nd Street, Fort Lauderdale, FL 33301, Attention: Proxy Group. Copies of the Fund’s proxy voting records are also made available online at franklintempleton.com and posted on the U.S. Securities and Exchange Commission’s website at sec.gov and reflect the most recent 12-month period ended June 30.
Quarterly Schedule of Investments
The Trust, on behalf of the Fund, files a complete schedule of investments with the U.S. Securities and Exchange Commission for the first and third quarters for each fiscal year as an exhibit to its report on Form N-PORT. Shareholders may view the filed Form N-PORT by visiting the Commission’s website at sec.gov. The filed form may also be viewed and copied at the Commission’s Public Reference Room in Washington, DC. Information regarding the operations of the Public Reference Room may be obtained by calling (800) SEC-0330.
| 66 | Annual Report | franklintempleton.com | ||||||||
FRANKLIN ALTERNATIVE STRATEGIES FUNDS
SHAREHOLDER INFORMATION
Householding of Reports and Prospectuses
You will receive, or receive notice of the availability of, the Fund’s financial reports every six months. In addition, you will receive an annual updated summary prospectus (detail prospectus available upon request). To reduce Fund expenses, we try to identify related shareholders in a household and send only one copy of the financial reports (to the extent received by mail) and summary prospectus. This process, called “householding,” will continue indefinitely unless you instruct us otherwise. If you prefer not to have these documents householded, please call us at (800) 632-2301. At any time you may view current prospectuses/summary prospectuses and financial reports on our website. If you choose, you may receive these documents through electronic delivery.
| franklintempleton.com | Annual Report | 67 | ||||||||
FRANKLIN ALTERNATIVE STRATEGIES FUNDS
FRANKLIN K2 LONG SHORT CREDIT FUND
Important Notice to Shareholders
SECTION 19(A) NOTICE
On December 30, 2021, the Fund distributed $0.2289, $0.1444, $0.2049, $0.2658 and $0.2582 from net investment income for Class A, Class C, Class R, Class R6 and Advisor Class, respectively; and $0.1352 from short-term capital gains, which are calculated on a tax basis in accordance with income tax regulations.
Estimated distribution sources are as follows: $0.1842, $0.1162, $0.1649, $0.2139 and $0.2078 represents net investment income for Class A, Class C, Class R, Class R6 and Advisor Class, respectively; $0.1581, $0.1497, $0.1557, $0.1618 and $0.1610 represents gain from the sale of securities for Class A, Class C, Class R, Class R6 and Advisor Class, respectively; and $0.0218, $0.0137, $0.0195, $0.0253 and $0.0246 represents return of principal for Class A, Class C, Class R, Class R6 and Advisor Class, respectively. These estimates are calculated in accordance with U.S. Generally Accepted Accounting Principles that may significantly differ from the amounts calculated on a tax basis. This information is being provided pursuant to Section 19(a) of the Investment Company Act of 1940 and should not be used for tax reporting purposes.
| 68 | Annual Report | franklintempleton.com | ||||||||
Authorized for distribution only when accompanied or preceded by a summary prospectus and/or prospectus. Investors should carefully consider a fund’s investment goals, risks, charges and expenses before investing. A prospectus contains this and other information; please read it carefully before investing.
To help ensure we provide you with quality service, all calls to and from our service areas are monitored and/or recorded.
 | Annual Report and Shareholder Letter Franklin K2 Long Short Credit Fund | |||||
| Investment Manager | Distributor | Shareholder Services | ||||
| K2/D&S Management Co., L.L.C. | Franklin Distributors, LLC (800) DIAL BEN®/342-5236 franklintempleton.com | (800) 632-2301 | ||||
| © 2022 Franklin Templeton Investments. All rights reserved. | 948 A 07/22 | |||||
| (b) | Not applicable. |
Item 2. Code of Ethics.
(a) The Registrant has adopted a code of ethics that applies to its principal executive officers and principal financial and accounting officer.
(c) N/A
(d) N/A
(f) Pursuant to Item 13(a)(1), the Registrant is attaching as an exhibit a copy of its code of ethics that applies to its principal executive officers and principal financial and accounting officer.
Item 3. Audit Committee Financial Expert.
(a)(1) The Registrant has an audit committee financial expert serving on its audit committee.
(2) The audit committee financial experts are Ann Torre Bates and David W. Niemiec and they are “independent” as defined under the relevant Securities and Exchange Commission Rules and Releases.
Item 4. Principal Accountant Fees and Services.
Audit Fees
(a) The aggregate fees paid to the principal accountant for professional services rendered by the principal accountant for the audit of the registrant’s annual financial statements or for services that are normally provided by the principal accountant in connection with statutory and regulatory filings or engagements were $215,144 for the fiscal year ended May 31, 2022 and $203,775 for the fiscal year ended May 31, 2021.
Audit-Related Fees
(b) There were no fees paid to the principal accountant for assurance and related services rendered by the principal accountant to the registrant that are reasonably related to the performance of the audit of the registrant’s financial statements and are not reported under paragraph (a) of Item 4.
There were no fees paid to the principal accountant for assurance and related services rendered by the principal accountant to the registrant’s investment adviser and any entity controlling, controlled by or under common control with the investment adviser that provides ongoing services to the registrant that are reasonably related to the performance of the audit of their financial statements.
Tax Fees
(c) The aggregate fees paid to the principal accountant for professional services rendered by the principal accountant to the registrant for tax compliance, tax advice and tax planning were $2,846 for the fiscal year ended May 31, 2022 and $1,637 for the fiscal year ended May 31, 2021. The services for which these fees were paid included identifying passive foreign investment companies to manage exposure to tax liabilities.
The aggregate fees paid to the principal accountant for professional services rendered by the principal accountant to the registrant’s investment adviser and any entity controlling, controlled by or under common control with the investment adviser that provides ongoing services to the registrant for tax compliance, tax advice and tax planning were $100,000 for the fiscal year ended May 31, 2022 and $71,000 for the fiscal year ended May 31, 2021. The services for which these fees were paid included technical tax consultation for withholding tax report to foreign governments, application of local country tax laws and tax advice.
All Other Fees
(d) There were no fees paid to the principal accountant for products and services rendered by the principal accountant to the registrant other than the services reported in paragraphs (a)-(c) of Item 4.
There were no fees paid to the principal accountant for products and services rendered by the principal accountant to the registrant’s investment adviser and any entity controlling, controlled by or under common control with the investment adviser that provides ongoing services to the registrant other than the services reported in paragraphs (a)-(c) of Item 4.
(e) (1) The registrant’s audit committee is directly responsible for approving the services to be provided by the auditors, including:
(i) pre-approval of all audit and audit related services;
(ii) pre-approval of all non-audit related services to be provided to the Fund by the auditors;
(iii) pre-approval of all non-audit related services to be provided to the registrant by the auditors to the registrant’s investment adviser or to any entity that controls, is controlled by or is under common control with the registrant’s investment adviser and that provides ongoing services to the registrant where the non-audit services relate directly to the operations or financial reporting of the registrant; and
(iv) establishment by the audit committee, if deemed necessary or appropriate, as an alternative to committee pre-approval of services to be provided by the auditors, as required by paragraphs (ii) and (iii) above, of policies and procedures to permit such services to be pre-approved by other means, such as through establishment of guidelines or by action of a designated member or members of the committee; provided the policies and procedures are detailed as to the particular service and the committee is informed of each service and such policies and procedures do not include delegation of audit committee responsibilities, as contemplated under the Securities Exchange Act of 1934, to management; subject, in the case of (ii) through (iv), to any waivers, exceptions or exemptions that may be available under applicable law or rules.
(e)(2) None of the services described in each of paragraphs (b) through (d) of this Item that were approved by the audit committee pursuant to paragraph (c)(7)(i)(C) of Rule 2-01 of Regulation S-X.
(f) No disclosures are required by this Item 4(f).
(g) The aggregate non-audit fees paid to the principal accountant for services rendered by the principal accountant to the registrant and the registrant’s investment adviser and any entity controlling, controlled by or under common control with the investment adviser that provides ongoing services to the registrant were $102,846 for the fiscal year ended May 31, 2022 and $72,637 for the fiscal year ended May 31, 2021.
(h) The registrant’s audit committee of the board of directors has considered whether the provision of non-audit services that were rendered to the registrant’s investment adviser (not including any sub-adviser whose role is primarily portfolio management and is subcontracted with or overseen by another investment adviser), and any entity controlling, controlled by, or under common control with the investment adviser that provides ongoing services to the registrant that were not pre-approved pursuant to paragraph (c)(7)(ii) of Rule 2-01 of Regulation S-X is compatible with maintaining the principal accountant’s independence.
(i) Not applicable.
(j) Not applicable.
Item 5. Audit Committee of Listed Registrants.
Not Applicable.
Item 6. Investments.
Not applicable.
Item 7. Disclosure of Proxy Voting Policies and Procedures for Closed-End Management Investment Companies.
Not applicable.
Item 8. Portfolio Managers of Closed-End Management Investment Companies.
Not applicable.
Item 9. Purchases of Equity Securities by Closed-End Management Investment Company and Affiliated Purchasers.
Not applicable.
Item 10. Submission of Matters to a Vote of Security Holders.
There have been no changes to the procedures by which shareholders may recommend nominees to the Registrant’s Board of Trustees that would require disclosure herein.
Item 11. Controls and Procedures.
| (a) | The registrant’s principal executive and principal financial officers, or persons performing similar functions, have concluded that the registrant’s disclosure controls and procedures (as defined in Rule 30a-3(c) under the Investment Company Act of 1940, as amended (the “1940 Act”) (17 CFR 270.30a-3(c))) are effective, as of a date within 90 days of the filing date of the report that includes the disclosure required by this paragraph, based on their evaluation of these controls and procedures required by Rule 30a-3(b) under the 1940 Act (17 CFR 270.30a-3(b)) and Rules 13a-15(b) or 15d-15(b) under the Securities Exchange Act of 1934, as amended (17 CFR 240.13a-15(b) or 240.15d-15(b)). |
| (b) | There were no changes in the registrant’s internal control over financial reporting (as defined in Rule 30a-3(d) under the 1940 Act (17 CFR 270.30a-3(d))) that occurred during the period covered by this report that has materially affected, or is reasonably likely to materially affect, the registrant’s internal control over financial reporting. |
Item 12. Disclosure of Securities Lending Activities for Closed-End Management Investment Companies.
Not applicable.
Item 13. Exhibits.
| (a)(1) | Code of Ethics | |
| (a)(2) | Certifications pursuant to Rule 30a-2(a) under the 1940 Act and Section 302 of the Sarbanes-Oxley Act of 2002 are attached hereto. | |
| a)(2)(1) | Not Applicable. | |
| (a)(2)(2) | Not Applicable. | |
| (b) | Certifications pursuant to Rule 30a-2(b) under the 1940 Act and Section 906 of the Sarbanes-Oxley Act of 2002 are attached hereto. | |
SIGNATURES
Pursuant to the requirements of the Securities Exchange Act of 1934 and the Investment Company Act of 1940, the registrant has duly caused this report to be signed on its behalf by the undersigned, thereunto duly authorized.
| (Registrant) Franklin Alternative Strategies Funds | ||
| By (Signature and Title) | /s/ Matthew T. Hinkle | |
| Matthew T. Hinkle, Chief Executive Officer – Finance and | ||
| Administration | ||
Date August 2, 2022
Pursuant to the requirements of the Securities Exchange Act of 1934 and the Investment Company Act of 1940, this report has been signed below by the following persons on behalf of the registrant and in the capacities and on the dates indicated.
| By (Signature and Title) | /s/ Matthew T. Hinkle | |
| Matthew T. Hinkle, Chief Executive Officer – Finance and | ||
| Administration | ||
| Date August 2, 2022 | ||
| By (Signature and Title) | /s/ Christopher Kings | |
| Christopher Kings, Treasurer, Chief Financial Officer, and Chief | ||
| Accounting Officer | ||
| Date August 2, 2022 | ||