|
Exhibit 99.2 
|
Quarterly Investor Supplement
December 31, 2016
This report should be read in conjunction with Voya Financial, Inc.‘s Annual Report on Form10-K for the twelve months ended December 31, 2016. Voya Financial’s Annual Reports on Form10-K, and Quarterly Reports on Form10-Q, can be accessed upon filing at the Securities and Exchange Commission’s website at www.sec.gov, and at our website at investors.voya.com. All information is unaudited.
|
|
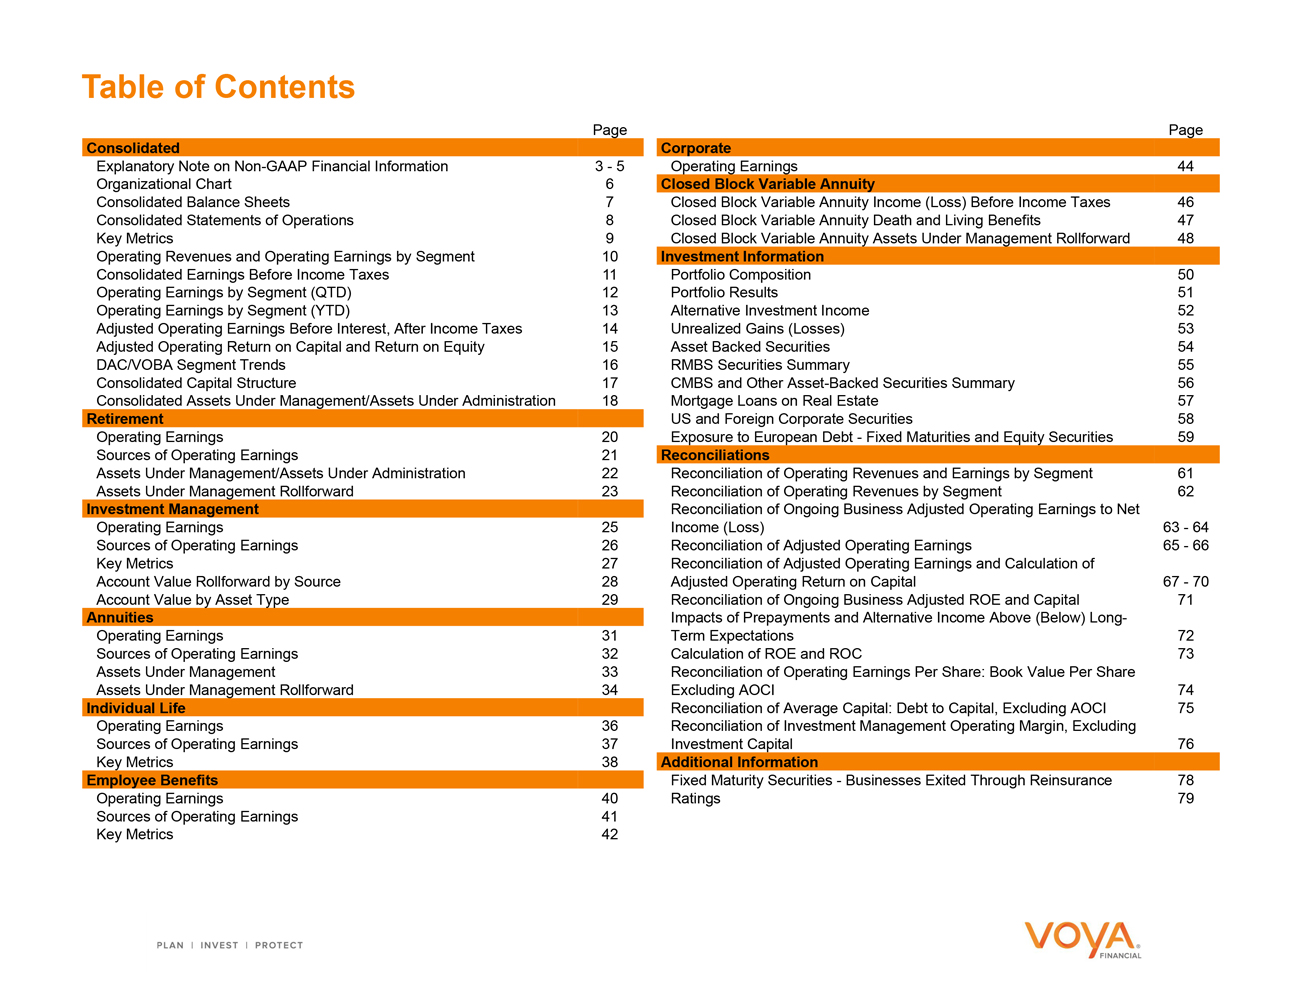
Table of Contents Page Consolidated Explanatory Note on Non-GAAP Financial Information 3—5 Organizational Chart 6 Consolidated Balance Sheets 7 Consolidated Statements of Operations 8 Key Metrics 9 Operating Revenues and Operating Earnings by Segment 10 Consolidated Earnings Before Income Taxes 11 Operating Earnings by Segment (QTD) 12 Operating Earnings by Segment (YTD) 13 Adjusted Operating Earnings Before Interest, After Income Taxes 14 Adjusted Operating Return on Capital and Return on Equity 15 DAC/VOBA Segment Trends 16 Consolidated Capital Structure 17 Consolidated Assets Under Management/Assets Under Administration 18 Retirement Operating Earnings 20 Sources of Operating Earnings 21 Assets Under Management/Assets Under Administration 22 Assets Under Management Rollforward 23 Investment Management Operating Earnings 25 Sources of Operating Earnings 26 Key Metrics 27 Account Value Rollforward by Source 28 Account Value by Asset Type 29 Annuities Operating Earnings 31 Sources of Operating Earnings 32 Assets Under Management 33 Assets Under Management Rollforward 34 Individual Life Operating Earnings 36 Sources of Operating Earnings 37 Key Metrics 38 Employee Benefits Operating Earnings 40 Sources of Operating Earnings 41 Key Metrics 42 Page Corporate Operating Earnings 44 Closed Block Variable Annuity Closed Block Variable Annuity Income (Loss) Before Income Taxes 46 Closed Block Variable Annuity Death and Living Benefits 47 Closed Block Variable Annuity Assets Under Management Rollforward 48 Investment Information Portfolio Composition 50 Portfolio Results 51 Alternative Investment Income 52 Unrealized Gains (Losses) 53 Asset Backed Securities 54 RMBS Securities Summary 55 CMBS and Other Asset-Backed Securities Summary 56 Mortgage Loans on Real Estate 57 US and Foreign Corporate Securities 58 Exposure to European Debt—Fixed Maturities and Equity Securities 59 Reconciliations Reconciliation of Operating Revenues and Earnings by Segment 61 Reconciliation of Operating Revenues by Segment 62 Reconciliation of Ongoing Business Adjusted Operating Earnings to Net Income (Loss) 63 - 64 Reconciliation of Adjusted Operating Earnings 65—66 Reconciliation of Adjusted Operating Earnings and Calculation of Adjusted Operating Return on Capital 67—70 Reconciliation of Ongoing Business Adjusted ROE and Capital 71 Impacts of Prepayments and Alternative Income Above (Below) Long-Term Expectations 72 Calculation of ROE and ROC 73 Reconciliation of Operating Earnings Per Share: Book Value Per Share Excluding AOCI 74 Reconciliation of Average Capital: Debt to Capital, Excluding AOCI 75 Reconciliation of Investment Management Operating Margin, Excluding Investment Capital 76 Additional Information Fixed Maturity Securities—Businesses Exited Through Reinsurance 78 Ratings 79
|
|
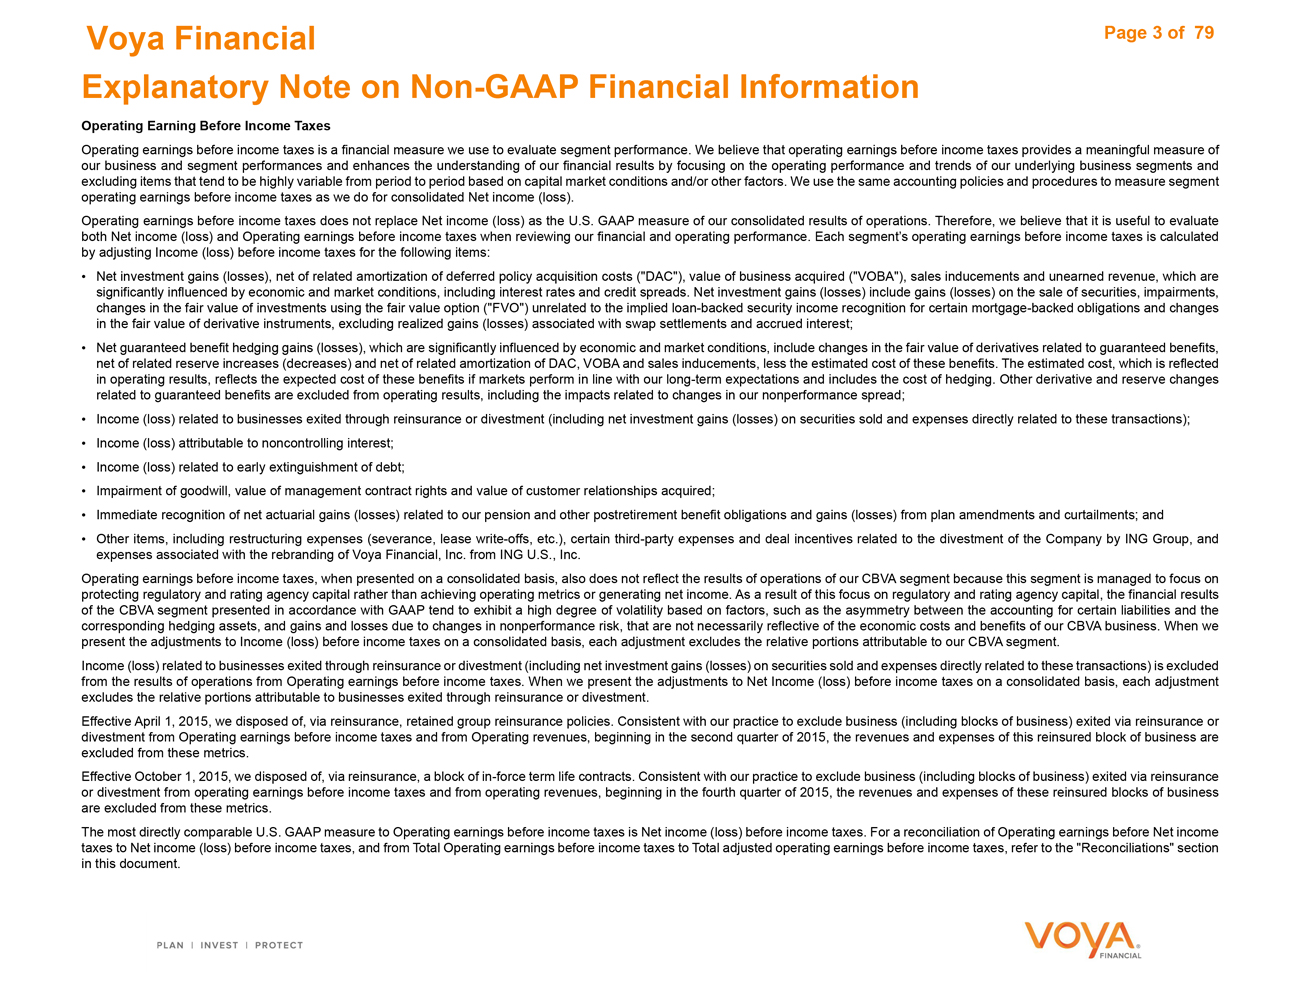
Voya Financial Page 3 of 79 Explanatory Note onNon-GAAP Financial Information
Operating Earning Before Income Taxes
Operating earnings before income taxes is a financial measure we use to evaluate segment performance. We believe that operating earnings before income taxes provides a meaningful measure of our business and segment performances and enhances the understanding of our financial results by focusing on the operating performance and trends of our underlying business segments and excluding items that tend to be highly variable from period to period based on capital market conditions and/or other factors. We use the same accounting policies and procedures to measure segment operating earnings before income taxes as we do for consolidated Net income (loss).
Operating earnings before income taxes does not replace Net income (loss) as the U.S. GAAP measure of our consolidated results of operations. Therefore, we believe that it is useful to evaluate both Net income (loss) and Operating earnings before income taxes when reviewing our financial and operating performance. Each segment’s operating earnings before income taxes is calculated by adjusting Income (loss) before income taxes for the following items:
• Net investment gains (losses), net of related amortization of deferred policy acquisition costs (“DAC”), value of business acquired (“VOBA”), sales inducements and unearned revenue, which are significantly influenced by economic and market conditions, including interest rates and credit spreads. Net investment gains (losses) include gains (losses) on the sale of securities, impairments, changes in the fair value of investments using the fair value option (“FVO”) unrelated to the implied loan-backed security income recognition for certain mortgage-backed obligations and changes in the fair value of derivative instruments, excluding realized gains (losses) associated with swap settlements and accrued interest;
• Net guaranteed benefit hedging gains (losses), which are significantly influenced by economic and market conditions, include changes in the fair value of derivatives related to guaranteed benefits, net of related reserve increases (decreases) and net of related amortization of DAC, VOBA and sales inducements, less the estimated cost of these benefits. The estimated cost, which is reflected in operating results, reflects the expected cost of these benefits if markets perform in line with our long-term expectations and includes the cost of hedging. Other derivative and reserve changes related to guaranteed benefits are excluded from operating results, including the impacts related to changes in our nonperformance spread;
• Income (loss) related to businesses exited through reinsurance or divestment (including net investment gains (losses) on securities sold and expenses directly related to these transactions);
• Income (loss) attributable to noncontrolling interest;
• Income (loss) related to early extinguishment of debt;
• Impairment of goodwill, value of management contract rights and value of customer relationships acquired;
• Immediate recognition of net actuarial gains (losses) related to our pension and other postretirement benefit obligations and gains (losses) from plan amendments and curtailments; and
• Other items, including restructuring expenses (severance, lease write-offs, etc.), certain third-party expenses and deal incentives related to the divestment of the Company by ING Group, and expenses associated with the rebranding of Voya Financial, Inc. from ING U.S., Inc.
Operating earnings before income taxes, when presented on a consolidated basis, also does not reflect the results of operations of our CBVA segment because this segment is managed to focus
on protecting regulatory and rating agency capital rather than achieving operating metrics or generating net income. As a result of this focus on regulatory and rating agency capital, the financial results of the CBVA segment presented in accordance with GAAP tend to exhibit a high degree of volatility based on factors, such as the asymmetry between the accounting for certain liabilities and the corresponding hedging assets, and gains and losses due to changes in nonperformance risk, that are not necessarily reflective of the economic costs and benefits of our CBVA business. When we present the adjustments to Income (loss) before income taxes on a consolidated basis, each adjustment excludes the relative portions attributable to our CBVA segment.
Income (loss) related to businesses exited through reinsurance or divestment (including net investment gains (losses) on securities sold and expenses directly related to these transactions) is excluded from the results of operations from Operating earnings before income taxes. When we present the adjustments to Net Income (loss) before income taxes on a consolidated basis, each adjustment excludes the relative portions attributable to businesses exited through reinsurance or divestment.
Effective April 1, 2015, we disposed of, via reinsurance, retained group reinsurance policies. Consistent with our practice to exclude business (including blocks of business) exited via reinsurance or divestment from Operating earnings before income taxes and from Operating revenues, beginning in the second quarter of 2015, the revenues and expenses of this reinsured block of business are excluded from these metrics.
Effective October 1, 2015, we disposed of, via reinsurance, a block ofin-force term life contracts. Consistent with our practice to exclude business (including blocks of business) exited via reinsurance or divestment from operating earnings before income taxes and from operating revenues, beginning in the fourth quarter of 2015, the revenues and expenses of these reinsured blocks of business are excluded from these metrics.
The most directly comparable U.S. GAAP measure to Operating earnings before income taxes is Net income (loss) before income taxes. For a reconciliation of Operating earnings before Net income taxes to Net income (loss) before income taxes, and from Total Operating earnings before income taxes to Total adjusted operating earnings before income taxes, refer to the “Reconciliations” section in this document.
|
|
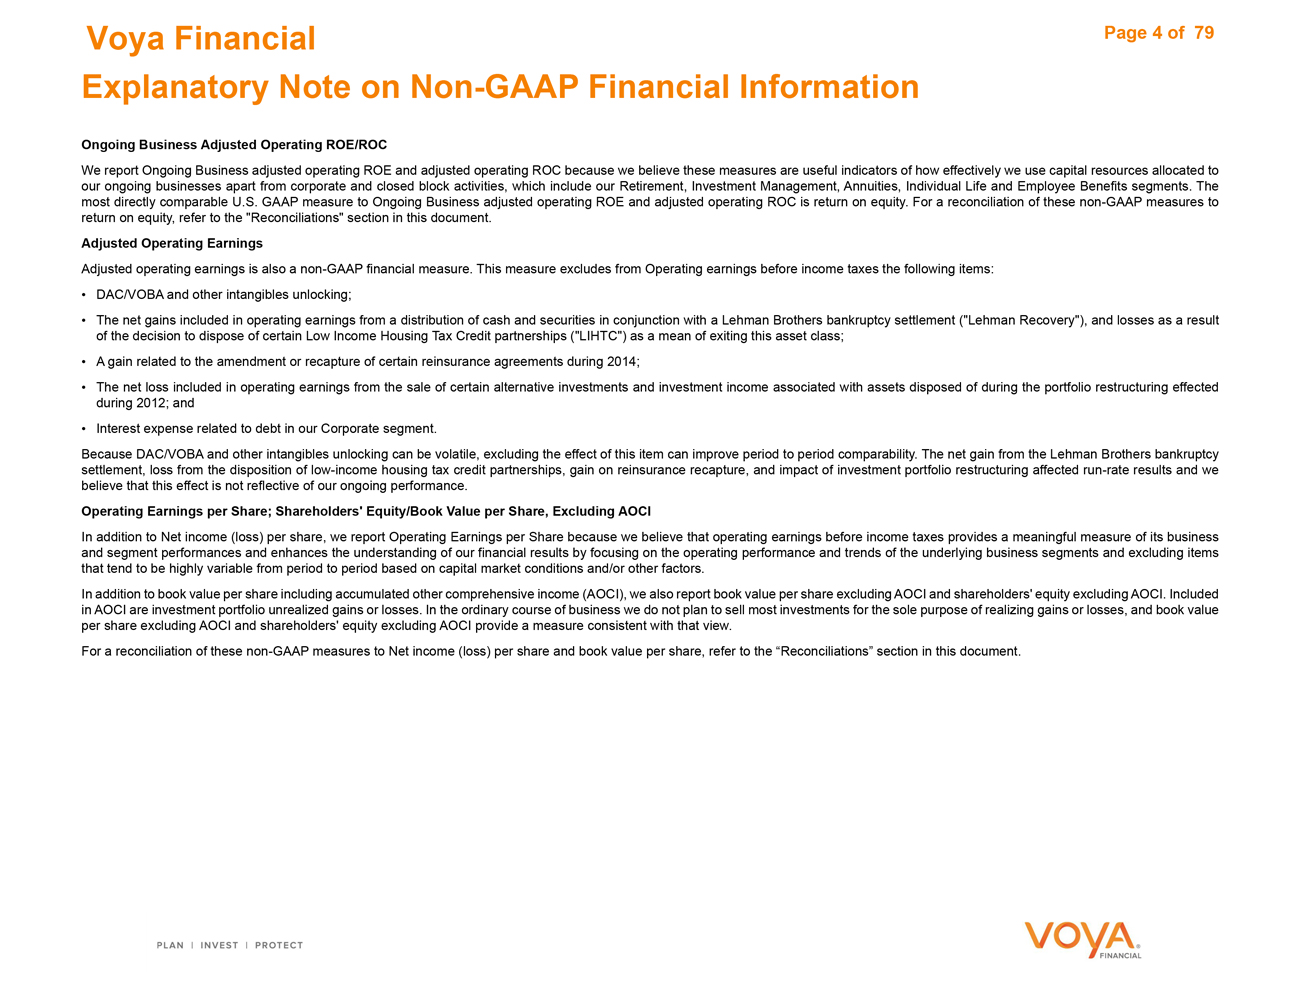
Voya Financial Page 4 of 79 Explanatory Note on Non-GAAP Financial Information Ongoing Business Adjusted Operating ROE/ROC We report Ongoing Business adjusted operating ROE and adjusted operating ROC because we believe these measures are useful indicators of how effectively we use capital resources allocated to our ongoing businesses apart from corporate and closed block activities, which include our Retirement, Investment Management, Annuities, Individual Life and Employee Benefits segments. The most directly comparable U.S. GAAP measure to Ongoing Business adjusted operating ROE and adjusted operating ROC is return on equity. For a reconciliation of these non-GAAP measures to return on equity, refer to the “Reconciliations” section in this document. Adjusted Operating Earnings Adjusted operating earnings is also a non-GAAP financial measure. This measure excludes from Operating earnings before income taxes the following items: DAC/VOBA and other intangibles unlocking; The net gains included in operating earnings from a distribution of cash and securities in conjunction with a Lehman Brothers bankruptcy settlement (“Lehman Recovery”), and losses as a result of the decision to dispose of certain Low Income Housing Tax Credit partnerships (“LIHTC”) as a mean of exiting this asset class; A gain related to the amendment or recapture of certain reinsurance agreements during 2014; The net loss included in operating earnings from the sale of certain alternative investments and investment income associated with assets disposed of during the portfolio restructuring effected during 2012; and Interest expense related to debt in our Corporate segment. Because DAC/VOBA and other intangibles unlocking can be volatile, excluding the effect of this item can improve period to period comparability. The net gain from the Lehman Brothers bankruptcy settlement, loss from the disposition of low-income housing tax credit partnerships, gain on reinsurance recapture, and impact of investment portfolio restructuring affected run-rate results and we believe that this effect is not reflective of our ongoing performance. Operating Earnings per Share; Shareholders’ Equity/Book Value per Share, Excluding AOCI In addition to Net income (loss) per share, we report Operating Earnings per Share because we believe that operating earnings before income taxes provides a meaningful measure of its business and segment performances and enhances the understanding of our financial results by focusing on the operating performance and trends of the underlying business segments and excluding items that tend to be highly variable from period to period based on capital market conditions and/or other factors. In addition to book value per share including accumulated other comprehensive income (AOCI), we also report book value per share excluding AOCI and shareholders’ equity excluding AOCI. Included in AOCI are investment portfolio unrealized gains or losses. In the ordinary course of business we do not plan to sell most investments for the sole purpose of realizing gains or losses, and book value per share excluding AOCI and shareholders’ equity excluding AOCI provide a measure consistent with that view. For a reconciliation of these non-GAAP measures to Net income (loss) per share and book value per share, refer to the “Reconciliations” section in this document.
|
|
Voya Financial Page 5 of 79 Explanatory Note on Non-GAAP Financial Information Operating Revenues Operating revenues is a measure of our segment revenues and a non-GAAP financial measure. Each segment’s Operating revenues are calculated by adjusting Total revenues for the following items: Net realized investment gains (losses) and related charges and adjustments, which are significantly influenced by economic and market conditions, including interest rates and credit spreads. Net investment gains (losses) include gains (losses) on the sale of securities, impairments, changes in the fair value of investments using the FVO unrelated to the implied loan-backed security income recognition for certain mortgage-backed obligations and changes in the fair value of derivative instruments, excluding realized gains (losses) associated with swap settlements and accrued interest. These are net of related amortization of unearned revenue; Gain (loss) on change in fair value of derivatives related to guaranteed benefits, which is significantly influenced by economic and market conditions, includes changes in the fair value of derivatives related to guaranteed benefits, less the estimated cost of these benefits. The estimated cost, which is reflected in operating results, reflects the expected cost of these benefits if markets perform in line with our long-term expectations and includes the cost of hedging. Other derivative and reserve changes related to guaranteed benefits are excluded from operating revenues, including the impacts related to changes our nonperformance spread; Revenues related to businesses exited through reinsurance or divestment (including net investment gains (losses) on securities sold related to these transactions); Revenues attributable to noncontrolling interest; and Other adjustments to operating revenues primarily reflect fee income earned by our broker dealers for sales of non-proprietary products, which are reflected net of commission expense in our segments’ operating revenues, other items where the income is passed on to third parties, and the elimination of intercompany investment expenses included in operating revenues. Operating revenues also excludes the revenues of our CBVA segment, since this segment is managed to focus on protecting regulatory and rating agency capital rather than generating operating earnings. When we present the adjustments to Total revenues on a consolidated basis, each adjustment excludes the relative portions attributable to our CBVA segment and the relative portions attributable to businesses exited through reinsurance or divestment. The most directly comparable U.S. GAAP measure to Operating revenues is Total revenues. For a reconciliation of Operating revenues to Total revenues, refer to the “Reconciliations” section in this document. Sources of Earnings We analyze our segment performance based on the sources of earnings. We believe this supplemental information is useful in order to gain a better understanding of our Operating earnings (loss) before income taxes for the following reasons: (1) we analyze our business using this information and (2) this presentation can be helpful for investors to understand the main drivers of Operating earnings (loss) before income taxes. The sources of earnings are defined as such: Investment spread and other investment income consists of net investment income and net realized investment gains (losses) associated with swap settlements and accrued interest, less interest credited to policyholder reserves. Fee based margin consists primarily of fees earned on assets under management (“AUM”), assets under administration (“AUA”), and transaction based recordkeeping fees. Net underwriting gain (loss) and other revenue contains the following: the difference between fees charged for insurance risks and incurred benefits, including mortality, morbidity, and surrender results, contractual charges for universal life and annuity contracts, the change in the unearned revenue reserve for universal life contracts, and that portion of traditional life insurance premiums intended to cover expenses and profits. Certain contract charges for universal life insurance are not recognized in income immediately, but are deferred as unearned revenues and are amortized into income in a manner similar to the amortization of DAC. Administrative expenses are general expenses, net of amounts capitalized as acquisition expenses and exclude commission expenses and fees on letters of credit. Trail commissions are commissions paid that are not deferred and thus recorded directly to expense. For a detail explanation of DAC/VOBA and other intangibles amortization/unlocking see “Unlocking of DAC/VOBA and other Contract Owner/Policyholder Intangibles” in our SEC filings. Other Information Financial information, unless otherwise noted, is rounded to millions, therefore may not sum to its corresponding total.
|
|
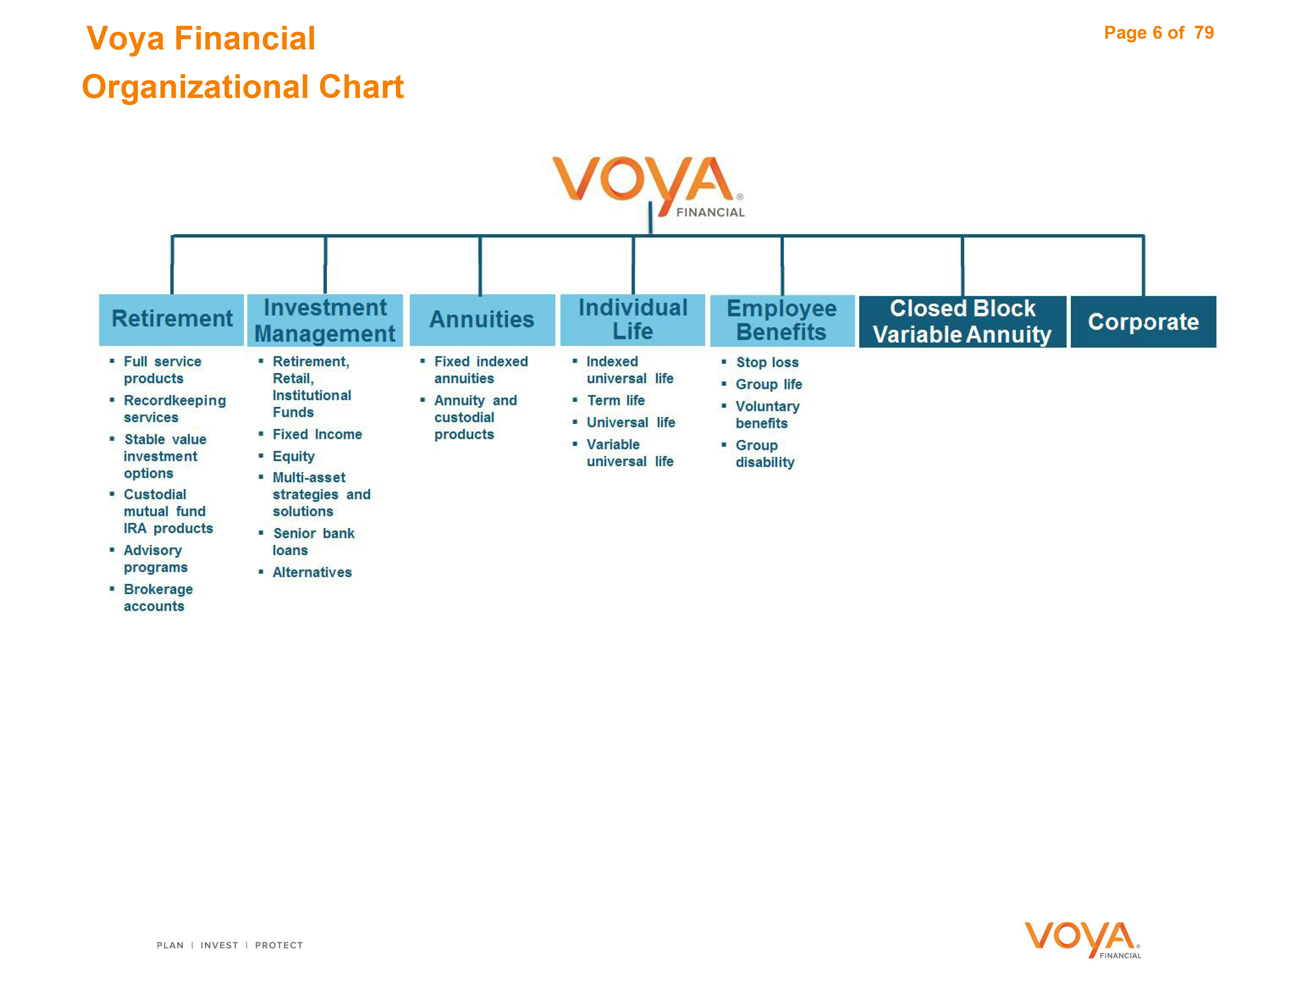
Voya Financial Page 6 of 79 Organizational Chart
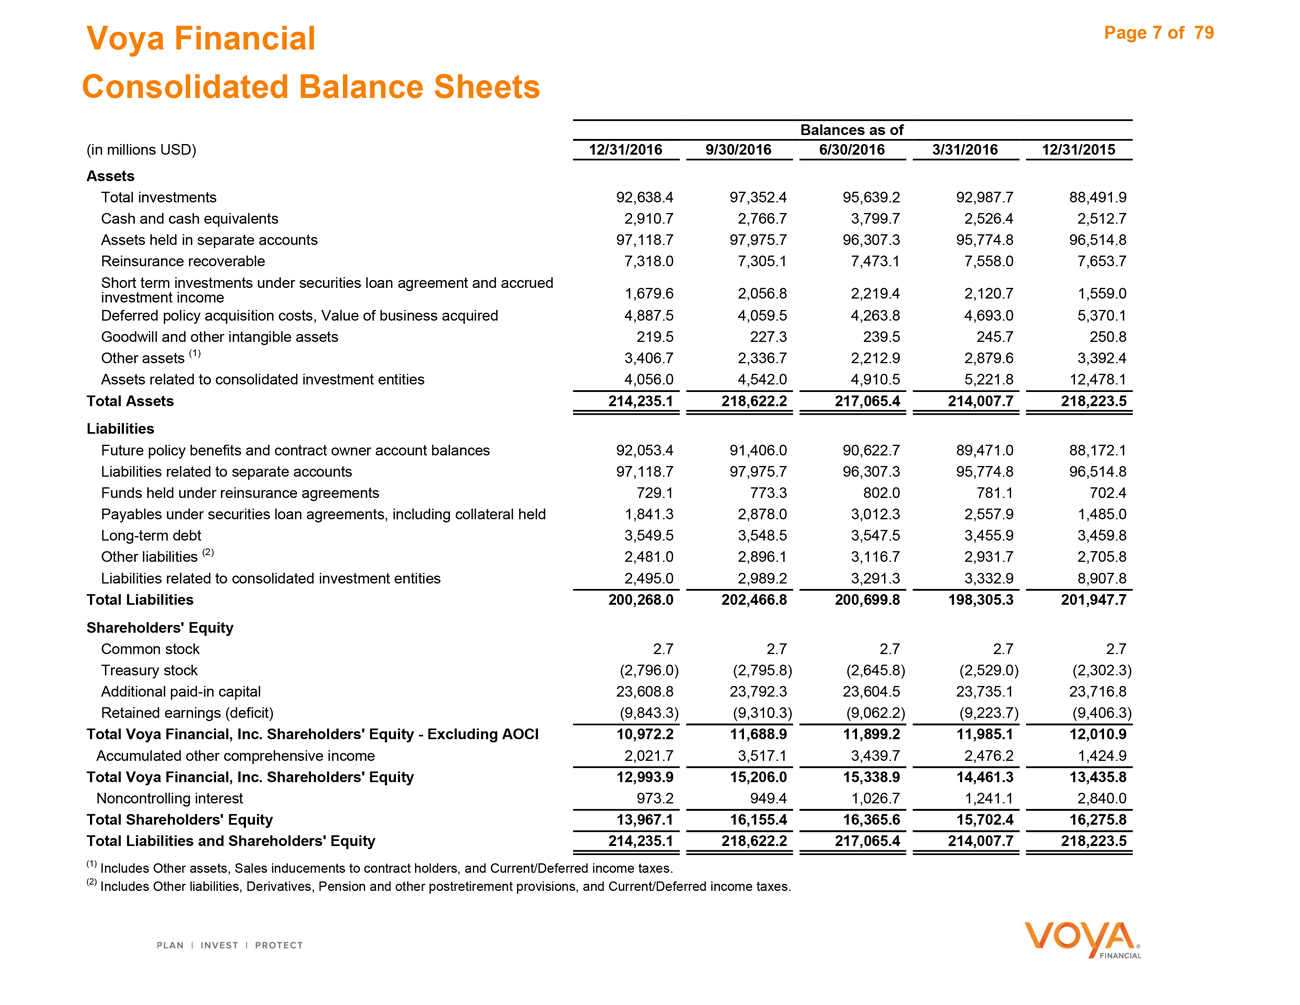
Voya Financial Page 7 of79
Consolidated Balance Sheets
Balances as of
(in millions USD) 12/31/2016 9/30/20166/30/20163/31/201612/31/2015
Assets
Total investments 92,638.4 97,352.495,639.292,987.788,491.9
Cash and cash equivalents 2,910.7 2,766.73,799.72,526.42,512.7
Assets held in separate accounts 97,118.7 97,975.796,307.395,774.896,514.8
Reinsurance recoverable 7,318.0 7,305.17,473.17,558.07,653.7
Short term investments under securities loan agreement and accrued
investment income 1,679.6 2,056.82,219.42,120.71,559.0
Deferred policy acquisition costs, Value of business acquired 4,887.5 4,059.54,263.84,693.05,370.1
Goodwill and other intangible assets 219.5 227.3239.5245.7250.8
Other assets (1) 3,406.7 2,336.72,212.92,879.63,392.4
Assets related to consolidated investment entities 4,056.0 4,542.04,910.55,221.812,478.1
Total Assets 214,235.1 218,622.2217,065.4214,007.7218,223.5
Liabilities
Future policy benefits and contract owner account balances 92,053.4 91,406.090,622.789,471.088,172.1
Liabilities related to separate accounts 97,118.7 97,975.796,307.395,774.896,514.8
Funds held under reinsurance agreements 729.1 773.3802.0781.1702.4
Payables under securities loan agreements, including collateral held 1,841.3 2,878.03,012.32,557.91,485.0
Long-term debt 3,549.5 3,548.53,547.53,455.93,459.8
Other liabilities (2) 2,481.0 2,896.13,116.72,931.72,705.8
Liabilities related to consolidated investment entities 2,495.0 2,989.23,291.33,332.98,907.8
Total Liabilities 200,268.0 202,466.8200,699.8198,305.3201,947.7
Shareholders’ Equity
Common stock 2.7 2.72.72.72.7
Treasury stock (2,796.0) (2,795.8)(2,645.8)(2,529.0)(2,302.3)
Additionalpaid-in capital 23,608.8 23,792.323,604.523,735.123,716.8
Retained earnings (deficit) (9,843.3) (9,310.3)(9,062.2)(9,223.7)(9,406.3)
Total Voya Financial, Inc. Shareholders’ Equity—Excluding AOCI 10,972.2 11,688.911,899.211,985.112,010.9
Accumulated other comprehensive income 2,021.7 3,517.13,439.72,476.21,424.9
Total Voya Financial, Inc. Shareholders’ Equity 12,993.9 15,206.015,338.914,461.313,435.8
Noncontrolling interest 973.2 949.41,026.71,241.12,840.0
Total Shareholders’ Equity 13,967.1 16,155.416,365.615,702.416,275.8
Total Liabilities and Shareholders’ Equity 214,235.1 218,622.2217,065.4214,007.7218,223.5
(1) Includes Other assets, Sales inducements to contract holders, and Current/Deferred income taxes.
(2) Includes Other liabilities, Derivatives, Pension and other postretirement provisions, and Current/Deferred income taxes.
|
|
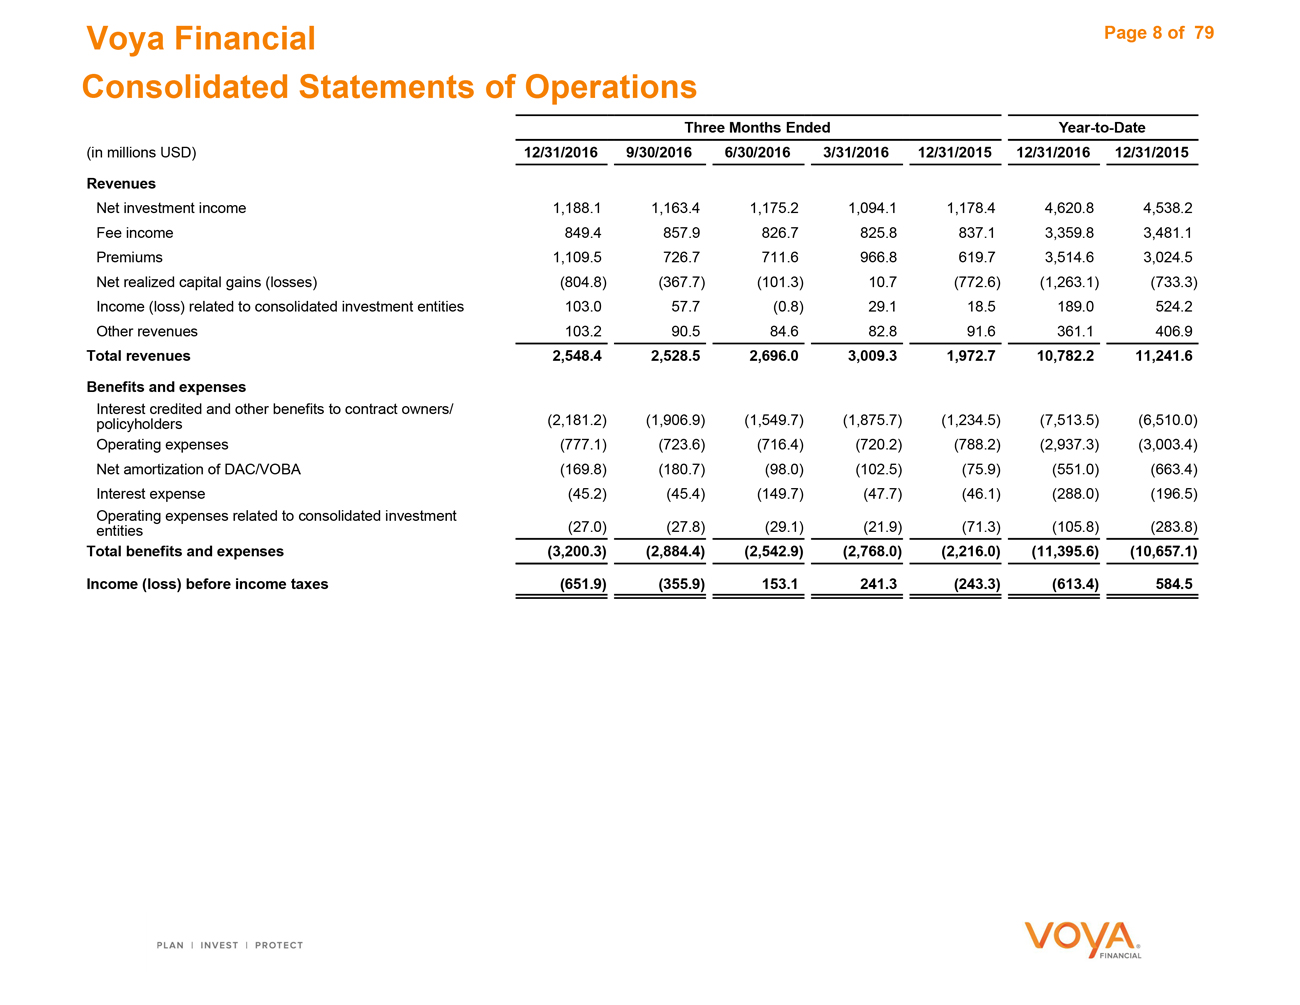
Voya Financial Page 8 of 79 Consolidated Statements of Operations Three Months EndedYear-to-Date (in millions USD)12/31/2016 9/30/20166/30/20163/31/201612/31/201512/31/201612/31/2015 Revenues Net investment income1,188.1 1,163.41,175.21,094.11,178.44,620.84,538.2 Fee income849.4 857.9826.7825.8837.13,359.83,481.1 Premiums1,109.5 726.7711.6966.8619.73,514.63,024.5 Net realized capital gains (losses)(804.8) (367.7)(101.3)10.7(772.6)(1,263.1)(733.3) Income (loss) related to consolidated investment entities103.0 57.7(0.8)29.118.5189.0524.2 Other revenues103.2 90.584.682.891.6361.1406.9 Total revenues2,548.4 2,528.52,696.03,009.31,972.710,782.211,241.6 Benefits and expenses Interest credited and other benefits to contract owners/ policyholders(2,181.2) (1,906.9)(1,549.7)(1,875.7)(1,234.5)(7,513.5)(6,510.0) Operating expenses(777.1) (723.6)(716.4)(720.2)(788.2)(2,937.3)(3,003.4) Net amortization of DAC/VOBA(169.8) (180.7)(98.0)(102.5)(75.9)(551.0)(663.4) Interest expense(45.2) (45.4)(149.7)(47.7)(46.1)(288.0)(196.5) Operating expenses related to consolidated investment entities(27.0) (27.8)(29.1)(21.9)(71.3)(105.8)(283.8) Total benefits and expenses(3,200.3) (2,884.4)(2,542.9)(2,768.0)(2,216.0)(11,395.6)(10,657.1) Income (loss) before income taxes(651.9) (355.9)153.1241.3(243.3)(613.4)584.5 Voya Financial
|
|
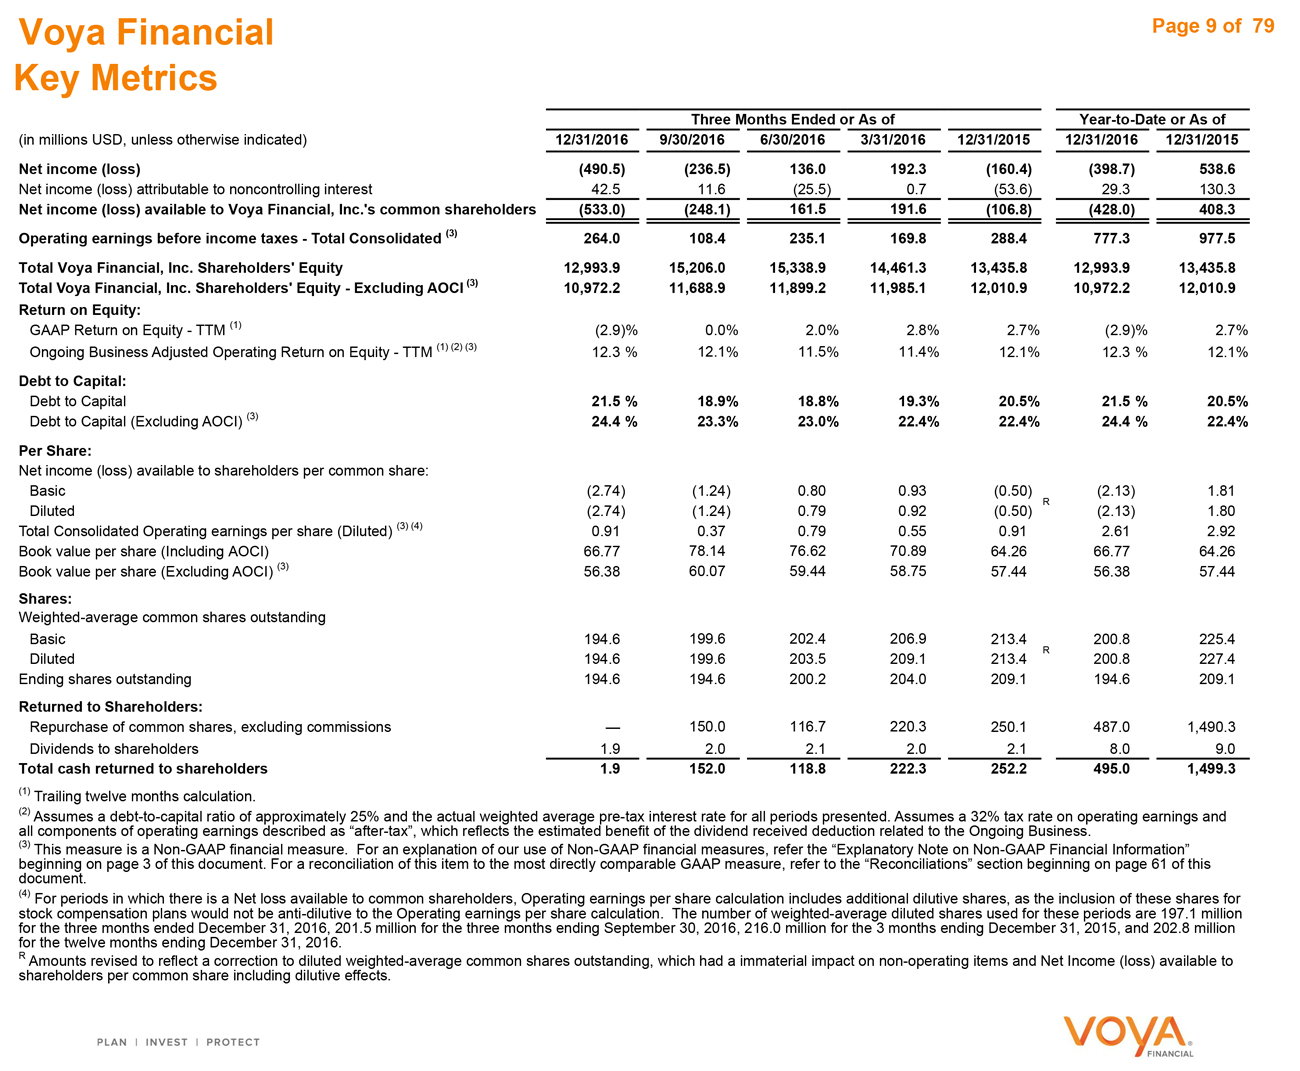
Voya Financial Key Metrics Page 9 of 79 Three Months Ended or As of Year-to-Date or As of (in millions USD, unless otherwise indicated) 12/31/2016 9/30/2016 6/30/2016 3/31/2016 12/31/2015 12/31/2016 12/31/2015 Net income (loss) (490.5) (236.5) 136.0 192.3 (160.4) (398.7) 538.6 Net income (loss) attributable to noncontrolling interest 42.5 11.6 (25.5) 0.7 (53.6) 29.3 130.3 Net income (loss) available to Voya Financial, Inc.’s common shareholders (533.0) (248.1) 161.5 191.6 (106.8) (428.0) 408.3 Operating earnings before income taxes - Total Consolidated (3) 264.0 108.4 235.1 169.8 288.4 777.3 977.5 Total Voya Financial, Inc. Shareholders’ Equity 12,993.9 15,206.0 15,338.9 14,461.3 13,435.8 12,993.9 13,435.8 Total Voya Financial, Inc. Shareholders’ Equity - Excluding AOCI (3) 10,972.2 11,688.9 11,899.2 11,985.1 12,010.9 10,972.2 12,010.9 Return on Equity: GAAP Return on Equity - TTM (1) (2.9)% 0.0% 2.0% 2.8% 2.7% (2.9)% 2.7% Ongoing Business Adjusted Operating Return on Equity - TTM (1) (2) (3) 12.3 % 12.1% 11.5% 11.4% 12.1% 12.3 % 12.1% Debt to Capital: Debt to Capital 21.5 % 18.9% 18.8% 19.3% 20.5% 21.5 % 20.5% Debt to Capital (Excluding AOCI) (3) 24.4 % 23.3% 23.0% 22.4% 22.4% 24.4 % 22.4% Per Share: Net income (loss) available to shareholders per common share: Basic (2.74) (1.24) 0.80 0.93 (0.50) (2.13) 1.81 Diluted (2.74) (1.24) 0.79 0.92 (0.50) R (2.13) 1.80 Total Consolidated Operating earnings per share (Diluted) (3) (4) 0.91 0.37 0.79 0.55 0.91 2.61 2.92 Book value per share (Including AOCI) 66.77 78.14 76.62 70.89 64.26 66.77 64.26 Book value per share (Excluding AOCI) (3) 56.38 60.07 59.44 58.75 57.44 56.38 57.44 Shares: Weighted-average common shares outstanding Basic 194.6 199.6 202.4 206.9 213.4 200.8 225.4 R Diluted 194.6 199.6 203.5 209.1 213.4 200.8 227.4 Ending shares outstanding 194.6 194.6 200.2 204.0 209.1 194.6 209.1 Returned to Shareholders: Repurchase of common shares, excluding commissions — 150.0 116.7 220.3 250.1 487.0 1,490.3 Dividends to shareholders 1.9 2.0 2.1 2.0 2.1 8.0 9.0 Total cash returned to shareholders 1.9 152.0 118.8 222.3 252.2 495.0 1,499.3 (1) Trailing twelve months calculation. (2) Assumes a debt-to-capital ratio of approximately 25% and the actual weighted average pre-tax interest rate for all periods presented. Assumes a 32% tax rate on operating earnings and all components of operating earnings described as “after-tax”, which reflects the estimated benefit of the dividend received deduction related to the Ongoing Business. (3) This measure is a Non-GAAP financial measure. For an explanation of our use of Non-GAAP financial measures, refer the “Explanatory Note on Non-GAAP Financial Information” beginning on page 3 of this document. For a reconciliation of this item to the most directly comparable GAAP measure, refer to the “Reconciliations” section beginning on page 61 of this document. (4) For periods in which there is a Net loss available to common shareholders, Operating earnings per share calculation includes additional dilutive shares, as the inclusion of these shares for stock compensation plans would not be anti-dilutive to the Operating earnings per share calculation. The number of weighted-average diluted shares used for these periods are 197.1 million for the three months ended December 31, 2016, 201.5 million for the three months ending September 30, 2016, 216.0 million for the 3 months ending December 31, 2015, and 202.8 million for the twelve months ending December 31, 2016. R Amounts revised to reflect a correction to diluted weighted-average common shares outstanding, which had a immaterial impact on non-operating items and Net Income (loss) available to shareholders per common share including dilutive effects.
|
|
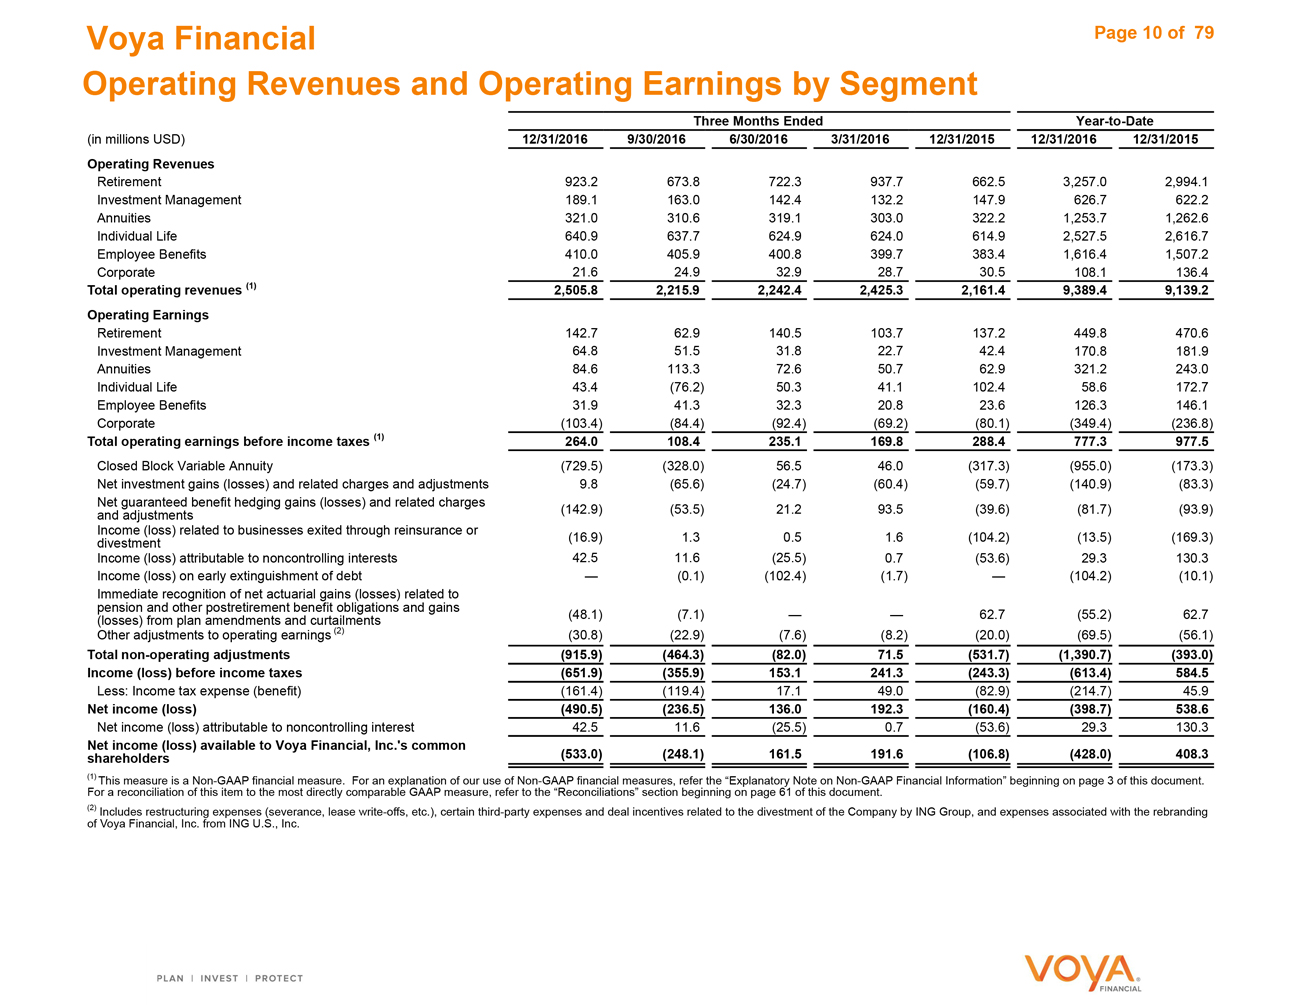
Voya Financial Page 10 of 79 Operating Revenues and Operating Earnings by Segment Three Months Ended Year-to-Date (in millions USD) 12/31/2016 9/30/2016 6/30/2016 3/31/2016 12/31/2015 12/31/2016 12/31/2015 Operating Revenues Retirement 923.2 673.8 722.3 937.7 662.5 3,257.0 2,994.1 Investment Management 189.1 163.0 142.4 132.2 147.9 626.7 622.2 Annuities 321.0 310.6 319.1 303.0 322.2 1,253.7 1,262.6 Individual Life 640.9 637.7 624.9 624.0 614.9 2,527.5 2,616.7 Employee Benefits 410.0 405.9 400.8 399.7 383.4 1,616.4 1,507.2 Corporate 21.6 24.9 32.9 28.7 30.5 108.1 136.4 Total operating revenues (1) 2,505.8 2,215.9 2,242.4 2,425.3 2,161.4 9,389.4 9,139.2 Operating Earnings Retirement 142.7 62.9 140.5 103.7 137.2 449.8 470.6 Investment Management 64.8 51.5 31.8 22.7 42.4 170.8 181.9 Annuities 84.6 113.3 72.6 50.7 62.9 321.2 243.0 Individual Life 43.4 (76.2) 50.3 41.1 102.4 58.6 172.7 Employee Benefits 31.9 41.3 32.3 20.8 23.6 126.3 146.1 Corporate (103.4) (84.4) (92.4) (69.2) (80.1) (349.4) (236.8) Total operating earnings before income taxes (1) 264.0 108.4 235.1 169.8 288.4 777.3 977.5 Closed Block Variable Annuity (729.5) (328.0) 56.5 46.0 (317.3) (955.0) (173.3) Net investment gains (losses) and related charges and adjustments 9.8 (65.6) (24.7) (60.4) (59.7) (140.9) (83.3) Net guaranteed benefit hedging gains (losses) and related charges and adjustments (142.9) (53.5) 21.2 93.5 (39.6) (81.7) (93.9) Income (loss) related to businesses exited through reinsurance or divestment (16.9) 1.3 0.5 1.6 (104.2) (13.5) (169.3) Income (loss) attributable to noncontrolling interests 42.5 11.6 (25.5) 0.7 (53.6) 29.3 130.3 Income (loss) on early extinguishment of debt —— (0.1) (102.4) (1.7) —— (104.2) (10.1) Immediate recognition of net actuarial gains (losses) related to pension and other postretirement benefit obligations and gains (losses) from plan amendments and curtailments (48.1) (7.1) —— —— 62.7 (55.2) 62.7 Other adjustments to operating earnings (2) (30.8) (22.9) (7.6) (8.2) (20.0) (69.5) (56.1) Total non-operating adjustments (915.9) (464.3) (82.0) 71.5 (531.7) (1,390.7) (393.0) Income (loss) before income taxes (651.9) (355.9) 153.1 241.3 (243.3) (613.4) 584.5 Less: Income tax expense (benefit) (161.4) (119.4) 17.1 49.0 (82.9) (214.7) 45.9 Net income (loss) (490.5) (236.5) 136.0 192.3 (160.4) (398.7) 538.6 Net income (loss) attributable to noncontrolling interest 42.5 11.6 (25.5) 0.7 (53.6) 29.3 130.3 Net income (loss) available to Voya Financial, Inc.’s common shareholders (533.0) (248.1) 161.5 191.6 (106.8) (428.0) 408.3 (1) This measure is a Non-GAAP financial measure. For an explanation of our use of Non-GAAP financial measures, refer the “Explanatory Note on Non-GAAP Financial Information” beginning on page 3 of this document. For a reconciliation of this item to the most directly comparable GAAP measure, refer to the “Reconciliations” section beginning on page 61 of this document. (2) Includes restructuring expenses (severance, lease write-offs, etc.), certain third-party expenses and deal incentives related to the divestment of the Company by ING Group, and expenses associated with the rebranding of Voya Financial, Inc. from ING U.S., Inc.
|
|
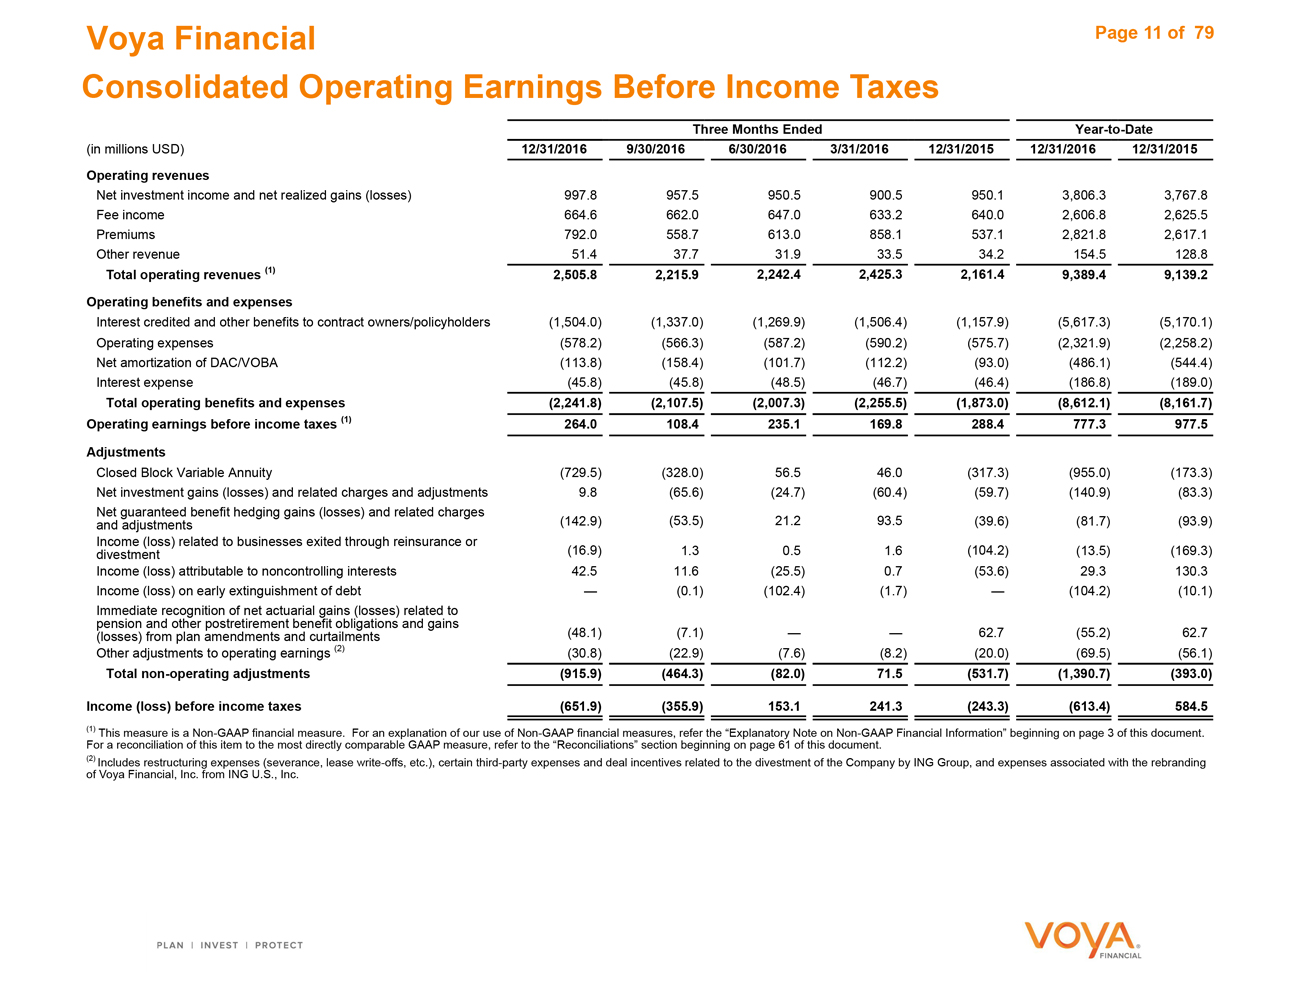
Voya Financial Page 11 of 79 Consolidated Operating Earnings Before Income Taxes Three Months Ended Year-to-Date (in millions USD) 12/31/2016 9/30/2016 6/30/2016 3/31/2016 12/31/2015 12/31/2016 12/31/2015 Operating revenues Net investment income and net realized gains (losses) 997.8 957.5 950.5 900.5 950.1 3,806.3 3,767.8 Fee income 664.6 662.0 647.0 633.2 640.0 2,606.8 2,625.5 Premiums 792.0 558.7 613.0 858.1 537.1 2,821.8 2,617.1 Other revenue 51.4 37.7 31.9 33.5 34.2 154.5 128.8 Total operating revenues (1) 2,505.8 2,215.9 2,242.4 2,425.3 2,161.4 9,389.4 9,139.2 Operating benefits and expenses Interest credited and other benefits to contract owners/policyholders (1,504.0) (1,337.0) (1,269.9) (1,506.4) (1,157.9) (5,617.3) (5,170.1) Operating expenses (578.2) (566.3) (587.2) (590.2) (575.7) (2,321.9) (2,258.2) Net amortization of DAC/VOBA (113.8) (158.4) (101.7) (112.2) (93.0) (486.1) (544.4) Interest expense (45.8) (45.8) (48.5) (46.7) (46.4) (186.8) (189.0) Total operating benefits and expenses (2,241.8) (2,107.5) (2,007.3) (2,255.5) (1,873.0) (8,612.1) (8,161.7) Operating earnings before income taxes (1) 264.0 108.4 235.1 169.8 288.4 777.3 977.5 Adjustments Closed Block Variable Annuity (729.5) (328.0) 56.5 46.0 (317.3) (955.0) (173.3) Net investment gains (losses) and related charges and adjustments 9.8 (65.6) (24.7) (60.4) (59.7) (140.9) (83.3) Net guaranteed benefit hedging gains (losses) and related charges and adjustments (142.9) (53.5) 21.2 93.5 (39.6) (81.7) (93.9) Income (loss) related to businesses exited through reinsurance or (16.9) divestment 1.3 0.5 1.6 (104.2) (13.5) (169.3) Income (loss) attributable to noncontrolling interests 42.5 11.6 (25.5) 0.7 (53.6) 29.3 130.3 Income (loss) on early extinguishment of debt —— (0.1) (102.4) (1.7) —— (104.2) (10.1) Immediate recognition of net actuarial gains (losses) related to pension and other postretirement benefit obligations and gains (48.1 (losses) from plan amendments and curtailments ) (7.1) —— —— 62.7 (55.2) 62.7 Other adjustments to operating earnings (2) (30.8) (22.9) (7.6) (8.2) (20.0) (69.5) (56.1) Total non-operating adjustments (915.9) (464.3) (82.0) 71.5 (531.7) (1,390.7) (393.0) Income (loss) before income taxes (651.9) (355.9) 153.1 241.3 (243.3) (613.4) 584.5 (1) This measure is a Non-GAAP financial measure. For an explanation of our use of Non-GAAP financial measures, refer the “Explanatory Note on Non-GAAP Financial Information” beginning on page 3 of this document. For a reconciliation of this item to the most directly comparable GAAP measure, refer to the “Reconciliations” section beginning on page 61 of this document. (2) Includes restructuring expenses (severance, lease write-offs, etc.), certain third-party expenses and deal incentives related to the divestment of the Company by ING Group, and expenses associated with the rebranding of Voya Financial, Inc. from ING U.S., Inc.
|
|
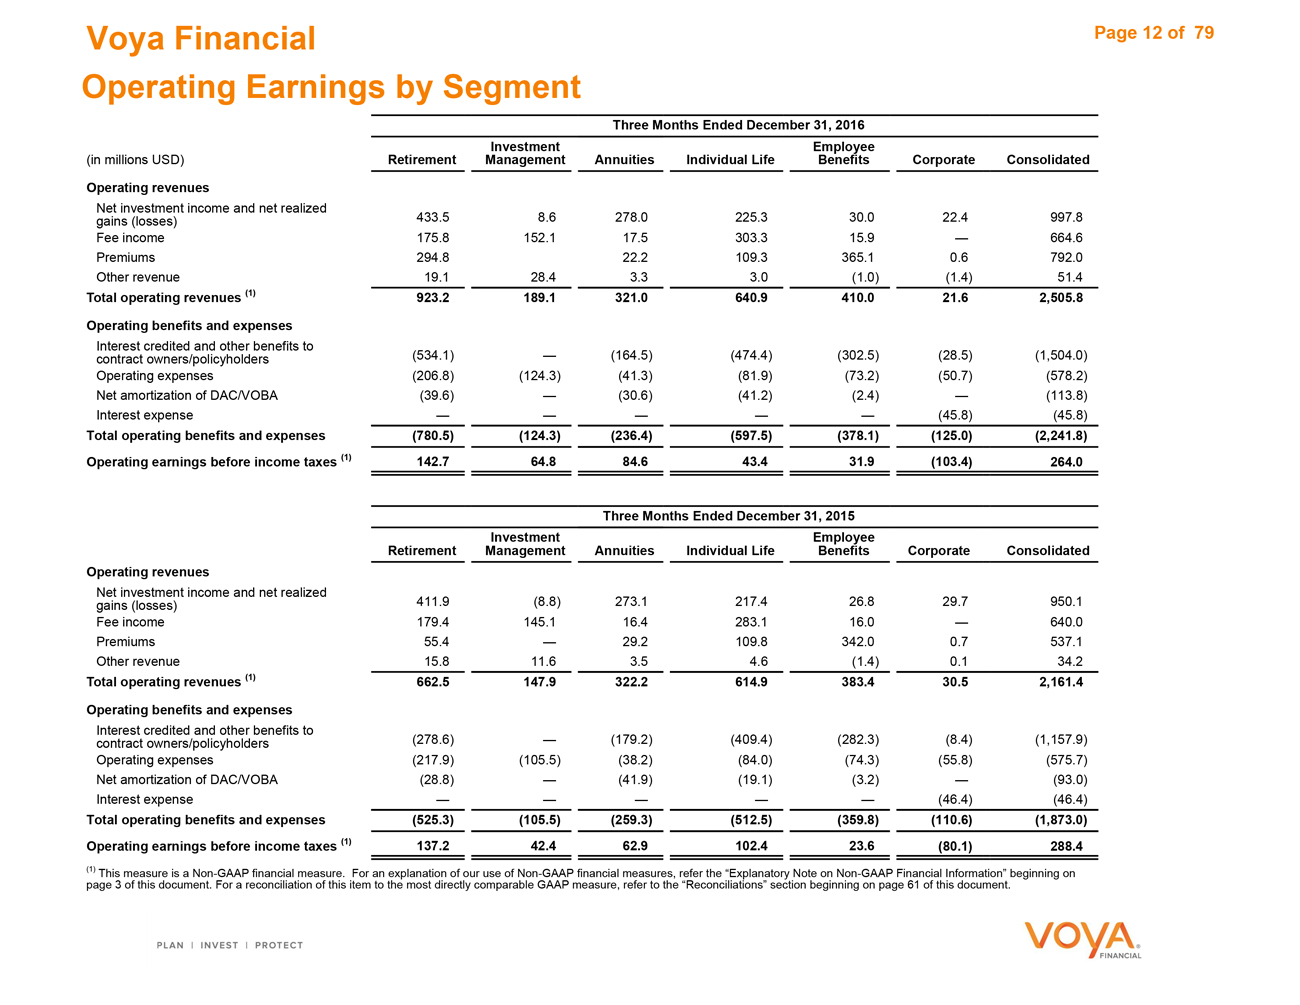
Voya Financial Page 12 of79 Operating Earnings by Segment Three Months Ended December 31, 2016 InvestmentEmployee (in millions USD)Retirement ManagementAnnuitiesIndividual LifeBenefitsCorporateConsolidated Operating revenues Net investment income and net realized433.5 gains (losses) 8.6278.0225.330.022.4997.8 Fee income175.8 152.117.5303.315.9—664.6 Premiums294.8 22.2109.3365.10.6792.0 Other revenue19.1 28.43.33.0(1.0)(1.4)51.4 Total operating revenues (1)923.2 189.1321.0640.9410.021.62,505.8 Operating benefits and expenses Interest credited and other benefits to contract owners/policyholders(534.1) —(164.5)(474.4)(302.5)(28.5)(1,504.0) Operating expenses(206.8) (124.3)(41.3)(81.9)(73.2)(50.7)(578.2) Net amortization of DAC/VOBA(39.6) —(30.6)(41.2)(2.4)—(113.8) Interest expense— ————(45.8)(45.8) Total operating benefits and expenses(780.5) (124.3)(236.4)(597.5)(378.1)(125.0)(2,241.8) Operating earnings before income taxes (1)142.7 64.884.643.431.9(103.4)264.0 Three Months Ended December 31, 2015 InvestmentEmployee RetirementManagementAnnuitiesIndividual LifeBenefitsCorporateConsolidated Operating revenues Net investment income and net realized411.9 (8.8 gains (losses) )273.1217.426.829.7950.1 Fee income179.4 145.116.4283.116.0—640.0 Premiums55.4 —29.2109.8342.00.7537.1 Other revenue15.8 11.63.54.6(1.4)0.134.2 Total operating revenues (1)662.5 147.9322.2614.9383.430.52,161.4 Operating benefits and expenses Interest credited and other benefits to contract owners/policyholders(278.6) —(179.2)(409.4)(282.3)(8.4)(1,157.9) Operating expenses(217.9) (105.5)(38.2)(84.0)(74.3)(55.8)(575.7) Net amortization of DAC/VOBA(28.8) —(41.9)(19.1)(3.2)—(93.0) Interest expense— ————(46.4)(46.4) Total operating benefits and expenses(525.3) (105.5)(259.3)(512.5)(359.8)(110.6)(1,873.0) Operating earnings before income taxes (1)137.2 42.462.9102.423.6(80.1)288.4 (1) This measure is a Non-GAAP financial measure. For an explanation of our use of Non-GAAP financial measures, refer the “Explanatory Note on Non-GAAP Financial Information” beginning on page 3 of this document. For a reconciliation of this item to the most directly comparable GAAP measure, refer to the “Reconciliations” section beginning on page 61 of this document.
|
|
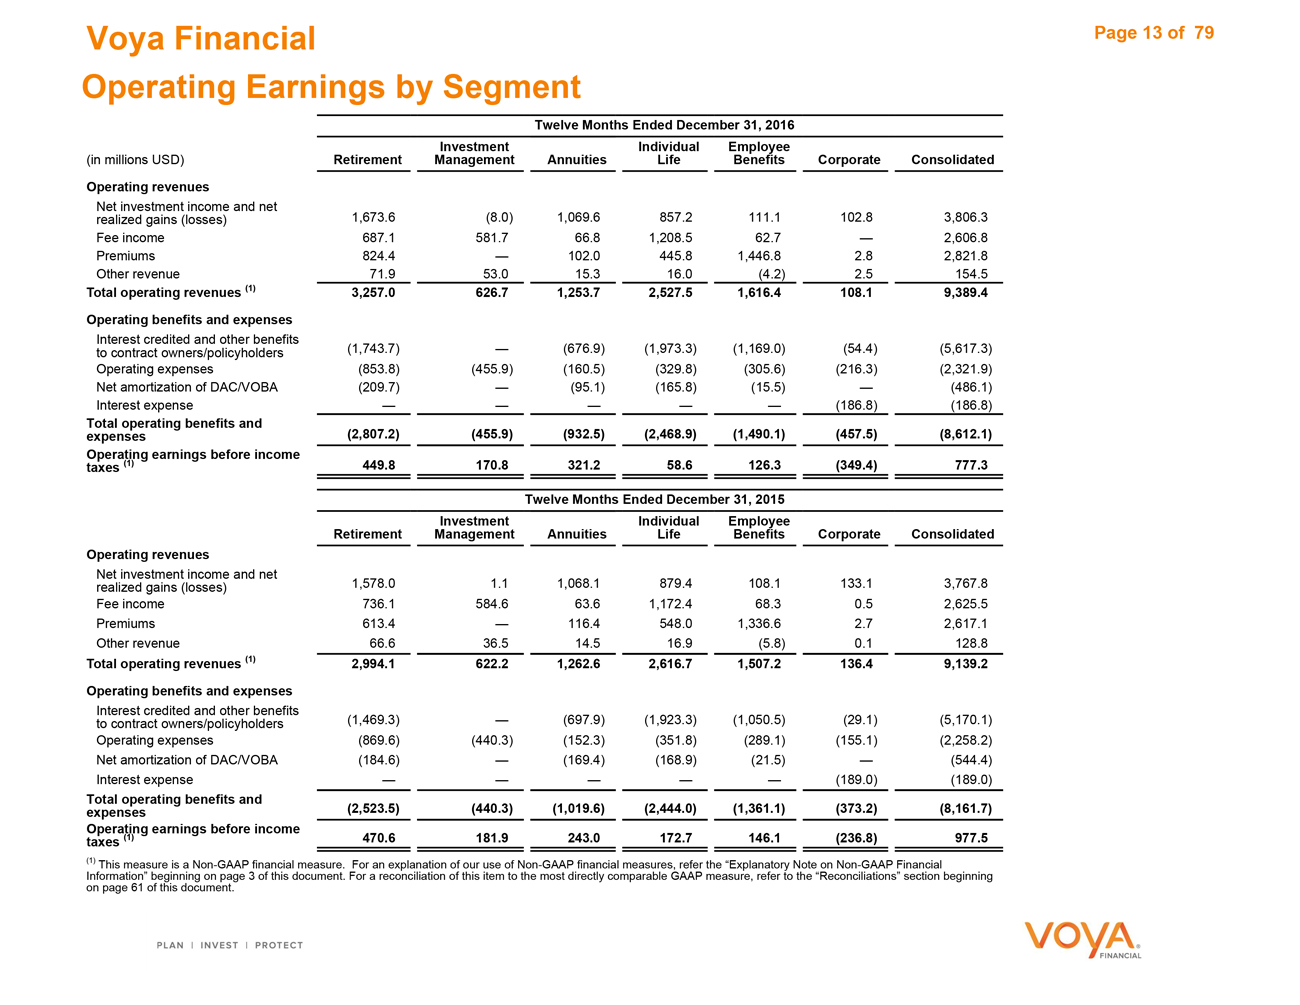
Voya Financial Page 13 of79 Operating Earnings by Segment Twelve Months Ended December 31, 2016 InvestmentIndividualEmployee (in millions USD)Retirement ManagementAnnuitiesLifeBenefitsCorporateConsolidated Operating revenues Net investment income and net realized gains (losses)1,673.6 (8.0)1,069.6857.2111.1102.83,806.3 Fee income687.1 581.766.81,208.562.7—2,606.8 Premiums824.4 —102.0445.81,446.82.82,821.8 Other revenue71.9 53.015.316.0(4.2)2.5154.5 Total operating revenues (1)3,257.0 626.71,253.72,527.51,616.4108.19,389.4 Operating benefits and expenses Interest credited and other benefits to contract owners/policyholders(1,743.7) —(676.9)(1,973.3)(1,169.0)(54.4)(5,617.3) Operating expenses(853.8) (455.9)(160.5)(329.8)(305.6)(216.3)(2,321.9) Net amortization of DAC/VOBA(209.7) —(95.1)(165.8)(15.5)—(486.1) Interest expense— ————(186.8)(186.8) Total operating benefits and expenses(2,807.2) (455.9)(932.5)(2,468.9)(1,490.1)(457.5)(8,612.1) Operating earnings before income taxes (1)449.8 170.8321.258.6126.3(349.4)777.3 Twelve Months Ended December 31, 2015 InvestmentIndividual Employee RetirementManagementAnnuitiesLifeBenefitsCorporate Consolidated Operating revenues Net investment income and net realized gains (losses)1,578.0 1.11,068.1879.4108.1133.13,767.8 Fee income736.1 584.663.61,172.468.30.52,625.5 Premiums613.4 —116.4548.01,336.62.72,617.1 Other revenue66.6 36.514.516.9(5.8)0.1128.8 Total operating revenues (1)2,994.1 622.21,262.62,616.71,507.2136.49,139.2 Operating benefits and expenses Interest credited and other benefits to contract owners/policyholders(1,469.3) —(697.9)(1,923.3)(1,050.5)(29.1)(5,170.1) Operating expenses(869.6) (440.3)(152.3)(351.8)(289.1)(155.1)(2,258.2) Net amortization of DAC/VOBA(184.6) —(169.4)(168.9)(21.5)—(544.4) Interest expense— ————(189.0)(189.0) Total operating benefits and expenses(2,523.5) (440.3)(1,019.6)(2,444.0)(1,361.1)(373.2)(8,161.7) Operating earnings before income taxes (1)470.6 181.9243.0172.7146.1(236.8)977.5 (1) This measure is a Non-GAAP financial measure. For an explanation of our use of Non-GAAP financial measures, refer the “Explanatory Note on Non-GAAP Financial Information” beginning on page 3 of this document. For a reconciliation of this item to the most directly comparable GAAP measure, refer to the “Reconciliations” section beginning on page 61 of this document.
|
|
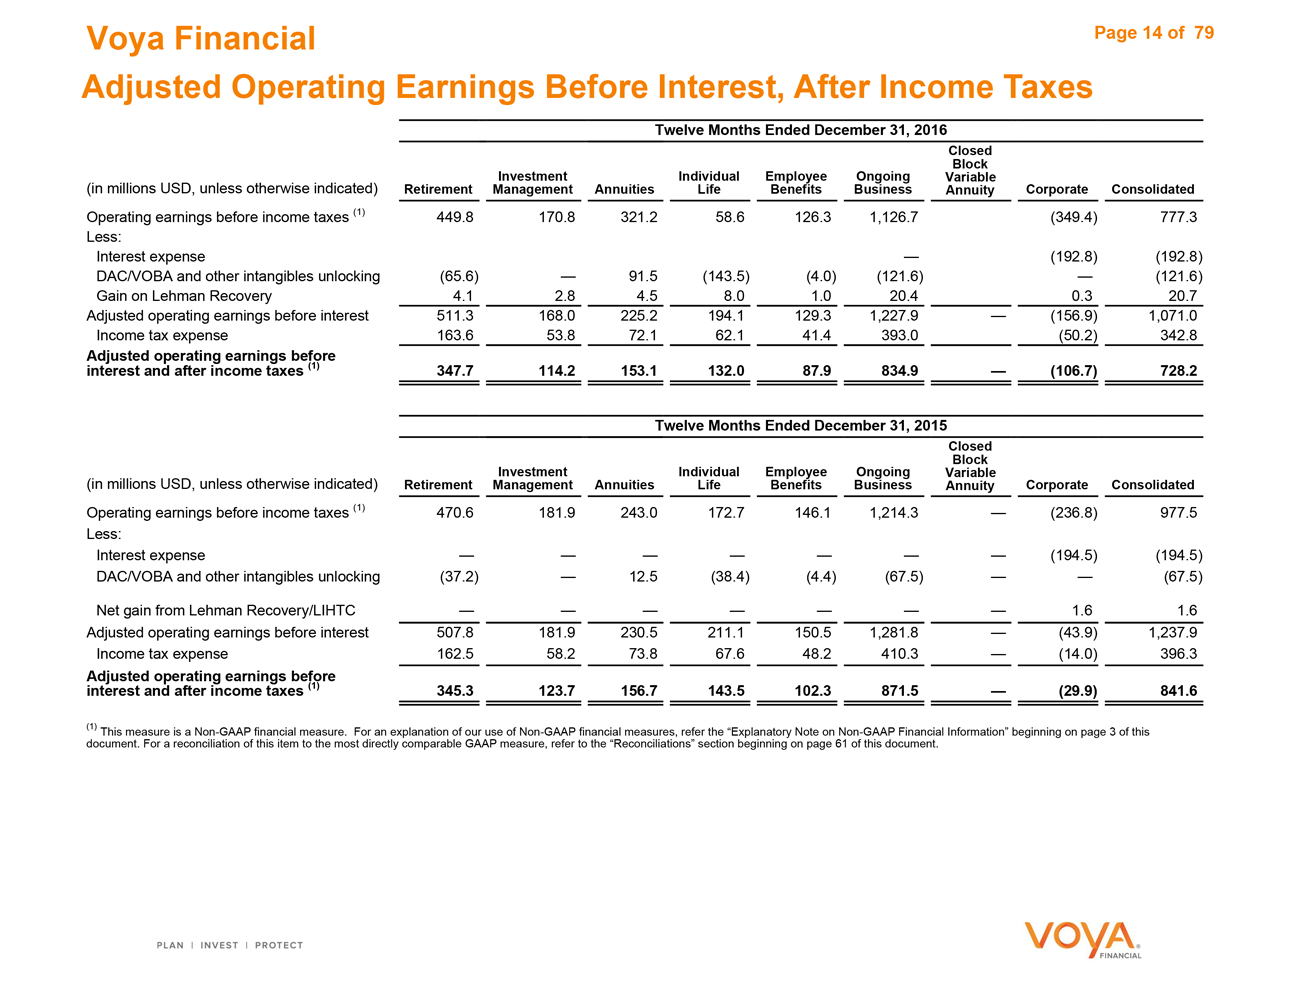
Voya Financial Page 14 of 79 Adjusted Operating Earnings Before Interest, After Income Taxes Twelve Months Ended December 31, 2016 Closed Block InvestmentIndividualEmployeeOngoingVariable (in millions USD, unless otherwise indicated)Retirement ManagementAnnuitiesLifeBenefitsBusinessAnnuityCorporateConsolidated Operating earnings before income taxes (1)449.8 170.8321.258.6126.31,126.7(349.4)777.3 Less: Interest expense —(192.8)(192.8) DAC/VOBA and other intangibles unlocking(65.6) —91.5(143.5)(4.0)(121.6)—(121.6) Gain on Lehman Recovery4.1 2.84.58.01.020.40.320.7 Adjusted operating earnings before interest511.3 168.0225.2194.1129.31,227.9—(156.9)1,071.0 Income tax expense163.6 53.872.162.141.4393.0(50.2)342.8 Adjusted operating earnings before interest and after income taxes (1)347.7 114.2153.1132.087.9834.9—(106.7)728.2 Twelve Months Ended December 31, 2015 Closed Block InvestmentIndividualEmployeeOngoingVariable (in millions USD, unless otherwise indicated)Retirement ManagementAnnuitiesLifeBenefitsBusinessAnnuityCorporateConsolidated Operating earnings before income taxes (1)470.6 181.9243.0172.7146.11,214.3—(236.8)977.5 Less: Interest expense— ——————(194.5)(194.5) DAC/VOBA and other intangibles unlocking(37.2) —12.5(38.4)(4.4)(67.5)——(67.5) Net gain from Lehman Recovery/LIHTC— ——————1.61.6 Adjusted operating earnings before interest507.8 181.9230.5211.1150.51,281.8—(43.9)1,237.9 Income tax expense162.5 58.273.867.648.2410.3—(14.0)396.3 Adjusted operating earnings before interest and after income taxes (1)345.3 123.7156.7143.5102.3871.5—(29.9)841.6 (1) This measure is a Non-GAAP financial measure. For an explanation of our use of Non-GAAP financial measures, refer the “Explanatory Note on Non-GAAP Financial Information” beginning on page 3 of this document. For a reconciliation of this item to the most directly comparable GAAP measure, refer to the “Reconciliations” section beginning on page 61 of this document.
|
|
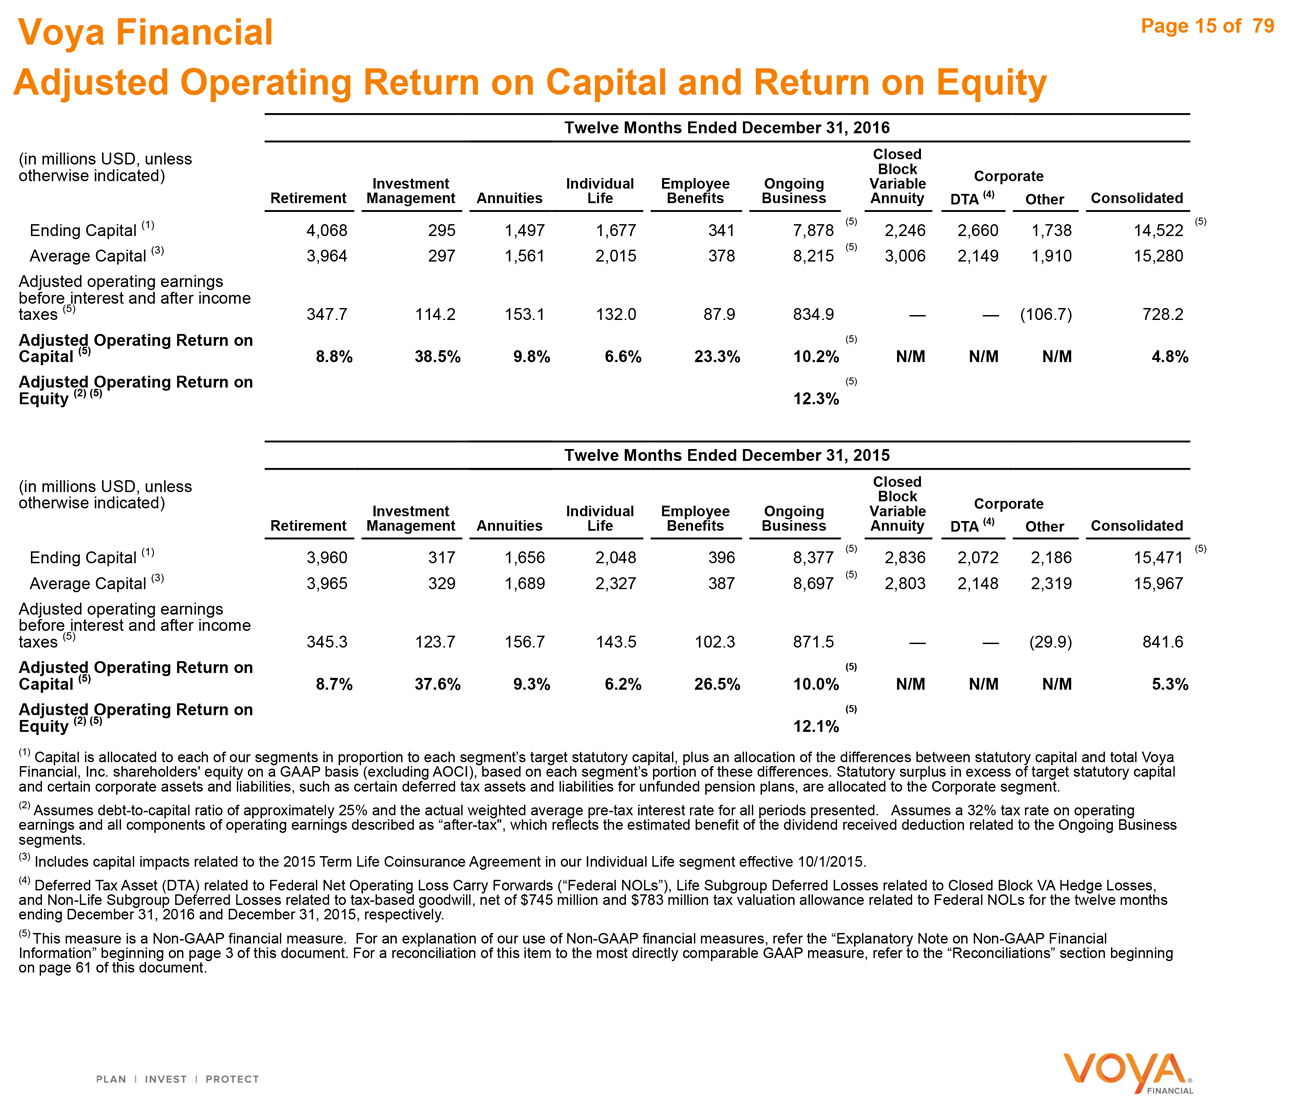
Voya Financial Adjusted Operating Return on Capital and Return on Equity Page 15 of 79 Twelve Months Ended December 31, 2016 (in millions USD, unless Closed otherwise indicated) Block Corporate Investment Individual Employee Ongoing Variable Retirement Management Annuities Life Benefits Business Annuity DTA (4) Other Consolidated Ending Capital (1) 4,068 295 1,497 1,677 341 7,878 (5) 2,246 2,660 1,738 14,522 (5) Average Capital (3) 3,964 297 1,561 2,015 378 8,215 (5) 3,006 2,149 1,910 15,280 Adjusted operating earnings before interest and after income taxes (5) 347.7 114.2 153.1 132.0 87.9 834.9 — — (106.7) 728.2 Adjusted Operating Return on (5) Capital (5) 8.8% 38.5% 9.8% 6.6% 23.3% 10.2% N/M N/M N/M 4.8% Adjusted Operating Return on (5) Equity (2) (5) 12.3% Twelve Months Ended December 31, 2015 (in millions USD, unless Closed otherwise indicated) Block Corporate Investment Individual Employee Ongoing Variable Retirement Management Annuities Life Benefits Business Annuity DTA (4) Other Consolidated Ending Capital (1) 3,960 317 1,656 2,048 396 8,377 (5) 2,836 2,072 2,186 15,471 (5) Average Capital (3) 3,965 329 1,689 2,327 387 8,697 (5) 2,803 2,148 2,319 15,967 Adjusted operating earnings before interest and after income taxes (5) 345.3 123.7 156.7 143.5 102.3 871.5 — — (29.9) 841.6 Adjusted Operating Return on (5) Capital (5) 8.7% 37.6% 9.3% 6.2% 26.5% 10.0% N/M N/M N/M 5.3% Adjusted Operating Return on (5) Equity (2) (5) 12.1% (1) Capital is allocated to each of our segments in proportion to each segment’s target statutory capital, plus an allocation of the differences between statutory capital and total Voya Financial, Inc. shareholders’ equity on a GAAP basis (excluding AOCI), based on each segment’s portion of these differences. Statutory surplus in excess of target statutory capital and certain corporate assets and liabilities, such as certain deferred tax assets and liabilities for unfunded pension plans, are allocated to the Corporate segment. (2) Assumes debt-to-capital ratio of approximately 25% and the actual weighted average pre-tax interest rate for all periods presented. Assumes a 32% tax rate on operating earnings and all components of operating earnings described as “after-tax”, which reflects the estimated benefit of the dividend received deduction related to the Ongoing Business segments. (3) Includes capital impacts related to the 2015 Term Life Coinsurance Agreement in our Individual Life segment effective 10/1/2015. (4) Deferred Tax Asset (DTA) related to Federal Net Operating Loss Carry Forwards (“Federal NOLs”), Life Subgroup Deferred Losses related to Closed Block VA Hedge Losses, and Non-Life Subgroup Deferred Losses related to tax-based goodwill, net of $745 million and $783 million tax valuation allowance related to Federal NOLs for the twelve months ending December 31, 2016 and December 31, 2015, respectively. (5) This measure is a Non-GAAP financial measure. For an explanation of our use of Non-GAAP financial measures, refer the “Explanatory Note on Non-GAAP Financial Information” beginning on page 3 of this document. For a reconciliation of this item to the most directly comparable GAAP measure, refer to the “Reconciliations” section beginning on page 61 of this document.
|
|
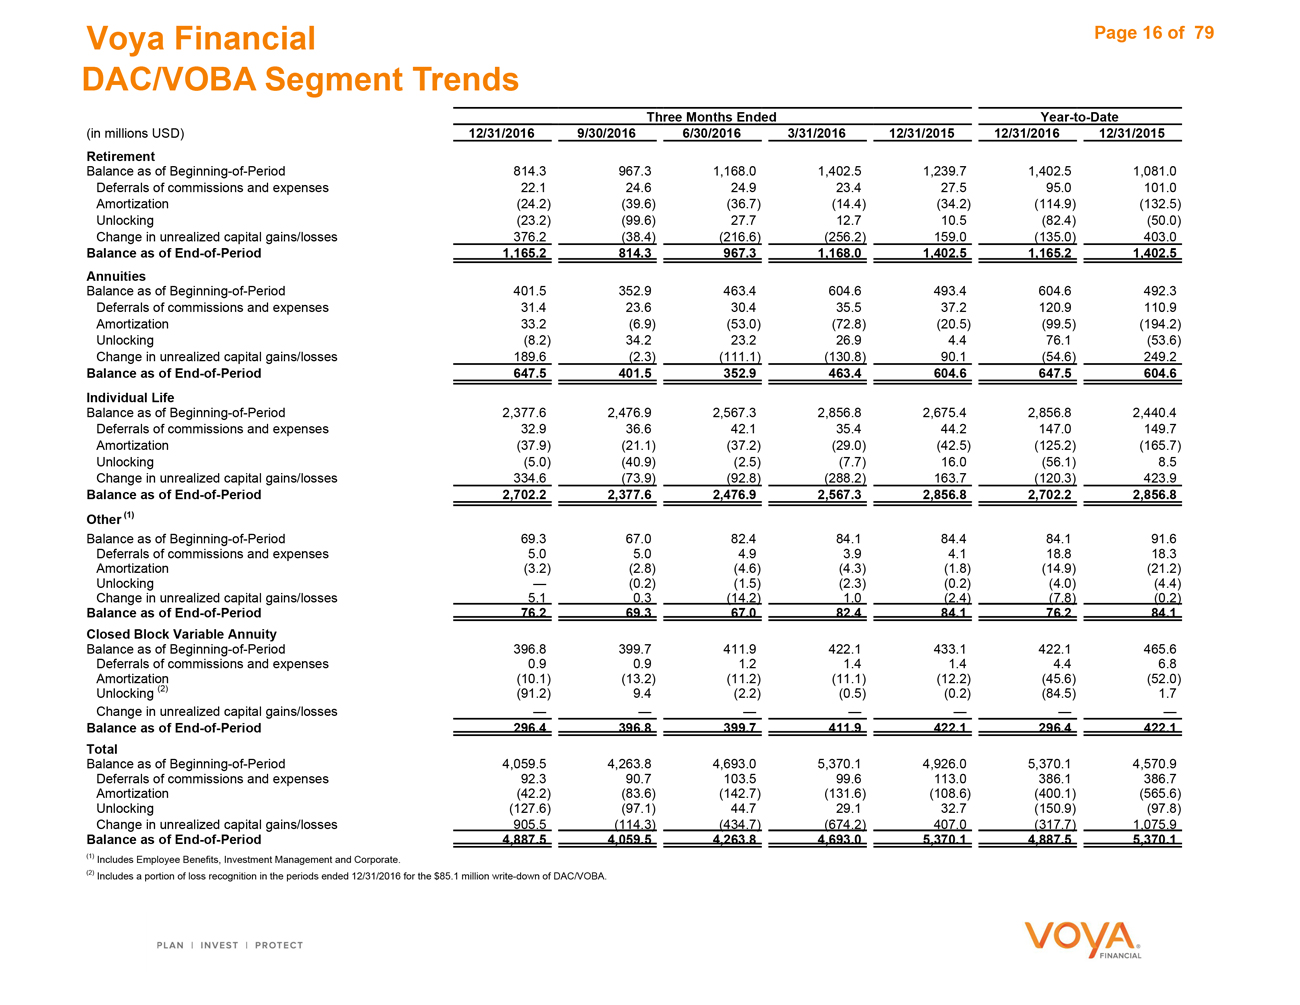
Voya Financial Page 16 of79 DAC/VOBA Segment Trends Three Months EndedYear-to-Date (in millions USD)12/31/2016 9/30/20166/30/20163/31/201612/31/201512/31/201612/31/2015 Retirement Balance as of Beginning-of-Period814.3 967.31,168.01,402.51,239.71,402.51,081.0 Deferrals of commissions and expenses22.1 24.624.923.427.595.0101.0 Amortization(24.2) (39.6)(36.7)(14.4)(34.2)(114.9)(132.5) Unlocking(23.2) (99.6)27.712.710.5(82.4)(50.0) Change in unrealized capital gains/losses376.2 (38.4)(216.6)(256.2)159.0(135.0)403.0 Balance as of End-of-Period1,165.2 814.3967.31,168.01,402.51,165.21,402.5 Annuities Balance as of Beginning-of-Period401.5 352.9463.4604.6493.4604.6492.3 Deferrals of commissions and expenses31.4 23.630.435.537.2120.9110.9 Amortization33.2 (6.9)(53.0)(72.8)(20.5)(99.5)(194.2) Unlocking(8.2) 34.223.226.94.476.1(53.6) Change in unrealized capital gains/losses189.6 (2.3)(111.1)(130.8)90.1(54.6)249.2 Balance as of End-of-Period647.5 401.5352.9463.4604.6647.5604.6 Individual Life Balance as of Beginning-of-Period2,377.6 2,476.92,567.32,856.82,675.42,856.82,440.4 Deferrals of commissions and expenses32.9 36.642.135.444.2147.0149.7 Amortization(37.9) (21.1)(37.2)(29.0)(42.5)(125.2)(165.7) Unlocking(5.0) (40.9)(2.5)(7.7)16.0(56.1)8.5 Change in unrealized capital gains/losses334.6 (73.9)(92.8)(288.2)163.7(120.3)423.9 Balance as of End-of-Period2,702.2 2,377.62,476.92,567.32,856.82,702.22,856.8 Other (1) Balance as of Beginning-of-Period69.3 67.082.484.184.484.191.6 Deferrals of commissions and expenses5.0 5.04.93.94.118.818.3 Amortization(3.2) (2.8)(4.6)(4.3)(1.8)(14.9)(21.2) Unlocking— (0.2)(1.5)(2.3)(0.2)(4.0)(4.4) Change in unrealized capital gains/losses5.1 0.3(14.2)1.0(2.4)(7.8)(0.2) Balance as of End-of-Period76.2 69.367.082.484.176.284.1 Closed Block Variable Annuity Balance as of Beginning-of-Period396.8 399.7411.9422.1433.1422.1465.6 Deferrals of commissions and expenses0.9 0.91.21.41.44.46.8 Amortization(10.1) (13.2)(11.2)(11.1)(12.2)(45.6)(52.0) Unlocking (2)(91.2) 9.4(2.2)(0.5)(0.2)(84.5)1.7 Change in unrealized capital gains/losses— — Balance as of End-of-Period296.4 396.8399.7411.9422.1296.4422.1 Total Balance as of Beginning-of-Period4,059.5 4,263.84,693.05,370.14,926.05,370.14,570.9 Deferrals of commissions and expenses92.3 90.7103.599.6113.0386.1386.7 Amortization(42.2) (83.6)(142.7)(131.6)(108.6)(400.1)(565.6) Unlocking(127.6) (97.1)44.729.132.7(150.9)(97.8) Change in unrealized capital gains/losses905.5 (114.3)(434.7)(674.2)407.0(317.7)1,075.9 Balance as of End-of-Period4,887.5 4,059.54,263.84,693.05,370.14,887.55,370.1 (1) Includes Employee Benefits, Investment Management and Corporate. (2) Includes a portion of loss recognition in the periods ended 12/31/2016 for the $85.1 million write-down of DAC/VOBA.
|
|
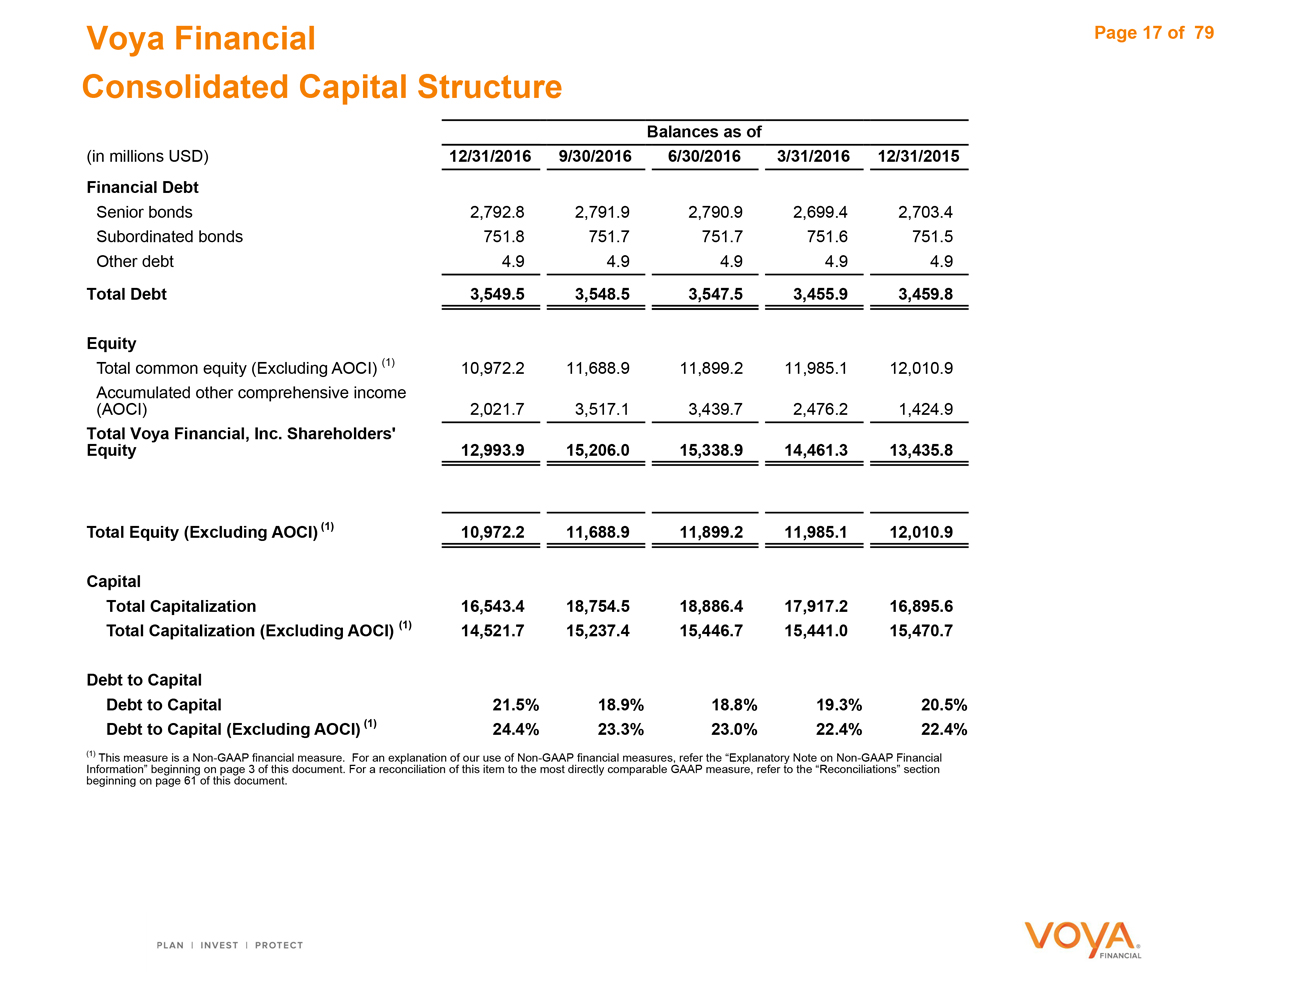
Voya Financial Page 17 of79 Consolidated Capital Structure Balances as of (in millions USD)12/31/2016 9/30/20166/30/20163/31/201612/31/2015 Financial Debt Senior bonds2,792.8 2,791.92,790.92,699.42,703.4 Subordinated bonds751.8 751.7751.7751.6751.5 Other debt4.9 4.94.94.94.9 Total Debt3,549.5 3,548.53,547.53,455.93,459.8 Equity Total common equity (Excluding AOCI) (1)10,972.2 11,688.911,899.211,985.112,010.9 Accumulated other comprehensive income (AOCI)2,021.7 3,517.13,439.72,476.21,424.9 Total Voya Financial, Inc. Shareholders’ Equity12,993.9 15,206.015,338.914,461.313,435.8 Total Equity (Excluding AOCI) (1)10,972.2 11,688.911,899.211,985.112,010.9 Capital Total Capitalization16,543.4 18,754.518,886.417,917.216,895.6 Total Capitalization (Excluding AOCI) (1)14,521.7 15,237.415,446.715,441.015,470.7 Debt to Capital Debt to Capital21.5% 18.9%18.8%19.3%20.5% Debt to Capital (Excluding AOCI) (1)24.4% 23.3%23.0%22.4%22.4% (1) This measure is a Non-GAAP financial measure. For an explanation of our use of Non-GAAP financial measures, refer the “Explanatory Note on Non-GAAP Financial Information” beginning on page 3 of this document. For a reconciliation of this item to the most directly comparable GAAP measure, refer to the “Reconciliations” section beginning on page 61 of this document.
|
|
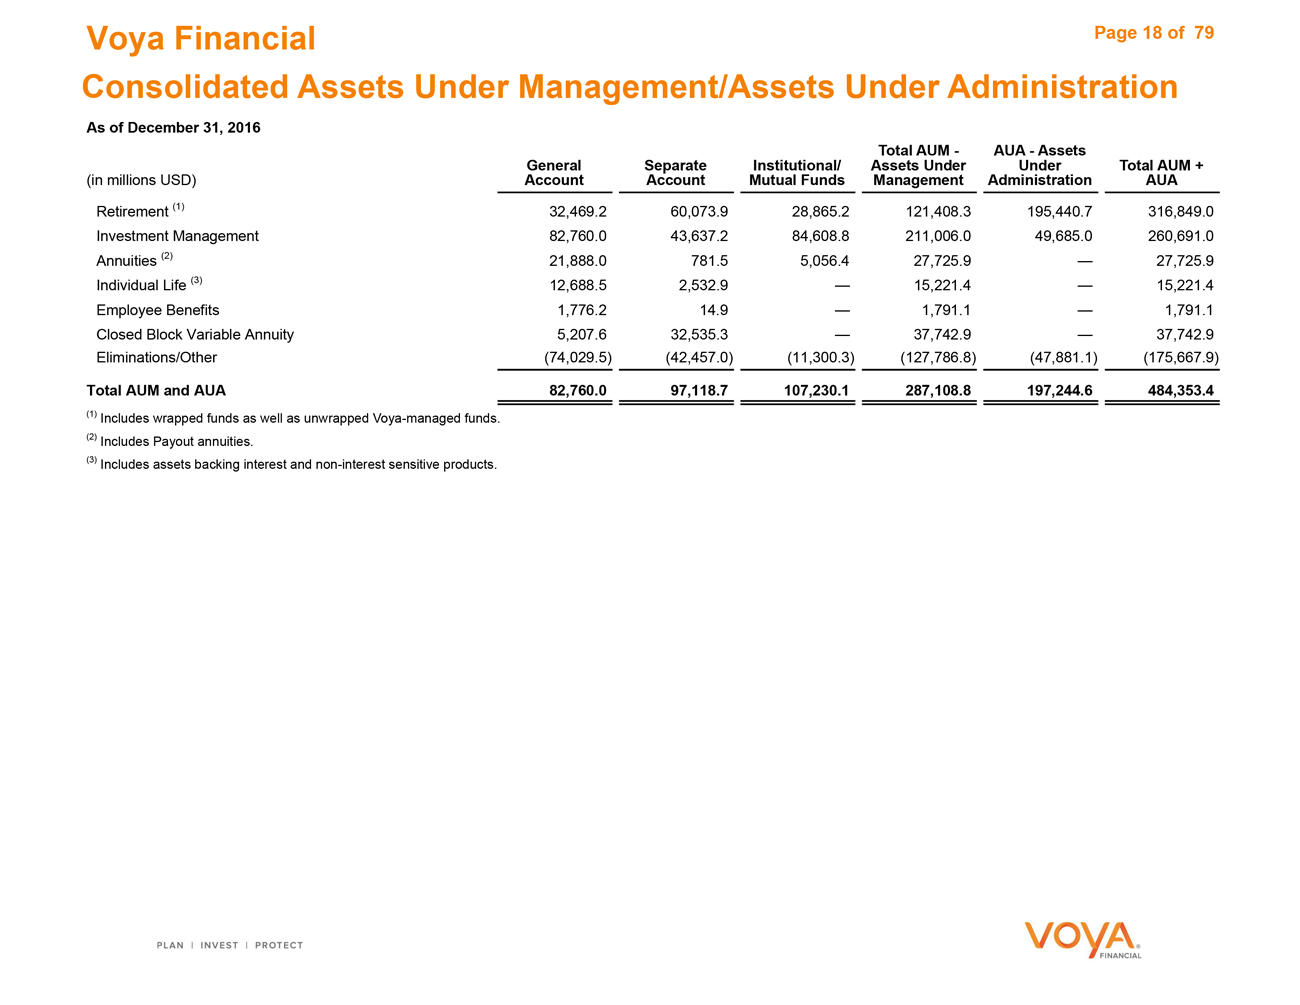
Voya Financial Page 18 of 79 Consolidated Assets Under Management/Assets Under Administration As of December 31, 2016 Total AUM -AUA—Assets GeneralSeparateInstitutional/Assets UnderUnderTotal AUM + (in millions USD)Account AccountMutual FundsManagementAdministrationAUA Retirement (1)32,469.2 60,073.928,865.2121,408.3195,440.7316,849.0 Investment Management82,760.0 43,637.284,608.8211,006.049,685.0260,691.0 Annuities (2)21,888.0 781.55,056.427,725.9—27,725.9 Individual Life (3)12,688.5 2,532.9—15,221.4—15,221.4 Employee Benefits1,776.2 14.9—1,791.1—1,791.1 Closed Block Variable Annuity5,207.6 32,535.3—37,742.9—37,742.9 Eliminations/Other(74,029.5) (42,457.0)(11,300.3)(127,786.8)(47,881.1)(175,667.9) Total AUM and AUA82,760.0 97,118.7107,230.1287,108.8197,244.6484,353.4 (1) Includes wrapped funds as well as unwrapped Voya-managed funds. (2) Includes Payout annuities. (3) Includes assets backing interest and non-interest sensitive products.
Retirement
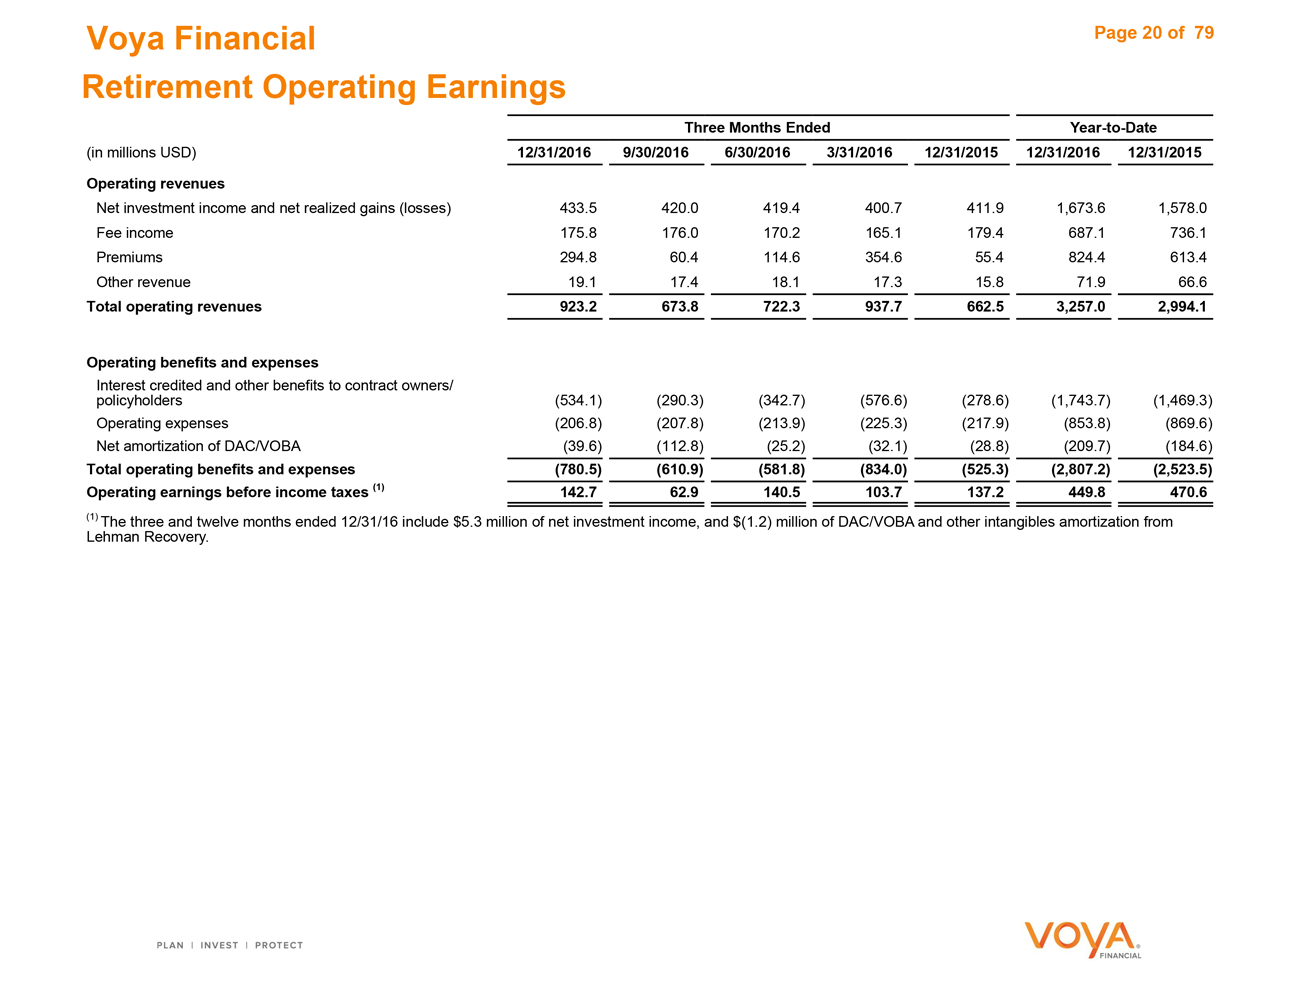
Voya Financial Page 20 of 79
Retirement Operating Earnings
Three MonthsEndedYear-to-Date
(in millions USD) 12/31/2016 9/30/20166/30/20163/31/201612/31/201512/31/201612/31/2015
Operating revenues
Net investment income and net realized gains (losses) 433.5 420.0419.4400.7411.91,673.61,578.0
Fee income 175.8 176.0170.2165.1179.4687.1736.1
Premiums 294.8 60.4114.6354.655.4824.4613.4
Other revenue 19.1 17.418.117.315.871.966.6
Total operating revenues 923.2 673.8722.3937.7662.53,257.02,994.1
Operating benefits and expenses
Interest credited and other benefits to contract owners/
policyholders (534.1) (290.3)(342.7)(576.6)(278.6)(1,743.7)(1,469.3)
Operating expenses (206.8) (207.8)(213.9)(225.3)(217.9)(853.8)(869.6)
Net amortization of DAC/VOBA (39.6) (112.8)(25.2)(32.1)(28.8)(209.7)(184.6)
Total operating benefits and expenses (780.5) (610.9)(581.8)(834.0)(525.3)(2,807.2)(2,523.5)
Operating earnings before income taxes (1) 142.7 62.9140.5103.7137.2449.8470.6
(1) The three and twelve months ended 12/31/16 include $5.3 million of net investment income, and $(1.2) million of DAC/VOBA and other intangibles amortization from
Lehman Recovery.
|
|
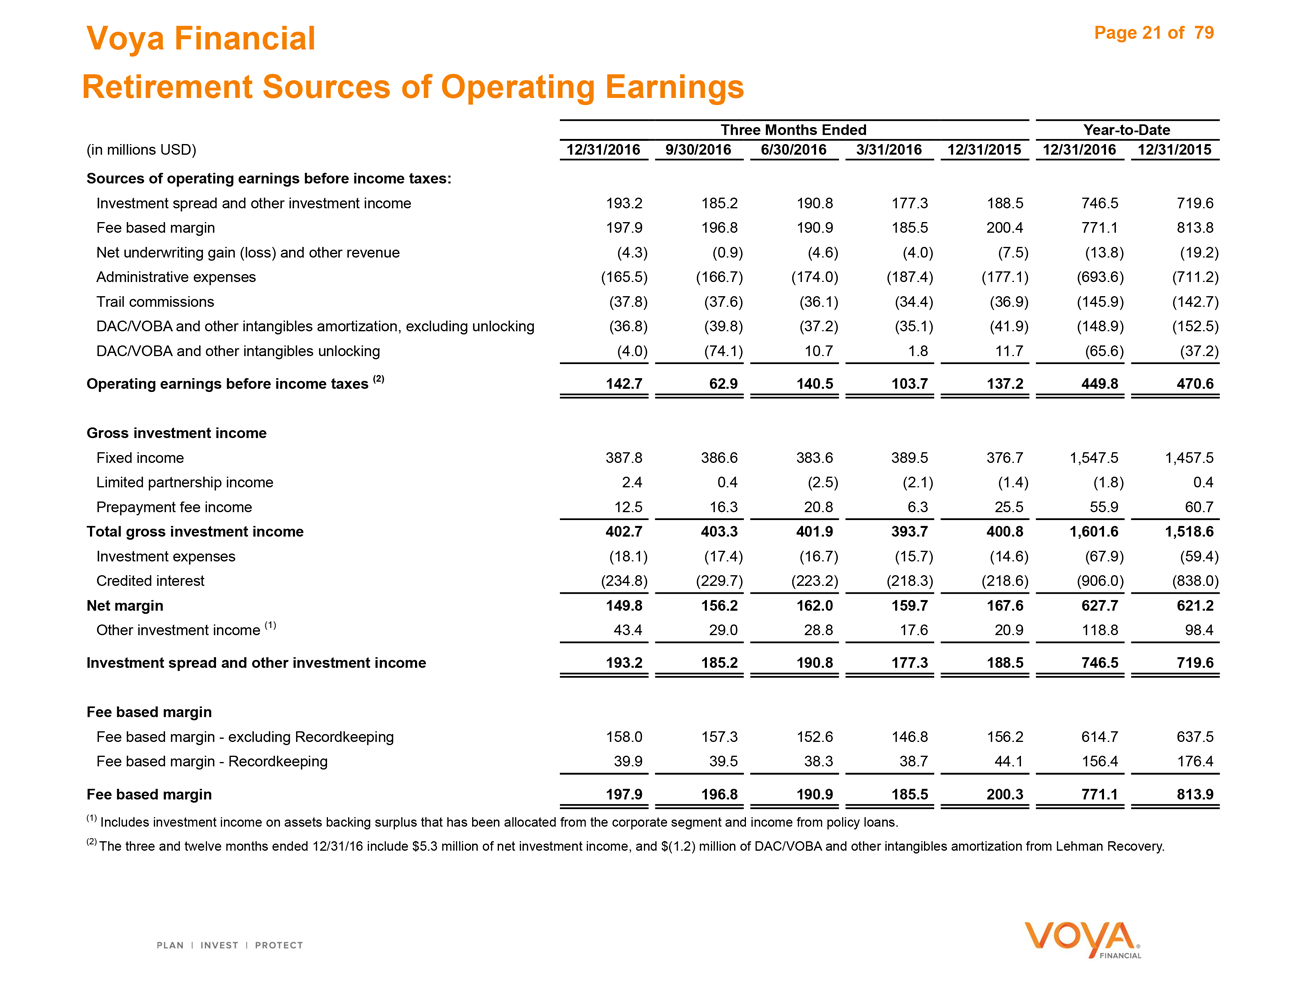
Voya Financial Page 21 of 79 Retirement Sources of Operating Earnings Three Months EndedYear-to-Date (in millions USD)12/31/2016 9/30/20166/30/20163/31/201612/31/201512/31/201612/31/2015 Sources of operating earnings before income taxes: Investment spread and other investment income193.2 185.2190.8177.3188.5746.5719.6 Fee based margin197.9 196.8190.9185.5200.4771.1813.8 Net underwriting gain (loss) and other revenue(4.3) (0.9)(4.6)(4.0)(7.5)(13.8)(19.2) Administrative expenses(165.5) (166.7)(174.0)(187.4)(177.1)(693.6)(711.2) Trail commissions(37.8) (37.6)(36.1)(34.4)(36.9)(145.9)(142.7) DAC/VOBA and other intangibles amortization, excluding unlocking(36.8) (39.8)(37.2)(35.1)(41.9)(148.9)(152.5) DAC/VOBA and other intangibles unlocking(4.0) (74.1)10.71.811.7(65.6)(37.2) Operating earnings before income taxes (2)142.7 62.9140.5103.7137.2449.8470.6 Gross investment income Fixed income387.8 386.6383.6389.5376.71,547.51,457.5 Limited partnership income2.4 0.4(2.5)(2.1)(1.4)(1.8)0.4 Prepayment fee income12.5 16.320.86.325.555.960.7 Total gross investment income402.7 403.3401.9393.7400.81,601.61,518.6 Investment expenses(18.1) (17.4)(16.7)(15.7)(14.6)(67.9)(59.4) Credited interest(234.8) (229.7)(223.2)(218.3)(218.6)(906.0)(838.0) Net margin149.8 156.2162.0159.7167.6627.7621.2 Other investment income (1)43.4 29.028.817.620.9118.898.4 Investment spread and other investment income193.2 185.2190.8177.3188.5746.5719.6 Fee based margin Fee based margin—excluding Recordkeeping158.0 157.3152.6146.8156.2614.7637.5 Fee based margin—Recordkeeping39.9 39.538.338.744.1156.4176.4 Fee based margin197.9 196.8190.9185.5200.3771.1813.9 (1) Includes investment income on assets backing surplus that has been allocated from the corporate segment and income from policy loans. (2) The three and twelve months ended 12/31/16 include $5.3 million of net investment income, and $(1.2) million of DAC/VOBA and other intangibles amortization from Lehman Recovery.
|
|
Voya Financial Page 22 of79
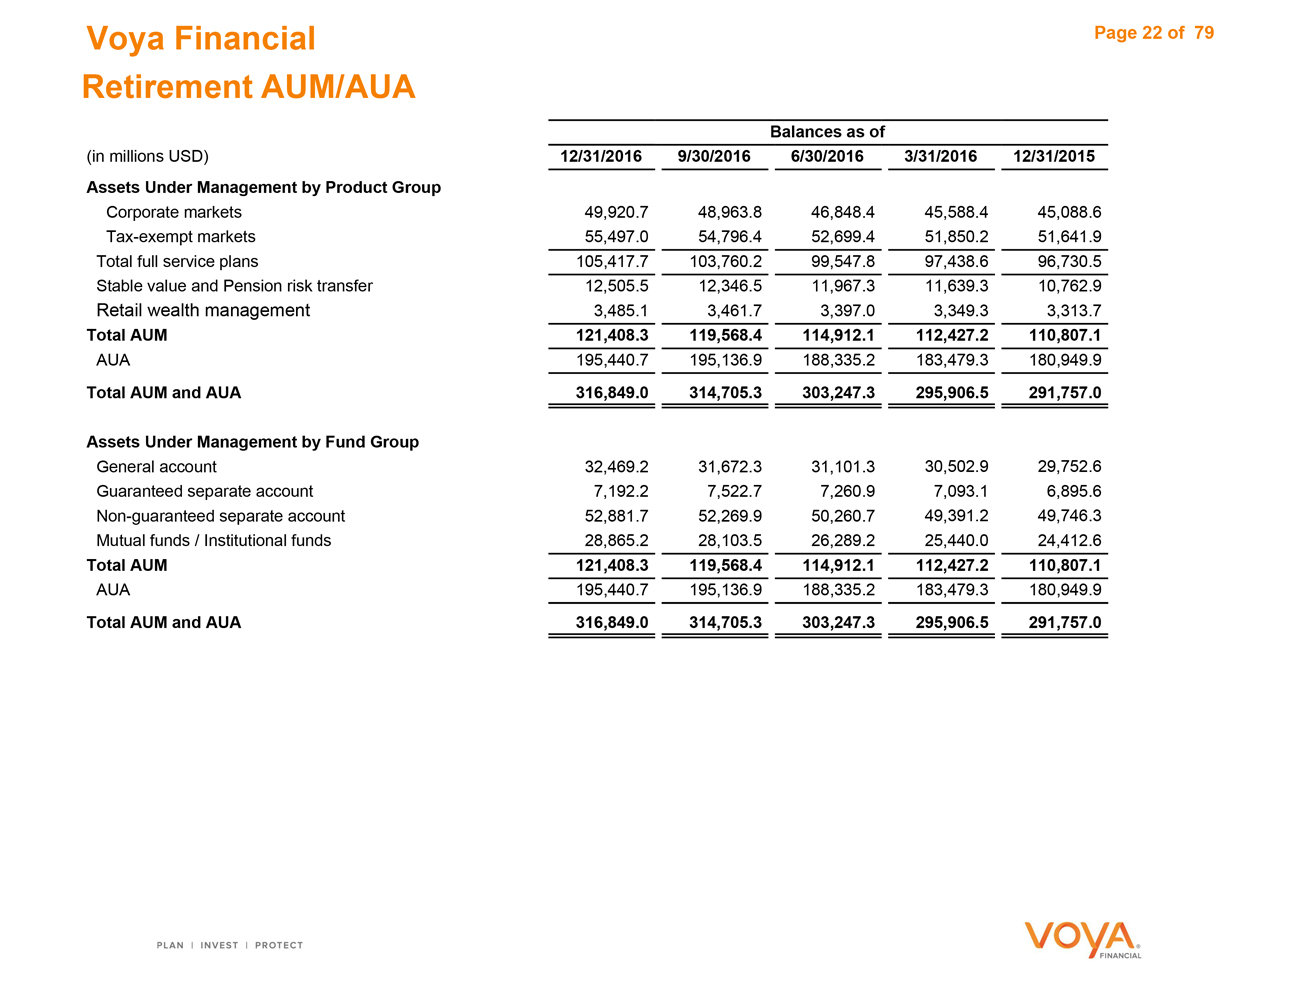
Retirement AUM/AUA
Balances as of
(in millions USD) 12/31/2016 9/30/20166/30/20163/31/201612/31/2015
Assets Under Management by Product Group
Corporate markets 49,920.7 48,963.846,848.445,588.445,088.6
Tax-exempt markets 55,497.0 54,796.452,699.451,850.251,641.9
Total full service plans 105,417.7 103,760.299,547.897,438.696,730.5
Stable value and Pension risk transfer 12,505.5 12,346.511,967.311,639.310,762.9
Retail wealth management 3,485.1 3,461.73,397.03,349.33,313.7
Total AUM 121,408.3 119,568.4114,912.1112,427.2110,807.1
AUA 195,440.7 195,136.9188,335.2183,479.3180,949.9
Total AUM and AUA 316,849.0 314,705.3303,247.3295,906.5291,757.0
Assets Under Management by Fund Group
General account 32,469.2 31,672.331,101.330,502.929,752.6
Guaranteed separate account 7,192.2 7,522.77,260.97,093.16,895.6
Non-guaranteed separate account 52,881.7 52,269.950,260.749,391.249,746.3
Mutual funds / Institutional funds 28,865.2 28,103.526,289.225,440.024,412.6
Total AUM 121,408.3 119,568.4114,912.1112,427.2110,807.1
AUA 195,440.7 195,136.9188,335.2183,479.3180,949.9
Total AUM and AUA 316,849.0 314,705.3303,247.3295,906.5291,757.0
|
|
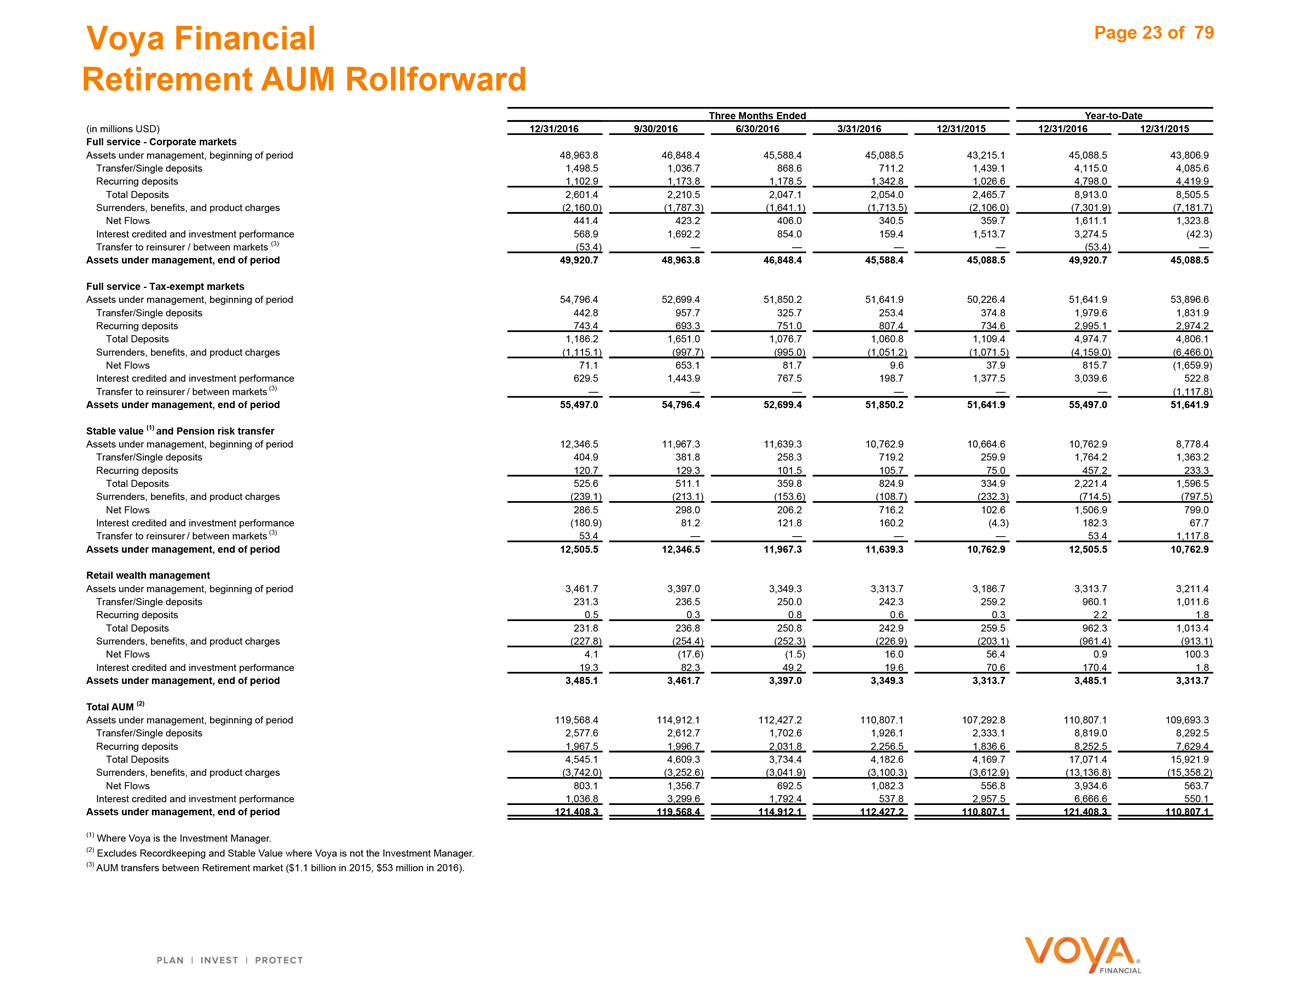
Voya Financial Page 23 of 79 Retirement AUM Rollforward Three Months EndedYear-to-Date (in millions USD)12/31/2016 9/30/20166/30/20163/31/201612/31/201512/31/201612/31/2015 Full service—Corporate markets Assets under management, beginning of period48,963.8 46,848.445,588.445,088.543,215.145,088.543,806.9 Transfer/Single deposits1,498.5 1,036.7868.6711.21,439.14,115.04,085.6 Recurring deposits1,102.9 1,173.81,178.51,342.81,026.64,798.04,419.9 Total Deposits2,601.4 2,210.52,047.12,054.02,465.78,913.08,505.5 Surrenders, benefits, and product charges(2,160.0) (1,787.3)(1,641.1)(1,713.5)(2,106.0)(7,301.9)(7,181.7) Net Flows441.4 423.2406.0340.5359.71,611.11,323.8 Interest credited and investment performance568.9 1,692.2854.0159.41,513.73,274.5(42.3) Transfer to reinsurer / between markets (3)(53.4) ————(53.4)— Assets under management, end of period49,920.7 48,963.846,848.445,588.445,088.549,920.745,088.5 Full service—Tax-exempt markets Assets under management, beginning of period54,796.4 52,699.451,850.251,641.950,226.451,641.953,896.6 Transfer/Single deposits442.8 957.7325.7253.4374.81,979.61,831.9 Recurring deposits743.4 693.3751.0807.4734.62,995.12,974.2 Total Deposits1,186.2 1,651.01,076.71,060.81,109.44,974.74,806.1 Surrenders, benefits, and product charges(1,115.1) (997.7)(995.0)(1,051.2)(1,071.5)(4,159.0)(6,466.0) Net Flows71.1 653.181.79.637.9815.7(1,659.9) Interest credited and investment performance629.5 1,443.9767.5198.71,377.53,039.6522.8 Transfer to reinsurer / between markets (3)— —————(1,117.8) Assets under management, end of period55,497.0 54,796.452,699.451,850.251,641.955,497.051,641.9 Stable value (1) and Pension risk transfer Assets under management, beginning of period12,346.5 11,967.311,639.310,762.910,664.610,762.98,778.4 Transfer/Single deposits404.9 381.8258.3719.2259.91,764.21,363.2 Recurring deposits120.7 129.3101.5105.775.0457.2233.3 Total Deposits525.6 511.1359.8824.9334.92,221.41,596.5 Surrenders, benefits, and product charges(239.1) (213.1)(153.6)(108.7)(232.3)(714.5)(797.5) Net Flows286.5 298.0206.2716.2102.61,506.9799.0 Interest credited and investment performance(180.9) 81.2121.8160.2(4.3)182.367.7 Transfer to reinsurer / between markets (3)53.4 ————53.41,117.8 Assets under management, end of period12,505.5 12,346.511,967.311,639.310,762.912,505.510,762.9 Retail wealth management Assets under management, beginning of period3,461.7 3,397.03,349.33,313.73,186.73,313.73,211.4 Transfer/Single deposits231.3 236.5250.0242.3259.2960.11,011.6 Recurring deposits0.5 0.30.80.60.32.21.8 Total Deposits231.8 236.8250.8242.9259.5962.31,013.4 Surrenders, benefits, and product charges(227.8) (254.4)(252.3)(226.9)(203.1)(961.4)(913.1) Net Flows4.1 (17.6)(1.5)16.056.40.9100.3 Interest credited and investment performance19.3 82.349.219.670.6170.41.8 Assets under management, end of period3,485.1 3,461.73,397.03,349.33,313.73,485.13,313.7 Total AUM (2) Assets under management, beginning of period119,568.4 114,912.1112,427.2110,807.1107,292.8110,807.1109,693.3 Transfer/Single deposits2,577.6 2,612.71,702.61,926.12,333.18,819.08,292.5 Recurring deposits1,967.5 1,996.72,031.82,256.51,836.68,252.57,629.4 Total Deposits4,545.1 4,609.33,734.44,182.64,169.717,071.415,921.9 Surrenders, benefits, and product charges(3,742.0) (3,252.6)(3,041.9)(3,100.3)(3,612.9)(13,136.8)(15,358.2) Net Flows803.1 1,356.7692.51,082.3556.83,934.6563.7 Interest credited and investment performance1,036.8 3,299.61,792.4537.82,957.56,666.6550.1 Assets under management, end of period121,408.3 119,568.4114,912.1112,427.2110,807.1121,408.3110,807.1 (1) Where Voya is the Investment Manager. (2) Excludes Recordkeeping and Stable Value where Voya is not the Investment Manager. (3) AUM transfers between Retirement market ($1.1 billion in 2015, $53 million in 2016).
|

|
Investment Management
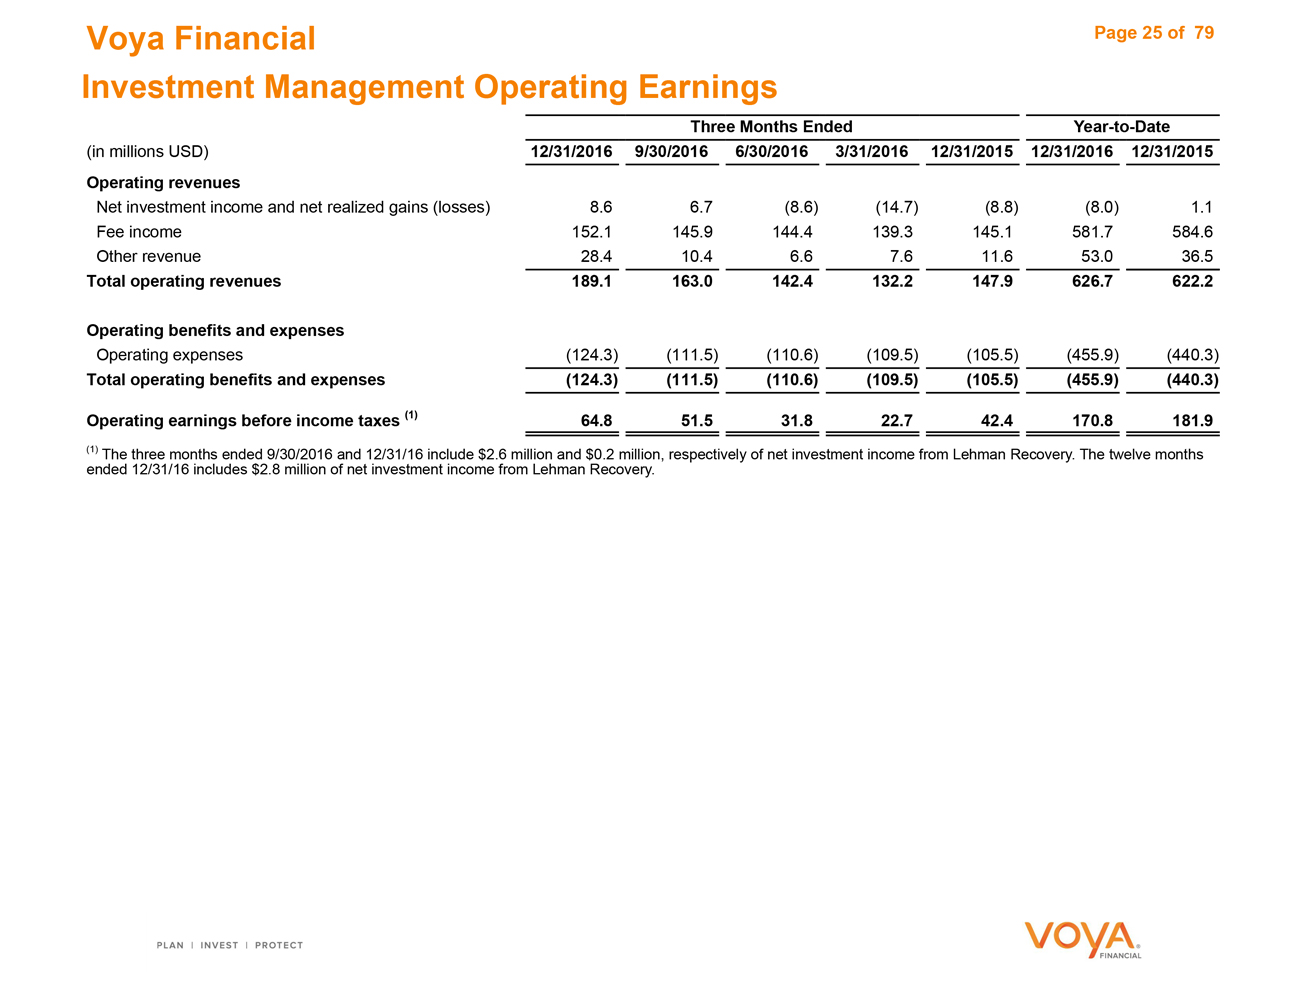
Voya Financial Page 25 of 79
Investment Management Operating Earnings
Three MonthsEndedYear-to-Date
(in millions USD) 12/31/2016 9/30/20166/30/20163/31/201612/31/201512/31/201612/31/2015
Operating revenues
Net investment income and net realized gains (losses) 8.6 6.7(8.6)(14.7)(8.8)(8.0)1.1
Fee income 152.1 145.9144.4139.3145.1581.7584.6
Other revenue 28.4 10.46.67.611.653.036.5
Total operating revenues 189.1 163.0142.4132.2147.9626.7622.2
Operating benefits and expenses
Operating expenses (124.3) (111.5)(110.6)(109.5)(105.5)(455.9)(440.3)
Total operating benefits and expenses (124.3) (111.5)(110.6)(109.5)(105.5)(455.9)(440.3)
Operating earnings before income taxes (1) 64.8 51.531.822.742.4170.8181.9
(1) The three months ended 9/30/2016 and 12/31/16 include $2.6 million and $0.2 million, respectively of net investment income from Lehman Recovery. The twelve months
ended 12/31/16 includes $2.8 million of net investment income from Lehman Recovery.
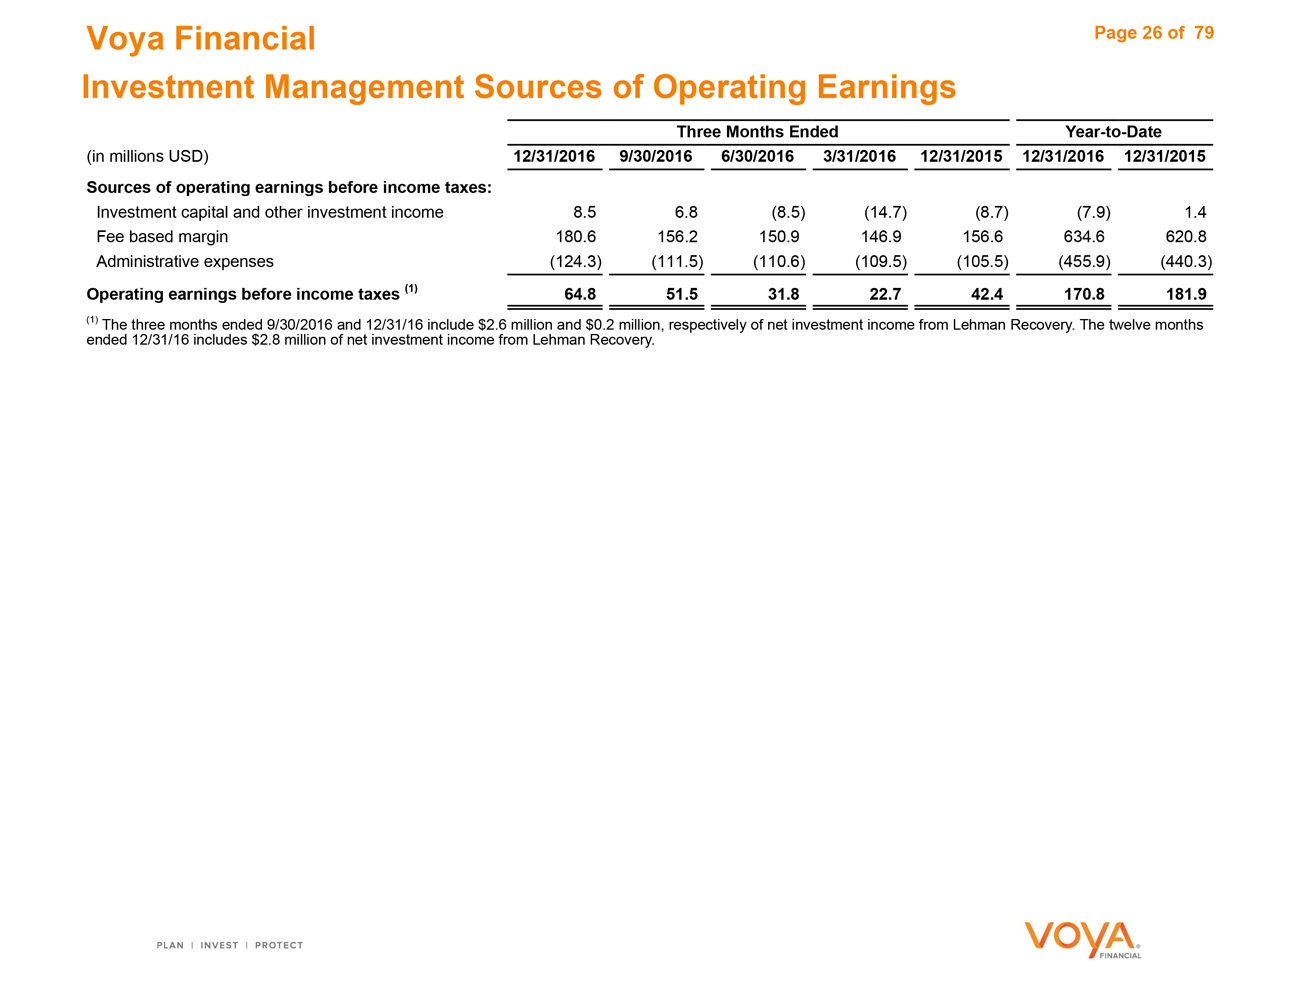
Voya Financial Page 26 of 79 Investment Management Sources of Operating Earnings Three MonthsEndedYear-to-Date (in millions USD) 12/31/2016 9/30/20166/30/20163/31/201612/31/201512/31/201612/31/2015 Sources of operating earnings before income taxes: Investment capital and other investment income 8.5 6.8(8.5)(14.7)(8.7)(7.9)1.4 Fee based margin 180.6 156.2150.9146.9156.6634.6620.8 Administrative expenses (124.3) (111.5)(110.6)(109.5)(105.5)(455.9)(440.3) Operating earnings before income taxes (1) 64.8 51.531.822.742.4170.8181.9 (1) The three months ended 9/30/2016 and 12/31/16 include $2.6 million and $0.2 million, respectively of net investment income from Lehman Recovery. The twelve months ended 12/31/16 includes $2.8 million of net investment income from Lehman Recovery.
|
|
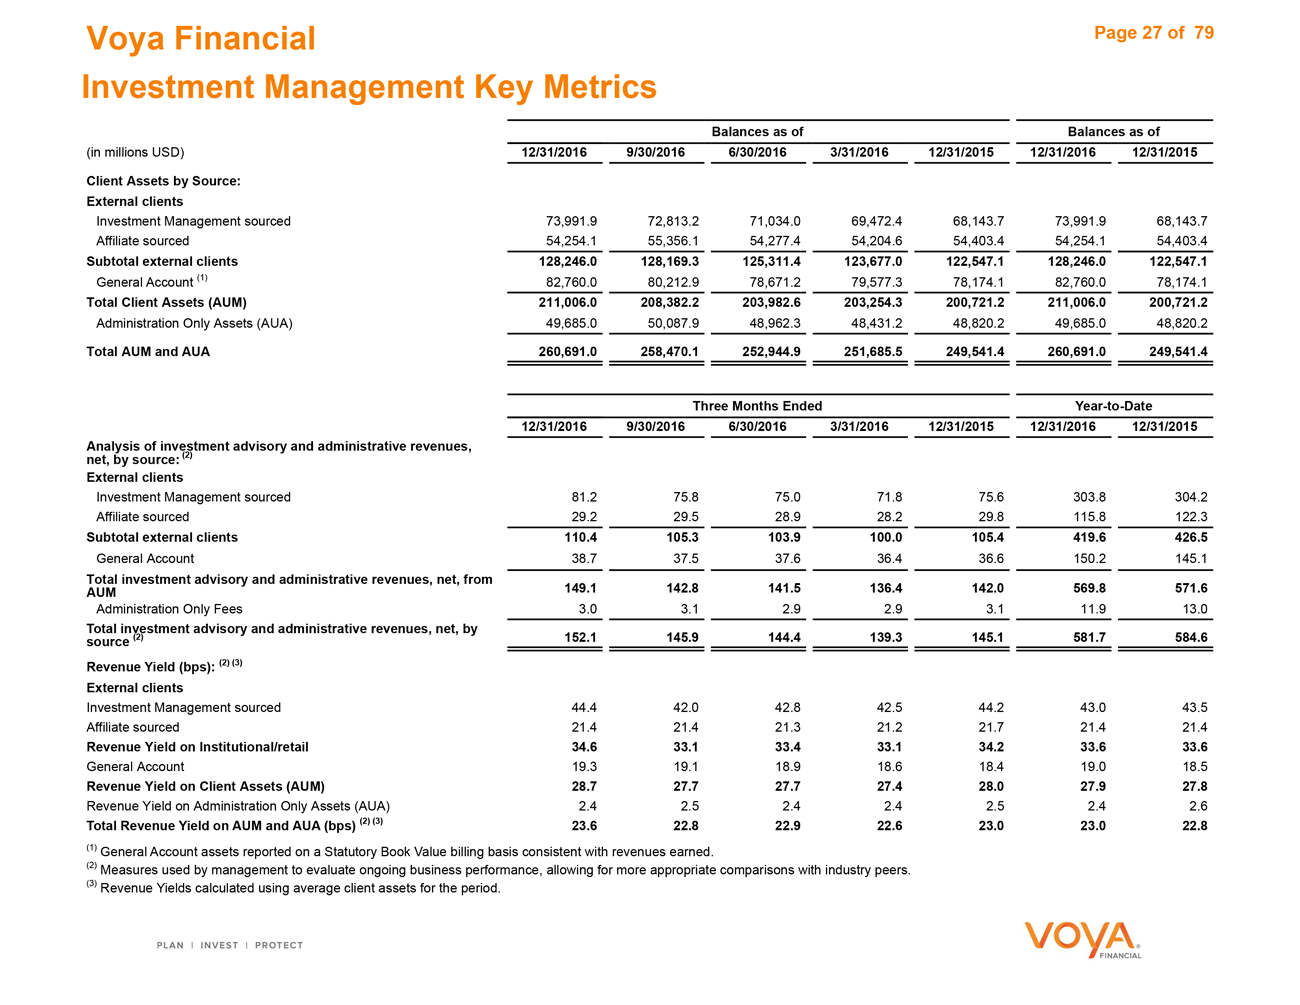
Voya Financial Page 27 of 79 Investment Management Key Metrics Balances as ofBalances as of (in millions USD)12/31/2016 9/30/20166/30/20163/31/201612/31/201512/31/201612/31/2015 Client Assets by Source: External clients Investment Management sourced73,991.9 72,813.271,034.069,472.468,143.773,991.968,143.7 Affiliate sourced54,254.1 55,356.154,277.454,204.654,403.454,254.154,403.4 Subtotal external clients128,246.0 128,169.3125,311.4123,677.0122,547.1128,246.0122,547.1 General Account (1)82,760.0 80,212.978,671.279,577.378,174.182,760.078,174.1 Total Client Assets (AUM)211,006.0 208,382.2203,982.6203,254.3200,721.2211,006.0200,721.2 Administration Only Assets (AUA)49,685.0 50,087.948,962.348,431.248,820.249,685.048,820.2 Total AUM and AUA260,691.0 258,470.1252,944.9251,685.5249,541.4260,691.0249,541.4 Three Months EndedYear-to-Date 12/31/20169/30/20166/30/20163/31/201612/31/201512/31/201612/31/2015 Analysis of investment advisory and administrative revenues, net, by source: (2) External clients Investment Management sourced81.2 75.875.071.875.6303.8304.2 Affiliate sourced29.2 29.528.928.229.8115.8122.3 Subtotal external clients110.4 105.3103.9100.0105.4419.6426.5 General Account38.7 37.537.636.436.6150.2145.1 Total investment advisory and administrative revenues, net, from149.1 142.8141.5136.4 AUM 142.0569.8571.6 Administration Only Fees3.0 3.12.92.93.111.913.0 Total investment advisory and administrative revenues, net, by source (2)152.1 145.9144.4139.3145.1581.7584.6 Revenue Yield (bps): (2) (3) External clients Investment Management sourced44.4 42.042.842.544.243.043.5 Affiliate sourced21.4 21.421.321.221.721.421.4 Revenue Yield on Institutional/retail34.6 33.133.433.134.233.633.6 General Account19.3 19.118.918.618.419.018.5 Revenue Yield on Client Assets (AUM)28.7 27.727.727.428.027.927.8 Revenue Yield on Administration Only Assets (AUA)2.4 2.52.42.42.52.42.6 Total Revenue Yield on AUM and AUA (bps) (2) (3)23.6 22.822.922.623.023.022.8 (1) General Account assets reported on a Statutory Book Value billing basis consistent with revenues earned. (2) Measures used by management to evaluate ongoing business performance, allowing for more appropriate comparisons with industry peers. (3) Revenue Yields calculated using average client assets for the period.
|
|
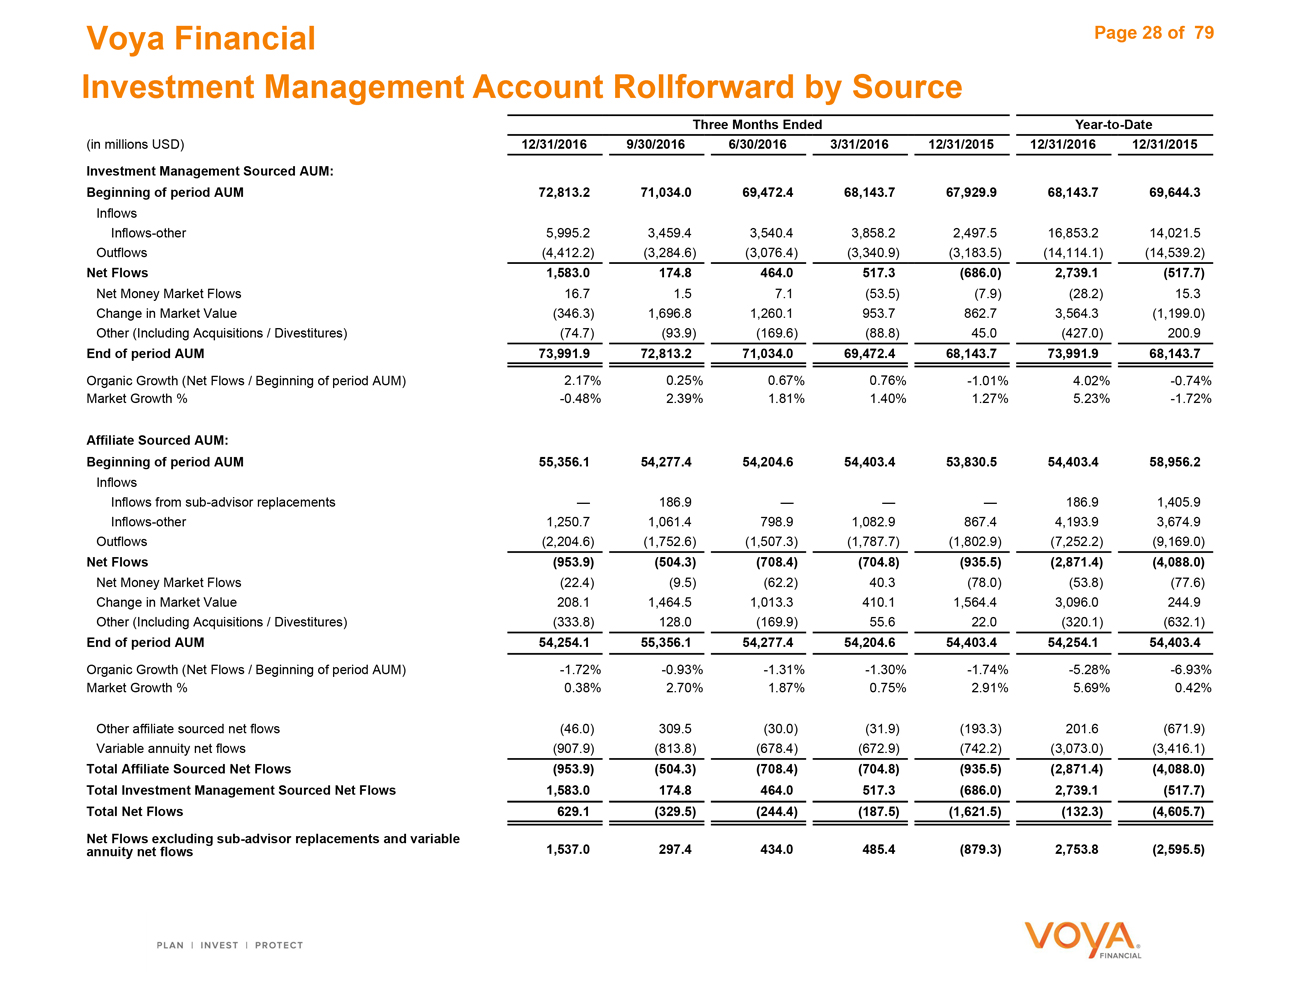
Voya Financial Page 28 of 79 Investment Management Account Rollforward by Source Three Months EndedYear-to-Date (in millions USD)12/31/2016 9/30/20166/30/20163/31/201612/31/201512/31/201612/31/2015 Investment Management Sourced AUM: Beginning of period AUM72,813.2 71,034.069,472.468,143.767,929.968,143.769,644.3 Inflows Inflows-other5,995.2 3,459.43,540.43,858.22,497.516,853.214,021.5 Outflows(4,412.2) (3,284.6)(3,076.4)(3,340.9)(3,183.5)(14,114.1)(14,539.2) Net Flows1,583.0 174.8464.0517.3(686.0)2,739.1(517.7) Net Money Market Flows16.7 1.57.1(53.5)(7.9)(28.2)15.3 Change in Market Value(346.3) 1,696.81,260.1953.7862.73,564.3(1,199.0) Other (Including Acquisitions / Divestitures)(74.7) (93.9)(169.6)(88.8)45.0(427.0)200.9 End of period AUM73,991.9 72,813.271,034.069,472.468,143.773,991.968,143.7 Organic Growth (Net Flows / Beginning of period AUM)2.17% 0.25%0.67%0.76%-1.01%4.02%-0.74% Market Growth %-0.48% 2.39%1.81%1.40%1.27%5.23%-1.72% Affiliate Sourced AUM: Beginning of period AUM55,356.1 54,277.454,204.654,403.453,830.554,403.458,956.2 Inflows Inflows from sub-advisor replacements— 186.9———186.91,405.9 Inflows-other1,250.7 1,061.4798.91,082.9867.44,193.93,674.9 Outflows(2,204.6) (1,752.6)(1,507.3)(1,787.7)(1,802.9)(7,252.2)(9,169.0) Net Flows(953.9) (504.3)(708.4)(704.8)(935.5)(2,871.4)(4,088.0) Net Money Market Flows(22.4) (9.5)(62.2)40.3(78.0)(53.8)(77.6) Change in Market Value208.1 1,464.51,013.3410.11,564.43,096.0244.9 Other (Including Acquisitions / Divestitures)(333.8) 128.0(169.9)55.622.0(320.1)(632.1) End of period AUM54,254.1 55,356.154,277.454,204.654,403.454,254.154,403.4 Organic Growth (Net Flows / Beginning of period AUM)-1.72% -0.93%-1.31%-1.30%-1.74%-5.28%-6.93% Market Growth %0.38% 2.70%1.87%0.75%2.91%5.69%0.42% Other affiliate sourced net flows(46.0) 309.5(30.0)(31.9)(193.3)201.6(671.9) Variable annuity net flows(907.9) (813.8)(678.4)(672.9)(742.2)(3,073.0)(3,416.1) Total Affiliate Sourced Net Flows(953.9) (504.3)(708.4)(704.8)(935.5)(2,871.4)(4,088.0) Total Investment Management Sourced Net Flows1,583.0 174.8464.0517.3(686.0)2,739.1(517.7) Total Net Flows629.1 (329.5)(244.4)(187.5)(1,621.5)(132.3)(4,605.7) Net Flows excluding sub-advisor replacements and variable annuity net flows1,537.0 297.4434.0485.4(879.3)2,753.8(2,595.5)
|
|
Voya Financial Page 29 of79
Investment Management Account Value by Asset Type
Balances as of
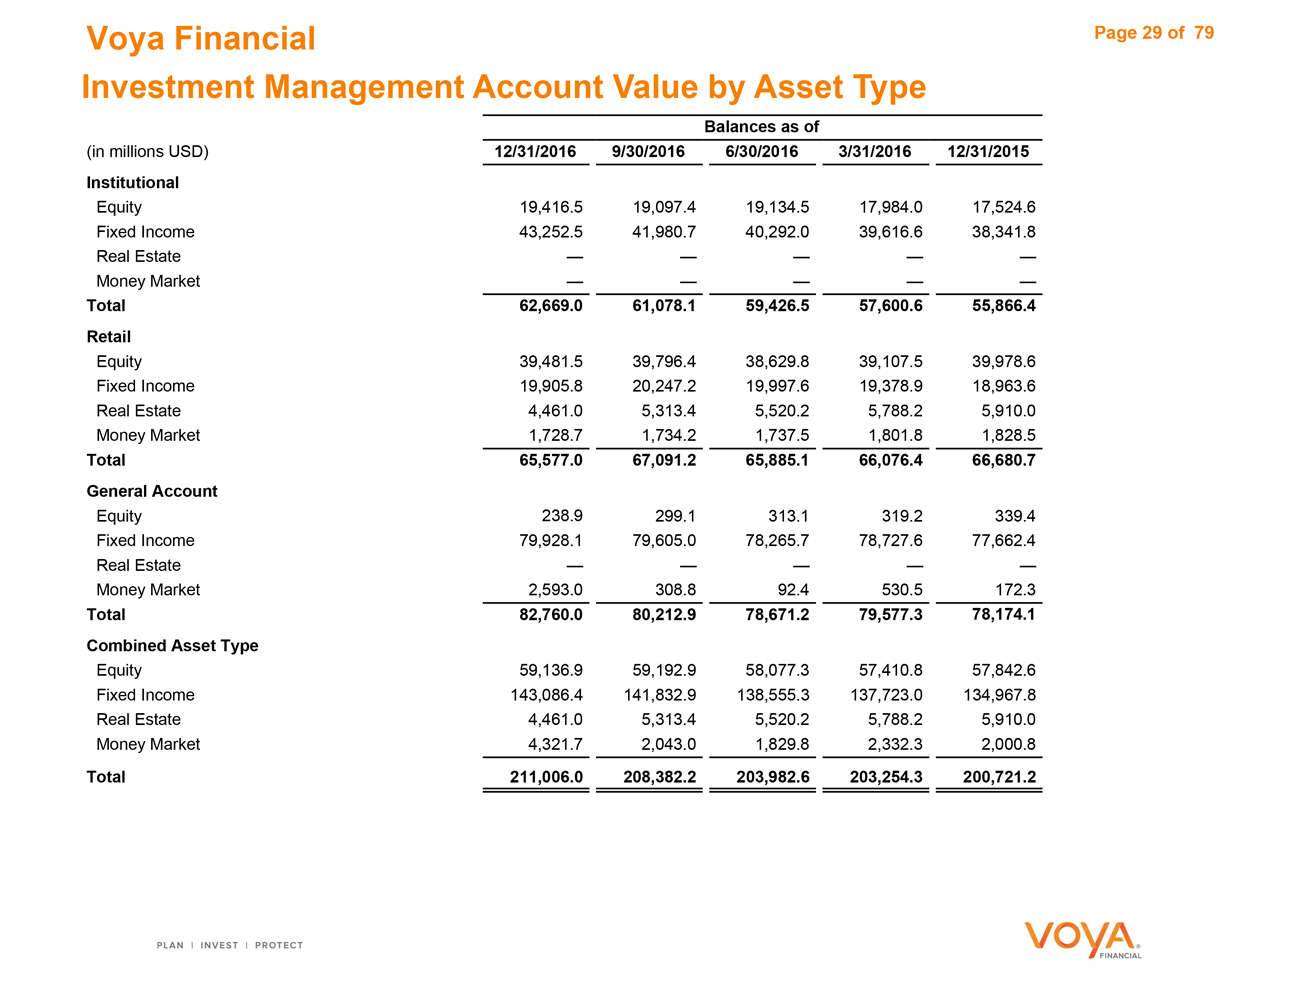
(in millions USD) 12/31/2016 9/30/20166/30/20163/31/201612/31/2015
Institutional
Equity 19,416.5 19,097.419,134.517,984.017,524.6
Fixed Income 43,252.5 41,980.740,292.039,616.638,341.8
Real Estate — ————
Money Market — ————
Total 62,669.0 61,078.159,426.557,600.655,866.4
Retail
Equity 39,481.5 39,796.438,629.839,107.539,978.6
Fixed Income 19,905.8 20,247.219,997.619,378.918,963.6
Real Estate 4,461.0 5,313.45,520.25,788.25,910.0
Money Market 1,728.7 1,734.21,737.51,801.81,828.5
Total 65,577.0 67,091.265,885.166,076.466,680.7
General Account
Equity 238.9 299.1313.1319.2339.4
Fixed Income 79,928.1 79,605.078,265.778,727.677,662.4
Real Estate — ————
Money Market 2,593.0 308.892.4530.5172.3
Total 82,760.0 80,212.978,671.279,577.378,174.1
Combined Asset Type
Equity 59,136.9 59,192.958,077.357,410.857,842.6
Fixed Income 143,086.4 141,832.9138,555.3137,723.0134,967.8
Real Estate 4,461.0 5,313.45,520.25,788.25,910.0
Money Market 4,321.7 2,043.01,829.82,332.32,000.8
Total 211,006.0 208,382.2203,982.6203,254.3200,721.2
Annuities
Voya Financial Page 31 of 79
Annuities Operating Earnings
Three MonthsEndedYear-to-Date
(in millions USD) 12/31/2016 9/30/20166/30/20163/31/201612/31/201512/31/201612/31/2015
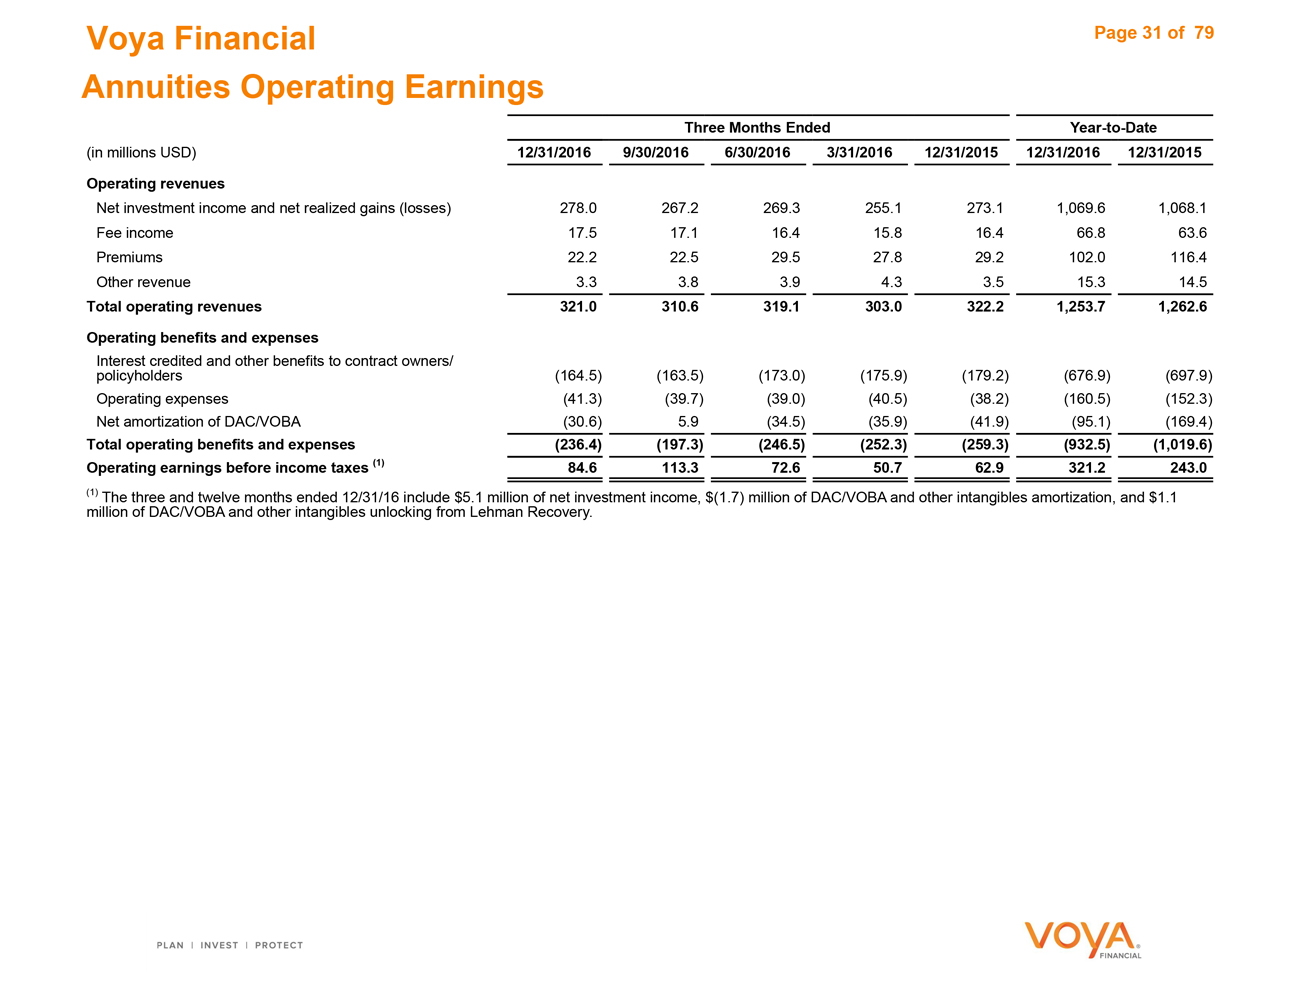
Operating revenues
Net investment income and net realized gains (losses) 278.0 267.2269.3255.1273.11,069.61,068.1
Fee income 17.5 17.116.415.816.466.863.6
Premiums 22.2 22.529.527.829.2102.0116.4
Other revenue 3.3 3.83.94.33.515.314.5
Total operating revenues 321.0 310.6319.1303.0322.21,253.71,262.6
Operating benefits and expenses
Interest credited and other benefits to contract owners/
policyholders (164.5) (163.5)(173.0)(175.9)(179.2)(676.9)(697.9)
Operating expenses (41.3) (39.7)(39.0)(40.5)(38.2)(160.5)(152.3)
Net amortization of DAC/VOBA (30.6) 5.9(34.5)(35.9)(41.9)(95.1)(169.4)
Total operating benefits and expenses (236.4) (197.3)(246.5)(252.3)(259.3)(932.5)(1,019.6)
Operating earnings before income taxes (1) 84.6 113.372.650.762.9321.2243.0
(1) The three and twelve months ended 12/31/16 include $5.1 million of net investment income, $(1.7) million of DAC/VOBA and other intangibles amortization, and $1.1
million of DAC/VOBA and other intangibles unlocking from Lehman Recovery.
Voya Financial
|
|
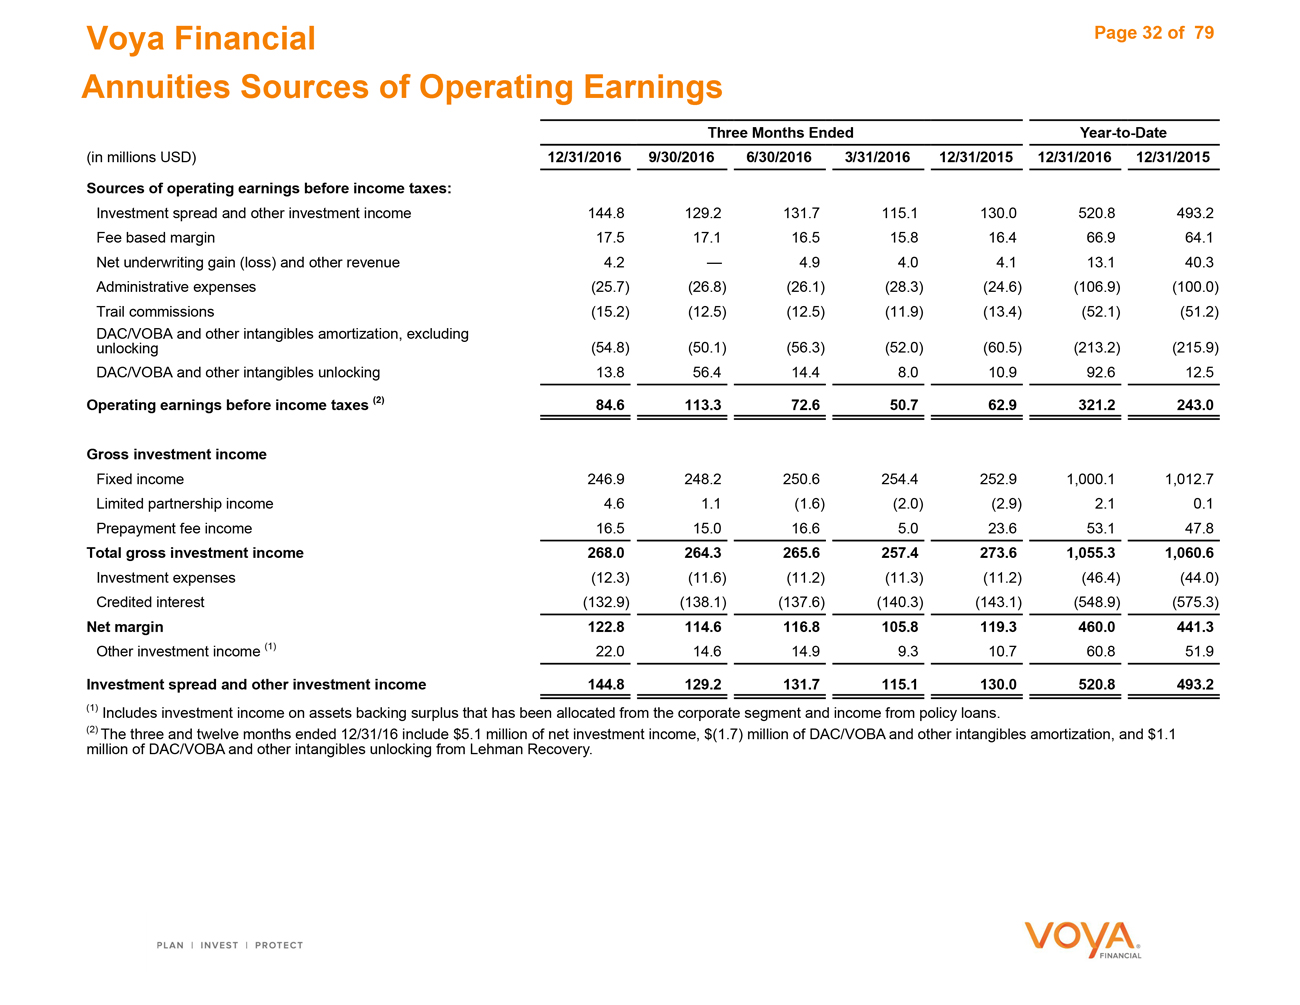
Page 32 of 79 Annuities Sources of Operating Earnings Three Months Ended Year-to-Date (in millions USD) 12/31/2016 9/30/2016 6/30/2016 3/31/2016 12/31/2015 12/31/2016 12/31/2015 Sources of operating earnings before income taxes: Investment spread and other investment income 144.8 129.2 131.7 115.1 130.0 520.8 493.2 Fee based margin 17.5 17.1 16.5 15.8 16.4 66.9 64.1 Net underwriting gain (loss) and other revenue 4.2 —— 4.9 4.0 4.1 13.1 40.3 Administrative expenses (25.7) (26.8) (26.1) (28.3) (24.6) (106.9) (100.0) Trail commissions (15.2) (12.5) (12.5) (11.9) (13.4) (52.1) (51.2) DAC/VOBA and other intangibles amortization, excluding unlocking (54.8) (50.1) (56.3) (52.0) (60.5) (213.2) (215.9) DAC/VOBA and other intangibles unlocking 13.8 56.4 14.4 8.0 10.9 92.6 12.5 Operating earnings before income taxes (2) 84.6 113.3 72.6 50.7 62.9 321.2 243.0 Gross investment income Fixed income 246.9 248.2 250.6 254.4 252.9 1,000.1 1,012.7 Limited partnership income 4.6 1.1 (1.6) (2.0) (2.9) 2.1 0.1 Prepayment fee income 16.5 15.0 16.6 5.0 23.6 53.1 47.8 Total gross investment income 268.0 264.3 265.6 257.4 273.6 1,055.3 1,060.6 Investment expenses (12.3) (11.6) (11.2) (11.3) (11.2) (46.4) (44.0) Credited interest (132.9) (138.1) (137.6) (140.3) (143.1) (548.9) (575.3) Net margin 122.8 114.6 116.8 105.8 119.3 460.0 441.3 Other investment income (1) 22.0 14.6 14.9 9.3 10.7 60.8 51.9 Investment spread and other investment income 144.8 129.2 131.7 115.1 130.0 520.8 493.2 (1) Includes investment income on assets backing surplus that has been allocated from the corporate segment and income from policy loans. (2) The three and twelve months ended 12/31/16 include $5.1 million of net investment income, $(1.7) million of DAC/VOBA and other intangibles amortization, and $1.1 million of DAC/VOBA and other intangibles unlocking from Lehman Recovery.
|
|
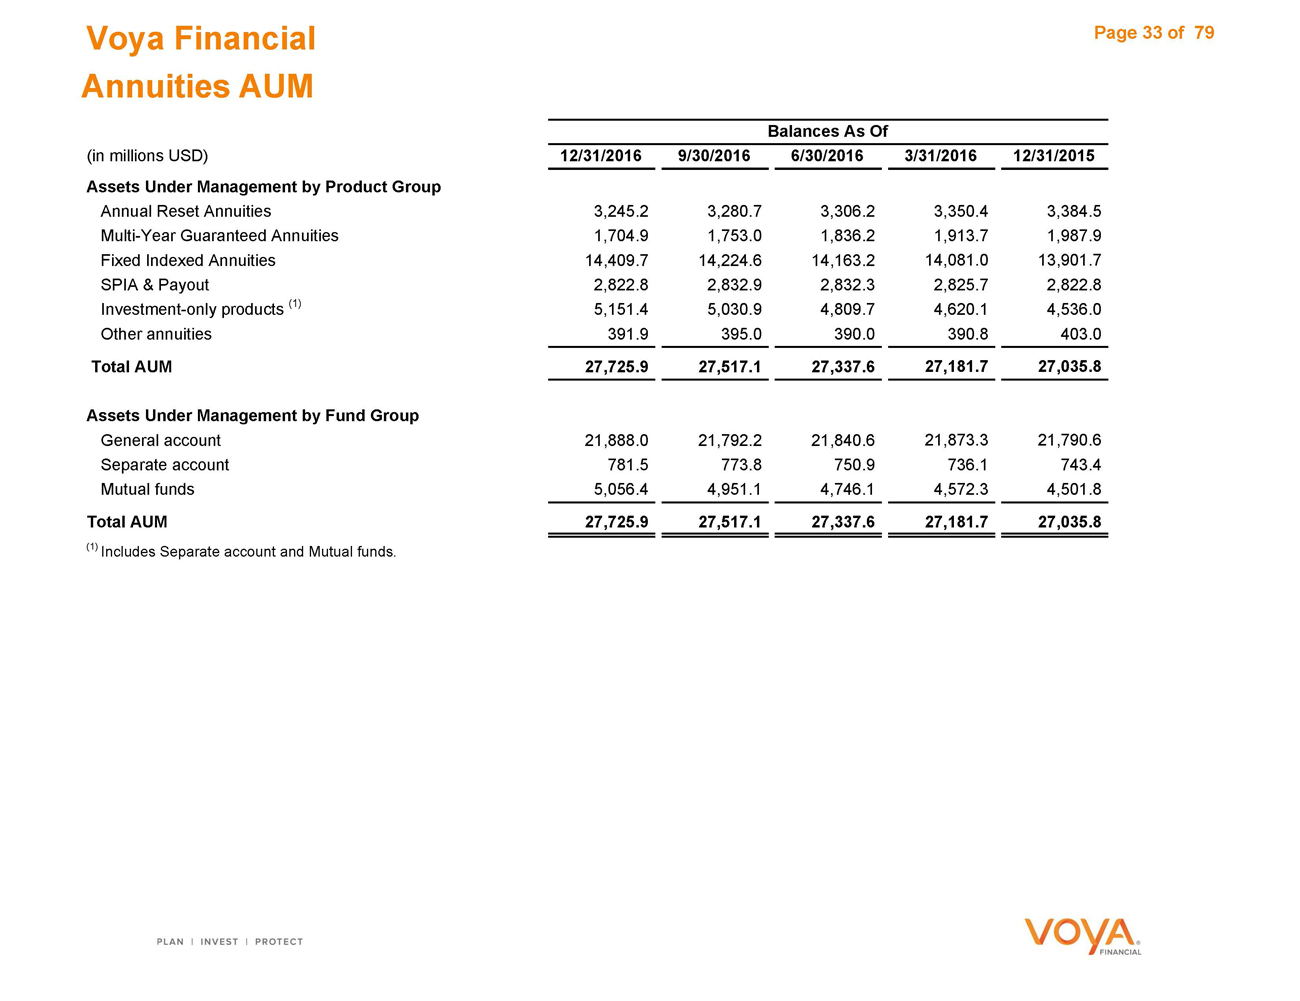
Voya Financial Page 33 of 79 Annuities AUM Balances As Of (in millions USD) 12/31/2016 9/30/2016 6/30/2016 3/31/2016 12/31/2015 Assets Under Management by Product Group Annual Reset Annuities 3,245.2 3,280.7 3,306.2 3,350.4 3,384.5 Multi-Year Guaranteed Annuities 1,704.9 1,753.0 1,836.2 1,913.7 1,987.9 Fixed Indexed Annuities 14,409.7 14,224.6 14,163.2 14,081.0 13,901.7 SPIA & Payout 2,822.8 2,832.9 2,832.3 2,825.7 2,822.8 Investment-only products (1) 5,151.4 5,030.9 4,809.7 4,620.1 4,536.0 Other annuities 391.9 395.0 390.0 390.8 403.0 Total AUM 27,725.9 27,517.1 27,337.6 27,181.7 27,035.8 Assets Under Management by Fund Group General account 21,888.0 21,792.2 21,840.6 21,873.3 21,790.6 Separate account 781.5 773.8 750.9 736.1 743.4 Mutual funds 5,056.4 4,951.1 4,746.1 4,572.3 4,501.8 Total AUM 27,725.9 27,517.1 27,337.6 27,181.7 27,035.8 (1) Includes Separate account and Mutual funds.
|
|
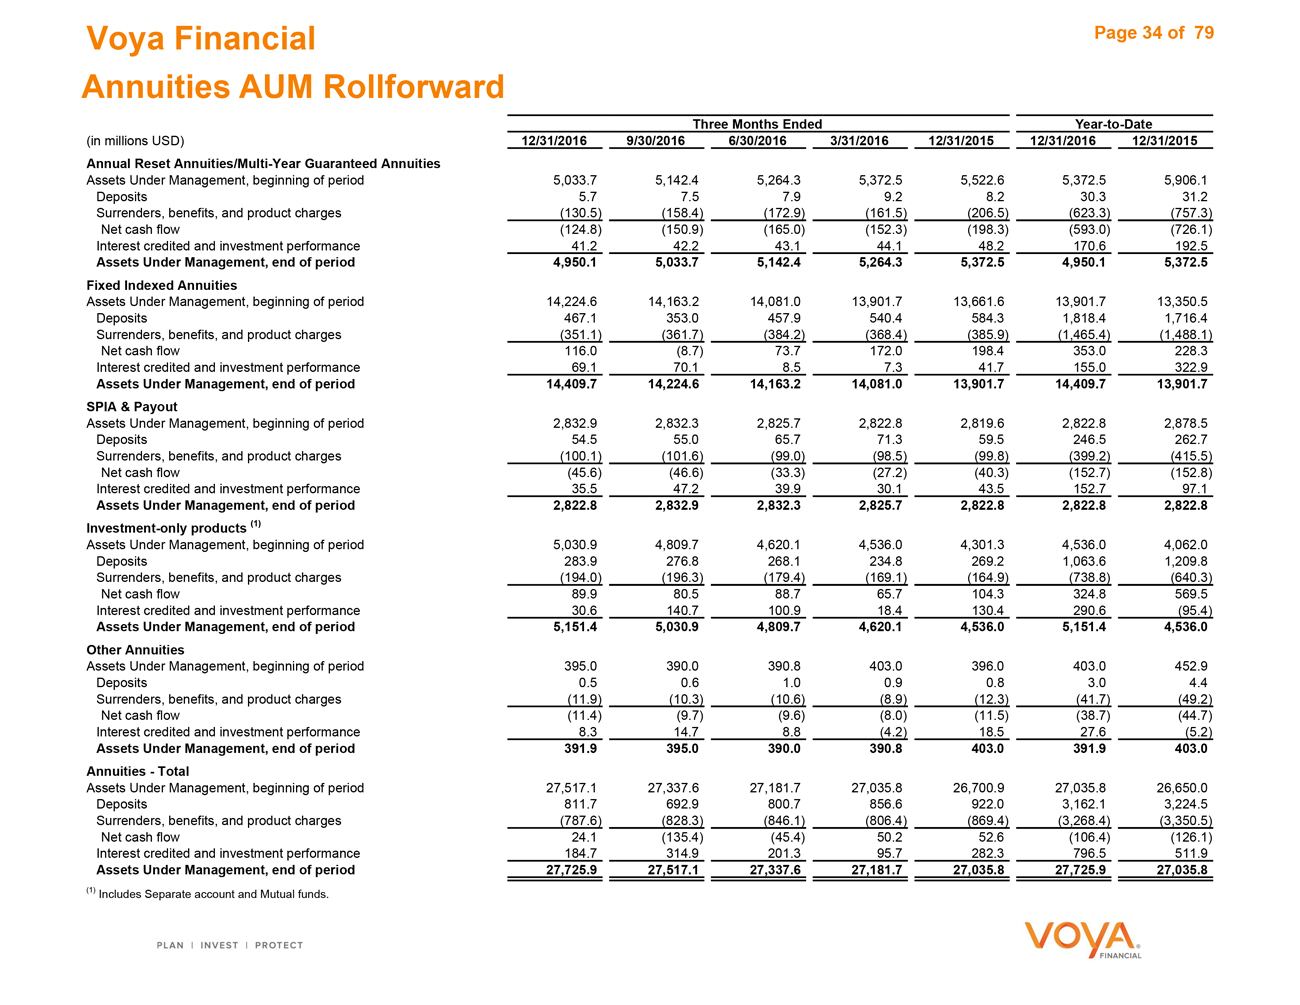
Voya Financial Page 34 of 79 Annuities AUM Rollforward Three Months EndedYear-to-Date (in millions USD)12/31/2016 9/30/20166/30/20163/31/201612/31/201512/31/201612/31/2015 Annual Reset Annuities/Multi-Year Guaranteed Annuities Assets Under Management, beginning of period5,033.7 5,142.45,264.35,372.55,522.65,372.55,906.1 Deposits5.7 7.57.99.28.230.331.2 Surrenders, benefits, and product charges(130.5) (158.4)(172.9)(161.5)(206.5)(623.3)(757.3) Net cash flow(124.8) (150.9)(165.0)(152.3)(198.3)(593.0)(726.1) Interest credited and investment performance41.2 42.243.144.148.2170.6192.5 Assets Under Management, end of period4,950.1 5,033.75,142.45,264.35,372.54,950.15,372.5 Fixed Indexed Annuities Assets Under Management, beginning of period14,224.6 14,163.214,081.013,901.713,661.613,901.713,350.5 Deposits467.1 353.0457.9540.4584.31,818.41,716.4 Surrenders, benefits, and product charges(351.1) (361.7)(384.2)(368.4)(385.9)(1,465.4)(1,488.1) Net cash flow116.0 (8.7)73.7172.0198.4353.0228.3 Interest credited and investment performance69.1 70.18.57.341.7155.0322.9 Assets Under Management, end of period14,409.7 14,224.614,163.214,081.013,901.714,409.713,901.7 SPIA & Payout Assets Under Management, beginning of period2,832.9 2,832.32,825.72,822.82,819.62,822.82,878.5 Deposits54.5 55.065.771.359.5246.5262.7 Surrenders, benefits, and product charges(100.1) (101.6)(99.0)(98.5)(99.8)(399.2)(415.5) Net cash flow(45.6) (46.6)(33.3)(27.2)(40.3)(152.7)(152.8) Interest credited and investment performance35.5 47.239.930.143.5152.797.1 Assets Under Management, end of period2,822.8 2,832.92,832.32,825.72,822.82,822.82,822.8 Investment-only products (1) Assets Under Management, beginning of period5,030.9 4,809.74,620.14,536.04,301.34,536.04,062.0 Deposits283.9 276.8268.1234.8269.21,063.61,209.8 Surrenders, benefits, and product charges(194.0) (196.3)(179.4)(169.1)(164.9)(738.8)(640.3) Net cash flow89.9 80.588.765.7104.3324.8569.5 Interest credited and investment performance30.6 140.7100.918.4130.4290.6(95.4) Assets Under Management, end of period5,151.4 5,030.94,809.74,620.14,536.05,151.44,536.0 Other Annuities Assets Under Management, beginning of period395.0 390.0390.8403.0396.0403.0452.9 Deposits0.5 0.61.00.90.83.04.4 Surrenders, benefits, and product charges(11.9) (10.3)(10.6)(8.9)(12.3)(41.7)(49.2) Net cash flow(11.4) (9.7)(9.6)(8.0)(11.5)(38.7)(44.7) Interest credited and investment performance8.3 14.78.8(4.2)18.527.6(5.2) Assets Under Management, end of period391.9 395.0390.0390.8403.0391.9403.0 Annuities—Total Assets Under Management, beginning of period27,517.1 27,337.627,181.727,035.826,700.927,035.826,650.0 Deposits811.7 692.9800.7856.6922.03,162.13,224.5 Surrenders, benefits, and product charges(787.6) (828.3)(846.1)(806.4)(869.4)(3,268.4)(3,350.5) Net cash flow24.1 (135.4)(45.4)50.252.6(106.4)(126.1) Interest credited and investment performance184.7 314.9201.395.7282.3796.5511.9 Assets Under Management, end of period27,725.9 27,517.127,337.627,181.727,035.827,725.927,035.8 (1) Includes Separate account and Mutual funds.
|

|
Individual Life
Voya Financial Page 36 of 79
Individual Life Operating Earnings
Three MonthsEndedYear-to-Date
(in millions USD) 12/31/2016 9/30/20166/30/20163/31/201612/31/201512/31/201612/31/2015
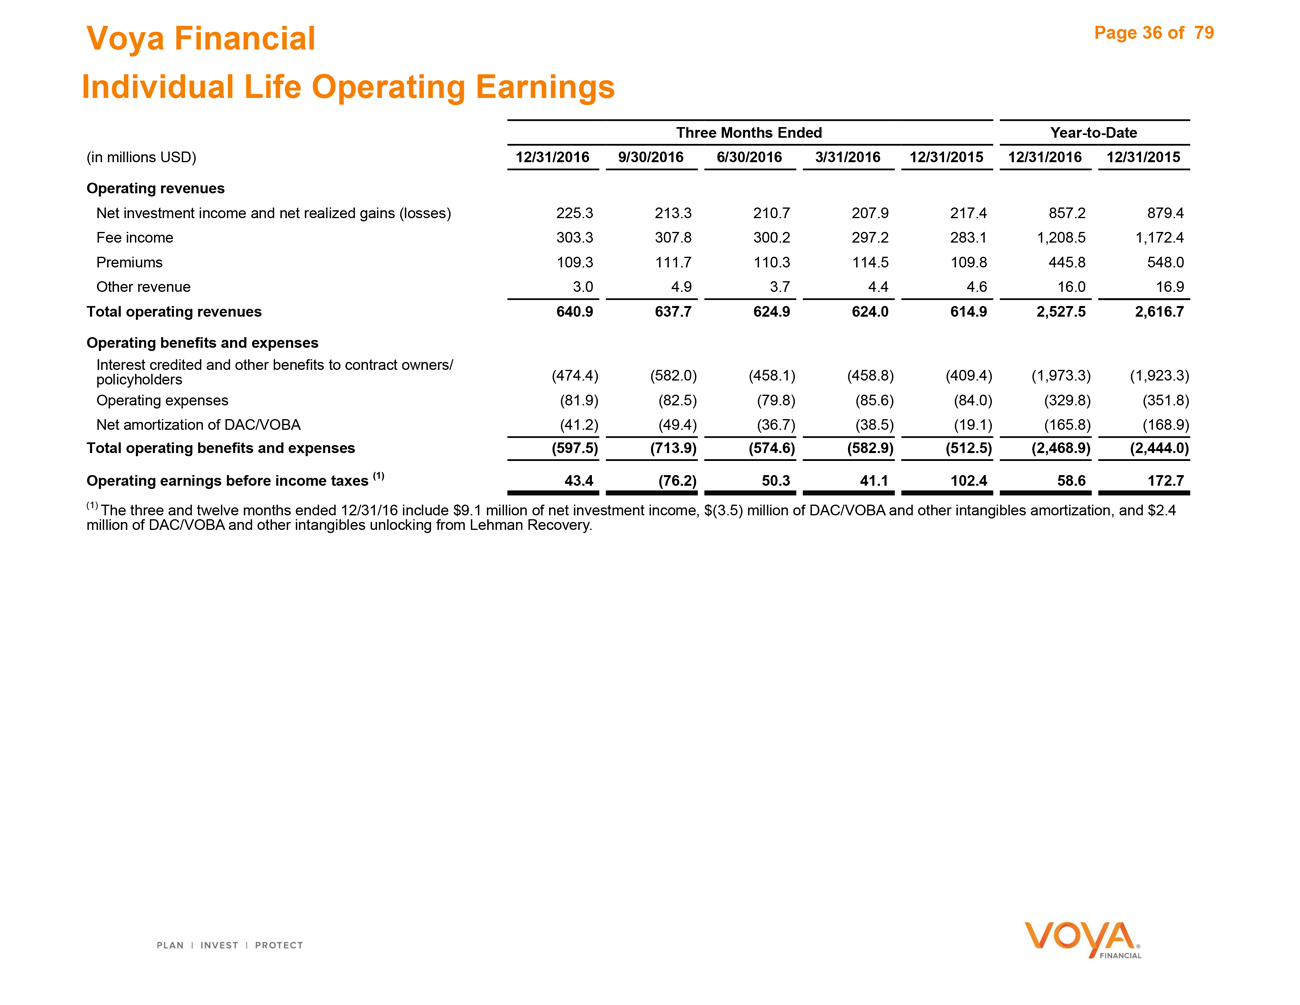
Operating revenues
Net investment income and net realized gains (losses) 225.3 213.3210.7207.9217.4857.2879.4
Fee income 303.3 307.8300.2297.2283.11,208.51,172.4
Premiums 109.3 111.7110.3114.5109.8445.8548.0
Other revenue 3.0 4.93.74.44.616.016.9
Total operating revenues 640.9 637.7624.9624.0614.92,527.52,616.7
Operating benefits and expenses
Interest credited and other benefits to contract owners/
policyholders (474.4) (582.0)(458.1)(458.8)(409.4)(1,973.3)(1,923.3)
Operating expenses (81.9) (82.5)(79.8)(85.6)(84.0)(329.8)(351.8)
Net amortization of DAC/VOBA (41.2) (49.4)(36.7)(38.5)(19.1)(165.8)(168.9)
Total operating benefits and expenses (597.5) (713.9)(574.6)(582.9)(512.5)(2,468.9)(2,444.0)
Operating earnings before income taxes (1) 43.4 (76.2)50.341.1102.458.6172.7
(1) The three and twelve months ended 12/31/16 include $9.1 million of net investment income, $(3.5) million of DAC/VOBA and other intangibles amortization, and $2.4
million of DAC/VOBA and other intangibles unlocking from Lehman Recovery.
|
|
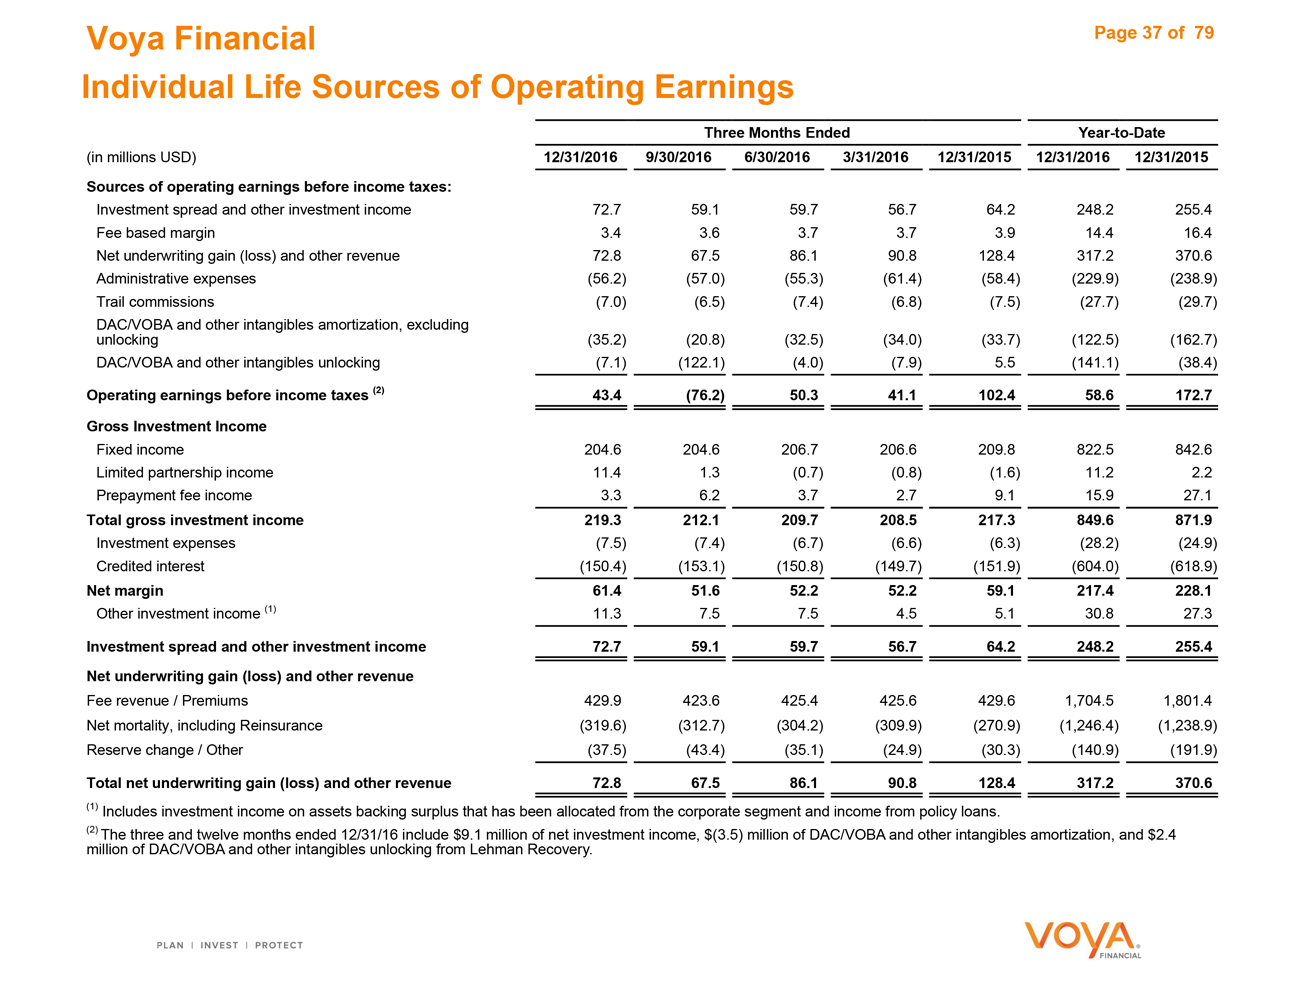
Voya Financial Page 37 of 79 Individual Life Sources of Operating Earnings Three Months EndedYear-to-Date (in millions USD)12/31/2016 9/30/20166/30/20163/31/201612/31/201512/31/201612/31/2015 Sources of operating earnings before income taxes: Investment spread and other investment income72.7 59.159.756.764.2248.2255.4 Fee based margin3.4 3.63.73.73.914.416.4 Net underwriting gain (loss) and other revenue72.8 67.586.190.8128.4317.2370.6 Administrative expenses(56.2) (57.0)(55.3)(61.4)(58.4)(229.9)(238.9) Trail commissions(7.0) (6.5)(7.4)(6.8)(7.5)(27.7)(29.7) DAC/VOBA and other intangibles amortization, excluding unlocking(35.2) (20.8)(32.5)(34.0)(33.7)(122.5)(162.7) DAC/VOBA and other intangibles unlocking(7.1) (122.1)(4.0)(7.9)5.5(141.1)(38.4) Operating earnings before income taxes (2)43.4 (76.2)50.341.1102.458.6172.7 Gross Investment Income Fixed income204.6 204.6206.7206.6209.8822.5842.6 Limited partnership income11.4 1.3(0.7)(0.8)(1.6)11.22.2 Prepayment fee income3.3 6.23.72.79.115.927.1 Total gross investment income219.3 212.1209.7208.5217.3849.6871.9 Investment expenses(7.5) (7.4)(6.7)(6.6)(6.3)(28.2)(24.9) Credited interest(150.4) (153.1)(150.8)(149.7)(151.9)(604.0)(618.9) Net margin61.4 51.652.252.259.1217.4228.1 Other investment income (1)11.3 7.57.54.55.130.827.3 Investment spread and other investment income72.7 59.159.756.764.2248.2255.4 Net underwriting gain (loss) and other revenue Fee revenue / Premiums429.9 423.6425.4425.6429.61,704.51,801.4 Net mortality, including Reinsurance(319.6) (312.7)(304.2)(309.9)(270.9)(1,246.4)(1,238.9) Reserve change / Other(37.5) (43.4)(35.1)(24.9)(30.3)(140.9)(191.9) Total net underwriting gain (loss) and other revenue72.8 67.586.190.8128.4317.2370.6 (1) Includes investment income on assets backing surplus that has been allocated from the corporate segment and income from policy loans. (2) The three and twelve months ended 12/31/16 include $9.1 million of net investment income, $(3.5) million of DAC/VOBA and other intangibles amortization, and $2.4 million of DAC/VOBA and other intangibles unlocking from Lehman Recovery.
|
|
Voya Financial Page 38 of 79
Individual Life Key Metrics
Three MonthsEndedYear-to-Date
(in millions USD) 12/31/2016 9/30/20166/30/20163/31/201612/31/201512/31/201612/31/2015
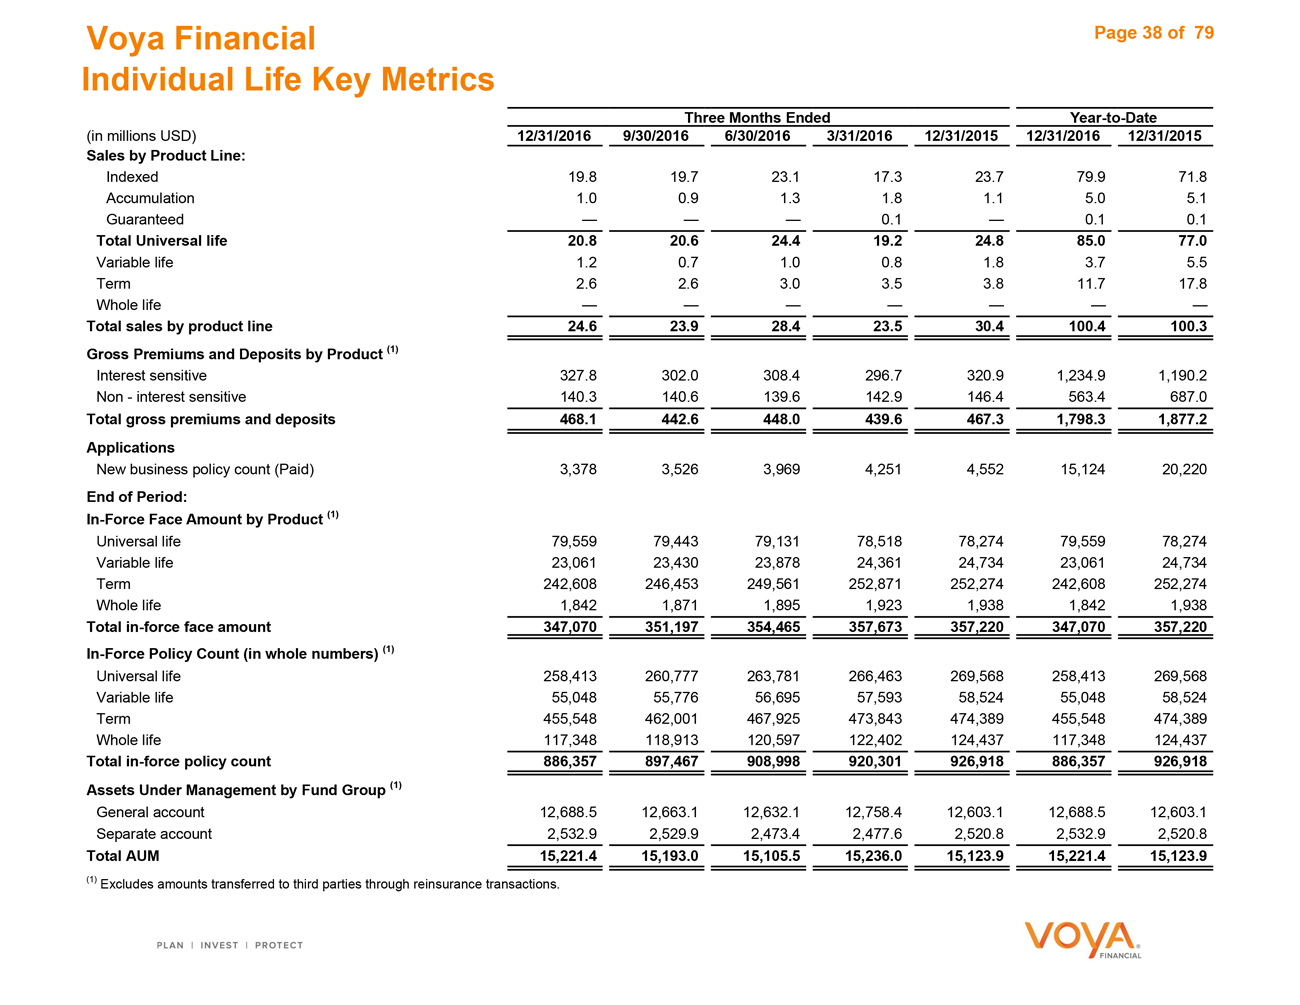
Sales by Product Line:
Indexed 19.8 19.723.117.323.779.971.8
Accumulation 1.0 0.91.31.81.15.05.1
Guaranteed — ——0.1—0.10.1
Total Universal life 20.8 20.624.419.224.885.077.0
Variable life 1.2 0.71.00.81.83.75.5
Term 2.6 2.63.03.53.811.717.8
Whole life — ——————
Total sales by product line 24.6 23.928.423.530.4100.4100.3
Gross Premiums and Deposits by Product (1)
Interest sensitive 327.8 302.0308.4296.7320.91,234.91,190.2
Non—interest sensitive 140.3 140.6139.6142.9146.4563.4687.0
Total gross premiums and deposits 468.1 442.6448.0439.6467.31,798.31,877.2
Applications
New business policy count (Paid) 3,378 3,5263,9694,2514,55215,12420,220
End of Period:
In-Force Face Amount by Product (1)
Universal life 79,559 79,44379,13178,51878,27479,55978,274
Variable life 23,061 23,43023,87824,36124,73423,06124,734
Term 242,608 246,453249,561252,871252,274242,608252,274
Whole life 1,842 1,8711,8951,9231,9381,8421,938
Totalin-force face amount 347,070 351,197354,465357,673357,220347,070357,220
In-Force Policy Count (in whole numbers) (1)
Universal life 258,413 260,777263,781266,463269,568258,413269,568
Variable life 55,048 55,77656,69557,59358,52455,04858,524
Term 455,548 462,001467,925473,843474,389455,548474,389
Whole life 117,348 118,913120,597122,402124,437117,348124,437
Totalin-force policy count 886,357 897,467908,998920,301926,918886,357926,918
Assets Under Management by Fund Group (1)
General account 12,688.5 12,663.112,632.112,758.412,603.112,688.512,603.1
Separate account 2,532.9 2,529.92,473.42,477.62,520.82,532.92,520.8
Total AUM 15,221.4 15,193.015,105.515,236.015,123.915,221.415,123.9
(1) Excludes amounts transferred to third parties through reinsurance transactions.
Employee Benefits
Voya Financial
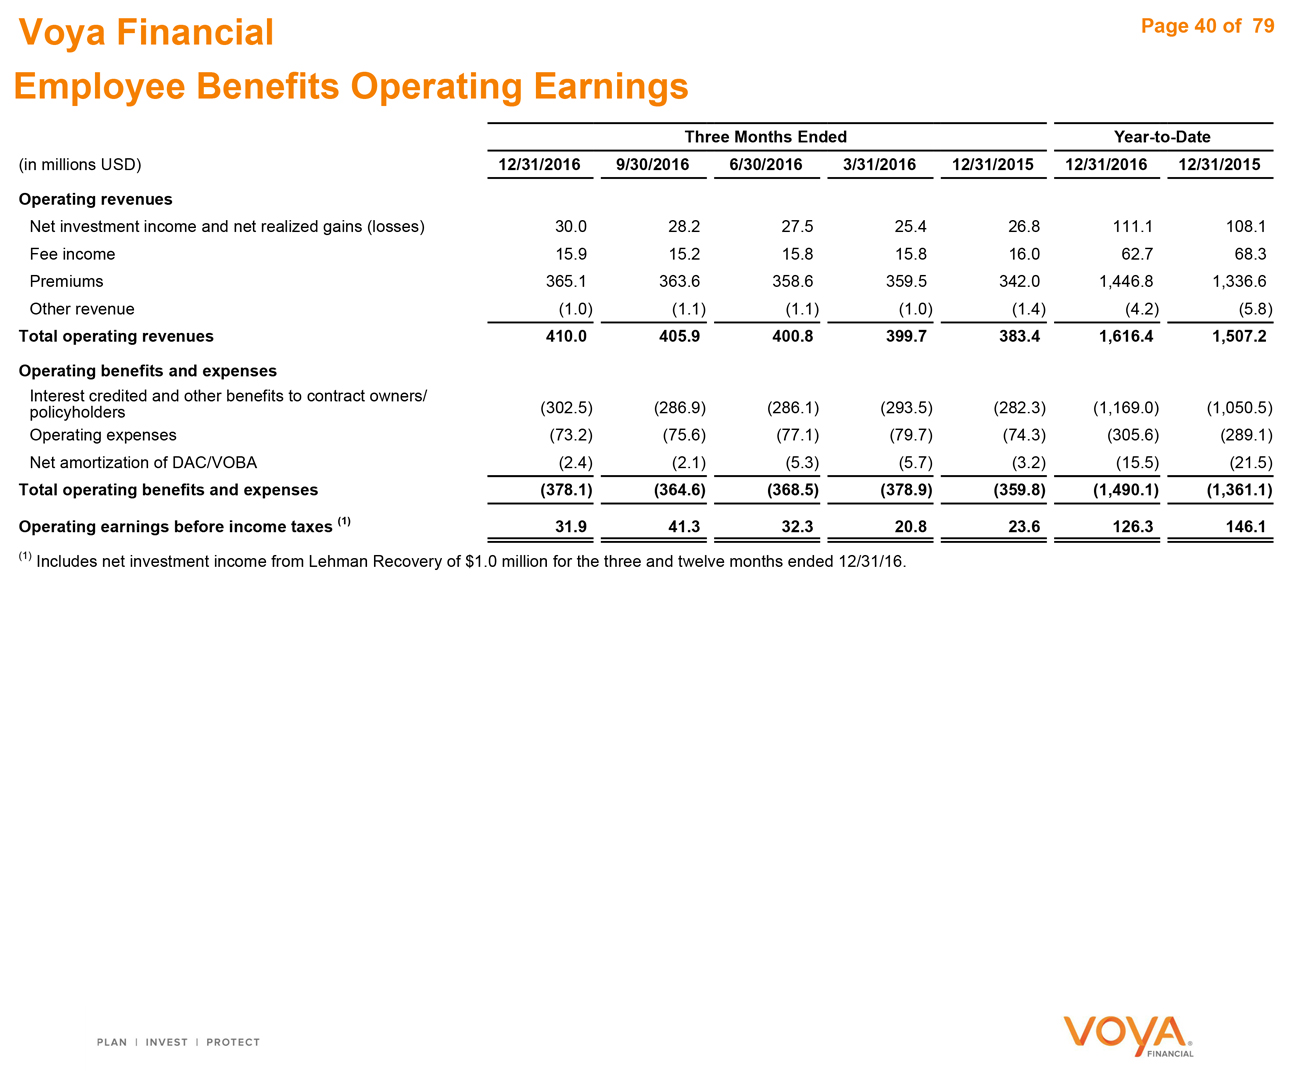
Employee Benefits Operating Earnings
Page 40 of 79
Three Months Ended Year-to-Date
(in millions USD) 12/31/2016 9/30/2016 6/30/2016 3/31/2016 12/31/2015 12/31/2016 12/31/2015
Operating revenues
Net investment income and net realized gains (losses) 30.0 28.2 27.5 25.4 26.8 111.1 108.1
Fee income 15.9 15.2 15.8 15.8 16.0 62.7 68.3
Premiums 365.1 363.6 358.6 359.5 342.0 1,446.8 1,336.6
Other revenue (1.0) (1.1) (1.1) (1.0) (1.4) (4.2) (5.8)
Total operating revenues 410.0 405.9 400.8 399.7 383.4 1,616.4 1,507.2
Operating benefits and expenses
Interest credited and other benefits to contract owners/
policyholders (302.5) (286.9) (286.1) (293.5) (282.3) (1,169.0) (1,050.5)
Operating expenses (73.2) (75.6) (77.1) (79.7) (74.3) (305.6) (289.1)
Net amortization of DAC/VOBA (2.4) (2.1) (5.3) (5.7) (3.2) (15.5) (21.5)
Total operating benefits and expenses (378.1) (364.6) (368.5) (378.9) (359.8) (1,490.1) (1,361.1)
Operating earnings before income taxes (1) 31.9 41.3 32.3 20.8 23.6 126.3 146.1
(1) Includes net investment income from Lehman Recovery of $1.0 million for the three and twelve months ended 12/31/16.
|
|
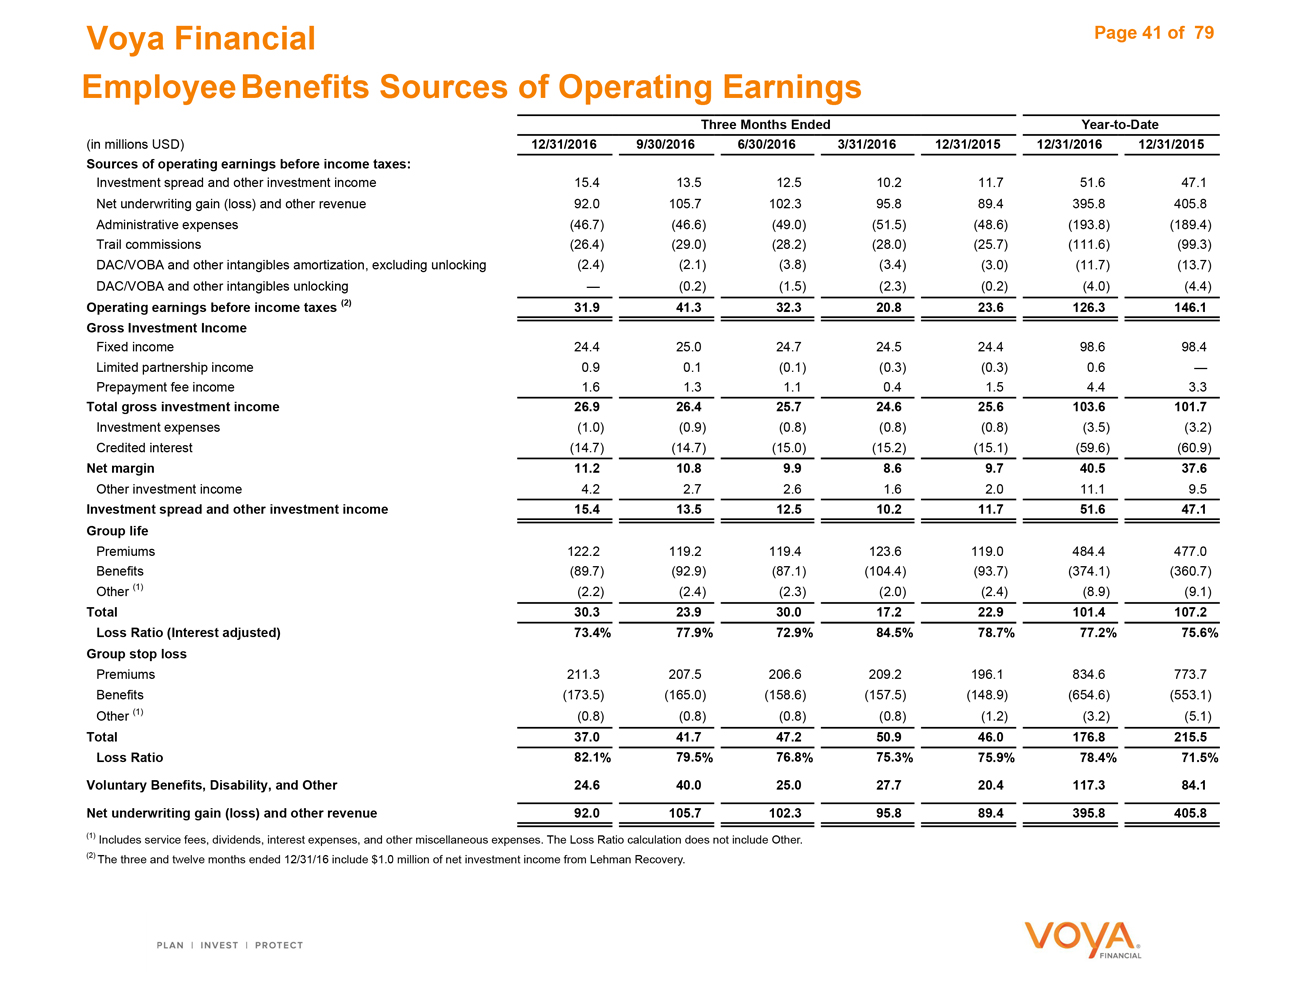
Voya Financial Page 41 of 79 Employee Benefits Sources of Operating Earnings Three Months EndedYear-to-Date (in millions USD)12/31/2016 9/30/20166/30/20163/31/201612/31/201512/31/201612/31/2015 Sources of operating earnings before income taxes: Investment spread and other investment income15.4 13.512.510.211.751.647.1 Net underwriting gain (loss) and other revenue92.0 105.7102.395.889.4395.8405.8 Administrative expenses(46.7) (46.6)(49.0)(51.5)(48.6)(193.8)(189.4) Trail commissions(26.4) (29.0)(28.2)(28.0)(25.7)(111.6)(99.3) DAC/VOBA and other intangibles amortization, excluding unlocking(2.4) (2.1)(3.8)(3.4)(3.0)(11.7)(13.7) DAC/VOBA and other intangibles unlocking— (0.2)(1.5)(2.3)(0.2)(4.0)(4.4) Operating earnings before income taxes (2)31.9 41.332.320.823.6126.3146.1 Gross Investment Income Fixed income24.4 25.024.724.524.498.698.4 Limited partnership income0.9 0.1(0.1)(0.3)(0.3)0.6— Prepayment fee income1.6 1.31.10.41.54.43.3 Total gross investment income26.9 26.425.724.625.6103.6101.7 Investment expenses(1.0) (0.9)(0.8)(0.8)(0.8)(3.5)(3.2) Credited interest(14.7) (14.7)(15.0)(15.2)(15.1)(59.6)(60.9) Net margin11.2 10.89.98.69.740.537.6 Other investment income4.2 2.72.61.62.011.19.5 Investment spread and other investment income15.4 13.512.510.211.751.647.1 Group life Premiums122.2 119.2119.4123.6119.0484.4477.0 Benefits(89.7) (92.9)(87.1)(104.4)(93.7)(374.1)(360.7) Other (1)(2.2) (2.4)(2.3)(2.0)(2.4)(8.9)(9.1) Total30.3 23.930.017.222.9101.4107.2 Loss Ratio (Interest adjusted)73.4% 77.9%72.9%84.5%78.7%77.2%75.6% Group stop loss Premiums211.3 207.5206.6209.2196.1834.6773.7 Benefits(173.5) (165.0)(158.6)(157.5)(148.9)(654.6)(553.1) Other (1)(0.8) (0.8)(0.8)(0.8)(1.2)(3.2)(5.1) Total37.0 41.747.250.946.0176.8215.5 Loss Ratio82.1% 79.5%76.8%75.3%75.9%78.4%71.5% Voluntary Benefits, Disability, and Other24.6 40.025.027.720.4117.384.1 Net underwriting gain (loss) and other revenue92.0 105.7102.395.889.4395.8405.8 (1) Includes service fees, dividends, interest expenses, and other miscellaneous expenses. The Loss Ratio calculation does not include Other. (2) The three and twelve months ended 12/31/16 include $1.0 million of net investment income from Lehman Recovery.
|
|
Voya Financial Page 42 of 79
Employee Benefits Key Metrics
Three MonthsEndedYear-to-Date
(in millions USD) 12/31/2016 9/30/20166/30/20163/31/201612/31/201512/31/201612/31/2015
Sales by Product Line:
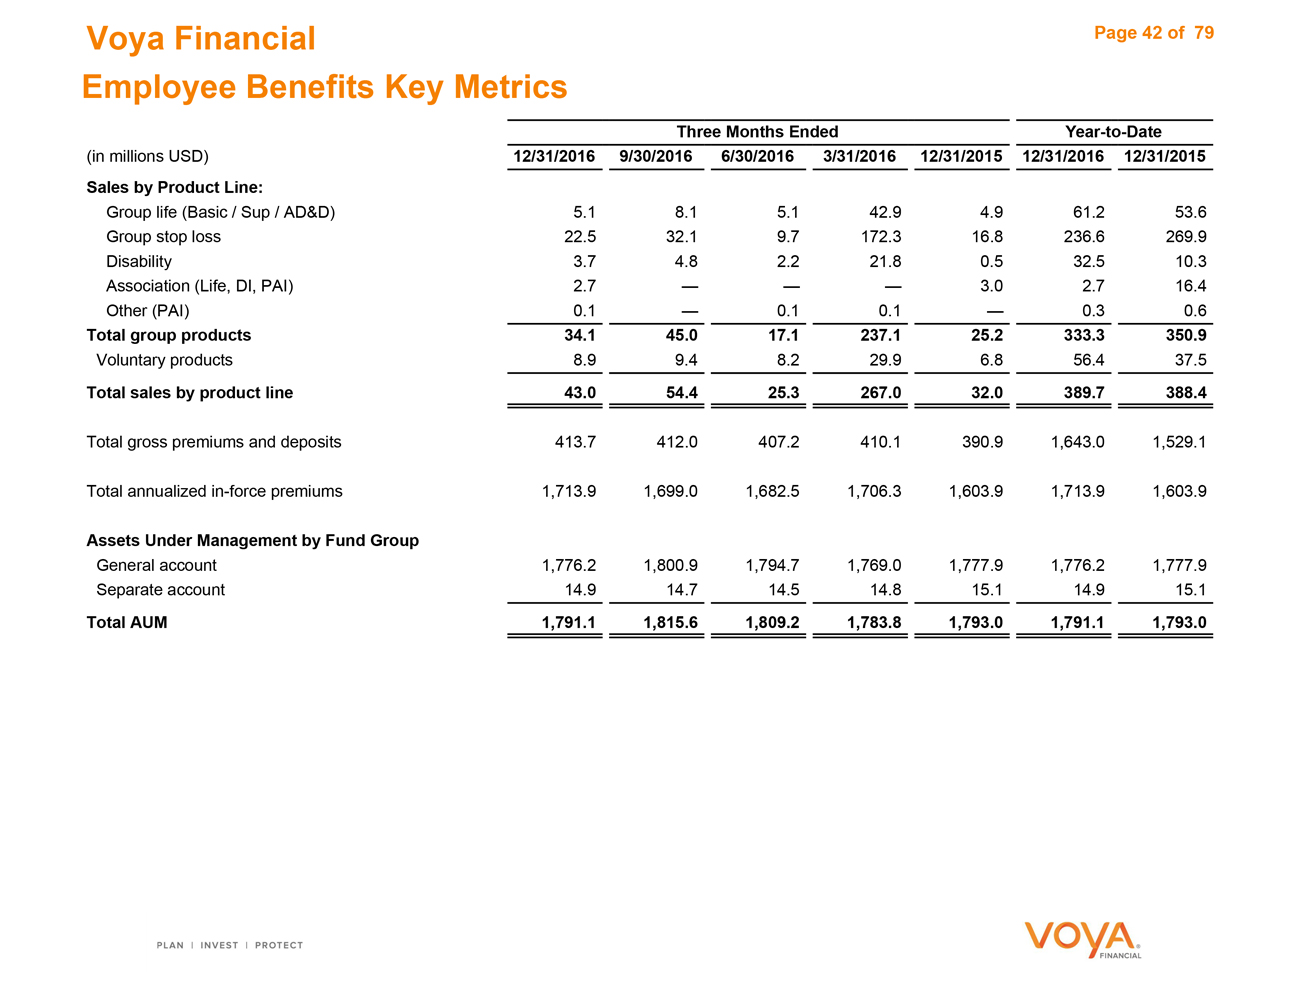
Group life (Basic / Sup / AD&D) 5.1 8.15.142.94.961.253.6
Group stop loss 22.5 32.19.7172.316.8236.6269.9
Disability 3.7 4.82.221.80.532.510.3
Association (Life, DI, PAI) 2.7 ———3.02.716.4
Other (PAI) 0.1 —0.10.1—0.30.6
Total group products 34.1 45.017.1237.125.2333.3350.9
Voluntary products 8.9 9.48.229.96.856.437.5
Total sales by product line 43.0 54.425.3267.032.0389.7388.4
Total gross premiums and deposits �� 413.7 412.0407.2410.1390.91,643.01,529.1
Total annualizedin-force premiums 1,713.9 1,699.01,682.51,706.31,603.91,713.91,603.9
Assets Under Management by Fund Group
General account 1,776.2 1,800.91,794.71,769.01,777.91,776.21,777.9
Separate account 14.9 14.714.514.815.114.915.1
Total AUM 1,791.1 1,815.61,809.21,783.81,793.01,791.11,793.0
Corporate
Voya Financial Page 44 of 79
Corporate Operating Earnings
Three MonthsEndedYear-to-Date
(in millions USD) 12/31/2016 9/30/20166/30/20163/31/201612/31/201512/31/201612/31/2015
Interest expense (47.5) (47.6)(49.0)(48.7)(48.5)(192.8)(194.5)
Amortization of intangibles (8.9) (8.9)(9.1)(9.1)(9.1)(36.0)(36.6)
Strategic investment program (1) (23.9) (28.9)(31.3)(33.3)(34.7)(117.4)(79.5)
Other (23.1) 1.0(3.0)21.912.2(3.2)73.8
Operating earnings before income taxes (2) (103.4) (84.4)(92.4)(69.2)(80.1)(349.4)(236.8)
(1) On June 2, 2015, we announced that we would undertake a strategic investment program over the next four years as it relates to IT simplification, digital and analytics,
and cross-enterprise initiatives.
(2) Includes net investment income from Lehman Recovery / LIHTC of $0.3 million for the twelve months ended 12/31/2016 and $1.6 million for the twelve months ended
12/31/2015.
Closed Block Variable Annuity
Voya Financial
Closed Block Variable Annuity Income (Loss) Before Income Taxes
Page 46 of 79
Three Months Ended Year-to-Date
(in millions USD) 12/31/2016 9/30/2016 6/30/2016 3/31/2016 12/31/2015 12/31/2016 12/31/2015
Revenues
Net investment income 76.8 72.0 69.1 67.6 64.4 285.5 231.1
Fee income 244.8 252.4 249.1 245.6 264.2 991.9 1,118.3
Premiums 316.0 166.6 97.2 107.2 80.3 687.0 416.2
Net realized gains (losses) (428.5) (219.8) (54.4) 31.0 (537.7) (671.7) (188.1)
Other revenues and premiums 0.4 0.5 1.0 1.6 1.4 3.5 7.0
Total revenues 209.5 271.7 362.0 453.0 (127.4) 1,296.2 1,584.5
Benefits and expenses
Interest credited and other benefits to contract owners/
policyholders (740.1) (497.9) (193.7) (296.8) (72.7) (1,728.5) (1,275.9)
Operating expenses and interest expense (97.6) (98.0) (98.4) (98.6) (104.8) (392.6) (431.5)
Net amortization of DAC/VOBA (101.3) (3.8) (13.4) (11.6) (12.4) (130.1) (50.4)
Total benefits and expenses (939.0) (599.7) (305.5) (407.0) (189.9) (2,251.2) (1,757.8)
Income (loss) before income taxes (729.5) (328.0) 56.5 46.0 (317.3) (955.0) (173.3)
The following table presents notable items that result in
volatility in income (loss) before income taxes:
Net gains (losses) related to incurred guaranteed
benefits and Variable Annuity Hedge Program,
excluding nonperformance risk (1) (152.9) (400.6) (364.4) (583.8) (361.2) (1,501.7) (1,114.8)
Gain (loss) due to nonperformance risk (1) (443.7) (123.3) 221.2 421.2 (156.8) 75.4 71.9
Net investment gains (losses) (1) — 2.5 3.3 13.7 (13.5) 19.5 (15.1)
DAC/VOBA and other intangibles unlocking and loss
recognition (2) (109.7) 9.4 (2.2) (0.5) (0.1) (103.0) 1.7
(1) Excludes net amortization of DAC/VOBA and other intangibles.
(2) During the periods ended December 31, 2016, we recorded loss recognition in our CBVA segment of $321.0 million before income taxes, of which $103.8 million is included in DAC/VOBA and other intangibles unlocking.
|
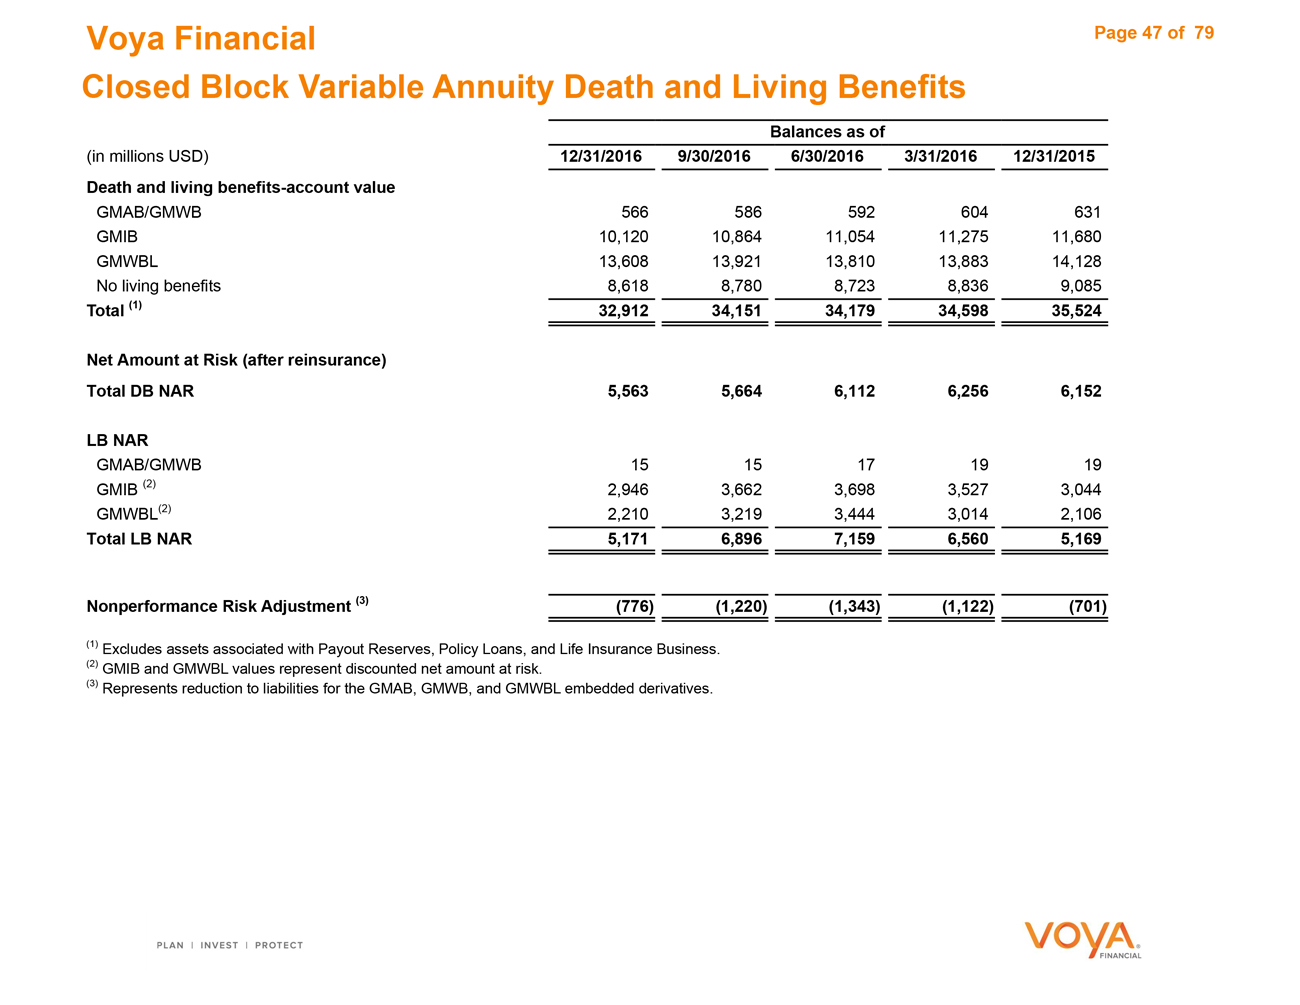
|
Voya Financial Page 47 of79 Closed Block Variable Annuity Death and Living Benefits Balances as of (in millions USD)12/31/2016 9/30/20166/30/20163/31/201612/31/2015 Death and living benefits-account value GMAB/GMWB566 586592604631 GMIB10,120 10,86411,05411,27511,680 GMWBL13,608 13,92113,81013,88314,128 No living benefits8,618 8,7808,7238,8369,085 Total (1)32,912 34,15134,17934,59835,524 Net Amount at Risk (after reinsurance) Total DB NAR5,563 5,6646,1126,2566,152 LB NAR GMAB/GMWB15 15171919 GMIB (2)2,946 3,6623,6983,5273,044 GMWBL(2)2,210 3,2193,4443,0142,106 Total LB NAR5,171 6,8967,1596,5605,169 Nonperformance Risk Adjustment (3)(776) (1,220)(1,343)(1,122)(701) (1) Excludes assets associated with Payout Reserves, Policy Loans, and Life Insurance Business. (2) GMIB and GMWBL values represent discounted net amount at risk. (3) Represents reduction to liabilities for the GMAB, GMWB, and GMWBL embedded derivatives.
|
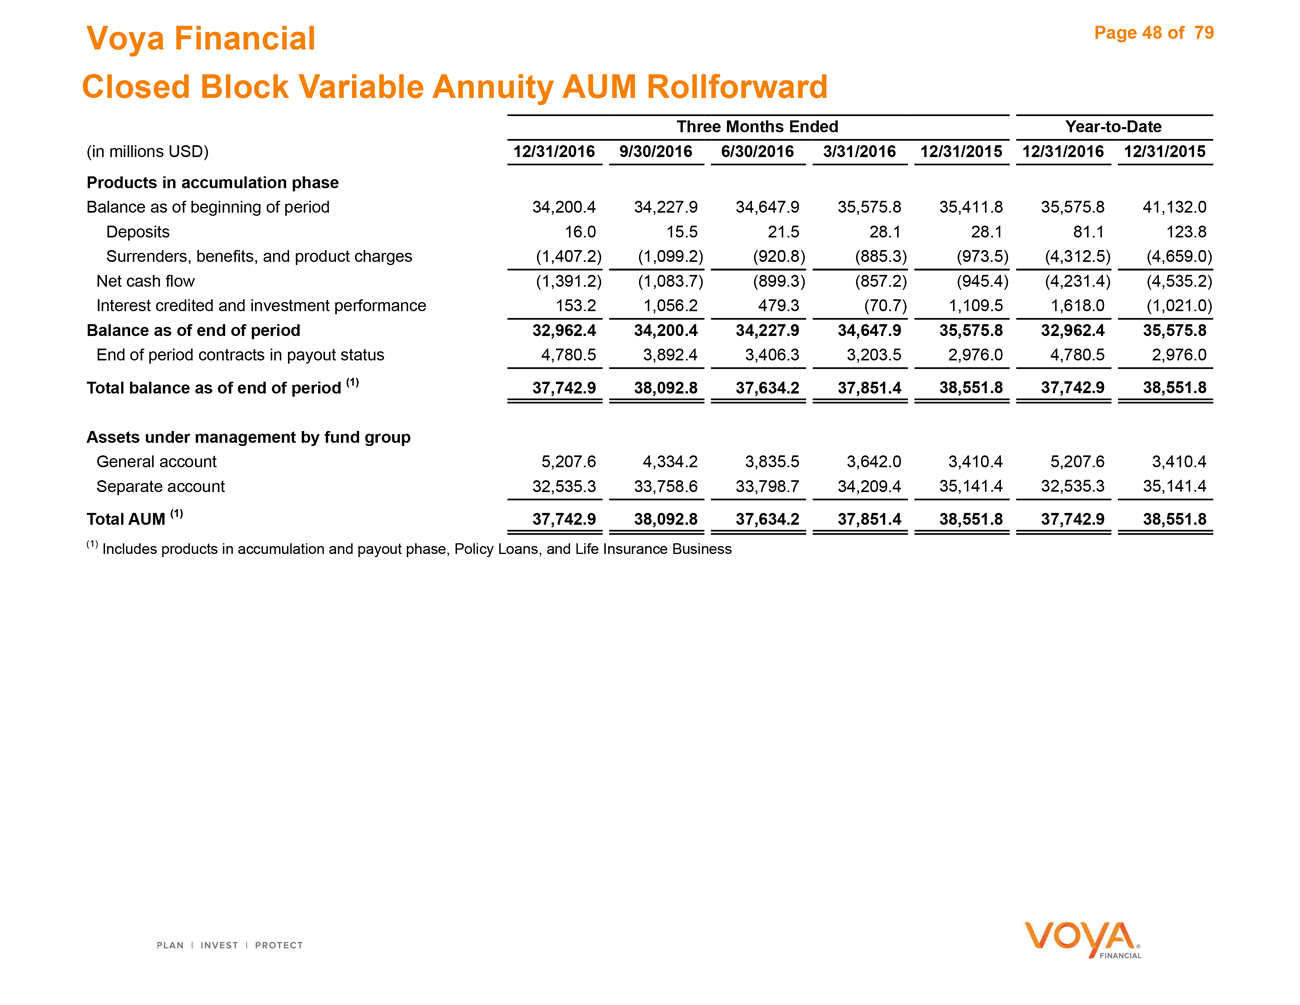
|
Voya Financial Page 48 of 79 Closed Block Variable Annuity AUM Rollforward Three Months EndedYear-to-Date (in millions USD)12/31/2016 9/30/20166/30/20163/31/201612/31/201512/31/201612/31/2015 Products in accumulation phase Balance as of beginning of period34,200.4 34,227.934,647.935,575.835,411.835,575.841,132.0 Deposits16.0 15.521.528.128.181.1123.8 Surrenders, benefits, and product charges(1,407.2) (1,099.2)(920.8)(885.3)(973.5)(4,312.5)(4,659.0) Net cash flow(1,391.2) (1,083.7)(899.3)(857.2)(945.4)(4,231.4)(4,535.2) Interest credited and investment performance153.2 1,056.2479.3(70.7)1,109.51,618.0(1,021.0) Balance as of end of period32,962.4 34,200.434,227.934,647.935,575.832,962.435,575.8 End of period contracts in payout status4,780.5 3,892.43,406.33,203.52,976.04,780.52,976.0 Total balance as of end of period (1)37,742.9 38,092.837,634.237,851.438,551.837,742.938,551.8 Assets under management by fund group General account5,207.6 4,334.23,835.53,642.03,410.45,207.63,410.4 Separate account32,535.3 33,758.633,798.734,209.435,141.432,535.335,141.4 Total AUM (1)37,742.9 38,092.837,634.237,851.438,551.837,742.938,551.8 (1) Includes products in accumulation and payout phase, Policy Loans, and Life Insurance Business
|

|
Investment Information
|

|
Voya Financial Page 50 of 79 Portfolio Composition Balances as of (in millions USD)12/31/2016 9/30/20166/30/20163/31/201612/31/2015 Composition of Investment PortfolioAmount % of TotalAmount% of TotalAmount% of TotalAmount% of TotalAmount% of Total Fixed maturities, available for sale, at fair value, after consolidation69,468.7 75.0%72,644.174.6%71,015.574.2%69,248.874.4%67,733.476.5% Fixed maturities, at fair value using the fair value option3,712.3 4.0%3,903.54.0%3,985.34.2%3,778.14.1%3,226.63.6% Equity securities, available for sale, before consolidation274.2 N/M396.5N/M391.6N/M380.3N/M421.6N/M VOE Adjustments— N/M(111.2)N/M(115.5)N/M(109.6)N/M(89.9)N/M Equity securities, available for sale, at fair value274.2 0.3%285.30.3%276.10.3%270.70.3%331.70.4% Short-term investments821.0 0.9%1,346.81.4%1,280.21.3%1,360.21.5%1,496.71.7% Mortgage loans on real estate11,725.2 12.7%11,475.711.8%11,209.411.7%11,065.911.8%10,447.511.8% Policy loans1,961.5 2.1%1,995.62.0%1,998.52.1%2,009.42.2%2,002.72.3% Limited partnerships/corporations, before consolidation1,235.4 N/M1,191.1N/M1,110.9N/M1,098.6N/M1,233.4N/M CLO/VOEs Adjustments (1)(476.8) N/M(492.3)N/M(477.3)N/M(538.5)N/M(632.9)N/M Limited partnerships/corporations, after consolidation758.6 0.8%698.80.7%633.60.7%560.10.6%510.60.6% Derivatives1,712.4 1.8%2,731.42.8%2,948.63.1%2,484.22.7%1,538.51.7% Other investments47.4 0.1%77.70.1%89.70.1%89.90.1%91.60.1% Securities pledged to creditors2,157.1 2.3%2,193.52.3%2,202.32.3%2,120.42.3%1,112.61.3% Total investments, after consolidation92,638.4 100.0%97,352.4100.0%95,639.2100.0%92,987.7100.0%88,491.9100.0% Fixed Maturity Securities—Security Sector (2) U.S. Government agencies and authorities4,188.3 5.5%4,191.95.3%4,378.95.7%4,420.65.9%4,001.65.6% U.S. Corporate—Public33,691.7 44.7%35,601.345.2%35,495.745.9%34,744.846.1%33,616.046.6% U.S. Corporate—Private7,808.0 10.4%7,684.99.8%7,181.29.3%6,688.88.9%6,641.19.2% Foreign Government / Agency1,023.8 1.4%1,043.11.3%1,019.31.3%988.01.3%922.21.3% Foreign Corporate—Public7,055.6 9.4%7,378.79.4%7,170.09.3%7,191.29.6%7,101.49.8% Foreign Corporate—Private7,785.8 10.3%7,907.310.1%7,701.210.0%7,669.110.2%7,348.610.2% State, municipalities and political subdivisions2,135.6 2.8%2,126.12.7%1,906.02.5%1,558.92.1%1,346.21.9% Residential mortgaged-backed securities: CMO-B Agency3,247.2 4.3%3,489.64.4%3,535.94.6%3,471.84.6%3,233.44.5% CMO-B Non-Agency729.5 1.0%769.81.0%708.40.9%582.20.8%322.30.4% Agency2,321.6 3.1%2,669.03.4%2,368.83.1%1,927.02.6%1,682.22.3% Non-Agency (3)786.0 1.0%952.71.2%930.81.2%988.51.3%1,062.21.5% Total Residential mortgage-backed securities7,084.3 9.4%7,881.110.0%7,543.99.8%6,969.59.3%6,300.18.7% Commercial mortgage-backed securities3,358.9 4.5%4,023.95.1%4,077.85.3%4,191.05.6%4,092.65.7% Other asset-backed securities (3)1,206.1 1.6%902.81.1%729.10.9%725.41.0%702.81.0% Total fixed maturities, including securities pledged (5)75,338.1 100.0%78,741.1100.0%77,203.1100.0%75,147.3100.0%72,072.6100.0% Fixed Maturity Securities—Contractual Maturity Dates Due to mature: Due in one year or less2,513.7 3.3%2,168.62.8%1,931.52.5%1,688.82.2%1,353.21.9% Due after one year through five years13,845.2 18.4%14,325.318.2%14,572.618.9%14,403.219.2%13,843.219.2% Due after five years through ten years19,303.8 25.6%20,135.425.6%19,955.825.8%20,388.027.1%20,511.728.5% Due after ten years28,026.1 37.2%29,304.037.2%28,392.436.8%26,781.435.6%25,269.035.0% CMO-B3,976.7 5.3%4,259.45.4%4,244.35.5%4,054.05.4%3,555.74.9% Mortgage-backed securities6,466.5 8.6%7,645.69.7%7,377.49.6%7,106.59.6%6,837.09.5% Other asset-backed securities (3)1,206.1 1.6%902.81.1%729.10.9%725.41.0%702.81.0% Total fixed maturities, including securities pledged (5)75,338.1 100.0%78,741.1100.0%77,203.1100.0%75,147.3100.0%72,072.6100.0% Fixed Maturity Securities—NAIC Quality Designation 144,387.7 58.9%46,271.258.8%45,460.358.9%43,843.358.3%41,315.457.3% 227,469.2 36.5%28,679.036.4%28,111.136.4%27,784.337.0%27,553.938.2% 32,699.1 3.6%2,914.13.7%2,730.63.5%2,630.03.5%2,571.73.6% 4501.5 0.7%594.60.7%616.50.8%613.60.8%421.00.6% 5101.5 0.1%68.80.1%78.60.1%81.20.1%44.00.1% 6179.1 0.2%213.40.3%206.00.3%194.90.3%166.60.2% Total fixed maturities, including securities pledged (4) (5)75,338.1 100.0%78,741.1100.0%77,203.1100.0%75,147.3100.0%72,072.6100.0% Fixed Maturity Securities—ARO Quality Rating AAA14,394.8 19.1%14,961.319.0%14,677.019.0%14,499.519.3%13,201.218.3% AA5,359.4 7.1%5,726.47.3%5,338.06.9%4,667.36.2%4,722.76.6% A22,902.4 30.4%23,705.530.1%23,527.430.5%22,839.430.4%21,514.329.9% BBB27,926.5 37.1%29,210.937.1%28,589.937.0%28,128.137.4%28,013.638.8% BB2,880.1 3.8%3,099.03.9%3,180.94.1%3,078.94.1%2,897.44.0% B and below1,874.9 2.5%2,038.02.6%1,889.92.5%1,934.12.6%1,723.42.4% Total fixed maturities, including securities pledged (5)75,338.1 100.0%78,741.1100.0%77,203.1100.0%75,147.3100.0%72,072.6100.0% (1) Adjustments include the elimination of intercompany transactions between the Company and its consolidated investment entities, primarily the elimination of the Company’s equity at risk recorded as investments by the Company (before consolidation) against either equity (private equity and real estate partnership funds) or senior and subordinated debt (CLOs) of the funds. (2) Fixed Maturity Securities includes fixed maturities,available for sale , fixed maturities at fair value using the fair value option and securities pledged to creditors. (3) Subprime asset-backed securities are included as a component of Non-Agency RMBS under this presentation. (4) ARO ratings do not directly translate into NAIC ratings. (5) Includes fixed maturities securities related to businesses exited through reinsurance where assets are retained on the Company’s balance sheet. Refer to the page in “Additional Information” section. Voya Financial
|
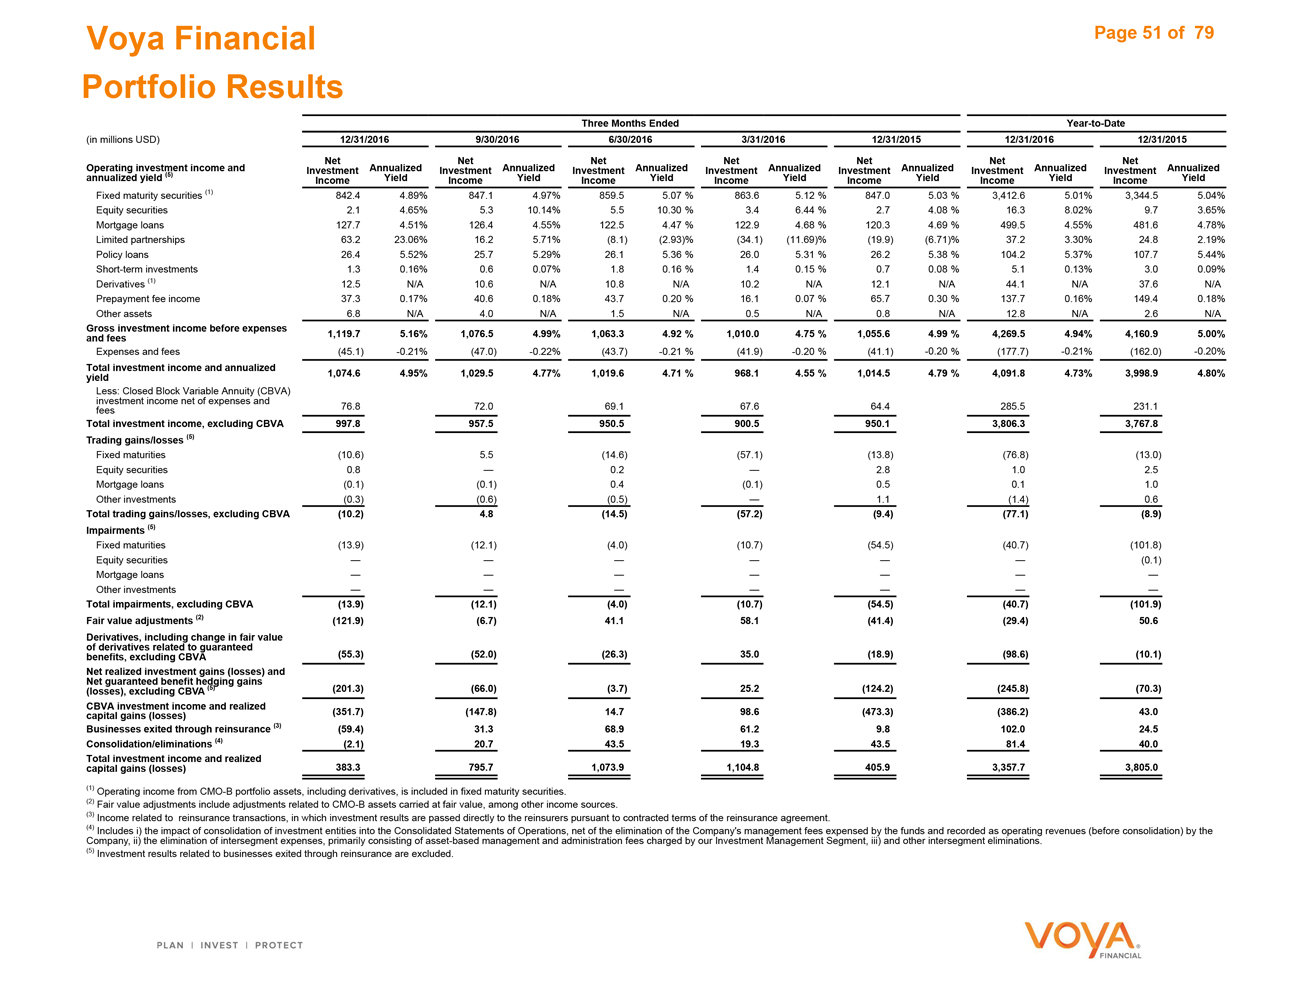
|
Page 51 of 79 Portfolio Results Three Months Ended Year-to-Date (in millions USD) 12/31/2016 9/30/2016 6/30/2016 3/31/2016 12/31/2015 12/31/2016 12/31/2015 Net Net Net Net Net Net Net Operating investment income and Investment Annualized Investment Annualized Investment Annualized Investment Annualized Investment Annualized Investment Annualized Investment Annualized annualized yield (5) Income Yield Income Yield Income Yield Income Yield Income Yield Fixed maturity securities (1) 842.4 4.89% 847.1 4.97% 859.5 5.07 % 863.6 5.12 % 847.0 5.03 % 3,412.6 5.01% 3,344.5 5.04% Equity securities 2.1 4.65% 5.3 10.14% 5.5 10.30 % 3.4 6.44 % 2.7 4.08 % 16.3 8.02% 9.7 3.65% Mortgage loans 127.7 4.51% 126.4 4.55% 122.5 4.47 % 122.9 4.68 % 120.3 4.69 % 499.5 4.55% 481.6 4.78% Limited partnerships 63.2 23.06% 16.2 5.71% (8.1) (2.93)% (34.1) (11.69)% (19.9) (6.71)% 37.2 3.30% 24.8 2.19% Policy loans 26.4 5.52% 25.7 5.29% 26.1 5.36 % 26.0 5.31 % 26.2 5.38 % 104.2 5.37% 107.7 5.44% Short-term investments 1.3 0.16% 0.6 0.07% 1.8 0.16 % 1.4 0.15 % 0.7 0.08 % 5.1 0.13% 3.0 0.09% Derivatives (1) 12.5 N/A 10.6 N/A 10.8 N/A 10.2 N/A 12.1 N/A 44.1 N/A 37.6 N/A Prepayment fee income 37.3 0.17% 40.6 0.18% 43.7 0.20 % 16.1 0.07 % 65.7 0.30 % 137.7 0.16% 149.4 0.18% Other assets 6.8 N/A 4.0 N/A 1.5 N/A 0.5 N/A 0.8 N/A 12.8 N/A 2.6 N/A Gross investment income before expenses and fees 1,119.7 5.16% 1,076.5 4.99% 1,063.3 4.92 % 1,010.0 4.75 % 1,055.6 4.99 % 4,269.5 4.94% 4,160.9 5.00% Expenses and fees (45.1) -0.21% (47.0) -0.22% (43.7) -0.21 % (41.9) -0.20 % (41.1) -0.20 % (177.7) -0.21% (162.0) -0.20% Total investment income and annualized yield 1,074.6 4.95% 1,029.5 4.77% 1,019.6 4.71 % 968.1 4.55 % 1,014.5 4.79 % 4,091.8 4.73% 3,998.9 4.80% Less: Closed Block Variable Annuity (CBVA) investment income net of expenses and fees 76.8 72.0 69.1 67.6 64.4 285.5 231.1 Total investment income, excluding CBVA 997.8 957.5 950.5 900.5 950.1 3,806.3 3,767.8 Trading gains/losses (5) Fixed maturities (10.6) 5.5 (14.6) (57.1) (13.8) (76.8) (13.0) Equity securities 0.8 —— 0.2 —— 2.8 1.0 2.5 Mortgage loans (0.1) (0.1) 0.4 (0.1) 0.5 0.1 1.0 Other investments (0.3) (0.6) (0.5) —— 1.1 (1.4) 0.6 Total trading gains/losses, excluding CBVA (10.2) 4.8 (14.5) (57.2) (9.4) (77.1) (8.9) Impairments (5) Fixed maturities (13.9) (12.1) (4.0) (10.7) (54.5) (40.7) (101.8) Equity securities —— —— —— —— —— —— (0.1) Mortgage loans —— —— —— —— —— —— —— Other investments —— —— —— —— —— —— —— Total impairments, excluding CBVA (13.9) (12.1) (4.0) (10.7) (54.5) (40.7) (101.9) Fair value adjustments (2) (121.9) (6.7) 41.1 58.1 (41.4) (29.4) 50.6 Derivatives, including change in fair value of derivatives related to guaranteed benefits, excluding CBVA (55.3) (52.0) (26.3) 35.0 (18.9) (98.6) (10.1) Net realized investment gains (losses) and Net guaranteed benefit hedging gains (losses), excluding CBVA (5) (201.3) (66.0) (3.7) 25.2 (124.2) (245.8) (70.3) CBVA investment income and realized capital gains (losses) (351.7) (147.8) 14.7 98.6 (473.3) (386.2) 43.0 Businesses exited through reinsurance (3) (59.4) 31.3 68.9 61.2 9.8 102.0 24.5 Consolidation/eliminations (4) (2.1) 20.7 43.5 19.3 43.5 81.4 40.0 Total investment income and realized capital gains (losses) 383.3 795.7 1,073.9 1,104.8 405.9 3,357.7 3,805.0 (1) Operating income from CMO-B portfolio assets, including derivatives, is included in fixed maturity securities. (2) Fair value adjustments include adjustments related to CMO-B assets carried at fair value, among other income sources. (3) Income related to reinsurance transactions, in which investment results are passed directly to the reinsurers pursuant to contracted terms of the reinsurance agreement. (4) Includes i) the impact of consolidation of investment entities into the Consolidated Statements of Operations, net of the elimination of the Company’s management fees expensed by the funds and recorded as operating revenues (before consolidation) by the Company, ii) the elimination of intersegment expenses, primarily consisting of asset-based management and administration fees charged by our Investment Management Segment, iii) and other intersegment eliminations. (5) Investment results related to businesses exited through reinsurance are excluded.
|
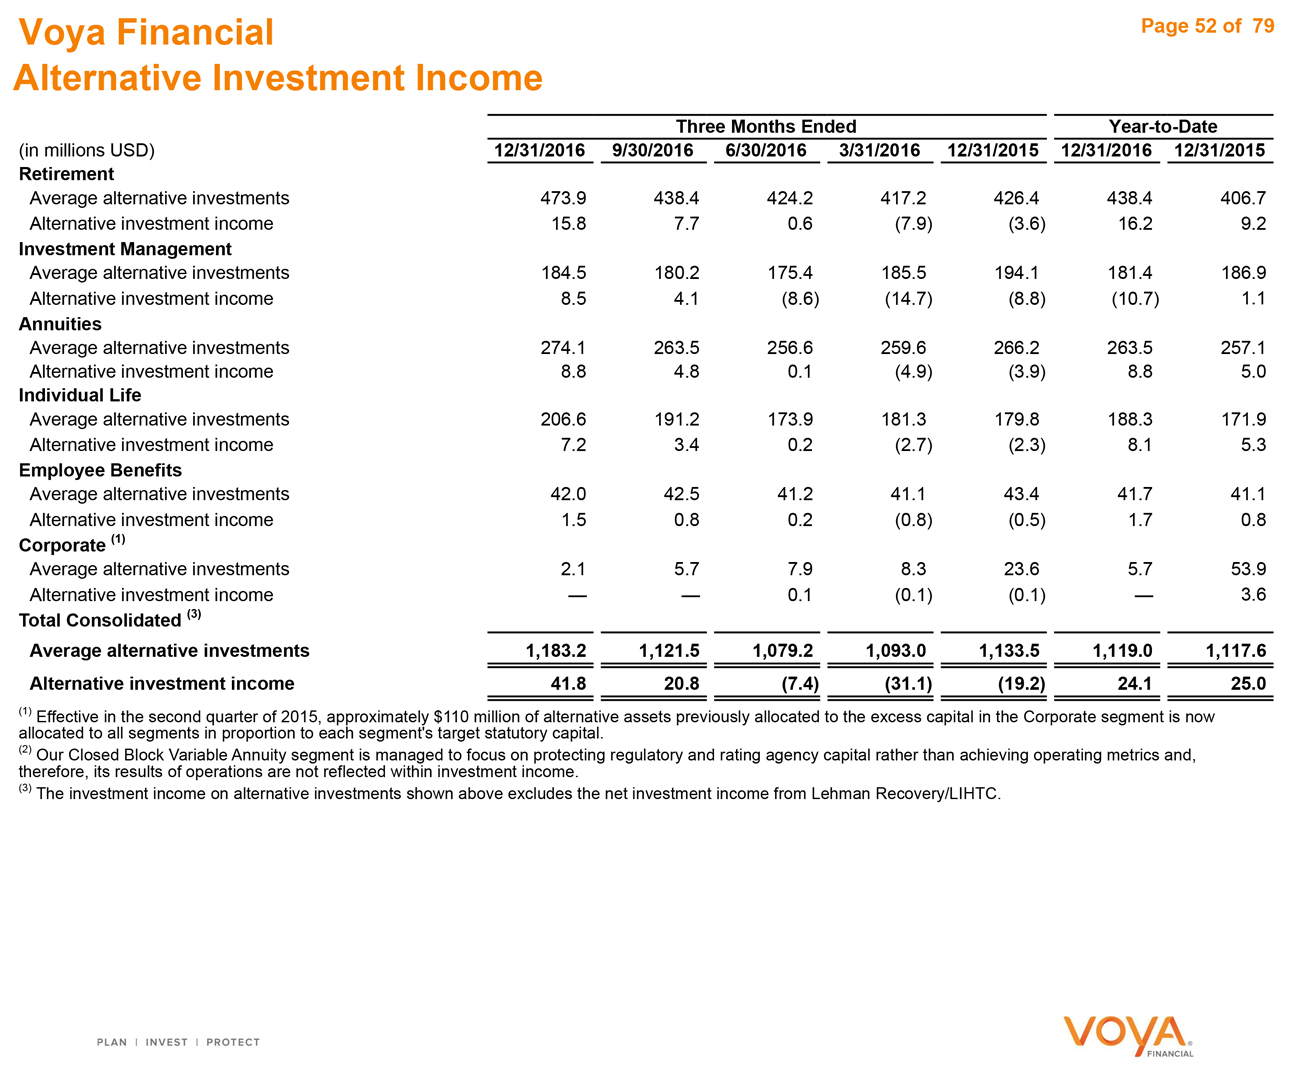
|
Voya Financial
Alternative Investment Income
Page 52 of 79
Three Months Ended Year-to-Date
(in millions USD) 12/31/2016 9/30/2016 6/30/2016 3/31/2016 12/31/2015 12/31/2016 12/31/2015
Retirement
Average alternative investments 473.9 438.4 424.2 417.2 426.4 438.4 406.7
Alternative investment income 15.8 7.7 0.6 (7.9) (3.6) 16.2 9.2
Investment Management
Average alternative investments 184.5 180.2 175.4 185.5 194.1 181.4 186.9
Alternative investment income 8.5 4.1 (8.6) (14.7) (8.8) (10.7) 1.1
Annuities
Average alternative investments 274.1 263.5 256.6 259.6 266.2 263.5 257.1
Alternative investment income 8.8 4.8 0.1 (4.9) (3.9) 8.8 5.0
Individual Life
Average alternative investments 206.6 191.2 173.9 181.3 179.8 188.3 171.9
Alternative investment income 7.2 3.4 0.2 (2.7) (2.3) 8.1 5.3
Employee Benefits
Average alternative investments 42.0 42.5 41.2 41.1 43.4 41.7 41.1
Alternative investment income 1.5 0.8 0.2 (0.8) (0.5) 1.7 0.8
Corporate (1)
Average alternative investments 2.1 5.7 7.9 8.3 23.6 5.7 53.9
Alternative investment income — — 0.1 (0.1) (0.1) — 3.6
Total Consolidated (3)
Average alternative investments 1,183.2 1,121.5 1,079.2 1,093.0 1,133.5 1,119.0 1,117.6
Alternative investment income 41.8 20.8 (7.4) (31.1) (19.2) 24.1 25.0
(1) Effective in the second quarter of 2015, approximately $110 million of alternative assets previously allocated to the excess capital in the Corporate segment is now allocated to all segments in proportion to each segment’s target statutory capital.
(2) Our Closed Block Variable Annuity segment is managed to focus on protecting regulatory and rating agency capital rather than achieving operating metrics and, therefore, its results of operations are not reflected within investment income.
(3) The investment income on alternative investments shown above excludes the net investment income from Lehman Recovery/LIHTC.
|
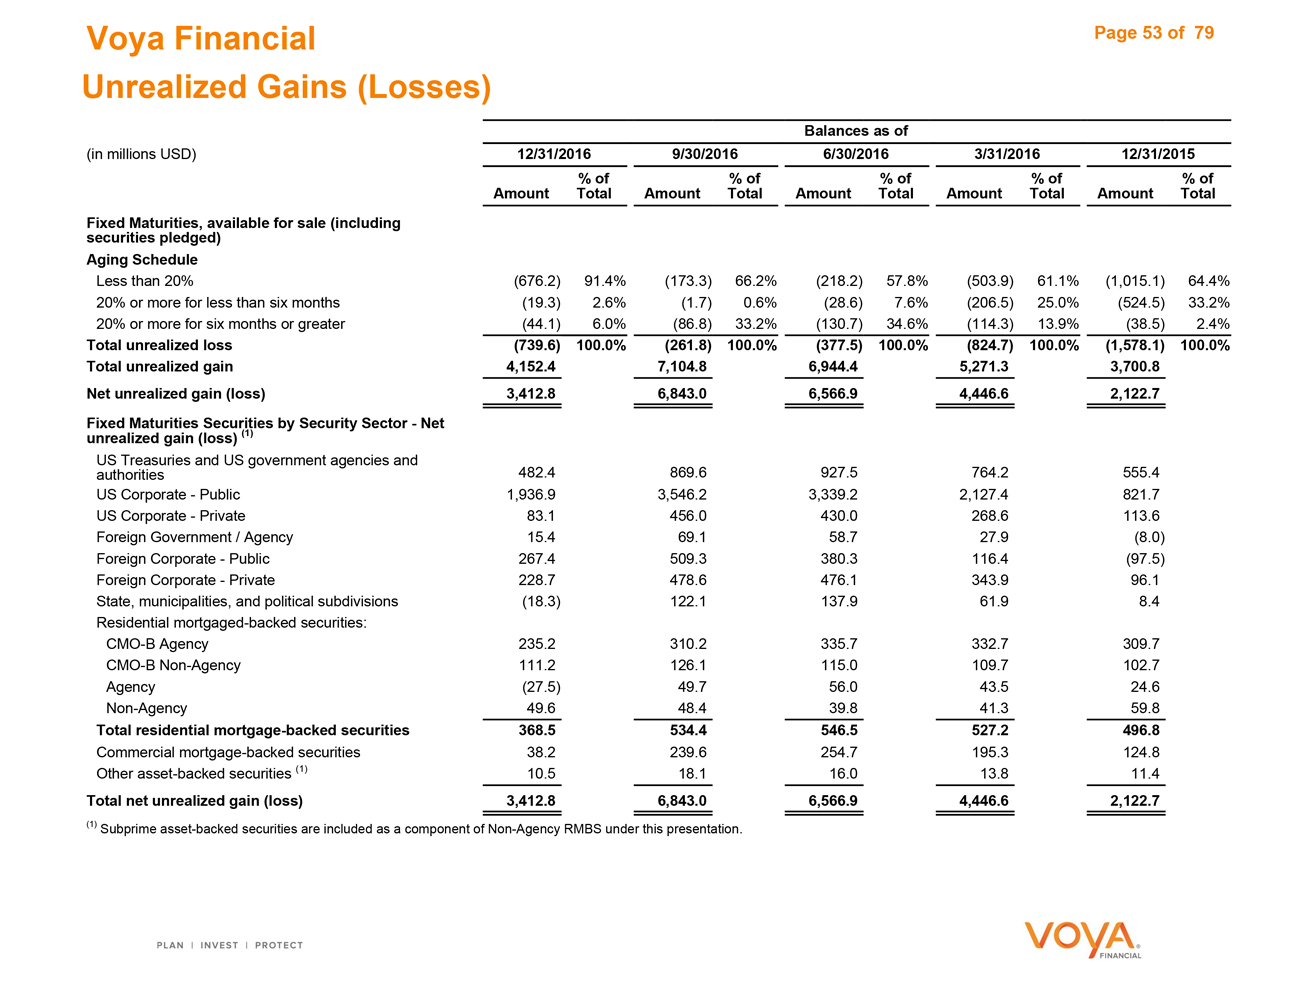
|
Voya Financial Page 53 of 79 Unrealized Gains (Losses) Balances as of (in millions USD)12/31/2016 9/30/20166/30/20163/31/201612/31/2015 % of% of% of% of% of AmountTotalAmountTotalAmountTotalAmountTotalAmountTotal Fixed Maturities, available for sale (including securities pledged) Aging Schedule Less than 20%(676.2) 91.4%(173.3)66.2%(218.2)57.8%(503.9)61.1%(1,015.1)64.4% 20% or more for less than six months(19.3) 2.6%(1.7)0.6%(28.6)7.6%(206.5)25.0%(524.5)33.2% 20% or more for six months or greater(44.1) 6.0%(86.8)33.2%(130.7)34.6%(114.3)13.9%(38.5)2.4% Total unrealized loss(739.6) 100.0%(261.8)100.0%(377.5)100.0%(824.7)100.0%(1,578.1)100.0% Total unrealized gain4,152.4 7,104.86,944.45,271.33,700.8 Net unrealized gain (loss)3,412.8 6,843.06,566.94,446.62,122.7 Fixed Maturities Securities by Security Sector—Net unrealized gain (loss) (1) US Treasuries and US government agencies and authorities482.4 869.6927.5764.2555.4 US Corporate—Public1,936.9 3,546.23,339.22,127.4821.7 US Corporate—Private83.1 456.0430.0268.6113.6 Foreign Government / Agency15.4 69.158.727.9(8.0) Foreign Corporate—Public267.4 509.3380.3116.4(97.5) Foreign Corporate—Private228.7 478.6476.1343.996.1 State, municipalities, and political subdivisions(18.3) 122.1137.961.98.4 Residential mortgaged-backed securities: CMO-B Agency235.2 310.2335.7332.7309.7 CMO-B Non-Agency111.2 126.1115.0109.7102.7 Agency(27.5) 49.756.043.524.6 Non-Agency49.6 48.439.841.359.8 Total residential mortgage-backed securities368.5 534.4546.5527.2496.8 Commercial mortgage-backed securities38.2 239.6254.7195.3124.8 Other asset-backed securities (1)10.5 18.116.013.811.4 Total net unrealized gain (loss)3,412.8 6,843.06,566.94,446.62,122.7 (1) Subprime asset-backed securities are included as a component of Non-Agency RMBS under this presentation.
|
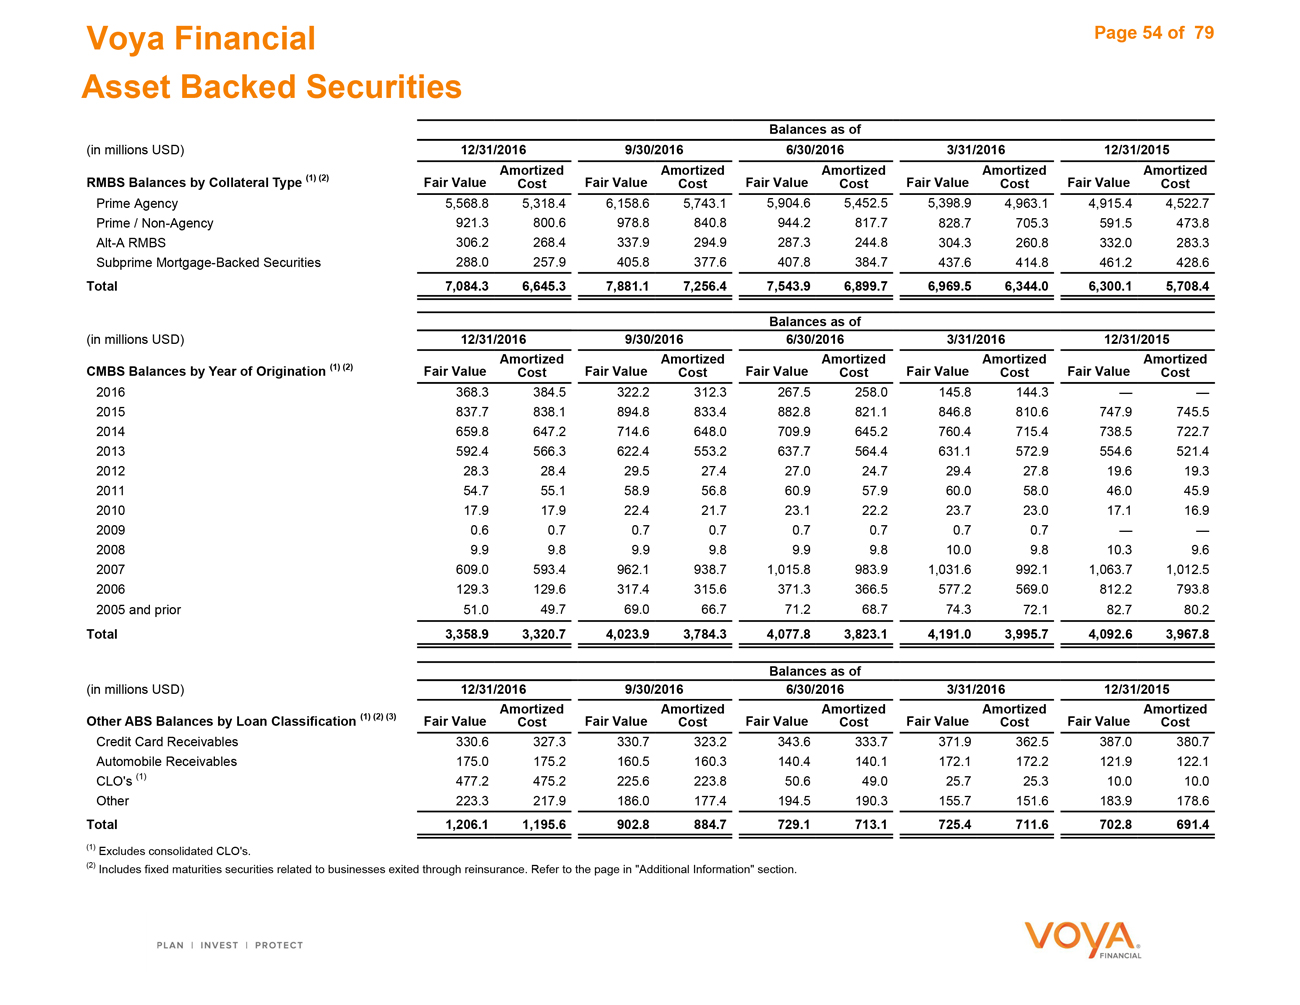
|
Voya Financial Page 54 of 79 Asset Backed Securities Balances as of (in millions USD)12/31/2016 9/30/20166/30/20163/31/201612/31/2015 AmortizedAmortizedAmortizedAmortizedAmortized RMBS Balances by Collateral Type (1) (2)Fair Value CostFair ValueCostFair ValueCostFair ValueCostFair ValueCost Prime Agency5,568.8 5,318.46,158.65,743.15,904.65,452.55,398.94,963.14,915.44,522.7 Prime / Non-Agency921.3 800.6978.8840.8944.2817.7828.7705.3591.5473.8 Alt-A RMBS306.2 268.4337.9294.9287.3244.8304.3260.8332.0283.3 Subprime Mortgage-Backed Securities288.0 257.9405.8377.6407.8384.7437.6414.8461.2428.6 Total7,084.3 6,645.37,881.17,256.47,543.96,899.76,969.56,344.06,300.15,708.4 Balances as of (in millions USD)12/31/2016 9/30/20166/30/20163/31/201612/31/2015 AmortizedAmortizedAmortizedAmortizedAmortized CMBS Balances by Year of Origination (1) (2)Fair Value CostFair ValueCostFair ValueCostFair ValueCostFair ValueCost 2016368.3 384.5322.2312.3267.5258.0145.8144.3—— 2015837.7 838.1894.8833.4882.8821.1846.8810.6747.9745.5 2014659.8 647.2714.6648.0709.9645.2760.4715.4738.5722.7 2013592.4 566.3622.4553.2637.7564.4631.1572.9554.6521.4 201228.3 28.429.527.427.024.729.427.819.619.3 201154.7 55.158.956.860.957.960.058.046.045.9 201017.9 17.922.421.723.122.223.723.017.116.9 20090.6 0.70.70.70.70.70.70.7—— 20089.9 9.89.99.89.99.810.09.810.39.6 2007609.0 593.4962.1938.71,015.8983.91,031.6992.11,063.71,012.5 2006129.3 129.6317.4315.6371.3366.5577.2569.0812.2793.8 2005 and prior51.0 49.769.066.771.268.774.372.182.780.2 Total3,358.9 3,320.74,023.93,784.34,077.83,823.14,191.03,995.74,092.63,967.8 Balances as of (in millions USD)12/31/2016 9/30/20166/30/20163/31/201612/31/2015 AmortizedAmortizedAmortizedAmortizedAmortized Other ABS Balances by Loan Classification (1) (2) (3)Fair Value CostFair ValueCostFair ValueCostFair ValueCostFair ValueCost Credit Card Receivables330.6 327.3330.7323.2343.6333.7371.9362.5387.0380.7 Automobile Receivables175.0 175.2160.5160.3140.4140.1172.1172.2121.9122.1 CLO’s (1)477.2 475.2225.6223.850.649.025.725.310.010.0 Other223.3 217.9186.0177.4194.5190.3155.7151.6183.9178.6 Total1,206.1 1,195.6902.8884.7729.1713.1725.4711.6702.8691.4 (1) Excludes consolidated CLO’s. (2) Includes fixed maturities securities related to businesses exited through reinsurance. Refer to the page in “Additional Information” section.
|
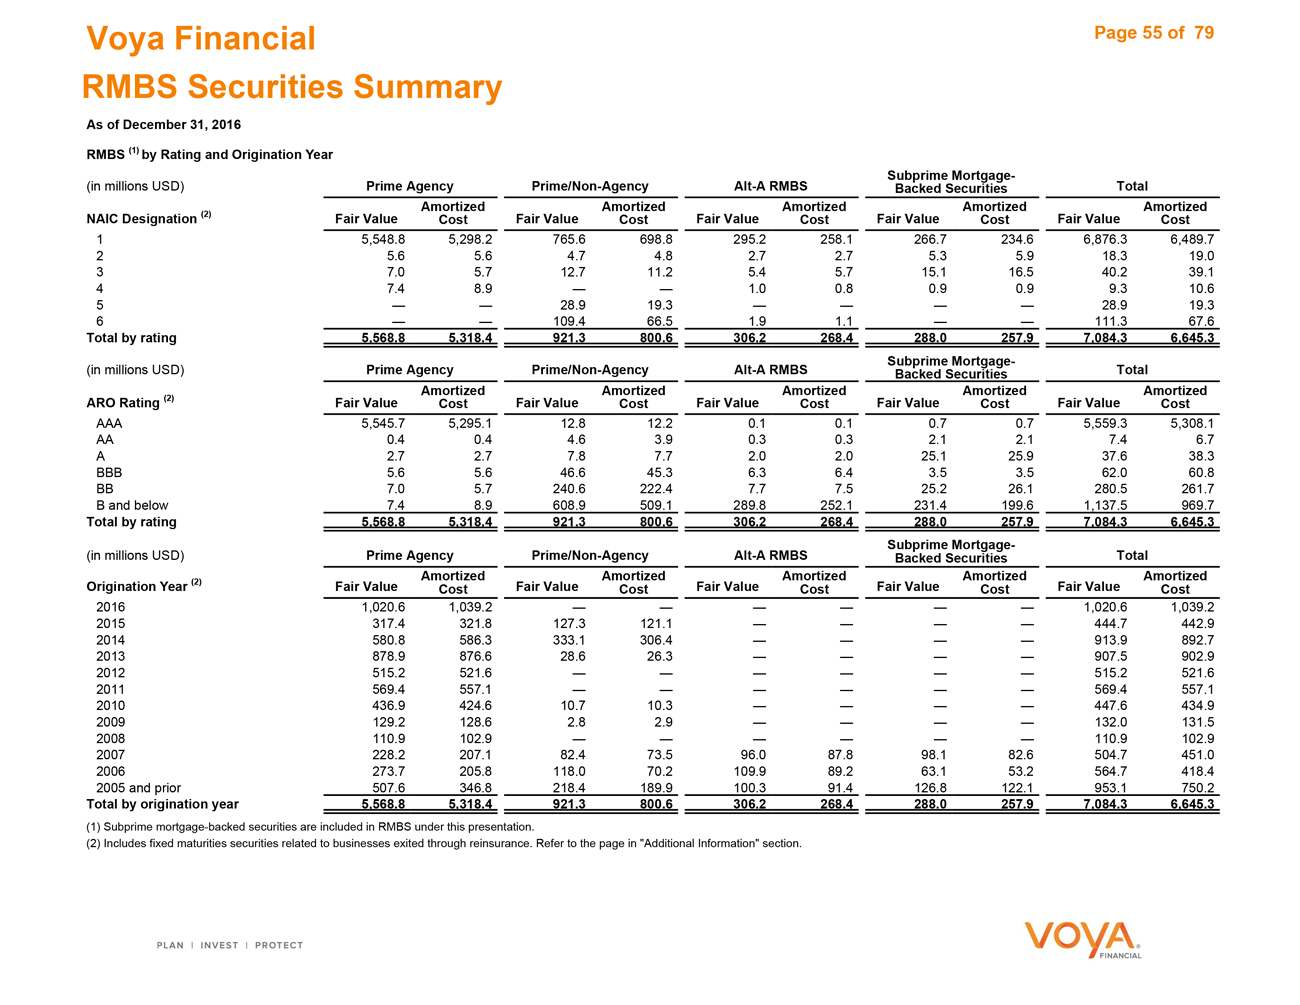
|
Voya Financial Page 55 of 79 RMBS Securities Summary As of December 31, 2016 RMBS (1) by Rating and Origination Year Subprime Mortgage- (in millions USD)Prime Agency Prime/Non-AgencyAlt-A RMBSBacked SecuritiesTotal AmortizedAmortizedAmortizedAmortizedAmortized NAIC Designation (2)Fair Value CostFair ValueCostFair ValueCostFair ValueCostFair ValueCost 15,548.8 5,298.2765.6698.8295.2258.1266.7234.66,876.36,489.7 25.6 5.64.74.82.72.75.35.918.319.0 37.0 5.712.711.25.45.715.116.540.239.1 47.4 8.9——1.00.80.90.99.310.6 5— —28.919.3————28.919.3 6— —109.466.51.91.1——111.367.6 Total by rating5,568.8 5,318.4921.3800.6306.2268.4288.0257.97,084.36,645.3 Subprime Mortgage- (in millions USD)Prime Agency Prime/Non-AgencyAlt-A RMBSBacked SecuritiesTotal AmortizedAmortizedAmortizedAmortizedAmortized ARO Rating (2)Fair Value CostFair ValueCostFair ValueCostFair ValueCostFair ValueCost AAA5,545.7 5,295.112.812.20.10.10.70.75,559.35,308.1 AA0.4 0.44.63.90.30.32.12.17.46.7 A2.7 2.77.87.72.02.025.125.937.638.3 BBB5.6 5.646.645.36.36.43.53.562.060.8 BB7.0 5.7240.6222.47.77.525.226.1280.5261.7 B and below7.4 8.9608.9509.1289.8252.1231.4199.61,137.5969.7 Total by rating5,568.8 5,318.4921.3800.6306.2268.4288.0257.97,084.36,645.3 Subprime Mortgage- (in millions USD)Prime Agency Prime/Non-AgencyAlt-A RMBSBacked SecuritiesTotal AmortizedAmortizedAmortizedAmortizedAmortized Origination Year (2)Fair Value CostFair ValueCostFair ValueCostFair ValueCostFair ValueCost 20161,020.6 1,039.2——————1,020.61,039.2 2015317.4 321.8127.3121.1————444.7442.9 2014580.8 586.3333.1306.4————913.9892.7 2013878.9 876.628.626.3————907.5902.9 2012515.2 521.6——————515.2521.6 2011569.4 557.1——————569.4557.1 2010436.9 424.610.710.3————447.6434.9 2009129.2 128.62.82.9————132.0131.5 2008110.9 102.9——————110.9102.9 2007228.2 207.182.473.596.087.898.182.6504.7451.0 2006273.7 205.8118.070.2109.989.263.153.2564.7418.4 2005 and prior507.6 346.8218.4189.9100.391.4126.8122.1953.1750.2 Total by origination year5,568.8 5,318.4921.3800.6306.2268.4288.0257.97,084.36,645.3 (1) Subprime mortgage-backed securities are included in RMBS under this presentation. (2) Includes fixed maturities securities related to businesses exited through reinsurance. Refer to the page in “Additional Information” section.
|
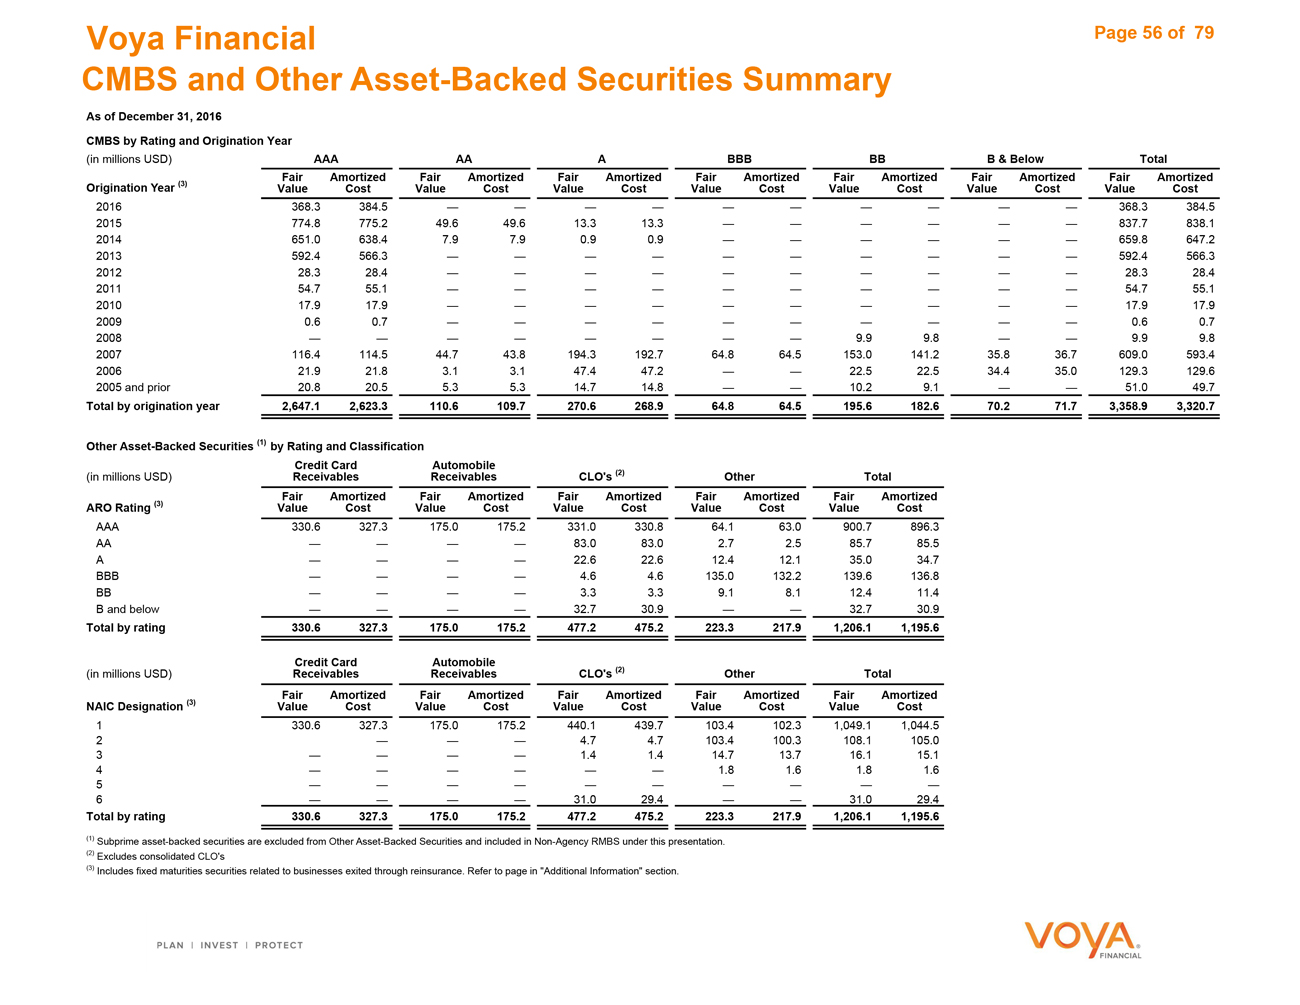
|
Voya Financial Page 56 of 79 CMBS and Other Asset-Backed Securities Summary As of December 31, 2016 CMBS by Rating and Origination Year (in millions USD)AAA AAABBBBBB & BelowTotal FairAmortizedFairAmortizedFairAmortizedFairAmortizedFairAmortizedFairAmortizedFairAmortized Origination Year (3)Value CostValueCostValueCostValueCostValueCostValueCostValueCost 2016368.3 384.5——————————368.3384.5 2015774.8 775.249.649.613.313.3——————837.7838.1 2014651.0 638.47.97.90.90.9——————659.8647.2 2013592.4 566.3——————————592.4566.3 201228.3 28.4——————————28.328.4 201154.7 55.1——————————54.755.1 201017.9 17.9——————————17.917.9 20090.6 0.7——————————0.60.7 2008— ———————9.99.8——9.99.8 2007116.4 114.544.743.8194.3192.764.864.5153.0141.235.836.7609.0593.4 200621.9 21.83.13.147.447.2——22.522.534.435.0129.3129.6 2005 and prior20.8 20.55.35.314.714.8——10.29.1——51.049.7 Total by origination year2,647.1 2,623.3110.6109.7270.6268.964.864.5195.6182.670.271.73,358.93,320.7 Other Asset-Backed Securities (1) by Rating and Classification Credit CardAutomobile (in millions USD)Receivables ReceivablesCLO’s (2)OtherTotal FairAmortizedFairAmortizedFairAmortizedFairAmortizedFairAmortized ARO Rating (3)Value CostValueCostValueCostValueCostValueCost AAA330.6 327.3175.0175.2331.0330.864.163.0900.7896.3 AA— ———83.083.02.72.585.785.5 A— ———22.622.612.412.135.034.7 BBB— ———4.64.6135.0132.2139.6136.8 BB— ———3.33.39.18.112.411.4 B and below— ———32.730.9——32.730.9 Total by rating330.6 327.3175.0175.2477.2475.2223.3217.91,206.11,195.6 Credit CardAutomobile (in millions USD)Receivables ReceivablesCLO’s (2)OtherTotal FairAmortizedFairAmortizedFairAmortizedFairAmortizedFairAmortized NAIC Designation (3)Value CostValueCostValueCostValueCostValueCost 1330.6 327.3175.0175.2440.1439.7103.4102.31,049.11,044.5 2 ———4.74.7103.4100.3108.1105.0 3— ———1.41.414.713.716.115.1 4— —————1.81.61.81.6 5— ————————— 6— ———31.029.4——31.029.4 Total by rating330.6 327.3175.0175.2477.2475.2223.3217.91,206.11,195.6 (1) Subprime asset-backed securities are excluded from Other Asset-Backed Securities and included in Non-Agency RMBS under this presentation. (2) Excludes consolidated CLO’s (3) Includes fixed maturities securities related to businesses exited through reinsurance. Refer to page in “Additional Information” section.
|
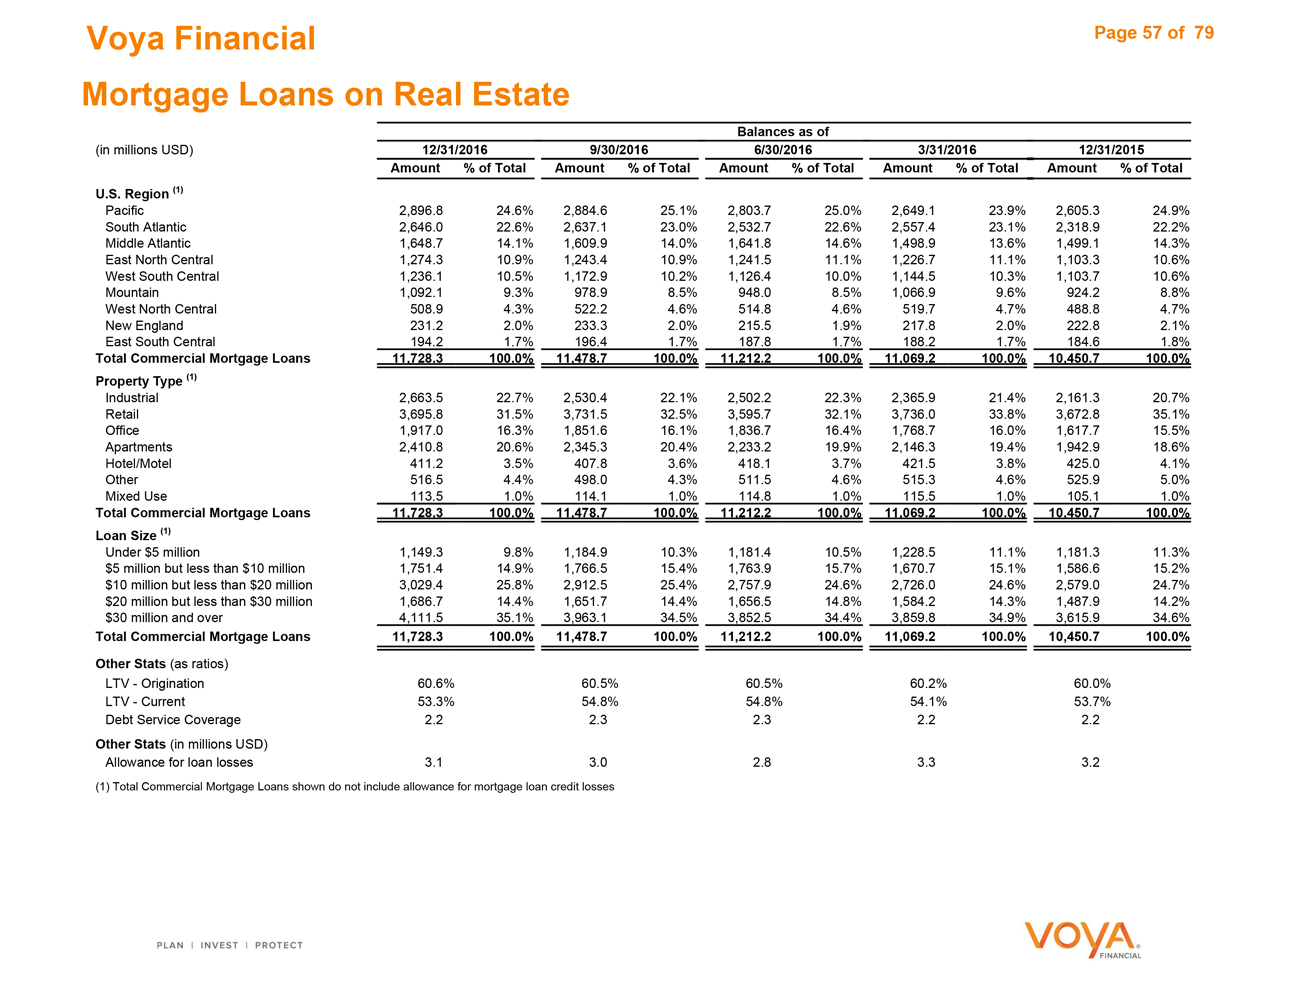
|
Voya Financial Page 57 of 79 Mortgage Loans on Real Estate Balances as of (in millions USD)12/31/2016 9/30/20166/30/20163/31/201612/31/2015 Amount% of TotalAmount% of TotalAmount% of TotalAmount% of TotalAmount% of Total U.S. Region (1) Pacific2,896.8 24.6%2,884.625.1%2,803.725.0%2,649.123.9%2,605.324.9% South Atlantic2,646.0 22.6%2,637.123.0%2,532.722.6%2,557.423.1%2,318.922.2% Middle Atlantic1,648.7 14.1%1,609.914.0%1,641.814.6%1,498.913.6%1,499.114.3% East North Central1,274.3 10.9%1,243.410.9%1,241.511.1%1,226.711.1%1,103.310.6% West South Central1,236.1 10.5%1,172.910.2%1,126.410.0%1,144.510.3%1,103.710.6% Mountain1,092.1 9.3%978.98.5%948.08.5%1,066.99.6%924.28.8% West North Central508.9 4.3%522.24.6%514.84.6%519.74.7%488.84.7% New England231.2 2.0%233.32.0%215.51.9%217.82.0%222.82.1% East South Central194.2 1.7%196.41.7%187.81.7%188.21.7%184.61.8% Total Commercial Mortgage Loans11,728.3 100.0%11,478.7100.0%11,212.2100.0%11,069.2100.0%10,450.7100.0% Property Type (1) Industrial2,663.5 22.7%2,530.422.1%2,502.222.3%2,365.921.4%2,161.320.7% Retail3,695.8 31.5%3,731.532.5%3,595.732.1%3,736.033.8%3,672.835.1% Office1,917.0 16.3%1,851.616.1%1,836.716.4%1,768.716.0%1,617.715.5% Apartments2,410.8 20.6%2,345.320.4%2,233.219.9%2,146.319.4%1,942.918.6% Hotel/Motel411.2 3.5%407.83.6%418.13.7%421.53.8%425.04.1% Other516.5 4.4%498.04.3%511.54.6%515.34.6%525.95.0% Mixed Use113.5 1.0%114.11.0%114.81.0%115.51.0%105.11.0% Total Commercial Mortgage Loans11,728.3 100.0%11,478.7100.0%11,212.2100.0%11,069.2100.0%10,450.7100.0% Loan Size (1) Under $5 million1,149.3 9.8%1,184.910.3%1,181.410.5%1,228.511.1%1,181.311.3% $5 million but less than $10 million1,751.4 14.9%1,766.515.4%1,763.915.7%1,670.715.1%1,586.615.2% $10 million but less than $20 million3,029.4 25.8%2,912.525.4%2,757.924.6%2,726.024.6%2,579.024.7% $20 million but less than $30 million1,686.7 14.4%1,651.714.4%1,656.514.8%1,584.214.3%1,487.914.2% $30 million and over4,111.5 35.1%3,963.134.5%3,852.534.4%3,859.834.9%3,615.934.6% Total Commercial Mortgage Loans11,728.3 100.0%11,478.7100.0%11,212.2100.0%11,069.2100.0%10,450.7100.0% Other Stats (as ratios) LTV—Origination60.6% 60.5%60.5%60.2%60.0% LTV—Current53.3% 54.8%54.8%54.1%53.7% Debt Service Coverage2.2 2.32.32.22.2 Other Stats (in millions USD) Allowance for loan losses3.1 3.02.83.33.2 (1) Total Commercial Mortgage Loans shown do not include allowance for mortgage loan credit losses
|
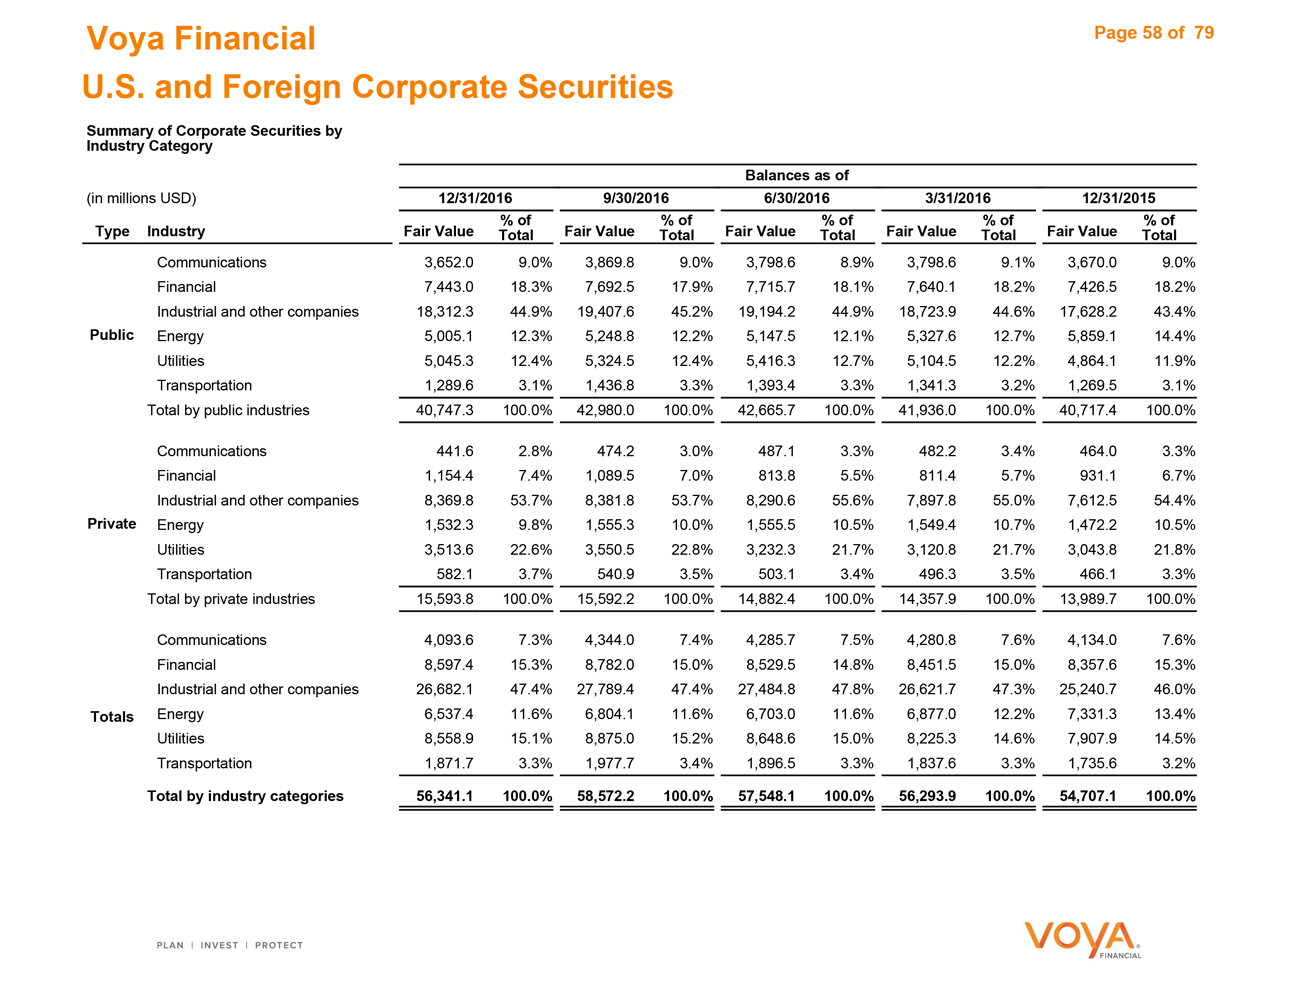
|
Voya Financial Page 58 of 79
U.S. and Foreign Corporate Securities
Summary of Corporate Securities by
Industry Category
Balances as of
(in millions USD) 12/31/2016 9/30/20166/30/20163/31/201612/31/2015
% of% of% of% of% of
Type Industry Fair ValueTotalFair ValueTotalFair ValueTotalFair ValueTotalFair ValueTotal
Communications 3,652.09.0%3,869.89.0%3,798.68.9%3,798.69.1%3,670.09.0%
Financial 7,443.018.3%7,692.517.9%7,715.718.1%7,640.118.2%7,426.518.2%
Industrial and other companies 18,312.344.9%19,407.645.2%19,194.244.9%18,723.944.6%17,628.243.4%
Public Energy 5,005.112.3%5,248.812.2%5,147.512.1%5,327.612.7%5,859.114.4%
Utilities 5,045.312.4%5,324.512.4%5,416.312.7%5,104.512.2%4,864.111.9%
Transportation 1,289.63.1%1,436.83.3%1,393.43.3%1,341.33.2%1,269.53.1%
Total by public industries 40,747.3100.0%42,980.0100.0%42,665.7100.0%41,936.0100.0%40,717.4100.0%
Communications 441.62.8%474.23.0%487.13.3%482.23.4%464.03.3%
Financial 1,154.47.4%1,089.57.0%813.85.5%811.45.7%931.16.7%
Industrial and other companies 8,369.853.7%8,381.853.7%8,290.655.6%7,897.855.0%7,612.554.4%
Private Energy 1,532.39.8%1,555.310.0%1,555.510.5%1,549.410.7%1,472.210.5%
Utilities 3,513.622.6%3,550.522.8%3,232.321.7%3,120.821.7%3,043.821.8%
Transportation 582.13.7%540.93.5%503.13.4%496.33.5%466.13.3%
Total by private industries 15,593.8100.0%15,592.2100.0%14,882.4100.0%14,357.9100.0%13,989.7100.0%
Communications 4,093.67.3%4,344.07.4%4,285.77.5%4,280.87.6%4,134.07.6%
Financial 8,597.415.3%8,782.015.0%8,529.514.8%8,451.515.0%8,357.615.3%
Industrial and other companies 26,682.147.4%27,789.447.4%27,484.847.8%26,621.747.3%25,240.746.0%
Totals Energy 6,537.411.6%6,804.111.6%6,703.011.6%6,877.012.2%7,331.313.4%
Utilities 8,558.915.1%8,875.015.2%8,648.615.0%8,225.314.6%7,907.914.5%
Transportation 1,871.73.3%1,977.73.4%1,896.53.3%1,837.63.3%1,735.63.2%
Total by industry categories 56,341.1100.0%58,572.2100.0%57,548.1100.0%56,293.9100.0%54,707.1100.0%
|
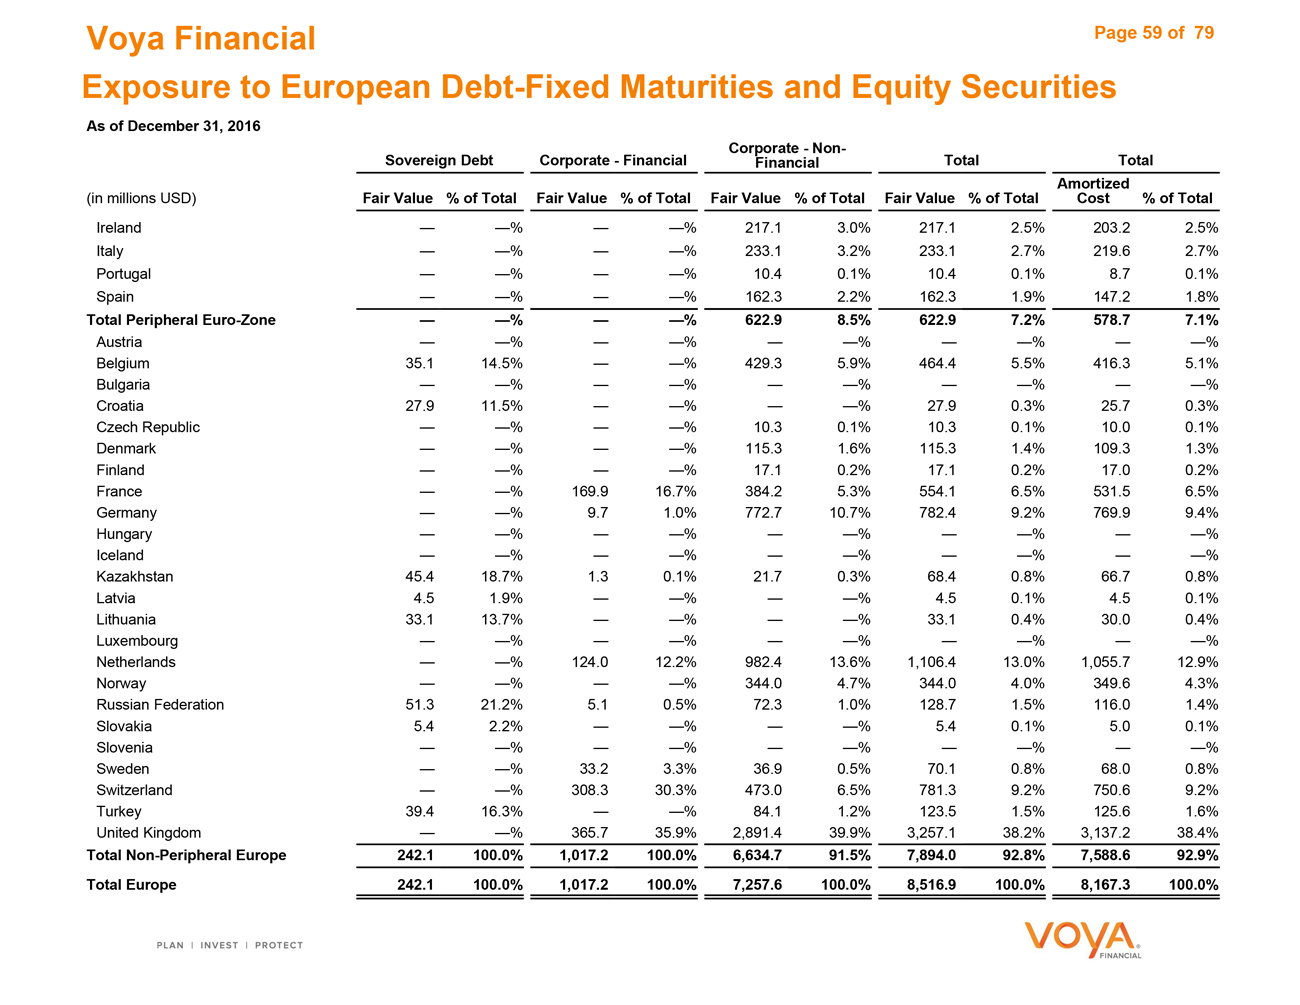
|
Voya Financial Page 59 of 79 Exposure to European Debt-Fixed Maturities and Equity Securities As of December 31, 2016 Corporate Non- Sovereign DebtCorporate FinancialFinancialTotalTotal Amortized (in millions USD)Fair Value % of TotalFair Value% of TotalFair Value% of TotalFair Value% of TotalCost% of Total Ireland % %217.13.0%217.12.5%203.22.5% Italy % %233.13.2%233.12.7%219.62.7% Portugal % %10.40.1%10.40.1%8.70.1% Spain % %162.32.2%162.31.9%147.21.8% Total Peripheral Euro-Zone % %622.98.5%622.97.2%578.77.1% Austria % % % % % Belgium35.1 14.5% %429.35.9%464.45.5%416.35.1% Bulgaria % % % % % Croatia27.9 11.5% % %27.90.3%25.70.3% Czech Republic % %10.30.1%10.30.1%10.00.1% Denmark % %115.31.6%115.31.4%109.31.3% Finland % %17.10.2%17.10.2%17.00.2% France %169.916.7%384.25.3%554.16.5%531.56.5% Germany %9.71.0%772.710.7%782.49.2%769.99.4% Hungary % % % % % Iceland % % % % % Kazakhstan45.4 18.7%1.30.1%21.70.3%68.40.8%66.70.8% Latvia4.5 1.9% % %4.50.1%4.50.1% Lithuania33.1 13.7% % %33.10.4%30.00.4% Luxembourg % % % % % Netherlands %124.012.2%982.413.6%1,106.413.0%1,055.712.9% Norway % %344.04.7%344.04.0%349.64.3% Russian Federation51.3 21.2%5.10.5%72.31.0%128.71.5%116.01.4% Slovakia5.4 2.2% % %5.40.1%5.00.1% Slovenia % % % % % Sweden %33.23.3%36.90.5%70.10.8%68.00.8% Switzerland %308.330.3%473.06.5%781.39.2%750.69.2% Turkey39.4 16.3% %84.11.2%123.51.5%125.61.6% United Kingdom %365.735.9%2,891.439.9%3,257.138.2%3,137.238.4% Total Non-Peripheral Europe242.1 100.0%1,017.2100.0%6,634.791.5%7,894.092.8%7,588.692.9% Total Europe242.1 100.0%1,017.2100.0%7,257.6100.0%8,516.9100.0%8,167.3100.0%
|

|
Reconciliations
|
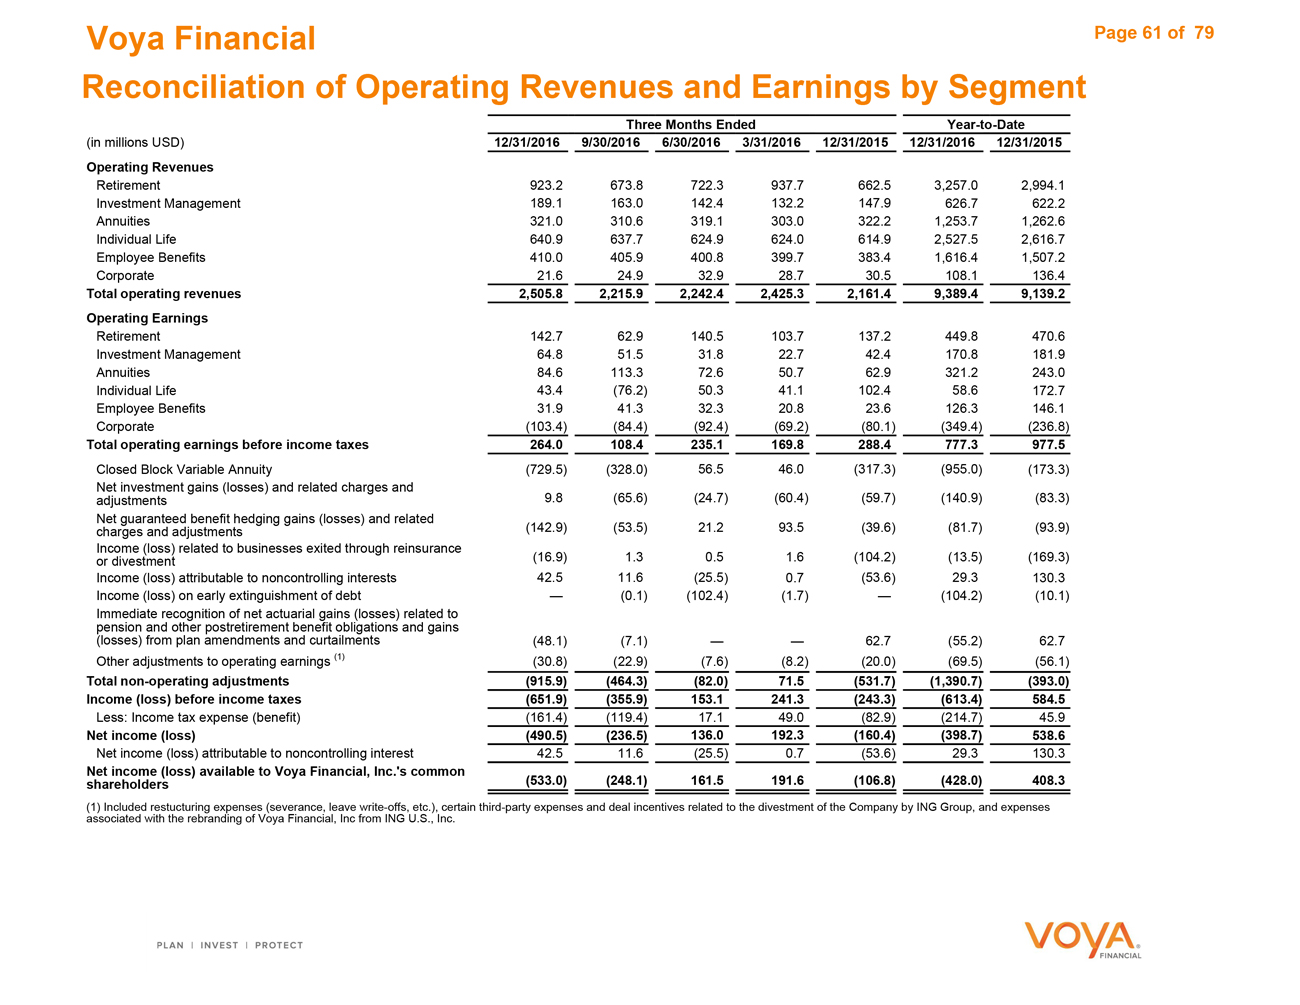
|
Voya Financial Page 61 of79 Reconciliation of Operating Revenues and Earnings by Segment Three Months EndedYear-to-Date (in millions USD)12/31/2016 9/30/20166/30/20163/31/201612/31/201512/31/201612/31/2015 Operating Revenues Retirement923.2 673.8722.3937.7662.53,257.02,994.1 Investment Management189.1 163.0142.4132.2147.9626.7622.2 Annuities321.0 310.6319.1303.0322.21,253.71,262.6 Individual Life640.9 637.7624.9624.0614.92,527.52,616.7 Employee Benefits410.0 405.9400.8399.7383.41,616.41,507.2 Corporate21.6 24.932.928.730.5108.1136.4 Total operating revenues2,505.8 2,215.92,242.42,425.32,161.49,389.49,139.2 Operating Earnings Retirement142.7 62.9140.5103.7137.2449.8470.6 Investment Management64.8 51.531.822.742.4170.8181.9 Annuities84.6 113.372.650.762.9321.2243.0 Individual Life43.4 (76.2)50.341.1102.458.6172.7 Employee Benefits31.9 41.332.320.823.6126.3146.1 Corporate(103.4) (84.4)(92.4)(69.2)(80.1)(349.4)(236.8) Total operating earnings before income taxes264.0 108.4235.1169.8288.4777.3977.5 Closed Block Variable Annuity(729.5) (328.0)56.546.0(317.3)(955.0)(173.3) Net investment gains (losses) and related charges and adjustments9.8 (65.6)(24.7)(60.4)(59.7)(140.9)(83.3) Net guaranteed benefit hedging gains (losses) and related charges and adjustments(142.9) (53.5)21.293.5(39.6)(81.7)(93.9) Income (loss) related to businesses exited through reinsurance(16.9) or divestment 1.30.51.6(104.2)(13.5)(169.3) Income (loss) attributable to noncontrolling interests42.5 11.6(25.5)0.7(53.6)29.3130.3 Income (loss) on early extinguishment of debt— (0.1)(102.4)(1.7)—(104.2)(10.1) Immediate recognition of net actuarial gains (losses) related to pension and other postretirement benefit obligations and gains (losses) from plan amendments and curtailments(48.1) (7.1)——62.7(55.2)62.7 Other adjustments to operating earnings (1)(30.8) (22.9)(7.6)(8.2)(20.0)(69.5)(56.1) Total non-operating adjustments(915.9) (464.3)(82.0)71.5(531.7)(1,390.7)(393.0) Income (loss) before income taxes(651.9) (355.9)153.1241.3(243.3)(613.4)584.5 Less: Income tax expense (benefit)(161.4) (119.4)17.149.0(82.9)(214.7)45.9 Net income (loss)(490.5) (236.5)136.0192.3(160.4)(398.7)538.6 Net income (loss) attributable to noncontrolling interest42.5 11.6(25.5)0.7(53.6)29.3130.3 Net income (loss) available to Voya Financial, Inc.’s common shareholders(533.0) (248.1)161.5191.6(106.8)(428.0)408.3 (1) Included restucturing expenses (severance, leave write-offs, etc.), certain third-party expenses and deal incentives related to the divestment of the Company by ING Group, and expenses associated with the rebranding of Voya Financial, Inc from ING U.S., Inc.
|
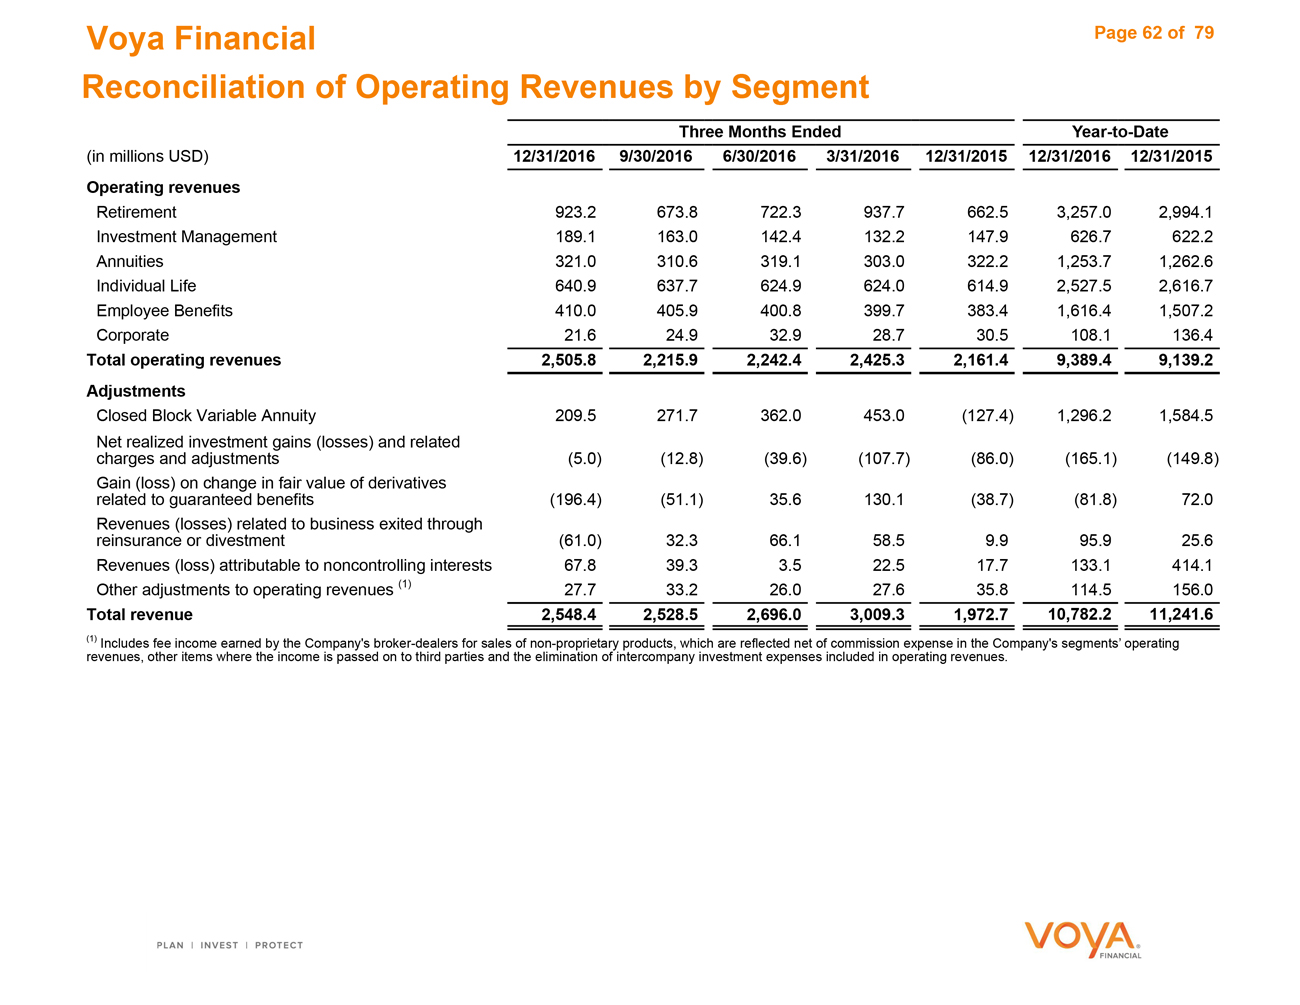
|
Voya Financial Page 62 of 79 Reconciliation of Operating Revenues by Segment Three Months EndedYear-to-Date (in millions USD)12/31/2016 9/30/20166/30/20163/31/201612/31/201512/31/201612/31/2015 Operating revenues Retirement923.2 673.8722.3937.7662.53,257.02,994.1 Investment Management189.1 163.0142.4132.2147.9626.7622.2 Annuities321.0 310.6319.1303.0322.21,253.71,262.6 Individual Life640.9 637.7624.9624.0614.92,527.52,616.7 Employee Benefits410.0 405.9400.8399.7383.41,616.41,507.2 Corporate21.6 24.932.928.730.5108.1136.4 Total operating revenues2,505.8 2,215.92,242.42,425.32,161.49,389.49,139.2 Adjustments Closed Block Variable Annuity209.5 271.7362.0453.0(127.4)1,296.21,584.5 Net realized investment gains (losses) and related charges and adjustments(5.0) (12.8)(39.6)(107.7)(86.0)(165.1)(149.8) Gain (loss) on change in fair value of derivatives related to guaranteed benefits(196.4) (51.1)35.6130.1(38.7)(81.8)72.0 Revenues (losses) related to business exited through reinsurance or divestment(61.0) 32.366.158.59.995.925.6 Revenues (loss) attributable to noncontrolling interests67.8 39.33.522.517.7133.1414.1 Other adjustments to operating revenues (1)27.7 33.226.027.635.8114.5156.0 Total revenue2,548.4 2,528.52,696.03,009.31,972.710,782.211,241.6 (1) Includes fee income earned by the Company’s broker-dealers for sales of non-proprietary products, which are reflected net of commission expense in the Company’s segments’ operating revenues, other items where the income is passed on to third parties and the elimination of intercompany investment expenses included in operating revenues.
|
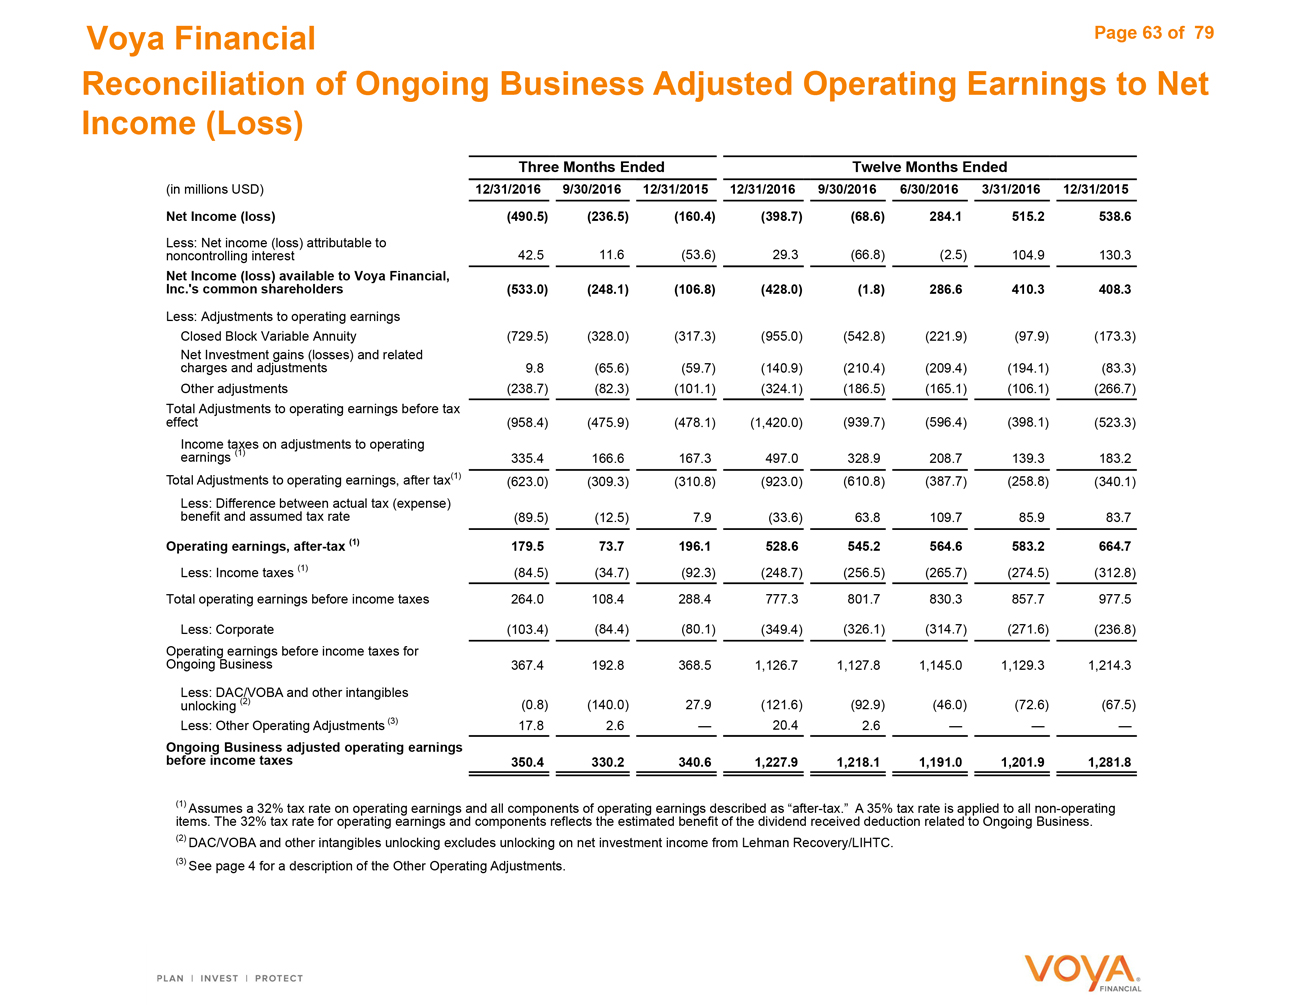
|
Voya Financial Page 63 of 79 Reconciliation of Ongoing Business Adjusted Operating Earnings to Net Income (Loss) Three Months Ended Twelve Months Ended (in millions USD) 12/31/2016 9/30/2016 12/31/2015 12/31/2016 9/30/2016 6/30/2016 3/31/2016 12/31/2015 Net Income (loss) (490.5) (236.5) (160.4) (398.7) (68.6) 284.1 515.2 538.6 Less: Net income (loss) attributable to noncontrolling interest 42.5 11.6 (53.6) 29.3 (66.8) (2.5) 104.9 130.3 Net Income (loss) available to Voya Financial, Inc.’s common shareholders (533.0) (248.1) (106.8) (428.0) (1.8) 286.6 410.3 408.3 Less: Adjustments to operating earnings Closed Block Variable Annuity (729.5) (328.0) (317.3) (955.0) (542.8) (221.9) (97.9) (173.3) Net Investment gains (losses) and related charges and adjustments 9.8 (65.6) (59.7) (140.9) (210.4) (209.4) (194.1) (83.3) Other adjustments (238.7) (82.3) (101.1) (324.1) (186.5) (165.1) (106.1) (266.7) Total Adjustments to operating earnings before tax effect (958.4) (475.9) (478.1) (1,420.0) (939.7) (596.4) (398.1) (523.3) Income taxes on adjustments to operating earnings (1) 335.4 166.6 167.3 497.0 328.9 208.7 139.3 183.2 Total Adjustments to operating earnings, after tax(1) (623.0) (309.3) (310.8) (923.0) (610.8) (387.7) (258.8) (340.1) Less: Difference between actual tax (expense) benefit and assumed tax rate (89.5) (12.5) 7.9 (33.6) 63.8 109.7 85.9 83.7 Operating earnings, after-tax (1) 179.5 73.7 196.1 528.6 545.2 564.6 583.2 664.7 Less: Income taxes (1) (84.5) (34.7) (92.3) (248.7) (256.5) (265.7) (274.5) (312.8) Total operating earnings before income taxes 264.0 108.4 288.4 777.3 801.7 830.3 857.7 977.5 Less: Corporate (103.4) (84.4) (80.1) (349.4) (326.1) (314.7) (271.6) (236.8) Operating earnings before income taxes for Ongoing Business 367.4 192.8 368.5 1,126.7 1,127.8 1,145.0 1,129.3 1,214.3 Less: DAC/VOBA and other intangibles unlocking (2) (0.8) (140.0) 27.9 (121.6) (92.9) (46.0) (72.6) (67.5) Less: Other Operating Adjustments (3) 17.8 2.6 —— 20.4 2.6 —— —— —— Ongoing Business adjusted operating earnings before income taxes 350.4 330.2 340.6 1,227.9 1,218.1 1,191.0 1,201.9 1,281.8 (1) Assumes a 32% tax rate on operating earnings and all components of operating earnings described as “after-tax.” A 35% tax rate is applied to all non-operating items. The 32% tax rate for operating earnings and components reflects the estimated benefit of the dividend received deduction related to Ongoing Business. (2) DAC/VOBA and other intangibles unlocking excludes unlocking on net investment income from Lehman Recovery/LIHTC. (3) See page 4 for a description of the Other Operating Adjustments.
|
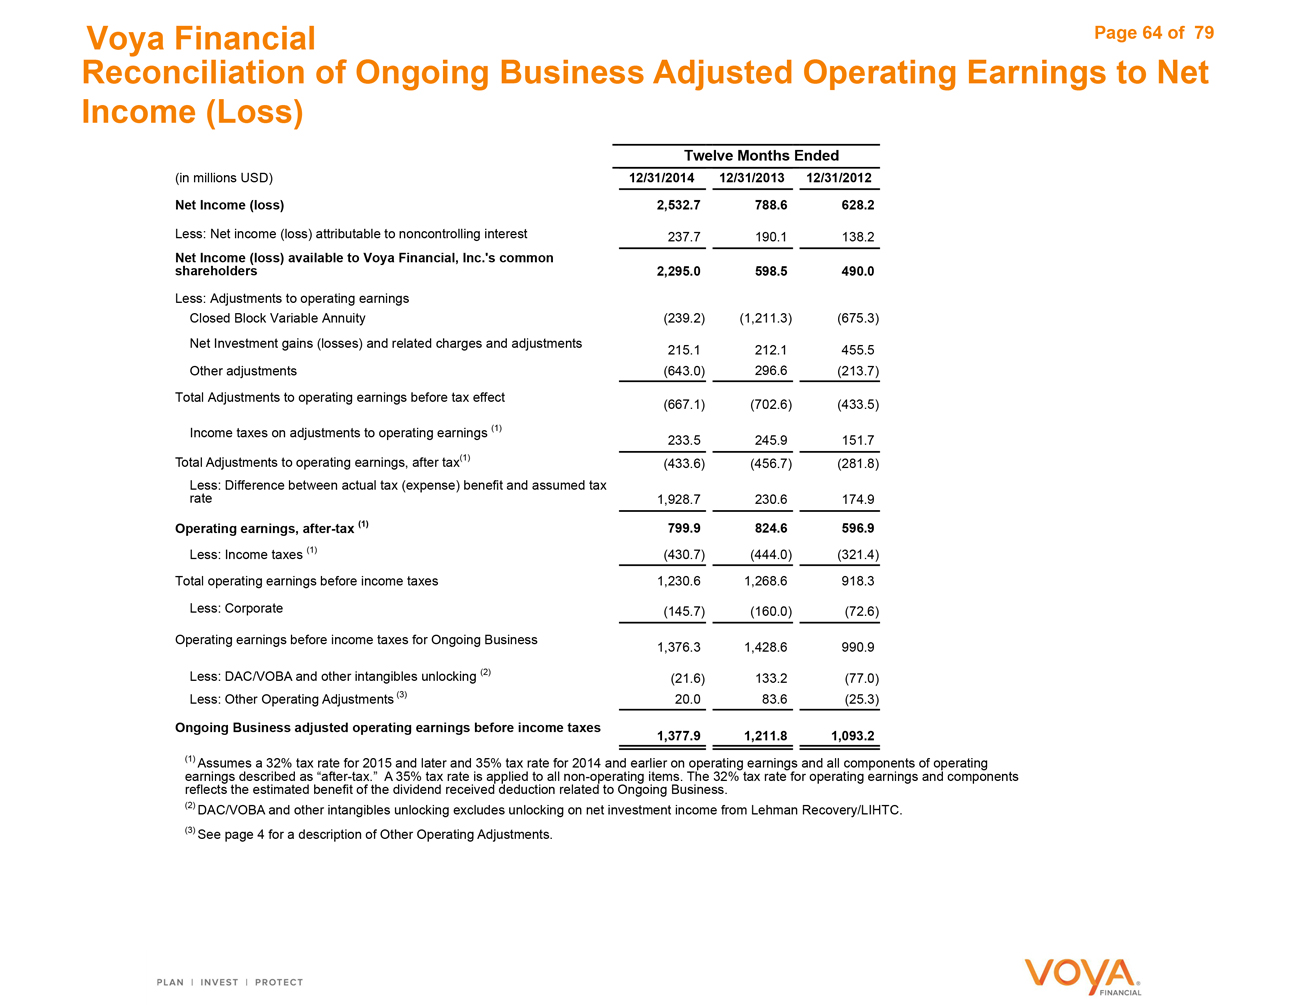
|
Voya Financial Page 64 of 79 Reconciliation of Ongoing Business Adjusted Operating Earnings to Net Income (Loss) Twelve Months Ended (in millions USD)12/31/2014 12/31/201312/31/2012 Net Income (loss)2,532.7 788.6628.2 Less: Net income (loss) attributable to noncontrolling interest237.7 190.1138.2 Net Income (loss) available to Voya Financial, Inc.’s common shareholders2,295.0 598.5490.0 Less: Adjustments to operating earnings Closed Block Variable Annuity(239.2) (1,211.3)(675.3) Net Investment gains (losses) and related charges and adjustments215.1 212.1455.5 Other adjustments(643.0) 296.6(213.7) Total Adjustments to operating earnings before tax effect(667.1) (702.6)(433.5) Income taxes on adjustments to operating earnings (1)233.5 245.9151.7 Total Adjustments to operating earnings, after tax(1)(433.6) (456.7)(281.8) Less: Difference between actual tax (expense) benefit and assumed tax rate1,928.7 230.6174.9 Operating earnings, after-tax (1)799.9 824.6596.9 Less: Income taxes (1)(430.7) (444.0)(321.4) Total operating earnings before income taxes1,230.6 1,268.6918.3 Less: Corporate(145.7) (160.0)(72.6) Operating earnings before income taxes for Ongoing Business1,376.3 1,428.6990.9 Less: DAC/VOBA and other intangibles unlocking (2)(21.6) 133.2(77.0) Less: Other Operating Adjustments (3)20.0 83.6(25.3) Ongoing Business adjusted operating earnings before income taxes1,377.9 1,211.81,093.2 (1) Assumes a 32% tax rate for 2015 and later and 35% tax rate for 2014 and earlier on operating earnings and all components of operating earnings described as “after-tax.” A 35% tax rate is applied to all non-operating items. The 32% tax rate for operating earnings and components reflects the estimated benefit of the dividend received deduction related to Ongoing Business. (2) DAC/VOBA and other intangibles unlocking excludes unlocking on net investment income from Lehman Recovery/LIHTC. (3) See page 4 for a description of Other Operating Adjustments.
|
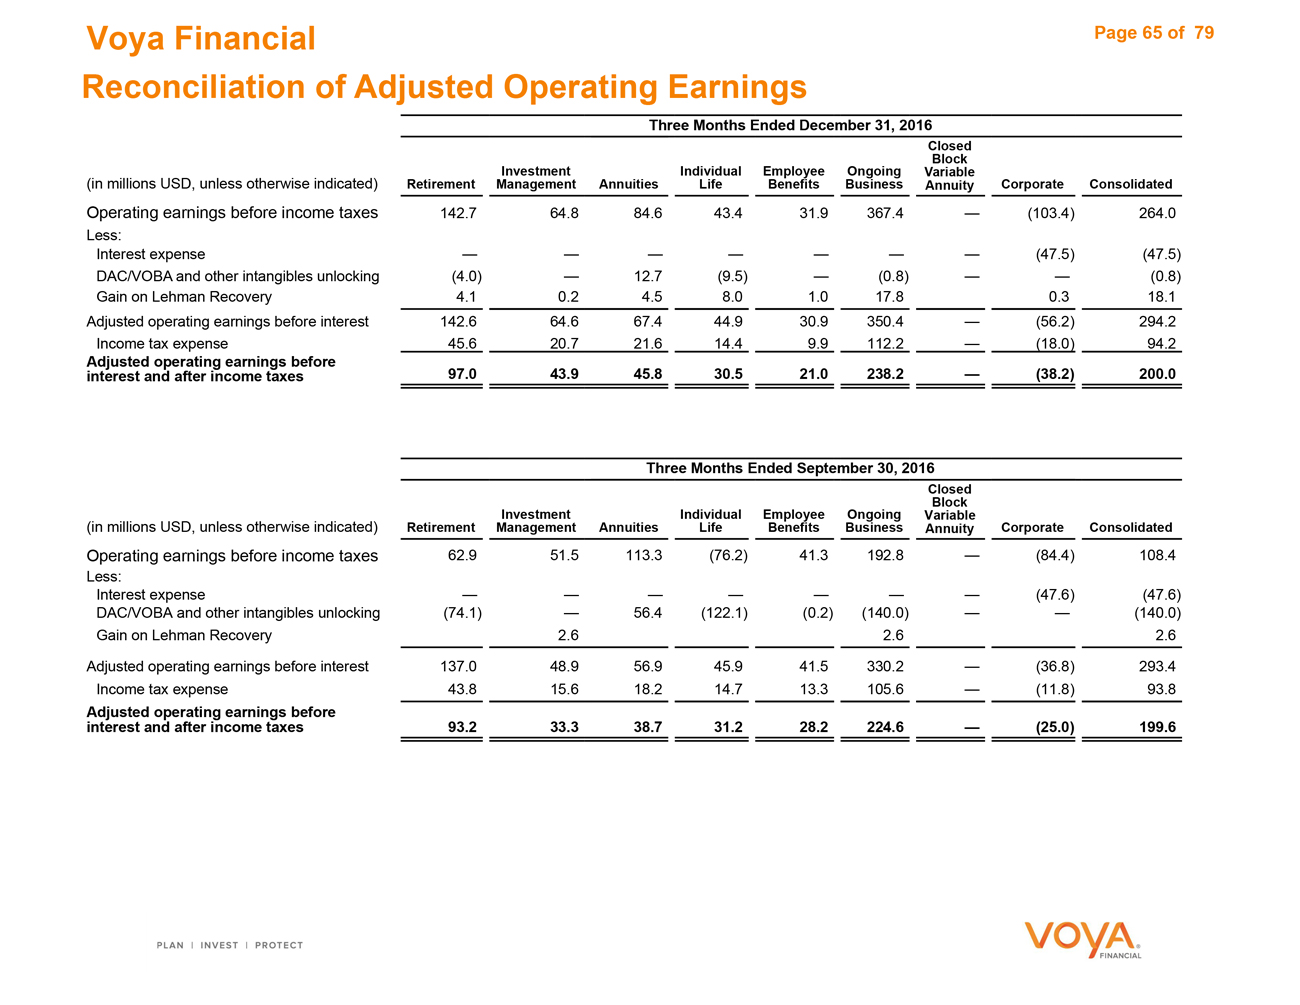
|
Voya Financial Page 65 of79 Reconciliation of Adjusted Operating Earnings Three Months Ended December 31, 2016 Closed Block InvestmentIndividualEmployeeOngoingVariable (in millions USD, unless otherwise indicated)Retirement ManagementAnnuitiesLifeBenefitsBusinessAnnuityCorporateConsolidated Operating earnings before income taxes142.7 64.884.643.431.9367.4—(103.4)264.0 Less: Interest expense— ——————(47.5)(47.5) DAC/VOBA and other intangibles unlocking(4.0) —12.7(9.5)—(0.8)——(0.8) Gain on Lehman Recovery4.1 0.24.58.01.017.80.318.1 Adjusted operating earnings before interest142.6 64.667.444.930.9350.4—(56.2)294.2 Income tax expense45.6 20.721.614.49.9112.2—(18.0)94.2 Adjusted operating earnings before interest and after income taxes97.0 43.945.830.521.0238.2—(38.2)200.0 Three Months Ended September 30, 2016 Closed Block InvestmentIndividualEmployeeOngoingVariable (in millions USD, unless otherwise indicated)Retirement ManagementAnnuitiesLifeBenefitsBusinessAnnuityCorporateConsolidated Operating earnings before income taxes62.9 51.5113.3(76.2)41.3192.8—(84.4)108.4 Less: Interest expense— ——————(47.6)(47.6) DAC/VOBA and other intangibles unlocking(74.1) —56.4(122.1)(0.2)(140.0)——(140.0) Gain on Lehman Recovery 2.62.62.6 Adjusted operating earnings before interest137.0 48.956.945.941.5330.2—(36.8)293.4 Income tax expense43.8 15.618.214.713.3105.6—(11.8)93.8 Adjusted operating earnings before interest and after income taxes93.2 33.338.731.228.2224.6—(25.0)199.6
|
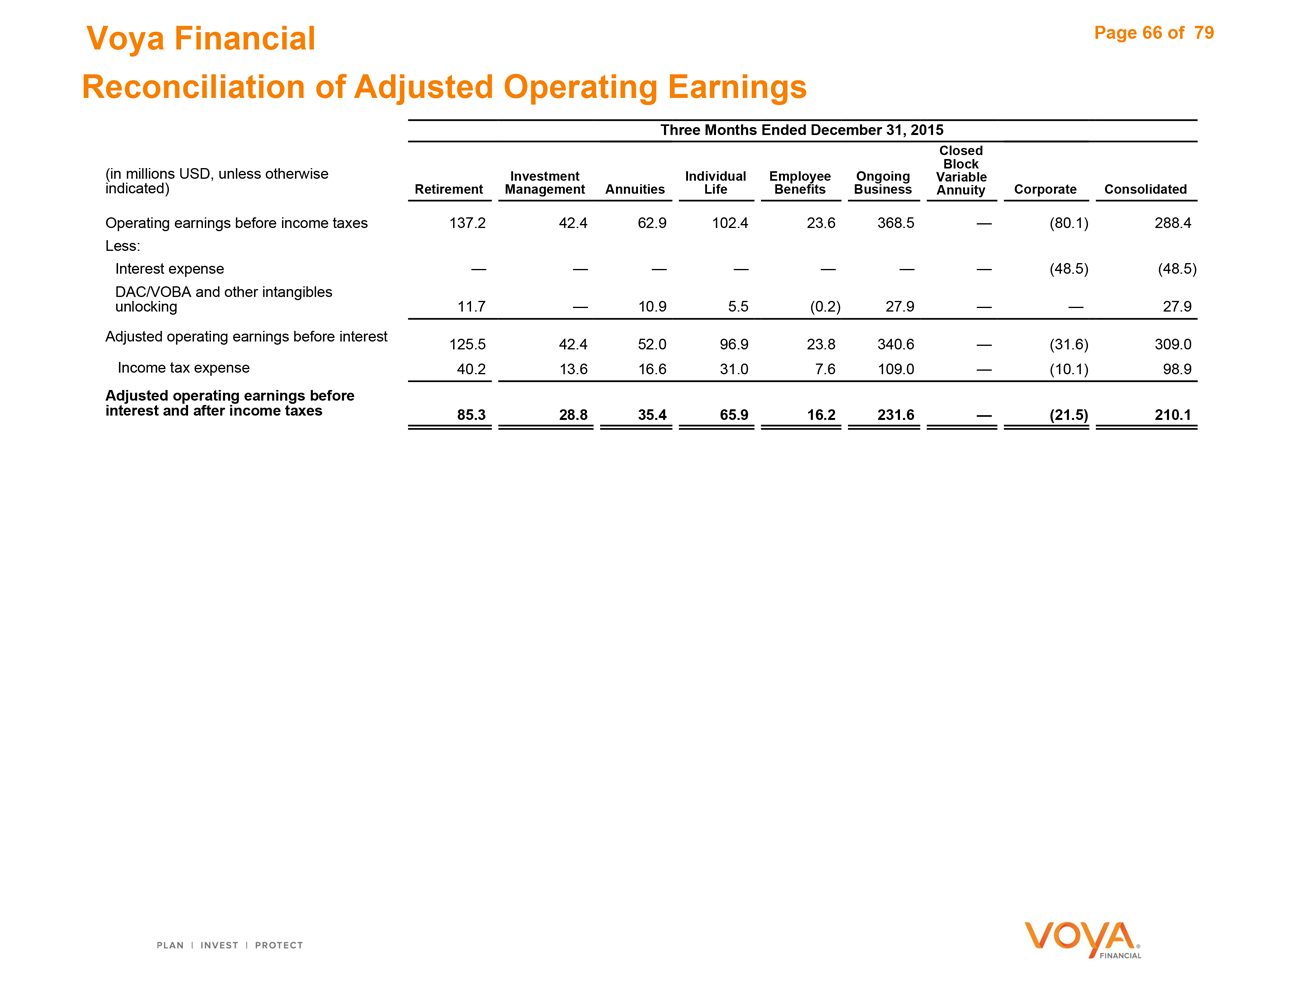
|
Voya Financial Page 66 of 79
Reconciliation of Adjusted Operating Earnings
Three Months Ended December 31, 2015
Closed
Block
(in millions USD, unless otherwise InvestmentIndividualEmployeeOngoingVariable
indicated) Retirement ManagementAnnuitiesLifeBenefitsBusinessAnnuityCorporateConsolidated
Operating earnings before income taxes 137.2 42.462.9102.423.6368.5—(80.1)288.4
Less:
Interest expense — ——————(48.5)(48.5)
DAC/VOBA and other intangibles
unlocking 11.7 —10.95.5(0.2)27.9——27.9
Adjusted operating earnings before interest 125.5 42.452.096.923.8340.6—(31.6)309.0
Income tax expense 40.2 13.616.631.07.6109.0—(10.1)98.9
Adjusted operating earnings before
interest and after income taxes 85.3 28.835.465.916.2231.6—(21.5)210.1
|
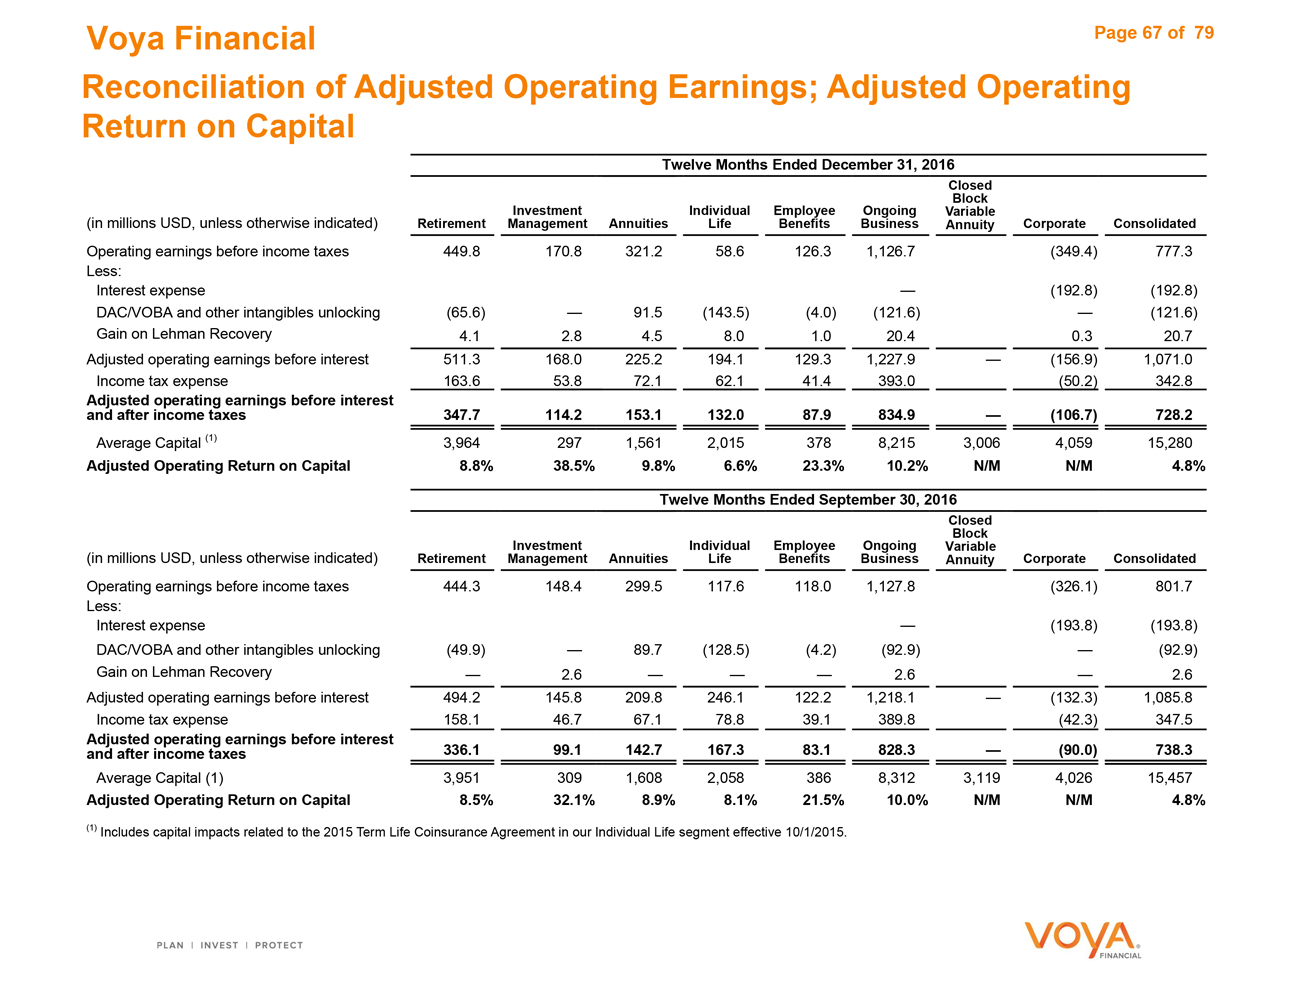
|
Voya Financial Page 67 of 79 Reconciliation of Adjusted Operating Earnings; Adjusted Operating Return on Capital Twelve Months Ended December 31, 2016 Closed Block Investment Individual Employee Ongoing Variable (in millions USD, unless otherwise indicated)Retirement ManagementAnnuitiesLifeBenefitsBusinessAnnuityCorporateConsolidated Operating earnings before income taxes449.8 170.8321.258.6126.31,126.7(349.4)777.3 Less: Interest expense —(192.8)(192.8) DAC/VOBA and other intangibles unlocking(65.6) —91.5(143.5)(4.0)(121.6)—(121.6) Gain on Lehman Recovery4.1 2.84.58.01.020.40.320.7 Adjusted operating earnings before interest511.3 168.0225.2194.1129.31,227.9—(156.9)1,071.0 Income tax expense163.6 53.872.162.141.4393.0(50.2)342.8 Adjusted operating earnings before interest and after income taxes347.7 114.2153.1132.087.9834.9—(106.7)728.2 Average Capital (1)3,964 2971,5612,0153788,2153,0064,05915,280 Adjusted Operating Return on Capital8.8% 38.5%9.8%6.6%23.3%10.2%N/MN/M4.8% Twelve Months Ended September 30, 2016 Closed Block Investment Individual Employee Ongoing Variable (in millions USD, unless otherwise indicated)Retirement ManagementAnnuitiesLifeBenefitsBusinessAnnuityCorporateConsolidated Operating earnings before income taxes444.3 148.4299.5117.6118.01,127.8(326.1)801.7 Less: Interest expense —(193.8)(193.8) DAC/VOBA and other intangibles unlocking(49.9) —89.7(128.5)(4.2)(92.9)—(92.9) Gain on Lehman Recovery— 2.6———2.6—2.6 Adjusted operating earnings before interest494.2 145.8209.8246.1122.21,218.1—(132.3)1,085.8 Income tax expense158.1 46.767.178.839.1389.8(42.3)347.5 Adjusted operating earnings before interest and after income taxes336.1 99.1142.7167.383.1828.3—(90.0)738.3 Average Capital (1)3,951 3091,6082,0583868,3123,1194,02615,457 Adjusted Operating Return on Capital8.5% 32.1%8.9%8.1%21.5%10.0%N/MN/M4.8% (1) Includes capital impacts related to the 2015 Term Life Coinsurance Agreement in our Individual Life segment effective 10/1/2015.
|
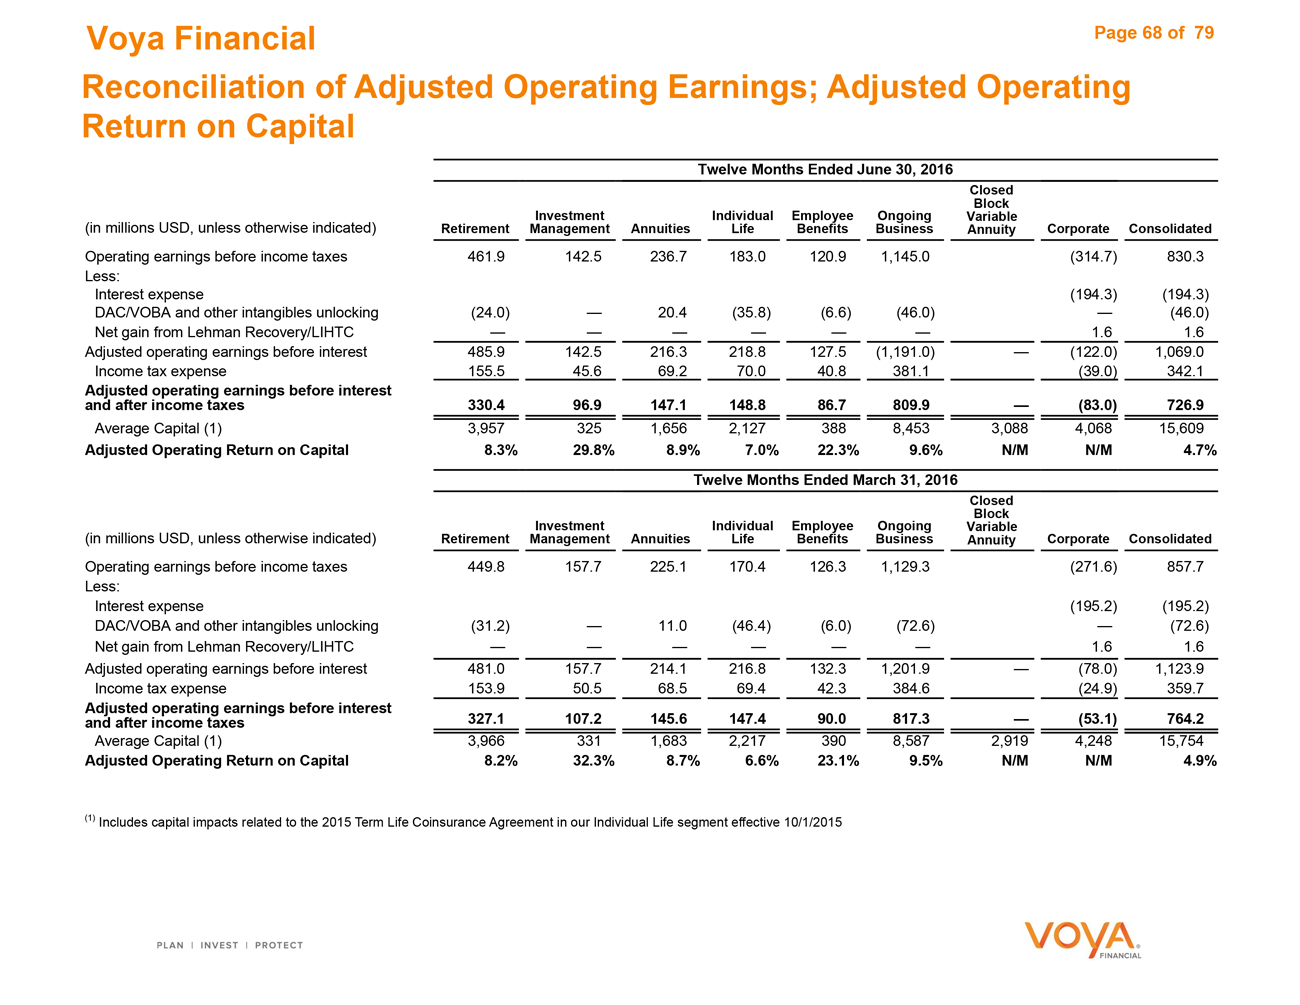
|
Voya Financial Page 68 of 79 Reconciliation of Adjusted Operating Earnings; Adjusted Operating Return on Capital Twelve Months Ended June 30, 2016 Closed Block InvestmentIndividual EmployeeOngoingVariable (in millions USD, unless otherwise indicated)Retirement ManagementAnnuitiesLifeBenefitsBusinessAnnuityCorporateConsolidated Operating earnings before income taxes461.9 142.5236.7183.0120.91,145.0(314.7)830.3 Less: Interest expense (194.3)(194.3) DAC/VOBA and other intangibles unlocking(24.0) —20.4(35.8)(6.6)(46.0)—(46.0) Net gain from Lehman Recovery/LIHTC— —————1.61.6 Adjusted operating earnings before interest485.9 142.5216.3218.8127.5(1,191.0)—(122.0)1,069.0 Income tax expense155.5 45.669.270.040.8381.1(39.0)342.1 Adjusted operating earnings before interest and after income taxes330.4 96.9147.1148.886.7809.9—(83.0)726.9 Average Capital (1)3,957 3251,6562,1273888,4533,0884,06815,609 Adjusted Operating Return on Capital8.3% 29.8%8.9%7.0%22.3%9.6%N/MN/M4.7% Twelve Months Ended March 31, 2016 Closed Block InvestmentIndividual EmployeeOngoingVariable (in millions USD, unless otherwise indicated)Retirement ManagementAnnuitiesLifeBenefitsBusinessAnnuityCorporateConsolidated Operating earnings before income taxes449.8 157.7225.1170.4126.31,129.3(271.6)857.7 Less: Interest expense (195.2)(195.2) DAC/VOBA and other intangibles unlocking(31.2) —11.0(46.4)(6.0)(72.6)—(72.6) Net gain from Lehman Recovery/LIHTC— —————1.61.6 Adjusted operating earnings before interest481.0 157.7214.1216.8132.31,201.9—(78.0)1,123.9 Income tax expense153.9 50.568.569.442.3384.6(24.9)359.7 Adjusted operating earnings before interest and after income taxes327.1 107.2145.6147.490.0817.3—(53.1)764.2 Average Capital (1)3,966 3311,6832,2173908,5872,9194,24815,754 Adjusted Operating Return on Capital8.2% 32.3%8.7%6.6%23.1%9.5%N/MN/M4.9% (1) Includes capital impacts related to the 2015 Term Life Coinsurance Agreement in our Individual Life segment effective 10/1/2015
|
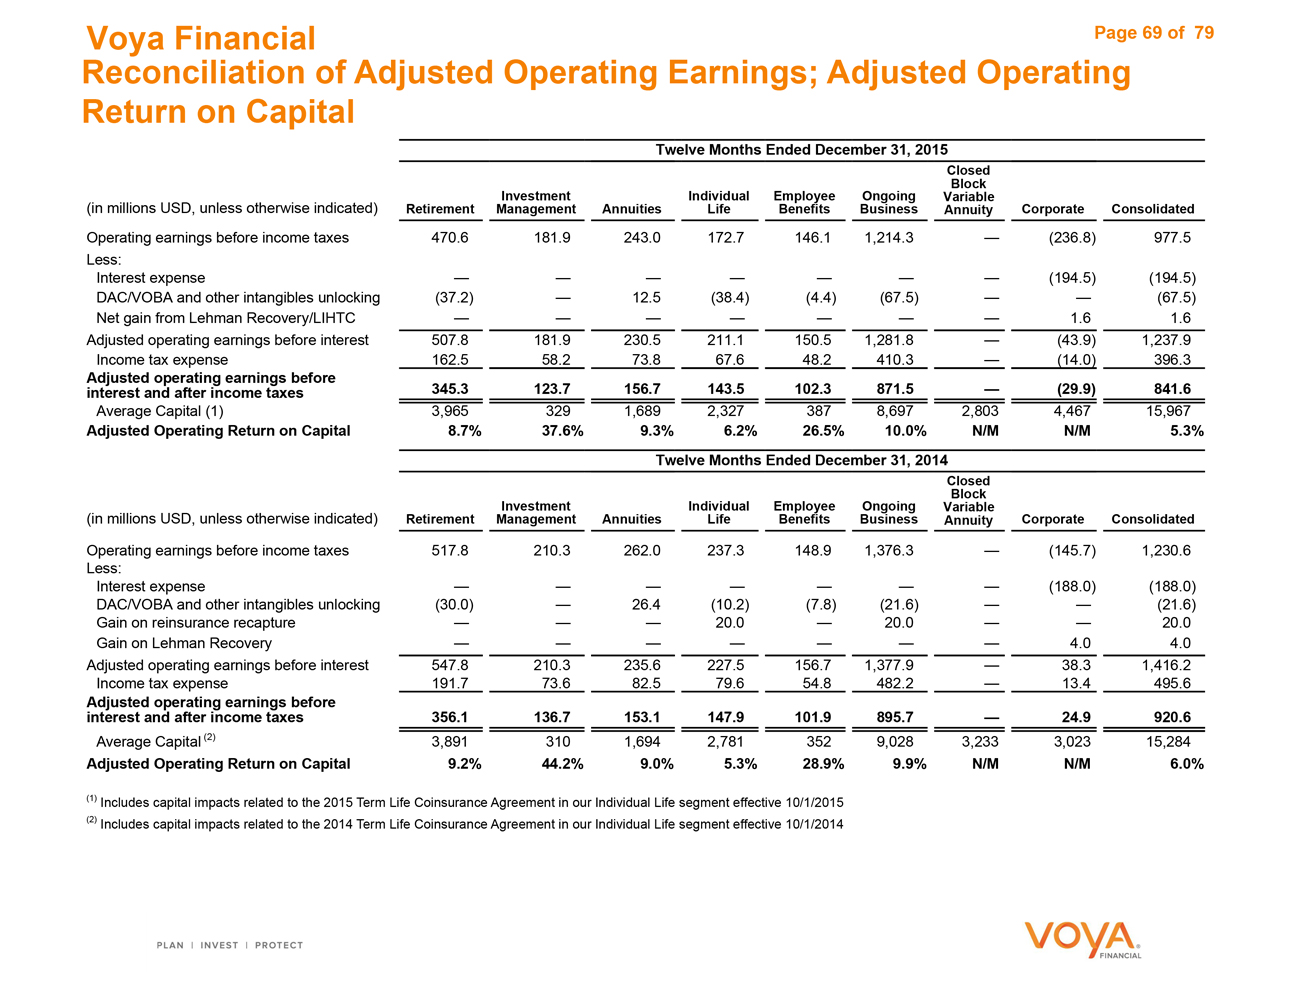
|
Voya Financial Page 69 of 79 Reconciliation of Adjusted Operating Earnings; Adjusted Operating Return on Capital Twelve Months Ended December 31, 2015 Closed Block Investment Individual Employee Ongoing Variable (in millions USD, unless otherwise indicated)Retirement Management Annuities Life Benefits Business Annuity Corporate Consolidated Operating earnings before income taxes470.6 181.9243.0172.7146.11,214.3—(236.8)977.5 Less: Interest expense— ——————(194.5)(194.5) DAC/VOBA and other intangibles unlocking(37.2) —12.5(38.4)(4.4)(67.5)——(67.5) Net gain from Lehman Recovery/LIHTC— ——————1.61.6 Adjusted operating earnings before interest507.8 181.9230.5211.1150.51,281.8—(43.9)1,237.9 Income tax expense162.5 58.273.867.648.2410.3—(14.0)396.3 Adjusted operating earnings before interest and after income taxes345.3 123.7156.7143.5102.3871.5—(29.9)841.6 Average Capital (1)3,965 3291,6892,3273878,6972,8034,46715,967 Adjusted Operating Return on Capital8.7% 37.6%9.3%6.2%26.5%10.0%N/MN/M5.3% Twelve Months Ended December 31, 2014 Closed Block Investment Individual Employee Ongoing Variable (in millions USD, unless otherwise indicated)Retirement Management Annuities Life Benefits Business Annuity Corporate Consolidated Operating earnings before income taxes517.8 210.3262.0237.3148.91,376.3—(145.7)1,230.6 Less: Interest expense— ——————(188.0)(188.0) DAC/VOBA and other intangibles unlocking(30.0) —26.4(10.2)(7.8)(21.6)——(21.6) Gain on reinsurance recapture— ——20.0—20.0——20.0 Gain on Lehman Recovery— ——————4.04.0 Adjusted operating earnings before interest547.8 210.3235.6227.5156.71,377.9—38.31,416.2 Income tax expense191.7 73.682.579.654.8482.2—13.4495.6 Adjusted operating earnings before interest and after income taxes356.1 136.7153.1147.9101.9895.7—24.9920.6 Average Capital (2)3,891 3101,6942,7813529,0283,2333,02315,284 Adjusted Operating Return on Capital9.2% 44.2%9.0%5.3%28.9%9.9%N/MN/M6.0% (1) Includes capital impacts related to the 2015 Term Life Coinsurance Agreement in our Individual Life segment effective 10/1/2015 (2) Includes capital impacts related to the 2014 Term Life Coinsurance Agreement in our Individual Life segment effective 10/1/2014
|
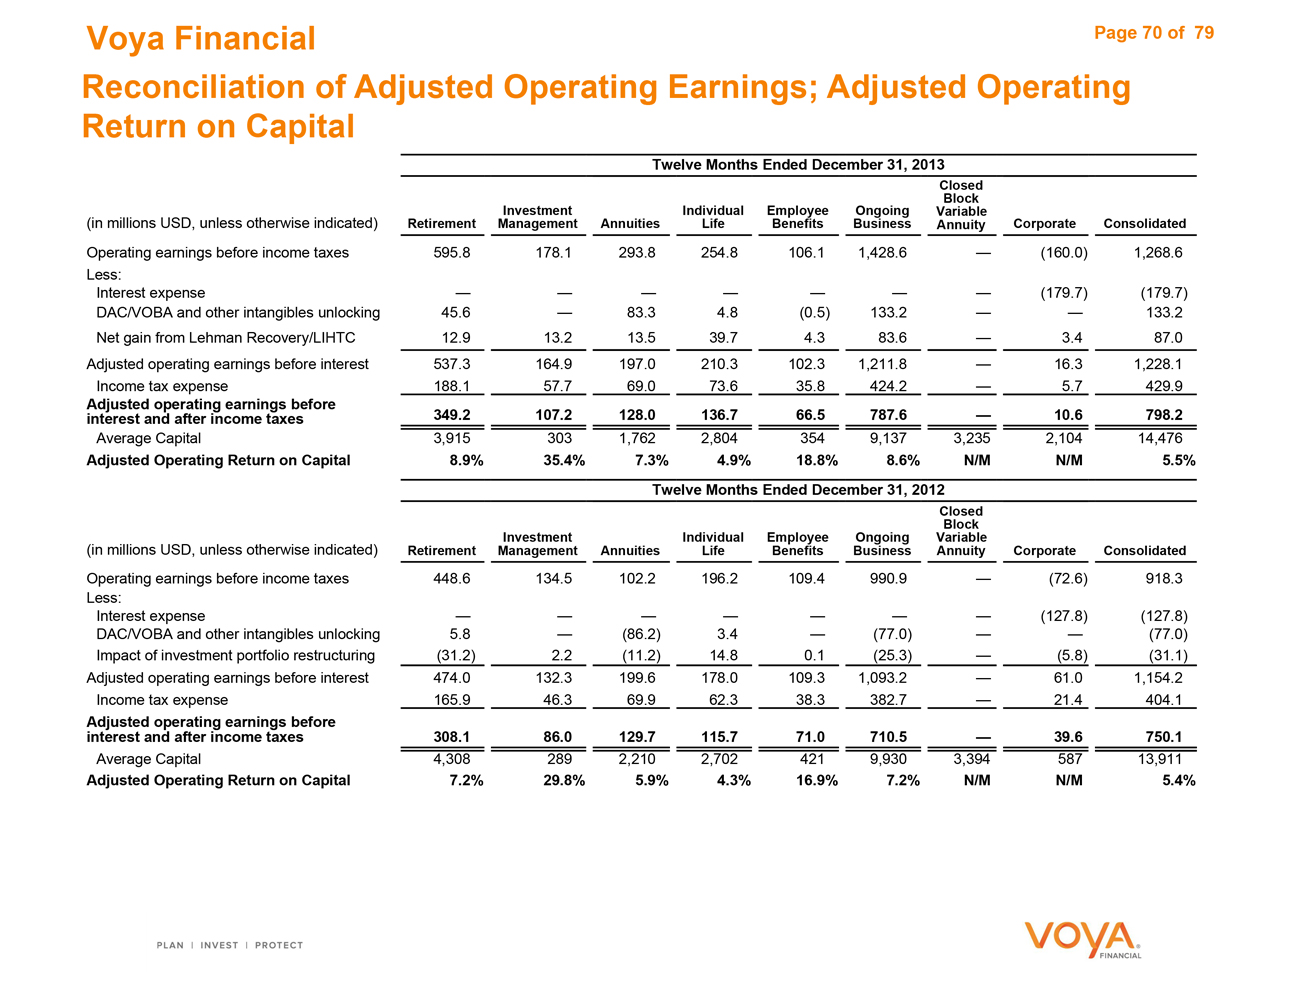
|
Voya Financial Page 70 of 79 Reconciliation of Adjusted Operating Earnings; Adjusted Operating Return on Capital Twelve Months Ended December 31, 2013 Closed Block InvestmentIndividual EmployeeOngoingVariable (in millions USD, unless otherwise indicated)Retirement ManagementAnnuitiesLifeBenefitsBusinessAnnuityCorporateConsolidated Operating earnings before income taxes595.8 178.1293.8254.8106.11,428.6—(160.0)1,268.6 Less: Interest expense— ——————(179.7)(179.7) DAC/VOBA and other intangibles unlocking45.6 —83.34.8(0.5)133.2——133.2 Net gain from Lehman Recovery/LIHTC12.9 13.213.539.74.383.6—3.487.0 Adjusted operating earnings before interest537.3 164.9197.0210.3102.31,211.8—16.31,228.1 Income tax expense188.1 57.769.073.635.8424.2—5.7429.9 Adjusted operating earnings before interest and after income taxes349.2 107.2128.0136.766.5787.6—10.6798.2 Average Capital3,915 3031,7622,8043549,1373,2352,10414,476 Adjusted Operating Return on Capital8.9% 35.4%7.3%4.9%18.8%8.6%N/MN/M5.5% Twelve Months Ended December 31, 2012 Closed Block InvestmentIndividual EmployeeOngoingVariable (in millions USD, unless otherwise indicated)Retirement ManagementAnnuitiesLifeBenefitsBusinessAnnuityCorporateConsolidated Operating earnings before income taxes448.6 134.5102.2196.2109.4990.9—(72.6)918.3 Less: Interest expense— ——————(127.8)(127.8) DAC/VOBA and other intangibles unlocking5.8 —(86.2)3.4—(77.0)——(77.0) Impact of investment portfolio restructuring(31.2) 2.2(11.2)14.80.1(25.3)—(5.8)(31.1) Adjusted operating earnings before interest474.0 132.3199.6178.0109.31,093.2—61.01,154.2 Income tax expense165.9 46.369.962.338.3382.7—21.4404.1 Adjusted operating earnings before interest and after income taxes308.1 86.0129.7115.771.0710.5—39.6750.1 Average Capital4,308 2892,2102,7024219,9303,39458713,911 Adjusted Operating Return on Capital7.2% 29.8%5.9%4.3%16.9%7.2%N/MN/M5.4%
|
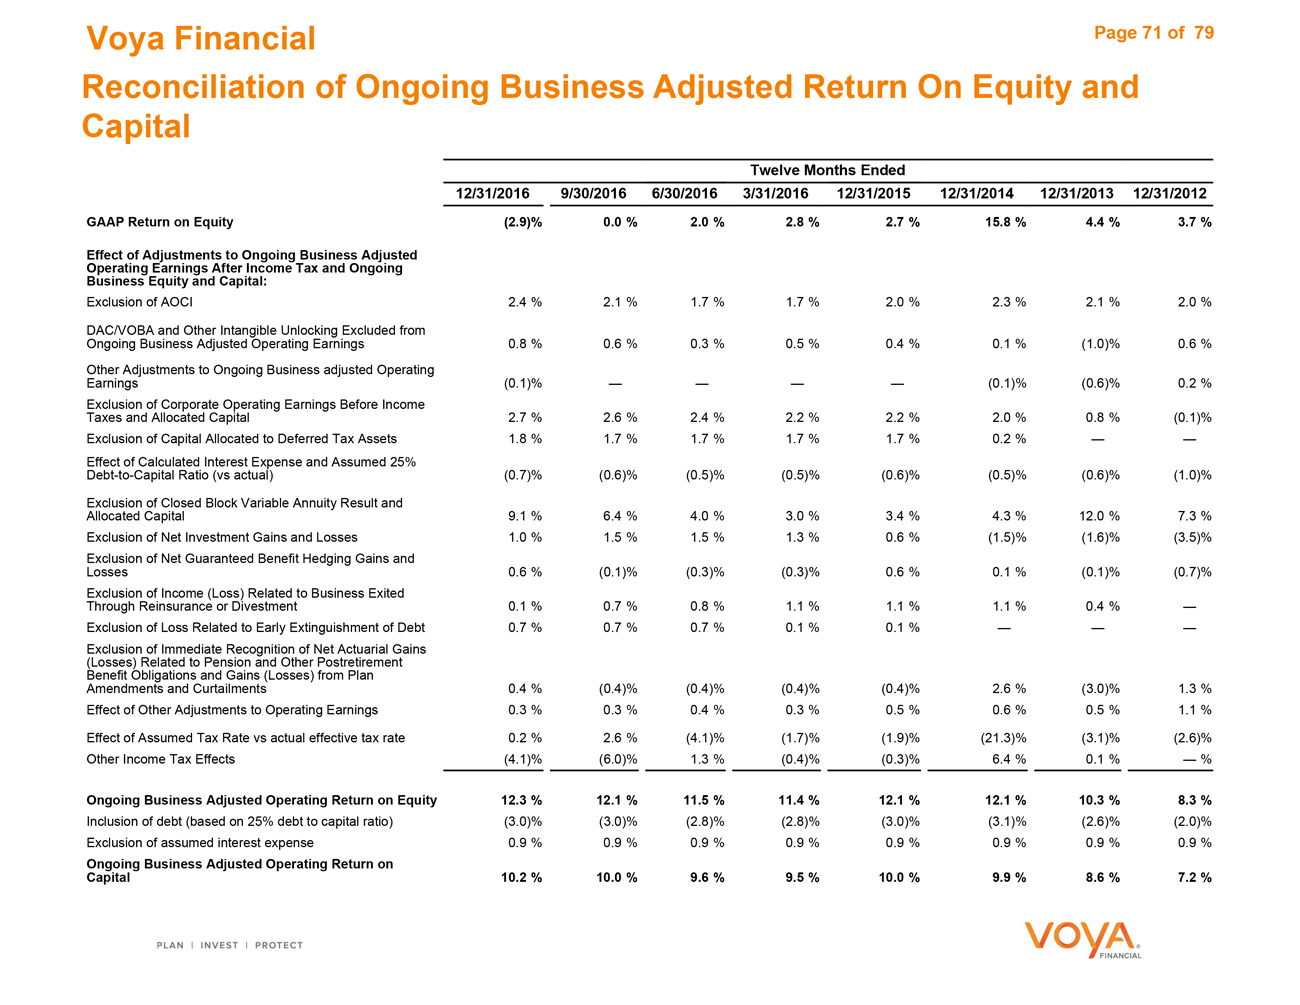
|
Voya Financial Page 71 of 79 Reconciliation of Ongoing Business Adjusted Return On Equity and Capital Twelve Months Ended 12/31/20169/30/20166/30/20163/31/201612/31/201512/31/201412/31/201312/31/2012 GAAP Return on Equity(2.9)% 0.0 %2.0 %2.8 %2.7 %15.8 %4.4 %3.7 % Effect of Adjustments to Ongoing Business Adjusted Operating Earnings After Income Tax and Ongoing Business Equity and Capital: Exclusion of AOCI2.4 % 2.1 %1.7 %1.7 %2.0 %2.3 %2.1 %2.0 % DAC/VOBA and Other Intangible Unlocking Excluded from Ongoing Business Adjusted Operating Earnings0.8 % 0.6 %0.3 %0.5 %0.4 %0.1 %(1.0)%0.6 % Other Adjustments to Ongoing Business adjusted Operating Earnings(0.1)% ————(0.1)%(0.6)%0.2 % Exclusion of Corporate Operating Earnings Before Income Taxes and Allocated Capital2.7 % 2.6 %2.4 %2.2 %2.2 %2.0 %0.8 %(0.1)% Exclusion of Capital Allocated to Deferred Tax Assets1.8 % 1.7 %1.7 %1.7 %1.7 %0.2 %—— Effect of Calculated Interest Expense and Assumed 25% Debt-to-Capital Ratio (vs actual)(0.7)% (0.6)%(0.5)%(0.5)%(0.6)%(0.5)%(0.6)%(1.0)% Exclusion of Closed Block Variable Annuity Result and Allocated Capital9.1 % 6.4 %4.0 %3.0 %3.4 %4.3 %12.0 %7.3 % Exclusion of Net Investment Gains and Losses1.0 % 1.5 %1.5 %1.3 %0.6 %(1.5)%(1.6)%(3.5)% Exclusion of Net Guaranteed Benefit Hedging Gains and Losses0.6 % (0.1)%(0.3)%(0.3)%0.6 %0.1 %(0.1)%(0.7)% Exclusion of Income (Loss) Related to Business Exited Through Reinsurance or Divestment0.1 % 0.7 %0.8 %1.1 %1.1 %1.1 %0.4 %— Exclusion of Loss Related to Early Extinguishment of Debt0.7 % 0.7 %0.7 %0.1 %0.1 %——— Exclusion of Immediate Recognition of Net Actuarial Gains (Losses) Related to Pension and Other Postretirement Benefit Obligations and Gains (Losses) from Plan Amendments and Curtailments0.4 % (0.4)%(0.4)%(0.4)%(0.4)%2.6 %(3.0)%1.3 % Effect of Other Adjustments to Operating Earnings0.3 % 0.3 %0.4 %0.3 %0.5 %0.6 %0.5 %1.1 % Effect of Assumed Tax Rate vs actual effective tax rate0.2 % 2.6 %(4.1)%(1.7)%(1.9)%(21.3)%(3.1)%(2.6)% Other Income Tax Effects(4.1)% (6.0)%1.3 %(0.4)%(0.3)%6.4 %0.1 %— % Ongoing Business Adjusted Operating Return on Equity12.3 % 12.1 %11.5 %11.4 %12.1 %12.1 %10.3 %8.3 % Inclusion of debt (based on 25% debt to capital ratio)(3.0)% (3.0)%(2.8)%(2.8)%(3.0)%(3.1)%(2.6)%(2.0)% Exclusion of assumed interest expense0.9 % 0.9 %0.9 %0.9 %0.9 %0.9 %0.9 %0.9 % Ongoing Business Adjusted Operating Return on Capital10.2 % 10.0 %9.6 %9.5 %10.0 %9.9 %8.6 %7.2 %
|
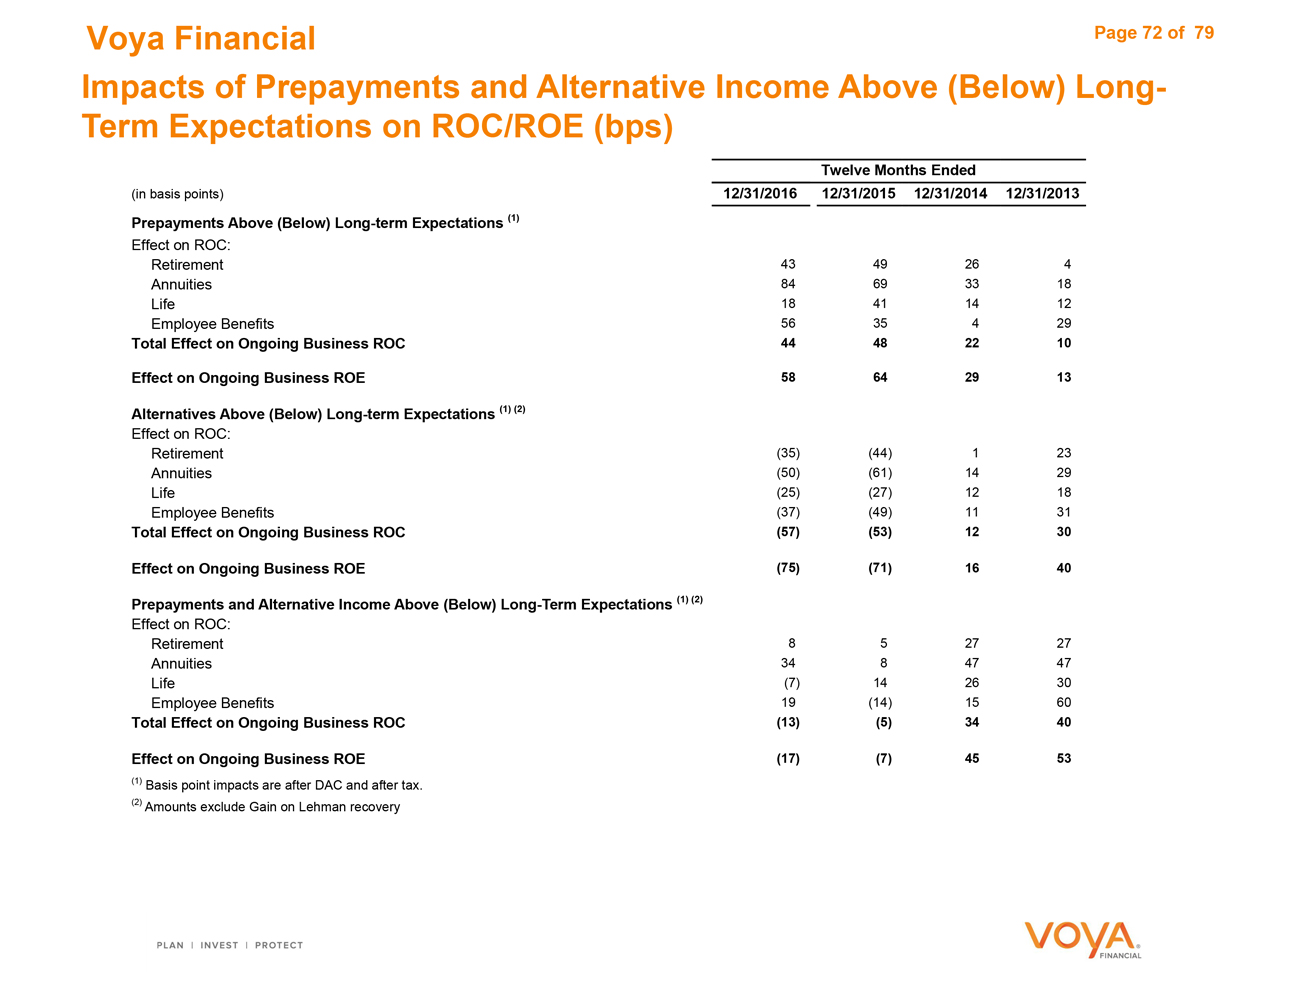
|
Voya Financial Page 72 of79 Impacts of Prepayments and Alternative Income Above (Below) Long- Term Expectations on ROC/ROE (bps) Twelve Months Ended (in basis points)12/31/2016 12/31/201512/31/201412/31/2013 Prepayments Above (Below) Long-term Expectations (1) Effect on ROC: Retirement43 49264 Annuities84 693318 Life18 411412 Employee Benefits56 35429 Total Effect on Ongoing Business ROC44 482210 Effect on Ongoing Business ROE58 642913 Alternatives Above (Below) Long-term Expectations (1) (2) Effect on ROC: Retirement(35) (44)123 Annuities(50) (61)1429 Life(25) (27)1218 Employee Benefits(37) (49)1131 Total Effect on Ongoing Business ROC(57) (53)1230 Effect on Ongoing Business ROE(75) (71)1640 Prepayments and Alternative Income Above (Below) Long-Term Expectations (1) (2) Effect on ROC: Retirement8 52727 Annuities34 84747 Life(7) 142630 Employee Benefits19 (14)1560 Total Effect on Ongoing Business ROC(13) (5)3440 Effect on Ongoing Business ROE(17) (7)4553 (1) Basis point impacts are after DAC and after tax. (2) Amounts exclude Gain on Lehman recovery
|
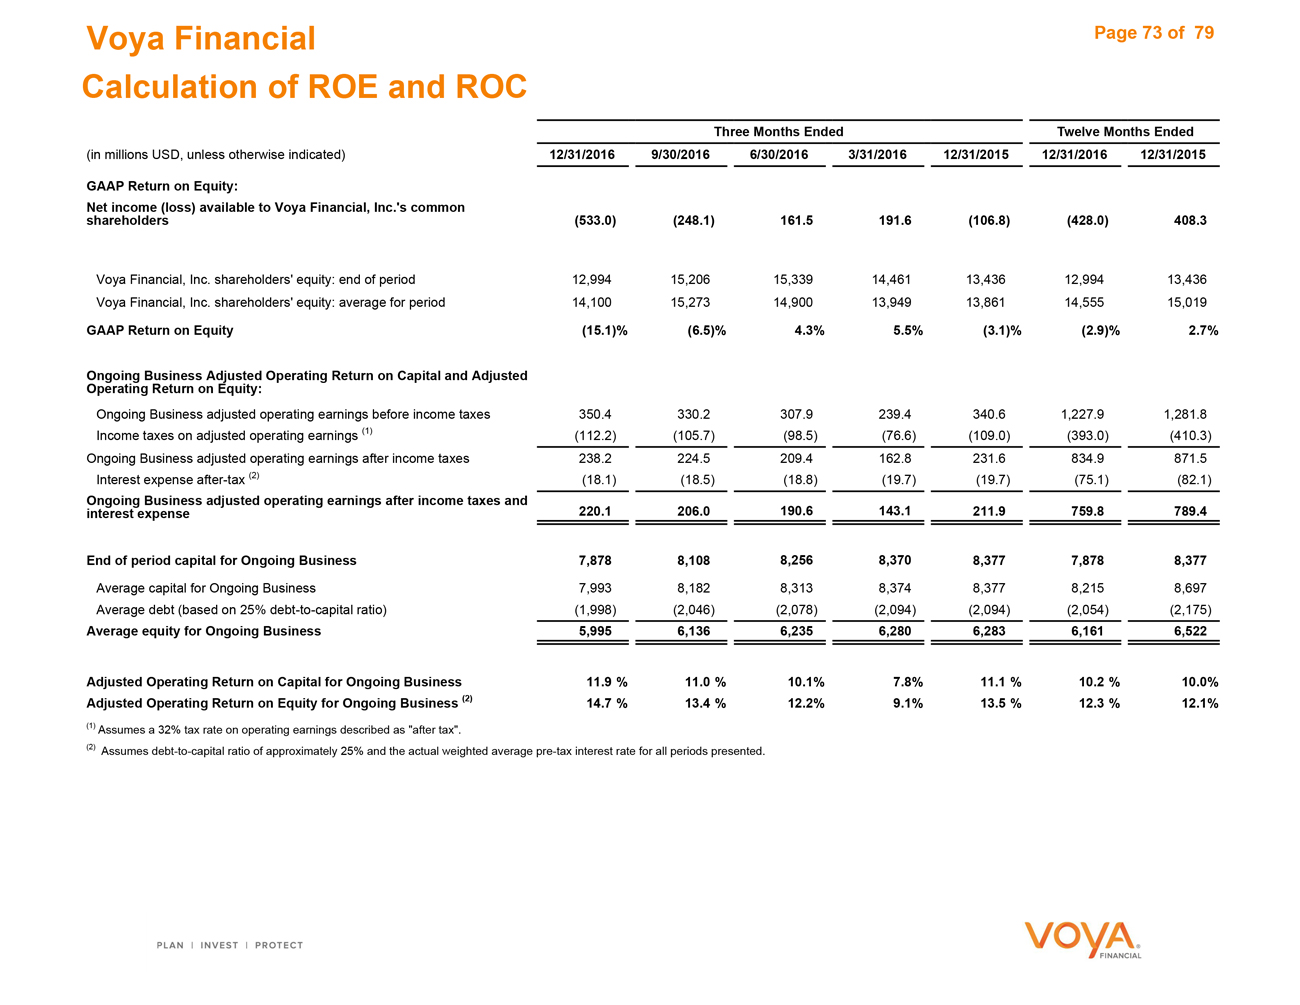
|
Voya Financial Page 73 of 79 Calculation of ROE and ROC Three Months EndedTwelve Months Ended (in millions USD, unless otherwise indicated)12/31/2016 9/30/20166/30/20163/31/201612/31/201512/31/201612/31/2015 GAAP Return on Equity: Net income (loss) available to Voya Financial, Inc.’s common shareholders(533.0) (248.1)161.5191.6(106.8)(428.0)408.3 Voya Financial, Inc. shareholders’ equity: end of period12,994 15,20615,33914,46113,43612,99413,436 Voya Financial, Inc. shareholders’ equity: average for period14,100 15,27314,90013,94913,86114,55515,019 GAAP Return on Equity(15.1)% (6.5)%4.3%5.5%(3.1)%(2.9)%2.7% Ongoing Business Adjusted Operating Return on Capital and Adjusted Operating Return on Equity: Ongoing Business adjusted operating earnings before income taxes350.4 330.2307.9239.4340.61,227.91,281.8 Income taxes on adjusted operating earnings (1)(112.2) (105.7)(98.5)(76.6)(109.0)(393.0)(410.3) Ongoing Business adjusted operating earnings after income taxes238.2 224.5209.4162.8231.6834.9871.5 Interest expense after-tax (2)(18.1) (18.5)(18.8)(19.7)(19.7)(75.1)(82.1) Ongoing Business adjusted operating earnings after income taxes and interest expense220.1 206.0190.6143.1211.9759.8789.4 End of period capital for Ongoing Business7,878 8,1088,2568,3708,3777,8788,377 Average capital for Ongoing Business7,993 8,1828,3138,3748,3778,2158,697 Average debt (based on 25% debt-to-capital ratio)(1,998) (2,046)(2,078)(2,094)(2,094)(2,054)(2,175) Average equity for Ongoing Business5,995 6,1366,2356,2806,2836,1616,522 Adjusted Operating Return on Capital for Ongoing Business11.9 % 11.0 %10.1%7.8%11.1 %10.2 %10.0% Adjusted Operating Return on Equity for Ongoing Business (2)14.7 % 13.4 %12.2%9.1%13.5 %12.3 %12.1% (1) Assumes a 32% tax rate on operating earnings described as “after tax”. (2) Assumes debt-to-capital ratio of approximately 25% and the actual weighted average pre-tax interest rate for all periods presented.
|
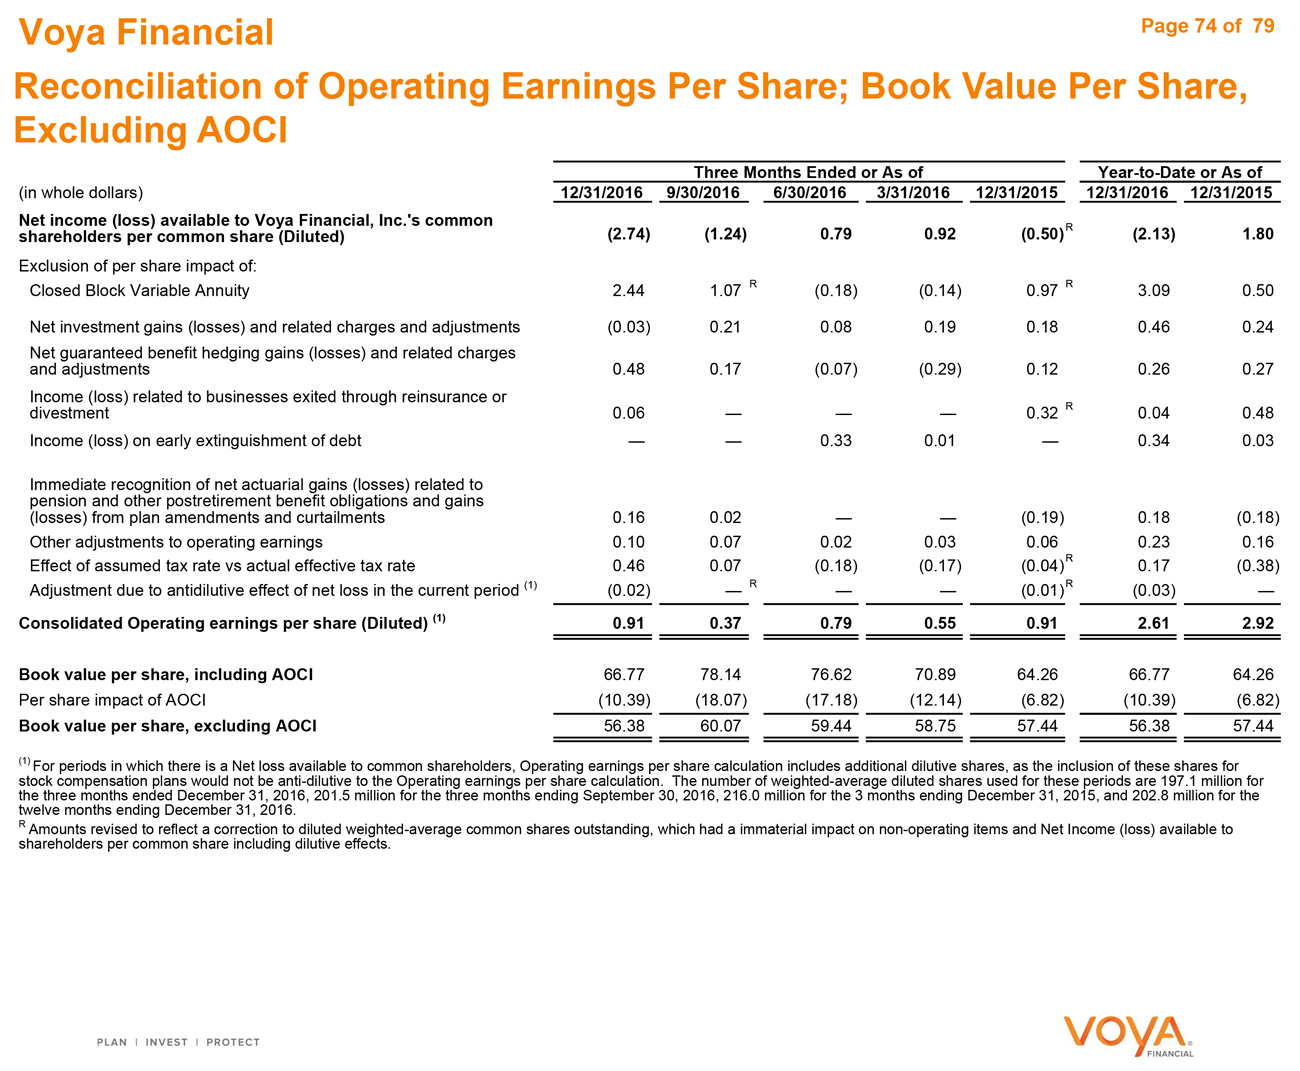
|
Voya Financial
Reconciliation of Operating Earnings Per Share; Book Value Per Share, Excluding AOCI
Page 74 of 79
Three Months Ended or As of Year-to-Date or As of
(in whole dollars) 12/31/2016 9/30/2016 6/30/2016 3/31/2016 12/31/2015 12/31/2016 12/31/2015
Net income (loss) available to Voya Financial, Inc.’s common R
shareholders per common share (Diluted) (2.74) (1.24) 0.79 0.92 (0.50) (2.13) 1.80
Exclusion of per share impact of:
Closed Block Variable Annuity 2.44 1.07 R (0.18) (0.14) 0.97 R 3.09 0.50
Net investment gains (losses) and related charges and adjustments (0.03) 0.21 0.08 0.19 0.18 0.46 0.24
Net guaranteed benefit hedging gains (losses) and related charges
and adjustments 0.48 0.17 (0.07) (0.29) 0.12 0.26 0.27
Income (loss) related to businesses exited through reinsurance or
divestment 0.06 — — — 0.32 R 0.04 0.48
Income (loss) on early extinguishment of debt — — 0.33 0.01 — 0.34 0.03
Immediate recognition of net actuarial gains (losses) related to
pension and other postretirement benefit obligations and gains
(losses) from plan amendments and curtailments 0.16 0.02 — — (0.19) 0.18 (0.18)
Other adjustments to operating earnings 0.10 0.07 0.02 0.03 0.06 0.23 0.16
Effect of assumed tax rate vs actual effective tax rate 0.46 0.07 (0.18) (0.17) (0.04) R 0.17 (0.38)
Adjustment due to antidilutive effect of net loss in the current period (1) (0.02) — R — — (0.01) R (0.03) —
Consolidated Operating earnings per share (Diluted) (1) 0.91 0.37 0.79 0.55 0.91 2.61 2.92
Book value per share, including AOCI 66.77 78.14 76.62 70.89 64.26 66.77 64.26
Per share impact of AOCI (10.39) (18.07) (17.18) (12.14) (6.82) (10.39) (6.82)
Book value per share, excluding AOCI 56.38 60.07 59.44 58.75 57.44 56.38 57.44
(1) For periods in which there is a Net loss available to common shareholders, Operating earnings per share calculation includes additional dilutive shares, as the inclusion of these shares for stock compensation plans would not be anti-dilutive to the Operating earnings per share calculation. The number of weighted-average diluted shares used for these periods are 197.1 million for the three months ended December 31, 2016, 201.5 million for the three months ending September 30, 2016, 216.0 million for the 3 months ending December 31, 2015, and 202.8 million for the twelve months ending December 31, 2016.
R Amounts revised to reflect a correction to diluted weighted-average common shares outstanding, which had a immaterial impact on non-operating items and Net Income (loss) available to shareholders per common share including dilutive effects.
Voya Financial Page 75 of 79
Reconciliation of Average Capital; Debt to Capital, Excluding AOCI
Three Months EndedTwelve Months Ended or As of
(in millions USD, unless otherwise indicated) 12/31/2016 9/30/20166/30/20163/31/201612/31/201512/31/201412/31/201312/31/2012
Voya Financial, Inc. shareholders’ equity: end
of period 12,993.9 15,206.015,338.914,461.313,435.816,146.213,315.213,919.9
AOCI 2,021.7 3,517.13,439.72,476.21,424.93,103.71,849.13,710.7
Voya Financial, Inc. shareholders’ equity
excluding AOCI end of period 10,972.2 11,688.911,899.211,985.112,010.913,042.511,466.110,209.2
Long—Term Debt 3,549.5 3,548.53,547.53,455.93,459.83,486.53,481.13,796.3
End of Period Capital 14,521.7 15,237.415,446.715,441.015,470.716,529.014,947.214,005.5
Corporate and Closed Block Variable Annuity 6,643.7 7,129.47,190.77,071.07,093.77,752.05,731.24,182.5
End of Period Capital for Ongoing Business 7,878.0 8,108.08,256.08,370.08,377.08,777.09,216.09,823.0
Adjustments to TTM Average Capital (1) 337.0 204.0197.0217.0320.0251.0(79.0)107.0
Average Capital for OngoingBusiness-TTM (1) 8,215.0 8,312.08,453.08,587.08,697.09,028.09,137.09,930.0
Debt to capital, including AOCI 21.5% 18.9%18.8%19.3%20.5%17.8%20.7%21.4%
Capital impact of AOCI 2.9% 4.4%4.2%3.1%1.9%3.3%2.6%5.7%
Debt to capital, excluding AOCI 24.4% 23.3%23.0%22.4%22.4%21.1%23.3%27.1%
(1) Trailing Twelve Months Calculation
Voya Financial Page 76 of 79
Reconciliation of Investment Management Operating Margin, Excluding
Investment Capital
Three Months Ended Twelve Months Ended
(in millions USD, unless otherwise indicated) 12/31/2016 9/30/201612/31/201512/31/201612/31/201512/31/201412/31/201312/31/2012
Operating revenues (1) 188.9 160.4147.9623.9622.2655.4594.5545.5
Operating expenses (124.3) (111.5)(105.5)(455.9)(440.3)(445.1)(429.6)(411.0)
Operating earnings before income taxes 64.6 48.942.4168.0181.9210.3164.9134.5
Operating margin 34.2% 30.5%28.7%26.9%29.2%32.1%27.7%24.6%
Operating revenues (1) 188.9 160.4147.9623.9622.2655.4594.5545.5
Less:
Investment Capital Results (1) 8.4 4.1(8.8)(10.8)1.119.723.841.6
Revenues excluding Investment Capital 180.5 156.3156.7634.7621.1635.7570.7503.9
Operating expenses (124.3) (111.5)(105.5)(455.9)(440.3)(445.1)(429.6)(411.0)
Operating earnings excluding Investment
Capital 56.2 44.851.2178.8180.8190.6141.192.9
Operating margin excluding Investment Capital 31.1% 28.7%32.7%28.2%29.1%30.0%24.7%18.4%
(1) Excludes gain from Lehman recovery in 2013 and 2016.
Additional Information
|

|
Voya Financial Page 78 of 79 Fixed Maturity Securities—Businesses Exited Through Reinsurance Balances as of (in millions USD)12/31/2016 9/30/20166/30/20163/31/201612/31/2015 Fixed Maturity Securities—Businesses Exited Through Reinsurance By Security Sector: U.S. Government agencies and authorities29.3 31.257.858.649.7 U.S. Corporate—Public1,012.6 1,083.61,156.11,075.11,064.7 Foreign Government / Agency— ———— Foreign Corporate—Public151.1 158.5171.0166.7175.9 State, municipalities and political subdivisions120.5 131.2135.7129.588.4 Residential mortgaged-backed securities: Agency45.6 48.951.648.828.5 Non—Agency115.9 116.771.829.573.3 Total Residential mortgage-backed securities161.5 165.6123.478.3101.8 Commercial mortgage-backed securities128.7 136.3139.4126.5120.0 Other asset-backed securities16.6 17.013.143.723.9 Total fixed maturities, including securities pledged (1)1,620.3 1,723.41,796.51,678.41,624.4 Fixed Maturity Securities—Businesses Exited Through Reinsurance Balance as of December 31, 2016 By ARO Rating:Total AAAAAABBBBBB & Below Residential mortgaged-backed securities: Agency45.6 45.6————— Non—Agency115.9 ——0.10.1—115.7 Total Residential mortgage-backed securities161.5 45.6—0.10.1—115.7 Commercial mortgage-backed securities128.7 42.661.418.4——6.3 Other asset-backed securities16.6 16.6————— Total Structured securities306.8 104.861.418.50.1—122.0 Non-structured securities1,313.5 59.6183.7624.8443.02.4— Total fixed maturities, including securities pledged (1)1,620.3 164.4245.1643.3443.12.4122.0 Fixed Maturity Securities—Businesses Exited Through Reinsurance Balance as of December 31, 2016 By NAIC Designation:Total 123456 Residential mortgaged-backed securities: Agency45.6 45.6————— Non—Agency115.9 115.9————— Total Residential mortgage-backed securities161.5 161.5————— Commercial mortgage-backed securities128.7 128.7————— Other asset-backed securities16.6 16.6————— Total Structured securities306.8 306.8————— Non-structured securities1,313.5 868.5442.62.4——— Total fixed maturities, including securities pledged (1)1,620.3 1,175.3442.62.4——— (1) Total investments, after consolidation (refer to the “Portfolio Composition” page), include amounts related to businesses exited through reinsurance where assets are retained on the Company’s balance sheet.
|
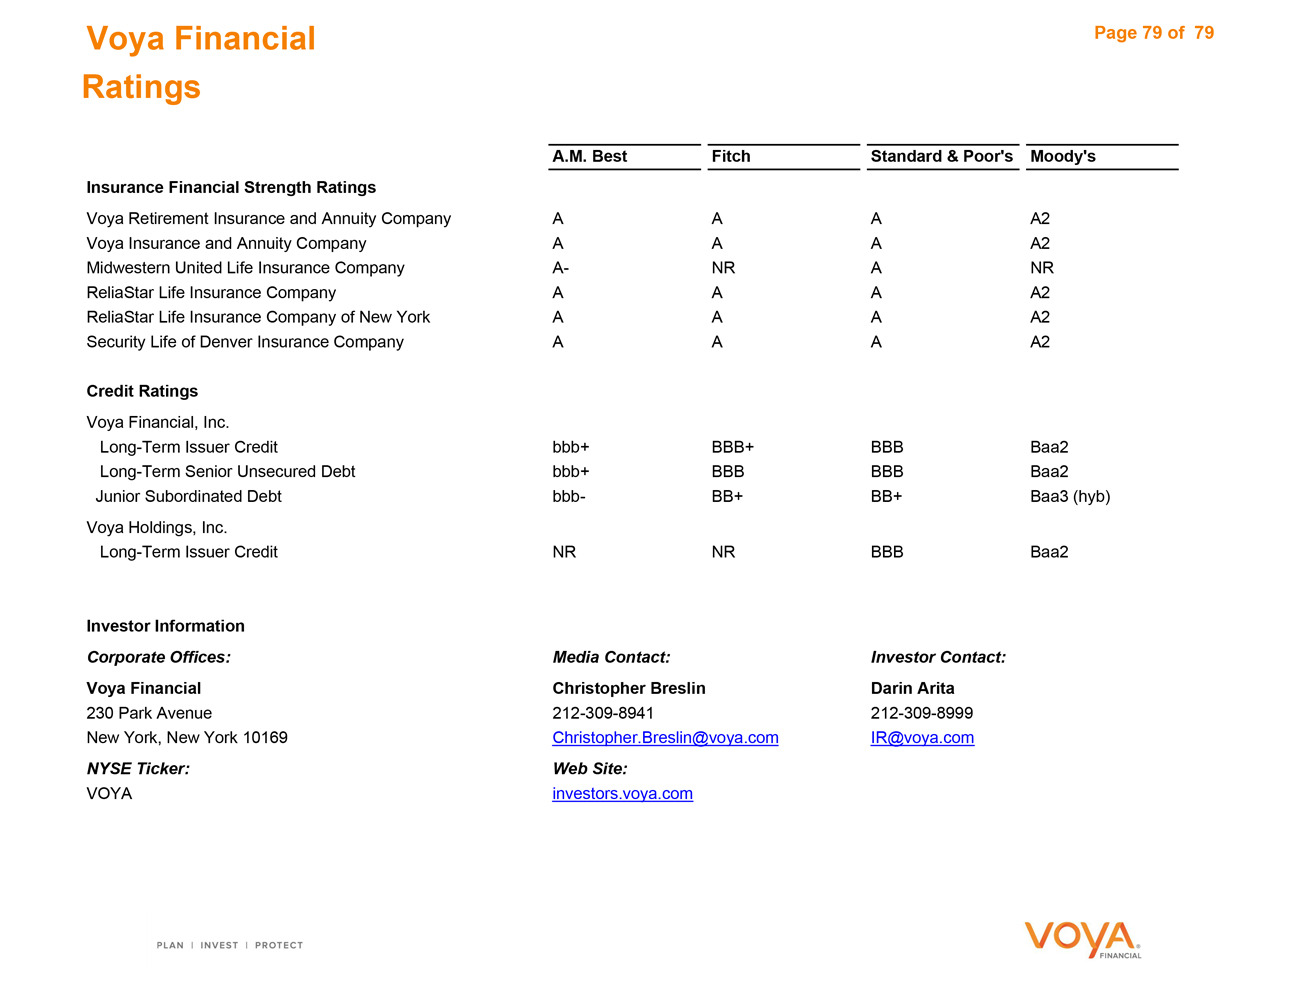
|
Voya Financial Page 79 of79
Ratings
A.M. Best FitchStandard & Poor’sMoody’s
Insurance Financial Strength Ratings
Voya Retirement Insurance and Annuity Company A AAA2
Voya Insurance and Annuity Company A AAA2
Midwestern United Life Insurance Company A- NRANR
ReliaStar Life Insurance Company A AAA2
ReliaStar Life Insurance Company of New York A AAA2
Security Life of Denver Insurance Company A AAA2
Credit Ratings
Voya Financial, Inc.
Long-Term Issuer Credit bbb+ BBB+BBBBaa2
Long-Term Senior Unsecured Debt bbb+ BBBBBBBaa2
Junior Subordinated Debt bbb- BB+BB+Baa3 (hyb)
Voya Holdings, Inc.
Long-Term Issuer Credit NR NRBBBBaa2
Investor Information
Corporate Offices: Media Contact: Investor Contact:
Voya Financial Christopher Breslin Darin Arita
230 ParkAvenue 212-309-8941212-309-8999
New York, New York 10169 Christopher.Breslin@voya.com IR@voya.com
NYSE Ticker: Web Site:
VOYA investors.voya.com