|
Exhibit 99.2 
|
Quarterly Investor Supplement
June 30, 2017
This report should be read in conjunction with Voya Financial, Inc.‘s Quarterly Report on Form10-Q for the Three months ended June 30, 2017. Voya Financial’s Annual Reports on Form10-K, and Quarterly Reports on Form10-Q, can be accessed upon filing at the Securities and Exchange Commission’s website at www.sec.gov, and at our website at investors.voya.com. All information is unaudited.
Corporate Offices: Media Contact: Investor Contact:
Voya Financial Christopher Breslin Darin Arita 230 Park Avenue212-309-8941212-309-8999 New York, New York 10169 Christopher.Breslin@voya.com IR@voya.com
NYSE Ticker: Web Site:
VOYA investors.voya.com
Table of Contents
Page Page
Consolidated Corporate
Explanatory Note onNon-GAAP Financial Information 3—5 Operating Earnings34
Key Metrics 6 Closed Block Variable Annuity
Consolidated Statements of Operations 7 Closed Block Variable Annuity Income (Loss) Before Income Taxes36
Consolidated Earnings Before Income Taxes 8 Closed Block Variable Annuity Death and Living Benefits37
Operating Earnings by Segment (QTD) 9 Investment Information
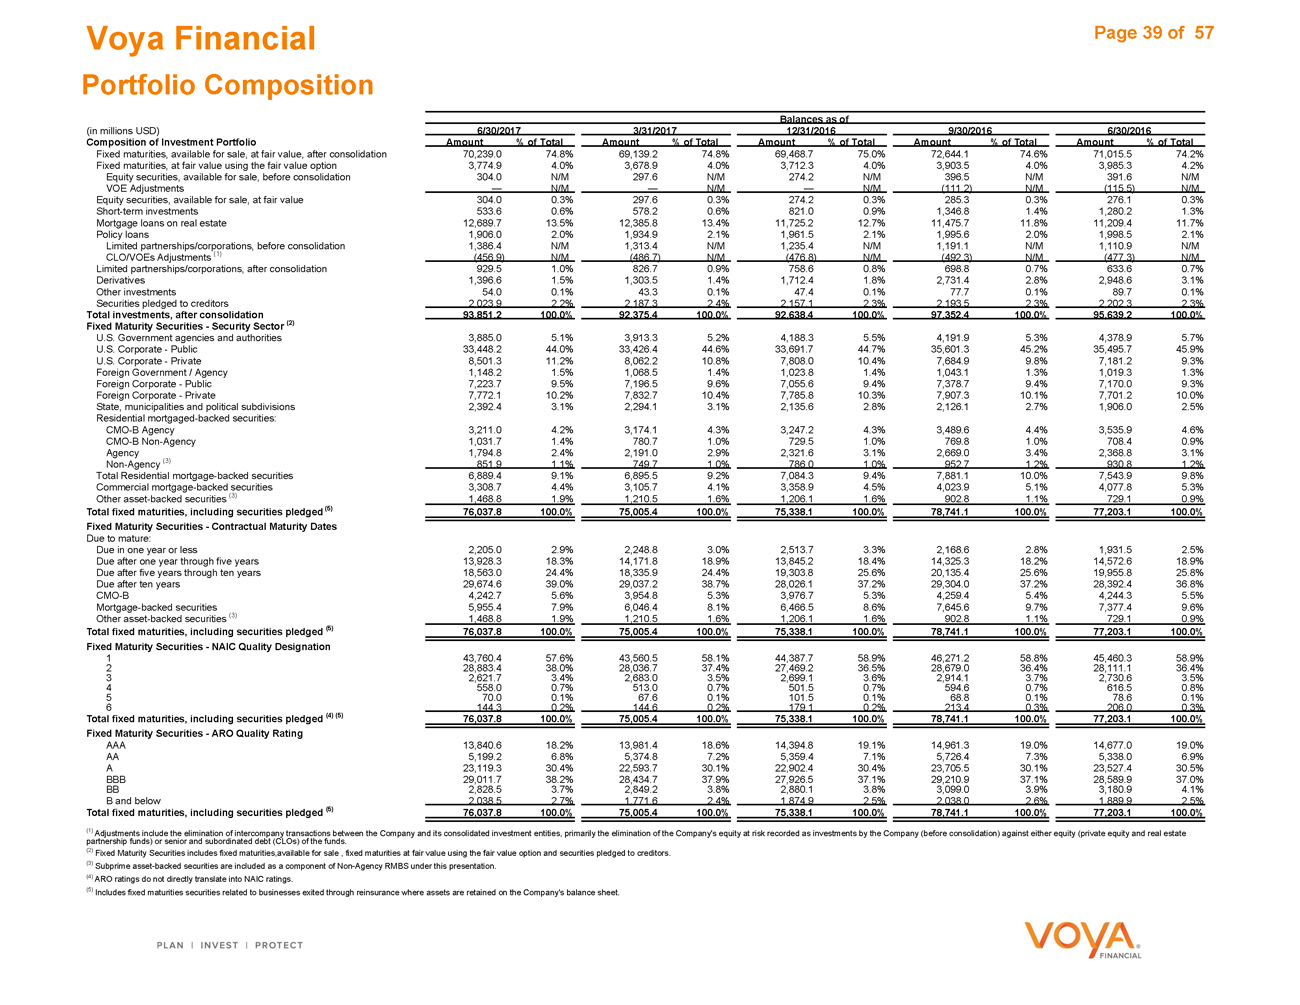
Operating Earnings by Segment (YTD) 10 Portfolio Composition39
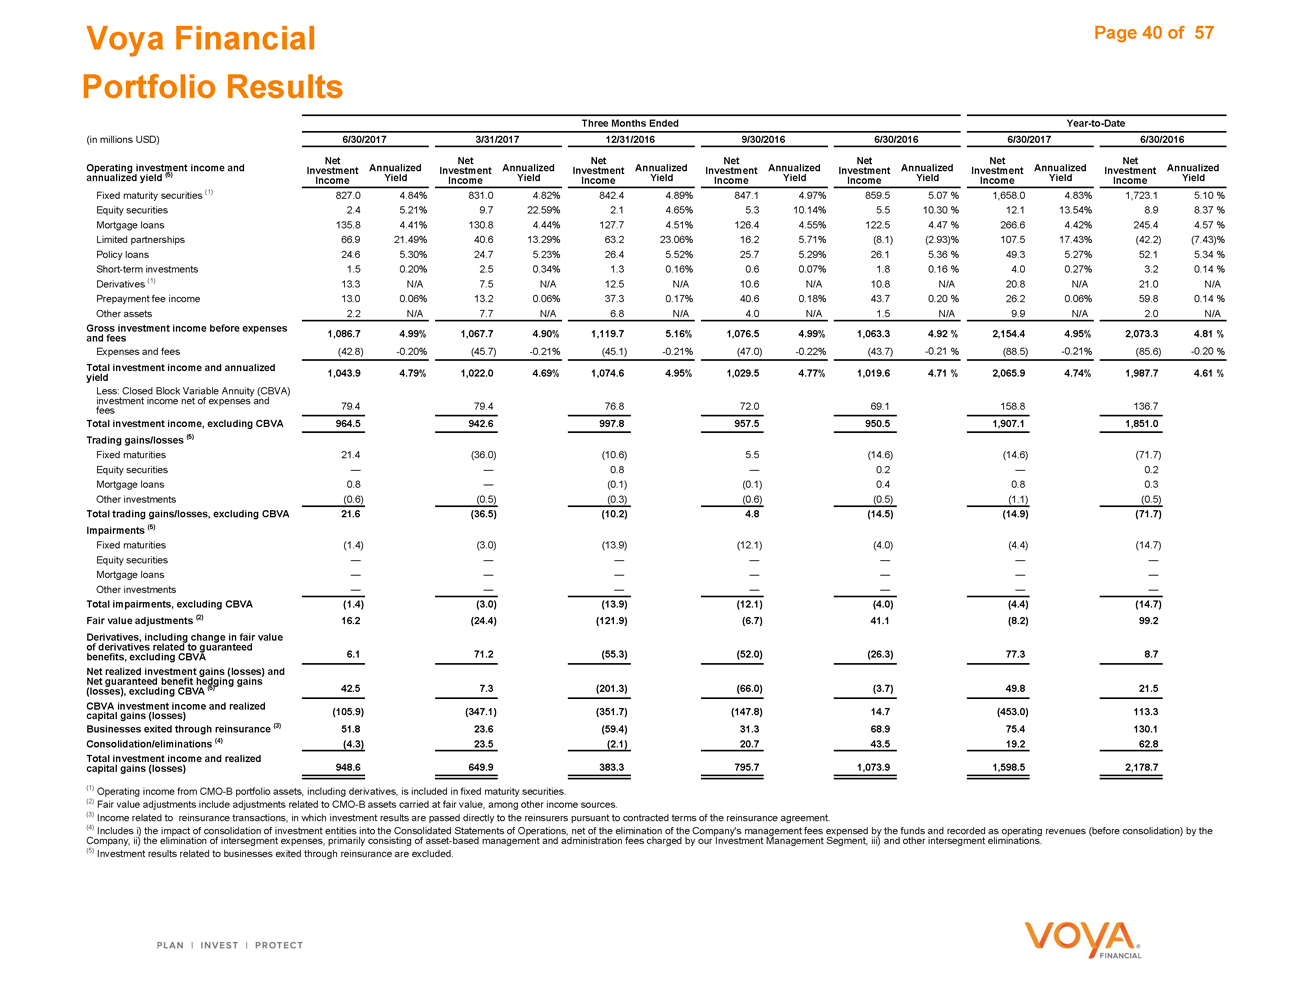
Consolidated Balance Sheets 11 Portfolio Results40
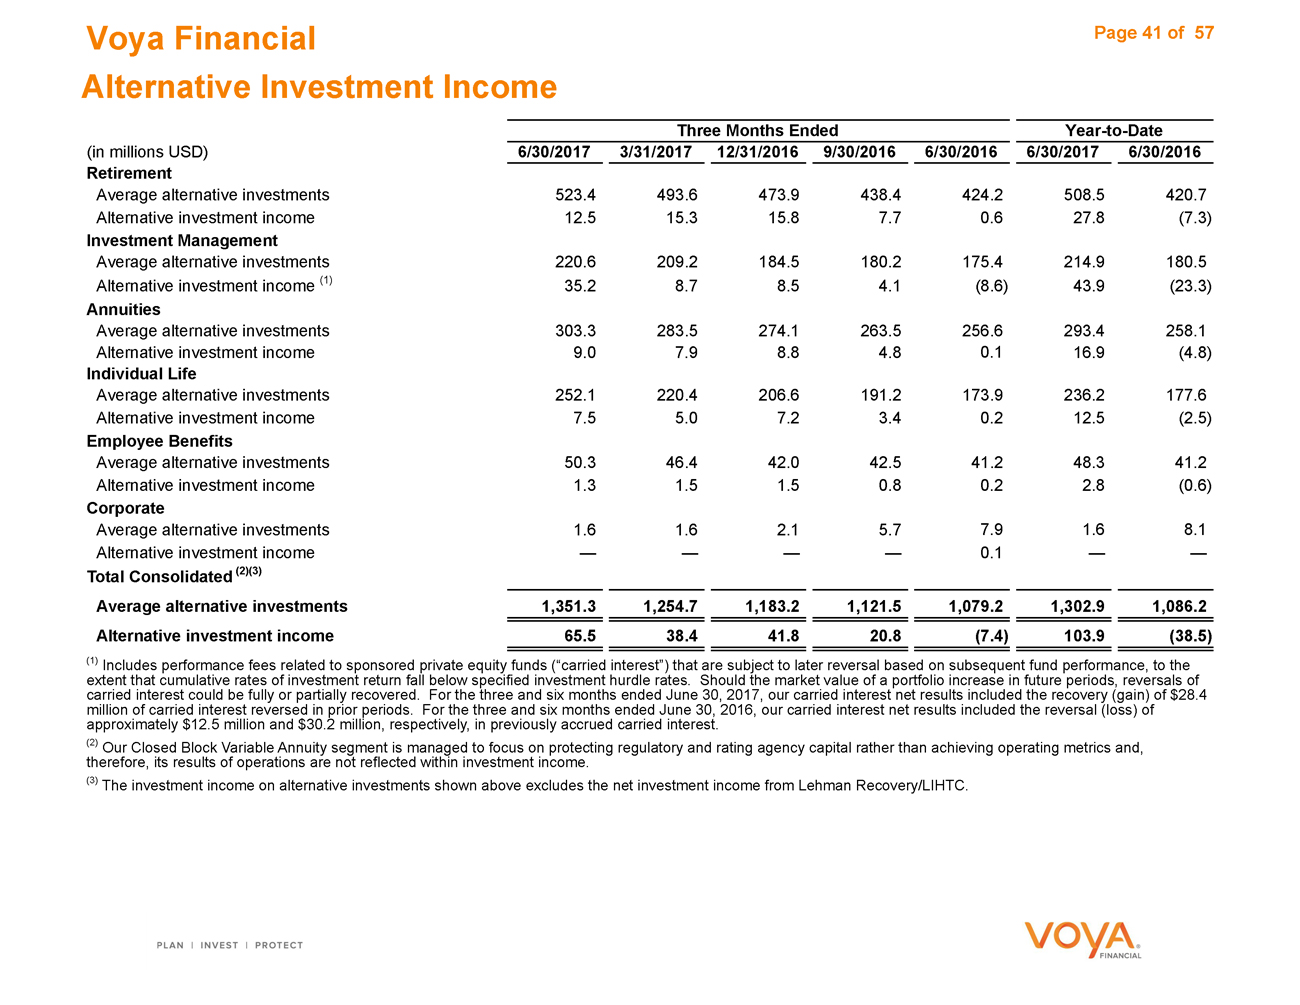
Adjusted Operating Earnings Before Interest, After Income Taxes 12 Alternative Investment Income41
DAC/VOBA Segment Trends 13 Reconciliations
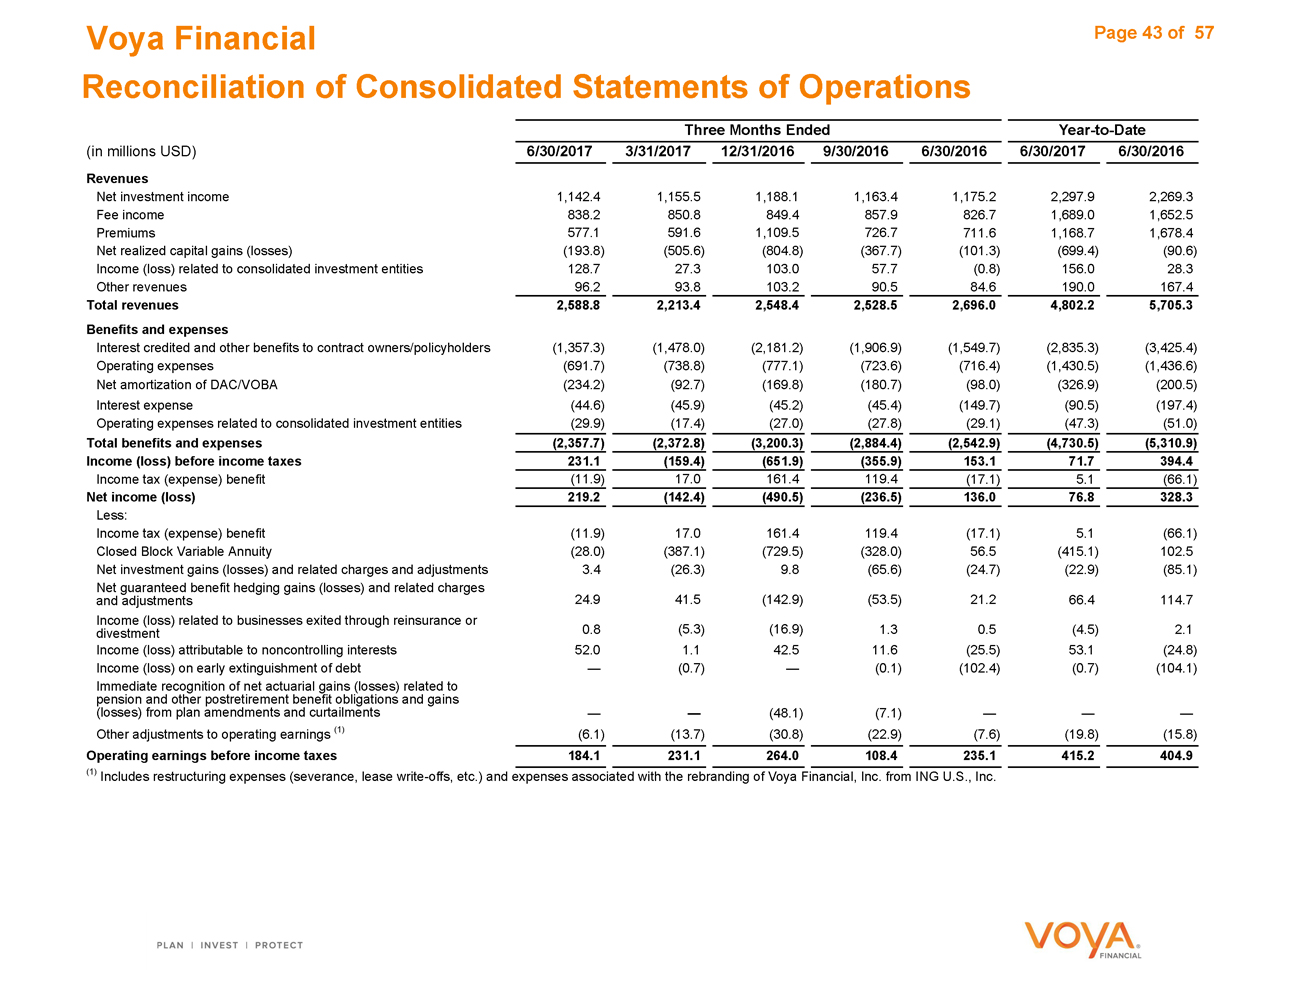
Consolidated Capital Structure 14 Reconciliation of Operating Revenues and Earnings by Segment43
Consolidated Assets Under Management/Assets Under Administration 15 Reconciliation of Operating Revenues by Segment44
Retirement Reconciliation of Ongoing Business Adjusted Operating Earnings to Net
Sources of Operating Earnings 17 Income (Loss)45—46
Assets Under Management Rollforward 18 Reconciliation of Adjusted Operating Earnings47—48
Investment Management Reconciliation of Adjusted Operating Earnings and Calculation of
Sources of Operating Earnings 20 Adjusted Operating Return on Capital49—51
Key Metrics 21 Reconciliation of Ongoing Business Adjusted ROE and Capital52
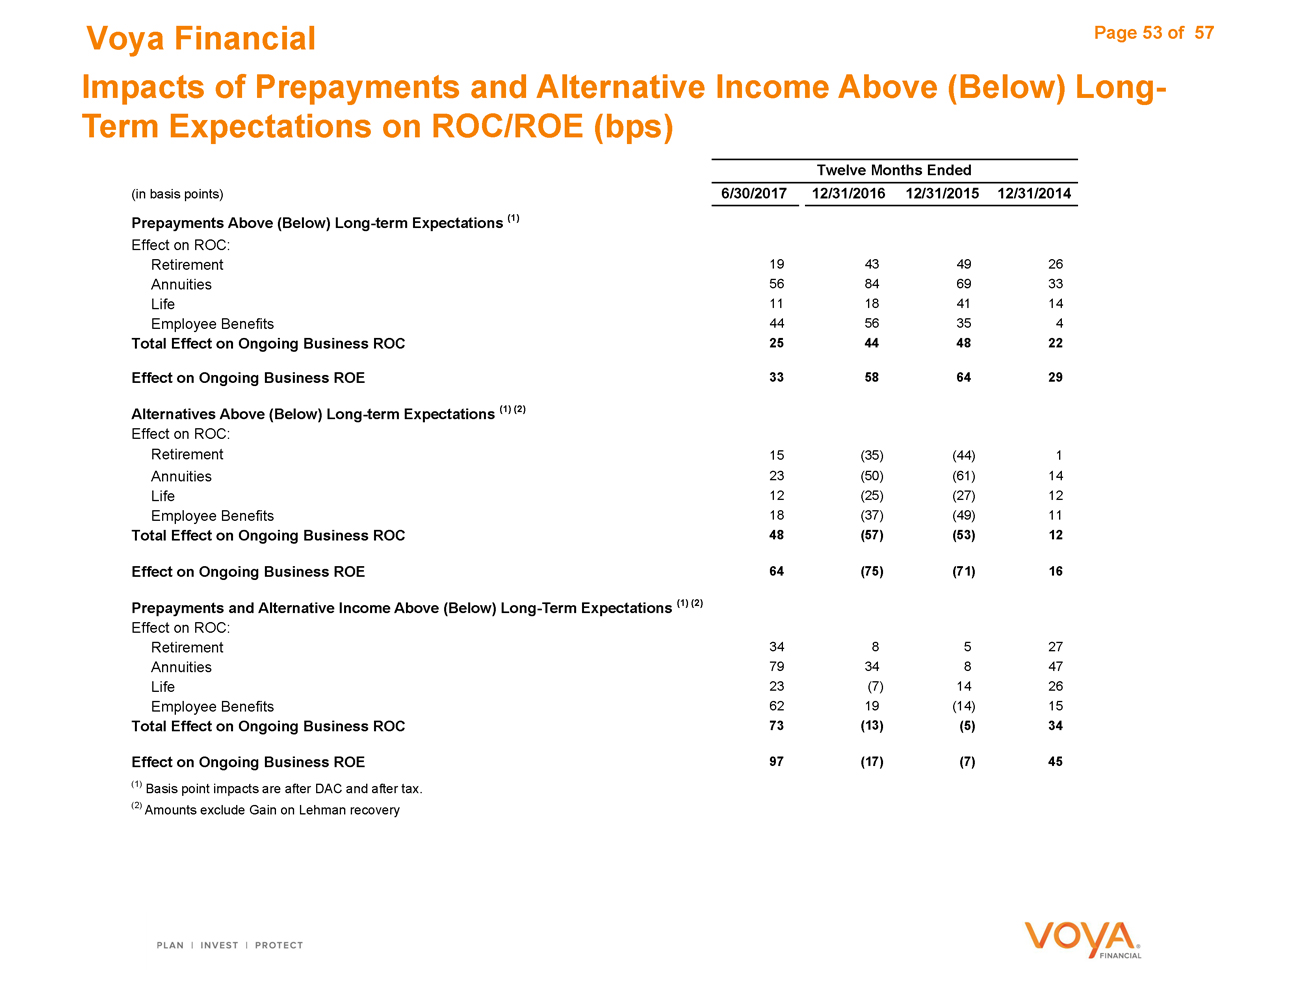
Account Value Rollforward by Source 22 Impacts of Prepayments and Alternative Income Above (Below) Long-
Account Value by Asset Type 23 Term Expectations53
Annuities Calculation of ROE and ROC54
Sources of Operating Earnings 25 Reconciliation of Operating Earnings Per Share: Book Value Per Share
Assets Under Management Rollforward 26 Excluding AOCI55
Individual Life Reconciliation of Average Capital: Debt to Capital, Excluding AOCI56
Sources of Operating Earnings 28 Reconciliation of Investment Management Operating Margin, Excluding
Key Metrics 29 Investment Capital57
Employee Benefits
Sources of Operating Earnings 31
Key Metrics 32
Voya Financial Page 3 of 57 Explanatory Note onNon-GAAP Financial Information
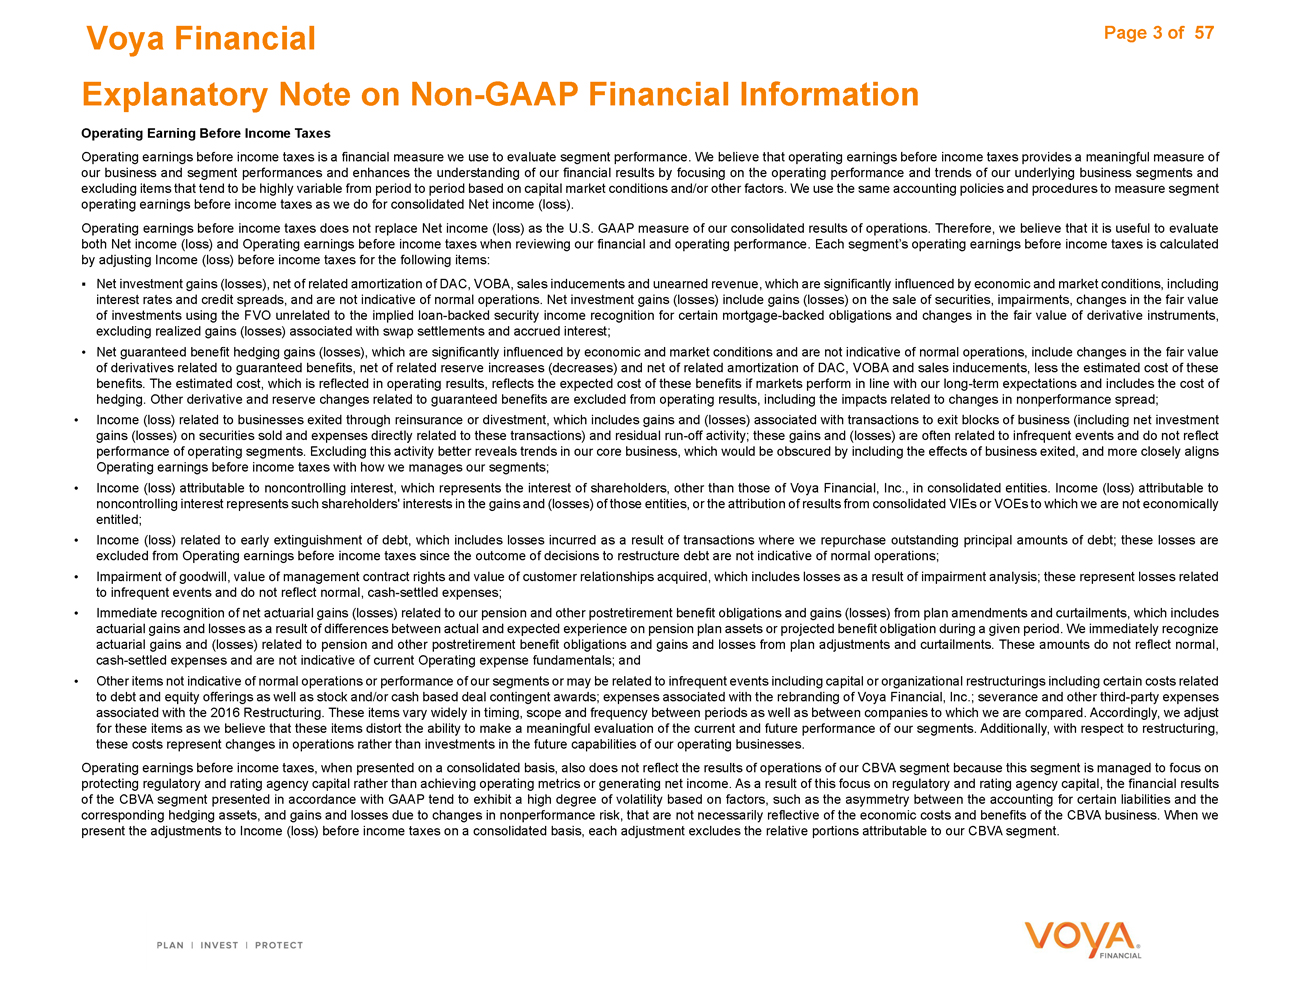
Operating Earning Before Income Taxes
Operating earnings before income taxes is a financial measure we use to evaluate segment performance. We believe that operating earnings before income taxes provides a meaningful measure of our business and segment performances and enhances the understanding of our financial results by focusing on the operating performance and trends of our underlying business segments and excluding items that tend to be highly variable from period to period based on capital market conditions and/or other factors. We use the same accounting policies and procedures to measure segment operating earnings before income taxes as we do for consolidated Net income (loss).
Operating earnings before income taxes does not replace Net income (loss) as the U.S. GAAP measure of our consolidated results of operations. Therefore, we believe that it is useful to evaluate both Net income (loss) and Operating earnings before income taxes when reviewing our financial and operating performance. Each segment’s operating earnings before income taxes is calculated by adjusting Income (loss) before income taxes for the following items: Net investment gains (losses), net of related amortization of DAC, VOBA, sales inducements and unearned revenue, which are significantly influenced by economic and market conditions, including interest rates and credit spreads, and are not indicative of normal operations. Net investment gains (losses) include gains (losses) on the sale of securities, impairments, changes in the fair value of investments using the FVO unrelated to the implied loan-backed security income recognition for certain mortgage-backed obligations and changes in the fair value of derivative instruments, excluding realized gains (losses) associated with swap settlements and accrued interest;
• Net guaranteed benefit hedging gains (losses), which are significantly influenced by economic and market conditions and are not indicative of normal operations, include changes in the fair value of derivatives related to guaranteed benefits, net of related reserve increases (decreases) and net of related amortization of DAC, VOBA and sales inducements, less the estimated cost of these benefits. The estimated cost, which is reflected in operating results, reflects the expected cost of these benefits if markets perform in line with our long-term expectations and includes the cost of hedging. Other derivative and reserve changes related to guaranteed benefits are excluded from operating results, including the impacts related to changes in nonperformance spread;
• Income (loss) related to businesses exited through reinsurance or divestment, which includes gains and (losses) associated with transactions to exit blocks of business (including net investment gains (losses) on securities sold and expenses directly related to these transactions) and residualrun-off activity; these gains and (losses) are often related to infrequent events and do not reflect performance of operating segments. Excluding this activity better reveals trends in our core business, which would be obscured by including the effects of business exited, and more closely aligns Operating earnings before income taxes with how we manages our segments;
• Income (loss) attributable to noncontrolling interest, which represents the interest of shareholders, other than those of Voya Financial, Inc., in consolidated entities. Income (loss) attributable to noncontrolling interest represents such shareholders’ interests in the gains and (losses) of those entities, or the attribution of results from consolidated VIEs or VOEs to which we are not economically entitled;
• Income (loss) related to early extinguishment of debt, which includes losses incurred as a result of transactions where we repurchase outstanding principal amounts of debt; these losses are excluded from Operating earnings before income taxes since the outcome of decisions to restructure debt are not indicative of normal operations;
• Impairment of goodwill, value of management contract rights and value of customer relationships acquired, which includes losses as a result of impairment analysis; these represent losses related to infrequent events and do not reflect normal, cash-settled expenses;
• Immediate recognition of net actuarial gains (losses) related to our pension and other postretirement benefit obligations and gains (losses) from plan amendments and curtailments, which includes actuarial gains and losses as a result of differences between actual and expected experience on pension plan assets or projected benefit obligation during a given period. We immediately recognize actuarial gains and (losses) related to pension and other postretirement benefit obligations and gains and losses from plan adjustments and curtailments. These amounts do not reflect normal, cash-settled expenses and are not indicative of current Operating expense fundamentals; and
• Other items not indicative of normal operations or performance of our segments or may be related to infrequent events including capital or organizational restructurings including certain costs related to debt and equity offerings as well as stock and/or cash based deal contingent awards; expenses associated with the rebranding of Voya Financial, Inc.; severance and other third-party expenses associated with the 2016 Restructuring. These items vary widely in timing, scope and frequency between periods as well as between companies to which we are compared. Accordingly, we adjust for these items as we believe that these items distort the ability to make a meaningful evaluation of the current and future performance of our segments. Additionally, with respect to restructuring, these costs represent changes in operations rather than investments in the future capabilities of our operating businesses.
Operating earnings before income taxes, when presented on a consolidated basis, also does not reflect the results of operations of our CBVA segment because this segment is managed to focus on protecting regulatory and rating agency capital rather than achieving operating metrics or generating net income. As a result of this focus on regulatory and rating agency capital, the financial results of the CBVA segment presented in accordance with GAAP tend to exhibit a high degree of volatility based on factors, such as the asymmetry between the accounting for certain liabilities and the corresponding hedging assets, and gains and losses due to changes in nonperformance risk, that are not necessarily reflective of the economic costs and benefits of the CBVA business. When we present the adjustments to Income (loss) before income taxes on a consolidated basis, each adjustment excludes the relative portions attributable to our CBVA segment.
|
|
Voya Financial Page 4 of 57 Explanatory Note onNon-GAAP Financial Information
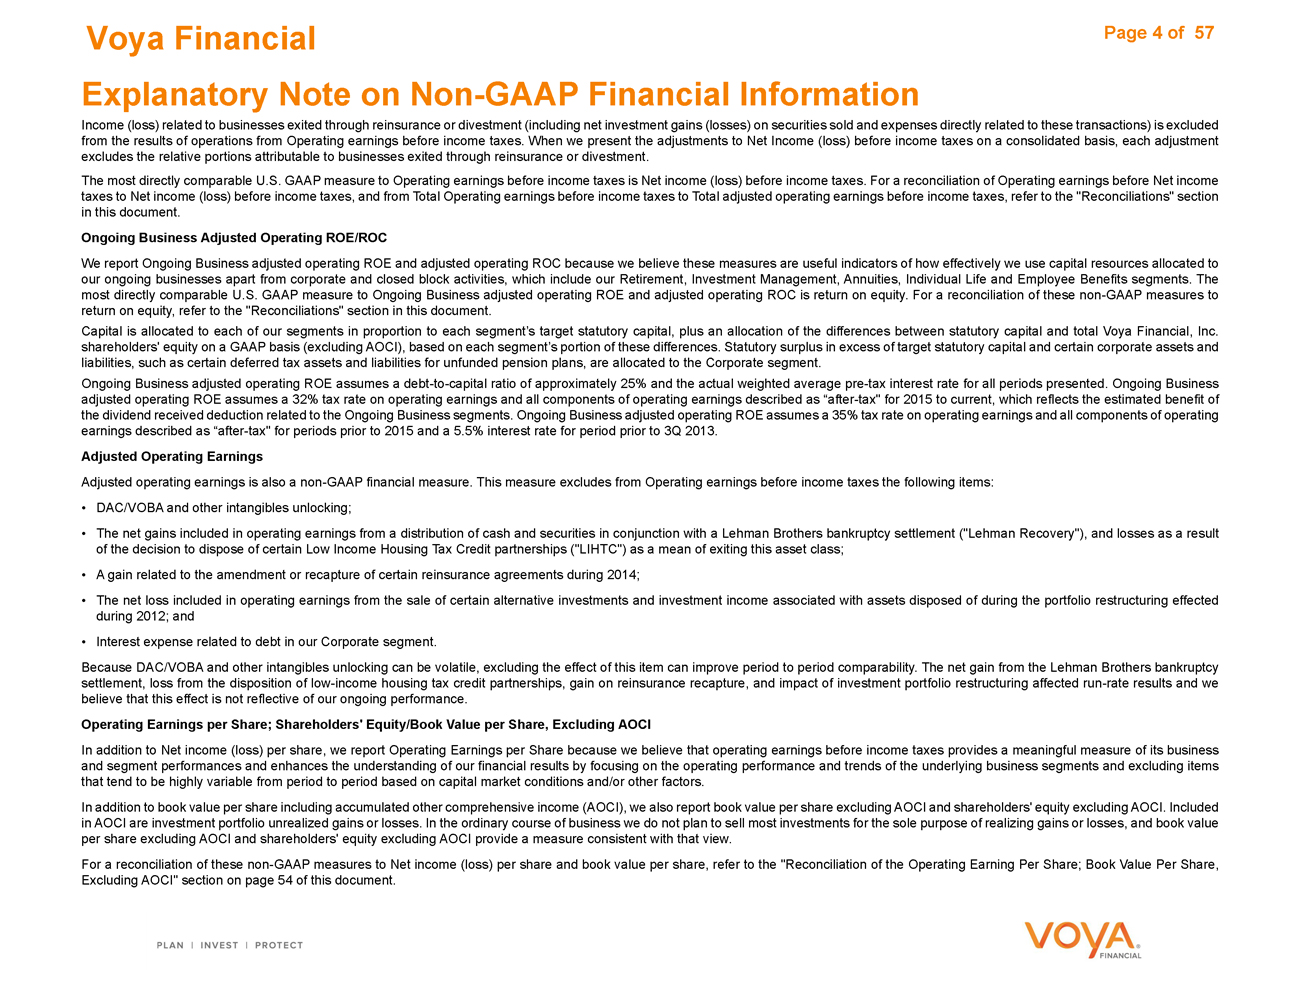
Income (loss) related to businesses exited through reinsurance or divestment (including net investment gains (losses) on securities sold and expenses directly related to these transactions) is excluded from the results of operations from Operating earnings before income taxes. When we present the adjustments to Net Income (loss) before income taxes on a consolidated basis, each adjustment excludes the relative portions attributable to businesses exited through reinsurance or divestment.
The most directly comparable U.S. GAAP measure to Operating earnings before income taxes is Net income (loss) before income taxes. For a reconciliation of Operating earnings before Net income taxes to Net income (loss) before income taxes, and from Total Operating earnings before income taxes to Total adjusted operating earnings before income taxes, refer to the “Reconciliations” section in this document.
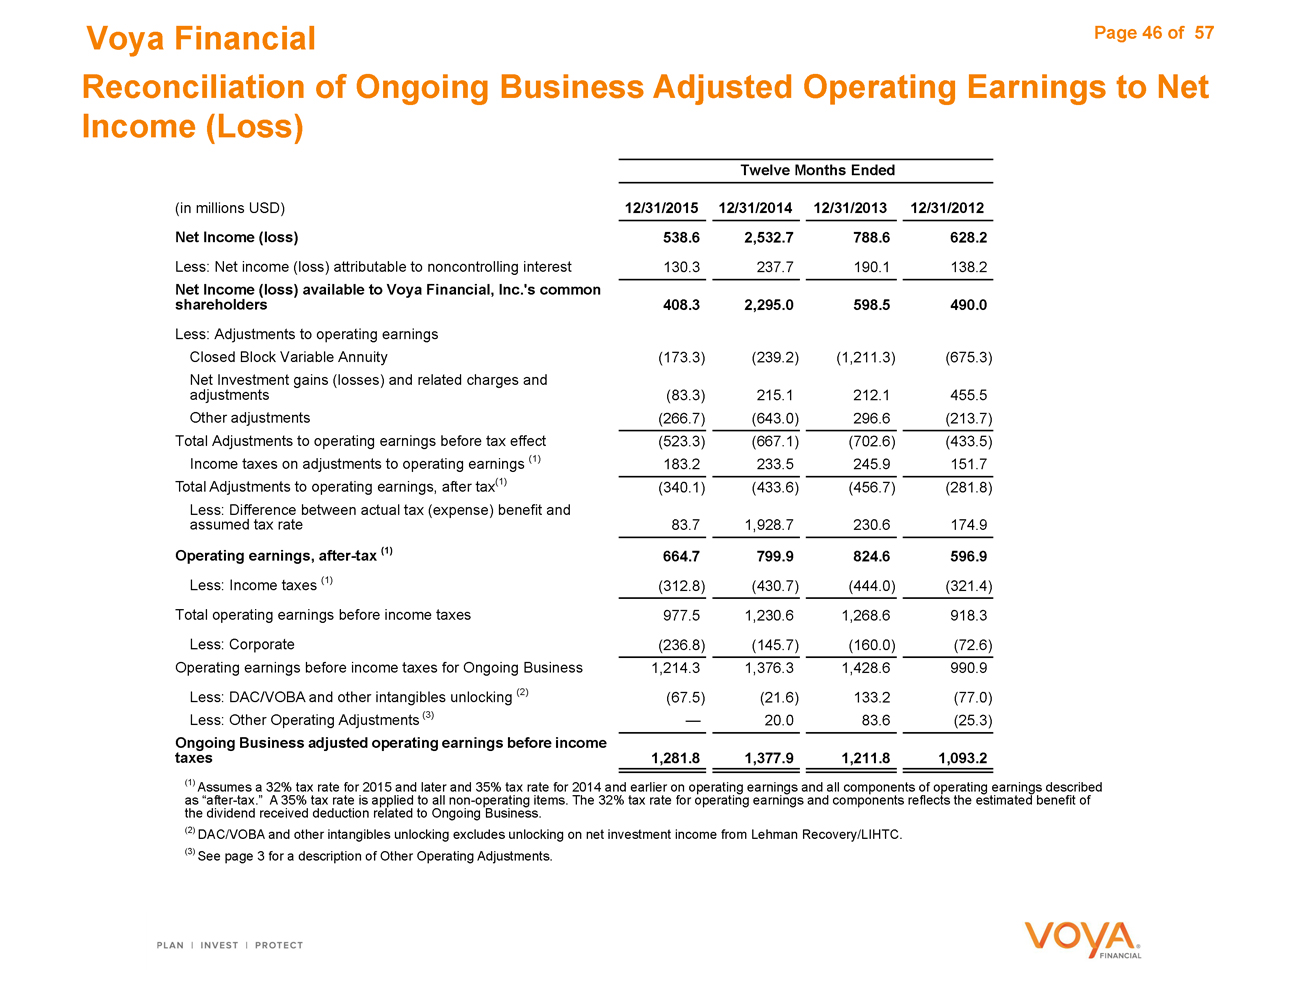
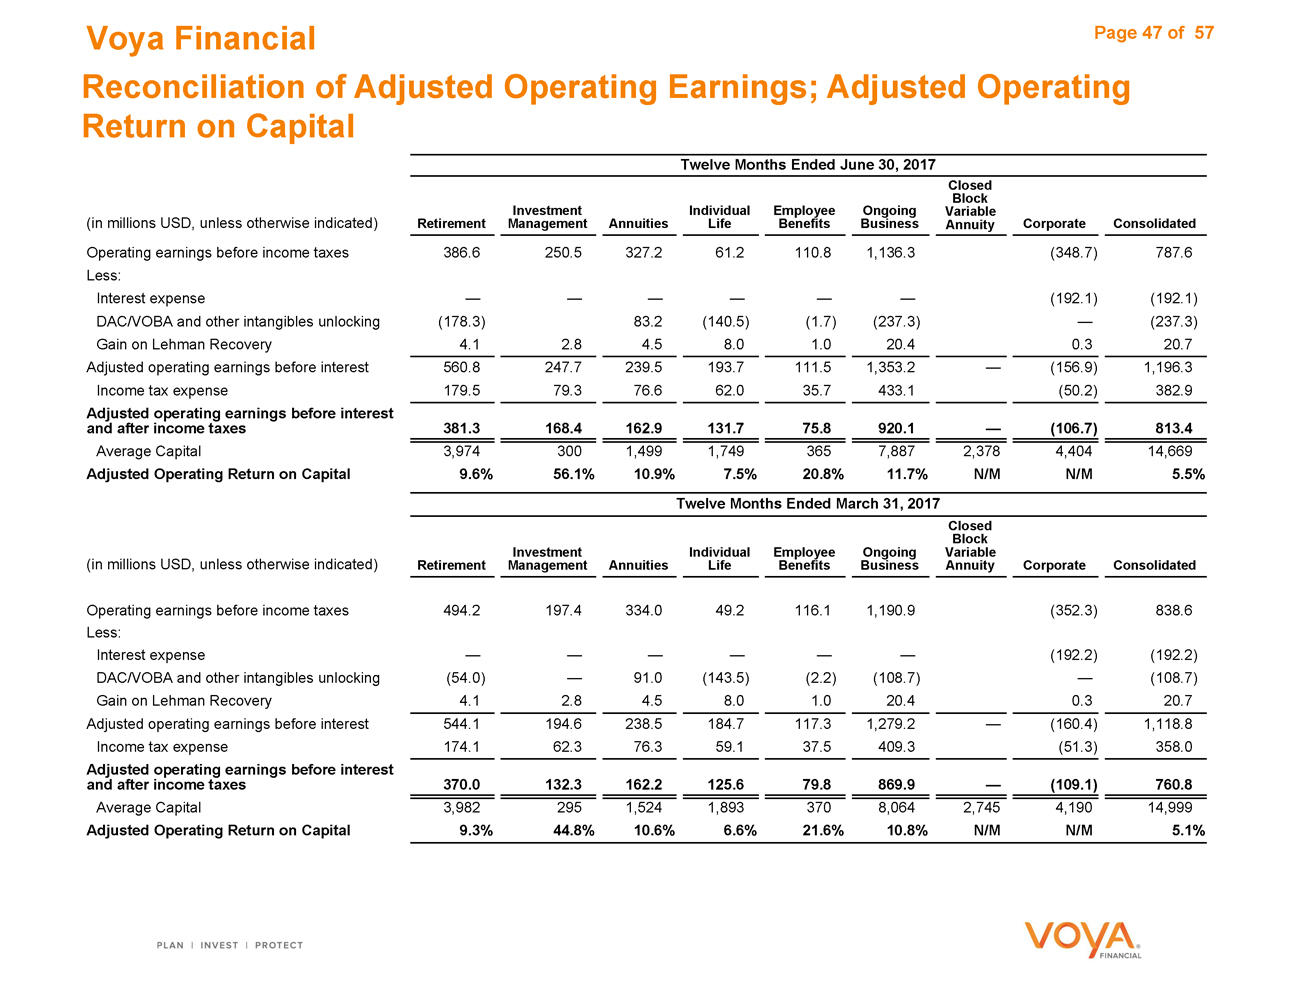
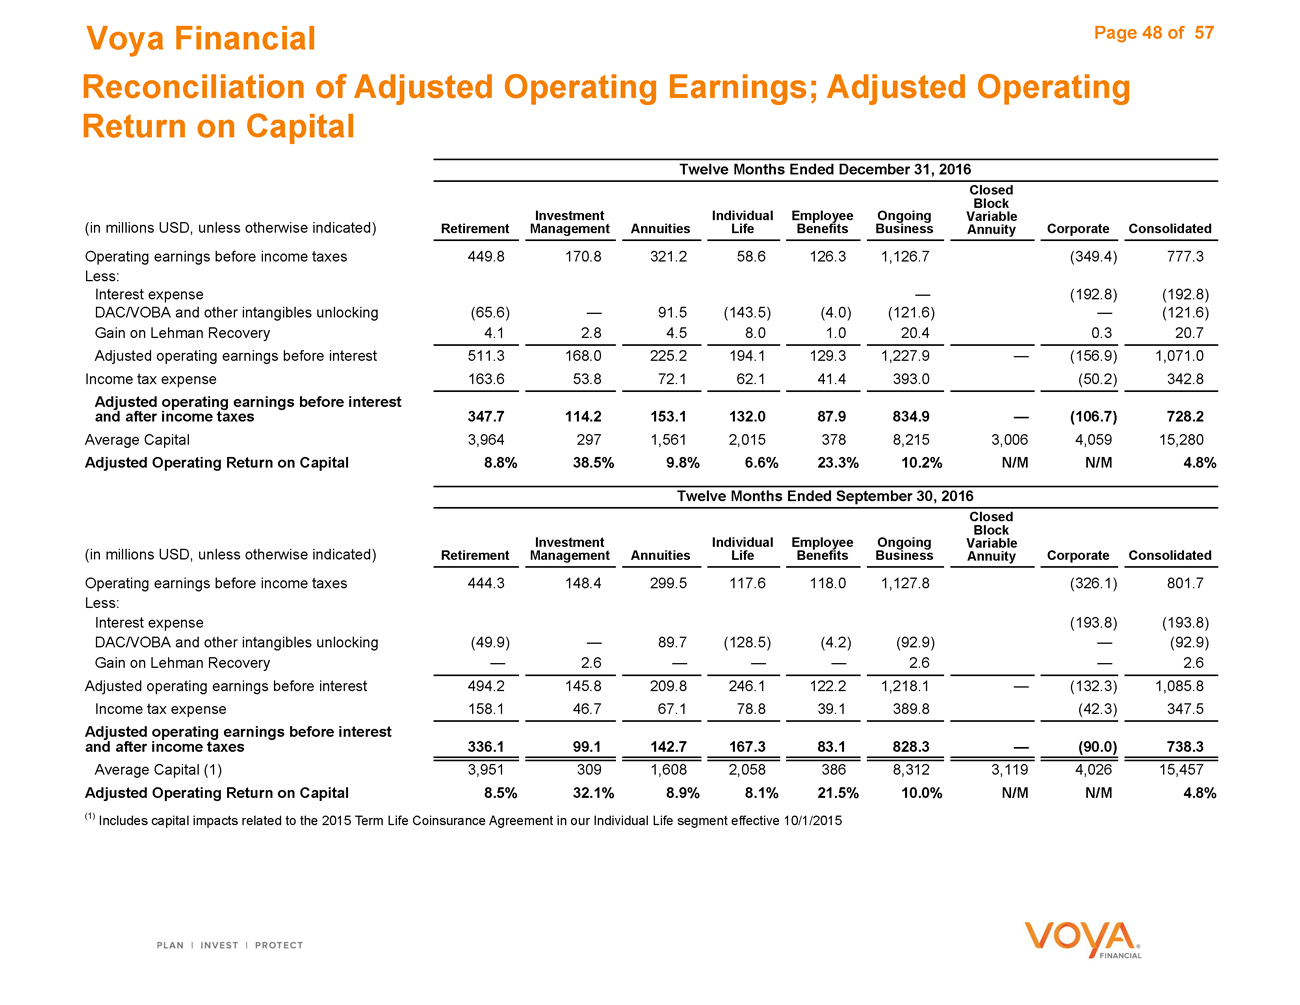
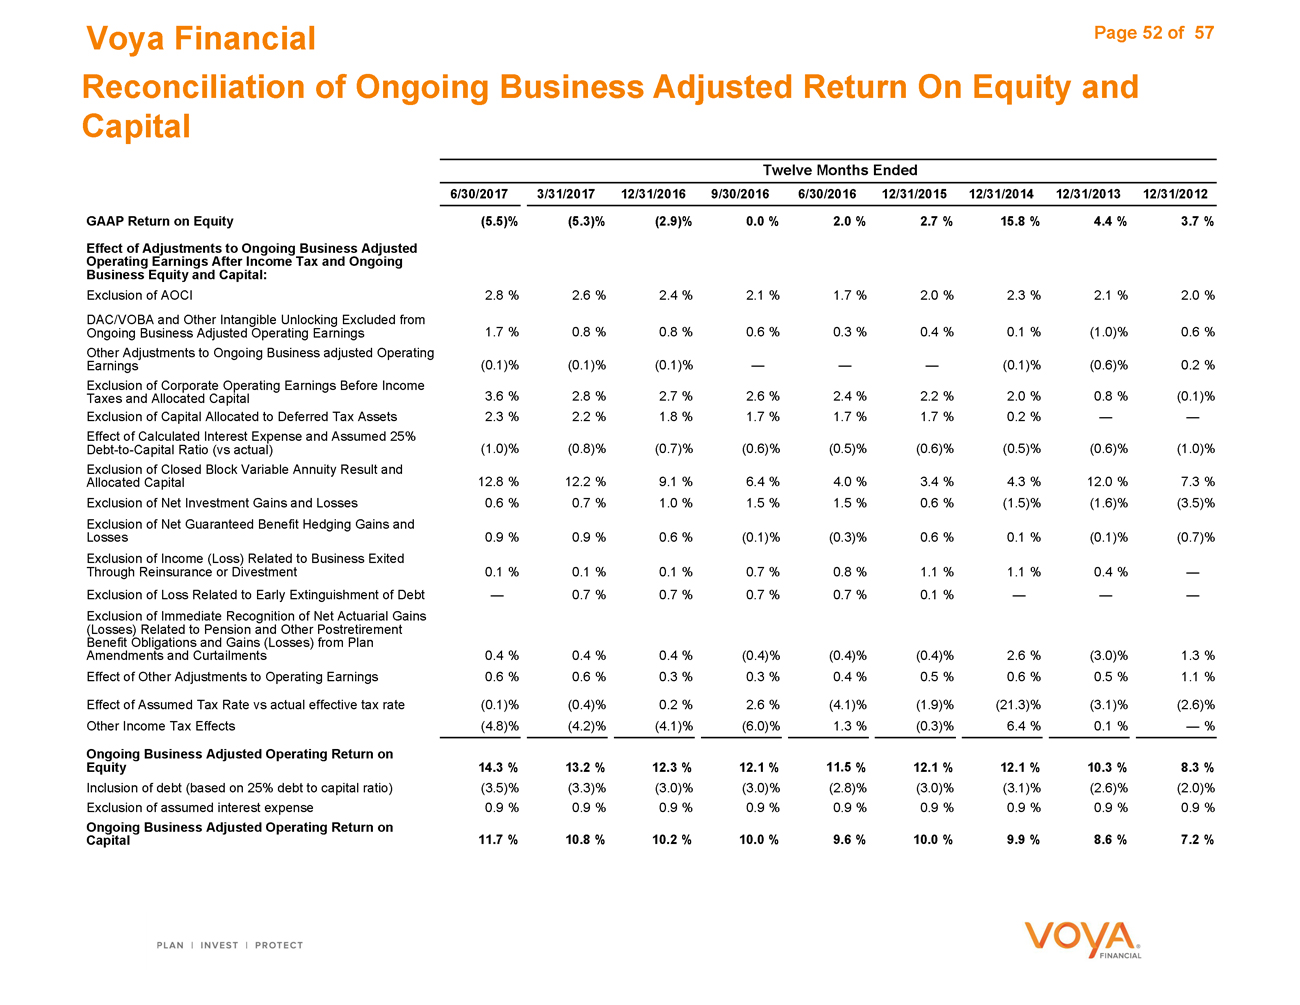
Ongoing Business Adjusted Operating ROE/ROC
We report Ongoing Business adjusted operating ROE and adjusted operating ROC because we believe these measures are useful indicators of how effectively we use capital resources allocated to our ongoing businesses apart from corporate and closed block activities, which include our Retirement, Investment Management, Annuities, Individual Life and Employee Benefits segments. The most directly comparable U.S. GAAP measure to Ongoing Business adjusted operating ROE and adjusted operating ROC is return on equity. For a reconciliation of thesenon-GAAP measures to return on equity, refer to the “Reconciliations” section in this document.
Capital is allocated to each of our segments in proportion to each segment’s target statutory capital, plus an allocation of the differences between statutory capital and total Voya Financial, Inc. shareholders’ equity on a GAAP basis (excluding AOCI), based on each segment’s portion of these differences. Statutory surplus in excess of target statutory capital and certain corporate assets and liabilities, such as certain deferred tax assets and liabilities for unfunded pension plans, are allocated to the Corporate segment.
Ongoing Business adjusted operating ROE assumes adebt-to-capital ratio of approximately 25% and the actual weighted averagepre-tax interest rate for all periods presented. Ongoing Business adjusted operating ROE assumes a 32% tax rate on operating earnings and all components of operating earnings described as“after-tax” for 2015 to current, which reflects the estimated benefit of the dividend received deduction related to the Ongoing Business segments. Ongoing Business adjusted operating ROE assumes a 35% tax rate on operating earnings and all components of operating earnings described as“after-tax” for periods prior to 2015 and a 5.5% interest rate for period prior to 3Q 2013.
Adjusted Operating Earnings
Adjusted operating earnings is also anon-GAAP financial measure. This measure excludes from Operating earnings before income taxes the following items:
• DAC/VOBA and other intangibles unlocking;
• The net gains included in operating earnings from a distribution of cash and securities in conjunction with a Lehman Brothers bankruptcy settlement (“Lehman Recovery”), and losses as a result of the decision to dispose of certain Low Income Housing Tax Credit partnerships (“LIHTC”) as a mean of exiting this asset class;
• A gain related to the amendment or recapture of certain reinsurance agreements during 2014;
• The net loss included in operating earnings from the sale of certain alternative investments and investment income associated with assets disposed of during the portfolio restructuring effected during 2012; and
• Interest expense related to debt in our Corporate segment.
Because DAC/VOBA and other intangibles unlocking can be volatile, excluding the effect of this item can improve period to period comparability. The net gain from the Lehman Brothers bankruptcy settlement, loss from the disposition oflow-income housing tax credit partnerships, gain on reinsurance recapture, and impact of investment portfolio restructuring affectedrun-rate results and we believe that this effect is not reflective of our ongoing performance.
Operating Earnings per Share; Shareholders’ Equity/Book Value per Share, Excluding AOCI
In addition to Net income (loss) per share, we report Operating Earnings per Share because we believe that operating earnings before income taxes provides a meaningful measure of its business and segment performances and enhances the understanding of our financial results by focusing on the operating performance and trends of the underlying business segments and excluding items that tend to be highly variable from period to period based on capital market conditions and/or other factors.
In addition to book value per share including accumulated other comprehensive income (AOCI), we also report book value per share excluding AOCI and shareholders’ equity excluding AOCI. Included in AOCI are investment portfolio unrealized gains or losses. In the ordinary course of business we do not plan to sell most investments for the sole purpose of realizing gains or losses, and book value per share excluding AOCI and shareholders’ equity excluding AOCI provide a measure consistent with that view.
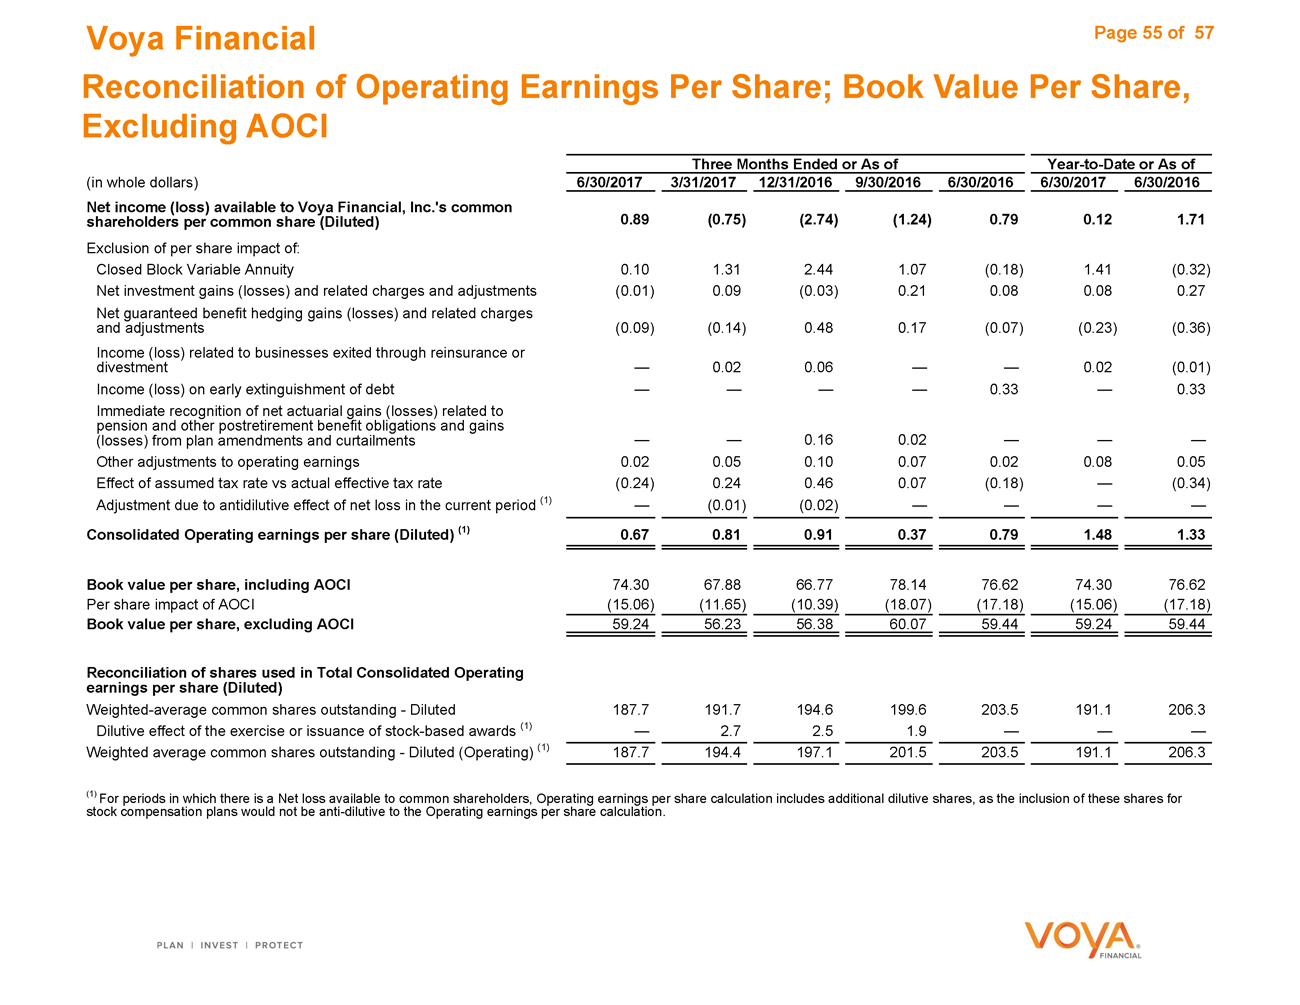
For a reconciliation of thesenon-GAAP measures to Net income (loss) per share and book value per share, refer to the “Reconciliation of the Operating Earning Per Share; Book Value Per Share, Excluding AOCI” section on page 54 of this document.
Voya Financial Page 5 of 57 Explanatory Note onNon-GAAP Financial Information
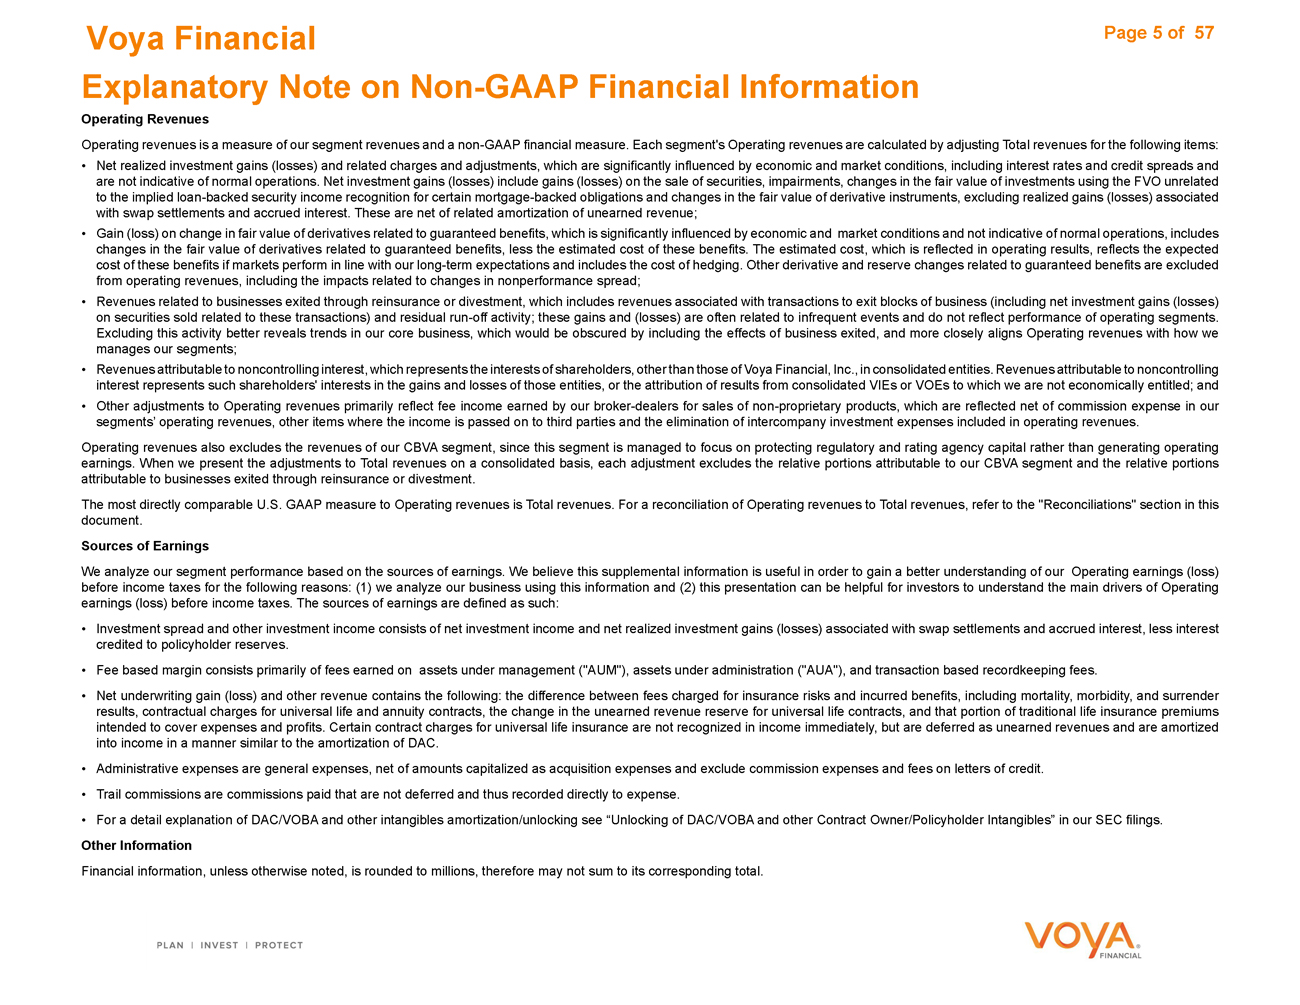
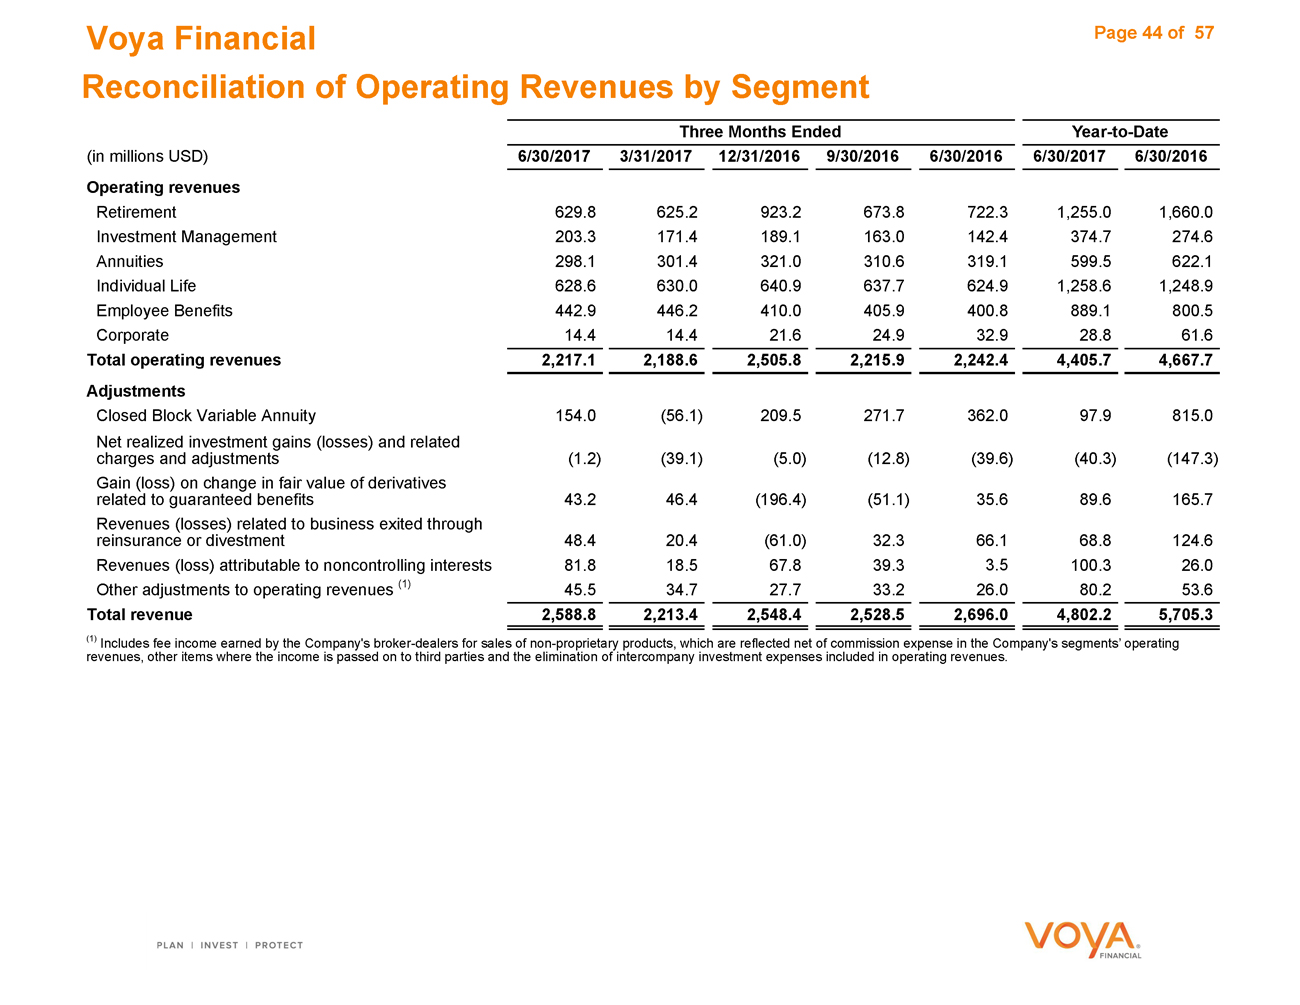
Operating Revenues
Operating revenues is a measure of our segment revenues and anon-GAAP financial measure. Each segment’s Operating revenues are calculated by adjusting Total revenues for the following items:
• Net realized investment gains (losses) and related charges and adjustments, which are significantly influenced by economic and market conditions, including interest rates and credit spreads and are not indicative of normal operations. Net investment gains (losses) include gains (losses) on the sale of securities, impairments, changes in the fair value of investments using the FVO unrelated to the implied loan-backed security income recognition for certain mortgage-backed obligations and changes in the fair value of derivative instruments, excluding realized gains (losses) associated with swap settlements and accrued interest. These are net of related amortization of unearned revenue;
• Gain (loss) on change in fair value of derivatives related to guaranteed benefits, which is significantly influenced by economic and market conditions and not indicative of normal operations, includes changes in the fair value of derivatives related to guaranteed benefits, less the estimated cost of these benefits. The estimated cost, which is reflected in operating results, reflects the expected cost of these benefits if markets perform in line with our long-term expectations and includes the cost of hedging. Other derivative and reserve changes related to guaranteed benefits are excluded from operating revenues, including the impacts related to changes in nonperformance spread;
• Revenues related to businesses exited through reinsurance or divestment, which includes revenues associated with transactions to exit blocks of business (including net investment gains (losses) on securities sold related to these transactions) and residualrun-off activity; these gains and (losses) are often related to infrequent events and do not reflect performance of operating segments. Excluding this activity better reveals trends in our core business, which would be obscured by including the effects of business exited, and more closely aligns Operating revenues with how we manages our segments;
• Revenues attributable to noncontrolling interest, which represents the interests of shareholders, other than those of Voya Financial, Inc., in consolidated entities. Revenues attributable to noncontrolling interest represents such shareholders’ interests in the gains and losses of those entities, or the attribution of results from consolidated VIEs or VOEs to which we are not economically entitled; and
• Other adjustments to Operating revenues primarily reflect fee income earned by our broker-dealers for sales ofnon-proprietary products, which are reflected net of commission expense in our segments’ operating revenues, other items where the income is passed on to third parties and the elimination of intercompany investment expenses included in operating revenues.
Operating revenues also excludes the revenues of our CBVA segment, since this segment is managed to focus on protecting regulatory and rating agency capital rather than generating operating earnings. When we present the adjustments to Total revenues on a consolidated basis, each adjustment excludes the relative portions attributable to our CBVA segment and the relative portions attributable to businesses exited through reinsurance or divestment.
The most directly comparable U.S. GAAP measure to Operating revenues is Total revenues. For a reconciliation of Operating revenues to Total revenues, refer to the “Reconciliations” section in this document.
Sources of Earnings
We analyze our segment performance based on the sources of earnings. We believe this supplemental information is useful in order to gain a better understanding of our Operating earnings (loss) before income taxes for the following reasons: (1) we analyze our business using this information and (2) this presentation can be helpful for investors to understand the main drivers of Operating earnings (loss) before income taxes. The sources of earnings are defined as such:
• Investment spread and other investment income consists of net investment income and net realized investment gains (losses) associated with swap settlements and accrued interest, less interest credited to policyholder reserves.
• Fee based margin consists primarily of fees earned on assets under management (“AUM”), assets under administration (“AUA”), and transaction based recordkeeping fees.
• Net underwriting gain (loss) and other revenue contains the following: the difference between fees charged for insurance risks and incurred benefits, including mortality, morbidity, and surrender results, contractual charges for universal life and annuity contracts, the change in the unearned revenue reserve for universal life contracts, and that portion of traditional life insurance premiums intended to cover expenses and profits. Certain contract charges for universal life insurance are not recognized in income immediately, but are deferred as unearned revenues and are amortized into income in a manner similar to the amortization of DAC.
• Administrative expenses are general expenses, net of amounts capitalized as acquisition expenses and exclude commission expenses and fees on letters of credit.
• Trail commissions are commissions paid that are not deferred and thus recorded directly to expense.
• For a detail explanation of DAC/VOBA and other intangibles amortization/unlocking see “Unlocking of DAC/VOBA and other Contract Owner/Policyholder Intangibles” in our SEC filings.
Other Information
Financial information, unless otherwise noted, is rounded to millions, therefore may not sum to its corresponding total.
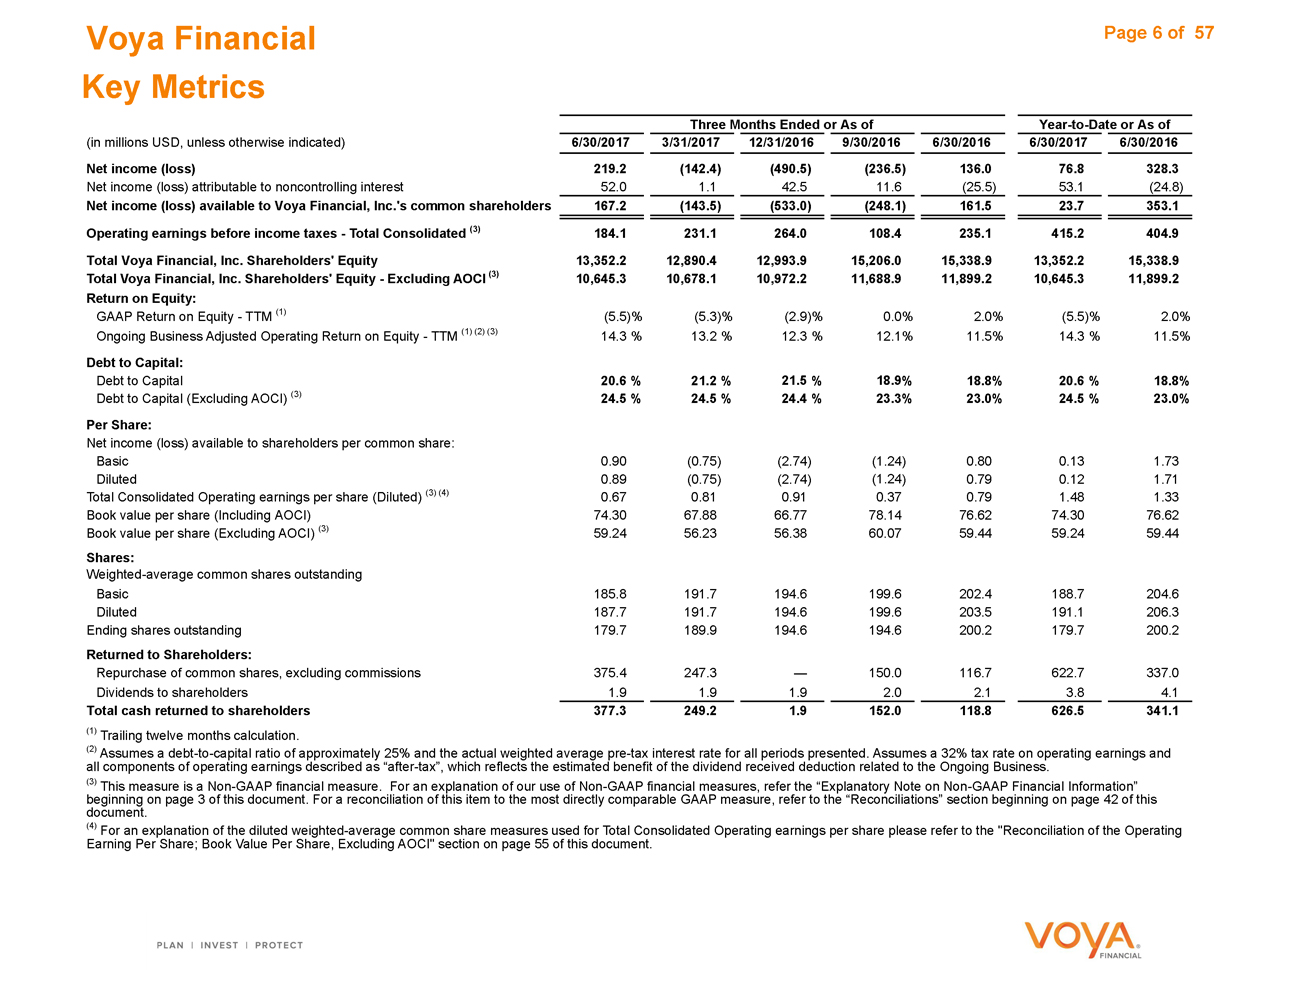
Voya Financial Key Metrics
Three Months Ended or AsofYear-to-Date or As of
(in millions USD, unless otherwise indicated) 6/30/2017 3/31/201712/31/20169/30/20166/30/20166/30/20176/30/2016
Net income (loss) 219.2 (142.4)(490.5)(236.5)136.076.8328.3
Net income (loss) attributable to noncontrolling interest 52.0 1.142.511.6(25.5)53.1(24.8)
Net income (loss) available to Voya Financial, Inc.‘s common shareholders 167.2 (143.5)(533.0)(248.1)161.523.7353.1
Operating earnings before income taxes—Total Consolidated (3) 184.1 231.1264.0108.4235.1415.2404.9
Total Voya Financial, Inc. Shareholders’ Equity 13,352.2 12,890.412,993.915,206.015,338.913,352.215,338.9
Total Voya Financial, Inc. Shareholders’ Equity—Excluding AOCI (3) 10,645.3 10,678.110,972.211,688.911,899.210,645.311,899.2
Return on Equity:
GAAP Return on Equity—TTM (1) (5.5)% (5.3)%(2.9)%0.0%2.0%(5.5)%2.0%
Ongoing Business Adjusted Operating Return on Equity—TTM (1) (2) (3) 14.3 %13.2 %12.3 %12.1%11.5%14.3 %11.5%
Debt to Capital:
Debt to Capital 20.6 % 21.2 %21.5 %18.9%18.8%20.6 %18.8%
Debt to Capital (Excluding AOCI) (3) 24.5 % 24.5 %24.4 %23.3%23.0%24.5 %23.0%
Per Share:
Net income (loss) available to shareholders per common share:
Basic 0.90 (0.75)(2.74)(1.24)0.800.131.73
Diluted 0.89 (0.75)(2.74)(1.24)0.790.121.71
Total Consolidated Operating earnings per share (Diluted) (3) (4) 0.67 0.810.910.370.791.481.33
Book value per share (Including AOCI) 74.30 67.8866.7778.1476.6274.3076.62
Book value per share (Excluding AOCI) (3) 59.24 56.2356.3860.0759.4459.2459.44
Shares:
Weighted-average common shares outstanding
Basic 185.8 191.7194.6199.6202.4188.7204.6
Diluted 187.7 191.7194.6199.6203.5191.1206.3
Ending shares outstanding 179.7 189.9194.6194.6200.2179.7200.2
Returned to Shareholders:
Repurchase of common shares, excluding commissions 375.4 247.3—150.0116.7622.7337.0
Dividends to shareholders 1.9 1.91.92.02.13.84.1
Total cash returned to shareholders 377.3 249.21.9152.0118.8626.5341.1
(1) Trailing twelve months calculation.
(2) Assumes adebt-to-capital ratio of approximately 25% and the actual weighted averagepre-tax interest rate for all periods presented. Assumes a 32% tax rate on operating earnings and all components of operating earnings described as“after-tax”, which reflects the estimated benefit of the dividend received deduction related to the Ongoing Business.
(3) This measure is aNon-GAAP financial measure. For an explanation of our use ofNon-GAAP financial measures, refer the “Explanatory Note onNon-GAAP Financial Information” beginning on page 3 of this document. For a reconciliation of this item to the most directly comparable GAAP measure, refer to the “Reconciliations” section beginning on page 42 of this document.
(4) For an explanation of the diluted weighted-average common share measures used for Total Consolidated Operating earnings per share please refer to the “Reconciliation of the Operating Earning Per Share; Book Value Per Share, Excluding AOCI” section on page 55 of this document.
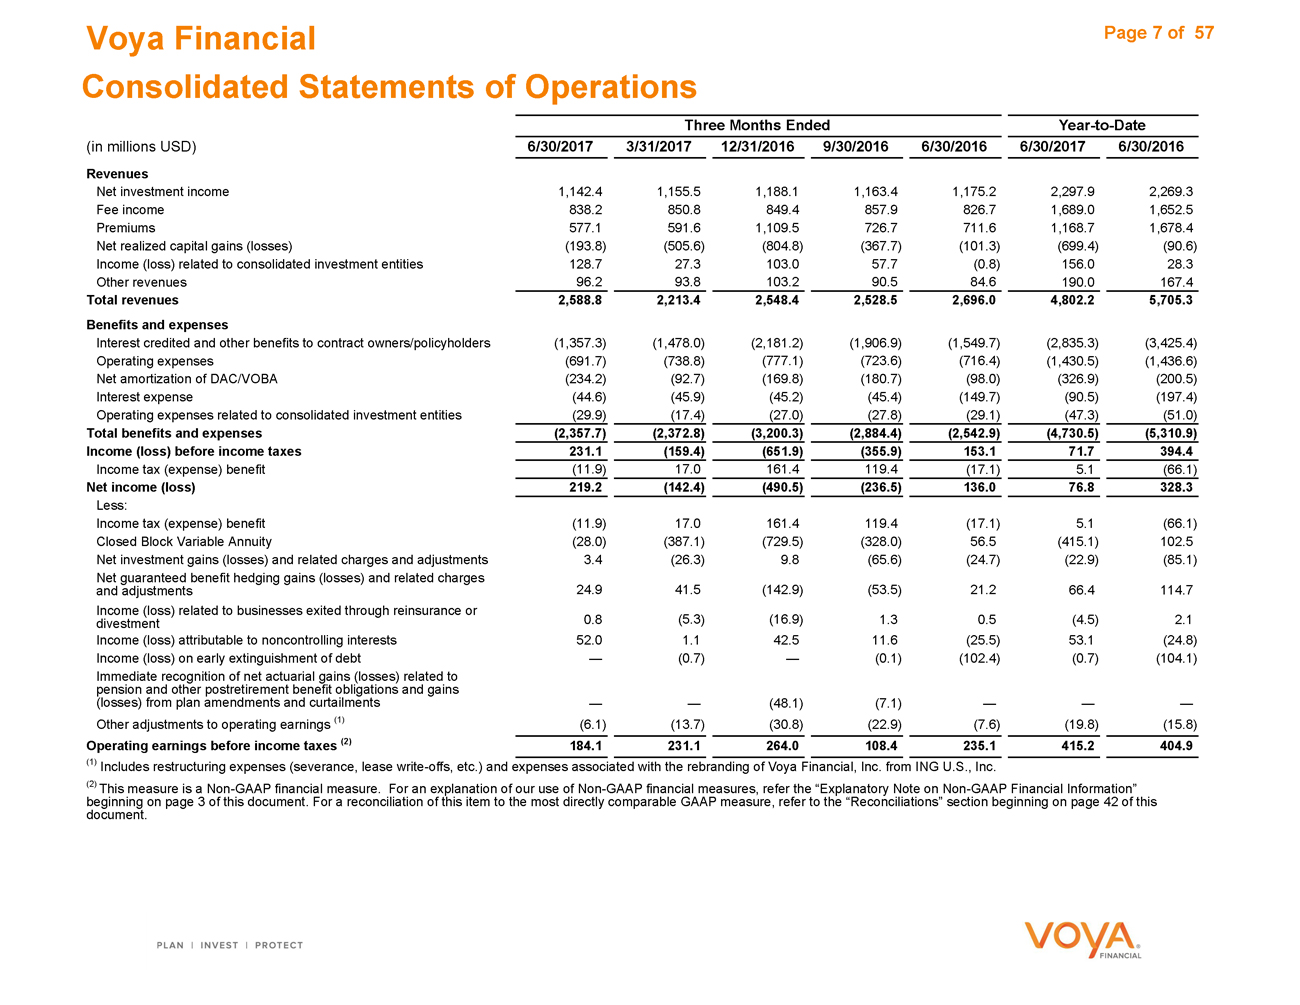
Voya Financial Page 7 of 57 Consolidated Statements of Operations
Three Months EndedYear-to-Date
(in millions USD) 6/30/2017 3/31/201712/31/20169/30/20166/30/20166/30/20176/30/2016
Revenues
Net investment income 1,142.4 1,155.51,188.11,163.41,175.22,297.92,269.3
Fee income 838.2 850.8849.4857.9826.71,689.01,652.5
Premiums 577.1 591.61,109.5726.7711.61,168.71,678.4
Net realized capital gains (losses) (193.8) (505.6)(804.8)(367.7)(101.3)(699.4)(90.6)
Income (loss) related to consolidated investment entities 128.7 27.3103.057.7(0.8)156.028.3
Other revenues 96.2 93.8103.290.584.6190.0167.4
Total revenues 2,588.8 2,213.42,548.42,528.52,696.04,802.25,705.3
Benefits and expenses
Interest credited and other benefits to contract owners/policyholders (1,357.3) (1,478.0)(2,181.2)(1,906.9)(1,549.7)(2,835.3)(3,425.4)
Operating expenses (691.7) (738.8)(777.1)(723.6)(716.4)(1,430.5)(1,436.6)
Net amortization of DAC/VOBA (234.2) (92.7)(169.8)(180.7)(98.0)(326.9)(200.5)
Interest expense (44.6) (45.9)(45.2)(45.4)(149.7)(90.5)(197.4)
Operating expenses related to consolidated investment entities (29.9) (17.4)(27.0)(27.8)(29.1)(47.3)(51.0)
Total benefits and expenses (2,357.7) (2,372.8)(3,200.3)(2,884.4)(2,542.9)(4,730.5)(5,310.9)
Income (loss) before income taxes 231.1 (159.4)(651.9)(355.9)153.171.7394.4
Income tax (expense) benefit (11.9) 17.0161.4119.4(17.1)5.1(66.1)
Net income (loss) 219.2 (142.4)(490.5)(236.5)136.076.8328.3
Less:
Income tax (expense) benefit (11.9) 17.0161.4119.4(17.1)5.1(66.1)
Closed Block Variable Annuity (28.0) (387.1)(729.5)(328.0)56.5(415.1)102.5
Net investment gains (losses) and related charges and adjustments 3.4 (26.3)9.8(65.6)(24.7)(22.9)(85.1)
Net guaranteed benefit hedging gains (losses) and related charges
and adjustments 24.9 41.5(142.9)(53.5)21.266.4114.7
Income (loss) related to businesses exited through reinsurance or
divestment 0.8 (5.3)(16.9)1.30.5(4.5)2.1
Income (loss) attributable to noncontrolling interests 52.0 1.142.511.6(25.5)53.1(24.8)
Income (loss) on early extinguishment of debt — (0.7)—(0.1)(102.4)(0.7)(104.1)
Immediate recognition of net actuarial gains (losses) related to
pension and other postretirement benefit obligations and gains
(losses) from plan amendments and curtailments — —(48.1)(7.1)———
Other adjustments to operating earnings (1) (6.1) (13.7)(30.8)(22.9)(7.6)(19.8)(15.8)
Operating earnings before income taxes (2) 184.1 231.1264.0108.4235.1415.2404.9
(1) Includes restructuring expenses (severance, lease write-offs, etc.) and expenses associated with the rebranding of Voya Financial, Inc. from ING U.S., Inc.
(2) This measure is aNon-GAAP financial measure. For an explanation of our use ofNon-GAAP financial measures, refer the “Explanatory Note onNon-GAAP Financial Information” beginning on page 3 of this document. For a reconciliation of this item to the most directly comparable GAAP measure, refer to the “Reconciliations” section beginning on page 42 of this document.
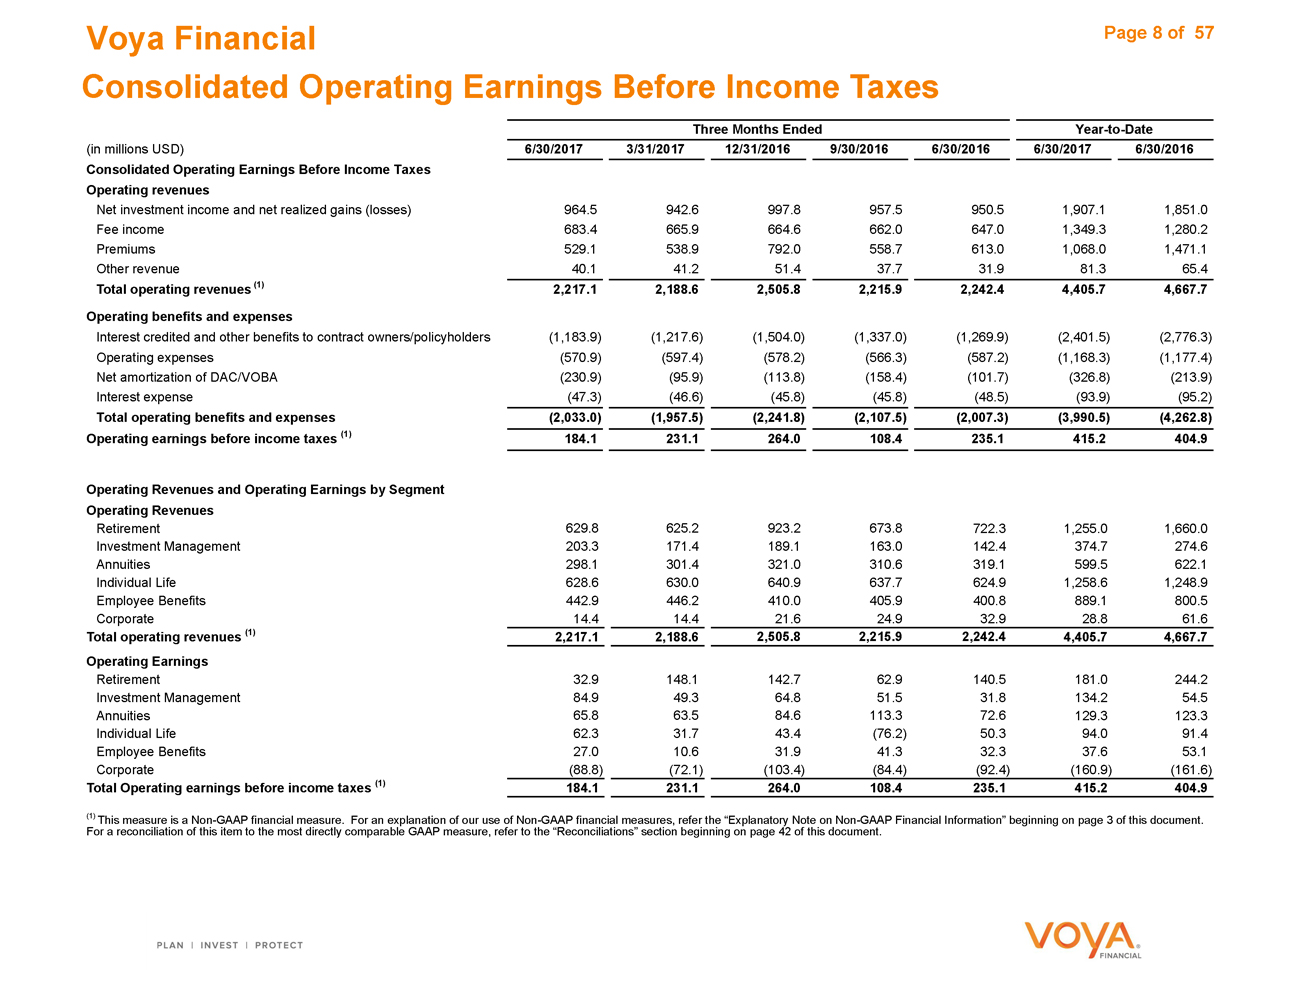
Voya Financial Page 8 of 57 Consolidated Operating Earnings Before Income Taxes
Three Months EndedYear-to-Date
(in millions USD) 6/30/2017 3/31/201712/31/20169/30/20166/30/20166/30/20176/30/2016
Consolidated Operating Earnings Before Income Taxes
Operating revenues
Net investment income and net realized gains (losses) 964.5 942.6997.8957.5950.51,907.11,851.0
Fee income 683.4 665.9664.6662.0647.01,349.31,280.2
Premiums 529.1 538.9792.0558.7613.01,068.01,471.1
Other revenue 40.1 41.251.437.731.981.365.4
Total operating revenues (1) 2,217.1 2,188.62,505.82,215.92,242.44,405.74,667.7
Operating benefits and expenses
Interest credited and other benefits to contract owners/policyholders (1,183.9) (1,217.6)(1,504.0)(1,337.0)(1,269.9)(2,401.5)(2,776.3)
Operating expenses (570.9) (597.4)(578.2)(566.3)(587.2)(1,168.3)(1,177.4)
Net amortization of DAC/VOBA (230.9) (95.9)(113.8)(158.4)(101.7)(326.8)(213.9)
Interest expense (47.3) (46.6)(45.8)(45.8)(48.5)(93.9)(95.2)
Total operating benefits and expenses (2,033.0) (1,957.5)(2,241.8)(2,107.5)(2,007.3)(3,990.5)(4,262.8)
Operating earnings before income taxes (1) 184.1 231.1264.0108.4235.1415.2404.9
Operating Revenues and Operating Earnings by Segment
Operating Revenues
Retirement 629.8 625.2923.2673.8722.31,255.01,660.0
Investment Management 203.3 171.4189.1163.0142.4374.7274.6
Annuities 298.1 301.4321.0310.6319.1599.5622.1
Individual Life 628.6 630.0640.9637.7624.91,258.61,248.9
Employee Benefits 442.9 446.2410.0405.9400.8889.1800.5
Corporate 14.4 14.421.624.932.928.861.6
Total operating revenues (1) 2,217.1 2,188.62,505.82,215.92,242.44,405.74,667.7
Operating Earnings
Retirement 32.9 148.1142.762.9140.5181.0244.2
Investment Management 84.9 49.364.851.531.8134.254.5
Annuities 65.8 63.584.6113.372.6129.3123.3
Individual Life 62.3 31.743.4(76.2)50.394.091.4
Employee Benefits 27.0 10.631.941.332.337.653.1
Corporate (88.8) (72.1)(103.4)(84.4)(92.4)(160.9)(161.6)
Total Operating earnings before income taxes (1) 184.1 231.1264.0108.4235.1415.2404.9
(1) This measure is aNon-GAAP financial measure. For an explanation of our use ofNon-GAAP financial measures, refer the “Explanatory Note onNon-GAAP Financial Information” beginning on page 3 of this document. For a reconciliation of this item to the most directly comparable GAAP measure, refer to the “Reconciliations” section beginning on page 42 of this document.
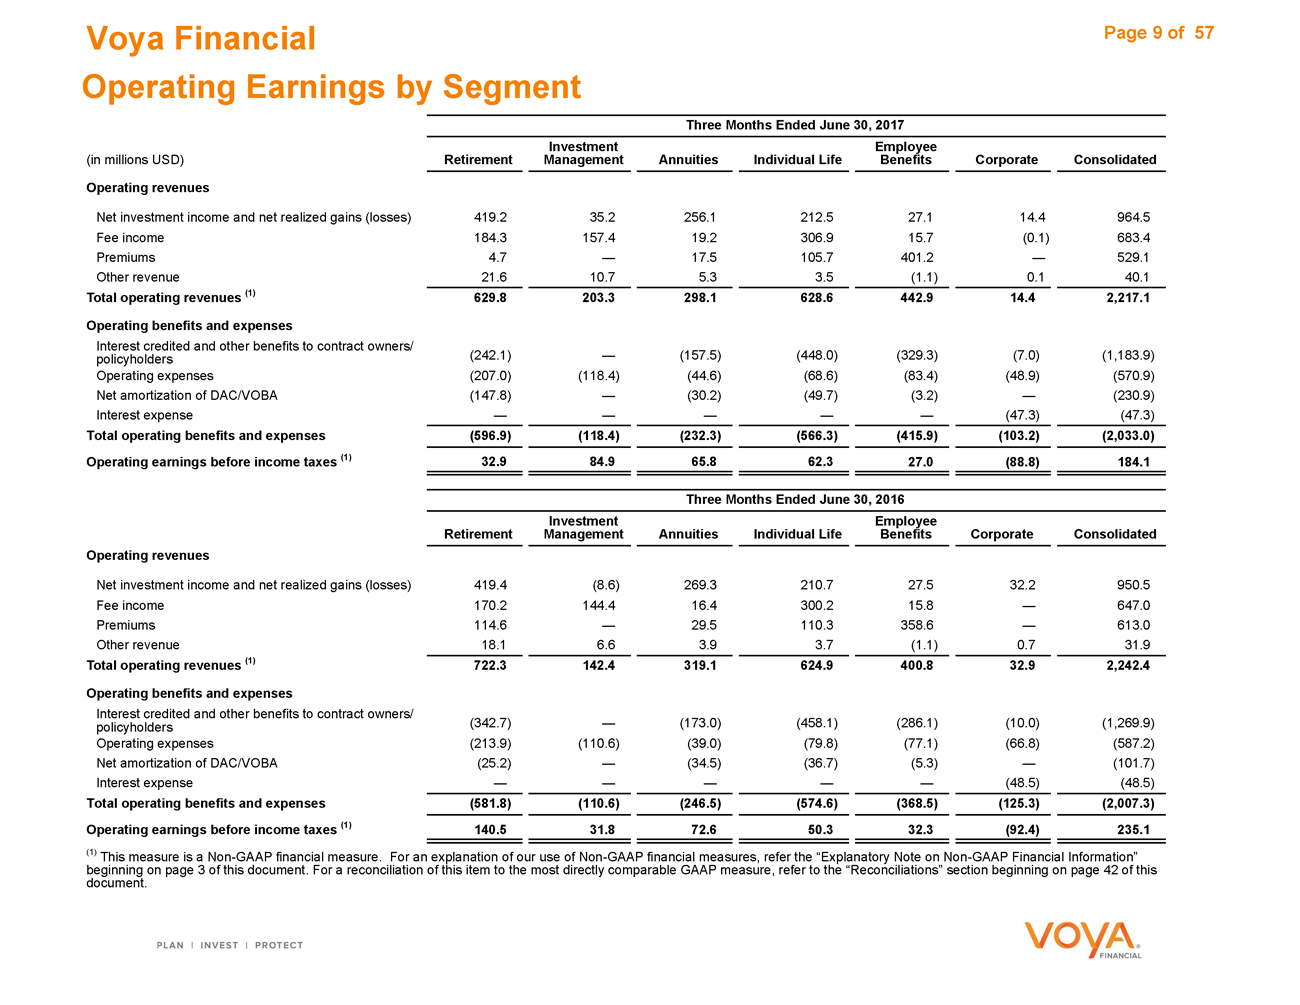
Voya Financial Page 9 of 57 Operating Earnings by Segment
Three Months Ended June 30, 2017
Investment Employee
(in millions USD) Retirement ManagementAnnuitiesIndividual LifeBenefitsCorporateConsolidated
Operating revenues
Net investment income and net realized gains (losses) 419.2 35.2256.1212.527.114.4964.5
Fee income 184.3 157.419.2306.915.7(0.1)683.4
Premiums 4.7 —17.5105.7401.2—529.1
Other revenue 21.6 10.75.33.5(1.1)0.140.1
Total operating revenues (1) 629.8 203.3298.1628.6442.914.42,217.1
Operating benefits and expenses
Interest credited and other benefits to contract owners/ (242.1)
policyholders —(157.5)(448.0)(329.3)(7.0)(1,183.9)
Operating expenses (207.0) (118.4)(44.6)(68.6)(83.4)(48.9)(570.9)
Net amortization of DAC/VOBA (147.8) —(30.2)(49.7)(3.2)—(230.9)
Interest expense — ————(47.3)(47.3)
Total operating benefits and expenses (596.9) (118.4)(232.3)(566.3)(415.9)(103.2)(2,033.0)
Operating earnings before income taxes (1) 32.9 84.965.862.327.0(88.8)184.1
Three Months Ended June 30, 2016
Investment Employee
Retirement Management AnnuitiesIndividual LifeBenefitsCorporateConsolidated
Operating revenues
Net investment income and net realized gains (losses) 419.4 (8.6)269.3210.727.532.2950.5
Fee income 170.2 144.416.4300.215.8—647.0
Premiums 114.6 —29.5110.3358.6—613.0
Other revenue 18.1 6.63.93.7(1.1)0.731.9
Total operating revenues (1) 722.3 142.4319.1624.9400.832.92,242.4
Operating benefits and expenses
Interest credited and other benefits to contract owners/ (342.7
policyholders ) —(173.0)(458.1)(286.1)(10.0)(1,269.9)
Operating expenses (213.9) (110.6)(39.0)(79.8)(77.1)(66.8)(587.2)
Net amortization of DAC/VOBA (25.2) —(34.5)(36.7)(5.3)—(101.7)
Interest expense — ————(48.5)(48.5)
Total operating benefits and expenses (581.8) (110.6)(246.5)(574.6)(368.5)(125.3)(2,007.3)
Operating earnings before income taxes (1) 140.5 31.872.650.332.3(92.4)235.1
(1) This measure is aNon-GAAP financial measure. For an explanation of our use ofNon-GAAP financial measures, refer the “Explanatory Note onNon-GAAP Financial Information” beginning on page 3 of this document. For a reconciliation of this item to the most directly comparable GAAP measure, refer to the “Reconciliations” section beginning on page 42 of this document.
Voya Financial Page 10 of 57 Operating Earnings by Segment
Six Months Ended June 30, 2017
Investment IndividualEmployee
(in millions USD) Retirement ManagementAnnuitiesLifeBenefitsCorporateConsolidated
Operating revenues
Net investment income and net realized gains (losses) 846.0 43.9512.1423.753.627.81,907.1
Fee income 362.5 307.837.5609.931.6—1,349.3
Premiums 4.1 —39.9216.4806.31.31,068.0
Other revenue 42.4 23.010.08.6(2.4)(0.3)81.3
Total operating revenues (1) 1,255.0 374.7599.51,258.6889.128.84,405.7
Operating benefits and expenses
Interest credited and other benefits to contract owners/ (474.2)
policyholders —(317.8)(923.4)(671.8)(14.3)(2,401.5)
Operating expenses (433.5) (240.5)(92.3)(147.0)(173.5)(81.5)(1,168.3)
Net amortization of DAC/VOBA (166.3) —(60.1)(94.2)(6.2)—(326.8)
Interest expense — ————(93.9)(93.9)
Total operating benefits and expenses (1,074.0) (240.5)(470.2)(1,164.6)(851.5)(189.7)(3,990.5)
Operating earnings before income taxes (1) 181.0 134.2129.394.037.6(160.9)415.2
Six Months Ended June 30, 2016
Investment IndividualEmployee
Retirement Management AnnuitiesLifeBenefitsCorporateConsolidated
Operating revenues
Net investment income and net realized gains (losses) 820.1 (23.3)524.4418.652.958.31,851.0
Fee income 335.3 283.732.2597.431.6—1,280.2
Premiums 469.2 —57.3224.8718.11.71,471.1
Other revenue 35.4 14.28.28.1(2.1)1.665.4
Total operating revenues (1) 1,660.0 274.6622.11,248.9800.561.64,667.7
Operating benefits and expenses
Interest credited and other benefits to contract owners/ (919.3
policyholders ) —(348.9)(916.9)(579.6)(11.6)(2,776.3)
Operating expenses (439.2) (220.1)(79.5)(165.4)(156.8)(116.4)(1,177.4)
Net amortization of DAC/VOBA (57.3) —(70.4)(75.2)(11.0)—(213.9)
Interest expense — ————(95.2)(95.2)
Total operating benefits and expenses (1,415.8) (220.1)(498.8)(1,157.5)(747.4)(223.2)(4,262.8)
Operating earnings before income taxes (1) 244.2 54.5123.391.453.1(161.6)404.9
(1) This measure is aNon-GAAP financial measure. For an explanation of our use ofNon-GAAP financial measures, refer the “Explanatory Note onNon-GAAP Financial Information” beginning on page 3 of this document. For a reconciliation of this item to the most directly comparable GAAP measure, refer to the “Reconciliations” section beginning on page 61 of this document.
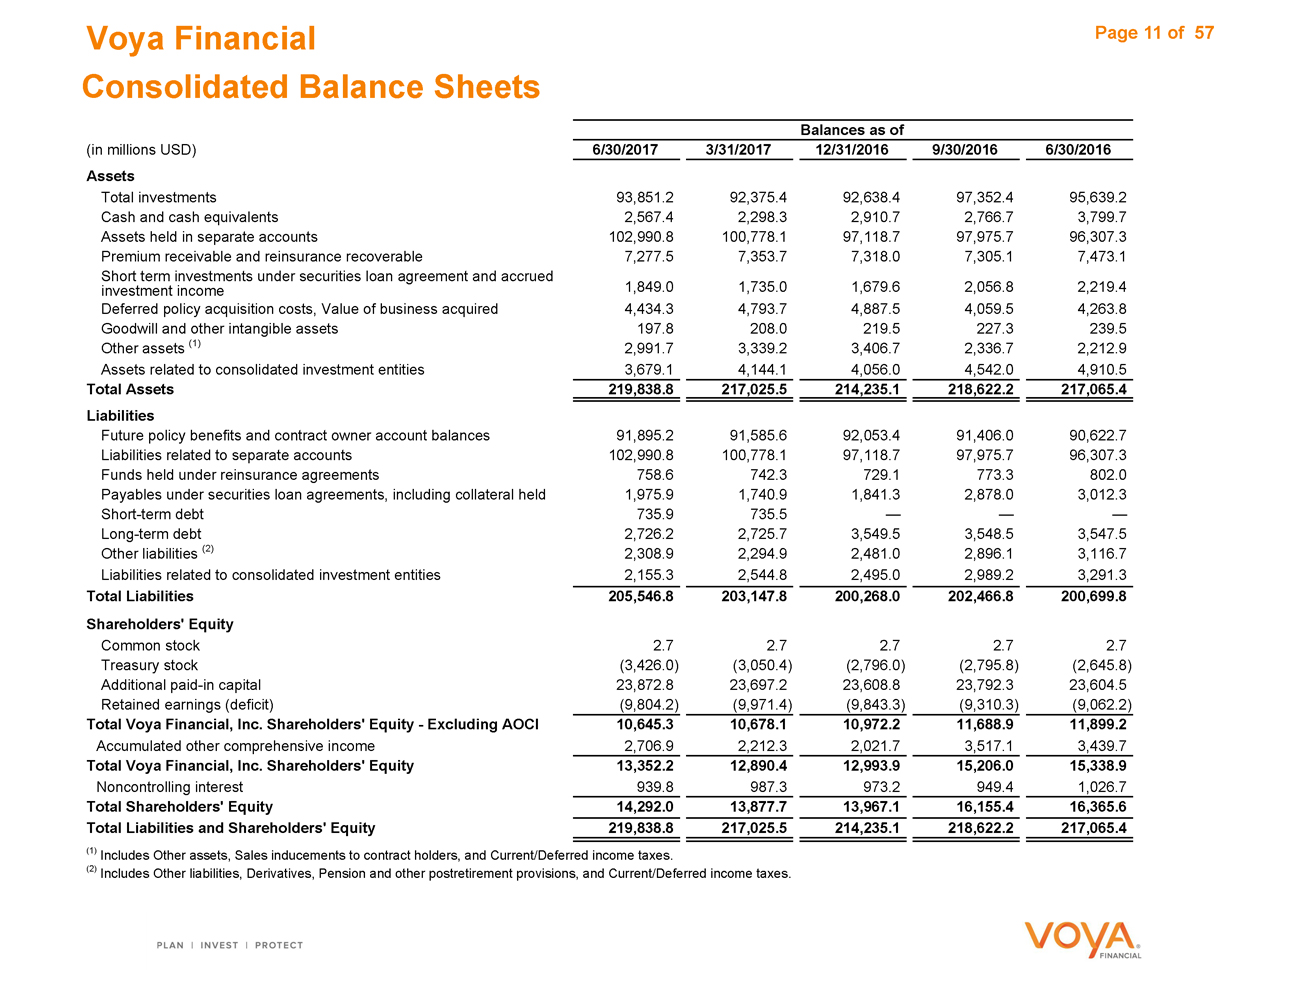
Voya Financial Page 11 of 57 Consolidated Balance Sheets
Balances as of
(in millions USD) 6/30/2017 3/31/201712/31/20169/30/20166/30/2016
Assets
Total investments 93,851.2 92,375.492,638.497,352.495,639.2
Cash and cash equivalents 2,567.4 2,298.32,910.72,766.73,799.7
Assets held in separate accounts 102,990.8 100,778.197,118.797,975.796,307.3
Premium receivable and reinsurance recoverable 7,277.5 7,353.77,318.07,305.17,473.1
Short term investments under securities loan agreement and accrued
investment income 1,849.0 1,735.01,679.62,056.82,219.4
Deferred policy acquisition costs, Value of business acquired 4,434.3 4,793.74,887.54,059.54,263.8
Goodwill and other intangible assets 197.8 208.0219.5227.3239.5
Other assets (1) 2,991.7 3,339.23,406.72,336.72,212.9
Assets related to consolidated investment entities 3,679.1 4,144.14,056.04,542.04,910.5
Total Assets 219,838.8 217,025.5214,235.1218,622.2217,065.4
Liabilities
Future policy benefits and contract owner account balances 91,895.2 91,585.692,053.491,406.090,622.7
Liabilities related to separate accounts 102,990.8 100,778.197,118.797,975.796,307.3
Funds held under reinsurance agreements 758.6 742.3729.1773.3802.0
Payables under securities loan agreements, including collateral held 1,975.9 1,740.91,841.32,878.03,012.3
Short-term debt 735.9 735.5———
Long-term debt 2,726.2 2,725.73,549.53,548.53,547.5
Other liabilities (2) 2,308.9 2,294.92,481.02,896.13,116.7
Liabilities related to consolidated investment entities 2,155.3 2,544.82,495.02,989.23,291.3
Total Liabilities 205,546.8 203,147.8200,268.0202,466.8200,699.8
Shareholders’ Equity
Common stock 2.7 2.72.72.72.7
Treasury stock (3,426.0) (3,050.4)(2,796.0)(2,795.8)(2,645.8)
Additionalpaid-in capital 23,872.8 23,697.223,608.823,792.323,604.5
Retained earnings (deficit) (9,804.2) (9,971.4)(9,843.3)(9,310.3)(9,062.2)
Total Voya Financial, Inc. Shareholders’ Equity—Excluding AOCI 10,645.3 10,678.110,972.211,688.911,899.2
Accumulated other comprehensive income 2,706.9 2,212.32,021.73,517.13,439.7
Total Voya Financial, Inc. Shareholders’ Equity 13,352.2 12,890.412,993.915,206.015,338.9
Noncontrolling interest 939.8 987.3973.2949.41,026.7
Total Shareholders’ Equity 14,292.0 13,877.713,967.116,155.416,365.6
Total Liabilities and Shareholders’ Equity 219,838.8 217,025.5214,235.1218,622.2217,065.4
(1) Includes Other assets, Sales inducements to contract holders, and Current/Deferred income taxes.
(2) Includes Other liabilities, Derivatives, Pension and other postretirement provisions, and Current/Deferred income taxes.
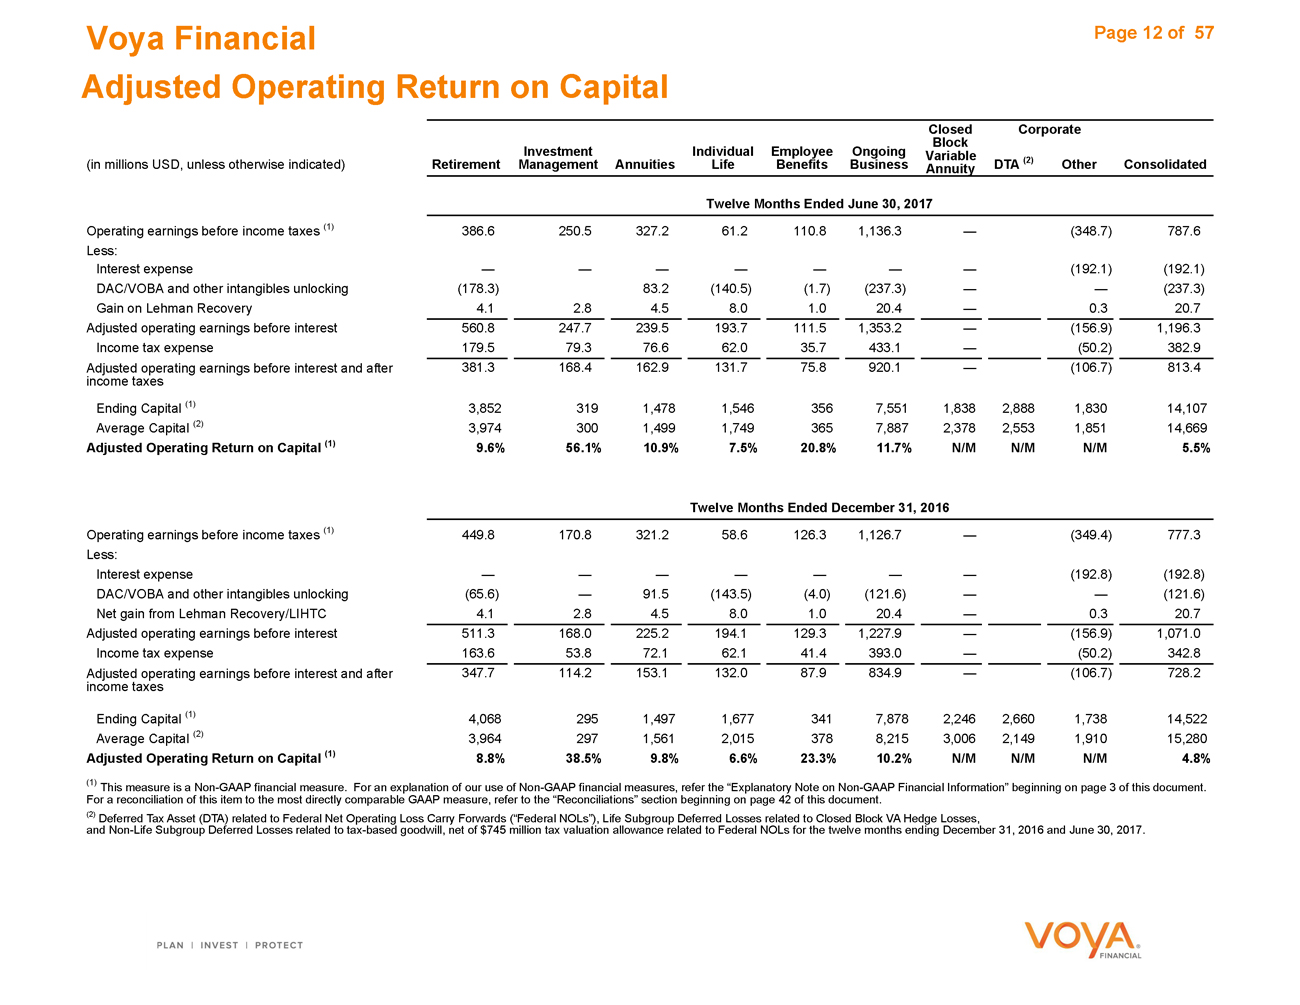
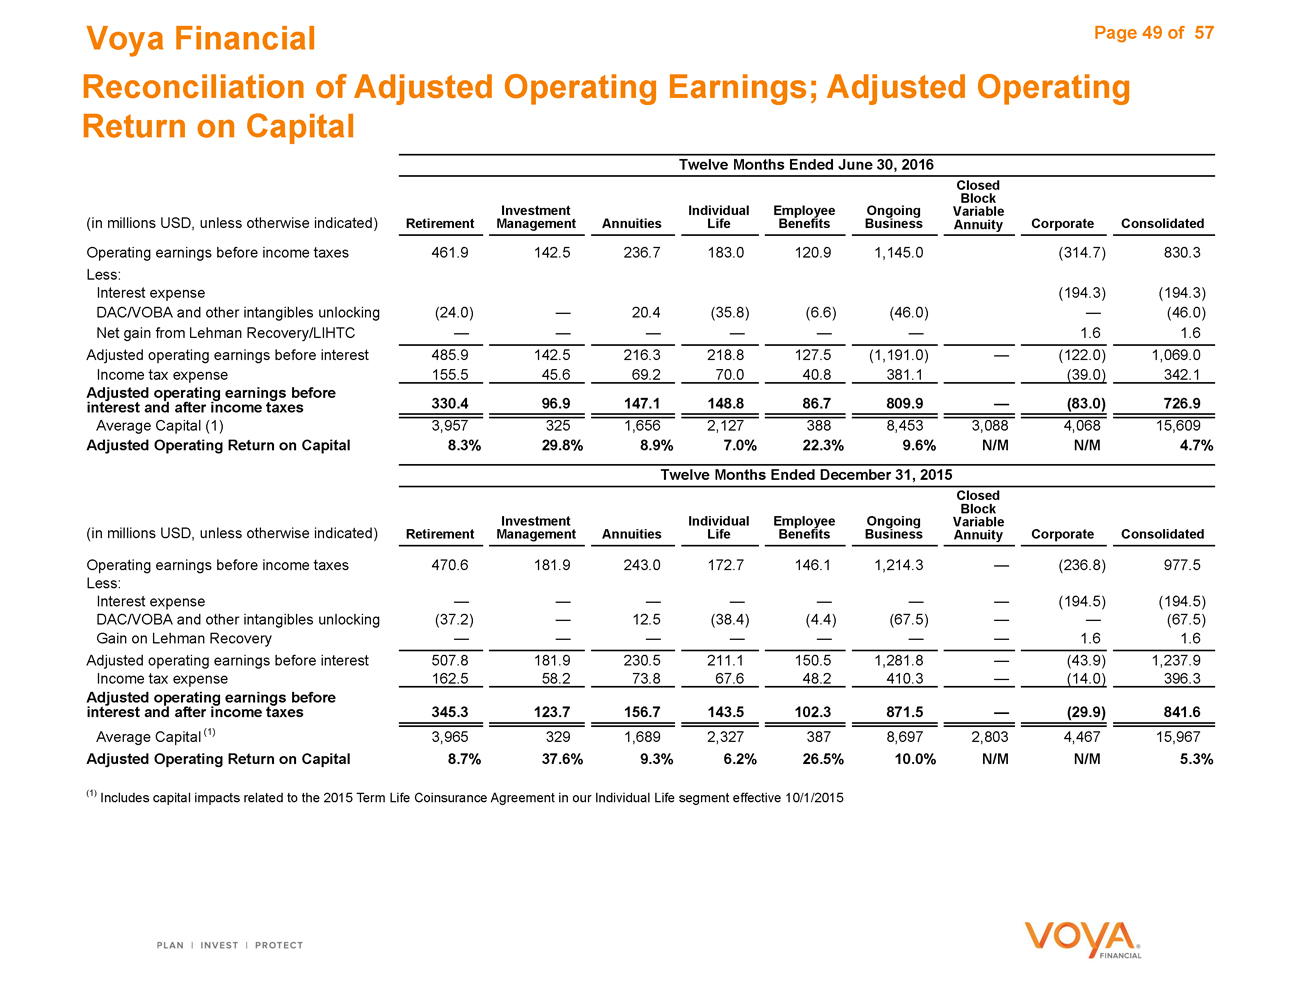
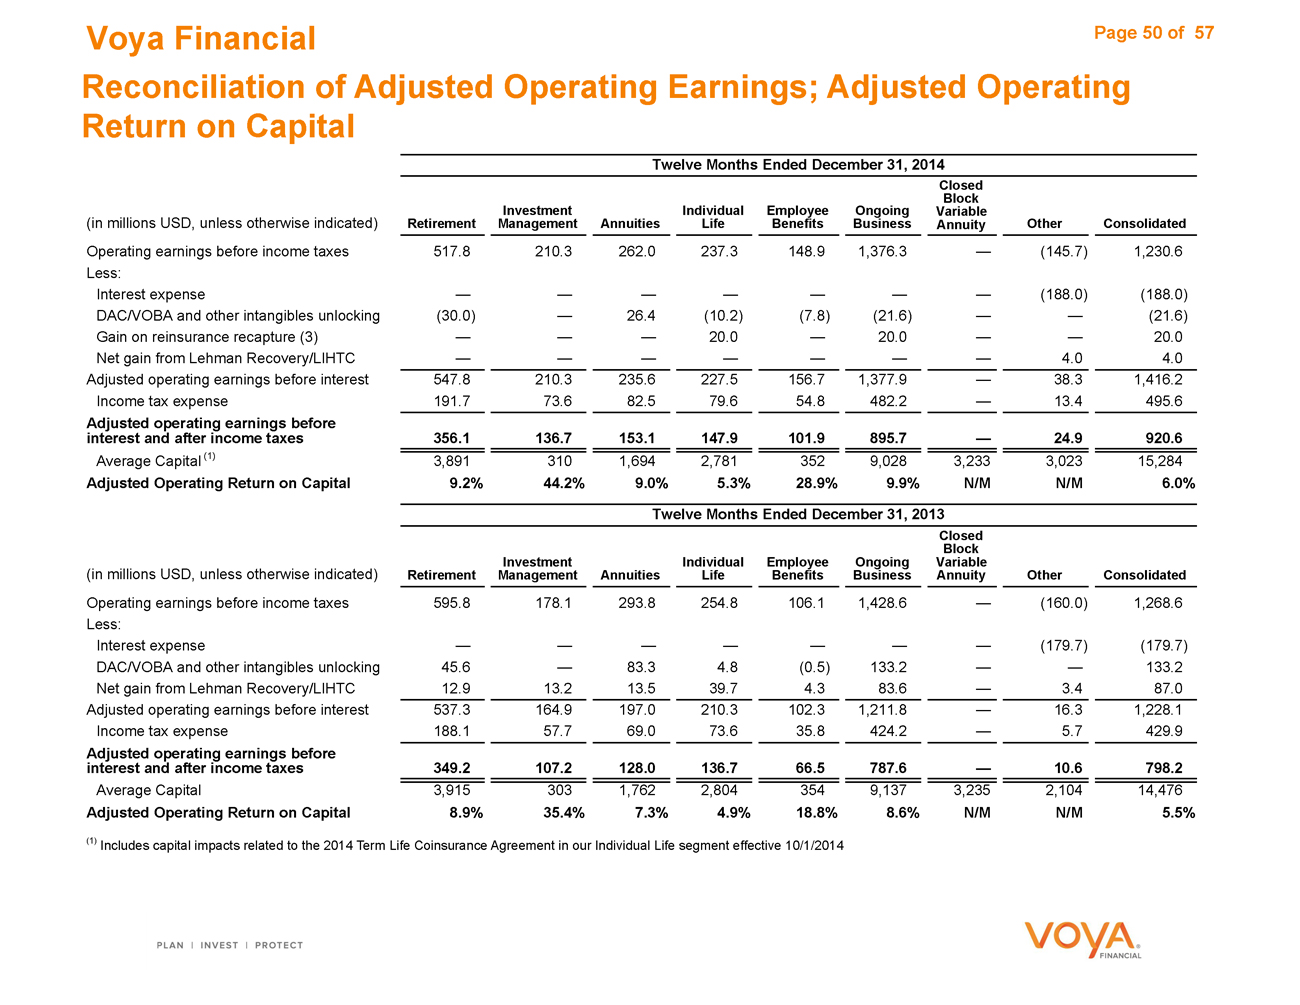
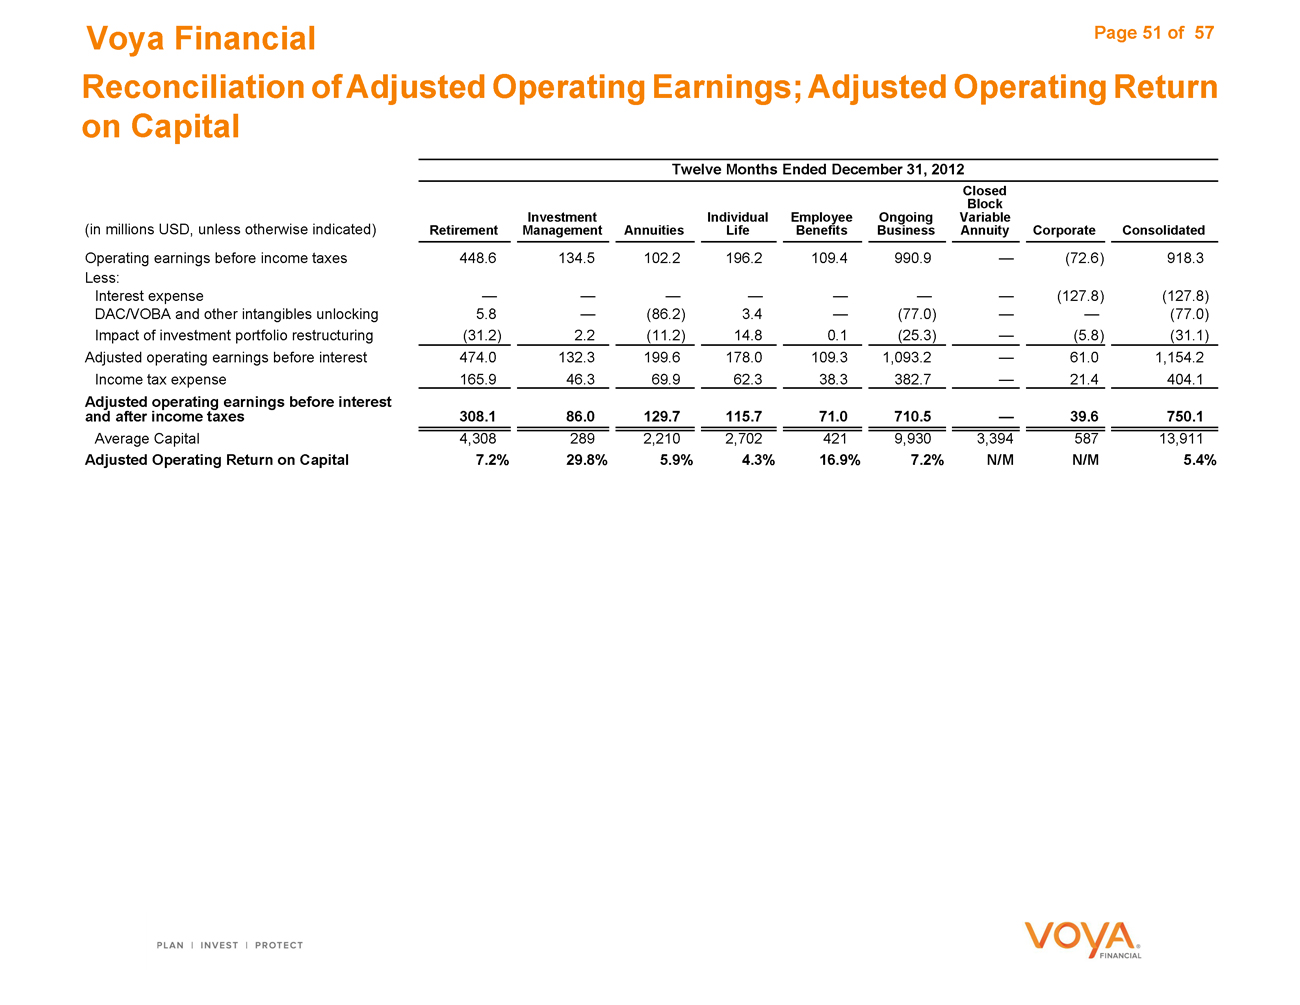
Voya Financial Page 12 of 57 Adjusted Operating Return on Capital
ClosedCorporate
Block
Investment Individual Employee Ongoing Variable(2)
(in millions USD, unless otherwise indicated) Retirement Management AnnuitiesLifeBenefits Business Annuity DTAOtherConsolidated
Twelve Months Ended June 30, 2017
Operating earnings before income taxes (1) 386.6 250.5327.261.2110.81,136.3—(348.7)787.6
Less:
Interest expense — ——————(192.1)(192.1)
DAC/VOBA and other intangibles unlocking (178.3) 83.2(140.5)(1.7)(237.3)——(237.3)
Gain on Lehman Recovery 4.1 2.84.58.01.020.4—0.320.7
Adjusted operating earnings before interest 560.8 247.7239.5193.7111.51,353.2—(156.9)1,196.3
Income tax expense 179.5 79.376.662.035.7433.1—(50.2)382.9
Adjusted operating earnings before interest and after 381.3 168.4162.9131.775.8920.1—(106.7)813.4
income taxes
Ending Capital (1) 3,852 3191,4781,5463567,5511,8382,8881,83014,107
Average Capital (2) 3,974 3001,4991,7493657,8872,3782,5531,85114,669
Adjusted Operating Return on Capital (1) 9.6% 56.1%10.9%7.5%20.8%11.7%N/MN/MN/M5.5%
Twelve Months Ended December 31, 2016
Operating earnings before income taxes (1) 449.8 170.8321.258.6126.31,126.7—(349.4)777.3
Less:
Interest expense — ——————(192.8)(192.8)
DAC/VOBA and other intangibles unlocking (65.6) —91.5(143.5)(4.0)(121.6)——(121.6)
Net gain from Lehman Recovery/LIHTC 4.1 2.84.58.01.020.4—0.320.7
Adjusted operating earnings before interest 511.3 168.0225.2194.1129.31,227.9—(156.9)1,071.0
Income tax expense 163.6 53.872.162.141.4393.0—(50.2)342.8
Adjusted operating earnings before interest and after 347.7 114.2153.1132.087.9834.9—(106.7)728.2
income taxes
Ending Capital (1) 4,068 2951,4971,6773417,8782,2462,6601,73814,522
Average Capital (2) 3,964 2971,5612,0153788,2153,0062,1491,91015,280
Adjusted Operating Return on Capital (1) 8.8% 38.5%9.8%6.6%23.3%10.2%N/MN/MN/M4.8%
(1) This measure is aNon-GAAP financial measure. For an explanation of our use ofNon-GAAP financial measures, refer the “Explanatory Note onNon-GAAP Financial Information” beginning on page 3 of this document. For a reconciliation of this item to the most directly comparable GAAP measure, refer to the “Reconciliations” section beginning on page 42 of this document.
(2) Deferred Tax Asset (DTA) related to Federal Net Operating Loss Carry Forwards (“Federal NOLs”), Life Subgroup Deferred Losses related to Closed Block VA Hedge Losses, andNon-Life Subgroup Deferred Losses related totax-based goodwill, net of $745 million tax valuation allowance related to Federal NOLs for the twelve months ending December 31, 2016 and June 30, 2017.
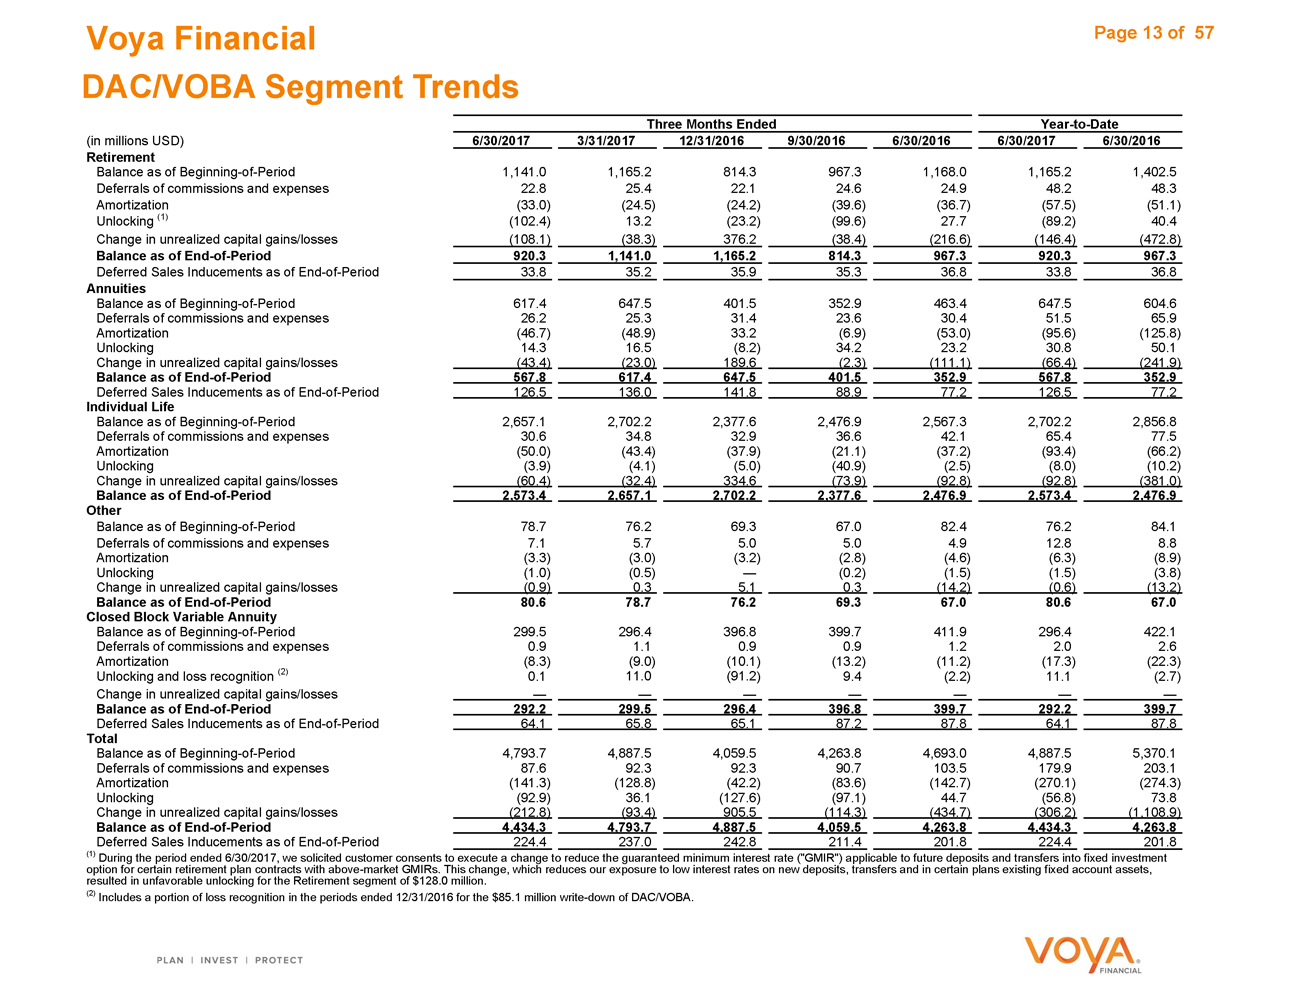
Voya Financial Page 13 of 57 DAC/VOBA Segment Trends
Three Months EndedYear-to-Date
(in millions USD) 6/30/2017 3/31/201712/31/20169/30/20166/30/20166/30/20176/30/2016
Retirement
Balance as ofBeginning-of-Period 1,141.0 1,165.2814.3967.31,168.01,165.21,402.5
Deferrals of commissions and expenses 22.8 25.422.124.624.948.248.3
Amortization (33.0) (24.5)(24.2)(39.6)(36.7)(57.5)(51.1)
Unlocking (1) (102.4) 13.2(23.2)(99.6)27.7(89.2)40.4
Change in unrealized capital gains/losses (108.1) (38.3)376.2(38.4)(216.6)(146.4)(472.8)
Balance as ofEnd-of-Period 920.3 1,141.01,165.2814.3967.3920.3967.3
Deferred Sales Inducements as ofEnd-of-Period 33.8 35.235.935.336.833.836.8
Annuities
Balance as ofBeginning-of-Period 617.4 647.5401.5352.9463.4647.5604.6
Deferrals of commissions and expenses 26.2 25.331.423.630.451.565.9
Amortization (46.7) (48.9)33.2(6.9)(53.0)(95.6)(125.8)
Unlocking 14.3 16.5(8.2)34.223.230.850.1
Change in unrealized capital gains/losses (43.4) (23.0)189.6(2.3)(111.1)(66.4)(241.9)
Balance as ofEnd-of-Period 567.8 617.4647.5401.5352.9567.8352.9
Deferred Sales Inducements as ofEnd-of-Period 126.5 136.0141.888.977.2126.577.2
Individual Life
Balance as ofBeginning-of-Period 2,657.1 2,702.22,377.62,476.92,567.32,702.22,856.8
Deferrals of commissions and expenses 30.6 34.832.936.642.165.477.5
Amortization (50.0) (43.4)(37.9)(21.1)(37.2)(93.4)(66.2)
Unlocking (3.9) (4.1)(5.0)(40.9)(2.5)(8.0)(10.2)
Change in unrealized capital gains/losses (60.4) (32.4)334.6(73.9)(92.8)(92.8)(381.0)
Balance as ofEnd-of-Period 2,573.4 2,657.12,702.22,377.62,476.92,573.42,476.9
Other
Balance as ofBeginning-of-Period 78.7 76.269.367.082.476.284.1
Deferrals of commissions and expenses 7.1 5.75.05.04.912.88.8
Amortization (3.3) (3.0)(3.2)(2.8)(4.6)(6.3)(8.9)
Unlocking (1.0) (0.5)—(0.2)(1.5)(1.5)(3.8)
Change in unrealized capital gains/losses (0.9) 0.35.10.3(14.2)(0.6)(13.2)
Balance as ofEnd-of-Period 80.6 78.776.269.367.080.667.0
Closed Block Variable Annuity
Balance as ofBeginning-of-Period 299.5 296.4396.8399.7411.9296.4422.1
Deferrals of commissions and expenses 0.9 1.10.90.91.22.02.6
Amortization (8.3) (9.0)(10.1)(13.2)(11.2)(17.3)(22.3)
Unlocking and loss recognition (2) 0.1 11.0(91.2)9.4(2.2)11.1(2.7)
Change in unrealized capital gains/losses — ——————
Balance as ofEnd-of-Period 292.2 299.5296.4396.8399.7292.2399.7
Deferred Sales Inducements as ofEnd-of-Period 64.1 65.865.187.287.864.187.8
Total
Balance as ofBeginning-of-Period 4,793.7 4,887.54,059.54,263.84,693.04,887.55,370.1
Deferrals of commissions and expenses 87.6 92.392.390.7103.5179.9203.1
Amortization (141.3) (128.8)(42.2)(83.6)(142.7)(270.1)(274.3)
Unlocking (92.9) 36.1(127.6)(97.1)44.7(56.8)73.8
Change in unrealized capital gains/losses (212.8) (93.4)905.5(114.3)(434.7)(306.2)(1,108.9)
Balance as ofEnd-of-Period 4,434.3 4,793.74,887.54,059.54,263.84,434.34,263.8
Deferred Sales Inducements as ofEnd-of-Period 224.4 237.0242.8211.4201.8224.4201.8
(1) During the period ended 6/30/2017, we solicited customer consents to execute a change to reduce the guaranteed minimum interest rate (“GMIR”) applicable to future deposits and transfers into fixed investment option for certain retirement plan contracts with above-market GMIRs. This change, which reduces our exposure to low interest rates on new deposits, transfers and in certain plans existing fixed account assets, resulted in unfavorable unlocking for the Retirement segment of $128.0 million.
(2) Includes a portion of loss recognition in the periods ended 12/31/2016 for the $85.1 million write-down of DAC/VOBA.
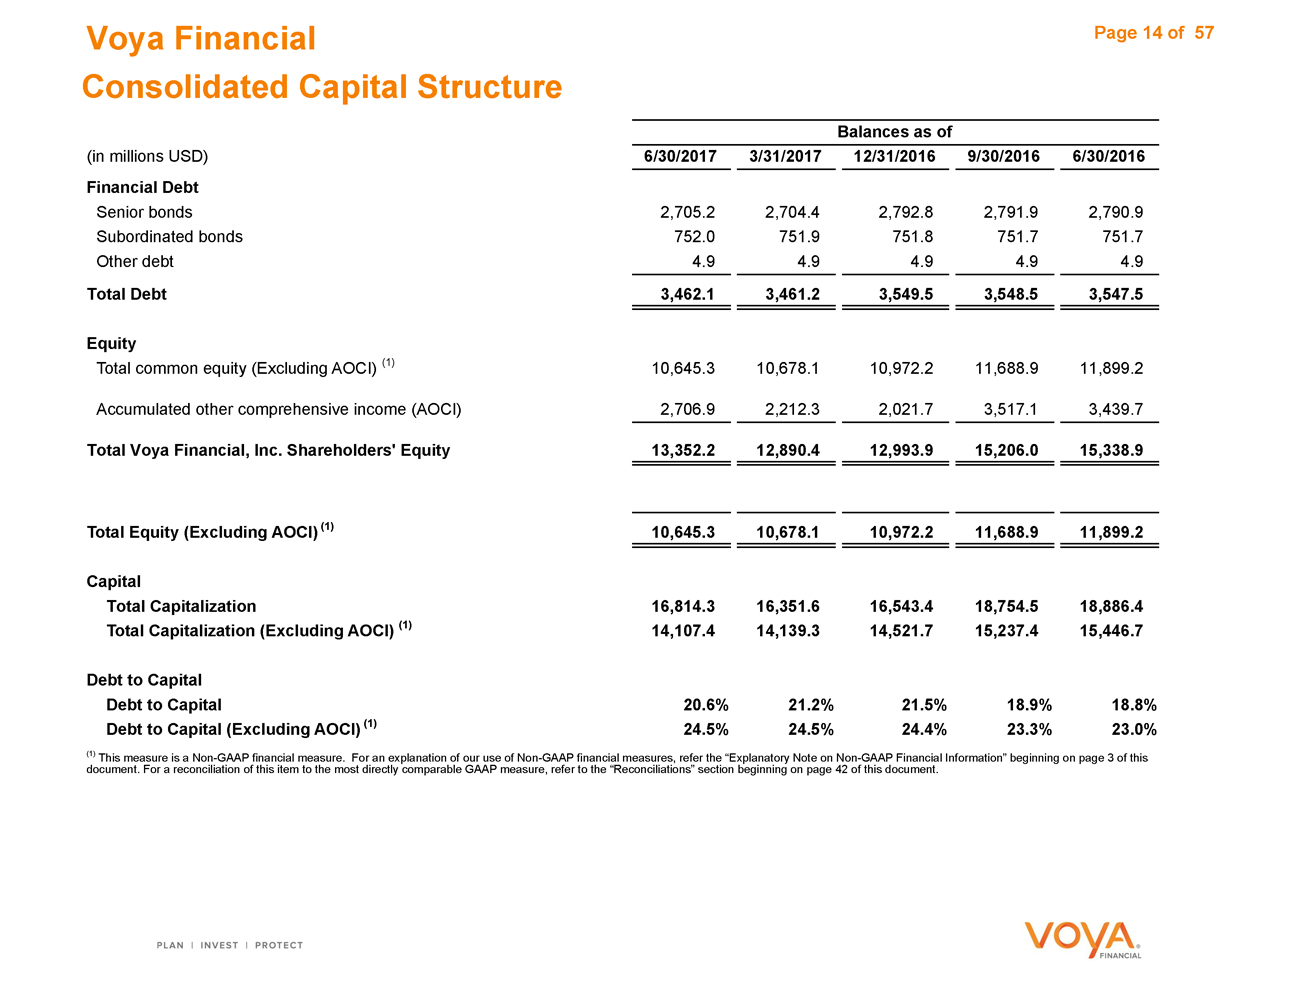
Voya Financial Page 14 of 57 Consolidated Capital Structure
Balances as of
(in millions USD) 6/30/2017 3/31/201712/31/20169/30/20166/30/2016
Financial Debt
Senior bonds 2,705.2 2,704.42,792.82,791.92,790.9
Subordinated bonds 752.0 751.9751.8751.7751.7
Other debt 4.9 4.94.94.94.9
Total Debt 3,462.1 3,461.23,549.53,548.53,547.5
Equity
Total common equity (Excluding AOCI) (1) 10,645.3 10,678.110,972.211,688.911,899.2
Accumulated other comprehensive income (AOCI) 2,706.9 2,212.32,021.73,517.13,439.7
Total Voya Financial, Inc. Shareholders’ Equity 13,352.2 12,890.412,993.915,206.015,338.9
Total Equity (Excluding AOCI) (1) 10,645.3 10,678.110,972.211,688.911,899.2
Capital
Total Capitalization 16,814.3 16,351.616,543.418,754.518,886.4
Total Capitalization (Excluding AOCI) (1) 14,107.4 14,139.314,521.715,237.415,446.7
Debt to Capital
Debt to Capital 20.6% 21.2%21.5%18.9%18.8%
Debt to Capital (Excluding AOCI) (1) 24.5% 24.5%24.4%23.3%23.0%
(1) This measure is aNon-GAAP financial measure. For an explanation of our use ofNon-GAAP financial measures, refer the “Explanatory Note onNon-GAAP Financial Information” beginning on page 3 of this document. For a reconciliation of this item to the most directly comparable GAAP measure, refer to the “Reconciliations” section beginning on page 42 of this document.
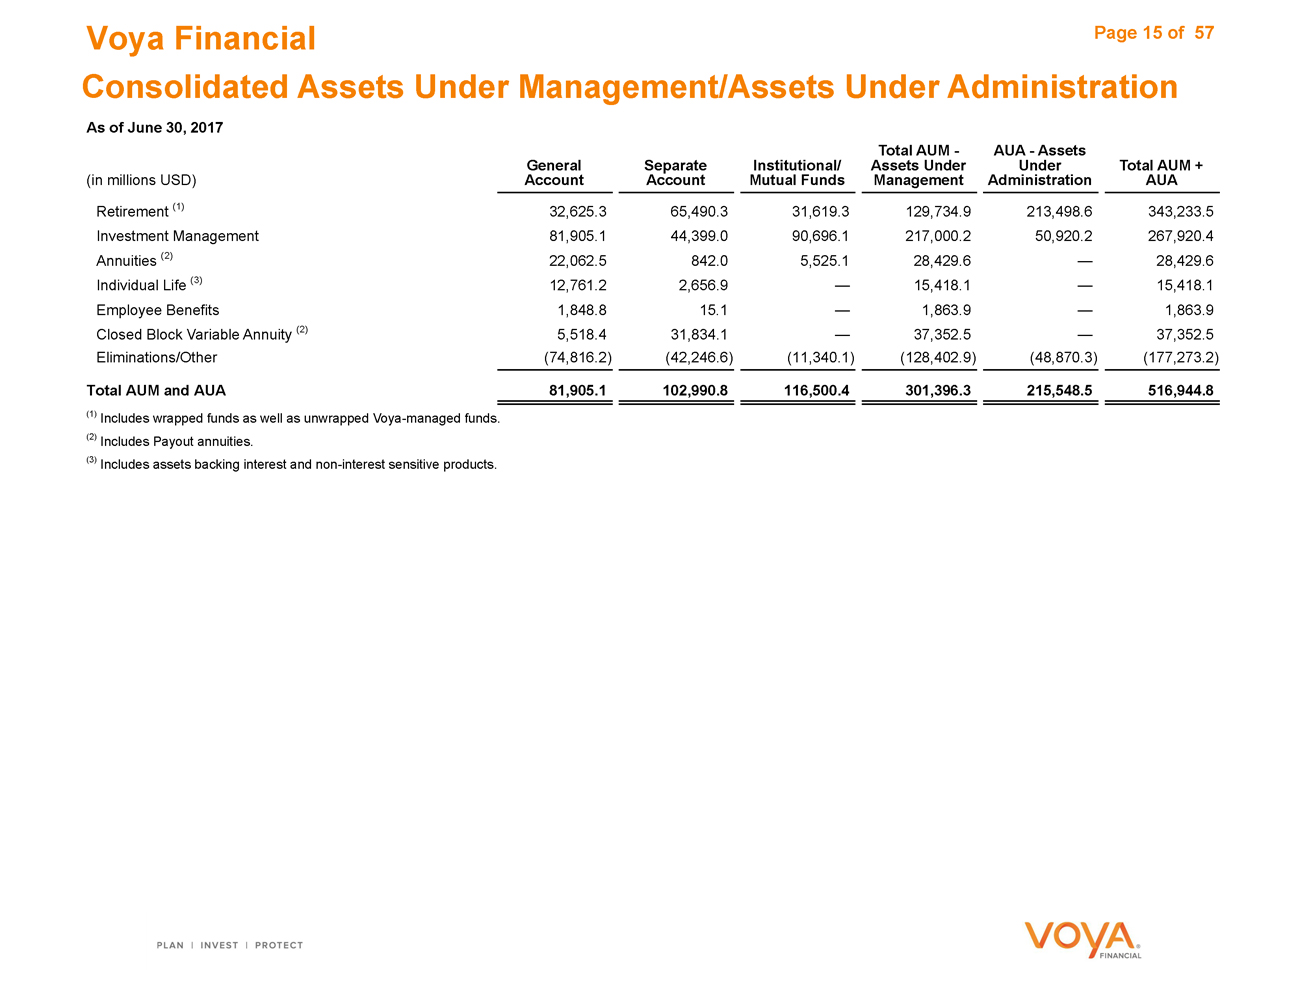
Voya Financial Page 15 of 57 Consolidated Assets Under Management/Assets Under Administration
As of June 30, 2017
Total AUM -AUA—Assets
General Separate Institutional/Assets UnderUnderTotal AUM +
(in millions USD) Account AccountMutual FundsManagementAdministrationAUA
Retirement (1) 32,625.3 65,490.331,619.3129,734.9213,498.6343,233.5
Investment Management 81,905.1 44,399.090,696.1217,000.250,920.2267,920.4
Annuities (2) 22,062.5 842.05,525.128,429.6—28,429.6
Individual Life (3) 12,761.2 2,656.9—15,418.1—15,418.1
Employee Benefits 1,848.8 15.1—1,863.9—1,863.9
Closed Block Variable Annuity (2) 5,518.4 31,834.1—37,352.5—37,352.5
Eliminations/Other (74,816.2) (42,246.6)(11,340.1)(128,402.9)(48,870.3)(177,273.2)
Total AUM and AUA 81,905.1 102,990.8116,500.4301,396.3215,548.5516,944.8
(1) Includes wrapped funds as well as unwrapped Voya-managed funds. (2) Includes Payout annuities.
(3) Includes assets backing interest andnon-interest sensitive products.
Retirement
Voya Financial Page 17 of 57 Retirement Sources of Operating Earnings and Key Metrics
Three Months Ended or As ofYear-to-Date or As of
(in millions USD) 6/30/2017 3/31/201712/31/20169/30/20166/30/20166/30/20176/30/2016
Sources of operating earnings before income taxes:
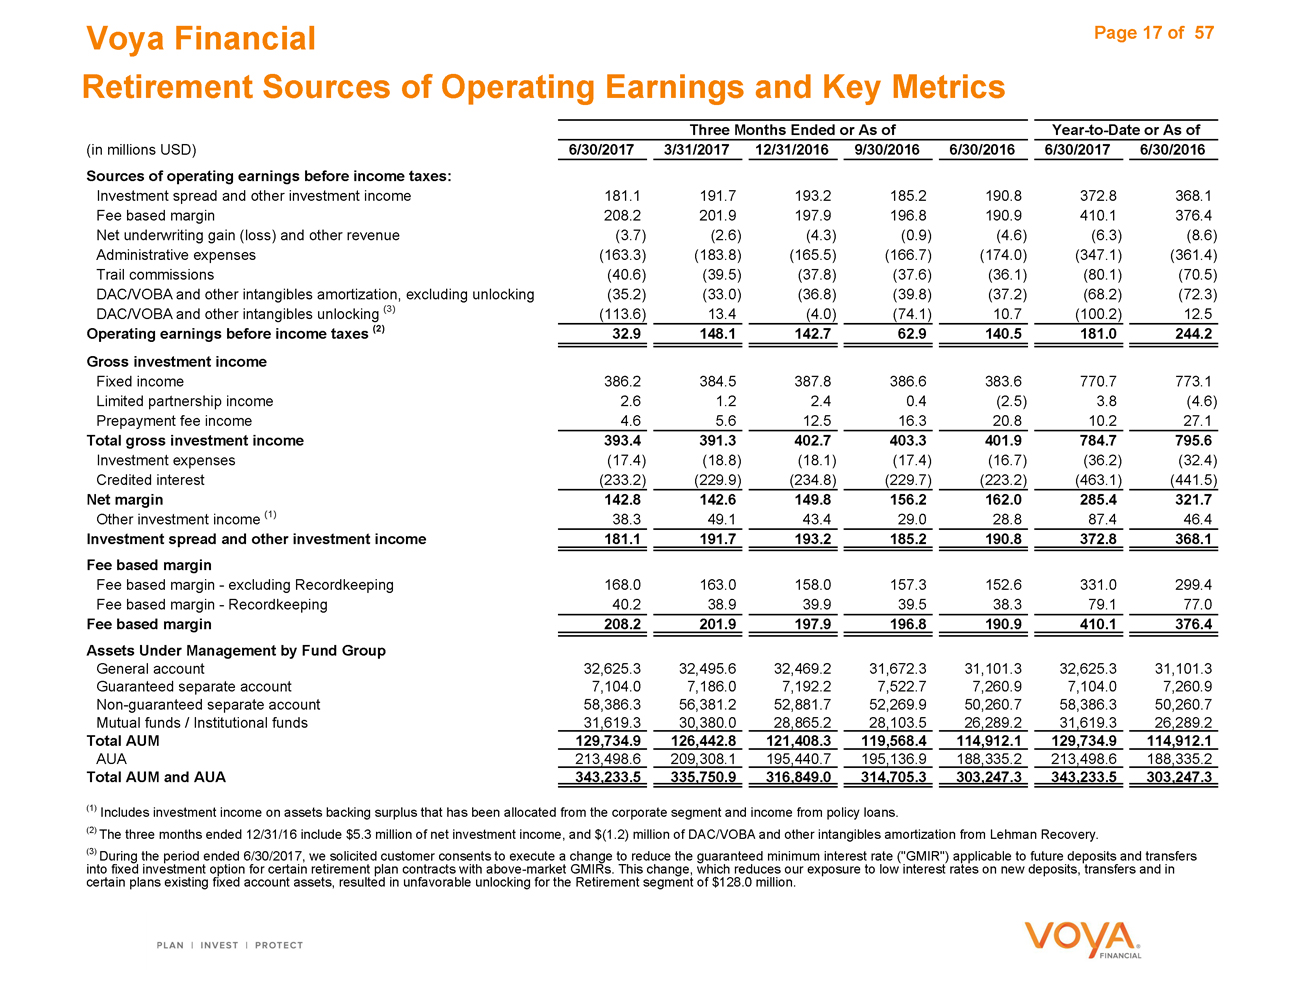
Investment spread and other investment income 181.1 191.7193.2185.2190.8372.8368.1
Fee based margin 208.2 201.9197.9196.8190.9410.1376.4
Net underwriting gain (loss) and other revenue (3.7) (2.6)(4.3)(0.9)(4.6)(6.3)(8.6)
Administrative expenses (163.3) (183.8)(165.5)(166.7)(174.0)(347.1)(361.4)
Trail commissions (40.6) (39.5)(37.8)(37.6)(36.1)(80.1)(70.5)
DAC/VOBA and other intangibles amortization, excluding unlocking (35.2) (33.0)(36.8)(39.8)(37.2)(68.2)(72.3)
DAC/VOBA and other intangibles unlocking (3) (113.6) 13.4(4.0)(74.1)10.7(100.2)12.5
Operating earnings before income taxes (2) 32.9 148.1142.762.9140.5181.0244.2
Gross investment income
Fixed income 386.2 384.5387.8386.6383.6770.7773.1
Limited partnership income 2.6 1.22.40.4(2.5)3.8(4.6)
Prepayment fee income 4.6 5.612.516.320.810.227.1
Total gross investment income 393.4 391.3402.7403.3401.9784.7795.6
Investment expenses (17.4) (18.8)(18.1)(17.4)(16.7)(36.2)(32.4)
Credited interest (233.2) (229.9)(234.8)(229.7)(223.2)(463.1)(441.5)
Net margin 142.8 142.6149.8156.2162.0285.4321.7
Other investment income (1) 38.3 49.143.429.028.887.446.4
Investment spread and other investment income 181.1 191.7193.2185.2190.8372.8368.1
Fee based margin
Fee based margin—excluding Recordkeeping 168.0 163.0158.0157.3152.6331.0299.4
Fee based margin—Recordkeeping 40.2 38.939.939.538.379.177.0
Fee based margin 208.2 201.9197.9196.8190.9410.1376.4
Assets Under Management by Fund Group
General account 32,625.3 32,495.632,469.231,672.331,101.332,625.331,101.3
Guaranteed separate account 7,104.0 7,186.07,192.27,522.77,260.97,104.07,260.9
Non-guaranteed separate account 58,386.3 56,381.252,881.752,269.950,260.758,386.350,260.7
Mutual funds / Institutional funds 31,619.3 30,380.028,865.228,103.526,289.231,619.326,289.2
Total AUM 129,734.9 126,442.8121,408.3119,568.4114,912.1129,734.9114,912.1
AUA 213,498.6 209,308.1195,440.7195,136.9188,335.2213,498.6188,335.2
Total AUM and AUA 343,233.5 335,750.9316,849.0314,705.3303,247.3343,233.5303,247.3
(1) Includes investment income on assets backing surplus that has been allocated from the corporate segment and income from policy loans.
(2) The three months ended 12/31/16 include $5.3 million of net investment income, and $(1.2) million of DAC/VOBA and other intangibles amortization from Lehman Recovery.
(3) During the period ended 6/30/2017, we solicited customer consents to execute a change to reduce the guaranteed minimum interest rate (“GMIR”) applicable to future deposits and transfers into fixed investment option for certain retirement plan contracts with above-market GMIRs. This change, which reduces our exposure to low interest rates on new deposits, transfers and in certain plans existing fixed account assets, resulted in unfavorable unlocking for the Retirement segment of $128.0 million.
Voya Financial Page 18 of 57 Retirement AUM Rollforward by Product Group
Three MonthsEndedYear-to-Date
(in millions USD) 6/30/2017 3/31/201712/31/20169/30/20166/30/20166/30/20176/30/2016
Full service—Corporate markets
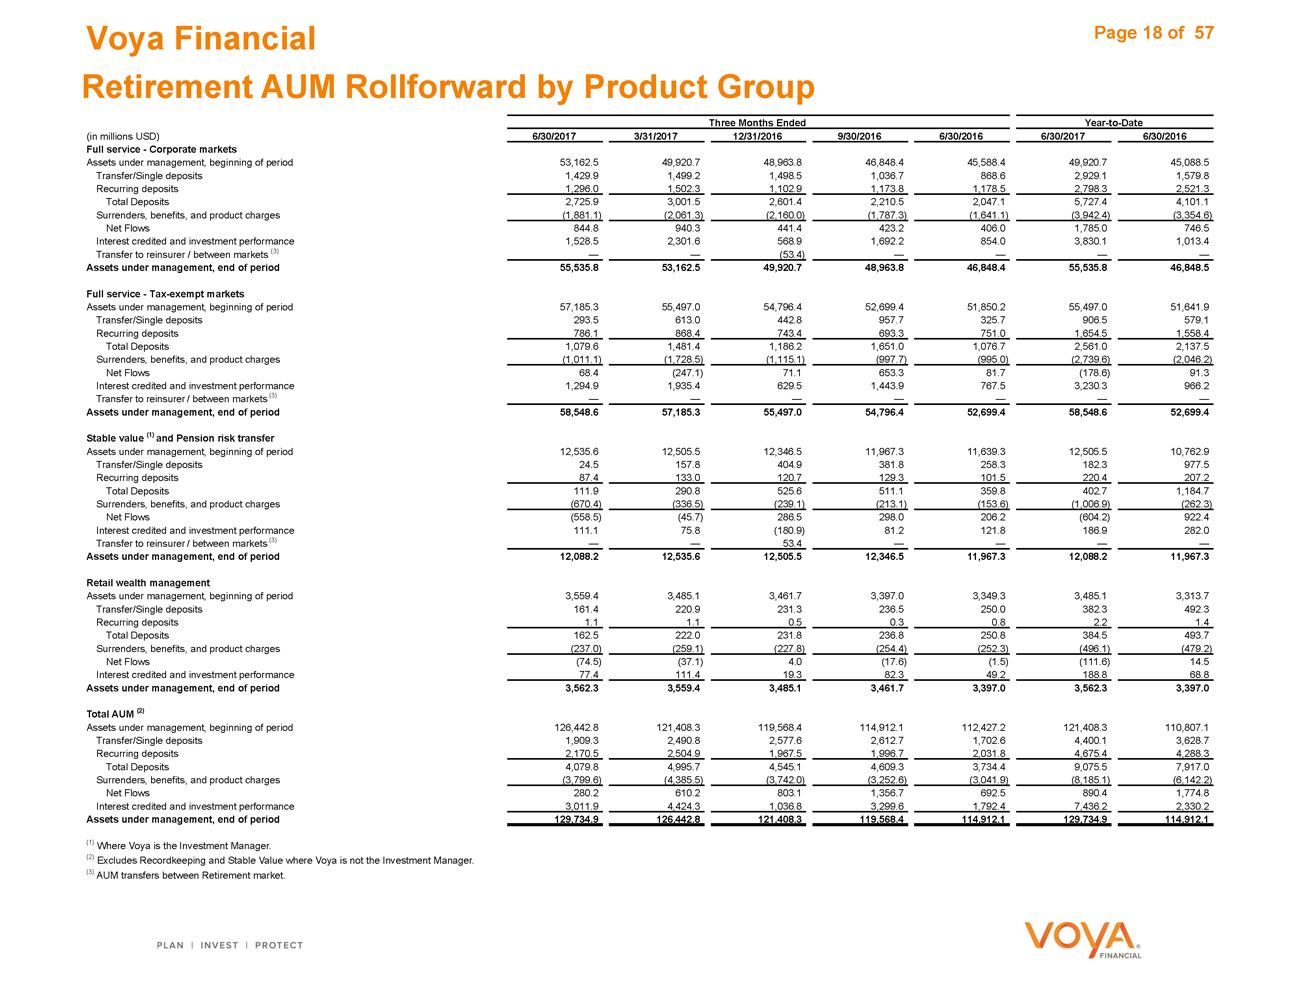
Assets under management, beginning of period 53,162.5 49,920.748,963.846,848.445,588.449,920.745,088.5
Transfer/Single deposits 1,429.9 1,499.21,498.51,036.7868.62,929.11,579.8
Recurring deposits 1,296.0 1,502.31,102.91,173.81,178.52,798.32,521.3
Total Deposits 2,725.9 3,001.52,601.42,210.52,047.15,727.44,101.1
Surrenders, benefits, and product charges (1,881.1) (2,061.3)(2,160.0)(1,787.3)(1,641.1)(3,942.4)(3,354.6)
Net Flows 844.8 940.3441.4423.2406.01,785.0746.5
Interest credited and investment performance 1,528.5 2,301.6568.91,692.2854.03,830.11,013.4
Transfer to reinsurer / between markets (3) — —(53.4)————
Assets under management, end of period 55,535.8 53,162.549,920.748,963.846,848.455,535.846,848.5
Fullservice—Tax-exempt markets
Assets under management, beginning of period 57,185.3 55,497.054,796.452,699.451,850.255,497.051,641.9
Transfer/Single deposits 293.5 613.0442.8957.7325.7906.5579.1
Recurring deposits 786.1 868.4743.4693.3751.01,654.51,558.4
Total Deposits 1,079.6 1,481.41,186.21,651.01,076.72,561.02,137.5
Surrenders, benefits, and product charges (1,011.1) (1,728.5)(1,115.1)(997.7)(995.0)(2,739.6)(2,046.2)
Net Flows 68.4 (247.1)71.1653.381.7(178.6)91.3
Interest credited and investment performance 1,294.9 1,935.4629.51,443.9767.53,230.3966.2
Transfer to reinsurer / between markets (3) — ——————
Assets under management, end of period 58,548.6 57,185.355,497.054,796.452,699.458,548.652,699.4
Stable value (1) and Pension risk transfer
Assets under management, beginning of period 12,535.6 12,505.512,346.511,967.311,639.312,505.510,762.9
Transfer/Single deposits 24.5 157.8404.9381.8258.3182.3977.5
Recurring deposits 87.4 133.0120.7129.3101.5220.4207.2
Total Deposits 111.9 290.8525.6511.1359.8402.71,184.7
Surrenders, benefits, and product charges (670.4) (336.5)(239.1)(213.1)(153.6)(1,006.9)(262.3)
Net Flows (558.5) (45.7)286.5298.0206.2(604.2)922.4
Interest credited and investment performance 111.1 75.8(180.9)81.2121.8186.9282.0
Transfer to reinsurer / between markets (3) — —53.4————
Assets under management, end of period 12,088.2 12,535.612,505.512,346.511,967.312,088.211,967.3
Retail wealth management
Assets under management, beginning of period 3,559.4 3,485.13,461.73,397.03,349.33,485.13,313.7
Transfer/Single deposits 161.4 220.9231.3236.5250.0382.3492.3
Recurring deposits 1.1 1.10.50.30.82.21.4
Total Deposits 162.5 222.0231.8236.8250.8384.5493.7
Surrenders, benefits, and product charges (237.0) (259.1)(227.8)(254.4)(252.3)(496.1)(479.2)
Net Flows (74.5) (37.1)4.0(17.6)(1.5)(111.6)14.5
Interest credited and investment performance 77.4 111.419.382.349.2188.868.8
Assets under management, end of period 3,562.3 3,559.43,485.13,461.73,397.03,562.33,397.0
Total AUM (2)
Assets under management, beginning of period 126,442.8 121,408.3119,568.4114,912.1112,427.2121,408.3110,807.1
Transfer/Single deposits 1,909.3 2,490.82,577.62,612.71,702.64,400.13,628.7
Recurring deposits 2,170.5 2,504.91,967.51,996.72,031.84,675.44,288.3
Total Deposits 4,079.8 4,995.74,545.14,609.33,734.49,075.57,917.0
Surrenders, benefits, and product charges (3,799.6) (4,385.5)(3,742.0)(3,252.6)(3,041.9)(8,185.1)(6,142.2)
Net Flows 280.2 610.2803.11,356.7692.5890.41,774.8
Interest credited and investment performance 3,011.9 4,424.31,036.83,299.61,792.47,436.22,330.2
Assets under management, end of period 129,734.9 126,442.8121,408.3119,568.4114,912.1129,734.9114,912.1
(1) Where Voya is the Investment Manager.
(2) Excludes Recordkeeping and Stable Value where Voya is not the Investment Manager. (3) AUM transfers between Retirement market.
Investment Management
Voya Financial Page 20 of 57 Investment Management Sources of Operating Earnings
| | | | | | | | | | | | | | |
| | | | | Three Months Ended | | | | Year-to-Date |
(in millions USD) | | 6/30/2017 | | 3/31/2017 | | 12/31/2016 | | 9/30/2016 | | 6/30/2016 | | 6/30/2017 | | 6/30/2016 |
Sources of operating earnings before income taxes: | | | | | | | | | | | | | | |
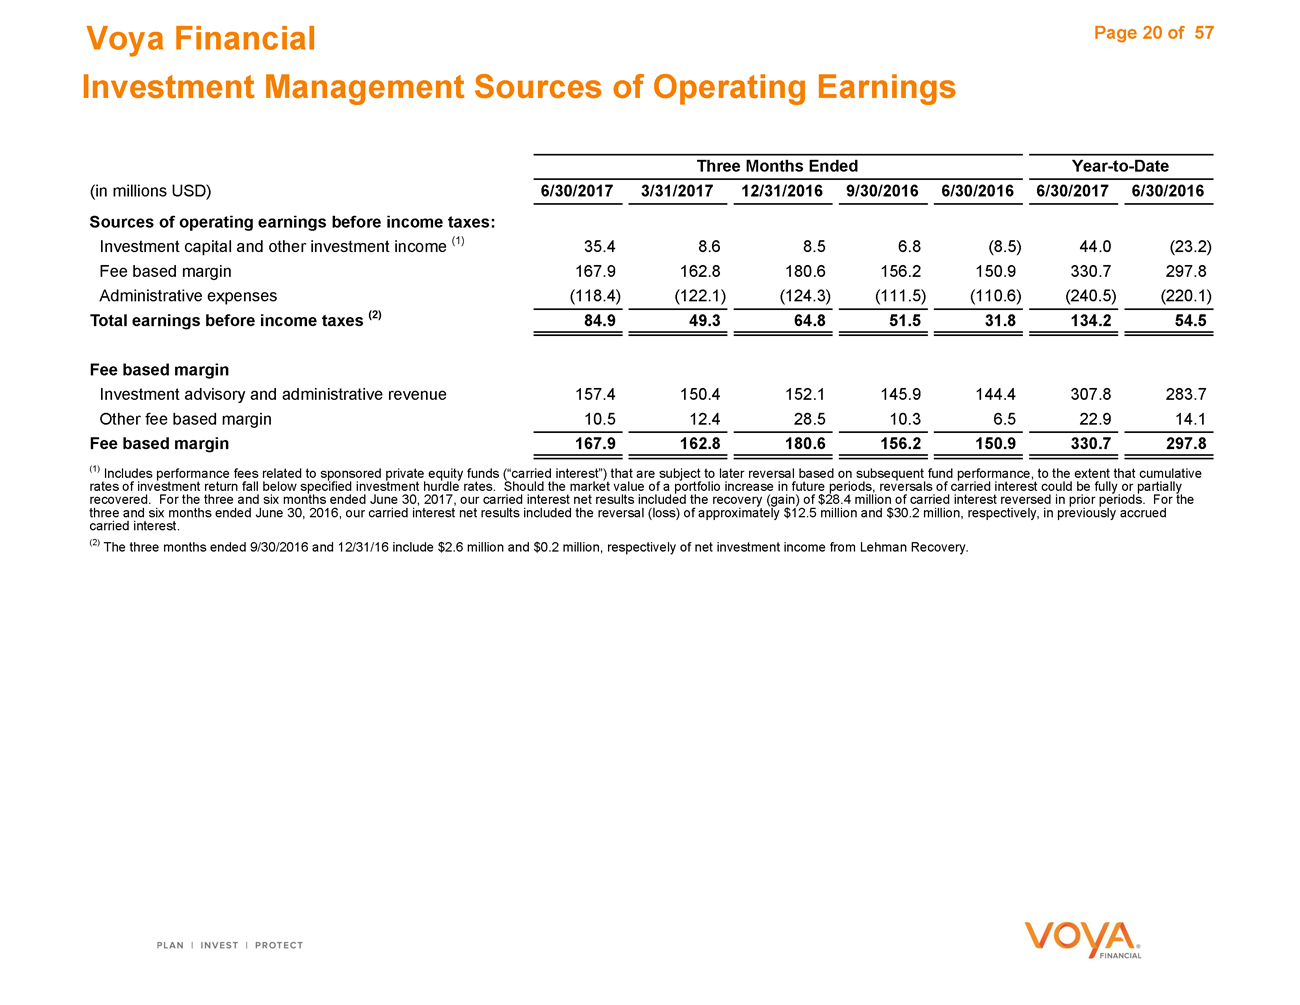
Investment capital and other investment income (1) | | 35.4 | | 8.6 | | 8.5 | | 6.8 | | (8.5) | | 44.0 | | (23.2) |
Fee based margin | | 167.9 | | 162.8 | | 180.6 | | 156.2 | | 150.9 | | 330.7 | | 297.8 |
Administrative expenses | | (118.4) | | (122.1) | | (124.3) | | (111.5) | | (110.6) | | (240.5) | | (220.1) |
Total earnings before income taxes (2) | | 84.9 | | 49.3 | | 64.8 | | 51.5 | | 31.8 | | 134.2 | | 54.5 |
Fee based margin | | | | | | | | | | | | | | |
Investment advisory and administrative revenue | | 157.4 | | 150.4 | | 152.1 | | 145.9 | | 144.4 | | 307.8 | | 283.7 |
Other fee based margin | | 10.5 | | 12.4 | | 28.5 | | 10.3 | | 6.5 | | 22.9 | | 14.1 |
Fee based margin | | 167.9 | | 162.8 | | 180.6 | | 156.2 | | 150.9 | | 330.7 | | 297.8 |
(1) Includes performance fees related to sponsored private equity funds (“carried interest”) that are subject to later reversal based on subsequent fund performance, to the extent that cumulative rates of investment return fall below specified investment hurdle rates. Should the market value of a portfolio increase in future periods, reversals of carried interest could be fully or partially recovered. For the three and six months ended June 30, 2017, our carried interest net results included the recovery (gain) of $28.4 million of carried interest reversed in prior periods. For the three and six months ended June 30, 2016, our carried interest net results included the reversal (loss) of approximately $12.5 million and $30.2 million, respectively, in previously accrued carried interest.
(2) The three months ended 9/30/2016 and 12/31/16 include $2.6 million and $0.2 million, respectively of net investment income from Lehman Recovery.
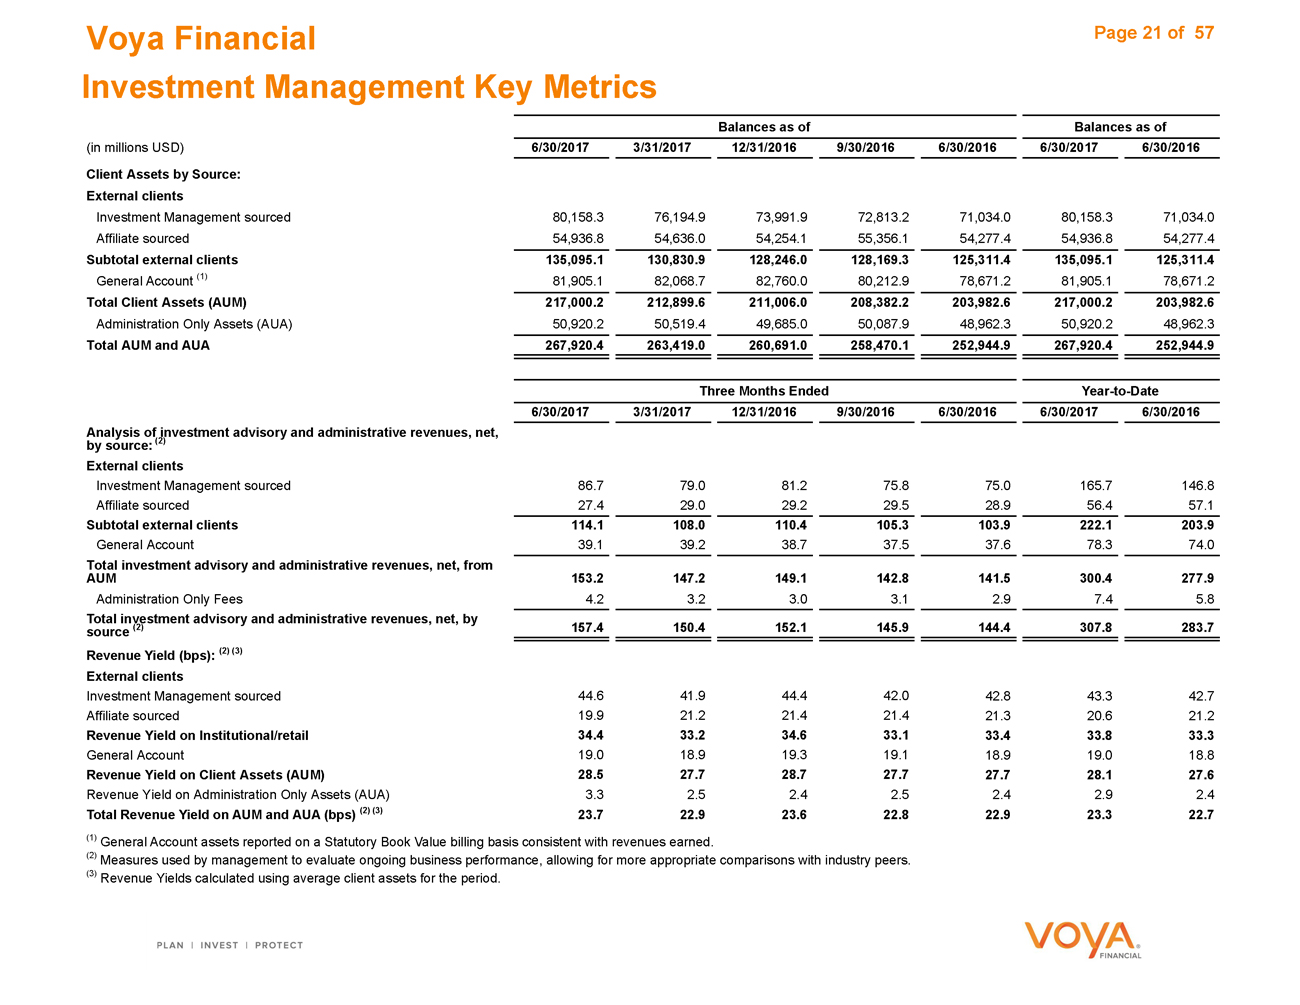
Voya Financial Page 21 of 57 Investment Management Key Metrics
Balances as ofBalances as of
(in millions USD) 6/30/2017 3/31/201712/31/20169/30/20166/30/20166/30/20176/30/2016
Client Assets by Source:
External clients
Investment Management sourced 80,158.3 76,194.973,991.972,813.271,034.080,158.371,034.0
Affiliate sourced 54,936.8 54,636.054,254.155,356.154,277.454,936.854,277.4
Subtotal external clients 135,095.1 130,830.9128,246.0128,169.3125,311.4135,095.1125,311.4
General Account (1) 81,905.1 82,068.782,760.080,212.978,671.281,905.178,671.2
Total Client Assets (AUM) 217,000.2 212,899.6211,006.0208,382.2203,982.6217,000.2203,982.6
Administration Only Assets (AUA) 50,920.2 50,519.449,685.050,087.948,962.350,920.248,962.3
Total AUM and AUA 267,920.4 263,419.0260,691.0258,470.1252,944.9267,920.4252,944.9
Three Months EndedYear-to-Date
6/30/2017 3/31/2017 12/31/20169/30/20166/30/20166/30/20176/30/2016
Analysis of investment advisory and administrative revenues, net,
by source: (2)
External clients
Investment Management sourced 86.7 79.081.275.875.0165.7146.8
Affiliate sourced 27.4 29.029.229.528.956.457.1
Subtotal external clients 114.1 108.0110.4105.3103.9222.1203.9
General Account 39.1 39.238.737.537.678.374.0
Total investment advisory and administrative revenues, net, from
AUM 153.2 147.2149.1142.8141.5300.4277.9
Administration Only Fees 4.2 3.23.03.12.97.45.8
Total investment advisory and administrative revenues, net, by
source (2) 157.4 150.4152.1145.9144.4307.8283.7
Revenue Yield (bps): (2) (3)
External clients
Investment Management sourced 44.6 41.944.442.042.843.342.7
Affiliate sourced 19.9 21.221.421.421.320.621.2
Revenue Yield on Institutional/retail 34.4 33.234.633.133.433.833.3
General Account 19.0 18.919.319.118.919.018.8
Revenue Yield on Client Assets (AUM) 28.5 27.728.727.727.728.127.6
Revenue Yield on Administration Only Assets (AUA) 3.3 2.52.42.52.42.92.4
Total Revenue Yield on AUM and AUA (bps) (2) (3) 23.7 22.923.622.822.923.322.7
(1) General Account assets reported on a Statutory Book Value billing basis consistent with revenues earned.
(2) Measures used by management to evaluate ongoing business performance, allowing for more appropriate comparisons with industry peers. (3) Revenue Yields calculated using average client assets for the period.
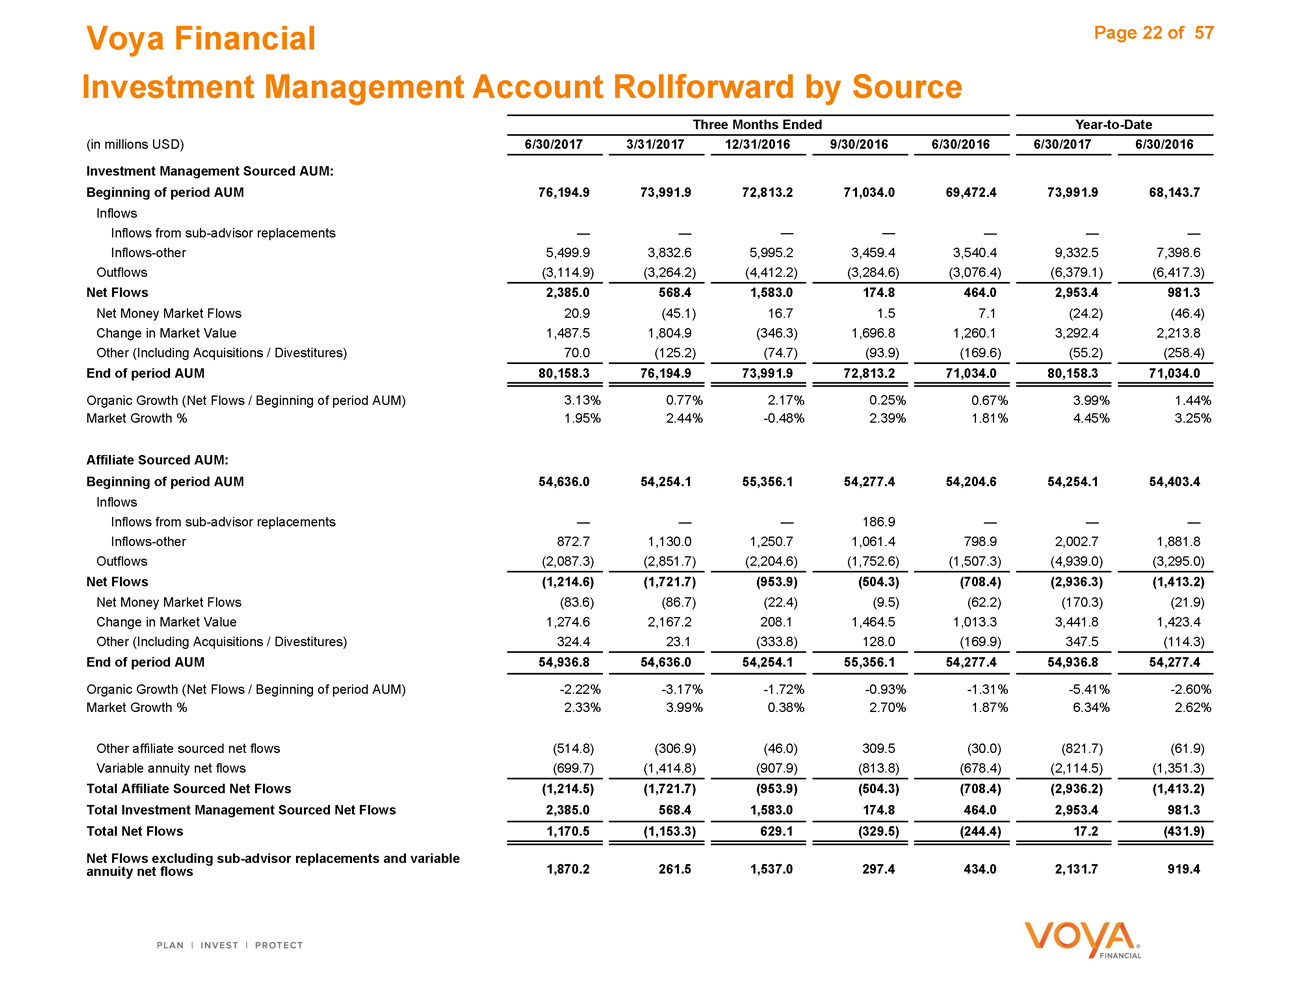
Voya Financial Page 22 of 57 Investment Management Account Rollforward by Source
Three Months EndedYear-to-Date
(in millions USD) 6/30/2017 3/31/201712/31/20169/30/20166/30/20166/30/20176/30/2016
Investment Management Sourced AUM:
Beginning of period AUM 76,194.9 73,991.972,813.271,034.069,472.473,991.968,143.7
Inflows
Inflows fromsub-advisor replacements — ——————
Inflows-other 5,499.9 3,832.65,995.23,459.43,540.49,332.57,398.6
Outflows (3,114.9) (3,264.2)(4,412.2)(3,284.6)(3,076.4)(6,379.1)(6,417.3)
Net Flows 2,385.0 568.41,583.0174.8464.02,953.4981.3
Net Money Market Flows 20.9 (45.1)16.71.57.1(24.2)(46.4)
Change in Market Value 1,487.5 1,804.9(346.3)1,696.81,260.13,292.42,213.8
Other (Including Acquisitions / Divestitures) 70.0 (125.2)(74.7)(93.9)(169.6)(55.2)(258.4)
End of period AUM 80,158.3 76,194.973,991.972,813.271,034.080,158.371,034.0
Organic Growth (Net Flows / Beginning of period AUM) 3.13% 0.77%2.17%0.25%0.67%3.99%1.44%
Market Growth % 1.95% 2.44%-0.48%2.39%1.81%4.45%3.25%
Affiliate Sourced AUM:
Beginning of period AUM 54,636.0 54,254.155,356.154,277.454,204.654,254.154,403.4
Inflows
Inflows fromsub-advisor replacements — ——186.9———
Inflows-other 872.7 1,130.01,250.71,061.4798.92,002.71,881.8
Outflows (2,087.3) (2,851.7)(2,204.6)(1,752.6)(1,507.3)(4,939.0)(3,295.0)
Net Flows (1,214.6) (1,721.7)(953.9)(504.3)(708.4)(2,936.3)(1,413.2)
Net Money Market Flows (83.6) (86.7)(22.4)(9.5)(62.2)(170.3)(21.9)
Change in Market Value 1,274.6 2,167.2208.11,464.51,013.33,441.81,423.4
Other (Including Acquisitions / Divestitures) 324.4 23.1(333.8)128.0(169.9)347.5(114.3)
End of period AUM 54,936.8 54,636.054,254.155,356.154,277.454,936.854,277.4
Organic Growth (Net Flows / Beginning of period AUM) -2.22% -3.17%-1.72%-0.93%-1.31%-5.41%-2.60%
Market Growth % 2.33% 3.99%0.38%2.70%1.87%6.34%2.62%
Other affiliate sourced net flows (514.8) (306.9)(46.0)309.5(30.0)(821.7)(61.9)
Variable annuity net flows (699.7) (1,414.8)(907.9)(813.8)(678.4)(2,114.5)(1,351.3)
Total Affiliate Sourced Net Flows (1,214.5) (1,721.7)(953.9)(504.3)(708.4)(2,936.2)(1,413.2)
Total Investment Management Sourced Net Flows 2,385.0 568.41,583.0174.8464.02,953.4981.3
Total Net Flows 1,170.5 (1,153.3)629.1(329.5)(244.4)17.2(431.9)
Net Flows excludingsub-advisor replacements and variable
annuity net flows 1,870.2 261.51,537.0297.4434.02,131.7919.4
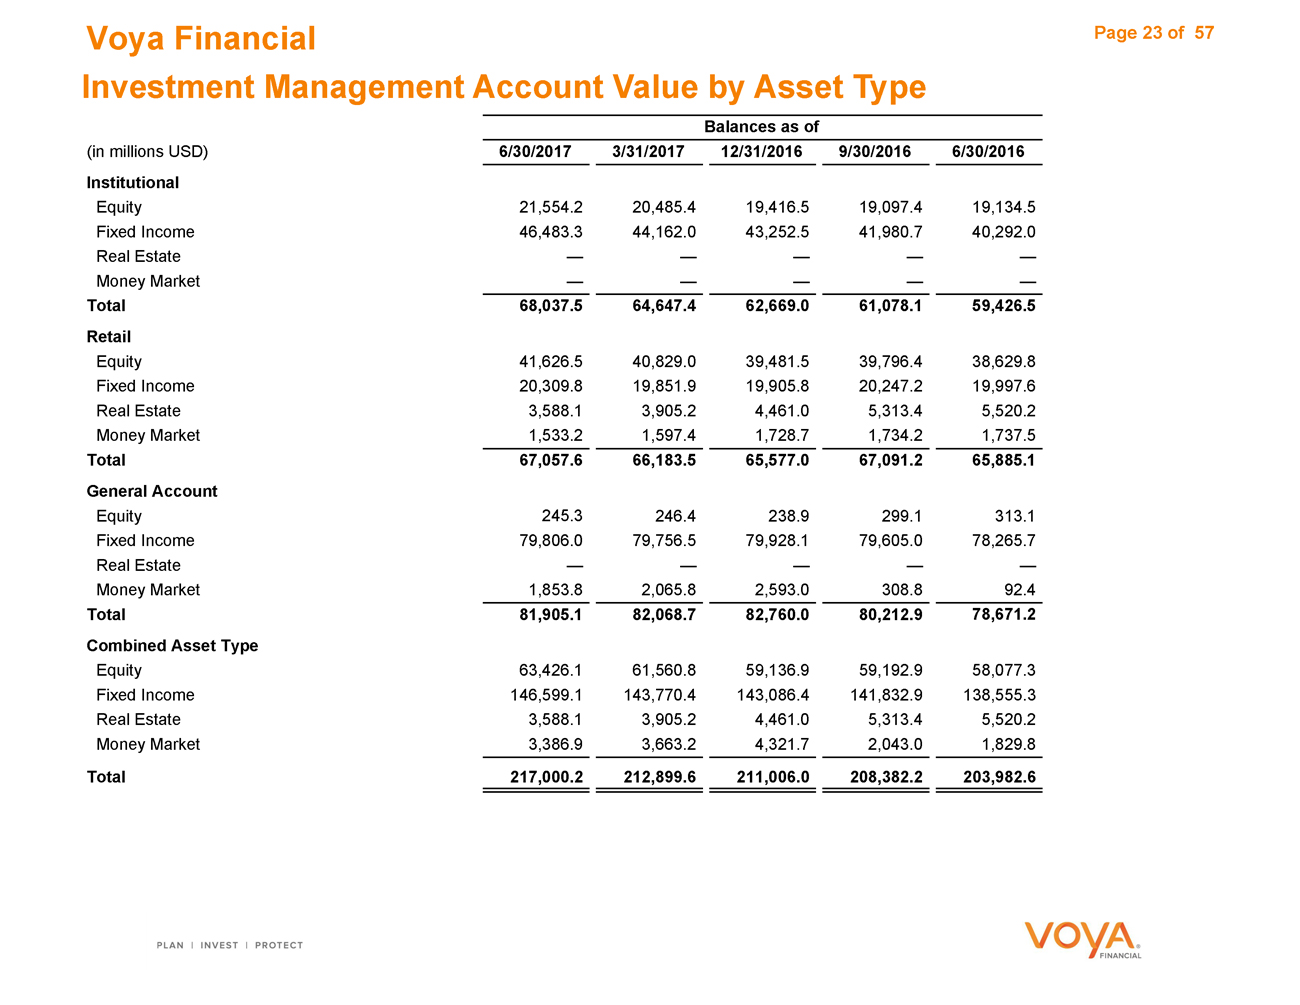
Voya Financial Page 23 of 57 Investment Management Account Value by Asset Type
Balances as of
(in millions USD) 6/30/2017 3/31/201712/31/20169/30/20166/30/2016
Institutional
Equity 21,554.2 20,485.419,416.519,097.419,134.5
Fixed Income 46,483.3 44,162.043,252.541,980.740,292.0
Real Estate — ————
Money Market — ————
Total 68,037.5 64,647.462,669.061,078.159,426.5
Retail
Equity 41,626.5 40,829.039,481.539,796.438,629.8
Fixed Income 20,309.8 19,851.919,905.820,247.219,997.6
Real Estate 3,588.1 3,905.24,461.05,313.45,520.2
Money Market 1,533.2 1,597.41,728.71,734.21,737.5
Total 67,057.6 66,183.565,577.067,091.265,885.1
General Account
Equity 245.3 246.4238.9299.1313.1
Fixed Income 79,806.0 79,756.579,928.179,605.078,265.7
Real Estate — ————
Money Market 1,853.8 2,065.82,593.0308.892.4
Total 81,905.1 82,068.782,760.080,212.978,671.2
Combined Asset Type
Equity 63,426.1 61,560.859,136.959,192.958,077.3
Fixed Income 146,599.1 143,770.4143,086.4141,832.9138,555.3
Real Estate 3,588.1 3,905.24,461.05,313.45,520.2
Money Market 3,386.9 3,663.24,321.72,043.01,829.8
Total 217,000.2 212,899.6211,006.0208,382.2203,982.6
Annuities
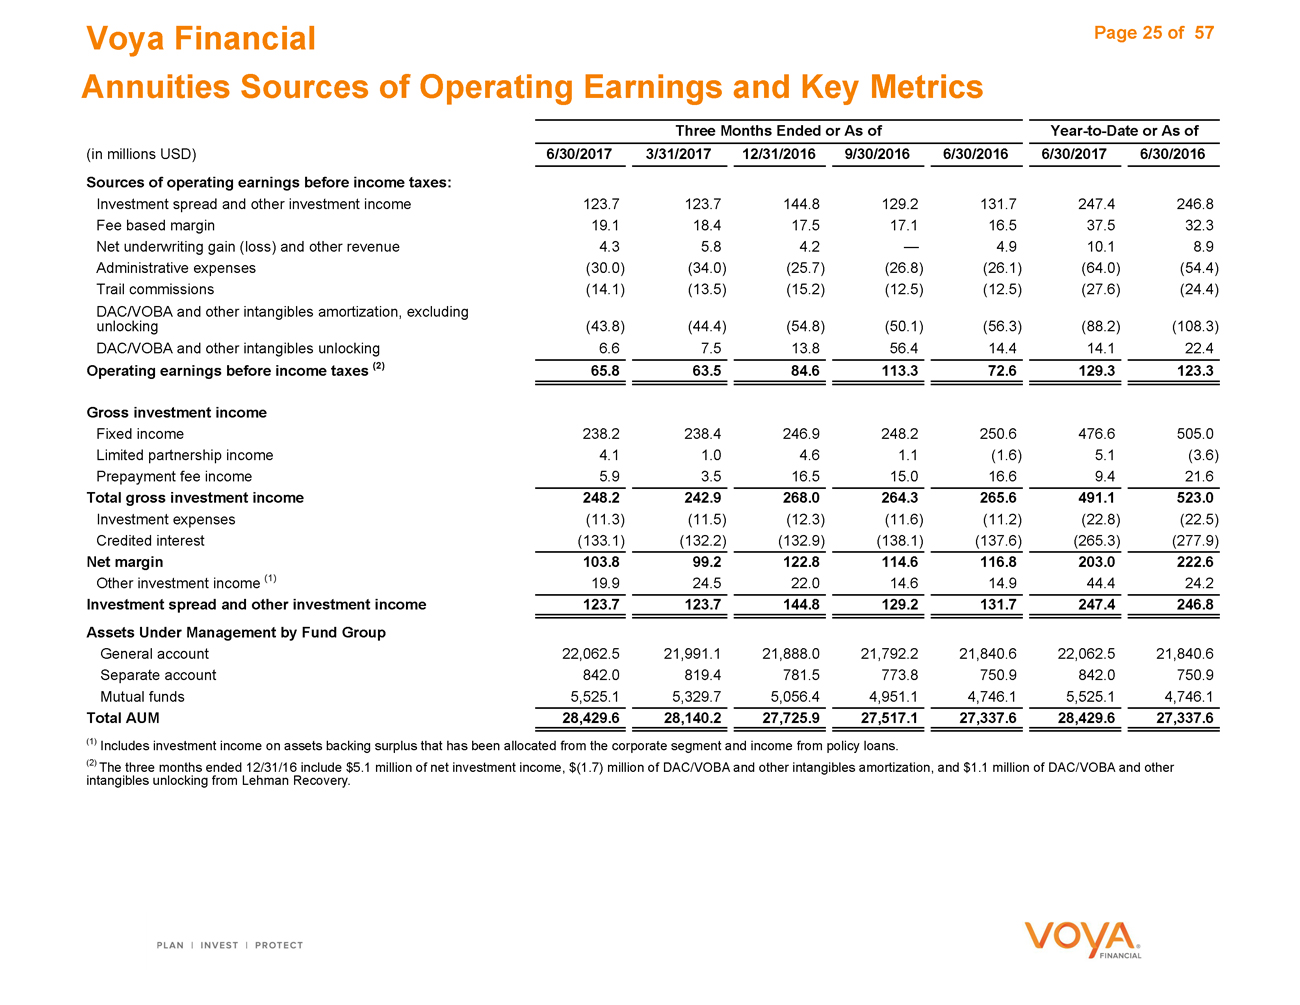
Voya Financial Page 25 of 57 Annuities Sources of Operating Earnings and Key Metrics
Three Months Ended or As ofYear-to-Date or As of
(in millions USD) 6/30/2017 3/31/201712/31/20169/30/20166/30/20166/30/20176/30/2016
Sources of operating earnings before income taxes:
Investment spread and other investment income 123.7 123.7144.8129.2131.7247.4246.8
Fee based margin 19.1 18.417.517.116.537.532.3
Net underwriting gain (loss) and other revenue 4.3 5.84.2—4.910.18.9
Administrative expenses (30.0) (34.0)(25.7)(26.8)(26.1)(64.0)(54.4)
Trail commissions (14.1) (13.5)(15.2)(12.5)(12.5)(27.6)(24.4)
DAC/VOBA and other intangibles amortization, excluding
unlocking (43.8) (44.4)(54.8)(50.1)(56.3)(88.2)(108.3)
DAC/VOBA and other intangibles unlocking 6.6 7.513.856.414.414.122.4
Operating earnings before income taxes (2) 65.8 63.584.6113.372.6129.3123.3
Gross investment income
Fixed income 238.2 238.4246.9248.2250.6476.6505.0
Limited partnership income 4.1 1.04.61.1(1.6)5.1(3.6)
Prepayment fee income 5.9 3.516.515.016.69.421.6
Total gross investment income 248.2 242.9268.0264.3265.6491.1523.0
Investment expenses (11.3) (11.5)(12.3)(11.6)(11.2)(22.8)(22.5)
Credited interest (133.1) (132.2)(132.9)(138.1)(137.6)(265.3)(277.9)
Net margin 103.8 99.2122.8114.6116.8203.0222.6
Other investment income (1) 19.9 24.522.014.614.944.424.2
Investment spread and other investment income 123.7 123.7144.8129.2131.7247.4246.8
Assets Under Management by Fund Group
General account 22,062.5 21,991.121,888.021,792.221,840.622,062.521,840.6
Separate account 842.0 819.4781.5773.8750.9842.0750.9
Mutual funds 5,525.1 5,329.75,056.44,951.14,746.15,525.14,746.1
Total AUM 28,429.6 28,140.227,725.927,517.127,337.628,429.627,337.6
(1) Includes investment income on assets backing surplus that has been allocated from the corporate segment and income from policy loans.
(2) The three months ended 12/31/16 include $5.1 million of net investment income, $(1.7) million of DAC/VOBA and other intangibles amortization, and $1.1 million of DAC/VOBA and other intangibles unlocking from Lehman Recovery.
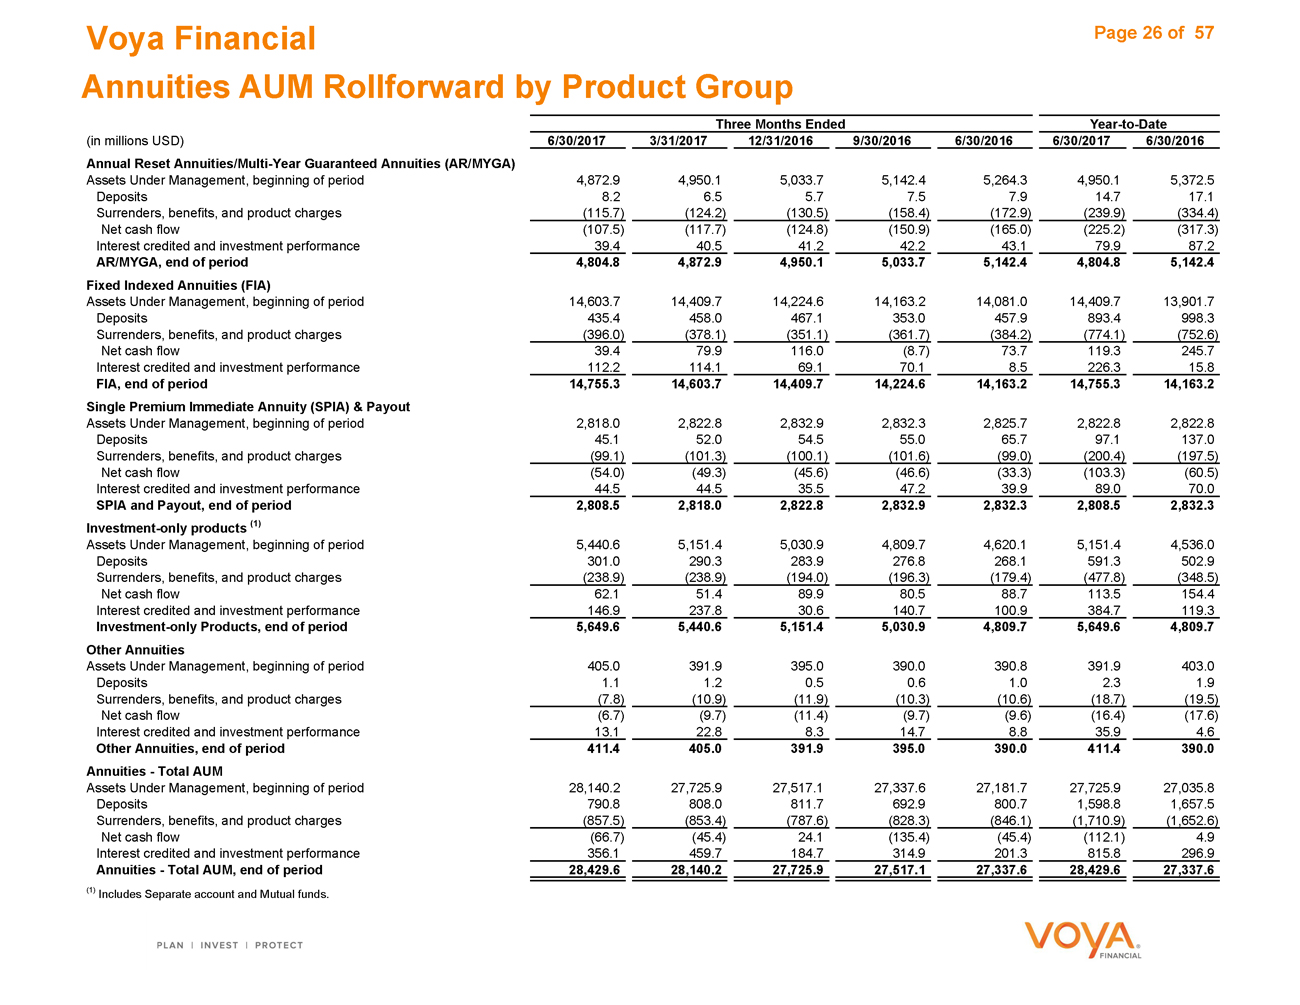
Voya Financial Page 26 of 57 Annuities AUM Rollforward by Product Group
Three Months EndedYear-to-Date
(in millions USD) 6/30/2017 3/31/201712/31/20169/30/20166/30/20166/30/20176/30/2016
Annual Reset Annuities/Multi-Year Guaranteed Annuities (AR/MYGA)
Assets Under Management, beginning of period 4,872.9 4,950.15,033.75,142.45,264.34,950.15,372.5
Deposits 8.2 6.55.77.57.914.717.1
Surrenders, benefits, and product charges (115.7) (124.2)(130.5)(158.4)(172.9)(239.9)(334.4)
Net cash flow (107.5) (117.7)(124.8)(150.9)(165.0)(225.2)(317.3)
Interest credited and investment performance 39.4 40.541.242.243.179.987.2
AR/MYGA, end of period 4,804.8 4,872.94,950.15,033.75,142.44,804.85,142.4
Fixed Indexed Annuities (FIA)
Assets Under Management, beginning of period 14,603.7 14,409.714,224.614,163.214,081.014,409.713,901.7
Deposits 435.4 458.0467.1353.0457.9893.4998.3
Surrenders, benefits, and product charges (396.0) (378.1)(351.1)(361.7)(384.2)(774.1)(752.6)
Net cash flow 39.4 79.9116.0(8.7)73.7119.3245.7
Interest credited and investment performance 112.2 114.169.170.18.5226.315.8
FIA, end of period 14,755.3 14,603.714,409.714,224.614,163.214,755.314,163.2
Single Premium Immediate Annuity (SPIA) & Payout
Assets Under Management, beginning of period 2,818.0 2,822.82,832.92,832.32,825.72,822.82,822.8
Deposits 45.1 52.054.555.065.797.1137.0
Surrenders, benefits, and product charges (99.1) (101.3)(100.1)(101.6)(99.0)(200.4)(197.5)
Net cash flow (54.0) (49.3)(45.6)(46.6)(33.3)(103.3)(60.5)
Interest credited and investment performance 44.5 44.535.547.239.989.070.0
SPIA and Payout, end of period 2,808.5 2,818.02,822.82,832.92,832.32,808.52,832.3
Investment-only products (1)
Assets Under Management, beginning of period 5,440.6 5,151.45,030.94,809.74,620.15,151.44,536.0
Deposits 301.0 290.3283.9276.8268.1591.3502.9
Surrenders, benefits, and product charges (238.9) (238.9)(194.0)(196.3)(179.4)(477.8)(348.5)
Net cash flow 62.1 51.489.980.588.7113.5154.4
Interest credited and investment performance 146.9 237.830.6140.7100.9384.7119.3
Investment-only Products, end of period 5,649.6 5,440.65,151.45,030.94,809.75,649.64,809.7
Other Annuities
Assets Under Management, beginning of period 405.0 391.9395.0390.0390.8391.9403.0
Deposits 1.1 1.20.50.61.02.31.9
Surrenders, benefits, and product charges (7.8) (10.9)(11.9)(10.3)(10.6)(18.7)(19.5)
Net cash flow (6.7) (9.7)(11.4)(9.7)(9.6)(16.4)(17.6)
Interest credited and investment performance 13.1 22.88.314.78.835.94.6
Other Annuities, end of period 411.4 405.0391.9395.0390.0411.4390.0
Annuities—Total AUM
Assets Under Management, beginning of period 28,140.2 27,725.927,517.127,337.627,181.727,725.927,035.8
Deposits 790.8 808.0811.7692.9800.71,598.81,657.5
Surrenders, benefits, and product charges (857.5) (853.4)(787.6)(828.3)(846.1)(1,710.9)(1,652.6)
Net cash flow (66.7) (45.4)24.1(135.4)(45.4)(112.1)4.9
Interest credited and investment performance 356.1 459.7184.7314.9201.3815.8296.9
Annuities—Total AUM, end of period 28,429.6 28,140.227,725.927,517.127,337.628,429.627,337.6
(1) Includes Separate account and Mutual funds.
Individual Life
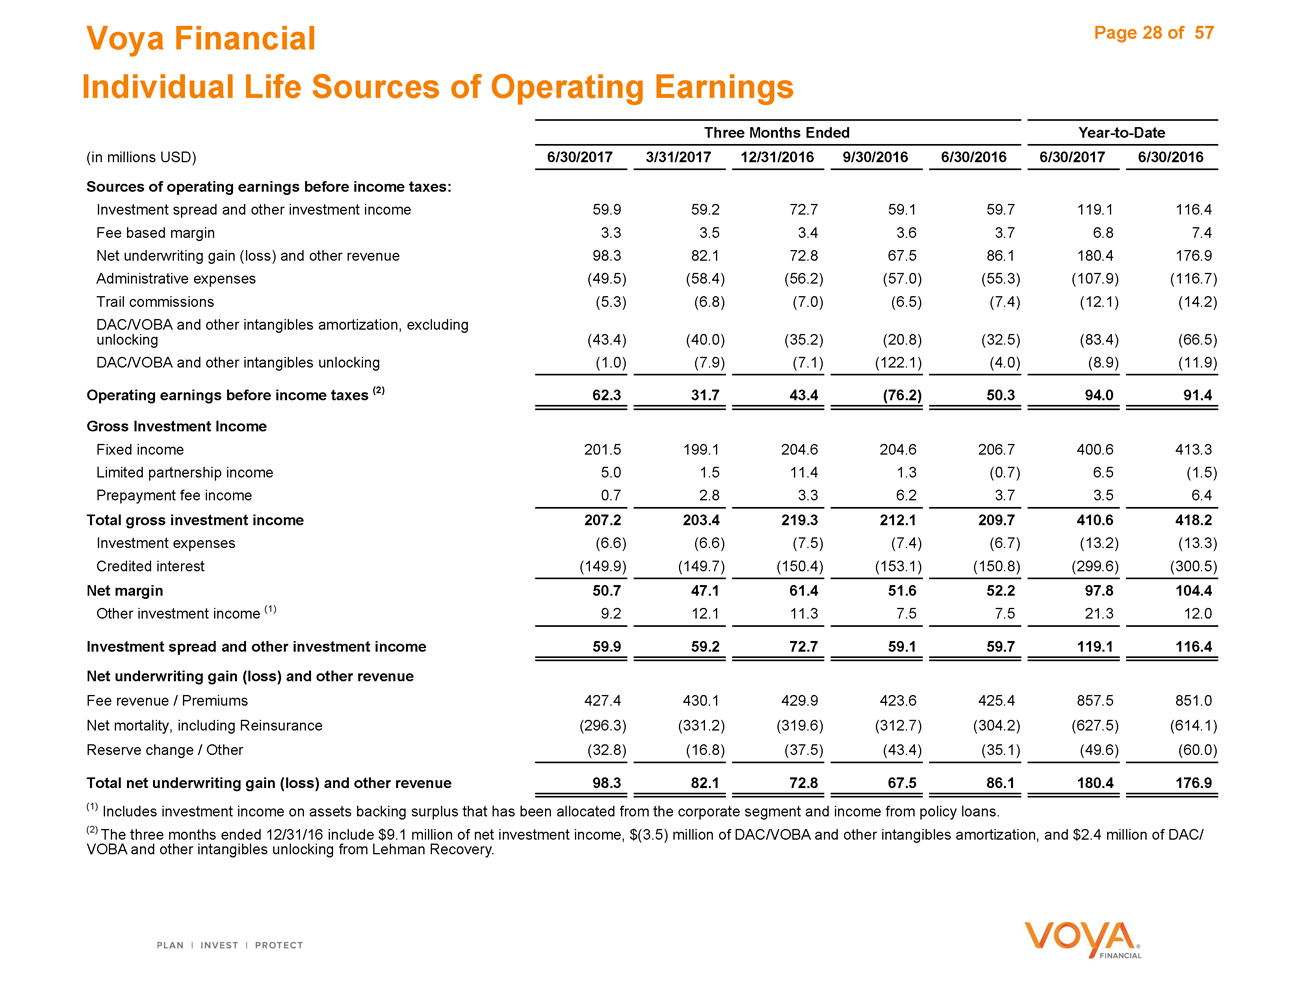
Voya Financial Page 28 of 57 Individual Life Sources of Operating Earnings
Three Months EndedYear-to-Date
(in millions USD) 6/30/2017 3/31/201712/31/20169/30/20166/30/20166/30/20176/30/2016
Sources of operating earnings before income taxes:
Investment spread and other investment income 59.9 59.272.759.159.7119.1116.4
Fee based margin 3.3 3.53.43.63.76.87.4
Net underwriting gain (loss) and other revenue 98.3 82.172.867.586.1180.4176.9
Administrative expenses (49.5) (58.4)(56.2)(57.0)(55.3)(107.9)(116.7)
Trail commissions (5.3) (6.8)(7.0)(6.5)(7.4)(12.1)(14.2)
DAC/VOBA and other intangibles amortization, excluding
unlocking (43.4) (40.0)(35.2)(20.8)(32.5)(83.4)(66.5)
DAC/VOBA and other intangibles unlocking (1.0) (7.9)(7.1)(122.1)(4.0)(8.9)(11.9)
Operating earnings before income taxes (2) 62.3 31.743.4(76.2)50.394.091.4
Gross Investment Income
Fixed income 201.5 199.1204.6204.6206.7400.6413.3
Limited partnership income 5.0 1.511.41.3(0.7)6.5(1.5)
Prepayment fee income 0.7 2.83.36.23.73.56.4
Total gross investment income 207.2 203.4219.3212.1209.7410.6418.2
Investment expenses (6.6) (6.6)(7.5)(7.4)(6.7)(13.2)(13.3)
Credited interest (149.9) (149.7)(150.4)(153.1)(150.8)(299.6)(300.5)
Net margin 50.7 47.161.451.652.297.8104.4
Other investment income (1) 9.2 12.111.37.57.521.312.0
Investment spread and other investment income 59.9 59.272.759.159.7119.1116.4
Net underwriting gain (loss) and other revenue
Fee revenue / Premiums 427.4 430.1429.9423.6425.4857.5851.0
Net mortality, including Reinsurance (296.3) (331.2)(319.6)(312.7)(304.2)(627.5)(614.1)
Reserve change / Other (32.8) (16.8)(37.5)(43.4)(35.1)(49.6)(60.0)
Total net underwriting gain (loss) and other revenue 98.3 82.172.867.586.1180.4176.9
(1) Includes investment income on assets backing surplus that has been allocated from the corporate segment and income from policy loans.
(2) The three months ended 12/31/16 include $9.1 million of net investment income, $(3.5) million of DAC/VOBA and other intangibles amortization, and $2.4 million of DAC/ VOBA and other intangibles unlocking from Lehman Recovery.
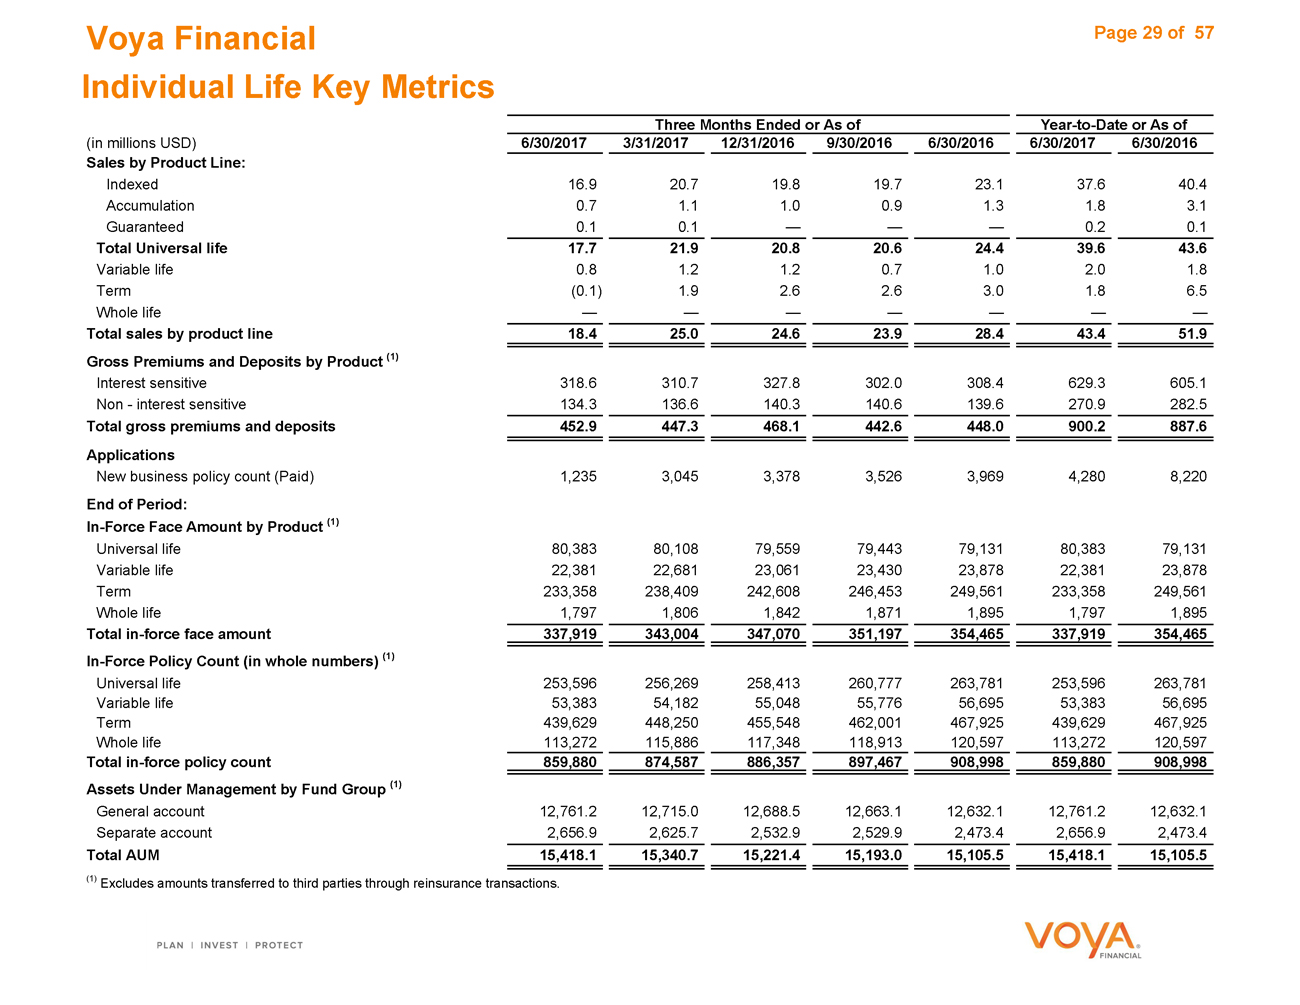
Voya Financial Page 29 of 57 Individual Life Key Metrics
Three Months Ended or As ofYear-to-Date or As of
(in millions USD) 6/30/2017 3/31/201712/31/20169/30/20166/30/20166/30/20176/30/2016
Sales by Product Line:
Indexed 16.9 20.719.819.723.137.640.4
Accumulation 0.7 1.11.00.91.31.83.1
Guaranteed 0.1 0.1———0.20.1
Total Universal life 17.7 21.920.820.624.439.643.6
Variable life 0.8 1.21.20.71.02.01.8
Term (0.1) 1.92.62.63.01.86.5
Whole life — ——————
Total sales by product line 18.4 25.024.623.928.443.451.9
Gross Premiums and Deposits by Product (1)
Interest sensitive 318.6 310.7327.8302.0308.4629.3605.1
Non—interest sensitive 134.3 136.6140.3140.6139.6270.9282.5
Total gross premiums and deposits 452.9 447.3468.1442.6448.0900.2887.6
Applications
New business policy count (Paid) 1,235 3,0453,3783,5263,9694,2808,220
End of Period:
In-Force Face Amount by Product (1)
Universal life 80,383 80,10879,55979,44379,13180,38379,131
Variable life 22,381 22,68123,06123,43023,87822,38123,878
Term 233,358 238,409242,608246,453249,561233,358249,561
Whole life 1,797 1,8061,8421,8711,8951,7971,895
Totalin-force face amount 337,919 343,004347,070351,197354,465337,919354,465
In-Force Policy Count (in whole numbers) (1)
Universal life 253,596 256,269258,413260,777263,781253,596263,781
Variable life 53,383 54,18255,04855,77656,69553,38356,695
Term 439,629 448,250455,548462,001467,925439,629467,925
Whole life 113,272 115,886117,348118,913120,597113,272120,597
Totalin-force policy count 859,880 874,587886,357897,467908,998859,880908,998
Assets Under Management by Fund Group (1)
General account 12,761.2 12,715.012,688.512,663.112,632.112,761.212,632.1
Separate account 2,656.9 2,625.72,532.92,529.92,473.42,656.92,473.4
Total AUM 15,418.1 15,340.715,221.415,193.015,105.515,418.115,105.5
(1) Excludes amounts transferred to third parties through reinsurance transactions.
Employee Benefits
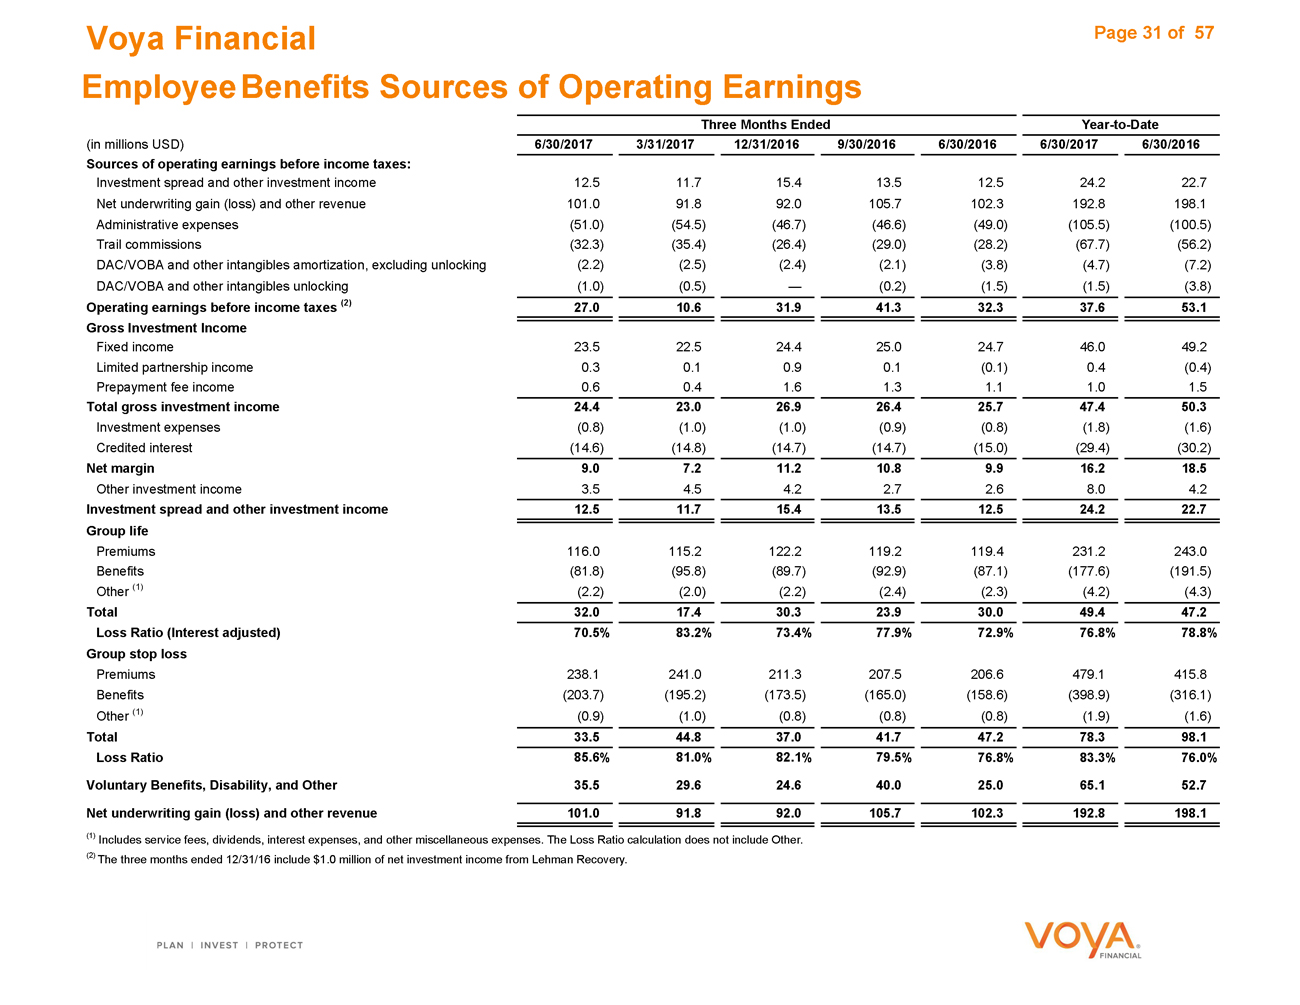
Voya Financial Page 31 of 57 Employee Benefits Sources of Operating Earnings
Three Months EndedYear-to-Date
(in millions USD) 6/30/2017 3/31/201712/31/20169/30/20166/30/20166/30/20176/30/2016
Sources of operating earnings before income taxes:
Investment spread and other investment income 12.5 11.715.413.512.524.222.7
Net underwriting gain (loss) and other revenue 101.0 91.892.0105.7102.3192.8198.1
Administrative expenses (51.0) (54.5)(46.7)(46.6)(49.0)(105.5)(100.5)
Trail commissions (32.3) (35.4)(26.4)(29.0)(28.2)(67.7)(56.2)
DAC/VOBA and other intangibles amortization, excluding unlocking (2.2) (2.5)(2.4)(2.1)(3.8)(4.7)(7.2)
DAC/VOBA and other intangibles unlocking (1.0) (0.5)—(0.2)(1.5)(1.5)(3.8)
Operating earnings before income taxes (2) 27.0 10.631.941.332.337.653.1
Gross Investment Income
Fixed income 23.5 22.524.425.024.746.049.2
Limited partnership income 0.3 0.10.90.1(0.1)0.4(0.4)
Prepayment fee income 0.6 0.41.61.31.11.01.5
Total gross investment income 24.4 23.026.926.425.747.450.3
Investment expenses (0.8) (1.0)(1.0)(0.9)(0.8)(1.8)(1.6)
Credited interest (14.6) (14.8)(14.7)(14.7)(15.0)(29.4)(30.2)
Net margin 9.0 7.211.210.89.916.218.5
Other investment income 3.5 4.54.22.72.68.04.2
Investment spread and other investment income 12.5 11.715.413.512.524.222.7
Group life
Premiums 116.0 115.2122.2119.2119.4231.2243.0
Benefits (81.8) (95.8)(89.7)(92.9)(87.1)(177.6)(191.5)
Other (1) (2.2) (2.0)(2.2)(2.4)(2.3)(4.2)(4.3)
Total 32.0 17.430.323.930.049.447.2
Loss Ratio (Interest adjusted) 70.5% 83.2%73.4%77.9%72.9%76.8%78.8%
Group stop loss
Premiums 238.1 241.0211.3207.5206.6479.1415.8
Benefits (203.7) (195.2)(173.5)(165.0)(158.6)(398.9)(316.1)
Other (1) (0.9) (1.0)(0.8)(0.8)(0.8)(1.9)(1.6)
Total 33.5 44.837.041.747.278.398.1
Loss Ratio 85.6% 81.0%82.1%79.5%76.8%83.3%76.0%
Voluntary Benefits, Disability, and Other 35.5 29.624.640.025.065.152.7
Net underwriting gain (loss) and other revenue 101.0 91.892.0105.7102.3192.8198.1
(1) Includes service fees, dividends, interest expenses, and other miscellaneous expenses. The Loss Ratio calculation does not include Other. (2) The three months ended 12/31/16 include $1.0 million of net investment income from Lehman Recovery.
Voya Financial Page 32 of 57 Employee Benefits Key Metrics
Three Months Ended or As ofYear-to-Date or As of
(in millions USD) 6/30/2017 3/31/201712/31/20169/30/20166/30/20166/30/20176/30/2016
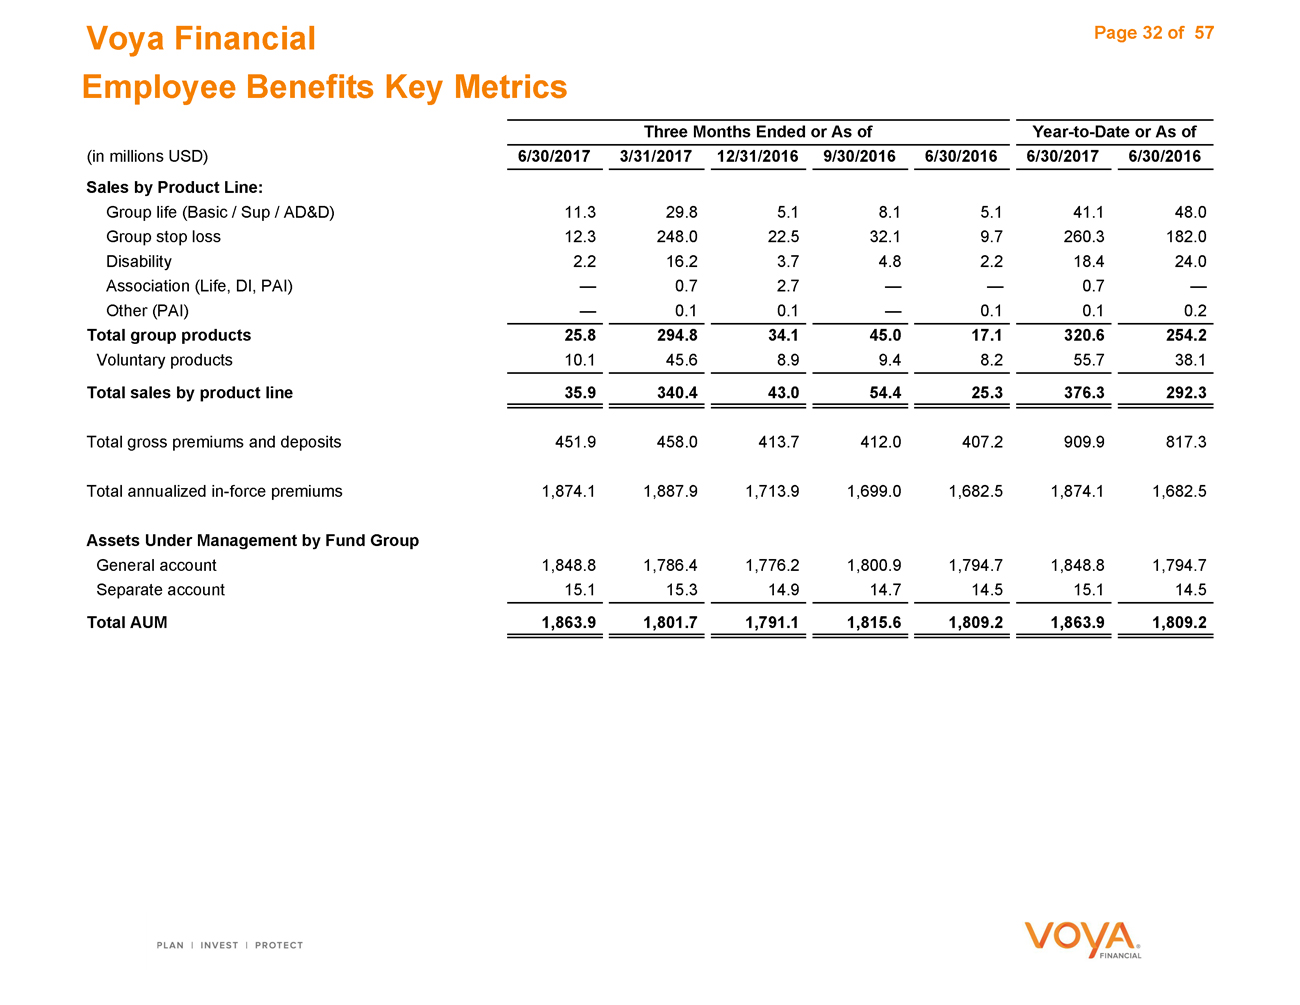
Sales by Product Line:
Group life (Basic / Sup / AD&D) 11.3 29.85.18.15.141.148.0
Group stop loss 12.3 248.022.532.19.7260.3182.0
Disability 2.2 16.23.74.82.218.424.0
Association (Life, DI, PAI) — 0.72.7——0.7—
Other (PAI) — 0.10.1—0.10.10.2
Total group products 25.8 294.834.145.017.1320.6254.2
Voluntary products 10.1 45.68.99.48.255.738.1
Total sales by product line 35.9 340.443.054.425.3376.3292.3
Total gross premiums and deposits 451.9 458.0413.7412.0407.2909.9817.3
Total annualizedin-force premiums 1,874.1 1,887.91,713.91,699.01,682.51,874.11,682.5
Assets Under Management by Fund Group
General account 1,848.8 1,786.41,776.21,800.91,794.71,848.81,794.7
Separate account 15.1 15.314.914.714.515.114.5
Total AUM 1,863.9 1,801.71,791.11,815.61,809.21,863.91,809.2
Corporate
Voya Financial Page 34 of 57 Corporate Operating Earnings
Three Months EndedYear-to-Date
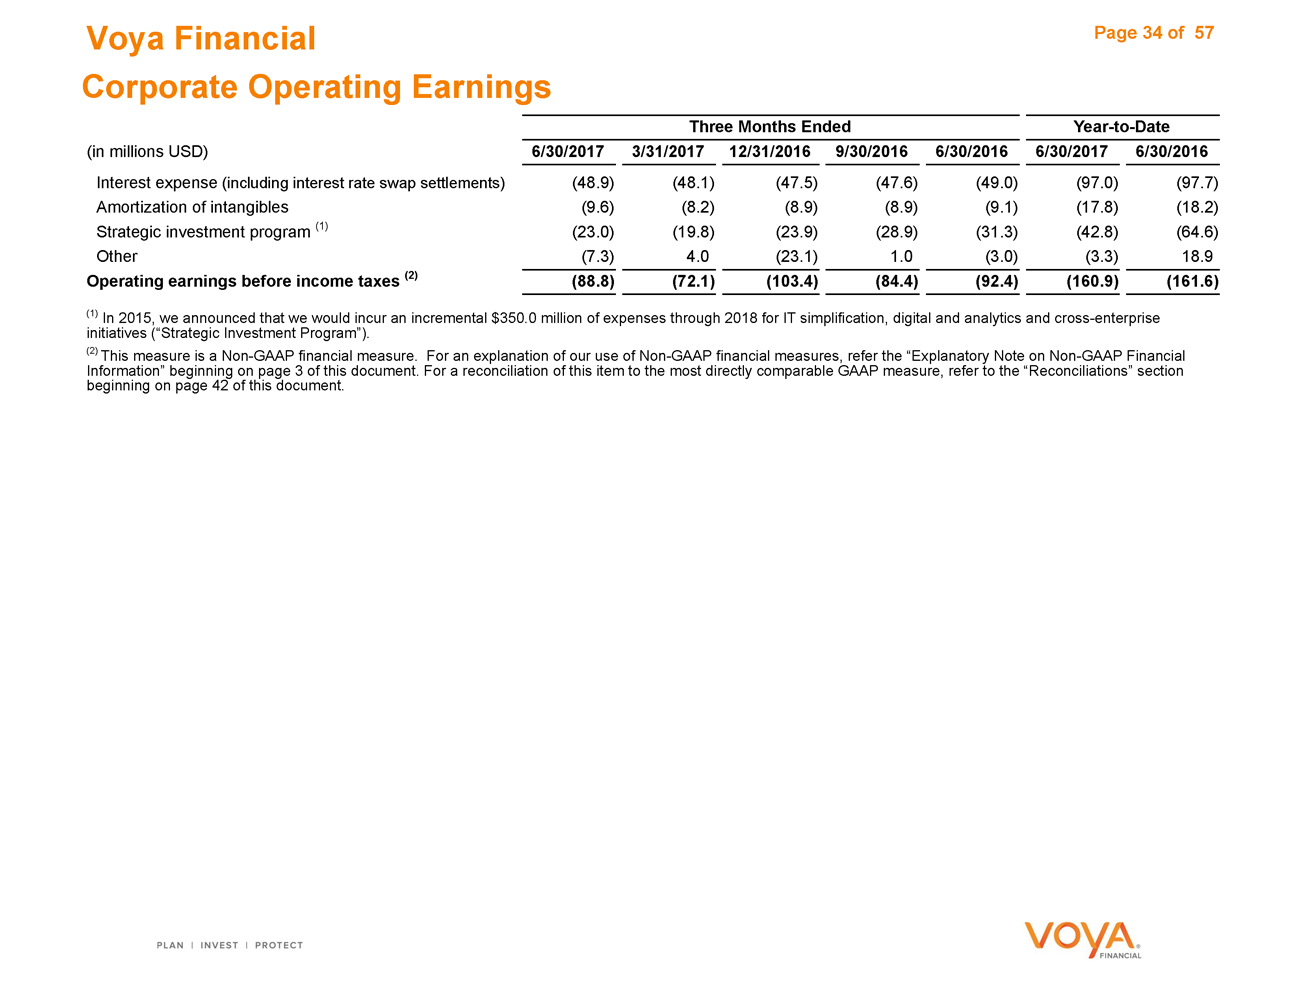
(in millions USD) 6/30/2017 3/31/201712/31/20169/30/20166/30/20166/30/20176/30/2016
Interest expense (including interest rate swap settlements) (48.9) (48.1)(47.5)(47.6)(49.0)(97.0)(97.7)
Amortization of intangibles (9.6) (8.2)(8.9)(8.9)(9.1)(17.8)(18.2)
Strategic investment program (1) (23.0) (19.8)(23.9)(28.9)(31.3)(42.8)(64.6)
Other (7.3) 4.0(23.1)1.0(3.0)(3.3)18.9
Operating earnings before income taxes (2) (88.8) (72.1)(103.4)(84.4)(92.4)(160.9)(161.6)
(1) In 2015, we announced that we would incur an incremental $350.0 million of expenses through 2018 for IT simplification, digital and analytics and cross-enterprise initiatives (“Strategic Investment Program”).
(2) This measure is aNon-GAAP financial measure. For an explanation of our use ofNon-GAAP financial measures, refer the “Explanatory Note onNon-GAAP Financial Information” beginning on page 3 of this document. For a reconciliation of this item to the most directly comparable GAAP measure, refer to the “Reconciliations” section beginning on page 42 of this document.
Closed Block Variable Annuity
Voya Financial Page 36 of 57 Closed Block Variable Annuity Income (Loss) Before Income Taxes
Three Months EndedYear-to-Date
(in millions USD) 6/30/2017 3/31/2017 12/31/2016 9/30/2016 6/30/2016 6/30/2017 6/30/2016
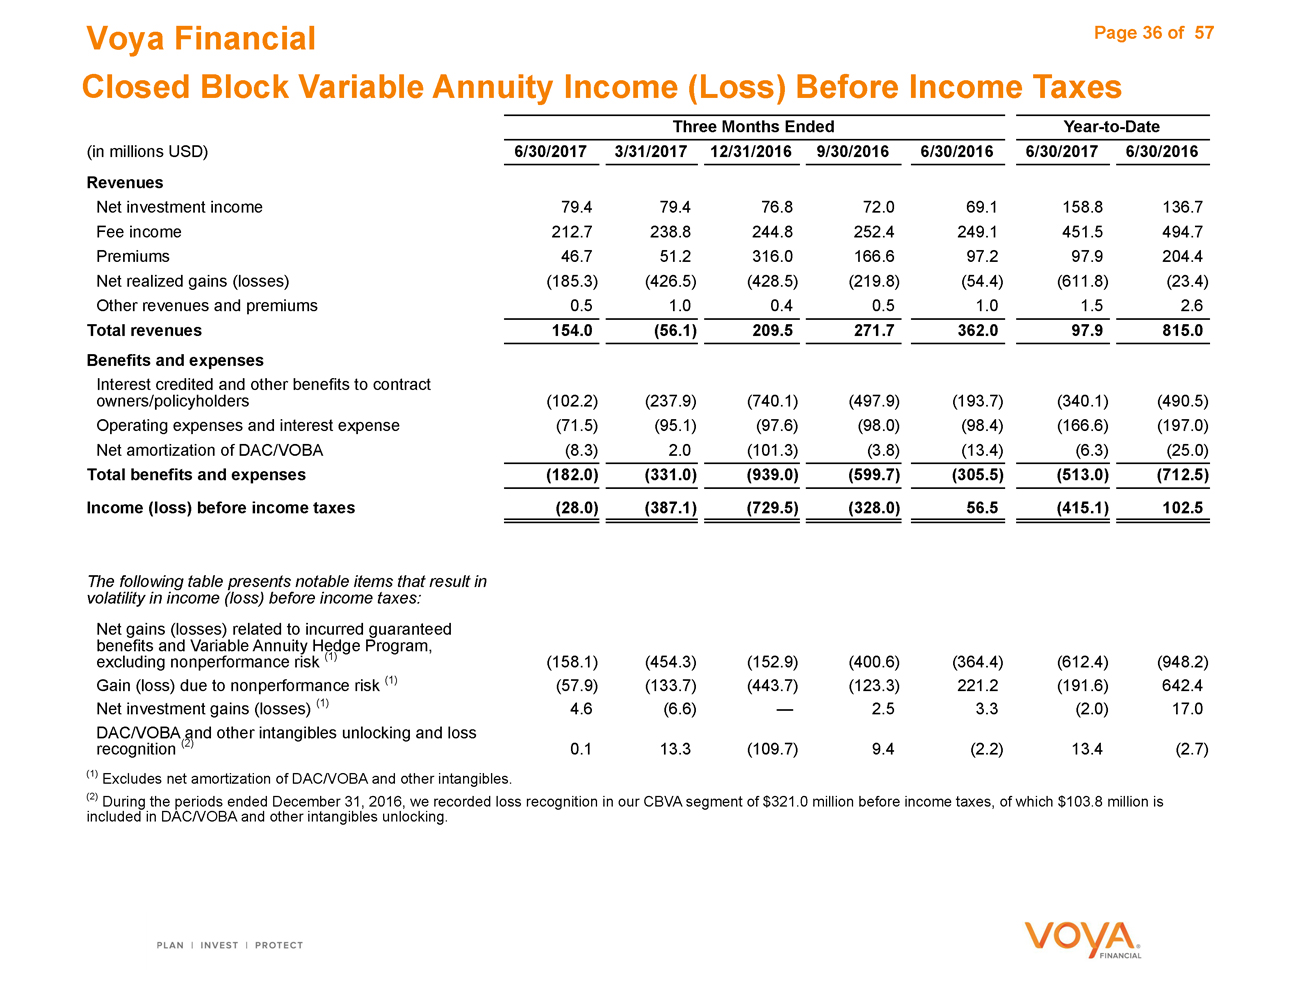
Revenues
Net investment income 79.4 79.4 76.8 72.0 69.1 158.8 136.7
Fee income 212.7 238.8 244.8 252.4 249.1 451.5 494.7
Premiums 46.7 51.2 316.0 166.6 97.2 97.9 204.4
Net realized gains (losses) (185.3) (426.5) (428.5) (219.8) (54.4) (611.8) (23.4)
Other revenues and premiums 0.5 1.0 0.4 0.5 1.0 1.5 2.6
Total revenues 154.0 (56.1) 209.5 271.7 362.0 97.9 815.0
Benefits and expenses
Interest credited and other benefits to contract
owners/policyholders (102.2) (237.9) (740.1) (497.9) (193.7) (340.1) (490.5)
Operating expenses and interest expense (71.5) (95.1) (97.6) (98.0) (98.4) (166.6) (197.0)
Net amortization of DAC/VOBA (8.3) 2.0 (101.3) (3.8) (13.4) (6.3) (25.0)
Total benefits and expenses (182.0) (331.0) (939.0) (599.7) (305.5) (513.0) (712.5)
Income (loss) before income taxes (28.0) (387.1) (729.5) (328.0) 56.5 (415.1) 102.5
The following table presents notable items that result in
volatility in income (loss) before income taxes:
Net gains (losses) related to incurred guaranteed
benefits and Variable Annuity Hedge Program,
excluding nonperformance risk (1) (158.1) (454.3) (152.9) (400.6) (364.4) (612.4) (948.2)
Gain (loss) due to nonperformance risk (1) (57.9) (133.7) (443.7) (123.3) 221.2 (191.6) 642.4
Net investment gains (losses) (1) 4.6 (6.6) — 2.5 3.3 (2.0) 17.0
DAC/VOBA and other intangibles unlocking and loss
recognition (2) 0.1 13.3 (109.7) 9.4 (2.2) 13.4 (2.7)
(1) Excludes net amortization of DAC/VOBA and other intangibles.
(2) During the periods ended December 31, 2016, we recorded loss recognition in our CBVA segment of $321.0 million before income taxes, of which $103.8 million is
included in DAC/VOBA and other intangibles unlocking.
Voya Financial Page 37 of 57 Closed Block Variable Annuity Death and Living Benefits and AUM
Three Months Ended or As ofYear-to-Date or As of
(in millions USD) 6/30/2017 3/31/2017 12/31/2016 9/30/2016 6/30/2016 6/30/2017 6/30/2016
Death and living benefits-account value
GMAB/GMWB 560 567 566 586 592 560 592
GMIB 9,122 9,182 10,120 10,864 11,054 9,122 11,054
GMWBL 13,818 13,837 13,608 13,921 13,810 13,818 13,810
No living benefits 8,689 8,725 8,618 8,780 8,723 8,689 8,723
Total (1) 32,189 32,311 32,912 34,151 34,179 32,189 34,179
Net Amount at Risk (NAR), after reinsurance
Total DB NAR 4,718 4,876 5,563 5,664 6,112 4,718 6,112
LB NAR
GMAB/GMWB 12 13 15 15 17 12 17
GMIB (2) 2,406 2,452 2,946 3,662 3,698 2,406 3,698
GMWBL(2) 1,996 1,992 2,210 3,219 3,444 1,996 3,444
Total LB NAR 4,414 4,457 5,171 6,896 7,159 4,414 7,159
Nonperformance Risk Adjustment (3) (585) (643) (776) (1,220) (1,343) (585) (1,343)
Products in accumulation phase
Balance as of beginning of period 32,363.5 32,962.4 34,200.4 34,227.9 34,647.9 32,962.4 35,575.8
Deposits 16.1 20.5 16.0 15.5 21.5 36.6 49.6
Surrenders, benefits, and product charges (939.5) (2,051.6) (1,407.2) (1,099.2) (920.8) (2,991.1) (1,806.1)
Net cash flow (923.4) (2,031.1) (1,391.2) (1,083.7) (899.3) (2,954.5) (1,756.5)
Interest credited and investment performance 800.4 1,432.2 153.2 1,056.2 479.3 2,232.6 408.6
Balance as of end of period 32,240.5 32,363.5 32,962.4 34,200.4 34,227.9 32,240.5 34,227.9
End of period contracts in payout status 5,112.0 5,061.0 4,780.5 3,892.4 3,406.3 5,112.0 3,406.3
Total balance as of end of period (4) 37,352.5 37,424.5 37,742.9 38,092.8 37,634.2 37,352.5 37,634.2
Assets under management by fund group
General account 5,518.4 5,481.9 5,207.6 4,334.2 3,835.5 5,518.4 3,835.5
Separate account 31,834.1 31,942.6 32,535.3 33,758.6 33,798.7 31,834.1 33,798.7
Total AUM (4) 37,352.5 37,424.5 37,742.9 38,092.8 37,634.2 37,352.5 37,634.2
Excludes assets associated with Payout Reserves, Policy Loans, and Life Insurance Business.
GMIB and GMWBL values represent discounted net amount at risk.
Represents reduction to liabilities for the GMAB, GMWB, and GMWBL embedded derivatives.
Includes products in accumulation and payout phase, Policy Loans, and Life Insurance Business
Investment Information
Voya Financial Page 39 of 57
Portfolio Composition
Balances as of
(in millions USD) 6/30/2017 3/31/2017 12/31/2016 9/30/2016 6/30/2016
Composition of Investment Portfolio Amount % of Total Amount % of Total Amount % of Total Amount % of Total Amount % of Total
Fixed maturities, available for sale, at fair value, after consolidation 70,239.0 74.8% 69,139.2 74.8% 69,468.7 75.0% 72,644.1 74.6% 71,015.5 74.2%
Fixed maturities, at fair value using the fair value option 3,774.9 4.0% 3,678.9 4.0% 3,712.3 4.0% 3,903.5 4.0% 3,985.3 4.2%
Equity securities, available for sale, before consolidation 304.0 N/M 297.6 N/M 274.2 N/M 396.5 N/M 391.6 N/M
VOE Adjustments — N/M — N/M — N/M (111.2) N/M (115.5) N/M
Equity securities, available for sale, at fair value 304.0 0.3% 297.6 0.3% 274.2 0.3% 285.3 0.3% 276.1 0.3%
Short-term investments 533.6 0.6% 578.2 0.6% 821.0 0.9% 1,346.8 1.4% 1,280.2 1.3%
Mortgage loans on real estate 12,689.7 13.5% 12,385.8 13.4% 11,725.2 12.7% 11,475.7 11.8% 11,209.4 11.7%
Policy loans 1,906.0 2.0% 1,934.9 2.1% 1,961.5 2.1% 1,995.6 2.0% 1,998.5 2.1%
Limited partnerships/corporations, before consolidation 1,386.4 N/M 1,313.4 N/M 1,235.4 N/M 1,191.1 N/M 1,110.9 N/M
CLO/VOEs Adjustments (1) (456.9) N/M (486.7) N/M (476.8) N/M (492.3) N/M (477.3) N/M
Limited partnerships/corporations, after consolidation 929.5 1.0% 826.7 0.9% 758.6 0.8% 698.8 0.7% 633.6 0.7%
Derivatives 1,396.6 1.5% 1,303.5 1.4% 1,712.4 1.8% 2,731.4 2.8% 2,948.6 3.1%
Other investments 54.0 0.1% 43.3 0.1% 47.4 0.1% 77.7 0.1% 89.7 0.1%
Securities pledged to creditors 2,023.9 2.2% 2,187.3 2.4% 2,157.1 2.3% 2,193.5 2.3% 2,202.3 2.3%
Total investments, after consolidation 93,851.2 100.0% 92,375.4 100.0% 92,638.4 100.0% 97,352.4 100.0% 95,639.2 100.0%
Fixed Maturity Securities—Security Sector (2)
U.S. Government agencies and authorities 3,885.0 5.1% 3,913.3 5.2% 4,188.3 5.5% 4,191.9 5.3% 4,378.9 5.7%
U.S. Corporate—Public 33,448.2 44.0% 33,426.4 44.6% 33,691.7 44.7% 35,601.3 45.2% 35,495.7 45.9%
U.S. Corporate—Private 8,501.3 11.2% 8,062.2 10.8% 7,808.0 10.4% 7,684.9 9.8% 7,181.2 9.3%
Foreign Government / Agency 1,148.2 1.5% 1,068.5 1.4% 1,023.8 1.4% 1,043.1 1.3% 1,019.3 1.3%
Foreign Corporate—Public 7,223.7 9.5% 7,196.5 9.6% 7,055.6 9.4% 7,378.7 9.4% 7,170.0 9.3%
Foreign Corporate—Private 7,772.1 10.2% 7,832.7 10.4% 7,785.8 10.3% 7,907.3 10.1% 7,701.2 10.0%
State, municipalities and political subdivisions 2,392.4 3.1% 2,294.1 3.1% 2,135.6 2.8% 2,126.1 2.7% 1,906.0 2.5%
Residential mortgaged-backed securities:
CMO-B Agency 3,211.0 4.2% 3,174.1 4.3% 3,247.2 4.3% 3,489.6 4.4% 3,535.9 4.6%
CMO-BNon-Agency 1,031.7 1.4% 780.7 1.0% 729.5 1.0% 769.8 1.0% 708.4 0.9%
Agency 1,794.8 2.4% 2,191.0 2.9% 2,321.6 3.1% 2,669.0 3.4% 2,368.8 3.1%
Non-Agency (3) 851.9 1.1% 749.7 1.0% 786.0 1.0% 952.7 1.2% 930.8 1.2%
Total Residential mortgage-backed securities 6,889.4 9.1% 6,895.5 9.2% 7,084.3 9.4% 7,881.1 10.0% 7,543.9 9.8%
Commercial mortgage-backed securities 3,308.7 4.4% 3,105.7 4.1% 3,358.9 4.5% 4,023.9 5.1% 4,077.8 5.3%
Other asset-backed securities (3) 1,468.8 1.9% 1,210.5 1.6% 1,206.1 1.6% 902.8 1.1% 729.1 0.9%
Total fixed maturities, including securities pledged (5) 76,037.8 100.0% 75,005.4 100.0% 75,338.1 100.0% 78,741.1 100.0% 77,203.1 100.0%
Fixed Maturity Securities—Contractual Maturity Dates
Due to mature:
Due in one year or less 2,205.0 2.9% 2,248.8 3.0% 2,513.7 3.3% 2,168.6 2.8% 1,931.5 2.5%
Due after one year through five years 13,928.3 18.3% 14,171.8 18.9% 13,845.2 18.4% 14,325.3 18.2% 14,572.6 18.9%
Due after five years through ten years 18,563.0 24.4% 18,335.9 24.4% 19,303.8 25.6% 20,135.4 25.6% 19,955.8 25.8%
Due after ten years 29,674.6 39.0% 29,037.2 38.7% 28,026.1 37.2% 29,304.0 37.2% 28,392.4 36.8%
CMO-B 4,242.7 5.6% 3,954.8 5.3% 3,976.7 5.3% 4,259.4 5.4% 4,244.3 5.5%
Mortgage-backed securities 5,955.4 7.9% 6,046.4 8.1% 6,466.5 8.6% 7,645.6 9.7% 7,377.4 9.6%
Other asset-backed securities (3) 1,468.8 1.9% 1,210.5 1.6% 1,206.1 1.6% 902.8 1.1% 729.1 0.9%
Total fixed maturities, including securities pledged (5) 76,037.8 100.0% 75,005.4 100.0% 75,338.1 100.0% 78,741.1 100.0% 77,203.1 100.0%
Fixed Maturity Securities—NAIC Quality Designation
1 43,760.4 57.6% 43,560.5 58.1% 44,387.7 58.9% 46,271.2 58.8% 45,460.3 58.9%
2 28,883.4 38.0% 28,036.7 37.4% 27,469.2 36.5% 28,679.0 36.4% 28,111.1 36.4%
3 2,621.7 3.4% 2,683.0 3.5% 2,699.1 3.6% 2,914.1 3.7% 2,730.6 3.5%
4 558.0 0.7% 513.0 0.7% 501.5 0.7% 594.6 0.7% 616.5 0.8%
5 70.0 0.1% 67.6 0.1% 101.5 0.1% 68.8 0.1% 78.6 0.1%
6 144.3 0.2% 144.6 0.2% 179.1 0.2% 213.4 0.3% 206.0 0.3%
Total fixed maturities, including securities pledged (4) (5) 76,037.8 100.0% 75,005.4 100.0% 75,338.1 100.0% 78,741.1 100.0% 77,203.1 100.0%
Fixed Maturity Securities—ARO Quality Rating
AAA 13,840.6 18.2% 13,981.4 18.6% 14,394.8 19.1% 14,961.3 19.0% 14,677.0 19.0%
AA 5,199.2 6.8% 5,374.8 7.2% 5,359.4 7.1% 5,726.4 7.3% 5,338.0 6.9%
A 23,119.3 30.4% 22,593.7 30.1% 22,902.4 30.4% 23,705.5 30.1% 23,527.4 30.5%
BBB 29,011.7 38.2% 28,434.7 37.9% 27,926.5 37.1% 29,210.9 37.1% 28,589.9 37.0%
BB 2,828.5 3.7% 2,849.2 3.8% 2,880.1 3.8% 3,099.0 3.9% 3,180.9 4.1%
B and below 2,038.5 2.7% 1,771.6 2.4% 1,874.9 2.5% 2,038.0 2.6% 1,889.9 2.5%
Total fixed maturities, including securities pledged (5) 76,037.8 100.0% 75,005.4 100.0% 75,338.1 100.0% 78,741.1 100.0% 77,203.1 100.0%
(1) Adjustments include the elimination of intercompany transactions between the Company and its consolidated investment entities, primarily the elimination of the Company’s equity at risk recorded as investments by the Company (before consolidation) against either equity (private equity and real estate partnership funds) or senior and subordinated debt (CLOs) of the funds.
(2) Fixed Maturity Securities includes fixed maturities,available for sale , fixed maturities at fair value using the fair value option and securities pledged to creditors. (3) Subprime asset-backed securities are included as a component ofNon-Agency RMBS under this presentation.
(4) ARO ratings do not directly translate into NAIC ratings.
(5) Includes fixed maturities securities related to businesses exited through reinsurance where assets are retained on the Company’s balance sheet.
Voya Financial Page 40 of 57 Portfolio Results
Three Months EndedYear-to-Date
(in millions USD) 6/30/2017 3/31/2017 12/31/2016 9/30/2016 6/30/2016 6/30/2017 6/30/2016
Net Net Net Net Net Net Net
Operating investment income and Investment Annualized Investment Annualized Investment Annualized Investment Annualized Investment Annualized Investment Annualized Investment Annualized
annualized yield (5) Income Yield Income Yield Income Yield Income Yield Income Yield Income Yield Income Yield
Fixed maturity securities (1) 827.0 4.84% 831.0 4.82% 842.4 4.89% 847.1 4.97% 859.5 5.07 % 1,658.0 4.83% 1,723.1 5.10 %
Equity securities 2.4 5.21% 9.7 22.59% 2.1 4.65% 5.3 10.14% 5.5 10.30 % 12.1 13.54% 8.9 8.37 %
Mortgage loans 135.8 4.41% 130.8 4.44% 127.7 4.51% 126.4 4.55% 122.5 4.47 % 266.6 4.42% 245.4 4.57 %
Limited partnerships 66.9 21.49% 40.6 13.29% 63.2 23.06% 16.2 5.71% (8.1) (2.93)% 107.5 17.43% (42.2) (7.43)%
Policy loans 24.6 5.30% 24.7 5.23% 26.4 5.52% 25.7 5.29% 26.1 5.36 % 49.3 5.27% 52.1 5.34 %
Short-term investments 1.5 0.20% 2.5 0.34% 1.3 0.16% 0.6 0.07% 1.8 0.16 % 4.0 0.27% 3.2 0.14 %
Derivatives (1) 13.3 N/A 7.5 N/A 12.5 N/A 10.6 N/A 10.8 N/A 20.8 N/A 21.0 N/A
Prepayment fee income 13.0 0.06% 13.2 0.06% 37.3 0.17% 40.6 0.18% 43.7 0.20 % 26.2 0.06% 59.8 0.14 %
Other assets 2.2 N/A 7.7 N/A 6.8 N/A 4.0 N/A 1.5 N/A 9.9 N/A 2.0 N/A
Gross investment income before expenses
and fees 1,086.7 4.99% 1,067.7 4.90% 1,119.7 5.16% 1,076.5 4.99% 1,063.3 4.92 % 2,154.4 4.95% 2,073.3 4.81 %
Expenses and fees (42.8) -0.20% (45.7) -0.21% (45.1) -0.21% (47.0) -0.22% (43.7) -0.21 % (88.5) -0.21% (85.6) -0.20 %
Total investment income and annualized
yield 1,043.9 4.79% 1,022.0 4.69% 1,074.6 4.95% 1,029.5 4.77% 1,019.6 4.71 % 2,065.9 4.74% 1,987.7 4.61 %
Less: Closed Block Variable Annuity (CBVA)
investment income net of expenses and
fees 79.4 79.4 76.8 72.0 69.1 158.8 136.7
Total investment income, excluding CBVA 964.5 942.6 997.8 957.5 950.5 1,907.1 1,851.0
Trading gains/losses (5)
Fixed maturities 21.4 (36.0) (10.6) 5.5 (14.6) (14.6) (71.7)
Equity securities — — 0.8 — 0.2 — 0.2
Mortgage loans 0.8 — (0.1) (0.1) 0.4 0.8 0.3
Other investments (0.6) (0.5) (0.3) (0.6) (0.5) (1.1) (0.5)
Total trading gains/losses, excluding CBVA 21.6 (36.5) (10.2) 4.8 (14.5) (14.9) (71.7)
Impairments (5)
Fixed maturities (1.4) (3.0) (13.9) (12.1) (4.0) (4.4) (14.7)
Equity securities — — — — — — —
Mortgage loans — — — — — — —
Other investments — — — — — — —
Total impairments, excluding CBVA (1.4) (3.0) (13.9) (12.1) (4.0) (4.4) (14.7)
Fair value adjustments (2) 16.2 (24.4) (121.9) (6.7) 41.1 (8.2) 99.2
Derivatives, including change in fair value
of derivatives related to guaranteed
benefits, excluding CBVA 6.1 71.2 (55.3) (52.0) (26.3) 77.3 8.7
Net realized investment gains (losses) and
Net guaranteed benefit hedging gains
(losses), excluding CBVA (5) 42.5 7.3 (201.3) (66.0) (3.7) 49.8 21.5
CBVA investment income and realized
capital gains (losses) (105.9) (347.1) (351.7) (147.8) 14.7 (453.0) 113.3
Businesses exited through reinsurance (3) 51.8 23.6 (59.4) 31.3 68.9 75.4 130.1
Consolidation/eliminations (4) (4.3) 23.5 (2.1) 20.7 43.5 19.2 62.8
Total investment income and realized
capital gains (losses) 948.6 649.9 383.3 795.7 1,073.9 1,598.5 2,178.7
(1) Operating income fromCMO-B portfolio assets, including derivatives, is included in fixed maturity securities.
(2) Fair value adjustments include adjustments related toCMO-B assets carried at fair value, among other income sources.
(3) Income related to reinsurance transactions, in which investment results are passed directly to the reinsurers pursuant to contracted terms of the reinsurance agreement.
(4) Includes i) the impact of consolidation of investment entities into the Consolidated Statements of Operations, net of the elimination of the Company’s management fees expensed by the funds and recorded as operating revenues (before consolidation) by the Company, ii) the elimination of intersegment expenses, primarily consisting of asset-based management and administration fees charged by our Investment Management Segment, iii) and other intersegment eliminations.
(5) Investment results related to businesses exited through reinsurance are excluded.
Voya Financial Page 41 of 57 Alternative Investment Income
Three Months EndedYear-to-Date
(in millions USD) 6/30/2017 3/31/2017 12/31/2016 9/30/2016 6/30/2016 6/30/2017 6/30/2016
Retirement
Average alternative investments 523.4 493.6 473.9 438.4 424.2 508.5 420.7
Alternative investment income 12.5 15.3 15.8 7.7 0.6 27.8 (7.3)
Investment Management
Average alternative investments 220.6 209.2 184.5 180.2 175.4 214.9 180.5
Alternative investment income (1) 35.2 8.7 8.5 4.1 (8.6) 43.9 (23.3)
Annuities
Average alternative investments 303.3 283.5 274.1 263.5 256.6 293.4 258.1
Alternative investment income 9.0 7.9 8.8 4.8 0.1 16.9 (4.8)
Individual Life
Average alternative investments 252.1 220.4 206.6 191.2 173.9 236.2 177.6
Alternative investment income 7.5 5.0 7.2 3.4 0.2 12.5 (2.5)
Employee Benefits
Average alternative investments 50.3 46.4 42.0 42.5 41.2 48.3 41.2
Alternative investment income 1.3 1.5 1.5 0.8 0.2 2.8 (0.6)
Corporate
Average alternative investments 1.6 1.6 2.1 5.7 7.9 1.6 8.1
Alternative investment income — — — — 0.1 — —
Total Consolidated (2)(3)
Average alternative investments 1,351.3 1,254.7 1,183.2 1,121.5 1,079.2 1,302.9 1,086.2
Alternative investment income 65.5 38.4 41.8 20.8 (7.4) 103.9 (38.5)
(1) Includes performance fees related to sponsored private equity funds (“carried interest”) that are subject to later reversal based on subsequent fund performance, to the extent that cumulative rates of investment return fall below specified investment hurdle rates. Should the market value of a portfolio increase in future periods, reversals of carried interest could be fully or partially recovered. For the three and six months ended June 30, 2017, our carried interest net results included the recovery (gain) of $28.4 million of carried interest reversed in prior periods. For the three and six months ended June 30, 2016, our carried interest net results included the reversal (loss) of approximately $12.5 million and $30.2 million, respectively, in previously accrued carried interest.
(2) Our Closed Block Variable Annuity segment is managed to focus on protecting regulatory and rating agency capital rather than achieving operating metrics and, therefore, its results of operations are not reflected within investment income.
(3) The investment income on alternative investments shown above excludes the net investment income from Lehman Recovery/LIHTC.
Reconciliations
Voya Financial Page 43 of 57 Reconciliation of Consolidated Statements of Operations
Three Months EndedYear-to-Date
(in millions USD) 6/30/2017 3/31/2017 12/31/2016 9/30/2016 6/30/2016 6/30/2017 6/30/2016
Revenues
Net investment income 1,142.4 1,155.5 1,188.1 1,163.4 1,175.2 2,297.9 2,269.3
Fee income 838.2 850.8 849.4 857.9 826.7 1,689.0 1,652.5
Premiums 577.1 591.6 1,109.5 726.7 711.6 1,168.7 1,678.4
Net realized capital gains (losses) (193.8) (505.6) (804.8) (367.7) (101.3) (699.4) (90.6)
Income (loss) related to consolidated investment entities 128.7 27.3 103.0 57.7 (0.8) 156.0 28.3
Other revenues 96.2 93.8 103.2 90.5 84.6 190.0 167.4
Total revenues 2,588.8 2,213.4 2,548.4 2,528.5 2,696.0 4,802.2 5,705.3
Benefits and expenses
Interest credited and other benefits to contract owners/policyholders (1,357.3) (1,478.0) (2,181.2) (1,906.9) (1,549.7) (2,835.3) (3,425.4)
Operating expenses (691.7) (738.8) (777.1) (723.6) (716.4) (1,430.5) (1,436.6)
Net amortization of DAC/VOBA (234.2) (92.7) (169.8) (180.7) (98.0) (326.9) (200.5)
Interest expense (44.6) (45.9) (45.2) (45.4) (149.7) (90.5) (197.4)
Operating expenses related to consolidated investment entities (29.9) (17.4) (27.0) (27.8) (29.1) (47.3) (51.0)
Total benefits and expenses (2,357.7) (2,372.8) (3,200.3) (2,884.4) (2,542.9) (4,730.5) (5,310.9)
Income (loss) before income taxes 231.1 (159.4) (651.9) (355.9) 153.1 71.7 394.4
Income tax (expense) benefit (11.9) 17.0 161.4 119.4 (17.1) 5.1 (66.1)
Net income (loss) 219.2 (142.4) (490.5) (236.5) 136.0 76.8 328.3
Less:
Income tax (expense) benefit (11.9) 17.0 161.4 119.4 (17.1) 5.1 (66.1)
Closed Block Variable Annuity (28.0) (387.1) (729.5) (328.0) 56.5 (415.1) 102.5
Net investment gains (losses) and related charges and adjustments 3.4 (26.3) 9.8 (65.6) (24.7) (22.9) (85.1)
Net guaranteed benefit hedging gains (losses) and related charges
and adjustments 24.9 41.5 (142.9) (53.5) 21.2 66.4 114.7
Income (loss) related to businesses exited through reinsurance or
divestment 0.8 (5.3) (16.9) 1.3 0.5 (4.5) 2.1
Income (loss) attributable to noncontrolling interests 52.0 1.1 42.5 11.6 (25.5) 53.1 (24.8)
Income (loss) on early extinguishment of debt — (0.7) — (0.1) (102.4) (0.7) (104.1)
Immediate recognition of net actuarial gains (losses) related to
pension and other postretirement benefit obligations and gains
(losses) from plan amendments and curtailments — — (48.1) (7.1) — — —
Other adjustments to operating earnings (1) (6.1) (13.7) (30.8) (22.9) (7.6) (19.8) (15.8)
Operating earnings before income taxes 184.1 231.1 264.0 108.4 235.1 415.2 404.9
(1) Includes restructuring expenses (severance, lease write-offs, etc.) and expenses associated with the rebranding of Voya Financial, Inc. from ING U.S., Inc.
Voya Financial Page 44 of 57 Reconciliation of Operating Revenues by Segment
Three Months EndedYear-to-Date
(in millions USD) 6/30/2017 3/31/2017 12/31/2016 9/30/2016 6/30/2016 6/30/2017 6/30/2016
Operating revenues
Retirement 629.8 625.2 923.2 673.8 722.3 1,255.0 1,660.0
Investment Management 203.3 171.4 189.1 163.0 142.4 374.7 274.6
Annuities 298.1 301.4 321.0 310.6 319.1 599.5 622.1
Individual Life 628.6 630.0 640.9 637.7 624.9 1,258.6 1,248.9
Employee Benefits 442.9 446.2 410.0 405.9 400.8 889.1 800.5
Corporate 14.4 14.4 21.6 24.9 32.9 28.8 61.6
Total operating revenues 2,217.1 2,188.6 2,505.8 2,215.9 2,242.4 4,405.7 4,667.7
Adjustments
Closed Block Variable Annuity 154.0 (56.1) 209.5 271.7 362.0 97.9 815.0
Net realized investment gains (losses) and related
charges and adjustments (1.2) (39.1) (5.0) (12.8) (39.6) (40.3) (147.3)
Gain (loss) on change in fair value of derivatives
related to guaranteed benefits 43.2 46.4 (196.4) (51.1) 35.6 89.6 165.7
Revenues (losses) related to business exited through
reinsurance or divestment 48.4 20.4 (61.0) 32.3 66.1 68.8 124.6
Revenues (loss) attributable to noncontrolling interests 81.8 18.5 67.8 39.3 3.5 100.3 26.0
Other adjustments to operating revenues (1) 45.5 34.7 27.7 33.2 26.0 80.2 53.6
Total revenue 2,588.8 2,213.4 2,548.4 2,528.5 2,696.0 4,802.2 5,705.3
(1) Includes fee income earned by the Company’s broker-dealers for sales ofnon-proprietary products, which are reflected net of commission expense in the Company’s segments’ operating revenues, other items where the income is passed on to third parties and the elimination of intercompany investment expenses included in operating revenues.
Voya Financial Page 45 of 57 Reconciliation of Ongoing Business Adjusted Operating Earnings to Net Income (Loss)
Three Months Ended Twelve Months Ended
(in millions USD) 6/30/2017 3/31/2017 6/30/2016 6/30/2017 3/31/2017 12/31/2016 9/30/2016 6/30/2016
Net Income (loss) 219.2 (142.4) 136.0 (650.2) (733.4) (398.7) (68.6) 284.1
Less: Net income (loss) attributable to noncontrolling
interest 52.0 1.1 (25.5) 107.2 29.7 29.3 (66.8) (2.5)
Net Income (loss) available to Voya Financial, Inc.‘s
common shareholders 167.2 (143.5) 161.5 (757.4) (763.1) (428.0) (1.8) 286.6
Less: Adjustments to operating earnings
Closed Block Variable Annuity (28.0) (387.1) 56.5 (1,472.6) (1,388.1) (955.0) (542.8) (221.9)
Net Investment gains (losses) and related charges and
adjustments 3.4 (26.3) (24.7) (78.7) (106.8) (140.9) (210.4) (209.4)
Other adjustments 19.6 21.8 (88.3) (279.6) (387.5) (324.1) (186.5) (165.1)
Total Adjustments to operating earnings before tax effect (5.0) (391.6) (56.5) (1,830.9) (1,882.4) (1,420.0) (939.7) (596.4)
Income taxes on adjustments to operating earnings (1) 1.8 137.1 19.8 640.9 658.9 497.0 328.9 208.7
Total Adjustments to operating earnings, after tax(1) (3.2) (254.5) (36.7) (1,190.0) (1,223.5) (923.0) (610.8) (387.7)
Less: Difference between actual tax (expense) benefit
and assumed tax rate 45.2 (46.1) 38.3 (102.9) (109.8) (33.6) 63.8 109.7
Operating earnings,after-tax (1) 125.2 157.1 159.9 535.5 570.2 528.6 545.2 564.6
Less: Income taxes (1) (58.9) (74.0) (75.2) (252.1) (268.4) (248.7) (256.5) (265.7)
Total operating earnings before income taxes 184.1 231.1 235.1 787.6 838.6 777.3 801.7 830.3
Less: Corporate (88.8) (72.1) (92.4) (348.7) (352.3) (349.4) (326.1) (314.7)
Operating earnings before income taxes for Ongoing
Business 272.9 303.2 327.5 1,136.3 1,190.9 1,126.7 1,127.8 1,145.0
Less: DAC/VOBA and other intangibles unlocking (2) (109.0) 12.5 19.6 (237.3) (108.7) (121.6) (92.9) (46.0)
Less: Other Operating Adjustments (3) — — — 20.4 20.4 20.4 2.6 —
Ongoing Business adjusted operating earnings before
income taxes 381.9 290.7 307.9 1,353.2 1,279.2 1,227.9 1,218.1 1,191.0
(1) Assumes a 32% tax rate on operating earnings and all components of operating earnings described as“after-tax.” A 35% tax rate is applied to allnon-operating items. The 32% tax rate for operating earnings and components reflects the estimated benefit of the dividend received deduction related to Ongoing Business.
(2) DAC/VOBA and other intangibles unlocking excludes unlocking on net investment income from Lehman Recovery/LIHTC. (3) See page 3 for a description of the Other Operating Adjustments.
Voya Financial Page 46 of 57 Reconciliation of Ongoing Business Adjusted Operating Earnings to Net Income (Loss)
Twelve Months Ended
(in millions USD) 12/31/2015 12/31/2014 12/31/2013 12/31/2012
Net Income (loss) 538.6 2,532.7 788.6 628.2
Less: Net income (loss) attributable to noncontrolling interest 130.3 237.7 190.1 138.2
Net Income (loss) available to Voya Financial, Inc.‘s common
shareholders 408.3 2,295.0 598.5 490.0
Less: Adjustments to operating earnings
Closed Block Variable Annuity (173.3) (239.2) (1,211.3) (675.3)
Net Investment gains (losses) and related charges and
adjustments (83.3) 215.1 212.1 455.5
Other adjustments (266.7) (643.0) 296.6 (213.7)
Total Adjustments to operating earnings before tax effect (523.3) (667.1) (702.6) (433.5)
Income taxes on adjustments to operating earnings (1) 183.2 233.5 245.9 151.7
Total Adjustments to operating earnings, after tax(1) (340.1) (433.6) (456.7) (281.8)
Less: Difference between actual tax (expense) benefit and
assumed tax rate 83.7 1,928.7 230.6 174.9
Operating earnings,after-tax (1) 664.7 799.9 824.6 596.9
Less: Income taxes (1) (312.8) (430.7) (444.0) (321.4)
Total operating earnings before income taxes 977.5 1,230.6 1,268.6 918.3
Less: Corporate (236.8) (145.7) (160.0) (72.6)
Operating earnings before income taxes for Ongoing Business 1,214.3 1,376.3 1,428.6 990.9
Less: DAC/VOBA and other intangibles unlocking (2) (67.5) (21.6) 133.2 (77.0)
Less: Other Operating Adjustments (3) — 20.0 83.6 (25.3)
Ongoing Business adjusted operating earnings before income
taxes 1,281.8 1,377.9 1,211.8 1,093.2
(1) Assumes a 32% tax rate for 2015 and later and 35% tax rate for 2014 and earlier on operating earnings and all components of operating earnings described as“after-tax.” A 35% tax rate is applied to allnon-operating items. The 32% tax rate for operating earnings and components reflects the estimated benefit of the dividend received deduction related to Ongoing Business.
(2) DAC/VOBA and other intangibles unlocking excludes unlocking on net investment income from Lehman Recovery/LIHTC. (3) See page 3 for a description of Other Operating Adjustments.
Voya Financial Page 47 of 57 Reconciliation of Adjusted Operating Earnings; Adjusted Operating Return on Capital
Twelve Months Ended June 30, 2017
Closed
Block
Investment Individual Employee Ongoing Variable
(in millions USD, unless otherwise indicated) Retirement Management Annuities Life Benefits Business Annuity Corporate Consolidated
Operating earnings before income taxes 386.6 250.5 327.2 61.2 110.8 1,136.3 (348.7) 787.6
Less:
Interest expense — — — — — — (192.1) (192.1)
DAC/VOBA and other intangibles unlocking (178.3) 83.2 (140.5) (1.7) (237.3) — (237.3)
Gain on Lehman Recovery 4.1 2.8 4.5 8.0 1.0 20.4 0.3 20.7
Adjusted operating earnings before interest 560.8 247.7 239.5 193.7 111.5 1,353.2 — (156.9) 1,196.3
Income tax expense 179.5 79.3 76.6 62.0 35.7 433.1 (50.2) 382.9
Adjusted operating earnings before interest
and after income taxes 381.3 168.4 162.9 131.7 75.8 920.1 — (106.7) 813.4
Average Capital 3,974 300 1,499 1,749 365 7,887 2,378 4,404 14,669
Adjusted Operating Return on Capital 9.6% 56.1% 10.9% 7.5% 20.8% 11.7% N/M N/M 5.5%
Twelve Months Ended March 31, 2017
Closed
Block
Investment Individual Employee Ongoing Variable
(in millions USD, unless otherwise indicated) Retirement Management Annuities Life Benefits Business Annuity Corporate Consolidated
Operating earnings before income taxes 494.2 197.4 334.0 49.2 116.1 1,190.9 (352.3) 838.6
Less:
Interest expense — — — — — — (192.2) (192.2)
DAC/VOBA and other intangibles unlocking (54.0) — 91.0 (143.5) (2.2) (108.7) — (108.7)
Gain on Lehman Recovery 4.1 2.8 4.5 8.0 1.0 20.4 0.3 20.7
Adjusted operating earnings before interest 544.1 194.6 238.5 184.7 117.3 1,279.2 — (160.4) 1,118.8
Income tax expense 174.1 62.3 76.3 59.1 37.5 409.3 (51.3) 358.0
Adjusted operating earnings before interest
and after income taxes 370.0 132.3 162.2 125.6 79.8 869.9 — (109.1) 760.8
Average Capital 3,982 295 1,524 1,893 370 8,064 2,745 4,190 14,999
Adjusted Operating Return on Capital 9.3% 44.8% 10.6% 6.6% 21.6% 10.8% N/M N/M 5.1%
Voya Financial Page 48 of 57 Reconciliation of Adjusted Operating Earnings; Adjusted Operating Return on Capital
Twelve Months Ended December 31, 2016
Closed
Block
Investment Individual Employee Ongoing Variable
(in millions USD, unless otherwise indicated) Retirement Management Annuities Life Benefits Business Annuity Corporate Consolidated
Operating earnings before income taxes 449.8 170.8 321.2 58.6 126.3 1,126.7 (349.4) 777.3
Less:
Interest expense — (192.8) (192.8)
DAC/VOBA and other intangibles unlocking (65.6) — 91.5 (143.5) (4.0) (121.6) — (121.6)
Gain on Lehman Recovery 4.1 2.8 4.5 8.0 1.0 20.4 0.3 20.7
Adjusted operating earnings before interest 511.3 168.0 225.2 194.1 129.3 1,227.9 — (156.9) 1,071.0
Income tax expense 163.6 53.8 72.1 62.1 41.4 393.0 (50.2) 342.8
Adjusted operating earnings before interest
and after income taxes 347.7 114.2 153.1 132.0 87.9 834.9 — (106.7) 728.2
Average Capital 3,964 297 1,561 2,015 378 8,215 3,006 4,059 15,280
Adjusted Operating Return on Capital 8.8% 38.5% 9.8% 6.6% 23.3% 10.2% N/M N/M 4.8%
Twelve Months Ended September 30, 2016
Closed
Block
Investment Individual Employee Ongoing Variable
(in millions USD, unless otherwise indicated) Retirement Management Annuities Life Benefits Business Annuity Corporate Consolidated
Operating earnings before income taxes 444.3 148.4 299.5 117.6 118.0 1,127.8 (326.1) 801.7
Less:
Interest expense (193.8) (193.8)
DAC/VOBA and other intangibles unlocking (49.9) — 89.7 (128.5) (4.2) (92.9) — (92.9)
Gain on Lehman Recovery — 2.6 — — — 2.6 — 2.6
Adjusted operating earnings before interest 494.2 145.8 209.8 246.1 122.2 1,218.1 — (132.3) 1,085.8
Income tax expense 158.1 46.7 67.1 78.8 39.1 389.8 (42.3) 347.5
Adjusted operating earnings before interest
and after income taxes 336.1 99.1 142.7 167.3 83.1 828.3 — (90.0) 738.3
Average Capital (1) 3,951 309 1,608 2,058 386 8,312 3,119 4,026 15,457
Adjusted Operating Return on Capital 8.5% 32.1% 8.9% 8.1% 21.5% 10.0% N/M N/M 4.8%
(1) Includes capital impacts related to the 2015 Term Life Coinsurance Agreement in our Individual Life segment effective 10/1/2015
Voya Financial Page 49 of 57 Reconciliation of Adjusted Operating Earnings; Adjusted Operating Return on Capital
Twelve Months Ended June 30, 2016
Closed
Block
Investment Individual Employee Ongoing Variable
(in millions USD, unless otherwise indicated) Retirement Management Annuities Life Benefits Business Annuity Corporate Consolidated
Operating earnings before income taxes 461.9 142.5 236.7 183.0 120.9 1,145.0 (314.7) 830.3
Less:
Interest expense (194.3) (194.3)
DAC/VOBA and other intangibles unlocking (24.0) — 20.4 (35.8) (6.6) (46.0) — (46.0)
Net gain from Lehman Recovery/LIHTC — — — — — — 1.6 1.6
Adjusted operating earnings before interest 485.9 142.5 216.3 218.8 127.5 (1,191.0) — (122.0) 1,069.0
Income tax expense 155.5 45.6 69.2 70.0 40.8 381.1 (39.0) 342.1
Adjusted operating earnings before
interest and after income taxes 330.4 96.9 147.1 148.8 86.7 809.9 — (83.0) 726.9
Average Capital (1) 3,957 325 1,656 2,127 388 8,453 3,088 4,068 15,609
Adjusted Operating Return on Capital 8.3% 29.8% 8.9% 7.0% 22.3% 9.6% N/M N/M 4.7%
Twelve Months Ended December 31, 2015
Closed
Block
Investment Individual Employee Ongoing Variable
(in millions USD, unless otherwise indicated) Retirement Management Annuities Life Benefits Business Annuity Corporate Consolidated
Operating earnings before income taxes 470.6 181.9 243.0 172.7 146.1 1,214.3 — (236.8) 977.5
Less:
Interest expense — — — — — — — (194.5) (194.5)
DAC/VOBA and other intangibles unlocking (37.2) — 12.5 (38.4) (4.4) (67.5) — — (67.5)
Gain on Lehman Recovery — — — — — — — 1.6 1.6
Adjusted operating earnings before interest 507.8 181.9 230.5 211.1 150.5 1,281.8 — (43.9) 1,237.9
Income tax expense 162.5 58.2 73.8 67.6 48.2 410.3 — (14.0) 396.3
Adjusted operating earnings before
interest and after income taxes 345.3 123.7 156.7 143.5 102.3 871.5 — (29.9) 841.6
Average Capital (1) 3,965 329 1,689 2,327 387 8,697 2,803 4,467 15,967
Adjusted Operating Return on Capital 8.7% 37.6% 9.3% 6.2% 26.5% 10.0% N/M N/M 5.3%
(1) Includes capital impacts related to the 2015 Term Life Coinsurance Agreement in our Individual Life segment effective 10/1/2015
Voya Financial Page 50 of 57 Reconciliation of Adjusted Operating Earnings; Adjusted Operating Return on Capital
Twelve Months Ended December 31, 2014
Closed
Block
Investment Individual Employee Ongoing Variable
(in millions USD, unless otherwise indicated) Retirement Management Annuities Life Benefits Business Annuity Other Consolidated
Operating earnings before income taxes 517.8 210.3 262.0 237.3 148.9 1,376.3 — (145.7) 1,230.6
Less:
Interest expense — — — — — — — (188.0) (188.0)
DAC/VOBA and other intangibles unlocking (30.0) — 26.4 (10.2) (7.8) (21.6) — — (21.6)
Gain on reinsurance recapture (3) — — — 20.0 — 20.0 — — 20.0
Net gain from Lehman Recovery/LIHTC — — — — — — — 4.0 4.0
Adjusted operating earnings before interest 547.8 210.3 235.6 227.5 156.7 1,377.9 — 38.3 1,416.2
Income tax expense 191.7 73.6 82.5 79.6 54.8 482.2 — 13.4 495.6
Adjusted operating earnings before
interest and after income taxes 356.1 136.7 153.1 147.9 101.9 895.7 — 24.9 920.6
Average Capital (1) 3,891 310 1,694 2,781 352 9,028 3,233 3,023 15,284
Adjusted Operating Return on Capital 9.2% 44.2% 9.0% 5.3% 28.9% 9.9% N/M N/M 6.0%
Twelve Months Ended December 31, 2013
Closed
Block
Investment Individual Employee Ongoing Variable
(in millions USD, unless otherwise indicated) Retirement Management Annuities Life Benefits Business Annuity Other Consolidated
Operating earnings before income taxes 595.8 178.1 293.8 254.8 106.1 1,428.6 — (160.0) 1,268.6
Less:
Interest expense — — — — — — — (179.7) (179.7)
DAC/VOBA and other intangibles unlocking 45.6 — 83.3 4.8 (0.5) 133.2 — — 133.2
Net gain from Lehman Recovery/LIHTC 12.9 13.2 13.5 39.7 4.3 83.6 — 3.4 87.0
Adjusted operating earnings before interest 537.3 164.9 197.0 210.3 102.3 1,211.8 — 16.3 1,228.1
Income tax expense 188.1 57.7 69.0 73.6 35.8 424.2 — 5.7 429.9
Adjusted operating earnings before
interest and after income taxes 349.2 107.2 128.0 136.7 66.5 787.6 — 10.6 798.2
Average Capital 3,915 303 1,762 2,804 354 9,137 3,235 2,104 14,476
Adjusted Operating Return on Capital 8.9% 35.4% 7.3% 4.9% 18.8% 8.6% N/M N/M 5.5%
(1) Includes capital impacts related to the 2014 Term Life Coinsurance Agreement in our Individual Life segment effective 10/1/2014
Voya Financial Page 51 of 57 Reconciliation of Adjusted Operating Earnings; Adjusted Operating Return on Capital
Twelve Months Ended December 31, 2012
Closed
Block
Investment Individual Employee Ongoing Variable
(in millions USD, unless otherwise indicated) Retirement Management Annuities Life Benefits Business Annuity Corporate Consolidated
Operating earnings before income taxes 448.6 134.5 102.2 196.2 109.4 990.9 — (72.6) 918.3
Less:
Interest expense — — — — — — — (127.8) (127.8)
DAC/VOBA and other intangibles unlocking 5.8 — (86.2) 3.4 — (77.0) — — (77.0)
Impact of investment portfolio restructuring (31.2) 2.2 (11.2) 14.8 0.1 (25.3) — (5.8) (31.1)
Adjusted operating earnings before interest 474.0 132.3 199.6 178.0 109.3 1,093.2 — 61.0 1,154.2
Income tax expense 165.9 46.3 69.9 62.3 38.3 382.7 — 21.4 404.1
Adjusted operating earnings before interest
and after income taxes 308.1 86.0 129.7 115.7 71.0 710.5 — 39.6 750.1
Average Capital 4,308 289 2,210 2,702 421 9,930 3,394 587 13,911
Adjusted Operating Return on Capital 7.2% 29.8% 5.9% 4.3% 16.9% 7.2% N/M N/M 5.4%
Voya Financial Page 52 of 57 Reconciliation of Ongoing Business Adjusted Return On Equity and Capital
Twelve Months Ended
6/30/2017 3/31/2017 12/31/2016 9/30/2016 6/30/2016 12/31/2015 12/31/2014 12/31/2013 12/31/2012
GAAP Return on Equity (5.5)% (5.3)% (2.9)% 0.0 % 2.0 % 2.7 % 15.8 % 4.4 % 3.7 %
Effect of Adjustments to Ongoing Business Adjusted
Operating Earnings After Income Tax and Ongoing
Business Equity and Capital:
Exclusion of AOCI 2.8 % 2.6 % 2.4 % 2.1 % 1.7 % 2.0 % 2.3 % 2.1 % 2.0 %
DAC/VOBA and Other Intangible Unlocking Excluded from
Ongoing Business Adjusted Operating Earnings 1.7 % 0.8 % 0.8 % 0.6 % 0.3 % 0.4 % 0.1 % (1.0)% 0.6 %
Other Adjustments to Ongoing Business adjusted Operating
Earnings (0.1)% (0.1)% (0.1)% — — — (0.1)% (0.6)% 0.2 %
Exclusion of Corporate Operating Earnings Before Income
Taxes and Allocated Capital 3.6 % 2.8 % 2.7 % 2.6 % 2.4 % 2.2 % 2.0 % 0.8 % (0.1)%
Exclusion of Capital Allocated to Deferred Tax Assets 2.3 % 2.2 % 1.8 % 1.7 % 1.7 % 1.7 % 0.2 % — —
Effect of Calculated Interest Expense and Assumed 25%
Debt-to-Capital Ratio (vs actual) (1.0)% (0.8)% (0.7)% (0.6)% (0.5)% (0.6)% (0.5)% (0.6)% (1.0)%
Exclusion of Closed Block Variable Annuity Result and
Allocated Capital 12.8 % 12.2 % 9.1 % 6.4 % 4.0 % 3.4 % 4.3 % 12.0 % 7.3 %
Exclusion of Net Investment Gains and Losses 0.6 % 0.7 % 1.0 % 1.5 % 1.5 % 0.6 % (1.5)% (1.6)% (3.5)%
Exclusion of Net Guaranteed Benefit Hedging Gains and
Losses 0.9 % 0.9 % 0.6 % (0.1)% (0.3)% 0.6 % 0.1 % (0.1)% (0.7)%
Exclusion of Income (Loss) Related to Business Exited
Through Reinsurance or Divestment 0.1 % 0.1 % 0.1 % 0.7 % 0.8 % 1.1 % 1.1 % 0.4 % —
Exclusion of Loss Related to Early Extinguishment of Debt — 0.7 % 0.7 % 0.7 % 0.7 % 0.1 % — — —
Exclusion of Immediate Recognition of Net Actuarial Gains
(Losses) Related to Pension and Other Postretirement
Benefit Obligations and Gains (Losses) from Plan
Amendments and Curtailments 0.4 % 0.4 % 0.4 % (0.4)% (0.4)% (0.4)% 2.6 % (3.0)% 1.3 %
Effect of Other Adjustments to Operating Earnings 0.6 % 0.6 % 0.3 % 0.3 % 0.4 % 0.5 % 0.6 % 0.5 % 1.1 %
Effect of Assumed Tax Rate vs actual effective tax rate (0.1)% (0.4)% 0.2 % 2.6 % (4.1)% (1.9)% (21.3)% (3.1)% (2.6)%
Other Income Tax Effects (4.8)% (4.2)% (4.1)% (6.0)% 1.3 % (0.3)% 6.4 % 0.1 % — %
Ongoing Business Adjusted Operating Return on
Equity 14.3 % 13.2 % 12.3 % 12.1 % 11.5 % 12.1 % 12.1 % 10.3 % 8.3 %
Inclusion of debt (based on 25% debt to capital ratio) (3.5)% (3.3)% (3.0)% (3.0)% (2.8)% (3.0)% (3.1)% (2.6)% (2.0)%
Exclusion of assumed interest expense 0.9 % 0.9 % 0.9 % 0.9 % 0.9 % 0.9 % 0.9 % 0.9 % 0.9 %
Ongoing Business Adjusted Operating Return on
Capital 11.7 % 10.8 % 10.2 % 10.0 % 9.6 % 10.0 % 9.9 % 8.6 % 7.2 %
Voya Financial Page 53 of 57 Impacts of Prepayments and Alternative Income Above (Below) Long-Term Expectations on ROC/ROE (bps)
Twelve Months Ended
(in basis points) 6/30/2017 12/31/2016 12/31/2015 12/31/2014
Prepayments Above (Below) Long-term Expectations (1)
Effect on ROC:
Retirement 19 43 49 26
Annuities 56 84 69 33
Life 11 18 41 14
Employee Benefits 44 56 35 4
Total Effect on Ongoing Business ROC 25 44 48 22
Effect on Ongoing Business ROE 33 58 64 29
Alternatives Above (Below) Long-term Expectations (1) (2)
Effect on ROC:
Retirement 15 (35) (44) 1
Annuities 23 (50) (61) 14
Life 12 (25) (27) 12
Employee Benefits 18 (37) (49) 11
Total Effect on Ongoing Business ROC 48 (57) (53) 12
Effect on Ongoing Business ROE 64 (75) (71) 16
Prepayments and Alternative Income Above (Below) Long-Term Expectations (1) (2)
Effect on ROC:
Retirement 34 8 5 27
Annuities 79 34 8 47
Life 23 (7) 14 26
Employee Benefits 62 19 (14) 15
Total Effect on Ongoing Business ROC 73 (13) (5) 34
Effect on Ongoing Business ROE 97 (17) (7) 45
(1) Basis point impacts are after DAC and after tax. (2) Amounts exclude Gain on Lehman recovery
Voya Financial Page 54 of 57 Calculation of ROE and ROC
Twelve Months Ended or As of
(in millions USD, unless otherwise indicated) 6/30/2017 3/31/2017 12/31/2016 9/30/2016 6/30/2016 12/31/2015 12/31/2014 12/31/2013 12/31/2012
GAAP Return on Equity:
Net income (loss) available to Voya Financial,
Inc.‘s common shareholders (757.4) (763.1) (428.0) (1.8) 286.6 408.3 2,295.0 598.5 490.0
Voya Financial, Inc. shareholders’ equity: end of
period 13,352 12,890 12,994 15,206 15,339 13,436 16,146 13,315 13,920
Voya Financial, Inc. shareholders’ equity:
average for period 13,859 14,304 14,555 14,496 14,320 15,019 14,571 13,618 13,151
GAAP Return on Equity (5.5)% (5.3)% (2.9)% 0.0% 2.0% 2.7% 15.8% 4.4% 3.7%
Ongoing Business Adjusted Operating Return
on Capital and Adjusted Operating Return on
Equity:
Ongoing Business adjusted operating earnings
before income taxes 1,353.2 1,279.2 1,227.9 1,218.1 1,191.0 1,281.8 1,377.9 1,211.8 1,093.2
Income taxes on adjusted operating earnings (1) (433.1) (409.3) (393.0) (389.8) (381.1) (410.3) (482.2) (424.2) (382.7)
Ongoing Business adjusted operating earnings
after income taxes 920.1 869.9 834.9 828.3 809.9 871.5 895.7 787.6 710.5
Interest expenseafter-tax (2) (71.6) (73.1) (75.1) (76.7) (78.8) (82.1) (77.3) (79.9) (88.7)
Ongoing Business adjusted operating
earnings after income taxes and interest 848.5 796.8 759.8 751.6 731.1 789.4 818.4 707.7 621.8
expense
End of period capital for Ongoing Business 7,551 7,656 7,878 8,108 8,256 8,377 8,777 9,216 9,823
Average capital for Ongoing Business 7,887 8,064 8,215 8,312 8,453 8,697 9,028 9,137 9,930
Average debt (based on 25%debt-to-capital (1,972) (2,016) (2,054) (2,078) (2,113) (2,175) (2,257) (2,284) (2,483)
ratio)
Average equity for Ongoing Business 5,915 6,048 6,161 6,234 6,340 6,522 6,771 6,853 7,447
Adjusted Operating Return on Capital for
Ongoing Business 11.7 % 10.8 % 10.2 % 10.0% 9.6% 10.0% 9.9% 8.6% 7.2%
Adjusted Operating Return on Equity for
Ongoing Business (2) 14.3 % 13.2 % 12.3 % 12.1% 11.5% 12.1% 12.1% 10.3% 8.3%
(1) Assumes a 32% tax rate on operating earnings described as “after tax” beginning 2015 to current and a 35% tax rate for all periods prior to 2015.
(2) Assumesdebt-to-capital ratio of approximately 25% and the actual weighted averagepre-tax interest rate for all periods presented. Assumes a 5.5% interest rate for periods prior to3Q 2013.
Voya Financial Page 55 of 57 Reconciliation of Operating Earnings Per Share; Book Value Per Share, Excluding AOCI
Three Months Ended or As ofYear-to-Date or As of
(in whole dollars) 6/30/2017 3/31/2017 12/31/2016 9/30/2016 6/30/2016 6/30/2017 6/30/2016
Net income (loss) available to Voya Financial, Inc.‘s common
shareholders per common share (Diluted) 0.89 (0.75) (2.74) (1.24) 0.79 0.12 1.71
Exclusion of per share impact of:
Closed Block Variable Annuity 0.10 1.31 2.44 1.07 (0.18) 1.41 (0.32)
Net investment gains (losses) and related charges and adjustments (0.01) 0.09 (0.03) 0.21 0.08 0.08 0.27
Net guaranteed benefit hedging gains (losses) and related charges
and adjustments (0.09) (0.14) 0.48 0.17 (0.07) (0.23) (0.36)
Income (loss) related to businesses exited through reinsurance or
divestment — 0.02 0.06 — — 0.02 (0.01)
Income (loss) on early extinguishment of debt — — — — 0.33 — 0.33
Immediate recognition of net actuarial gains (losses) related to
pension and other postretirement benefit obligations and gains
(losses) from plan amendments and curtailments — — 0.16 0.02 — — —
Other adjustments to operating earnings 0.02 0.05 0.10 0.07 0.02 0.08 0.05
Effect of assumed tax rate vs actual effective tax rate (0.24) 0.24 0.46 0.07 (0.18) — (0.34)
Adjustment due to antidilutive effect of net loss in the current period (1) — (0.01) (0.02) — — — —
Consolidated Operating earnings per share (Diluted) (1) 0.67 0.81 0.91 0.37 0.79 1.48 1.33
Book value per share, including AOCI 74.30 67.88 66.77 78.14 76.62 74.30 76.62
Per share impact of AOCI (15.06) (11.65) (10.39) (18.07) (17.18) (15.06) (17.18)
Book value per share, excluding AOCI 59.24 56.23 56.38 60.07 59.44 59.24 59.44
Reconciliation of shares used in Total Consolidated Operating
earnings per share (Diluted)
Weighted-average common shares outstanding—Diluted 187.7 191.7 194.6 199.6 203.5 191.1 206.3
Dilutive effect of the exercise or issuance of stock-based awards (1) — 2.7 2.5 1.9 — — —
Weighted average common shares outstanding—Diluted (Operating) (1) 187.7 194.4 197.1 201.5 203.5 191.1 206.3
(1) For periods in which there is a Net loss available to common shareholders, Operating earnings per share calculation includes additional dilutive shares, as the inclusion of these shares for stock compensation plans would not be anti-dilutive to the Operating earnings per share calculation.
Voya Financial Page 56 of 57 Reconciliation of Average Capital; Debt to Capital, Excluding AOCI
Three Months Ended or As of Twelve Months Ended or As of
(in millions USD, unless otherwise
indicated) 6/30/2017 3/31/2017 12/31/2016 9/30/2016 6/30/2016 12/31/2015 12/31/2014 12/31/2013 12/31/2012
Voya Financial, Inc. shareholders’
equity: end of period 13,352.2 12,890.4 12,993.9 15,206.0 15,338.9 13,435.8 16,146.2 13,315.2 13,919.9
AOCI 2,706.9 2,212.3 2,021.7 3,517.1 3,439.7 1,424.9 3,103.7 1,849.1 3,710.7
Voya Financial, Inc. shareholders’ equity
excluding AOCI end of period 10,645.3 10,678.1 10,972.2 11,688.9 11,899.2 12,010.9 13,042.5 11,466.1 10,209.2
Debt 3,462.1 3,461.2 3,549.5 3,548.5 3,547.5 3,459.8 3,486.5 3,481.1 3,796.3
End of Period Capital 14,107.4 14,139.3 14,521.7 15,237.4 15,446.7 15,470.7 16,529.0 14,947.2 14,005.5
Corporate and Closed Block Variable
Annuity 6,556.4 6,483.3 6,643.7 7,129.4 7,190.7 7,093.7 7,752.0 5,731.2 4,182.5
End of Period Capital for Ongoing
Business 7,551.0 7,656.0 7,878.0 8,108.0 8,256.0 8,377.0 8,777.0 9,216.0 9,823.0
Adjustments to TTM Average Capital (1) 336.0 408.0 337.0 204.0 197.0 320.0 251.0 (79.0) 107.0
Average Capital for Ongoing Business-
TTM (1) 7,887.0 8,064.0 8,215.0 8,312.0 8,453.0 8,697.0 9,028.0 9,137.0 9,930.0
Debt to capital, including AOCI 20.6% 21.2% 21.5% 18.9% 18.8% 20.5% 17.8% 20.7% 21.4%
Capital impact of AOCI 3.9% 3.3% 2.9% 4.4% 4.2% 1.9% 3.3% 2.6% 5.7%
Debt to capital, excluding AOCI 24.5% 24.5% 24.4% 23.3% 23.0% 22.4% 21.1% 23.3% 27.1%
(1) Trailing Twelve Months Calculation
Voya Financial Page 57 of 57 Reconciliation of Investment Management Operating Margin, Excluding Investment Capital
Three Months Ended Twelve Months Ended
(in millions USD, unless otherwise indicated) 6/30/2017 3/31/2017 6/30/2016 6/30/2017 12/31/2016 12/31/2015 12/31/2014 12/31/2013 12/31/2012
Operating revenues (1) 203.3 171.4 142.4 724.0 623.9 622.2 655.4 594.5 545.5
Operating expenses (118.4) (122.1) (110.6) (476.3) (455.9) (440.3) (445.1) (429.6) (411.0)
Operating earnings before income taxes 84.9 49.3 31.8 247.7 168.0 181.9 210.3 164.9 134.5
Operating margin 41.8% 28.8% 22.3% 34.2% 26.9% 29.2% 32.1% 27.7% 24.6%
Operating revenues (1) 203.3 171.4 142.4 724.0 623.9 622.2 655.4 594.5 545.5
Less:
Investment Capital Results (1) 35.2 8.7 (8.6) 56.4 (10.8) 1.1 19.7 23.8 41.6
Revenues excluding Investment Capital 168.1 162.7 151.0 667.6 634.7 621.1 635.7 570.7 503.9
Operating expenses (118.4) (122.1) (110.6) (476.3) (455.9) (440.3) (445.1) (429.6) (411.0)
Operating earnings excluding Investment
Capital 49.7 40.6 40.4 191.3 178.8 180.8 190.6 141.1 92.9
Operating margin excluding Investment
Capital 29.6% 25.0% 26.8% 28.7% 28.2% 29.1% 30.0% 24.7% 18.4%
(1) Excludes gain from Lehman recovery in 2013 and 2016.