Exhibit 99.2
Exhibit 99.2 VOVA FINANCIAL Quarterly Investor Supplement December 31, 2017 This report should be read in conjunction with Voya Financial, Inc.‘s Annual Report on Form10-K for the Twelve Months Ended December 31,2017. Voya Financial’s Annual Reports on Form10-K, and Quarterly Reports on Form10-Q, can be accessed upon filing at the Securities andExchange Commission’s website at www.sec.gov, and at our website at investors.voya.com. All information is unaudited. Corporate Offices:Voya Financial230 Park AvenueNew York, New York 10169 NYSE Ticker: VOYA Media Contact:Christopher Breslin212-309-8941 Christopher.Breslin@voya.com Investor Contact: Darin Arita212-309-8999 IR@voya.com Web Site: investors.voya.com
|
|
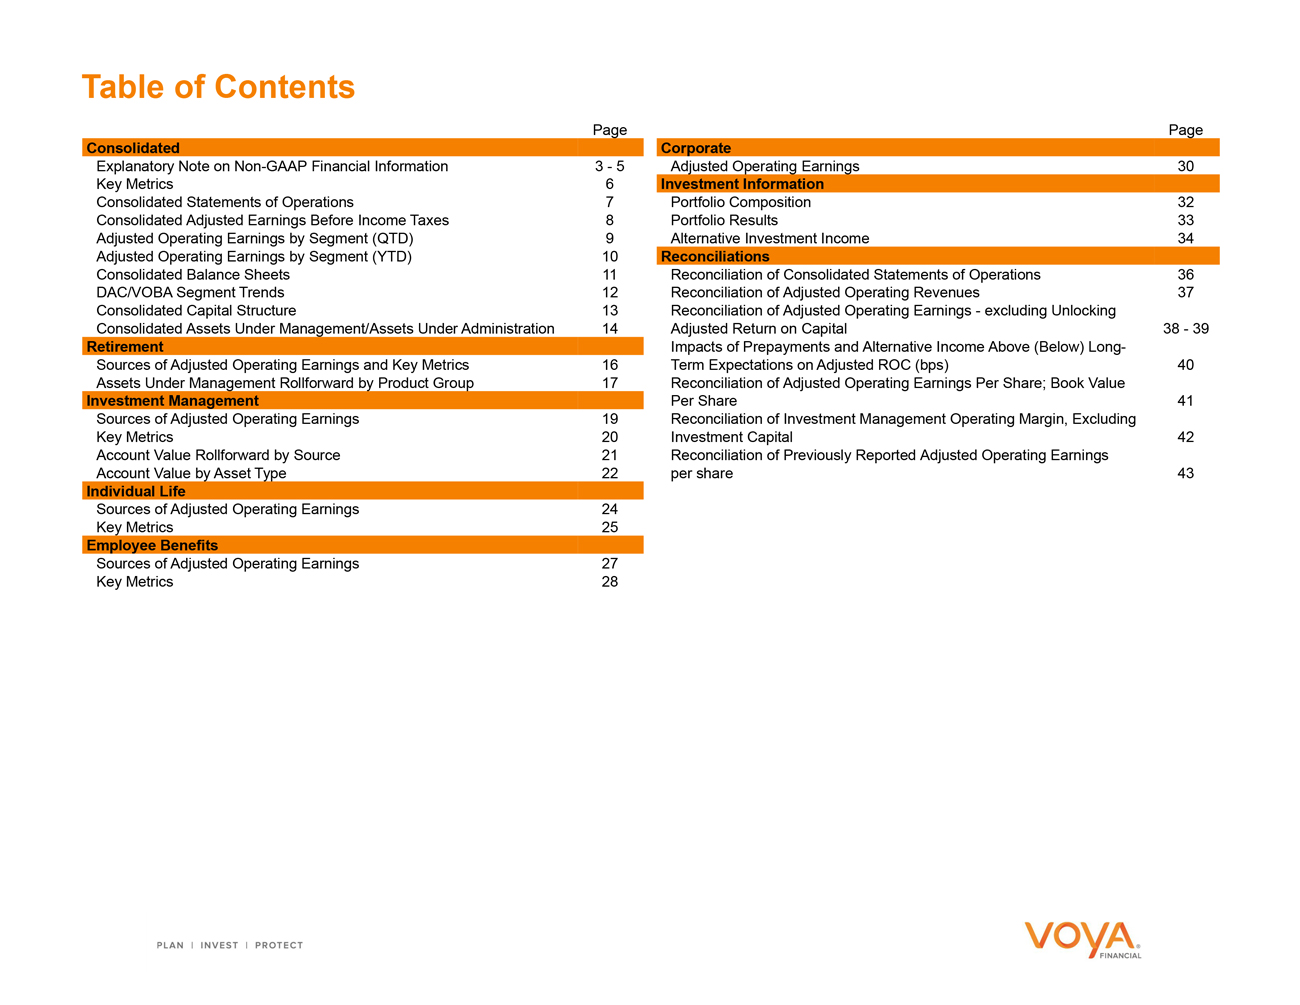
Table of Contents Explanatory Note onNon-GAAP Financial Information 3 - 5 Adjusted Operating Earnings30 Key Metrics 6 Investment Information Consolidated Statements of Operations 7 Portfolio Composition32 Consolidated Adjusted Earnings Before Income Taxes 8 Portfolio Results33 Adjusted Operating Earnings by Segment (QTD) 9 Alternative Investment Income34 Adjusted Operating Earnings by Segment (YTD) 10 Reconciliations Consolidated Balance Sheets 11 Reconciliation of Consolidated Statements of Operations36 DAC/VOBA Segment Trends 12 Reconciliation of Adjusted Operating Revenues37 Consolidated Capital Structure 13 Reconciliation of Adjusted Operating Earnings - excluding Unlocking Consolidated Assets Under Management/Assets Under Administration 14 Adjusted Return on Capital38 - 39 Retirement Impacts of Prepayments and Alternative Income Above (Below) Long- Sources of Adjusted Operating Earnings and Key Metrics 16 Term Expectations on Adjusted ROC (bps)40 Assets Under Management Rollforward by Product Group 17 Reconciliation of Adjusted Operating Earnings Per Share; Book Value Investment Management Per Share 41 Sources of Adjusted Operating Earnings 19 Reconciliation of Investment Management Operating Margin, Excluding Key Metrics 20 Investment Capital42 Account Value Rollforward by Source 21 Reconciliation of Previously Reported Adjusted Operating Earnings Account Value by Asset Type 22 per share43 Individual Life Sources of Adjusted Operating Earnings 24 Key Metrics 25 Employee Benefits Sources of Adjusted Operating Earnings 27 Key Metrics 28 Consolidated Page Corporate Page
|
|
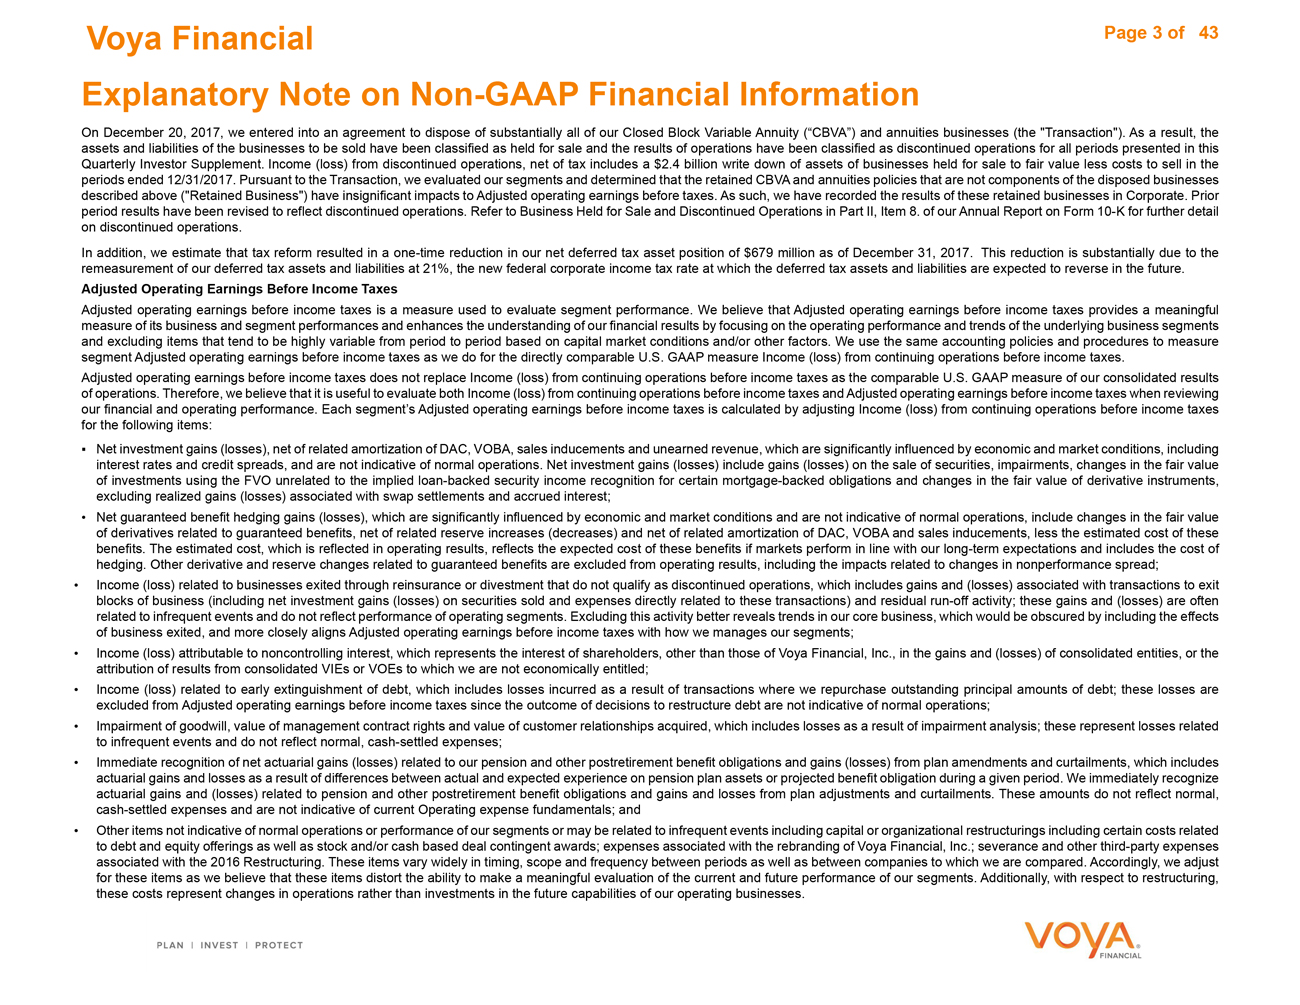
Page 3 of 43 Voya Financial Page 3 of 43 Explanatory Note onNon-GAAP Financial Information On December 20, 2017, we entered into an agreement to dispose of substantially all of our Closed Block Variable Annuity (“CBVA”) and annuities businesses (the “Transaction”). As a result, the assets and liabilities of the businesses to be sold have been classified as held for sale and the results of operations have been classified as discontinued operations for all periods presented in this Quarterly Investor Supplement. Income (loss) from discontinued operations, net of tax includes a $2.4 billion write down of assets of businesses held for sale to fair value less costs to sell in the periods ended 12/31/2017. Pursuant to the Transaction, we evaluated our segments and determined that the retained CBVA and annuities policies that are not components of the disposed businesses described above (“Retained Business”) have insignificant impacts to Adjusted operating earnings before taxes. As such, we have recorded the results of these retained businesses in Corporate. Prior period results have been revised to reflect discontinued operations. Refer to Business Held for Sale and Discontinued Operations in Part II, Item 8. of our Annual Report on Form10-K for further detail on discontinued operations. In addition, we estimate that tax reform resulted in aone-time reduction in our net deferred tax asset position of $679 million as of December 31, 2017. This reduction is substantially due to the remeasurement of our deferred tax assets and liabilities at 21%, the new federal corporate income tax rate at which the deferred tax assets and liabilities are expected to reverse in the future. Adjusted Operating Earnings Before Income Taxes Adjusted operating earnings before income taxes is a measure used to evaluate segment performance. We believe that Adjusted operating earnings before income taxes provides a meaningful measure of its business and segment performances and enhances the understanding of our financial results by focusing on the operating performance and trends of the underlying business segments and excluding items that tend to be highly variable from period to period based on capital market conditions and/or other factors. We use the same accounting policies and procedures to measure segment Adjusted operating earnings before income taxes as we do for the directly comparable U.S. GAAP measure Income (loss) from continuing operations before income taxes. Adjusted operating earnings before income taxes does not replace Income (loss) from continuing operations before income taxes as the comparable U.S. GAAP measure of our consolidated results of operations. Therefore, we believe that it is useful to evaluate both Income (loss) from continuing operations before income taxes and Adjusted operating earnings before income taxes when reviewing our financial and operating performance. Each segment’s Adjusted operating earnings before income taxes is calculated by adjusting Income (loss) from continuing operations before income taxes for the following items: Net investment gains (losses), net of related amortization of DAC, VOBA, sales inducements and unearned revenue, which are significantly influenced by economic and market conditions, including interest rates and credit spreads, and are not indicative of normal operations. Net investment gains (losses) include gains (losses) on the sale of securities, impairments, changes in the fair value of investments using the FVO unrelated to the implied loan-backed security income recognition for certain mortgage-backed obligations and changes in the fair value of derivative instruments, excluding realized gains (losses) associated with swap settlements and accrued interest; • Net guaranteed benefit hedging gains (losses), which are significantly influenced by economic and market conditions and are not indicative of normal operations, include changes in the fair value of derivatives related to guaranteed benefits, net of related reserve increases (decreases) and net of related amortization of DAC, VOBA and sales inducements, less the estimated cost of these benefits. The estimated cost, which is reflected in operating results, reflects the expected cost of these benefits if markets perform in line with our long-term expectations and includes the cost of hedging. Other derivative and reserve changes related to guaranteed benefits are excluded from operating results, including the impacts related to changes in nonperformance spread; • Income (loss) related to businesses exited through reinsurance or divestment that do not qualify as discontinued operations, which includes gains and (losses) associated with transactions to exit blocks of business (including net investment gains (losses) on securities sold and expenses directly related to these transactions) and residualrun-off activity; these gains and (losses) are often related to infrequent events and do not reflect performance of operating segments. Excluding this activity better reveals trends in our core business, which would be obscured by including the effects of business exited, and more closely aligns Adjusted operating earnings before income taxes with how we manages our segments; • Income (loss) attributable to noncontrolling interest, which represents the interest of shareholders, other than those of Voya Financial, Inc., in the gains and (losses) of consolidated entities, or the attribution of results from consolidated VIEs or VOEs to which we are not economically entitled; • Income (loss) related to early extinguishment of debt, which includes losses incurred as a result of transactions where we repurchase outstanding principal amounts of debt; these losses are excluded from Adjusted operating earnings before income taxes since the outcome of decisions to restructure debt are not indicative of normal operations; • Impairment of goodwill, value of management contract rights and value of customer relationships acquired, which includes losses as a result of impairment analysis; these represent losses related to infrequent events and do not reflect normal, cash-settled expenses; • Immediate recognition of net actuarial gains (losses) related to our pension and other postretirement benefit obligations and gains (losses) from plan amendments and curtailments, which includes actuarial gains and losses as a result of differences between actual and expected experience on pension plan assets or projected benefit obligation during a given period. We immediately recognize actuarial gains and (losses) related to pension and other postretirement benefit obligations and gains and losses from plan adjustments and curtailments. These amounts do not reflect normal, cash-settled expenses and are not indicative of current Operating expense fundamentals; and • Other items not indicative of normal operations or performance of our segments or may be related to infrequent events including capital or organizational restructurings including certain costs related to debt and equity offerings as well as stock and/or cash based deal contingent awards; expenses associated with the rebranding of Voya Financial, Inc.; severance and other third-party expenses associated with the 2016 Restructuring. These items vary widely in timing, scope and frequency between periods as well as between companies to which we are compared. Accordingly, we adjust for these items as we believe that these items distort the ability to make a meaningful evaluation of the current and future performance of our segments. Additionally, with respect to restructuring, these costs represent changes in operations rather than investments in the future capabilities of our operating businesses.
|
|
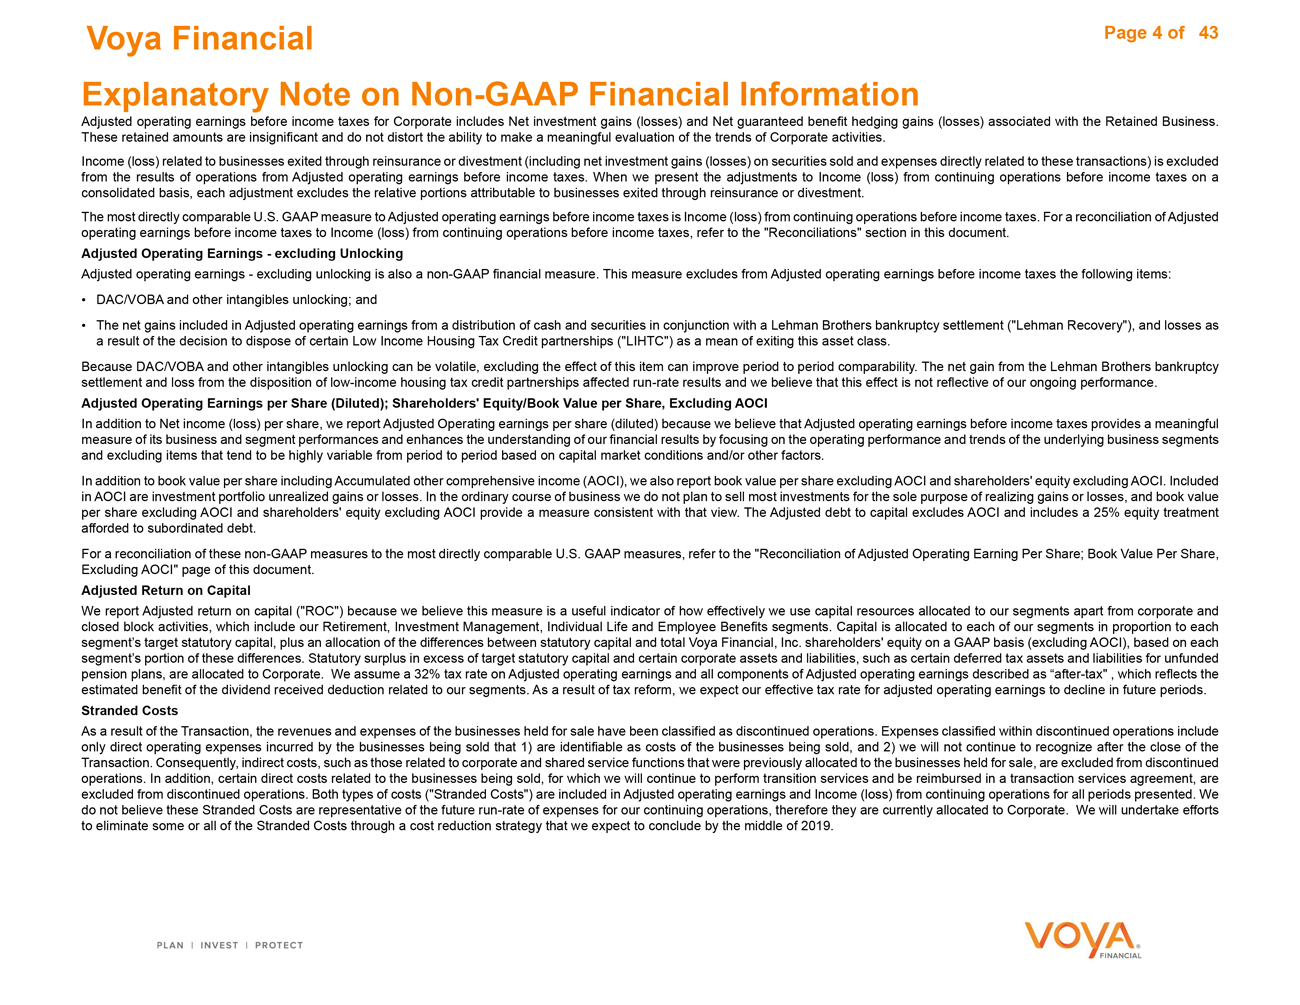
Voya Financial Page 4 of 43 Explanatory Note onNon-GAAP Financial Information Adjusted operating earnings before income taxes for Corporate includes Net investment gains (losses) and Net guaranteed benefit hedging gains (losses) associated with the Retained Business. These retained amounts are insignificant and do not distort the ability to make a meaningful evaluation of the trends of Corporate activities. Income (loss) related to businesses exited through reinsurance or divestment (including net investment gains (losses) on securities sold and expenses directly related to these transactions) is excluded from the results of operations from Adjusted operating earnings before income taxes. When we present the adjustments to Income (loss) from continuing operations before income taxes on a consolidated basis, each adjustment excludes the relative portions attributable to businesses exited through reinsurance or divestment. The most directly comparable U.S. GAAP measure to Adjusted operating earnings before income taxes is Income (loss) from continuing operations before income taxes. For a reconciliation of Adjusted operating earnings before income taxes to Income (loss) from continuing operations before income taxes, refer to the “Reconciliations” section in this document. Adjusted Operating Earnings - excluding Unlocking Adjusted operating earnings - excluding unlocking is also anon-GAAP financial measure. This measure excludes from Adjusted operating earnings before income taxes the following items: • DAC/VOBA and other intangibles unlocking; and • The net gains included in Adjusted operating earnings from a distribution of cash and securities in conjunction with a Lehman Brothers bankruptcy settlement (“Lehman Recovery”), and losses as a result of the decision to dispose of certain Low Income Housing Tax Credit partnerships (“LIHTC”) as a mean of exiting this asset class. Because DAC/VOBA and other intangibles unlocking can be volatile, excluding the effect of this item can improve period to period comparability. The net gain from the Lehman Brothers bankruptcy settlement and loss from the disposition oflow-income housing tax credit partnerships affectedrun-rate results and we believe that this effect is not reflective of our ongoing performance. Adjusted Operating Earnings per Share (Diluted); Shareholders’ Equity/Book Value per Share, Excluding AOCI In addition to Net income (loss) per share, we report Adjusted Operating earnings per share (diluted) because we believe that Adjusted operating earnings before income taxes provides a meaningful measure of its business and segment performances and enhances the understanding of our financial results by focusing on the operating performance and trends of the underlying business segments and excluding items that tend to be highly variable from period to period based on capital market conditions and/or other factors. In addition to book value per share including Accumulated other comprehensive income (AOCI), we also report book value per share excluding AOCI and shareholders’ equity excluding AOCI. Included in AOCI are investment portfolio unrealized gains or losses. In the ordinary course of business we do not plan to sell most investments for the sole purpose of realizing gains or losses, and book value per share excluding AOCI and shareholders’ equity excluding AOCI provide a measure consistent with that view. The Adjusted debt to capital excludes AOCI and includes a 25% equity treatment afforded to subordinated debt. For a reconciliation of thesenon-GAAP measures to the most directly comparable U.S. GAAP measures, refer to the “Reconciliation of Adjusted Operating Earning Per Share; Book Value Per Share, Excluding AOCI” page of this document. Adjusted Return on Capital
We report Adjusted return on capital (“ROC”) because we believe this measure is a useful indicator of how effectively we use capital resources allocated to our segments apart from corporate and closed block activities, which include our Retirement, Investment Management, Individual Life and Employee Benefits segments. Capital is allocated to each of our segments in proportion to each segment’s target statutory capital, plus an allocation of the differences between statutory capital and total Voya Financial, Inc. shareholders’ equity on a GAAP basis (excluding AOCI), based on each segment’s portion of these differences. Statutory surplus in excess of target statutory capital and certain corporate assets and liabilities, such as certain deferred tax assets and liabilities for unfunded pension plans, are allocated to Corporate. We assume a 32% tax rate on Adjusted operating earnings and all components of Adjusted operating earnings described as“after-tax” , which reflects the estimated benefit of the dividend received deduction related to our segments. As a result of tax reform, we expect our effective tax rate for adjusted operating earnings to decline in future periods. Stranded Costs As a result of the Transaction, the revenues and expenses of the businesses held for sale have been classified as discontinued operations. Expenses classified within discontinued operations include only direct operating expenses incurred by the businesses being sold that 1) are identifiable as costs of the businesses being sold, and 2) we will not continue to recognize after the close of the Transaction. Consequently, indirect costs, such as those related to corporate and shared service functions that were previously allocated to the businesses held for sale, are excluded from discontinued operations. In addition, certain direct costs related to the businesses being sold, for which we will continue to perform transition services and be reimbursed in a transaction services agreement, are excluded from discontinued operations. Both types of costs (“Stranded Costs”) are included in Adjusted operating earnings and Income (loss) from continuing operations for all periods presented. We do not believe these Stranded Costs are representative of the futurerun-rate of expenses for our continuing operations, therefore they are currently allocated to Corporate. We will undertake efforts to eliminate some or all of the Stranded Costs through a cost reduction strategy that we expect to conclude by the middle of 2019. Explanatory Note onNon-GAAP Financial Information
Adjusted Operating Revenues
|
|
Voya Financial Page 5 of 43 Adjusted operating revenues is a measure of our segment revenues and anon-GAAP financial measure. Each segment’s Adjusted operating revenues are calculated by adjusting Total revenues for the following items: Net realized investment gains (losses) and related charges and adjustments, which are significantly influenced by economic and market conditions, including interest rates and credit spreads and are not indicative of normal operations. Net investment gains (losses) include gains (losses) on the sale of securities, impairments, changes in the fair value of investments using the FVO unrelated to the implied loan-backed security income recognition for certain mortgage-backed obligations and changes in the fair value of derivative instruments, excluding realized gains (losses) associated with swap settlements and accrued interest. These are net of related amortization of unearned revenue; Gain (loss) on change in fair value of derivatives related to guaranteed benefits, which is significantly influenced by economic and market conditions and not indicative of normal operations, includes changes in the fair value of derivatives related to guaranteed benefits, less the estimated cost of these benefits. The estimated cost, which is reflected in operating results, reflects the expected cost of these benefits if markets perform in line with our long-term expectations and includes the cost of hedging. Other derivative and reserve changes related to guaranteed benefits are excluded from operating revenues, including the impacts related to changes in nonperformance spread; Revenues related to businesses exited through reinsurance or divestment that do not qualify as discontinued operations, which includes revenues associated with transactions to exit blocks of business (including net investment gains (losses) on securities sold related to these transactions) and residualrun-off activity; these gains and (losses) are often related to infrequent events and do not reflect performance of operating segments. Excluding this activity better reveals trends in our core business, which would be obscured by including the effects of business exited, and more closely aligns Operating revenues with how we manages our segments; Revenues attributable to noncontrolling interest, which represents the interests of shareholders, other than those of Voya Financial, Inc., in consolidated entities. Revenues attributable to noncontrolling interest represents such shareholders’ interests in the gains and losses of those entities, or the attribution of results from consolidated VIEs or VOEs to which we are not economically entitled; and Other adjustments to total revenues primarily reflect fee income earned by our broker-dealers for sales ofnon-proprietary products, which are reflected net of commission expense in our segments’ operating revenues, other items where the income is passed on to third parties and the elimination of intercompany investment expenses included in operating revenues. Adjusted operating revenues for Corporate includes Net investment gains (losses) and Gains (losses) on change in fair value of derivatives related to guaranteed benefits associated with the Retained Business. These retained amounts are insignificant and do not distort the ability to make a meaningful evaluation of the trends of Corporate activities. The most directly comparable U.S. GAAP measure to Adjusted operating revenues is Total revenues. For a reconciliation of Adjusted operating revenues to Total revenues, refer to the “Reconciliations” section in this document. Sources of Earnings We analyze our segment performance based on the sources of earnings. We believe this supplemental information is useful in order to gain a better understanding of our Adjusted operating earnings before income taxes for the following reasons: (1) we analyze our business using this information and (2) this presentation can be helpful for investors to understand the main drivers of Adjusted operating earnings (loss) before income taxes. The sources of earnings are defined as such: Investment spread and other investment income consists of net investment income and net realized investment gains (losses) associated with swap settlements and accrued interest, less interest credited to policyholder reserves. Fee based margin consists primarily of fees earned on assets under management (“AUM”), assets under administration (“AUA”), and transaction based recordkeeping fees. Net underwriting gain (loss) and other revenue contains the following: the difference between fees charged for insurance risks and incurred benefits, including mortality, morbidity, and surrender results, contractual charges for universal life and annuity contracts, the change in the unearned revenue reserve for universal life contracts, and that portion of traditional life insurance premiums intended to cover expenses and profits. Certain contract charges for universal life insurance are not recognized in income immediately, but are deferred as unearned revenues and are amortized into income in a manner similar to the amortization of DAC. Administrative expenses are general expenses, net of amounts capitalized as acquisition expenses and exclude commission expenses and fees on letters of credit. Trail commissions are commissions paid that are not deferred and thus recorded directly to expense. For a detail explanation of DAC/VOBA and other intangibles amortization/unlocking see “Unlocking of DAC/VOBA and other Contract Owner/Policyholder Intangibles” in our SEC filings. Other Information Financial information, unless otherwise noted, is rounded to millions, therefore may not sum to its corresponding total.
|
|
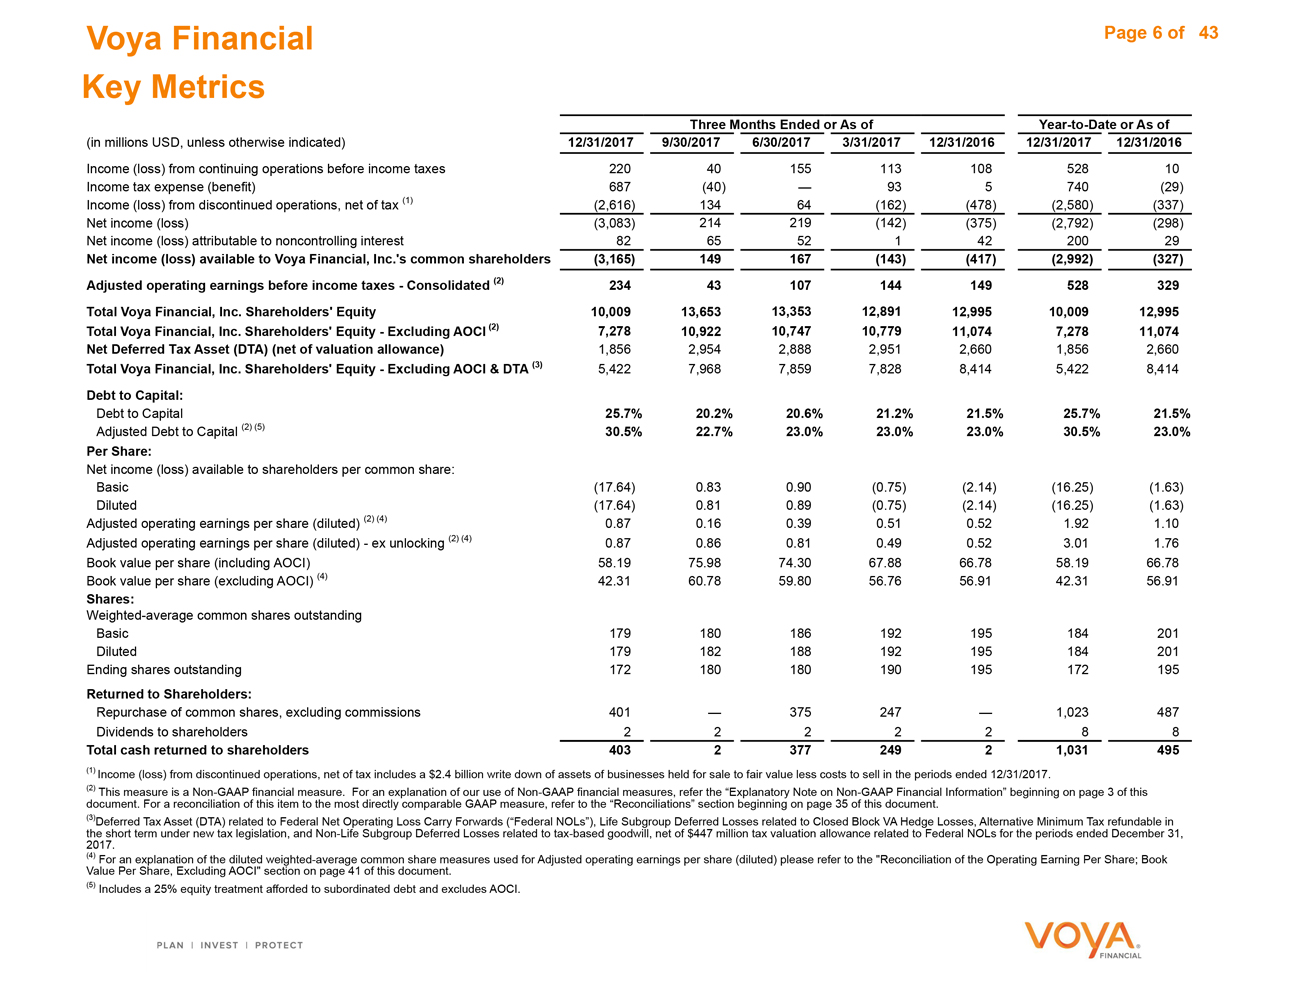
Voya Financial Page 6 of 43 Key Metrics Three Months Ended or As of Year-to-Date or As of (in millions USD, unless otherwise indicated) 12/31/2017 9/30/2017 6/30/2017 3/31/2017 12/31/2016 12/31/2017 12/31/2016 Income (loss) from continuing operations before income taxes 220 4015511310852810 Income tax expense (benefit) 687 (40)—935740(29) Income (loss) from discontinued operations, net of tax (1) (2,616) 13464(162)(478)(2,580)(337) Net income (loss) (3,083) 214219(142)(375)(2,792)(298) Net income (loss) attributable to noncontrolling interest 82 655214220029 Net income (loss) available to Voya Financial, Inc.’s common shareholders (3,165) 149 167 (143) (417) (2,992) (327) Adjusted operating earnings before income taxes - Consolidated (2) 234 43 107 144 149 528 329 Total Voya Financial, Inc. Shareholders’ Equity 10,009 13,653 13,353 12,891 12,995 10,009 12,995 Total Voya Financial, Inc. Shareholders’ Equity - Excluding AOCI (2) 7,278 10,922 10,747 10,779 11,074 7,278 11,074 Net Deferred Tax Asset (DTA) (net of valuation allowance) 1,856 2,9542,8882,9512,6601,8562,660 Total Voya Financial, Inc. Shareholders’ Equity - Excluding AOCI & DTA (3) 5,422 7,9687,8597,8288,4145,4228,414 Debt to Capital: Debt to Capital 25.7% 20.2% 20.6% 21.2% 21.5% 25.7% 21.5% Adjusted Debt to Capital (2) (5) 30.5% 22.7% 23.0% 23.0% 23.0% 30.5% 23.0% Per Share: Net income (loss) available to shareholders per common share: Basic (17.64) 0.830.90(0.75)(2.14)(16.25)(1.63) Diluted (17.64) 0.810.89(0.75)(2.14)(16.25)(1.63) Adjusted operating earnings per share (diluted) (2) (4) 0.87 0.160.390.510.521.921.10 Adjusted operating earnings per share (diluted) - ex unlocking (2) (4) 0.87 0.860.810.490.523.011.76 Book value per share (including AOCI) 58.19 75.9874.3067.8866.7858.1966.78 Book value per share (excluding AOCI) (4) 42.31 60.7859.8056.7656.9142.3156.91 Shares: Weighted-average common shares outstanding Basic 179 180186192195184201 Diluted 179 182188192195184201 Ending shares outstanding 172 180180190195172195 Returned to Shareholders: Repurchase of common shares, excluding commissions 401 375 2471,023 487 Dividends to shareholders 2 222288 Total cash returned to shareholders 403 2 377 249 2 1,031 495 (1) Income (loss) from discontinued operations, net of tax includes a $2.4 billion write down of assets of businesses held for sale to fair value less costs to sell in the periods ended 12/31/2017. (2) This measure is a Non-GAAP financial measure. For an explanation of our use of Non-GAAP financial measures, refer the “Explanatory Note on Non-GAAP Financial Information” beginning on page 3 of this document. For a reconciliation of this item to the most directly comparable GAAP measure, refer to the “Reconciliations” section beginning on page 35 of this document. (3) Deferred Tax Asset (DTA) related to Federal Net Operating Loss Carry Forwards (“Federal NOLs”), Life Subgroup Deferred Losses related to Closed Block VA Hedge Losses, Alternative Minimum Tax refundable in the short term under new tax legislation, and Non-Life Subgroup Deferred Losses related to tax-based goodwill, net of $447 million tax valuation allowance related to Federal NOLs for the periods ended December 31, 2017. (4) For an explanation of the diluted weighted-average common share measures used for Adjusted operating earnings per share (diluted) please refer to the “Reconciliation of the Operating Earning Per Share; Book Value Per Share, Excluding AOCI” section on page 41 of this document. (5) Includes a 25% equity treatment afforded to subordinated debt and excludes AOCI.
|
|
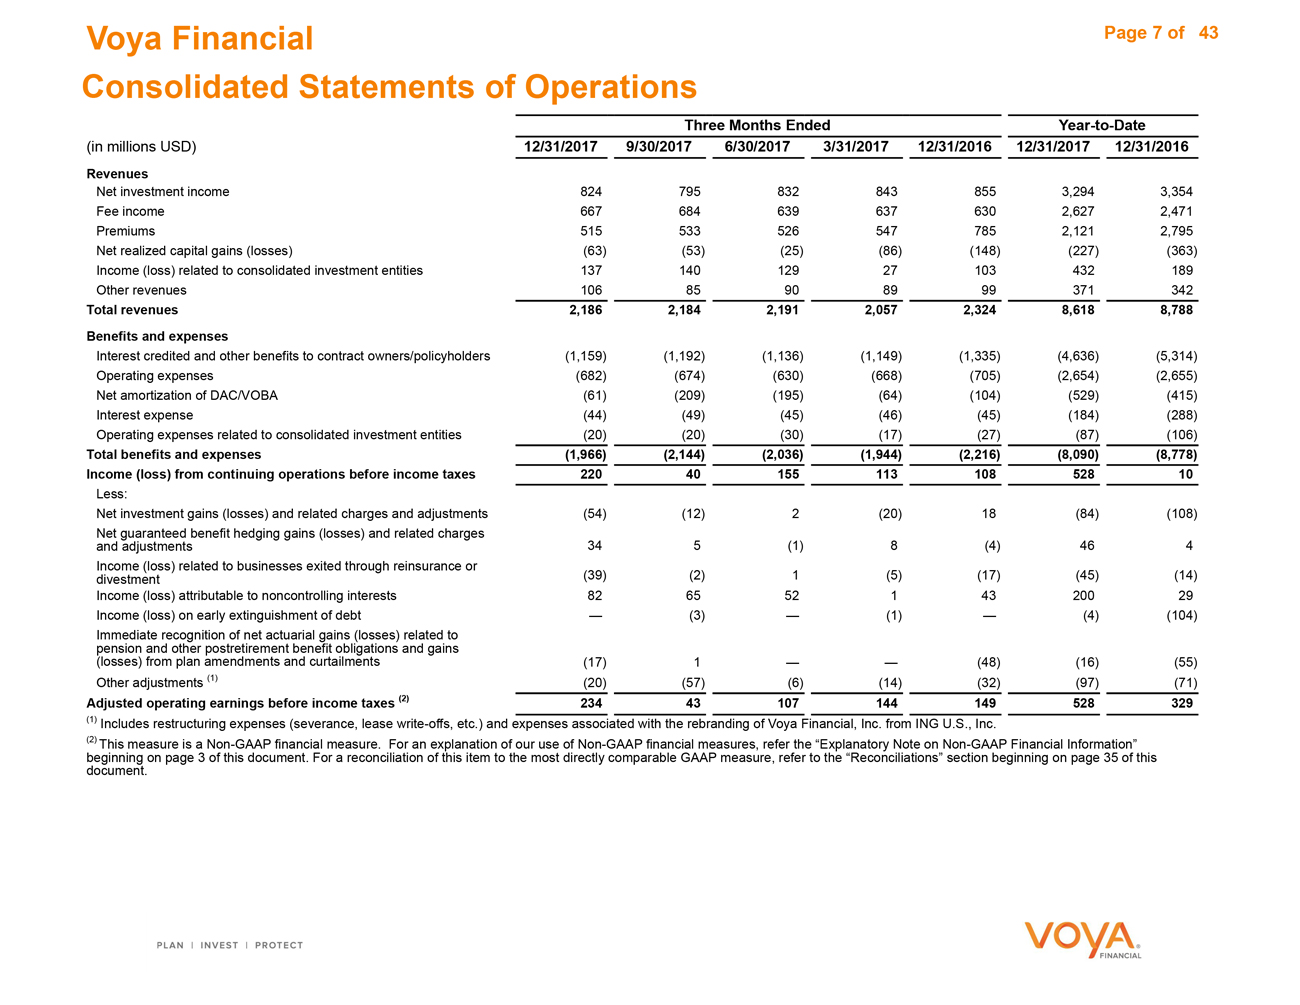
Voya Financial Page 7 of 43 Consolidated Statements of Operations Three Months Ended Year-to-Date (in millions USD) 12/31/2017 9/30/2017 6/30/2017 3/31/2017 12/31/2016 12/31/2017 12/31/2016 Revenues Net investment income 824 795 832 843 855 3,294 3,354 Fee income 667 684 639 637 630 2,627 2,471 Premiums 515 533 526 547 785 2,121 2,795 Net realized capital gains (losses) (63) (53) (25) (86) (148) (227) (363) Income (loss) related to consolidated investment entities 137 140 129 27 103 432 189 Other revenues 106 85 90 89 99 371 342 Total revenues 2,186 2,184 2,191 2,057 2,324 8,618 8,788 Benefits and expenses Interest credited and other benefits to contract owners/policyholders (1,159) (1,192) (1,136) (1,149) (1,335) (4,636) (5,314) Operating expenses (682) (674) (630) (668) (705) (2,654) (2,655) Net amortization of DAC/VOBA (61) (209) (195) (64) (104) (529) (415) Interest expense (44) (49) (45) (46) (45) (184) (288) Operating expenses related to consolidated investment entities (20) (20) (30) (17) (27) (87) (106) Total benefits and expenses (1,966) (2,144) (2,036) (1,944) (2,216) (8,090) (8,778) Income (loss) from continuing operations before income taxes 220 40 155 113 108 528 10 Less: Net investment gains (losses) and related charges and adjustments (54) (12) 2 (20) 18 (84) (108) Net guaranteed benefit hedging gains (losses) and related charges and adjustments 34 5 (1) 8 (4) 46 4 Income (loss) related to businesses exited through reinsurance or divestment (39) (2) 1 (5) (17) (45) (14) Income (loss) attributable to noncontrolling interests 82 65 52 1 43 200 29 Income (loss) on early extinguishment of debt — (3) — (1) — (4) (104) Immediate recognition of net actuarial gains (losses) related to pension and other postretirement benefit obligations and gains (losses) from plan amendments and curtailments (17) 1 (48) (16) (55) Other adjustments (1) (20) (57) (6) (14) (32) (97) (71) Adjusted operating earnings before income taxes (2) 234 43 107 144 149 528 329 Includes restructuring expenses (severance, lease write-offs, etc.) and expenses associated with the rebranding of Voya Financial, Inc. from ING U.S., Inc. This measure is a Non-GAAP financial measure. For an explanation of our use of Non-GAAP financial measures, refer the “Explanatory Note on Non-GAAP Financial Information” beginning on page 3 of this document. For a reconciliation of this item to the most directly comparable GAAP measure, refer to the “Reconciliations” section beginning on page 35 of this document.
|
|
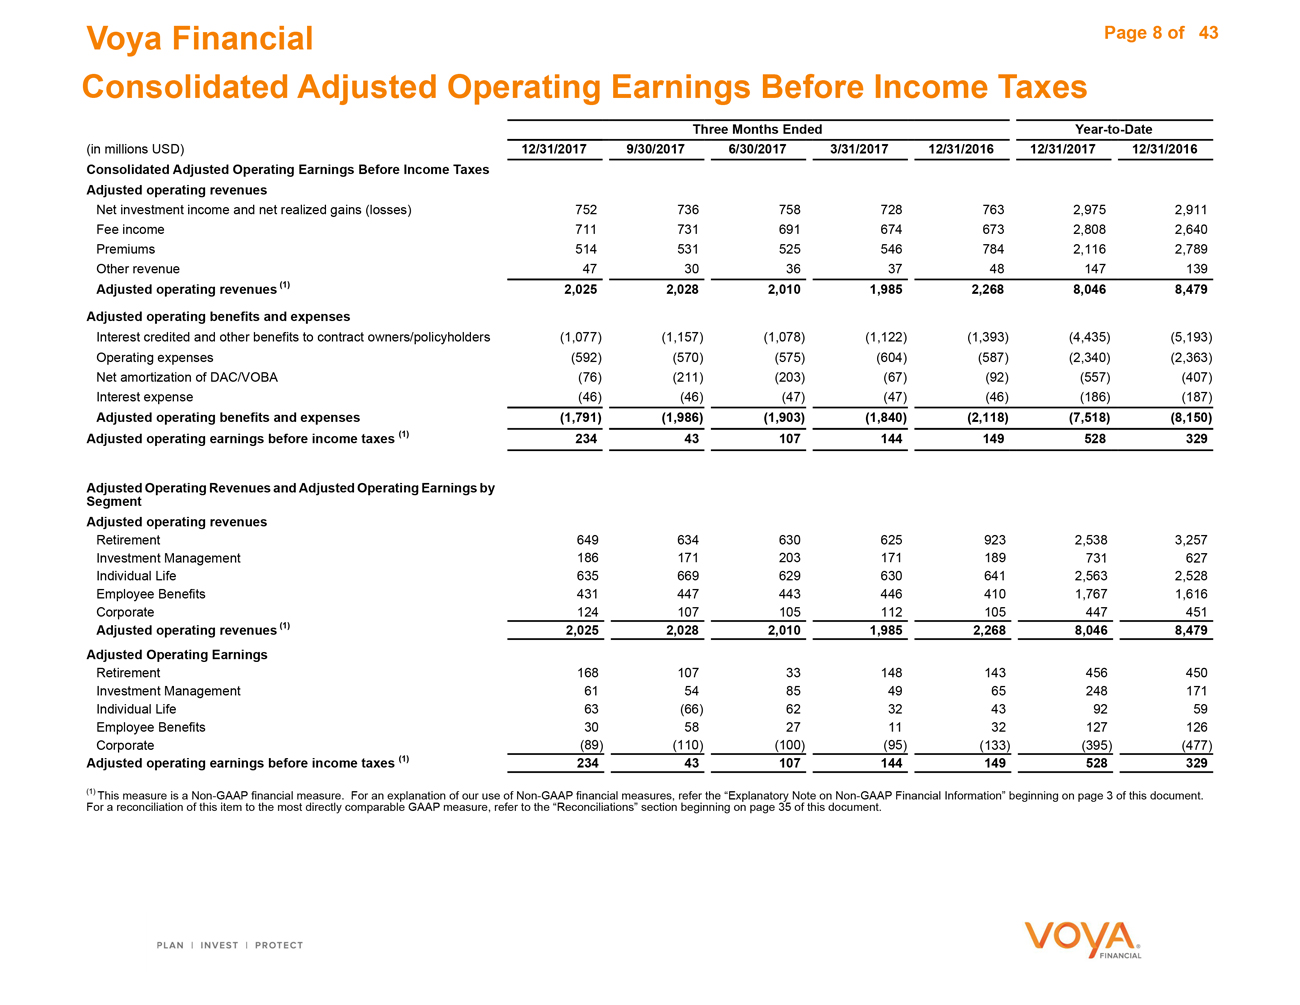
Voya Financial Page 8 of 43 Consolidated Adjusted Operating Earnings Before Income Taxes Three Months Ended Year-to-Date (in millions USD) 12/31/2017 9/30/2017 6/30/2017 3/31/2017 12/31/2016 12/31/2017 12/31/2016 Consolidated Adjusted Operating Earnings Before Income Taxes Adjusted operating revenues Net investment income and net realized gains (losses) 752 7367587287632,9752,911 Fee income 711 7316916746732,8082,640 Premiums 514 5315255467842,1162,789 Other revenue 47 30363748147139 Adjusted operating revenues (1) 2,025 2,028 2,010 1,985 2,268 8,046 8,479 Adjusted operating benefits and expenses Interest credited and other benefits to contract owners/policyholders (1,077) (1,157)(1,078)(1,122)(1,393)(4,435)(5,193) Operating expenses (592) (570)(575)(604)(587)(2,340)(2,363) Net amortization of DAC/VOBA (76) (211)(203)(67)(92)(557)(407) Interest expense (46) (46)(47)(47)(46)(186)(187) Adjusted operating benefits and expenses (1,791) (1,986) (1,903) (1,840) (2,118) (7,518) (8,150) Adjusted operating earnings before income taxes (1) 234 43 107 144 149 528 329 Adjusted Operating Revenues and Adjusted Operating Earnings by Segment Adjusted operating revenues Retirement 649 6346306259232,5383,257 Investment Management 186 171203171189731627 Individual Life 635 6696296306412,5632,528 Employee Benefits 431 4474434464101,7671,616 Corporate 124 107105112105447451 Adjusted operating revenues (1) 2,025 2,028 2,010 1,985 2,268 8,046 8,479 Adjusted Operating Earnings Retirement 168 10733148143456450 Investment Management 61 54854965248171 Individual Life 63 (66)6232439259 Employee Benefits 30 58271132127126 Corporate (89) (110)(100)(95)(133)(395)(477) Adjusted operating earnings before income taxes (1) 234 43 107 144 149 528 329 (1) This measure is a Non-GAAP financial measure. For an explanation of our use of Non-GAAP financial measures, refer the “Explanatory Note on Non-GAAP Financial Information” beginning on page 3 of this document. For a reconciliation of this item to the most directly comparable GAAP measure, refer to the “Reconciliations” section beginning on page 35 of this document.
|
|
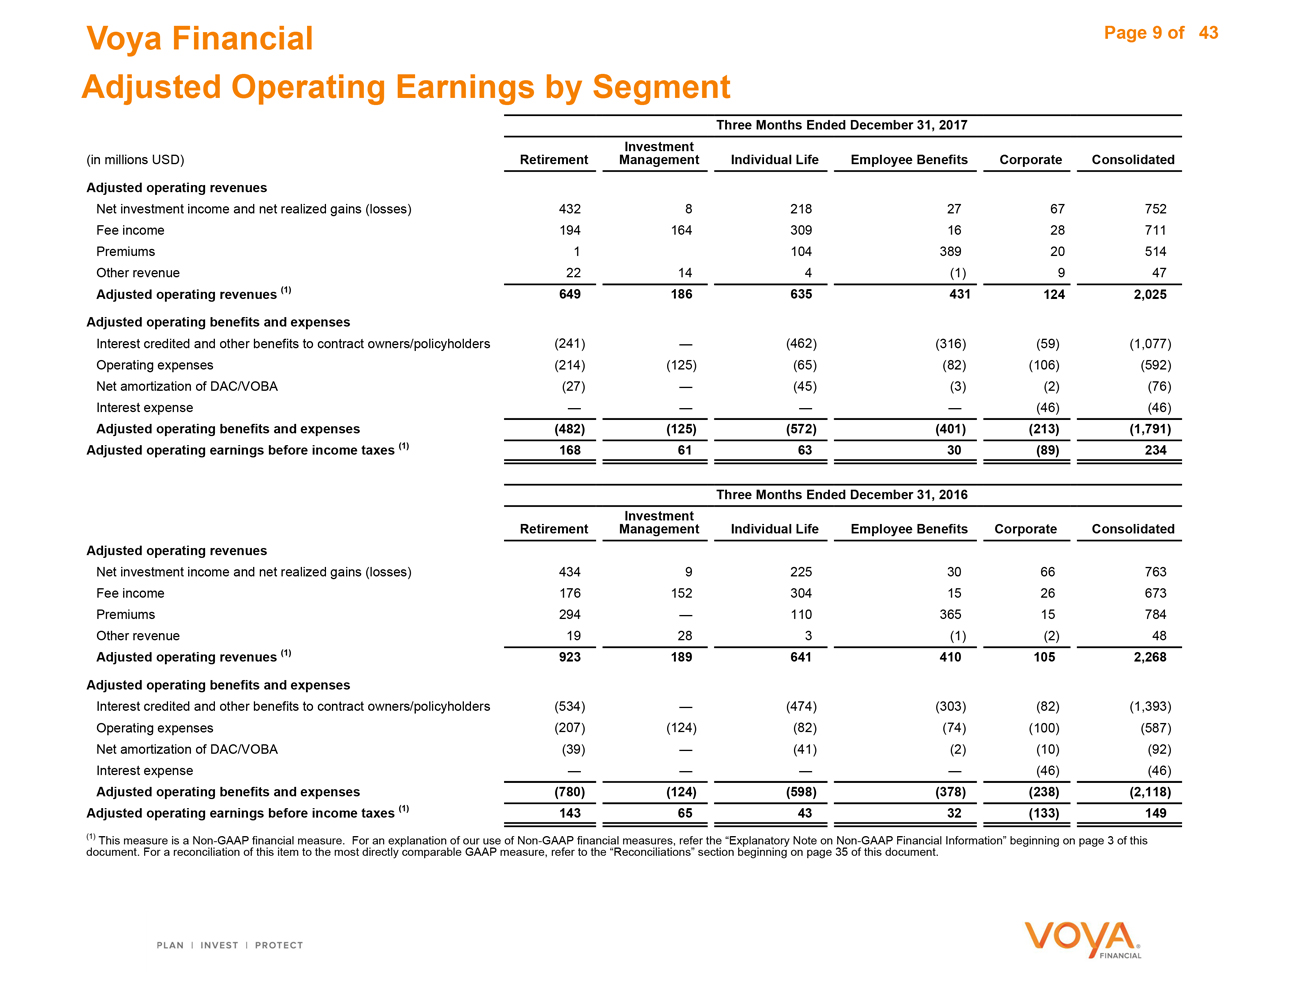
Voya Financial Page 9 of 43 Adjusted Operating Earnings by Segment Three Months Ended December 31, 2017 Investment (in millions USD) Retirement Management Individual Life Employee Benefits Corporate Consolidated Adjusted operating revenues Net investment income and net realized gains (losses) 432 82182767752 Fee income 194 1643091628711 Premiums 1 104 38920514 Other revenue 22 144(1)947 Adjusted operating revenues (1) 649 186 635 431 124 2,025 Adjusted operating benefits and expenses Interest credited and other benefits to contract owners/policyholders (241) (462)(316)(59)(1,077) Operating expenses (214) (125)(65)(82)(106)(592) Net amortization of DAC/VOBA (27) (45)(3)(2)(76) Interest expense (46)(46) Adjusted operating benefits and expenses (482) (125) (572) (401) (213) (1,791) Adjusted operating earnings before income taxes (1) 168 61 63 30 (89) 234 Three Months Ended December 31, 2016 Retirement Investment Management Individual Life Employee Benefits Corporate Consolidated Adjusted operating revenues Net investment income and net realized gains (losses) 434 92253066763 Fee income 176 1523041526673 Premiums 294 11036515784 Other revenue 19 283(1)(2)48 Adjusted operating revenues (1) 923 189 641 410 105 2,268 Adjusted operating benefits and expenses Interest credited and other benefits to contract owners/policyholders (534) (474)(303)(82)(1,393) Operating expenses (207) (124)(82)(74)(100)(587) Net amortization of DAC/VOBA (39) (41)(2)(10)(92) Interest expense (46)(46) Adjusted operating benefits and expenses (780) (124) (598) (378) (238) (2,118) Adjusted operating earnings before income taxes (1) 143 65 43 32 (133) 149 (1) This measure is a Non-GAAP financial measure. For an explanation of our use of Non-GAAP financial measures, refer the “Explanatory Note on Non-GAAP Financial Information” beginning on page 3 of this document. For a reconciliation of this item to the most directly comparable GAAP measure, refer to the “Reconciliations” section beginning on page 35 of this document.
|

|
Voya Financial Page 10 of 43 Adjusted Operating Earnings by Segment Twelve Months Ended December 31, 2017 (in millions USD) Retirement Investment Management Individual Life Employee Benefits Corporate Consolidated Adjusted operating revenues Net investment income and net realized gains (losses) 1,703 578601092462,975 Fee income 744 6321,259631102,808 Premiums 6 4281,600822,116 Other revenue 85 4216(5)9147 Adjusted operating revenues (1) 2,538 731 2,563 1,767 447 8,046 Adjusted operating benefits and expenses Interest credited and other benefits to contract owners/policyholders (958) (1,935)(1,293)(249)(4,435) Operating expenses (850) (483)(275)(336)(396)(2,340) Net amortization of DAC/VOBA (274) (261)(11)(11)(557) Interest expense (186)(186) Adjusted operating benefits and expenses (2,082) (483) (2,471) (1,640) (842) (7,518) Adjusted operating earnings before income taxes (1) 456 24892127(395)528 Twelve Months Ended December 31, 2016 Retirement Investment Management Individual Life Employee Benefits Corporate Consolidated Adjusted operating revenues Net investment income and net realized gains (losses) 1,674 (8)8571112772,911 Fee income 687 5821,209621002,640 Premiums 824 4461,447722,789 Other revenue 72 5316(4)2139 Adjusted operating revenues (1) 3,257 627 2,528 1,616 451 8,479 Adjusted operating benefits and expenses Interest credited and other benefits to contract owners/policyholders (1,744) (1,973)(1,169)(307)(5,193) Operating expenses (854) (456)(330)(306)(417)(2,363) Net amortization of DAC/VOBA (209) (166)(15)(17)(407) Interest expense (187)(187) Adjusted operating benefits and expenses (2,807) (456) (2,469) (1,490) (928) (8,150) Adjusted operating earnings before income taxes (1) 450 171 59 126 (477) 329 (1) This measure is a Non-GAAP financial measure. For an explanation of our use of Non-GAAP financial measures, refer the “Explanatory Note on Non-GAAP Financial Information” beginning on page 3 of this document. For a reconciliation of this item to the most directly comparable GAAP measure, refer to the “Reconciliations” section beginning on page 38 of this document.
|
|
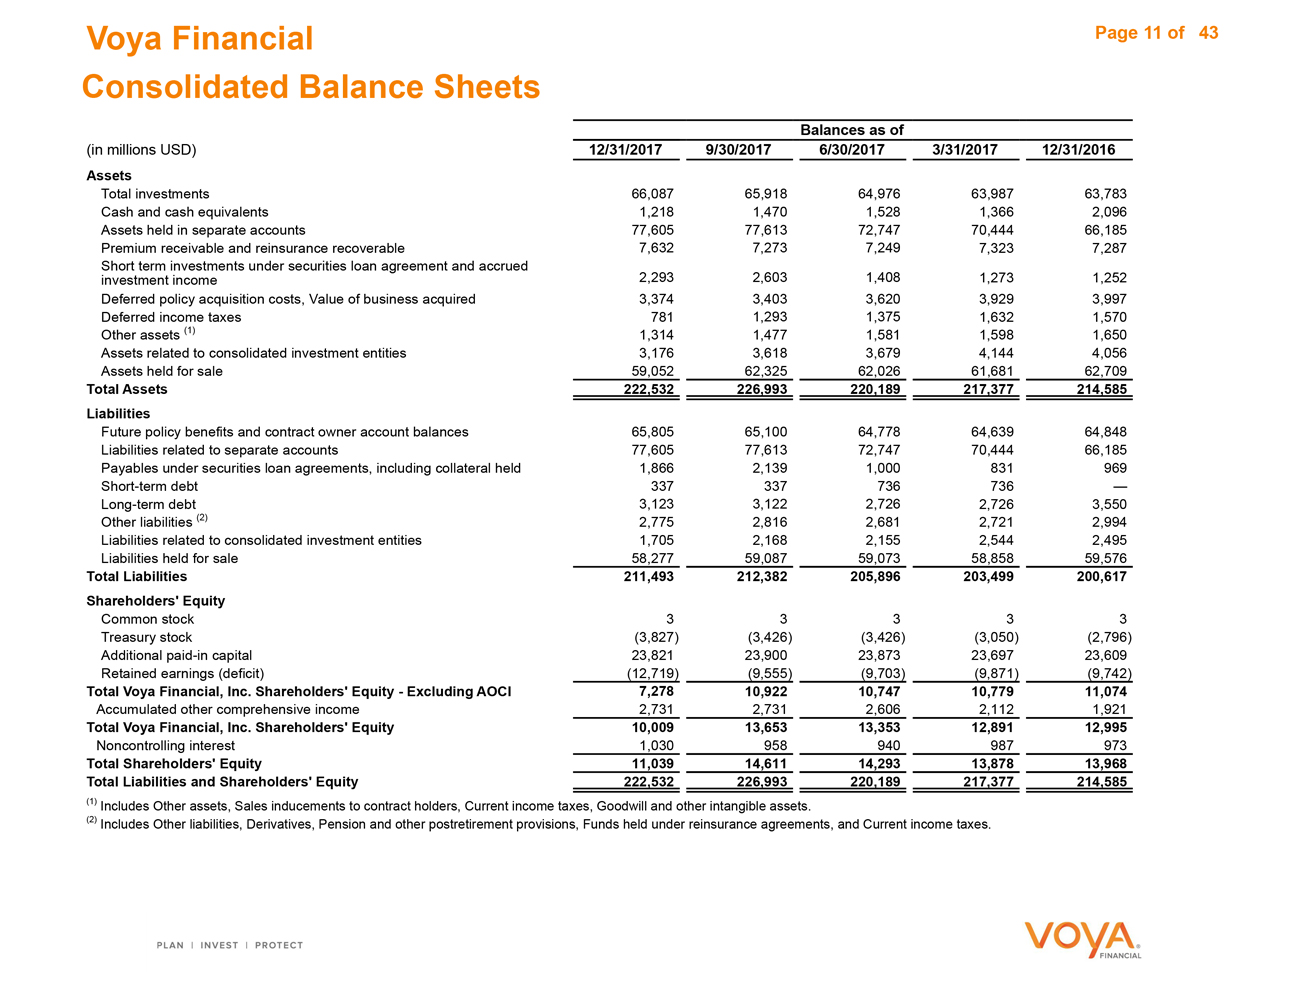
Voya Financial Page 11 of 43 Consolidated Balance Sheets (in millions USD) Balances as of 12/31/2017 9/30/2017 6/30/2017 3/31/2017 12/31/2016 Assets Total investments 66,087 65,91864,97663,98763,783 Cash and cash equivalents 1,218 1,4701,5281,3662,096 Assets held in separate accounts 77,605 77,61372,74770,44466,185 Premium receivable and reinsurance recoverable 7,632 7,2737,2497,3237,287 Short term investments under securities loan agreement and accrued investment income 2,293 2,6031,4081,2731,252 Deferred policy acquisition costs, Value of business acquired 3,374 3,4033,6203,9293,997 Deferred income taxes 781 1,2931,3751,6321,570 Other assets (1) 1,314 1,4771,5811,5981,650 Assets related to consolidated investment entities 3,176 3,6183,6794,1444,056 Assets held for sale 59,052 62,32562,02661,68162,709 Total Assets 222,532 226,993 220,189 217,377 214,585 Liabilities Future policy benefits and contract owner account balances 65,805 65,10064,77864,63964,848 Liabilities related to separate accounts 77,605 77,61372,74770,44466,185 Payables under securities loan agreements, including collateral held 1,866 2,1391,000831969 Short-term debt 337 337736736— Long-term debt 3,123 3,1222,7262,7263,550 Other liabilities (2) 2,775 2,8162,6812,7212,994 Liabilities related to consolidated investment entities 1,705 2,1682,1552,5442,495 Liabilities held for sale 58,277 59,08759,07358,85859,576 Total Liabilities 211,493 212,382 205,896 203,499 200,617 Shareholders’ Equity Common stock 3 3333 Treasury stock (3,827) (3,426)(3,426)(3,050)(2,796) Additional paid-in capital 23,821 23,90023,87323,69723,609 Retained earnings (deficit) (12,719) (9,555)(9,703)(9,871)(9,742) Total Voya Financial, Inc. Shareholders’ Equity - Excluding AOCI 7,278 10,922 10,747 10,779 11,074 Accumulated other comprehensive income 2,731 2,7312,6062,1121,921 Total Voya Financial, Inc. Shareholders’ Equity 10,009 13,653 13,353 12,891 12,995 Noncontrolling interest 1,030 958940987973 Total Shareholders’ Equity 11,039 14,611 14,293 13,878 13,968 Total Liabilities and Shareholders’ Equity 222,532 226,993 220,189 217,377 214,585 (1) Includes Other assets, Sales inducements to contract holders, Current income taxes, Goodwill and other intangible assets. (2) Includes Other liabilities, Derivatives, Pension and other postretirement provisions, Funds held under reinsurance agreements, and Current income taxes.
|
|
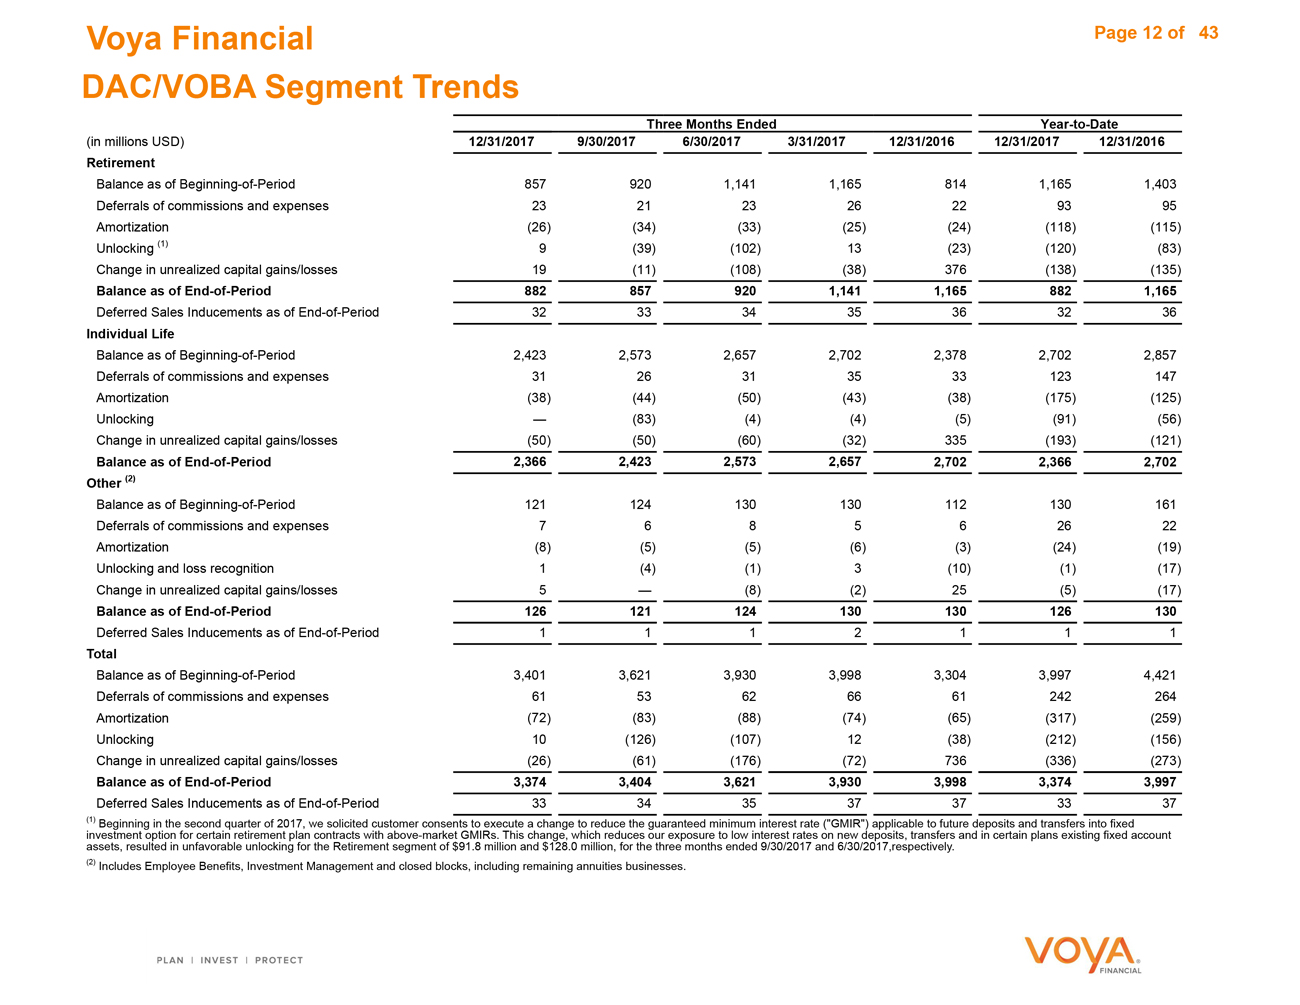
Voya Financial Page 12 of 43 DAC/VOBA Segment Trends Three Months EndedYear-to-Date (in millions USD) 12/31/2017 9/30/2017 6/30/2017 3/31/2017 12/31/2016 12/31/2017 12/31/2016 Retirement Balance as ofBeginning-of-Period 857 920 1,141 1,165 814 1,165 1,403 Deferrals of commissions and expenses 23 21 23 26 22 93 95 Amortization (26) (34) (33) (25) (24) (118) (115) Unlocking (1) 9 (39) (102) 13 (23) (120) (83) Change in unrealized capital gains/losses 19 (11) (108) (38) 376 (138) (135) Balance as ofEnd-of-Period 882 857 920 1,141 1,165 882 1,165 Deferred Sales Inducements as ofEnd-of-Period 32 33 34 35 36 32 36 Individual Life Balance as ofBeginning-of-Period 2,423 2,573 2,657 2,702 2,378 2,702 2,857 Deferrals of commissions and expenses 31 26 31 35 33 123 147 Amortization (38) (44) (50) (43) (38) (175) (125) Unlocking — (83) (4) (4) (5) (91) (56) Change in unrealized capital gains/losses (50) (50) (60) (32) 335 (193) (121) Balance as ofEnd-of-Period 2,366 2,423 2,573 2,657 2,702 2,366 2,702 Other (2) Balance as ofBeginning-of-Period 121 124 130 130 112 130 161 Deferrals of commissions and expenses 7 6 8 5 6 26 22 Amortization (8) (5) (5) (6) (3) (24) (19) Unlocking and loss recognition 1 (4) (1) 3 (10) (1) (17) Change in unrealized capital gains/losses 5 — (8) (2) 25 (5) (17) Balance as ofEnd-of-Period 126 121 124 130 130 126 130 Deferred Sales Inducements as ofEnd-of-Period 1 1 1 2 1 1 1 Total Balance as ofBeginning-of-Period 3,401 3,621 3,930 3,998 3,304 3,997 4,421 Deferrals of commissions and expenses 61 53 62 66 61 242 264 Amortization (72) (83) (88) (74) (65) (317) (259) Unlocking 10 (126) (107) 12 (38) (212) (156) Change in unrealized capital gains/losses (26) (61) (176) (72) 736 (336) (273) Balance as ofEnd-of-Period 3,374 3,404 3,621 3,930 3,998 3,374 3,997 Deferred Sales Inducements as ofEnd-of-Period 33 34 35 37 37 33 37 (1) Beginning in the second quarter of 2017, we solicited customer consents to execute a change to reduce the guaranteed minimum interest rate (“GMIR”) applicable to future deposits and transfers into fixed investment option for certain retirement plan contracts with above-market GMIRs. This change, which reduces our exposure to low interest rates on new deposits, transfers and in certain plans existing fixed account assets, resulted in unfavorable unlocking for the Retirement segment of $91.8 million and $128.0 million, for the three months ended 9/30/2017 and 6/30/2017,respectively. (2) Includes Employee Benefits, Investment Management and closed blocks, including remaining annuities businesses.
|
|
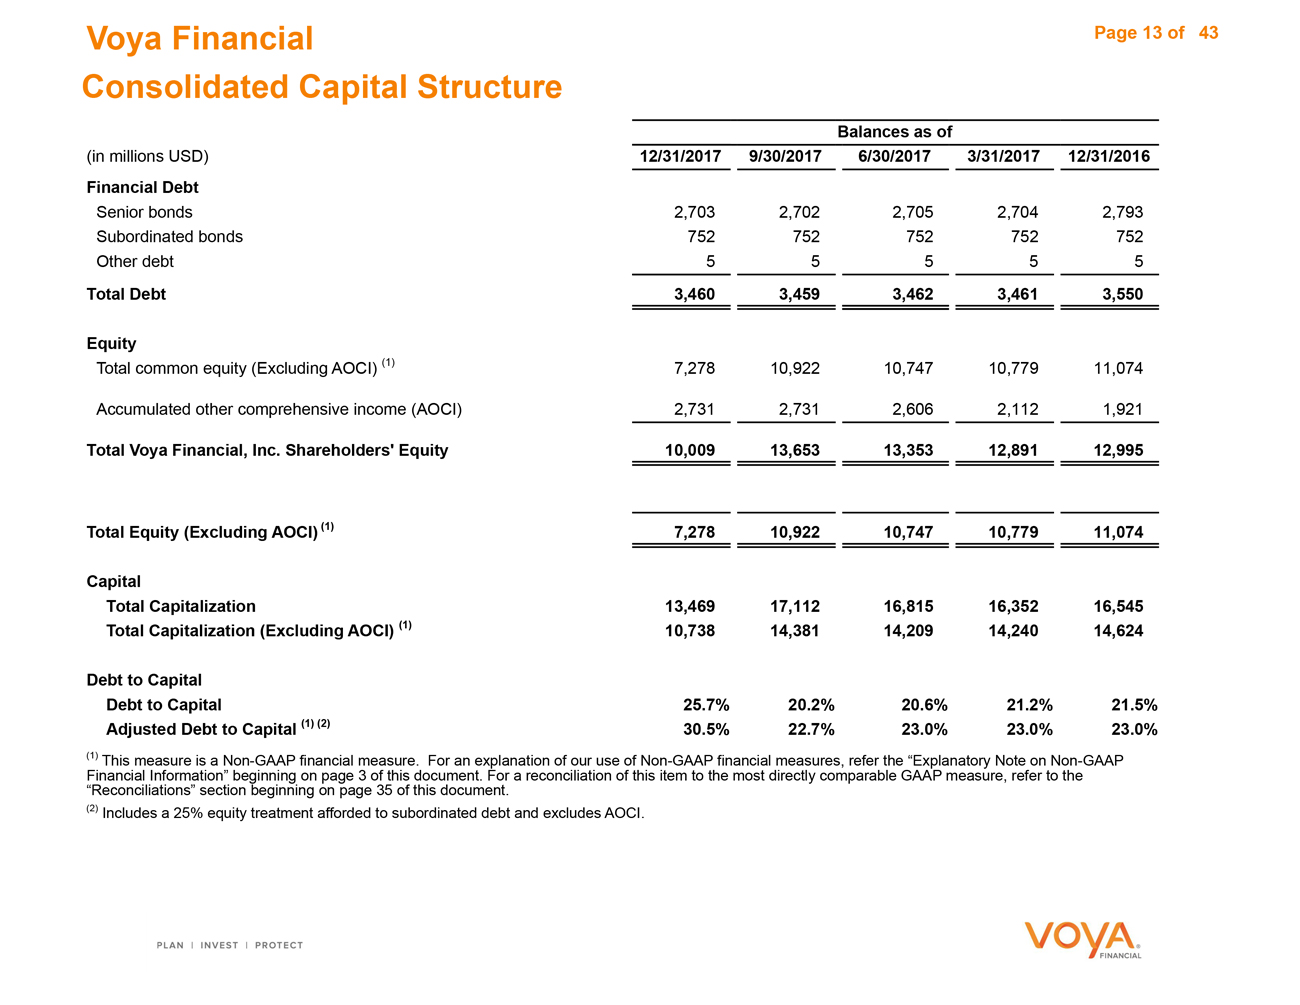
Voya Financial Page 13 of 43 Consolidated Capital Structure (in millions USD) 12/31/2017 9/30/2017 Balances as of 6/30/2017 3/31/2017 12/31/2016 Financial Debt Senior bonds 2,703 2,7022,7052,7042,793 Subordinated bonds 752 752752752752 Other debt 5 5555 Total Debt 3,460 3,459 3,462 3,461 3,550 Equity Total common equity (Excluding AOCI) (1) 7,278 10,92210,74710,77911,074 Accumulated other comprehensive income (AOCI) 2,731 2,7312,6062,1121,921 Total Voya Financial, Inc. Shareholders’ Equity 10,009 13,653 13,353 12,891 12,995 Total Equity (Excluding AOCI) (1) 7,278 10,922 10,747 10,779 11,074 Capital Total Capitalization 13,469 17,112 16,815 16,352 16,545 Total Capitalization (Excluding AOCI) (1) 10,738 14,381 14,209 14,240 14,624
Debt to Capital Debt to Capital 25.7% 20.2% 20.6% 21.2% 21.5% Adjusted Debt to Capital (1) (2) 30.5% 22.7% 23.0% 23.0% 23.0%
(1) This measure is aNon-GAAP financial measure. For an explanation of our use ofNon-GAAP financial measures, refer the “Explanatory Note onNon-GAAP Financial Information” beginning on page 3 of this document. For a reconciliation of this item to the most directly comparable GAAP measure, refer to the “Reconciliations” section beginning on page 35 of this document.
(2) Includes a 25% equity treatment afforded to subordinated debt and excludes AOCI.
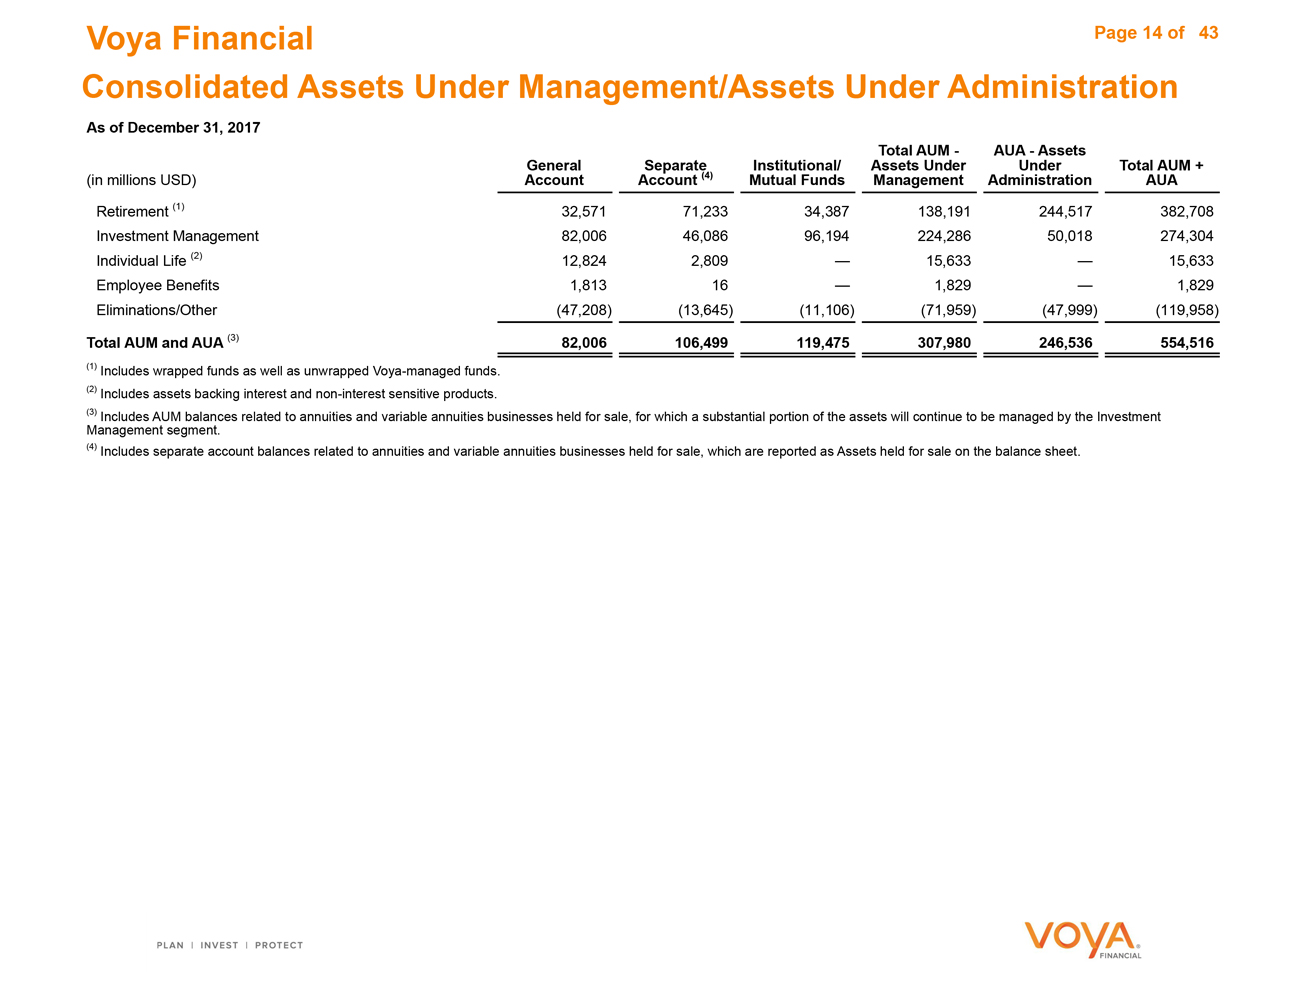
Voya Financial Page 14 of 43 Consolidated Assets Under Management/Assets Under Administration As of December 31, 2017
(in millions USD) General Account Separate(4) Account (4) Institutional/ Mutual Funds Total AUM - Assets Under Management AUA - Assets Under Administration Total AUM + AUA Retirement (1) 32,571 71,23334,387138,191244,517382,708 Investment Management 82,006 46,08696,194224,28650,018274,304 Individual Life (2) 12,824 2,809—15,633—15,633 Employee Benefits 1,813 16—1,829—1,829 Eliminations/Other (47,208) (13,645)(11,106)(71,959)(47,999)(119,958) Total AUM and AUA (3) 82,006 106,499 119,475 307,980 246,536 554,516 (1) Includes wrapped funds as well as unwrapped Voya-managed funds. (2) Includes assets backing interest andnon-interest sensitive products. (3) Includes AUM balances related to annuities and variable annuities businesses held for sale, for which a substantial portion of the assets will continue to be managed by the Investment Management segment. (4) Includes separate account balances related to annuities and variable annuities businesses held for sale, which are reported as Assets held for sale on the balance sheet.
|

|
Retirement
|
|
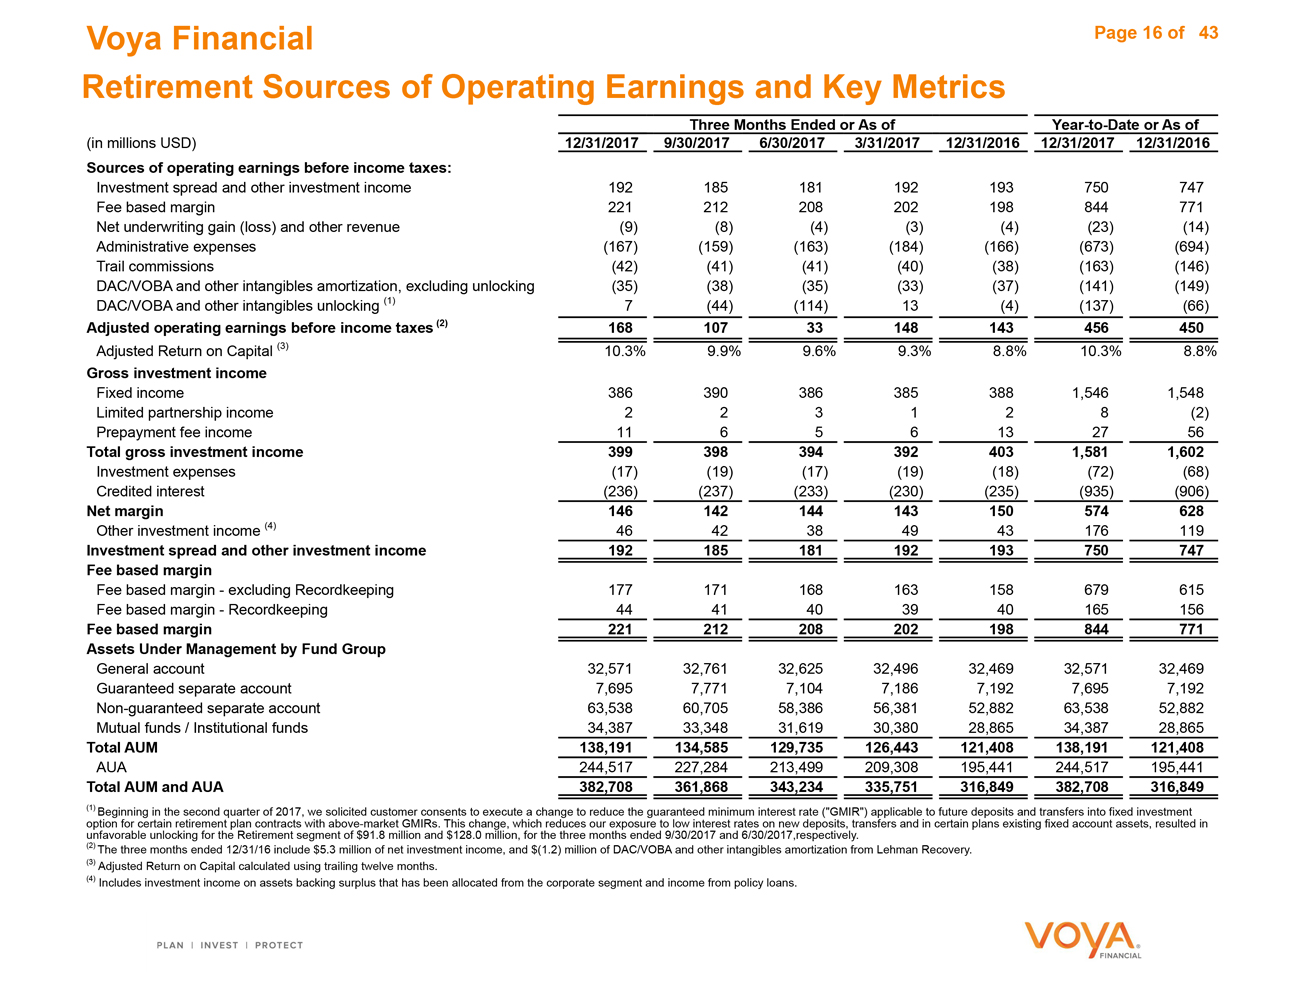
Voya Financial Page 16 of 43 Retirement Sources of Operating Earnings and Key Metrics (in millions USD) Three Months Ended or As of Year-to-Date or As of 12/31/2017 9/30/2017 6/30/2017 3/31/2017 12/31/2016 12/31/2017 12/31/2016 Sources of operating earnings before income taxes: Investment spread and other investment income 192 185181192193750747 Fee based margin 221 212208202198844771 Net underwriting gain (loss) and other revenue (9) (8)(4)(3)(4)(23)(14) Administrative expenses (167) (159)(163)(184)(166)(673)(694) Trail commissions (42) (41)(41)(40)(38)(163)(146) DAC/VOBA and other intangibles amortization, excluding unlocking (35) (38)(35)(33)(37)(141)(149) DAC/VOBA and other intangibles unlocking (1) 7 (44)(114)13(4)(137)(66) Adjusted operating earnings before income taxes (2) 168 107 33 148 143 456 450 Adjusted Return on Capital (3) 10.3% 9.9%9.6%9.3%8.8%10.3%8.8% Gross investment income Fixed income 386 3903863853881,5461,548 Limited partnership income 2 23128(2) Prepayment fee income 11 656132756 Total gross investment income 399 398 394 392 403 1,581 1,602 Investment expenses (17) (19)(17)(19)(18)(72)(68) Credited interest (236) (237)(233)(230)(235)(935)(906) Net margin 146 142 144 143 150 574 628 Other investment income (4) 46 42384943176119 Investment spread and other investment income 192 185 181 192 193 750 747 Fee based margin Fee based margin - excluding Recordkeeping 177 171168163158679615 Fee based margin - Recordkeeping 44 41403940165156 Fee based margin 221 212 208 202 198 844 771 Assets Under Management by Fund Group General account 32,571 32,76132,62532,49632,46932,57132,469 Guaranteed separate account 7,695 7,7717,1047,1867,1927,6957,192 Non-guaranteed separate account 63,538 60,70558,38656,38152,88263,53852,882 Mutual funds / Institutional funds 34,387 33,34831,61930,38028,86534,38728,865 Total AUM 138,191 134,585 129,735 126,443 121,408 138,191 121,408 AUA 244,517 227,284213,499209,308195,441244,517195,441 Total AUM and AUA 382,708 361,868 343,234 335,751 316,849 382,708 316,849 (1) Beginning in the second quarter of 2017, we solicited customer consents to execute a change to reduce the guaranteed minimum interest rate (“GMIR”) applicable to future deposits and transfers into fixed investment option for certain retirement plan contracts with above-market GMIRs. This change, which reduces our exposure to low interest rates on new deposits, transfers and in certain plans existing fixed account assets, resulted in unfavorable unlocking for the Retirement segment of $91.8 million and $128.0 million, for the three months ended 9/30/2017 and 6/30/2017, respectively. (2) The three months ended 12/31/16 include $5.3 million of net investment income, and $(1.2) million of DAC/VOBA and other intangibles amortization from Lehman Recovery. (3) Adjusted Return on Capital calculated using trailing twelve months. (4) Includes investment income on assets backing surplus that has been allocated from the corporate segment and income from policy loans.
|
|
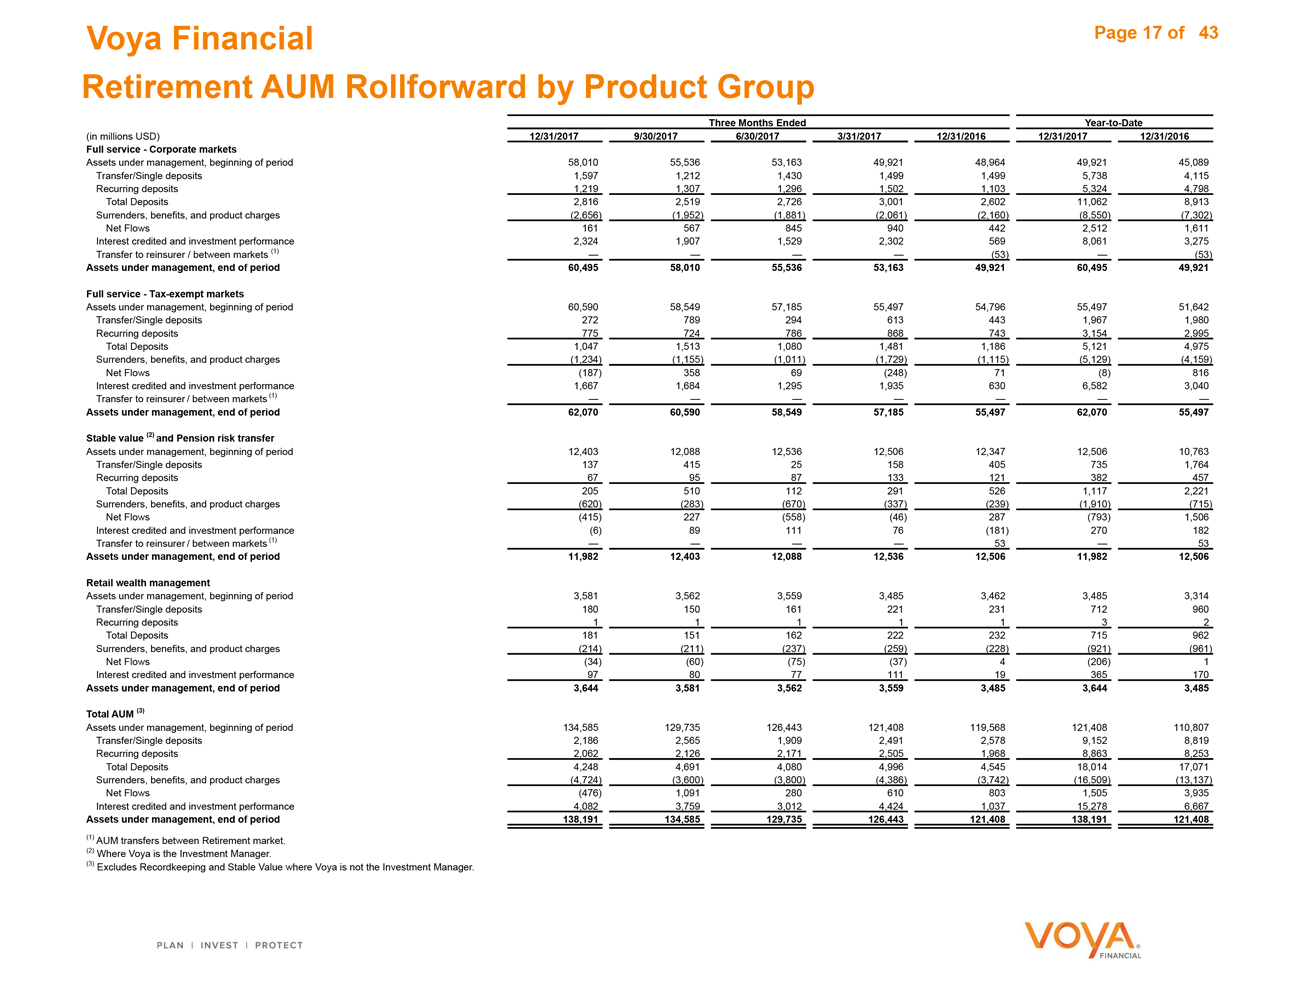
Voya Financial Page 17 of 43 Retirement AUM Rollforward by Product Group Three Months Ended Year-to-Date (in millions USD) 12/31/2017 9/30/2017 6/30/2017 3/31/2017 12/31/2016 12/31/2017 12/31/2016 Full service - Corporate markets Assets under management, beginning of period 58,010 55,53653,16349,92148,96449,92145,089 Transfer/Single deposits 1,597 1,2121,4301,4991,4995,7384,115 Recurring deposits 1,219 1,3071,2961,5021,1035,3244,798 Total Deposits 2,816 2,5192,7263,0012,60211,0628,913 Surrenders, benefits, and product charges (2,656) (1,952)(1,881)(2,061)(2,160)(8,550)(7,302) Net Flows 161 5678459404422,5121,611 Interest credited and investment performance 2,324 1,9071,5292,3025698,0613,275 Transfer to reinsurer / between markets (1) (53)—(53) Assets under management, end of period 60,495 58,010 55,536 53,163 49,921 60,495 49,921 Full service - Tax-exempt markets Assets under management, beginning of period 60,590 58,54957,18555,49754,79655,49751,642 Transfer/Single deposits 272 7892946134431,9671,980 Recurring deposits 775 7247868687433,1542,995 Total Deposits 1,047 1,5131,0801,4811,1865,1214,975 Surrenders, benefits, and product charges (1,234) (1,155)(1,011)(1,729)(1,115)(5,129)(4,159) Net Flows (187) 35869(248)71(8)816 Interest credited and investment performance 1,667 1,6841,2951,9356306,5823,040 Transfer to reinsurer / between markets (1) Assets under management, end of period 62,070 60,590 58,549 57,185 55,497 62,070 55,497 Stable value (2) and Pension risk transfer Assets under management, beginning of period 12,403 12,08812,53612,50612,34712,50610,763 Transfer/Single deposits 137 415251584057351,764 Recurring deposits 67 9587133121382457 Total Deposits 205 5101122915261,1172,221 Surrenders, benefits, and product charges (620) (283)(670)(337)(239)(1,910)(715) Net Flows (415) 227(558)(46)287(793)1,506 Interest credited and investment performance (6) 8911176(181)270182 Transfer to reinsurer / between markets (1) 53—53 Assets under management, end of period 11,982 12,403 12,088 12,536 12,506 11,982 12,506 Retail wealth management Assets under management, beginning of period 3,581 3,5623,5593,4853,4623,4853,314 Transfer/Single deposits 180 150161221231712960 Recurring deposits 1 111132 Total Deposits 181 151162222232715962 Surrenders, benefits, and product charges (214) (211)(237)(259)(228)(921)(961) 1 Net Flows (34) (60) (75) (37) 4 (206) Interest credited and investment performance 97 807711119365170 Assets under management, end of period 3,644 3,581 3,562 3,559 3,485 3,644 3,485 Total AUM (3) Assets under management, beginning of period 134,585 129,735126,443121,408119,568121,408110,807 Transfer/Single deposits 2,186 2,5651,9092,4912,5789,1528,819 Recurring deposits 2,062 2,1262,1712,5051,9688,8638,253 Total Deposits 4,248 4,6914,0804,9964,54518,01417,071 Surrenders, benefits, and product charges (4,724) (3,600)(3,800)(4,386)(3,742)(16,509)(13,137) Net Flows (476) 1,0912806108031,5053,935 Interest credited and investment performance 4,082 3,7593,0124,4241,03715,2786,667 Assets under management, end of period 138,191 134,585 129,735 126,443 121,408 138,191 121,408 (1) AUM transfers between Retirement market. (2) Where Voya is the Investment Manager. (3) Excludes Recordkeeping and Stable Value where Voya is not the Investment Manager.
|

|
Investment Management
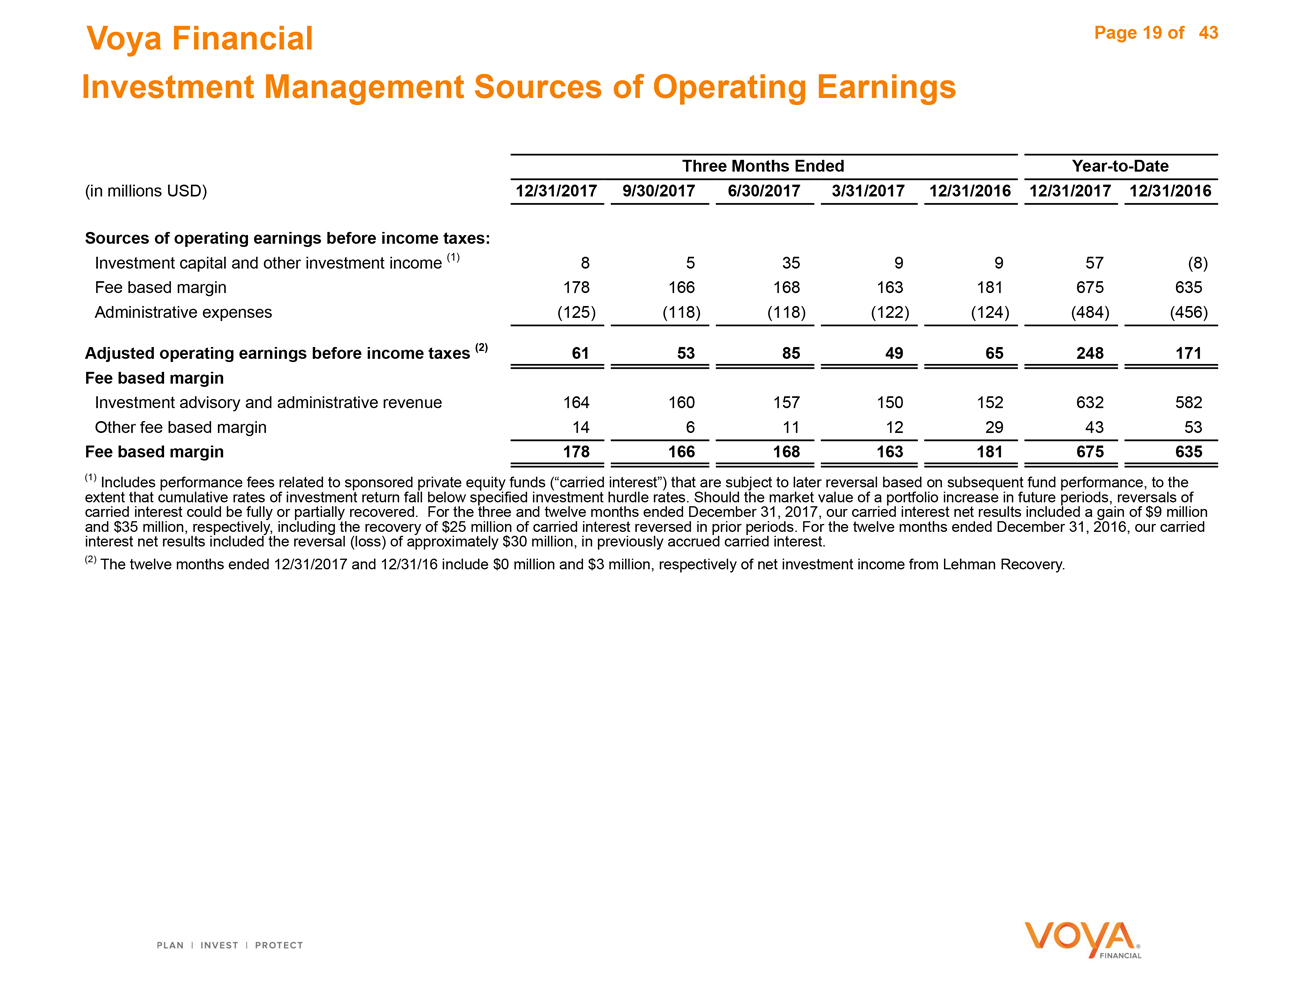
Voya Financial Page 19 of 43
Investment Management Sources of Operating Earnings
(in millions USD) Three Months EndedYear-to-Date
12/31/2017 9/30/2017 6/30/2017 3/31/201712/31/2016 12/31/2017 12/31/2016
Sources of operating earnings before income taxes:
Investment capital and other investment income (1) 8 5359957(8)
Fee based margin 178 166168163181675635
Administrative expenses (125) (118)(118)(122)(124)(484)(456)
Adjusted operating earnings before income taxes (2) 61 53 85 49 65 248 171
Fee based margin
Investment advisory and administrative revenue 164 160157150152632582
Other fee based margin 14 61112294353
Fee based margin 178 166 168 163 181 675 635
(1) Includes performance fees related to sponsored private equity funds (“carried interest”) that are subject to later reversal based on subsequent fund performance, to the
extent that cumulative rates of investment return fall below specified investment hurdle rates. Should the market value of a portfolio increase in future periods, reversals of carried interest could be fully or partially recovered. For the three and twelve months ended December 31,2017, our carried interest net results included a gain of $9 million and $35 million, respectively, including the recovery of $25 million of carried interest reversed in prior periods. For the twelve months ended December 31,2016, our carried interest net results included the reversal (loss) of approximately $30 million, in previously accrued carried interest.
(2) The twelve months ended 12/31/2017 and 12/31/16 include $0 million and $3 million, respectively of net investment income from Lehman Recovery.
|
|
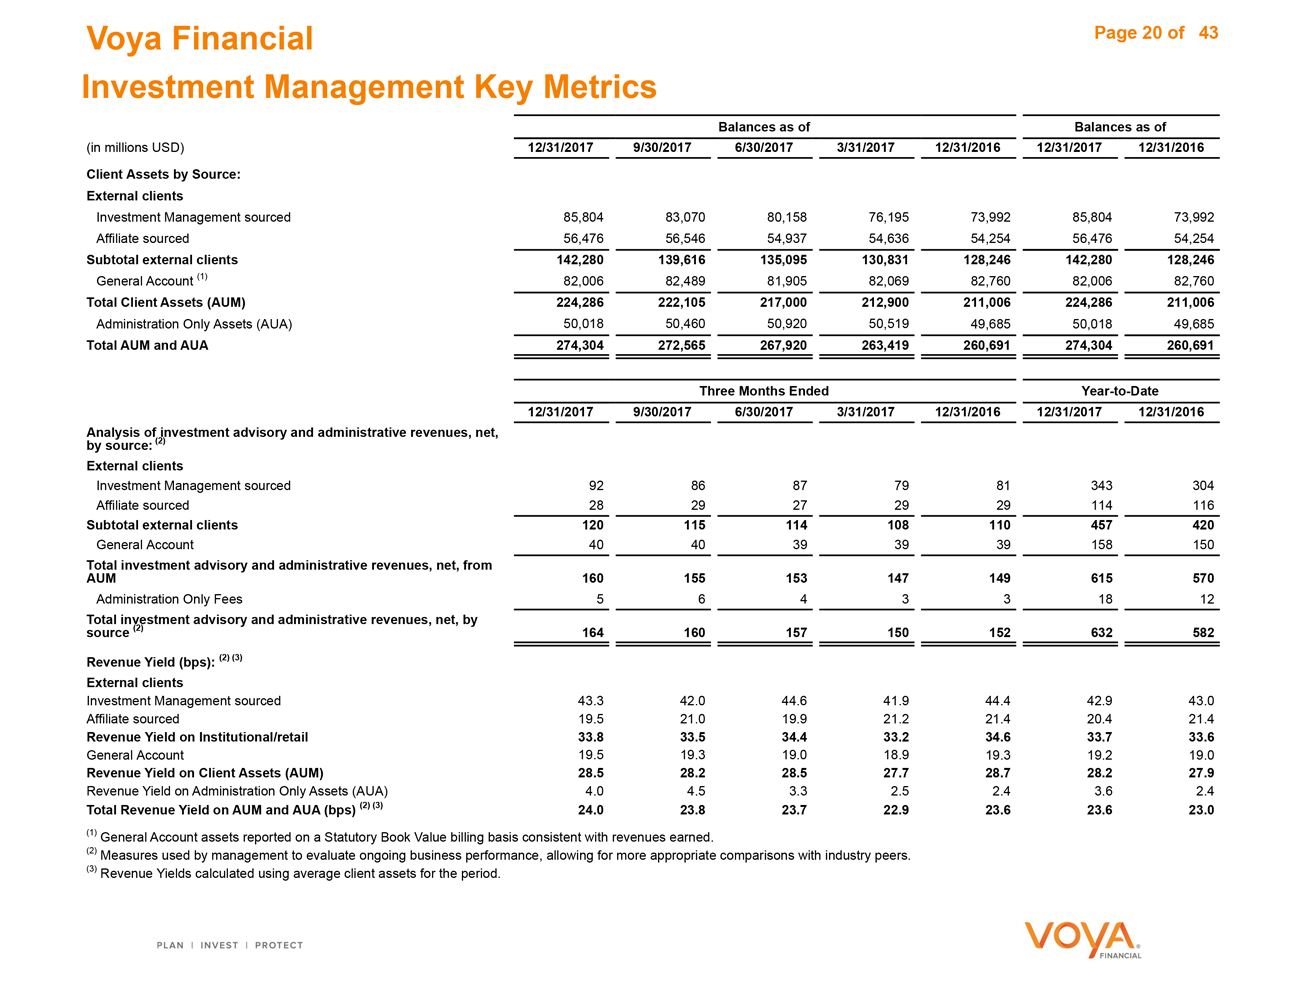
Voya Financial Page 20 of 43 Investment Management Key Metrics Balances as of Balances as of (in millions USD) 12/31/2017 9/30/2017 6/30/2017 3/31/2017 12/31/2016 12/31/2017 12/31/2016 Client Assets by Source: External clients Investment Management sourced 85,804 83,07080,15876,19573,99285,80473,992 Affiliate sourced 56,476 56,54654,93754,63654,25456,47654,254 Subtotal external clients 142,280 139,616 135,095 130,831 128,246 142,280 128,246 General Account (1) 82,006 82,48981,90582,06982,76082,00682,760 Total Client Assets (AUM) 224,286 222,105 217,000 212,900 211,006 224,286 211,006 Administration Only Assets (AUA) 50,018 50,46050,92050,51949,68550,01849,685 Total AUM and AUA 274,304 272,565 267,920 263,419 260,691 274,304 260,691 Three Months Ended Year-to-Date 12/31/2017 9/30/2017 6/30/20173/31/201712/31/201612/31/201712/31/2016 Analysis of(2i)nvestment advisory and administrative revenues, net, by source: (2) External clients Investment Management sourced 92 86877981343304 Affiliate sourced 28 29272929114116 Subtotal external clients 120 115 114 108 110 457 420 General Account 40 40393939158150 Total investment advisory and administrative revenues, net, from AUM 160 155 153 147 149 615 570 Administration Only Fees 5 64331812 Total inv(2e) stment advisory and administrative revenues, net, by source (2) 164 160 157 150 152 632 582 Revenue Yield (bps): (2) (3) External clients Investment Management sourced 43.3 42.044.641.944.442.943.0 Affiliate sourced 19.5 21.019.921.221.420.421.4 Revenue Yield on Institutional/retail 33.8 33.5 34.4 33.2 34.6 33.7 33.6 General Account 19.5 19.319.018.919.319.219.0 Revenue Yield on Client Assets (AUM) 28.5 28.2 28.5 27.7 28.7 28.2 27.9 Revenue Yield on Administration Only Assets (AUA) 4.0 4.53.32.52.43.62.4 Total Revenue Yield on AUM and AUA (bps) (2) (3) 24.0 23.8 23.7 22.9 23.6 23.6 23.0 (1) General Account assets reported on a Statutory Book Value billing basis consistent with revenues earned. (2) Measures used by management to evaluate ongoing business performance, allowing for more appropriate comparisons with industry peers. (3) Revenue Yields calculated using average client assets for the period.
|
|
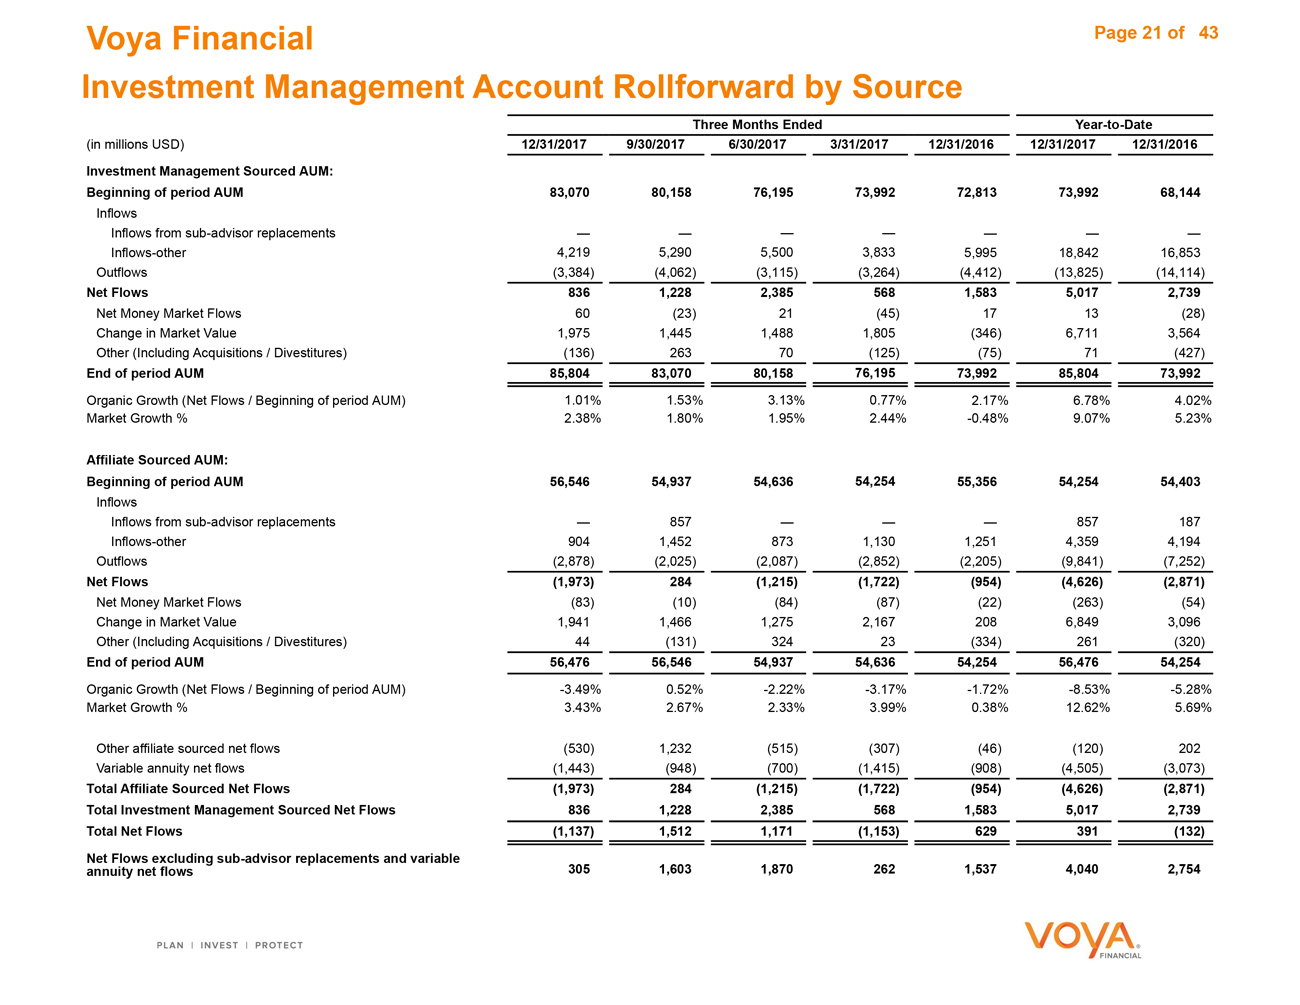
Voya Financial Page 21 of 43 Investment Management Account Rollforward by Source Three Months Ended Year-to-Date (in millions USD) 12/31/2017 9/30/2017 6/30/2017 3/31/2017 12/31/2016 12/31/2017 12/31/2016 Investment Management Sourced AUM: Beginning of period AUM 83,070 80,158 76,195 73,992 72,813 73,992 68,144 Inflows Inflows from sub-advisor replacements — —————— Inflows-other 4,219 5,2905,5003,8335,99518,84216,853 Outflows (3,384) (4,062)(3,115)(3,264)(4,412)(13,825)(14,114) Net Flows 836 1,228 2,385 568 1,583 5,017 2,739 Net Money Market Flows 60 (23)21(45)1713(28) Change in Market Value 1,975 1,4451,4881,805(346)6,7113,564 Other (Including Acquisitions / Divestitures) (136) 26370(125)(75)71(427) End of period AUM 85,804 83,070 80,158 76,195 73,992 85,804 73,992 Organic Growth (Net Flows / Beginning of period AUM) 1.01% 1.53%3.13%0.77%2.17%6.78%4.02% Market Growth % 2.38% 1.80%1.95%2.44%-0.48%9.07%5.23% Affiliate Sourced AUM: Beginning of period AUM 56,546 54,937 54,636 54,254 55,356 54,254 54,403 Inflows Inflows from sub-advisor replacements — 857———857187 Inflows-other 904 1,4528731,1301,2514,3594,194 Outflows (2,878) (2,025)(2,087)(2,852)(2,205)(9,841)(7,252) Net Flows (1,973) 284 (1,215) (1,722) (954) (4,626) (2,871) Net Money Market Flows (83) (10)(84)(87)(22)(263)(54) Change in Market Value 1,941 1,4661,2752,1672086,8493,096 Other (Including Acquisitions / Divestitures) 44 (131)32423(334)261(320) End of period AUM 56,476 56,546 54,937 54,636 54,254 56,476 54,254 Organic Growth (Net Flows / Beginning of period AUM) -3.49% 0.52%-2.22%-3.17%-1.72%-8.53%-5.28% Market Growth % 3.43% 2.67%2.33%3.99%0.38%12.62%5.69% Other affiliate sourced net flows (530) 1,232(515)(307)(46)(120)202 Variable annuity net flows (1,443) (948)(700)(1,415)(908)(4,505)(3,073) Total Affiliate Sourced Net Flows (1,973) 284 (1,215) (1,722) (954) (4,626) (2,871) Total Investment Management Sourced Net Flows 836 1,228 2,385 568 1,583 5,017 2,739 Total Net Flows (1,137) 1,512 1,171 (1,153) 629 391 (132) Net Flows excluding sub-advisor replacements and variable annuity net flows 305 1,603 1,870 262 1,537 4,040 2,754 Balances as of
|
|
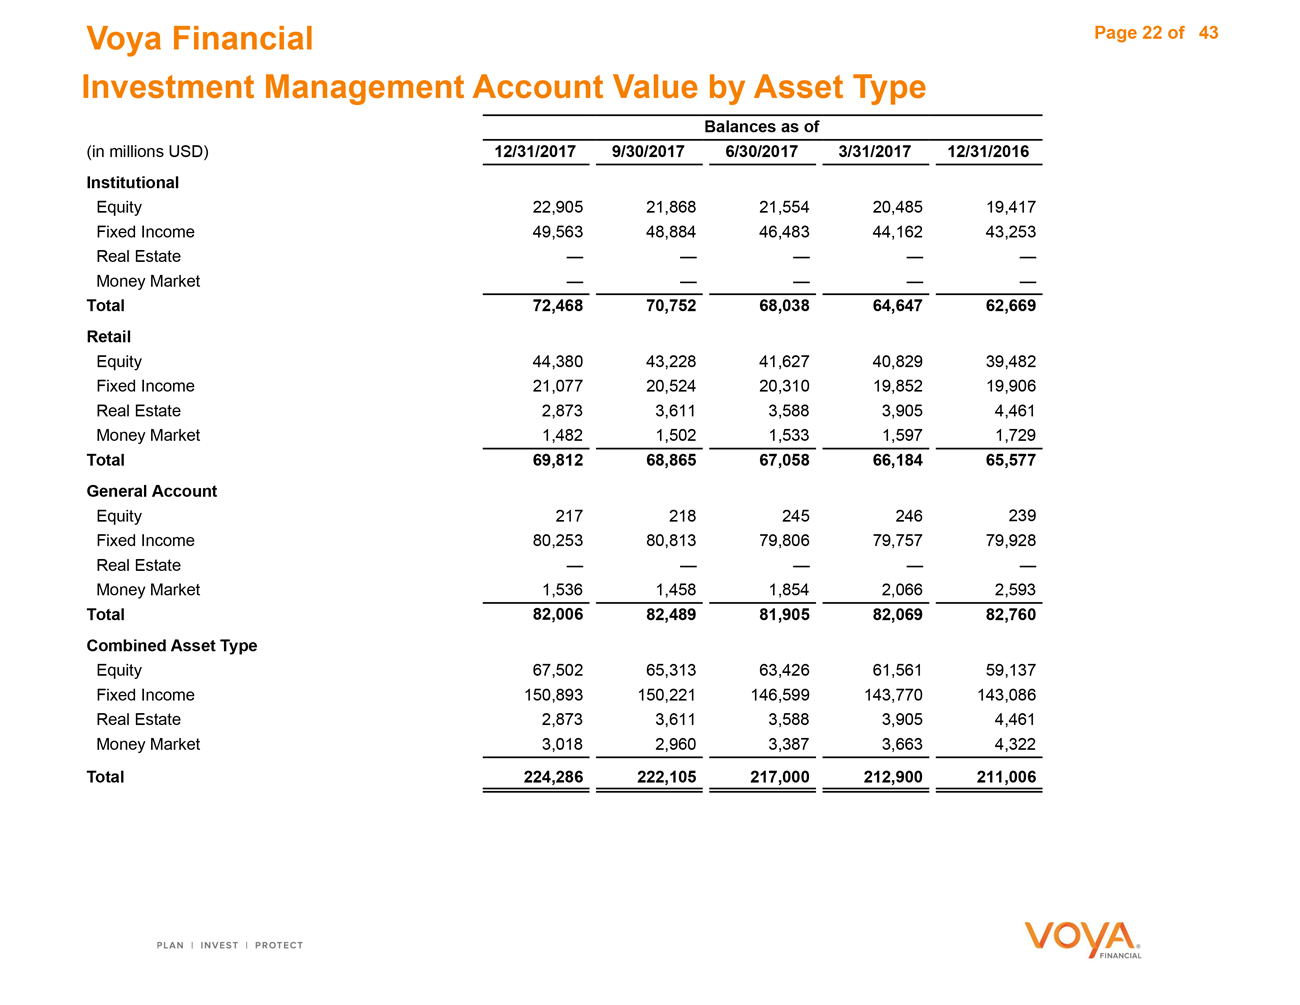
Voya Financial Page 22 of 43 Investment Management Account Value by Asset Type (in millions USD) 12/31/2017 9/30/2017 6/30/2017 3/31/2017 12/31/2016 Institutional Equity 22,905 21,86821,55420,48519,417 Fixed Income 49,563 48,88446,48344,16243,253 Real Estate — ———— Money Market — ———— Total 72,468 70,752 68,038 64,647 62,669 Retail Equity 44,380 43,22841,62740,82939,482 Fixed Income 21,077 20,52420,31019,85219,906 Real Estate 2,873 3,6113,5883,9054,461 Money Market 1,482 1,5021,5331,5971,729 Total 69,812 68,865 67,058 66,184 65,577 General Account Equity 217 218245246239 Fixed Income 80,253 80,81379,80679,75779,928 Real Estate — ———— Money Market 1,536 1,4581,8542,0662,593 Total 82,006 82,489 81,905 82,069 82,760 Combined Asset Type Equity 67,502 65,31363,42661,56159,137 Fixed Income 150,893 150,221146,599143,770143,086 Real Estate 2,873 3,6113,5883,9054,461 Money Market 3,018 2,9603,3873,6634,322 Total 224,286 222,105 217,000 212,900 211,006
Individual Life
|
|
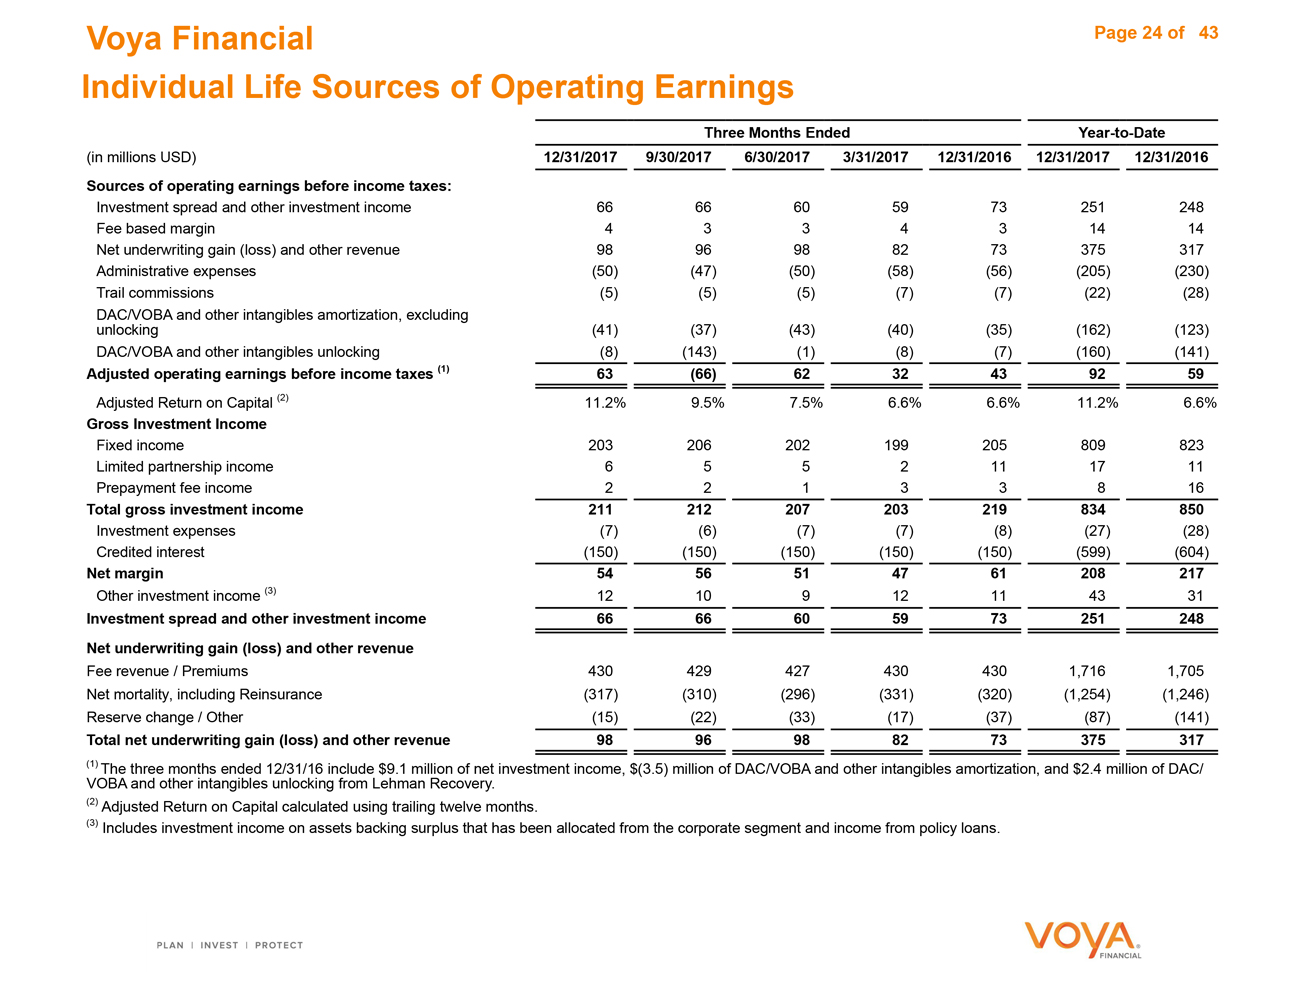
Voya Financial Page 24 of 43 Individual Life Sources of Operating Earnings (in millions USD) Three Months Ended Year-to-Date 12/31/2017 9/30/2017 6/30/2017 3/31/201712/31/2016 12/31/2017 12/31/2016 Sources of operating earnings before income taxes: Investment spread and other investment income 66 66605973251248 Fee based margin 4 33431414 Net underwriting gain (loss) and other revenue 98 96988273375317 Administrative expenses (50) (47)(50)(58)(56)(205)(230) Trail commissions (5) (5)(5)(7)(7)(22)(28) DAC/VOBA and other intangibles amortization, excluding unlocking (41) (37)(43)(40)(35)(162)(123) DAC/VOBA and other intangibles unlocking (8) (143)(1)(8)(7)(160)(141) Adjusted operating earnings before income taxes (1) 63 (66) 62 32 43 92 59 Adjusted Return on Capital (2) 11.2% 9.5%7.5%6.6%6.6%11.2%6.6% Gross Investment Income Fixed income 203 206202199205809823 Limited partnership income 6 552111711 Prepayment fee income 2 2133816 Total gross investment income 211 212 207 203 219 834 850 Investment expenses (7) (6)(7)(7)(8)(27)(28) Credited interest (150) (150)(150)(150)(150)(599)(604) Net margin 54 56 51 47 61 208 217 Other investment income (3) 12 10912114331 Investment spread and other investment income 66 66 60 59 73 251 248 Net underwriting gain (loss) and other revenue Fee revenue / Premiums 430 4294274304301,7161,705 Net mortality, including Reinsurance (317) (310)(296)(331)(320)(1,254)(1,246) Reserve change / Other (15) (22)(33)(17)(37)(87)(141) Total net underwriting gain (loss) and other revenue 98 96 98 82 73 375 317 (1) The three months ended 12/31/16 include $9.1 million of net investment income, $(3.5) million of DAC/VOBA and other intangibles amortization, and $2.4 million of DAC/ VOBA and other intangibles unlocking from Lehman Recovery. (2) Adjusted Return on Capital calculated using trailing twelve months. (3) Includes investment income on assets backing surplus that has been allocated from the corporate segment and income from policy loans.
|
|
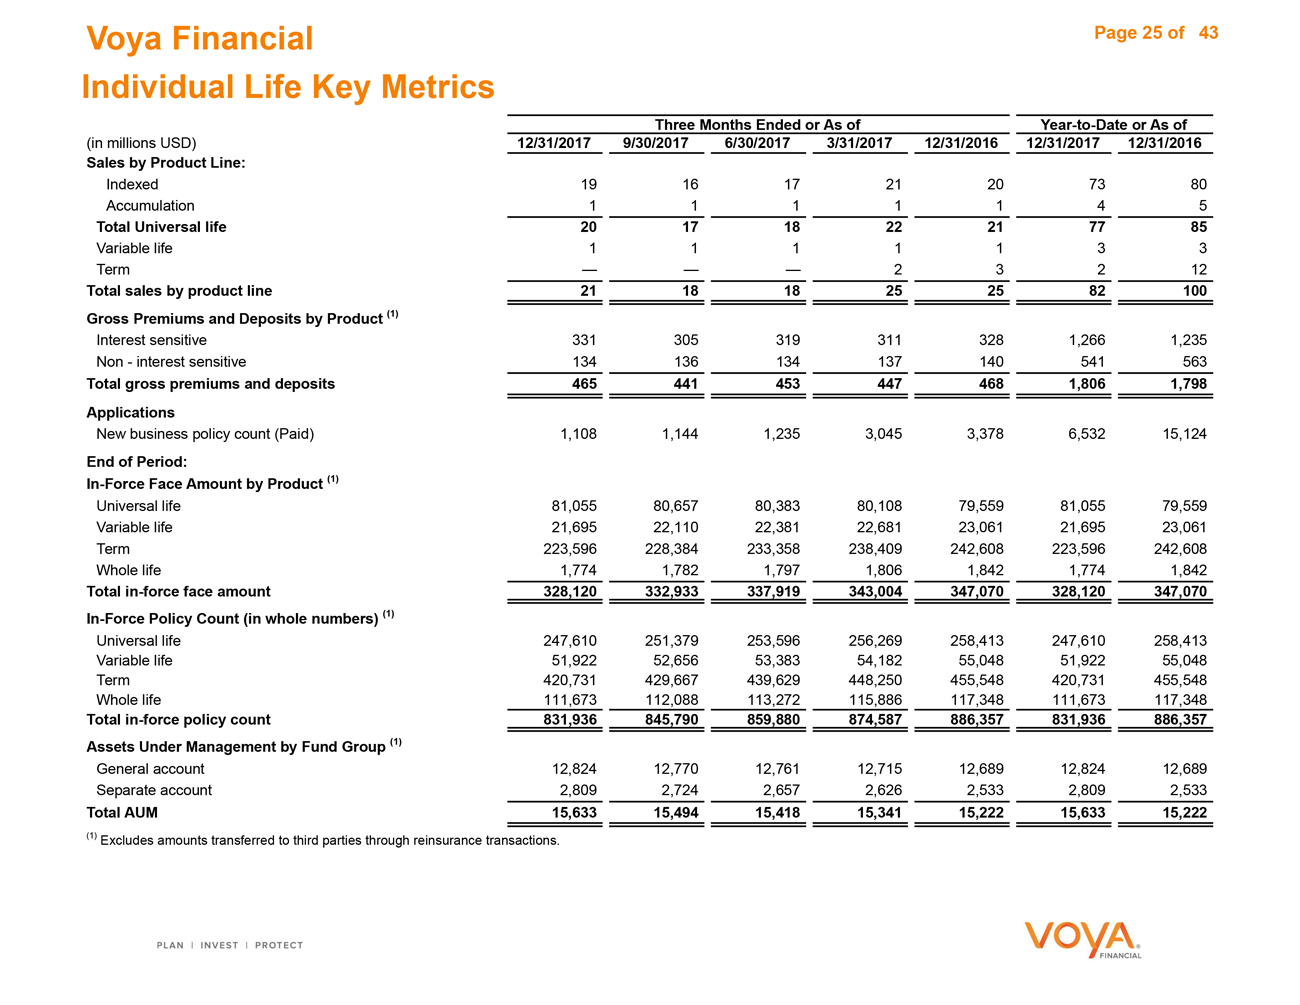
Voya Financial Page 25 of 43 Individual Life Key Metrics (in millions USD) Three Months Ended or As of Year-to-Date or As of 12/31/2017 9/30/2017 6/30/2017 3/31/2017 12/31/2016 12/31/2017 12/31/2016 Sales by Product Line: Indexed 19 161721207380 Accumulation 1 111145 Total Universal life 20 17 18 22 21 77 85 Variable life 1 111133 Term — ——23212 Total sales by product line 21 18 18 25 25 82 100 Gross Premiums and Deposits by Product (1) Interest sensitive 331 3053193113281,2661,235 Non - interest sensitive 134 136134137140541563 Total gross premiums and deposits 465 441 453 447 468 1,806 1,798 Applications New business policy count (Paid) 1,108 1,1441,2353,0453,3786,53215,124 End of Period: In-Force Face Amount by Product (1) Universal life 81,055 80,65780,38380,10879,55981,05579,559 Variable life 21,695 22,11022,38122,68123,06121,69523,061 Term 223,596 228,384233,358238,409242,608223,596242,608 Whole life 1,774 1,7821,7971,8061,8421,7741,842 Total in-force face amount 328,120 332,933 337,919 343,004 347,070 328,120 347,070 In-Force Policy Count (in whole numbers) (1) Universal life 247,610 251,379253,596256,269258,413247,610258,413 Variable life 51,922 52,65653,38354,18255,04851,92255,048 Term 420,731 429,667439,629448,250455,548420,731455,548 Whole life 111,673 112,088113,272115,886117,348111,673117,348 Total in-force policy count 831,936 845,790 859,880 874,587 886,357 831,936 886,357 Assets Under Management by Fund Group (1) General account 12,824 12,77012,76112,71512,68912,82412,689 Separate account 2,809 2,7242,6572,6262,5332,8092,533 Total AUM 15,633 15,494 15,418 15,341 15,222 15,633 15,222 (1) Excludes amounts transferred to third parties through reinsurance transactions.
|

|
Employee Benefits
|
|
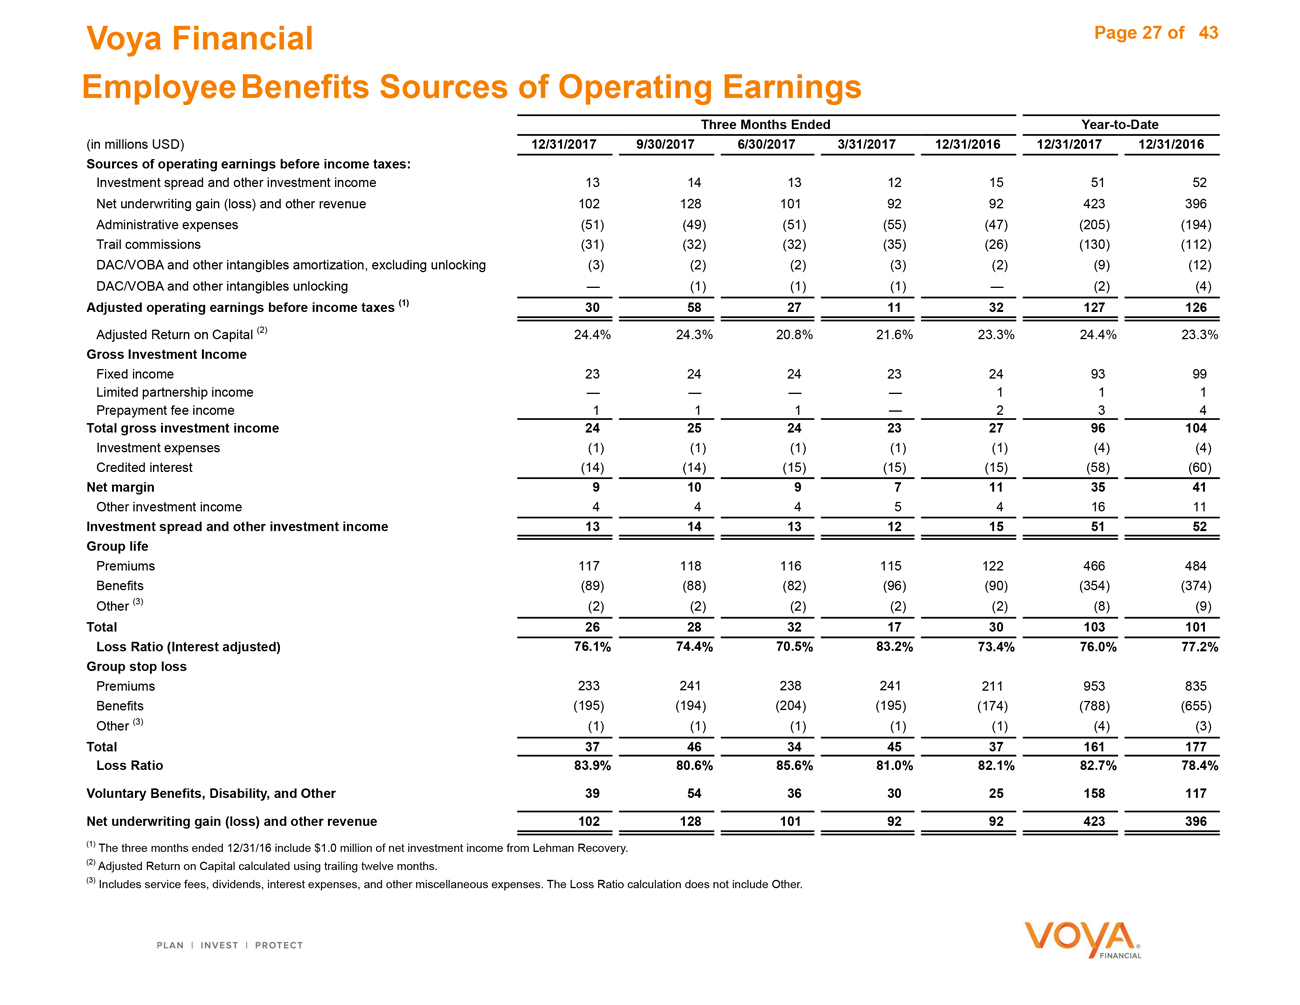
Voya Financial Page 27 of 43 Employee Benefits Sources of Operating Earnings Three Months Ended Year-to-Date (in millions USD) 12/31/2017 9/30/2017 6/30/2017 3/31/2017 12/31/2016 12/31/2017 12/31/2016 Sources of operating earnings before income taxes: Investment spread and other investment income 13 141312155152 Net underwriting gain (loss) and other revenue 102 1281019292423396 Administrative expenses (51) (49)(51)(55)(47)(205)(194) Trail commissions (31) (32)(32)(35)(26)(130)(112) DAC/VOBA and other intangibles amortization, excluding unlocking (3) (2)(2)(3)(2)(9)(12) DAC/VOBA and other intangibles unlocking — (1)(1)(1)—(2)(4) Adjusted operating earnings before income taxes (1) 30 58 27 11 32 127 126 Adjusted Return on Capital (2) 24.4% 24.3%20.8%21.6%23.3%24.4%23.3% Gross Investment Income Fixed income 23 242423249399 Limited partnership income — ———111 Prepayment fee income 1 11—234 Total gross investment income 24 25 24 23 27 96 104 Investment expenses (1) (1)(1)(1)(1)(4)(4) Credited interest (14) (14)(15)(15)(15)(58)(60) Net margin 9 10 9 7 11 35 41 Other investment income 4 44541611 Investment spread and other investment income 13 14 13 12 15 51 52 Group life Premiums 117 118116115122466484 Benefits (89) (88)(82)(96)(90)(354)(374) Other (3) (2) (2)(2)(2)(2)(8)(9) Total 26 28 32 17 30 103 101 Loss Ratio (Interest adjusted) 76.1% 74.4% 70.5% 83.2% 73.4% 76.0% 77.2% Group stop loss Premiums 233 241238241211953835 Benefits (195) (194)(204)(195)(174)(788)(655) Other (3) (1) (1)(1)(1)(1)(4)(3) Total 37 46 34 45 37 161 177 Loss Ratio 83.9% 80.6% 85.6% 81.0% 82.1% 82.7% 78.4% Voluntary Benefits, Disability, and Other 39 54 36 30 25 158 117 Net underwriting gain (loss) and other revenue 102 128 101 92 92 423 396 (1) The three months ended 12/31/16 include $1.0 million of net investment income from Lehman Recovery. (2) Adjusted Return on Capital calculated using trailing twelve months. (3) Includes service fees, dividends, interest expenses, and other miscellaneous expenses. The Loss Ratio calculation does not include Other.
|
|
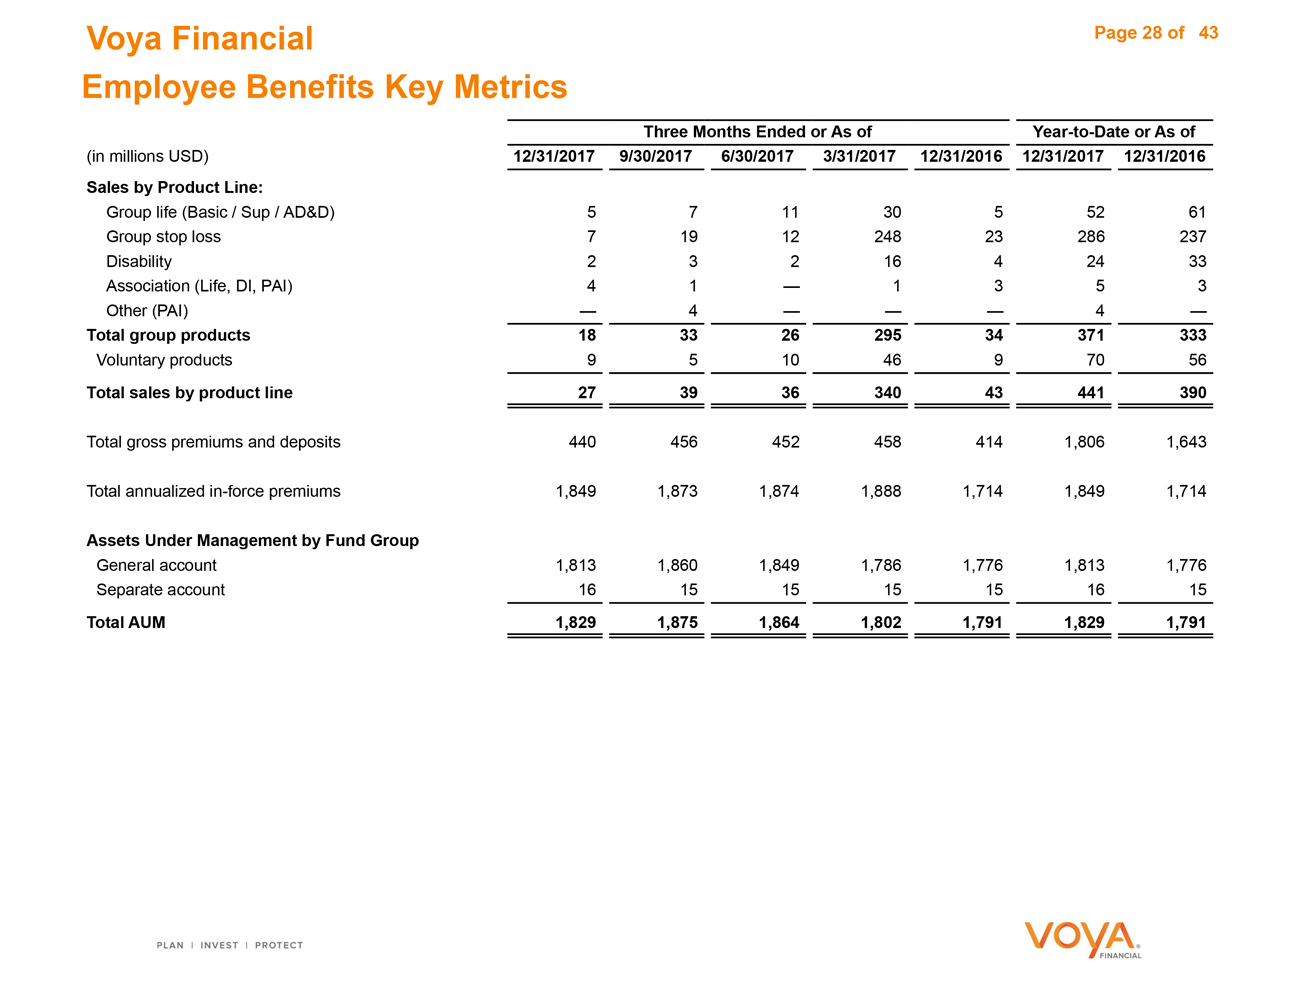
Voya Financial Page 28 of 43 Employee Benefits Key Metrics (in millions USD) Three Months Ended or As ofYear-to-Date or As of 12/31/2017 9/30/2017 6/30/2017 3/31/2017 12/31/2016 12/31/2017 12/31/2016 Sales by Product Line: Group life (Basic / Sup / AD&D) 5 7113055261 Group stop loss 7 191224823286237 Disability 2 321642433 Association (Life, DI, PAI) 4 1—1353 Other (PAI) — 4———4— Total group products 18 33 26 295 34 371 333 Voluntary products 9 5104697056 Total sales by product line 27 39 36 340 43 441 390 Total gross premiums and deposits 440 4564524584141,8061,643 Total annualizedin-force premiums 1,849 1,8731,8741,8881,7141,8491,714 Assets Under Management by Fund Group General account 1,813 1,8601,8491,7861,7761,8131,776 Separate account 16 151515151615 Total AUM 1,829 1,875 1,864 1,802 1,791 1,829 1,791
Corporate
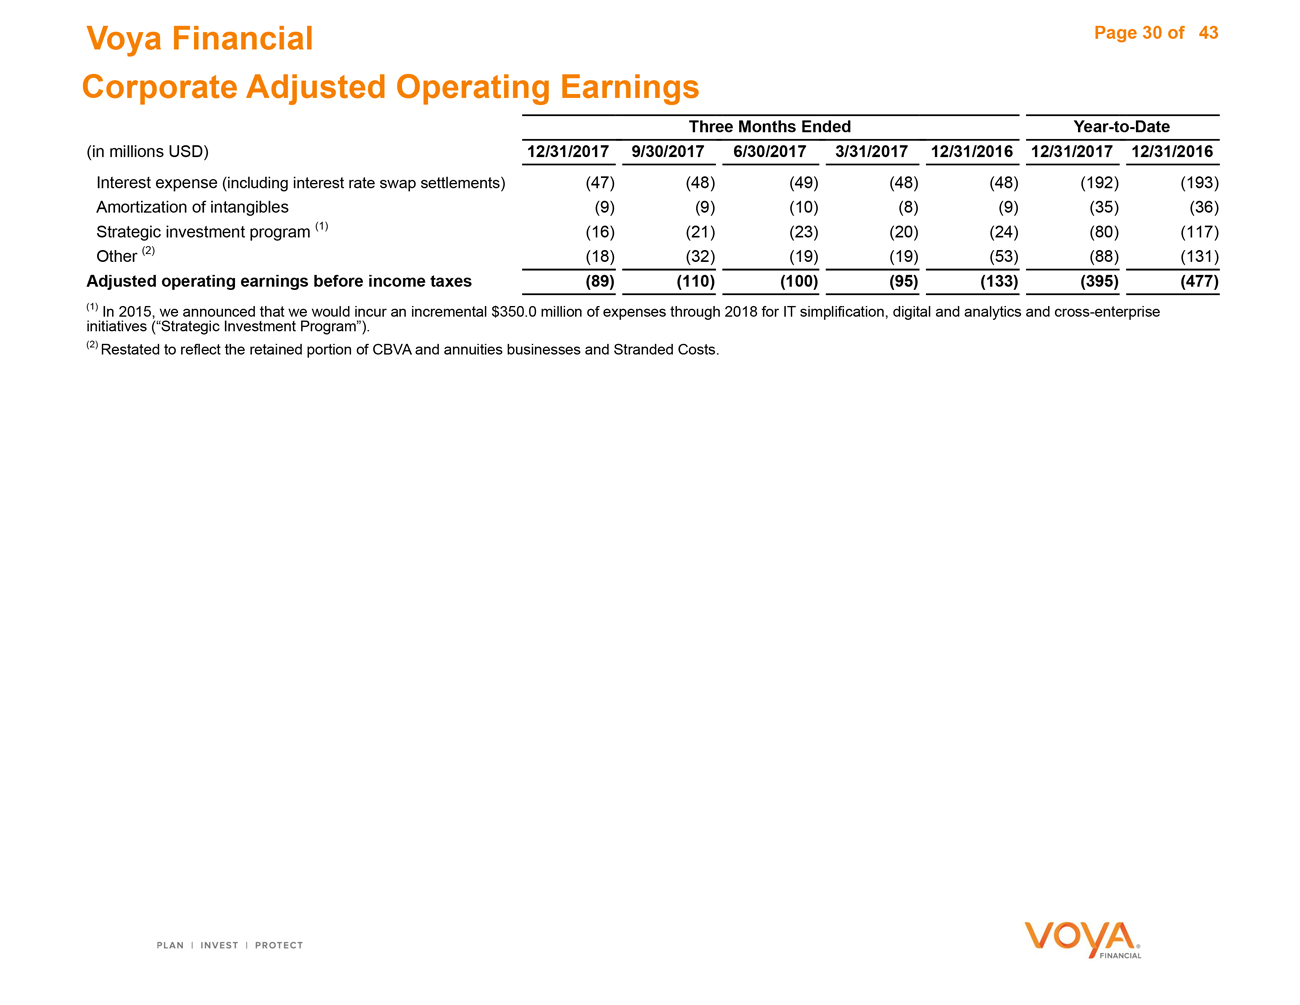
Voya Financial Page 30 of 43 Corporate Adjusted Operating Earnings Three Months EndedYear-to-Date (in millions USD) 12/31/2017 9/30/2017 6/30/2017 3/31/2017 12/31/2016 12/31/2017 12/31/2016 Interest expense (including interest rate swap settlements) (47) (48) (49) (48) (48) (192) (193) Amortization of intangibles (9) (9) (10) (8) (9) (35) (36) Strategic investment program (1) (16) (21) (23) (20) (24) (80) (117) Other (2) (18) (32) (19) (19) (53) (88) (131) Adjusted operating earnings before income taxes (89) (110) (100) (95) (133) (395) (477) (1) In 2015, we announced that we would incur an incremental $350.0 million of expenses through 2018 for IT simplification, digital and analytics and cross-enterprise initiatives (“Strategic Investment Program”). (2) Restated to reflect the retained portion of CBVA and annuities businesses and Stranded Costs.
Investment Information
|
|
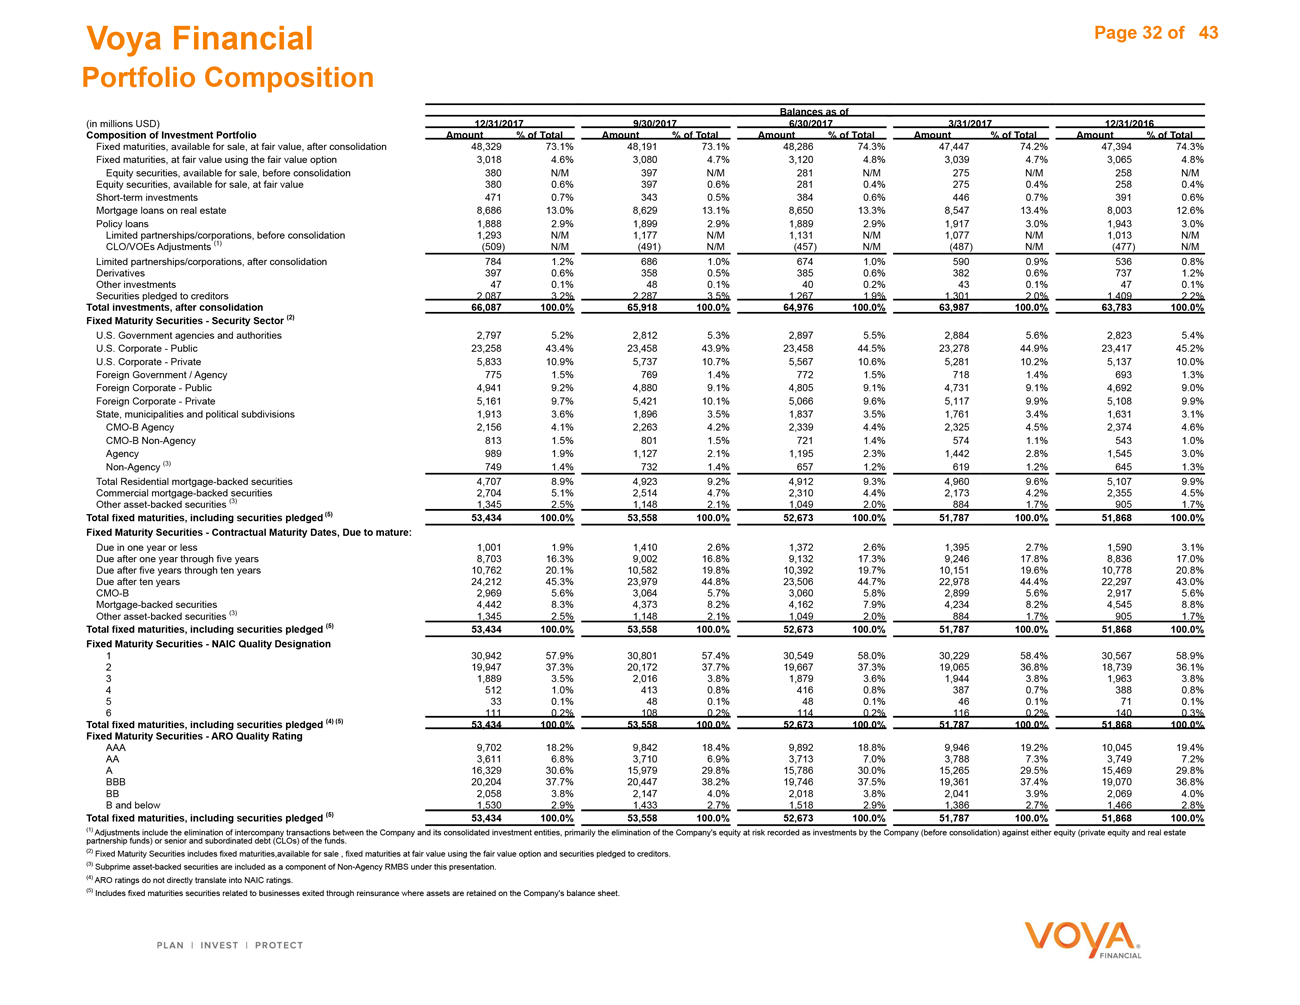
Voya Financial Page 32 of 43 Portfolio Composition (in millions USD) Composition of Investment Portfolio Balances as of 12/31/2017 9/30/2017 6/30/2017 3/31/2017 12/31/2016 Amount % of Total Amount % of Total Amount % of Total of Total Amount % of Total Fixed maturities, available for sale, at fair value, after consolidation 48,329 73.1%48,19173.1%48,28674.3%47,44774.2%47,39474.3% Fixed maturities, at fair value using the fair value option 3,018 4.6%3,0804.7%3,1204.8%3,0394.7%3,0654.8% Equity securities, available for sale, before consolidation 380 N/M397N/M281N/M275N/M258N/M Equity securities, available for sale, at fair value 380 0.6%3970.6%2810.4%2750.4%2580.4% Short-term investments 471 0.7%3430.5%3840.6%4460.7%3910.6% Mortgage loans on real estate 8,686 13.0%8,62913.1%8,65013.3%8,54713.4%8,00312.6% Policy loans 1,888 2.9%1,8992.9%1,8892.9%1,9173.0%1,9433.0% Limited partnerships/corporations, before consolidation 1,293 N/M1,177N/M1,131N/M1,077N/M1,013N/M CLO/VOEs Adjustments (1) (509) N/M(491)N/M(457)N/M(487)N/M(477)N/M Limited partnerships/corporations, after consolidation 784 1.2%6861.0%6741.0%5900.9%5360.8% Derivatives 397 0.6%3580.5%3850.6%3820.6%7371.2% Other investments 47 0.1%480.1%400.2%430.1%470.1% Securities pledged to creditors 2,087 3.2%2,2873.5%1,2671.9%1 3012.0%1,4092.2% Total investments, after consolidation 66,087 100.0% 65,918 100.0% 64,976 100.0% 63,987 100.0% 63,783 100.0% Fixed Maturity Securities - Security Sector (2) U.S. Government agencies and authorities 2,797 5.2%2,8125.3%2,8975.5%2,8845.6%2,8235.4% U.S. Corporate - Public 23,258 43.4%23,45843.9%23,45844.5%23,27844.9%23,41745.2% U.S. Corporate - Private 5,833 10.9%5,73710.7%5,56710.6%5,28110.2%5,13710.0% Foreign Government / Agency 775 1.5%7691.4%7721.5%7181.4%6931.3% Foreign Corporate - Public 4,941 9.2%4,8809.1%4,8059.1%4,7319.1%4,6929.0% Foreign Corporate - Private 5,161 9.7%5,42110.1%5,0669.6%5,1179.9%5,1089.9% State, municipalities and political subdivisions 1,913 3.6%1,8963.5%1,8373.5%1,7613.4%1,6313.1% CMO-B Agency 2,156 4.1%2,2634.2%2,3394.4%2,3254.5%2,3744.6% CMO-B Non-Agency 813 1.5%8011.5%7211.4%5741.1%5431.0% Agency 989 1.9%1,1272.1%1,1952.3%1,4422.8%1,5453.0% Non-Agency (3) 749 1.4%7321.4%6571.2%6191.2%6451.3% Total Residential mortgage-backed securities 4,707 8.9%4,9239.2%4,9129.3%4,9609.6%5,1079.9% Commercial mortgage-backed securities 2,704 5.1%2,5144.7%2,3104.4%2,1734.2%2,3554.5% Other asset-backed securities (3) 1,345 2.5%1,1482.1%1,0492.0%8841.7%9051.7% Total fixed maturities, including securities pledged (5) 53,434 100.0% 53,558 100.0% 52,673 100.0% 51,787 100.0% 51,868 100.0% Fixed Maturity Securities - Contractual Maturity Dates, Due to mature: Due in one year or less 1,001 1.9%1,4102.6%1,3722.6%1,3952.7%1,5903.1% Due after one year through five years 8,703 16.3%9,00216.8%9,13217.3%9,24617.8%8,83617.0% Due after five years through ten years 10,762 20.1%10,58219.8%10,39219.7%10,15119.6%10,77820.8% Due after ten years 24,212 45.3%23,97944.8%23,50644.7%22,97844.4%22,29743.0% CMO-B 2,969 5.6%3,0645.7%3,0605.8%2,8995.6%2,9175.6% Mortgage-backed securities 4,442 8.3%4,3738.2%4,1627.9%4,2348.2%4,5458.8% Other asset-backed securities (3) 1,345 2.5%1,1482.1%1,0492.0%8841.7%9051.7% Total fixed maturities, including securities pledged (5) 53,434 100.0% 53,558 100.0% 52,673 100.0% 51,787 100.0% 51,868 100.0% Fixed Maturity Securities - NAIC Quality Designation 1 30,942 57.9%30,80157.4%30,54958.0%30,22958.4%30,56758.9% 2 19,947 37.3%20,17237.7%19,66737.3%19,06536.8%18,73936.1% 3 1,889 3.5%2,0163.8%1,8793.6%1,9443.8%1,9633.8% 4 512 1.0%4130.8%4160.8%3870.7%3880.8% 5 33 0.1%480.1%480.1%460.1%710.1% 6 111 0.2%1080.2%1140.2%1160.2%1400.3% Total fixed maturities, including securities pledged (4) (5) 53,434 100.0% 53,558 100.0% 52,673 100.0% 51,787 100.0% 51,868 100.0% Fixed Maturity Securities - ARO Quality Rating AAA 9,702 18.2%9,84218.4%9,89218.8%9,94619.2%10,04519.4% AA 3,611 6.8%3,7106.9%3,7137.0%3,7887.3%3,7497.2% A 16,329 30.6%15,97929.8%15,78630.0%15,26529.5%15,46929.8% BBB 20,204 37.7%20,44738.2%19,74637.5%19,36137.4%19,07036.8% BB 2,058 3.8%2,1474.0%2,0183.8%2,0413.9%2,0694.0% B and below 1,530 2.9%1,4332.7%1,5182.9%1,3862.7%1,4662.8% Total fixed maturities, including securities pledged (5) 53,434 100.0% 53,558 100.0% 52,673 100.0% 51,787 100.0% 51,868 100.0% (1) Adjustments include the elimination of intercompany transactions between the Company and its consolidated investment entities, primarily the elimination of the Company’s equity at risk recorded as investments by the Company (before consolidation) against either equity (private equity and real estate partnership funds) or senior and subordinated debt (CLOs) of the funds. (2) Fixed Maturity Securities includes fixed maturities,available for sale , fixed maturities at fair value using the fair value option and securities pledged to creditors. (3) Subprime asset-backed securities are included as a component of Non-Agency RMBS under this presentation. (4) ARO ratings do not directly translate into NAIC ratings. (4) ARO ratings do not directly translate into NAIC ratings. (5) Includes fixed maturities securities related to businesses exited through reinsurance where assets are retained on the Company’s balance sheet. (5) Includes fixed maturities securities related to businesses exited through reinsurance where assets are retained on the Company’s balance sheet.
|
|
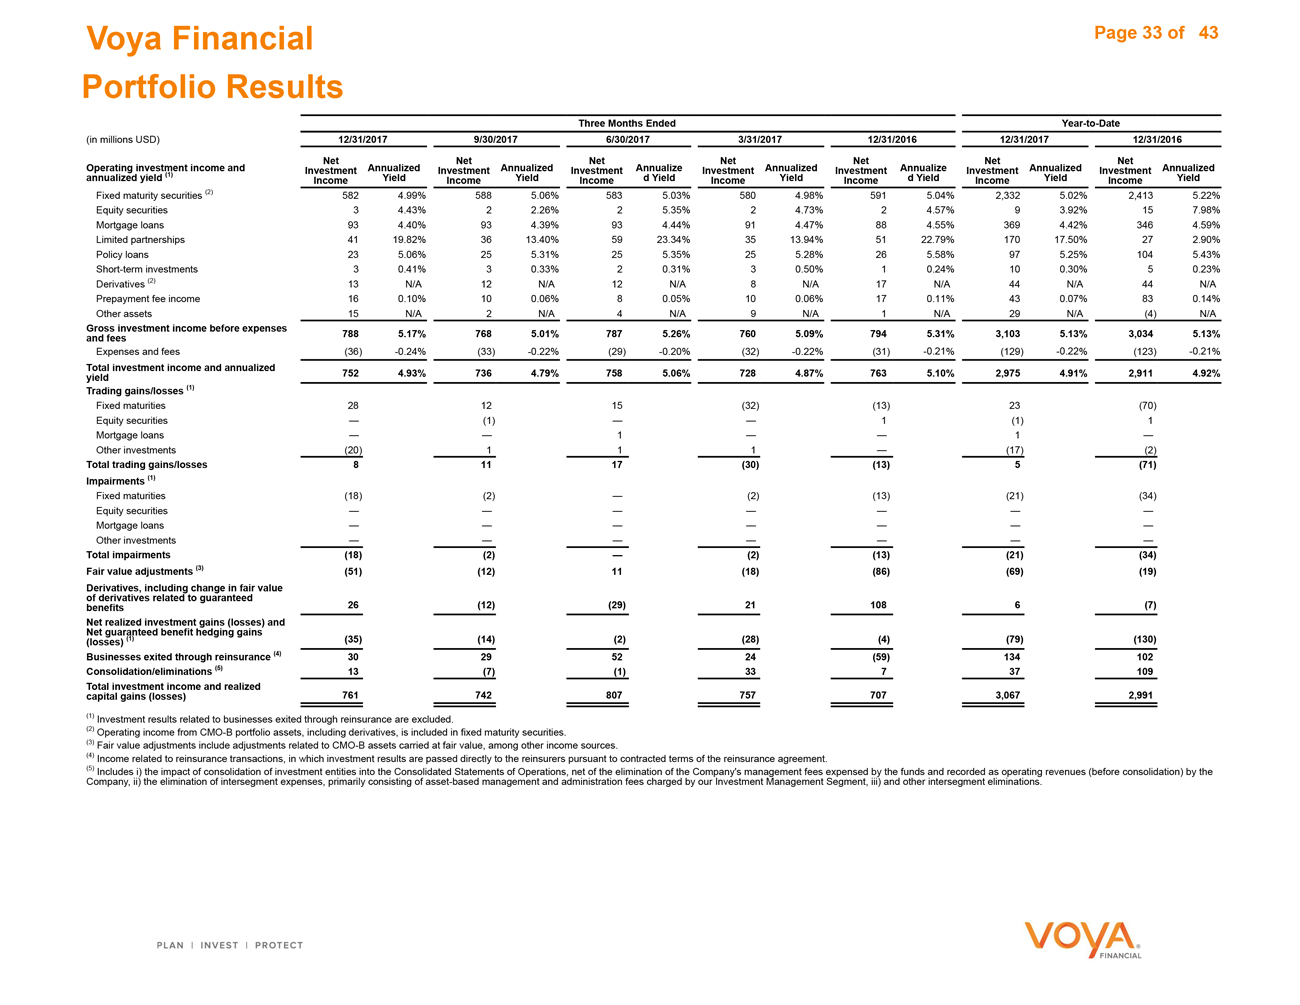
Voya Financial Page 33 of 43 Portfolio Results Three Months Ended Year-to-Date (in millions USD) 12/31/2017 9/30/2017 6/30/2017 3/31/2017 12/31/2016 12/31/2017 12/31/2016 Operating investment income and annualized yield (1) Net Investment Income Annualized Yield Net Investment Income Annualized Yield Net Investment Income Annualize d Yield Net Investment Income Annualized Yield Net Investment Income Annualize d Yield Net Investment Income Annualized Yield Net Investment Income Annualized Yield Fixed maturity securities (2) 582 4.99% 588 5.06% 583 5.03% 580 4.98% 591 5.04% 2,332 5.02% 2,413 5.22% Equity securities 3 4.43% 2 2.26% 2 5.35% 2 4.73% 2 4.57% 9 3.92% 15 7.98% Mortgage loans 93 4.40% 93 4.39% 93 4.44% 91 4.47% 88 4.55% 369 4.42% 346 4.59% Limited partnerships 41 19.82% 36 13.40% 59 23.34% 35 13.94% 51 22.79% 170 17.50% 27 2.90% Policy loans 23 5.06% 25 5.31% 25 5.35% 25 5.28% 26 5.58% 97 5.25% 104 5.43% Short-term investments 3 0.41% 3 0.33% 2 0.31% 3 0.50% 1 0.24% 10 0.30% 5 0.23% Derivatives (2) 13 N/A 12 N/A 12 N/A 8 N/A 17 N/A 44 N/A 44 N/A Prepayment fee income 16 0.10% 10 0.06% 8 0.05% 10 0.06% 17 0.11% 43 0.07% 83 0.14% Other assets 15 N/A 2 N/A 4 N/A 9 N/A 1 N/A 29 N/A (4) N/A Gross investment income before expenses and fees 788 5.17% 768 5.01% 787 5.26% 760 5.09% 794 5.31% 3,103 5.13% 3,034 5.13% Expenses and fees (36) -0.24% (33) -0.22% (29) -0.20% (32) -0.22% (31) -0.21% (129) -0.22% (123) -0.21% Total investment income and annualized yield 752 4.93% 736 4.79% 758 5.06% 728 4.87% 763 5.10% 2,975 4.91% 2,911 4.92% Trading gains/losses (1) Fixed maturities 28 12 15 (32) (13) 23 (70) Equity securities — (1) — — 1 (1) 1 Mortgage loans — — 1 — — 1 — Other investments (20) 1 1 1 — (17) (2) Total trading gains/losses 8 11 17 (30) (13) 5 (71) Impairments (1) Fixed maturities (18) (2) — (2) (13) (21) (34) Equity securities — — — — — — — Mortgage loans — — — — — — — Other investments — — — — — — — Total impairments (18) (2) — (2) (13) (21) (34) Fair value adjustments (3) (51) (12) 11 (18) (86) (69) (19) Derivatives, including change in fair value of derivatives related to guaranteed benefits 26 (12) (29) 21 108 6 (7) Net realized investment gains (losses) and Net guaranteed benefit hedging gains (losses) (1) (35) (14) (2) (28) (4) (79) (130) Businesses exited through reinsurance (4) 30 29 52 24 (59) 134 102 Consolidation/eliminations (5) 13 (7) (1) 33 7 37 109 Total investment income and realized capital gains (losses) 761 742 807 757 707 3,067 2,991 (1) Investment results related to businesses exited through reinsurance are excluded. (2) Operating income from CMO-B portfolio assets, including derivatives, is included in fixed maturity securities. (3) Fair value adjustments include adjustments related to CMO-B assets carried at fair value, among other income sources. (4) Income related to reinsurance transactions, in which investment results are passed directly to the reinsurers pursuant to contracted terms of the reinsurance agreement. (5) Includes i) the impact of consolidation of investment entities into the Consolidated Statements of Operations, net of the elimination of the Company’s management fees expensed by the funds and recorded as operating revenues (before consolidation) by the Company, ii) the elimination of intersegment expenses, primarily consisting of asset-based management and administration fees charged by our Investment Management Segment, iii) and other intersegment eliminations.
|
|
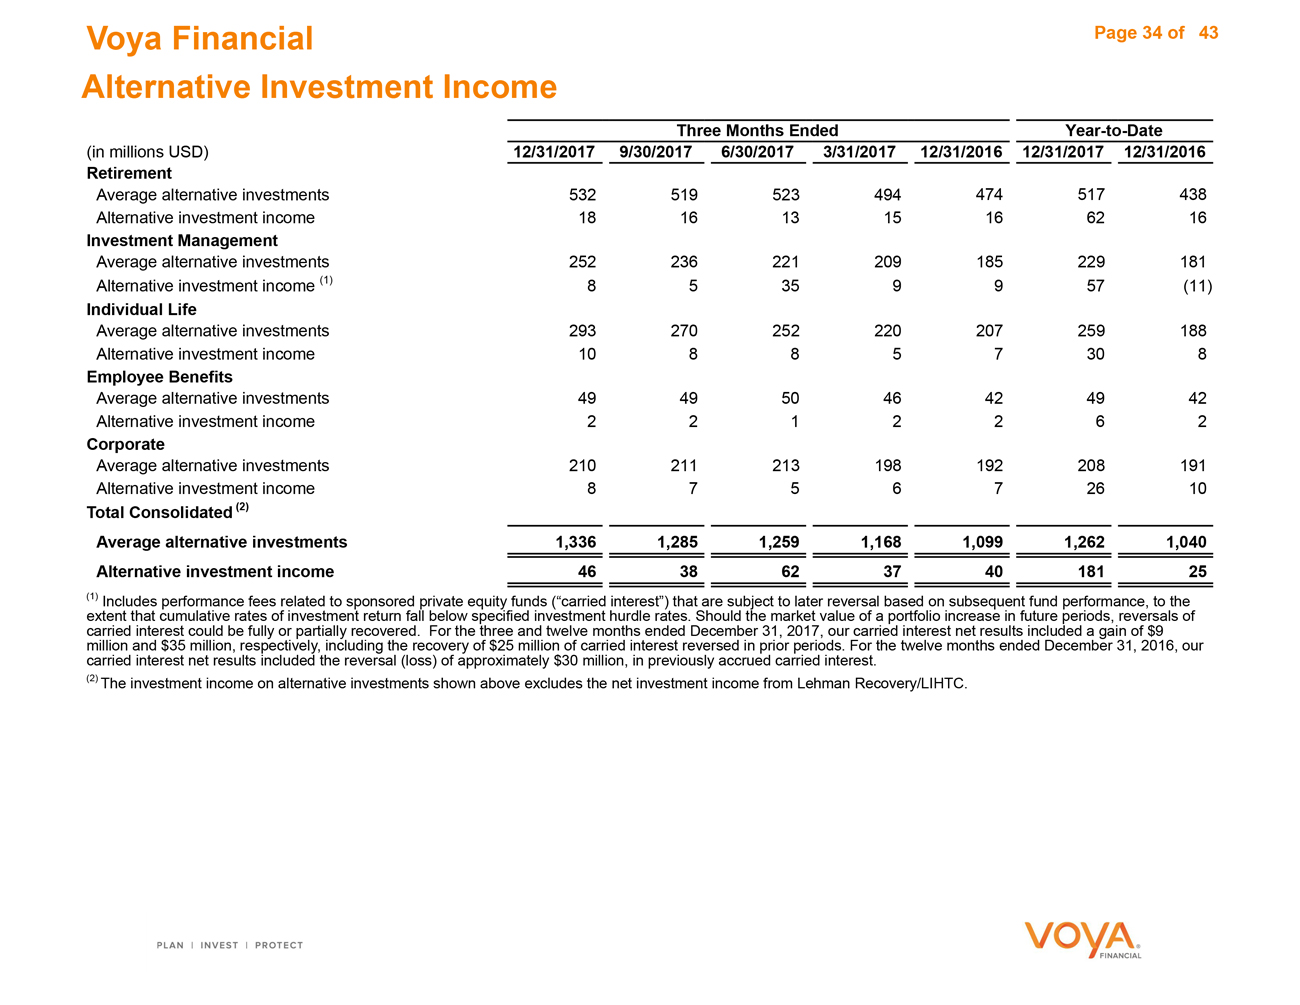
Voya Financial Page 34 of 43 Alternative Investment Income Three Months Ended Year-to-Date (in millions USD) 12/31/2017 9/30/2017 6/30/2017 3/31/2017 12/31/2016 12/31/2017 12/31/2016 Retirement Average alternative investments 532 519523494474517438 Alternative investment income 18 161315166216 Investment Management Average alternative investments 252 236221209185229181 Alternative investment income (1) 8 5359957(11) Individual Life Average alternative investments 293 270252220207259188 Alternative investment income 10 8857308 Employee Benefits Average alternative investments 49 495046424942 Alternative investment income 2 212262 Corporate Average alternative investments 210 211213198192208191 Alternative investment income Total Consolidated (2) 8 75672610 Average alternative investments 1,336 1,285 1,259 1,168 1,099 1,262 1,040 Alternative investment income 46 38 62 37 40 181 25 (1) Includes performance fees related to sponsored private equity funds (“carried interest”) that are subject to later reversal based on subsequent fund performance, to the extent that cumulative rates of investment return fall below specified investment hurdle rates. Should the market value of a portfolio increase in future periods, reversals of carried interest could be fully or partially recovered. For the three and twelve months ended December 31, 2017, our carried interest net results included a gain of $9 million and $35 million, respectively, including the recovery of $25 million of carried interest reversed in prior periods. For the twelve months ended December 31, 2016, our carried interest net results included the reversal (loss) of approximately $30 million, in previously accrued carried interest. (2) The investment income on alternative investments shown above excludes the net investment income from Lehman Recovery/LIHTC.
|

|
Reconciliations
|
|
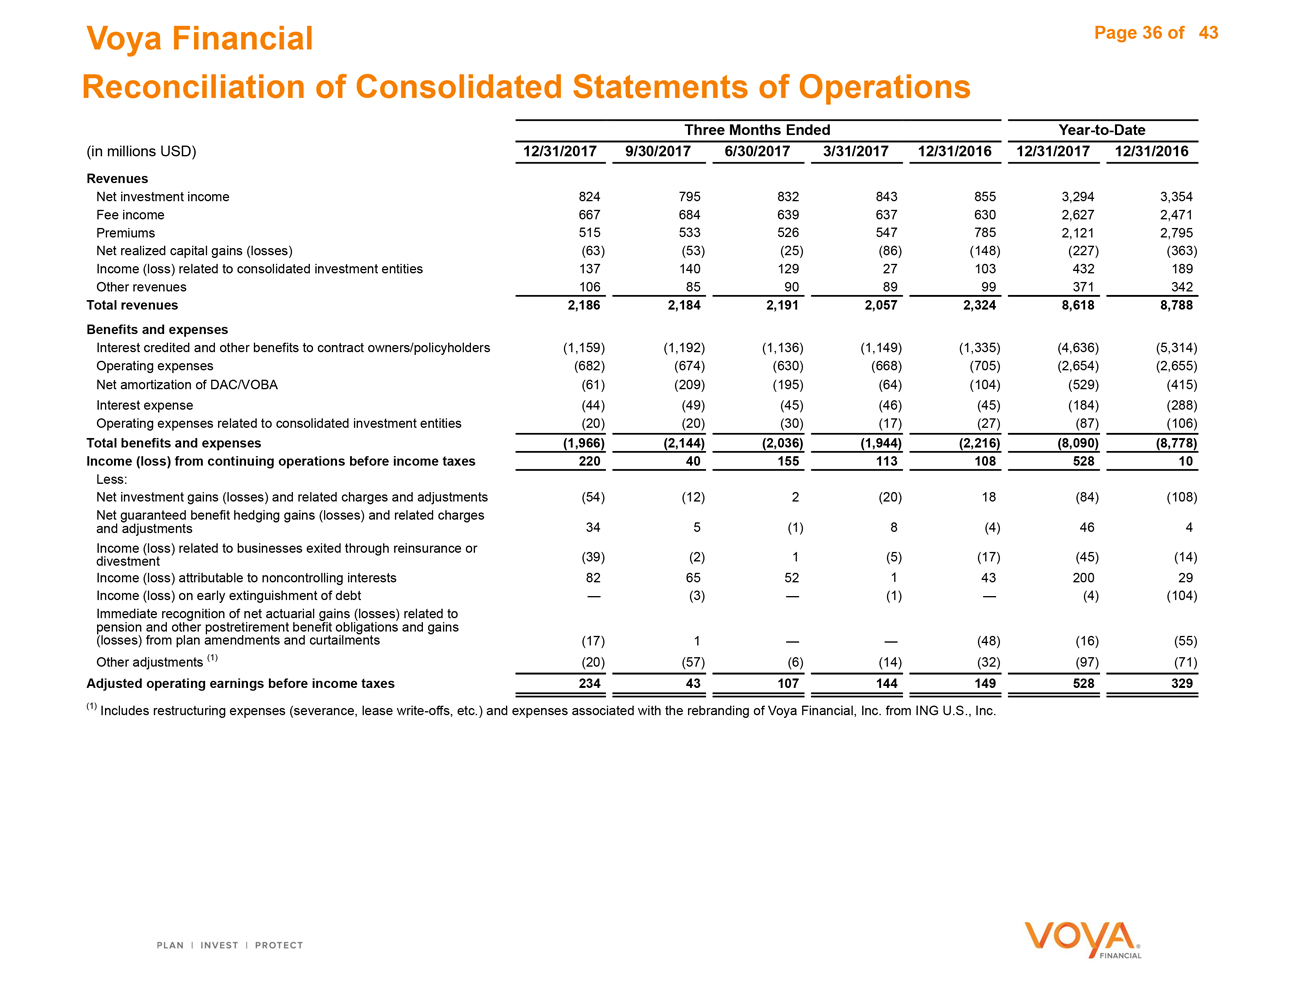
Three Months Ended Year-to-Date Voya Financial Page 36 of 46 Reconciliation of Consolidated Statements of Operations (in millions USD) 12/31/2017 9/30/2017 6/30/2017 3/31/2017 12/31/2016 12/31/2017 12/31/2016 Revenues Net investment income 824 7958328438553,2943,354 Fee income 667 6846396376302,6272,471 Premiums 515 5335265477852,1212,795 Net realized capital gains (losses) (63) (53)(25)(86)(148)(227)(363) Income (loss) related to consolidated investment entities 137 14012927103432189 Other revenues 106 85908999371342 Total revenues 2,186 2,184 2,191 2,057 2,324 8,618 8,788 Benefits and expenses Interest credited and other benefits to contract owners/policyholders (1,159) (1,192)(1,136)(1,149)(1,335)(4,636)(5,314) Operating expenses (682) (674)(630)(668)(705)(2,654)(2,655) Net amortization of DAC/VOBA (61) (209)(195)(64)(104)(529)(415) Interest expense (44) (49)(45)(46)(45)(184)(288) Operating expenses related to consolidated investment entities (20) (20)(30)(17)(27)(87)(106) Total benefits and expenses (1,966) (2,144) (2,036) (1,944) (2,216) (8,090) (8,778) Income (loss) from continuing operations before income taxes 220 40 155 113 108 528 10 Less: Net investment gains (losses) and related charges and adjustments (54) (12)2(20)18(84)(108) Net guaranteed benefit hedging gains (losses) and related charges and adjustments 34 5(1)8(4)464 Income (loss) related to businesses exited through reinsurance or divestment (39) (2)1(5)(17)(45)(14) Income (loss) attributable to noncontrolling interests 82 655214320029 Income (loss) on early extinguishment of debt — (3)—(1)—(4)(104) Immediate recognition of net actuarial gains (losses) related to pension and other postretirement benefit obligations and gains (losses) from plan amendments and curtailments (17) 1(48) (16)(55) Other adjustments (1) (20) (57)(6)(14)(32)(97)(71) Adjusted operating earnings before income taxes 234 43 107 144 149 528 329 (1) Includes restructuring expenses (severance, lease write-offs, etc.) and expenses associated with the rebranding of Voya Financial, Inc. from ING U.S., Inc.
|
|
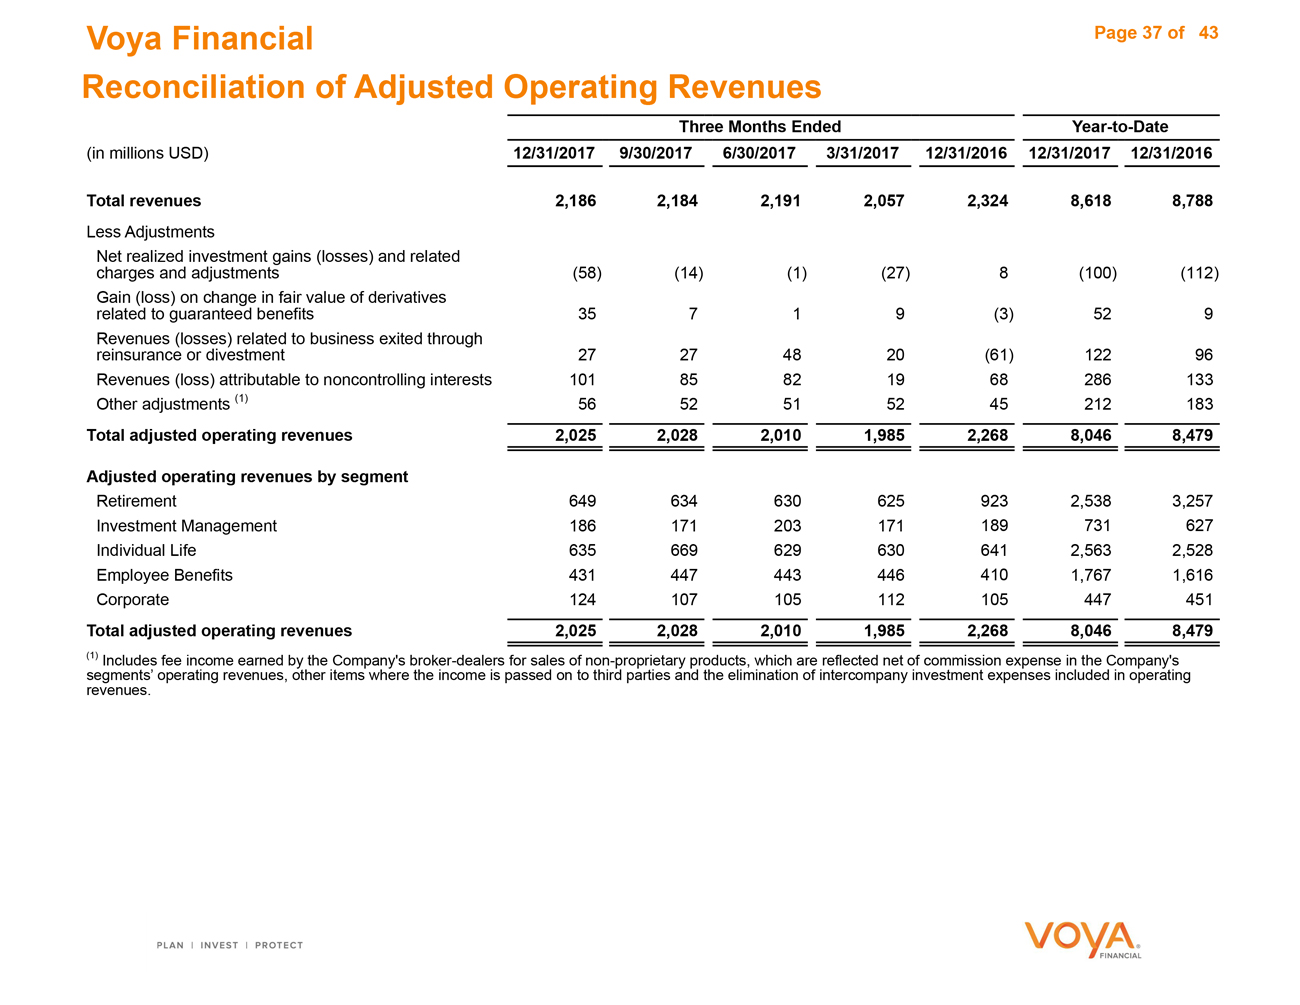
Voya Financial Page 37 of 43 Reconciliation of Adjusted Operating Revenues Three Months EndedYear-to-Date
(in millions USD) 12/31/2017 9/30/2017 6/30/2017 3/31/2017 12/31/2016 12/31/2017 12/31/2016
Total revenues 2,186 2,184 2,191 2,057 2,324 8,618 8,788
Less Adjustments
Net realized investment gains (losses) and related charges and adjustments (58) (14)(1)(27)8(100)(112)
Gain (loss) on change in fair value of derivatives related to guaranteed benefits 35 719(3)529
Revenues (losses) related to business exited through reinsurance or divestment 27 274820(61)12296
Revenues (loss) attributable to noncontrolling interests 101 85821968286133
Other adjustments (1) 56 52515245212183 Total adjusted operating revenues 2,025 2,028 2,010 1,985 2,268 8,046 8,479
Adjusted operating revenues by segment Retirement 649 6346306259232,5383,257 Investment Management 186 171203171189731627 Individual Life 635 6696296306412,5632,528 Employee Benefits 431 4474434464101,7671,616
Corporate 124 107105112105447451 Total adjusted operating revenues 2,025 2,028 2,010 1,985 2,268 8,046 8,479
(1) Includes fee income earned by the Company’s broker-dealers for sales ofnon-proprietary products, which are reflected net of commission expense in the Company’s
segments’ operating revenues, other items where the income is passed on to third parties and the elimination of intercompany investment expenses included in operating revenues.
|

|
Reconciliation of Adjusted Operating Earnings - excluding Unlocking; Adjusted Return on Capital (1) Page 38 of 43 (in millions USD, unless otherwise indicated) Retirement Twelve Months Ended (1) 12/31/2017 9/30/2017 6/30/2017 3/31/2017 12/31/2016 Adjusted operating earnings before income taxes Less: 456 431387494450 DAC/VOBA and other intangibles unlocking (137) (148)(178)(54)(66) Gain on Lehman Recovery — 4444 Adjusted Operating Earnings - excluding Unlocking before interest 593 574561544512 Income tax expense 190 184180174164 Adjusted Operating Earnings - excluding Unlocking before interest and after income taxes 403 391 381 370 348 Average Capital 3,928 3,9563,9743,9823,964 Ending Capital 4,130 3,8563,8524,0154,068 Adjusted Return on Capital 10.3% 9.9% 9.6% 9.3% 8.8% Investment Management Adjusted operating earnings before income taxes Less: 248 253 251 197 171 Gain on Lehman Recovery — — 3 3 3 Adjusted Operating Earnings - excluding Unlocking before interest 248 252 248 195 168 Income tax expense 79 81 79 62 54 Adjusted Operating Earnings - excluding Unlocking before interest and after income taxes 169 172 168 132 114 Average Capital 308 306 300 295 297 Ending Capital 290 311 319 309 295 Adjusted Return on Capital 54.9% 56.1% 56.1% 44.8% 38.5% (1) Due to rounding, trailing twelve month totals may not equal the sum of the quarters
|
|
Reconciliation of Adjusted Operating Earnings - excluding Unlocking; Adjusted Return on Capital (1) Page 39 of 43 (in millions USD, unless otherwise indicated) Individual Life Twelve Months Ended (1) 12/31/2017 9/30/2017 6/30/2017 3/31/2017 12/31/2016 Adjusted operating earnings before income taxes Less: 91 71614959 DAC/VOBA and other intangibles unlocking (160) (162)(141)(144)(143) Gain on Lehman Recovery — 8888 Adjusted Operating Earnings - excluding Unlocking before interest 251 225194185194 Income tax expense 80 72625962 Adjusted Operating Earnings - excluding Unlocking before interest and after income taxes 171 153 132 126 132 Average Capital 1,527 1,6141,7491,8932,015 Ending Capital 2,141 1,4761,5461,4881,677 Adjusted Return on Capital 11.2% 9.5% 7.5% 6.6% 6.6% Employee Benefits Adjusted operating earnings before income taxes Less: 126 128111116126 DAC/VOBA and other intangibles unlocking (2) (2)(2)(2)(4) Gain on Lehman Recovery — 1111 Adjusted Operating Earnings - excluding Unlocking before interest 128 129112117129 Income tax expense 41 41363841 Adjusted Operating Earnings - excluding Unlocking before interest and after income taxes 87 87 76 80 88 Average Capital 360 359365370378 Ending Capital 387 364356367341 Adjusted Return on Capital 24.4% 24.3% 20.8% 21.6% 23.3% (1) Due to rounding, trailing twelve month totals may not equal the sum of the quarters.
|
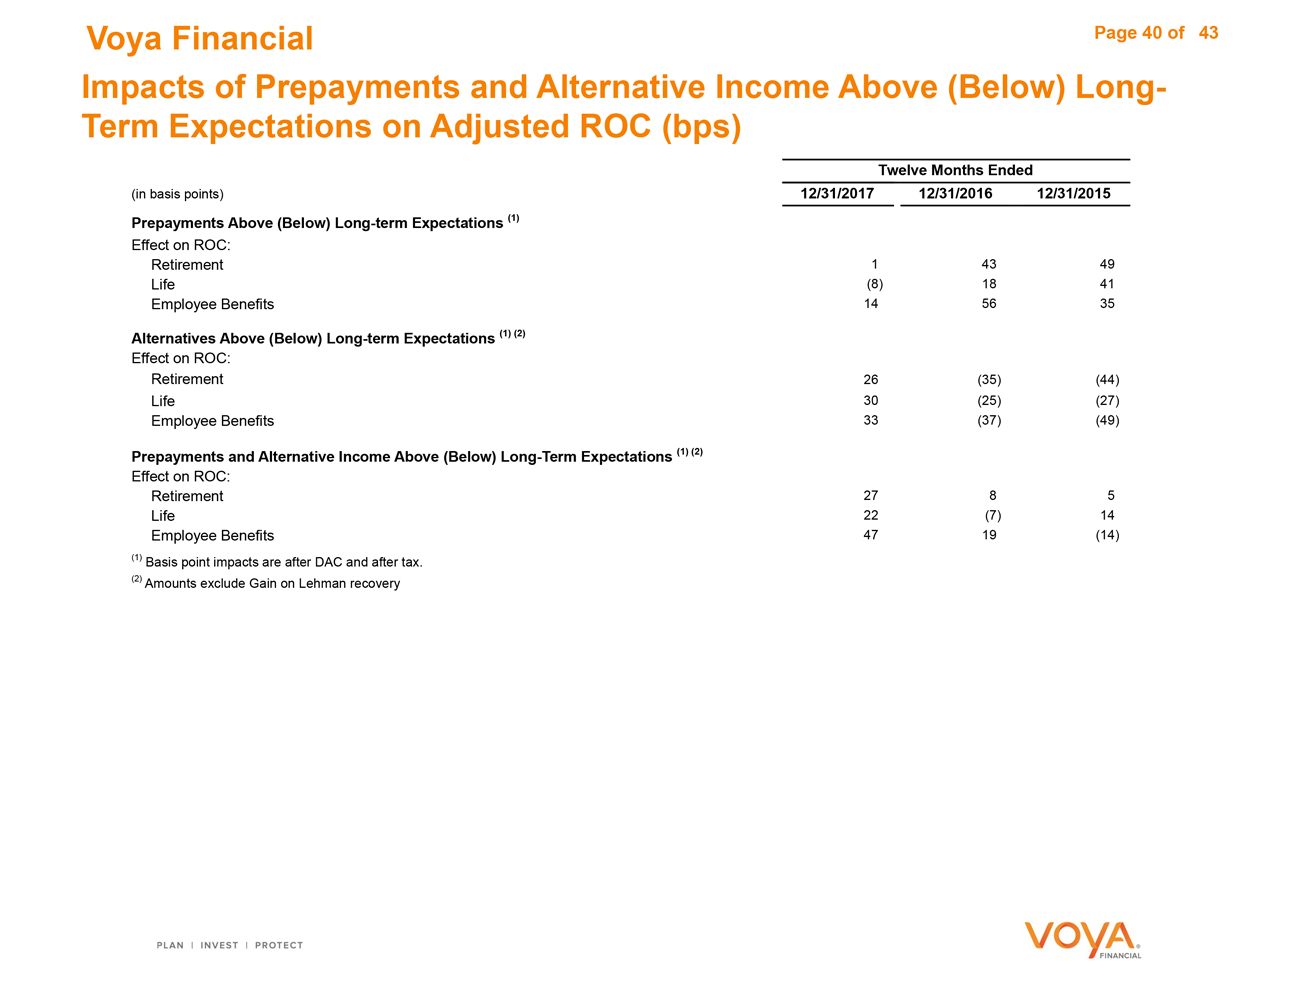
|
Voya Financial Page 40 of 43 Impacts of Prepayments and Alternative Income Above (Below) Long- Term Expectations on Adjusted ROC (bps) Twelve Months Ended (in basis points) 12/31/2017 12/31/2016 12/31/2015 Prepayments Above (Below) Long-term Expectations (1) Effect on ROC: Retirement 1 43 49 Life (8) 18 41 Employee Benefits 14 56 35 Alternatives Above (Below) Long-term Expectations (1) (2) Effect on ROC: Retirement 26 (35) (44) Life 30 (25) (27) Employee Benefits 33 (37) (49) Prepayments and Alternative Income Above (Below) Long-Term Expectations (1) (2) Effect on ROC: Retirement 27 8 5 Life 22 (7) 14 Employee Benefits 47 19 (14) (1) Basis point impacts are after DAC and after tax. (2) Amounts exclude Gain on Lehman recovery
Reconciliation of Adjusted Operating Earnings Per Share; Book Value Per Share, Excluding AOCI Page 41 of 43
(in whole dollars) Three Months Ended or As ofYear-to-Date or As of 12/31/2017 9/30/2017 6/30/2017 3/31/2017 12/31/2016 12/31/2017 12/31/2016 Net income (loss) from continuing operations available to Voya
Financial, Inc.‘s common shareholders per common share (Diluted) (17.64) 0.81 0.89 (0.75) (2.14) (16.25) (1.63)
Exclusion of per share impact of:
Net investment gains (losses) and related charges and adjustments 0.19 0.04(0.01)0.07(0.06)0.290.35
Net guaranteed benefit hedging gains (losses) and related charges
and adjustments (0.12) (0.02)—(0.03)0.01(0.16)(0.01)
Income (loss) related to businesses exited through reinsurance or
divestment 0.14 0.01—0.020.060.160.04
Income (loss) on early extinguishment of debt — 0.01———0.010.33
Immediate recognition of net actuarial gains (losses) related to pension and other postretirement benefit obligations and gains
(losses) from plan amendments and curtailments 0.06 ———0.160.060.18
Other adjustments to operating earnings 0.07 0.200.020.050.090.330.22
Effect of discontinued operations 14.58 (0.73)(0.34)0.852.4614.011.68
Effect of assumed tax rate vs actual effective tax rate 3.53 (0.16)(0.17)0.30(0.07)3.43(0.06)
Adjustment due to antidilutive effect of net loss in the current period 0.06 ———0.010.04—
Adjusted operating earnings per share (Diluted) (1) 0.87 0.16 0.39 0.51 0.52 1.92 1.10
Impact of unlocking to earnings per share (Diluted) — 0.700.42(0.02)—1.090.66
Adjusted operating earnings per share (Diluted) - ex Unlocking 0.87 0.86 0.81 0.49 0.52 3.01 1.76
Book value per share, including AOCI 58.19 75.9874.3067.8866.7858.1966.78
Per share impact of AOCI (15.88) (15.20)(14.50)(11.12)(9.87)(15.88)(9.87)
Book value per share, excluding AOCI 42.31 60.7859.8056.7656.9142.3156.91
Reconciliation of shares used in Total Consolidated Operating
earnings per share (Diluted)
Weighted-average common shares outstanding - Diluted 179 182188192195184201
Dilutive effect of the exercise or issuance of stock-based awards (1) 4 ——2232
Weighted average common shares outstanding - Diluted (Operating) (1) 183 182188194197187203
Debt to capital 25.7 % 20.2 %20.6 %21.2 %21.5 %25.7 %21.5 %
Capital impact of AOCI 6.5 % 3.9 %3.8 %3.1 %2.8 %6.5 %2.8 %
Impact of 25% equity treatment afforded to subordinate debt (1.7)% (1.4)%(1.4)%(1.3)%(1.3)%(1.7)%(1.3)%
Adjusted Debt to capital 30.5 % 22.7 %23.0 %23.0 %23.0 %30.5 %23.0 %
(1) For periods in which there is a Net loss available to common shareholders, Adjusted operating earnings per share calculation includes additional dilutive shares, as the inclusion of these shares for stock compensation plans would not be anti-dilutive to the Adjusted operating earnings per share calculation.
Reconciliation of Investment Management Adjusted Operating Margin, Excluding Investment Capital Voya Financial Page 42 of 43
Three Months Ended Twelve Months Ended
(in millions USD, unless otherwise indicated) 12/31/2017 9/30/2017 12/31/2016 12/31/2017 12/31/2016 12/31/2015
Adjusted operating revenues (1) 186 171189731624622
Adjusted operating expenses (125) (118)(124)(483)(456)(440)
Adjusted operating earnings before income taxes 61 5465248168182
Adjusted operating margin 32.3% 31.3%34.2%33.9%26.9%29.2%
Adjusted operating revenues (1) 186 171189731624622
Less:
Investment Capital Results (1) 8 5857(11)1
Revenues excluding Investment Capital 178 166181674635621
Adjusted operating expenses (125) (118)(124)(483)(456)(440)
Adjusted operating earnings excluding Investment Capital 53 4956191179181
Adjusted operating margin excluding Investment Capital 29.3% 29.2%31.1%28.3%28.2%29.1%
(1) Excludes gain from Lehman recovery in 2016.
|
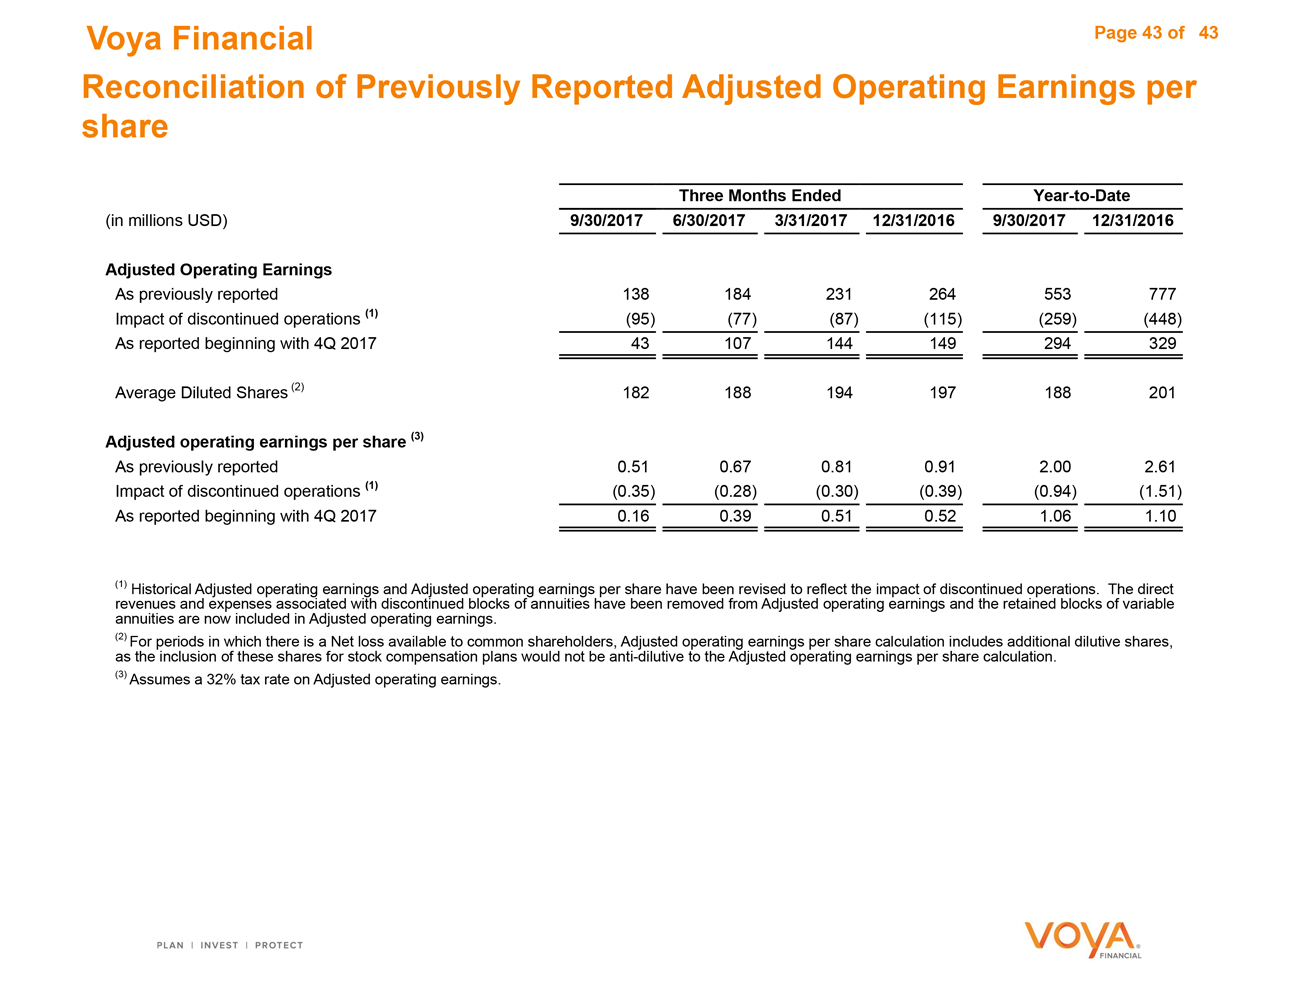
|
Voya Financial Page 43 of 43 Reconciliation of Previously Reported Adjusted Operating Earnings per share Three Months EndedYear-to-Date (in millions USD) 9/30/2017 6/30/2017 3/31/2017 12/31/2016 9/30/2017 12/31/2016 Adjusted Operating Earnings As previously reported 138 184 231 264 553 777 Impact of discontinued operations (1) (95) (77) (87) (115) (259) (448) As reported beginning with 4Q 2017 43 107 144 149 294 329 Average Diluted Shares (2) 182 188 194 197 188 201 Adjusted operating earnings per share (3) As previously reported 0.51 0.67 0.81 0.91 2.00 2.61 Impact of discontinued operations (1) (0.35) (0.28) (0.30) (0.39) (0.94) (1.51) As reported beginning with 4Q 2017 0.16 0.39 0.51 0.52 1.06 1.10 (1) Historical Adjusted operating earnings and Adjusted operating earnings per share have been revised to reflect the impact of discontinued operations. The direct revenues and expenses associated with discontinued blocks of annuities have been removed from Adjusted operating earnings and the retained blocks of variable annuities are now included in Adjusted operating earnings. (2) For periods in which there is a Net loss available to common shareholders, Adjusted operating earnings per share calculation includes additional dilutive shares, as the inclusion of these shares for stock compensation plans would not be anti-dilutive to the Adjusted operating earnings per share calculation. (3) Assumes a 32% tax rate on Adjusted operating earnings.