Investor Day 2018 Exhibit 99.2 Voya Financial, Inc. | Investor Day 2018

Introduction Mike Katz Senior Vice President, Investor Relations and Enterprise FP&A

Forward-Looking and Other Cautionary Statements This presentation and the remarks made orally contain forward-looking statements. Forward-looking statements include statements relating to future developments in our business or expectations for our future financial performance and any statement not involving a historical fact. Forward-looking statements use words such as “anticipate,” “believe,” “estimate,” “expect,” “intend,” “plan,” and other words and terms of similar meaning in connection with a discussion of future operating or financial performance. Actual results, performance or events may differ materially from those projected in any forward-looking statement due to, among other things, (i) general economic conditions, particularly economic conditions in our core markets, (ii) performance of financial markets, including emerging markets, (iii) the frequency and severity of insured loss events, (iv) mortality and morbidity levels, (v) persistency and lapse levels, (vi) interest rates, (vii) currency exchange rates, (viii) general competitive factors, (ix) changes in laws and regulations, such as those relating to Federal taxation, state insurance regulations and NAIC regulations and guidelines, (x) changes in the policies of governments and/or regulatory authorities, and (xi) our ability to successfully manage the separation of the fixed and variable annuities business that Voya sold to VA Capital LLC on June 1, 2018, including the transaction services, on the expected timeline and economic terms. Factors that may cause actual results to differ from those in any forward-looking statement also include those described under “Risk Factors” and “Management’s Discussion and Analysis of Results of Operations and Financial Condition – Trends and Uncertainties” in our Annual Report on Form 10-K for the year ended December 31, 2017 as filed with the Securities and Exchange Commission (“SEC”) on February 23, 2018, and our Quarterly Report on Form 10-Q for the three months ended September 30, 2018, filed with the SEC on November 1, 2018. This presentation and the remarks made orally contain certain non-GAAP financial measures, as identified herein. For a reconciliation of these measures to the most directly comparable GAAP financial measures, see the document entitled “2018 Investor Day – GAAP Reconciliations”, which is available on Voya Financial’s investor website at investors.voya.com. This presentation contains certain projections of non-GAAP financial measures. Projections of such non-GAAP financial measures, as well as projections of the most closely comparable GAAP financial measures, include factors that are both difficult to predict and not within Voya Financial’s control such as future interest rate and equity market prices. As a result, any reconciliations of such non-GAAP financial measures would not be possible without unreasonable effort.

Agenda 1 Welcome Remarks and Video Mike Katz 1:00 – 1:10 p.m. 2 Voya’s Next Chapter – Growth Rod Martin 1:10 – 1:25 p.m. 3 Retirement Charlie Nelson 1:25 – 1:45 p.m. 4 Employee Benefits Rob Grubka 1:45 – 2:05 p.m. 5 Voya Cares Heather Lavallee / Bill Harmon 2:05 – 2:15 p.m. 6 Presentation Break 2:15 – 2:30 p.m. 7 Investment Management Christine Hurtsellers 2:30 – 2:50 p.m. 8 Technology & Innovation Maggie Parent 2:50 – 3:00 p.m. 9 Financial Update Mike Smith 3:00 – 3:15 p.m. 10 All Speaker Q&A All Presenters 3:15 – 4:15 p.m. 11 Closing Remarks Rod Martin 4:15 – 4:20 p.m. 12 Cocktail Reception 4:20 – 5:30 p.m.

Voya’s Next Chapter – Growth Rod Martin Chairman and Chief Executive Officer

Investor Day Key Takeaways Team track record, brand, and culture are differentiators Organic growth, cost savings, and capital deployment provide clear path for future EPS growth and higher valuation Voya has three high-growth, high-return, capital-light complementary businesses focused on the workplace and institutional customers
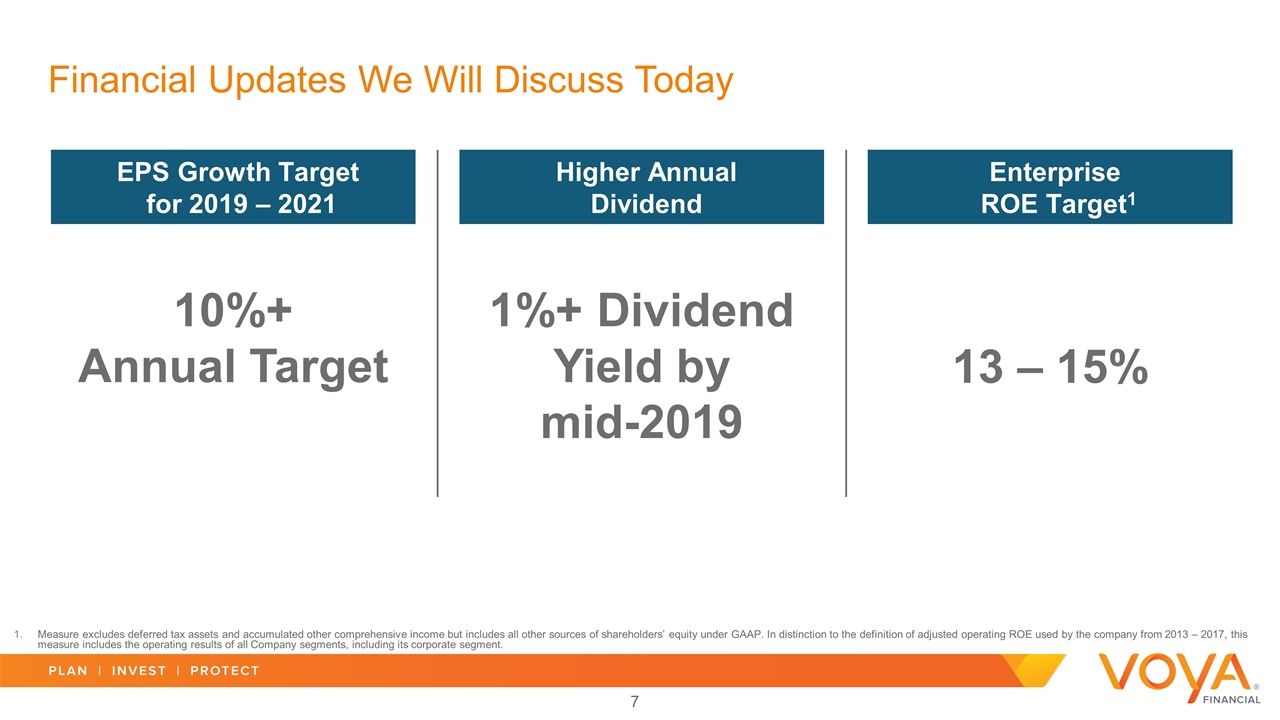
Enterprise ROE Target1 EPS Growth Target for 2019 – 2021 Higher Annual Dividend Financial Updates We Will Discuss Today 10%+ Annual Target 1%+ Dividend Yield by mid-2019 13 – 15% Measure excludes deferred tax assets and accumulated other comprehensive income but includes all other sources of shareholders’ equity under GAAP. In distinction to the definition of adjusted operating ROE used by the company from 2013 – 2017, this measure includes the operating results of all Company segments, including its corporate segment.
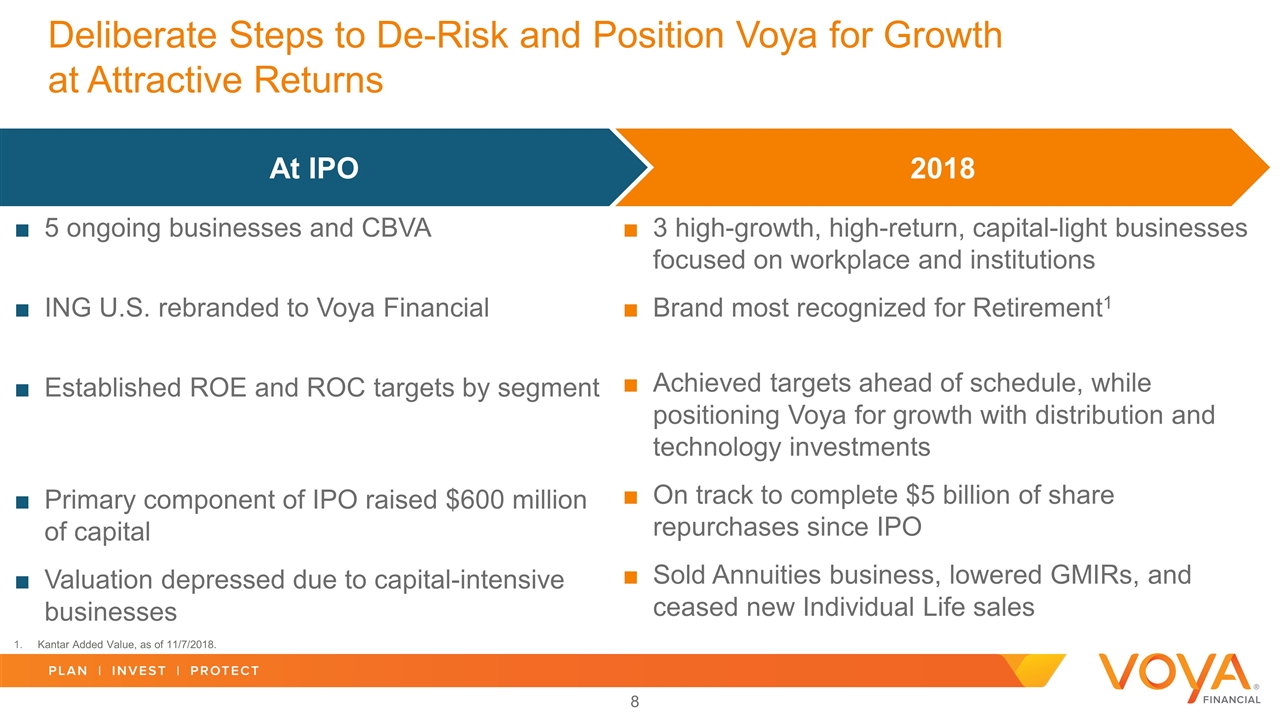
5 ongoing businesses and CBVA ING U.S. rebranded to Voya Financial Established ROE and ROC targets by segment Primary component of IPO raised $600 million of capital Valuation depressed due to capital-intensive businesses Deliberate Steps to De-Risk and Position Voya for Growth at Attractive Returns At IPO 2018 3 high-growth, high-return, capital-light businesses focused on workplace and institutions Brand most recognized for Retirement1 Achieved targets ahead of schedule, while positioning Voya for growth with distribution and technology investments On track to complete $5 billion of share repurchases since IPO Sold Annuities business, lowered GMIRs, and ceased new Individual Life sales Kantar Added Value, as of 11/7/2018.

Voya Today – Complementary Businesses Well Positioned to Serve Workplace Participants and Institutions 3Q’18 TTM Adjusted Operating Earnings by Segment (excludes DAC/VOBA unlocking): $1,305 million1 49% 18% 12% 21% Investment Management Retirement Employee Benefits Individual Life Committed to being America’s Retirement Company High-growth, high-return, capital-light businesses provide complementary solutions to workplace and institutions Top 5 Retirement franchise with strong market share in multiple markets $200+ billion in Investment Management AUM “Must quote” Employee Benefits stop loss provider Individual Life in-force block provides earnings and capital diversification with strong free cash flow generation Pre-tax. Excludes adjusted operating earnings attributable to Corporate and all unlocking of DAC/VOBA and other intangibles. Adjusted operating earnings excluding unlocking of DAC/VOBA and other intangibles is a non-GAAP financial measure. For a reconciliation of this measure to the most directly comparable GAAP financial measure, see the document entitled "2018 Investor Day - GAAP Reconciliations", which is available on Voya's investor website at investors.voya.com, and which has been furnished as an exhibit to Voya's Current Report on Form 8-K dated November 13, 2018, available at www.sec.gov.
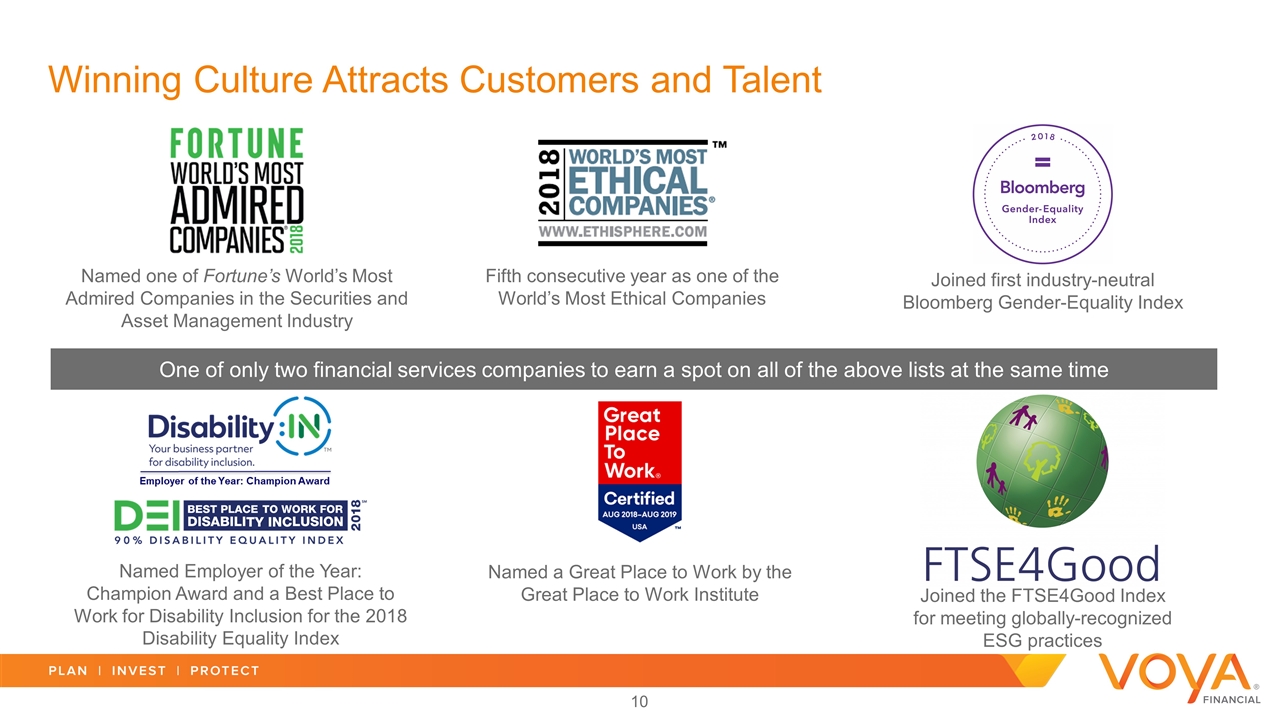
Winning Culture Attracts Customers and Talent Named one of Fortune’s World’s Most Admired Companies in the Securities and Asset Management Industry Fifth consecutive year as one of the World’s Most Ethical Companies Named Employer of the Year: Champion Award and a Best Place to Work for Disability Inclusion for the 2018 Disability Equality Index Joined first industry-neutral Bloomberg Gender-Equality Index Named a Great Place to Work by the Great Place to Work Institute Joined the FTSE4Good Index for meeting globally-recognized ESG practices One of only two financial services companies to earn a spot on all of the above lists at the same time
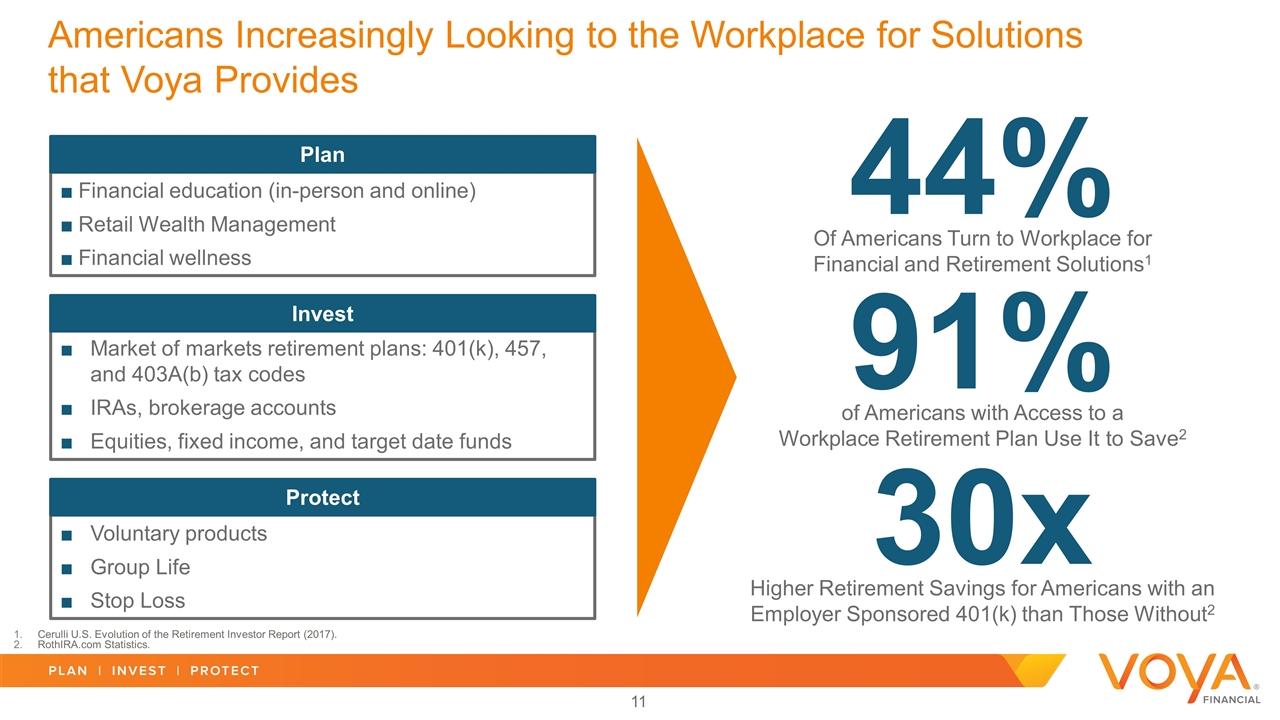
Americans Increasingly Looking to the Workplace for Solutions that Voya Provides Market of markets retirement plans: 401(k), 457, and 403A(b) tax codes IRAs, brokerage accounts Equities, fixed income, and target date funds Invest Voluntary products Group Life Stop Loss Protect Financial education (in-person and online) Retail Wealth Management Financial wellness Plan 44% Of Americans Turn to Workplace for Financial and Retirement Solutions1 91% of Americans with Access to a Workplace Retirement Plan Use It to Save2 30x Higher Retirement Savings for Americans with an Employer Sponsored 401(k) than Those Without2 Cerulli U.S. Evolution of the Retirement Investor Report (2017). RothIRA.com Statistics.
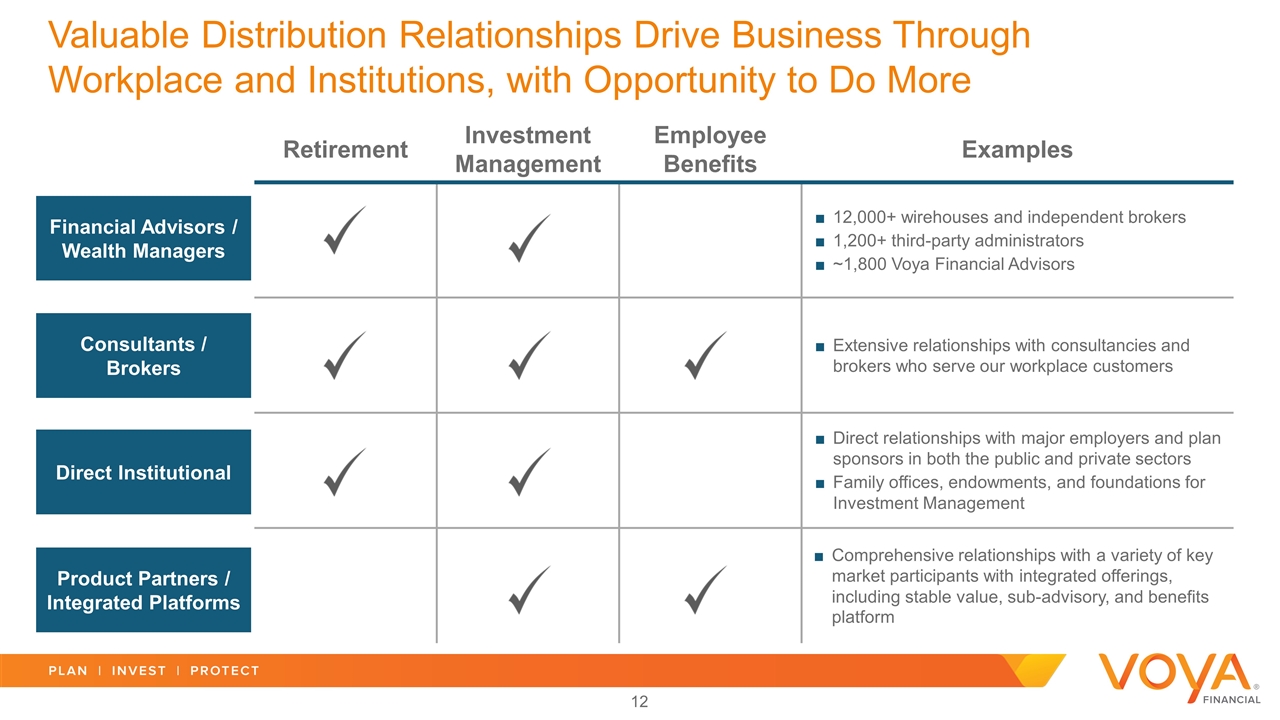
Valuable Distribution Relationships Drive Business Through Workplace and Institutions, with Opportunity to Do More Retirement Investment Management Employee Benefits Examples Financial Advisors / Wealth Managers Consultants / Brokers Direct Institutional Product Partners / Integrated Platforms 12,000+ wirehouses and independent brokers 1,200+ third-party administrators ~1,800 Voya Financial Advisors Extensive relationships with consultancies and brokers who serve our workplace customers Comprehensive relationships with a variety of key market participants with integrated offerings, including stable value, sub-advisory, and benefits platform Direct relationships with major employers and plan sponsors in both the public and private sectors Family offices, endowments, and foundations for Investment Management
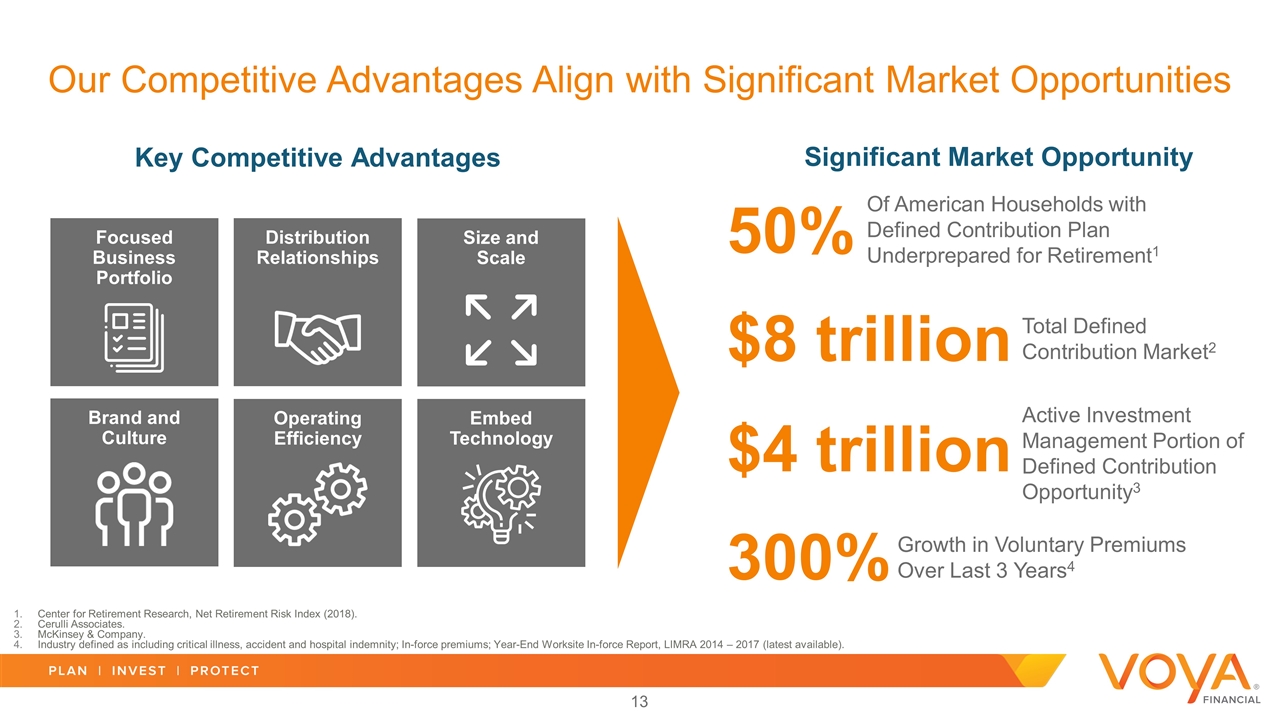
Our Competitive Advantages Align with Significant Market Opportunities Key Competitive Advantages Significant Market Opportunity Brand and Culture Size and Scale Operating Efficiency Distribution Relationships Focused Business Portfolio Embed Technology 50% Of American Households with Defined Contribution Plan Underprepared for Retirement1 $8 trillion Total Defined Contribution Market2 $4 trillion Active Investment Management Portion of Defined Contribution Opportunity3 300% Growth in Voluntary Premiums Over Last 3 Years4 Center for Retirement Research, Net Retirement Risk Index (2018). Cerulli Associates. McKinsey & Company. Industry defined as including critical illness, accident and hospital indemnity; In-force premiums; Year-End Worksite In-force Report, LIMRA 2014 – 2017 (latest available).
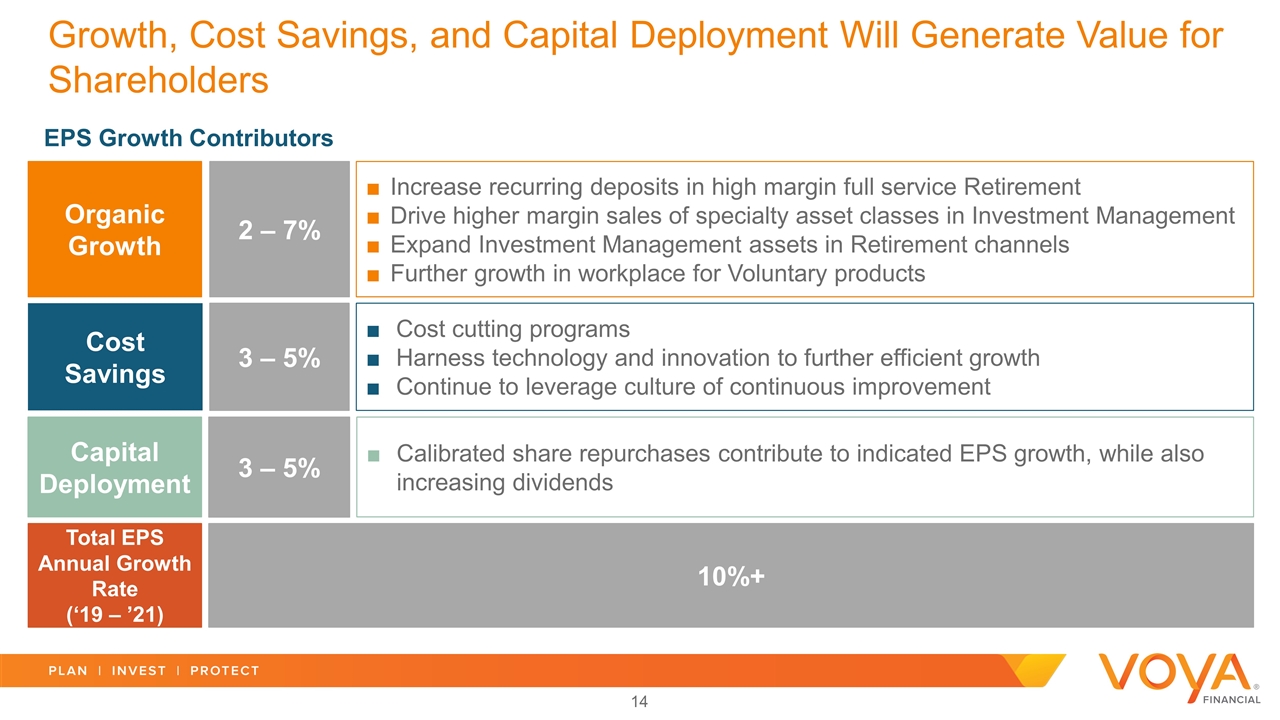
Growth, Cost Savings, and Capital Deployment Will Generate Value for Shareholders Increase recurring deposits in high margin full service Retirement Drive higher margin sales of specialty asset classes in Investment Management Expand Investment Management assets in Retirement channels Further growth in workplace for Voluntary products Organic Growth 2 – 7% Cost cutting programs Harness technology and innovation to further efficient growth Continue to leverage culture of continuous improvement Cost Savings 3 – 5% Calibrated share repurchases contribute to indicated EPS growth, while also increasing dividends Capital Deployment 3 – 5% Total EPS Annual Growth Rate (‘19 – ’21) 10%+ EPS Growth Contributors

Business Mix, Growth Prospects and Significantly Reduced Tail Risk Merit Higher Valuation S&P 500 ~15.0x 10% 6.9x 10%+ (Ex-DTA) Life Insurance 7.0 – 8.0x Mid-to-high single digits Retirement & Asset Management 8.0 – 8.5x Mid-to-high single digits Forward P/E Multiple Upside P/E Multiple1,2 Forward EPS CAGR3 Voya’s implied forward P/E multiple is excluding deferred tax asset. FY’19 consensus per FactSet, as of 11/7/2018. FactSet. Based on 3-year average multiple. FactSet. Based on 2018-2020 FY EPS estimates.

Investor Day Key Takeaways Team track record, brand, and culture are differentiators Organic growth, cost savings, and capital deployment provide clear path for future EPS growth and higher valuation Voya has three high-growth, high-return, capital-light complementary businesses focused on the workplace and institutional customers

Retirement Charlie Nelson Chief Executive Officer, Retirement and Employee Benefits
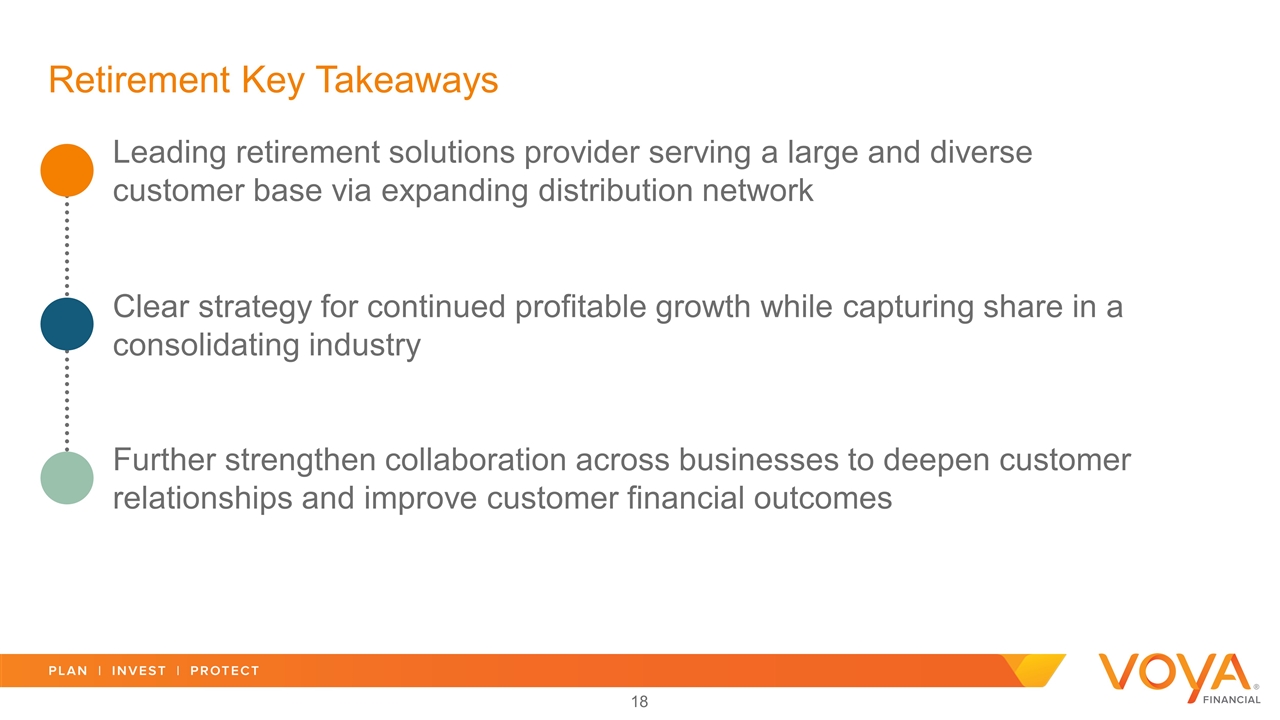
Retirement Key Takeaways Clear strategy for continued profitable growth while capturing share in a consolidating industry Further strengthen collaboration across businesses to deepen customer relationships and improve customer financial outcomes Leading retirement solutions provider serving a large and diverse customer base via expanding distribution network
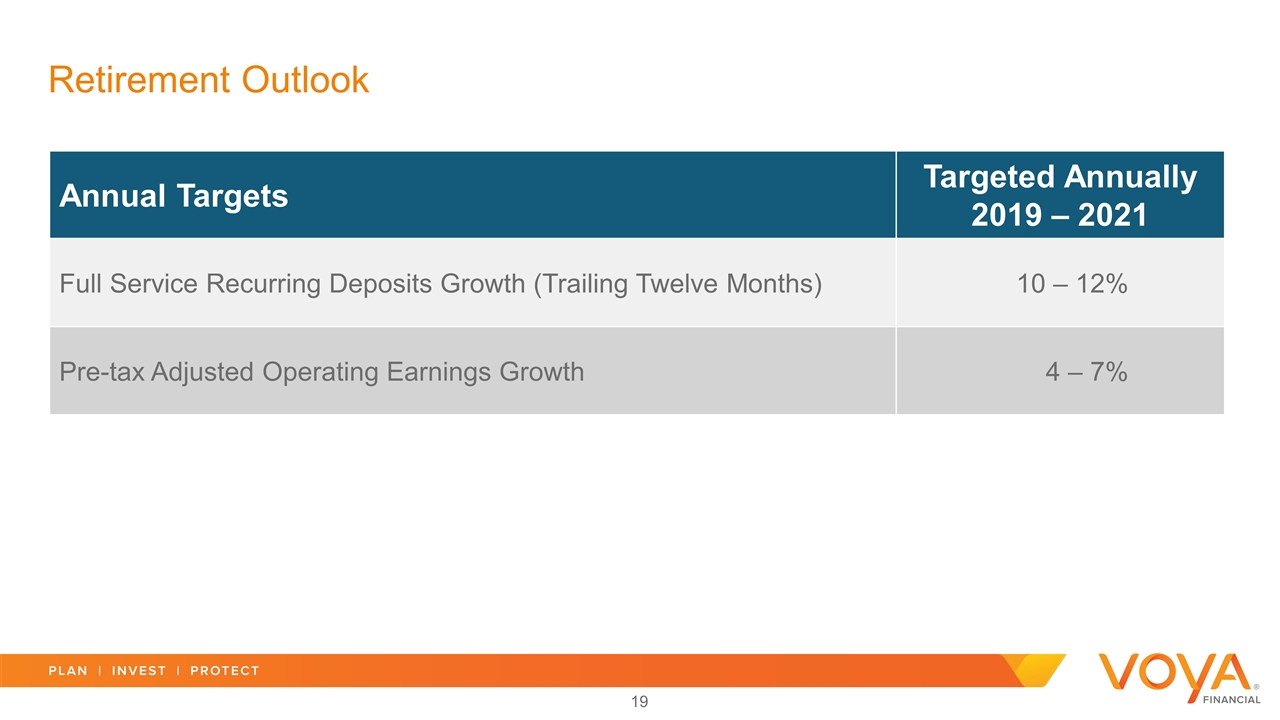
Retirement Outlook Annual Targets Targeted Annually 2019 – 2021 Full Service Recurring Deposits Growth (Trailing Twelve Months) 10 – 12% Pre-tax Adjusted Operating Earnings Growth 4 – 7%

$435B of AUM/AUA1 Scale Provider in the Defined Contribution Market: #3 by number of Plans2 #5 by number of Participants2 #6 by total Assets2 >49,000 DC Plans3 ~5.2 million Participant Accounts3 Sizeable Retail Business Providing Wealth Management, Advisory, and IRA: ~1,800 Advisors Voya Financial Advisors ranked Top Quartile Independent Broker Dealer4 Industry Leading Provider of Retirement Solutions Across a Large and Diverse Customer Base Assets Under Administration includes assets under advisement. As of 3Q’18. Rankings based on Pensions and Investments DC Recordkeeper Survey based on companies self-reported data as of September 30, 2017. Voya data as of June 30, 2018. Investment News Independent Broker Dealer Listing of 130 independent broker dealers, published in March 2018 with ranking based on number of producing representatives (Rank #13) and on gross revenue (Rank #16). Large / Mega Corporate Small / Mid Corporate Government Stable Value & Other Retail Wealth Management Education Healthcare

Well Positioned to Capture Increasing Share in a Consolidating Industry ~50% ~75% Industry Asset Growth1 ($ trillion) 25% 6% CAGR Top 10 Provider Share of Industry Assets2 Voya’s Rank3 #10 #6 2007 – 2017 CAGR for Total Defined Contribution market excluding Federal Thrift; Cerulli Defined Contribution Distribution 2018. Top 10 providers’ share of assets as of year-end (Pensions and Investments Defined Contribution Recordkeeper Survey 2018); estimated industry assets as of year-end (ICI Factbook 2018). Rankings based on Pensions and Investments DC Recordkeeper Survey based on companies self-reported data as of September 30, 2017.
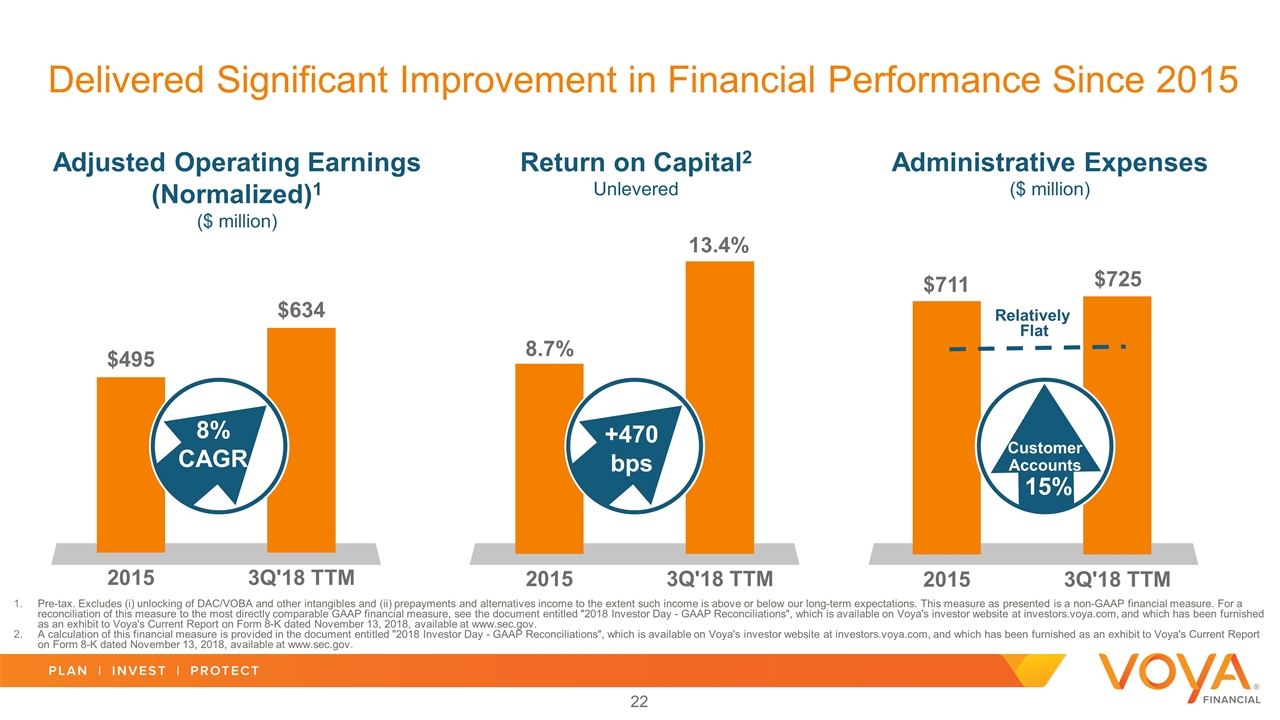
Delivered Significant Improvement in Financial Performance Since 2015 Relatively Flat $711 $725 8.7% 13.4% Return on Capital2 Unlevered Adjusted Operating Earnings (Normalized)1 ($ million) Administrative Expenses ($ million) +470 bps 8% CAGR Customer Accounts 15% Pre-tax. Excludes (i) unlocking of DAC/VOBA and other intangibles and (ii) prepayments and alternatives income to the extent such income is above or below our long-term expectations. This measure as presented is a non-GAAP financial measure. For a reconciliation of this measure to the most directly comparable GAAP financial measure, see the document entitled "2018 Investor Day - GAAP Reconciliations", which is available on Voya's investor website at investors.voya.com, and which has been furnished as an exhibit to Voya's Current Report on Form 8-K dated November 13, 2018, available at www.sec.gov. A calculation of this financial measure is provided in the document entitled "2018 Investor Day - GAAP Reconciliations", which is available on Voya's investor website at investors.voya.com, and which has been furnished as an exhibit to Voya's Current Report on Form 8-K dated November 13, 2018, available at www.sec.gov.

While Investing In and Executing on Initiatives to Improve the Customer Experience and Position Voya for Further Growth Improved Digital Capabilities Award winning¹ participant website driving higher savings rates and improved outcomes Greater Collaboration across Businesses Provides greater outcomes through a focus on solutions and a holistic approach to customers’ financial wellness Simplified IT Infrastructure Consolidated 4 legacy Retirement platforms onto a common platform 4 1 DALBAR digital communications awards.

Customers Choose Voya for Our Brand, Breadth of Solutions, and Holistic Approach to Retirement Recognized Brand; ranked #2 DC provider by advisors Reputation for: Quality of solutions Customer service Ease of doing business Brand & Reputation Micro to Mega Corporate, Tax Exempt, IRA, non-qualified Workplace Retail Breadth of Solutions Financial Wellness Interconnectivity of Wealth and Health Holistic Approach to Retirement

Need for Retirement Solutions Driving Significant Opportunity for Growth Under Covered Under Served Under Saved More than 30 million private sector workers in the U.S. do not have access to a workplace retirement plan2 47% of small, private sector workers do not have access to a DC plan2 There are over half a million total 401(k) plans³ in the U.S. An estimated 2/3 of plans don’t offer any participant investment advice services4 126 million U.S. households¹ Of the U.S. households with only a defined contribution plan, 50% are still at risk of not having enough to maintain their living standards in retirement5 U.S. Census Bureau; total employees of private sector firms with <100 employees (2015). Presidential Executive Order, August 31, 2018; smaller firms are those which have <100 workers. Cerulli Associates. Plan Sponsor Council of America 60th Annual Survey of Profit Sharing and 401(k) Plans, 2017. Center For Retirement Research at Boston College: National Retirement Risk Index (NRRI) National Retirement Risk Index Shows Modest Improvement in 2016.
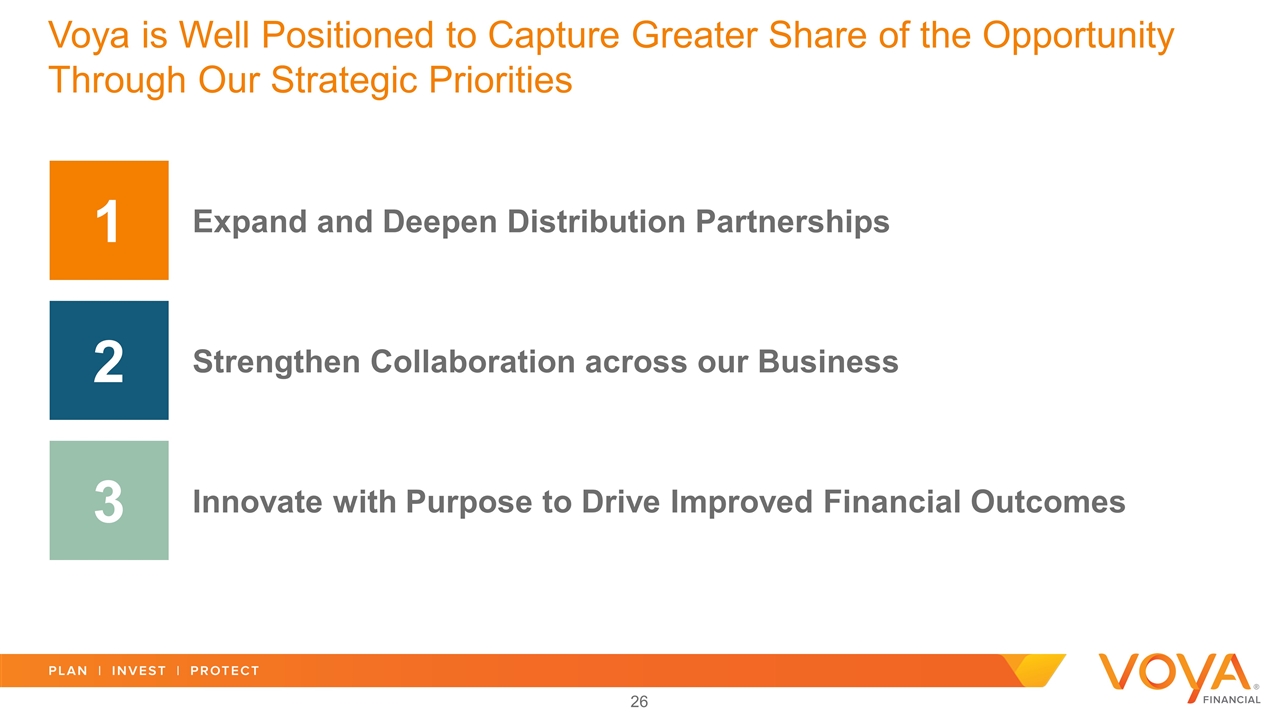
Voya is Well Positioned to Capture Greater Share of the Opportunity Through Our Strategic Priorities 1 Expand and Deepen Distribution Partnerships 2 Strengthen Collaboration across our Business 3 Innovate with Purpose to Drive Improved Financial Outcomes
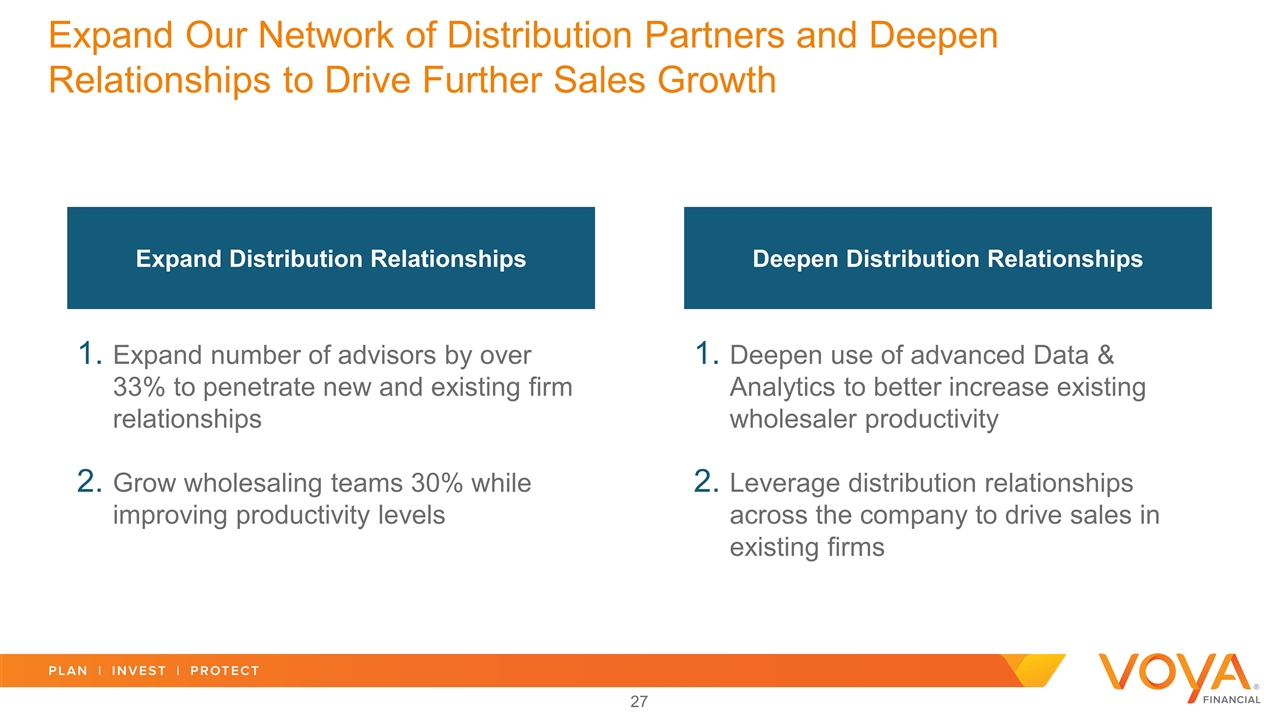
Expand Our Network of Distribution Partners and Deepen Relationships to Drive Further Sales Growth Expand number of advisors by over 33% to penetrate new and existing firm relationships Grow wholesaling teams 30% while improving productivity levels Expand Distribution Relationships Deepen use of advanced Data & Analytics to better increase existing wholesaler productivity Leverage distribution relationships across the company to drive sales in existing firms Deepen Distribution Relationships

Strengthen Collaboration Across Our Businesses to Retain, Attract, and Deepen Customer Relationships Investment Management Grow Retirement assets leveraging in Investment Management solutions Evolve products and solutions to meet growing needs for income and wealth preservation Employee Benefits Increase Retirement client adoption of Voluntary Employee Benefits Drive higher engagement and participant outcomes through Voya’s Financial Wellness experience Retail Wealth Management Retain and grow retail assets Evolve product and solutions to serve in-plan or rollover customers
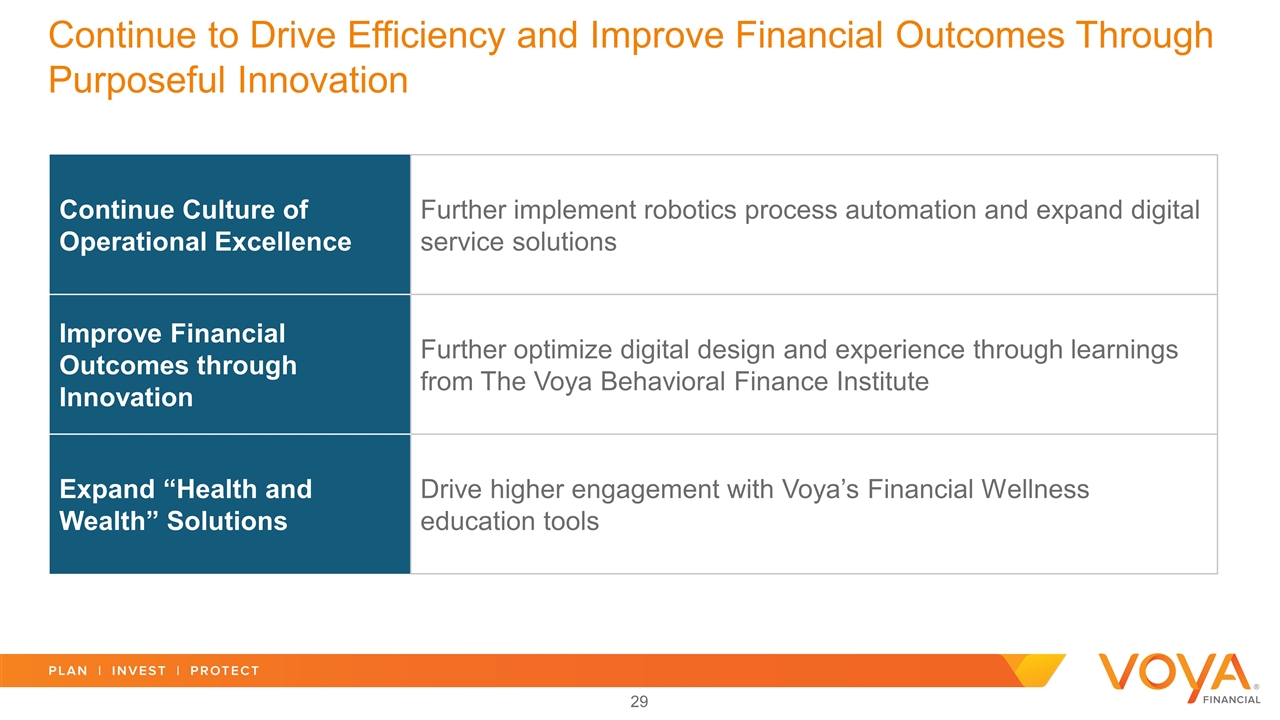
Continue Culture of Operational Excellence Further implement robotics process automation and expand digital service solutions Improve Financial Outcomes through Innovation Further optimize digital design and experience through learnings from The Voya Behavioral Finance Institute Expand “Health and Wealth” Solutions Drive higher engagement with Voya’s Financial Wellness education tools Continue to Drive Efficiency and Improve Financial Outcomes Through Purposeful Innovation

Retirement Key Takeaways Clear strategy for continued profitable growth while capturing share in a consolidating industry Further strengthen collaboration across businesses to deepen customer relationships and improve customer financial outcomes Leading retirement solutions provider serving a large and diverse customer base via expanding distribution network

Employee Benefits Rob Grubka President, Employee Benefits
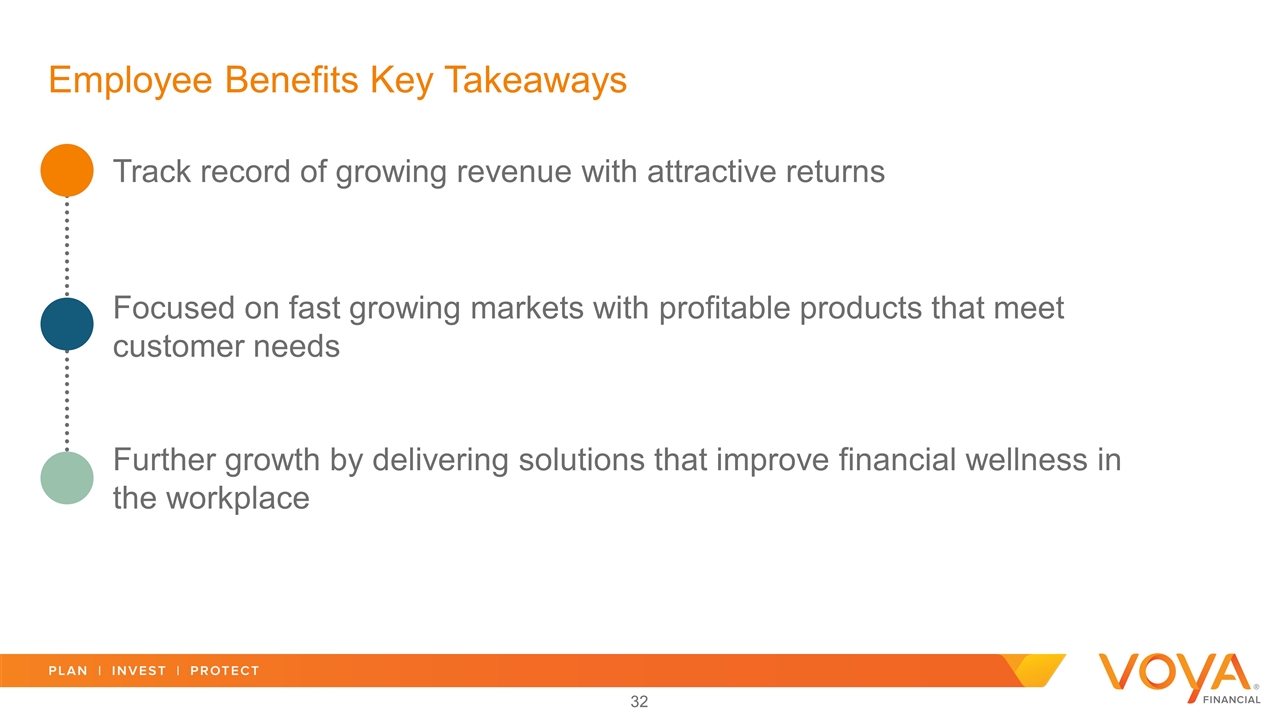
Employee Benefits Key Takeaways Focused on fast growing markets with profitable products that meet customer needs Further growth by delivering solutions that improve financial wellness in the workplace Track record of growing revenue with attractive returns

Employee Benefits Outlook Annual Targets Targeted Annually 2019 – 2021 In-Force Premium Growth 7 – 10% Pre-tax Adjusted Operating Earnings Growth 7 – 10% Total Aggregate Loss Ratio (Trailing Twelve Months) 71 – 74%
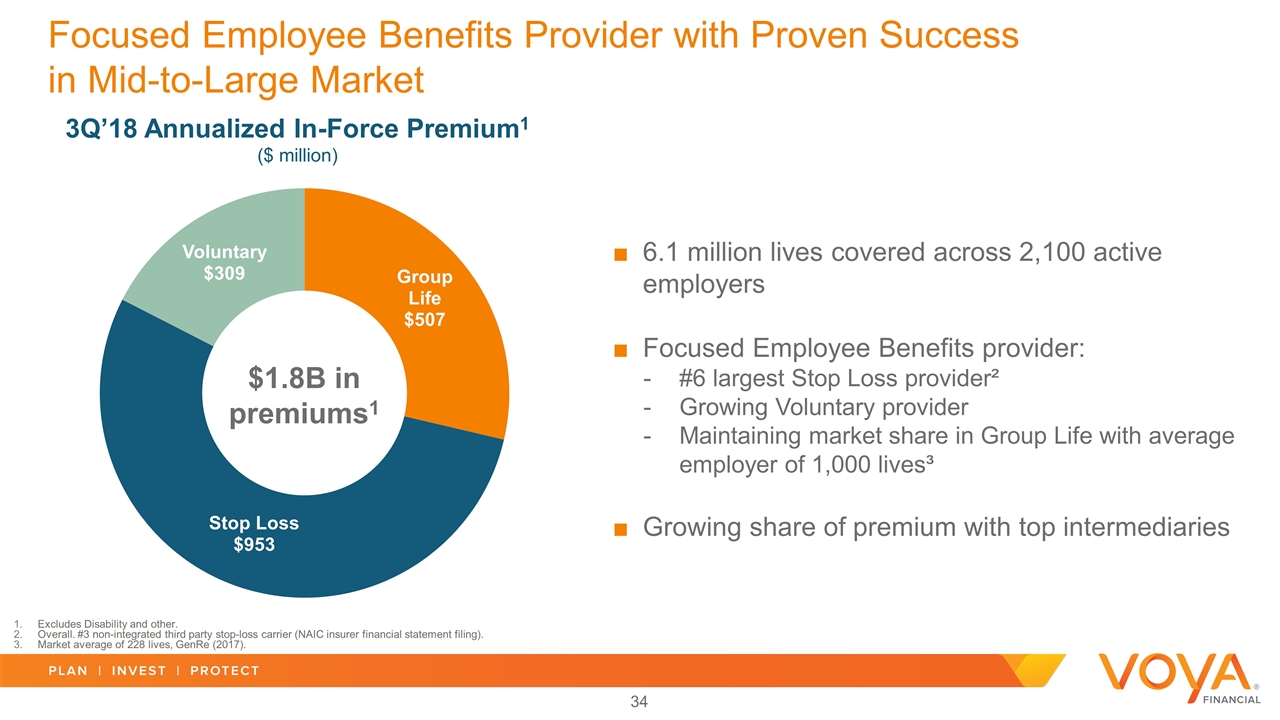
6.1 million lives covered across 2,100 active employers Focused Employee Benefits provider: #6 largest Stop Loss provider² Growing Voluntary provider Maintaining market share in Group Life with average employer of 1,000 lives³ Growing share of premium with top intermediaries Focused Employee Benefits Provider with Proven Success in Mid-to-Large Market 3Q’18 Annualized In-Force Premium1 ($ million) Excludes Disability and other. Overall. #3 non-integrated third party stop-loss carrier (NAIC insurer financial statement filing). Market average of 228 lives, GenRe (2017). $1.8B in premiums1

Excludes Disability and other. Pre-tax. Excludes (i) unlocking of DAC/VOBA and other intangibles and (ii) prepayments and alternatives income to the extent such income is above or below our long-term expectations. This measure as presented is a non-GAAP financial measure. For a reconciliation of this measure to the most directly comparable GAAP financial measure, see the document entitled "2018 Investor Day - GAAP Reconciliations", which is available on Voya's investor website at investors.voya.com, and which has been furnished as an exhibit to Voya's Current Report on Form 8-K dated November 13, 2018, available at www.sec.gov. A calculation of this financial measure is provided in the document entitled "2018 Investor Day - GAAP Reconciliations", which is available on Voya's investor website at investors.voya.com, and which has been furnished as an exhibit to Voya's Current Report on Form 8-K dated November 13, 2018, available at www.sec.gov. Employee Benefits has Grown Premium with Strong Returns $1,499 $1,769 26.5% 26.9% +18.0% +40 bps FY’15 Loss Ratio for Stop Loss was 71.5% 4Q’15 3Q’18 TTM Adjusted Operating Earnings (Normalized)2 ($ million) Annualized In-Force Premium1 ($ million) Return on Capital3 Unlevered
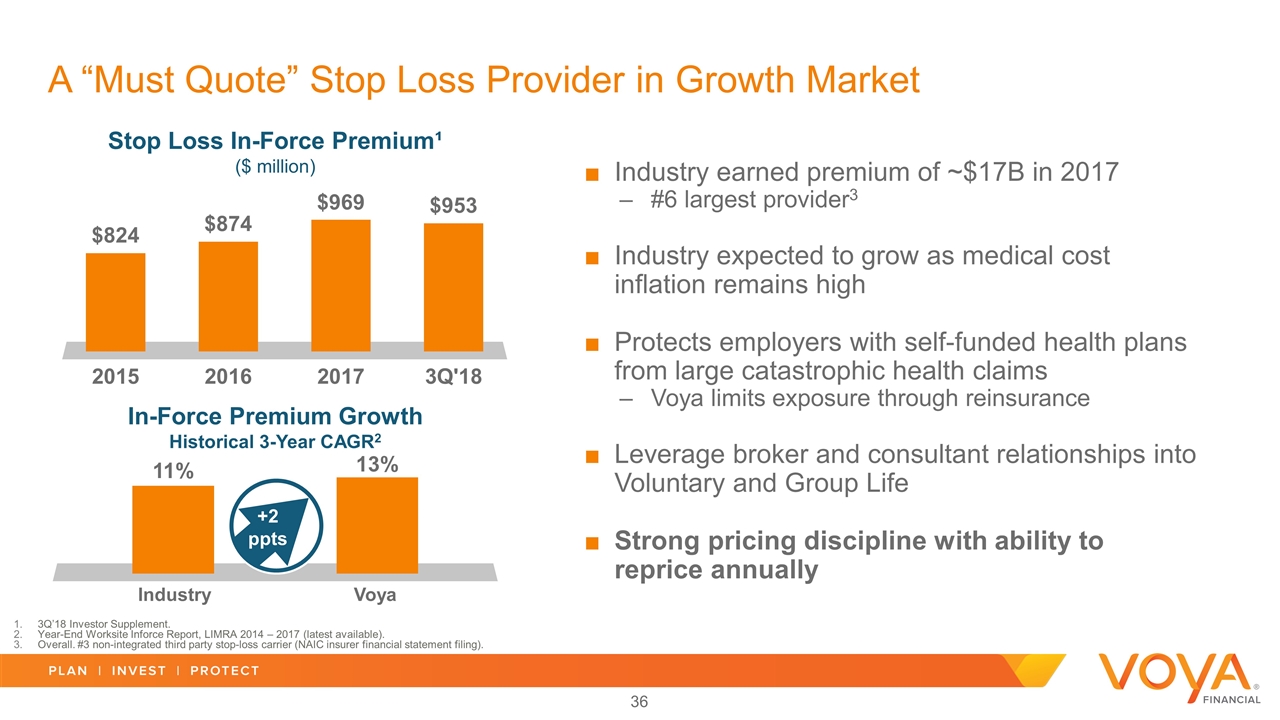
A “Must Quote” Stop Loss Provider in Growth Market Industry earned premium of ~$17B in 2017 #6 largest provider3 Industry expected to grow as medical cost inflation remains high Protects employers with self-funded health plans from large catastrophic health claims Voya limits exposure through reinsurance Leverage broker and consultant relationships into Voluntary and Group Life Strong pricing discipline with ability to reprice annually Industry Voya In-Force Premium Growth Historical 3-Year CAGR2 Stop Loss In-Force Premium¹ ($ million) +2 ppts 3Q’18 Investor Supplement. Year-End Worksite Inforce Report, LIMRA 2014 – 2017 (latest available). Overall. #3 non-integrated third party stop-loss carrier (NAIC insurer financial statement filing).
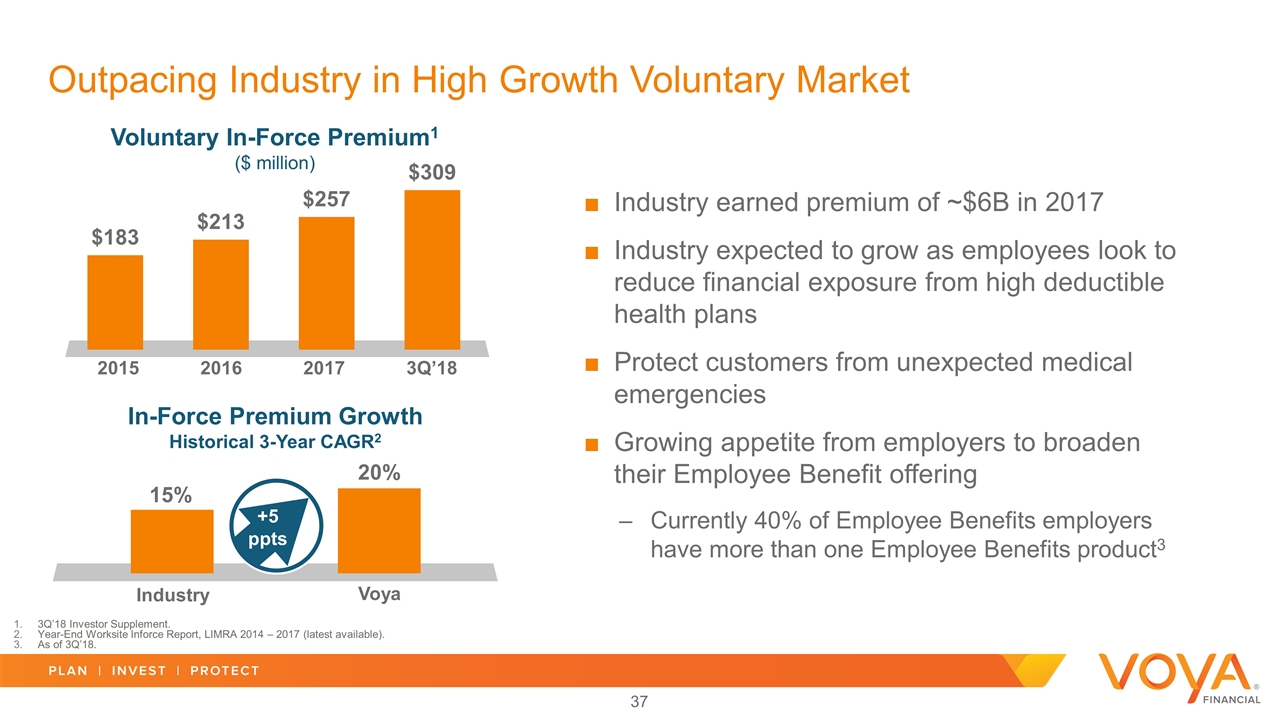
Industry earned premium of ~$6B in 2017 Industry expected to grow as employees look to reduce financial exposure from high deductible health plans Protect customers from unexpected medical emergencies Growing appetite from employers to broaden their Employee Benefit offering Currently 40% of Employee Benefits employers have more than one Employee Benefits product3 3Q’18 Investor Supplement. Year-End Worksite Inforce Report, LIMRA 2014 – 2017 (latest available). As of 3Q’18. Outpacing Industry in High Growth Voluntary Market Voluntary In-Force Premium1 ($ million) Industry Voya 3Q’18 2017 2016 2015 In-Force Premium Growth Historical 3-Year CAGR2 +5 ppts
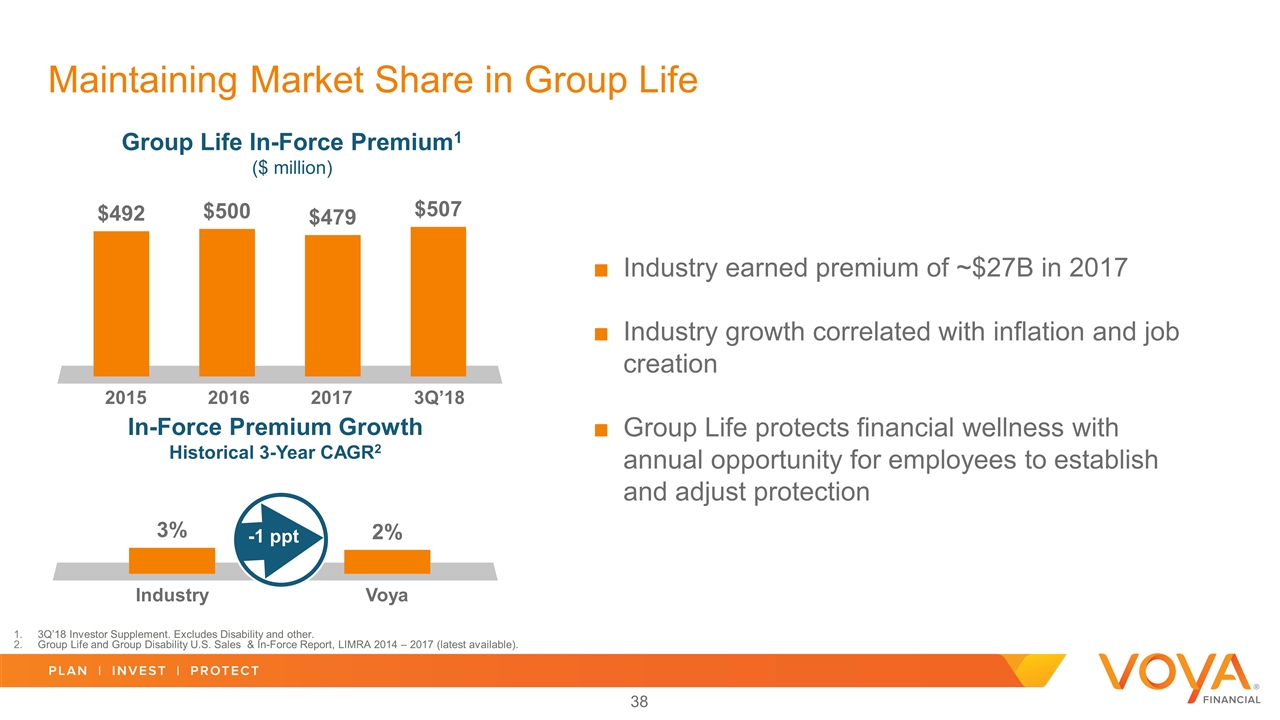
Industry earned premium of ~$27B in 2017 Industry growth correlated with inflation and job creation Group Life protects financial wellness with annual opportunity for employees to establish and adjust protection Maintaining Market Share in Group Life Group Life In-Force Premium1 ($ million) Industry Voya 3Q’18 2017 2016 2015 -1 ppt 3Q’18 Investor Supplement. Excludes Disability and other. Group Life and Group Disability U.S. Sales & In-Force Report, LIMRA 2014 – 2017 (latest available). In-Force Premium Growth Historical 3-Year CAGR2
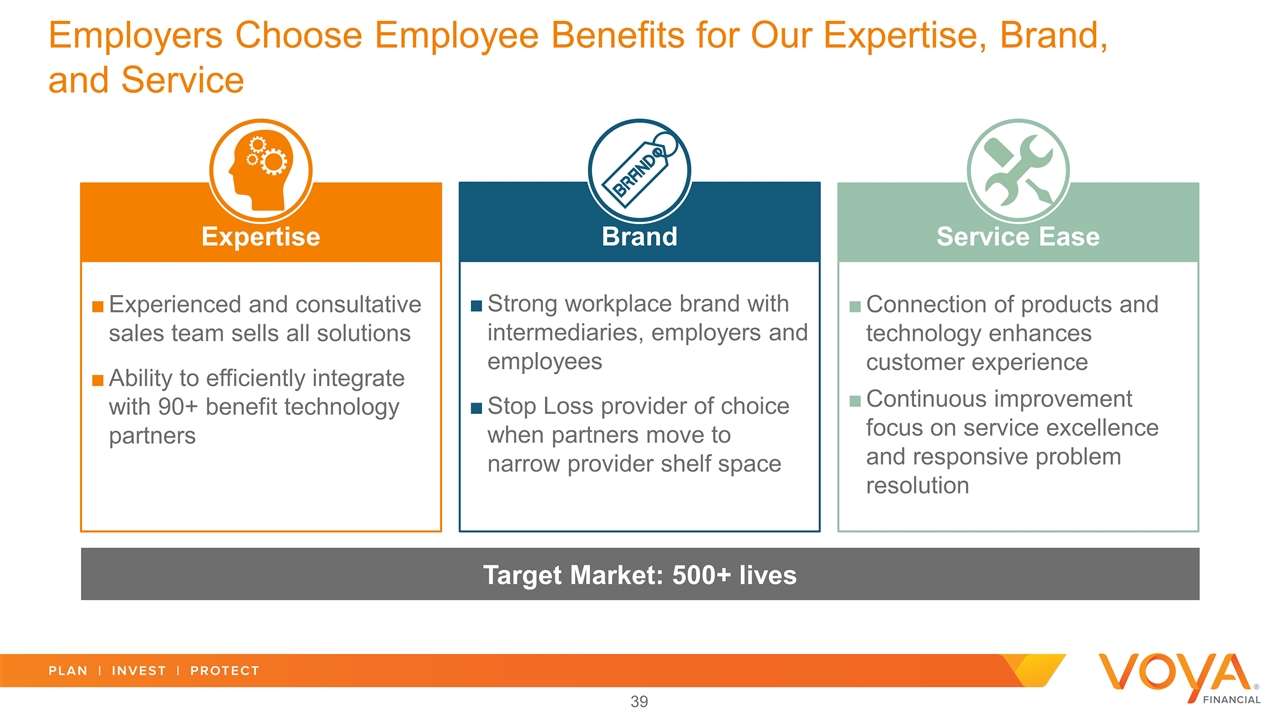
Employers Choose Employee Benefits for Our Expertise, Brand, and Service Target Market: 500+ lives Experienced and consultative sales team sells all solutions Ability to efficiently integrate with 90+ benefit technology partners Expertise Connection of products and technology enhances customer experience Continuous improvement focus on service excellence and responsive problem resolution Service Ease Strong workplace brand with intermediaries, employers and employees Stop Loss provider of choice when partners move to narrow provider shelf space Brand

The “Health and Wealth” Convergence Driving Opportunity for Voluntary Solutions 2018 Employer Health Benefits Survey, Kaiser Family Foundation. 2017 Year-End HSA Market Statistics & Trends Executive Summary, Devenir (2/22/18). Industry defined as including critical illness, accident and hospital indemnity; In-Force premiums; Year-End Worksite In-Force Report, LIMRA 2014 – 2017 (latest available). Growth in Voluntary has more than tripled3 Financial responsibility shifting to employee while facing increasing decision complexity ~1 in 3 hardship withdrawals are a result of emergency medical expenses Health and Wealth Convergence Increasing importance of the Workplace 1 in 4 employees covered by high deductible health plans1 Total HSA accounts increased by 61% over the past 3 years2 High-Deductible Health Plans

Voya is Well Positioned to Capture Greater Share of the Opportunity Through Our Strategic Priorities 1 Growing Our Premium with Top Intermediaries as They Drive Consolidation 2 Continue Leveraging our Leadership Position in Stop Loss to Deliver Voluntary Growth 3 Maximize the Enterprise Opportunity to Help Employees Optimize Financial Wellness at the Workplace
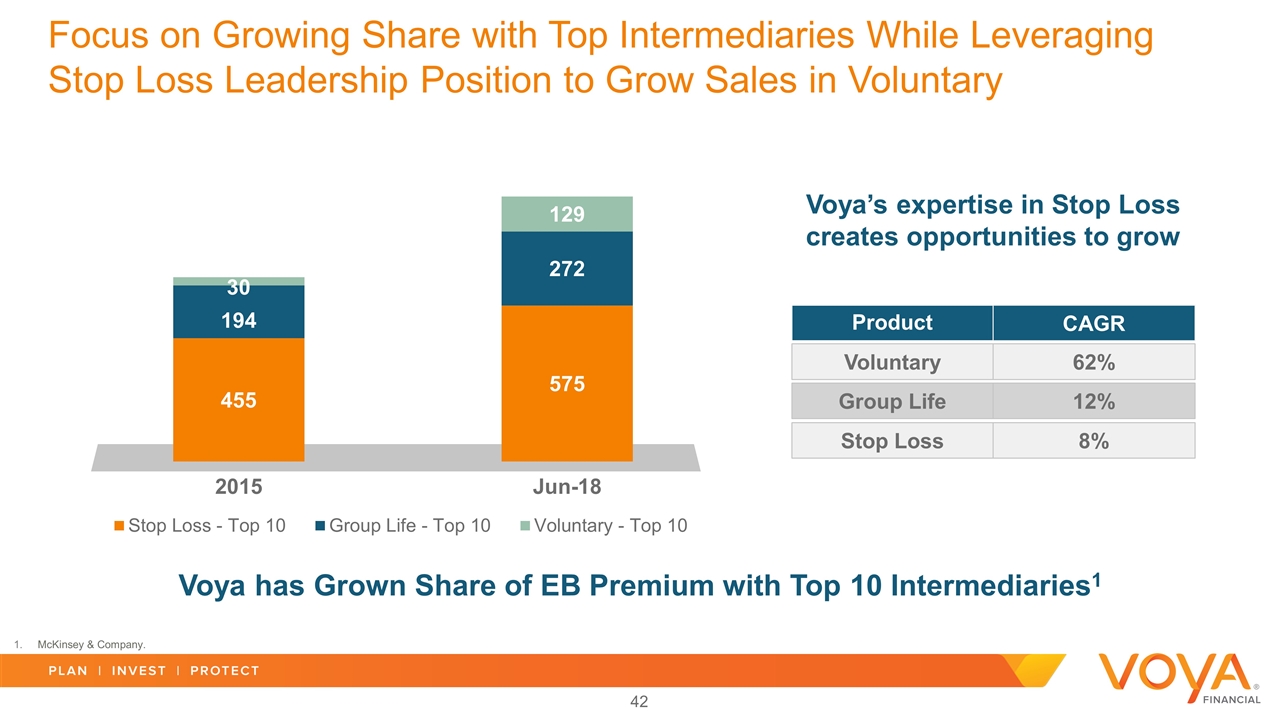
Focus on Growing Share with Top Intermediaries While Leveraging Stop Loss Leadership Position to Grow Sales in Voluntary Product CAGR Voluntary 62% Group Life 12% Stop Loss 8% Voya has Grown Share of EB Premium with Top 10 Intermediaries1 McKinsey & Company. Voya’s expertise in Stop Loss creates opportunities to grow
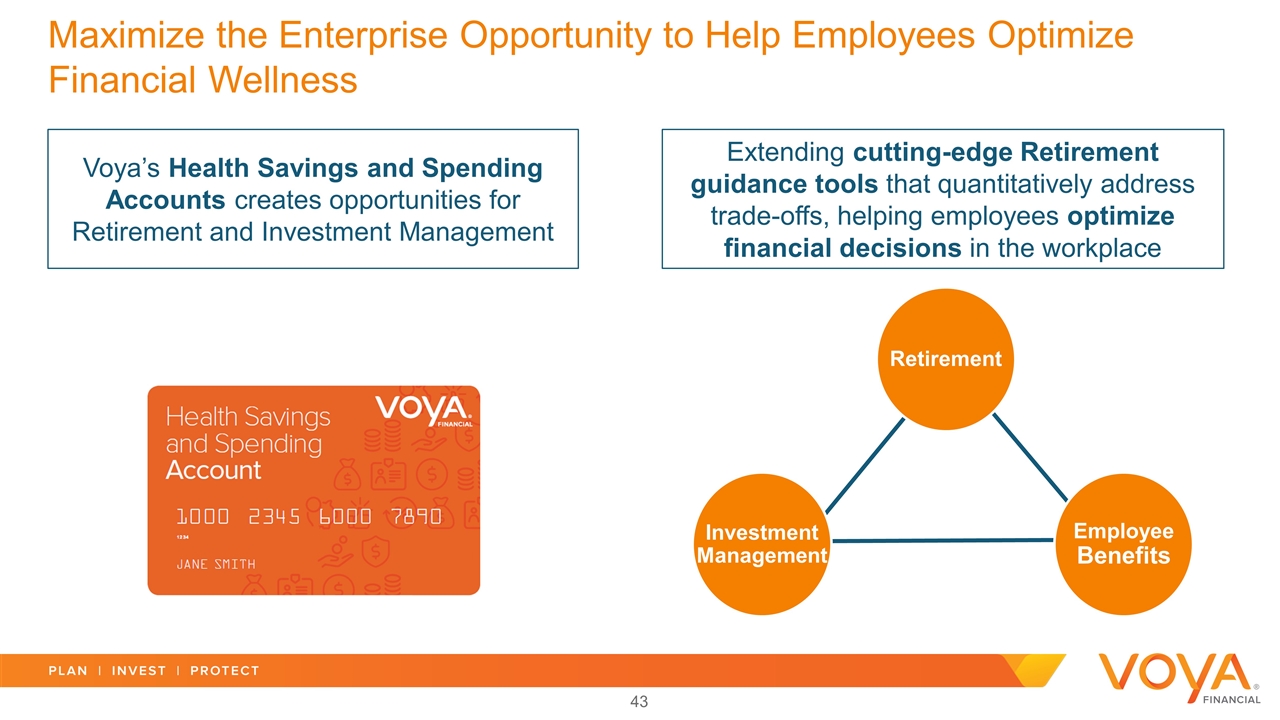
Maximize the Enterprise Opportunity to Help Employees Optimize Financial Wellness Voya’s Health Savings and Spending Accounts creates opportunities for Retirement and Investment Management Extending cutting-edge Retirement guidance tools that quantitatively address trade-offs, helping employees optimize financial decisions in the workplace Retirement Investment Management Employee Benefits
Employee Benefits Key Takeaways Focused on fast growing markets with profitable products that meet customer needs Further growth by delivering solutions that improve financial wellness in the workplace Track record of growing revenue with attractive returns

Voya Cares® Heather Lavallee President, Tax-Exempt Markets Bill Harmon President, Corporate Markets
Voya Cares – Helping People with Special Needs and Caregivers Plan for the Future They Envision Vast and underserved community – over 100 million Americans Intersects our culture and business expertise – a differentiator driving business results Voya Cares is an extension of our mission to serve all Americans, specifically those with special needs and their caregivers
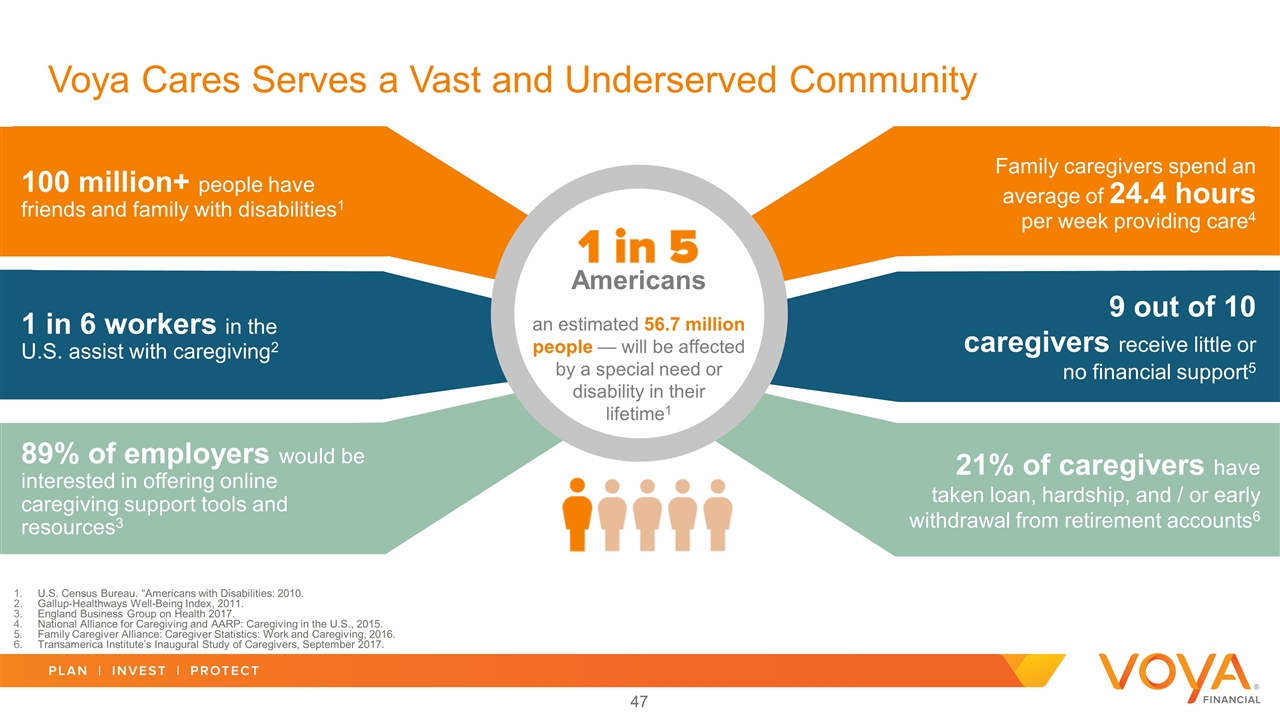
Voya Cares Serves a Vast and Underserved Community an estimated 56.7 million people — will be affected by a special need or disability in their lifetime1 Americans 100 million+ people have friends and family with disabilities1 1 in 6 workers in the U.S. assist with caregiving2 9 out of 10 caregivers receive little or no financial support5 Family caregivers spend an average of 24.4 hours per week providing care4 21% of caregivers have taken loan, hardship, and / or early withdrawal from retirement accounts6 89% of employers would be interested in offering online caregiving support tools and resources3 U.S. Census Bureau. “Americans with Disabilities: 2010. Gallup-Healthways Well-Being Index, 2011. England Business Group on Health 2017. National Alliance for Caregiving and AARP: Caregiving in the U.S., 2015. Family Caregiver Alliance: Caregiver Statistics: Work and Caregiving, 2016. Transamerica Institute’s Inaugural Study of Caregivers, September 2017.
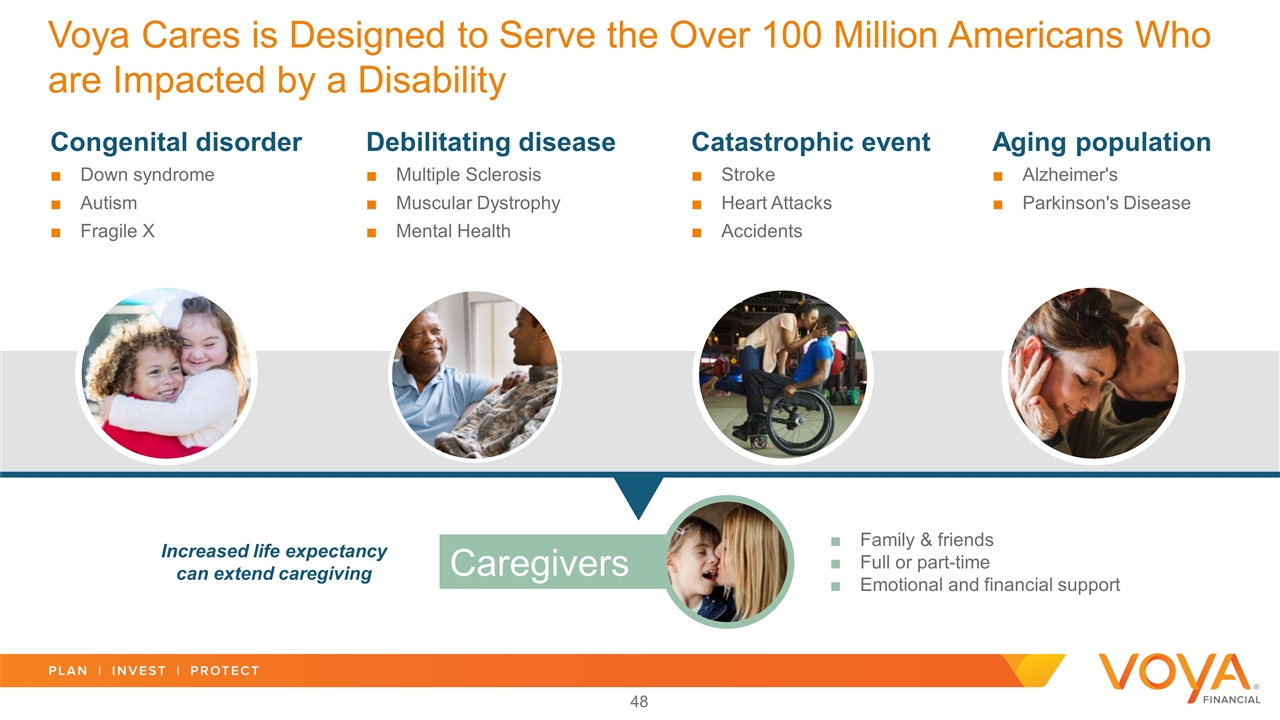
Debilitating disease Multiple Sclerosis Muscular Dystrophy Mental Health Voya Cares is Designed to Serve the Over 100 Million Americans Who are Impacted by a Disability Congenital disorder Down syndrome Autism Fragile X Catastrophic event Stroke Heart Attacks Accidents Aging population Alzheimer's Parkinson's Disease Family & friends Full or part-time Emotional and financial support Increased life expectancy can extend caregiving Caregivers
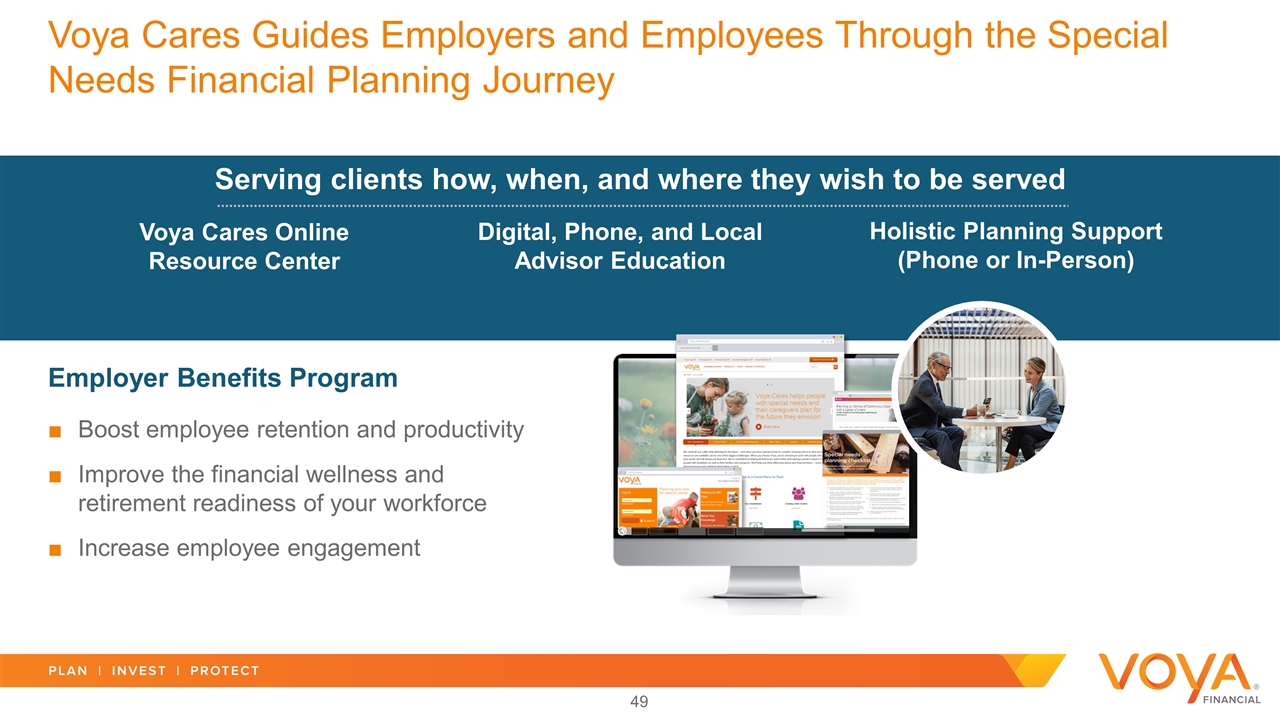
Serving clients how, when, and where they wish to be served Voya Cares Guides Employers and Employees Through the Special Needs Financial Planning Journey Voya Cares Online Resource Center Digital, Phone, and Local Advisor Education Holistic Planning Support (Phone or In-Person) Boost employee retention and productivity Improve the financial wellness and retirement readiness of your workforce Increase employee engagement Employer Benefits Program
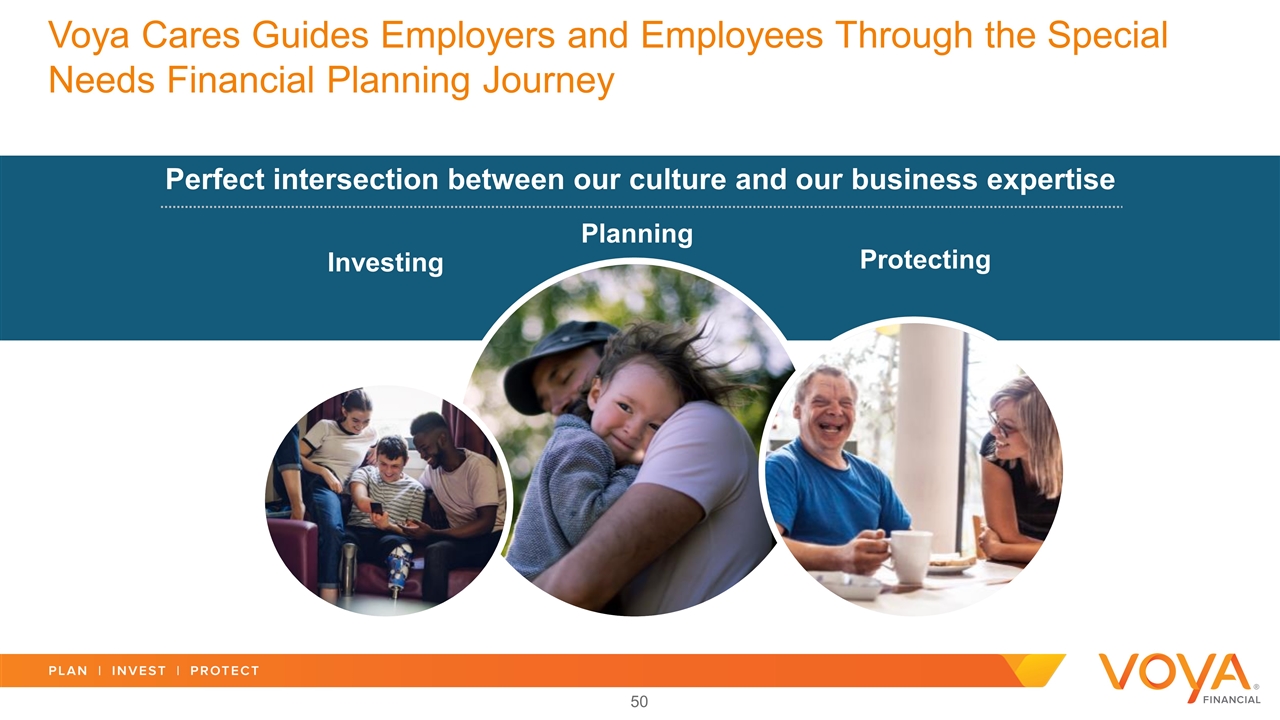
Voya Cares Guides Employers and Employees Through the Special Needs Financial Planning Journey Perfect intersection between our culture and our business expertise Investing Planning Protecting
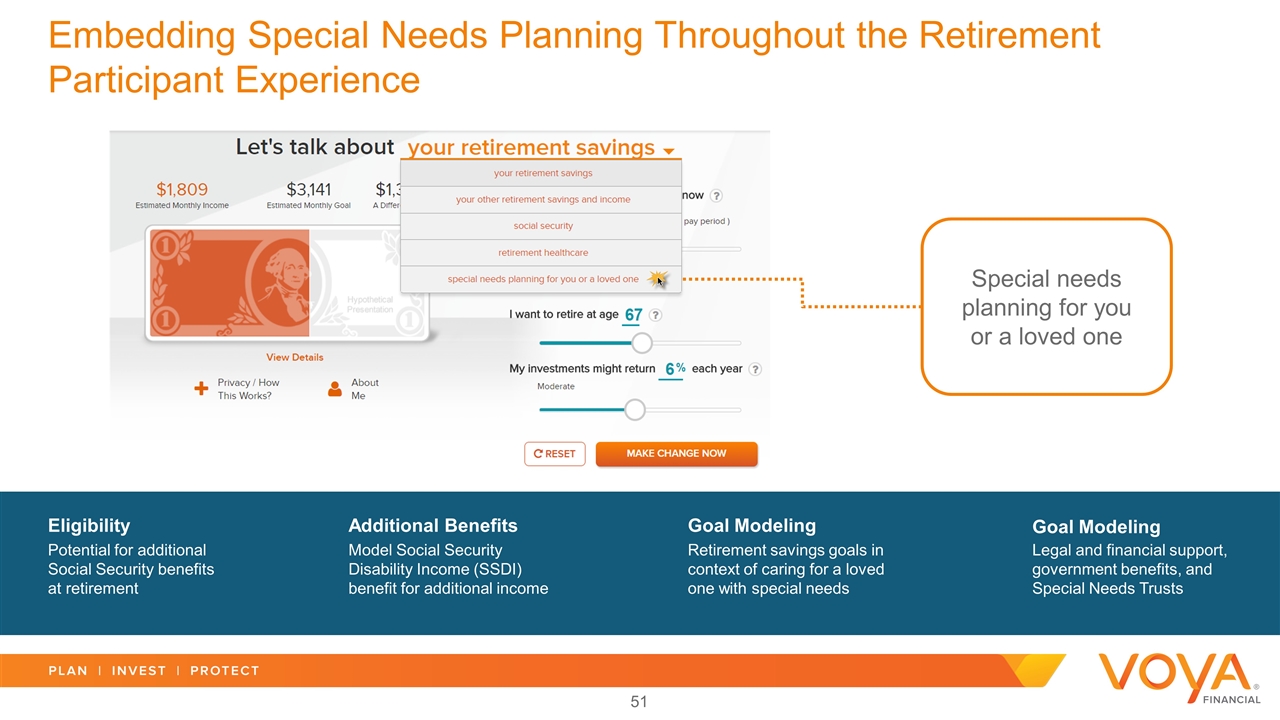
Embedding Special Needs Planning Throughout the Retirement Participant Experience Special needs planning for you or a loved one Potential for additional Social Security benefits at retirement Eligibility Additional Benefits Model Social Security Disability Income (SSDI) benefit for additional income Goal Modeling Retirement savings goals in context of caring for a loved one with special needs Legal and financial support, government benefits, and Special Needs Trusts Goal Modeling

Voya Cares Impact on a Caregiver, Advisor, and Employer
“ Voya Cares – Helping People with Special Needs and Caregivers Plan for the Future They Envision Vast and underserved community – over 100 million Americans Intersects our culture and business expertise – a differentiator driving business results Voya Cares is an extension of our mission to serve all Americans, specifically those with special needs and their caregivers No other recordkeeper is doing anything like Voya Cares, and how becoming experts in navigating all of the complexities of the special needs community could really help grow their practices. But mostly they appreciated it because it is the ‘right thing to do.’ - Gallagher Healthcare Team ”

Investment Management Christine Hurtsellers Chief Executive Officer, Investment Management
Investment Management Key Takeaways Continue building on our strong performance track record Enabling growth with attractive specialty and retirement capabilities Our investment capabilities and client value proposition appeal to a broad range of investors and provide multiple avenues for growth
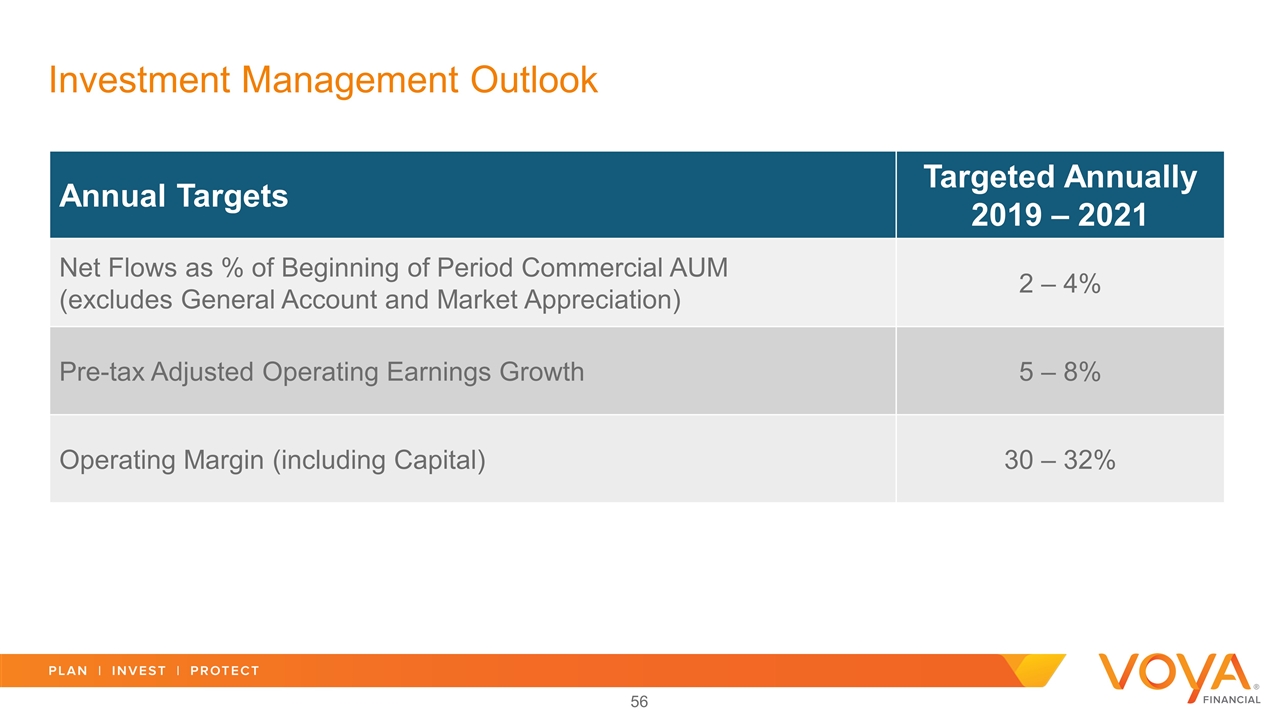
Investment Management Outlook Annual Targets Targeted Annually 2019 – 2021 Net Flows as % of Beginning of Period Commercial AUM (excludes General Account and Market Appreciation) 2 – 4% Pre-tax Adjusted Operating Earnings Growth 5 – 8% Operating Margin (including Capital) 30 – 32%

88 61 15 27 10 9 55 48 51 24 13 19 Diversified Asset Manager Delivering Specialty and Retirement Capabilities to a Broad Range of Clients Diversified Asset Base1 ($ billion) Broad Range of Clients2 ($ billion) Voya General Account Retirement Providers2 Domestic Institutions Retail Intermediaries Third-Party Insurers International Institutions Private Fixed Income Bank Loans Commercial Real Estate Private Equity Public Fixed Income Public Equity $210B $210B Strength in hard to replicate specialized asset classes Retirement-oriented investing that aligns with asset / liability management solution expertise Efficient, scalable infrastructure, and top-tier client service practices As of September 30, 2018. Total Retirement Providers AUM of $48 billion differs from Retirement and Wealth Management Assets as disclosed in the Investor Supplement as it excludes Retail Wealth Management AUM of $24 billion (captured through Retail Intermediaries) and General Account AUM of $31 billion.
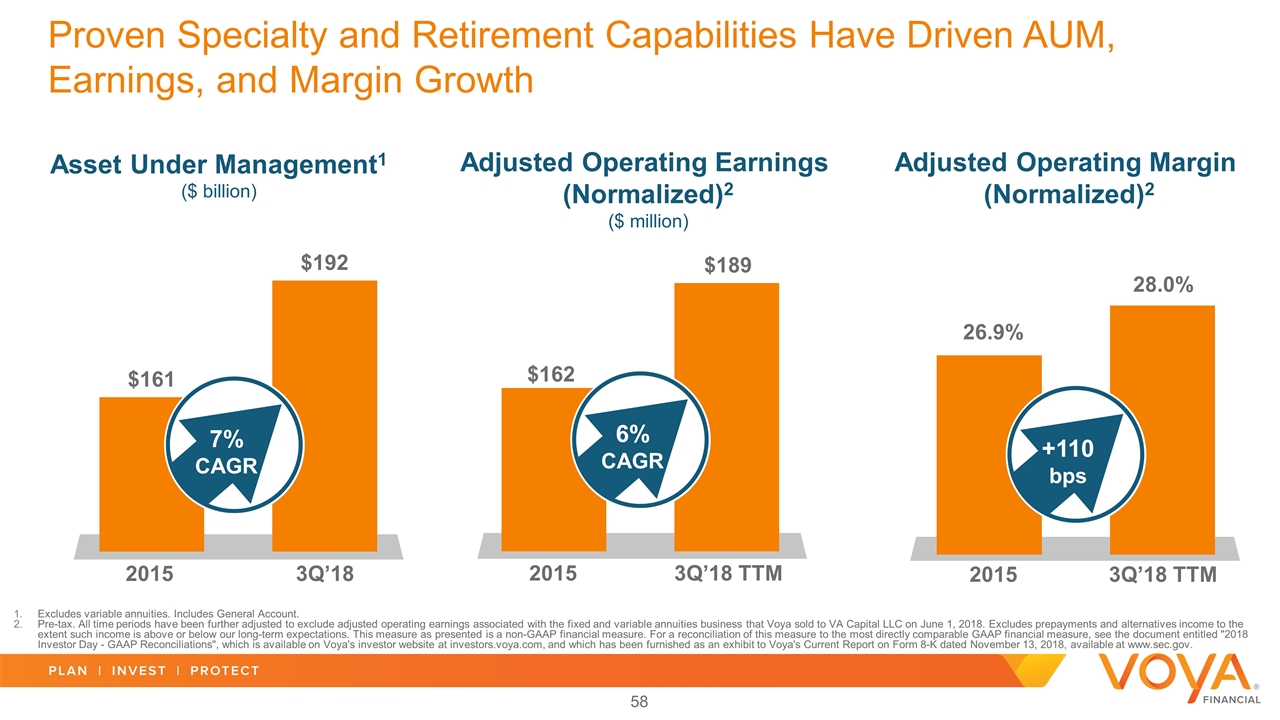
Bar chart numbers calculated as of 10/16/2018 Adjusted Operating Earnings (Normalized)2 ($ million) Adjusted Operating Margin (Normalized)2 2015 3Q’18 TTM 28.0% 2015 3Q’18 TTM Need 2018 forecasts Flows? Third metric will be included; will look like other segment slides Asset Under Management1 ($ billion) +110 Bps 2015 3Q’18 Excludes variable annuities. Includes General Account. Pre-tax. All time periods have been further adjusted to exclude adjusted operating earnings associated with the fixed and variable annuities business that Voya sold to VA Capital LLC on June 1, 2018. Excludes prepayments and alternatives income to the extent such income is above or below our long-term expectations. This measure as presented is a non-GAAP financial measure. For a reconciliation of this measure to the most directly comparable GAAP financial measure, see the document entitled "2018 Investor Day - GAAP Reconciliations", which is available on Voya's investor website at investors.voya.com, and which has been furnished as an exhibit to Voya's Current Report on Form 8-K dated November 13, 2018, available at www.sec.gov. 7% CAGR 6% CAGR +110 bps Proven Specialty and Retirement Capabilities Have Driven AUM, Earnings, and Margin Growth
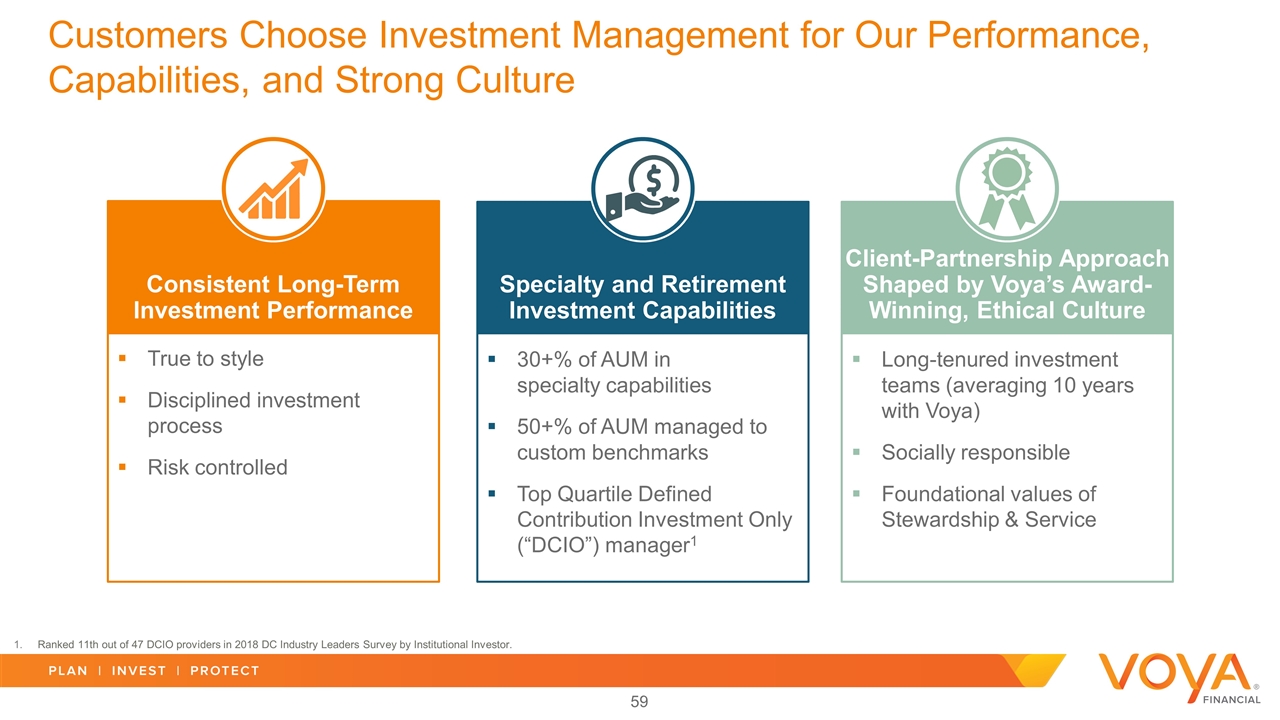
True to style Disciplined investment process Risk controlled Consistent Long-Term Investment Performance Long-tenured investment teams (averaging 10 years with Voya) Socially responsible Foundational values of Stewardship & Service Client-Partnership Approach Shaped by Voya’s Award-Winning, Ethical Culture 30+% of AUM in specialty capabilities 50+% of AUM managed to custom benchmarks Top Quartile Defined Contribution Investment Only (“DCIO”) manager1 Specialty and Retirement Investment Capabilities Ranked 11th out of 47 DCIO providers in 2018 DC Industry Leaders Survey by Institutional Investor. Customers Choose Investment Management for Our Performance, Capabilities, and Strong Culture
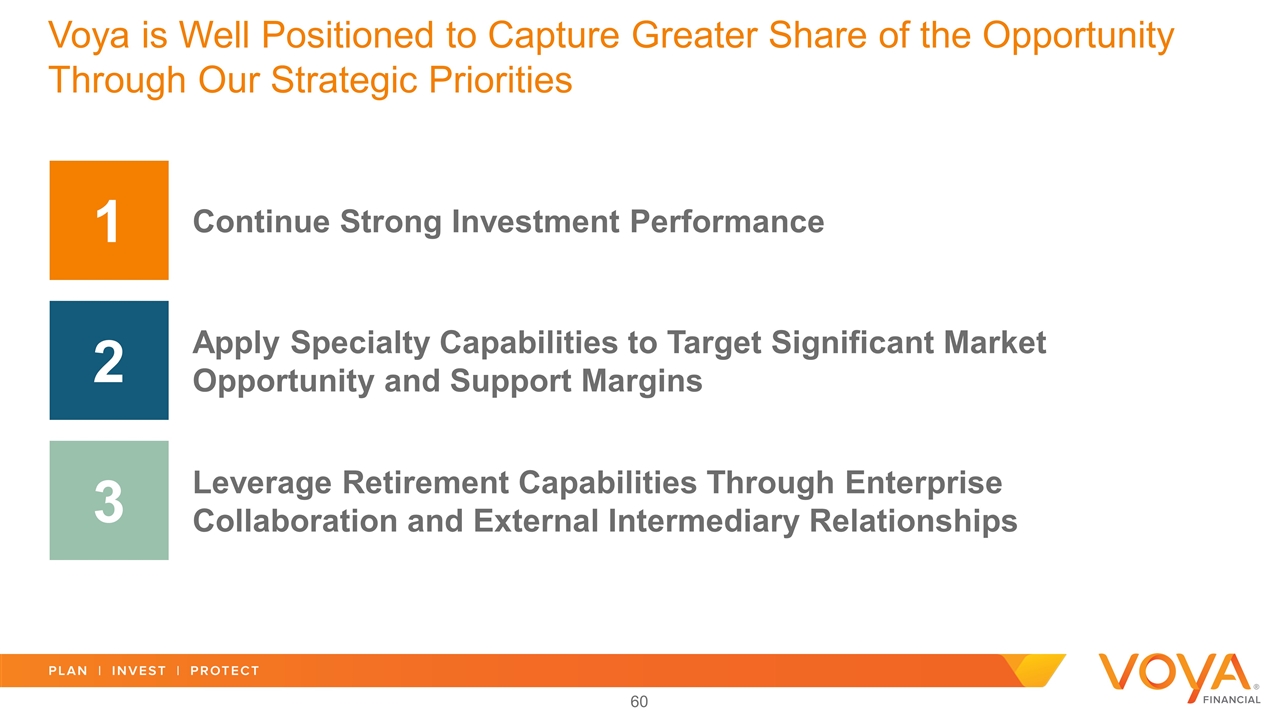
Voya is Well Positioned to Capture Greater Share of the Opportunity Through Our Strategic Priorities 1 Continue Strong Investment Performance 2 Apply Specialty Capabilities to Target Significant Market Opportunity and Support Margins 3 Leverage Retirement Capabilities Through Enterprise Collaboration and External Intermediary Relationships
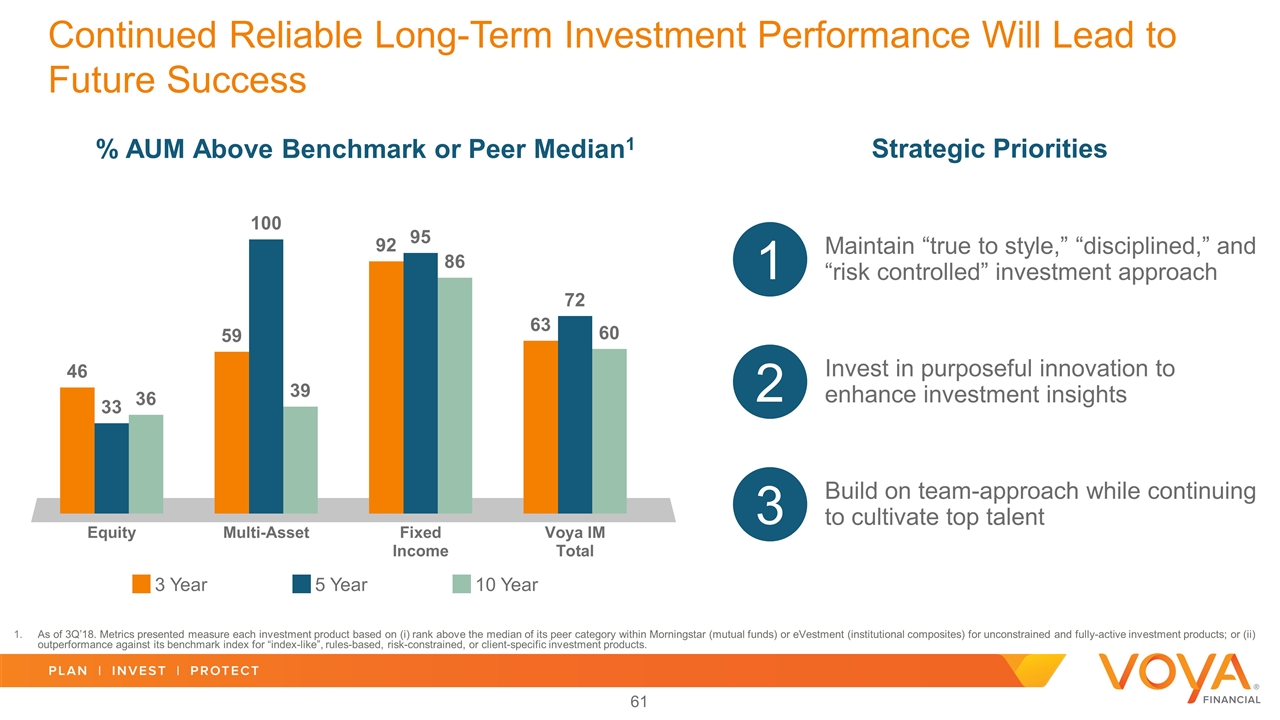
% AUM Above Benchmark or Peer Median1 3 Year 5 Year 10 Year Strategic Priorities Maintain “true to style,” “disciplined,” and “risk controlled” investment approach 1 Invest in purposeful innovation to enhance investment insights 2 Build on team-approach while continuing to cultivate top talent 3 As of 3Q’18. Metrics presented measure each investment product based on (i) rank above the median of its peer category within Morningstar (mutual funds) or eVestment (institutional composites) for unconstrained and fully-active investment products; or (ii) outperformance against its benchmark index for “index-like”, rules-based, risk-constrained, or client-specific investment products. Continued Reliable Long-Term Investment Performance Will Lead to Future Success
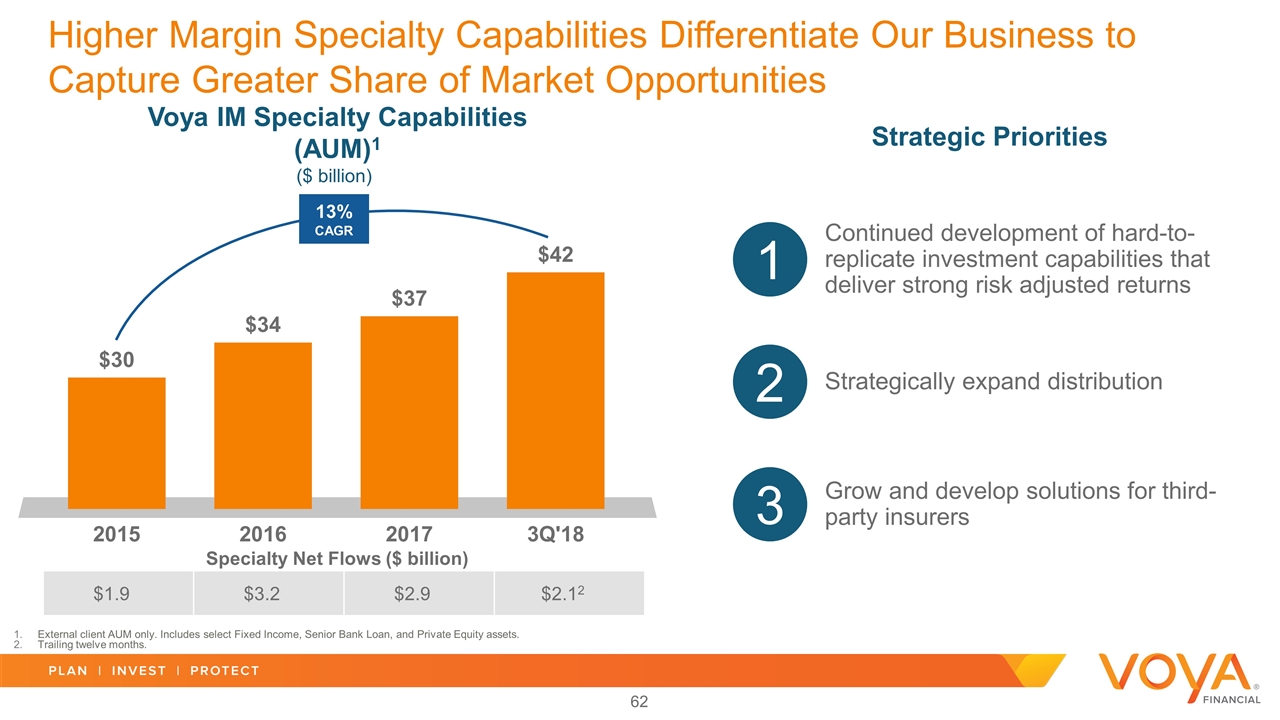
Higher Margin Specialty Capabilities Differentiate Our Business to Capture Greater Share of Market Opportunities Voya IM Specialty Capabilities (AUM)1 ($ billion)1 13% CAGR Specialty Net Flows ($ billion) $1.9 $3.2 $2.9 $2.12 Continued development of hard-to-replicate investment capabilities that deliver strong risk adjusted returns 1 Strategically expand distribution 2 Grow and develop solutions for third-party insurers 3 External client AUM only. Includes select Fixed Income, Senior Bank Loan, and Private Equity assets. Trailing twelve months. Strategic Priorities

$4 Trillion Actively-Managed Defined Contribution Opportunity1 Multi-Asset Active Fixed Income Active Equity Alternatives Product evolution to meet growing needs for income and wealth preservation 1 Partner with Retirement and Employee Benefits to engage clients holistically 2 Use data analytics to strengthen external intermediary relationships 3 2018 estimate based on McKinsey Performance Lens Global Growth Cube, December 2017. Strategic Priorities Further Leverage Retirement Capabilities through Voya Partnerships and Intermediary Relationships

Investment Management Key Takeaways Continue building on our strong performance track record Enabling growth with attractive specialty and retirement capabilities Our investment capabilities and client value proposition appeal to a broad range of investors and provide multiple avenues for growth

Technology & Innovation Maggie Parent Chief Administrative Officer

Technology and Innovation a Key Enabler to Our Strategy to Grow Efficiently Increase recurring deposits in high margin full service Retirement Drive higher margin sales of specialty asset classes in Investment Management Expand Investment Management assets in Retirement channels Further growth in workplace for Voluntary products Organic Growth 2 – 7% Cost cutting programs Harness technology and innovation to further efficient growth Continue to leverage culture of continuous improvement Cost Savings 3 – 5% Calibrated share repurchases contribute to indicated EPS growth, while also increasing dividends Capital Deployment 3 – 5% EPS Growth Contributors Total EPS Annual Growth Rate (‘19 – ’21) 10%+
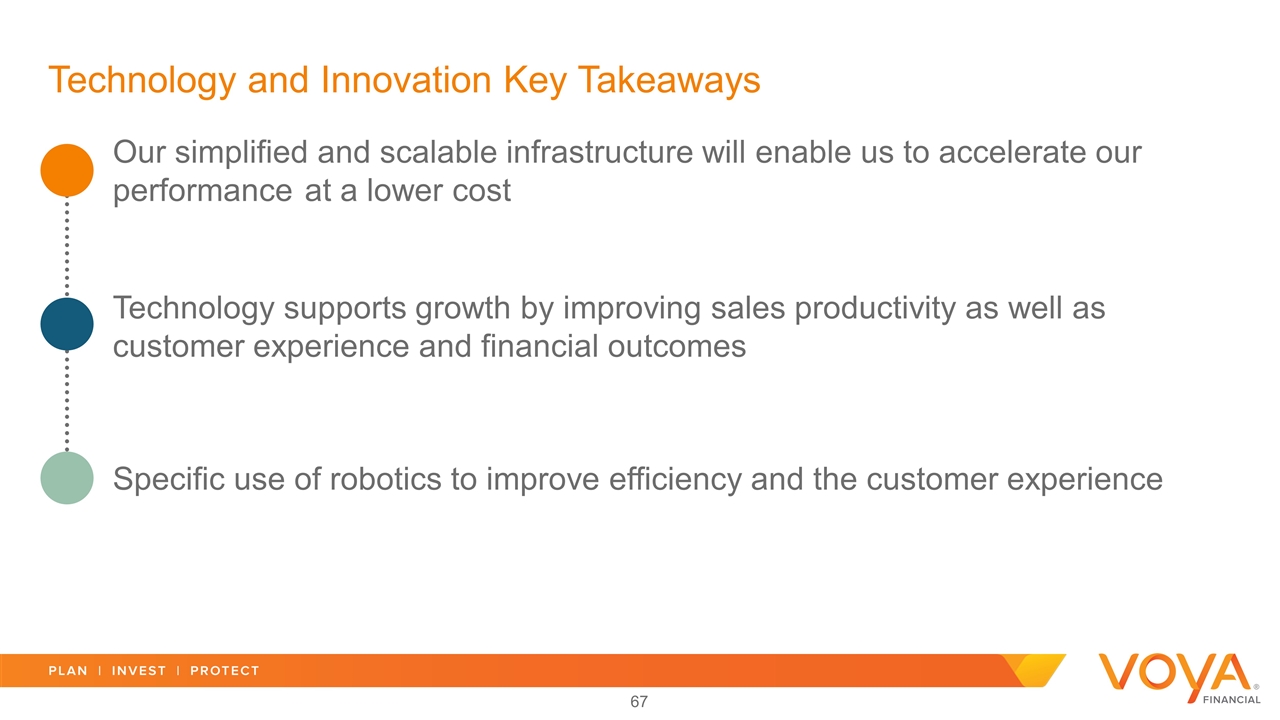
Technology and Innovation Key Takeaways Technology supports growth by improving sales productivity as well as customer experience and financial outcomes Specific use of robotics to improve efficiency and the customer experience Our simplified and scalable infrastructure will enable us to accelerate our performance at a lower cost
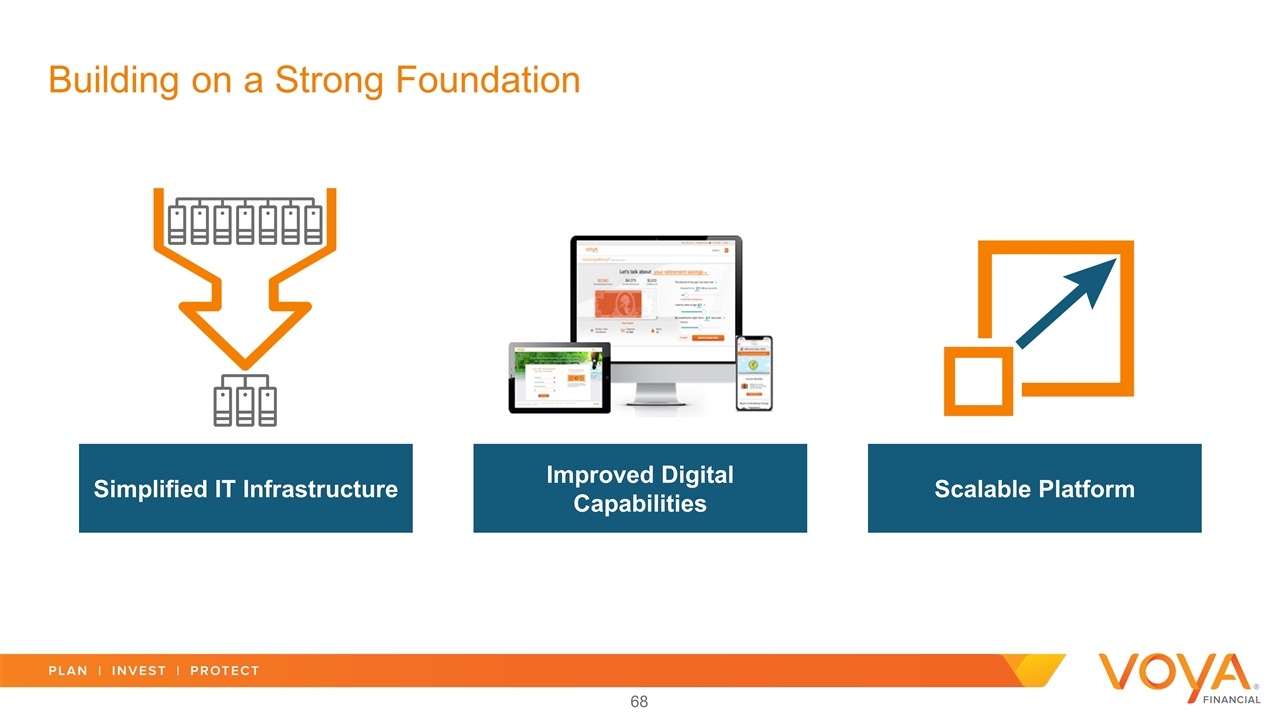
Building on a Strong Foundation Investment Management Employee Benefits Improved Digital Capabilities Scalable Platform Simplified IT Infrastructure
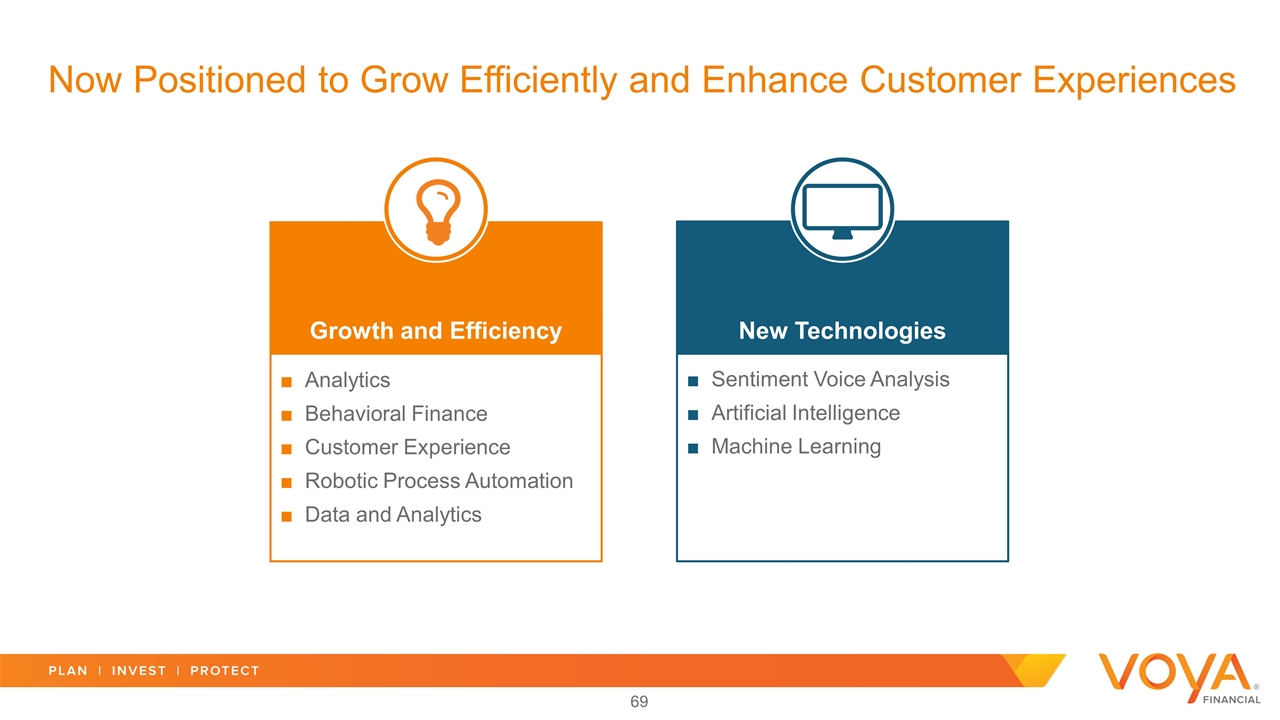
Now Positioned to Grow Efficiently and Enhance Customer Experiences Analytics Behavioral Finance Customer Experience Robotic Process Automation Data and Analytics Growth and Efficiency Sentiment Voice Analysis Artificial Intelligence Machine Learning New Technologies
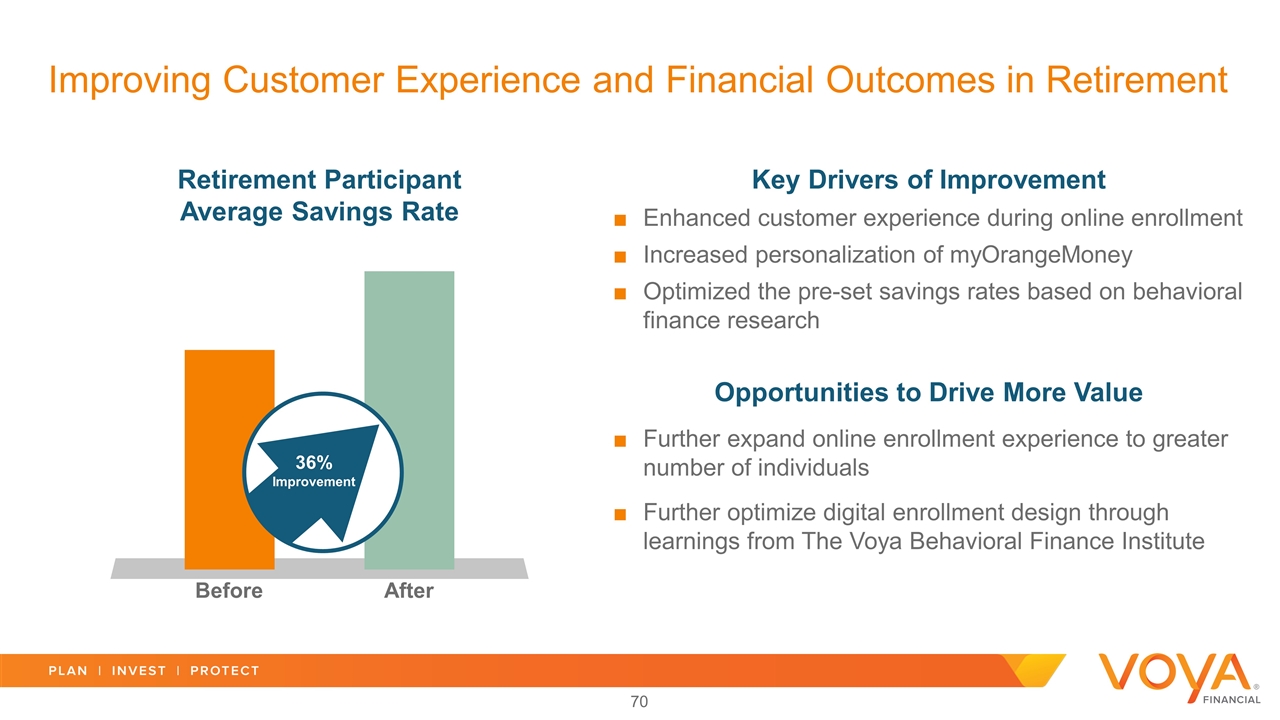
Retirement Participant Average Savings Rate Before After Key Drivers of Improvement Enhanced customer experience during online enrollment Increased personalization of myOrangeMoney Optimized the pre-set savings rates based on behavioral finance research Opportunities to Drive More Value Further expand online enrollment experience to greater number of individuals Further optimize digital enrollment design through learnings from The Voya Behavioral Finance Institute Improving Customer Experience and Financial Outcomes in Retirement 36% Improvement
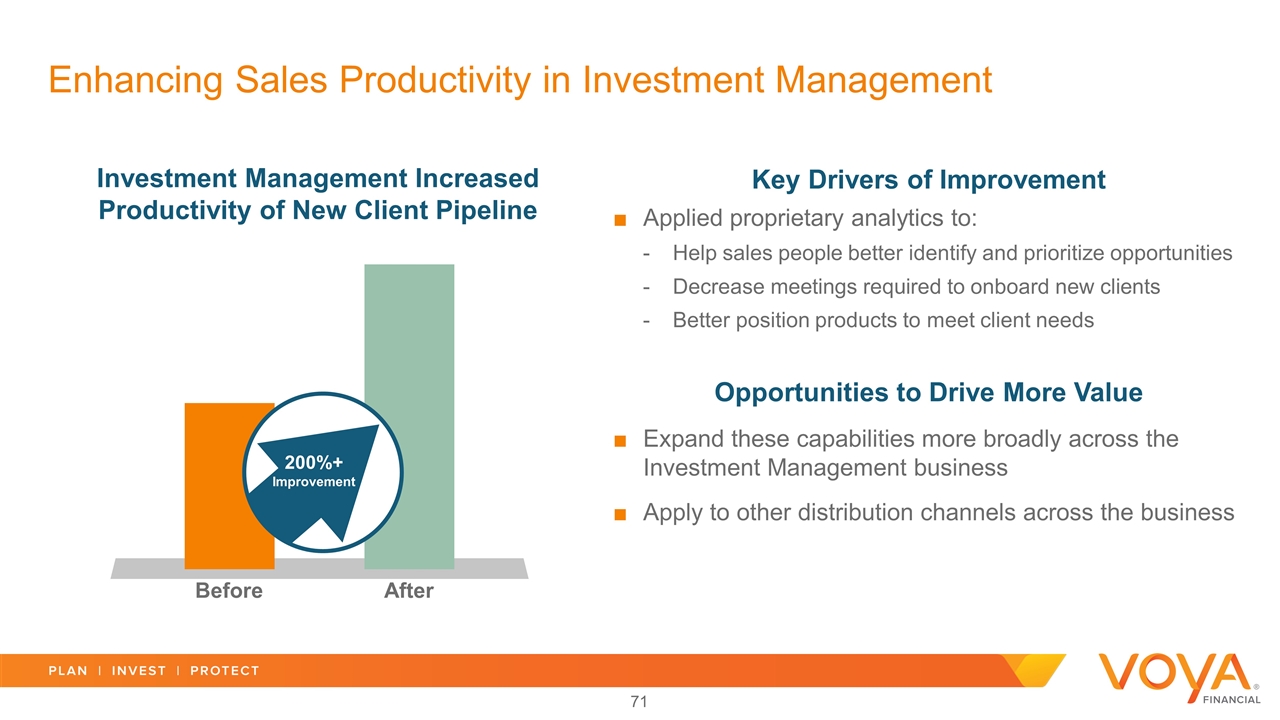
Key Drivers of Improvement Applied proprietary analytics to: Help sales people better identify and prioritize opportunities Decrease meetings required to onboard new clients Better position products to meet client needs Opportunities to Drive More Value Expand these capabilities more broadly across the Investment Management business Apply to other distribution channels across the business Enhancing Sales Productivity in Investment Management Investment Management Increased Productivity of New Client Pipeline Before After 200%+ Improvement

Key Drivers of Improvement Installed simplified straight-through processing Triaged large portion of claims that are straightforward and can be paid more efficiently Identified and eliminated causes of repeat errors Opportunities to Drive More Value Prioritizing similar enhancements for other processes that are moments that matter to customers Pursuing additional opportunities to deliver enhanced capabilities that similarly are valued by employers Improving Efficiency and Customer Experience in Employee Benefits Reduced Time Spent on Employee Benefits Wellness Claims Process Before After 12 days 1 day
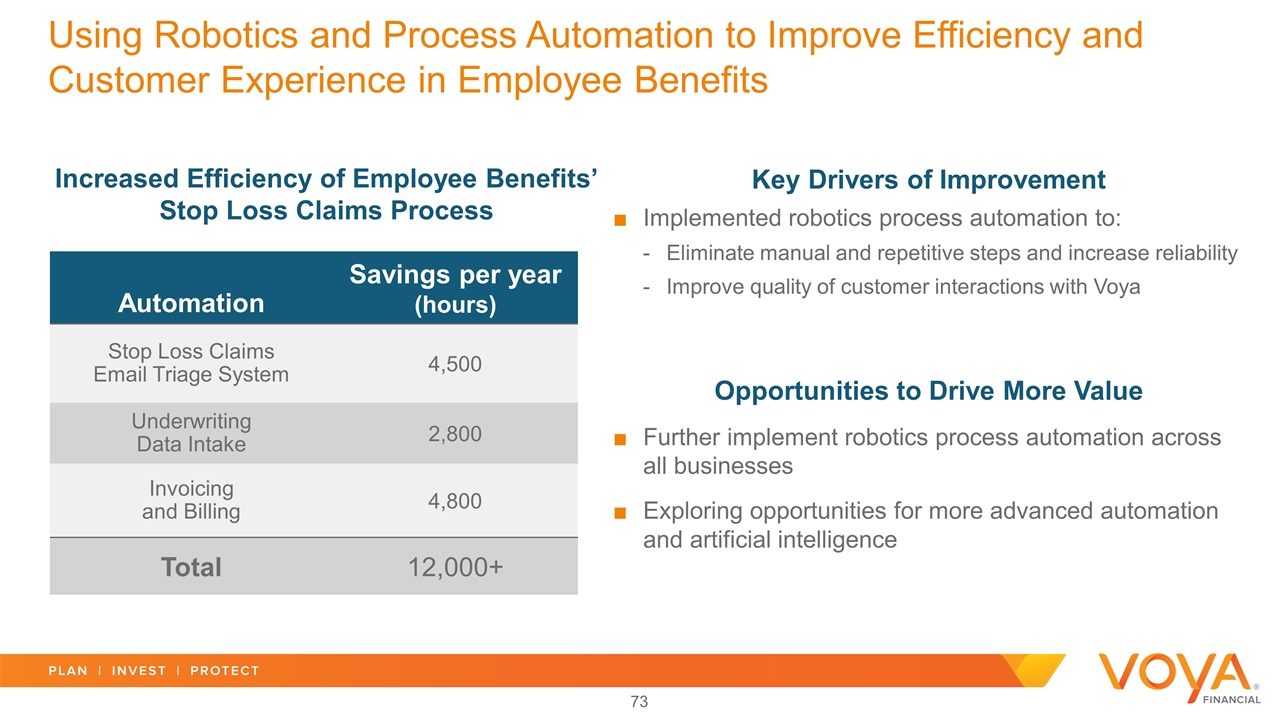
Key Drivers of Improvement Implemented robotics process automation to: Eliminate manual and repetitive steps and increase reliability Improve quality of customer interactions with Voya Opportunities to Drive More Value Further implement robotics process automation across all businesses Exploring opportunities for more advanced automation and artificial intelligence Using Robotics and Process Automation to Improve Efficiency and Customer Experience in Employee Benefits Automation Savings per year (hours) Stop Loss Claims Email Triage System 4,500 Underwriting Data Intake 2,800 Invoicing and Billing 4,800 Total 12,000+ Increased Efficiency of Employee Benefits’ Stop Loss Claims Process

Technology and Innovation Key Takeaways Technology supports growth by improving sales productivity as well as customer experience and financial outcomes Specific use of robotics to improve efficiency and the customer experience Our simplified and scalable infrastructure will enable us to accelerate our performance at a lower cost

Financial Update Mike Smith Chief Financial Officer
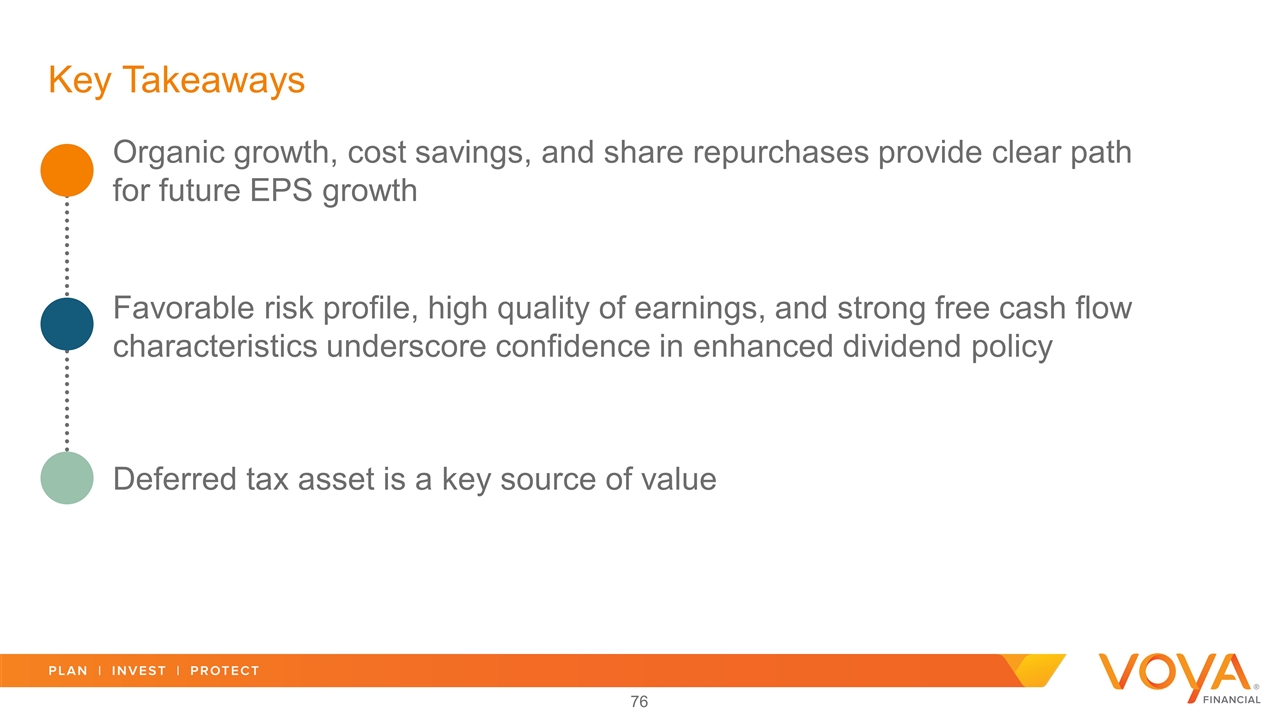
Key Takeaways Favorable risk profile, high quality of earnings, and strong free cash flow characteristics underscore confidence in enhanced dividend policy Deferred tax asset is a key source of value Organic growth, cost savings, and share repurchases provide clear path for future EPS growth
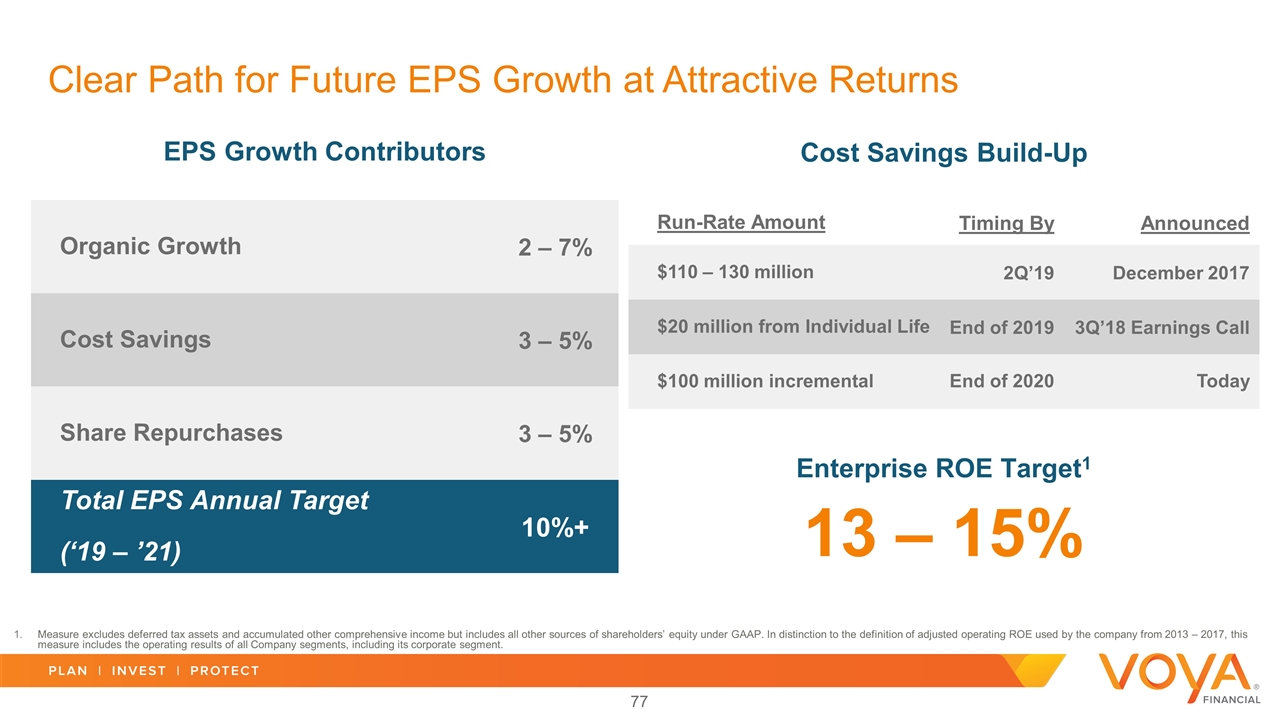
Run-Rate Amount Timing By Announced $110 – 130 million 2Q’19 December 2017 $20 million from Individual Life End of 2019 3Q’18 Earnings Call $100 million incremental End of 2020 Today EPS Growth Contributors Cost Savings Build-Up Organic Growth 2 – 7% Cost Savings 3 – 5% Share Repurchases 3 – 5% Total EPS Annual Target (‘19 – ’21) 10%+ Measure excludes deferred tax assets and accumulated other comprehensive income but includes all other sources of shareholders’ equity under GAAP. In distinction to the definition of adjusted operating ROE used by the company from 2013 – 2017, this measure includes the operating results of all Company segments, including its corporate segment. 13 – 15% Enterprise ROE Target1 Clear Path for Future EPS Growth at Attractive Returns

Both 2015 and 2018 periods have been further adjusted to exclude Investment Management adjusted operating earnings associated with the fixed and variable annuities business that Voya sold to VA Capital LLC on June 1, 2018. Excludes (i) unlocking of DAC/VOBA and other intangibles and (ii) prepayments and alternatives income to the extent such income is above or below our long-term expectations. This measure as presented is a non-GAAP financial measure. For a reconciliation of this measure to the most directly comparable GAAP financial measure, see the document entitled "2018 Investor Day - GAAP Reconciliations", which is available on Voya's investor website at investors.voya.com, and which has been furnished as an exhibit to Voya's Current Report on Form 8-K dated November 13, 2018, available at www.sec.gov. Normalized EPS Growth1 Strong Financial Performance Track Record +89% excluding tax reform Cumulative Capital Return Has Doubled in Last 3 Years ($ billion) $2.3 $5.0 $2.08 $4.77 2015 2018E +129%
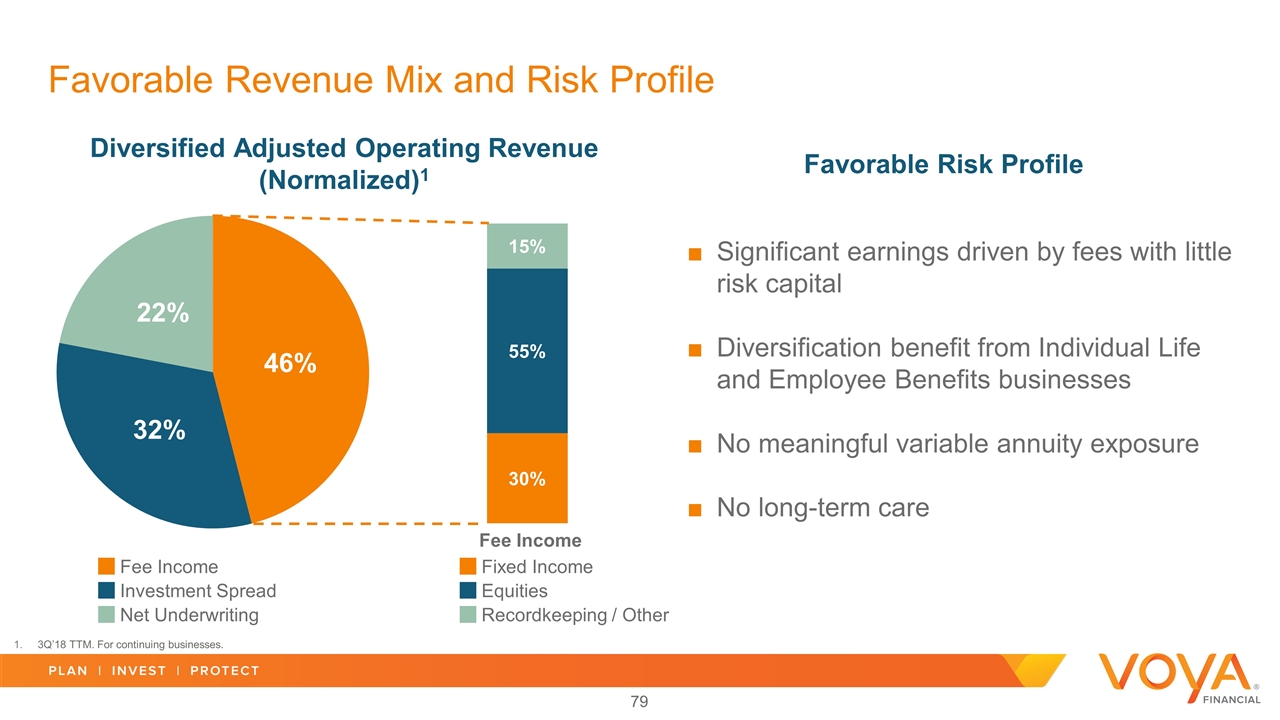
Favorable Revenue Mix and Risk Profile Diversified Adjusted Operating Revenue (Normalized)1 Favorable Risk Profile Significant earnings driven by fees with little risk capital Diversification benefit from Individual Life and Employee Benefits businesses No meaningful variable annuity exposure No long-term care Fee Income Investment Spread Net Underwriting Fixed Income Equities Recordkeeping / Other Fee Income 3Q’18 TTM. For continuing businesses.

Retirement 75 – 85% Investment Management 90 – 100% Employee Benefits 75 – 85% Individual Life 70 – 80% Corporate / Tax Asset Utilization Benefit 0 – 5% Total Free Cash Flow Conversion 85 – 95% ~80% of adjusted operating earnings from high-growth / high-return lines Projected Free Cash Flow Conversion by Segment Investment Management Retirement Employee Benefits Individual Life 3Q’18 TTM Adjusted Operating Earnings by Segment (excludes DAC/VOBA unlocking)1 High Quality Business Mix Pre-tax. Excludes adjusted operating earnings attributable to Corporate and all unlocking of DAC/VOBA and other intangibles. Adjusted operating earnings excluding unlocking of DAC/VOBA and other intangibles is a non-GAAP financial measure. For a reconciliation of this measure to the most directly comparable GAAP financial measure, see the document entitled "2018 Investor Day - GAAP Reconciliations", which is available on Voya's investor website at investors.voya.com, and which has been furnished as an exhibit to Voya's Current Report on Form 8-K dated November 13, 2018, available at www.sec.gov. Our High-Growth, High-Return, Capital-Light Business Mix Generates High Free Cash Flow

Improved Economics and Strong Cash Flow Experienced Management Team Capable of Delivering Further Value Improves free cash flow generation Individual Life delivering $1+ billion in 5-6 years Individual Life free cash flow conversion increases to 70-80% One-time initiatives No capital strain from new Individual Life sales Diversification benefit retained Individual Life Will Enhance Free Cash Flow and Provide Earnings and Capital Diversification In-Force Management Reserve Financing Administrative Simplification Free Cash Flow Improvement

Our High Free Cash Flow Businesses Give Confidence in Raising Dividend which Potentially Expands Investor Base 1%+ Dividend Yield by mid-2019 Near-Term Target Capital Deployment1 Strategy Broaden Investor Base with Higher Dividend Yield Common Stock Dividends Share Repurchase, Organic Growth, and Potential Strategic M&A Capital deployment as a percentage of GAAP Net Income Available to Common Shareholders.
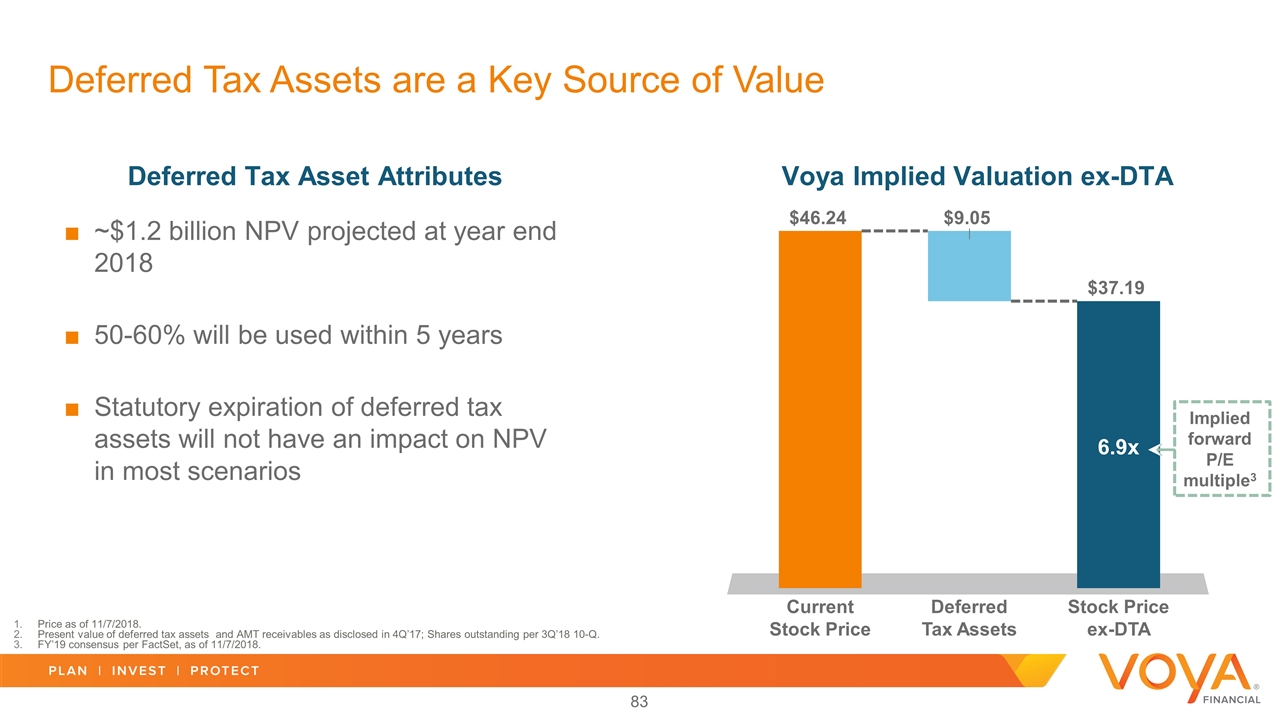
Deferred Tax Assets are a Key Source of Value ~$1.2 billion NPV projected at year end 2018 50-60% will be used within 5 years Statutory expiration of deferred tax assets will not have an impact on NPV in most scenarios Deferred Tax Asset Attributes Voya Implied Valuation ex-DTA Implied forward P/E multiple3 6.9x Price as of 11/7/2018. Present value of deferred tax assets and AMT receivables as disclosed in 4Q’17; Shares outstanding per 3Q’18 10-Q. FY’19 consensus per FactSet, as of 11/7/2018.
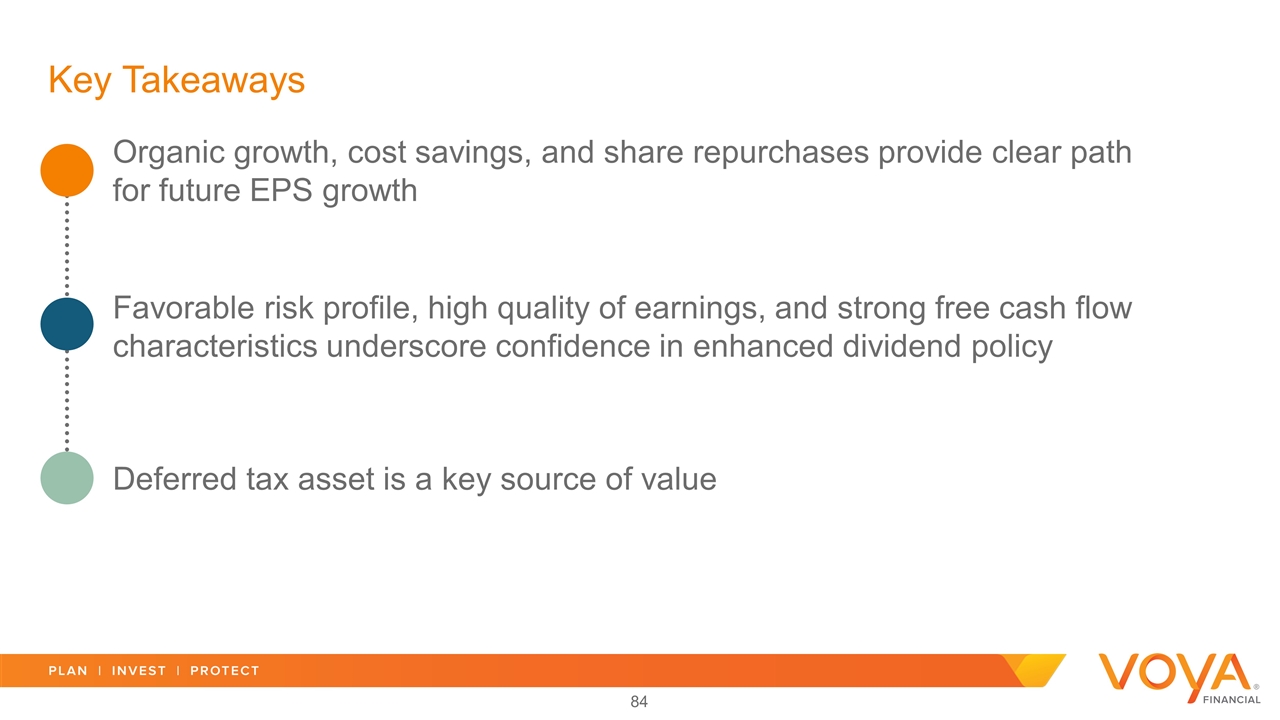
Key Takeaways Favorable risk profile, high quality of earnings, and strong free cash flow characteristics underscore confidence in enhanced dividend policy Deferred tax asset is a key source of value Organic growth, cost savings, and share repurchases provide clear path for future EPS growth

Q&A
Closing Remarks Rod Martin Chairman and Chief Executive Officer
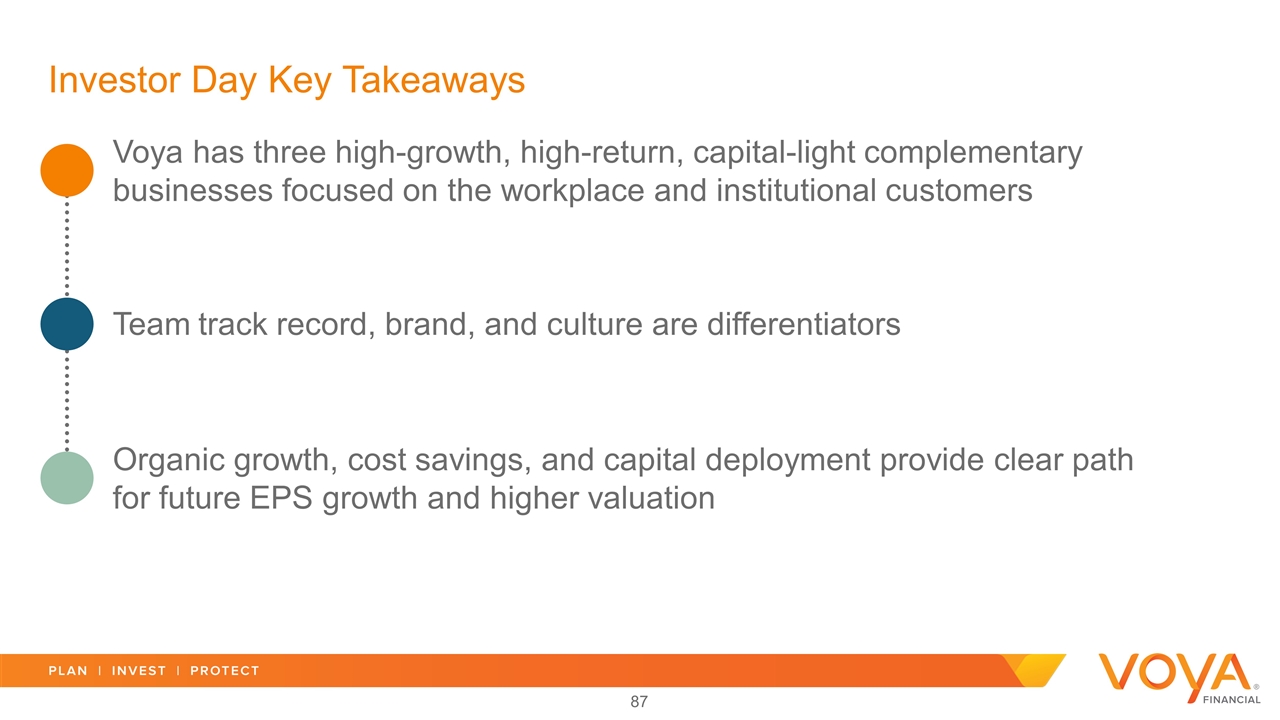
Investor Day Key Takeaways Team track record, brand, and culture are differentiators Organic growth, cost savings, and capital deployment provide clear path for future EPS growth and higher valuation Voya has three high-growth, high-return, capital-light complementary businesses focused on the workplace and institutional customers


