UNITED STATES
SECURITIES AND EXCHANGE COMMISSION
Washington, D.C. 20549
FORM 10-K
ANNUAL REPORT PURSUANT TO SECTION 13 OR 15(d)
OF THE SECURITIES EXCHANGE ACT OF 1934
For the fiscal year ended December 29, 2012
Commission File number 001-35422
Roundy’s, Inc.
(Exact name of registrant as specified in its charter)
| | |
| Delaware | | 27-2337996 |
| (State of incorporation) | | (I.R.S. Employer Identification No.) |
| |
875 East Wisconsin Avenue Milwaukee, Wisconsin | | 53202 |
| (Address of principal executive offices) | | (Zip Code) |
Registrant’s telephone number, including area code: (414) 231-5000
SECURITIES REGISTERED PURSUANT TO SECTION 12(b) OF THE ACT:
| | |
Title of Each Class | | Name of Each Exchange on Which Registered |
| Common Stock, $0.01 par value per share | | New York Stock Exchange |
SECURITIES REGISTERED PURSUANT TO SECTION 12(g) OF THE ACT:
NONE
Indicate by check mark if the registrant is a well-known seasoned issuer, as defined in Rule 405 of the Securities Act. ¨ Yes x No
Indicate by check mark if the registrant is not required to file reports pursuant to Section 13 or Section 15(d) of the Act. ¨ Yes x No
Indicate by check mark whether the registrant (1) has filed all reports required to be filed by Section 13 or 15(d) of the Securities Exchange Act of 1934 during the preceding 12 months (or for such shorter period that the registrant was required to file such reports), and (2) has been subject to such filing requirements for the past 90 days. x Yes ¨ No
Indicate by check mark whether the registrant has submitted electronically and posted on its corporate Website, if any, every Interactive Data File required to be submitted and posted pursuant to Rule 405 of Regulation S-T (§229.405 of this chapter) during the preceding 12 months (or for such shorter period that the registrant was required to submit and post such files). x Yes ¨ No
Indicate by check mark if disclosure of delinquent filers pursuant to Item 405 of Regulation S-K is not contained herein and will not be contained, to the best of the registrant’s knowledge, in definitive proxy or information statements incorporated by reference in Part III of this Form 10-K or any amendment to this Form 10-K. ¨
Indicate by check mark whether the registrant is a large accelerated filer, an accelerated filer, a non-accelerated filer, or a smaller reporting company. See definitions of “large accelerated filer,” “accelerated filer” and “smaller reporting company” in Rule 12b-2 of the Exchange Act.
| | | | | | |
| Large accelerated filer | | ¨ | | Accelerated filer | | ¨ |
| | | |
| Non-accelerated filer | | x | | Smaller reporting company | | ¨ |
Indicate by check mark whether the registrant is a shell company (as defined in Rule 12b-2 of the Exchange Act). ¨ Yes x No
The aggregate market value of all common stock held by non-affiliates of the registrant as of June 30, 2012 was $286,018,662.
As of March 5, 2013, 45,597,533 shares of the registrants common stock, par value $0.01 per share, were issued and outstanding.
Documents Incorporated by Reference
Portions of the registrant’s Proxy Statement for the Annual Meeting of Stockholders to be held on May 17, 2013 (hereinafter referred to as the 2012 Proxy Statement) are incorporated by reference into Part III.
Roundy’s, Inc.
FORM 10-K
For the Fiscal Year Ended December 29, 2012
Table of Contents
Forward-Looking Statements
This Annual Report on Form 10-K for Roundy’s, Inc. and its subsidiaries contains forward-looking statements that are subject to risks and uncertainties. All statements other than statements of historical fact included in this Annual Report on Form 10-K are forward-looking statements. Forward-looking statements give our current expectations and projections relating to our financial condition, results of operations, plans, objectives, future performance and business. You can identify forward-looking statements by the fact that they do not relate strictly to historical or current facts. These statements may include words such as “anticipate,” “estimate,” “expect, “ “project,” “forecast,” “continue,” “plan,” “intend,” “believe,” “may,” “will,” “should,” “can have,” “likely” and other words and terms of similar meaning in connection with any discussion of the timing or nature of future operating or financial performance or other events. For example, all statements we make relating to our estimated and projected store openings, costs, expenditures, cash flows, growth rates and financial results, our plans and objectives for future operations, growth or initiatives, strategies or the expected outcome or impact of pending or threatened litigation are forward-looking statements. All forward-looking statements are subject to risks and uncertainties that may cause actual results to differ materially from those that we expected, including:
| | • | | our ability to compete effectively with other retailers; |
| | • | | our ability to maintain price competitiveness; |
| | • | | ongoing economic uncertainty; |
| | • | | the geographic concentration of our stores; |
| | • | | our ability to achieve sustained sales and profitable operating margins at new stores; |
| | • | | our ability to maintain or increase our operating margins; |
| | • | | our ability to implement our expansion into the Chicago market on a timely basis; |
| | • | | ordering errors or product supply disruptions in the delivery of perishable products; |
| | • | | increases in commodity prices; |
| | • | | our ability to protect or maintain our intellectual property; |
| | • | | severe weather, and other natural disasters in areas in which we have stores or distribution facilities; |
| | • | | the failure of our information technology or administrative systems to perform as anticipated; |
| | • | | data security breaches and the release of confidential customer information; |
| | • | | our ability to offset increasing energy costs with more efficient usage; |
| | • | | negative effects to our reputation from real or perceived quality or health issues with our food products; |
| | • | | our ability to retain and attract senior management and key employees; |
| | • | | our ability to renegotiate expiring collective bargaining agreements and new collective bargaining agreements; |
| | • | | our ability to satisfy our ongoing capital needs and unanticipated cash requirements; |
| | • | | the availability of financing to pursue our expansion into the Chicago market on satisfactory terms or at all; |
| | • | | additional indebtedness incurred in the future; |
| | • | | our ability to retain and attract qualified store- and distribution-level employees; |
| | • | | rising costs of providing employee benefits, including increased pension contributions due to unfunded pension liabilities; |
1
| | • | | risks inherent in packaging and distributing pharmaceuticals and other healthcare products; |
| | • | | wartime activities, threats or acts of terror or a widespread regional, national or global health epidemic; |
| | • | | claims made against us resulting in litigation; |
| | • | | changes to financial accounting standards regarding store leases; |
| | • | | our high level of fixed lease obligations; |
| | • | | further impairment of our goodwill; and |
| | • | | other factors discussed under Item 1A – Risk Factors. |
We derive many of our forward-looking statements from our operating budgets and forecasts, which are based upon many detailed assumptions. While we believe that our assumptions are reasonable, we caution that it is very difficult to predict the impact of known factors, and it is impossible for us to anticipate all factors that could affect our actual results. Important factors that could cause actual results to differ materially from our expectations, or cautionary statements, are disclosed under the sections entitled “Risk Factors” and “Management’s Discussion and Analysis of Financial Condition and Results of Operations” in this Annual Report on Form 10-K. All written and oral forward-looking statements attributable to us, or persons acting on our behalf, are expressly qualified in their entirety by the cautionary statements as well as other cautionary statements that are made from time to time in our other filings with the United States Securities and Exchange Commission (“SEC”) and public communications. You should evaluate all forward-looking statements made in this Annual Report on Form 10-K in the context of these risks and uncertainties.
The forward-looking statements included in this Annual Report on Form 10-K are made only as of the date hereof. We undertake no obligation to publicly update or revise any forward-looking statement as a result of new information, future events or otherwise, except as otherwise required by law.
2
PART I
Unless we state otherwise or the context otherwise requires, the terms “we,” “us,” “our,” “Roundy’s,” “the Company,” “our business,” “our company” refer to Roundy’s, Inc. and its subsidiaries as a combined entity.
We are a leading Midwest supermarket chain with a 141-year operating history. We were founded in 1872 as a privately owned food wholesaling company. In 1952, we were sold to certain of our customers and until 2002 operated under the Roundy’s corporate name as a retailer owned cooperative, with food wholesaling operations largely focused in Wisconsin. We opened our first Pick ’n Save store in 1975 and built a base of company-owned and operated retail stores throughout the 1980s and 1990s.
In June 2002, we were acquired by an investor group led by Willis Stein and our management team. At that time, we derived more than 50% of our sales from food wholesaling operations and the remainder from our company-operated retail stores. Following the acquisition, we accelerated our strategy of expanding our retail store base through selective acquisitions and organic growth, while divesting our wholesale operations. The substantial elimination of the wholesale business has helped to optimize our distribution network to better support our retail stores. As of December 29, 2012, our retail operations consisted of 161 grocery stores, with 121 stores in Wisconsin operating under the Pick ’n Save, Copps and Metro Market banners, 32 stores in Minneapolis/St. Paul operating under the Rainbow banner and eight stores in Illinois operating under the Mariano’s banner.
Our corporate headquarters are located at 875 East Wisconsin Avenue, Milwaukee, Wisconsin 53202. Our telephone number is (414) 231-5000. Our website address is www.roundys.com.
Stores
We operate retail grocery stores under our Pick ’n Save, Rainbow, Copps, Metro Market and Mariano’s retail banners. The following table represents our store network as of the end of each of our last five fiscal years:
| | | | | | | | | | | | | | | | | | | | |
| | | 1/3/2009 | | | 1/2/2010 | | | 1/1/2011 | | | 12/31/2011 | | | 12/29/2012 | |
Pick ’n Save | | | 94 | | | | 95 | | | | 94 | | | | 93 | | | | 93 | |
Rainbow | | | 31 | | | | 32 | | | | 32 | | | | 32 | | | | 32 | |
Copps | | | 26 | | | | 26 | | | | 26 | | | | 26 | | | | 25 | |
Metro Market | | | 1 | | | | 1 | | | | 2 | | | | 3 | | | | 3 | |
Mariano’s | | | — | | | | — | | | | 1 | | | | 4 | | | | 8 | |
| | | | | | | | | | | | | | | | | | | | |
Total Company-owned stores | | | 152 | | | | 154 | | | | 155 | | | | 158 | | | | 161 | |
| | | | | | | | | | | | | | | | | | | | |
Our stores, which average approximately 61,000 square feet, offer all of the products and services found in a conventional supermarket, including nationally branded food products and own-brand products. In addition, our stores feature expansive meat, produce, deli and other perishable products and specialty and prepared foods departments, which represent higher growth and margin categories. We also offer a broad line of health and beauty care products and a large selection of seasonal merchandise to maximize the conveniences offered to our customers.
Our Pick ’n Save, Rainbow and Copps retail banners are operated as high volume, value oriented supermarkets that seek to offer attractive prices and the best value among conventional food retailers in a given market. Our value price strategy is complemented by weekly promotions, a broad assortment of high quality fresh produce and other perishable products, as well as a focus on providing a high level of customer service and conveniences. Substantially all stores have full-service deli, meat, seafood and bakery departments, and 98 stores feature full-service pharmacies.
| | • | | Pick ’n Save.We operate Pick ’n Save stores primarily in the Milwaukee area, as well as in certain other Wisconsin markets, including Racine, Oshkosh, Kenosha, and Fond du Lac. We also serve as the primary wholesaler for one additional Pick ’n Save bannered store that we do not operate. |
3
| | • | | Rainbow.We operate Rainbow stores in the Minneapolis/St. Paul area. |
| | • | | Copps.We operate Copps stores primarily in the Madison area as well as in certain northern Wisconsin markets, including Green Bay and Appleton. |
We have focused on leveraging our strong brand names, high level of customer service, high quality perishables and strategically located stores, to increase market share. We believe the Pick ’n Save banner maintains the number one market share position in the Milwaukee metropolitan area. Additionally, through the Pick ’n Save and Copps banners, we believe we also maintain the number one market share position in several other large Wisconsin markets, including Madison, Racine, Fond du Lac and Oshkosh. We believe the Rainbow banner maintains the number three market share position in the Minneapolis/St. Paul metropolitan area.
Our Mariano’s and Metro Market specialty food retail banners combine our value oriented conventional offering with an enhanced selection of full-service premium perishable and prepared food departments.
| | • | | Mariano’s.We entered the Chicago market in July 2010 through the opening of our first Mariano’s store in Arlington Heights, Illinois. As of December 29, 2012, we had opened eight stores in the Chicago market and secured ten leases for future stores in attractive locations. Mariano’s brings an innovative format to the Chicago market, providing an expanded variety of produce and other perishables at competitive prices, unique specialty departments and superior customer service within an inviting ambiance. |
| | • | | Metro Market.We opened our first Metro Market store in August 2004 primarily to serve downtown Milwaukee apartment and condominium residents. The Metro Market store format features an expanded variety of produce, meat and prepared food offerings, coupled with exceptional customer service. We opened our second Metro Market store in March 2010 and our third in February 2011. Both of these additional locations are in suburbs of Milwaukee. All Metro Market stores operate in-store pharmacies. |
Merchandising
We provide our customers with a compelling one-stop shopping experience featuring a high level of customer service in our attractive and convenient stores. Our product assortment includes high quality perishables and a broad selection of national brand and own-brand products at competitive prices. Many of our product categories include natural and organic options, catering to our customers’ focus on healthier eating choices.
Products
We offer our customers a wide variety of products, with a typical store stocking approximately 45,000 different items. Our stores sell most nationally advertised brands, as well as numerous products under our Roundy’s Select, Roundy’s and Clear Value own-brand labels, which maintain strong brand recognition throughout our markets. Our products can broadly be classified as non-perishable, perishable and non-food. Non-perishable food categories consist of grocery, frozen, and dairy products. Perishable categories include produce, meat, seafood, deli, bakery and floral. Non-food primarily includes general merchandise, health and beauty care, pharmacy, and alcohol.
In recent years, we have enhanced the quality and selection of key perishable products to meet growing customer demand due to an increased focus on healthy eating. Perishable product sales also typically generate higher gross margins than non-perishable products. As a result, the percentage of our net sales generated from perishable products has increased in recent periods as illustrated by the table below:
| | | | | | | | | | | | | | | | | | | | |
| | | Fiscal 2008 | | | Fiscal 2009 | | | Fiscal 2010 | | | Fiscal 2011 | | | Fiscal 2012 | |
Non-perishable food | | | 53.2 | % | | | 53.0 | % | | | 51.7 | % | | | 50.9 | % | | | 49.6 | % |
Perishable | | | 31.8 | % | | | 32.0 | % | | | 32.3 | % | | | 33.0 | % | | | 33.7 | % |
Non-food | | | 15.0 | % | | | 15.0 | % | | | 16.0 | % | | | 16.1 | % | | | 16.7 | % |
| | | | | | | | | | | | | | | | | | | | |
Total | | | 100.0 | % | | | 100.0 | % | | | 100.0 | % | | | 100.0 | % | | | 100.0 | % |
| | | | | | | | | | | | | | | | | | | | |
4
We generally classify our products into the following primary categories: grocery, frozen & dairy; produce; meat & seafood; bakery; deli, cheese & prepared foods; floral; general merchandise; alcohol; pharmacy; and health & beauty care. A brief description of the type of products we offer within each of these categories is set forth below.
| | • | | Grocery, Frozen & Dairy.We offer a wide selection of grocery items at competitive prices, including both national brands and own-brands. Our frozen department offers everyday staples such as vegetables, juice, microwaveable dinners, pizza and ice cream. In our dairy department, our milk, yogurt, sour cream, cheese and eggs generally are produced locally in Wisconsin to ensure our customers are offered the freshest tasting products. We also provide a broad selection of natural and organic products. |
| | • | | Produce.We are committed to offering our customers the highest quality produce. We offer over 500 varieties of fresh fruit and vegetables sourced locally and from around the globe. Our stores offer an expansive assortment of USDA Certified organic produce. Our value-added produce offering includes fresh cut fruit, fresh squeezed juice and salad bars in many of our stores. |
| | • | | Meat & Seafood.We offer a distinctive selection of meat and fresh seafood, including natural and organic varieties, delivered with knowledgeable customer service. Our beef offerings consists primarily of fresh cut USDA Choice graded beef, and we also sell all-natural pork, lamb, veal, Italian sausage and bratwurst, and chicken. Our fresh seafood includes, for example, salmon, whitefish and locally harvested rainbow trout. In addition, we offer popular ready-to-bake selections in both our meat and seafood departments. |
| | • | | Bakery. Our bakery department offers a wide selection of breads, rolls, pies, donuts, muffins, cookies and other goods baked in-store daily. Our Roundy’s Select muffins are made with high quality ingredients, including Maine wild blueberries, Wisconsin cranberries, and spicy Korintje cinnamon. Roundy’s breads range from traditional French and Italian loaves to select artisanal varieties. |
| | • | | Deli, Cheese & Prepared Foods.We provide our customers with a “neighborhood deli” experience by offering fresh foods from high quality suppliers at competitive prices. Our deli selections include fresh salads, sandwiches, meals to go, and fresh sliced deli meats. We also offer an abundant selection of local, domestic, and imported artisanal cheeses, including creamy brie, gruyere, hard shaving cheeses, fresh mozzarella, and sharp cheddars. We also offer many varieties of fresh soups that are sold hot on our soup bars. Our prepared foods include entrees such as meat loaf, chicken Milanese, rotisserie chickens, baby back ribs, chicken pot pies, various varieties of quiche, and hand-breaded, fresh fried chicken. |
| | • | | Floral.We are committed to providing our customers with the freshest roses, bouquets, arrangements, green plants and attractive seasonal favorites. Our flower market offers a broad variety of cut flowers and allows customers to create their own bouquets. |
| | • | | General Merchandise. In order to maximize the conveniences offered to our customers that facilitate one-stop shopping, we offer a wide variety of candy and seasonal merchandise, as well as an assortment of household cleaning and cooking products. We also offer a wide selection of baby products for our customers from diapers to baby food and formula and other baby accessories. |
| | • | | Alcohol.We offer a wide selection of competitively priced beer, wine and spirits. Our beer selection includes over 70 domestic and international brands in multiple styles, including local and regional craft beers. We also offer a wide assortment of wines from North America and around the world, and a broad variety of spirits. |
| | • | | Pharmacy.Our pharmacies offer helpful and knowledgeable pharmacists, quality products and value-added services for our customers. We accept over 4,000 different prescription plans, and all of our pharmacists are licensed as immunizers and trained in medication therapy management. |
| | • | | Health & Beauty Care.Our stores provide a convenient location for everyday health and beauty needs. We stock a wide variety of healthcare products, from thermometers and bandages to toothpaste and floss. We also offer a wide selection of beauty products from cosmetics to hair and skin care. |
5
Own-Brand Strategy
We have been expanding the breadth of our own-brand offering over the last five years. Our premium Roundy’s Select and mid-tier Roundy’s own-brand lines feature quality levels that we believe equal or exceed national brands at competitive prices. Our Clear Value line offers entry-level own-brand products serving as our lowest price alternative to national brands. Our portfolio of own-brand items includes approximately 5,700 as of December 29, 2012, with the percentage of sales from own-brand items representing 21.2% of our net sales.
Competitive Environment
For the disclosure related to the Company’s competitive environment, see Item 1A—Risk Factors under the heading “Risks Related to our Business.”
Marketing and Advertising
The support of our retail brands occurs through an integrated marketing approach. We use print circulars distributed through shared mail delivery or inserted into local newspapers as a key medium for advertising. These circulars contain traffic-driving promotions from key departments, a weekly themed promotion and branding emphasis on the quality of our fresh perishable products. Weekly campaigns are also supported through the use of local radio and television, web, digital, social media and public relations initiatives. We also utilize targeted direct mail in specific markets.
Manufacturing and Distribution
We operate three distribution centers with an aggregate of approximately 1.8 million square feet of warehouse and administrative space. Our distribution network is supported by a modern fleet of 100 tractors and 371 trailers. In addition to the primary function of supplying our retail operations a broad product line that includes dry grocery, frozen foods, fresh produce, meat, dairy products, bakery goods and non-food products, our three distribution centers in Wisconsin also supply the primary needs of one independent licensed Pick ’n Save location. We have a long-term license and supply contract in place with this independent customer. Under the terms of the licensing agreement, we allow the licensee to use the Pick ’n Save banner free of charge in exchange for entering into a license and supply agreement in which the licensee generally agrees to purchase a majority of its product requirements from us.
We operate a 116,000 square foot central commissary that manufactures a wide range of food products, including unique own-brand products. The commissary is a multi-purpose food production manufacturing plant and includes a complete food testing laboratory and an on-site product development department. The commissary currently produces a variety of perishable and non-perishable own-brand food items. We continually add to our capability to produce a wider variety of perishable and prepared foods. The commissary is an important element of the Company’s strategy to grow sales of own-brand products, perishables and prepared foods.
Intellectual Property
We maintain registered trademarks for our Pick ’n Save and Rainbow store banner trade names and our Roundy’s private label brand name. Registered trademarks are generally renewable on a 10 year cycle. We also have several common law trademarks, including Copps and Mariano’s. We consider trademarks an important way to establish and protect our brands in a competitive environment.
Segments
The Company has determined that it has one reportable operating statement. See Note 15 to our audited consolidated financial statements set forth in Item 8—Financial Statements and Supplementary Data below.
6
Employees
As of December 29, 2012, we had 18,710 employees, including 7,552 full-time employees and 11,158 part-time employees. Approximately 52% of our employees were subject to a collective bargaining agreement as of December 29, 2012. With respect to our unionized employees, as of March 5, 2013, we have 3.0% of our unionized employees working under expired contracts and 10.5% of our unionized employees working under contracts that will expire prior to December 28, 2013.
We consider our employee relations to be good and do not anticipate any difficulties in re-negotiating these expired contracts. We have never experienced a strike or significant work stoppage.
Executive Officers of the Registrant
The disclosure regarding executive officers is set forth in our 2012 Proxy Statement under the caption “Directors and Executive Officers” and is incorporated herein by reference.
Available Information
Our internet address is http://www.roundys.com. Through “Investor Relations”—“SEC Filings” on our home page, we make available free of charge our annual report on Form 10-K, our quarterly reports on Form 10-Q, our proxy statements, our current reports on Form 8-K, SEC Forms 3, 4 and 5 and any amendments to those reports filed or furnished pursuant to Section 13(a) or 15(d) of the Securities Exchange Act of 1934 as soon as reasonably practicable after we electronically file such material with, or furnish it to, the SEC. Our reports filed with the SEC are also made available to read and copy at the SEC’s Public Reference Room at 100 F Street, N.E., Washington, D.C. 20549. You may obtain information about the Public Reference Room by contacting the SEC at 1-800-SEC-0330. Reports filed with the SEC are also made available on its website atwww.sec.gov.
Copies of the Charters of the Audit, Compensation and Nominating and Corporate Governance Committees of the Board of Directors, our Code of Business Conduct and Corporate Governance Guidelines can also be found on the Roundy’s website.
ITEM 1A—RISK FACTORS
There are risks and uncertainties that can affect our business, financial condition and results of operation, any one of which could cause our actual results to vary materially from recent results or from those indicated by forward looking statements included within this Annual Report on Form 10-K, and within other filings with the SEC, news releases, registration statements and other written communication. Any of these risks could materially and adversely affect our business, financial condition and results of operations, which in turn could materially and adversely affect the price of our common stock.
Risks Related to our Business
We operate in a highly competitive industry.
The retail food industry as a whole, and our marketing areas in Wisconsin, Minneapolis/St. Paul and Chicago, are highly competitive. We compete with various types of retailers, including national, regional and local conventional supermarkets, national and regional supercenters, membership warehouse clubs, and other alternative food retailers, such as natural foods stores, smaller specialty stores and farmers’ markets.
Our principal competitors include national conventional supermarkets such as SUPERVALU (operating under the Jewel/Osco and Cub Foods banners) and Safeway (operating under the Dominick’s banner); national supercenters such as Costco, Target and Wal-Mart; regional supercenters such as Woodman’s and Meijer’s; regional supermarkets such as Festival Foods and Piggly Wiggly; alternative food retailers such as Aldi, Trader
7
Joe’s and Whole Foods; and local supermarkets, natural foods stores, smaller specialty stores and farmers’ markets. In general, we compete with Aldi, Costco, Target and Wal-Mart across all of our geographic markets. Our remaining principal competitors within each of our geographic markets vary to a significant degree and include the following:
| | • | | Wisconsin: Festival Foods, Piggly Wiggly and Woodman’s; |
| | • | | Minneapolis/St. Paul: Cub Foods and Lund’s/Byerly’s; and |
| | • | | Chicago: Dominick’s, Jewel/Osco, Meijer’s, Strack & Van Til, Trader Joe’s and Whole Foods. |
Some of these competitors have attempted to increase market share by expanding their footprints in our marketing areas. This competitor expansion creates a more difficult competitive environment for us. We also face limited competition from restaurants and fast-food chains. In addition, other established food retailers could enter our markets, increasing competition for market share.
We compete with other food retailers primarily on the basis of product selection and quality, price, customer service, store format and location or a combination of these factors. Pricing in particular is a significant driver of consumer choice in our industry and we regularly engage in price competition. To the extent that our competitors lower prices, our ability to maintain gross profit margins and sales levels may be negatively impacted. We expect competitors to continue to apply pricing and other competitive pressures. Some of our competitors have greater resources than we do and do not have unionized work forces, which may result in lower labor and benefit costs. These competitors could use these advantages to take measures, including reducing prices, which could materially adversely affect our competitive position, our financial condition and results of operations.
In addition to price competitiveness, our success depends on our ability to offer products that appeal to our customers’ preferences. Failure to offer such products, or to accurately forecast changing customer preferences, could lead to a decrease in the number of customer transactions at our stores and a decrease in the amount customers spend when they visit our stores. We also attempt to create a convenient and appealing shopping experience for our customers in terms of customer service, store format and location. If we do not succeed in offering attractively priced products that consumers want to buy or are unable to provide a convenient and appealing shopping experience, our sales, operating margins and market share may decrease, resulting in reduced profitability.
Economic conditions that impact consumer spending could materially affect our business.
Ongoing economic uncertainty continues to negatively affect consumer confidence and discretionary spending. Our results of operations may be materially affected by changes in economic conditions nationwide or in the regions in which we operate that impact consumer confidence and spending, including discretionary spending. This risk may be exacerbated if customers choose lower-cost alternatives to our product offerings in response to economic conditions. In particular, a decrease in discretionary spending could adversely impact sales of certain of our higher margin product offerings. Future economic conditions affecting disposable consumer income, such as employment levels, business conditions, changes in housing market conditions, the availability of credit, interest rates, tax rates and fuel and energy costs, could reduce overall consumer spending or cause consumers to shift their spending to lower-priced competitors. In addition, inflation or deflation can impact our business. Food deflation could reduce sales growth and earnings, while food inflation, combined with reduced consumer spending, could reduce gross profit margins. As a result, our results of operations could be materially adversely affected.
The geographic concentration of our stores creates an exposure to local economies and regional downturns that may materially adversely affect our financial condition and results of operations.
As of December 29, 2012, we operated 121 stores in Wisconsin, making Wisconsin our largest market with 75% of our stores. Of our Wisconsin stores, 60, or nearly half, are located in the Milwaukee area. We also have 32 stores located in the Minneapolis/St. Paul area. Our business is closely linked to local economic conditions in those areas and, as a result, we are vulnerable to economic downturns in those regions. In addition, any other factors that
8
negatively affect these areas could materially adversely affect our revenues and profitability. These factors could include, among other things, changes in regional demographics, population and employer base. Any of these factors may disrupt our businesses and materially adversely affect our financial condition and results of operations.
We may be unable to maintain or improve levels of same-store sales, which could harm our business and cause our stock price to decline.
We may not be able to maintain or improve our current levels of same-store sales. Our same-store sales have fluctuated in the past and will likely fluctuate in the future. A variety of factors affect our same-store sales, including:
| | • | | overall economic trends and conditions; |
| | • | | consumer preferences, buying trends and spending levels; |
| | • | | our competition, including competitor store openings or closings near our stores; |
| | • | | the pricing of our products, including the effects of inflation or deflation; |
| | • | | the number of customer transactions in our stores; |
| | • | | our ability to provide product offerings that generate new and repeat visits to our stores; |
| | • | | the level of customer service that we provide in our stores; |
| | • | | our in-store merchandising-related activities; |
| | • | | our ability to source products efficiently; and |
| | • | | the number of stores we open, remodel or relocate in any period. |
Adverse changes in these factors may cause our same-store sales results to be materially lower than in recent periods, which would harm our business and could result in a decline in the price of our common stock.
We may be unable to maintain our operating margins, which could adversely affect the price of our common stock.
We intend to maintain our operating margins in an environment of increased competition through various initiatives, including expansion of our own-brand offerings, increased sales of perishables and prepared foods, improved ordering, and strategic remodels and relocations of our stores, as well as continued cost discipline focused on improving labor productivity and reducing shrink. If competitive pressures cause us to lower our prices, our operating margins may decrease. If customers do not adopt our increased own-brand, perishable or prepared food offerings, these higher margin items will not improve our operating margins. If we do not adequately refine and improve our various ordering, tracking and allocation systems, we may not be able to increase sales and reduce inventory shrink. Any failure to achieve gains in labor productivity may adversely impact our operating margins. As a result, our operating margins may stagnate or decline, which could adversely affect the price of our stock.
Prolonged labor disputes with unionized employees and increases in labor costs could adversely affect us.
Our largest operating costs are attributable to labor costs and, therefore, our financial performance is greatly influenced by increases in wage and benefit costs, including pension and health care costs. As a result, we are exposed to risks associated with a competitive labor market and, more specifically, to any disruption of our unionized work force.
As of December 29, 2012, approximately 52% of our employees were represented by unions and covered by collective bargaining or similar agreements that are subject to periodic renegotiation. Our renegotiation of expiring collective bargaining agreements and negotiation of new collective bargaining agreements may not
9
prove successful, may result in a significant increase in labor costs, or may result in a disruption to our operations. We expect that we would incur additional costs and face increased competition if we lost customers during a work stoppage or labor disturbance.
As of December 29, 2012, we had an aggregate of 44 collective bargaining agreements in effect, all of which are scheduled to expire between 2013 and 2016. As of December 29, 2012 there were no employees operating under an expired collective bargaining agreement.
In the renegotiation of our current contracts and the negotiation of our new contracts, rising health care and pension costs and the nature and structure of work rules will be important issues. The terms of the renegotiated collective bargaining agreements could create either a financial advantage or disadvantage for us as compared to our major competitors and could have a material adverse effect on our results of operations and financial condition. Our labor negotiations may not conclude successfully and work stoppages or labor disturbances could occur. A prolonged work stoppage affecting a substantial number of stores could have a material adverse effect on our financial condition, results of operations and cash flows. We also expect that in the event of a work stoppage or labor disturbance, we could incur additional costs and face increased competition for customers.
The Patient Protection and Affordable Care Act may materially increase our costs and/or make it harder for us to compete as an employer.
The Patient Protection and Affordable Care Act imposed new mandates on employers, including a requirement effective January 1, 2014 that employers with 50 or more full-time employees provide “credible” health insurance to employees or pay a financial penalty. Given our generally low-wage workforce and our current health plan design, and assuming the law is implemented without significant changes, these mandates could materially increase our costs. Moreover, if we choose to opt out of offering health insurance to our employees, we may become less attractive as an employer and it may be harder for us to compete for qualified employees.
We may not be able to successfully implement our expansion into the Chicago market, which could limit our prospects for future growth.
Our ability to continue to expand into the Chicago market with a new format of stores under our Mariano’s banner is an important component of our business strategy. Successful execution of this expansion depends upon, among other things:
| | • | | the levels of sales and profitability of Mariano’s stores; |
| | • | | the attractiveness of the Mariano’s store format and brand to local customers; |
| | • | | the hiring, training and retention of skilled store personnel and management; |
| | • | | the incorporation of new Mariano’s stores into our existing distribution network; |
| | • | | the identification of suitable sites in the Chicago market for store locations; |
| | • | | the negotiation of acceptable lease terms for store sites; |
| | • | | the effective management of inventory to meet the needs of our stores on a timely basis; |
| | • | | the availability of levels of cash flow or financing necessary to support our expansion; and |
| | • | | our ability to successfully address competitive pricing, merchandising, distribution and other challenges encountered in connection with expansion into the Chicago market. |
We, or our third-party vendors, may not be able to adapt our distribution, management information and other operating systems to adequately supply products to new stores at competitive prices so that we can operate the stores in a successful and profitable manner. Additionally, our expansion into the Chicago market will place
10
increased demands on our operational, managerial and administrative resources. These increased demands could cause us to operate our existing business less effectively, which in turn could cause deterioration in the financial performance of our existing stores.
In addition, new stores build their sales volume and their customer base over time and, as a result, generally have lower gross margin rates and higher operating expenses, as a percentage of sales, than our more mature stores. If our Chicago market stores do not generate sufficient revenue or operate with acceptable margins, or if we experience an overall decline in performance, we may slow or discontinue our expansion plans, or we may decide to close stores in Chicago or elsewhere. We believe that the competitive dynamics in Chicago are currently favorable for our expansion into the market, but to the extent these conditions change, on account of competitors reacting to our entrance or otherwise, our growth may be inhibited. If we fail to successfully implement our expansion into Chicago, our growth prospects will be materially limited and could result in a decline in the price of our common stock.
Increased commodity prices and availability may impact our profitability.
Many of our products include ingredients such as wheat, corn, oils, milk, sugar, proteins, cocoa and other commodities. Commodity prices worldwide have generally been increasing. While commodity price inputs do not typically represent the substantial majority of our product costs, any increase in commodity prices may cause our vendors to seek price increases from us. Although we typically are able to mitigate or plan for vendor efforts to increase our costs, we may be unable to continue to do so, either in whole or in part. In the event we are unable to continue mitigating potential vendor price increases, we may in turn consider raising our prices, and our customers may be deterred by any such price increases. Our profitability may be impacted through increased costs to us which may impact gross margins, or through reduced revenue as a result of a decline in the number and average size of customer transactions.
Our plans to remodel or relocate certain of our existing stores and build new stores in the Chicago market require us to spend capital, which must be allocated among various projects. Failure to use our capital efficiently could have an adverse effect on our profitability.
We plan to remodel or relocate certain of our existing stores, and to open additional Mariano’s stores in the Chicago market. These initiatives will use cash generated by our operations. If this cash is not allocated efficiently among these various projects, or if any of these initiatives prove to be unsuccessful, we may experience reduced profitability and we could be required to delay, significantly curtail or eliminate planned store openings, remodels or relocations.
We have significant debt service and lease obligations and may incur additional indebtedness in the future which could adversely affect our financial health and our ability to react to changes to our business.
We have significant debt service and lease obligations, which could adversely affect our financial health. As of December 29, 2012, we had approximately $696.6 million in total debt and capital lease obligations. In addition, we had future minimum lease payment commitments of approximately $2.0 billion at December 29, 2012.
Our high level of debt and fixed lease obligations will require us to use a significant portion of cash generated by our operations to satisfy these obligations, and could adversely impact our ability to obtain future financing to support our capital expenditures or other operational investments or shareholder dividends. In fiscal 2011 and 2012, we had debt service repayments, of $133.2 million and $56.2 million, respectively. Fiscal 2011 debt service obligations included a scheduled repayment of $54 million of our term loan principal amount under our old credit facilities. Fiscal 2012 debt service obligations included scheduled repayments of our senior credit facility, as discussed below.
11
If we cannot generate sufficient cash flow from operations to service our debt, we may need to refinance our debt, dispose of assets or issue equity to obtain necessary funds. We do not know whether we will be able to take any of such actions on a timely basis, on terms satisfactory to us or at all. Our level of indebtedness has important consequences. For example, our level of indebtedness may:
| | • | | require us to use a substantial portion of our cash flow from operations to pay interest and principal on our debt, which would reduce the funds available to us for working capital, capital expenditures and other general corporate purposes; |
| | • | | limit our ability to pay future dividends; |
| | • | | limit our ability to obtain additional financing for working capital, capital expenditures, expansion plans and other investments, which may limit our ability to implement our business strategy; |
| | • | | heighten our vulnerability to downturns in our business, the retail food industry or in the general economy and limit our flexibility in planning for, or reacting to, changes in our business and the retail food industry; or |
| | • | | prevent us from taking advantage of business opportunities as they arise or successfully carrying out our plans to expand our store base and product offerings. |
We cannot assure you that our business will generate sufficient cash flow from operations or that future financing will be available to us in amounts sufficient to enable us to make payments on our indebtedness or to fund our operations. In addition, our failure to make payments under our operating leases could trigger defaults under other leases or under agreements governing our other indebtedness, which could cause the counterparties under those agreements to accelerate the obligations due thereunder.
We will require substantial cash flows from operations to make our payments under our operating leases. If we are not able to make the required payments under our debt and lease agreements, the lenders or owners of the stores we lease may, among other things, repossess those assets, which could adversely affect our ability to conduct our operations.
The terms of our senior credit facility may restrict our current and future operations, which could adversely affect our ability to respond to changes in our business and to manage our operations.
Concurrent with the completion of our initial public offering (“IPO”) in February 2012, we entered into a new senior credit facility, which includes a number of customary restrictive covenants. These covenants could impair our financing and operational flexibility and make it difficult for us to react to market conditions and satisfy our ongoing capital needs and unanticipated cash requirements. Specifically, such covenants may restrict our ability and, if applicable, the ability of our subsidiaries to, among other things:
| | • | | make certain investments; |
| | • | | enter into certain types of transactions with affiliates; |
| | • | | limit dividends or other payments by our restricted subsidiaries to us; |
| | • | | use assets as security in other transactions; |
| | • | | pay dividends on our common stock or repurchase our equity interests; |
| | • | | sell certain assets or merge with or into other companies; |
| | • | | guarantee the debts of others; |
| | • | | enter into new lines of business; |
| | • | | make capital expenditures; |
12
| | • | | prepay, redeem or exchange or debt; and |
| | • | | form any joint ventures or subsidiary investments. |
In addition, our senior credit facility requires us to maintain specified financial ratios.
Our ability to comply with the covenants and other terms of our senior credit facility will depend on our future operating performance. If we fail to comply with such covenants and terms, we would be required to obtain waivers from our lenders or agree with our lenders to an amendment of the facility’s terms to maintain compliance under such facility. If we are unable to obtain any necessary waivers or amendments and the debt under our senior credit facility is accelerated, it would have a material adverse effect on our financial condition and future operating performance.
Proposed changes to financial accounting standards could require our store leases to be recognized on the balance sheet.
In addition to our significant level of indebtedness, we have significant obligations relating to our current operating leases. Proposed changes to financial accounting standards could require such leases to be recognized on the balance sheet. As of December 29, 2012, we had undiscounted operating lease commitments of approximately $2.0 billion, scheduled through 2037, related primarily to our stores. These leases are classified as operating leases and disclosed in Note 9 to our audited consolidated financial statements set forth in Item 8—Financial Statements and Supplementary Data below, but are not reflected as liabilities on our consolidated balance sheets. As of December 29, 2012, substantially all our stores were subject to leases, which have terms generally up to 20 years, and during fiscal 2012 our operating lease expense was approximately $114.4 million.
In August 2010, the Financial Accounting Standards Board (“FASB”) and the International Accounting Standards Board (“IASB”) issued a joint discussion paper highlighting proposed changes to financial accounting standards for leases. Currently, Accounting Standards Codification 840 (“ASC 840”), Leases (formerly Statement of Financial Accounting Standards 13, Accounting for Leases) requires that operating leases are classified as an off-balance sheet transaction and only the current year operating lease expense is accounted for in the income statement. In order to determine the proper classification of our stores as either operating leases or capital leases, we must make certain estimates at the inception of the lease relating to the economic useful life and the fair value of an asset as well as select an appropriate discount rate to be used in discounting future lease payments. These estimates are utilized by management in making computations as required by existing accounting standards that determine whether the lease is classified as an operating lease or a capital lease. Substantially all of our store leases have been classified as operating leases, which results in rental payments being charged to expense over the terms of the related leases. Additionally, operating leases are not reflected in our consolidated balance sheets, which means that neither a leased asset nor an obligation for future lease payments is reflected in our consolidated balance sheets. The proposed changes to ASC 840 would require that substantially all operating leases be recognized as assets and liabilities on our balance sheet. The right to use the leased property would be capitalized as an asset and the present value of future lease payments would be accounted for as a liability. A revised exposure draft is planned for the first half of 2013. The effective date, which has not been determined, could be as early as 2016 and may require retrospective adoption. While we have not quantified the impact this proposed standard would have on our financial statements, if our current operating leases are instead recognized on the balance sheet, it will result in a significant increase in the liabilities reflected on our balance sheet and in the interest expense and depreciation and amortization expense reflected in our income statement, while reducing the amount of rent expense. This could potentially decrease our net income.
13
Compliance with Section 404 of the Sarbanes-Oxley Act may negatively impact our results of operations and failure to comply may subject us to regulatory scrutiny and a loss of investors’ confidence in our internal control over financial reporting.
Section 404 of the Sarbanes-Oxley Act of 2002 (“Section 404”) requires us to perform an evaluation of our internal control over financial reporting and file management’s attestation with our Annual Report on Form 10-K each year. Our independent registered accounting firm will be required to issue an opinion on the effectiveness of internal controls beginning in 2013. We have evaluated, tested and implemented internal controls over financial reporting to enable management to report on such internal controls under Section 404. However, we cannot assure you that the conclusions we reached as of December 29, 2012 will represent conclusions we or our independent registered public accounting firm reach in future periods. Failure on our part to comply with Section 404 may subject us to regulatory scrutiny and a loss of public confidence in the reliability of our financial statements. In addition, we may be required to incur costs in improving our internal control over financial reporting and hiring additional personnel. Any such actions could negatively affect our results of operations.
We will continue to incur significant increased costs as a result of operating as a public company, and our management will be required to divert attention from operational and other business matters to devote substantial time to public company requirements.
We have historically operated our business as a private company. In February 2012, we completed an initial public offering. As a result, we are required to incur additional legal, accounting, compliance and other expenses that we did not incur as a private company. We are obligated to file with the SEC quarterly and annual information and other reports that are specified in Section 13 and other sections of the Securities Exchange Act of 1934, as amended (the “Exchange Act”). In addition, we are also subject to other reporting and corporate governance requirements, including certain requirements of the New York Stock Exchange (“NYSE”), and certain provisions of the Sarbanes-Oxley Act (“Sarbanes-Oxley”) and other regulations promulgated thereunder, which impose significant compliance obligations upon us. We must be certain that we have the ability to institute and maintain a comprehensive compliance function; establish internal policies; ensure that we have the ability to prepare financial statements that are fully compliant with all SEC reporting requirements on a timely basis; design, establish, evaluate and maintain a system of internal controls over financial reporting in compliance with Sarbanes-Oxley; involve and retain outside counsel and accounting and financial staff with the appropriate experience in connection with the above activities and maintain an investor relations function. We also expect that operating as a public company will continue to make it more difficult and more expensive for us to obtain director and officer liability insurance than as it was as a private company, and we may be required to accept reduced policy limits and coverage or incur substantially higher costs to obtain the same or similar coverage. As a result, it may be more difficult for us to attract and retain qualified people to serve on our board of directors, our board committees or as executive officers.
Sarbanes-Oxley, as well as rules subsequently implemented by the SEC and the NYSE, have imposed increased regulation and disclosure and have required enhanced corporate governance practices of public companies. Our efforts to comply with evolving laws, regulations and standards in this regard are likely to result in increased administrative expenses and a diversion of management’s time and attention from revenue-generating activities to compliance activities. These changes require a significant commitment of resources. We may not be successful in implementing or maintaining these requirements, any failure of which could materially adversely affect our business, results of operations and financial condition. In addition, if we fail to implement or maintain the requirements with respect to our internal accounting and audit functions, our ability to continue to report our operating results on a timely and accurate basis could be impaired. If we do not implement or maintain such requirements in a timely manner or with adequate compliance, we might be subject to sanctions or investigation by regulatory authorities, such as the SEC or NYSE. Any such actions could harm our reputation and the confidence of investors and customers in our company and could materially adversely affect our business and cause our share price to fall.
14
Our business may suffer as a result of our lack of public company operating experience. In addition, if securities or industry analysts do not publish research regularly or publish inaccurate or unfavorable research about our business, our stock price and trading volume could decline.
Up until February 2012, we were a privately-held company. Our recent lack of public company operating experience may make it difficult to forecast and evaluate our future prospects. If we are unable to execute our business strategy, either as a result of our inability to effectively manage our business in a public company environment or for any other reason, our business, prospects, financial condition and results of operations may be harmed.
In addition, as a new public company we may not be able to maintain regular research coverage by securities and industry analysts, which could negatively impact the trading price for our stock. If one or more of the analysts who covers us downgrades our stock or publishes inaccurate or unfavorable research about our business, our stock price would likely decline. If one or more of these analysts ceases coverage of us or fails to publish reports on us regularly, demand for our stock could decrease, which could cause our stock price and trading volume to decline.
Failure to attract, train and retain qualified store-level and distribution-level employees could adversely affect our ability to carry out strategic initiatives and ultimately impact our financial performance.
The retail food industry is labor intensive. Our ability to meet our labor needs, including our needs for specialized workers, such as pharmacists, while controlling wage and labor-related costs, is subject to numerous external factors, including the availability of a sufficient number of qualified persons in the work force in the markets in which we are located, unemployment levels within those markets, unionization of the available work force, prevailing wage rates, changing demographics, health and other insurance costs and changes in employment legislation. Failure to do so could adversely affect our results of operations.
The loss of key employees could negatively affect our business.
A key component of our success is the experience of our key employees, including our Chairman, President and Chief Executive Officer, Robert Mariano, our Executive Vice President and Chief Financial Officer, Darren Karst and our Executive Vice President—Operations, Donald Rosanova. These employees have extensive experience in our industry and are familiar with our business, systems and processes. In addition, Messrs. Mariano, Karst and Rosanova are key to our strategy of expansion into the Chicago market, due to their experience with, and understanding of, food retailing in that region. The loss of services of one or more of our key employees could impair our ability to manage our business effectively. We do not maintain key person life insurance on any employee.
The cost of providing employee benefits continues to increase and is subject to factors outside of our control.
We sponsor defined benefit pension plans, which are frozen with respect to benefit accruals and closed to new participants. Even though our employees are not accruing additional pension benefits under these plans, these pension plans are not fully funded. Our funding requirements vary based upon plan asset performance, interest rates and actuarial assumptions. Poorer than assumed asset performance and continuing low interest rates would likely cause our required funding contributions to increase in the future. As of December 29, 2012, the accumulated benefit obligation and fair value of plan assets for our Company-sponsored defined benefit plans were $199.7 million and $163.7 million, respectively. As of December 31, 2011, the accumulated benefit obligation and fair value of plan assets for these three plans were $185.6 million and $143.5 million, respectively.
In addition, we participate in three underfunded multi-employer pension plans on behalf of our union-affiliated employees, and we are required to make contributions to these plans under our collective bargaining agreements. Each of these three multi-employer pension plans is currently underfunded in part due to increases in the costs of benefits provided or paid under these plans as well as lower returns on plan assets over the past several years. The unfunded liabilities of these three plans may result in increased future payments by us and other participating employers. Two of the multi-employer plans in which we participate were deemed by their plan actuaries to be in
15
“critical status,” prompting federally mandated increases in our contributions to them. Going forward, our required contributions to these multi-employer plans could increase as a result of many factors, including the outcome of collective bargaining with the unions, actions taken by trustees who manage the plans, government regulations, the actual return on assets held in the plans and the payment of a withdrawal liability if we choose to exit a plan. We expect meaningful increases in contribution expense as a result of required incremental plan contributions to reduce underfunding. Our risk of future increased payments may be greater if other participating employers withdraw from the plan and are not able to pay the total liability assessed as a result of such withdrawal, or if the pension plan adopts surcharges and/or increased pension contributions as part of a rehabilitation plan. For example, in recent years our share of plan underfunding has increased due to the withdrawal of participating employers that, because of their financial distress, were unable to pay contributions or their portion of the unfunded pension liability. In the fourth quarter of 2012, we withdrew from one multi-employer plan and incurred a withdrawal liability estimated to be approximately $1.0 million, which is payable in quarterly installments commencing around August 1, 2013 for a period of 13 years.
Pursuant to the Employee Retirement Income Security Act of 1974, as amended (“ERISA”), the Pension Benefit Guaranty Corporation (the “PBGC”) has the right, subject to satisfaction of certain statutory requirements, to involuntarily terminate our defined benefit pension plans (thus accelerating funding obligations), or enter into an alternative arrangement with us to prevent such termination. In March 2010, we were contacted by the PBGC expressing concern regarding the impact that the payment of a $150 million shareholder dividend could have on our ability to meet our obligations to our largest defined benefit pension plan. We subsequently entered into an amendment to our existing agreement with the PBGC that required us to make additional contributions to one of our Company-sponsored defined benefit pension plans, one of which we were required to make no later than April 29, 2010 and one on each of the first two anniversaries thereafter, and for us to increase and continue the credit support in the form of the existing letter of credit with respect to our obligations under such agreement. We completed these steps in accordance with our agreement with the PBGC, and in December 2012 the PBGC agreed that we could reduce the amount of our letter of credit to the previous level. We cannot assure you that the PBGC will not seek to increase or accelerate our funding requirements under our defined benefit plans in the event our operating performance declines or we otherwise increase our indebtedness.
We also provide health benefits to substantially all of our full-time employees and to certain part-time employees depending on average hours worked. Even though employees generally pay a portion of the cost, our cost of providing these benefits has increased steadily over the last several years. We anticipate future increases in the cost of health benefits, partly, but not entirely, as a result of the implementation of federal health care reform legislation. If we are unable to control healthcare and pension costs, we may experience increased operating costs, which may adversely affect our financial condition and results of operations.
Variability in self-insurance liability estimates could significantly impact our results of operations.
We self-insure for workers’ compensation, general liability, automobile liability and employee health care benefits up to a set retention level, beyond which we maintain excess insurance coverage. Liabilities are determined using actuarial estimates of the aggregate liability for claims incurred and an estimate of incurred but not reported claims, on an undiscounted basis. Our accruals for insurance reserves reflect certain actuarial assumptions and management judgments, which are subject to a high degree of variability. The variability is caused by factors external to us such as: historical claims experience; medical inflation; legislative changes to benefit levels; trends relating to jury verdicts; and claim settlement patterns. Any significant variation in these factors could cause a material change to our reserves for self-insurance liabilities and may adversely affect our financial condition and results of operations.
Litigation may materially adversely affect our business, financial condition and results of operations.
Our operations are characterized by a high volume of customer traffic and by transactions involving a wide variety of product selections. These operations carry a higher exposure to consumer litigation risk when
16
compared to the operations of companies operating in many other industries. Consequently, we may be a party to individual personal injury, product liability and other legal actions in the ordinary course of our business, including litigation arising from food-related illness. The outcome of litigation, particularly class action lawsuits and regulatory actions, is difficult to assess or quantify. Plaintiffs in these types of lawsuits may seek recovery of very large or indeterminate amounts, and the magnitude of the potential loss relating to such lawsuits may remain unknown for substantial periods of time. The cost to defend future litigation may be significant. There may also be adverse publicity associated with litigation that may decrease consumer confidence in our businesses, regardless of whether the allegations are valid or whether we are ultimately found liable. As a result, litigation may materially adversely affect our businesses, financial condition, results of operations and cash flows.
Various aspects of our business are subject to federal, state and local laws and regulations. Our compliance with these regulations may require additional capital expenditures and could materially adversely affect our ability to conduct our business as planned.
We are subject to federal, state and local laws and regulations relating to zoning, land use, environmental protection, work place safety, public health, community right-to-know, alcoholic beverage sales, tobacco sales and pharmaceutical sales. In particular, the states of Wisconsin, Minnesota and Illinois and several local jurisdictions regulate the licensing of supermarkets, including alcoholic beverage license grants. In addition, certain local regulations may limit our ability to sell alcoholic beverages at certain times. A variety of state programs regulate the production and sale of milk, including the price of raw milk, through federal market orders and price support programs. We are also subject to laws governing our relationship with employees, including minimum wage requirements, overtime, working conditions, disabled access and work permit requirements. Compliance with new laws in these areas, or with new or stricter interpretations of existing requirements, could reduce the revenue and profitability of our stores and could otherwise materially adversely affect our business, financial condition or results of operations. Additionally, a number of federal, state and local laws impose requirements or restrictions on business owners with respect to access by disabled persons. Our compliance with these laws may result in modifications to our properties, or prevent us from performing certain further renovations.
Our pharmacy business is subject to, and influenced by, certain government laws and regulations, including those administered and enforced by Medicare, Medicaid, the Drug Enforcement Administration (the “DEA”), the Consumer Product Safety Commission, the U.S. Federal Trade Commission and the U.S. Food and Drug Administration. For example, the conversion of various prescription drugs to over-the-counter medications, a decrease in the rate at which new prescription drugs become available or the failed introduction of new prescription drugs into the market could materially adversely affect our pharmacy sales. The withdrawal of certain drugs from the market may also materially adversely affect our pharmacy business. Changes in third party reimbursement levels for prescription drugs, including changes in Medicare or state Medicaid programs, could also reduce our margins and have a material adverse effect on our business. In order to dispense controlled substances, we are required to register our pharmacies with the DEA and to comply with security, recordkeeping, inventory control and labeling standards.
In addition, our pharmacy business is subject to local regulations in the states where our pharmacies are located, applicable Medicare and Medicaid regulations and state and federal prohibitions against certain payments intended to induce referrals of patients or other health care business. Failure to properly adhere to these and other applicable regulations could result in the imposition of civil, administrative and criminal penalties including suspension of payments from government programs; loss of required government certifications; loss of authorizations to participate in, or exclusion from, government reimbursement programs such as Medicare and Medicaid; loss of licenses; significant fines or monetary penalties for anti-kickback law violations, submission of false claims or other failures to meet reimbursement program requirements and could materially adversely affect the continued operation of our business. Our pharmacy business is also subject to the Health Insurance Portability and Accountability Act, including its obligations to protect the confidentiality of certain patient information and other obligations. Failure to properly adhere to these requirements could result in the imposition of civil as well as criminal penalties.
17
We may experience negative effects to our reputation from real or perceived quality or health issues with our food products, which could have an adverse effect on our operating results.
We believe that a reputation for providing our customers with fresh, high-quality food products is an important component of our customer value proposition. Concerns regarding the safety or quality of our food products or of our food supply chain could cause consumers to avoid purchasing certain products from us, or to seek alternative sources of food, even if the basis for the concern is outside of our control. Food products containing contaminants could be inadvertently distributed by us and, if processing at the consumer level does not eliminate them, these contaminants could result in illness or death. Adverse publicity about these concerns, whether or not ultimately based on fact, and whether or not involving products sold at our stores, could discourage consumers from buying our products and have an adverse effect on our operating results. Furthermore, the sale of food products entails an inherent risk of product liability claims, product recall and the resulting negative publicity. Any such claims, recalls or adverse publicity with respect to our own-brand products may have an even greater negative effect on our sales and operating results, in addition to generating adverse publicity for our own-brand products. Any lost confidence in us on the part of our customers would be difficult and costly to re-establish. Any such adverse effect could significantly reduce our brand value. Issues regarding the safety of any food items sold by us, regardless of the cause, could have a substantial and adverse effect on our sales and operating results.
Certain risks are inherent in providing pharmacy services, and our insurance may not be adequate to cover any claims against us.
Pharmacies are exposed to risks inherent in the packaging and distribution of pharmaceuticals and other healthcare products, such as risks of liability for products which cause harm to consumers. Although we maintain professional liability insurance and errors and omissions liability insurance, we cannot guarantee that the coverage limits under our insurance programs will be adequate to protect us against future claims, or that we will be able to maintain this insurance on acceptable terms in the future, or at all. Our results of operations, financial condition or cash flows may be materially adversely affected if in the future our insurance coverage proves to be inadequate or unavailable, or there is an increase in the liability for which we self-insure, or we suffer harm to our reputation as a result of an error or omission.
If our goodwill becomes further impaired, we may be required to record significant charges to earnings in the future.
We have a significant amount of goodwill. As of December 29, 2012, we had goodwill of approximately $606.0 million, which represented approximately 43.9% of our total assets as of such date. Goodwill is reviewed for impairment on an annual basis (as of the first day of the third quarter) or whenever events occur or circumstances change that would more likely than not reduce the fair value of our reporting unit below its carrying amount. Fair value is determined based on the discounted cash flows and comparable market values of our single reporting unit. An impairment charge is recorded for any excess of the carrying value of goodwill over the implied fair value of the assets and liabilities.
Fair value is determined by using the income approach and market approach. Determining fair value using an income approach requires that we make significant estimates and assumptions, including management’s long-term projections of cash flows, market conditions and appropriate discount rates. Our judgments are based on historical experience, current market trends and other information. In estimating future cash flows, we rely on internally generated forecasts for operating profits and cash flows, including capital expenditures. The rates used to discount projected future cash flows reflect a weighted average cost of capital based on the Company’s industry, capital structure and risk premiums including those reflected in the current market capitalization. The market approach is based upon applying a multiple of earnings based upon publicly traded companies in our industry.
Based on our annual impairment testing completed at the beginning of the third quarter of Fiscal 2010, 2011 and 2012, no impairment of goodwill was indicated. During the fourth quarter of fiscal 2012, our market capitalization experienced a significant decline. As a result, management believed that there were circumstances
18
evident which indicated that the fair value of our reporting unit could be below its carrying amount. Management therefore updated its annual review of goodwill for impairment that had been completed in the third quarter and concluded that the carrying amount of goodwill exceeded its estimated fair value, resulting in a pre-tax, non-cash impairment charge of $120.8 million ($106.4 million, after taxes) during the fourth quarter of fiscal 2012.
Changes in estimates of future cash flows caused by items such as unforeseen events or changes in market conditions could negatively affect our reporting unit’s fair value and result in further impairment charges. Factors that could cause us to change our estimates of future cash flows include, among other things, a deterioration in general economic conditions, successful efforts by our competitors to gain market share in our core markets, an increased competitive environment, our inability to compete effectively with other retailers or our inability to maintain price competitiveness. An impairment of a significant portion of our goodwill could materially adversely affect our financial condition and results of operations.
Severe weather, natural disasters and adverse climate changes may materially adversely affect our financial condition and results of operations.
Severe weather conditions and other natural disasters in areas where we have stores or distribution facilities or from which we obtain the products we sell may materially adversely affect our retail or distribution operations or our product offerings and, therefore, our results of operations. Such conditions may result in physical damage to, or temporary or permanent closure of, one or more of our stores or distribution facilities, an insufficient work force in our markets, and/or temporary disruption in the supply of products, including delays in the delivery of goods to our stores or a reduction in the availability of products in our stores. In addition, adverse climate conditions and adverse weather patterns, such as drought or flood, that impact growing conditions and the quantity and quality of crops may materially adversely affect the availability or cost of certain products within our supply chain. Any of these factors may disrupt our businesses and materially adversely affect our financial condition, results of operations and cash flows.
Our business could be harmed by a failure of our information technology or administrative systems.
We rely on our information technology and administrative systems to effectively manage our business data, communications, supply chain, order entry and fulfillment and other business processes. The failure of our information technology or administrative systems to perform as we anticipate could disrupt our business and result in transaction errors, processing inefficiencies and the loss of sales and systems may be vulnerable to damage or interruption from circumstances beyond our control, including fire, natural disasters, systems failures, viruses and security breaches, including breaches of our transaction processing or other systems that could result in the compromise of confidential customer data. Any such damage or interruption could have a material adverse effect on our business, cause us to face significant fines, customer notice obligations or costly litigation, harm our reputation with our customers, require us to expend significant time and expense developing, maintaining or upgrading our information technology or administrative systems, or prevent us from paying our suppliers or employees, receiving payments from our customers or performing other information technology or administrative services on a timely basis.
If we experience a data security breach and confidential customer information is disclosed, we may be subject to penalties and experience negative publicity, which could affect our customer relationships and have a material adverse effect on our business.
We and our customers could suffer harm if customer information were accessed by third parties due to a security failure in our systems. The collection of data and processing of transactions require us to receive and store a large amount of personally identifiable data. This type of data is subject to legislation and regulation in various jurisdictions. Recently, data security breaches suffered by well-known companies and institutions have attracted a substantial amount of media attention, prompting state and federal legislative proposals addressing data privacy and security. If some of the current proposals are adopted, we may be subject to more extensive requirements to protect
19
the customer information that we process in connection with the purchases of our products. We may become exposed to potential liabilities with respect to the data that we collect, manage and process, and may incur legal costs if our information security policies and procedures are not effective or if we are required to defend our methods of collection, processing and storage of personal data. Future investigations, lawsuits or adverse publicity relating to our methods of handling personal data could adversely affect our business, results of operations, financial condition and cash flows due to the costs and negative market reaction relating to such developments.
Energy costs are a significant component of our operating expenses, and increasing energy costs, unless offset by more efficient usage or other operational responses, may impact our profitability.
We utilize natural gas and electricity in our stores and distribution centers and gasoline and diesel fuel in the trucks that deliver products to our stores. Increases in energy costs, whether driven by increased demand, decreased or disrupted supply or an anticipation of any such events, will increase the costs of operating our stores and distribution network and may increase the costs of our products. We may not be able to recover these rising costs through increased prices charged to our customers, and any increased prices may exacerbate the risk of customers choosing lower-cost alternatives. In addition, if we are unsuccessful in protecting against these increases in energy costs through long-term energy contracts, improved energy procurement, improved efficiency and other operational improvements, the overall costs of operating our stores will increase which would impact our profitability.
We may be unable to protect or maintain our intellectual property, which could results in customer confusion and adversely affect our business.
We believe that our intellectual property has substantial value and has contributed significantly to the success of our business. In particular, our trademarks, including our registered trademarks of Roundy’s, Pick ’n Save and Rainbow, and our common law trademarks of Copps and Mariano’s, are valuable assets that reinforce our customers’ favorable perception of our stores. From time to time, third parties have used names similar to ours, have applied to register trademarks similar to ours and, we believe, have infringed or misappropriated our intellectual property rights. We respond to these actions on a case-by-case basis. The outcomes of these actions have included both negotiated out-of-court settlements as well as litigation.
Risks Related to the Ownership of Our Common Stock
Funds controlled by Willis Stein continue to exercise significant control over us and could delay or prevent a change in control.
As of March 5, 2013, funds controlled by Willis Stein directly owned approximately 32.5% of our outstanding common stock. In addition, pursuant to the Investor Rights Agreement among Willis Stein, Robert A. Mariano, Darren W. Karst and certain of our other existing stockholders (together, the “IRA Parties”), Willis Stein was the beneficial owner of approximately 41.3% of our common stock. Pursuant to the Investor Rights Agreement, the IRA Parties have agreed to vote their shares of common stock in the manner in which the funds managed by Willis Stein direct in connection with: (i) any merger, combination, or consolidation of us with any independent third party; and (ii) the sale, lease or exchange of all or substantially all of our assets to an independent third party, for a period of two years from the date of our initial public offering. Any rights and obligations of stockholders under the Investor Rights Agreement related to approved sales will terminate on February 8, 2014.
As a result of this ownership and the Investor Rights Agreement, Willis Stein continues to have a substantial influence on our affairs and its voting power constitutes a large percentage of any quorum of our stockholders voting on any matter requiring the approval of our stockholders. Such matters include the election of directors, the adoption of amendments to our certificate of incorporation and bylaws and approval of mergers or sales of substantially all of our assets. This concentration of ownership may also have the effect of delaying or preventing a change in control of our company whether or not other stockholders believe that such transaction is in their own
20
best interests, or discouraging others from making tender offers for our shares. In addition, three of our seven directors are representatives of Willis Stein. Willis Stein may have interests that differ from yours and the Willis Stein directors may vote in a way with which you disagree and which may be adverse to your interests.
Conflicts of interest may arise because some of our directors are representatives of Willis Stein.
Messrs. Larson, Stein and Willis, who are representatives of Willis Stein, serve on our board of directors. Willis Stein and entities controlled by them may hold equity interests in entities that directly or indirectly compete with us, and companies in which they currently invest may begin competing with us. As a result of these relationships, when conflicts between the interests of Willis Stein, on the one hand, and the interests of our other stockholders, on the other hand, arise, these directors may not be disinterested. Although our directors and officers have a duty of loyalty to us under Delaware law and our certificate of incorporation, transactions that we enter into in which a director or officer has a conflict of interest are generally permissible so long as (1) the material facts relating to the director’s or officer’s relationship or interest as to the transaction are disclosed to our board of directors and a majority of our disinterested directors, or a committee consisting solely of disinterested directors, approves the transaction, (2) the material facts relating to the director’s or officer’s relationship or interest as to the transaction are disclosed to our stockholders and a majority of our disinterested stockholders approves the transaction or (3) the transaction is otherwise fair to us. Under our amended and restated certificate of incorporation, representatives of Willis Stein are not required to offer to us any transaction opportunity of which they become aware and could take any such opportunity for themselves or offer it to other companies in which they have an investment, unless such opportunity is offered to them solely in their capacity as a director of ours. Our certificate of incorporation provides that the doctrine of “corporate opportunity” will not apply to Willis Stein, or any of our directors who are associates of, or affiliated with, Willis Stein, in a manner that would prohibit them from investing in competing businesses or doing business with our clients or guests. It is possible that the interests of Willis Stein and its affiliates may in some circumstances conflict with our interests and the interests of our other stockholders.
Market volatility may affect our stock price and the value of your investment.
The market price of our common stock may fluctuate significantly in response to a number of factors, most of which we cannot predict or control, including:
| | • | | announcements of new initiatives, commercial relationships, acquisitions or other events by us or our competitors; |
| | • | | failure of any of our initiatives to achieve commercial success; |
| | • | | fluctuations in stock market prices and trading volumes of securities of similar companies; |
| | • | | general market conditions and overall fluctuations in U.S. equity markets; |
| | • | | variations in our operating results, or the operating results of our competitors; |
| | • | | changes in our financial guidance to investors and analysts or our failure to achieve such expectations; |
| | • | | delays in, or our failure to provide, financial guidance; |
| | • | | changes in securities analysts’ estimates of our financial performance or our failure to achieve such estimates; |
| | • | | sales of large blocks of our common stock, including sales by Willis Stein or by our executive officers or directors; |
| | • | | additions or departures of any of our key personnel; |
| | • | | changes in accounting principles or methodologies; |
| | • | | changing legal or regulatory developments in the U.S. and other countries; and |
| | • | | discussion of us or our stock price by the financial press and in online investor communities. |
21
In addition, the stock market in general has experienced substantial price and volume volatility that is often seemingly unrelated to the operating performance of particular companies. These broad market fluctuations may cause the trading price of our common stock to decline. In the past, securities class action litigation has often been brought against a company after a period of volatility in the market price of its common stock. We may become involved in this type of litigation in the future. Any securities litigation claims brought against us could result in substantial expenses and the diversion of our management’s attention from our business.
We may not declare dividends or have the available cash to make dividend payments.
During 2012, we paid quarterly cash dividends of $0.23 per share in the second and third quarters and $0.12 per share in the fourth quarter. We currently intend to pay quarterly cash dividends in an amount equal to $0.12 per share during 2013. Whether we will do so, however, and the timing and amount of those dividends, will be subject to approval and declaration by our board of directors and will depend upon on a variety of factors, including the financial results, cash requirements and financial condition of the company, our ability to pay dividends under the credit agreement governing our new senior secured credit facilities and any other applicable contracts, and other factors deemed relevant by our board of directors.
Because Roundy’s, Inc. is a holding company with no material assets (other than the equity interests of its direct subsidiary), its cash flow and ability to pay dividends is dependent upon the financial results and cash flows of its operating subsidiaries and the distribution or other payment of cash to it in the form of dividends or otherwise. The direct and indirect subsidiaries of Roundy’s, Inc. are separate and distinct legal entities and have no obligation to make any funds available to it.
Future sales of our common stock, or the perception in the public markets that these sales may occur, may depress our stock price.
As of March 5, 2013, there were 45,597,533 shares of our common stock outstanding. A large portion of our shares are held by a small number of persons and investment funds. Sales by these stockholders of a substantial number of shares could significantly reduce the market price of our common stock. Moreover, Willis Stein has rights, subject to some conditions, to require us to file registration statements covering the shares they currently hold, or to include these shares in registration statements that we may file for ourselves or other stockholders.
An aggregate of 5,656,563 shares of our common stock has been registered and reserved for future issuance under the 2012 Incentive Compensation Plan. As of March 5, 2013 there were 4,882,743 remaining shares available for issuance. These shares can be freely sold in the public market upon issuance, subject to satisfaction of applicable vesting provisions. If a large number of these shares are sold in the public market, the sales could reduce the trading price of our common stock.
Our future operating results may fluctuate significantly and our current operating results may not be a good indication of our future performance. Fluctuations in our quarterly financial results could affect our stock price in the future.
Our revenues and operating results have historically varied from period-to-period, and we expect that they will continue to do so as a result of a number of factors, many of which are outside of our control. If our quarterly financial results or our predictions of future financial results fail to meet the expectations of securities analysts and investors, our stock price could be negatively affected. Any volatility in our quarterly financial results may make it more difficult for us to raise capital in the future or pursue acquisitions that involve issuances of our stock. Our operating results for prior periods may not be effective predictors of our future performance.
Factors associated with our industry, the operation of our business and the markets for our products may cause our quarterly financial results to fluctuate, including:
| | • | | our ability to compete effectively with other retailers; |
22
| | • | | our ability to maintain price competitiveness; |
| | • | | ongoing economic uncertainty; |
| | • | | the geographic concentration of our stores; |
| | • | | our ability to achieve sustained sales and profitable operating margins at new stores; |
| | • | | our ability to maintain or increase our operating margins; |
| | • | | our ability to implement our expansion into the Chicago market on a timely basis or at all; |
| | • | | ordering errors or product supply disruptions in the delivery of perishable products; |
| | • | | increases in commodity prices; |
| | • | | our ability to protect or maintain our intellectual property; |
| | • | | severe weather, and other natural disasters in areas in which we have stores or distribution facilities; |
| | • | | the failure of our information technology or administrative systems to perform as anticipated; |
| | • | | data security breaches and the release of confidential customer information; |
| | • | | our ability to offset increasing energy costs with more efficient usage; |
| | • | | negative effects to our reputation from real or perceived quality or health issues with our food products; |
| | • | | our ability to retain and attract senior management and key employees; |
| | • | | our ability to renegotiate expiring collective bargaining agreements and new collective bargaining agreements; |
| | • | | our ability to satisfy our ongoing capital needs and unanticipated cash requirements; |
| | • | | the availability of financing to pursue our expansion into the Chicago market on satisfactory terms or at all; |
| | • | | additional indebtedness incurred in the future; |
| | • | | our ability to retain and attract qualified store-and distribution-level employees; |
| | • | | rising costs of providing employee benefits, including increased pension contributions due to unfunded pension liabilities; |
| | • | | risks inherent in packaging and distributing pharmaceuticals and other healthcare products; |
| | • | | wartime activities, threats or acts of terror or a widespread regional, national or global health epidemic; |
| | • | | changes to financial accounting standards regarding store leases; |
| | • | | our high level of fixed lease obligations; |
| | • | | claims made against us resulting in litigation; and |
| | • | | further impairment of our goodwill. |
Any one of the factors above or the cumulative effect of some of the factors referred to above may result in significant fluctuations in our quarterly financial and other operating results, including fluctuations in our key metrics. This variability and unpredictability could result in our failing to meet our internal operating plan or the expectations of securities analysts or investors for any period. If we fail to meet or exceed such expectations for these or any other reasons, the market price of our shares could fall substantially and we could face costly lawsuits, including securities class action suits. In addition, a significant percentage of our operating expenses are fixed in nature and based on forecasted revenue trends. Accordingly, in the event of revenue shortfalls, we are generally unable to mitigate the negative impact on margins in the short term.
23
Anti-takeover provisions in our charter documents and Delaware law might discourage or delay attempts to acquire us that you might consider favorable.
Our amended and restated certificate of incorporation and amended and restated bylaws contain provisions that may make the acquisition of our company more difficult without the approval of our board of directors. These provisions include:
| | • | | a classified board of directors so that not all members of our board of directors are elected at one time; |
| | • | | authorization of the issuance of undesignated preferred stock, the terms of which may be established and the shares of which may be issued without stockholder approval, and which may include super voting, special approval, dividend, or other rights or preferences superior to the rights of the holders of common stock; |
| | • | | prohibition on stockholder action by written consent unless such action is recommended by either unanimous written consent of the board of directors or by unanimous vote of directors at a board meeting with a quorum, which requires that all stockholder actions not so approved be taken at a meeting of our stockholders; |
| | • | | special meetings of our stockholders may only be called by a resolution adopted by a majority of our directors then in office or by the chairman; |
| | • | | express authorization for our board of directors to make, alter, or repeal our amended and restated bylaws; and |
| | • | | advance notice requirements for nominations for elections to our board of directors or for proposing matters that can be acted upon by stockholders at stockholder meetings. |
In addition, we are governed by the provisions of Section 203 of the Delaware General Corporation Law (the “DGCL”) which limits the ability of stockholders owning in excess of 15% of our outstanding voting stock to merge or combine with us. Although we believe these provisions collectively provide for an opportunity to obtain greater value for stockholders by requiring potential acquirers to negotiate with our board of directors, they would apply even if an offer rejected by our board were considered beneficial by some stockholders. In addition, these provisions may frustrate or prevent any attempts by our stockholders to replace or remove our current management by making it more difficult for stockholders to replace members of our board of directors, which is responsible for appointing the members of our management.
These anti-takeover provisions and other provisions under Delaware law could discourage, delay or prevent a transaction involving a change in control of our company, even if doing so would benefit our stockholders. These provisions could also discourage proxy contests and make it more difficult for stockholders to elect directors of their choosing and to cause us to take other corporate actions which they may desire.
ITEM 1B—UNRESOLVED STAFF COMMENTS
None.
24
We lease all of our properties from unaffiliated parties, except for two of our stores and our Stevens Point Distribution center, which we own. A typical store lease is for an initial 20-year term with four renewal options of five years each. The following table shows the number of stores operated by geographic market as of December 29, 2012:
| | | | | | | | | | | | |
| | | Wisconsin | | | Minnesota | | | Illinois | |
Retail Stores: | | | | | | | | | | | | |
Pick ’n Save | | | 93 | | | | — | | | | — | |
Metro Market | | | 3 | | | | — | | | | — | |
Copps | | | 25 | | | | — | | | | — | |
Rainbow | | | — | | | | 32 | | | | — | |
Mariano’s | | | — | | | | — | | | | 8 | |
Distribution Centers | | | 3 | | | | — | | | | — | |
Manufacturing | | | 1 | | | | — | | | | — | |
Our Oconomowoc distribution center operates under a long-term lease expiring in 2030 with five renewal options of five years each and our Mazomanie distribution center operates under a long-term lease expiring in 2022 with one ten year renewal option. Our commissary is located in Kenosha, Wisconsin and operates under a long-term lease expiring in 2020, with five renewal options of five years each. Our executive offices are located in a leased 115,000 square foot office facility in downtown Milwaukee, the lease for which expires in 2018, with three renewal options of five years each.
ITEM 3—LEGAL PROCEEDINGS
We are subject to various legal claims and proceedings which arise in the ordinary course of our business, including employment related claims, involving routine claims incidental to our business. Although the outcome of these routine claims cannot be predicted with certainty, we do not believe that the ultimate resolution of these claims will have a material adverse effect on our results of operations, financial condition or cash flows.
| ITEM | 4—MINE SAFETY DISCLOSURES |
Not applicable.
25
PART II
| ITEM 5—MARKET | FOR REGISTRANT’S COMMON EQUITY, RELATED STOCKHOLDER MATTERS AND ISSUER PURCHASES OF EQUITY SECURITIES |
Shares of our common stock, traded under the symbol “RNDY”, have been publicly traded since February 8, 2012, when our common stock was listed and began trading on the New York Stock Exchange (“NYSE”). Accordingly, no market for our stock existed prior to February 8, 2012.
As of March 5, 2013, there were 59 holders of record of our common stock, and the closing price of our common stock was $6.11 per share as reported by the NYSE. Because many of our shares of common stock are held by brokers and other institutions on behalf of stockholders, we are unable to estimate the total number of stockholders represented by these record holders.
Common Stock Price
The following table shows the high and low sale prices per share of our common stock as reported on The New York Stock Exchange for each quarter during the fiscal year ended December 29, 2012.
| | | | | | | | |
| | | Common Stock Price Range | |
| | | 2012 | |
Fiscal | | High | | | Low | |
First Quarter | | $ | 11.23 | | | $ | 9.00 | |
Second Quarter | | $ | 12.44 | | | $ | 9.69 | |
Third Quarter | | $ | 10.58 | | | $ | 6.31 | |
Fourth Quarter | | $ | 6.45 | | | $ | 3.73 | |
Year | | $ | 12.44 | | | $ | 3.73 | |
26
Stock Performance Graph
The following graph compares the cumulative total stockholder return on Roundy’s common stock between February 8, 2012 and December 29, 2012, based on the market price of the common shares and assumes reinvestment of dividends, with the cumulative total return of companies in the Russell 2000 Stock Index and a peer group composed of comparable companies in the grocery retail sector.
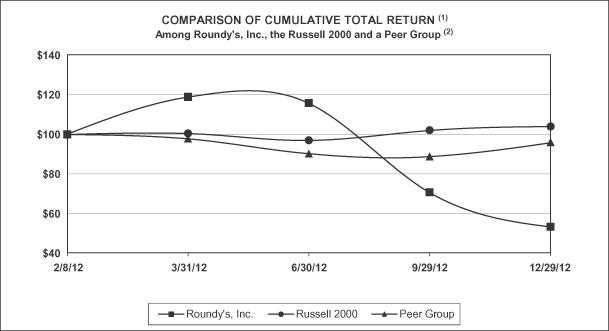
| | | | | | | | | | | | | | | | | | | | |
| | | Base
Period
2/8/12 | | | INDEXED RETURNS | |
| | | | Quarter Ending | |
Company / Index | | | 3/31/12 | | | 6/30/12 | | | 9/29/12 | | | 12/29/12 | |
Roundy’s, Inc. | | | 100 | | | | 118.89 | | | | 115.86 | | | | 70.76 | | | | 53.36 | |
Russell 2000 | | | 100 | | | | 100.48 | | | | 96.99 | | | | 102.09 | | | | 103.98 | |
Peer Group | | | 100 | | | | 97.86 | | | | 90.29 | | | | 88.79 | | | | 95.78 | |
| | (1) | Assumes $100 invested on February 8, 2012 in Roundy’s, Inc., Russell 2000 and the Peer Group, with reinvestment of dividends. |
| | (2) | Peer Group consists of The Kroger Co., Safeway, Inc., Spartan Stores, Inc., SUPERVALU Inc., Weis Markets, Inc., Harris Teeter Supermarkets, Inc., Ingles Markets, Inc., Delhaize Group SA (ADR), Koninklijke Ahold NV (ADR). |
Issuer Purchases of Equity Securities
During the year ended December 29, 2012 there were no issuer purchases of equity securities.
27
Dividend Policy
We currently intend to declare quarterly dividends of approximately $0.12 per share on all outstanding shares of common stock. The declaration of this and any other dividends, and, if declared, the amount of any such dividend, will be subject to our actual future earnings and capital requirements and to the discretion of our board of directors. Our board of directors may take into account such matters as general business conditions, our financial results, capital requirements, contractual, legal and regulatory restrictions and such other factors as our board of directors may deem relevant. For example, our ability to pay cash dividends on our common stock will be subject to our continued compliance with the terms of our outstanding indebtedness, including our senior credit facility as further outlined below. We currently expect that our dividend payments for any particular quarter may represent a meaningful portion, but less than all, of our free cash flow for such period. We generally consider our free cash flow for any particular period to be our net earnings plus any non-cash charges and expenses incurred in such period after subtracting our capital expenditures and mandatory debt repayments for that period. Because any future payment of dividends will be at the discretion of our board of directors, we do not expect that any such dividend payments will have an adverse impact on our liquidity or otherwise limit our ability to fund capital expenditures or otherwise pursue our business strategy over the long-term. We intend to fund any future dividends out of our free cash flow and, as a result, we do not expect to incur any indebtedness to fund such payments.
Because Roundy’s, Inc. is a holding company, its cash flow and ability to pay dividends are dependent upon the financial results and cash flows of its operating subsidiaries and the distribution or other payment of cash to it in the form of dividends or otherwise. We expect to cause the operating subsidiaries of Roundy’s, Inc. to pay distributions to it to fund its expected dividend payments, subject to applicable law and any restrictions contained in its subsidiaries’ current or future debt agreements.
Roundy’s, Inc.’s principal operating subsidiary, Roundy’s Supermarkets, Inc. (“RSI”), as the borrower under our senior credit facility, is permitted to declare cash dividends on account of its capital stock for the purpose of funding our expected dividend payments in an amount that does not exceed the sum of (i) 70% of RSI’s excess cash flow calculated on a quarterly basis and (ii) $25.0 million plus an amount equal to its retained portion of adjusted excess cash flow measured cumulatively, in each case, subject to pro forma compliance with the financial covenants contained in, and no default or event of default being continuing under, our senior credit facility. Excess cash flow is equal to Adjusted EBITDA minus capital expenditures, cash payments of interest, cash payments of taxes, mandatory loan repayments and amortization of capital leases for that period, and adjusted excess cash flow will be an amount equal to excess cash flow minus cash dividends paid, plus or minus changes in net working capital and certain other items. Under our senior credit facility, RSI is required to comply with certain financial covenants, including (a) a maximum total leverage ratio and (b) a minimum cash interest coverage ratio. All of RSI’s existing subsidiaries are guarantors under the senior credit facility and are otherwise restricted in their ability to transfer assets to the issuer in the form of loans, advances or cash dividends other than described above. See Item 7—Management’s Discussion and Analysis of Financial Condition and Results of Operations under the caption “Senior Credit Facility”.
The ability of our subsidiaries to comply with the foregoing limitations and restrictions is, to a significant degree, subject to their respective operating results, which are dependent on a number of factors outside of our control. As a result, we cannot assure you that we will be able to declare dividends as contemplated herein. See Item 1A—Risk Factors “Risks Related to the Ownership of our Common Stock”—We may not declare dividends or have the available cash to make dividend payments.”
We paid cash dividends to holders of our equity securities in an aggregate amount of $150.0 million in fiscal 2010, including approximately $79.2 million on account of our common stock. We did not pay any dividends on account of our common stock during fiscal 2011. We paid dividends of $26.0 million on account of our common stock during fiscal 2012.
28
ITEM 6—SELECTED FINANCIAL DATA
The following table presents selected historical consolidated statement of income, balance sheet, cash flow and operating data for the periods presented and should only be read in conjunction with Item 7—Management’s Discussion and Analysis of Financial Condition and Results of Operations and the audited consolidated financial statements and the related notes thereto (in thousands, except for per share data and amounts relating to square feet).
| | | | | | | | | | | | | | | | | | | | |
| | | Fiscal Year | |
| | | 2008 | | | 2009 | | | 2010 | | | 2011 | | | 2012 | |
| Statement of Income Data: | | | | | | | | | | | | | | | | | | | | |
Net Sales | | $ | 3,867,146 | | | $ | 3,745,774 | | | $ | 3,766,988 | | | $ | 3,841,984 | | | $ | 3,890,537 | |
| | | | | |
Costs and Expenses: | | | | | | | | | | | | | | | | | | | | |
Cost of sales | | | 2,820,828 | | | | 2,726,672 | | | | 2,748,919 | | | | 2,804,709 | | | | 2,855,385 | |
Operating and administrative | | | 891,028 | | | | 876,510 | | | | 868,972 | | | | 886,862 | | | | 908,300 | |
Goodwill impairment charge | | | — | | | | — | | | | — | | | | — | | | | 120,800 | |
Interest expense, current and long-term debt, net | | | 50,435 | | | | 32,281 | | | | 64,037 | | | | 68,855 | | | | 48,825 | |
Interest expense, dividends on preferred stock | | | 14,376 | | | | 14,799 | | | | 2,716 | | | | — | | | | — | |
Amortization of deferred financing costs | | | 1,797 | | | | 1,816 | | | | 2,906 | | | | 3,469 | | | | 2,413 | |
Loss on debt extinguishment (1) (2) | | | — | | | | 5,879 | | | | — | | | | — | | | | 13,304 | |
| | | | | | | | | | | | | | | | | | | | |
| | | 3,778,464 | | | | 3,657,957 | | | | 3,687,550 | | | | 3,763,895 | | | | 3,949,027 | |
| | | | | | | | | | | | | | | | | | | | |
Income (loss) before income taxes | | | 88,682 | | | | 87,817 | | | | 79,438 | | | | 78,089 | | | | (58,490 | ) |
Provision for income taxes | | | 39,244 | | | | 40,638 | | | | 33,244 | | | | 30,041 | | | | 10,759 | |
| | | | | | | | | | | | | | | | | | | | |
Net income (loss) | | $ | 49,438 | | | $ | 47,179 | | | $ | 46,194 | | | $ | 48,048 | | | $ | (69,249 | ) |
| | | | | | | | | | | | | | | | | | | | |
Net earnings (loss) per common share (3): | | | | | | | | | | | | | | | | | | | | |
Basic | | $ | — | | | $ | — | | | $ | 1.01 | | | $ | 1.58 | | | $ | (1.61 | ) |
Diluted | | $ | — | | | $ | — | | | $ | 1.01 | | | $ | 1.58 | | | $ | (1.61 | ) |
| | | | | |
Weighted average number of common shares outstanding: | | | | | | | | | | | | | | | | | | | | |
Basic | | | 27,853 | | | | 27,587 | | | | 27,384 | | | | 27,324 | | | | 43,047 | |
Diluted | | | 30,917 | | | | 30,648 | | | | 30,434 | | | | 30,374 | | | | 43,047 | |
| | | | | |
Dividends declared per common share | | $ | — | | | $ | — | | | $ | 2.90 | | | $ | — | | | $ | 0.58 | |
| | | | | |
Cash Flow Financial Data: | | | | | | | | | | | | | | | | | | | | |
Cash provided by (used in): | | | | | | | | | | | | | | | | | | | | |
Operating activities | | $ | 169,993 | | | $ | 175,362 | | | $ | 40,633 | | | $ | 182,017 | | | $ | 105,734 | |
Investing activities | | | (70,710 | ) | | | (93,689 | ) | | | (57,754 | ) | | | (65,868 | ) | | | (61,554 | ) |
Financing activities | | | (90,817 | ) | | | (99,200 | ) | | | (21,365 | ) | | | (65,516 | ) | | | (58,359 | ) |
Depreciation and amortization | | | 81,074 | | | | 81,091 | | | | 75,237 | | | | 72,949 | | | | 68,549 | |
Capital expenditures | | | 76,467 | | | | 76,436 | | | | 62,932 | | | | 66,497 | | | | 62,004 | |
| | | | | |
Balance Sheet Data (at end of period): | | | | | | | | | | | | | | | | | | | | |
Working capital | | $ | 55,518 | | | $ | 30,030 | | | $ | 28,215 | | | $ | 79,755 | | | $ | 79,909 | |
Total assets | | | 1,488,706 | | | | 1,481,877 | | | | 1,446,931 | | | | 1,512,682 | | | | 1,380,085 | |
Total debt and capital lease obligations (4) | | | 757,625 | | | | 747,286 | | | | 884,008 | | | | 820,141 | | | | 696,562 | |
Preferred stock subject to mandatory redemption | | | 129,968 | | | | 69,156 | | | | — | | | | — | | | | — | |
Shareholders’ equity | | | 133,673 | | | | 186,165 | | | | 152,564 | | | | 177,175 | | | | 193,266 | |
| | | | | |
Operating Data: | | | | | | | | | | | | | | | | | | | | |
Number of stores at end of fiscal year | | | 152 | | | | 154 | | | | 155 | | | | 158 | | | | 161 | |
Average weekly net sales per store (5) | | $ | 473 | | | $ | 468 | | | $ | 469 | | | $ | 471 | | | $ | 467 | |
Net sales per average selling square foot per period (6) | | $ | 605 | | | $ | 596 | | | $ | 592 | | | $ | 588 | | | $ | 578 | |
Average store size: | | | | | | | | | | | | | | | | | | | | |
Average total square feet | | | 60,082 | | | | 60,363 | | | | 60,792 | | | | 61,109 | | | | 61,422 | |
Average selling square feet | | | 40,667 | | | | 40,852 | | | | 41,201 | | | | 41,784 | | | | 42,086 | |
Change in same-store sales (7) | | | 0.6 | % | | | (1.2 | %) | | | (0.8 | %) | | | (0.2 | %) | | | (2.8 | %) |
| (1) | On October 30, 2009, Roundy’s Supermarkets Inc. amended its first lien credit facility, which extended a portion of our Term Loan and modified our interest rate structure. As a result of the amendment, we recognized a loss on debt extinguishment of $5.9 million. |
29
| (2) | In connection with the completion of our initial public offering on February 13, 2012, Roundy’s Supermarkets, Inc. entered into a new senior credit facility. As a result of this refinancing, we recognized a loss on debt extinguishment of $13.3 million. |
| (3) | Prior to the April 29, 2010 payment of the liquidation value and unpaid dividends on our preferred stock, common shareholders did not share in net income unless earnings exceeded the remaining unpaid dividends and liquidation value. Accordingly, the common stock earnings per share prior to April 29, 2010 was zero, as the unpaid dividends and liquidation value exceeded net income. For additional information as to how we calculated net earnings per common share, see Note 13 to our audited consolidated financial statements. |
| (4) | Amounts shown are net of unamortized discounts of $2,647, $2,147 and $8,806 at January 1, 2011, December 31, 2011 and December 29, 2012, respectively. |
| (5) | We calculated average weekly net sales per store by dividing net sales by the average number of stores open during the applicable weeks. |
| (6) | The amount for fiscal 2008 has been decreased to reflect a 52-week year so as to be comparable to other years presented. |
| (7) | Represents the percentage change in our same-store sales as compared to the prior comparable period. Our practice is to include sales from a store in same-store sales beginning on the first day of the fifty-third week following the store’s opening. When a store that is included in same-store sales is remodeled or relocated, we continue to consider sales from that store to be same-store sales. This practice may differ from the methods that other food retailers use to calculate same-store or “comparable” sales. As a result, data in this Form 10-K regarding our same-store sales may not be comparable to similar data made available by other food retailers. |
30
ITEM 7—MANAGEMENT’S DISCUSSION AND ANALYSIS OF FINANCIAL CONDITION AND RESULTS OF OPERATIONS
You should read the following discussion and analysis in conjunction with the information included in Item 6—Selected Financial Data and our consolidated financial statements and the notes to those statements included in Item 8—Financial Statements and Supplementary Data of this Annual Report on Form 10-K. The statements in this discussion regarding our expectations of future performance, liquidity and capital resources and other non-historical statements in this discussion are forward-looking statements. These forward-looking statements are subject to numerous risks and uncertainties, including, but not limited to, the risks and uncertainties described under Item 1A—Risk Factors and “Forward-Looking Statements.” Our actual results may differ materially from those contained in or implied by any forward-looking statements.
Overview
We are a leading Midwest supermarket chain with a 141-year operating history. We have achieved leading market positions in our core markets and are the largest grocery retailer in the state of Wisconsin by net sales for fiscal 2011, based on comparative data that we obtained from Metro Market Studies,Grocery Distribution Analysis and Guide,2012. As of December 29, 2012, we operated 161 grocery stores in Wisconsin, Minnesota and Illinois under the Pick ’n Save, Rainbow, Copps, Metro Market and Mariano’s retail banners, which are served by our three strategically located distribution centers and our food processing and preparation commissary.
Our net sales have remained relatively stable over our last three completed fiscal years, despite economic challenges. During this period, we have pursued pricing and merchandising improvement initiatives, as well as our Chicago expansion strategy. We also completed our exit from third party wholesale distribution, begun in 2002, with wholesale distribution sales decreasing from $63 million in fiscal 2008 to $15 million in fiscal 2012. As of December 29, 2012, we continue to serve as the primary wholesaler for one independent Pick ’n Save retail store. In recent periods, our net sales have increased as compared to prior comparable periods due primarily to sales generated from stores opened or replaced during fiscal 2011 and 2012.
Since fiscal 2009, we have been able to maintain attractive and consistent operating margins and cash flows generated as a result of our value positioning, efficient operating structure and distinctive merchandising strategies, especially those involving own-brand and perishable goods. In addition, we implemented several cost reduction measures during this period to help support our operating margins and cash flow, including initiatives to reduce shrink and improve labor productivity throughout our operations. These initiatives, together with our efficient cost structure, have enabled us to continue to make targeted investments to lower our everyday retail prices in an effort to improve our competitive position within our markets.
Going forward, we plan to continue to maintain our market leadership and focus on growing same-store sales, opening new stores and increasing our cash flow. We intend to pursue same-store sales growth by continuing to focus on price competitiveness, improving our marketing efforts, selectively remodeling and relocating existing stores and enhancing and expanding our own-brand, perishable and prepared food offerings. In addition, we intend to continue our expansion into the Chicago market with plans to open four to five stores per year in the Chicago market over the next five years. As of December 29, 2012, we had eight stores open in the Chicago market. Given its favorable competitive dynamics and attractive demographics, including a large population and above average household income, we believe the Chicago market provides us with a compelling expansion opportunity. We also plan to continue to support our operating margins and cash flow generation by implementing cost reduction measures, including initiatives to reduce shrink and improve labor productivity throughout our operations and by focusing on higher margin products.
31
Factors Affecting Our Operating Results
Various factors affect our operating results during each period, including:
General Economic Conditions and Changes in Consumer Behavior
The overall economic environment and related changes in consumer behavior have a significant impact on our business. In general, positive conditions in the broader economy promote customer spending in our stores, while economic weakness results in a reduction of customer spending. Macroeconomic factors that can affect customer spending patterns, and thereby our results of operations, include employment rates, business conditions, changes in the housing market, the availability of credit, interest rates, tax rates and fuel and energy costs.
We believe that the impact of the current economic slowdown on our recent operating results has at least been partially mitigated by increased consumer preferences for meals at home. The recent economic environment has also led consumers to become more price sensitive and, as a result, consumers are increasingly purchasing own-brand products that offer a better value than national brands. Because own-brand items have a lower price point than national brands, as our own-brand sales mix increases, our overall net sales are reduced but our gross profit and gross margin improve.
Our core markets also feature relatively stable local economies with diversified employer bases and stable to modestly growing populations. Although our markets have been impacted by the economic downturn, unemployment rates in Wisconsin and Minneapolis are lower than the national average.
Inflation and Deflation Trends
Inflation and deflation can impact our financial performance. During inflationary periods, our financial results can be positively impacted in the short term as we sell lower-priced inventory in a higher price environment if we are able to successfully pass those higher prices on to our customers. Over the longer term, the impact of inflation is largely dependent on our ability to pass through inventory price increases to our customers, which is subject to competitive market conditions. In recent inflationary periods, we have generally been able to pass through most cost increases. For example, our operating results in fiscal 2008 were positively impacted by the inflationary environment, largely driven by higher commodity prices. Conversely, during deflationary periods our operating results are generally adversely affected. In fiscal 2009, for example, the food retail sector began experiencing deflation, as input costs declined and price competition among retailers intensified, pressuring sales across the industry. In fiscal 2010, food deflation moderated and, beginning in early fiscal 2011, we began to experience inflation in some commodity driven categories, which has had a slight negative impact on our gross margins as price competition has partially limited our ability to immediately pass through higher prices on certain products. In fiscal 2012, we again experienced deflationary trends, some of which were related to pricing and promotional activity, in several key product categories that negatively affected our same-store sales and margins.
Cost Management Initiatives
Our recent operating results reflect the impact of our ongoing initiatives to lower our operating costs to support our margins. For example, we have improved our labor productivity over the last several years through various initiatives. In particular, we have reduced unproductive labor hours through implementation of lean initiatives, including a focus on improving organizational efficiency, work processes and store layouts. We have also refined our labor standards and have also centralized certain perishable and prepared foods production in our commissary operation.
We have also undertaken a number of initiatives to improve our supply chain costs. For example, we have outsourced our inbound transportation to a third party transportation services organization. We have also reduced our mileage for outbound loads through a lean initiative that improved our cube sizing and allowed maximum space utilization of our fleet. In our warehouse operation, we have reduced our warehouse labor costs by refining our labor standards. We have also improved our product procurement costs with a third party driven initiative to
32
develop a collaborative process with suppliers to take excess costs out of the supply chain through vendor consolidation, SKU rationalization, direct sourcing and reverse engineering of product costs.
Targeted Investments in Everyday Low Prices
Our recent operating results have been impacted by our price cutback initiative that we began to implement in fiscal 2007 in order to improve our pricing compared to conventional supermarket and supercenter competitors. Through this initiative we have lowered our everyday prices on approximately 5,500 to 6,000 key value items in highly competitive and price sensitive markets. A substantial portion of our existing store network has absorbed the impact of the price cutback initiative, and we expect to expand it to other stores depending on local competitive conditions. In addition, we recently adjusted our pricing in certain markets for select key product categories to better compete against supercenter pricing. In those markets and categories, we are going to market with a lower everyday price and fewer deep promotional offers. This is more efficient and ultimately helps our overall price image.
Store Openings and Store Closings
Our operating results in any particular period are impacted by the timing of new store openings and store closings. For example, we typically incur higher than normal employee costs at the time of a new store opening associated with set-up and other opening costs. During the first several weeks following a new store opening, operating margins are also affected by promotional discounts and other marketing costs and strategies associated with new store openings, as well as higher shrink and costs related to hiring and training new employees. A new store in our core markets can take a year or more to achieve a level of operating profitability comparable to our company-wide average for existing stores, with a somewhat longer time horizon anticipated with respect to our new Chicago stores.
In addition, many of our new store openings in existing markets have had a near term negative impact on our same-store sales as a result of cannibalization from existing stores in close proximity. Over the longer term, we believe that any such cannibalization will be more than offset by future net sales growth and expanded market share. When we close underperforming stores, we expense the present value of any remaining future lease liabilities, net of expected sublease income, which negatively impacts our operating results during the period of the closure.
We also look for opportunities to relocate existing stores to improve location, lease terms or store layout. Relocated stores typically achieve a level of operating profitability comparable to our company-wide average for existing stores more quickly than new stores.
Changes in our store base during the periods presented are summarized below:
| | | | | | | | | | | | |
| | | Fiscal Year Ended | |
| | | 1/1/2011 | | | 12/31/2011 | | | 12/29/2012 | |
Stores at beginning of period | | | 154 | | | | 155 | | | | 158 | |
New stores opened | | | 1 | | | | 3 | | | | 4 | |
Relocated stores opened | | | 5 | | | | 4 | | | | 2 | |
Stores closed but relocated | | | (5 | ) | | | (4 | ) | | | (3 | ) |
| | | | | | | | | | | | |
Stores at end of period | | | 155 | | | | 158 | | | | 161 | |
| | | | | | | | | | | | |
Expanded Own-brand Offering
Delivering high quality own-brand products is a key component of our pricing and merchandising strategy, as we believe it builds and deepens customer loyalty, enhances our value proposition, generates higher gross margins relative to national brands and improves the breadth and selection of our product offering. A strong own-brand offering has become an increasingly important competitive advantage in the retail food industry, given consumers’ growing focus on value and greater willingness to purchase own-brand products over national brands.
33
Our portfolio of own-brand items has increased from approximately 1,600 items at the end of fiscal 2005 to approximately 5,700 as of December 29, 2012, with the percentage of sales from own-brand items increasing from 8.4% to 21.2% during this same period. Because own-brand items have a lower price point than national brands, as our own-brand sales mix increases, our overall net sales are reduced but our gross profit and gross margin improve.
Developments in Competitive Landscape
The U.S. food retail industry is highly competitive. Our competitors include national, regional and local conventional supermarkets, national and regional supercenters, membership warehouse clubs, and alternative food retailers, such as natural foods stores, smaller specialty stores and farmers’ markets. In any particular financial period, our results of operations may be impacted by changes to the competitive landscape in one or more of our markets, including as a result of existing competitors expanding their presence or new competitors entering our markets. For example, in recent years we have faced increased competition from the continued expansion of supercenters, such as Wal-Mart throughout our Wisconsin markets and SuperTarget in the Minneapolis/St. Paul area. In certain cases, the impact of these competitive supercenter openings has caused our net sales to decline in the near term. However, the longer term impact of supercenter openings on our overall net sales and market share is more difficult to predict and is dependent on a number of factors in a particular market, including strength of competition, the competitive response by us and other food retailers, and consumer shopping preferences. In some cases, smaller regional and independent grocers are displaced by supercenter openings, creating an opportunity for us to gain market share.
Our competitors will often implement significant promotional activities in an effort to gain market share, in particular in connection with new store openings. In order to remain competitive and maintain our market share, we sometimes elect to implement competing promotional activities, which may result in near term pressure on our operating margins unless we are able to implement corresponding cost saving initiatives. Changes in the competitive landscape in our markets may also impact our level of capital expenditures in the event we decide to remodel or relocate an existing store to improve our competitive position.
Interest Expense and Loss on Debt Extinguishment
Our interest expense in any particular period is impacted by our overall level of indebtedness during that period and changes in the interest rates payable on such indebtedness. In April 2010, we borrowed $150 million under a second lien credit facility in order to pay a $150 million dividend to our shareholders, and entered into an additional amendment to a first lien credit facility that modified our interest rate structure. In February 2012, we used all of the net proceeds that we received from our initial public offering (“IPO”), together with our indebtedness from our new senior credit facility, to repay all of our outstanding borrowings and other amounts owed under our old credit facilities. In connection with such repayment, we recorded a charge of approximately $8.0 million, net of tax, to write off all of our unamortized deferred financing costs and the unamortized original issue discount as well as prepayment penalties associated with such indebtedness and to reflect the related prepayment premiums. Going forward, our interest expense will include the amortization of the financing costs associated with our new debt financing arrangements.
Stock Compensation
In connection with the completion of our IPO, we granted an aggregate of 819,286 shares of restricted stock to certain of our directors, executive officers and non-executive officers. During fiscal 2012, we cancelled 62,348 shares of restricted stock that were granted to executives that are no longer with the Company, and granted an additional 73,110 shares to new directors and executive officers. The restricted stock for executive officers and non-executive officers associated with these grants will vest over five years and the restricted stock for our directors will vest over one year. We recorded total stock-based compensation expense of $0.8 million, net of tax, in fiscal 2012. We estimate that we will record compensation expense associated with these grants of
34
approximately $0.8 million for fiscal 2013 through fiscal 2016, and approximately $0.1 million for fiscal 2017, in each case net of tax, and based on the initial public offering price of $8.50 per share for those shares granted in connection with the IPO or the share price on the day of each grant that occurred subsequent to the IPO.-
How We Assess the Performance of Our Business
In assessing the performance of our business, we consider a variety of performance and financial measures. These key measures include net sales and same-store sales, gross profit, operating and administrative expenses and Adjusted EBITDA.
Net Sales and Same-Store Sales
We evaluate net sales because it helps us measure the impact of economic trends and inflation or deflation, the effectiveness of our marketing, promotional and merchandising activities, the impact of new store openings and store closings, and the effect of competition over a given period. Net sales represent product sales less returns and allowances and sales promotions. We derive our net sales primarily from the operation of retail grocery stores and to a much lesser extent from the independent distribution of food and non-food products to an independently-owned store. We recognize retail sales at the point of sale. We do not record sales taxes as a component of retail revenues as we consider ourselves a pass-through conduit for collecting and remitting sales taxes.
We also consider same-store sales to be a key indicator in evaluating our performance. Same-store sales controls for the effects of new store openings, making it a useful measure for period-to-period comparisons. Our practice is to include sales from a store in same-store sales beginning 53 weeks following the store’s opening. When a store that is included in same-store sales is remodeled or relocated, we continue to include sales from that store in same-store sales. This practice may differ from the methods that our competitors use to calculate same-store or “comparable” sales. As a result, data in this Annual Report on Form 10-K regarding our same-store sales may not be comparable to similar data made available by our competitors.
Various factors may affect our net sales and same-store sales, including:
| | • | | overall economic trends and conditions; |
| | • | | consumer preferences and buying trends; |
| | • | | our competition, including competitor store openings or closings near our stores; |
| | • | | the pricing of our products, including the effects of inflation or deflation; |
| | • | | the number of customer transactions in our stores; |
| | • | | our ability to provide product offerings that generate new and repeat visits to our stores; |
| | • | | the level of customer service that we provide in our stores; |
| | • | | our in-store merchandising-related activities; |
| | • | | our ability to source products efficiently; and |
| | • | | the number of stores we open, remodel or relocate in any period. |
Gross Profit
We use gross profit to measure the effectiveness of our pricing and procurement strategies as well as initiatives to increase sales of higher margin items and to reduce shrink. We calculate gross profit as net sales less cost of sales. Cost of sales includes product costs, inbound freight, warehousing costs, receiving and inspection costs, distribution costs, and depreciation and amortization expenses associated with our supply chain operations. The
35
components of our cost of sales may not be identical to those of our competitors. As a result, data in this Annual Report on Form 10-K regarding our gross profit may not be comparable to similar data made available by our competitors.
Our cost of sales is directly correlated with our overall level of sales. Gross profit as a percentage of net sales is affected by:
| | • | | relative mix of products sold; |
| | • | | shrink resulting from product waste, damage, theft or obsolescence; |
| | • | | promotional activity; and |
| | • | | inflationary and deflationary trends. |
Operating and Administrative Expenses
We evaluate our operating and administrative expenses in order to identify areas where we can create savings, such as labor process improvements. Operating and administrative expenses consist primarily of personnel costs, sales and marketing expenses, depreciation and amortization expenses as well as other expenses associated with facilities unrelated to our supply chain network, internal management expenses and expenses for accounting, information systems, legal, business development, human resources, purchasing and other administrative departments.
Store-level labor costs are generally the largest component of our operating and administrative expenses. Store-level expenses, including labor, rent, utilities and maintenance, generally decrease as a percentage of net sales as our net sales increase. Accordingly, higher sales volumes allow us to leverage our store-level fixed costs to improve our operating margin.
The components of our operating and administrative expenses may not be identical to those of our competitors. As a result, data in this Annual Report on Form 10-K regarding our operating and administrative expenses may not be comparable to similar data made available by our competitors. Our operating and administrative expenses have increased due to additional legal, accounting, insurance and other expenses incurred as a result of being a public company.
Adjusted EBITDA
We believe that Adjusted EBITDA is a useful performance measure and we use it to facilitate a comparison of our operating performance on a consistent basis from period-to-period and to provide for a more complete understanding of factors and trends affecting our business. We also use Adjusted EBITDA as one of the primary methods for planning and forecasting overall expected performance and for evaluating on a quarterly and annual basis actual results against such expectations, and as a performance evaluation metric in determining achievement of certain compensation programs and plans for employees, including our senior executives.
We define Adjusted EBITDA as earnings before interest expense, interest expense associated with preferred stock, provision for income taxes, depreciation and amortization, LIFO charges, amortization of deferred financing costs, non-cash compensation expenses arising from the issuance of stock, costs incurred in connection with our IPO (or subsequent offerings of Roundy’s common stock), loss on debt extinguishment, certain non-recurring or unusual employee and pension related costs and goodwill impairment charges. All of the omitted items are either (i) non-cash items or (ii) items that we do not consider in assessing our on-going operating performance. Because it omits non-cash items, we believe that Adjusted EBITDA is less susceptible to variances in actual performance resulting from depreciation, amortization and other non-cash charges and more reflective of other factors that affect our operating performance. Because it omits the other items, we believe Adjusted EBITDA is also more reflective of our on-going operating performance.
36
We determine the amount of the LIFO charges that we exclude in calculating Adjusted EBITDA by determining the base year values of beginning and ending inventories that we account for on a LIFO basis using cumulative price indexes as published by the Bureau of Labor Statistics and subtracting the current year difference between inventories calculated on a LIFO basis and the current cost of inventories valued on a FIFO basis.
Basis of Presentation
Our fiscal year is the 52 or 53 week period ending on the Saturday nearest to December 31. For the last three completed calendar years, our fiscal year ended on January 1, 2011, December 31, 2011 and December 29, 2012. For ease of reference, we identify our fiscal years in this Annual Report on Form 10-K by reference to the calendar year ending nearest to such date. For example, “fiscal 2012” refers to our fiscal year ended December 29, 2012. Our fiscal years include 12 reporting periods, with an additional week in the eleventh reporting period for 53 week fiscal years. All fiscal years presented included 52 weeks.
Results of Operations
Our results of operations in any particular period are affected by the number of stores we have in operation during that period. The following table summarizes our store network as of the end of each of our last three fiscal years.
| | | | | | | | | | | | |
| | | Fiscal Year Ended | |
| | | 1/1/2011 | | | 12/31/2011 | | | 12/29/2012 | |
Pick ’n Save | | | 94 | | | | 93 | | | | 93 | |
Rainbow | | | 32 | | | | 32 | | | | 32 | |
Copps | | | 26 | | | | 26 | | | | 25 | |
Metro Market | | | 2 | | | | 3 | | | | 3 | |
Mariano’s | | | 1 | | | | 4 | | | | 8 | |
| | | | | | | | | | | | |
Total Company-owned stores | | | 155 | | | | 158 | | | | 161 | |
| | | | | | | | | | | | |
Number of same-stores | | | 154 | | | | 155 | | | | 156 | |
The following table sets forth various components of our consolidated statements of income for fiscal 2010, 2011 and 2012 from the audited consolidated financial statements included in Item 8—Financial Statements and Supplementary Data in this Annual Report on Form 10-K, expressed both in dollars and as a percentage of net sales for the period indicated.
| | | | | | | | | | | | | | | | | | | | | | | | |
| | | Fiscal Year | |
| | | 2010 | | | 2011 | | | 2012 | |
Net Sales | | $ | 3,766,988 | | | | 100.0 | % | | $ | 3,841,984 | | | | 100.0 | % | | $ | 3,890,537 | | | | 100.0 | % |
| | | | | | |
Costs and Expenses: | | | | | | | | | | | | | | | | | | | | | | | | |
Cost of sales | | | 2,748,919 | | | | 73.0 | | | | 2,804,709 | | | | 73.0 | | | | 2,855,385 | | | | 73.4 | |
Operating and administrative | | | 868,972 | | | | 23.1 | | | | 886,862 | | | | 23.1 | | | | 908,300 | | | | 23.3 | |
Goodwill impairment charge | | | — | | | | — | | | | — | | | | — | | | | 120,800 | | | | 3.1 | |
Interest expense, current and long-term debt, net | | | 64,037 | | | | 1.7 | | | | 68,855 | | | | 1.8 | | | | 48,825 | | | | 1.3 | |
Interest expense, dividends on preferred stock | | | 2,716 | | | | 0.1 | | | | — | | | | — | | | | — | | | | — | |
Amortization of deferred financing costs | | | 2,906 | | | | 0.1 | | | | 3,469 | | | | 0.1 | | | | 2,413 | | | | 0.1 | |
Loss on debt extinguishment | | | — | | | | — | | | | — | | | | — | | | | 13,304 | | | | 0.3 | |
| | | | | | | | | | | | | | | | | | | | | | | | |
| | | 3,687,550 | | | | 97.9 | % | | | 3,763,895 | | | | 98.0 | % | | | 3,949,027 | | | | 101.5 | % |
| | | | | | | | | | | | | | | | | | | | | | | | |
Income (loss) before Income Taxes | | | 79,438 | | | | 2.1 | | | | 78,089 | | | | 2.0 | | | | (58,490 | ) | | | (1.5 | ) |
Provision for Income Taxes | | | 33,244 | | | | 0.9 | | | | 30,041 | | | | 0.8 | | | | 10,759 | | | | 0.3 | |
| | | | | | | | | | | | | | | | | | | | | | | | |
Net Income (Loss) | | $ | 46,194 | | | | 1.2 | % | | $ | 48,048 | | | | 1.3 | % | | $ | (69,249 | ) | | | (1.8 | %) |
| | | | | | | | | | | | | | | | | | | | | | | | |
37
Fiscal 2012 Compared With Fiscal 2011
Net Sales.Net sales were $3.89 billion for 2012, an increase of $48.6 million, or 1.3% from $3.84 billion for 2011. The increase primarily reflects the impact of new stores, partially offset by a 2.8% decrease in same-store sales. The decline in same-store sales was due to a 2.6% decrease in the number of customer transactions and 0.1% decrease in the average transaction size. The Company’s same-store sales were negatively impacted by the effect of competitive store openings during the last twelve months, as well as the continued challenging economic and promotional environment. Same-store sales were also affected by the calendar shift of both the 2011 New Year’s holiday, which is traditionally a slow sales day and fell in the first quarter of 2012 and the 2012 New Year’s Eve holiday as more of these holiday related sales were shifted into the first quarter of 2013. Adjusted for the effect of both New Year’s holiday calendar shifts, same-store sales declined 2.5%.
As of December 29, 2012, we operated 161 retail grocery stores including 93 Pick ’n Save stores, 32 Rainbow stores, 25 Copps stores, 8 Mariano’s stores and 3 Metro Market stores.
Gross Profit. Gross profit was $1.04 billion for fiscal 2012 and fiscal 2011. Gross profit, as a percentage of net sales, was 26.6% and 27.0% for fiscal 2012 and fiscal 2011, respectively. The decrease in gross profit as a percentage of net sales primarily reflects price and promotional investments in certain of our markets and increased shrink, offset somewhat by lower costs in our supply chain operations.
Operating and Administrative Expenses. Operating and administrative expenses were $908.3 million for 2012, an increase of $21.4 million, or 2.4%, from $886.9 million for 2011. Operating and administrative expenses, as a percentage of net sales, was 23.3% and 23.1% for 2012 and 2011, respectively. The increase was primarily due to increased occupancy costs related to new and replacement stores, incremental costs related to being a public company and reduced fixed cost leverage in our core business resulting from lower same-store sales.
Goodwill Impairment Charge.During the fourth quarter of fiscal 2012, the Company’s market capitalization experienced a significant decline. As a result, management believed that there were circumstances evident which indicated that the fair value of our reporting unit could be below its carrying amount. Management therefore updated its annual review of goodwill for impairment that had been completed in the third quarter, and concluded that the carrying amount of goodwill exceeded its estimated fair value, resulting in a pre-tax, non-cash goodwill impairment charge of $120.8 million ($106.4 million after-tax) during the fourth quarter 2012.
Interest Expense. Interest expense includes interest on our outstanding indebtedness and amortization of deferred financing costs and original issue discount and is net of interest income earned on our invested cash.
Interest expense was $51.2 million for 2012, a decrease of $21.1 million, from $72.3 million for 2011. The decrease was primarily due to decreased levels of indebtedness and reduced interest rates resulting from our debt refinancing in the first quarter 2012.
Loss on Debt Extinguishment. In connection with our debt refinancing in February 2012, we recognized a loss on debt extinguishment of $13.3 million.
Income Taxes. Provision for income taxes was $10.8 million for 2012, a decrease of $19.2 million, from $30.0 million for 2011. The effective income tax rates for 2012 and 2011 were (18.4%) and 38.5%, respectively. The provision for income taxes and effective tax rate for 2012 reflects the impact of the goodwill impairment charge recorded during the fourth quarter of 2012, the majority of which is non-deductible for tax purposes.
Fiscal 2011 Compared With Fiscal 2010
Net Sales.Net sales were $3.84 billion for 2011, an increase of $75.0 million, or 2.0% from $3.77 billion for 2010. The increase primarily reflects the impact of new stores, offset by decreased same-store sales, which were
38
0.2% lower than 2010. The same-store sales decrease was due to a 2.6% decrease in the number of customer transactions offset by a 2.5% increase in the average transaction size, and was impacted by new competitive store openings in certain markets in the last 12 months offset by the increase in sales at store relocations opened in 2011.
As of December 31, 2011, we operated 158 retail grocery stores including 93 Pick ’n Save stores, 32 Rainbow stores, 26 Copps stores, 4 Mariano’s stores and 3 Metro Market stores.
Gross Profit. Gross profit was $1.04 billion for fiscal 2011, an increase of $19.2 million, or 1.9%, from $1.02 billion for fiscal 2010. Gross profit, as a percentage of net sales, was 27.0% for 2011 and 2010.
Operating and Administrative Expenses. Operating and administrative expenses were $886.9 million for 2011, an increase of $17.9 million, or 2.1%, from $869.0 million for 2010. The increase in operating and administrative expenses was due to higher store occupancy costs related to new stores and increased rent on relocated stores. Operating and administrative expenses, as a percentage of net sales, was 23.1% for 2011 and 2010. Increases in occupancy costs and rent expense were offset by reduced labor and benefit costs, resulting from labor productivity improvements and tight cost controls at our stores.
Interest Expense.Interest expense was $72.3 million for 2011, an increase of $5.4 million, from $66.9 million for 2010. The increase was primarily due to increased interest rates and increased overall levels of indebtedness as a result of the second lien credit facility we entered into on April 29, 2010.
Interest Expense Associated with Preferred Stock.Interest expense associated with preferred stock includes dividends accrued on preferred stock subject to mandatory payment.
There was no interest expense on account of dividends on preferred stock for fiscal 2011, as compared to $2.7 million for fiscal 2010. The preferred stock ceased to accrue dividends on April 29, 2010.
Income Taxes. Provision for income taxes was $30.0 million for 2011, a decrease of $3.2 million, from $33.2 million for 2010. The effective income tax rates for 2011 and 2010 were 38.5% and 41.8%, respectively. The decrease in the effective income tax rate is primarily due to different state income tax rates in states where we operate and the mix of our earnings in those states as well as to the effect of the preferred stock ceasing to accrue dividends, which were non-deductible for tax purposes, on April 29, 2010.
Liquidity and Capital Resources
Overview
Our principal sources of liquidity are cash flow generated from operations and borrowings under our revolving credit facility. Our principal uses of cash are to provide for working capital, finance capital expenditures, meet debt service requirements and pay stockholder dividends. The most significant components of our working capital are cash, inventories and accounts payable. Our working capital was $79.9 million at December 29, 2012, compared to $79.8 million at December 31, 2011.
At December 29, 2012, we had $72.9 million of cash and cash equivalents and $97.4 million of availability under our revolving credit facility. We also had an aggregate of $673.1 million of outstanding indebtedness under our term loan (excluding unamortized discount on our term loan of $8.8 million) and other long-term debt, $32.3 million of capital lease obligations, no outstanding borrowings under our revolving credit facility and outstanding letters of credit of $27.6 million.
During 2012, we paid cash dividends of $0.58 per share. We currently intend to declare quarterly dividends of approximately $0.12 per share on all outstanding shares of common stock during 2013. We expect to fund these
39
dividend payments using our free cash flow, which we generally consider to be for any particular period our net earnings plus any non-cash charges and expenses incurred in such period after subtracting our capital expenditures and mandatory debt repayments for that period. The declaration of dividends, and, if declared, the amount of any such dividend, will be subject to our actual future earnings and capital requirements and to the discretion of our board of directors. Our board of directors may take into account such matters as general business conditions, our financial results, capital requirements, contractual, legal and regulatory restrictions and such other factors as our board of directors may deem relevant. For example, our ability to pay cash dividends on our common stock will be subject to our continued compliance with the terms of any indebtedness, including our senior credit facility, as further defined below. We currently expect that our dividend payments for any particular quarter may represent a meaningful portion, but less than all, of our free cash flow for such period. Because any future payment of dividends will be at the discretion of our board of directors, we do not expect that any such dividend payments will have an adverse impact on our liquidity or otherwise limit our ability to fund capital expenditures or otherwise pursue our business strategy over the long-term. We do not expect to incur any indebtedness to fund any future dividend payments.
Initial Public Offering
On February 7, 2012, we priced the initial public offering of our common stock which began trading on the New York Stock Exchange on February 8, 2012. On February 13, 2012, we completed our offering of 22,059,091 shares of our common stock at a price of $8.50 per share, which included 14,705,883 shares sold by Roundy’s and 7,353,208 shares sold by existing shareholders. Roundy’s received approximately $125.0 million in gross proceeds from the IPO, or approximately $111.8 million in net proceeds after deducting the underwriting discount and expenses related to the offering. The net proceeds of our IPO were used to pay down RSI’s existing debt.
Senior Credit Facility
In connection with the completion of our IPO, our principal operating subsidiary Roundy’s Supermarkets, Inc. (“RSI”) entered into a new senior credit facility (the “Refinancing”), consisting of a $675 million term loan (the “Term Facility”) and a $125 million revolving credit facility (the “Revolving Facility” and together with the Term Facility, the “Credit Facilities”) with the Term Facility maturing in February 2019 and the Revolving Facility maturing in February 2017. We used the net proceeds from the IPO, together with borrowings under the Credit Facilities, to refinance our existing indebtedness and to pay accrued interest and related prepayment premiums.
Borrowings under the Term Facility and the Revolving Facility bear interest, at our option, at (i) adjusted LIBOR (subject to a 1.25% floor) plus 4.5% or (ii) an alternate base rate plus 3.5%. In addition, there is a fee payable quarterly in an amount equal to 0.5% per annum of the undrawn portion of the Revolving Facility.
All of RSI’s obligations under the Credit Facilities are unconditionally guaranteed (the “Guarantees”) by each of the direct and indirect subsidiaries of the Company (other than any future unrestricted subsidiaries as we may designate, at our discretion, from time to time) (the “Guarantors”).
Additionally, the Credit Facilities and the Guarantees are secured by a first-priority perfected security interest in substantially all present and future assets of RSI and each Guarantor, including accounts receivable, equipment, inventory, general intangibles, intellectual property, investment property and intercompany notes among Guarantors; except that the security interest granted by Roundy’s Acquisition Corp. (the direct parent of RSI) is limited to its right, title and interest in and to the stock and promissory notes of RSI and general intangibles and investment property related thereto, and all proceeds, supporting obligations and products related thereto and all collateral security and guarantees given by any person with respect thereto.
40
Mandatory prepayments under the Credit Facilities are required with (i) 50% of adjusted excess cash flow (which percentage may be reduced upon achievement and maintenance of certain leverage ratios); (ii) 100% of the net cash proceeds of assets sales or other dispositions of property by RSI and its restricted subsidiaries (subject to certain exceptions and reinvestment provisions); and (iii) 100% of the net cash proceeds of issuances, offerings or placements of debt obligations of RSI or its restricted subsidiaries (subject to certain exceptions).
The Credit Facilities contain a number of customary affirmative covenants. The Credit Facilities also contain customary negative covenants, including restrictions on (i) dividends on, and redemptions of, equity interest and other restricted payments (with a permitted basket for cash dividends on common stock in the sum of (a) 70% of excess cash flow calculated on a quarterly basis and (b) $25,000,000, plus a builder basket based on the Company’s retained portion of adjusted excess cash flow measured cumulatively, in each case, subject to pro forma compliance with financial covenants and no default or event of default being continuing; (ii) liens and sale-leaseback transactions; (iii) loans and investments; (iv) guarantees and hedging agreements; (v) the sale, transfer or disposition of assets and businesses; (vi) transactions with affiliates; (vii) changes in business conducted by the Borrower and its subsidiaries; (viii) payment or amendment of subordinated debt and organizational documents; and (ix) maximum capital expenditures. Excess cash flow is an amount equal to Adjusted EBITDA minus capital expenditures, cash payments of interest, cash payments of taxes, mandatory loan repayments and amortization of capital leases for that period. RSI is also required to comply with the following financial covenants: (i) a maximum total leverage ratio and (ii) a minimum cash interest coverage ratio.
At December 29, 2012, we were in compliance with our financial covenants for all of our indebtedness.
Old Credit Facilities
Prior to the Refinancing, our long-term debt included a first lien senior credit facility consisting of a term loan and $95 million revolving credit agreement (together, the “First Lien Credit Agreement) and a second lien credit facility (“Second Lien Credit Agreement”).
Our first and second lien loans and the revolving credit facility bore interest based upon LIBOR or base rate options. Under the LIBOR option for the first lien loan and revolving credit facility, the applicable rate was LIBOR plus 5.00% (subject to a floor of 2.0%) and under the base rate option for the first lien loan and revolving credit facility, the applicable rate of interest was the base rate plus 4.00%. For the portion of our first lien loan which matured in November 2011, the applicable rate of interest was LIBOR plus 3.50% and under the base rate option, the applicable interest rate was the base rate plus 2.50%.
On April 16, 2010, the Company borrowed $150 million under the Second Lien Credit Agreement to pay dividends to our preferred and common shareholders. This loan was issued at a 2% discount and was to mature in April 2016. This loan bore interest based upon LIBOR or base rate options. Under the LIBOR option, the applicable rate was LIBOR plus 8.0% (subject to a floor of 2%) and under the base rate option, the applicable rate was the base rate plus 7.0%.
41
Cash Flows
The following table presents a summary of our net cash provided by (used in) operating, investing and financing activities (in thousands):
| | | | | | | | | | | | |
| | | 2010 | | | 2011 | | | 2012 | |
Net cash provided by operating activities | | $ | 40,633 | | | $ | 182,017 | | | $ | 105,734 | |
Net cash used in investing activities | | | (57,754 | ) | | | (65,868 | ) | | | (61,554 | ) |
Net cash used in financing activities | | | (21,365 | ) | | | (65,516 | ) | | | (58,359 | ) |
| | | | | | | | | | | | |
Net (decrease) increase in cash and cash equivalents | | $ | (38,486 | ) | | $ | 50,633 | | | $ | (14,179 | ) |
| | | | | | | | | | | | |
Cash and cash equivalents at end of period | | $ | 36,435 | | | $ | 87,068 | | | $ | 72,889 | |
| | | | | | | | | | | | |
Net Cash Provided by Operating Activities.Net cash provided by operating activities was $182.0 million in fiscal 2011 compared to $40.6 million for fiscal 2010. The increase in net cash provided by operating activities in fiscal 2011 was due primarily to vendor payments that were made in late 2010, rather than early 2011. Net cash provided by operating activities was also impacted by a decrease in income taxes paid, offset by an increase in inventories and an increase in interest payments.
Net cash provided by operating activities in fiscal 2012 was $105.7 million, compared to $182.0 million in fiscal 2011. The decrease in cash provided by operating activities was due primarily to the higher use of cash for working capital in 2012, which was primarily related to the unusual timing of vendor payments that were made in late 2010, rather than early 2011, as discussed above, together with lower operating income and higher income tax payments made during 2012.
Net Cash Used in Investing Activities.Net cash used in investing activities consists primarily of capital expenditures for opening new stores and relocating and remodeling existing stores, as well as investments in information technology, store maintenance and our supply chain.
Net cash used in investing activities was $57.8 million during fiscal 2010. Net cash used during the period related primarily to capital expenditures of $62.9 million partially offset by $5.9 million of proceeds from asset sales.
Net cash used in investing activities was $65.9 million during fiscal 2011. Net cash used during the period related primarily to capital expenditures of $66.5 million, partially offset by $0.6 million of proceeds from asset sales.
Net cash used in investing activities was $61.6 million during fiscal 2012. Net cash used during the period related primarily to capital expenditures of $62.0 million, partially offset by $0.5 million of proceeds from asset sales.
Net Cash Used in Financing Activities.Net cash used in financing activities consists primarily of payments on our debt and capital lease obligations, proceeds from debt borrowing, and payment of dividends to our shareholders.
Net cash used in financing activities was $21.4 million during fiscal 2010. Net cash used in financing activities in 2010 was due primarily to repayments of $10.6 million on our long-term debt and capital lease obligations and $7.9 million in financing costs. In addition, during 2010, we received net proceeds of $147.0 million from our second lien credit facility, which was used to fund $150.0 million in dividends to equity holders and to pay the liquidation value of our preferred stock.
Net cash used in financing activities was $65.5 million during fiscal 2011. Net cash used in financing activities in 2011 was due primarily to scheduled payments of debt and capital lease obligations, which included a payment of $53.5 million for a portion of our term loan which matured in November 2011.
42
Net cash used in financing activities was $58.4 million during fiscal 2012. Net cash used in 2012 consisted of payments of debt and capital lease obligations of $791.6 million, primarily to refinance our existing indebtedness and related financing costs of $18.2 million, offset somewhat by the net proceeds from our term loan of $664.9 million and net proceeds from our initial public offering of $111.8 million. In addition, during 2012, we paid dividends to shareholders in the amount of $26.0 million.
Capital Expenditures
Total capital expenditures for fiscal 2013, excluding any acquisitions, are estimated to be approximately $63 to $68 million.
Non-GAAP Measures
We present Adjusted EBITDA, a non-GAAP measure, to provide investors with a supplemental measure of our operating performance. We define Adjusted EBITDA as earnings before interest expense, interest expense associated with preferred stock, provision for income taxes, depreciation and amortization, LIFO charges, amortization of deferred financing costs, non-cash compensation expenses arising from the issuance of stock, costs incurred in connection with our IPO (or subsequent offerings of our Roundy’s common stock), loss on debt extinguishment, certain non-recurring or unusual employee and pension related costs and goodwill impairment charges. Omitting interest, taxes and the other items provides a financial measure that facilitates comparisons of our results of operations with those of companies having different capital structures. Since the levels of indebtedness, tax structures, and methodologies in calculating LIFO expense that other companies have are different from ours, we omit these amounts to facilitate investors’ ability to make these comparisons. Similarly, we omit depreciation and amortization because other companies may employ a greater or lesser amount of owned property, and because in our experience, whether a store is new or one that is fully or mostly depreciated does not necessarily correlate to the contribution that such store makes to operating performance. We believe that investors, analysts and other interested parties consider Adjusted EBITDA an important measure of our operating performance. Adjusted EBITDA should not be considered as an alternative to net income as a measure of our performance. Other companies in our industry may calculate Adjusted EBITDA differently than we do, limiting its usefulness as a comparative measure.
Adjusted EBITDA has limitations as an analytical tool, and should not be considered in isolation or as a substitute for analysis of our results as reported under GAAP. The limitations of Adjusted EBITDA include: (i) it does not reflect our cash expenditures or future requirements for capital expenditures or contractual commitments; (ii) it does not reflect changes in, or cash requirements for, our working capital needs; (iii) it does not reflect income tax payments we may be required to make; and (iv) although depreciation and amortization are non-cash charges, the assets being depreciated and amortized often will have to be replaced in the future, and Adjusted EBITDA does not reflect any cash requirements for such replacements.
To properly and prudently evaluate our business, we encourage you to review our audited consolidated financial statements included elsewhere in this Annual Report on Form 10-K and the reconciliation to Adjusted EBITDA from net income, the most directly comparable financial measure presented in accordance with GAAP, set forth in the table below. All of the items included in the reconciliation from net income to Adjusted EBITDA are either (i) non-cash items or (ii) items that management does not consider in assessing our on-going operating performance. In the case of the non-cash items, management believes that investors may find it useful to assess our comparative operating performance because the measures without such items are less susceptible to variances in actual performance resulting from depreciation, amortization and other non-cash charges and more reflective of other factors that affect operating performance. In the case of the other items that management does not consider in assessing our on-going operating performance, management believes that investors may find it useful to assess our operating performance if the measures are presented without these items because their financial impact may not reflect on-going operating performance.
43
The following is a summary of the calculation of Adjusted EBITDA for Fiscal 2010, 2011 and 2012 (in thousands):
| | | | | | | | | | | | |
| | | 2010 | | | 2011 | | | 2012 | |
Net income (loss) | | $ | 46,194 | | | $ | 48,048 | | | $ | (69,249 | ) |
Interest expense, current and long-term debt, net | | | 64,037 | | | | 68,855 | | | | 48,825 | |
Interest expense, dividends on preferred stock | | | 2,716 | | | | — | | | | — | |
Provision for income taxes | | | 33,244 | | | | 30,041 | | | | 10,759 | |
Depreciation and amortization expense | | | 72,331 | | | | 69,480 | | | | 66,136 | |
LIFO charges | | | 1,665 | | | | 4,262 | | | | 1,343 | |
Amortization of deferred financing costs | | | 2,906 | | | | 3,469 | | | | 2,413 | |
Non-cash stock compensation expense | | | — | | | | — | | | | 1,431 | |
Loss on debt extinguishment | | | — | | | | — | | | | 13,304 | |
Goodwill impairment charge | | | — | | | | — | | | | 120,800 | |
Executive recruiting fees and relocation expenses | | | — | | | | — | | | | 484 | |
Severance to former executives | | | — | | | | — | | | | 904 | |
One-time pension withdrawal expense | | | — | | | | — | | | | 1,006 | |
One-time IPO expenses | | | — | | | | — | | | | 519 | |
| | | | | | | | | | | | |
Adjusted EBITDA | | $ | 223,093 | | | $ | 224,155 | | | $ | 198,675 | |
| | | | | | | | | | | | |
Our principal sources of liquidity are cash flows generated from operations and borrowings under our revolving credit facility. Our principal uses of cash are to meet debt service requirements, finance capital expenditures, make acquisitions and provide for working capital. We expect that current excess cash, cash available from operations and funds available under our revolving credit facility will be sufficient to fund our operations, debt service requirements and capital expenditures for at least the next 12 months.
Our ability to make payments on and to refinance our debt, and to fund planned capital expenditures depends on our ability to generate sufficient cash in the future. This, to some extent, is subject to general economic, financial, competitive and other factors that are beyond our control. We believe that, based upon current levels of operations, we will be able to meet our debt service obligations when due. Significant assumptions underlie this belief, including, among other things, that we will continue to be successful in implementing our business strategy and that there will be no material adverse developments in our business, liquidity or capital requirements. If our future cash flow from operations and other capital resources are insufficient to pay our obligations as they mature or to fund our liquidity needs, we may be forced to reduce or delay our business activities and capital expenditures, sell assets, obtain additional debt or equity capital or restructure or refinance all or a portion of our debt, on or before maturity. There can be no assurance that we would be able to accomplish any of these alternatives on a timely basis or on satisfactory terms, if at all. In addition, the terms of our existing and future indebtedness may limit our ability to pursue any of these alternatives.
Contractual Obligations
The following table of material debt and lease commitments at December 29, 2012 summarizes the effect these obligations are expected to have on our cash flow in the future periods as set forth in the table below (in thousands):
| | | | | | | | | | | | | | | | | | | | | | | | | | | | |
| | | 2013 | | | 2014 | | | 2015 | | | 2016 | | | 2017 | | | Thereafter | | | Total | |
Long-term debt(1) | | $ | 10,918 | | | $ | 13,025 | | | $ | 11,737 | | | $ | 11,900 | | | $ | 11,409 | | | $ | 646,379 | | | $ | 705,368 | |
Interest(1) | | | 41,005 | | | | 40,269 | | | | 39,488 | | | | 38,674 | | | | 37,870 | | | | 44,028 | | | | 241,334 | |
Operating leases | | | 122,607 | | | | 136,168 | | | | 134,300 | | | | 130,975 | | | | 126,911 | | | | 1,315,653 | | | | 1,966,614 | |
Sublease income | | | (4,794 | ) | | | (3,712 | ) | | | (3,084 | ) | | | (2,431 | ) | | | (1,451 | ) | | | (4,922 | ) | | | (20,394 | ) |
| | | | | | | | | | | | | | | | | | | | | | | | | | | | |
Total commitments | | $ | 169,736 | | | $ | 185,750 | | | $ | 182,441 | | | $ | 179,118 | | | $ | 174,739 | | | $ | 2,001,138 | | | $ | 2,892,922 | |
| | | | | | | | | | | | | | | | | | | | | | | | | | | | |
44
| (1) | Includes principal and interest payments for our outstanding indebtedness and capital lease obligations (See Note 6 to the consolidated financial statements included within Item 8 – Financial Statements and Supplementary Data). Interest payments have been estimated based on the coupon rate for fixed rate obligations or the rate in effect at December 29, 2012 for variable rate obligations. Interest obligations exclude amounts which have been accrued through December 29, 2012. |
As of December 29, 2012, we have $11.0 million of unrecognized tax benefits. The Company believes it is reasonably possible that tax audit resolutions could reduce its unrecognized tax benefits by $4.7 million in the next twelve months. These amounts have been excluded from the contractual obligations table because a reasonably reliable estimate of the period of cash settlement with the respective taxing authorities cannot be determined due to uncertainty regarding the timing of future cash outflows associated with these liabilities.
Our purchase obligations are cancelable and therefore not included in the above table.
We have outstanding letters of credit that total approximately $27.6 million at December 29, 2012.
We are required to make contributions to our defined benefit plans. These contributions are required under the minimum funding requirements of Employee Retirement Pension Plan Income Security Act. Our estimated 2013 minimum required contributions to our defined benefit plans are approximately $6.2 million. Due to uncertainties regarding significant assumptions involved in estimating future required contributions to our defined benefit plans, such as interest rate levels, the amount and timing of asset returns and the impact of proposed legislation, we are not able to reasonably estimate our future required contributions beyond 2013.
Off-Balance Sheet Items
General
We have not created, and are not party to, any special-purpose or off-balance sheet entities for the purpose of raising capital, incurring debt or operating our business. With the exception of operating lease and pension obligations, we do not have any off-balance sheet arrangements or relationships with entities that are not consolidated into or disclosed in our financial statements that have or are reasonably likely to have a material current or future effect on our financial condition, changes in financial condition, revenues, expenses, results of operations, liquidity, capital expenditures or capital resources. In addition, we do not engage in trading activities involving non-exchange traded contracts.
Multiemployer Plans
We are a party to three underfunded multi-employer pension plans on behalf of our union-affiliated employees. This underfunding has increased in part due to increases in the costs of benefits provided or paid under these plans as well as lower returns on plan assets. The unfunded liabilities of these plans may result in increased future payments by us and other participating employers. Going forward, our required contributions to these multi-employer plans could increase as a result of many factors, including the outcome of collective bargaining with the unions, actions taken by trustees who manage the plans, government regulations, the actual return on assets held in the plans and the payment of a withdrawal liability if we choose to exit a plan. We expect meaningful increases in contribution expense as a result of required incremental plan contributions to reduce underfunding. Our risk of future increased payments may be greater if other participating employers withdraw from the plan and are not able to pay the total liability assessed as a result of such withdrawal, or if the pension plan adopts surcharges and/or increased pension contributions as part of a rehabilitation plan.
In December 2012, the company entered into a withdrawal agreement for the Company’s liability related to approximately 3% of our employees who participate in the United Food and Commercial Workers Union and Employers Pension Fund. The Company recognized a charge of $1.0 million related to the withdrawal, which will be paid quarterly over 13 years.
45
Critical Accounting Policies and Estimates
The preparation of our financial statements in conformity with U.S. GAAP require us to make estimates, assumptions and judgments that affect amounts of assets and liabilities reported in the consolidated financial statements, the disclosure of contingent assets and liabilities as of the date of the financial statements and reported amounts of revenues and expenses during the year. We believe our estimates and assumptions are reasonable; however, future results could differ from those estimates.
Critical accounting policies reflect material judgment and uncertainty and may result in materially different results using different assumptions or conditions. We identified the following critical accounting policies and estimates: inventories, income taxes, discounts and vendor allowances, allowance for losses on receivables, closed facility commitments, reserves for self-insurance, employee benefit plans, goodwill and impairment of long-lived assets. For a detailed discussion of accounting policies, please refer to the notes to the consolidated financial statements in Item 8—Financial Statements and Supplementary Data.
Senior management of the Company has discussed the development and selection of the following critical accounting policies with the audit committee of our board of directors.
Inventories
Inventories are recorded at the lower of cost or market. Substantially all of our inventories consist of finished goods. Cost is calculated on a FIFO and a LIFO basis for approximately 63% and 37%, and 64% and 36%, of our inventories at December 31, 2011 and December 29, 2012, respectively. We use the link chain method for computing dollar value LIFO, whereby the base year values of beginning and ending inventories are determined using price indexes published by the Bureau of Labor Statistics. We use a combination of the retail inventory method (“RIM”) and weighted average cost method to determine the current cost of inventory before any LIFO reserve is applied. Under RIM, the current cost of inventories and gross margins are calculated by applying a cost-to-retail ratio to the current retail value of inventories. The weighted average cost method is used for our supply chain and perishable store inventories and the RIM method is used for all other inventories. If the FIFO method had been used to determine cost of inventories for which the LIFO method is used, our inventories would have been higher by approximately $22.1 million and $23.5 million as of December 31, 2011 and December 29, 2012, respectively.
Income Taxes
We pay income taxes based on tax statutes, regulations and case law of the various jurisdictions in which we operate. At any one time, multiple tax years are subject to audit by the various taxing authorities. Income taxes are accounted for under the asset and liability method. Deferred income tax assets and liabilities are recognized for the future tax consequences attributable to differences between the financial statement carrying amounts of existing assets and liabilities and their respective tax bases. Deferred income tax assets and liabilities are measured using enacted tax rates expected to apply to taxable income in the years in which those temporary differences are expected to be recovered or settled. The effect on deferred income tax assets and liabilities of a change in tax rates is recognized in income in the period that includes the enactment date. We recognize an income tax benefit from an uncertain tax position only if it is more likely than not that the tax position will be sustained on examination by the taxing authorities based on the technical merits of the position. The income tax benefit recognized in our financial statements from such a position is measured based on the largest estimated benefit that has a greater than 50% likelihood of being realized upon ultimate settlement.
Discounts and Vendor Allowances
Purchases of product at discounted costs are recorded in inventory at the discounted cost until sold. Volume and other program allowances are accrued as a receivable when it is reasonably assured they will be earned and reduce the cost of the related inventory for product on hand or cost of sales for product already sold. Vendor
46
allowances received to fund advertising and certain other expenses are recorded as a reduction of our expense for such related advertising or other expense, if such vendor allowances reimburse us for specific, identifiable and incremental costs incurred by us in selling the vendor’s product. Any excess reimbursement over our cost is classified as a reduction to cost of sales.
Allowances for Losses on Receivables
Management makes estimates of the uncollectibility of its accounts and notes receivable portfolios. In determining the adequacy of the allowances, management analyzes its accounts based on historical collection experience, aging of receivables and other economic and industry factors. It is possible that the accuracy of the estimation process could be materially impacted by different judgments as to collectability based on the information considered and further deterioration of accounts.
Closed Facility Commitments
In prior years, we leased store sites which we have subleased to qualified independent retailers at rates that are generally equal to the rent paid by us. We also lease store sites for our retail operations. Under the terms of the original lease agreements, we remain primarily liable for any properties that are subleased as well as our own retail stores. Should a retailer be unable to perform under the sublease or should we close underperforming stores, we would record a charge to earnings for the discounted cost of the remaining term of the lease and related costs, less any anticipated sublease income. Should the number of defaults by sublessees or store closures increase, or the actual sublease income be less than estimated, the remaining lease commitments we must record could have a material adverse effect on our operating results and cash flows. Early settlements of lease obligations with the landlord and the discount rate used to calculate the estimated liability will also impact recorded balances or future results.
Reserves for Self-Insurance
We are primarily self-insured for potential liabilities for workers’ compensation, general liability and employee health care benefits. It is our policy to record the liability based on claims filed and a consideration of historical claims experience, demographic factors and other actuarial assumptions for those claims incurred but not yet reported. Any projection of losses concerning these claims is subject to a considerable degree of variability. Among the causes of this variability are unpredictable external factors affecting future inflation rates, litigation trends, legal interpretations, benefit level changes and claim settlement patterns.
Employee Benefit Plans
Certain of our employees are covered by noncontributory defined benefit pension plans. U.S. GAAP requires that we recognize in our consolidated balance sheet a liability for plans which are underfunded or unfunded, or an asset for plans which are overfunded. U.S. GAAP also requires that we measure the benefit obligations and fair value of plan assets that determine our plans’ funded status as of our fiscal year end date. We currently use a December 31 measurement date. We record, as a component of accumulated other comprehensive income/(loss), actuarial gains or losses that have not yet been recognized.
The determination of our obligation and expense for Company-sponsored pension plans is dependent upon assumptions we select for use by actuaries in calculating those amounts. Those assumptions are described in Note 7 to our consolidated financial statements and include the discount rate, the expected long-term rate of return on plan assets and the rate of future compensation increases. Actual returns on plan assets and changes in the interest rates used to determine the discount rate are accumulated and amortized over future periods. While we believe that our assumptions are appropriate, significant differences in our actual experience or significant changes in our assumptions, including the discount rate used and expected return on plan assets, may significantly impact pension expense and cash contributions in the future.
47
The objective of our discount rate assumptions was intended to reflect the rates at which the pension benefits could be effectively settled. Our methodology for selecting the discount rates as of December 29, 2012 was to match the plans’ cash flows to that of a yield curve that provides the equivalent yields on high-quality fixed income securities for each maturity. Benefit cash flows due in a particular year can theoretically be “settled” by “investing” them in high quality income securities that mature in the same year. The discount rates are the single rates that produce the same present value of cash flows. The selection of the 3.77% weighted average discount rate as of December 29, 2012 represents the equivalent rate constructed under a broad-market yield curve. We utilized a discount rate of 4.30% as of December 31, 2011. A 100 basis point increase in the discount rate would decrease the projected pension benefit obligation as of December 29, 2012, by approximately $28 million.
To determine the expected rate of return on pension plan assets, we consider current and forecasted plan asset allocations as well as historical and forecasted rates of return on various asset categories. For 2011 and 2012, we assumed a pension plan investment return rate of 8.5%. For our fiscal year ending December 28, 2013, we have assumed a pension plan investment return rate of 8.25%.
Goodwill
We have a significant amount of goodwill. As of December 29, 2012, we had goodwill of approximately $606.0 million, which represented approximately 43.9% of our total assets as of such date. Goodwill is reviewed for impairment on an annual basis (as of the first day of the third quarter) or whenever events occur or circumstances change that would more likely than not reduce the fair value of a reporting unit below its carrying amount. Fair value is determined based on the discounted cash flows and comparable market values of our single reporting unit. If the fair value of the reporting unit is less than its carrying value, the fair value of the implied goodwill is calculated as the difference between the fair value of our reporting unit and the fair value of the underlying assets and liabilities, excluding goodwill. An impairment charge is recorded for any excess of the carrying value of goodwill over the implied fair value.
We have determined that a single financial reporting unit is appropriate for goodwill impairment testing purposes because while our stores are operated in varying geographies and under different banners, they offer the same general mix of products, have similar pricing strategies and promotional programs resulting in similar economic characteristics. Stores are managed centrally through a consolidated buying, merchandising, operational and financial management organization.
Fair value is determined by using the income approach and market approach. Determining fair value using an income approach requires that we make significant estimates and assumptions, including management’s long-term projections of cash flows, market conditions and appropriate discount rates. Our judgments are based on historical experience, current market trends and other information. In estimating future cash flows, we rely on internally generated forecasts for operating profits and cash flows, including capital expenditures. Changes in estimates of future cash flows caused by items such as unforeseen events or changes in market conditions could negatively affect our reporting unit’s fair value and result in an impairment charge. Factors that could cause us to change our estimates of future cash flows include a deterioration in general economic conditions, successful efforts by our competitors to gain market share in our core markets, an increased competitive environment, our inability to compete effectively with other retailers or our inability to maintain price competitiveness. The rates used to discount projected future cash flows reflect a weighted average cost of capital based on the Company’s industry, capital structure and risk premiums including those reflected in the current market capitalization. The market approach is based upon applying a multiple of earnings based upon publicly traded companies in our industry.
Based on our annual impairment testing completed at the beginning of the third quarter of Fiscal 2010, 2011 and 2012, no impairment of goodwill was indicated. During the fourth quarter of Fiscal 2012, our market capitalization experienced a significant decline. As a result, management believed that there were circumstances
48
evident which indicated that the fair value of our reporting unit could be below its carrying amount and management therefore updated its annual review of goodwill for impairment that had been completed in the third quarter. With the assistance of a third party valuation firm, we completed the first step of the impairment evaluation process in comparing the fair value of our reporting unit to its carrying value. At that time the carrying value exceeded the fair value of our reporting unit and therefore, the Company completed the second step of the impairment evaluation. The second step calculates the implied fair value of the goodwill, which is compared to the carrying value of goodwill. The implied fair value of goodwill is calculated by valuing all of the tangible and intangible assets of the reporting unit at the hypothetical fair value, assuming the reporting unit had been acquired in a business combination. The excess fair value of the entire reporting unit over the fair value of its identifiable assets and liabilities is the implied fair value of the goodwill. Based upon the calculation of the implied fair value of goodwill, it was determined that the carrying value of the goodwill exceeded the implied fair value of goodwill, which resulted in a non-cash, pre-tax impairment charge of $120.8 million ($106.4 million, net of taxes) during the fourth quarter of fiscal 2012.
Impairment of Long-Lived Assets Other Than Goodwill
Long-lived assets are reviewed for potential impairment when events or changes in circumstances indicate that the carrying amount of the assets may not be recoverable. Recoverability of assets to be held and used is measured by comparison of the carrying value of such assets to the undiscounted future cash flows expected to be generated by such assets. If the carrying value of an asset exceeds its estimated undiscounted future cash flows, an impairment provision is recognized to the extent that the carrying amount of the asset exceeds its fair value. We consider factors such as historic or forecasted operating results, trends and future prospects, current market value, significant industry trends and other economic and regulatory factors in performing these analyses. Using different assumptions and definitions could result in a change in our estimates of cash flows and those differences could produce materially different results.
Recent Accounting Pronouncements
In June 2011, the Financial Accounting Standards Board (“FASB”) issued Accounting Standards Update (ASU) No. 2011-05, “Presentation of Comprehensive Income,” its rules regarding the presentation of comprehensive income. The objective of this amendment is to improve the comparability, consistency and transparency of financial reporting and to increase the prominence of items reported in other comprehensive income. Specifically, this amendment requires that all non-owner changes in shareholders’ equity be presented either in a single continuous statement of comprehensive income or in two separate but consecutive statements. The new rules became effective during interim and annual periods beginning after December 15, 2011. Because the standard only affects the presentation of comprehensive income and does not affect what is included in comprehensive income, the standard did not have a material effect on our consolidated financial statements.
In September 2011, the FASB issued ASU No. 2011-08, “Intangibles—Goodwill and Other (Topic 350): Testing Goodwill for Impairment.” ASU No. 2011-08 permits an entity to first assess qualitative factors to determine whether certain events and circumstances exist that indicate it is more likely than not that goodwill is impaired. The more-likely-than-not threshold is defined as having a likelihood of more than 50 percent. If as a result of the qualitative assessment it is determined that is not more likely than not that goodwill is impaired, then the company is not required to take further action and calculate the fair value of a reporting unit. ASU No. 2011-08 was effective for annual and interim goodwill impairment tests performed for fiscal years beginning after December 15, 2011, and was considered but not used during our annual and interim goodwill impairment tests for fiscal 2012.
In July 2012, the FASB issued ASU No. 2012-02, “Intangibles—Goodwill and Other (Topic 350): Testing Indefinite-Lived Intangible Assets for Impairment.” ASU No. 2012-02 essentially expanded the amendment discussed above to apply to the testing of all indefinite-lived intangible assets in order to improve consistency in impairment testing guidance among long-lived asset categories. ASU No. 2012-02 was effective for annual and
49
interim goodwill impairment tests performed for fiscal years beginning after September 15, 2012. Because the standard only impacts our annual and interim impairment tests, we do not anticipate this standard will have an impact on our consolidated financial statements.
In February 2013, the FASB issued ASU No. 2013-02, “Reporting Amounts Reclassified Out of Accumulated Other Comprehensive Income”. ASU No. 2013-02 requires companies to provide additional information about the amounts reclassified out of accumulated other comprehensive income by component. In addition, companies are required to present, either on the face of the financial statements or in the notes, significant amounts reclassified out of accumulated other comprehensive income by the respective line items of net income. The amendments are effective prospectively for reporting periods beginning after December 15, 2012. This ASU does not change the requirements for reporting net income or other comprehensive income. Because the standard only affects the presentation of comprehensive income and does not affect what is included in comprehensive income, we do not anticipate this standard will have a material effect on our consolidated financial statements.
Item 7A—Quantitative and Qualitative Disclosures about Market Risk
The Company is exposed to financial market risks associated with interest rate and commodity prices.
Interest Rate Risk
We have a market risk exposure to changes in interest rates. We manage interest rate risk through the use of fixed- and variable-interest rate debt. The Credit Facilities provide a floor in the rates under which we are charged interest expense. Currently, the LIBOR rate is below the interest rate floor included in the Credit Facilities. Should the LIBOR rate exceed the floor provided in the Credit Facilities agreement, we would be required to make higher interest payments than we are currently making. A one percentage point increase in LIBOR above the 1.25% minimum floor would cause an increase to the interest expense on our borrowings under the Term Facility of approximately $6.7 million. We historically have not engaged in interest rate hedging activities related to our interest rate risk but from time to time may do so in the future.
Commodity Risk
We are subject to volatility in food costs as a result of market risk associated with commodity prices. Although we typically are able to mitigate these cost increases, our ability to continue to do so, either in whole or in part, and may be limited by the competitive environment we operate in. We manage our exposure to this risk primarily through pricing agreements with our vendors.
50
Item 8—FINANCIAL STATEMENTS AND SUPPLEMENTARY DATA
| | | | |
| | | Page
Reference | |
Consolidated Financial Statements | | | | |
Report of Independent Registered Public Accounting Firm | | | 52 | |
| |
Consolidated Statements of Income for the fiscal years ended January 1, 2011, December 31, 2011, and December 29, 2012 | | | 53 | |
| |
Consolidated Statements of Comprehensive Income for the fiscal years ended January 1, 2011, December 31, 2011, and December 29, 2012 | | | 54 | |
| |
Consolidated Balance Sheets as of December 31, 2011 and December 29, 2012 | | | 55 | |
| |
Consolidated Statements of Cash Flows for the fiscal years ended January 1, 2011, December 31, 2011, and December 29, 2012 | | | 56 | |
| |
Consolidated Statements of Shareholders’ Equity for the fiscal years ended January 1, 2011 December 31, 2011, and December 29, 2012 | | | 57 | |
| |
Notes to Consolidated Financial Statements | | | 58 | |
51
REPORT OF INDEPENDENT REGISTERED PUBLIC ACCOUNTING FIRM
The Board of Directors and Shareholders of Roundy’s, Inc.;
We have audited the accompanying consolidated balance sheets of Roundy’s, Inc. as of December 31, 2011 and December 29, 2012, and the related consolidated statements of income, comprehensive income, cash flows, and shareholders’ equity for each of the three years in the period ended December 29, 2012. Our audits also included the financial statement schedule listed in the Index at Item 15. These financial statements and schedule are the responsibility of the Company’s management. Our responsibility is to express an opinion on these financial statements and schedule based on our audits.
We conducted our audits in accordance with the standards of the Public Company Accounting Oversight Board (United States). Those standards require that we plan and perform the audit to obtain reasonable assurance about whether the financial statements are free of material misstatement. We were not engaged to perform an audit of the Company’s internal control over financial reporting. Our audits included consideration of internal control over financial reporting as a basis for designing audit procedures that are appropriate in the circumstances, but not for the purpose of expressing an opinion on the effectiveness of the Company’s internal control over financial reporting. Accordingly, we express no such opinion. An audit also includes examining, on a test basis, evidence supporting the amounts and disclosures in the financial statements, assessing the accounting principles used and significant estimates made by management, and evaluating the overall financial statement presentation. We believe that our audits provide a reasonable basis for our opinion.
In our opinion, the financial statements referred to above present fairly, in all material respects, the consolidated financial position of Roundy’s, Inc. at December 31, 2011 and December 29, 2012, and the consolidated results of its operations and its cash flows for each of the three years in the period ended December 29, 2012, in conformity with U.S. generally accepted accounting principles. Also, in our opinion, the related financial statement schedule, when considered in relation to the basic financial statements as a whole, presents fairly in all material aspects the information set forth herein.
/s/ ERNST & YOUNG LLP
Milwaukee, Wisconsin
March 22, 2013
52
CONSOLIDATED STATEMENTS OF INCOME
(In thousands, except per share amounts)
| | | | | | | | | | | | |
| | | Year Ended | |
| | | January 1,
2011 | | | December 31,
2011 | | | December 29,
2012 | |
Net Sales | | $ | 3,766,988 | | | $ | 3,841,984 | | | $ | 3,890,537 | |
| | | |
Costs and Expenses: | | | | | | | | | | | | |
Cost of sales | | | 2,748,919 | | | | 2,804,709 | | | | 2,855,385 | |
Operating and administrative | | | 868,972 | | | | 886,862 | | | | 908,300 | |
Goodwill impairment charge | | | — | | | | — | | | | 120,800 | |
Interest: | | | | | | | | | | | | |
Interest expense, current and long-term debt, net | | | 64,037 | | | | 68,855 | | | | 48,825 | |
Interest expense, dividends on preferred stock | | | 2,716 | | | | — | | | | — | |
Amortization of deferred financing costs | | | 2,906 | | | | 3,469 | | | | 2,413 | |
Loss on debt extinguishment | | | — | | | | — | | | | 13,304 | |
| | | | | | | | | | | | |
| | | 3,687,550 | | | | 3,763,895 | | | | 3,949,027 | |
| | | | | | | | | | | | |
Income (Loss) before Income Taxes | | | 79,438 | | | | 78,089 | | | | (58,490 | ) |
| | | |
Provision for Income Taxes | | | 33,244 | | | | 30,041 | | | | 10,759 | |
| | | | | | | | | | | | |
| | | |
Net Income (Loss) | | $ | 46,194 | | | $ | 48,048 | | | $ | (69,249 | ) |
| | | | | | | | | | | | |
| | | |
Net earnings (loss) per common share: | | | | | | | | | | | | |
Basic | | $ | 1.01 | | | $ | 1.58 | | | $ | (1.61 | ) |
Diluted | | $ | 1.01 | | | $ | 1.58 | | | $ | (1.61 | ) |
| | | |
Weighted average number of common shares outstanding: | | | | | | | | | | | | |
Basic | | | 27,384 | | | | 27,324 | | | | 43,047 | |
Diluted | | | 30,434 | | | | 30,374 | | | | 43,047 | |
| | | |
Dividends declared per share | | $ | 2.90 | | | $ | — | | | $ | 0.58 | |
See notes to consolidated financial statements.
53
CONSOLIDATED STATEMENTS OF COMPREHENSIVE INCOME
(In thousands)
| | | | | | | | | | | | |
| | | Year Ended | |
| | | January 1, 2011 | | | December 31, 2011 | | | December 29, 2012 | |
Net Income (Loss) | | $ | 46,194 | | | $ | 48,048 | | | $ | (69,249 | ) |
| | | |
Other Comprehensive Loss: | | | | | | | | | | | | |
Employee benefit plans funded status adjustment, net of tax benefit of $1,064 in 2010, $15,262 in 2011, and $971 in 2012 | | | (1,596 | ) | | | (22,886 | ) | | | (1,455 | ) |
| | | | | | | | | | | | |
Comprehensive Income (Loss) | | $ | 44,598 | | | $ | 25,162 | | | $ | (70,704 | ) |
| | | | | | | | | | | | |
See notes to consolidated financial statements.
54
CONSOLIDATED BALANCE SHEETS
(In thousands, except per share data)
| | | | | | | | |
| | | December 31, 2011 | | | December 29, 2012 | |
| Assets | | | | | | | | |
Current Assets: | | | | | | | | |
Cash and cash equivalents | | $ | 87,068 | | | $ | 72,889 | |
Notes and accounts receivable, less allowance for losses of $770 and $792, respectively | | | 32,467 | | | | 33,118 | |
Merchandise inventories | | | 286,537 | | | | 292,673 | |
Prepaid expenses | | | 18,880 | | | | 9,706 | |
Deferred income taxes | | | 6,038 | | | | 5,259 | |
| | | | | | | | |
Total current assets | | | 430,990 | | | | 413,645 | |
| | | | | | | | |
Property and Equipment, net | | | 309,575 | | | | 314,044 | |
| | |
Other Assets: | | | | | | | | |
Other assets—net | | | 45,238 | | | | 46,410 | |
Goodwill | | | 726,879 | | | | 605,986 | |
| | | | | | | | |
Total other assets | | | 772,117 | | | | 652,396 | |
| | | | | | | | |
Total assets | | $ | 1,512,682 | | | $ | 1,380,085 | |
| | | | | | | | |
| | |
| Liabilities and Shareholders’ Equity | | | | | | | | |
Current Liabilities: | | | | | | | | |
Accounts payable | | $ | 245,216 | | | $ | 240,392 | |
Accrued wages and benefits | | | 48,876 | | | | 39,540 | |
Other accrued expenses | | | 42,089 | | | | 40,594 | |
Current maturities of long-term debt and capital lease obligations | | | 10,789 | | | | 10,918 | |
Income taxes payable | | | 4,265 | | | | 2,292 | |
| | | | | | | | |
Total current liabilities | | | 351,235 | | | | 333,736 | |
| | | | | | | | |
Long-term Debt and Capital Lease Obligations | | | 809,352 | | | | 685,644 | |
Deferred Income Taxes | | | 66,438 | | | | 59,112 | |
Other Liabilities | | | 108,482 | | | | 108,327 | |
| | | | | | | | |
Total liabilities | | | 1,335,507 | | | | 1,186,819 | |
| | | | | | | | |
Commitments and Contingencies | | | | | | | | |
| | |
Shareholders’ Equity: | | | | | | | | |
Preferred stock (20 shares and 5,000 shares authorized at 12/31/11 and 12/29/12, respectively, $0.01 par value, 10 shares and 0 shares at 12/31/11 and 12/29/12, respectively, issued and outstanding) | | | 1,044 | | | | — | |
Common stock (150,000 shares authorized, $0.01 par value, 27,072 shares and 45,654 shares at 12/31/11 and 12/29/12, respectively, issued and outstanding) | | | 271 | | | | 457 | |
Additional paid-in capital | | | — | | | | 114,120 | |
Retained earnings | | | 221,365 | | | | 125,649 | |
Accumulated other comprehensive loss | | | (45,505 | ) | | | (46,960 | ) |
| | | | | | | | |
Total shareholders’ equity | | | 177,175 | | | | 193,266 | |
| | | | | | | | |
Total liabilities and shareholders’ equity | | $ | 1,512,682 | | | $ | 1,380,085 | |
| | | | | | | | |
See notes to consolidated financial statements.
55
CONSOLIDATED STATEMENTS OF CASH FLOWS
(In thousands)
| | | | | | | | | | | | |
| | | Year Ended | |
| | | January 1,
2011 | | | December 31,
2011 | | | December 29,
2012 | |
Cash Flows From Operating Activities: | | | | | | | | | | | | |
Net income (loss) | | $ | 46,194 | | | $ | 48,048 | | | $ | (69,249 | ) |
Adjustments to reconcile net income (loss) to net cash flows provided by operating activities: | | | | | | | | | | | | |
Goodwill impairment charge | | | — | | | | — | | | | 120,800 | |
Depreciation and amortization, including deferred financing costs | | | 75,237 | | | | 72,949 | | | | 68,549 | |
Gain on sale of property and equipment and other assets | | | (415 | ) | | | (542 | ) | | | (438 | ) |
LIFO charges | | | 1,665 | | | | 4,262 | | | | 1,343 | |
Deferred income taxes | | | 12,301 | | | | 18,030 | | | | (5,659 | ) |
Interest earned on shareholder notes receivable | | | (218 | ) | | | (187 | ) | | | — | |
Deferred dividends on preferred stock | | | 2,716 | | | | — | | | | — | |
Loss on debt extinguishment | | | — | | | | — | | | | 13,304 | |
Amortization of debt discount | | | 353 | | | | 500 | | | | 1,381 | |
Stock-based compensation expense | | | — | | | | — | | | | 1,431 | |
Forgiveness of shareholder notes receivable | | | — | | | | 75 | | | | — | |
Changes in operating assets and liabilities, net of the effect of business acquisitions: | | | | | | | | | | | | |
Notes and accounts receivable | | | (5,102 | ) | | | 4,609 | | | | (651 | ) |
Merchandise inventories | | | (9,828 | ) | | | (32,565 | ) | | | (7,479 | ) |
Prepaid expenses | | | (573 | ) | | | (2,061 | ) | | | 9,174 | |
Other assets | | | 195 | | | | 532 | | | | 329 | |
Accounts payable | | | (74,236 | ) | | | 79,744 | | | | (4,824 | ) |
Accrued expenses and other liabilities | | | (11,185 | ) | | | (19,725 | ) | | | (21,458 | ) |
Income taxes | | | 3,529 | | | | 8,348 | | | | (819 | ) |
| | | | | | | | | | | | |
Net cash flows provided by operating activities | | | 40,633 | | | | 182,017 | | | | 105,734 | |
| | | | | | | | | | | | |
| | | |
Cash Flows From Investing Activities: | | | | | | | | | | | | |
Capital expenditures | | | (62,932 | ) | | | (66,497 | ) | | | (62,004 | ) |
Proceeds from sale of property and equipment and other assets | | | 5,899 | | | | 629 | | | | 450 | |
Payment for business acquisitions, net of cash acquired | | | (721 | ) | | | — | | | | — | |
| | | | | | | | | | | | |
Net cash flows used in investing activities | | | (57,754 | ) | | | (65,868 | ) | | | (61,554 | ) |
| | | | | | | | | | | | |
| | | |
Cash Flows From Financing Activities: | | | | | | | | | | | | |
Dividends and liquidation value of preferred stock paid to preferred shareholders | | | (70,828 | ) | | | — | | | | — | |
Dividends paid to common shareholders | | | (77,006 | ) | | | — | | | | (25,998 | ) |
Borrowings on revolving credit facility | | | 12,400 | | | | — | | | | 117,500 | |
Payments made on revolving credit facility | | | (12,400 | ) | | | — | | | | (117,500 | ) |
Proceeds from long-term borrowings | | | 147,000 | | | | — | | | | 664,875 | |
Payments of debt and capital lease obligations | | | (10,631 | ) | | | (64,367 | ) | | | (791,610 | ) |
Purchase of common stock | | | (2,156 | ) | | | (439 | ) | | | — | |
Issuance of common stock, net of issuance costs | | | 65 | | | | — | | | | 112,540 | |
Repayment of shareholder notes receivable | | | 72 | | | | — | | | | — | |
Payment of equity issuance costs in advance of stock issuance | | | — | | | | (710 | ) | | | — | |
Debt issuance and refinancing fees and related expenses | | | — | | | | — | | | | (18,166 | ) |
Credit agreement amendment fees and expenses | | | (7,881 | ) | | | — | | | | — | |
| | | | | | | | | | | | |
Net cash flows used in financing activities | | | (21,365 | ) | | | (65,516 | ) | | | (58,359 | ) |
| | | | | | | | | | | | |
Net (Decrease) Increase in Cash and Cash Equivalents | | | (38,486 | ) | | | 50,633 | | | | (14,179 | ) |
| | | |
Cash and Cash Equivalents, Beginning of Year | | | 74,921 | | | | 36,435 | | | | 87,068 | |
| | | | | | | | | | | | |
Cash and Cash Equivalents, End of Year | | $ | 36,435 | | | $ | 87,068 | | | $ | 72,889 | |
| | | | | | | | | | | | |
| | | |
Supplemental Cash Flow Information: | | | | | | | | | | | | |
Cash paid for interest | | $ | 60,817 | | | $ | 71,122 | | | $ | 53,484 | |
Cash paid for income taxes | | | 15,131 | | | | 3,663 | | | | 17,237 | |
Shareholder notes cancelled in exchange for common stock | | | — | | | | 4,203 | | | | — | |
Dividends utilized for repayment of shareholder notes receivable | | | 2,165 | | | | — | | | | — | |
See notes to consolidated financial statements.
56
CONSOLIDATED STATEMENTS OF SHAREHOLDERS’ EQUITY
(In thousands)
| | | | | | | | | | | | | | | | | | | | | | | | | | | | | | | | | | | | |
| | | Preferred Stock | | | Common Stock | | | Additional
Paid-in
Capital | | | Retained
Earnings | | | Shareholder
Notes
Receivable | | | Accumulated
Other
Comprehensive
Loss | | | Total
Shareholders’
Equity | |
| | | Shares | | | Amount | | | Shares | | | Amount | | | | | | |
Balance, January 2, 2010 | | | — | | | $ | — | | | | 27,491 | | | $ | 275 | | | $ | 5,654 | | | $ | 207,369 | | | $ | (6,110 | ) | | $ | (21,023 | ) | | $ | 186,165 | |
| | | | | | | | | |
Net income | | | — | | | | — | | | | — | | | | — | | | | — | | | | 46,194 | | | | — | | | | — | | | | 46,194 | |
Reclassification of preferred stock | | | 10 | | | | 1,044 | | | | — | | | | — | | | | — | | | | — | | | | — | | | | — | | | | 1,044 | |
Common stock dividends | | | — | | | | — | | | | — | | | | — | | | | — | | | | (79,171 | ) | | | — | | | | — | | | | (79,171 | ) |
Purchase of common stock | | | — | | | | — | | | | (150 | ) | | | (2 | ) | | | (2,154 | ) | | | — | | | | 72 | | | | — | | | | (2,084 | ) |
Issuance of common stock | | | — | | | | — | | | | 4 | | | | — | | | | 65 | | | | — | | | | — | | | | — | | | | 65 | |
Repayment of shareholder notes receivable and interest | | | — | | | | — | | | | — | | | | — | | | | — | | | | — | | | | 2,165 | | | | — | | | | 2,165 | |
Interest on shareholder notes receivable | | | — | | | | — | | | | — | | | | — | | | | — | | | | — | | | | (218 | ) | | | — | | | | (218 | ) |
Employee benefit plans, net of ($1,064) tax | | | — | | | | — | | | | — | | | | — | | | | — | | | | — | | | | — | | | | (1,596 | ) | | | (1,596 | ) |
| | | | | | | | | | | | | | | | | | | | | | | | | | | | | | | | | | | | |
| | | | | | | | | |
Balance, January 1, 2011 | | | 10 | | | $ | 1,044 | | | | 27,345 | | | $ | 273 | | | $ | 3,565 | | | $ | 174,392 | | | $ | (4,091 | ) | | $ | (22,619 | ) | | $ | 152,564 | |
| | | | | | | | | |
Net income | | | — | | | | — | | | | — | | | | — | | | | — | | | | 48,048 | | | | — | | | | — | | | | 48,048 | |
Purchase of common stock | | | — | | | | — | | | | (26 | ) | | | — | | | | — | | | | (439 | ) | | | — | | | | — | | | | (439 | ) |
Interest on shareholder notes receivable | | | — | | | | — | | | | — | | | | — | | | | — | | | | — | | | | (187 | ) | | | — | | | | (187 | ) |
Cancellation of shareholder notes receivable and accrued interest in exchange for common stock | | | — | | | | — | | | | (247 | ) | | | (2 | ) | | | (3,565 | ) | | | (636 | ) | | | 4,278 | | | | — | | | | 75 | |
Employee benefit plans, net of ($15,262) tax | | | — | | | | — | | | | — | | | | — | | | | — | | | | — | | | | — | | | | (22,886 | ) | | | (22,886 | ) |
| | | | | | | | | | | | | | | | | | | | | | | | | | | | | | | | | | | | |
| | | | | | | | | |
Balance, December 31, 2011 | | | 10 | | | $ | 1,044 | | | | 27,072 | | | $ | 271 | | | $ | — | | | $ | 221,365 | | | $ | — | | | $ | (45,505 | ) | | $ | 177,175 | |
| | | | | | | | | |
Net loss | | | — | | | | — | | | | — | | | | — | | | | — | | | | (69,249 | ) | | | — | | | | — | | | | (69,249 | ) |
Conversion of preferred stock to common stock | | | (10 | ) | | | (1,044 | ) | | | 3,050 | | | | 31 | | | | 1,013 | | | | — | | | | — | | | | — | | | | — | |
Issuance of common stock, net of issuance costs | | | — | | | | — | | | | 14,706 | | | | 147 | | | | 111,684 | | | | — | | | | — | | | | — | | | | 111,831 | |
Restricted stock grants | | | — | | | | — | | | | 830 | | | | 8 | | | | 1,423 | | | | — | | | | — | | | | — | | | | 1,431 | |
Rounding of partial shares held prior to stock split | | | — | | | | — | | | | (4 | ) | | | — | | | | — | | | | — | | | | — | | | | — | | | | — | |
Common stock dividends | | | — | | | | — | | | | — | | | | — | | | | — | | | | (26,467 | ) | | | — | | | | — | | | | (26,467 | ) |
Employee benefit plans, net of ($971) tax | | | — | | | | — | | | | — | | | | — | | | | — | | | | — | | | | — | | | | (1,455 | ) | | | (1,455 | ) |
| | | | | | | | | | | | | | | | | | | | | | | | | | | | | | | | | | | | |
Balance, December 29, 2012 | | | — | | | $ | — | | | | 45,654 | | | $ | 457 | | | $ | 114,120 | | | $ | 125,649 | | | $ | — | | | $ | (46,960 | ) | | $ | 193,266 | |
| | | | | | | | | | | | | | | | | | | | | | | | | | | | | | | | | | | | |
See notes to consolidated financial statements.
57
ROUNDY’S, INC.
NOTES TO CONSOLIDATED FINANCIAL STATEMENTS
FOR THE YEARS ENDED JANUARY 1, 2011, DECEMBER 31, 2011 AND DECEMBER 29, 2012
1. ORGANIZATION
Roundy’s, Inc. (“Roundy’s” or the “Company”) is a corporation formed in 2010 for the purpose of owning and operating Roundy’s Acquisition Corp. (“RAC”), and its 100% owned subsidiary, Roundy’s Supermarkets, Inc. (“RSI”).
Roundy’s is a leading food retailer in the state of Wisconsin. As of December 29, 2012, Roundy’s owned and operated 161 retail grocery stores, of which 121 are located in Wisconsin, 32 are located in Minnesota and 8 are located in Illinois. Roundy’s also distributes a full line of food and non-food products from three wholesale distribution centers and provides services to one independent licensee retail grocery store in Wisconsin.
Initial Public Offering—On February 7, 2012, Roundy’s priced the initial public offering (the “IPO”) of its common stock which began trading on the New York Stock Exchange on February 8, 2012. On February 13, 2012, Roundy’s completed the offering of 22,059,091 shares of its common stock at a price of $8.50 per share, which included 14,705,883 shares sold by Roundy’s and 7,353,208 shares sold by existing shareholders. Roundy’s received approximately $125.0 million in gross proceeds from the IPO, or approximately $111.8 million in net proceeds after deducting the underwriting discount and expenses related to the offering. The net proceeds of the IPO were used to pay down RSI’s existing debt (see the Long-Term Debt footnote below).
A summary of our capitalization upon closing of the IPO is as follows (in thousands):
| | | | |
Common stock issued and outstanding at December 31, 2011 | | | 27,072 | |
Conversion of preferred stock into common stock prior to IPO | | | 3,050 | |
Rounding of partial shares held prior to stock split | | | (4 | ) |
Sale of common stock through IPO | | | 14,706 | |
| | | | |
Common stock issued and outstanding at IPO, February 7, 2012 | | | 44,824 | |
| | | | |
On January 24, 2012, the Board of Directors approved an amendment to the articles of incorporation to increase the number of shares we are authorized to issue to 150,000,000 shares of common stock and 5,000,000 shares of preferred stock, and to convert all of our outstanding preferred stock into shares of common stock on a one-for-one basis. Subsequent to the preferred stock conversion, the Board of Directors approved an approximately 292.2-for-one stock split on all common shares outstanding as of that date. In accordance with applicable accounting rules, we have restated all of the historical common share and per share amounts for the periods presented to give retroactive effect to this 292.2-for-one common stock split but have not given retroactive effect to the conversion of preferred stock into common stock. Therefore, the 10,439 shares of outstanding preferred stock at December 31, 2011 are reflected as having been converted and then subsequently split in January 2012.
2. Roundy’s/RAC Merger
On April 15, 2010, Roundy’s and RAC were parties to a merger accomplished pursuant to Section 251(g) of the Delaware General Corporation Law (the “Holding Company Merger”) whereby each outstanding share of capital stock of RAC was converted into one share of Roundy’s stock, having the same rights, preferences and privileges as the shares of RAC from which they were converted. This transaction was a reorganization and there was no change in control as a result of these actions. Accordingly, all periods are presented as if Roundy’s was in existence as of the first period presented.
58
3. BASIS OF PRESENTATION AND SUMMARY OF SIGNIFICANT ACCOUNTING POLICIES
Principles of Consolidation—The accompanying consolidated financial statements include the accounts of Roundy’s and its subsidiaries, all of which are wholly owned. All significant intercompany accounts and transactions have been eliminated in consolidation. Unless otherwise indicated, all references in these consolidated financial statements to “the Company”, “we,” “us” or “our” or similar words are to Roundy’s, Inc. and its subsidiaries.
Fiscal Year—Our fiscal year is the 52 or 53 week period ending on the Saturday nearest to December 31. The years ended January 1, 2011 (“Fiscal 2010”), December 31, 2011 (“Fiscal 2011”) and December 29, 2012 (“Fiscal 2012”) included 52 weeks.
Use of Estimates—The preparation of financial statements in conformity with U.S. generally accepted accounting principles (“U.S. GAAP”) requires management to make estimates and assumptions that affect the reported amounts of assets and liabilities, disclosure of contingent assets and liabilities at the date of the consolidated financial statements, and the reported amounts of revenues and expenses during the reporting period. Management reviews its estimates on an ongoing basis, including those related to allowances for doubtful accounts and notes receivable, valuation of inventories, self-insurance reserves, closed facilities reserves, purchase accounting estimates, useful lives for depreciation and amortization of property and equipment, and litigation based on currently available information. Changes in facts and circumstances may result in revised estimates and actual results could differ from those estimates.
Revenue Recognition—Retail revenues are recognized at the point of sale. Discounts provided to customers by the Company at the time of sale, including those provided in connection with loyalty cards, are recognized as a reduction of sales as the products are sold. Discounts provided by vendors, usually in the form of paper coupons, are not recognized as a reduction in sales provided the coupons are redeemable at any retailer that accepts coupons. The Company records a receivable from the vendor for the difference in sales price and payment received from the customer. Sales taxes are not recorded as a component of retail revenues as we consider ourselves a pass-through conduit for collecting and remitting sales taxes.
We record deferred revenue when we sell Roundy’s gift cards. A sale is then recognized when the gift card is redeemed to purchase our product. Gift card breakage is recognized when redemption is deemed remote. The amount of breakage has not been material in Fiscal 2010, Fiscal 2011, or Fiscal 2012.
Independent distribution revenues are recognized, net of any estimated returns and allowances, when product is shipped, collectability is reasonably assured, and title has passed.
Cost of Sales—Cost of sales includes product costs, inbound freight, warehousing costs, receiving and inspection costs, distribution costs, and depreciation and amortization expenses associated with our supply chain operations.
Purchases of product at discounted costs are recorded in inventory at the discounted cost until sold. Volume and other program allowances are accrued as a receivable when it is reasonably assured they will be earned and reduce the cost of the related inventory for product on hand or cost of sales for product already sold. Vendor allowances received to fund advertising and certain other expenses are recorded as a reduction of our expense for such related advertising or other expense if such vendor allowances reimburse us for specific, identifiable and incremental costs we incur in selling the vendor’s product. Any excess reimbursement over our cost is classified as a reduction to cost of sales.
Vendor allowances for volume and other program allowances and allowances to fund advertising related expenses totaled $129.7 million, $127.7 million and $125.7 million for Fiscal 2010, Fiscal 2011, and Fiscal 2012, respectively.
59
Operating and Administrative Expenses—Operating and administrative expenses consist primarily of personnel costs, sales and marketing expenses, depreciation and amortization expenses and other expenses associated with facilities unrelated to our supply chain operations, internal management expenses and expenses for finance, legal, business development, human resources, purchasing and other administrative departments. Pre-opening costs associated with opening new and remodeled stores are expensed as incurred. We expense advertising costs as incurred. Advertising expenses totaled $32.2 million, $31.2 million and $28.4 million for Fiscal 2010, Fiscal 2011 and Fiscal 2012, respectively.
Interest Expense—Interest expense includes interest on our outstanding indebtedness (and dividends on our preferred stock in Fiscal 2010) and is net of interest income earned on invested cash and shareholder notes receivable.
Income Taxes—The provision for federal income tax is computed based upon our consolidated tax return. The provision for state income tax is computed based upon the tax returns we file in the appropriate tax jurisdictions. We provide for income taxes in accordance with Accounting Standards Codification (“ASC”) 740 “Income Taxes,” which requires an asset and liability approach to financial accounting and reporting for income taxes. Deferred income tax assets and liabilities are computed for differences between the financial statement and tax bases of assets and liabilities that will result in taxable or deductible amounts in the future based on enacted tax laws and rates applicable to the periods in which the differences are expected to affect taxable income. We periodically review tax positions taken or expected to be taken, and income tax benefits are recognized for those positions for which it is more likely than not will be upheld upon examination by taxing authorities. We recognize the settlement of certain tax positions based upon criteria under which a position may be determined to be effectively settled.
Comprehensive Income (Loss)—Comprehensive income (loss) refers to revenues, expenses, gains and losses that are not included in net income (loss) but rather are recorded directly in shareholders’ equity in the consolidated statements of shareholders’ equity. The Company’s other comprehensive income (loss) is comprised solely of the adjustments for pension liabilities.
Fair Value of Financial Instruments—ASC 820, “Fair Value Measurements and Disclosures,” (“ASC 820”) defines fair value, establishes a framework for measuring fair value and requires additional disclosures about fair value measurements. ASC 820 prioritizes the inputs to valuation techniques used to measure fair value into the following hierarchy:
| | • | | Level 1: Observable inputs that reflect unadjusted quoted prices for identical assets or liabilities traded in active markets. |
| | • | | Level 2: Inputs other than quoted prices included within Level 1 that are observable for the asset or liability, either directly or indirectly. |
| | • | | Level 3: Unobservable inputs where there is little or no market data, which requires the reporting entity to develop its own assumptions. |
Financial instruments consist of cash and cash equivalents, accounts and notes receivable, accounts payable and long-term debt. The carrying amounts of cash and cash equivalents, notes and accounts receivable and accounts payable approximated fair value at December 31, 2011 and December 29, 2012 due to the short-term nature of these financial instruments. Based on estimated market rents for those leased properties which are recorded as capital leases, the fair value of our capital lease obligations is approximately $24.4 million and $22.4 million, as of December 31, 2011 and December 29, 2012, respectively. Based on recent open market transactions of our term loan, the fair value of long-term debt, including current maturities, is approximately $817.0 million and $673.6 million as of December 31, 2011 and December 29, 2012, respectively. We consider the fair value of the capital leases and term loan to be Level 2.
60
The determination of fair value of certain tangible and intangible assets for purposes of our goodwill impairment evaluation as discussed below was based upon Level 3 inputs.
Cash Equivalents—We consider all highly liquid investments with maturities of three months or less when acquired to be cash equivalents. Accounts payable includes $48.1 million and $47.3 million at December 31, 2011 and December 29, 2012, respectively, of checks written in excess of related bank balances but not yet presented to our bank for collection.
Accounts Receivable—We are exposed to credit risk with respect to accounts receivable. We continually monitor our receivables with vendors and customers by evaluating the collectability of accounts receivable based on a combination of factors, namely aging and historical trends. An allowance for doubtful accounts is recorded based on the likelihood of collection based on management’s review of the facts. Accounts receivable are written off after all collection efforts have been exhausted.
Inventories—Inventories are recorded at the lower of cost or market. Substantially all of our inventories consist of finished goods. Cost is calculated on a first-in-first-out (“FIFO”) and last-in-first-out (“LIFO”) basis for approximately 63% and 37%, and 64% and 36%, of our inventories at December 31, 2011 and December 29, 2012, respectively. If the FIFO method was used to calculate the cost for our entire inventory, inventories would have been approximately $22.1 million and $23.5 million greater at December 31, 2011 and December 29, 2012, respectively.
Additionally, cost of sales would have been approximately $0.1 million greater during both Fiscal 2010 and Fiscal 2011 and $0.3 million greater during Fiscal 2012, respectively, had the Company not experienced a reduction in inventory quantities that are valued under the LIFO method.
Cost is determined using the retail inventory method for all retail inventories, which totals approximately 67% and 72% of total inventories at December 31, 2011 and December 29, 2012, respectively. Cost for our supply chain inventory is determined based on the weighted average costing method and such inventory totals 33% and 28% of total inventories at December 31, 2011 and December 29, 2012, respectively.
We record an inventory shrink adjustment based on a physical count and also provide an estimated inventory shrink adjustment for the period between the last physical inventory count and each balance sheet date. We perform physical counts of perishable store inventories approximately every month and nonperishable store inventories at least twice per year. The adjustments resulting from the physical inventory counts have been consistent with the inventory shrink estimates provided for in the consolidated financial statements.
Property and Equipment—Property and equipment are stated at cost and are depreciated by the straight-line method for financial reporting purposes and by use of accelerated methods for income tax purposes. Depreciation and amortization of property and equipment are expensed over their estimated useful lives, which are generally 39 years for buildings and three to ten years for equipment. Leasehold improvements and property under capital leases are amortized over the lesser of the useful life of the asset or the term of the lease. Terms of leases used in the determination of estimated useful lives may include renewal periods at our discretion when penalty for a failure to renew is so significant that exercise of the option is determined to be reasonably assured at the inception of the lease.
Leases—We categorize leases at inception as either operating leases or capital leases. We record rent liabilities for contingent percentage of sales lease provisions when we determine that it is probable that the specified levels will be reached as defined by the lease. Lease expense for operating leases with increasing rate rents is recognized on a straight-line basis over the term of the lease.
Deferred Financing Costs—Deferred financing costs are amortized over the life of the related debt using the effective interest rate method.
61
Long-Lived Assets—Long-lived assets are reviewed for potential impairment when events or changes in circumstances indicate that the carrying amount of the asset may not be recoverable. Recoverability of assets to be held and used is measured by comparison of the carrying value of such assets to the undiscounted future cash flows expected to be generated by the assets. If the carrying value of an asset exceeds its estimated undiscounted future cash flows, an impairment provision is recognized to the extent that the carrying amount of the asset exceeds its fair value. We consider factors such as current results, trends and future prospects, current market value, and other economic and regulatory factors in performing these analyses. The Company determined that no long-lived assets were impaired as of Fiscal 2010, Fiscal 2011 and Fiscal 2012, other than goodwill as described below.
Customer Lists—Customer lists, which represent prescription files from acquired pharmacies, are amortized over the estimated payback period on acquisition of the files and subject to review for potential impairment when events or changes in circumstances indicate the carrying amount may not be recoverable.
Goodwill—Goodwill represents the excess of cost over the fair value of net assets of businesses acquired. The carrying value of goodwill is evaluated for impairment annually on the first day of the third quarter or whenever events occur or circumstances change that would more likely than not reduce the fair value of our reporting unit below its carrying amount.
We have determined that the Company has one financial reporting unit.
We have determined that a single financial reporting unit is appropriate for goodwill impairment testing purposes because while our stores are operated in varying geographies and under different banners, they offer the same general mix of products, have similar pricing strategies and promotional programs resulting in similar economic characteristics. Stores are managed centrally through a consolidated buying, merchandising, operational and financial management organization.
The fair value of our financial reporting unit is determined by using an income approach based on the discounted cash flows of the reporting unit and a market approach based on comparable market values of the reporting unit. Projected future cash flows are based on management’s knowledge of the current operating environment and expectations for the future. If the fair value of the reporting unit is less than its carrying amount, the fair value of the implied goodwill is calculated as the difference between the fair value of the reporting unit and the fair value of the underlying assets and liabilities, excluding goodwill. An impairment charge is recorded for any excess of the carrying amount of goodwill over the implied fair value.
We completed our annual impairment reviews for Fiscal 2010, Fiscal 2011 and Fiscal 2012 and concluded there was no impairment of goodwill. During the fourth quarter of fiscal 2012, our market capitalization experienced a significant decline. As a result, management believed that there were circumstances evident which indicated that the fair value of our reporting unit could be below its carrying amount and management therefore updated its annual review of goodwill for impairment that had been completed in the third quarter. With the assistance of a third party valuation firm, we completed the first step of the impairment evaluation process in comparing the fair value of our reporting unit to its carrying value. At that time the carrying value exceeded the fair value of our reporting unit and therefore, the Company completed the second step of the impairment evaluation. The second step calculates the implied fair value of the goodwill, which is compared to the carrying value of goodwill. The implied fair value of goodwill is calculated by valuing all of the tangible and intangible assets of the reporting unit at the hypothetical fair value, assuming the reporting unit had been acquired in a business combination. The excess fair value of the entire reporting unit over the fair value of its identifiable assets and liabilities is the implied fair value of the goodwill. Based upon the calculation of the implied fair value of goodwill, it was determined that the carrying value of the goodwill exceeded the implied fair value of goodwill, which resulted in a non-cash, pre-tax impairment charge of $120.8 million ($106.4 million, net of taxes) during the fourth quarter of 2012.
62
The testing for impairment of goodwill requires the extensive use of management judgment and financial estimates including weighted average cost of capital, future revenue, profitability, cash flows and fair values of assets and liabilities.
The change in the net carrying amount of goodwill consisted of the following (in thousands):
| | | | | | | | |
| | | Year Ended | |
| | | December 31,
2011 | | | December 29,
2012 | |
Balance at beginning of year | | $ | 727,065 | | | $ | 726,879 | |
Impairment charge | | | — | | | | (120,800 | ) |
Adjustment to acquisition liabilities, net of tax | | | (186 | ) | | | (93 | ) |
| | | | | | | | |
Balance at end of year | | $ | 726,879 | | | $ | 605,986 | |
| | | | | | | | |
The adjustment to acquisition liabilities relates to closed facility reserves that were established during purchase accounting from prior acquisitions. This adjustment represents the reduction in reserve from our original estimate at the time the facilities were acquired. As these reserves were recognized in accordance with EITF 95-3, “Recognition of Liabilities in Connection with a Purchase Business Combination,” any subsequent adjustments are recognized as an adjustment to goodwill.
Trademarks—Trademarks, which have indefinite lives, are not amortized but are evaluated annually for impairment. The review consists of comparing the estimated fair value to the carrying value. Fair value of the Company’s trade names is determined primarily by discounting an assumed royalty value applied to managements’ estimate of projected future revenues associated with the trade name. The royalty cash flows are discounted using rates based on the weighted average cost of capital. There was no impairment in Fiscal 2010, Fiscal 2011, or Fiscal 2012.
Self-Insurance—We are primarily self-insured for potential liabilities for workers’ compensation, general liability and employee health care benefits. It is our policy to record the liability based on claims filed and a consideration of historical claims experience, demographic factors and other actuarial assumptions for those claims incurred but not yet reported. Any projection of losses concerning these claims is subject to a considerable degree of variability. Among the causes of this variability are unpredictable external factors affecting future inflation rates, litigation trends, legal interpretations, benefit level changes and claim settlement patterns. A summary of the changes in our self-insurance liability is as follows (in thousands):
| | | | | | | | | | | | |
| | | Year Ended | |
| | | January 1,
2011 | | | December 31,
2011 | | | December 29,
2012 | |
Balance at beginning of year | | $ | 32,900 | | | $ | 32,143 | | | $ | 30,334 | |
Claim payments | | | (77,192 | ) | | | (79,738 | ) | | | (76,867 | ) |
Reserve accruals | | | 76,435 | | | | 77,929 | | | | 78,054 | |
| | | | | | | | | | | | |
Balance at end of year | | $ | 32,143 | | | $ | 30,334 | | | $ | 31,521 | |
| | | | | | | | | | | | |
Closed Facilities Reserve—When a facility is closed, the remaining net book value of the property, net of expected salvage value, is charged to operations. For properties under lease agreements, the present value of any remaining future liability under the lease, net of estimated sublease income, is expensed at the time the use of the property is discontinued and is classified as operating and administrative expense. The liabilities for leases of closed facilities are paid over the remaining lease term. Adjustments to closed facility reserves primarily relate to changes in subtenant income or actual costs differing from original estimates, and are recognized in the period in which the adjustments become known.
63
The following table provides the activity in the liability for closed stores (in thousands):
| | | | | | | | |
| | | Year Ended | |
| | | December 31,
2011 | | | December 29,
2012 | |
Balance at beginning of year | | $ | 15,336 | | | $ | 14,909 | |
Charges for closed stores | | | 4,607 | | | | 445 | |
Payments | | | (4,724 | ) | | | (6,506 | ) |
Adjustments | | | (310 | ) | | | (212 | ) |
| | | | | | | | |
Balance at end of year | | $ | 14,909 | | | $ | 8,636 | |
| | | | | | | | |
Concentrations of Risk—Certain of our employees are covered by collective bargaining agreements. We currently participate in 44 union contracts covering approximately 52% of our employees. Of these contracts, none were expired as of December 29, 2012 and 13 expire in 2013, of which one has been subsequently ratified. In the aggregate, contracts expired or expiring in 2013 cover approximately 19% of our employees. The remaining 31 contracts expire in 2014 through 2016. We believe that our relationships with our employees are good; therefore, we do not anticipate significant difficulty in renegotiating these contracts.
Stock-based Compensation—The Company accounts for stock-based compensation to employees and directors based on the fair value on the date of the grant. Stock-based compensation expense is recognized over the requisite service period of the award, net of an estimated forfeiture rate.
Reclassifications—Payments and borrowings related to our revolving credit facility were previously reported on a net basis and are now presented on a gross basis.
4. RECENTLY ISSUED ACCOUNTING PRONOUNCEMENTS
In June 2011, the Financial Accounting Standards Board (“FASB”) issued Accounting Standards Update (“ASU”) No. 2011-05, “Presentation of Comprehensive Income,”, which amended the rules regarding the presentation of comprehensive income. The objective of this amendment is to improve the comparability, consistency and transparency of financial reporting and to increase the prominence of items reported in other comprehensive income. Specifically, this amendment requires that all non-owner changes in shareholders’ equity be presented either in a single continuous statement of comprehensive income or in two separate but consecutive statements. The new rules became effective during interim and annual periods beginning after December 15, 2011. Because the standard only affects the presentation of comprehensive income and does not affect what is included in comprehensive income, the standard did not have a material effect on the Company’s consolidated financial statements.
In September 2011, the FASB issued ASU No. 2011-08, “Intangibles—Goodwill and Other (Topic 350): Testing Goodwill for Impairment.” ASU No. 2011-08 permits an entity to first assess qualitative factors to determine whether certain events and circumstances exist that indicate it is more likely than not that goodwill is impaired. The more-likely-than-not threshold is defined as having a likelihood of more than 50 percent. If as a result of the qualitative assessment it is determined that is not more likely than not that goodwill is impaired, then the company is not required to take further action and calculate the fair value of a reporting unit. ASU No. 2011-08 was effective for annual and interim goodwill impairment tests performed for fiscal years beginning after December 15, 2011, and was considered but not used during our annual and interim goodwill impairment tests for fiscal 2012.
In July 2012, the FASB issued ASU No. 2012-02, “Intangibles—Goodwill and Other (Topic 350): Testing Indefinite-Lived Intangible Assets for Impairment.” ASU No. 2012-02 essentially expanded the amendment discussed above to apply to the testing of all indefinite-lived intangible assets in order to improve consistency in impairment testing guidance among long-lived asset categories. ASU No. 2012-02 was effective for annual and
64
interim goodwill impairment tests performed for fiscal years beginning after September 15, 2012. Because the standard only impacts our annual and any interim impairment tests, we do not anticipate this standard will have an impact on the Company’s consolidated financial statements.
In February 2013, the FASB issued ASU No. 2013-02, “Reporting Amounts Reclassified Out of Accumulated Other Comprehensive Income,”. ASU No. 2013-02 requires companies to provide additional information about the amounts reclassified out of accumulated other comprehensive income by component. In addition, companies are required to present, either on the face of the financial statements or in the notes, significant amounts reclassified out of accumulated other comprehensive income by the respective line items of net income. The amendments are effective prospectively for reporting periods beginning after December 15, 2012. This ASU does not change the requirements for reporting net income or other comprehensive income. Because the standard only affects the presentation of comprehensive income and does not affect what is included in comprehensive income, we do not anticipate this standard will have a material effect on our consolidated financial statements.
5. PROPERTY AND EQUIPMENT AND OTHER ASSETS
Property and equipment, which are recorded at cost, consisted of the following (in thousands):
| | | | | | | | |
| | | December 31,
2011 | | | December 29,
2012 | |
Land | | $ | 7,392 | | | $ | 7,722 | |
Buildings | | | 23,920 | | | | 29,867 | |
Equipment | | | 582,125 | | | | 625,965 | |
Property under capital leases | | | 47,041 | | | | 45,684 | |
Leasehold improvements | | | 165,896 | | | | 175,715 | |
| | | | | | | | |
| | | 826,374 | | | | 884,953 | |
Less accumulated depreciation and amortization | | | 516,799 | | | | 570,909 | |
| | | | | | | | |
Property and equipment, net | | $ | 309,575 | | | $ | 314,044 | |
| | | | | | | | |
Depreciation expense for property and equipment, including amortization of property under capital leases, was $69.6 million, $67.0 million and $63.8 million for Fiscal 2010, Fiscal 2011 and Fiscal 2012, respectively.
Other assets, which are recorded at cost, consisted of the following (in thousands):
| | | | | | | | | | | | | | | | | | | | | | | | |
| | | December 31, 2011 | | | December 29, 2012 | |
| | | Gross | | | Accumulated
Amortization | | | Net | | | Gross | | | Accumulated
Amortization | | | Net | |
Trademarks | | $ | 23,400 | | | $ | — | | | $ | 23,400 | | | $ | 23,400 | | | $ | — | | | $ | 23,400 | |
Deferred financing costs | | | 16,682 | | | | (8,601 | ) | | | 8,081 | | | | 20,288 | | | | (7,673 | ) | | | 12,615 | |
Customer lists | | | 12,053 | | | | (4,497 | ) | | | 7,556 | | | | 12,053 | | | | (6,431 | ) | | | 5,622 | |
Favorable lease rights | | | 5,000 | | | | (3,101 | ) | | | 1,899 | | | | 5,000 | | | | (3,453 | ) | | | 1,547 | |
Other assets | | | 4,523 | | | | (689 | ) | | | 3,834 | | | | 3,553 | | | | (795 | ) | | | 2,758 | |
Assets held for sale | | | 468 | | | | — | | | | 468 | | | | 468 | | | | — | | | | 468 | |
| | | | | | | | | | | | | | | | | | | | | | | | |
Total other assets | | $ | 62,126 | | | $ | (16,888 | ) | | $ | 45,238 | | | $ | 64,762 | | | $ | (18,352 | ) | | $ | 46,410 | |
| | | | | | | | | | | | | | | | | | | | | | | | |
Amortization expense (including the amortization of deferred financing costs) was $5.6 million, $5.9 million, and $4.7 million for Fiscal 2010, Fiscal 2011 and Fiscal 2012, respectively.
Amortization of other assets (including the amortization of deferred financing costs), excluding trademarks which have indefinite lives, will be approximately $4.6 million in 2013, $4.6 million in 2014, $4.4 million in 2015, $2.7 million in 2016 and $1.9 million in 2017. The remaining weighted average life of the Company’s customer lists is 2.9 years.
65
6. LONG-TERM DEBT
Long-term debt consists of the following (in thousands):
| | | | | | | | |
| | | December 31,
2011 | | | December 29,
2012 | |
Term Loan | | $ | — | | | $ | 671,625 | |
First Lien Loan | | | 634,217 | | | | — | |
Second Lien Loan | | | 150,000 | | | | — | |
Capital lease obligations, 7.6% to 10.0%, due 2013 to 2027 | | | 36,426 | | | | 32,298 | |
Other long-term debt | | | 1,645 | | | | 1,445 | |
| | | | | | | | |
| | | 822,288 | | | | 705,368 | |
| | |
Less: Unamortized discount on Term Loan | | | — | | | | 8,806 | |
Less: Unamortized discount on Second Lien Loan | | | 2,147 | | | | — | |
Less: Current maturities | | | 10,789 | | | | 10,918 | |
| | | | | | | | |
Total long-term debt, net of current maturities | | $ | 809,352 | | | $ | 685,644 | |
| | | | | | | | |
In connection with our IPO on February 13, 2012, RSI entered into a new senior credit facility (the “Refinancing”), consisting of a $675 million term loan (the ‘‘Term Facility’’) and a $125 million revolving credit facility (the ‘‘Revolving Facility’’ and together with the Term Facility, the ‘‘Credit Facilities”) with the Term Facility maturing in February 2019 and the Revolving Facility maturing in February 2017. We used the net proceeds from the IPO, together with borrowings under the Credit Facilities, to refinance our existing indebtedness and to pay accrued interest thereon and related prepayment premiums.
Borrowings under the Credit Facilities bear interest, at our option, at (i) adjusted LIBOR (subject to a 1.25% floor) plus 4.5% or (ii) an alternate base rate plus 3.5%. In addition, there is a fee payable quarterly in an amount equal to 0.5% per annum of the undrawn portion of the Revolving Facility. The terms of the Credit Facilities contain customary provisions regarding prepayments and restrictive covenants, and are also secured by substantially all of our tangible and intangible assets.
Mandatory prepayments under the Credit Facilities are required with (i) 50% of adjusted excess cash flow (which percentage may be reduced upon achievement and maintenance of certain leverage ratios); (ii) 100% of the net cash proceeds of assets sales or other dispositions of property by RSI and its restricted subsidiaries (subject to certain exceptions and reinvestment provisions); and (iii) 100% of the net cash proceeds of issuances, offerings or placements of debt obligations of RSI or its restricted subsidiaries (subject to certain exceptions). As of December 29, 2012, our current maturities included a $2.2 million mandatory prepayment due from our excess cash flow calculated for Fiscal 2012.
In connection with the Refinancing, we recognized a loss on debt extinguishment of $13.3 million, which consists primarily of the write-off of $4.5 million of previously capitalized financing costs, the write-off of the remaining unamortized discount of $2.1 million on our old second lien loan that was repaid, prepayment premiums on our old first and second lien loans that were repaid and certain fees and expenses of $2.0 million related to the Credit Facilities.
As of December 29, 2012, there were no outstanding borrowings under the Revolving Facility. Outstanding letters of credit, totaling $27.6 million on December 29, 2012, reduce availability under the Revolving Facility.
Prior to the Refinancing, our long-term debt included a first lien senior credit facility consisting of a term loan and $95 million revolving credit agreement (together, the “First Lien Credit Agreement) and a second lien credit facility (“Second Lien Credit Agreement”). Our first and second lien loans and the revolving credit facility bore interest based upon LIBOR or base rate options. Under the LIBOR option for the first lien loan and revolving
66
credit facility, the applicable rate was LIBOR plus 5.00% (subject to a floor of 2.0%) and under the base rate option for the first lien loan and revolving credit facility, the applicable rate of interest was the base rate plus 4.00%. For the portion of our first lien loan which matured in November 2011, the applicable rate of interest was LIBOR plus 3.50% and under the base rate option, the applicable interest rate was the base rate plus 2.50%. On April 16, 2010, the Company borrowed $150 million under the Second Lien Credit Agreement to pay dividends to our preferred and common shareholders. This second lien loan was issued at a 2% discount and was to mature in April 2016. This loan bore interest based upon LIBOR or base rate options. Under the LIBOR option, the applicable rate was LIBOR plus 8.0% (subject to a floor of 2%) and under the base rate option, the applicable rate was the base rate plus 7.0%.
Our credit agreement contains various restrictive covenants which, among other things: (i) prohibit us from prepaying other indebtedness; (ii) require us to maintain specified financial ratios; and (iii) limit our capital expenditures. In addition, the credit agreement limits our ability to declare or pay dividends.
At December 29, 2012, we were in compliance with all financial covenants relating to our indebtedness.
On December 29, 2012, repayment of principal on long-term debt outstanding was as follows (in thousands):
| | | | |
2013 | | $ | 10,918 | |
2014 | | | 13,025 | |
2015 | | | 11,737 | |
2016 | | | 11,900 | |
2017 | | | 11,409 | |
Thereafter | | | 646,379 | |
| | | | |
Total debt | | $ | 705,368 | |
| | | | |
7. EMPLOYEE BENEFIT PLANS
Company-Sponsored Plans
Certain non-union employees are covered by defined benefit pension plans. Prior to January 1, 2005, benefits were based on either years of service and the employee’s highest compensation during five of the most recent ten years of employment or on stated amounts for each year of service. On May 31, 2006, we amended our primary pension plan. As a result of this amendment, no new participants will be added to the plan and current participants will no longer accrue benefits. Employees are still required to meet the vesting requirements of the plan in order to receive benefits.
On April 28, 2010, we amended our agreement with the Pension Benefit Guaranty Corporation (“PBGC”) dated November 3, 2005, whereby, among other things, we agreed to contribute $7.5 million in April 2010, $5 million in April 2011 and $2.5 million in April 2012 to our primary pension plan. In addition, in April 2010 we increased the amount of the letter of credit we had posted in favor of the PBGC to $12.5 million from $10 million, for the benefit of the pension plan, which was in place until December 2012, when certain conditions were satisfied. During 2012, we were allowed to reduce the letter of credit, and as of December 29, 2012, the amount of the letter of credit we had posted in favor of the PBGC was $10 million.
67
The benefit obligation and related assets under all plans have been measured as of the end of Fiscal 2011 and Fiscal 2012, the plans’ measurement dates. The following tables set forth pension obligations and plan assets information (in thousands):
| | | | | | | | |
| | | Year Ended | |
| | | December 31, 2011 | | | December 29, 2012 | |
Change in projected benefit obligations: | | | | | | | | |
Projected benefit obligation-beginning of year | | $ | 157,808 | | | $ | 185,605 | |
Service cost | | | 411 | | | | 482 | |
Interest cost | | | 8,515 | | | | 7,835 | |
Actuarial loss | | | 26,898 | | | | 14,345 | |
Benefits paid | | | (8,027 | ) | | | (8,612 | ) |
| | | | | | | | |
Projected benefit obligation-end of year | | $ | 185,605 | | | $ | 199,655 | |
| | | | | | | | |
| | |
Change in plan assets: | | | | | | | | |
Fair value-beginning of year | | $ | 139,461 | | | $ | 143,530 | |
Actual return on plan assets | | | (911 | ) | | | 19,790 | |
Company contributions | | | 13,007 | | | | 8,942 | |
Benefits paid | | | (8,027 | ) | | | (8,612 | ) |
| | | | | | | | |
Fair value-end of year | | $ | 143,530 | | | $ | 163,650 | |
| | | | | | | | |
| | |
Funded status | | $ | (42,075 | ) | | $ | (36,005 | ) |
| | | | | | | | |
| | |
Components of net amount recognized in balance sheet: | | | | | | | | |
Accrued pension costs (accrued wages and benefits) | | $ | (185 | ) | | $ | (184 | ) |
Accrued pension costs (other liabilities) | | | (41,890 | ) | | | (35,821 | ) |
| | | | | | | | |
Net amount recognized in balance sheet | | $ | (42,075 | ) | | $ | (36,005 | ) |
| | | | | | | | |
As of December 31, 2011 and December 29, 2012 all plans were underfunded. As of December 31, 2011, the accumulated benefit obligation and fair value of plan assets for all plans was $185.6 million and $143.5 million, respectively. As of December 29, 2012, the accumulated benefit obligation and fair value of plan assets for all plans was $199.7 million and $163.7 million, respectively.
Amounts recognized in accumulated other comprehensive loss consist of (in thousands):
| | | | | | | | |
| | | December 31, 2011 | | | December 29, 2012 | |
Net actuarial loss | | $ | (75,785 | ) | | $ | (78,211 | ) |
Deferred taxes | | | 30,280 | | | | 31,251 | |
| | | | | | | | |
Net amount recognized in accumulated other comprehensive loss | | $ | (45,505 | ) | | $ | (46,960 | ) |
| | | | | | | | |
We expect to amortize $4.4 million of the actuarial loss as a component of net pension cost in 2013.
68
Net pension expense (income) consists of (in thousands):
| | | | | | | | | | | | |
| | | Year Ended | |
| | | January 1, 2011 | | | December 31, 2011 | | | December 29, 2012 | |
Service cost | | $ | 435 | | | $ | 411 | | | $ | 482 | |
Interest cost on projected benefit obligation | | | 8,608 | | | | 8,515 | | | | 7,835 | |
Expected return on plan assets | | | (10,471 | ) | | | (12,092 | ) | | | (12,237 | ) |
Amortization of unrecognized net loss | | | 1,498 | | | | 1,758 | | | | 4,368 | |
| | | | | | | | | | | | |
Net pension expense (income) | | $ | 70 | | | $ | (1,408 | ) | | $ | 448 | |
| | | | | | | | | | | | |
The weighted-average assumptions to determine net periodic benefit costs were as follows:
| | | | | | | | | | | | |
| | | Year Ended | |
| | | January 1, 2011 | | | December 31, 2011 | | | December 29, 2012 | |
Discount rate | | | 6.00 | % | | | 5.50 | % | | | 4.30 | % |
Rate of increase in compensation levels | | | 4.00 | % | | | n/a | | | | n/a | |
Expected long-term rate of return on plan assets | | | 8.50 | % | | | 8.50 | % | | | 8.50 | % |
The weighted-average discount rate assumptions used to determine the benefit obligation was 4.30% and 3.77% at December 31, 2011 and December 29, 2012, respectively.
In fiscal 2010, one of our plans had several active participants whose benefits were dependent upon compensation levels. In fiscal 2010, the remaining participants in this plan retired, and as such, compensations levels do not impact participant benefits.
For future periods, the expected long-term rate of return on plan assets is 8.25%. The expected return on plan assets is based on the Company’s expectation of long-term average rate of return of capital markets in which the plans invest. The return on plan assets reflects the weighted-average of the expected long-term rates of return for the broad categories of investments held in the plans. The expected long-term rate of return is adjusted when there are fundamental changes in expected returns on the plans’ investments.
We have an administrative committee that oversees the investment of the assets of the plans and has created a target allocation investment policy. The Company’s investment policies employ an approach whereby a mix of equities and fixed income investments are used to maximize the long-term return of plan assets for a prudent level of risk. The investment portfolio primarily contains a diversified blend of equity and fixed-income investments. The Company’s planned allocation range at December 29, 2012 as a percentage of total market value was approximately 60% equity and 40% fixed-income. Equity investments are diversified across domestic and non-domestic stocks, as well as growth, value, and small to large capitalizations. Fixed income investments include corporate and government securities with short-, mid- and long-term maturities with investment grade ratings at the time of purchase. Investment and market risks are measured and monitored on an ongoing basis through regular investment portfolio reviews, annual liability measurement and periodic asset/liability studies. Investment strategies for plan assets measured at fair value include:
| | • | | Fixed Income—Invest primarily in fixed income securities of U.S. and foreign affiliates, including securities issued or guaranteed by the U.S. and non-U.S. governments. |
| | • | | Cash Equivalents—Invest primarily in high quality debt instruments, including commercial paper and corporate obligations, securities issued or guaranteed by the U.S. government or its agencies, certificates of deposit, and bankers’ acceptances. |
| | • | | Large/Mid/Small Cap Equity—Invest primarily in common stocks and other equity securities of U.S. companies. |
69
| | • | | Allocation Fund—Invest in equities, fixed income and commodities using a risk-balanced approach so that each asset contributes a relatively equal amount of risk. |
| | • | | International Equity—Invest primarily in foreign equity securities, located in Europe, Latin America, and Asia. |
| | • | | Real Estate—Invest primarily in common stocks and other equity securities of real estate companies, including real estate investment trusts, and real estate operating companies. |
| | • | | Emerging Markets Equity—Invest primarily in common stocks of issuers in emerging and developing markets throughout the world, and may include up to 100% of total assets in foreign securities, primarily of companies with high growth potential. |
The plans’ assets are held in pooled separate accounts. The fair value of the plans’ assets is primarily based on quoted market prices for the underlying securities or investments. The method by which fair value is determined can impact the valuation of the plans’ assets and therefore our net pension expense (income). The fair values are classified as Level 2 in the fair value hierarchy since the net asset value per share of the pooled separate account itself is not publicly quoted and the values are not dependent on the input of significant judgment or assumptions by management.
The fair value of the Company’s pension plan assets as of December 31, 2011 and December 29, 2012 are as follows (in thousands):
| | | | | | | | | | | | | | | | |
| | | Balance as of
December 31,
2011 | | | Quoted Prices
in Active
Markets for
Identical Assets
(Level 1) | | | Significant
Other
Observable
Inputs
(Level 2) | | | Significant
Unobservable
Inputs
(Level 3) | |
Fixed Income and Cash Equivalents | | $ | 54,292 | | | $ | — | | | $ | 54,292 | | | $ | — | |
Large Cap Equity | | | 43,470 | | | | — | | | | 43,470 | | | | — | |
International Equity | | | 16,743 | | | | — | | | | 16,743 | | | | — | |
Small Cap Equity | | | 9,150 | | | | — | | | | 9,150 | | | | — | |
Mid Cap Equity | | | 9,053 | | | | — | | | | 9,053 | | | | — | |
Real Estate | | | 8,056 | | | | — | | | | 8,056 | | | | — | |
Emerging markets Equity | | | 2,766 | | | | — | | | | 2,766 | | | | — | |
| | | | | | | | | | | | | | | | |
Total | | $ | 143,530 | | | $ | — | | | $ | 143,530 | | | $ | — | |
| | | | | | | | | | | | | | | | |
| | | | | | | | | | | | | | | | |
| | | Balance as of
December 29,
2012 | | | Quoted Prices
in Active
Markets for
Identical
Assets
(Level 1) | | | Significant
Other
Observable
Inputs
(Level 2) | | | Significant
Unobservable
Inputs
(Level 3) | |
Fixed Income and Cash Equivalents | | $ | 63,956 | | | $ | — | | | $ | 63,956 | | | $ | — | |
Large Cap Equity | | | 40,597 | | | | — | | | | 40,597 | | | | — | |
International Equity | | | 17,693 | | | | — | | | | 17,693 | | | | — | |
Small Cap Equity | | | 6,603 | | | | — | | | | 6,603 | | | | — | |
Mid Cap Equity | | | 6,750 | | | | — | | | | 6,750 | | | | — | |
Allocation Fund | | | 16,279 | | | | — | | | | 16,279 | | | | — | |
Real Estate | | | 8,391 | | | | — | | | | 8,391 | | | | — | |
Emerging markets Equity | | | 3,381 | | | | — | | | | 3,381 | | | | — | |
| | | | | | | | | | | | | | | | |
Total | | $ | 163,650 | | | $ | — | | | $ | 163,650 | | | $ | — | |
| | | | | | | | | | | | | | | | |
70
The following benefit payments, which reflect expected future costs, are expected to be paid by the plans during the following fiscal years (in thousands):
| | | | |
| | | Estimated future
benefit payments | |
2013 | | $ | 8,659 | |
2014 | | | 8,987 | |
2015 | | | 9,199 | |
2016 | | | 9,341 | |
2017 | | | 9,427 | |
2018-2022 | | | 48,809 | |
| | | | |
| | $ | 94,422 | |
| | | | |
We estimate 2013 minimum required contributions to our defined benefit pension plans will be approximately $6.2 million. Due to uncertainties regarding significant assumptions involved in estimating future required contributions to our defined benefit pension plans, such as interest rate levels, the amount and timing of asset returns and the impact of proposed legislation, we are not able to reasonably estimate our future required contributions beyond 2013.
Multi-Employer Plans
The Company contributes to a number of multi-employer pension plans based on obligations arising from our collective bargaining agreements covering supply chain and certain store union employees. These plans provide retirement benefits to participants based on their service to contributing employers. The benefits are paid from assets held in trust for that purpose. Trustees are appointed by employers and unions. The trustees are responsible for determining the level of benefits to be provided to participants as well as for such matters as the investment of the assets and the administration of the plan.
The risks of participating in multi-employer pension plans are different from the risks of participating in single-employer pension plans in the following respects:
| | a. | Assets contributed to the multi-employer plan by one employer may be used to provide benefits to employees of other participating employers. |
| | b. | If a participating employer stops contributing to the plan, the unfunded obligations of the plan allocable to such withdrawing employer may be borne by the remaining participating employers. |
| | c. | If the company stops participating in some of its multi-employer pension plans, the Company may be required to pay those plans an amount based on its allocable share of the underfunded status of the plan, referred to as a withdrawal liability. |
We contribute to the following multi-employer pension plans:
| | | | |
Plan Name | | EIN | | Expiration Date of
Contracts with
Covered Employees |
Central States, Southeast and Southwest Areas Pension Fund (a) | | 36-6044243 | | September 2013 to March 2016 |
United Food and Commercial Workers Unions and Employers Pension Plan (b) | | 39-6069053/001 | | April 2013 to October 2014 |
United Food and Commercial Workers International Union-Industry Pension Fund | | 51-6055922/001 | | April 2013 |
Minneapolis Retail Meat Cutters and Food Handlers Pension Plan | | 41-0905139/001 | | March 2013 (c) |
71
| (a) | The Company is party to two collective bargaining agreements requiring contributions to this fund, one of which expires in September 2013, and the other expires in March 2016. |
| (b) | In December 2012, the Company entered into a withdrawal agreement for the Company’s liability related to approximately 3% of the Company’s employees who participate in this plan. The Company recognized a charge of $1.0 million related to the withdrawal, which will be paid over 13 years. |
| (c) | This contract was ratified in March 2013 and currently expires in March 2014. |
The Central States, Southeast and Southwest Areas Pension Fund, United Food and Commercial Workers Unions and Employers Pension Plan and Minneapolis Retail Meat Cutters and Food Handlers Pension Plans are underfunded as of December 29, 2012.
The following table represents the zone status (as currently defined by the Pension Protection Act of 2006) as of each plan’s most recent fiscal year-end nearest December 31, 2011 and December 29, 2012:
| | | | | | | | |
| | | As of December 31, 2011 | | As of December 29, 2012 |
Plan Name | | Plan
Year-End Date | | Zone
Status | | Plan
Year-End Date | | Zone
Status |
Central States, Southeast and Southwest Areas Pension Fund | | December 31, 2010 | | Red | | December 31, 2011 | | Red |
United Food and Commercial Workers Unions and Employers Pension Plan | | October 31, 2011 | | Red | | October 31, 2012 | | Red |
United Food and Commercial Workers International Union-Industry Pension Fund | | June 30, 2011 | | Green | | June 30, 2012 | | Green |
Minneapolis Retail Meat Cutters and Food Handlers Pension Plan | | February 28, 2011 | | Yellow | | February 28, 2012 | | Yellow |
Total contributions made to the plans in Fiscal 2010, Fiscal 2011, and Fiscal 2012 are as follows (in thousands):
| | | | | | | | | | | | |
Plan Name | | Fiscal 2010 | | | Fiscal 2011 | | | Fiscal 2012 | |
Central States, Southeast and Southwest Areas Pension Fund | | $ | 5,618 | | | $ | 5,676 | | | $ | 5,801 | |
United Food and Commercial Workers Unions and Employers Pension Plan | | | 1,368 | | | | 1,457 | | | | 1,346 | |
United Food and Commercial Workers International Union-Industry Pension Fund | | | 219 | | | | 209 | | | | 202 | |
Minneapolis Retail Meat Cutters and Food Handlers Pension Plan | | | 4,432 | | | | 4,639 | | | | 4,838 | |
| | | | | | | | | | | | |
Total multi-employer plan contributions | | $ | 11,637 | | | $ | 11,981 | | | $ | 12,187 | |
| | | | | | | | | | | | |
The Company has made contributions in excess of 5% of total contributions for United Food and Commercial Workers Unions and Employers Pension Plan for its plan year ending October 31, 2012 and for the Minneapolis Retail Meat Cutters and Food Handlers Pension Plan for its plan year ending February 28, 2012.
As of the end of each plans’ most recent annual period, the table below indicates plans for which a funding improvement plan (“FIP”) or a rehabilitation plan (“RP”) has been implemented and any surcharges paid to the plans by us or minimum funding requirements (due to contractual, statutory or other obligations):
| | | | | | | | |
Plan Name | | Plan
Year-End Date | | FIP/RP
Status | | Surcharges
paid by
Roundy’s | | Minimum
Funding
Requirements |
Central States, Southeast and Southwest Areas Pension Fund | | December 31, 2011 | | Implemented | | No | | No |
United Food and Commercial Workers Unions and Employers Pension Plan | | October 31, 2012 | | Implemented | | No | | No |
United Food and Commercial Workers International Union-Industry Pension Fund | | June 30, 2012 | | No | | No | | No |
Minneapolis Retail Meat Cutters and Food Handlers Pension Plan | | February 28, 2012 | | Implemented | | No | | No |
72
We anticipate that our contributions to these plans may increase; however, because we are one of a number of employers contributing to these plans, it is difficult to ascertain what our share of the underfunding would be. If we choose to exit a plan, any adjustment for a withdrawal liability will be recorded when it is probable that a liability exists and can be reasonably determined.
Defined Contribution Plans
We have a defined contribution plan covering substantially all salaried and hourly employees not covered by collective bargaining agreements. We also have a defined contribution plan covering certain hourly employees covered by a number of collective bargaining agreements. Total expense for our defined contribution plans was $6.9 million, $5.7 million and $6.1 million for Fiscal 2010, Fiscal 2011 and Fiscal 2012, respectively.
8. INCOME TAXES
The provision for income taxes consisted of the following (in thousands):
| | | | | | | | | | | | |
| | | Year Ended | |
| | | January 1,
2011 | | | December 31,
2011 | | | December 29,
2012 | |
Current income tax provision: | | | | | | | | | | | | |
Federal | | $ | 16,753 | | | $ | 9,158 | | | $ | 13,372 | |
State | | | 4,190 | | | | 2,853 | | | | 3,046 | |
| | | | | | | | | | | | |
Total Current | | | 20,943 | | | | 12,011 | | | | 16,418 | |
Deferred income tax provision (benefit): | | | | | | | | | | | | |
Federal | | | 9,893 | | | | 16,520 | | | | (4,425 | ) |
State | | | 2,408 | | | | 1,510 | | | | (1,234 | ) |
| | | | | | | | | | | | |
Total Deferred | | | 12,301 | | | | 18,030 | | | | (5,659 | ) |
| | | | | | | | | | | | |
Total | | $ | 33,244 | | | $ | 30,041 | | | $ | 10,759 | |
| | | | | | | | | | | | |
Federal income tax at the statutory rate of 35% for Fiscal 2010, Fiscal 2011 and Fiscal 2012 and income tax expense as reported are reconciled as follows (in thousands):
| | | | | | | | | | | | |
| | | Year Ended | |
| | | January 1,
2011 | | | December 31,
2011 | | | December 29,
2012 | |
Federal income tax at statutory rate | | $ | 27,803 | | | $ | 27,331 | | | $ | (20,471 | ) |
State income taxes, net of federal tax benefits | | | 5,212 | | | | 4,006 | | | | 1,213 | |
Preferred dividends, non-deductible | | | 951 | | | | — | | | | — | |
Goodwill impairment charge | | | — | | | | — | | | | 29,700 | |
Other, net | | | (722 | ) | | | (1,296 | ) | | | 317 | |
| | | | | | | | | | | | |
Income tax expense | | $ | 33,244 | | | $ | 30,041 | | | $ | 10,759 | |
| | | | | | | | | | | | |
73
The approximate tax effects of temporary differences as of December 31, 2011 and December 29, 2012 are as follows (in thousands):
| | | | | | | | | | | | | | | | | | | | | | | | |
| | | December 31, 2011 | | | December 29, 2012 | |
| | | Assets | | | Liabilities | | | Total | | | Assets | | | Liabilities | | | Total | |
Current: | | | | | | | | | | | | | | | | | | | | | | | | |
Allowance for doubtful accounts | | $ | 308 | | | $ | — | | | $ | 308 | | | $ | 319 | | | $ | — | | | $ | 319 | |
Inventories | | | 2,702 | | | | (6,377 | ) | | | (3,675 | ) | | | 2,837 | | | | (6,362 | ) | | | (3,525 | ) |
Depreciation and amortization | | | 721 | | | | — | | | | 721 | | | | 727 | | | | — | | | | 727 | |
Employee benefits | | | 10,366 | | | | (2,777 | ) | | | 7,589 | | | | 11,057 | | | | (3,699 | ) | | | 7,358 | |
Accrued expenses not currently deductible | | | 2,701 | | | | (1,606 | ) | | | 1,095 | | | | 1,920 | | | | (1,540 | ) | | | 380 | |
| | | | | | | | | | | | | | | | | | | | | | | | |
Total current | | | 16,798 | | | | (10,760 | ) | | | 6,038 | | | | 16,860 | | | | (11,601 | ) | | | 5,259 | |
| | | | | | | | | | | | | | | | | | | | | | | | |
| | | | | | |
Long-term: | | | | | | | | | | | | | | | | | | | | | | | | |
Depreciation and amortization | | | 874 | | | | (102,149 | ) | | | (101,275 | ) | | | (308 | ) | | | (91,622 | ) | | | (91,930 | ) |
Employee benefits | | | 31,357 | | | | (14,608 | ) | | | 16,749 | | | | 33,304 | | | | (17,816 | ) | | | 15,488 | |
Accrued expenses not currently deductible | | | 14,864 | | | | — | | | | 14,864 | | | | 14,071 | | | | — | | | | 14,071 | |
Other | | | 2,549 | | | | — | | | | 2,549 | | | | 2,586 | | | | — | | | | 2,586 | |
Net operating loss carryforwards | | | 675 | | | | — | | | | 675 | | | | 673 | | | | — | | | | 673 | |
| | | | | | | | | | | | | | | | | | | | | | | | |
Total noncurrent | | | 50,319 | | | | (116,757 | ) | | | (66,438 | ) | | | 50,326 | | | | (109,438 | ) | | | (59,112 | ) |
| | | | | | | | | | | | | | | | | | | | | | | | |
Total | | $ | 67,117 | | | $ | (127,517 | ) | | $ | (60,400 | ) | | $ | 67,186 | | | $ | (121,039 | ) | | $ | (53,853 | ) |
| | | | | | | | | | | | | | | | | | | | | | | | |
As of December 29, 2012, we have state tax net operating loss carry forwards of approximately $13.1 million, which are due to expire beginning 2017.
We file income tax returns in the U.S. federal jurisdiction and various state jurisdictions. With few exceptions, we are no longer subject to U.S. federal or state tax audits for years before 2005. The Internal Revenue Service is currently examining our U.S. income tax returns for 2010 and 2011. State tax authorities are currently examining our income tax returns for fiscal years 2005 through 2008. We have state tax net operating loss carry forwards which are open for review from 2003 and subsequent years.
A reconciliation of beginning and ending amount of unrecognized tax benefits is as follows (in thousands):
| | | | | | | | | | | | |
| | | January 1,
2011 | | | December 31,
2011 | | | December 29,
2012 | |
Balance at beginning of year | | $ | 5,440 | | | $ | 7,725 | | | $ | 12,177 | |
Tax positions taken in prior year | | | 18 | | | | 1,484 | | | | 20 | |
Tax positions taken in current year | | | 2,267 | | | | 2,968 | | | | 2,113 | |
Settlements | | | — | | | | — | | | | (3,300 | ) |
Lapse of applicable statute of limitations | | | — | | | | — | | | | — | |
| | | | | | | | | | | | |
Balance at end of year | | $ | 7,725 | | | $ | 12,177 | | | $ | 11,010 | |
| | | | | | | | | | | | |
The total amount of tax benefits that, if recognized, would impact the effective tax rate was $2.9 million, $3.4 million, and $3.0 million (net of tax) at January 1, 2011, December 31, 2011, and December 29, 2012, respectively. Our policy is to recognize interest and penalties related to income tax matters in our provision for income taxes.
During Fiscal 2010, Fiscal 2011, and Fiscal 2012, the Company recognized $0.2 million, $1.5 million, and $0.7 million respectively, in interest and penalties. The Company has accrued $2.5 million and $2.6 million for the payment of interest and penalties at December 31, 2011 and December 29, 2012, respectively.
74
Although timing of the resolution of federal and state income tax audits is highly uncertain, as of December 29, 2012, we believe that the amount of unrecognized tax benefits which is reasonably possible to be settled within the next 12 months, including interest and penalties, is approximately $4.7 million.
9. LEASE OBLIGATIONS AND CONTINGENT LIABILITIES
Rent expense and related subleasing income under operating leases are as follows (in thousands):
| | | | | | | | | | | | |
| | | Rent Expense | | | Subleasing
Income | |
| | | Minimum | | | Contingent | | |
Fiscal 2010 | | $ | 100,020 | | | $ | 638 | | | $ | 8,636 | |
Fiscal 2011 | | | 105,737 | | | | 367 | | | | 6,917 | |
Fiscal 2012 | | | 113,743 | | | | 656 | | | | 6,538 | |
In addition, many of the store leases obligate us to pay real estate taxes, insurance and maintenance costs, and contain multiple renewal options, exercisable at our option, that generally range from one additional five-year period to four additional five-year periods. Those items are not included in the rent expense listed above.
Contingent rentals may be paid under certain store leases on the basis of the store’s sales in excess of stipulated amounts.
Future minimum rental payments under non-cancellable long-term leases, assuming the exercise of certain lease extension options, and future minimum sublease rental income, are as follows at December 29, 2012 (in thousands):
| | | | | | | | | | | | |
| | | Operating
Leases | | | Capitalized
Leases | | | Sublease
Income | |
2013 | | $ | 122,607 | | | $ | 6,561 | | | $ | 4,794 | |
2014 | | | 136,168 | | | | 6,620 | | | | 3,712 | |
2015 | | | 134,300 | | | | 6,626 | | | | 3,084 | |
2016 | | | 130,975 | | | | 6,364 | | | | 2,431 | |
2017 | | | 126,911 | | | | 5,457 | | | | 1,451 | |
Thereafter | | | 1,315,653 | | | | 13,174 | | | | 4,922 | |
| | | | | | | | | | | | |
Total | | $ | 1,966,614 | | | | 44,802 | | | $ | 20,394 | |
| | | | | | | | | | | | |
Amount representing interest | | | | | | | 12,504 | | | | | |
| | | | | | | | | | | | |
Present value of net minimum lease payments | | | | | | | 32,298 | | | | | |
Current portion | | | | | | | 3,960 | | | | | |
| | | | | | | | | | | | |
Long-term portion | | | | | | $ | 28,338 | | | | | |
| | | | | | | | | | | | |
A liability of approximately $5.8 million related to the operating lease commitments disclosed above has been recorded in the closed facility reserve at December 29, 2012.
Sublease income primarily includes payments to be received from third party subtenants at our retail store locations.
In connection with the exit or sale of our independent distribution business in prior years, we have assigned leases and subleases for retail stores which expire at various dates through 2021. A remaining potential obligation exists in the event of a default under the assigned leases and subleases by the assignee. The potential obligations would include rent, real estate taxes, common area costs and other sundry expenses. The future minimum lease payments are approximately $7.1 million. We believe the likelihood of a liability related to these assigned leases and subleases is remote.
75
Assets under capital leases, consisting of retail store sites, had a net book value of $20.9 million, net of accumulated amortization of $26.1 million, at December 31, 2011 and $17.1 million, net of accumulated amortization of $28.6 million, at December 29, 2012.
We are involved in various claims and litigation arising in the normal course of business. In the opinion of management, the ultimate resolution of these actions will not materially affect our consolidated financial position, results of operations or cash flows.
10. PREFERRED STOCK SUBJECT TO MANDATORY PAYMENT
The Company had 20,000 shares of preferred stock authorized. In 2002, the Company issued preferred stock at a fair value of $29,200 per share. The preferred stock accrued a 12% dividend quarterly on the unpaid stated liquidation value of $29,100 per share. All unpaid dividends and stated liquidation value of the shares were payable to the stockholders on September 30, 2012 or earlier in certain cases. Preferred shareholders were entitled to a first preference to all dividends paid by the Company. Dividends paid were first applied to unpaid dividends and then were applied to the stated liquidation value of the preferred shares. After the stated liquidation value was repaid, the preferred stock ceased to accrue dividends. At that time, the preferred stock continued to have voting rights, consistent with common stock and was entitled to receive a pro-rata share of any future distributions.
The remaining liquidation value of the preferred stock was convertible to common stock at the election of the majority of the preferred shareholders. As of December 31, 2011, the known outstanding contingently convertible preferred stock was 10,439 shares. As discussed further below, as of April 29, 2010, the Company fully paid all unpaid dividends and the liquidation value of the preferred stock. Accordingly, there are no unknown contingently convertible shares as of December 31, 2011. The remaining 10,439 outstanding shares of preferred stock were each convertible to 292.2 shares of common stock subsequent to the stock split approved by our Board of Directors on January 24, 2012.
The Company determined that the preferred stock was subject to mandatory payment, as there was a fixed date and a fixed and determinable payment amount. Accordingly, the Company recorded the preferred stock as a long term liability in its consolidated balance sheet until April 29, 2010 at which time all unpaid dividends and liquidation value had been paid. Dividends accreted during Fiscal 2010 were $2.7 million, and have been recorded as a component of interest expense on the consolidated statements of income.
On April 29, 2010, the Company paid all unpaid dividends accrued at that time, and the remaining liquidation value of the preferred stock to the preferred shareholders. Upon reduction of the liquidation value to zero, the preferred stock was no longer entitled to any dividends, and preferred stockholders were no longer entitled to preferential distributions from the Company. As the shareholders retained voting rights in the Company, the remaining value of the preferred stock was reclassified into shareholders’ equity at that time.
11. COMMON STOCK
Common stock shareholders have voting rights and have pro-rata rights to dividends after the liquidation value and unpaid dividends related to the preferred stock is paid.
On April 29, 2010, the Company declared and paid a dividend to the common shareholders aggregating $79.2 million or $2.90 per common share.
During Fiscal 2010, the Company re-purchased 150,191 shares of common stock at approximately $14 per share, which represented management’s estimate of fair value. During Fiscal 2011, the Company re-purchased 25,875 shares of common stock at approximately $17 per share, which represented management’s estimate of fair value. During 2012, the Company did not re-purchase any shares of common stock.
76
On November 30, 2011, in order to comply with certain provisions of the Sarbanes-Oxley Act, $4.3 million of shareholder notes (and accrued interest) were cancelled in exchange for our repurchase of 247,587 common shares held by such shareholders. The purchase price for the repurchased shares was based on fair market value as determined by the Board of Directors of the Company using a valuation methodology consistent with previous stock sales and repurchases. The purchase price per share was approximately $17 per share, which represented management’s estimate of fair value. All repurchased shares were subsequently retired.
12. SHAREHOLDER NOTES RECEIVABLE
The Company issued notes receivable due from certain members of management and directors, which were partially with recourse and were used to purchase common shares of the Company. Shareholder notes receivable were with full recourse for the accrued interest and had a 50% recourse for the principal balance. The notes were secured by the noteholders’ common stock. The notes accrued interest at a fixed rate of interest determined on the date the shares were issued, compounded on a daily basis. Notes were payable generally upon payment of a dividend by the Company or termination of employment.
In connection with the April 29, 2010 dividend described in Note 11, at the direction of the board of directors, common stock shareholders with note receivable balances were required to use a minimum of 80% of the paid dividend to repay the outstanding balance on their shareholder note. This resulted in a repayment of $2.2 million of shareholder notes receivable.
During Fiscal 2010 and 2011, the Company recorded interest income related to the shareholder notes of $0.2 million and $0.2 million, respectively. As a result of the shareholder note cancellation described in Note 11, at December 31, 2011 and December 29, 2012, there were no shareholder notes outstanding and no accrued interest.
13. EARNINGS PER SHARE
The Company had one class of common stock as of December 29, 2012. Prior to the conversion of our preferred stock to common stock in January 2012, the preferred stock was a participating stock security requiring the use of the two-class method for the computation of basic net earnings per share in accordance with the provisions of ASC 260-10, “Earnings per Share”. As described in Note 10, until the liquidation value and unpaid dividends on preferred stock were paid in 2010, the preferred shareholders received first preference to all dividends. Once the unpaid dividends and liquidation value were paid, the preferred stock ceased to accrue dividends and the preferred and common shareholders were entitled to receive a pro-rata share of any future distributions.
Preferred stock was convertible on a one-to-one conversion ratio into common stock and these shares are included in the diluted weighted average common shares outstanding. Prior to April 29, 2010, there were unpaid dividends and liquidation value associated with preferred stock. These amounts would be converted to common stock upon completion of an initial public offering. Because the Company has fully paid all unpaid dividends and the liquidation of the preferred stock as of April 29, 2010, there are no unknown contingently convertible shares at January 1, 2011.
Basic earnings per share excludes the effect of common stock equivalents and is computed using the two-class computation method, which excludes earnings attributable to the preferred stock preferential payments from total earnings available to common shareholders. Until the liquidation value and unpaid dividends were paid to the preferred shareholders, the common stock shareholders did not share in net income, unless earnings exceeded the remaining unpaid dividends and liquidation value. Accordingly, the common stock earnings per share prior to April 29, 2010 was zero as the unpaid dividends and liquidation value exceeded net income. On April 29, 2010, the liquidation value and unpaid dividends were fully paid to all preferred stock shareholders and therefore preferred and common shareholders rights to earnings were similar. For the period from April 30, 2010 through January 1, 2011, net income of $30.9 million was used to calculate earnings per share for common shareholders.
77
For the year ended December 29, 2012 there were restricted shares outstanding of approximately 583,000 shares that were excluded because their inclusion would have had an anti-dilutive effect on earnings per share.
The following table reflects the calculation of basic and diluted net earnings (loss) per share for Fiscal 2010, 2011, and 2012 (in thousands, except per share amounts):
| | | | | | | | | | | | |
| | | Fiscal
2010 | | | Fiscal
2011 | | | Fiscal
2012 | |
Net earnings (loss) per common share—basic: | | | | | | | | | | | | |
Net Income (loss) | | $ | 46,194 | | | $ | 48,048 | | | $ | (69,249 | ) |
Deduct: undistributed earnings allocable to convertible preferred stock | | $ | (18,412 | ) | | $ | (4,825 | ) | | $ | (35 | ) |
| | | | | | | | | | | | |
Net income (loss) attributable to common shareholders | | $ | 27,782 | | | $ | 43,223 | | | $ | (69,284 | ) |
Basic weighted average common shares outstanding | | | 27,384 | | | | 27,324 | | | | 43,047 | |
Net earnings (loss) per common share—basic | | $ | 1.01 | | | $ | 1.58 | | | $ | (1.61 | ) |
| | | | | | | | | | | | |
| | | |
Net earnings (loss) per common share—diluted: | | | | | | | | | | | | |
Net Income (loss) | | $ | 46,194 | | | $ | 48,048 | | | $ | (69,249 | ) |
Deduct: undistributed earnings allocable to convertible preferred stock | | $ | (15,317 | ) | | $ | — | | | $ | (35 | ) |
| | | | | | | | | | | | |
Net income (loss) attributable to common shareholders | | $ | 30,877 | | | $ | 48,048 | | | $ | (69,284 | ) |
Basic weighted average common shares outstanding | | | 27,384 | | | | 27,324 | | | | 43,047 | |
Dilutive impact of convertible preferred stock | | | 3,050 | | | | 3,050 | | | | — | |
Effect of dilutive securities—nonvested restricted stock | | | — | | | | — | | | | — | |
| | | | | | | | | | | | |
Diluted weighted average common shares outstanding | | | 30,434 | | | | 30,374 | | | | 43,047 | |
Net earnings (loss) per common share—diluted | | $ | 1.01 | | | $ | 1.58 | | | $ | (1.61 | ) |
| | | | | | | | | | | | |
14. SHARE-BASED COMPENSATION
Our 2012 Incentive Compensation Plan (the “Plan”) provides for grants of stock options, stock appreciation rights, restricted stock, other stock-based awards and other cash-based awards. An aggregate of 5,656,563 shares of our common stock has been registered and reserved for future issuance under the 2012 Incentive Compensation Plan. As of December 29, 2012 there were 4,826,515 remaining shares available for issuance.
The Company has granted restricted stock to certain of its employees, as well as to its non-employee directors, under the Plan. The restricted stock that has been granted for employees generally vests over five years and the restricted stock for our non-employee directors vests over one year. These shares generally have the rights of a stockholder with respect to the shares, including the right to receive dividends, the right to vote the shares of restricted stock and, conditioned upon full vesting of restricted stock, the right to tender such shares, subject to the conditions and restrictions generally applicable to restricted stock or specifically set forth in the recipient’s stock agreement. All restricted stock granted becomes fully vested upon certain changes of control of the Company.
We account for share-based compensation awards in accordance with the provisions of FASB ASC Topic 718—Compensation—Stock Compensation (“ASC 718”) which requires companies to estimate the fair value of share-based payment awards on the date of grant. The value of the portion of the awards ultimately expected to vest is recognized as expense over the requisite service period. The Company recognized total stock-based compensation of $1.4 million in Fiscal 2012, compared to no stock-based compensation in Fiscal 2010 or 2011, as operating and administrative expenses in the Company’s Consolidated Statements of Income.
78
Changes in equity awards outstanding under the Plan are summarized below (in thousands, except per share data):
| | | | | | | | |
| | | Restricted Shares
Outstanding | | | Weighted-average
grant-date fair
value per share | |
Outstanding, December 31, 2011 | | | — | | | $ | — | |
Granted | | | 892 | | | | 8.56 | |
Lapsed | | | — | | | | — | |
Cancelled or Expired | | | (62 | ) | | | 8.50 | |
| | | | | | | | |
Outstanding, December 29, 2012 | | | 830 | | | $ | 8.56 | |
| | | | | | | | |
As of December 29, 2012, there was $5.3 million of unrecognized compensation expense related to unvested restricted stock awards granted under the 2012 Incentive Compensation Plan. The expense is expected to be recognized over a weighted-average period of approximately four years.
15. BUSINESS SEGMENTS
The Company has determined that it has one reportable segment. The Company’s revenues are derived predominantly from the sale of food and non-food products at its stores. Non-perishable categories consist of traditional grocery, frozen and dairy products. Perishable food categories include meat, seafood, produce, deli, bakery and floral. Non-food categories include general merchandise, health and beauty care, pharmacy and alcohol.
The following is a summary of the percentage of sales of non-perishable, perishable, and non-food items for Fiscal 2010, Fiscal 2011, and Fiscal 2012:
| | | | | | | | | | | | |
| | | Fiscal 2010 | | | Fiscal 2011 | | | Fiscal 2012 | |
Non-perishable | | | 51.7 | % | | | 50.9 | % | | | 49.6 | % |
Perishable | | | 32.3 | % | | | 33.0 | % | | | 33.7 | % |
Non-food | | | 16.0 | % | | | 16.1 | % | | | 16.7 | % |
79
16. QUARTERLY INFORMATION (Unaudited)
The summarized quarterly financial data presented below reflect all adjustments, which in the opinion of management, are of a normal and recurring nature necessary to present fairly the results of operations for the periods presented (Annual amounts may not sum due to rounding. In thousands, except for per share amounts).
Fiscal 2011
| | | | | | | | | | | | | | | | | | | | |
| | | First
Quarter
(13 weeks) | | | Second
Quarter
(13 weeks) | | | Third
Quarter
(13 weeks) | | | Fourth
Quarter
(13 weeks) | | | Total
Year
(52 weeks) | |
Net sales | | $ | 916,016 | | | $ | 980,365 | | | $ | 976,881 | | | $ | 968,722 | | | $ | 3,841,984 | |
Cost of sales | | | 660,711 | | | | 715,675 | | | | 713,699 | | | | 714,623 | | | | 2,804,709 | |
Operating and administrative expenses | | | 222,419 | | | | 216,933 | | | | 224,455 | | | | 223,054 | | | | 886,862 | |
Interest expense (including amortization of deferred financing costs) | | | 18,260 | | | | 18,185 | | | | 18,126 | | | | 17,753 | | | | 72,324 | |
| | | | | | | | | | | | | | | | | | | | |
Income before Income Taxes | | | 14,626 | | | | 29,572 | | | | 20,601 | | | | 13,292 | | | | 78,089 | |
Provision for Income Taxes | | | 5,854 | | | | 11,825 | | | | 8,240 | | | | 4,122 | | | | 30,041 | |
| | | | | | | | | | | | | | | | | | | | |
Net Income | | $ | 8,772 | | | $ | 17,747 | | | $ | 12,361 | | | $ | 9,170 | | | $ | 48,048 | |
| | | | | | | | | | | | | | | | | | | | |
Net earnings per common share | | | | | | | | | | | | | | | | | | | | |
Basic and Diluted | | $ | 0.28 | | | $ | 0.58 | | | $ | 0.41 | | | $ | 0.30 | | | $ | 1.58 | |
Weighted average number of common shares outstanding | | | | | | | | | | | | | | | | | | | | |
Basic | | | 27,345 | | | | 27,345 | | | | 27,345 | | | | 27,260 | | | | 27,324 | |
Diluted | | | 30,395 | | | | 30,395 | | | | 30,395 | | | | 30,310 | | | | 30,374 | |
Fiscal 2012
| | | | | | | | | | | | | | | | | | | | |
| | | First
Quarter
(13 weeks) | | | Second
Quarter
(13 weeks) | | | Third
Quarter
(13 weeks) | | | Fourth
Quarter
(13 weeks) | | | Total
Year
(52 weeks) | |
Net sales | | $ | 938,245 | | | $ | 996,842 | | | $ | 973,595 | | | $ | 981,855 | | | $ | 3,890,537 | |
Cost of sales | | | 681,483 | | | | 729,150 | | | | 722,432 | | | | 722,320 | | | | 2,855,385 | |
Operating and administrative expenses | | | 226,109 | | | | 224,006 | | | | 225,907 | | | | 232,278 | | | | 908,300 | |
Goodwill impairment charge (See Footnote #3) | | | — | | | | — | | | | — | | | | 120,800 | | | | 120,800 | |
Interest expense (including amortization of deferred financing costs) | | | 14,758 | | | | 12,168 | | | | 12,171 | | | | 12,141 | | | | 51,238 | |
Loss on debt extinguishment | | | 13,304 | | | | — | | | | — | | | | — | | | | 13,304 | |
| | | | | | | | | | | | | | | | | | | | |
Income (Loss) before Income Taxes | | | 2,591 | | | | 31,518 | | | | 13,085 | | | | (105,684 | ) | | | (58,490 | ) |
Provision (Benefit) for Income Taxes | | | 320 | | | | 12,607 | | | | 5,152 | | | | (7,320 | ) | | | 10,759 | |
| | | | | | | | | | | | | | | | | | | | |
Net Income (Loss) | | $ | 2,271 | | | $ | 18,911 | | | $ | 7,933 | | | $ | (98,364 | ) | | $ | (69,249 | ) |
| | | | | | | | | | | | | | | | | | | | |
Net earnings (loss) per common share | | | | | | | | | | | | | | | | | | | | |
Basic | | $ | 0.06 | | | $ | 0.42 | | | $ | 0.18 | | | $ | (2.19 | ) | | $ | (1.61 | ) |
Diluted | | $ | 0.06 | | | $ | 0.42 | | | $ | 0.18 | | | $ | (2.19 | ) | | $ | (1.61 | ) |
Weighted average number of common shares outstanding | | | | | | | | | | | | | | | | | | | | |
Basic | | | 37,719 | | | | 44,824 | | | | 44,824 | | | | 44,824 | | | | 43,047 | |
Diluted | | | 38,596 | | | | 44,990 | | | | 44,976 | | | | 44,824 | | | | 43,047 | |
80
17. CONDENSED PARENT COMPANY ONLY FINANCIAL STATEMENTS
The Company’s principal operating subsidiary, RSI, is a party to a senior credit facility. All obligations under the Credit Facilities are secured by a lien on substantially all of the assets of RSI. The Credit Facilities contain various covenants, including operating performance, ability to incur additional indebtedness, create liens, make certain investments, pay dividends, sell assets, or enter into a merger or acquisition. With respect to dividends, the Credit Facilities prohibited RSI, subject to certain limited exceptions, from paying dividends or making distributions to Roundy’s.
The following condensed financial statements present Roundy’s financial position as of December 31, 2011 and December 29, 2012 and its results of operations and cash flows for each of the three years in the period ended December 29, 2012 on a parent company-only basis.
In the parent company-only financial statements, Roundy’s investment in its sole direct subsidiary is stated at cost plus equity in undistributed earnings of the subsidiary since the date of formation. Roundy’s share of income is recorded as equity in net income of the unconsolidated subsidiary. The parent company only financial statements should be read in conjunction with Roundy’s consolidated financial statements.
Roundy’s, Inc.
Consolidated Statements of Income
(In thousands)
| | | | | | | | | | | | |
| | | Fiscal 2010 | | | Fiscal 2011 | | | Fiscal 2012 | |
Net Sales | | $ | — | | | $ | — | | | $ | — | |
| | | |
Costs and Expenses: | | | | | | | | | | | | |
Cost of sales | | | — | | | | — | | | | — | |
Operating and administrative | | | — | | | | 75 | | | | — | |
Interest: | | | | | | | | | | | | |
Interest income | | | (231 | ) | | | (187 | ) | | | — | |
Interest expense, dividends on preferred stock | | | 2,716 | | | | — | | | | — | |
| | | | | | | | | | | | |
| | | 2,485 | | | | (112 | ) | | | — | |
| | | | | | | | | | | | |
Income (Loss) before Equity in Earnings of Subsidiary and Income Taxes | | | (2,485 | ) | | | 112 | | | | — | |
Equity in Earnings (Loss) of Unconsolidated Subsidiary | | | 48,667 | | | | 47,888 | | | | (69,249 | ) |
| | | | | | | | | | | | |
Income (Loss) before Income Taxes | | | 46,182 | | | | 48,000 | | | | (69,249 | ) |
Provision (Benefit) for Income Taxes | | | (12 | ) | | | (48 | ) | | | — | |
| | | | | | | | | | | | |
Net Income (Loss) | | $ | 46,194 | | | $ | 48,048 | | | $ | (69,249 | ) |
| | | | | | | | | | | | |
81
Roundy’s, Inc.
Consolidated Balance Sheet
(In thousands)
| | | | | | | | |
| | | 12/31/2011 | | | 12/29/2012 | |
| Assets | | | | | | | | |
| | |
Current Assets: | | | | | | | | |
Cash and cash equivalents | | $ | 15 | | | $ | 15 | |
| | | | | | | | |
Total Current Assets | | | 15 | | | | 15 | |
| | | | | | | | |
| | |
Other Assets: | | | | | | | | |
Investment in subsidiary | | | 177,204 | | | | 193,251 | |
| | | | | | | | |
Total Other Assets | | | 177,204 | | | | 193,251 | |
| | | | | | | | |
| | |
Total Assets | | $ | 177,219 | | | $ | 193,266 | |
| | | | | | | | |
| | |
| Liabilities and Shareholders’ Equity | | | | | | | | |
| | |
Current Liabilities: | | | | | | | | |
Income taxes payable | | $ | 44 | | | $ | — | |
| | | | | | | | |
Total Current Liabilities | | | 44 | | | | — | |
| | | | | | | | |
Shareholders’ Equity: | | | | | | | | |
Preferred stock | | | 1,044 | | | | — | |
Common stock | | | 271 | | | | 457 | |
Additional paid-in capital | | | — | | | | 114,120 | |
Retained earnings | | | 221,365 | | | | 125,649 | |
Accumulated other comprehensive loss | | | (45,505 | ) | | | (46,960 | ) |
| | | | | | | | |
Total Shareholders’ Equity | | | 177,175 | | | | 193,266 | |
| | | | | | | | |
Total Liabilities and Shareholders’ Equity | | $ | 177,219 | | | $ | 193,266 | |
| | | | | | | | |
82
Roundy’s, Inc.
Consolidated Statements of Cash Flows
(In thousands)
| | | | | | | | | | | | |
| | | Fiscal 2010 | | | Fiscal 2011 | | | Fiscal 2012 | |
Cash Flows from Operating Activities: | | | | | | | | | | | | |
Net Income (Loss) | | $ | 46,194 | | | $ | 48,048 | | | $ | (69,249 | ) |
| | | |
Adjustments to reconcile net income (loss) to net cash flows provided by operating activities: | | | | | | | | | | | | |
Interest earned on shareholder notes receivables | | | (218 | ) | | | (187 | ) | | | — | |
Deferred dividends on preferred stock | | | 2,716 | | | | — | | | | — | |
Equity in net (income) loss of unconsolidated subsidiaries | | | (48,667 | ) | | | (47,888 | ) | | | 69,249 | |
Forgiveness of shareholder note receivable | | | — | | | | 75 | | | | — | |
Deferred income taxes | | | — | | | | — | | | | — | |
Stock-based compensation expense | | | — | | | | — | | | | — | |
| | | |
Changes in working capital | | | | | | | | | | | | |
Income taxes | | | (12 | ) | | | (48 | ) | | | — | |
| | | | | | | | | | | | |
Net cash flows provided by operating activities | | | 13 | | | | — | | | | — | |
| | | |
Cash Flows From Investing Activities | | | | | | | | | | | | |
Investment of net common stock issuance proceeds in subsidiary | | | — | | | | — | | | | (111,831 | ) |
| | | | | | | | | | | | |
Net cash flows used in investing activities | | | — | | | | — | | | | (111,831 | ) |
Cash Flows From Financing Activities: | | | | | | | | | | | | |
Dividends and liquidation value of preferred stock paid to preferred shareholders | | | (70,828 | ) | | | — | | | | — | |
Dividend from subsidiary | | | 149,841 | | | | 439 | | | | 25,998 | |
Dividends paid to common shareholders | | | (77,006 | ) | | | — | | | | (25,998 | ) |
Purchase of common stock | | | (2,156 | ) | | | (439 | ) | | | — | |
Issuance of common stock, net of issuance costs | | | 65 | | | | — | | | | 111,831 | |
Repayment of shareholder notes receivable | | | 72 | | | | — | | | | — | |
| | | | | | | | | | | | |
Net cash flows provided by (used in) in financing activities | | | (12 | ) | | | — | | | | 111,831 | |
| | | | | | | | | | | | |
Net Increase in Cash and Cash Equivalents | | | 1 | | | | — | | | | — | |
Cash and Cash Equivalents, Beginning of Year | | | 14 | | | | 15 | | | | 15 | |
| | | | | | | | | | | | |
Cash and Cash Equivalents, End of Year | | $ | 15 | | | $ | 15 | | | $ | 15 | |
| | | | | | | | | | | | |
Supplemental Cash Flow Information: | | | | | | | | | | | | |
Shareholder notes cancelled in exchange for common stock | | $ | — | | | $ | 4,203 | | | $ | — | |
Dividends utilized for repayment of shareholder notes receivable | | | 2,165 | | | | — | | | | — | |
83
ITEM 9—CHANGES IN AND DISAGREEMENTS WITH ACCOUNTANTS ON ACCOUNTING AND FINANCIAL DISCLOSURE
None.
ITEM 9A—CONTROLS AND PROCEDURES
Evaluation of Disclosure Controls and Procedures
As required by Rule 13a-15 under the Securities Exchange Act of 1934 (“Exchange Act”), the Chief Executive Officer and the Chief Financial Officer, together with a disclosure review committee appointed by the Chief Executive Officer, evaluated Roundy’s disclosure controls and procedures as of December 29, 2012, the end of the period covered by this report. Based on that evaluation, Roundy’s Chief Executive Officer and Chief Financial Officer concluded that Roundy’s disclosure controls and procedures (as defined in Rule 13a-15(e) of the Exchange Act) were effective as of the end of the period covered by this report to provide reasonable assurance that information required to be disclosed by us in the reports that we file or submit under the Exchange Act is recorded, processed, summarized and reported within the time periods specified in the SEC’s rules and forms, and that such information is accumulated and communicated to our management, including the Chief Executive Officer and Chief Financial Officer, as appropriate, to allow timely decisions regarding required disclosure.
Management’s Annual Report on Internal Control Over Financial Reporting
Our management is responsible for establishing and maintaining adequate internal control over financial reporting, as such term is defined in Rule 13a-15(f) under the Exchange Act, as amended. Under the supervision of management and with the participation of our management, including our CEO and CFO, we conducted an evaluation of the effectiveness of our internal control over financial reporting as of December 29, 2012 based on the framework in Internal Control-Integrated Framework, issued by the Committee of Sponsoring Organizations of the Treadway Commission. Based on our evaluation, we concluded that our internal control over financial reporting was effective as of December 29, 2012.
This annual report does not include an attestation report regarding internal controls over financial reporting from Ernst & Young LLP, our independent registered public accounting firm. Management’s report was not subject to attestation by our independent registered public accounting firm pursuant to Section 404(c) to the Sarbanes-Oxley of 2002 that permits Roundy’s to provide only management’s report in this Annual Report on Form 10-K.
Changes in Internal Control over Financial Reporting
There were no changes in our internal control over financial reporting during the most recent fiscal quarter that have materially affected, or are reasonably likely to materially affect, our internal control over financial reporting.
ITEM 9B—OTHER INFORMATION
None.
84
PART III
ITEM 10—DIRECTORS, EXECUTIVE OFFICERS AND CORPORATE GOVERNANCE
Code of Ethics for Chief Executive Officer, Chief Financial Officer and Chief Accounting Officer—We have adopted a Code of Business Conduct which applies to our chief executive officer, chief financial officer, chief accounting officer and all our other employees, and which can be found through our website, www.roundys.com under the “Investor Relations” section. Any amendments or waivers to the Code of Business Conduct applicable to our chief executive officer, chief financial officer or chief accounting officer may also be found through our website, www.roundys.com under the “Investor Relations” section.
The information required by Item 401 of Regulation S-K will be included under the captions “Election of Directors” and “Directors and Executive Officers” in the Company’s definitive Proxy Statement for the Annual Meeting of Stockholders (“Fiscal 2012 Proxy Statement”) to be held May 17, 2013, which section is incorporated in this item by reference. The information required by Items 405, 407(d)(4) and 407(d)(5) of Regulation S-K will be included under the captions “Stock Ownership Information—Section 16(a) Beneficial Ownership Reporting Compliance” and “Corporate Governance” in the Fiscal 2012 Proxy Statement, which sections are incorporated in this item by reference.
ITEM 11—EXECUTIVE COMPENSATION
The information required by Item 402 of Regulation S-K will be included under the captions “Executive Compensation” and “Director Compensation” in the Fiscal 2012 Proxy Statement, which section is incorporated in this item by reference. The information required by Item 407(e)(4) of Regulation S-K will be included under the caption “Compensation Committee Interlocks and Insider Participation” in the Fiscal 2012 Proxy Statement, which section is incorporated in this item by reference.
The information required by Item 407(e)(5) of Regulation S-K will be included under the caption “Compensation Committee Report” in the Fiscal 2012 Proxy Statement, which section is incorporated in this item by reference; however, such information is only “furnished” hereunder and not deemed “filed” for purposes of Section 18 of the Securities Exchange Act of 1934.
ITEM 12—SECURITY OWNERSHIP OF CERTAIN BENEFICIAL OWNERS AND MANAGEMENT
The information required by this item will appear under the headings “Stock Ownership Information” in our Fiscal 2012 Proxy Statement, which section is incorporated in this item by reference.
The information required by Item 201(d) of Regulation S-K will be included under the caption “Stock Ownership Information” in our Fiscal 2012 Proxy Statement, which section is incorporated in this item by reference.
The information required by Item 403 of Regulation S-K will be included under the caption “Stock Ownership Information” in our Fiscal 2012 Proxy Statement, which section is incorporated in this item by reference.
ITEM 13—CERTAIN RELATIONSHIPS AND RELATED TRANSACTIONS AND DIRECTOR INDEPENDENCE
The information required by Item 404 of Regulation S-K will be included under the caption “Related Person Transactions” in our Fiscal 2012 Proxy Statement, which sections are incorporated in this item by reference.
The information required by Item 407(a) of Regulation S-K will be included under the caption “Director Independence” in our Fiscal 2012 Proxy Statement, which sections are incorporated in this item by reference.
ITEM 14—PRINCIPAL ACCOUNTING FEES AND SERVICES
The information required by this item will appear under the heading “Ratification of Selection of Independent Registered Public Accounting Firm (Proposal No. 2)” in our Fiscal 2012 Proxy Statement, which section is incorporated in this item by reference.
85
PART IV
ITEM 15—EXHIBITS, FINANCIAL STATEMENT SCHEDULES
| 1. | The following financial statements are included in Part II, Item 8—Financial Statements and Supplementary Data and are incorporated herein by reference: |
Consolidated Balance Sheets, December 31, 2011 and December 29, 2012
For the Fiscal Years Ended January 1, 2011, December 31, 2011 and December 29, 2012:
Consolidated Statements of Income
Consolidated Statements of Comprehensive Income
Consolidated Statements of Cash Flows
Consolidated Statements of Shareholders’ Equity
| 2. | Financial Statement Schedules: |
Schedule II—Valuation and Qualifying Accounts: The following table displays changes in our valuation accounts:
| | | | | | | | | | | | | | | | |
Description | | Balance at
Beginning of
Fiscal year | | | Additions | | | Deductions | | | Balance at
End of
Fiscal year | |
Allowance for losses on accounts receivable: | | | | | | | | | | | | | | | | |
Fiscal 2010 | | $ | 988 | | | $ | 736 | | | $ | (830 | ) | | $ | 894 | |
Fiscal 2011 | | | 894 | | | | 743 | | | | (867 | ) | | | 770 | |
Fiscal 2012 | | | 770 | | | | 758 | | | | (736 | ) | | | 792 | |
All other schedules are omitted since the required information is not present.
Refer to the Exhibit Index incorporated herein by reference. Each management contract or compensatory plan or arrangement required to be filed as an exhibit to this report is identified in the Exhibit Index by an asterisk following the Exhibit Number.
86
Signatures
Pursuant to the requirements of Section 13 or 15(d) of the Securities Exchange Act of 1934, the registrant has duly caused this report to be signed on its behalf by the undersigned, thereunto duly authorized.
| | |
| Roundy’s, Inc. |
| |
| By: | | /S/ DARREN W. KARST |
| | Darren W. Karst Executive Vice President, Chief Financial Officer and Assistant Secretary |
|
| Date: March 22, 2013 |
Pursuant to the requirements of the Securities Exchange Act of 1934, this report has been signed below by the following persons on behalf of the registrant and in the capacities and on March 22, 2013.
| | |
/S/ ROBERT A. MARIANO Robert A. Mariano Chairman, President and Chief Executive Officer and Director (Principal Executive Officer) | | /S/ DARREN W. KARST Darren W. Karst Executive Vice President, Chief Financial Officer and Assistant Secretary |
| |
/S/ MICHAEL P. TURZENSKI Michael P. Turzenski Group Vice President—Chief Accounting Officer | | * Christopher F. Larson Director |
| |
* Patrick J. Condon Director | | * Avy H. Stein Director |
| |
* Ralph W. Drayer Director | | * John R. Willis Director |
| |
* Gregory P. Josefowicz Director | | |
| | |
| |
| * By: | | /S/ EDWARD G. KITZ |
| | Edward G. Kitz Attorney-in-Fact |
87
EXHIBIT INDEX
| | |
Exhibit Number | | Description |
| |
| 3.1 | | Second Amended and Restated Certificate of Incorporation of Roundy’s, Inc. (incorporated by reference to Exhibit 10.1 to Amendment No. 2 to the registrant’s Registration Statement on Form S-1 dated January 26, 2012 in Commission File No. 333-178311) |
| |
| 3.2 | | Amended and Restated By-laws of Roundy’s, Inc. (incorporated by reference to Exhibit 10.1 to Amendment No. 2 to the registrant’s Registration Statement on Form S-1 dated January 26, 2012 in Commission File No. 333-178311) |
| |
| 4.1 | | Specimen Common Stock Certificate (incorporated by reference to Exhibit 10.1 to Amendment No. 2 to the registrant’s Registration Statement on Form S-1 dated January 26, 2012 in Commission File No. 333-178311) |
| |
| 10.1 | | Amended and Restated Credit Agreement, dated November 3, 2005, by and among Roundy’s Supermarkets, Inc., as borrower, Bear Stearns Corporate Lending Inc., as Administrative Agent, Goldman Sachs Credit Partners L.P., as Syndication Agent, and LaSalle Bank National Association, JPMorgan Chase Bank, N.A., and Coöperatieve Centrale. (incorporated by reference to Exhibit 10.1 to the registrant’s Registration Statement on Form S-1 dated December 5, 2011 in Commission File No. 333-178311) |
| |
| 10.2 | | First Amendment to the Amended and Restated Credit Agreement, dated June 7, 2006, by and among Roundy’s Supermarkets, Inc., as borrower, Bear Stearns Corporate Lending Inc., as Administrative Agent, Goldman Sachs Credit Partners L.P., as Syndication Agent, and LaSalle Bank National Association, JPMorgan Chase Bank, N.A., and Coöperatieve Centrale Raiffeisen-Boerenleenbank B.A., “Rabobank Nederland”, New York Branch. (incorporated by reference to Exhibit 10.2 to the registrant’s Registration Statement on Form S-1 dated December 5, 2011 in Commission File No. 333-178311) |
| |
| 10.3 | | Second Amendment to the Amended and Restated Credit Agreement, dated January 29, 2007, by and among Roundy’s Supermarkets, Inc., as borrower, Bear Stearns Corporate Lending Inc., as Administrative Agent, Goldman Sachs Credit Partners L.P., as Syndication Agent, and LaSalle Bank National Association, JPMorgan Chase Bank, N.A., and Coöperatieve Centrale Raiffeisen-Boerenleenbank B.A., “Rabobank Nederland”, New York Branch. (incorporated by reference to Exhibit 10.3 to the registrant’s Registration Statement on Form S-1 dated December 5, 2011 in Commission File No. 333-178311) |
| |
| 10.4 | | Third Amendment to the Amended and Restated Credit Agreement, dated October 30, 2009, by and among Roundy’s Supermarkets, Inc., as borrower, JPMorgan Chase Bank, N.A., as Administrative Agent, Goldman Sachs Credit Partners L.P., as Syndication Agent, and LaSalle Bank National Association, and Coöperatieve Centrale. (incorporated by reference to Exhibit 10.4 to the registrant’s Registration Statement on Form S-1 dated December 5, 2011 in Commission File No. 333-178311) |
| |
| 10.5 | | Fourth Amendment to the Amended and Restated Credit Agreement, dated April 16, 2010, by and among Roundy’s Supermarkets, Inc., as borrower, JPMorgan Chase Bank, N.A., as Administrative Agent, Goldman Sachs Credit Partners L.P., as Syndication Agent, and LaSalle Bank National Association, and Coöperatieve Centrale Raiffeisen-Boerenleenbank B.A., “Rabobank Nederland”, New York Branch. (incorporated by reference to Exhibit 10.5 to the registrant’s Registration Statement on Form S-1 dated December 5, 2011 in Commission File No. 333-178311) |
| |
| 10.6 | | Second Lien Credit Agreement, dated April 16, 2010, by and among Roundy’s Supermarkets, Inc., as borrower, Credit Suisse Securities (USA) LLC, as Sole Bookrunner, Moelis & Company LLC, as Syndication Agent, and the lenders party thereto. (incorporated by reference to Exhibit 10.6 to the registrant’s Registration Statement on Form S-1 dated December 5, 2011 in Commission File No. 333-178311) |
88
| | |
Exhibit Number | | Description |
| |
| 10.7 | | Investor Rights Agreement, dated June 6, 2002, by and among, Roundy’s Acquisition Corp., Willis Stein & Partners III, L.P., Willis Stein & Partners III-C, L.P., Willis Stein & Partners Dutch III-A, L.P., Willis Stein & Partners Dutch III-B, L.P., and Roundy’s Acquisition LLC, Stichting Pensioenfonds ABP, Stichting Pensioenfonds Zong en Welzijn, previously known as Stichting Pensioenfonds voor de Gezondheid Geestelijke en Maatschappelijke Belangen, The Northwestern Mutual Life Insurance Company, Norwest Equity Partners VII LP, and Randolph Street Partners IV, Robert A. Mariano and Darren W. Karst. (incorporated by reference to Exhibit 10.7 to the registrant’s Registration Statement on Form S-1 dated December 5, 2011 in Commission File No. 333-178311) |
| |
| 10.8* | | Restricted Stock Purchase Agreement and Release, dated December 5, 2002, by and among Roundy’s Acquisition Corp. and Ralph W. Drayer. (incorporated by reference to Exhibit 10.28 to the registrant’s Registration Statement on Form S-1 dated December 5, 2011 in Commission File No. 333-178311) |
| |
| 10.9* | | Form of Roundy’s, Inc. 2012 Incentive Compensation Plan. (incorporated by reference to Exhibit 10.31 to Amendment No. 2 to the registrant’s Registration Statement on Form S-1 dated January 26, 2012 in Commission File No. 333-178311) |
| |
| 10.10* | | Form of Restricted Stock Agreement pursuant to the Roundy’s, Inc. 2012 Incentive Compensation Plan. (incorporated by reference to Exhibit 10.32 to Amendment No. 2 to the registrant’s Registration Statement on Form S-1 dated January 26, 2012 in Commission File No. 333-178311) |
| |
| 10.11* | | Form of Roundy’s, Inc. Severance Pay Plan. (incorporated by reference to Exhibit 10.33 to Amendment No. 2 to the registrant’s Registration Statement on Form S-1 dated January 26, 2012 in Commission File No. 333-178311) |
| |
| 10.12* | | Form of Employment Agreement for Robert A. Mariano. (incorporated by reference to Exhibit 10.35 to Amendment No. 2 to the registrant’s Registration Statement on Form S-1 dated January 26, 2012 in Commission File No. 333-178311) |
| |
| 10.13* | | Form of Employment Agreement for Darren W. Karst. (incorporated by reference to Exhibit 10.36 to Amendment No. 2 to the registrant’s Registration Statement on Form S-1 dated January 26, 2012 in Commission File No. 333-178311) |
| |
| 10.14 | | Credit Agreement, dated as of February 13, 2012, by and among Roundy’s Supermarkets, Inc., the lenders party thereto and Credit Suisse AG, as administrative agent and collateral agent, Bank of America, N.A. and Cooperatieve Centrale Raiffeisen-Boerenleebank B.A., “Rabobank Nederland” New York Branch, as co-documentation agents, JPMorgan Chase Bank, N.A., as syndication agent and as letter of credit issuer. (incorporated by reference to Exhibits 4.1 to the registrant’s Current Report on Form 8-K dated February 15, 2012 in Commission File No. 001-35422) |
| |
| 10.15 | | Guarantee and Collateral Agreement, dated as of February 13, 2012, among Roundy’s Supermarkets, Inc., certain of the Company’s subsidiaries, and Credit Suisse AG, as administrative agent and collateral agent. (incorporated by reference to Exhibits 4.2 to the registrant’s Current Report on Form 8-K dated February 15, 2012 in Commission File No. 001-35422) |
| |
| 10.16* | | Form of Indemnification Agreement for directors and executive officers. (incorporated by reference to Exhibit 10.37 to the registrant’s Post-Effective Amendment No. 1 to its Registration Statement on Form S-1 dated February 10, 2012 in Commission File No. 333-178311) |
| |
| 10.17* | | Form of Employee Confidentiality and Non-Competition Agreement by and among Roundy’s, Inc. and certain executives (incorporated by reference to Exhibit 10.39 to the registrant’s Annual Report on Form 10-K dated March 28, 2012 in Commission File No. 001-35422). |
89
| | |
Exhibit Number | | Description |
| |
| 10.18* | | Indemnification Agreement for directors and executive officers dated March 29, 2012, by and among Roundy’s, Inc. and Gregory P. Josefowicz (incorporated by reference to Exhibit 10.11 to the registrant’s Quarterly Report on Form 10-Q dated May 14, 2012 in Commission File No. 001-35422). |
| |
| 10.19* | | Restricted Stock Agreement pursuant to the Roundy’s, Inc. 2012 Incentive Compensation Plan, dated March 29, 2012 by and among Roundy’s, Inc. and Gregory P. Josefowicz (incorporated by reference to Exhibit 10.12 to the registrant’s Quarterly Report on Form 10-Q dated May 14, 2012 in Commission File No. 001-35422). |
| |
| 10.20* | | Form of Director Confidentiality and Non-Competition Agreement dated by and among Roundy’s, Inc. and directors (entered into with Gregory P. Josefowicz and Patrick J. Condon) (incorporated by reference to Exhibit 10.13 to the registrant’s Quarterly Report on Form 10-Q dated May 14, 2012 in Commission File No. 001-35422). |
| |
| 10.21* | | Indemnification Agreement for directors and officers dated May 17, 2012, by and among Roundy’s, Inc. and Patrick J. Condon. |
| |
| 10.22* | | Restricted Stock Agreement pursuant to the Roundy’s, Inc. 2012 Incentive Compensation Plan, dated May 17, 2012, by and among Roundy’s, Inc. and Patrick J. Condon. |
| |
| 21.1 | | List of subsidiaries of Roundy’s, Inc. |
| |
| 23.1 | | Consent of Ernst & Young LLP, independent registered public accounting firm |
| |
| 24.1 | | Powers of Attorney |
| |
| 31.1 | | Certification Statement of Chief Executive Officer pursuant to Section 302 of the Sarbanes-Oxley Act of 2002 |
| |
| 31.2 | | Certification Statement of Chief Financial Officer pursuant to Section 302 of the Sarbanes-Oxley Act of 2002 |
| |
| 32.1 | | Certification Statement of Chief Executive Officer pursuant to Section 906 of the Sarbanes-Oxley Act of 2002 |
| |
| 32.2 | | Certification Statement of Chief Financial Officer pursuant to Section 906 of the Sarbanes-Oxley Act of 2002 |
| |
| 101.INS | | XBRL Instance Document |
| |
| 101.SCH | | XBRL Taxonomy Extension Schema Document |
| |
| 101.CAL | | XBRL Taxonomy Calculation Linkbase Document |
| |
| 101.DEF | | XBRL Taxonomy Extension Definition Linkbase Document |
| |
| 101.LAB | | XBRL Taxonomy Extension Label Linkbase Document |
| |
| 101.PRE | | XBRL Taxonomy Extension Presentation Linkbase Document |
| • | Denotes a management contract or compensatory plan. |
90