Exhibit 99.1

Lender Presentation
December 2013
Disclaimer
All statements other than statements of historical fact included in this presentation are forward-looking statements. We derived many of our forward-looking statements from our operating budgets and forecasts, which are based upon many detailed assumptions. While we believe that our assumptions are reasonable, we caution that it is very difficult to predict the impact of known factors, and it is impossible for us to anticipate all factors that could affect our actual results.
Actual results may differ materially from those indicated by these forward-looking statements as a result of various factors, including those discussed in the Company’s most recent Annual Form 10-K and Quarterly Form 10-Q, which are available from the SEC or from Roundy’s. These factors should be considered carefully and undue reliance should not be placed on these forward-looking statements. We cannot ensure that actual results will not be materially different from those expressed or implied by these forward-looking statements.
In addition, any forward-looking statements represent our estimates only as of today and should not be relied upon as representing our estimates as of any subsequent date. While we may elect to update forward-looking statements at some point in the future, we specifically disclaim any obligation to do so, even if our estimates change.
This presentation also contains certain non-GAAP financial measures such as Adjusted EBITDA, Adjusted EBITDAR and Return on Invested Capital (“ROIC”). Management believes that Adjusted EBITDA, Adjusted EBITDAR and ROIC are measures commonly reported by issuers and widely used by investors as indicators of a company’s operating performance and liquidity. These non-GAAP financial measures, while providing useful information, should not be considered in isolation or as a substitute for Roundy’s net income as an indicator of operating performance or as an alternative to cash flow as a measure of liquidity. Investors should carefully consider the specific items included in our computations of Adjusted EBITDA, Adjusted EBITDAR and ROIC. Adjusted EBITDA, Adjusted EBITDAR and ROIC do not have any standardized meanings prescribed by GAAP, and therefore, are unlikely to be comparable to similar measures presented by other companies. Reconciliations between certain non-GAAP financial measures and the GAAP financial measures are included in the last slides of this presentation.
This presentation is not intended to, and does not constitute, an offer to sell or a solicitation of an offer to buy securities.
Disclaimer
Industry Data
Unless otherwise indicated, information contained in this presentation concerning our industry and the markets in which we operate is based on information from independent industry and research organizations, such as the Food Marketing Institute, Willard Bishop and other third-party sources (including industry publications, surveys and forecasts), and management estimates. Management estimates are derived from publicly available information released by independent industry analysts and third-party sources, as well as data from our internal research, and are based on assumptions made by us upon reviewing such data and our knowledge of such industry and markets, which we believe to be reasonable. Management has derived statewide market share data based on various sources, including the Metro Market Study. Although we believe the data from these third-party sources are reliable, we have not independently verified this information. In addition, projections, assumptions and estimates of the future performance of the industry in which we operate and our future performance are necessarily subject to a high degree of uncertainty and risk due to a variety of factors. These factors could cause results to differ materially from those expressed in the estimates made by the independent parties and by us.
In this presentation, we refer to our estimated weighted average market share in Wisconsin of 37%. We calculate this estimate by multiplying our market shares based on sales volumes, as reported in the Metro Market Study, in each of our reported Wisconsin markets (excluding Kenosha) by the respective number of our stores in each market and dividing that amount by our total stores in all such markets. We exclude the market of Kenosha (where we operate three stores) because the Metro Market Study aggregates Kenosha with Chicago market data. We use the number of our stores in each market, as opposed to our net sales, to calculate our estimated weighted average market share so that we can better compare our weighted average market share to that of other food retailers where store data is available but sales data may not be. Approximately half of our Wisconsin stores are in Milwaukee, where our market share is approximately 45%.
Agenda
1 Transaction overview
2 Business update
3 Mariano’s: Acquisition of Dominick’s stores
4 Financial overview
Appendix

1. Transaction overview
Transaction summary
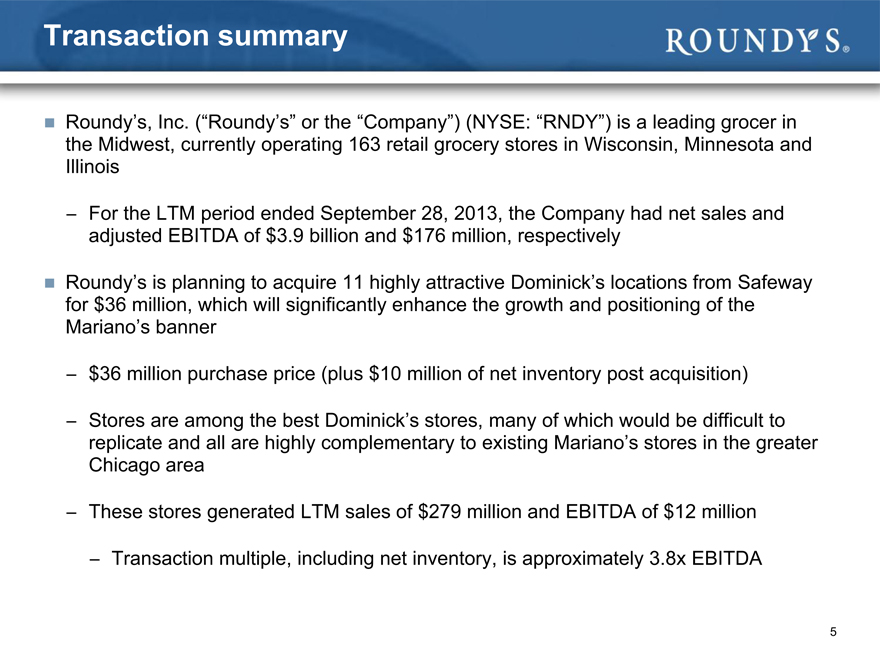
Roundy’s, Inc. (“Roundy’s” or the “Company”) (NYSE: “RNDY”) is a leading grocer in the Midwest, currently operating 163 retail grocery stores in Wisconsin, Minnesota and Illinois
For the LTM period ended September 28, 2013, the Company had net sales and adjusted EBITDA of $3.9 billion and $176 million, respectively
Roundy’s is planning to acquire 11 highly attractive Dominick’s locations from Safeway for $36 million, which will significantly enhance the growth and positioning of the Mariano’s banner
$36 million purchase price (plus $10 million of net inventory post acquisition)
Stores are among the best Dominick’s stores, many of which would be difficult to replicate and all are highly complementary to existing Mariano’s stores in the greater Chicago area
These stores generated LTM sales of $279 million and EBITDA of $12 million — Transaction multiple, including net inventory, is approximately 3.8x EBITDA
2. Business update
Overview of Roundy’s
Current locations
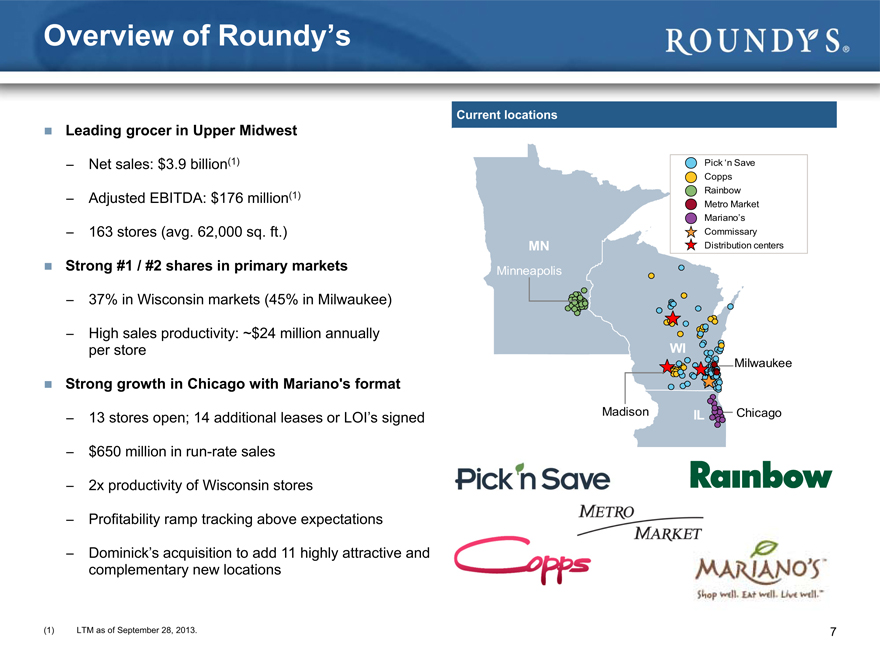
Leading grocer in Upper Midwest
- Net sales: $3.9 billion(1) Pick ‘n Save
Copps Rainbow
- Adjusted EBITDA: $176 million(1) Metro Market
Mariano’s
- 163 stores (avg. 62,000 sq. ft.) Commissary
MN Distribution centers
Strong #1 / #2 shares in primary markets Minneapolis
- 37% in Wisconsin markets (45% in Milwaukee)
- High sales productivity: ~$24 million annually per store WI
Milwaukee
Strong growth in Chicago with Mariano’s format
- 13 stores open; 14 additional leases or LOI’s signed Madison IL Chicago
- $650 million in run-rate sales
- 2x productivity of Wisconsin stores
- Profitability ramp tracking above expectations
- Dominick’s acquisition to add 11 highly attractive and complementary new locations
(1) | | LTM as of September 28, 2013. |
Among best positioned grocers in U.S….…
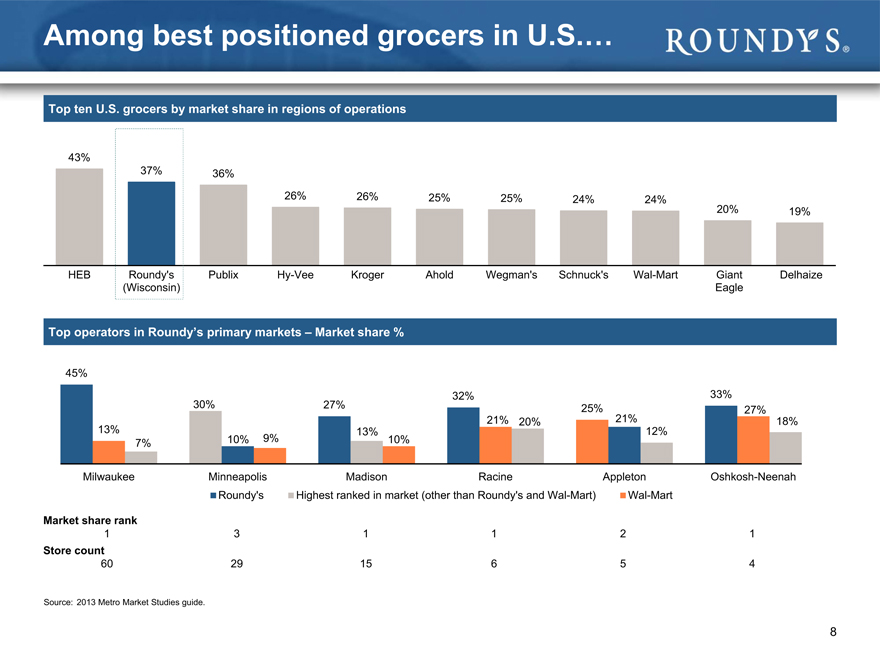
Top ten U.S. grocers by market share in regions of operations
43%
37% 36%
26% 26% 25% 25% 24% 24%
20% 19%
HEB Roundy’s Publix Hy-Vee Kroger Ahold Wegman’s Schnuck’s Wal-Mart Giant Delhaize (Wisconsin) Eagle
Top operators in Roundy’s primary markets – Market share %
45%
30% 32% 33% 27% 25% 27% 21% 20% 21% 18% 13% 13% 12%
7% 10% 9% 10%
Milwaukee Minneapolis Madison Racine Appleton Oshkosh-Neenah Roundy’s Highest ranked in market (other than Roundy’s and Wal-Mart) Wal-Mart
Market share rank
13 1 1 2 1
Store count
60 29 15 6 5 4
Source: 2013 Metro Market Studies guide.
…with strong store productivity and attractive margin profile
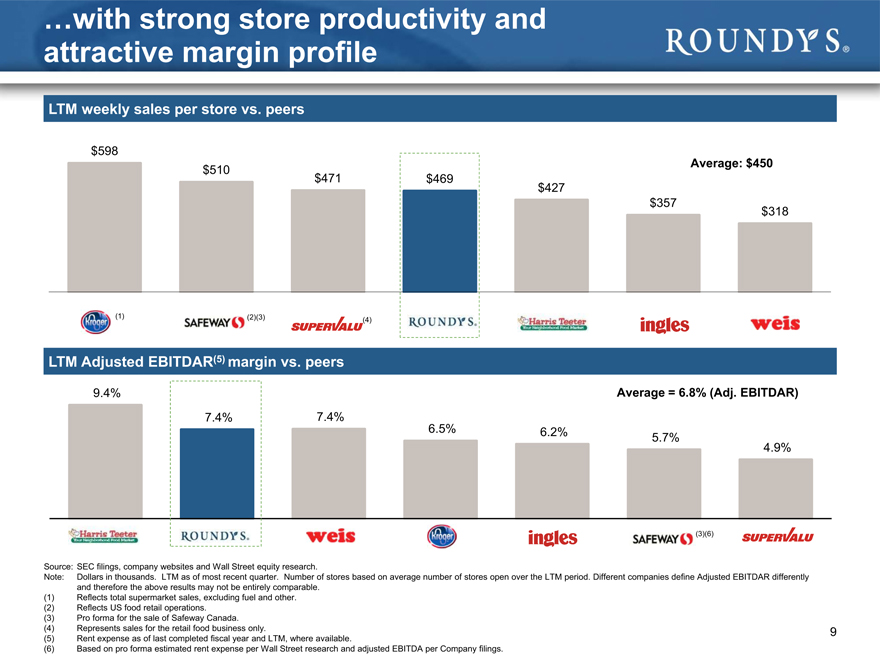
LTM weekly sales per store vs. peers
$598
Average: $450 $510 $471 $469 $427 $357 $318
Kroger Safeway SuperValu Roundy’s Harris Teeter Ingles Weis
LTM Adjusted EBITDAR(5) margin vs. peers
9.4% Average = 6.8% (Adj. EBITDAR)
7.4% 7.4%
6.5% 6.2%
5.7%
4.9%
(3)(6)
Source: SEC filings, company websites and Wall Street equity research.
Note: Dollars in thousands. LTM as of most recent quarter. Number of stores based on average number of stores open over the LTM period. Different companies define Adjusted EBITDAR differently and therefore the above results may not be entirely comparable.
(1) | | Reflects total supermarket sales, excluding fuel and other. (2) Reflects US food retail operations. |
(3) | | Pro forma for the sale of Safeway Canada. |
(4) Represents sales for the retail food business only. (5) Rent expense as of last completed fiscal year and LTM, where available.
(6) | | Based on pro forma estimated rent expense per Wall Street research and adjusted EBITDA per Company filings. |
9
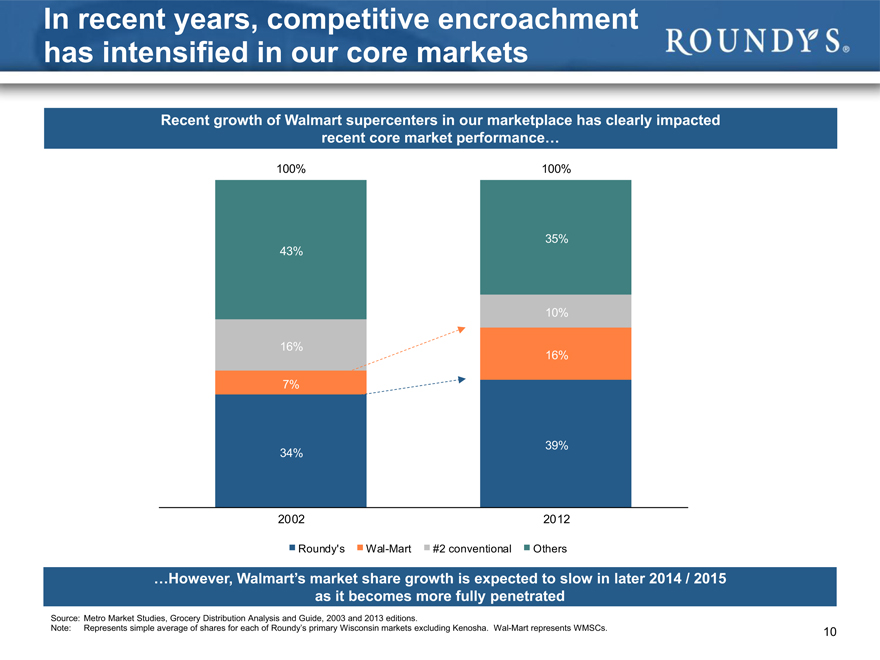
In recent years, competitive encroachment has intensified in our core markets
Recent growth of Walmart supercenters in our marketplace has clearly impacted recent core market performance…
100% 100%
35% 43%
10%
16%
16%
7%
39% 34%
2002 2012
Roundy’s Wal-Mart #2 conventional Others
…However, Walmart’s market share growth is expected to slow in later 2014 / 2015 as it becomes more fully penetrated
Source: Metro Market Studies, Grocery Distribution Analysis and Guide, 2003 and 2013 editions.
Note: Represents simple average of shares for each of Roundy’s primary Wisconsin markets excluding Kenosha. Wal-Mart represents WMSCs. 10
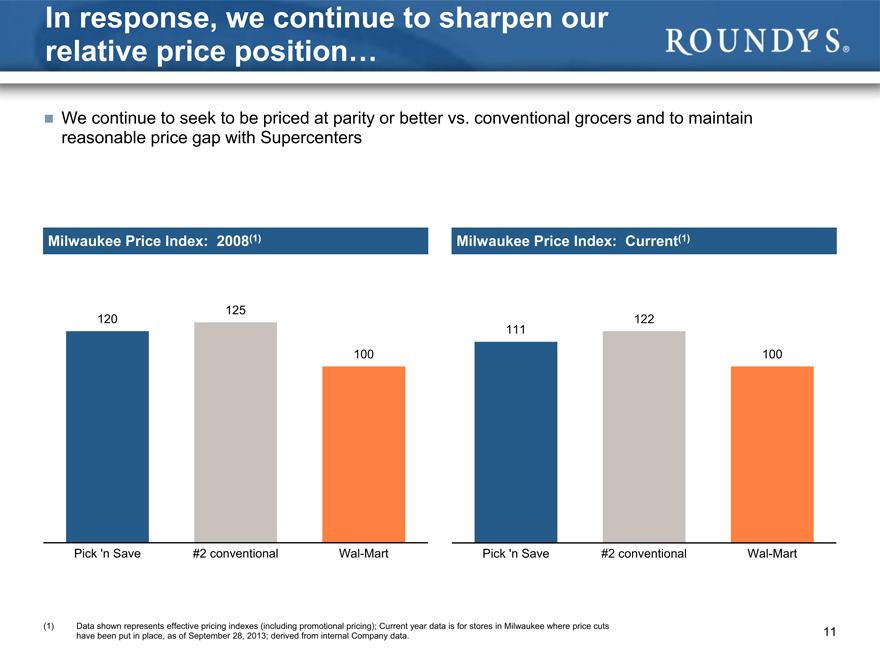
In response, we continue to sharpen our relative price position…
We continue to seek to be priced at parity or better vs. conventional grocers and to maintain reasonable price gap with Supercenters
Milwaukee Price Index: 2008(1)
Milwaukee Price Index: Current(1)
120125 100 111 122 100 Pick ‘n Save #2 conventional Wal-Mart Pick ‘n Save #2 conventional Wal-Mart
(1) Data shown represents effective pricing indexes (including promotional pricing); Current year data is for stores in Milwaukee where price cuts have been put in place, as of September 28, 2013; derived from internal Company data.
11
…and have implemented core market renewal projects that are now underway
In early 2013, Roundy’s launched Wave I (14 stores) of the Milwaukee renewal project to position Pick ‘n Save as the best conventional grocery operator by implementing a set of cross-functional initiatives
Based on the initial success of Wave I, we rolled out Wave II to 19 additional stores in June 2013 and to the remaining 36 Milwaukee area stores in late third quarter 2013
Improve Customer Experience Differentiate Perishable Merchandise
Increased hours in service Implemented “Field of Dreams”
departments and checkout product reset in produce departments
Measuring progress in both customer Introduced numerous new organic
items, bringing total organic product
and employee satisfaction count to ~250
Implemented case ready pork
program to improve quality and in-
stock positions
Demonstrate Value to Customers Rebrand Pick ‘n Save
Implemented price investment in key Completed media development,
categories including television and radio spots –
launched media campaign late in Q3
Launched price lock program “77
Days of Summer” Converted to new circular design
Tested new end cap and signage
Initial test results are demonstrating compelling comparable store sales growth increases and growth in profitability
12
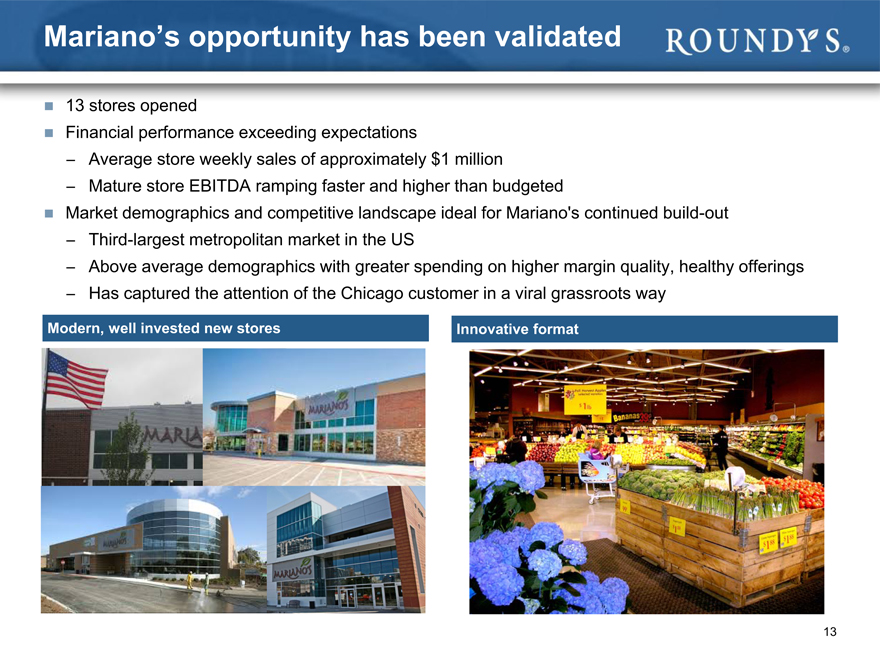
Mariano’s opportunity has been validated
13 stores opened
Financial performance exceeding expectations
Average store weekly sales of approximately $1 million
Mature store EBITDA ramping faster and higher than budgeted
Market demographics and competitive landscape ideal for Mariano’s continued build-out
Third-largest metropolitan market in the US
Above average demographics with greater spending on higher margin quality, healthy offerings
Has captured the attention of the Chicago customer in a viral grassroots way
Modern, well invested new stores Innovative format
13
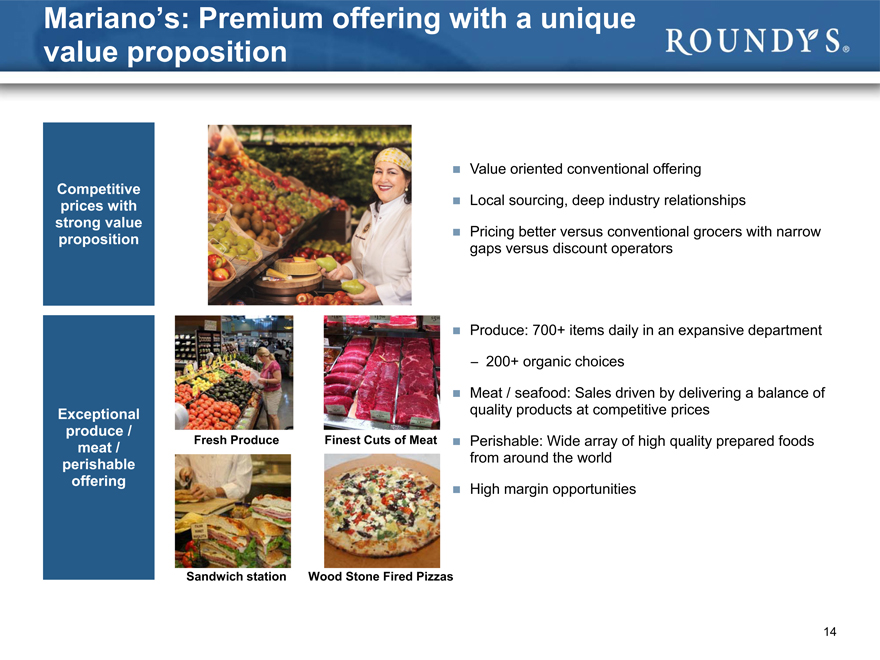
Mariano’s: Premium offering with a unique value proposition
Value oriented conventional offering
Competitive prices with Local sourcing, deep industry relationships strong value
Pricing better versus conventional grocers with narrow proposition gaps versus discount operators
Produce: 700+ items daily in an expansive department
- 200+ organic choices
Meat / seafood: Sales driven by delivering a balance of Exceptional quality products at competitive prices produce /
Fresh Produce Finest Cuts of Meat Perishable: Wide array of high quality prepared foods meat / perishable from around the world offering
High margin opportunities
Sandwich station
Wood Stone Fired Pizzas
14
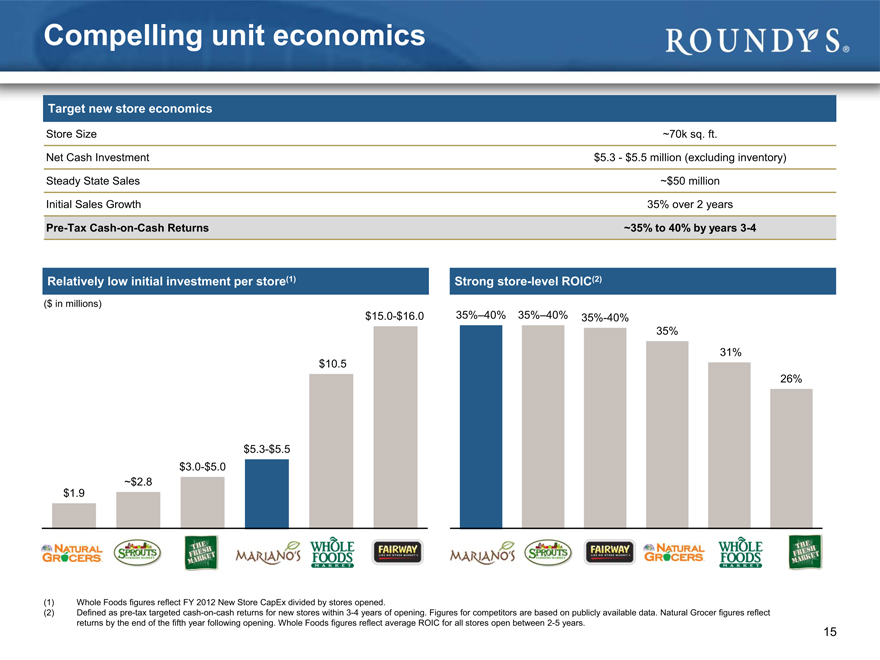
Target new store economics
Store Size ~70k sq. ft.
Net Cash Investment $5.3 - $5.5 million (excluding inventory)
Steady state Sales ~$50 million
Initial Sales Growth 35% over 2 years
Pre-Tax Cash-on-Cash Returns ~35% to 40% by years 3-4
Relatively low initial investment per store(1) Strong store-level ROIC(2)
($ in millions)
$15.0-$16.0 35%–40% 35%–40% 35%-40%
35%
31%
$10.5
26%
$5.3-$5.5
$3.0-$5.0
~$2.8
$1.9
Whole Foods figures reflect FY 2012 New Store CapEx divided by stores opened.
Defined as pre-tax targeted cash-on-cash returns for new stores within 3-4 years of opening. Figures for competitors are based on publicly available data. Natural Grocer figures reflect returns by the end of the fifth year following opening. Whole Foods figures reflect average ROIC for all stores open between 2-5 years.
(1) Whole Foods figures reflect FY 2012 New Store CapEx divided by stores opened.
(2) Defined as pre-tax targeted cash-on-cash returns for new stores within 3-4 years of opening. Figures for competitors are based on publicly available data. Natural grocer figures reflect returns by the end of the fifth year following opening. Whole Foods figures reflect average ROIC for all stores open between 2-5 years.
15
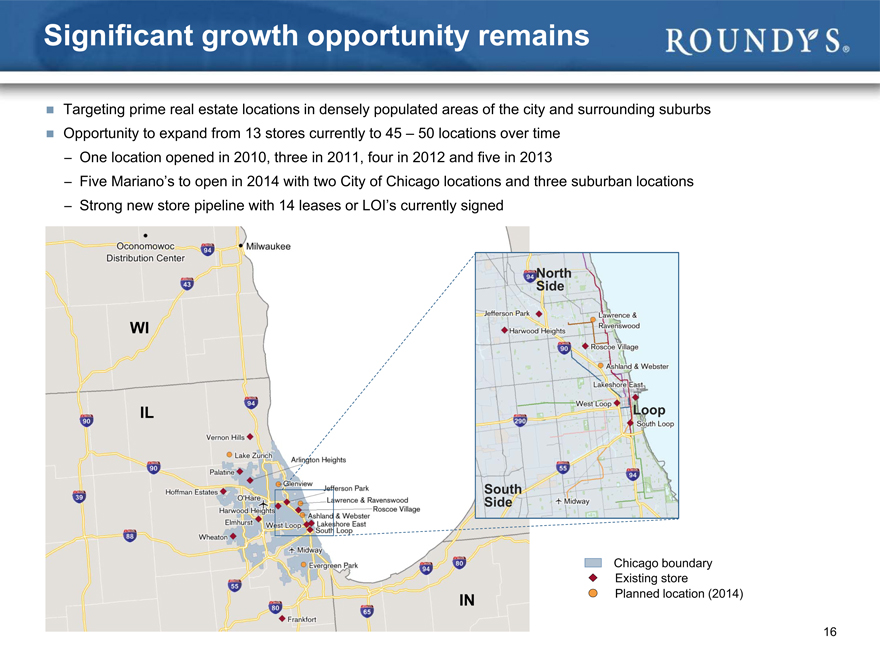
Significant growth opportunity remains
Targeting prime real estate locations in densely populated areas of the city and surrounding suburbs
Opportunity to expand from 13 stores currently to 45 – 50 locations over time
One location opened in 2010, three in 2011, four in 2012 and five in 2013
Five Mariano’s to open in 2014 with two City of Chicago locations and three suburban locations
Strong new store pipeline with 14 leases or LOI’s currently signed
North Side
WI
IL Loop
South Side
Chicago boundary Existing store IN Planned location (2014)
16
3. Mariano’s: Acquisition of Dominick’s stores
17
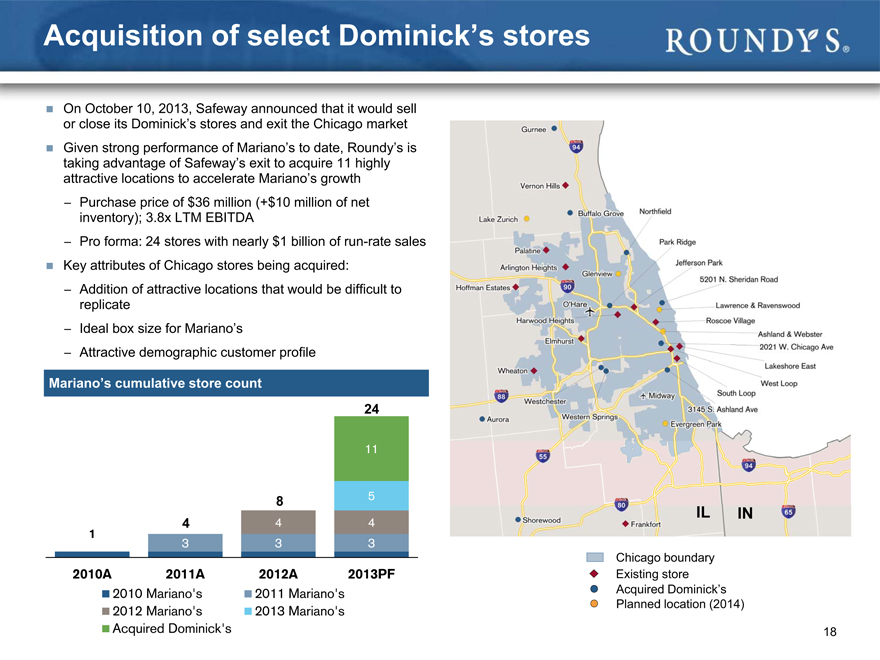
Acquisition of select Dominick’s stores
On October 10, 2013, Safeway announced that it would sell or close its Dominick’s stores and exit the Chicago market Given strong performance of Mariano’s to date, Roundy’s is taking advantage of Safeway’s exit to acquire 11 highly attractive locations to accelerate Mariano’s growth
- Purchase price of $36 million (+$10 million of net inventory); 3.8x LTM EBITDA
- Pro forma: 24 stores with nearly $1 billion of run-rate sales Key attributes of Chicago stores being acquired:
- Addition of attractive locations that would be difficult to replicate
- Ideal box size for Mariano’s
- Attractive demographic customer profile
Mariano’s cumulative store count
24
11
IL IN
Chicago boundary
2010A 2011A 2012A 2013PF Existing store
2010 Mariano’s 2011 Mariano’s Acquired Dominick’s Planned location (2014)
2012 Mariano’s 2013 Mariano’s
Acquired Dominick’s 18
Acquisition / converted store economics
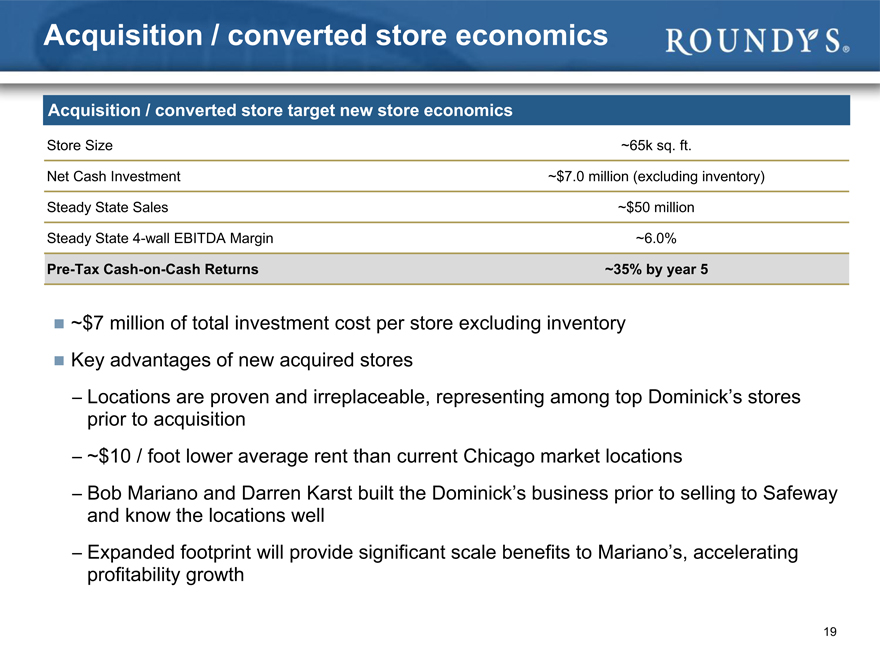
Acquisition / converted store target new store economics
Store Size ~65k sq. ft.
Net Cash Investment ~$7.0 million (excluding inventory)
Steady State Sales ~$50 million
Steady State 4-wall EBITDA Margin ~6.0%
Pre-Tax Cash-on-Cash Returns ~35% by year 5
~$7 million of total investment cost per store excluding inventory
Key advantages of new acquired stores
Locations are proven and irreplaceable, representing among top Dominick’s stores prior to acquisition
~$10 / foot lower average rent than current Chicago market locations
Bob Mariano and Darren Karst built the Dominick’s business prior to selling to Safeway and know the locations well
Expanded footprint will provide significant scale benefits to Mariano’s, accelerating profitability growth
19
4. Financial overview
20
Growing sales in challenging operating environment
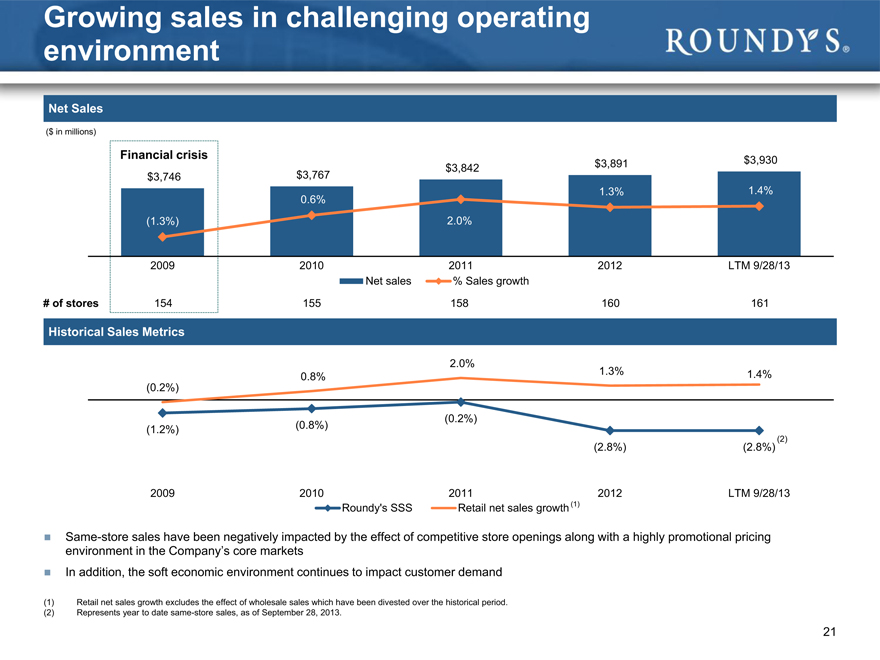
Net Sales
($ in millions)
Financial crisis $3,930 $3,842 $3,891 $3,746 $3,767
1.3% 1.4%
0.6%
(1.3%) 2.0%
2009 2010 2011 2012 LTM 9/28/13 Net sales % Sales growth # of stores 154 155 158 160 161
Historical Sales Metrics
2.0%
1.3% 1.4%
0.8%
(0.2%)
(0.2%)
(1.2%) (0.8%)
(2.8%) (2.8%)
2009 2010 2011 2012 LTM 9/28/13 Roundy’s SSS Retail net sales growth (1)
Same-store sales have been negatively impacted by the effect of competitive store openings along with a highly promotional pricing environment in the Company’s core markets
In addition, the soft economic environment continues to impact customer demand
(1) Retail net sales growth excludes the effect of wholesale sales which have been divested over the historical period.
(2) Represents year to date same-store sales, as of September 28, 2013.
21
Solid margin profile
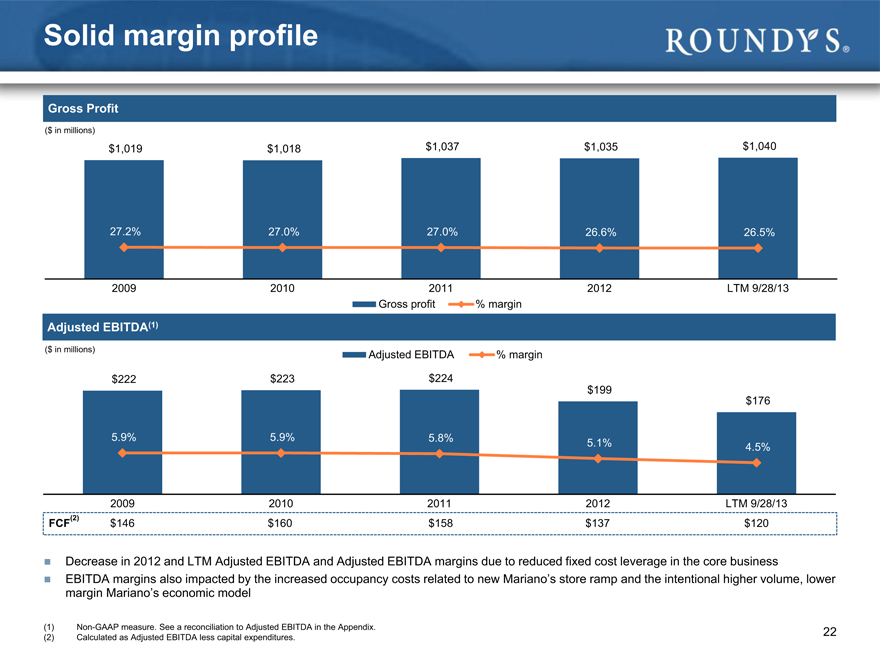
Gross Profit
($ in millions)
$1,019 $1,018 $1,037 $1,035 $1,040
27.2% 27.0% 27.0% 26.6% 26.5%
2009 2010 2011 2012 LTM 9/28/13 Gross profit % margin
Adjusted EBITDA(1)
($ in millions) Adjusted EBITDA % margin $222 $223 $224 $199 $176
5.9% 5.9% 5.8%
5.1% 4.5%
2009 2010 2011 2012 LTM 9/28/13 FCF(2) $146 $160 $158 $137 $120
Decrease in 2012 and LTM Adjusted EBITDA and Adjusted EBITDA margins due to reduced fixed cost leverage in the core business
EBITDA margins also impacted by the increased occupancy costs related to new Mariano’s store ramp and the intentional higher volume, lower margin Mariano’s economic model
(1) | | Non-GAAP measure. See a reconciliation to Adjusted EBITDA in the Appendix. |
(2) | | Calculated as Adjusted EBITDA less capital expenditures. |
22
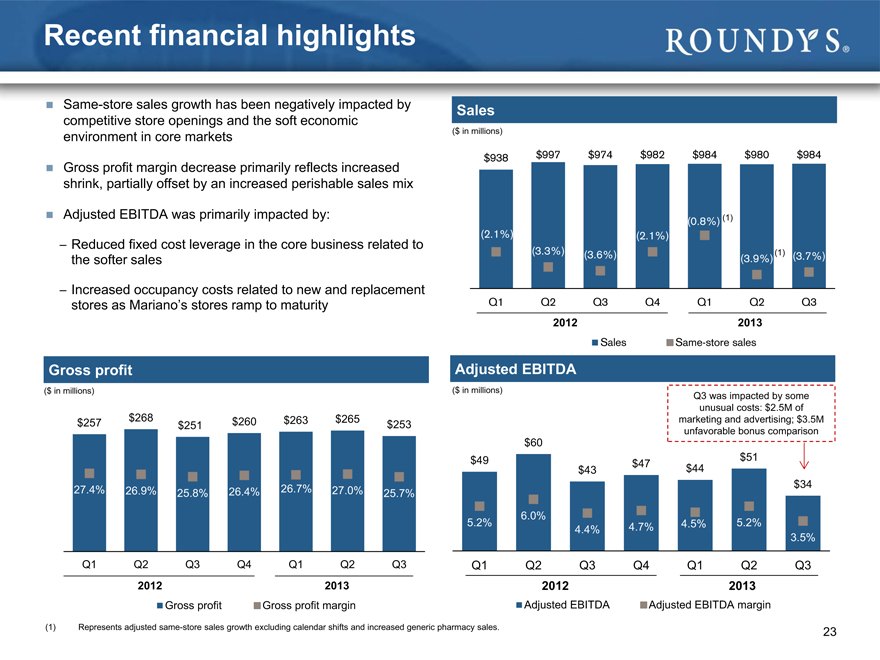
Recent financial highlights
Same-store sales growth has been negatively impacted by competitive store openings and the soft economic environment in core markets
Gross profit margin decrease primarily reflects increased shrink, partially offset by an increased perishable sales mix
Adjusted EBITDA was primarily impacted by:
Reduced fixed cost leverage in the core business related to the softer sales
Increased occupancy costs related to new and replacement stores as Mariano’s stores ramp to maturity
Gross profit
Sales
($ in millions)
$938 $997 $974
($ in millions) ($ in millions)
$268 $260 $263 $265 $257 $251 $253 $60
$49 $43
27.4% 26.9% 25.8% 26.4% 26.7% 27.0% 25.7%
6.0%
5.2%
4.4%
Q1 Q2 Q3 Q4 Q1 Q2 Q3 Q1 Q2 Q3
2012 2013 2012
Gross profit Gross profit margin Adjusted EBITDA
(1) | | Represents adjusted same-store sales growth excluding calendar shifts and increased generic pharmacy sales. |
Q3 was impacted by some unusual costs: $2.5M of marketing and advertising; $3.5M unfavorable bonus comparison
$51
$47 $44 $34
4.7% 4.5% 5.2%
3.5%
Q4 Q1 Q2 Q3
2013
Adjusted EBITDA margin
$982 $984 $980 $984 (2.1%) (3.3%) (3.6%) (2.1%) (0.8%)(1) (3.9%)(1) (3.7%) sales same-store sales
23
Appendix
24
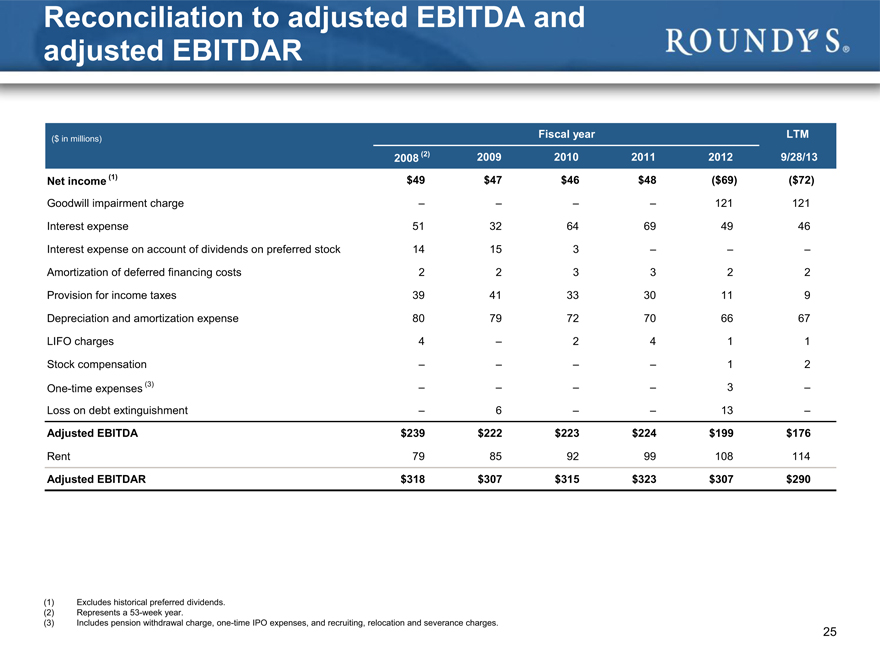
Reconciliation to adjusted EBITDA and adjusted EBITDAR
($ in millions) Fiscal year LTM
2008 (2) 2009 2010 2011 2012 9/28/13
Net income (1) $49 $47 $46 $48($69)($72)
Goodwill impairment charge – – – – 121 121
Interest expense 51 32 64 69 49 46
Interest expense on account of dividends on preferred stock 14 15 3 – – –
Amortization of deferred financing costs 2 2 3 3 2 2
Provision for income taxes 39 41 33 30 11 9
Depreciation and amortization expense 80 79 72 70 66 67
LIFO charges 4 – 2 4 1 1
Stock compensation – – – – 1 2
One-time expenses (3) – – – – 3 –
Loss on debt extinguishment – 6 – – 13 –
Adjusted EBITDA $239 $222 $223 $224 $199 $176
Rent 79 85 92 99 108 114
Adjusted EBITDAR $318 $307 $315 $323 $307 $290
Excludes historical preferred dividends.
Represents a 53-week year.
Includes pension withdrawal charge, one-time IPO expenses, and recruiting, relocation and severance charges.
25
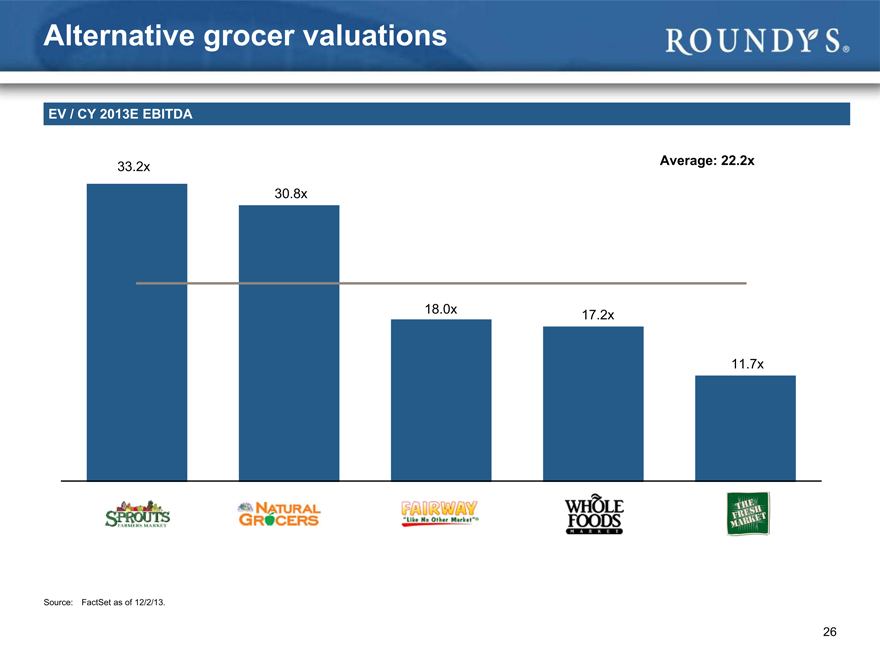
Alternative grocer valuations
EV / CY 2013E EBITDA
Average: 22.2x
33.2x
30.8x
18.0x 17.2x
11.7x
Source: FactSet as of 12/2/13.
26