| OMB APPROVAL | ||
| OMB Number: 3235-0570 Expires: January 31, 2017 Estimated average burden hours per response. . . . . . .20.6 |
UNITED STATES
SECURITIES AND EXCHANGE COMMISSION
Washington, D.C. 20549
Form N-CSR
CERTIFIED SHAREHOLDER REPORT OF REGISTERED
MANAGEMENT INVESTMENT COMPANIES
Investment Company Act File Number 811-22646
PRIVATE ADVISORS ALTERNATIVE STRATEGIES MASTER FUND
(Exact name of Registrant as specified in charter)
51 Madison Avenue, New York, NY 10010
(Address of principal executive offices) (Zip code)
J. Kevin Gao, Esq.
169 Lackawanna Avenue
Parsippany, New Jersey 07054
(Name and address of agent for service)
Registrant’s telephone number, including area code: (800) 624-6782
Date of fiscal year end: March 31
Date of reporting period: September 30, 2014
| Item 1. | Reports to Stockholders. |
Private Advisors Alternative
Strategies Master Fund
Message from the President and Semiannual Report
Unaudited | September 30, 2014


This page intentionally left blank
Message from the President
We are pleased to present the semiannual report for Private Advisors Alternative Strategies Master Fund.
The semiannual report includes detailed information about the market events, macroeconomic trends and investment decisions that shaped Private Advisors Alternative Strategies Master Fund during the six months ended September 30, 2014.
We hope that you will find the following material useful in your ongoing investment planning and review process. We appreciate your choice of Private Advisors Alternative Strategies Master Fund and we look forward to serving your investment needs for many years to come.
Sincerely,

Stephen P. Fisher
President
The opinions expressed are as of the date of this report and are subject to change. There is no guarantee that any forecast made will come to pass. This material does not constitute investment advice and is not intended as an endorsement of any specific investment. Past performance is no guarantee of future results.
Not part of the Semiannual Report
Certain material in this report may include statements that constitute “forward-looking” statements under the U.S. securities laws. Forward-looking statements include, among other things, projections, estimates and information about possible future results or events related to the Fund, market or regulatory developments. The views expressed herein are not guarantees of future performance or economic results and involve certain risks, uncertainties and assumptions that could cause the actual outcomes and results to differ materially from the views expressed herein. The views expressed herein are subject to change at any time based upon economic, market, or other conditions and the Fund undertakes no obligation to update the views expressed herein.
Performance data quoted represents past performance. Past performance is no guarantee of future results. Because of market volatility, current performance may be lower or higher than the figures shown. Investment return and principal value will fluctuate, and as a result, when shares are redeemed, they may be worth more or less than their original cost. For performance information current to the most recent month-end, please visit mainstayinvestments.com/privateadvisors or call 1-888-207-6176.
Average Annual Total Returns for the Period Ended September 30, 2014
| Fund | Sales Charge | Six Months | One Year | Since Inception | Gross Expense Ratio2 | |||||||||||||||
| Private Advisors Alternative Strategies Fund | Maximum 3% Initial Sales Charge | With sales charges Excluding sales charges |
| –4.33 –1.37 | %
|
| –0.52 2.55 | %
|
| 3.46 4.77 | %
|
| 11.17 11.17 | %
| ||||||
| Private Advisors Alternative Strategies Master Fund | No Sales Charge | –1.00 | 3.28 | 5.49 | 7.99 | |||||||||||||||
| Benchmark Performance | Six Months | One Year | Since Inception | |||||||||||
HFRI Fund of Funds Diversified Index3 | 2.02 | % | 6.55 | % | 5.56 | % | ||||||||
S&P 500® Index4 | 6.42 | 19.73 | 17.85 | |||||||||||
Barclays U.S. Aggregate Bond Index5 | 2.21 | 3.96 | 1.96 | |||||||||||
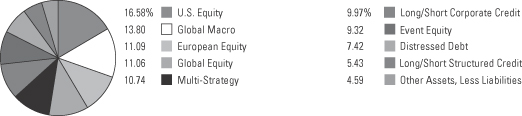
Strategy Allocations as of September 30, 2014 (Unaudited)
Top Ten Holdings as of September 30, 2014 (Unaudited)
| 1. | SRS Partners, Ltd. |
| 2. | Archer Capital Offshore Fund, Ltd. |
| 3. | Luxor Capital Partners Offshore, Ltd. |
| 4. | Fir Tree International Value Fund II, Ltd. |
| 5. | Adelphi Europe Fund (The) |
| 6. | North Run Offshore Partners, Ltd. |
| 7. | Autonomy Global Macro Fund Limited |
| 8. | Impala Fund Ltd. |
| 9. | Pelham Long/Short Fund, Ltd. |
| 10. | HBK Multi-Strategy Offshore Fund, Ltd. |
| 1. | The performance table does not reflect the deduction of taxes that a shareholder would pay on distributions or Fund-share redemptions. Total returns reflect the maximum applicable sales charge as indicated in the table above, changes in share price, and reinvestment of dividend and capital gain distributions. Performance figures reflect certain fee waivers and/or expense limitations, without which total returns may have been lower. For more information on current fee waivers and/or expense limitations, please refer to the notes to the financial statements. |
| 2. | The gross expense ratios presented reflect the Fund’s “Total Annual Fund Operating Expenses” from the most recent Prospectus and may differ from other expense ratios disclosed in this report. |
| 3. | The HFRI Fund of Funds Diversified Index is a non-investable product of diversified fund of funds. The index is weighted (fund weighted) with an inception of January 1990. An investment cannot be made directly in an index. |
| 4. | “S&P 500®” is a trademark of the McGraw-Hill Companies, Inc. The S&P 500® Index is widely regarded as the standard index for measuring large-cap U.S. stock market performance. Results assume reinvestment of all dividends and capital gains. An investment cannot be made directly in an index. |
| 5. | The Barclays U.S. Aggregate Bond Index is a broad-based benchmark that measures the investment grade, U.S. dollar-denominated, fixed-rate taxable bond market, including Treasurys, government-related and corporate securities, mortgage-backed securities (agency fixed-rate and hybrid adjustable rate mortgage pass-throughs), asset-backed securities, and commercial mortgage-backed securities. Results assume reinvestment of all income and capital gains. An investment cannot be made directly in an index. |
| Private Advisors Funds | 5 |
Portfolio Management Discussion and Analysis (Unaudited)
For the six months ended September 30, 2014, Private Advisors Alternative Strategies Master Fund (“Master Fund”) returned –1.00%. Private Advisors Alternative Strategies Fund (“Feeder Fund”) returned –1.37%, excluding all sales charges. See page 5 for Feeder Fund returns with applicable sales charges. The Master Fund and the Feeder Fund are collectively referred to herein as “Funds.” The Funds underperformed the 2.02% return of the HFRI Fund of Funds Diversified Index,1 the 6.42% return of the S&P 500® Index1 and the 2.21% return of the Barclays U.S. Aggregate Bond Index.1
The Funds underperformed the S&P 500® Index given the Index’s strong performance during four of the six months in the reporting period. However, the Funds outperformed the S&P 500® Index during the difficult months of July and September 2014.
The Private Advisors Alternative Strategies Fund is a “feeder” fund in what is known in the investment company industry as a master-feeder structure. The Feeder Fund invests substantially all of its assets, net of reserves maintained for reasonably anticipated expenses, in the Master Fund. The Master Fund, which has the same investment objective as the Feeder Fund, seeks to achieve its investment objective by investing principally in private investment funds or “hedge funds” managed by third-party portfolio managers who employ diverse styles and strategies.
Market Summary
Equity markets have had a strong six months of performance during the reporting period, with the exception of only two negative months in July and September. Small-caps and non-U.S. equities experienced larger losses than large-cap stocks during those months. Analysts who had predicted a choppier market in 2014 have finally started to see some of that volatility occur more recently. A number of factors contributed to the increase in volatility, including the Argentine debt default in July, political turmoil in the Middle East and the Ukraine, and disappointing economic data in Europe where growth remains stagnant.
Equities
The S&P 500® Index started the six-month reporting period strongly, posting positive returns in April, May and June with very little volatility. However, that streak came to an end in July as political tensions increased outside the U.S., and the situation in the Ukraine worsened after the downing of the Malaysian airliner and further trade sanctions being imposed upon Russia. By the end of July, the Argentine sovereign debt default had caused more ripples in international markets. Portugal, Austria, France and Germany led European markets lower for the month. U.S. equity markets partially recovered in August and posted positive returns; although equity market
performance outside the U.S. was still disappointing. September brought more volatility and negative performance for equities, particularly in the financials and energy sectors.
Fixed Income
The Barclays U.S. Aggregate Bond Index gained 2.21% for the six-month period ending September 30, 2014. Overall, fixed income performance has been positive, with longer dated Treasuries performing well as yields have remained relatively consistent during the period. Meanwhile, non-investment grade and distressed credit experienced losses in September as investors sought safety.
High-yield loan volume declined and issuance slipped to $67.9 billion by the end of the third quarter (from $105.1 billion in the second quarter) according to S&P Capital IQ. A spike in retail fund outflows created some disruption in the market during the last three months. Overall, new issue activity in the leverage loan market slowed as deal flow languished and retail fund flows dropped off despite increased M&A activity. Default activity and borrowing costs remained low during the six months ending September 30, 2014. High-yield spreads increased to 440 basis points by the end of the six-month reporting period. Investment-grade spreads also ended the period slightly higher at 120 basis points; while CCC & lower-rated spreads ended the period higher at 792 basis points.
Contributors and Detractors
The Master Fund’s allocation to global macro hedge funds was the largest contributor to overall performance during the reporting period. (Contributions take weightings and total returns into account.) The strategy was a slight detractor in the months of April and June, but that underperformance was offset as macro managers preserved capital in both July and September and performed well in spite of volatility in many other market segments. Developed market central bank activity captured the majority of headlines, and consensus views among macro managers were strongly rewarded in the third quarter. The Master Fund’s global macro managers seek to express their views through a variety of investments in rates, yield curves, currencies, equities, credit, etc. Additionally, there was still meaningful divergence of investment themes in emerging markets, particularly related to the growth and policy trajectories within emerging economies. We believe this dynamic may continue to provide robust investment opportunities for the Master Fund’s managers.
Long/short structured credit also contributed to performance during the reporting period, as both Marathon Securitized Credit Fund and One William Street Capital Offshore Fund were both positive for the six months ended September 30, 2014. The Master Fund’s structured credit managers continued to find
| 1. | See footnote on page 5 for more information on this index. |
| 6 | Private Advisors Funds |
bonds that had favorable asymmetry in a less efficient part of the fixed-income market.
Long/short equity was the largest detractor for the reporting period. Long/short equity managers have struggled in 2014 as their shorting ability has been less effective in strong markets, but we believe this may prove beneficial as markets return to the long-term, historical averages. Lancaster Fund Limited, Pelham Long/Short Fund and Miura Global Fund were among the largest detractors during the reporting period. Lancaster, Pelham and Miura experienced weakness in their long positions outside the U.S.
Event equity managers have also struggled as a result of long positions where value has not yet been recognized, as well as some short positions that rallied unexpectedly. Long/short corporate credit fund Saba Offshore Fund also produced a loss during the six-month reporting period.
Fund Activity
There were two manager additions and one exit in the Master Fund during the reporting period. In June 2014, we added LionEye Offshore Fund to the Master Fund as a 3% position. LionEye is focused on complex corporate change, and its investment process combines core risk arbitrage disciplines with fundamental valuation skills. LionEye uses an actively traded, tactical approach to risk management and maintains low net exposures.
At the end of August, we redeemed from global macro fund MKP Opportunity Offshore and redeployed capital through an investment in Macrosynergy Trading Fund in order to gain differentiated exposure within the strategy. Macrosynergy is managed by co-CIOs Nikos Makris and Gavin Moule, who worked together at BlueCrest as co-heads of emerging markets and portfolio managers from 2004 to 2009. They are both seasoned, deeply experienced global macro traders. Macrosynergy is an emerging markets focused discretionary global macro fund investing in foreign exchange, interest rates, credit, equity and commodities. Macrosynergy’s edge comes from its implementation and trading with a disciplined process to sizing, scaling and timing positions within its stringent risk management framework.
We are currently in various stages of due diligence with several managers. Additionally, we continue to re-evaluate the investment and operational merits of our existing managers. The Master Fund was invested in 30 active holdings at the end of September.
Outlook
It has been a disappointing six months (and longer) for long/short equity managers as they have been challenged by relative underperformance in 2014 versus traditional equity markets. In particular, it has been a difficult environment for fundamental stock selection on both the long and short sides of their portfolios. Individual, company-specific performance has been less important since the bull market began in March 2009,
while participation (or non-participation) in the equity market as a whole, or in specific sectors or segments of the market, has been a primary driver of returns. We believe this environment makes it extremely difficult for long/short equity managers (or any active managers) that seek to produce alpha through fundamental, bottom-up research to be successful. Regardless of whether it is an environment of indiscriminate buying or selling, long/short equity performance will likely be challenged.
Ultimately, we believe that fundamental stock selection will drive returns over the long-term in both long and short portfolios. While some managers have moved to an indexed approach in their short portfolios, we continue to be disciplined about seeking long/short equity managers that have an active and balanced approach to researching both short and long investment opportunities.
We have a positive view of global macro strategies as divergent central bank actions are beginning to result in trading opportunities in currencies and rates. Global macro’s historic lack of correlation to other asset classes could prove helpful if global deleveraging or a reversion to the mean in rates causes market dislocations.
We also find event-driven strategies, specifically event equity, attractive in the current environment. We prefer event equity strategies that focus on near-term catalysts to increase value and profitability, as well as those that expressly seek to limit market beta. We expect the event equity strategy to continue to benefit from an increase in corporate activity in 2014. The level of cash on corporate balance sheets has increased significantly in the last year, and companies and their shareholders are looking for opportunities to drive future growth. We are not adding activist strategies or other high equity beta strategies, but prefer managers who benefit from isolated event risk in a hedged format.
While we do not find credit market beta compelling today, we continue to appreciate the idiosyncratic and event-driven opportunities across corporate capital structures and mortgage securities. We are encouraged that the environment may be improving for shorting credit and equity. We continue to monitor Europe and the emerging markets from a stressed or distressed standpoint, but remain patient around the opportunity sets. We have intentionally allocated to credit managers that are 1) process or event driven (i.e., liquidations and litigations), 2) deep value focused (therefore less impacted by future rate environments due to price/yield cushion) or 3) hedged with alpha shorts or an arbitrage/relative value focus.
Thank you for your continued support.
Tim Berry
Portfolio Manager
Charles Honey
Portfolio Manager
| Private Advisors Funds | 7 |
Private Advisors Alternative Strategies Master Fund
Schedule of Investments as of September 30, 2014 (Unaudited)
| First Acquisition Date | Cost | Fair Value | Percent of Net Assets | Next Available Redemption Date* | Liquidity** | |||||||||||||||||||
Investments in Hedge Funds Bermuda Domiciled | ||||||||||||||||||||||||
European Equity | ||||||||||||||||||||||||
Pelham Long/Short Fund, Ltd. | 5/1/2012 | $ | 1,890,000 | $ | 2,484,635 | 3.67 | % | 10/31/2014 | Monthly | |||||||||||||||
|
|
|
|
|
| |||||||||||||||||||
Total Bermuda Domiciled | 1,890,000 | 2,484,635 | 3.67 | |||||||||||||||||||||
|
|
|
|
|
| |||||||||||||||||||
| British Virgin Islands Domiciled | ||||||||||||||||||||||||
Global Equity | ||||||||||||||||||||||||
Miura Global Fund, Ltd. | 2/1/2013 | 2,100,000 | 2,382,820 | 3.52 | 10/31/2014 | Monthly | ||||||||||||||||||
|
|
|
|
|
| |||||||||||||||||||
Multi-Strategy | ||||||||||||||||||||||||
Davidson Kempner International (BVI), Ltd. | 1/1/2014 | 2,000,000 | 2,124,628 | 3.14 | 12/31/2014 | Quarterly | ||||||||||||||||||
|
|
|
|
|
| |||||||||||||||||||
Total British Virgin Islands Domiciled | 4,100,000 | 4,507,448 | 6.66 | |||||||||||||||||||||
|
|
|
|
|
| |||||||||||||||||||
| Cayman Islands Domiciled | ||||||||||||||||||||||||
Distressed Debt | ||||||||||||||||||||||||
Redwood Offshore Fund, Ltd. | 5/1/2012 | 1,200,000 | 1,636,904 | 2.42 | 6/30/2014 | Bi-Annually | ||||||||||||||||||
North America | ||||||||||||||||||||||||
Aurelius Capital International, Ltd. | 5/1/2012 | 1,600,000 | 2,096,431 | 3.10 | 12/31/2014 | Semi-Annually | ||||||||||||||||||
Contrarian Capital Trade Claims Offshore, Ltd. | 5/1/2012 | 1,050,000 | 1,287,241 | 1.90 | 5/31/2015 | Annually | ||||||||||||||||||
|
|
|
|
|
| |||||||||||||||||||
Total Distressed Debt | 3,850,000 | 5,020,576 | 7.42 | |||||||||||||||||||||
|
|
|
|
|
| |||||||||||||||||||
European Equity | ||||||||||||||||||||||||
Adelphi Europe Fund (The) | 5/1/2013 | 2,250,000 | 2,586,849 | 3.83 | 12/31/2014 | Quarterly | ||||||||||||||||||
LAE Fund, Ltd. | 5/1/2012 | 2,010,000 | 2,425,989 | 3.59 | 12/31/2014 | Quarterly | ||||||||||||||||||
|
|
|
|
|
| |||||||||||||||||||
Total European Equity | 4,260,000 | 5,012,838 | 7.42 | |||||||||||||||||||||
|
|
|
|
|
| |||||||||||||||||||
Event Equity | ||||||||||||||||||||||||
Luxor Capital Partners Offshore, Ltd. | 5/1/2012 | 2,510,000 | 2,722,844 | 4.03 | 12/31/2014 | Quarterly | ||||||||||||||||||
LionEye Offshore Fund, Ltd. | 6/1/2014 | 1,800,000 | 1,828,702 | 2.70 | 12/31/2014 | Quarterly | ||||||||||||||||||
Global | ||||||||||||||||||||||||
Mason Capital, Ltd. | 5/1/2012 | 1,600,000 | 1,750,493 | 2.59 | 4/30/2015 | Annually | ||||||||||||||||||
|
|
|
|
|
| |||||||||||||||||||
Total Event Equity | 5,910,000 | 6,302,039 | 9.32 | |||||||||||||||||||||
|
|
|
|
|
| |||||||||||||||||||
Global Equity | ||||||||||||||||||||||||
Sheffield International Partners, Ltd. | 5/1/2012 | 1,960,000 | 2,210,960 | 3.27 | 12/31/2014 | Quarterly | ||||||||||||||||||
SRS Partners, Ltd. | 5/1/2012 | 2,140,000 | 2,886,909 | 4.27 | 12/31/2014 | Quarterly | ||||||||||||||||||
|
|
|
|
|
| |||||||||||||||||||
Total Global Equity | 4,100,000 | 5,097,869 | 7.54 | |||||||||||||||||||||
|
|
|
|
|
| |||||||||||||||||||
| 8 | Private Advisors Alternative Strategies Master Fund | The notes to the financial statements are an integral part of, and should be read in conjunction with, the financial statements. |
| First Acquisition Date | Cost | Fair Value | Percent of Net Assets | Next Available Redemption Date* | Liquidity** | |||||||||||||||||||
| Cayman Islands Domiciled (continued) | ||||||||||||||||||||||||
Global Macro | ||||||||||||||||||||||||
Anderson Global Macro Fund, Ltd. | 7/1/2013 | $ | 1,700,000 | $ | 1,633,491 | 2.41 | % | 12/31/2014 | Quarterly | |||||||||||||||
Autonomy Global Macro Fund Limited | 6/1/2013 | 2,200,000 | 2,536,463 | 3.75 | 10/31/2014 | Monthly | ||||||||||||||||||
Macrosynergy Trading Fund Limited | 9/1/2014 | 1,300,000 | 1,284,404 | 1.90 | 9/30/2015 | Quarterly | ||||||||||||||||||
Stone Milliner Macro Fund Inc. | 12/1/2013 | 1,800,000 | 1,948,836 | 2.88 | 10/31/2014 | Monthly | ||||||||||||||||||
Tudor BVI Global Fund, Ltd. (The) | 5/1/2012 | 1,600,000 | 1,931,924 | 2.86 | 12/31/2014 | Quarterly | ||||||||||||||||||
|
|
|
|
|
| |||||||||||||||||||
Total Global Macro | 8,600,000 | 9,335,118 | 13.80 | |||||||||||||||||||||
|
|
|
|
|
| |||||||||||||||||||
Long/Short Corporate Credit | ||||||||||||||||||||||||
Archer Capital Offshore Fund, Ltd. | 5/1/2012 | 2,370,000 | 2,725,036 | 4.03 | 12/31/2014 | Quarterly | ||||||||||||||||||
Panning Overseas Fund, Ltd. | 6/1/2013 | 1,980,000 | 2,175,137 | 3.22 | 5/31/2015 | Quarterly | ||||||||||||||||||
Saba Capital Offshore Fund, Ltd. | 7/1/2012 | 2,320,000 | 1,840,030 | 2.72 | 12/31/2014 | Quarterly | ||||||||||||||||||
|
|
|
|
|
| |||||||||||||||||||
Total Long/Short Corporate Credit | 6,670,000 | 6,740,203 | 9.97 | |||||||||||||||||||||
|
|
|
|
|
| |||||||||||||||||||
Long/Short Structured Credit | ||||||||||||||||||||||||
Marathon Securitized Credit Fund, Ltd. | 5/1/2012 | 1,413,872 | 1,838,029 | 2.72 | 12/31/2014 | Quarterly | ||||||||||||||||||
One William Street Capital Offshore Fund, Ltd. | 5/1/2012 | 1,470,000 | 1,833,031 | 2.71 | 12/31/2014 | Quarterly | ||||||||||||||||||
|
|
|
|
|
| |||||||||||||||||||
Total Long/Short Structured Credit | 2,883,872 | 3,671,060 | 5.43 | |||||||||||||||||||||
|
|
|
|
|
| |||||||||||||||||||
Multi-Strategy | ||||||||||||||||||||||||
Fir Tree International Value Fund II, Ltd. | 5/1/2012 | 2,210,000 | 2,690,100 | 3.98 | 5/31/2015 | Annually | ||||||||||||||||||
HBK Multi-Strategy Offshore Fund, Ltd. | 5/1/2012 | 2,140,000 | 2,447,564 | 3.62 | 12/31/2014 | Quarterly | ||||||||||||||||||
|
|
|
|
|
| |||||||||||||||||||
Total Multi-Strategy | 4,350,000 | 5,137,664 | 7.60 | |||||||||||||||||||||
|
|
|
|
|
| |||||||||||||||||||
U.S. Equity | ||||||||||||||||||||||||
Hoplite Offshore Fund, Ltd. | 5/1/2012 | 2,140,000 | 2,296,655 | 3.40 | 12/31/2014 | Quarterly | ||||||||||||||||||
Impala Fund Ltd. | 5/1/2012 | 2,010,000 | 2,492,311 | 3.68 | 12/31/2014 | Quarterly | ||||||||||||||||||
Marble Arch Offshore Partners, Ltd. | 7/1/2012 | 1,600,000 | 1,776,657 | 2.63 | 12/31/2014 | Quarterly | ||||||||||||||||||
North Run Offshore Partners, Ltd. | 5/1/2012 | 2,300,000 | 2,575,821 | 3.81 | 12/31/2014 | Quarterly | ||||||||||||||||||
Southpoint Qualified Offshore Fund, Ltd. | 5/1/2012 | 1,820,000 | 2,073,255 | 3.06 | 12/31/2014 | Quarterly | ||||||||||||||||||
|
|
|
|
|
| |||||||||||||||||||
Total U.S. Equity | 9,870,000 | 11,214,699 | 16.58 | |||||||||||||||||||||
|
|
|
|
|
| |||||||||||||||||||
Total Cayman Islands Domiciled | 50,493,872 | 57,532,066 | 85.08 | |||||||||||||||||||||
|
|
|
|
|
| |||||||||||||||||||
Total Investments in Hedge Funds | $ | 56,483,872 | 64,524,149 | 95.41 | ||||||||||||||||||||
|
| |||||||||||||||||||||||
Other Assets, less Liabilities | 3,102,687 | 4.59 | ||||||||||||||||||||||
|
|
|
| |||||||||||||||||||||
Net Assets | $ | 67,626,836 | 100.00 | % | ||||||||||||||||||||
|
|
|
| |||||||||||||||||||||
| * | Investments in Hedge Funds may be composed of multiple series. The Next Available Redemption Date relates to the earliest date after September 30, 2014 that redemption from a series is available. Other series may have an available redemption date that is after the Next Available Redemption Date. Redemptions from Hedge Funds may be subject to fees. |
| ** | Available frequency of redemption after initial lock-up period, if any. Different series may have different liquidity terms. |
| The notes to the financial statements are an integral part of, and should be read in conjunction with, the financial statements. | Private Advisors Alternative Strategies Master Fund | 9 |
Private Advisors Alternative Strategies Master Fund
Statement of Assets and Liabilities as of September 30, 2014 (Unaudited)
| Assets | ||||
Investments in Hedge Funds, at fair value | $ | 64,524,149 | ||
Cash | 4,104,833 | |||
Prepaid assets | 16,887 | |||
|
| |||
Total assets | 68,645,869 | |||
|
| |||
| Liabilities | ||||
Redemptions payable | 418,647 | |||
Subscriptions received in advance | 375,000 | |||
Management fee payable (see Note 5) | 105,786 | |||
Accrued expenses | 119,600 | |||
|
| |||
Total liabilities | 1,019,033 | |||
|
| |||
Net Assets | $ | 67,626,836 | ||
|
| |||
| Composition of Net Assets: | ||||
Paid-in capital | $ | 66,884,864 | ||
Accumulated net investment loss | (7,220,681 | ) | ||
Accumulated net realized gain (loss) from investments in Hedge Funds | (77,624 | ) | ||
Net unrealized appreciation (depreciation) on investments in Hedge Funds | 8,040,277 | |||
|
| |||
Net Assets | $ | 67,626,836 | ||
|
| |||
| Net Asset Value Per Share: | ||||
65,606.52 Shares issued and outstanding, par value $0.001 per share 450,000 registered shares of beneficial interest | $ | 1,030.79 | ||
|
| |||
| 10 | Private Advisors Alternative Strategies Master Fund | The notes to the financial statements are an integral part of, and should be read in conjunction with, the financial statements. |
Private Advisors Alternative Strategies Master Fund
Statement of Operations for the six months ended September 30, 2014 (Unaudited)
Expenses | ||||
Management Fee (See Note 5) | $ | 360,360 | ||
Administration fees | 90,219 | |||
Professional fees | 60,665 | |||
Transfer agent | 14,782 | |||
Insurance fees | 14,782 | |||
Shareholder communication | 12,631 | |||
Custodian | 11,444 | |||
Trustees | 1,369 | |||
Miscellaneous | 5,788 | |||
|
| |||
Total expenses before waiver/reimbursement | 572,040 | |||
Expense waiver/reimbursement from Manager | (80,640 | ) | ||
|
| |||
Net expenses | 491,400 | |||
|
| |||
Net investment income (loss) | (491,400 | ) | ||
|
| |||
| Net realized and unrealized gain (loss) on investments | ||||
Net realized gain (loss) from investments in Hedge Funds | 236,777 | |||
Net change in unrealized appreciation (depreciation) on investments in Hedge Funds | (403,872 | ) | ||
|
| |||
Net increase (decrease) in net assets resulting from operations | $ | (658,495 | ) | |
|
| |||
| The notes to the financial statements are an integral part of, and should be read in conjunction with, the financial statements. | Private Advisors Alternative Strategies Master Fund | 11 |
Private Advisors Alternative Strategies Master Fund
Statement of Changes in Net Assets (Unaudited)
| Six months ended September 30, 2014 | Year ended March 31, 2014 | |||||||
| Increase (decrease) in net assets resulting from operations: | ||||||||
Net investment income (loss) | $ | (491,400 | ) | $ | (853,979 | ) | ||
Net realized gain (loss) from investments in Hedge Funds | 236,777 | (88,079 | ) | |||||
Net change in unrealized appreciation (depreciation) on investments | (403,872 | ) | 4,894,037 | |||||
|
|
|
| |||||
Net increase (decrease) in net assets resulting from operations | (658,495 | ) | 3,951,979 | |||||
|
|
|
| |||||
Distributions to shareholders from: | ||||||||
Net investment income | — | (4,835,426 | ) | |||||
|
|
|
| |||||
Capital share transactions: | ||||||||
Subscriptions (representing 8,754.35 and 17,847.76 Shares) | 9,098,590 | 19,005,252 | ||||||
Redemptions (representing 2,314.98 and 5,868.23 Shares) | (2,418,648 | ) | (6,153,184 | ) | ||||
Distributions reinvested (representing 4,535.94 Shares) | — | 4,649,467 | ||||||
|
|
|
| |||||
Increase (decrease) in net assets derived from capital share transactions | 6,679,942 | 17,501,535 | ||||||
|
|
|
| |||||
Net increase (decrease) in net assets | 6,021,447 | 16,618,088 | ||||||
Net assets, beginning of year (representing 59,167.15 and 42,651.68 Shares) | 61,605,389 | 44,987,301 | ||||||
|
|
|
| |||||
Net assets, end of year (representing 65,606.52 and 59,167.15 Shares) | $ | 67,626,836 | $ | 61,605,389 | ||||
|
|
|
| |||||
Distributions in excess of net investment income at end of year | $ | — | $ | (6,729,281 | ) | |||
|
|
|
| |||||
| 12 | Private Advisors Alternative Strategies Master Fund | The notes to the financial statements are an integral part of, and should be read in conjunction with, the financial statements. |
Private Advisors Alternative Strategies Master Fund
Statement of Cash Flows for the six months ended September 30, 2014 (Unaudited)
| Cash flows from operating activities | ||||
Net increase (decrease) in net assets resulting from operations | $ | (658,495 | ) | |
Adjustments to reconcile net increase (decrease) in net assets resulting from operations to net cash provided by (used in) operating activities: | ||||
Purchases of investments in Hedge Funds | (5,270,000 | ) | ||
Proceeds from sales of investments in Hedge Funds | 2,622,905 | |||
Net realized (gain) loss from investments in Hedge Funds | (236,777 | ) | ||
Net change in unrealized (appreciation) depreciation on investments in Hedge Funds | 403,872 | |||
Changes in operating assets and liabilities: | ||||
Prepaid assets | 17,032 | |||
Accrued expenses | 3,839 | |||
Management Fee | 53,344 | |||
|
| |||
Net cash provided by (used in) operating activities | (3,064,280 | ) | ||
|
| |||
| Cash flows from financing activities | ||||
Subscriptions | 8,123,590 | |||
Redemptions | (4,007,660 | ) | ||
|
| |||
Net cash provided by (used in) financing activities | 4,115,930 | |||
|
| |||
Net increase (decrease) in cash | 1,051,650 | |||
Cash, beginning of period | 3,053,183 | |||
|
| |||
Cash, end of period | $ | 4,104,833 | ||
|
| |||
| The notes to the financial statements are an integral part of, and should be read in conjunction with, the financial statements. | Private Advisors Alternative Strategies Master Fund | 13 |
Private Advisors Alternative Strategies Master Fund
Financial Highlights selected per share data and ratios (Unaudited)
Six months September 30, | Year ended March 31, | May 1, 2012 (commencement of operations) through March 31, | ||||||||||
| 2014 | 2014 | 2013 | ||||||||||
Per Share operating performance: | ||||||||||||
Net asset value at beginning of year/period | $ | 1,041.21 | $ | 1,054.76 | $ | 1,000.00 | ||||||
Net investment income (loss) (a) | (7.90 | ) | (16.35 | ) | (13.87 | ) | ||||||
Net realized and unrealized gain (loss) on investments | (2.52 | ) | 90.05 | 86.21 | ||||||||
|
|
|
|
|
| |||||||
Net increase (decrease) resulting from operations | (10.42 | ) | 73.70 | 72.34 | ||||||||
|
|
|
|
|
| |||||||
Distributions paid | ||||||||||||
Net investment income | — | (87.25 | ) | (17.58 | ) | |||||||
|
|
|
|
|
| |||||||
Net asset value at end of year/period | $ | 1,030.79 | $ | 1,041.21 | $ | 1,054.76 | ||||||
|
|
|
|
|
| |||||||
Total investment return (b) | (1.00 | %)(c) | 7.12 | % | 7.32 | % (c) | ||||||
Ratios (to average net assets)/Supplemental Data | ||||||||||||
Net investment income (loss) (d) | (1.50 | %)†† | (1.50 | %) | (1.50 | %)†† | ||||||
Net expenses (d) | 1.50 | % †† | 1.50 | % | 1.50 | % †† | ||||||
Expenses (before waiver/reimbursement) (d) | 1.77 | % †† | 2.12 | % | 2.84 | % †† | ||||||
Portfolio turnover rate | 4 | % | 10 | % | 0 | % (e) | ||||||
Net assets at end of year/period (in 000’s) | $ | 67,627 | $ | 61,605 | $ | 44,987 | ||||||
| †† | Annualized. |
| (a) | Per share data based on average shares outstanding during the year/period. |
| (b) | Total investment return is calculated exclusive of sales charges and assumes the reinvestment of dividends and distributions. |
| (c) | Total investment return is not annualized. |
| (d) | Ratios of expenses and net investment income (loss) do not include the impact of expenses and incentive allocations or incentive fees related to the Underlying Hedge Funds. |
| (e) | Portfolio turnover was calculated at 0.00% as no securities were sold during the period from May 1, 2012 (commencement of operations) through March 31, 2013. |
The above ratios and total return have been calculated for the Shareholders taken as a whole. An individual Shareholder’s ratios and total return may vary from these due to the timing of capital share transactions.
| 14 | Private Advisors Alternative Strategies Master Fund | The notes to the financial statements are an integral part of, and should be read in conjunction with, the financial statements. |
Private Advisors Alternative Strategies Master Fund
Notes to Financial Statements (Unaudited)
1. Organization and Business
Private Advisors Alternative Strategies Master Fund (the “Master Fund”) was organized on December 15, 2011 as a Delaware statutory trust pursuant to an Agreement and Declaration of Trust (“Declaration of Trust”) dated December 14, 2011. The Master Fund is a non-diversified, closed-end management investment company registered under the Investment Company Act of 1940, as amended (“1940 Act”). The Master Fund commenced investment operations on May 1, 2012 (“Commencement of Operations”).
The Master Fund is a “Master” fund within what is known in the investment company industry as a “master-feeder” structure. Within this structure, another closed-end, non-diversified management investment company, Private Advisors Alternative Strategies Fund (the “Feeder Fund”), invests substantially all of its assets, net of reserves maintained for reasonably anticipated expenses, in the Master Fund. The Master Fund may also accept investments from certain other investors as well, including, among others, investors purchasing shares through (i) certain “wrap fee” or other programs sponsored by financial intermediary firms and (ii) certain non-broker/dealer registered investment advisory firms.
The investment objective of the Master Fund is to seek long-term capital appreciation above equity returns over a full market cycle with volatility that is lower than that of the equity market and returns that demonstrate a low correlation to both traditional equity and fixed income markets. The Master Fund seeks to achieve this investment objective by investing principally in private investment funds or “hedge funds” managed by third-party portfolio managers (“Portfolio Managers”) who employ diverse styles and strategies (“Hedge Funds”). The Master Fund generally seeks to invest in Hedge Funds managed by Portfolio Managers who have proven investment management experience and who invest in the Hedge Funds they manage alongside their clients’ capital. The investment strategies employed by the Portfolio Managers selected may include, among others, credit, event-driven, distressed, global macro, income, long/short credit, long/short equity and relative value/arbitrage strategies.
New York Life Investment Management LLC (“New York Life Investments” or the “Manager”), a Delaware limited liability company, is registered as an investment adviser under the Investment Advisers Act of 1940, as amended (“Advisers Act”), and serves as the Master Fund’s investment manager. New York Life Investments has in turn delegated its portfolio management responsibilities to Private Advisors LLC, a Virginia limited liability company, (“Private Advisors”), who serves as the Master Fund’s subadvisor (together with New York Life Investments, the “Advisors”). New York Life Investments also serves as the investment manager to the Feeder Fund, and Private Advisors also serves as the subadvisor to the Feeder Fund. Subject to policies adopted by the Funds’ Board of Trustees (“Board”), Private Advisors, among other things, (i) manages the day-to-day investment operations of the Funds, (ii) seeks investment opportunities for the Funds and (iii) monitors the performance of and makes investment and trading decisions with respect to the Funds’ investment portfolio.
The Board has overall responsibility for monitoring and overseeing the Funds’ investment program and its management and operations.
A majority of the Trustees are “Independent Trustees” who are not “interested persons” (as defined by the 1940 Act) of the Funds.
As of September 30, 2014, the Feeder Fund represented $24,062,750 or 35.58% of the Master Fund’s net assets.
2. Significant Accounting Policies
The Master Fund prepares its financial statements, which are expressed in U.S. dollars, in accordance with generally accepted accounting principles in the United States of America (“GAAP”) and follows significant accounting policies described below.
Management has determined that the Master Fund is an investment company in accordance with Accounting Standards Codification Topic 946, Investment Companies, for the purpose of financial reporting.
Investment in the Fund
NYLIFE Distributors LLC (“Distributor”), an affiliate of the Advisors, acts as the distributor of the Master Fund’s shares of beneficial interest (“Shares”). The Distributor may enter into selected dealer arrangements with various brokers, dealers, banks and other financial intermediaries (“Financial Intermediaries”) to sell Shares.
Although Shares are registered under the Securities Act of 1933, as amended (“Securities Act”), investments in the Master Fund generally may be made only by investors that satisfy the definition of “accredited investors” as defined in Rule 501(a) of Regulation D under the Securities Act (“Eligible Investors”). Eligible Investors who subscribe for Shares and are admitted to the Master Fund become shareholders (“Shareholders”) of the Master Fund. Generally, Shares will be continuously offered on a monthly basis at a price equal to their then current net asset value (“NAV”) per Share. The minimum initial subscription for Shares is $50,000, and the minimum subsequent subscriptions are $10,000. The Master Fund may accept subscriptions for lesser amounts at the discretion of the Advisors. Shares are offered for purchase as of the first business day of each month or at such other times as determined in the discretion of the Board. Shares are subject to substantial restrictions on transferability and resale, and may not be transferred or resold except as permitted under the Master Fund’s Declaration of Trust. As described below, the Master Fund may, however, offer to repurchase Shares pursuant to written tenders by Shareholders.
No Shareholder or other person holding Shares acquired from a Shareholder has the right to require the Master Fund to redeem Shares. However, the Master Fund may from time to time offer to repurchase Shares from its Shareholders in accordance with written tenders by Shareholders. Each tender offer may be limited and will generally apply to up to 20% of the net assets of the Master Fund at those times, in those amounts, and on such terms and conditions as the Board may determine in its sole discretion. If a tender offer is oversubscribed, the Master Fund will, in its sole discretion, either (a) accept the additional Shares permitted to be accepted pursuant to Rule 13e-4(f)(1) under the Securities Exchange Act of 1934, as amended; (b) extend the tender offer, if necessary, and increase the number of Shares that the Master Fund is offering to repurchase to a number it believes sufficient to
Private Advisors Alternative Strategies Master Fund | 15 |
Private Advisors Alternative Strategies Master Fund
Notes to Financial Statements (Unaudited) (continued)
accommodate the excess Shares tendered as well as any Shares tendered during the extended offer; or (c) accept Shares tendered on or before the expiration date for payment on a pro rata basis based on the number of tendered Shares. In determining whether the Master Fund should offer to repurchase Shares from Shareholders, the Board will consider the recommendations of the Advisors as to the timing of such a tender offer, as well as a variety of operational, business and economic factors. In the event that the Master Fund does not at least once during any 24 consecutive month period beginning after January 1, 2013, offer to repurchase Shares tendered in accordance with such terms and conditions as the Board may determine in its sole discretion, the Board will be required to call a meeting of Shareholders for the purposes of considering whether to dissolve the Master Fund.
The Advisors expect that they will generally recommend to the Board that the Master Fund offer to repurchase Shares from Shareholders quarterly on the last business day of March, June, September and December. However, the Master Fund is not required to conduct a tender offer and may be less likely to conduct tenders during periods of exceptional tender conditions or when Hedge Funds suspend redemptions. The Master Fund will require that each tendering Shareholder tender a minimum of $25,000 worth of Shares, subject to the Board’s ability to permit a Shareholder to tender a lesser amount in its discretion.
A 5.00% early repurchase fee (“Repurchase Fee”) will be assessed to any Shareholder that tenders his or her Shares to the Master Fund prior to the business day immediately preceding the one-year anniversary of the Shareholder’s purchase of the respective Shares. The Repurchase Fee applies separately to each purchase of Shares made by a Shareholder. The purpose of the Repurchase Fee is to, among other things, discourage short-term investments, which are generally disruptive to the Master Fund’s investment program.
Valuation of Investments
Private Advisors has designed ongoing due diligence processes with respect to the Hedge Funds and their Portfolio Managers, which assist Private Advisors in assessing the quality of information provided by, or on behalf of, each Hedge Fund and in determining whether such information continues to be reliable or whether further investigation is necessary. Such investigation, as applicable, may or may not require Private Advisors to forego their normal reliance on the value supplied by, or on behalf of, such Hedge Fund and to determine independently a fair valuation of the Master Fund’s interest in such Hedge Fund, consistent with the Master Fund’s fair valuation procedures.
The Board has adopted procedures for the valuation of each of the Hedge Funds and has delegated the responsibility for valuation determinations under those procedures to the Valuation Committee of the Master Fund (the “Valuation Committee”). The Board has also authorized the Valuation Committee to appoint a Sub-Committee (“Valuation Sub-Committee”) to deal in the first instance with questions that arise or cannot be resolved under these procedures. The Valuation Sub-Committee will meet (in person, via electronic mail or via teleconference) on an as-needed basis. Determinations of the Valuation Committee and the Valuation Sub-Committee are subject to review and
ratification by the Board at its next regularly scheduled meeting after valuations are determined. The procedures recognize that, subject to the oversight of the Board and unless otherwise noted, primary responsibility for the monthly valuation of portfolio assets (including Hedge Funds for which market prices are not readily available) rests with Private Advisors and/or New York Life Investments.
Investments in Hedge Funds
The Board has approved procedures pursuant to which the Master Fund values its investments in Hedge Funds at fair value, which ordinarily will be the amount equal to the Master Fund’s pro rata interest in the net assets of each such Hedge Fund, as such value is supplied by, or on behalf of, the Hedge Fund’s portfolio manager from time to time, usually monthly. The Master Fund complies with the authoritative guidance under GAAP for estimating the fair value of investments in the Hedge Funds that have calculated NAV in accordance with the specialized accounting guidance for investment companies (the “practical expedient”). Investments in Hedge Funds are generally valued, as a practical expedient, utilizing the net asset valuations provided by the Hedge Funds when the net asset valuations of the investments are calculated without further adjustment (or adjusted by the Master Fund if the NAV is deemed to be not reflective of fair value). The Master Fund applies the practical expedient to its investments in Hedge Funds on an investment-by-investment basis and consistently with the Master Fund’s entire position in a particular investment unless it is probable that the Master Fund will sell an investment at an amount different from the net asset valuation or in other situations where the practical expedient is not available. When the Master Fund believes alternative valuation techniques are more appropriate, the Master Fund considers other factors in addition to the net asset valuation, such as, but not limited to, features of the investment, including subscription and redemption rights, expected discounted cash flows, transactions in the secondary market, bids received from potential buyers, and overall market conditions in its determination of fair value. Certain financial statements of the Hedge Funds were either not available or excluded details of investment securities portfolios. As of September 30, 2014, the Master Fund’s Advisors were unaware of any significant issuer concentration in the Hedge Funds.
The valuations reported by the Portfolio Managers, upon which the Master Fund primarily relies in calculating its month-end NAV and NAV per Share, may be subject to later adjustment, based on information reasonably available at that time. The Master Fund will pay repurchase proceeds, as well as calculate management and other fees, on the basis of net asset valuations determined using the best information available as of the valuation date. In the event that a Hedge Fund, in accordance with its valuation procedures, subsequently corrects, revises or adjusts an unaudited estimated or final value that was properly relied upon by the Master Fund, the Master Fund will generally not make any retroactive adjustments to its NAV, or to any amounts paid based upon such NAV, to reflect a revised valuation. If, after the Master Fund pays repurchase proceeds, or one or more of the valuations used to determine the NAV on which the repurchase payment is based are revised, the repurchasing Shareholders (if the valuations are revised upward) or the remaining Shareholders (if the valuations are revised
| 16 | Private Advisors Alternative Strategies Master Fund |
downward) will bear the risk of such revisions. A repurchasing Shareholder will neither receive distributions from, nor be required to reimburse, the Master Fund in such circumstances. This may have the effect of diluting or increasing the economic interests of other Shareholders. Such adjustments or revisions, whether increasing or decreasing the NAV at the time they occur, because they relate to information available only at the time of the adjustment or revision, will not affect the amount of the repurchase proceeds received by Shareholders who had their Shares repurchased prior to such adjustments and received their repurchase proceeds. As a result, to the extent that such subsequently adjusted valuations from Portfolio Managers or revisions to NAV of a Hedge Fund adversely affect the Master Fund’s NAV, the outstanding Shares of the Master Fund will be adversely affected by prior repurchases to the benefit of Shareholders who had their Shares repurchased at an NAV per Share higher than the adjusted amount. Conversely, any increases in the NAV per Share resulting from such subsequently adjusted valuations will be entirely for the benefit of the holders of the outstanding Shares and to the detriment of Shareholders who previously had their Shares repurchased at an NAV per Share lower than the adjusted amount. New Shareholders, as well as Shareholders purchasing additional Shares, may be affected in a similar way because the same principles apply to the subscription for Shares.
Because of the inherent uncertainty of valuation, the estimated value of Hedge Funds for which no ready market exists may differ significantly from the value that would be used had a ready market for the security existed, and the differences could be material. When market quotations may not be available, investments such as complex or unique financial instruments may be priced pursuant to a number of methodologies, such as computer-based analytical modeling or individual security evaluations. These methodologies generate approximations of market values, and there may be significant professional disagreement about the best methodology for a particular type of financial instruments or different methodologies that might be used under different circumstances. In the absence of an actual market transaction, reliance on such methodologies is essential, but may introduce significant variances in the ultimate valuation of Hedge Funds.
The following are descriptions of the various strategies utilized by the underlying Hedge Funds.
Distressed Debt
Portfolio Managers seek to purchase securities (typically debt) of companies experiencing financial or operating difficulties due to excessive debt burdens or temporary liquidity problems. Often these companies are in or about to enter bankruptcy. Understanding the complexities of the bankruptcy process allows experienced distressed Portfolio Managers to profit by buying the securities at a deep discount to intrinsic value.
European Equity
This strategy involves taking both long and short positions primarily in public equities with a geographic focus in Europe.
Event Equity
This strategy involves a long and short fundamental approach to equity investments that have a visible catalyst that can enhance value in a short to intermediate term horizon. Situations can also offer underpriced positive optionality. Portfolio managers who utilize this strategy seek to limit the macro, market and/or industry risk that accompanies the holdings, such that the event drives the ultimate profitability of the investment.
Global Equity
This strategy involves taking both long and short positions primarily in public equities with a global geographic focus.
Global Macro
This strategy relies on the assessment of relative valuations at a macroeconomic level across multiple geographies and asset classes based on economic indicators, trend and factor analysis and flow of funds data. Investments can span the fixed income, currency, commodity and equity markets. Global Macro investing is generally a liquid, high frequency trading strategy.
Long/Short Corporate Credit
This strategy involves taking both long and short positions in distinct corporate debt instruments.
Long/Short Structured Credit
This strategy attempts to isolate returns by trading in tranches of various types of structured credit instruments. This may include multiple tranches of collateralized debt obligations (CDOs), collateralized loan obligations (CLOs), residential mortgage-backed securities (RMBS), commercial mortgage-backed securities (CMBS), credit default swaps (CDS), credit default swap index (CDX), asset-backed securities index (ABX) and commercial mortgage-backed securities index (CMBX).
Multi-Strategy
This strategy grants Portfolio Managers the ability to invest across strategies.
U.S. Equity
This strategy involves taking both long and short positions primarily in public equities with a geographic focus in the United States.
Distribution of Income and Gains
The Master Fund intends to distribute all of its net investment income, and net short-term and long-term capital gain, if any, to Shareholders each year as required to maintain regulated investment company (“RIC”) status. Distributions will be made annually to each Shareholder pro rata based upon the number of Shares held by such Shareholder on the record date and will be net of expenses. Dividends and distributions are recorded on the ex-dividend date. Dividends and distributions to shareholders are determined in accordance with federal income tax regulations and may differ from GAAP. Dividends from net investment
Private Advisors Alternative Strategies Master Fund | 17 |
Private Advisors Alternative Strategies Master Fund
Notes to Financial Statements (Unaudited) (continued)
income for the period ended September 30, 2014 and for the year ended March 31, 2014 represent distributions from ordinary income for tax purposes arising primarily from mark-to-market adjustments relating to passive foreign investment companies.
In order to satisfy the diversification requirements under Subchapter M of the Internal Revenue Code, of 1986, as amended (the “Code”), the Master Fund generally invests its assets in Hedge Funds organized outside the United States that are treated as corporations for U.S. tax purposes and are expected to be classified as passive foreign investment companies (“PFICs”). As such, the Master Fund expects that its distributions generally will be taxable as ordinary income to the Shareholders.
Pursuant to the dividend reinvestment plan established by the Master Fund (“DRIP”), each Shareholder whose Shares are registered in its own name will automatically be a participant under the DRIP and have all income, dividends and/or capital gains distributions automatically reinvested in additional Shares at NAV unless such Shareholder specifically elects to receive all income, dividends and capital gain distributions in cash.
Statement of Cash Flows
The cash amount shown in the Statement of Cash Flows of the Master Fund is the amount included in the Master Fund’s Statement of Assets and Liabilities and represents the cash on hand at its custodian and does not include any short-term investments or restricted cash.
Income and Operating Expenses
The Master Fund bears its own expenses including, but not limited to, legal expenses, accounting expenses (including third-party accounting services), auditing and other professional expenses, administration expenses and custody expenses. Interest income and interest expense are recorded on an accrual basis. Operating expenses are recorded as incurred.
In addition, the Master Fund bears a pro rata share of the fees and expenses of the Hedge Funds in which it invests. Because the Hedge Funds have varied expense and fee levels and the Master Fund may own different proportions of the Hedge Funds at different times, the amount of fees and expenses incurred indirectly by the Master Fund may vary. These indirect expenses of the Hedge Funds are included in net realized gain/(loss) from investments in Hedge Funds and net change in unrealized appreciation/(depreciation) on investments in Hedge Funds on the Master Fund’s Statement of Operations.
Recognition of Gains and Losses
Changes in unrealized appreciation or depreciation from each Hedge Fund are included in the Master Fund’s Statement of Operations as net change in unrealized appreciation (depreciation) on investments in Hedge Funds.
Purchases of investments in the Portfolio Funds are recorded as of the first day of legal ownership of a Portfolio Fund. Sales are recorded as of the last day of legal ownership or participation in a Portfolio Fund. Any
proceeds received from Hedge Fund redemptions that are in excess of the Hedge Funds’ cost basis are classified as net realized gain from investments in Hedge Funds on the Master Fund’s Statement of Operations. Any proceeds received from Hedge Fund redemptions that are less than the Hedge Funds’ cost basis are classified as net realized loss from investments in Hedge Funds on the Master Fund’s Statement of Operations. Realized gains and losses from investments in Hedge Funds are calculated based on specific identification method.
Use of Estimates
In preparing financial statements in conformity with GAAP, management makes estimates and assumptions that affect the reported amounts and disclosures in the financial statements, such as valuation of its investments. Actual results could differ from those estimates.
3. Income Taxes
Federal Income Taxes
The Master Fund intends to comply with the requirements of the Code applicable to regulated investment companies (“RICs”) and to distribute substantially all of its taxable income to its Shareholders. Therefore, no provision for federal income taxes is required. The Master Fund has adopted a tax year-end of October 31. The Master Fund files tax returns with the U.S. Internal Revenue Service and various states. The Master Fund may be subject to taxes imposed by countries in which it invests. Such taxes are generally based on income earned or gains realized or repatriated. Taxes are accrued and applied to net investment income, net realized capital gains and net unrealized appreciation, as applicable, as the income is earned or capital gains are recorded. Management evaluates its tax positions to determine if the tax positions taken meet the minimum recognition threshold in connection with accounting for uncertainties in income tax positions taken or expected to be taken for the purposes of measuring and recognizing tax liabilities in the financial statements. Recognition of tax benefits of an uncertain tax position is required only when the position is “more likely than not” to be sustained assuming examination by taxing authorities. Management has analyzed the Master Fund’s tax positions taken on federal, state and local income tax returns for the open tax year (for up to three tax years), and has concluded that no provision for federal, state and local income tax are required in the Master Fund’s financial statements. The Master Fund’s federal, state and local tax returns for tax years for which the applicable statutes of limitation have not expired are subject to examination by the U.S. Internal Revenue Service and state and local departments of revenue.
4. Fair Value of Financial Instruments
“Fair value” is defined as the price that the Master Fund would receive upon selling an investment or paid to transfer a liability in an orderly transaction between market participants at the measurement date.
In determining fair value, the Master Fund uses the practical expedient. A fair value hierarchy for inputs is used in measuring fair value that maximizes the use of observable inputs and minimizes the use of unobservable inputs by requiring that most observable inputs are to be
| 18 | Private Advisors Alternative Strategies Master Fund |
used when available. The fair value hierarchy is categorized into three levels based on the inputs as follows:
The fair value hierarchy categorizes asset and liability positions into one of three levels, as summarized below, based on the inputs and assumptions used in deriving fair value.
| • | Level 1—Unadjusted quoted prices in active markets for identical, unrestricted investments that the Master Fund has the ability to access at the measurement date; |
| • | Level 2—Quoted prices which are not active, quoted prices for similar investments in active markets or inputs other than quoted prices that are observable (either directly or indirectly) for substantially the full term of the asset or liability. Investments in Hedge Funds that are redeemable at net asset value without penalties within 3 months of period-end are considered Level 2 assets and represent the net asset values as reported by the Hedge Funds; and |
| • | Level 3—Significant unobservable prices or inputs (including the Master Fund’s own assumptions in determining the fair value of investments) where there is little or no market activity for the investment at the measurement date. Investments in Hedge Funds that are not redeemable at net asset value within 3 months of period-end, or are subject to a redemption penalty extending past three months are considered Level 3 assets and represent the net asset values as reported by the Hedge Funds. |
Fair value is a market-based measure, based on assumptions of prices and inputs considered from the perspective of a market participant that are current as of the measurement date, rather than an entity-specific measure. Therefore, even when market assumptions are not readily available, the Master Fund’s own assumptions are set to reflect those that market participants would use in pricing the asset or liability at the measurement date.
The availability of valuation techniques and observable inputs can vary from investment to investment and are affected by a wide variety of factors, including the type of investment, whether the investment is new and not yet established in the market place, the liquidity of markets and other characteristics particular to the transaction. To the extent that valuation is based on models or inputs that are less observable or unobservable in the market, the determination of fair value requires more judgment. Because of the inherent uncertainty of valuation, those estimated values may be materially higher or lower than the values that would have been used had a ready market for the investments existed, and the differences could be material. Accordingly, the degree of judgment exercised by the Master Fund in determining fair value is greatest for investments categorized in Level 3. In certain cases, the inputs used to measure fair value may fall into different levels of the fair value hierarchy. In such cases, the level in the fair value hierarchy which the fair value measurement falls in its entirety is determined based on the lowest level input that is significant to the fair value measurement.
Investments in Hedge Funds are included in Level 2 or 3 of the fair value hierarchy. In determining the level, the Master Fund considers the length of time until the investment is redeemable, including notice and lock-up periods or any other restrictions on the disposition of the investment. The Master Fund also considers the nature of the portfolios of the underlying Hedge Funds and their ability to liquidate their underlying investments. If the Master Fund does not know when it will have the ability to redeem its investment in the near term, the investment is included in Level 3 of the fair value hierarchy.
The valuation techniques used by the Master Fund to measure fair value maximizes the use of observable inputs and minimizes the use of unobservable inputs.
The inputs or methodology used for valuing securities are not necessarily an indication of the risk associated with investing in those securities.
Private Advisors Alternative Strategies Master Fund | 19 |
Private Advisors Alternative Strategies Master Fund
Notes to Financial Statements (Unaudited) (continued)
The following is a summary of the fair value inputs used as of September 30, 2014 in valuing the Master Fund’s investments in Hedge Funds.
| Assets at Fair Value as of September 30, 2014 | ||||||||||||||||
Level 1 | Level 2 | Level 3 | Total | |||||||||||||
Investments in Hedge Funds | ||||||||||||||||
Bermuda Domiciled | ||||||||||||||||
European Equity | $ | — | $ | 2,484,635 | $ | — | $ | 2,484,635 | ||||||||
British Virgin Islands Domiciled | ||||||||||||||||
Global Equity | 2,382,820 | — | 2,382,820 | |||||||||||||
Multi-Strategy | — | 2,124,628 | — | 2,124,628 | ||||||||||||
Cayman Islands Domiciled | ||||||||||||||||
Distressed Debt | — | 2,364,204 | 2,656,372 | 5,020,576 | ||||||||||||
European Equity | — | 5,012,838 | — | 5,012,838 | ||||||||||||
Event Equity | — | 4,551,546 | 1,750,493 | 6,302,039 | ||||||||||||
Global Equity | — | 3,653,673 | 1,444,196 | 5,097,869 | ||||||||||||
Global Macro | — | 8,050,714 | 1,284,404 | 9,335,118 | ||||||||||||
Long/Short Corporate Credit | — | 4,565,066 | 2,175,137 | 6,740,203 | ||||||||||||
Long/Short Structured Credit | — | 3,167,797 | 503,263 | 3,671,060 | ||||||||||||
Multi-Strategy | — | 2,447,564 | 2,690,100 | 5,137,664 | ||||||||||||
U.S. Equity | — | 10,869,407 | 345,292 | 11,214,699 | ||||||||||||
|
|
|
| |||||||||||||
Total investments in Hedge Funds | $ | — | $ | 51,674,892 | $ | 12,849,257 | $ | 64,524,149 | ||||||||
|
| |||||||||||||||
The Master Fund recognizes transfers between levels as of the beginning of the period.
Level 2 and Level 3 investments at September 30, 2014 were valued using the practical expedient.
The following is a reconciliation of investments in Hedge Funds in which significant unobservable inputs (Level 3) were used in determining value:
| Bermuda Domiciled | Cayman Islands Domiciled | |||||||||||||||||||
European Equity | Distressed Debt | Event Equity | Global Equity | Global Macro | ||||||||||||||||
Balance as of April 1, 2014 | $ | 328,387 | $ | 268,379 | $ | — | $ | 1,045,393 | $ | 999,632 | ||||||||||
| Net realized gains (losses) | — | — | — | — | — | |||||||||||||||
| Net change in unrealized appreciation (depreciation) | — | — | — | 374,196 | (15,596 | ) | ||||||||||||||
| Purchases | — | — | — | 1,070,000 | 1,300,000 | |||||||||||||||
| Sales | — | — | — | — | — | |||||||||||||||
| Transfers into Level 3 (a) | — | 2,656,372 | 1,750,493 | — | — | |||||||||||||||
| Transfers out of Level 3 (a) | (328,387 | ) | (268,379 | ) | — | (1,045,393 | ) | (999,632 | ) | |||||||||||
|
|
|
|
|
|
|
|
|
| |||||||||||
Balance as of September 30, 2014 | $ | — | $ | 2,656,372 | $ | 1,750,493 | $ | 1,444,196 | $ | 1,284,404 | ||||||||||
|
|
|
|
|
|
|
|
|
| |||||||||||
Net change in unrealized appreciation (depreciation) on Level 3 investments in Hedge Funds still held as of September 30, 2014 | $ | — | $ | — | $ | — | $ | 374,196 | $ | (15,596 | ) | |||||||||
|
|
|
|
|
|
|
|
|
| |||||||||||
| 20 | Private Advisors Alternative Strategies Master Fund |
| Cayman Islands Domiciled | ||||||||||||||||||||
| Long/Short Corporate Credit | Long/Short Structured Credit | Multi- Strategy | US Equity | Total | ||||||||||||||||
Balance as of April 1, 2014 | $ | 2,753,487 | $ | 281,345 | $ | 227,537 | $ | 1,391,525 | $ | 7,295,685 | ||||||||||
| Net realized gains (losses) | — | — | — | — | — | |||||||||||||||
| Net change in unrealized appreciation (depreciation) | 61,603 | 3,263 | (3,424 | ) | (4,708 | ) | 415,334 | |||||||||||||
| Purchases | — | 500,000 | — | 350,000 | 3,220,000 | |||||||||||||||
| Sales | — | — | — | — | — | |||||||||||||||
| Transfers into Level 3 (a) | — | — | 2,465,987 | — | 6,872,852 | |||||||||||||||
| Transfers out of Level 3 (a) | (639,953 | ) | (281,345 | ) | — | (1,391,525 | ) | (4,954,614 | ) | |||||||||||
|
|
|
|
|
|
|
|
|
| |||||||||||
Balance as of September 30, 2014 | $ | 2,175,137 | $ | 503,263 | $ | 2,690,100 | $ | 345,292 | $ | 12,849,257 | ||||||||||
|
|
|
|
|
|
|
|
|
| |||||||||||
Net change in unrealized appreciation (depreciation) on Level 3 investments in Hedge Funds still held as of September 30, 2014 | $ | 61,603 | $ | 3,263 | $ | (3,424 | ) | $ | (4,708 | ) | $ | 415,334 | ||||||||
|
|
|
|
|
|
|
|
|
| |||||||||||
| (a) | Transfers between levels may occur based on changes in the underlying Hedge Funds and/or changes in liquidity and are recognized as of the beginning of the period. For the six months ended September 30, 2014, the Master Fund’s investments in Hedge Funds with fair values of $6,872,852 and $(4,954,614) were transferred out of Level 2 to Level 3 and transferred out of Level 3 to Level 2, respectively, due to expiration of lock ups. |
There were no changes in valuation technique and no transfers between the levels of the fair value hierarchy during the reporting period, except as noted above.
Net realized gains (losses) and net changes in unrealized appreciation (depreciation) presented above are reflected in the accompanying Master Fund’s Statement of Operations.
5. Fees and Related Party Transactions
The Master Fund bears all of the expenses of its own operations, including, but not limited to, the investment management fee for the Master Fund payable to New York Life Investments, administration fees, custody fees, and transfer agent fees payable to State Street Bank and Trust Company (“State Street”).
In consideration of the management services provided by New York Life Investments to the Master Fund, the Master Fund pays New York Life Investments a monthly management fee of 0.0917% (1.10% on an annualized basis) of the Master Fund’s month end NAV (“Management Fee”). New York Life Investments will pay a portion of the Management Fee it receives from the Master Fund (net of any fee waiver or expense reimbursement arrangements) to Private Advisors for the provision of its subadvisory services. For the six months ended September 30, 2014, the Master Fund incurred management fees of $360,360. As of September 30, 2014, $122,967 is due to the Manager.
New York Life Investments has contractually agreed to waive fees and/or reimburse expenses so that Total Annual Operating Expenses (excluding taxes, interest, litigation, extraordinary expenses, brokerage and other transaction expenses relating to the purchase or sale of portfolio investments, and Acquired (Underlying) Fund Fees and Expenses (i.e., the expenses of the underlying Hedge Funds)) do not exceed 1.50% of its average month-end net assets. This agreement will remain in effect until August 1, 2015, and shall renew automatically for one-year terms unless New York Life Investments provides written notice of termination prior to the start of the next term or upon approval of the Board. Accordingly, $80,640 of expenses was reimbursed, none of which pertained to offering costs (See Note 8), so that expenses do
not exceed 1.50% of its average month-end net assets. As of September 30, 2014, $17,181 is due from the Manager.
The Master Fund has retained State Street to provide administrative and accounting services to the Master Fund. State Street also serves as the Master Fund’s transfer agent and custodian. Under the terms of an administration agreement with the Master Fund (“Administration Agreement”), State Street is responsible for, among other things: (i) reconciling cash and investment balances; (ii) maintaining the general ledger and sub-ledger accounts and arranging for the computation of the Master Fund’s NAV; (iii) preparing the Master Fund’s annual and semi-annual reports; (iv) maintaining the register of Shareholders; (v) processing matters relating to subscriptions for and repurchases of Shares; and (vi) issuing reports and transaction statements to Shareholders. For its services, State Street is paid a monthly fee directly from the Master Fund. For the six months ended September 30, 2014, the Master Fund incurred administration fees, custody fees, and transfer agent fees of $90,219, $11,444, and $14,782, respectively.
From time to time, the Master Fund may have a concentration of Shareholders holding a significant percentage of its net assets. Investment activities of these Shareholders could have a material impact on the Master Fund. As of September 30, 2014, New York Life Management Holdings, LLC, an affiliate of the Advisors, maintains a significant holding in the Master Fund that represents 55.28% of the Master Fund’s NAV.
6. Investments in Hedge Funds
As of September 30, 2014, the Master Fund had investments in 30 Hedge Funds. The Master Fund, as an investor in these Hedge Funds, pays management fees of up to 2.75% (per annum) of the NAV of its ownership interest in such Hedge Funds, as well as incentive fees or allocations of up to 27.00% of net profits earned that are allocable to the Master Fund’s ownership interest in such Hedge Funds.
For the six months ended September 30, 2014, aggregate purchases and proceeds from sales of investments in Hedge Funds were
Private Advisors Alternative Strategies Master Fund | 21 |
Private Advisors Alternative Strategies Master Fund
Notes to Financial Statements (Unaudited) (continued)
$5,270,000 and $2,622,905 respectively. There were no unfunded commitments outstanding to Hedge Funds as of September 30, 2014.
7. Offering of Shares
The Master Fund’s Share activities for the six months ended September 30, 2014 were as follows:
Balance as of April 1, 2014 | Subscriptions | Redemptions | Balance as of September 30, 2014 | |||
59,167.15 | 8,754.35 | (2,314.98) | 65,606.52 |
8. Organization and Offering Expenses
New York Life Investments has agreed to pay all of the Master Fund’s organizational expenses. As a result, organizational expenses of the Master Fund are not reflected in the Master Fund’s financial statements. Organizational expenses incurred through September 30, 2014 and paid by New York Life Investments were $308,129.
The Master Fund will bear its own offering costs, as well as the offering costs related to the Feeder Fund. Offering costs were deferred until operations of the Fund began and were amortized over a 12 month period on a straight-line basis. As of September 30, 2014, the Master Fund had incurred offering costs of $344,143, none of which have been expensed over the six months ended September 30, 2014.
9. Risks and Contingencies
The Master Fund may be subject to various risk factors including the following broad categories (i) the risks related to an investment in the Master Fund; (ii) the risks related to the types of investments utilized by the Hedge Funds; (iii) the risks related to the investment strategies of the Hedge Funds; and (iv) the risks related to the management and operations of the Hedge Funds.
The Master Fund has a limited operating history as (i) an investment company registered under the 1940 Act, or (ii) a “master-feeder” fund. In this regard, an investment in the Master Fund is therefore subject to all of the risks and uncertainties associated with operating in such capacities.
Because Hedge Funds may have the ability to concentrate their investments by investing an unlimited amount of their assets in a specific issuer, sector, market, industry, strategy, country or geographic region, Hedge Funds will be subject to risks such as rapid obsolescence of technology, sensitivity to regulatory changes, minimal barriers to entry and sensitivity to overall market swings, and may be more susceptible to risks associated with a single economic, political or regulatory circumstance or event than a more diversified portfolio might be.
Certain of the Portfolio Managers will, among other things, seek to utilize specialized investment strategies, follow allocation methodologies, apply investment models or assumptions, achieve a certain level of performance relative to specified benchmarks, and enter into hedging and other strategies intended, among other things, to affect the Hedge Funds’ performance, risk levels, and/or market correlation. There can be no assurance that any Portfolio Manager will have success in achieving any goal related to such practices. The Portfolio Managers may be unable to, or may choose in their judgment not to seek to, achieve such goals.
Although Private Advisors generally seeks to invest with Portfolio Managers that have a minimum three-year Hedge Fund performance track record, there could be exceptions for sufficiently compelling opportunities. In this regard, certain Hedge Funds may have no prior or limited operating history upon which Private Advisors can evaluate their potential performance. The past investment performance of Hedge Funds managed by Portfolio Managers in which the Master Fund invests or expect to invest may not be construed as an indication of the future results of an investment in the Master Fund. In addition, Portfolio Managers of Hedge Funds that have no or limited operating history may not have direct experience managing Hedge Funds, including experience with financial, legal or regulatory considerations unique to Hedge Funds, and because there is generally less information available on which to base an opinion of such Portfolio Managers’ investment and management expertise, these types of investments may be subject to greater risk and uncertainty than investments with more experienced Portfolio Managers.
10. Contractual Obligations
The Master Fund enters into contracts that contain a variety of indemnifications. The Master Fund’s maximum exposure under these arrangements is unknown. However, the Master Fund has not had prior claims or losses pursuant to these contracts and expects the risk of loss to be remote.
11. Subsequent Events
In connection with the preparation of the financial statements of the Master Fund for the six months ended September 30, 2014, events and transactions subsequent to September 30, 2014 through the date the financial statements were issued have been evaluated by the Master Fund’s management for possible adjustment and/or disclosure. No subsequent events requiring financial statement adjustment or disclosure have been identified.
| 22 | Private Advisors Alternative Strategies Master Fund |
Proxy Voting Policies and Procedures and Proxy Voting Record
A copy of (1) the Private Advisors Alternative Strategies Feeder and Master Fund’s policies and procedures with respect to the voting of proxies; and (2) a record of how the Master Fund voted proxies during the most recent six months ended September 30 is available without charge, upon request, by calling the Master Fund at 1-888-207-6176. This information is also available on the Securities and Exchange Commission’s website at www.sec.gov.
Quarterly Schedule of Investments
Each of the Private Advisors Alternative Strategies Feeder and Master Fund is required to file its complete Schedule of Investments with the SEC for its first and third fiscal quarters on Form N-Q. The Master Fund’s Form N-Q is available without charge, on the SEC’s website at www.sec.gov or by calling 1-800-SEC-0330. The Master Fund’s Form N-Q may be reviewed and copied by visiting the SEC’s Public Reference Room in Washington, D.C. (information on the operation of the Public Reference Room may be obtained by calling 1-800-SEC-0330).
Private Advisors Alternative Strategies Master Fund | 23 |
This page intentionally left blank
This page intentionally left blank
This page intentionally left blank
Other Information
Private Advisors Alternative Strategies Master Fund
51 Madison Avenue
New York, NY 10010
Trustees
Susan B. Kerley
John Y. Kim
Alan R. Latshaw
Peter Meenan
Richard H. Nolan, Jr.
Richard S. Trutanic
Roman L. Weil
John A. Weisser
Officers
Jack R. Benintende, Treasurer
Kevin M. Bopp, Chief Compliance Officer
Stephen P. Fisher, President
J. Kevin Gao, Secretary
Scott T. Harrington, Vice President
Investment Manager
New York Life Investment Management LLC
51 Madison Avenue
New York, NY 10036
Subadvisor
Private Advisors LLC
901 East Byrd Street
Suite 1400
Richmond, VA 23219
Administrator, Custodian, Fund Accounting Agent and Transfer Agent
State Street Bank and Trust Company
One Lincoln Street
Boston, MA 02111
Independent Registered Public Accounting Firm
PricewaterhouseCoopers LLP
300 Madison Avenue
New York, NY 10017
Legal Counsel
Dechert LLP
1900 K Street, NW
Washington, DC 20006
Not part of the Semiannual Report

mainstayinvestments.com/privateadvisors
MainStay Investments® is a registered service mark and name under which New York Life Investment Management LLC does business. MainStay Investments, an indirect subsidiary of New York Life Insurance Company, New York, NY 10010, provides investment advisory products and services. The Private Advisors Alternative Strategies Fund and the Private Advisors Alternative Strategies Master Fund are managed by New York Life Investment Management LLC, an indirect subsidiary of New York Life Insurance Company, and are distributed through NYLIFE Distributors LLC, 169 Lackawanna Avenue, Parsippany, NJ 07054, a wholly owned subsidiary of New York Life Insurance Company. NYLIFE Distributors LLC is a member of FINRA/SIPC. Private Advisors LLC is an affiliate of New York Life Investment Management LLC and acts as the Funds’ subadvisor.
Investors should consider the Funds’ investment objectives, risks, and charges and expenses carefully before investing. The Prospectuses, which contain this and other information about the Funds, should be read carefully before investing. Your financial advisor can provide you with a copy of the Prospectus for either of the Funds. Please read it carefully before investing. This material is not an offer to sell these securities and is not soliciting an offer to buy these securities in any jurisdiction where the offer or sale is not permitted.
| Not FDIC/NCUA Insured | Not a Deposit | May Lose Value | No Bank Guarantee | Not Insured by Any Government Agency |
| 1628893 PA027-14 | PAAS10m-11/14 NL260 |
| Item 2. | Code of Ethics. |
Not applicable.
| Item 3. | Audit Committee Financial Expert. |
Not applicable.
| Item 4. | Principal Accountant Fees and Services. |
Not applicable.
| Item 5. | Audit Committee of Listed Registrants |
Not applicable.
| Item 6. | Schedule of Investments |
The Schedule of Investments is included as part of Item 1 of this report.
| Item 7. | Disclosure of Proxy Voting Policies and Procedures for Closed-End Management Investment Companies. |
Not applicable.
| Item 8. | Portfolio Managers of Closed-End Management Investment Companies. |
Not applicable.
| Item 9. | Purchases of Equity Securities by Closed-End Management Investment Company and Affiliated Purchasers. |
Not applicable.
| Item 10. | Submission of Matters to a Vote of Security Holders. |
Since the Registrant’s last response to this Item, there have been no material changes to the procedures by which shareholders may recommend nominees to the Registrant’s Board of Trustees.
| Item 11. | Controls and Procedures. |
(a) Based on an evaluation of the Registrant’s Disclosure Controls and Procedures (as defined in Rule 30a-3(c) under the Investment Company Act of 1940) (the “Disclosure Controls”), as of a date within 90 days prior to the filing date (the “Filing Date”) of this Form N-CSR (the “Report”), the Registrant’s principal executive officer and principal financial officer have concluded that the Disclosure Controls are reasonably designed to ensure that information required to be disclosed by the Registrant in the Report is recorded, processed, summarized and reported by the Filing Date, including ensuring that information required to be disclosed in the Report is accumulated and communicated to the Registrant’s management, including the Registrant’s principal executive officer and principal financial officer, as appropriate to allow timely decisions regarding required disclosure.
(b) There were no changes in the Registrant’s internal control over financial reporting (as defined in Rule 30a-3(d)) under the Investment Company Act of 1940 that occurred during the second fiscal quarter of the period covered by this report that has materially affected, or is reasonably likely to materially affect, the Registrant’s internal control over financial reporting.
| Item 12. | Exhibits. |
(a) Certifications of principal executive officer and principal financial officer as required by Rule 30a-2 under the Investment Company Act of 1940.
(b) Certifications of principal executive officer and principal financial officer as required by Section 906 of the Sarbanes-Oxley Act of 2002.
SIGNATURES
Pursuant to the requirements of the Securities Exchange Act of 1934 and the Investment Company Act of 1940, the Registrant has duly caused this Report to be signed on its behalf by the undersigned, thereunto duly authorized.
| PRIVATE ADVISORS ALTERNATIVE STRATEGIES MASTER FUND | ||
| By: | /s/ Stephen P. Fisher | |
| Stephen P. Fisher | ||
| President and Principal Executive Officer | ||
| Date: | December 5, 2014 | |
Pursuant to the requirements of the Securities Exchange Act of 1934 and the Investment Company Act of 1940, this Report has been signed below by the following persons on behalf of the Registrant and in the capacities and on the dates indicated.
| By: | /s/ Stephen P. Fisher | |
| Stephen P. Fisher | ||
President and Principal Executive Officer | ||
| Date: | December 5, 2014 | |
| By: | /s/ Jack R. Benintende | |
| Jack R. Benintende | ||
President and Principal Executive Officer Treasurer and Principal Financial and Accounting Officer | ||
| Date: | December 5, 2014 | |
EXHIBIT INDEX
| (a) | Certifications of principal executive officer and principal financial officer as required by Rule 30a-2 under the Investment Company Act of 1940. | |
| (b) | Certification of principal executive officer and principal financial officer as required by Section 906 of the Sarbanes-Oxley Act of 2002. | |